- Analiza
- Novosti i instrumenti
- Vesti sa tržišta
Forex-novosti i prognoze od 21-04-2021
| Time | Country | Event | Period | Previous value | Forecast |
|---|---|---|---|---|---|
| 06:00 (GMT) | Switzerland | Trade Balance | March | 3.3 | |
| 10:00 (GMT) | United Kingdom | CBI industrial order books balance | April | -5 | |
| 11:45 (GMT) | Eurozone | ECB Interest Rate Decision | 0% | ||
| 12:30 (GMT) | U.S. | Continuing Jobless Claims | April | 3731 | |
| 12:30 (GMT) | Canada | New Housing Price Index, MoM | March | 1.9% | |
| 12:30 (GMT) | Canada | New Housing Price Index, YoY | March | 7% | |
| 12:30 (GMT) | U.S. | Initial Jobless Claims | April | 576 | |
| 12:30 (GMT) | U.S. | Chicago Federal National Activity Index | March | -1.09 | |
| 12:30 (GMT) | Eurozone | ECB Press Conference | |||
| 14:00 (GMT) | Eurozone | Consumer Confidence | April | -10.8 | |
| 14:00 (GMT) | U.S. | Leading Indicators | March | 0.2% | 0.6% |
| 14:00 (GMT) | U.S. | Existing Home Sales | March | 6.22 | 6.25 |
| 23:01 (GMT) | United Kingdom | Gfk Consumer Confidence | April | -16 | |
| 23:30 (GMT) | Japan | National CPI Ex-Fresh Food, y/y | March | -0.4% | |
| 23:30 (GMT) | Japan | National Consumer Price Index, y/y | March | -0.4% |
According to ActionForex, analysts at RBC Financial Group note that Canada's headline CPI jumped 2.2% year-over-year in March, on the back of slumping energy prices a year ago.
"As expected, headline CPI growth printed an eye-catching 2.2% increase year-over-year, driven by a rebound in the energy component (+19%). Oil prices in March of last year were exceptionally low as demand fell while production from key OPEC countries rose. Price growth for the shelter and transportation components both dialed higher in March as well, propped up by lower year-ago electricity, natural gas and gasoline comparables."
"Core CPI excluding food and energy components grew moderately, up 0.9% from year ago. Still, there are signs of underlying inflation pressure building, with over 50% of the goods and services in the CPI basket growing 2% or more in March."
"Year-over-year CPI readings will continue to accelerate near-term because of exceptionally low oil prices in the spring a year ago. Monetary policymakers will look through that energy price volatility. More closely watched will be broader underlying inflation trends aside from energy prices. The supply side of the economy has been ringing the inflation bell as input prices increase. And a stronger-than-expected rebound in household spending may collide with capacity constraints to propel prices higher. We see that as a risk for later in 2021, contingent on the healthy reopening of the economy."
The
U.S. Energy Information Administration (EIA) revealed on Wednesday that crude
inventories rose by 0.594 million barrels in the week ended April 16, following
a drop of 5.889 million barrels in the previous week. Economists had forecast a
draw of 2.975 million barrels.
At
the same time, gasoline stocks edged up 0.086 million barrels, while analysts
had expected a build of 0.464 million barrels. Distillate stocks dropped by 1.074
million barrels, while analysts had forecast a decrease of 0.956 million barrels.
Meanwhile,
oil production in the U.S. remained unchanged at 11.000 million barrels a day.
U.S.
crude oil imports averaged 5.4 million barrels per day last week, down by
448,000 thousand barrels per day from the previous week.
The
Bank of Canada (BoC) maintained its benchmark interest rates unchanged at 0.25
percent on Wednesday, as widely expected.
In
its policy statement, the Canadian central bank noted:
- Effective the week of April 26, weekly net purchases of Government of Canada bonds will be adjusted to target of CAD3 billion; this adjustment to amount of incremental stimulus being added each week reflects progress made in economic recovery;
- Outlook has improved for both global and Canadian economies;
- Canada’s Q1 growth appears considerably stronger than Bank’s January forecast, as households and companies adapted to the second wave and associated restrictions;
- BoC now forecasts real GDP growth of 6.5 percent in 2021 (versus +4.0 percent in January), moderating to around 3.75 percent in 2022 and 3.25 percent in 2023;
- Inflation is expected to rise temporarily to around the top of the 1-3 percent inflation-control range over the next few months; this is largely the result of base-year effects;
- CPI inflation is expected to ease back toward 2 percent over H2 of 2021 as these base-year effects diminish;
- Bank now projects global GDP to grow by just over 6.75 percent in 2021, about 4 percent in 2022, and almost 3.25 percent in 2023;
- Global recovery has lifted commodity prices, including oil, contributing to the strength of the Canadian dollar;
- We remain committed to holding policy interest rate at effective lower bound until economic slack is absorbed so that 2-percent inflation target is sustainably achieved; based on the Bank’s latest projection, this is now expected to happen some time in H2 of 2022;
- BoC is continuing its QE program to reinforce this commitment and keep interest rates low across the yield curve; decisions regarding further adjustments to the pace of net purchases will be guided by Governing Council’s ongoing assessment of strength and durability of the recovery;
- We will continue to provide the appropriate degree of monetary policy stimulus to support recovery and achieve inflation objective.
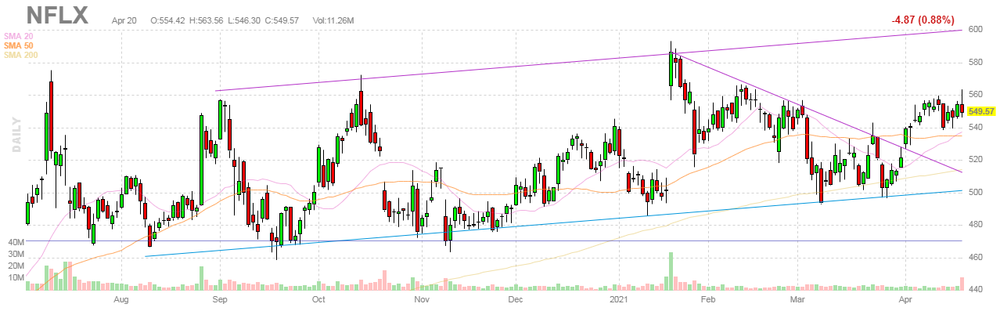
U.S. stock-index futures declined on Wednesday, as Netflix’s (NFLX) disappointing Q1 earnings report put pressure on the tech stocks, while a spike in coronavirus infections in Asia heightened concerns about global economic recovery, dampening investors’ risk appetite.
Global Stocks:
Index/commodity | Last | Today's Change, points | Today's Change, % |
Nikkei | 28,508.55 | -591.83 | -2.03% |
Hang Seng | 28,621.92 | -513.81 | -1.76% |
Shanghai | 3,472.93 | -0.0129 | 0.00% |
S&P/ASX | 6,997.50 | -20.30 | -0.29% |
FTSE | 6,867.88 | +8.01 | +0.12% |
CAC | 6,183.14 | +18.03 | +0.29% |
DAX | 15,089.86 | -39.65 | -0.26% |
Crude oil | $61.34 | -2.12% | |
Gold | $1,787.10 | +0.49% |
FXStreet reports that the Credit Suisse analyst team notes that GBP/USD needs to clear its March high at 1.4017 to reinforce its “double bottom” base above 1.3919 to reinforce the view that the decline from the 1.4237 late February peak remains a corrective phase only within the core longer-term uptrend.
“Above 1.3973, the cable can clear the way for a retest of 1.4009/17, above which should further reinforce the base and our bullish outlook for strength to the ‘measured base objective’ at 1.4169 and eventually a retest of the February YTD highs at 1.4237. We look for a move above here in due course for our 1.4302/77 first and long-held upside target – the 38.2% retracement of the 2014/2020 bear trend and key highs of 2018.
(company / ticker / price / change ($/%) / volume)
3M Co | MMM | 198 | -0.30(-0.15%) | 862 |
ALCOA INC. | AA | 32.79 | -0.19(-0.58%) | 80901 |
ALTRIA GROUP INC. | MO | 47 | -0.19(-0.40%) | 99101 |
Amazon.com Inc., NASDAQ | AMZN | 3,315.00 | -19.69(-0.59%) | 10173 |
American Express Co | AXP | 145.35 | 0.25(0.17%) | 1208 |
Apple Inc. | AAPL | 132.6 | -0.51(-0.38%) | 500876 |
AT&T Inc | T | 29.85 | -0.04(-0.13%) | 96758 |
Boeing Co | BA | 233.17 | -0.89(-0.38%) | 74492 |
Caterpillar Inc | CAT | 227.52 | -0.11(-0.05%) | 4578 |
Chevron Corp | CVX | 100.49 | -0.84(-0.83%) | 13641 |
Cisco Systems Inc | CSCO | 51.58 | -0.21(-0.40%) | 10037 |
Citigroup Inc., NYSE | C | 69.57 | -0.22(-0.32%) | 46655 |
E. I. du Pont de Nemours and Co | DD | 75.05 | -0.08(-0.11%) | 1363 |
Exxon Mobil Corp | XOM | 54.88 | -0.41(-0.74%) | 66475 |
Facebook, Inc. | FB | 301.17 | -1.48(-0.49%) | 46098 |
FedEx Corporation, NYSE | FDX | 279.1 | -1.24(-0.44%) | 914 |
Ford Motor Co. | F | 11.42 | -0.03(-0.26%) | 196979 |
Freeport-McMoRan Copper & Gold Inc., NYSE | FCX | 35.58 | -0.30(-0.84%) | 83512 |
General Electric Co | GE | 12.99 | -0.07(-0.54%) | 311509 |
General Motors Company, NYSE | GM | 55.66 | -0.11(-0.20%) | 61270 |
Goldman Sachs | GS | 331.41 | -0.47(-0.14%) | 3653 |
Google Inc. | GOOG | 2,284.00 | -9.63(-0.42%) | 4187 |
Hewlett-Packard Co. | HPQ | 33.31 | -0.06(-0.18%) | 16433 |
Home Depot Inc | HD | 322.75 | -1.21(-0.37%) | 2112 |
Intel Corp | INTC | 62.5 | -0.20(-0.32%) | 32209 |
International Business Machines Co... | IBM | 137.25 | -0.91(-0.66%) | 19907 |
International Paper Company | IP | 56.42 | 0.01(0.02%) | 428 |
Johnson & Johnson | JNJ | 165.04 | -1.44(-0.87%) | 9036 |
JPMorgan Chase and Co | JPM | 149.12 | -0.15(-0.10%) | 23729 |
McDonald's Corp | MCD | 232.69 | -0.32(-0.14%) | 732 |
Merck & Co Inc | MRK | 78.45 | -0.12(-0.15%) | 5819 |
Microsoft Corp | MSFT | 257.88 | -0.38(-0.15%) | 64874 |
Nike | NKE | 127.31 | 0.20(0.16%) | 37895 |
Pfizer Inc | PFE | 38.81 | -0.22(-0.56%) | 116512 |
Procter & Gamble Co | PG | 136.77 | -0.98(-0.71%) | 16752 |
Starbucks Corporation, NASDAQ | SBUX | 116.03 | -0.24(-0.21%) | 93400 |
Tesla Motors, Inc., NASDAQ | TSLA | 710.95 | -8.04(-1.12%) | 229817 |
The Coca-Cola Co | KO | 54.06 | -0.11(-0.20%) | 30677 |
Twitter, Inc., NYSE | TWTR | 65.85 | 0.15(0.23%) | 74643 |
UnitedHealth Group Inc | UNH | 398.64 | 2.11(0.53%) | 3591 |
Verizon Communications Inc | VZ | 58.2 | -0.19(-0.33%) | 132208 |
Visa | V | 222.47 | -0.81(-0.36%) | 3367 |
Wal-Mart Stores Inc | WMT | 140.53 | -0.26(-0.18%) | 8449 |
Walt Disney Co | DIS | 182.25 | -0.54(-0.30%) | 42773 |
Yandex N.V., NASDAQ | YNDX | 60.68 | -0.14(-0.23%) | 2381 |
Procter & Gamble (PG) downgraded to Neutral from Buy at Citigroup; target lowered to $150
UnitedHealth (UNH) upgraded to Buy from Hold at Argus; target $450
Morgan Stanley (MS) upgraded to Buy from Hold at Berenberg; target raised to $91
Statistics
Canada reported on Wednesday the country’s consumer price index (CPI) rose 0.5
percent m-o-m in March, the same pace as in the previous month.
On
the y-o-y basis, Canada’s inflation rate surged 2.2 percent last month after
advancing 1.1 percent in February. This was the highest inflation rate since
February 2020.
Economists
had predicted inflation would increase 0.6 percent m-o-m and 2.3 percent y-o-y
in March.
According
to the report, a significant proportion of March’s year-over-year increase was
attributable to a steep decline in prices in March 2020, triggered by the
COVID-19 pandemic.
Compared
with March 2020, prices rose in five of the eight major components, with
transportation (+7.1 percent y-o-y) and shelter (+2.4 percent y-o-y) prices
contributing the most to CPI growth. At the same time, consumers paid less for
clothing and footwear (-5.4 percent y-o-y) and for household operations,
furnishings and equipment (-0.2 percent y-o-y).
Meanwhile, the closely watched the Bank of
Canada's core index rose 1.4 percent y-o-y in March, following a 1.2 percent
y-o-y advance in February.
FXStreet reports that the S&P 500 Index has all but achieved the 4200 area and with the market seen at its “typical” extreme analysts at Credit Suisse are looking for an interim peak here, reinforced by the poor Volume picture and overextended sentiment readings.
“Below support at 4126/21 is needed to add weight to the view of an interim peak at 4200, as this would mark a near-term top for a fall back to 4068, then 4034/20, where we would then look for a fresh floor. Below though would warn of a more protracted correction lower and a move towards the 63-day average, currently at 3933.”
“Big picture, even if correct, our bias would be to view a pullback/correction from 4200 as temporary and corrective, with a clear break in due course seen opening the door to a move to 4260 next, then 4350.”
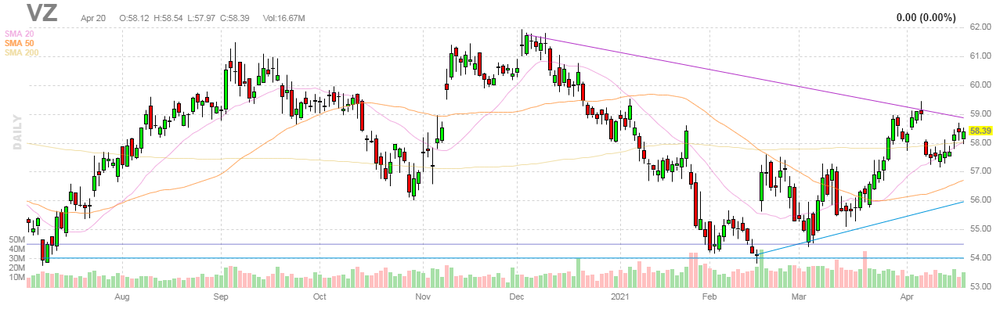
Verizon (VZ) reported Q1 FY 2021 earnings of $1.31 per share (versus $1.26 per share in Q1 FY 2020), beating analysts’ consensus estimate of $1.28 per share.
The company’s quarterly revenues amounted to $32.867 bln (+4.0% y/y), beating analysts’ consensus estimate of $32.473 bln.
The company also reaffirmed guidance for FY 2021, projecting EPS of $5.00-5.15 versus analysts’ consensus estimate of $5.07.
VZ fell to $58.19 (-0.34%) in pre-market trading.
| Time | Country | Event | Period | Previous value | Forecast | Actual |
|---|---|---|---|---|---|---|
| 06:00 | United Kingdom | Producer Price Index - Output (YoY) | March | 0.9% | 1.7% | 1.9% |
| 06:00 | United Kingdom | Producer Price Index - Input (MoM) | March | 0.9% | 0.6% | 1.3% |
| 06:00 | United Kingdom | Producer Price Index - Input (YoY) | March | 3.3% | 4.4% | 5.9% |
| 06:00 | United Kingdom | Producer Price Index - Output (MoM) | March | 0.7% | 0.3% | 0.5% |
| 06:00 | United Kingdom | Retail Price Index, m/m | March | 0.5% | 0.3% | 0.3% |
| 06:00 | United Kingdom | HICP ex EFAT, Y/Y | March | 0.9% | 1.1% | |
| 06:00 | United Kingdom | Retail prices, Y/Y | March | 1.4% | 1.6% | 1.5% |
| 06:00 | United Kingdom | HICP, m/m | March | 0.1% | 0.3% | 0.3% |
| 06:00 | United Kingdom | HICP, Y/Y | March | 0.4% | 0.8% | 0.7% |
| 08:05 | United Kingdom | MPC Member Ramsden Speaks | ||||
| 10:30 | United Kingdom | BOE Gov Bailey Speaks |
USD strengthened against most of its major rivals in the European session on Wednesday as an alarming surge in coronavirus infections in Asia raised concerns about global economic recovery, dampening investors’ risk appetite.
The U.S. Dollar Index (DXY), measuring the U.S. currency's value relative to a basket of foreign currencies, rose 0.12% to 91.35.
According to CNN, India reported 295,041 cases of coronavirus and 2,023 deaths on Wednesday, its highest spike in cases and highest single-day death toll since the beginning of the pandemic.
Japan’s PM Yoshihide Suga said he will decide on the state of emergency measures for the Tokyo and Osaka regions this week, as the major parts of the country are facing a fresh wave of infections. On Wednesday Tokyo reported 843 new infections, the most since January 29, while the number of new COVID-19 cases in Osaka stood at 1,242, a record high for the prefecture.
FXStreet reports that Karen Jones, Team Head FICC Technical Analysis Research at Commerzbank, notes that palladium’s new high has not been confirmed by the daily RSI and this reflects a loss of upside momentum ahead of the all-time high at 2878.04.
“Palladium is approaching the 2020 peak and all-time high at 2878.04. The high so far has been 2848. While it is underpinned by the 20-day ma at 2680, we cannot rule out further upside attempts. However, we note that the new high has not been confirmed by the daily RSI and this reflects a loss of upside momentum ahead of the all-time high and we would tighten up stops as we are concerned that a move higher will not be sustained.”
“The 20-day ma at 2680 guards the 2491.10 February high.”
“Only an unexpected slip below the 2491.10 February high would make us re-evaluate our longer-term bullish view and may lead to further sideways trading around the 2278.99 March low and above the September-to-January lows at 2202.99/2184.67 to be witnessed.”
U.S.
weekly mortgage applications jump 8.6 percent
The
Mortgage Bankers Association (MBA) reported on Wednesday the mortgage
application volume in the U.S. surged 8.6 percent in the week ended April 16,
following a 3.7 percent drop in the previous week. This was the first increase
in seven weeks and the strongest advance since early January.
According
to the report, refinance applications surged 10.4 percent, while applications
to purchase a home rose 5.7 percent.
Meanwhile,
the average fixed 30-year mortgage rate decreased from 3.27 percent to 3.20 percent,
the lowest level in eight weeks.
“Mortgage
rates dropped to their lowest levels in around two months, prompting a small
resurgence in refinance activity after six weeks of declines,” noted Joel Kan,
MBA’s associate vice president of economic and industry forecasting. “Borrowers
acted on the decrease in rates for most loan types, with both conventional and
government refinance applications showing gains.”
FXStreet reports that FX Strategists at UOB Group suggest that USD/CNH could drop to the 6.4700 area on a break below 6.4850.
24-hour view: “USD subsequently dropped to 6.4885 before recovering. The combination of oversold conditions coupled with waning momentum suggest USD is unlikely to weaken further. For today, USD is more likely to trade sideways between 6.4900 and 6.5150.”
Next 1-3 weeks: “We highlighted yesterday that ‘downward momentum has improved, albeit not by all that much’. However, we were of the view that ‘a clear break of 6.5000 would shift the focus to 6.4850’. USD subsequently dropped to 6.4885 before recovering. There is no change in our view and we continue to see downside risk in USD. Looking ahead, the next support below 6.4850 is at 6.4700. On the upside, a breach of 6.5300 (‘strong resistance’ level was at 6.5350 yesterday) would indicate that the downside risk has dissipated.”
Netflix (NFLX) reported Q1 FY 2021 earnings of $3.75 per share (versus $1.57 per share in Q1 FY 2020), beating analysts’ consensus estimate of $2.94 per share.
The company’s quarterly revenues amounted to $7.163 bln (+24.2% y/y), roughly in line with analysts’ consensus estimate of $7.132 bln.
The company also reported Q1 FY 2021 global streaming paid net adds of +3.98 mln versus its prior guidance of +6.00 mln and +8.51 mln in Q4 FY 2020. Analysts had forecast +6.2 mln, according to Factset.
Netflix issued mixed guidance for Q2 FY 2021, projecting EPS of $3.16 versus analysts’ consensus estimate of $2.67 and revenues of $7.302 bln versus analysts’ consensus estimate of $7.37 bln. It also guided to Q2 FY 2021 global streaming net adds of +1.00 mln.
In addition, the company approved a $5 bln share buyback program beginning in FY 2021 with no fixed expiration date. The buyback program is expected to begin this quarter.
NFLX fell to $505.70 (-7.98%) in pre-market trading.
James Smith, a Developed Markets economist at ING, believes that the UK inflation is set to rise above 2% this year but is more likely to drift lower in 2022, suggesting the pressure on the Bank of England (BoE) to tighten policy again will be fairly modest.
"UK inflation bounced back to 0.7% in March, after a series of quirks caused an outsized slowdown in headline CPI to 0.4% in February."
"More importantly, though, this is really the last reading where we are comparing current prices to pre-pandemic levels. From next month, we’ll likely see the rate of CPI more-or-less double. Partly this reflects the slump in energy prices this time last year, but more recently we’ve also had a sharp 9% rise in the household energy cap. These factors, combined with the ongoing cost rises associated with global shipping and Brexit, are likely to push headline inflation above 2% later in the year."
"What matters for policymakers, however, is whether this above-target stint lasts into 2022. And unlike the US, where we expect inflation to be relatively sticky above 2%, we think the UK story is likely to be less exciting."
"We’d also expect any demand-supply imbalances to be more reflected in services prices over coming months, given that this is where consumer resources are likely to be more heavily targeted. Will these sectors take the opportunity to lever up prices? There will undoubtedly be some examples of this, though in general the price of services tends to be much stickier than goods. Indeed, despite the damaging effect of the pandemic on the likes of consumer services, the rate of inflation hasn’t really noticeably slowed (if you strip out the effect of the VAT cut in hospitality)."
"For the Bank of England, all of this has two implications. The fact that inflation is likely to rise this year while the economic outlook is improving suggests little imminent need to look at negative interest rates. However, the less exciting inflation story for 2022 suggests policymakers will be in little rush to tighten policy, which we don’t expect to happen before 2023."
FXStreet notes that gold has set a base above $1755/65 after retesting long-term support at $1682/71. Strategists at Credit Suisse expect XAU/USD to rise towards the $1835 mark.
“Gold has retested and again held key support at $1682/71 - the 38.2% retracement of the entire 2015/2020 bull market and the recent and June 2020 lows - and the subsequent break above $1755/65 has seen a near-term ‘double bottom’ base established.”
“We look for a recovery back to $1835, potentially the 200-day average and downtrend at $1857/83, but with a fresh cap expected here for now.”
CNBC reports that there is a growing body of strategists that believe investors are underestimating the outlook for consumer prices.
David Roche, president of investment firm Independent Strategy, told that he believed the U.S. inflation rate, which stood at 2.6% in March from a year ago, could rise much further.
“My own view is that we will see inflation of probably 3 or 4% by the middle of next year and that is completely inconsistent with, say, U.S. 10-year bond yields being at 1.6%. That yield could easily double and when it does, then you come to the crunch point that markets are going to experience,” he told.
“The reason prices will rise, and really there are a couple of things, is that you’re going to end up with, on the other side of Covid (the pandemic), huge demand as consumers spend the excess savings which they have accumulated,” he said.
“And you’re going to end up with big government forever ... and that of course is less efficient and less efficiency means higher inflation.”
Rising inflation is one of the biggest concerns facing the market right now, as high prices could affect asset values and corporate margins and limit consumer buying power.
eFXdata reports that Credit Agricole discusses its expectations for BoC policy meeting.
"We believe that FX investors are cautious ahead of the April BoC meeting. Ahead of the meeting, investors expect the MPC to announce the start of its QE taper. In our view, a reduction in the pace of asset purchases could be indeed announced this week. Moreover, the BoC could push against the recent frontloading of rate hike expectations," CACIB notes.
"Also focus will be on the Canadian CPI data for March. With many positives in the price already, the CAD could be vulnerable to any dovish surprises from the BoC and/or downside surprises from the incoming data," CACIB adds.
FXStreet reports that economists at MUFG expect the EUR/USD to near the 1.2350 in the month ahead.
“We see scope for the EUR/USD pair to continue to head higher in the month ahead and back towards the highs from earlier this year at just below 1.2350.”
“There has been a notable pick-up in the pace of vaccine roll-out especially in Germany and Spain where the total number of people who have received one dose has increased by more than 50% in the first half of April. It provides encouragement that the eurozone economy will be able to reopen as well during the second half of this year.”
“Market participants are already beginning to anticipate that the ECB will slow down the pace of QE purchases in Q3 which alongside the improving growth outlook is helping to lift European yields and the euro. However, we do not expect the ECB to provide more clarity on QE purchase plans beyond Q2 at the current juncture.”
CNBC reports that oil expert Dan Yergin said that demand and supply pressures will offset each other in the oil market, and it’s possible for prices to remain in its current range in a year’s time as countries recover from the coronavirus crisis.
“If we really do have the rest of the world recover, I think it’s reasonable to think that oil would be in that $60 to $75 range,” the vice chairman of IHS Markit said.
“That’s what the markets are telling us as the U.S. recovers, and China has already recovered,” he told.
While one trader sees prices potentially spiking to $100, Yergin’s perspective is that a lot of supply is still offline, and can meet a surge in demand as global economies recover.
“There’s still a big surplus of oil that has to be brought back into the market,” he said, noting that OPEC and its allies helped to lift prices by cutting production by nearly 10 million barrels per day.
“There’ll be offsetting pressures, and more supply would come in and we’d start to see the U.S. coming back into production again,” he said.
But Yergin acknowledged that it’s difficult to predict where prices will be, and said Europe’s recovery hangs in the balance.
According to the report from Office for National Statistics, UK average house prices increased by 8.6% over the year to February 2021, up from 8.0% in January 2021; this is the highest annual growth rate the UK has seen since October 2014.
The average UK house price was £250,000 in February 2021; this is £20,000 higher than in February 2020.
On a non-seasonally adjusted basis, average house prices in the UK were unchanged between January and February 2021, compared with a decrease of 0.6% in the same period a year ago.
On a seasonally adjusted basis, average house prices in the UK increased by 0.5% between January and February 2021, following an increase of 0.8% in the previous month.
Average house prices increased over the year in England to £268,000 (8.7%), in Wales to £180,000 (8.4%), in Scotland to £162,000 (8.0%) and in Northern Ireland to £148,000 (5.3%).
The North West was the English region to see the highest annual growth in average house prices (11.9%), while London saw the lowest (4.6%).
Reuters reports that Germany's constitutional court paved the way on Wednesday for the country to sign off legislation ratifying the European Union's Recovery Fund as it dismissed legal challenges against the debt-financed investment plan.
The decision is essential for launching the bloc's 750 billion euro recovery spending to mitigate the consequences of the COVID-19 pandemic.
The change that is to be ratified raises the upper limit for national contributions to the EU budget by 0.6 percentage points to 2.0% of gross national income until 2058 to safeguard the repayment of the recovery borrowing in case there is not enough money from taxes planned for that purpose.
Seven out of the eight judges supported the decision, the court said.
FXStreet reports that Jane Foley, Senior FX Strategist at Rabobank, expects the pound to continue appreciating but at a slower pace.
“While we are forecasting further gains for the pound in the months ahead, we do expect the pace of this to be slower than seen at the start of the year. Not only is there a lot of good news priced into the pound but there is likely to be some degree of ‘catch-up’ in the vaccine rollout in the EU.”
"Today the European Internal Market Commissioner Breton has stated that at least 12 of the 27 countries in the bloc are confident that they will be able to vaccinate 70% of their adult population by mid-July. Although such good news is likely to be EUR supportive, we do not expect the EUR to react in the same bullish way as GBP did at the start of the year as the UK’s vaccine roll-out accelerated.”
“We are forecasting EUR/GBP at 0.85 on a 3-month view.”
“We are assuming the USD can recover some ground into the summer and thus look for cable to trade mostly in a GBP/USD 1.38-1.40 range in the coming months.”
CNBC reports that former Treasury Secretary Jacob Lew said that President Joe Biden’s plans to bolster the U.S. economy will help the country compete with China’s massive Belt and Road Initiative.
Lew, who was Treasury secretary from 2013 to 2017 under former President Barack Obama, pointed out that China’s Belt and Road Initiative has gained traction in the last few years. At the same time, the U.S. under former President Donald Trump retreated from the world stage, he said.
“The challenge we have is to look at our domestic challenges and to look at the places where we are very strong and should be stronger,” Lew told. He added that the U.S. is strong in technology and innovation, education, and remaining open to talent from around the world.
“We then look ahead to the challenges of the future ... we have to engage in the world, we have to engage with other countries, working together. And you can’t say we’re not going to be there and then object when someone else shows up,” said Lew.
Lew’s comments came as Biden has held meetings with Democratic and Republican members of Congress to discuss his proposed $2 trillion infrastructure and economic recovery package.
| Time | Country | Event | Period | Previous value | Forecast | Actual |
|---|---|---|---|---|---|---|
| 01:30 | Australia | Leading Index | March | 0.02% | 0.38% | |
| 01:30 | Australia | Retail Sales, M/M | March | -0.8% | 1% | 1.4% |
| 06:00 | United Kingdom | Producer Price Index - Output (YoY) | March | 0.9% | 1.7% | 1.9% |
| 06:00 | United Kingdom | Producer Price Index - Input (MoM) | March | 0.9% | 0.6% | 1.3% |
| 06:00 | United Kingdom | Producer Price Index - Input (YoY) | March | 3.3% | 4.4% | 5.9% |
| 06:00 | United Kingdom | Producer Price Index - Output (MoM) | March | 0.7% | 0.3% | 0.5% |
| 06:00 | United Kingdom | Retail Price Index, m/m | March | 0.5% | 0.3% | 0.3% |
| 06:00 | United Kingdom | HICP ex EFAT, Y/Y | March | 0.9% | 1.1% | |
| 06:00 | United Kingdom | Retail prices, Y/Y | March | 1.4% | 1.6% | 1.5% |
| 06:00 | United Kingdom | HICP, m/m | March | 0.1% | 0.3% | 0.3% |
| 06:00 | United Kingdom | HICP, Y/Y | March | 0.4% | 0.8% | 0.7% |
During today's Asian trading, the US dollar was trading steadily against the pound and the yen, and rose slightly against the euro.
Traders will focus on the meeting of the European Central Bank (ECB), the results of which will be announced on Thursday at 11:45 GMT. Experts expect that the ECB will maintain the current course of monetary policy, as the euro zone economy is recovering slowly and still needs monetary stimulus.
Investors are waiting for the speech of ECB President Christine Lagarde, in which they will look for hints on what the European Central Bank intends to do with the anti-crisis program of asset purchases after June.
Traders would like to hear the ECB's opinion on the outlook for the euro zone economy. Growing optimism about the outlook for the European economy is contributing to higher government bond yields, and traders want to know whether the ECB's outlook is becoming more optimistic, experts at ABN Amro said. Investors are also waiting for more clarity from the ECB on its strategy to curb rising yields.
The ICE index, which tracks the dollar's performance against six currencies (euro, swiss franc, yen, canadian dollar, pound sterling and swedish krona), fell 0.03%.
FXStreet reports that economists at BBH discuss their expectations from the Bank of Canada meeting, the results of which will be announced at 14:00 GMT.
“If the BoC delivers tapering, we would expect USD/CAD to fall and perhaps test the March 18 low near 1.2365. If it does not taper, then we would expect USD/CAD to rise and perhaps test the March 5 high near 1.2735.”
“Longer-term, CAD direction will be driven in large part by broader USD movements. We remain bullish on USD due to the economic outperformance of the US, but the recent slump in US yields has weighed on the greenback.”
EUR/USD
Resistance levels (open interest**, contracts)
$1.2176 (924)
$1.2140 (1834)
$1.2111 (1360)
Price at time of writing this review: $1.2031
Support levels (open interest**, contracts):
$1.1983 (903)
$1.1956 (750)
$1.1922 (736)
Comments:
- Overall open interest on the CALL options and PUT options with the expiration date May, 7 is 52190 contracts (according to data from April, 20) with the maximum number of contracts with strike price $1,2000 (3339);
GBP/USD
$1.4028 (795)
$1.4004 (2260)
$1.3985 (916)
Price at time of writing this review: $1.3941
Support levels (open interest**, contracts):
$1.3827 (674)
$1.3761 (400)
$1.3722 (1876)
Comments:
- Overall open interest on the CALL options with the expiration date May, 7 is 13516 contracts, with the maximum number of contracts with strike price $1,4200 (3763);
- Overall open interest on the PUT options with the expiration date May, 7 is 17128 contracts, with the maximum number of contracts with strike price $1,3700 (1911);
- The ratio of PUT/CALL was 1.27 versus 1.27 from the previous trading day according to data from April, 20
* - The Chicago Mercantile Exchange bulletin (CME) is used for the calculation.
** - Open interest takes into account the total number of option contracts that are open at the moment.
RTTNews reports that the Australian Bureau of Statistics said that the value of retail sales in Australia was up a seasonally adjusted 1.4 percent on month in March, coming in at A$30.724 billion.
That beat expectations for an increase of 1.0 percent following the 0.8 percent decline in February.
Cafes, restaurants and takeaway food services (6 percent) led the industry rises, which were driven by Victoria and Western Australia. Similarly, these states saw rises for Clothing, footwear and personal accessory retailing, and Department stores. These rises were offset by a 1 percent fall in Food retailing.
For the first quarter of 2021, retail sales were down 0.1 percent.
According to the report from Office for National Statistics, the Consumer Prices Index (CPI) rose by 0.7% in the 12 months to March 2021, up from 0.4% to February 2021. Economists had expected a 0.8% increase. On a monthly basis, CPI rose by 0.3% in March 2021, compared with little change in March 2020.
The Consumer Prices Index including owner occupiers’ housing costs (CPIH) rose by 1.0% in the 12 months to March 2021, up from 0.7% to February.
The largest upward contribution to the CPIH 12-month inflation rate came from transport (0.44 percentage points).
Rising prices for motor fuels and clothing resulted in the largest upward contributions to the change in the CPIH 12-month inflation rate between February and March 2021. These were partially offset by falls in the price of food.
On a monthly basis, the CPIH rose by 0.2% in March 2021, compared with little change in March 2020.
As a result of the ongoing restrictions caused by the coronavirus (COVID-19) pandemic, the number of CPIH items identified as unavailable in March 2021 was 67, accounting for 8.2% of the basket by weight; this is slightly down from 69 in February 2021; for the March 2021 price collection, we collected a weighted total of 82.2% of comparable coverage collected before the first lockdown (excluding unavailable items).
| Raw materials | Closed | Change, % |
|---|---|---|
| Brent | 66.22 | -1.34 |
| Silver | 25.805 | 0.07 |
| Gold | 1778.418 | 0.44 |
| Palladium | 2752.16 | -1.24 |
| Time | Country | Event | Period | Previous value | Forecast |
|---|---|---|---|---|---|
| 01:30 (GMT) | Australia | Leading Index | March | 0.02% | |
| 01:30 (GMT) | Australia | Retail Sales, M/M | March | -0.8% | |
| 06:00 (GMT) | United Kingdom | Producer Price Index - Output (YoY) | March | 0.9% | |
| 06:00 (GMT) | United Kingdom | Producer Price Index - Input (MoM) | March | 0.6% | |
| 06:00 (GMT) | United Kingdom | Producer Price Index - Input (YoY) | March | 2.6% | |
| 06:00 (GMT) | United Kingdom | Producer Price Index - Output (MoM) | March | 0.6% | |
| 06:00 (GMT) | United Kingdom | Retail Price Index, m/m | March | 0.5% | |
| 06:00 (GMT) | United Kingdom | HICP ex EFAT, Y/Y | March | 0.9% | |
| 06:00 (GMT) | United Kingdom | Retail prices, Y/Y | March | 1.4% | |
| 06:00 (GMT) | United Kingdom | HICP, m/m | March | 0.1% | |
| 06:00 (GMT) | United Kingdom | HICP, Y/Y | March | 0.4% | |
| 08:05 (GMT) | United Kingdom | MPC Member Ramsden Speaks | |||
| 10:30 (GMT) | United Kingdom | BOE Gov Bailey Speaks | |||
| 12:30 (GMT) | Canada | Consumer Price Index m / m | March | 0.5% | |
| 12:30 (GMT) | Canada | Bank of Canada Consumer Price Index Core, y/y | March | 1.2% | |
| 12:30 (GMT) | Canada | Consumer price index, y/y | March | 1.1% | |
| 14:00 (GMT) | Canada | Bank of Canada Monetary Policy Report | |||
| 14:00 (GMT) | Canada | Bank of Canada Rate | 0.25% | ||
| 14:30 (GMT) | U.S. | Crude Oil Inventories | April | -5.889 | |
| 15:00 (GMT) | Canada | BOC Press Conference |
| Pare | Closed | Change, % |
|---|---|---|
| AUDUSD | 0.7723 | -0.39 |
| EURJPY | 130.059 | -0.07 |
| EURUSD | 1.20336 | -0.02 |
| GBPJPY | 150.584 | -0.41 |
| GBPUSD | 1.39324 | -0.36 |
| NZDUSD | 0.71691 | -0.04 |
| USDCAD | 1.26065 | 0.62 |
| USDCHF | 0.91569 | 0.08 |
| USDJPY | 108.07 | -0.06 |


© 2000-2026. Sva prava zaštićena.
Sajt je vlasništvo kompanije Teletrade D.J. LLC 2351 LLC 2022 (Euro House, Richmond Hill Road, Kingstown, VC0100, St. Vincent and the Grenadines).
Svi podaci koji se nalaze na sajtu ne predstavljaju osnovu za donošenje investicionih odluka, već su informativnog karaktera.
The company does not serve or provide services to customers who are residents of the US, Canada, Iran, The Democratic People's Republic of Korea, Yemen and FATF blacklisted countries.
Izvršenje trgovinskih operacija sa finansijskim instrumentima upotrebom marginalne trgovine pruža velike mogućnosti i omogućava investitorima ostvarivanje visokih prihoda. Međutim, takav vid trgovine povezan je sa potencijalno visokim nivoom rizika od gubitka sredstava. Проведение торговых операций на финанcовых рынках c маржинальными финанcовыми инcтрументами открывает широкие возможноcти, и позволяет инвеcторам, готовым пойти на риcк, получать выcокую прибыль, но при этом неcет в cебе потенциально выcокий уровень риcка получения убытков. Iz tog razloga je pre započinjanja trgovine potrebno odlučiti o izboru odgovarajuće investicione strategije, uzimajući u obzir raspoložive resurse.
Upotreba informacija: U slučaju potpunog ili delimičnog preuzimanja i daljeg korišćenja materijala koji se nalazi na sajtu, potrebno je navesti link odgovarajuće stranice na sajtu kompanije TeleTrade-a kao izvora informacija. Upotreba materijala na internetu mora biti praćena hiper linkom do web stranice teletrade.org. Automatski uvoz materijala i informacija sa stranice je zabranjen.
Ako imate bilo kakvih pitanja, obratite nam se pr@teletrade.global.
транcфери