- Analiza
- Novosti i instrumenti
- Vesti sa tržišta
Forex-novosti i prognoze od 24-04-2018
| raw materials | closing price | % change |
| Oil | 67.72 | -1.34% |
| Gold | 1,332.20 | +0.62% |
| index | closing price | change items | % change |
| Nikkei | +190.08 | 22278.12 | +0.86% |
| TOPIX | +18.96 | 1769.75 | +1.08% |
| Hang Seng | +381.84 | 30636.24 | +1.26% |
| CSI 300 | +77.16 | 3843.49 | +2.05% |
| Euro Stoxx 50 | -2.18 | 3510.88 | -0.06% |
| FTSE 100 | +26.53 | 7425.40 | +0.36% |
| DAX | -21.57 | 12550.82 | -0.17% |
| CAC 40 | +5.61 | 5444.16 | +0.10% |
| DJIA | -424.56 | 24024.13 | -1.74% |
| S&P 500 | -35.73 | 2634.56 | -1.34% |
| NASDAQ | -121.25 | 7007.35 | -1.70% |
| S&P/TSX | -75.06 | 15477.00 | -0.48% |
| Pare | Closed | % change |
| EUR/USD | $1,2233 | +0,20% |
| GBP/USD | $1,3980 | +0,30% |
| USD/CHF | Chf0,97872 | +0,07% |
| USD/JPY | Y108,81 | +0,10% |
| EUR/JPY | Y133,12 | +0,31% |
| GBP/JPY | Y152,13 | +0,40% |
| AUD/USD | $0,7603 | -0,02% |
| NZD/USD | $0,7114 | -0,55% |
| USD/CAD | C$1,28246 | -0,13% |
| Time | Region | Event | Period | Previous | Forecast |
| 07:30 | Japan | All Industry Activity Index, m/m | February | -1.8% | 0.1% |
| 09:45 | France | Consumer confidence | April | 100 | 100 |
| 11:00 | Switzerland | Credit Suisse ZEW Survey (Expectations) | April | 16.7 | |
| 17:30 | USA | Crude Oil Inventories | April | -1.071 | -2.648 |
| 23:15 | Canada | BOC Gov Stephen Poloz Speaks | | |

Major US stock indexes finished trading in negative territory amid a sharp fall in the shares of the so-called group of technology companies "FAANG", while the growth in yield on 10-year bonds also increased pressure on the market.
Investors also analyzed statistics on the United States. As it became known, housing prices in the US in February rose by 0.6% compared to the previous month, according to the housing price index (HPI) from the Federal Agency for Housing Finance (FHFA). The previously announced increase of 0.8% in January was revised to 0.9%. From February 2017 to February 2018, housing prices rose by 7.2%.
At the same time, the index of consumer confidence from the Conference Board grew in April, after a decline in March. The index now stands at 128.7 (1985 = 100), compared with 127.0 in March. The index of the current situation increased from 158.1 to 159.6, and the index of expectations improved from 106.2 last month to 108.1 this month.
In addition, the US Department of Commerce reported that sales of new homes increased by 4.0%, to a seasonally adjusted annual figure of 694,000 units. The sales pace in February was revised to 667,000 units from the previously announced 618,000 units. Data for January were also revised to show that sales remained unchanged, but not decreased. Economists predicted that sales of new homes increased by 1.9%, to 630,000.
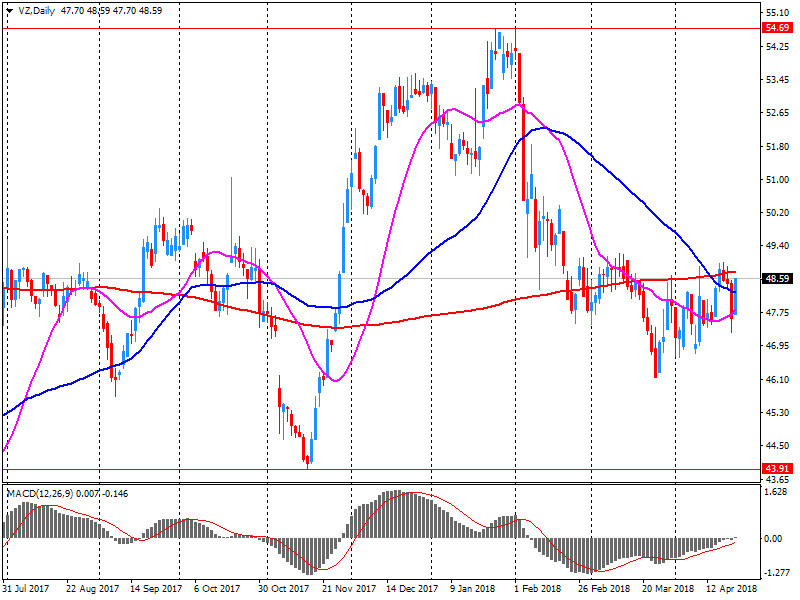
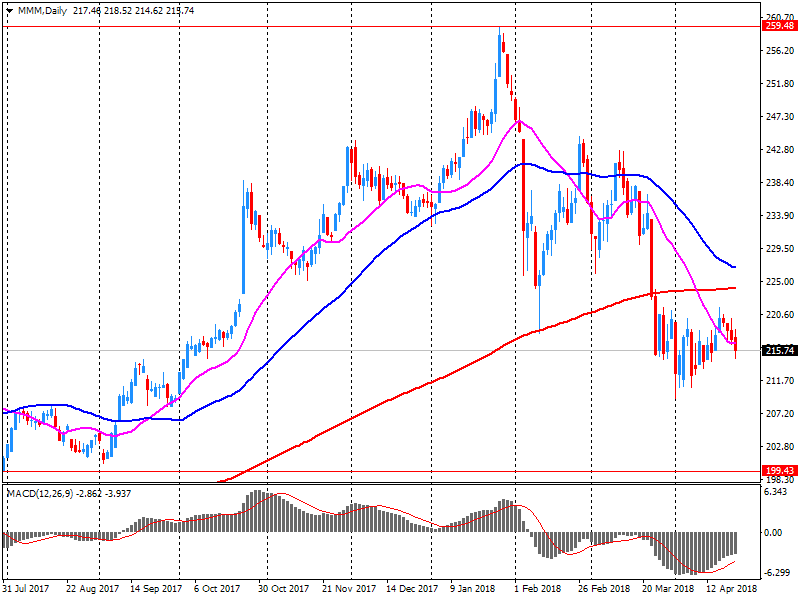
Most components of the DOW index recorded a decline (24 out of 30). Outsider were shares of 3M Company (MMM, -6.91%). Leader of growth were shares of Verizon Communications Inc. (VZ, + 1.69%).
Almost all sectors of S & P finished trading in the red. The largest decrease was registered in the sector of industrial goods (-2.8%). Only the utilities sector grew (+ 0.2%).
At closing:
Dow 24,024.13 -424.56 -1.74%
S&P 500 2,634.56 -35.73 -1.34%
Nasdaq 100 7,007.35 -121.25 -1.70%
Sales of new single-family houses in March 2018 were at a seasonally adjusted annual rate of 694,000, according to estimates released jointly today by the U.S. Census Bureau and the Department of Housing and Urban Development. This is 4.0 percent above the revised February rate of 667,000 and is 8.8 percent
above the March 2017 estimate of 638,000.
The median sales price of new houses sold in March 2018 was $337,200. The average sales price was $369,900.
U.S. stock-index futures rose moderately on Tuesday, as Treasury yields eased, while strong quarterly results and full-year guidance from industrial heavyweights Caterpillar (CAT) and United Technologies (UTX) reinforced investors' optimism about the first-quarter earnings season.
Global Stocks:
| Index/commodity | Last | Today's Change, points | Today's Change, % |
| Nikkei | 22,278.12 | +190.08 | +0.86% |
| Hang Seng | 30,636.24 | +381.84 | +1.26% |
| Shanghai | 3,128.60 | +60.59 | +1.97% |
| S&P/ASX | 5,921.60 | +35.60 | +0.60 |
| FTSE | 7,427.44 | +28.57 | +0.39% |
| CAC | 5,439.52 | +0.97 | +0.02% |
| DAX | 12,582.23 | +9.84 | +0.08% |
| Crude | $68.93 | | +0.42% |
| Gold | $1,326.20 | | +0.17% |
U.S. house prices rose in February, up 0.6 percent from the previous month, according to the Federal Housing Finance Agency (FHFA) seasonally adjusted monthly House Price Index (HPI). The previously reported 0.8 percent increase in January was revised upward to 0.9 percent.
The FHFA monthly HPI is calculated using home sales price information from mortgages sold to, or guaranteed by, Fannie Mae and Freddie Mac. From February 2017 to February 2018, house prices were up 7.2 percent.
For the nine census divisions, seasonally adjusted monthly price changes from January 2018 to February 2018 ranged from 0.1 percent in the West North Central division to +1.6 percent in the East South Central division. The 12-month changes were all positive, ranging from +4.8 percent in the Middle Atlantic division to +10.3 percent in the Pacific division.
(company / ticker / price / change ($/%) / volume)
| 3M Co | MMM | 205.7 | -10.18(-4.72%) | 60319 |
| ALCOA INC. | AA | 51.49 | -0.41(-0.79%) | 42915 |
| ALTRIA GROUP INC. | MO | 56.4 | -0.17(-0.30%) | 9421 |
| Amazon.com Inc., NASDAQ | AMZN | 1,530.00 | 12.14(0.80%) | 50486 |
| AMERICAN INTERNATIONAL GROUP | AIG | 54.65 | -0.53(-0.96%) | 5831 |
| Apple Inc. | AAPL | 165.63 | 0.39(0.24%) | 168541 |
| AT&T Inc | T | 35.2 | 0.31(0.89%) | 87894 |
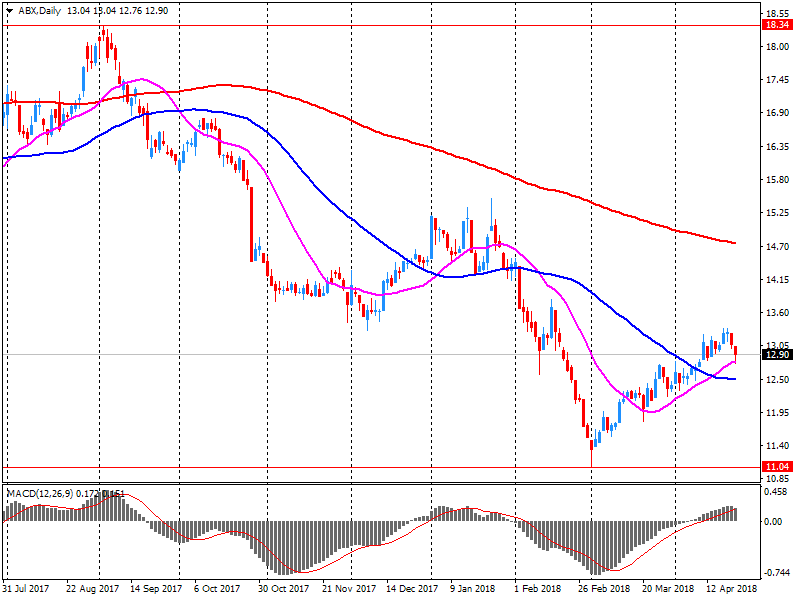
| Barrick Gold Corporation, NYSE | ABX | 12.95 | 0.03(0.23%) | 4490 |
| Boeing Co | BA | 342 | 3.16(0.93%) | 11936 |
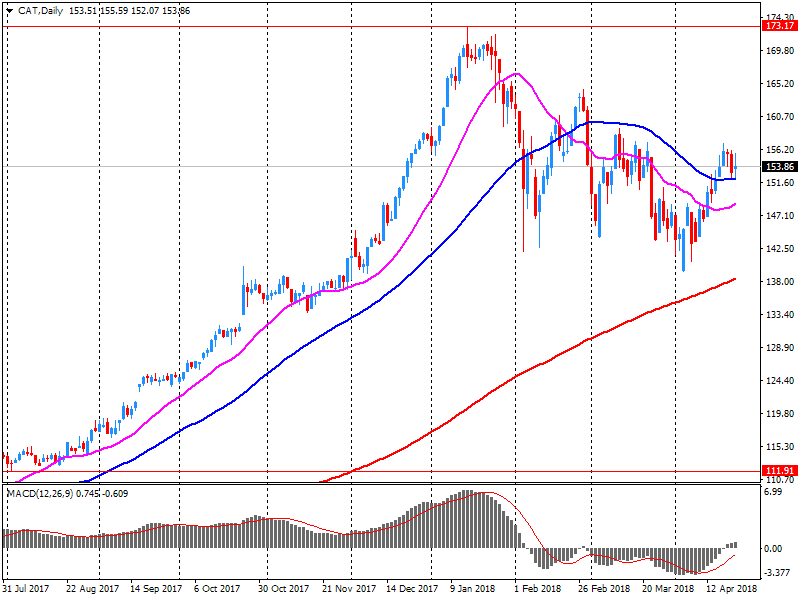
| Caterpillar Inc | CAT | 159.84 | 5.85(3.80%) | 392861 |
| Chevron Corp | CVX | 124.38 | 0.80(0.65%) | 4097 |
| Cisco Systems Inc | CSCO | 44.49 | 0.24(0.54%) | 33031 |
| Citigroup Inc., NYSE | C | 69.9 | 0.42(0.60%) | 13077 |
| Deere & Company, NYSE | DE | 149 | 2.96(2.03%) | 12925 |
| Exxon Mobil Corp | XOM | 79.94 | 0.37(0.47%) | 9764 |
| Facebook, Inc. | FB | 166.1 | 0.26(0.16%) | 84800 |
| Ford Motor Co. | F | 11.05 | 0.01(0.09%) | 55474 |
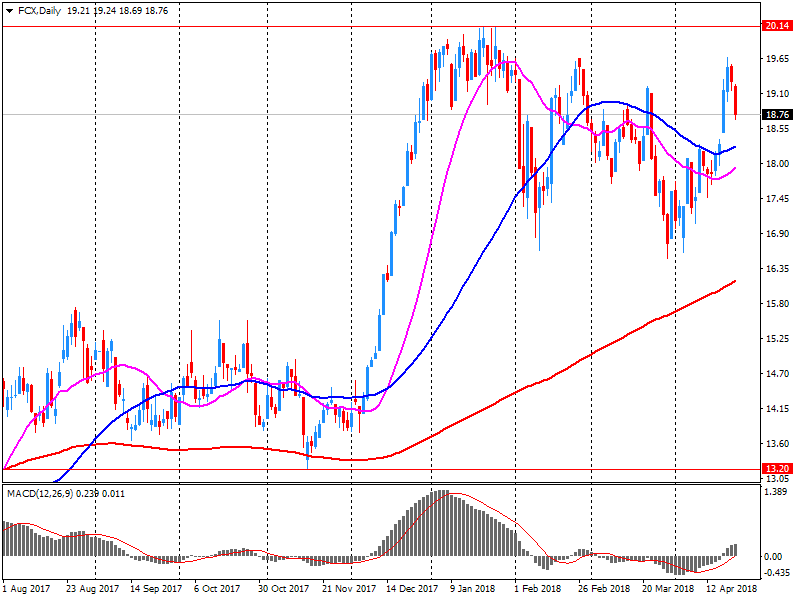
| Freeport-McMoRan Copper & Gold Inc., NYSE | FCX | 18.52 | -0.29(-1.54%) | 62279 |
| General Electric Co | GE | 14.63 | 0.11(0.76%) | 74580 |
| General Motors Company, NYSE | GM | 38.11 | 0.42(1.11%) | 2461 |
| Goldman Sachs | GS | 248.7 | 2.03(0.82%) | 6788 |
| Google Inc. | GOOG | 1,062.50 | -4.95(-0.46%) | 39741 |
| Hewlett-Packard Co. | HPQ | 21.25 | -0.13(-0.61%) | 13770 |
| Home Depot Inc | HD | 179.25 | 1.59(0.90%) | 4453 |
| Intel Corp | INTC | 51.9 | 0.80(1.57%) | 71959 |
| International Business Machines Co... | IBM | 146.31 | 0.45(0.31%) | 8341 |
| International Paper Company | IP | 53.95 | 0.24(0.45%) | 159 |
| Johnson & Johnson | JNJ | 127.44 | 0.61(0.48%) | 1989 |
| JPMorgan Chase and Co | JPM | 111.66 | 0.73(0.66%) | 4616 |
| Merck & Co Inc | MRK | 60.5 | 0.25(0.41%) | 4079 |
| Microsoft Corp | MSFT | 96.12 | 0.77(0.81%) | 31072 |
| Pfizer Inc | PFE | 36.98 | 0.18(0.49%) | 3021 |
| Procter & Gamble Co | PG | 73.42 | 0.42(0.58%) | 12574 |
| Tesla Motors, Inc., NASDAQ | TSLA | 286.01 | 2.64(0.93%) | 27854 |
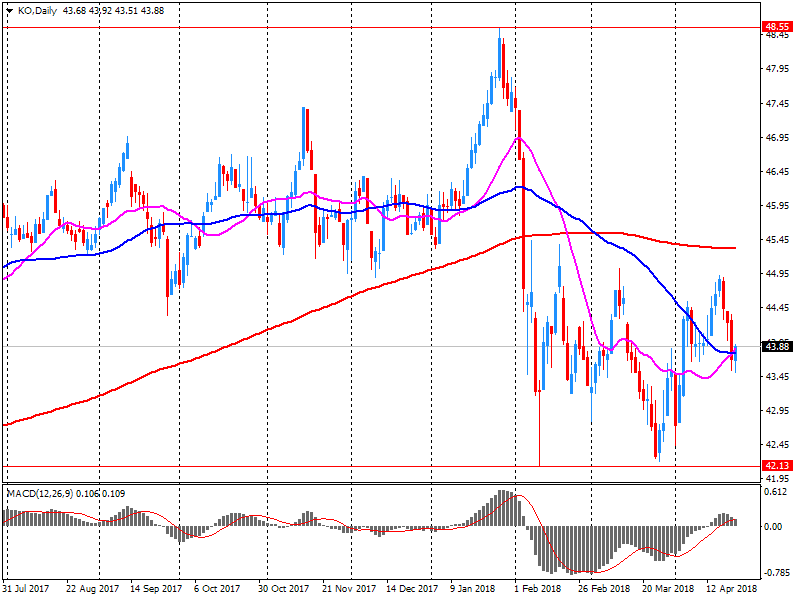
| The Coca-Cola Co | KO | 44.3 | 0.32(0.73%) | 115410 |
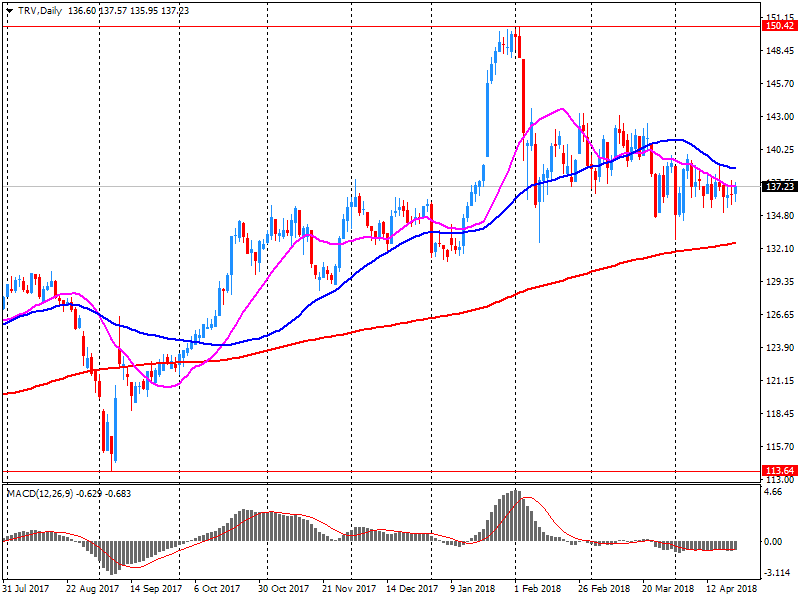
| Travelers Companies Inc | TRV | 133.28 | -3.95(-2.88%) | 5957 |
| Twitter, Inc., NYSE | TWTR | 31.44 | 0.22(0.70%) | 106088 |
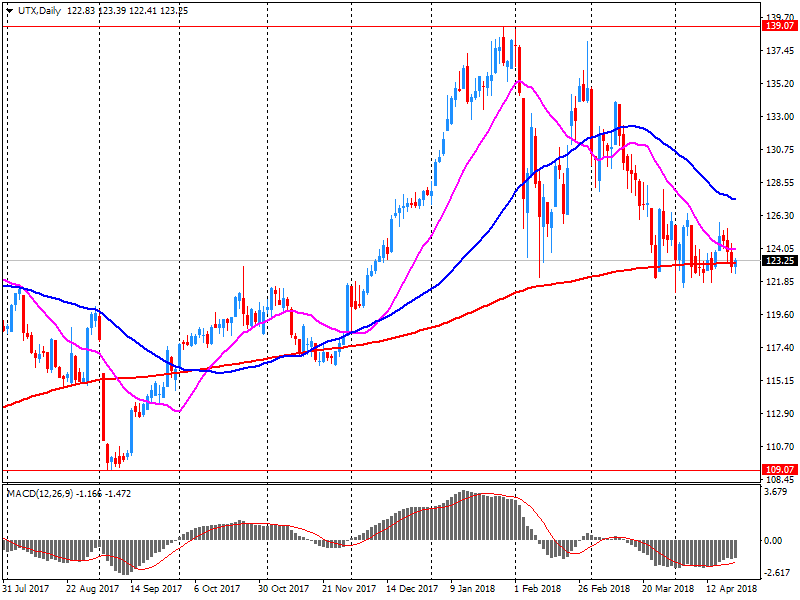
| United Technologies Corp | UTX | 125.95 | 2.49(2.02%) | 37537 |
| UnitedHealth Group Inc | UNH | 236.35 | 2.01(0.86%) | 4254 |
| Verizon Communications Inc | VZ | 50.26 | 1.60(3.29%) | 289390 |
| Visa | V | 125.19 | 0.73(0.59%) | 5647 |
| Wal-Mart Stores Inc | WMT | 86.69 | 0.59(0.69%) | 3941 |
| Walt Disney Co | DIS | 100.75 | 0.60(0.60%) | 2646 |
| Yandex N.V., NASDAQ | YNDX | 34.8 | 0.73(2.14%) | 13928 |
Alphabet A (GOOGL) target lowered to $970 from $1040 at Pivotal Research Group
Alphabet A (GOOGL) target lowered to $1225 from $1275 at MoffetNathanson
Freeport-McMoRan (FCX) reported Q1 FY 2018 earnings of $0.46 per share (versus $0.15 in Q1 FY 2017), missing analysts' consensus estimate of $0.56.
The company's quarterly revenues amounted to $4.868 bln (+45.7% y/y), missing analysts' consensus estimate of $4.923 bln.
FCX fell to $18.61 (-1.06%) in pre-market trading.
Verizon (VZ) reported Q1 FY 2018 earnings of $1.11 per share (versus $0.95 in Q1 FY 2017), in-line with analysts' consensus estimate.
The company's quarterly revenues amounted to $31.772 bln (+6.6% y/y), beating analysts' consensus estimate of $31.251 bln.
VZ rose to $50.00 (+2.75%) in pre-market trading.
Caterpillar (CAT) reported Q1 FY 2018 earnings of $2.82 per share (versus $1.28 in Q1 FY 2017), beating analysts' consensus estimate of $2.10.
The company's quarterly revenues amounted to $12.859 bln (+30.9% y/y), beating analysts' consensus estimate of $11.989 bln.
The company also raised guidance for FY 2018, projecting EPS of $10.25-11.25 (versus analysts' consensus estimate of $9.15), up from $8.25-9.25.
CAT rose to $160.25 (+4.07%) in pre-market trading.
3M (MMM) reported Q1 FY 2018 earnings of $2.50 per share (versus $2.16 in Q1 FY 2017), beating analysts' consensus estimate of $2.48.
The company's quarterly revenues amounted to $8.278 bln (+7.70% y/y), generally in-line with analysts' consensus estimate of $8.213 bln.
The company lowered guidance for FY 2018, projecting EPS of $10.20-10.55 (compared to analysts' consensus estimate of $10.54 and its prior expectation of $10.20-10.70) and organic sales growth guidance in the range of +3-4% y/y (compared to a prior range of +3-5% y/y).
MMM fell to $208.00 (-3.65%) in pre-market trading.
United Tech (UTX) reported Q1 FY 2018 earnings of $1.77 per share (versus $1.48 in Q1 FY 2017), beating analysts' consensus estimate of $1.51.
The company's quarterly revenues amounted to $15.242 bln (+10.3% y/y), beating analysts' consensus estimate of $14.623 bln.
The company also raised guidance for FY 2018. It now sees EPS of $6.95-7.15 (compared to its prior estimate of $6.85-7.10 and analysts' consensus estimate of $7.05) and revenues of $63.0-64.5 bln (compared to its prior estimate of $62.5-64.0 bln and analysts' consensus estimate of $64.01 bln).
UTX rose to $126.99 (+2.86%) in pre-market trading.
Coca-Cola (KO) reported Q1 FY 2018 earnings of $0.47 per share (versus $0.43 in Q1 FY 2017), beating analysts' consensus estimate of $0.46.
The company's quarterly revenues amounted to $7.600 bln (-16.6% y/y), beating analysts' consensus estimate of $7.318 bln.
The company reaffirmed guidance for FY 2018, projecting EPS of ~$2.06-2.10 (+8-10% y/y) versus analysts' consensus estimate of $2.10.
KO rose to $44.40 (+0.96%) in pre-market trading.
Barrick Gold (ABX) reported Q1 FY 2018 earnings of $0.15 per share (versus $0.14 in Q1 FY 2017), beating analysts' consensus estimate of $0.14.
The company's quarterly revenues amounted to $1.790 bln (-10.2% y/y), generally in-line with analysts' consensus estimate of $1.805 bln.
ABX rose to $13.00 (+0.62%) in pre-market trading.
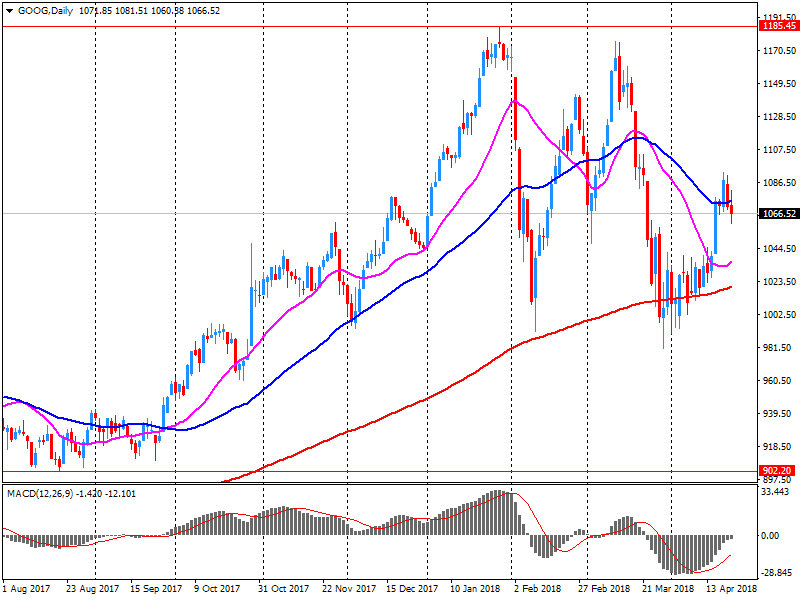
Alphabet (GOOG) reported Q1 FY 2018 earnings of $9.93 per share (versus $7.73 in Q1 FY 2017), beating analysts' consensus estimate of $9.28.
The company's quarterly revenues amounted to $31.146 bln (+25.8% y/y), beating analysts' consensus estimate of $30.283 bln.
GOOG rose to $1,075.00 (+0.71%) in pre-market trading.
The survey of 356 manufacturers revealed that optimism about general business conditions deteriorated marginally, while domestic orders were largely unchanged on the quarter. Output growth slowed somewhat, but remained well above the long-run average.
In contrast, optimism regarding export prospects for the year ahead continued to improve at an above-average pace, while export orders growth accelerated at the fastest pace in more than 20 years. Meanwhile, inventories of raw materials rose at the fastest pace since 1977.
Public sector net borrowing (excluding public sector banks) decreased by £3.5 billion to £42.6 billion in the latest financial year (April 2017 to March 2018), compared with the previous financial year; this is the lowest net borrowing since the financial year ending March 2007.
The Office for Budget Responsibility (OBR) forecast that public sector net borrowing (excluding public sector banks) for the latest financial year (April 2017 to March 2018) would be £45.2 billion, that is, £2.6 billion more than the provisional estimate of £42.6 billion.
Public sector net debt (excluding public sector banks) was £1,798.0 billion at the end of March 2018, equivalent to 86.3% of gross domestic product (GDP), an increase of £71.2 billion (or 1.0 percentage point as a ratio of GDP) on March 2017.
High spirits among German businesses have evaporated. The ifo Business Climate Index for Germany fell to 102.1 points in April from 103.3 points in March. The indicator for the current business situation fell and expectations also deteriorated. The German economy is slowing down.
In manufacturing the business climate deteriorated for the third consecutive month. Assessments of the current business situation declined but nevertheless remain at a high level. Business expectations dropped to their lowest ebb since August 2016. Capacity utilisation fell by 0.3 percentage points to 87.7 percent. However, it remains above its long-term average of 83.6 percent.
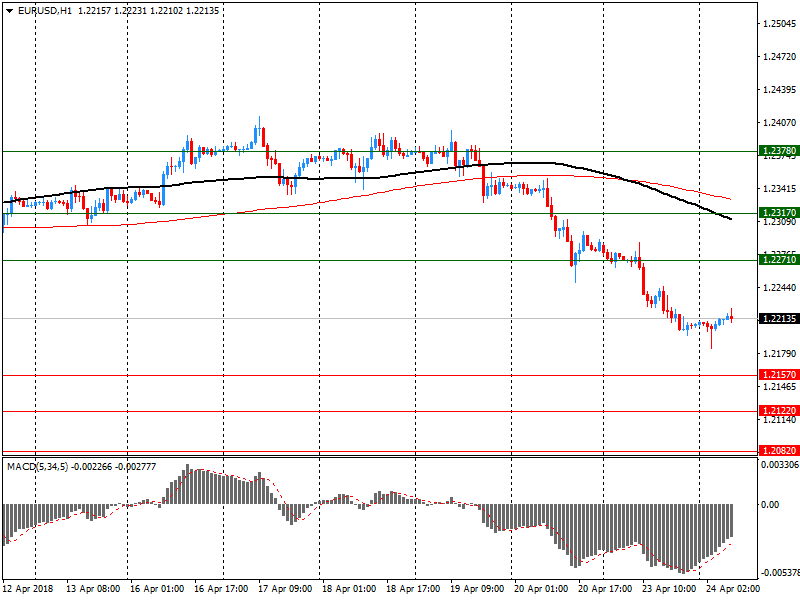
EUR/USD
Resistance levels (open interest**, contracts)
$1.2378 (2331)
$1.2317 (270)
$1.2271 (217)
Price at time of writing this review: $1.2213
Support levels (open interest**, contracts):
$1.2157 (3775)
$1.2122 (2551)
$1.2082 (3227)
Comments:
- Overall open interest on the CALL options and PUT options with the expiration date May, 4 is 77464 contracts (according to data from April, 23) with the maximum number of contracts with strike price $1,2650 (4236);
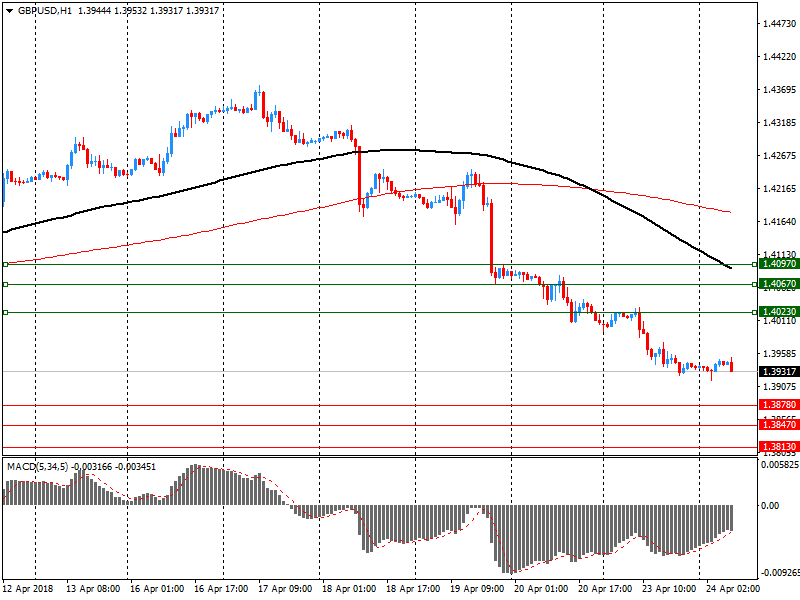
GBP/USD
Resistance levels (open interest**, contracts)
$1.4097 (931)
$1.4067 (644)
$1.4023 (414)
Price at time of writing this review: $1.3932
Support levels (open interest**, contracts):
$1.3878 (1172)
$1.3847 (2091)
$1.3813 (2259)
Comments:
- Overall open interest on the CALL options with the expiration date May, 4 is 22599 contracts, with the maximum number of contracts with strike price $1,4400 (3262);
- Overall open interest on the PUT options with the expiration date May, 4 is 24858 contracts, with the maximum number of contracts with strike price $1,3850 (2259);
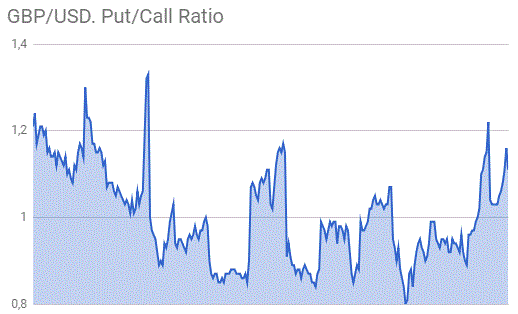
- The ratio of PUT/CALL was 1.10 versus 1.11 from the previous trading day according to data from April, 23
* - The Chicago Mercantile Exchange bulletin (CME) is used for the calculation.
** - Open interest takes into account the total number of option contracts that are open at the moment.
The Consumer Price Index (CPI) rose 0.4 per cent in the March quarter 2018, the latest Australian Bureau of Statistics (ABS) figures reveal. This follows a rise of 0.6 per cent in the December quarter 2017.
The most significant price rises this quarter are secondary education (+3.3%), gas and other household fuels (+6.0%), pharmaceutical products (+5.6%), vegetables (+3.7%) and medical and hospital services (+1.5%). These price rises were partially offset by falls in international holiday travel and accommodation (-2.4%), audio, visual and computing media and services (-6.1%) and furniture (-2.8%).
Chief Economist for the ABS, Bruce Hockman, said "While the annual CPI rose 1.9 per cent, most East Coast cities have continued to experience annual inflation above 2.0 per cent, due in part to the strength in prices related to Housing and Food. Softer economic conditions in Darwin and Perth have resulted in annual inflation remaining subdued at 1.1 and 0.9 per cent respectively."
-
Most important risk to the outlook remains protectionist trade policies
-
Statistics on job vacancies a symptom of very strong job market
© 2000-2026. Sva prava zaštićena.
Sajt je vlasništvo kompanije Teletrade D.J. LLC 2351 LLC 2022 (Euro House, Richmond Hill Road, Kingstown, VC0100, St. Vincent and the Grenadines).
Svi podaci koji se nalaze na sajtu ne predstavljaju osnovu za donošenje investicionih odluka, već su informativnog karaktera.
The company does not serve or provide services to customers who are residents of the US, Canada, Iran, The Democratic People's Republic of Korea, Yemen and FATF blacklisted countries.
Izvršenje trgovinskih operacija sa finansijskim instrumentima upotrebom marginalne trgovine pruža velike mogućnosti i omogućava investitorima ostvarivanje visokih prihoda. Međutim, takav vid trgovine povezan je sa potencijalno visokim nivoom rizika od gubitka sredstava. Проведение торговых операций на финанcовых рынках c маржинальными финанcовыми инcтрументами открывает широкие возможноcти, и позволяет инвеcторам, готовым пойти на риcк, получать выcокую прибыль, но при этом неcет в cебе потенциально выcокий уровень риcка получения убытков. Iz tog razloga je pre započinjanja trgovine potrebno odlučiti o izboru odgovarajuće investicione strategije, uzimajući u obzir raspoložive resurse.
Upotreba informacija: U slučaju potpunog ili delimičnog preuzimanja i daljeg korišćenja materijala koji se nalazi na sajtu, potrebno je navesti link odgovarajuće stranice na sajtu kompanije TeleTrade-a kao izvora informacija. Upotreba materijala na internetu mora biti praćena hiper linkom do web stranice teletrade.org. Automatski uvoz materijala i informacija sa stranice je zabranjen.
Ako imate bilo kakvih pitanja, obratite nam se pr@teletrade.global.
