- Analiza
- Novosti i instrumenti
- Vesti sa tržišta
Forex-novosti i prognoze od 31-12-2021
- The USD/JPY edges higher in the year’s last trading day, up some 0.03%.
- A risk-off market mood put capped the downtrend of the USD/JPY.
- USD/JPY Price Forecast: The upward bias to continue, a break above 115.20 would open the door for a test of the YTD high at 115.52.
As of year-end looms, the USD/JPY extends its rally to three consecutive days, trading at 115.12 during the New York session at the time of writing. A risk-off market mood, as portrayed by US equity indices trading in the red, while the CAC 40 and FTSE 100, the only two European stock markets open, slide between 0.28% and 0.32%, each.
In the meantime, US Treasury yields, with the 10-year benchmark note, edge lower one and a half basis points, down to 1.502%, a headwind for the USD/JPY. The US Dollar Index, a measure of the greenback’s value against a basket of six rivals, slides some 0.28%, sits at 95.70.
Thin liquidity conditions attributed to holidays in Japan, Australia, and New Zealand kept the USD/JPY within familiar levels. The lack of worldwide macroeconomic news, as investors book profits, put a lid on the USD/JPY, which in the last hour or so, retraced from monthly highs.
USD/JPY Price Forecast: Technical outlook
The USD/JPY hourly chart portrays the pair has an upward bias, even though it dipped to the confluence of the 50-hour simple moving average (SMA) and the daily pivot point around 115.06.
To the upside, USD/JPY’s first resistance is the year-to-date high is the November 24 high at 115.52. A breach of that level would expose crucial resistance levels, like the 116.00, followed by the December 2016 swing lows at 118.65.
On the other hand, the first line of defense for USD bulls would be 115.00. A break of that level would be the December 29 cycle low at 114.67 and the 200-hour SMA at 114.60.
-637765646941546731.png)
- The S&P 500 is flat in subdued trade on the final session of 2021, having slipped back under 4800 on Thursday.
- The index is on course to post an annual return of more than 27%.
- All the major US indices were powered higher in 2021 by massive fiscal and monetary stimulus plus mass vaccine rollouts.
After sliding back under the 4780 level after printing record intra-day highs earlier in the session near 4810 on Thursday, the S&P 500 is trading in subdued fashion in the 4770s on Friday. Trading conditions have been especially light, with European markets either shut or closing early and a great number of US market participants also on holiday for New Year’s celebrations. Despite trading roughly 0.75% lower versus Thursday’s record highs, the S&P 500 remains on course to close out the week about 1.0% higher, after power above resistance in the 4740 area (the November and earlier December highs) on Monday.
Equity market sentiment has been given a substantial boost in recent sessions (the S&P 500 is more than 5.0% higher versus last week’s lows) as more and more data confirmed the fast-spreading Omicron variant to be substantially milder than prior Covid-19 strains. Meanwhile, the US FDA last week approved two effective at-home treatments (oral pills) for Covid-19. Meanwhile, evidence in the form of December business sentiment survey data, card spending data and the latest weekly jobless claims report all suggest the US economy has (so far) held up well in the face of surging Omicron infection rates.
Whilst Omicron does pose downside risks to economic activity in Q1 2022, with analysts highlighting store closures across the US and rampant flight cancellations, most suspect this will be economic activity delayed rather than permentantly lost. Analysts (and the Fed) view the US economy as much better adapted to cope with future Covid-19 infection waves.
Looking ahead to 2022, focus is likely to shift away from the pandemic and back onto earnings and the Fed. The Q3 2021 earnings season (in October) helped power US equities at the time to fresh record levels and analyst expectations are high that Q4 performance should be strong as well. This may provide US equities with tailwinds, though investors will also have to deal with the possibility that the Fed might start hiking interest rates as soon as March, by which time it will have completely unwound its QE programme. At the moment, investors are confident that in the long-run, Fed policy will remain highly accommodative by historical standards (hence why 10 and 30-year yields remain so low) and, as long as this remains the case, equities should be able to weather any near-term Fed hawkishness.
That suggests that even in wake of its best annual performance since 1999, during which time the S&P 500 has rallied more than 27% on the year, the outlook for 2022 remains upbeat. For reference, the Nasdaq 100 index is also on course to clock a roughly 27% annual gain, while the Dow is up just shy of 19%. All the major US indices were powered higher in 2021 by massive fiscal and monetary stimulus, as well as easing pandemic concerns amid mass vaccine rollouts.
- Euro rises to seven-week highs versus Japanese yen on the last day of 2021.
- Short-term bias points to the upside in EUR/JPY.
- Next resistance located around 131.00, horizontal level and upper limit of the channel.
The EUR/JPY is rising on Friday, confirming the break of the 20-week moving average. The next level to watch in the weekly chart could be seen at 131.50, with a close above opening the doors to more gains.
The bias is to the upside in the short term as it moves within an upward channel. The upside limit is seen slightly above 131.00. The mentioned level is also a horizontal support; the euro could likely make a stop in there and a pullback.
The bullish tone will remain intact as long as it holds above the 21-SMA in the four hours chart and the lower limit of the channel, both levels around 131.25. A slide below should point to weakness ahead with the next support at 129.75.
More gains are likely if EUR/JPY breaks and holds above 131.00. The next critical resistance stands at 131.60.
EUR/JPY 4-hour chart
-637765637721229615.png)
- USD/TRY is set to end the week 20% higher, though the rally has stalled at resistance in the 13.50 area.
- Investors remain fearful as President Erdogan continues to push “new economic programme” despite surging inflation.
- TRY has lost more than 40% of its value versus USD this year, its worst annual performance in two decades.
USD/TRY is on course to post a fifth successive day of gains during which time its has rallied from underneath the 11.00 mark to current levels just above 13.00. That marks a roughly 20% rally on the week and corresponds to an approximate 18.5% depreciation in the value of the lira versus the US dollar. The pace of USD/TRY’s rally has subsided somewhat this Friday, however, with the “only” trading higher on the day by about 0.6%, a tiny intra-day move in the context of recent USD/TRY volatility. The pair seemed to find resistance at its 21-day moving average which currently resides close to 13.50.
Renewed calls from Turkish President Recep Erdogan on Friday for Turks to have trust in his “new economic programme” has not had any notable intra-day impact on the price action. The President rallied against dollarisation/the use of other medium’s of exchange in the Turkish economy, saying "I want all my citizens to keep their savings in our own money, to run all their business with our own money, and I recommend this”. “Let's not forget this” he continued in a speech to a Turkish business group, “as long as we don't take our own money as a benchmark, we are doomed to sink. The Turkish Lira, our money, that is what we will go forward with. Not with this foreign currency, that foreign currency.”
Erdogan’s new economic programme batters lira
The implementation of Erdogan’s “new economic programme” has put the lira on course to post its worst annual return in more than two decades. The lira has lost more than 40% of its value versus the US dollar. Erdogan thinks high-interest rates as a cause of inflation (the opposite of classic economic orthodoxy) and has exerted pressure on the CBRT, which is supposed to be independent of the government, to cut interest rates despite high inflation. Indeed, even though Turkish inflation is likely to close in on 30% in December and some analysts think it could surpass 40% next year, the CBRT has been aggressively cutting interest rates in recent months. Rates have been lower by 500bps since September to 14.0%.
The massive gulf between interest rates and inflation in Turkey means real interest rates reside in deeply negative territory, which has spurred an ongoing flight from the lira, worsened as investors in Turkey fear Erdogan is going to push the nation into hyperinflation.
Lira deposit protection scheme adds to risks
USD/TRY surged as high as 18.0 earlier in the month, but then dropped back to near 10.0 after the Turkish government unveiled a raft of new anti-dollarisation policies including a pledge that the government would protect converted local deposits from losses via lira depreciation. Some analysts saw this as an alternative to rate hikes, hence supporting the currency at the time.
But analysts are clearly skeptical that the Turkish government’s new deposit protection scheme can provide lasting support to the beleaguered lira and reverse the recent dollarisation of the Turkish economy. Analysts at Societe Generale said that while the new assurance could provide some “backstop” for the currency, “market participants need to see tangible steps to address underlying problems in the economy”. In other words, aggressive rate hikes to bring the CBRT rate above the inflation rate and Erdogan permanently stepping back from his meddling in the central bank’s affairs.
That is not going to happen anytime soon, which is likely why the lira has been back under selling pressure this week. Some analysts think the government’s new pledge adds to downside lira risks given that rapid lira depreciation now exposes the government to massive liabilities where it has to reimburse investors for their lira-depreciation-related losses. With CBRT forex reserves sat at a two-decade low of just $8.63B, there is precious little the central bank can do to push back against a new wave of lira selling pressure.
The first week of next year will have a busy schedule regarding economic data. In the US and Canada, employment numbers and ISM figures are due. Also the Federal Reserve will release the minutes from its latest meeting. Analysts from TD Securities expect a net job creation of 30K in Canada during December and NFP at 500K.
Key Quotes:
“The late-December COVID surge likely came too late to prevent a pickup in US payrolls after the gain in November (210k) appeared to be held down by an overly aggressive seasonal factor. In Canada, we look for labour market gains to moderate with 30k jobs added in December, well below the 6m (126k) trend, which should leave the unemployment rate stable at 6.0%.”
“Following the FOMC's decision to double the pace of QE tapering and the projection of a significantly more hawkish dot plot, focus will now turn to the elements that led to the evolution of views among policymakers (including on "maximum employment") after the November meeting. President Biden's nominations for three Fed governor seats could also garner attention.”
“Data already released for December suggest slowing in the ISMs, but to high levels still. We expect the services index to decline more markedly following November's eye-popping jump to 69.1—an all-time high—and given the likely initial impact from Omicron. The mfg index probably fell below the 60 mark for the first time in four months. Anything over 60 is exceptionally strong.”
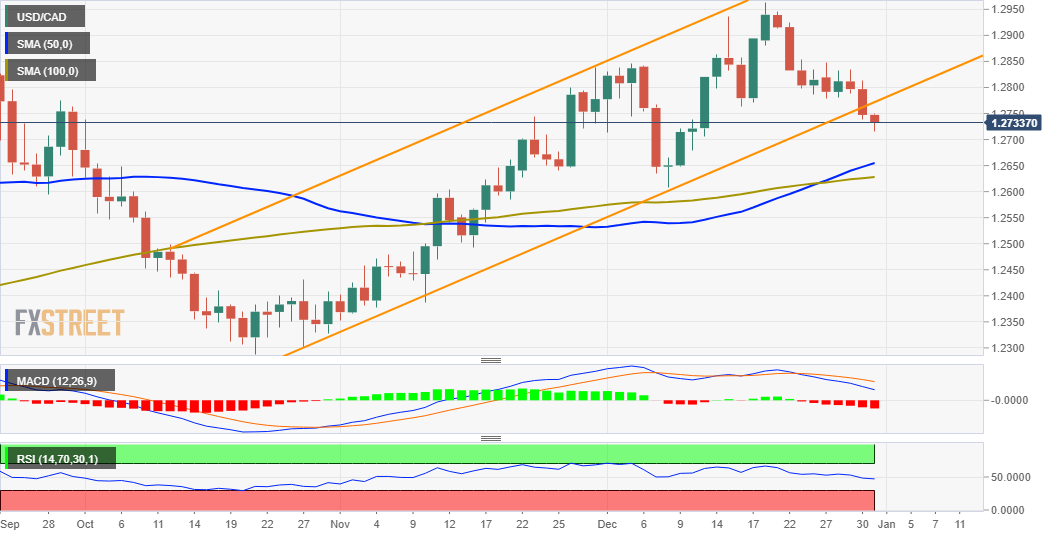
- The loonie advances some 0.55% during the New York session.
- US equity futures point to a lower open in a short-trading session in Wall Street.
- USD/CAD Price Forecast: A break of an upslope trendline might open the door towards the 50-DMA at 1.2652.
The USD/CAD drops to fresh three-week lows during the New York session, trading at 1.2677 at the time of writing. The last trading day of the year has a downbeat market mood; despite that Asian equities closed in the green, European stock indices like the CAC40 and the FTSE 100, the only ones open, are down, while US equity futures slide.
Thin liquidity conditions and a weaker US dollar across the board boost the prospects of the loonie, despite US crude oil prices falling around 1%, as investors close their books, aiming towards 2022. Nevertheless, the US central bank hawkish pivot led by Fed’s Chief Jerome Powell, appearing at the congress on November, emphasizing that inflation is no longer “transitory,” put a lid on the USD/CAD fall, as market participants assess which of the Fed and the Bank of Canada (BoC) would be the first to pull the trigger hiking rates.
USD/CAD Price Forecast: Technical outlook
The USD/CAD daily chart depicts the pair as upward biased in the long-term, but a technical break of an upslope trendline drawn from October 2021 swing lows, paves the way for further losses, as CAD bull’s aims for a test of the 50-day moving average (DMA) at 1.2652.
In the event of breaching the aforementioned, the following USD bulls line of defense would be the 100-DMA at 1.2626, immediately followed by the December 8 swing low at 1.2607.
On the other hand, the first resistance would be 1.2700. A break above that level would expose the December 30 swing low support-turned-resistance at 1.2734. and then the upslope trendline break around the 1.2740-60 area.
-637765594255965103.png)
- NZD/USD remains subdued underneath the 0.6850 level after finding resistance at an uptrend and monthly highs.
- The pair is on course to end the year about 4.8% lower, outperforming AUD on an annual basis.
NZD/USD is trading in a stable fashion just underneath the 0.6850 with New Zealand having now already welcomed in the new year. The pair found resistance at an uptrend that has been capping the price action since early December on Thursday and this, combined with prior monthly highs in the 0.6860s, has kept the currency pair subdued to the south of the 0.6850 mark. Most likely, amid holiday-thinned trading conditions where European markets have already closed for New Year’s Eve and volumes are very low, NZD/USD will continue to trade within its recent intra-day 0.6810s-0.6850 range into the year’s end.
NZD/USD’s gains on the month stand at a modest 0.2%, with the kiwi underperforming the Aussie by a surprising degree in December. For reference, the Aussie is set to gain about 1.9% versus the US dollar. However, NZD/USD is set to close out the year with losses of about 4.8% versus the buck, which is not nearly as bad as the Aussie’s 5.7% (at current prices) loss. Both currencies lost ground versus the US dollar amid a hotter than expected recovery in the US economy and labour market sparking a much larger and longer than anticipated surge in US inflation, thus triggering a hawkish pivot at the Fed. The fact that the New Zealand economy has been running comparatively hotter than the Australian economy, thus prompting the RBNZ to have axed its QE programme long ago and hike interest rates twice, seems to have supported the NZD over AUD.
But as indicated by the divergence in the two currencies’ December performance, investors are clearly doubtful about whether NZD outperformance against the Aussie can continue into 2022. The RBNZ has been known to be the G10’s most hawkish central bank for some time and the risks seem more tilted towards the bank underdelivering rather than overdelivering. Meanwhile, the RBA has room to pivot substantially in a more hawkish direction. While the RBA hasn’t yet conceded that its first post-pandemic rate hikes could be coming any sooner than 2023, markets are priced for the bank to start hikes in 2022 in tandem with the Fed. Strategists might argue that there is thus also substantial room for the RBA to disappoint.
- The Mexican peso is among the top performers on the last day of the year and the best of December.
- USD/MXN extends slide after breaking below 20.45.
The USD/MXN is trading at 20.34, the lowest level since November 10, falling for the fourth consecutive day. The Mexican peso strengthened across the board on the last week of the year and pushed the cross further lower.
Technical factors also contribute to the decline, first with the break of an uptrend line and then with the slide under the 20.45/50 support area. Now USD/MXN is looking at the 200-day simple moving average that awaits at 20.27.
An improvement in market sentiment across global financial markets helped the MXN. The currency was the best performer in December and is about to end the year with small losses versus the US dollar.
The short-term outlook continues to favor the downside, although the daily RSI is approaching 30. So far, no signs of a correction area seen. The area around 20.25/30 should limit the downside and could trigger a rebound to 20.45. If it breaks below, the next support at 20.10 would be exposed.
To remove the negative bias, the dollar needs to rise above 20.90. Before that level, resistance levels are seen at 20.50 and 20.71.
USD/MXN daily chart
-637765581816805877.png)
- EUR/USD has rebounded from its 21DMA at 1.1300 for a second successive day, but remains within recent ranges pre-year end.
- On the year, the pair looks on course to post a 7.0% decline, largely due to Fed/ECB policy divergence.
On the final trading day of the year, a day marred by low liquidity/volumes given market closures across Europe and other parts of the world, EUR/USD has continued to find support at its 21-day moving average. The pair rebounded from a test of the 1.1300 level for a second session running and has, despite the recent closure of the few European markets that had actually been open on New Year’s Eve, is rebounding towards 1.1350. The short-term bulls won’t be getting too excited just yet given that the pair continues to trade within recent ranges and below the 1.1360-80ish monthly highs that have acted as a ceiling over the past few weeks.
EUR/USD is likely to remain subdued within recent ranges for the rest of what will be a very quiet session and looks on course to close out the month ever so slightly in the green. On the year, the pair looks on course to post a 7.0% decline. A blistering US economic and labour market recovery driven by a combination of massive fiscal and monetary stimulus has pushed inflation in the US to four-decade highs and triggered a hawkish pivot from the Fed. While the Eurozone recovery has also been strong and inflationary pressures there are also elevated, the ECB’s hawkish pivot has been much less aggressive (they will taper the pace of QE purchases in 2022, but have not yet set an end date). This has been a key factor weighing on the pair this year.
Looking at EUR/USD from a technical perspective; some technicians might argue that the pair has formed an ascending triangle in December, with gains capped in the upper 1.1300s, whilst the pair posted ever higher lows throughout the month. That suggests a bullish breakout could be in the offing, though this may cut against the fundamentals. Many FX strategists expect dollar strength to persist in Q1 2022 as the Fed winds down its QE buying to zero and perhaps even kicks off its hiking cycle. The market's reaction to what will in all likelihood be a very strong US labour market and ISM PMI survey data next week will be a good guage of the market’s appetite to continue to chase the dollar higher.
- WTI has dipped back into the mid-$75.00s and is currently trading just above weekly lows set earlier in the session.
- Low liquidity and year-end profit-taking has resulted in choppy trading conditions for oil prices on the final day of the year.
- Nonetheless, WTI is set to post massive annual gains of more than 55%.
Front-month WTI futures slipped to fresh lows for the week near $75.00 per barrel in recent trade amid what appears to be some modest profit-taking in holiday-thinned trading conditions on the final session of the year. Prices have since rebounded to around the $75.50 mark, but choppiness may continue into the US session amid expectations for a continued lack of liquidity.
Intra-day volatility that has seen WTI dip just under $1.0 on the session shouldn’t distract from the fact that oil prices are set to post their best annual return since 2009. WTI is set to post gains of more than 55% having surged from lows last January of underneath $50.00 per barrel. Crude oil has surged this year as the global economy has recovered from the 2020 pandemic-induced recession and become more resilient with time to successive waves of the virus, largely thanks to rising vaccination rates.
After surging as high as the $85.00s in October (annual gains of nearly 80% at the time), oil prices saw a sharp correction lower in November and into December on fears of economic disruption and crude oil demand destruction after the emergence of the new, highly transmissible Omicron variant of Covid-19. However, as evidence has built over the last few weeks that the new variant is far milder than any prior strains of the virus and government’s have held off on imposing lockdowns, risk-appetite and crude oil prices have recovered sharply. WTI is thus set to post a monthly gain of about $8.50 or nearly 13% and is more than $12.50 or 20% up from earlier monthly lows in the $62.00s.
But Omicron risks remain, with countries across the world (including the US, UK and Australia)reporting record daily infections and this is capping oil’s gains. The fact that New Year’s celebrations have been canceled across many parts of the world is indicative of some of the near-term risks faced by the global economy and could perhaps be behind some of Friday’s year-end profit-taking. Separately, some investors fear supply-side dynamics could weigh on oil prices in 2022 as OPEC+ and US output climbs.
These fears were on show in a poll released by Reuters on Friday. The median forecast of survey participants was for WTI to average slightly more than $71.00 over the course of 2022, a downwards revision of expectations for next year’s oil prices from the November poll. In the prior poll, the median investor forecast had been for WTI to average just over $73.00 next year. Sources speaking to Reuters earlier in the week said that the cartel looks on track to agree to hike output by 400K barrels per day again in February. According to analysts at Julius Baer, “with oil demand growth slowing, supply growth persisting, and the energy crunch easing, we see the oil market balance expanding rather than shrinking in 2022 and thus expect prices to trend lower from today's levels.”
- Spot gold consolidating close to monthly highs just under $1820, supported from earlier weekly lows by falling real yields.
- XAU/USD looks on course to post a yearly loss of about 4.0%.
- According to a Reuters poll, investors expect losses of a similar magnitude in 2022.
Spot gold prices are consolidating close to monthly highs just under the $1820 mark, have jumped from earlier weekly lows in the $1790 area after finding support at the 21-day moving average as US real yields slid. Despite a notable improvement in the market’s broader appetite for risk as Omicron-related fears about potential economic disruption and hawkish policy shifts at major central banks including the Fed, ECB and BoE, spot gold is on course to post a healthy monthly gain of about 2.5%, having rebounded more than 3.5% from earlier monthly lows under $1760.
Bond and FX market moves this month have been favourable to precious metals; the 10-year TIPS (real) yield is down roughly 12bps to back under -1.1%, while the DXY is flat on the month just under 96.00, having pulled back sharply from earlier monthly highs closer to 97.00. Recall that gold has an inverse relation to both real yields and the dollar as when the former rises, it raises the opportunity cost of holding non-yields gold and when the latter rises, it raises the cost of dollar-denominated gold for international investors.
On the final day of the year, XAU/USD looks on course to post a yearly loss of about 4.0%, its first annual loss in three. According to analysts at Reuters, the “global economic recovery made its (gold’s) safe-haven appeal less attractive… as central banks prepared to raise interest rates to contain inflation”. According to a Reuters poll released at the end of October which asked investors about their outlook for gold in 2022, the median forecast was for the precious metal to average $1750 throughout the year.
If XAU/USD closed out 2022 at this level, that would mark another roughly 4.0% annual decline. To summarise the thinking of many of the poll’s participants; “gold is unlikely to rise much while investors expect the U.S. Federal Reserve to reduce its asset purchases and raise rates” Reuters said, before quoting an analyst at Phillip Futures as saying that "both (QE taper and rate hikes)… are events that traditionally see gold prices put under pressure”.
- AUD/USD consolidated its recent gains and remained confined in a range below the monthly high.
- A softer tone around the equity markets acted as a headwind for the perceived riskier aussie.
- The downside remains cushioned amid receding Omicron fears and thin end-of-year liquidity.
The AUD/USD pair surrendered its modest intraday gains and was last seen hovering near the lower end of the daily trading range, around mid-0.7200s.
The pair struggled to capitalize on its recent upward trajectory and oscillated in a narrow trading band, below the 100-day SMA for the second successive day on Friday. A cautious market mood – as depicted by a softer tone around the equity markets – acted as a headwind for the perceived riskier aussie.
That said, the recent optimism over signs that the Omicron variant might be less severe than feared and is unlikely to derail the economic recovery continued underpinning the risk sentiment. This, along with subdued US dollar price action, should help limit the downside for the AUD/USD pair amid thin end-of-year liquidity.
In the absence of any major market-moving economic releases, the broader market risk sentiment would drive the USD demand and allow traders to grab some short-term opportunities on New Year's Eve. Nevertheless, the AUD/USD pair remains on track to end with modest gains for the second successive week.
The market focus now shifts to important US macro data, including the closely-watched US monthly jobs report (NFP), scheduled at the beginning of a new month. Apart from this, developments surrounding the coronavirus would assist traders to determine the next leg of a directional move for the AUD/USD pair.
Technical levels to watch
- GBP/USD has sliped back under 1.3500 but remains close to monthly highs amid choppy, holiday-thinned trading conditions.
- Following a BoE hike and improvement in Omicron-related sentiment, the pair is on course for a 1.4% monthly gain.
In thin trading conditions on the final day of 2021, GBP/USD is choppy and recently slipped back under the 1.3500 handle. Trading conditions are subdued with many European markets closed for the day and markets in the UK and France shutting early. Though the pair is down about 0.15% on the day as its trades in the 1.3475 area, it only trades about 0.4% below monthly highs hit earlier this week in the 1.3520s. Following a surprise (to some) 15bps rate hike from the BoE midway through the month coupled with a substantial improvement in the market’s appetite for risk as perceived risks to the global economy from the spread of Omicron subside, GBP/USD is on course to post a 1.4% gain on the month.
However, if the GBP/USD closes out the year at current levels, that would mean an annual loss of slightly more than 1.0%. Despite one of the strongest growth rates in the G10 in 2021 for the UK economy and a comparatively hawkish BoE, GBP has been unable to resist the advances of the US dollar, which has powered higher throughout the year as surging US inflation brought forward expectations for Fed policy normalisation. Indeed, some market participants are betting that the bank might immediately commence rate hikes right after the bank’s QE programme ends in March 2022.
Looking at the pair on a shorter time horizon, the fact that GBP/USD ran into resistance just above 1.3500 and failed to push above this level suggests that, for now, further gains may have to wait until the new year. The fact that the pair was able to clear its 50-day moving average with ease earlier in the week suggests that the short-term technical momentum is looking good. As long as the UK economy doesn’t face too much disruption from the spread of Omicron, thus keeping the BoE on course for another rate hike in February, the short-term fundamentals look positive for GBP as well. News on Friday that the UK’s drug regulatory had approved Pfizer’s highly effective at-home Covid-19 treatment pill Paxlovid may further support this positive narrative.
But some FX strategists think that the US dollar, which has pulled back sharply from earlier monthly highs despite continued evidence of elevated inflation, a hot labour market, strong growth conditions and a hawkishly shifting Fed, is overdue a short-term rebound. Perhaps further strong data in the form of next week’s US December labour market reports and December ISM PMI surveys could provide the catalyst for such a rebound. Key levels of support to keep an eye on if the bearish scenario unfolds would be in the 1.3375 area and then the 2021 lows in the 1.3160s.
- A combination of factors assisted USD/CAD to reverse the early slide to a three-week low.
- Ascending channel breakdown supports prospects for an extension of the recent decline.
- Any further recovery move might get sold into and remain capped near the 1.2800 mark.
The USD/CAD pair reversed an intraday dip to a near three-week low and was last seen trading around the 1.2730-35 region, just a few pips below the daily swing high.
A modest pullback in the equity markets benefitted the safe-haven US dollar for the second successive day on Friday. Apart from this, retreating crude oil prices undermined the commodity-linked loonie and assisted the USD/CAD pair to attract some dip-buying near the 1.2715 region.
Looking at the technical picture, the overnight fall and the subsequent decline during the early part of the trading on Friday confirmed a near-term breakdown through an upwards sloping channel. This might have already set the stage for an extension of the recent downfall.
Moreover, technical indicators on the daily chart have just started drifting into the negative territory and add credence to the negative outlook. Hence, any meaningful recovery attempt could be seen as a selling opportunity and runs the risk of fizzling out quickly.
From current levels, any further recovery move is more likely to meet with a fresh supply near the 1.2770-75 horizontal support breakpoint. This, in turn, should cap the upside for the USD/CAD pair near the 1.2800 mark, which should now act as a pivotal point.
That said, a sustained strength beyond might prompt some short-covering move and lift the USD/CAD pair back towards the 1.2835-45 supply zone. Some follow-through buying will negate the negative bias and pave the way for a further near-term appreciating move.
On the flip side, the daily swing low, around the 1.2715 region, now seems to protect the immediate downside ahead of the 1.2700 mark. Failure to defend the mentioned support levels could drag the USD/CAD pair to mid-1.2600s (50-DMA) en-route 100-DMA, around the 1.2625 area.
USD/CAD daily chart
Technical levels to watch
The UK's Medicines and Healthcare Products Regulator Agency (MHRA) announced on Friday that they have approved the oral COVID-19 antiviral, Paxlovid, as reported by Reuters.
Key takeaways
"New combination treatment is for people with mild to moderate COVID-19 who are at high risk of developing severe COVID-19."
"Too early to know whether Omicron variant has any impact on Paxlovid's effectiveness."
"Number of hospitalisations and deaths were 0.8% (3 out of 389) in the Paxlovid group compared with 7% (27 out of 385) in the placebo group."
"The two active substances of Paxlovid come as separate tablets that are packaged together and taken together, twice a day by mouth for 5 days."
"MHRA is proactively working with the company to establish the effectiveness of Paxlovid against omicron."
"Paxlovid authorised for use in people aged 18 & above who have mild to moderate COVID-19 infection & at least 1 risk factor for developing severe illness."
"Based on clinical trial data, Paxlovid is most effective when taken during the early stages of infection."
"Before Paxlovid is prescribed, MHRA is advising that patients' current medications should be carefully reviewed."
Market reaction
This headline doesn't seem to be having a noticeable impact on risk sentiment.
- EUR/USD attracted some dip-buying near the 1.1300 mark amid subdued USD price action.
- Retreating US bond yields acted as a headwind for the greenback amid easing Omicron fears.
- The recent range-bound moves warrant caution before placing aggressive directional bets.
The EUR/USD pair rallied around 30-35 pips from the early European session low and sho to the 1.1335 region, or a fresh daily high in the last hour.
The US dollar struggle to gain any meaningful traction amid a softer tone surrounding the US Treasury bond yields and remained well within the striking distance of the weekly low touched on Wednesday. This, in turn, was seen as a key factor that assisted the EUR/USD pair to defend and attract fresh buying near the 1.1300 round-figure mark on Friday.
Apart from this, the latest optimism over signs that the Omicron variant might be less severe than feared and is unlikely to derail the economic recovery further undermined the safe-haven greenback. That said, the mixed performance in the equity markets, along with the Fed's hawkish outlook should act as a tailwind for the greenback and cap the EUR/USD pair.
Even from a technical perspective, the pair has been oscillating in a familiar trading range since the beginning of this month. This constituted the formation of a rectangle on the daily chart, which points to indecision among traders. Hence, it will be prudent to wait for a strong follow-through buying before positioning for any further appreciating move.
In the absence of any major market-moving economic releases, either from the Eurozone or the US, the broader market risk sentiment and the US bond yields will influence the USD. This, in turn, might provide some impetus to the EUR/USD pair, though the momentum is likely to be restricted amid thin end-of-year trading volumes on New Year's eve.
Technical levels to watch
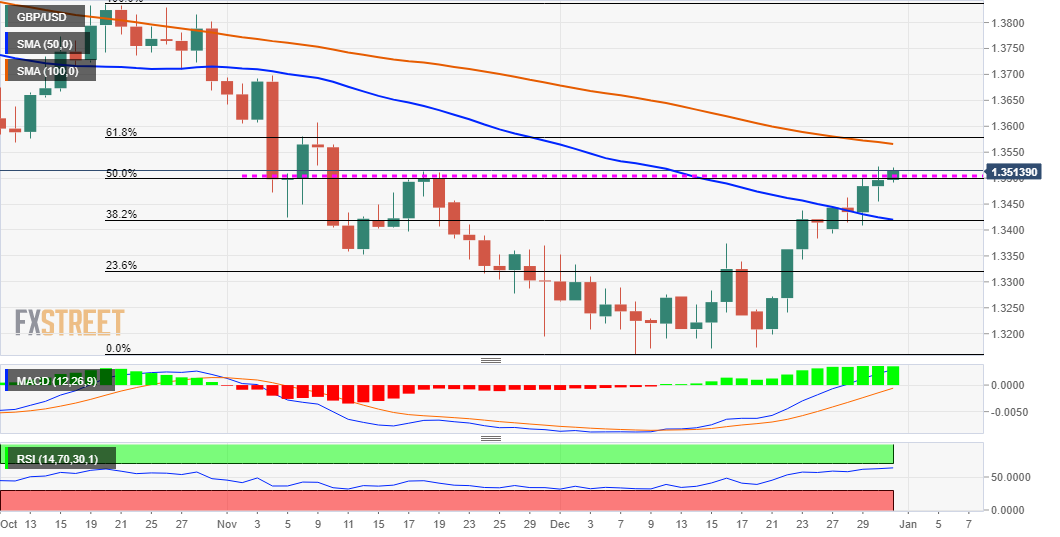
- GBP/USD regained positive traction on Friday and climbed back closer to the monthly high.
- The set-up supports prospects for a move towards testing the 1.3565 confluence resistance.
- Only a sustained break below the 1.3400 mark will negate the near-term positive outlook.
The GBP/USD pair edged during the early part of the European session and shot closer to the highest level since November 10, around the 1.3520 area touched in the previous day.
From a technical perspective, a move back above the 50% Fibonacci level of the 1.3834-1.3161 downfall could be seen as a fresh trigger for bullish traders. This, along with bullish technical indicators on the daily chart, supports prospects for a further near-term appreciating move.
Hence, a subsequent move toward testing the next relevant hurdle, around the 1.3565 confluence region, now looks like a distinct possibility. The mentioned hurdle comprises 61.8% Fibo. level and the 100-day SMA, which if cleared decisively should pave the way for additional gains.
On the flip side, the overnight swing low, around the 1.3455-50 area, now seems to protect the immediate downside. Any further decline could be seen as a buying opportunity near the 38.2% Fibo. level/50-DMA confluence resistance breakpoint, around the 1.3420-15 region.
This, in turn, should help limit the downside near the 1.3400 round-figure mark. Some follow-through selling below the 1.3385-75 region might shift the bias in favour of bearish traders. The GBP/USD pair could then accelerate the fall towards the 23.6% Fibo. level, around the 1.3320 area.
GBP/USD daily chart
Technical levels to watch
- EUR/GBP prolonged its bearish trend witnessed over the past four weeks or so.
- Easing Omicron fears turned out to be a key factor that underpinned the sterling.
The EUR/GBP cross edged lower through the early European session and dropped to the lowest level since February 2020, around the 0.8370-65 region in the last hour.
Following an early uptick to the 0.8400 neighbourhood, the EUR/GBP cross met with a fresh supply on Friday and prolonged its recent bearish trend witnessed over the past four weeks or so. The British pound has been outperforming against its European counterpart amid easing concerns about the potential economic fallout from the continuous surge in new COVID-19 cases.
In fact, Britain reported a record 189,213 new COVID-19 cases on Thursday amid an alarming spread of the Omicron variant. Investors, however, remain optimistic over signs the new strain might be less severe than the Delta variant and is unlikely to derail the economic recovery. Moreover, a UK study indicated that Omicron infections are less likely to lead to hospitalization.
This comes on the back of a surprise rate hike by the Bank of England on December 16, which turned out to be a key factor that continued underpinning the sterling. Conversely, the shared currency, so far, has struggled to gain any meaningful traction and remained at the mercy of the US dollar price dynamics. This was seen as another factor exerting pressure on the EUR/GBP cross.
With the latest leg down, the EUR/GBP cross has now dropped over 200 pips from the vicinity of the 0.8600 mark, or the monthly swing high, which coincided with a multi-month-old descending trend-line resistance. Given that technical indicators on the daily chart are still far from being in the oversold territory, the stage seems all set for a further near-term depreciating move.
Technical levels to watch
- USD/CHF gained traction on Friday and reversed the overnight losses back closer to the monthly low.
- The underlying bullish tone weighed on the safe-haven CHF and extended some support to the major.
- A modest USD strength remains supportive, though any meaningful recovery move still seems elusive.
The USD/CHF pair traded with a positive bias through the early European session and was last seen hovering near the daily top, just below mid-0.9100s.
A combination of factors assisted the USD/CHF pair to attract some buying near the 0.9130 area on Friday and rebound from the vicinity of the monthly low touched earlier this week. The underlying bullish tone in the financial markets weighed on the safe-haven Swiss franc. This, along with a modest US dollar strength provided a modest lift to the USD/CHF pair.
Investors remain optimistic over signs that the Omicron variant might be less severe than feared and is unlikely to derail the economic recovery. This, to a larger extent, helped offset worries about the continuous surge in new COVID-19 cases and continued boosting investors' sentiment. This was evident from the recent runup in the global equity markets.
On the other hand, the USD edged higher for the second successive day and was supported by Thursday's upbeat US macro data. In fact, the US Initial Weekly Jobless Claims fell to the lowest level since 1969 in the week ended December 24. Separately, the Chicago PMI beat expectations and rose to 63.1 for the current month from 61.8 in November.
It, however, remains to be seen if the USD/CHF pair is able to capitalize on the recovery amid absent relevant fundamental catalyst and thin end-of-year trading volumes. From a technical perspective, the overnight sharp intraday fall of around 50 pips validated the recent break below the 200-day SMA and supports prospects for a further depreciating move.
Hence, any subsequent recovery move might still be seen as a selling opportunity and runs the risk of fizzling out rather quickly. The USD/CHF pair seems vulnerable to prolong its recent sharp decline from the 0.9375 region, or a multi-month high touched in November and slide further towards challenging the 0.91000 round-figure mark.
Technical levels to watch
- Easing Omicron fears continued lending some support to the perceived riskier kiwi.
- A modest USD strength held back bulls from placing fresh bets and capped NZD/USD.
The NZD/USD pair lacked any firm directional bias on Friday and remained confined in a range, around the 0.6825-30 region through the early European session.
A combination of diverging forces failed to provide any meaningful impetus to the NZD/USD pair and led to subdued/range-bound price action on the last trading day of the year. The underlying bullish sentiment in the financial markets continued acting as a tailwind for the perceived riskier kiwi. That said, a modest US dollar strength acted as a headwind and kept a lid on any meaningful gains.
The global risk sentiment remained well supported by the latest optimism over signs that the Omicron variant might be less severe than feared and is unlikely to derail the economic recovery. This, to a larger extent, helped offset concerns about the continuous surge in new COVID-19 cases and boosted investors' sentiment, which was evident from the recent runup in the global equity markets.
Meanwhile, the greenback gained some traction for the second successive day and was underpinned by Thursday's upbeat US macro data. In fact, the US Initial Jobless Claims fell more than anticipated, to 198k in the week ended December 24 – marking the lowest level since 1969. Separately, the Chicago PMI also surpassed expectations and rose to 63.1 for the current month from 61.8 in November.
This, in turn, held back traders from placing aggressive bullish bets around the NZD/USD pair and capped the upside. The mixed fundamental backdrop warrants some caution before positioning for the near-term direction amid absent relevant market-moving economic data and thin trading volumes on New Year’s Eve.
Technical levels to watch
- GBP/JPY rises for the third consecutive day, mildly bid near two-month top.
- Overbought RSI, Doji at multi-day high challenges further upside.
- 100/200 SMA confluence appears a tough nut to crack for bears.
GBP/JPY grinds higher inside a bullish chart pattern during an inactive Asian session on Friday. That said, the cross-currency pair picks up bids to 155.45, up 0.08% intraday, by the press time.
Although a one-week-old ascending trend channel formation keeps GBP/JPY buyers hopeful, Thursday’s Doji candlestick near the highest level in two months joins overbought RSI conditions to challenge the pair’s further upside.
Even if the quote rises past the recently flashed multi-day top of 155.67 and rejects the bearish candlestick, the upper line of the stated channel near 155.85 will act as an extra filter to the north.
In a case where GBP/JPY remains firmer beyond 155.85, tops marked during May and November, around 156.10 and 156.25, will be in focus.
Alternatively, a downside break of the channel’s lower line, near 155.05, will need validation from the 155.00 threshold before directing the GBP/JPY bears towards a join of the 100 and 200 SMAs, near 152.00. During the fall, December 23 swing low near 153.00 may act as a buffer.
GBP/JPY: Four-hour chart
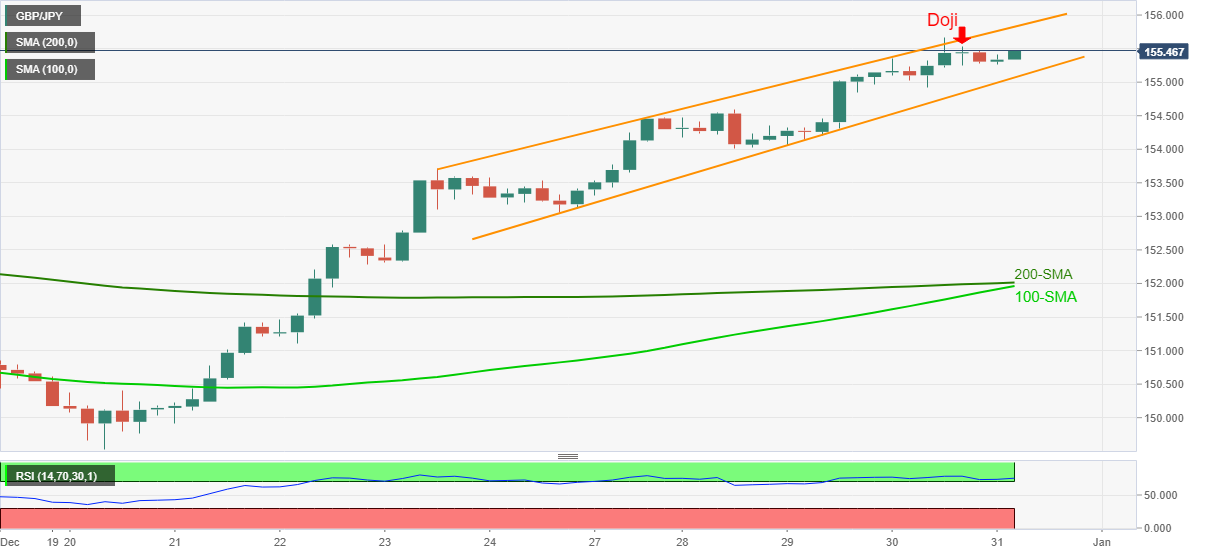
Trend: Pullback expected
Here is what you need to know on Friday, December 31:
Following Thursday's choppy market action, major pairs stay quiet as we head into 2022. There won't be any macroeconomic data releases on New Year's Eve but US stock markets will be open. The US bond markets will close early.
Earlier in the day, the data from China showed that the business activity in the private sector expanded at a modest pace in December. The NBS Manufacturing PMI inched higher to 50.3 from 50.1 in November and the Non-Manufacturing PMI rose to 52.7 from 52.3.
The S&P 500 and the Dow Jones Industrial Average both registered small losses on Thursday and US stocks futures are down between 0.15% and 0.12% in the early European session on Friday. The 10-year US Treasury bond yield is holding above 1.5% following Thursday's steep correction.
The number of confirmed coronavirus cases continues to rise at an unprecedented pace but the hospitalization rate remains relatively low, easing concerns over the potential negative impact on global economic activity.
EUR/USD gained traction in the early American session on Thursday but lost its momentum after rising above 1.1350 and closed in the negative territory. The pair is moving sideways slightly above 1.1300.
GBP/USD touched its highest level since late November at 1.3522 on Thursday and seems to have gone into a consolidation phase around 1.3500 on Friday.
USD/JPY lost its bullish momentum amid retreating US Treasury bond yield and trades in a tight range near 115.00 on Friday.
Gold registered strong daily gains after reclaiming $1,800 and looks to end the year on a firm footing. As of writing, XAU/USD was up modestly on the day at $1,818.
Bitcoin is moving up and down in a narrow range after dropping below $50,000 earlier in the week. Ethereum extends its sideways grind near $3,700 but it's losing 8% on a weekly basis.
- Gold stays on the front foot after rising the most in two weeks the previous day.
- Market sentiment improves, lack of data/events and year-end liquidity crunch to restrict moves.
- Multiple hurdles on the north will test buyers, Fed v/s ECB battle will be crucial.
Gold (XAU/EUR) pokes the highest levels since December 26, taking the bids around €1,608 during early European morning on Friday. In doing so, the yellow metal prices in Euro increase for the second consecutive day, extending a notable jump marked on Thursday.
The firmer US data and hopes of early Fed rate-hike favored the USD and weighed on the Euro, fueling the gold prices the previous day. However, the commodity’s latest run-up could be linked to the cautious optimism in the market amid a sluggish end of 2021.
That said, the Euro Index remains pressured amid worsening covid conditions and the resulted activity restrictions in the bloc. “In Europe, where almost one million people have died of coronavirus over the past 12 months, traditional concerts and firework displays that typically draw thousands of people onto the streets were canceled in most major cities, including London, Paris, Zurich, Brussels, Warsaw and Rome,” said Reuters.
Elsewhere, Reuters’ tally for the US seven-day average of new coronavirus cases refreshes record top for the second consecutive day with 290,000 latest figures.
Adding to the US dollar strength are the market fears, recently backed by geopolitical headlines. Iran’s space launch derails previous optimism concerning the denuclearization deal with the global leaders. On the same line were the dislikes of China and Hong Kong for the US push to release Hong Kong-based journalists. Also portraying the fears of the geopolitical tension were the headlines from Reuters over Ukraine, “US President Joe Biden and his Russian counterpart Vladimir Putin on Thursday warned each other that an escalation of tensions over Ukraine could rupture relations between the two countries, U.S. and Russian officials said.”
It should be noted that the US Dollar Index (DXY) prints mild gains around 96.05 during its second consecutive positive day. The S&P 500 Futures pare Asian session losses and help the gold buyers to stay hopeful amid hopes of fewer odds favoring hospitalization due to the South African covid variant, namely Omicron.
Looking forward, a light calendar and the yearn-end holiday mood can restrict XAU/EUR performance.
Technical analysis
Sustained trading beyond the 100-SMA level of €1,587 enables the XAU/EUR bulls to aim for the seven-week-old horizontal area near €1,610-12. However, an upward sloping trend line from December 07, near €1,616, adds to the upside filters.
In a case where the gold buyers manage to cross the €1,616 resistance, the odds of witnessing a rally towards €1,633 and November’s peak of €1,653 can’t be ruled out.
Alternatively, a downside break of the 100-SMA level surrounding €1,587 isn’t a green card for the XAU/EUR bears as the monthly support line will precede ascending trend line from December 15, respectively around €1,584-83, to challenge the quote’s further weakness.
To sum up, gold prices remain firmer but nearly overbought RSI conditions may trigger the quote’s pullback from nearby resistance.
Gold: Four-hour chart
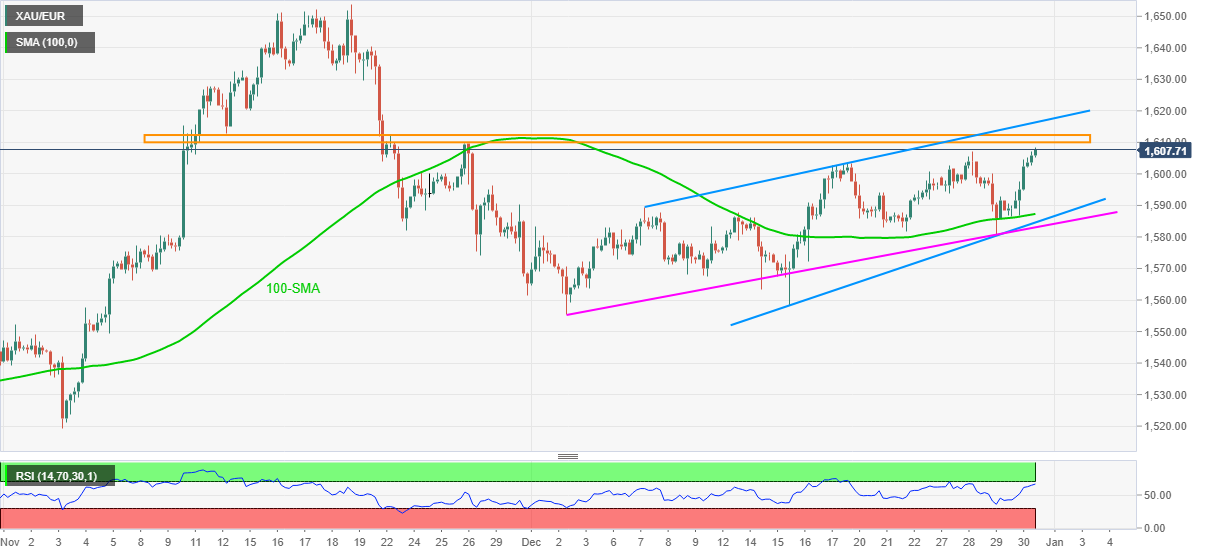
Trend: Pullback expected
- AUD/USD overcomes early Asian session sluggishness picks up bids of late.
- Bearish candlestick, chart pattern and Fibonacci are all trying to stop the bulls.
- Three-month-old horizontal support becomes a tough nut to crack for bears.
After an inactive start to the final day of 2021, AUD/USD traders seem to flex muscles while taking the bids to 0.7260 during the initial European morning on Friday.
AUD/USD eased from the resistance line of a monthly rising wedge bearish chart pattern the previous day, which in turn formed a bearish candlestick called Gravestone Doji. Adding strength to the 0.7275 hurdle is the 50% Fibonacci retracement (Fibo.) of October-December downside.
Although oscillators favor an upside break of the immediate 0.7275 resistance, the 100-DMA level of 0.7290 will act as a validation point for the further rally towards the mid-November swing high of 0.7371. It’s worth noting that the RSI line is nearly overbought and hence the 0.7290 hurdle could well act as a pullback point.
If not, then the 0.7400 threshold and late October’s swing low near 0.7455 will gain the market’s attention.
Alternatively, pullback moves can retest 38.2% Fibo. level surrounding 0.7200 but a three-month-old horizontal area near 0.7175-70 will restrict any further downside.
Should the AUD/USD prices decline below 0.7170, the support line of the stated wedge around 0.7140 will be crucial to watch.
AUD/USD: Daily chart
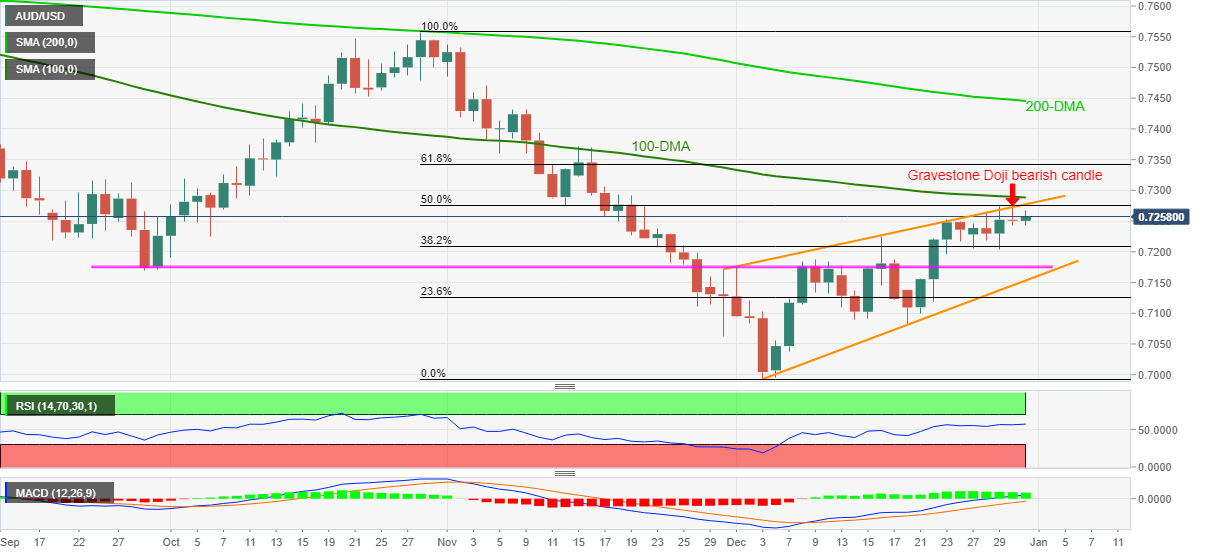
Trend: Pullback expected
The UBS strategists remain bullish on global equities, despite the looming risks of coronavirus and rising price pressures.
Key quotes
“While mindful of risks around COVID-19 variants and inflation, we keep a positive outlook on stocks for the start of 2022.”
“Global economic growth is likely to remain above trend for the first half of 2022, monetary policy is still accommodative, even if emergency support measures are being scaled back, and we expect 10% growth in global corporate earnings in the year ahead.”
- USD/CAD takes offers to renew multi-day bottom, down for the third consecutive day.
- Oil prices benefit from cautious optimism concerning Omicron, geopolitical fears.
- Quebec set a curfew to slow down the virus increase, US reports record high covid cases.
- Lack of major data/events could offer a sluggish end to 2021 but bears are likely to turn hopeful.
USD/CAD remains on the back foot for the third consecutive day, taking offers around 1.2730 to refresh multi-day low during the early Friday morning in Europe.
The latest weakness in the USD/CAD prices could be linked to the consolidation in the market’s early Asian risk-off mood, as well as mildly bid oil prices. However, thin end-of-year liquidity conditions and an absence of major data/events could restrict the pair’s immediate moves.
WTI crude oil prices, Canada’s main export item, add 0.05% intraday while taking rounds to the five-week top flashed the previous day. Behind the oil’s moves could be the market’s hopes of fewer health emergencies due to the South African covid variant, namely Omicron, as well as fears of geopolitical tension in the Middle East.
Read: WTI justifies Thursday’s bearish Doji, ignores China PMI to ease around $76.00
It’s worth noting that the global policymakers, ex-Canada, seem to take Omicron a bit lightly as the majority of them have refrained from major lockdown majors around the year-end celebrations. However, Quebec is the odd one out to put a 10:00 pm to 5:00 am curfew in place. On the other hand, Reuters’ tally for the US seven-day average of new coronavirus cases refreshes record top for the second consecutive day with 290,000 latest figures.
Talking about the geopolitics, Iran’s space launch derails previous optimism concerning the denuclearization deal with the global leaders. On the same line were the dislikes of China and Hong Kong for the US push to release Hong Kong-based journalists. Also portraying the fears of the geopolitical tension were the headlines from Reuters over Ukraine, “US President Joe Biden and his Russian counterpart Vladimir Putin on Thursday warned each other that an escalation of tensions over Ukraine could rupture relations between the two countries, U.S. and Russian officials said.”
Amid these plays, the Wall Street benchmarks posted mild losses whereas the S&P 500 Futures pare intraday losses, recently down 0.20% on a day.
To sum up, USD/CAD bears are likely to keep reins amid firmer oil and currently improving market sentiment. However, the year-end liquidity crunch may restrict the pair’s moves for the day.
Read: USD/CAD Price Forecast 2022: One reason the loonie will outperform other currencies against the US dollar
Technical analysis
While refreshing the multi-day low, the USD/CAD pair broke an ascending support line, now resistance, from November 10, which in turn joins descending Momentum line to favor sellers. That said, 38.2% Fibonacci retracement of October-December upside, around 1.2705, can restrict the quote’s immediate declines before directing USD/CAD sellers towards the 50-DMA level of 1.2655.
Alternatively, recovery moves remain elusive below a confluence of the previous support line and 21-DMA, near 1.2800.
FX option expiries for December 31 NY cut at 10:00 Eastern Time, via DTCC, can be found below.
- EUR/USD: EUR amounts
- 1.1200 221m
- 1.1400 335m
- 1.1505 840m
- GBP/USD: GBP amounts
- 1.3275 271m
- USD/CHF: USD amounts
- 0.9400 400m
- USD/CAD: USD amounts
- 1.2900 242m
- GBP/USD grinds higher around multi-day top, up for the third consecutive day.
- Two-week-old ascending support line, horizontal line from November 18 limit immediate moves, RSI conditions hint at buyer’s exhaustion.
Alike other major currency pairs, GBP/USD also treads water around 1.3500 heading into Friday’s European session. In doing so, the cable pair seesaws near the highest levels in seven weeks amid a lack of major data/events.
That said, the pair’s immediate moves are confined between an upward sloping trend line from December 20 and a horizontal line comprising double tops marked since November, namely between 1.3480 and 1.3515.
It should be noted, however, that the RSI conditions repeatedly test overbought region while the Momentum line is also descending, which in turn hints at the receding bullish bias for the pair.
However, a clear downside break of 1.3480 becomes necessary for the GBP/USD sellers before they can aim for the 200-SMA support of 1.3330.
It’s worth observing that the pair’s declines past 1.3330 will be challenged by the 1.3170-60 area comprising the monthly, also the yearly, low.
On the contrary, an upside clearance of 1.3515 will aim for the mid-October swing low near 1.3570 before November 09 top of 1.3607 lures the GBP/USD buyers.
In a case where the cable remains directed towards the north past 1.3607, the last month’s high near 1.3700 will be in focus.
GBP/USD: Four-hour chart
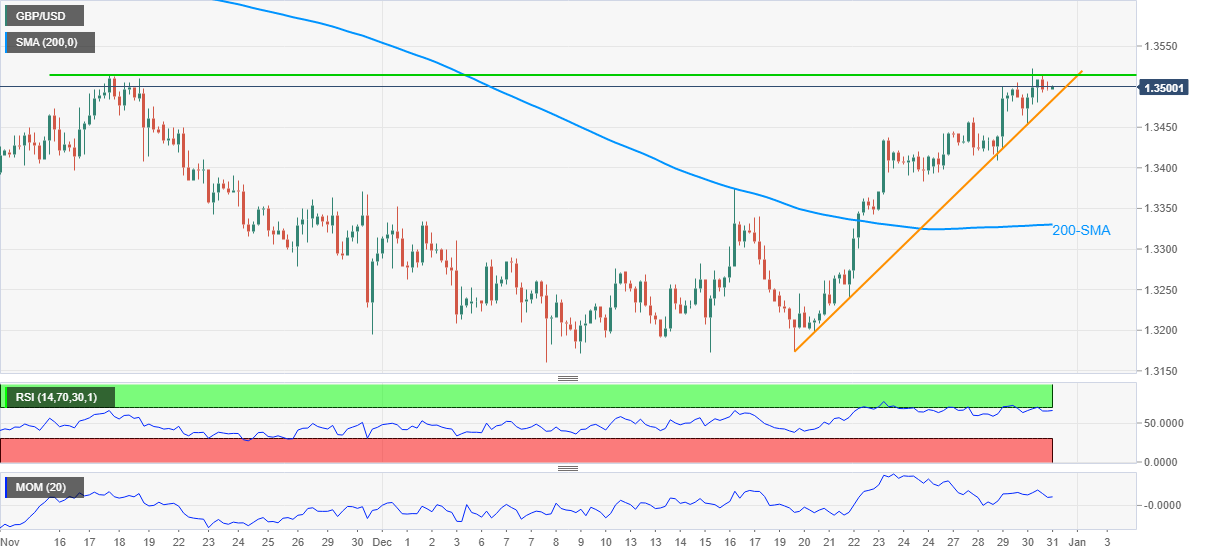
Trend: Pullback expected
- EUR/USD stays pressured around intraday low after posting the biggest daily losses in two weeks.
- Sour sentiment, light calendar and year-end liquidity crunch tests momentum.
- ECB v/s Fed battle to keep bears hopeful in 2022.
- New Year’s Eve in multiple bourses restricts immediate moves.
EUR/USD pares daily losses around 1.1320, despite fading bounce off intraday low, during the early Friday morning in Europe. In doing so, the major currency pair remains inactive amid a lack of major data/events and mixed catalysts as traders brace for 2022.
Major Asia-Pacific markets are off while some in Europe will also cheer New Year’s Eve, contributing to the inactive day. That said, the recent consolidation in EUR/USD could be linked to the US dollar’s mixed performance and an absence of major bond traders due to Japan’s holiday.
Talking about risk catalysts, the South African covid variant, namely Omicron, as well as geopolitical headlines relating to Iran, China and Ukraine are the key to watch.
Reuters’ tally for the US seven-day average of new coronavirus cases refreshes record top for the second consecutive day with 290,000 latest figures. The same is the conditions with Europe, Australia and the UK while some of the Asian nations have also registered pick-up in covid infections. The same push Health Experts and World Health Organizations (WHO) to warn over year-end celebrations.
On the other hand, Iran’s space launch derails previous optimism concerning the denuclearization deal with the global leaders. On the same line were the dislikes of China and Hong Kong for the US push to release Hong Kong-based journalists. Furthermore, “US President Joe Biden and his Russian counterpart Vladimir Putin on Thursday warned each other that an escalation of tensions over Ukraine could rupture relations between the two countries, U.S. and Russian officials said,” per Reuters.
On Thursday, European Central Bank (ECB) governing council member and Dutch central bank head Klaas Knot joined ECB policymaker Robert Holzmann to highlight inflation fears and challenges to the ECB’s easy money policies. However, firmer US data and strong US inflation expectations favored EUR/USD sellers.
US inflation expectations, per 10-Year Breakeven Inflation Rate numbers from the Federal Reserve Bank of St. Louis (FRED), jumped to the highest levels since November 24. Further, the US Initial Jobless Claims eased to 198K versus 208K expected during the week ended on December 24. Further, Chicago Purchasing Managers’ Index rose past 62.0 forecast to 63.1 for December.
Amid these plays, the Wall Street benchmarks posted mild losses whereas the S&P 500 Futures decline 0.35% at the latest.
Although the market’s inaction is likely to continue for the rest of the day, comparatively more hawkish Fed and upbeat US fundamentals may favor EUR/USD bears during 2022.
Read: EUR/USD 2022 Forecast: Policymakers will continue to chase inflation and King Dollar will make the best out of it
Technical analysis
EUR/USD repeatedly fades bounce off the 100-SMA amid sluggish oscillators, namely the MACD and RSI, which in turn hints at another inactive daily performance by the pair as it approaches 2022. That said, a downside break of the 100-SMA level of 1.1300 will have another support to watch, namely a two-week-old ascending trend line near 1.1280.
Meanwhile, an upside clearance of the monthly horizontal hurdle around 1.1360 will need validation from the November 16 peak of 1.1385 to convince the EUR/USD bulls.
After two days of dismal option market behavior, one-month risk reversal (RR) of USD/CHF, a gauge of calls to puts, jumps the most since December 13 on Thursday. That said, the RR rose to +0.037 figure at the latest per the data source Reuters.
Even so, the options market gauge remains negative on the weekly, monthly, quarterly and yearly basis, which in turn keeps USD/CHF bears hopeful.
Behind the bearish bias of USD/CHF could be the Swiss Franc’s (CHF) safe-haven status that gains major attention during times when virus woes are escalating and the inflation fears also hover.
That said, the USD/CHF pair remains down for the fifth consecutive day, lackluster around 0.9140 of late, while testing the seven-week low.
- DXY keeps the previous day’s rebound from multi-day low.
- Omicron, geopolitics underpin safe-haven demand of the greenback.
- Japan’s off restrict bond moves in Asia, light calendar and year-end liquidity crunch add to the trading filters.
- Bulls remain hopeful on hawkish Fed, stimulus expectations.
US Dollar Index (DXY) picks up bids to refresh intraday high near 96.05, up for the second consecutive day during Friday morning in Asia.
The greenback gauge portrays the market’s cautious sentiment amid thin end-of-year liquidity conditions. That said, the major catalysts are mixed concerns over the South African covid variant, namely Omicron, as well as geopolitical headlines relating to Iran, China and Ukraine.
Reuters’ tally for the US seven-day average of new coronavirus cases refreshes record top for the second consecutive day with 290,000 latest figures. The same is the conditions with Europe, Australia and the UK while some of the Asian nations have also registered pick-up in covid infections. The same push Health Experts and World Health Organizations (WHO) to warn over year-end celebrations.
Elsewhere, Iran’s space launch derails previous optimism concerning the denuclearization deal with the global leaders. On the same line were the dislikes of China and Hong Kong for the US push to release Hong Kong-based journalists. Furthermore, “US President Joe Biden and his Russian counterpart Vladimir Putin on Thursday warned each other that an escalation of tensions over Ukraine could rupture relations between the two countries, U.S. and Russian officials said,” per Reuters.
It’s worth noting that the firmer US data joined five-week high US inflation expectations, per 10-Year Breakeven Inflation Rate numbers from the Federal Reserve Bank of St. Louis (FRED), favored the DXY to rebound the previous day. The US Initial Jobless Claims eased to 198K versus 208K expected during the week ended on December 24. Further, Chicago Purchasing Managers’ Index rose past 62.0 forecast to 63.1 for December.
That said, the Wall Street benchmarks posted mild losses whereas the S&P 500 Futures decline 0.35% at the latest.
Moving on, the DXY traders are likely to witness a lackluster end of 2021 but the bulls may keep the reins considering the Fed’s hawkish mood and hopes of further stimulus from the Biden administration.
Technical analysis
Thursday’s inverted hammer candlestick hints at another battle with the 21-DMA level of 96.20. Adding strength to the stated resistance is a descending trend line from December 15. Meanwhile, DXY bears remain away before witnessing a daily closing below the 50-DMA surrounding 95.55.
- USD/INR looks vulnerable on New Year Eve amid a four-day downtrend.
- US dollar index is holding the higher ground, courtesy of year-end flows.
- The daily technical setup suggests more pain for the USD/INR pair.
USD/INR is fluctuating between gains and losses on the final trading day of 2021, as it wavers near the midpoint of the 74.00 level.
The pair is looking to extend its four-day losing streak, despite the rebound in the US dollar across the board, as the daily technical setup suggests more room for the downside.
At the time of writing, the spot is trading almost unchanged on the day, pressuring lows near 74.40.
“A number of traders and corporates have been wrong-footed by what has been an unprecedented finish to the year for the rupee. A move above 74.50 was never on the cards. The RBI likely helped the rupee when it fell to below 76, and from there, the dollar has been in a free fall. The pair has shown little respect to key support levels or to momentum indicators that it is highly oversold,” Reuters reports, citing a dealer at a private bank.
Technically, USD/INR remains vulnerable, having breached the 100-Daily Moving Average (DMA), now at 74.53, on a daily closing basis.
The 14-day Relative Strength Index (RSI) is heading towards the oversold region, backing the bearish potential in the price.
Sellers target the 200-DMA support at 74.25, which will be the line in the sand for USD/INR buyers.
USD/INR: Daily chart
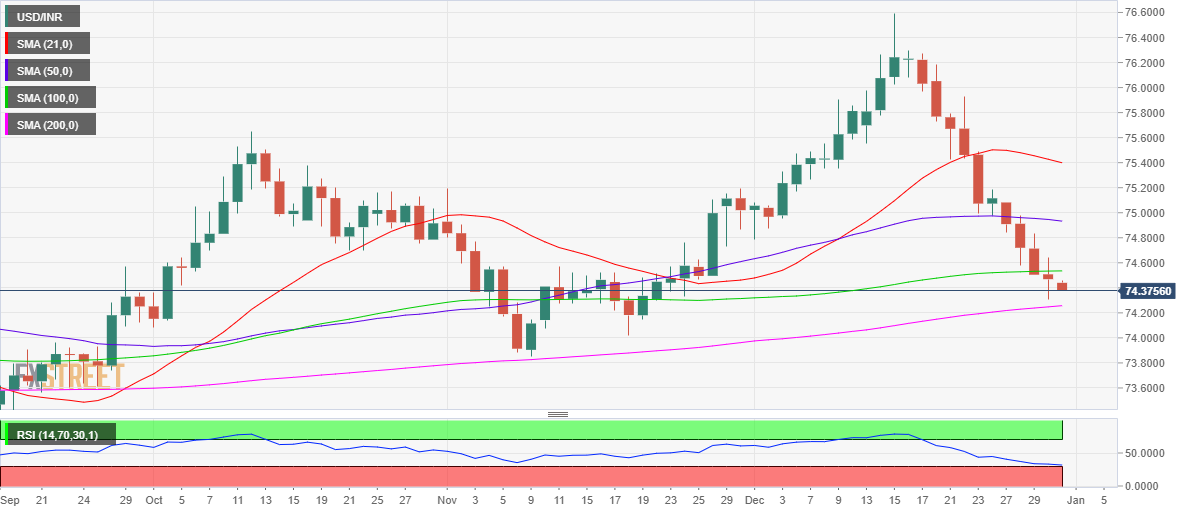
For any meaningful recovery to kick in, the spot needs to recapture the 100-DMA on a sustained basis.
Acceptance above the latter will call for a fresh advance towards the 75.00 level.
USD/INR: Additional levels
- Silver extends rebound from 21-DMA, refreshes intraday top.
- Upbeat MACD signals, firmer RSI line adds strength to the bullish bias.
- Bears remain cautious until witnessing a break of $21.42.
Silver (XAG/USD) remains on the front foot around $23.15, up 0.25% intraday during the mid-Asian session on Friday.
The bright metal recovered from the 21-DMA the previous day, backed by the bullish MACD signals.
However, a confluence of the 50-DMA and 100-DMA near $23.35-40 appears a tough nut to crack for the XAG/USD buyers.
Should silver prices rally beyond $23.40, 38.2% Fibonacci retracement of the May-September downside, near $24.20, will be in focus.
On the contrary, a downside break of the 21-DMA level surrounding $22.55 will direct the quote towards the $22.00 threshold.
Though, any further weakness below $22.00 will be challenged by the double bottoms marked in September and December around $21.42.
If at all the metal drops below $21.42, it becomes vulnerable to aim for the $20.00 psychological magnet.
Silver: Daily chart
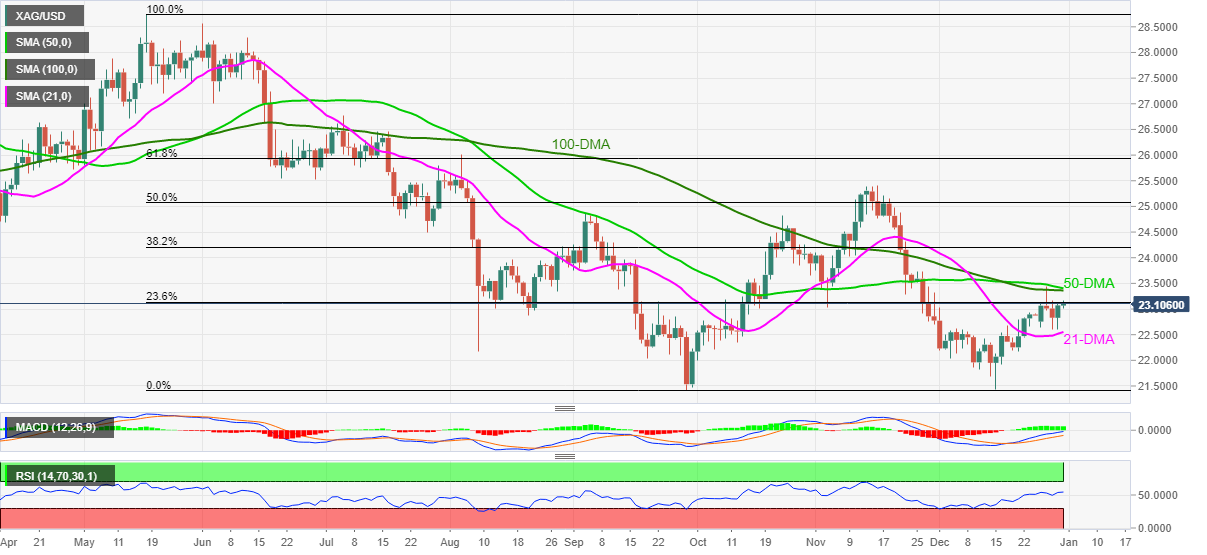
Trend: Further recovery expected
The Bank of Korea (BOK) Governor Lee Ju-yeol said that they are committed to adjusting policy interest rates as an economic recovery takes shape and price pressures tighten heading into 2022.
Key quotes
"The degree of monetary policy easing will be adjusted appropriately in line with the improvement of economic conditions,"
"We should look carefully to see if there is a possibility that inflationary pressure would last longer than expected."
According to the Reuters poll, the interest rate is seen reaching higher to 1.25% in the first quarter and 1.50% by the end of 2022.
USD/KRW reaction
USD/KRW fell from one-week highs of 1,190.87 on Governor Lee’s comments. At the time of writing, the pair is losing 0.05% on the day, trading at 1,187.
Wang Jun, head of China’s State Taxation Administration said at an annual meeting on Friday, the country will step up tax and fee cuts next year to stabilize economic growth and promote high-quality development, per Xinhua News Agency.
Key quotes
“The newly added tax and fee cuts in 2021 are expected to exceed 1 trillion yuan (about 157 billion U.S. dollars). The total tax and fee reduction topped 8.6 trillion yuan over the past six years.”
“China has deferred an estimated 200 billion yuan of tax payments for micro, small and medium-sized enterprises in the manufacturing sector in 2021 to help them address difficulties and shore up the industrial economy.”
Related reads
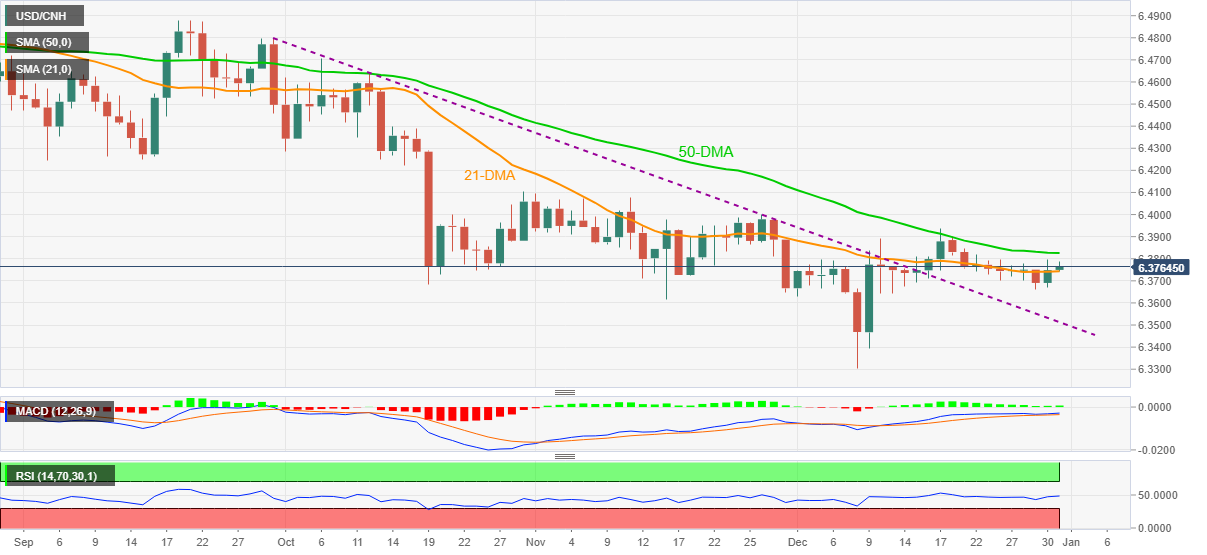
- USD/CNH Price Analysis: Stays on the way to 50-DMA despite upbeat China PMI
- China's NBS Manufacturing PMI expands to 50.3 in December vs. 50.1 expected
| Raw materials | Closed | Change, % |
|---|---|---|
| Brent | 79.02 | -0.23 |
| Silver | 23.044 | 0.96 |
| Gold | 1814.822 | 0.59 |
| Palladium | 1958.04 | -0.87 |
- USD/CNH recovers from intraday low, stays positive for second consecutive day.
- China’s official PMI data arrived better than expected in December.
- Sustained break of 21-DMA, firmer oscillators favor bulls.
- The previous resistance line from September becomes critical support.
USD/CNH picks up bids to extend the previous day’s rebound, bouncing off intraday low to $6.3775 during early Friday in Asia.
In doing so, the offshore Chinese currency (CNH) pair fails to cheer upbeat official PMI data for December. That said, China’s NBS Manufacturing Purchasing Managers' Index (PMI) grew past the 50.1 forecast and prior release to 50.3 while the Non-Manufacturing PMI rose to 52.7 versus 52.3 previous readouts but eased below 53.1 market consensus.
Technically, the pair’s sustained bounce off 21-DMA joins firmer RSI and bullish MACD signals to direct USD/CNH buyers towards the 50-DMA, around $6.3825 at the latest.
However, the monthly top around $6.3940 and the $6.4000 threshold will challenge the pair’s further upside.
Meanwhile, pullback moves remain elusive until staying beyond the 21-DMA level of $6.3743, a break of which will direct the quote towards the weekly low of $6.3660.
It should be noted, though, that a three-month-old resistance-turned-support line near $6.3500, becomes crucial support to watch for the USD/CNH traders.
USD/CNH: Daily chart
Trend: Further upside expected
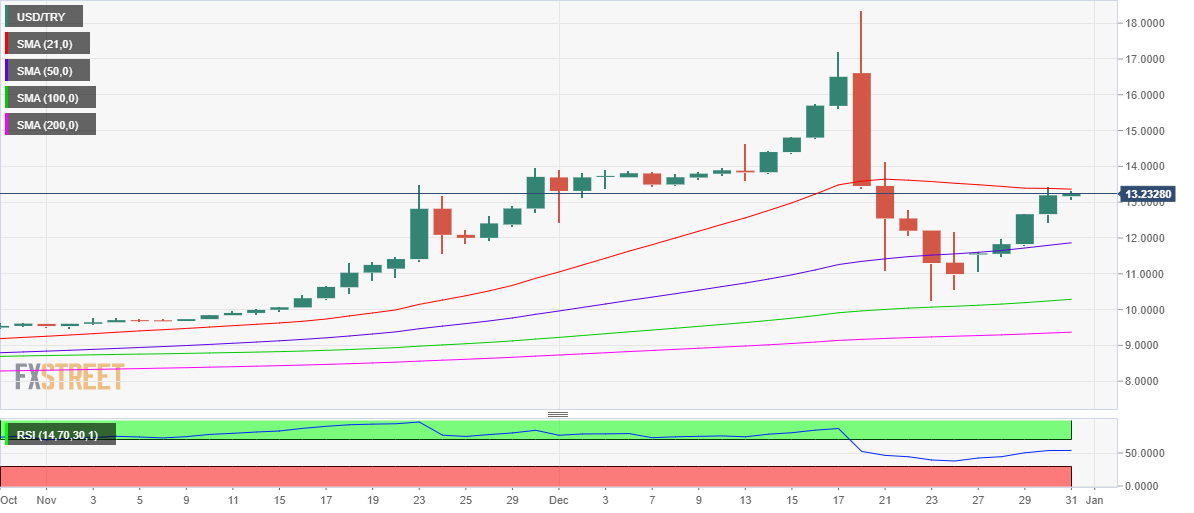
- USD/TRY keeps its recovery rally intact from five-week lows.
- The lira is unable to draw support from the government's support and confidence.
- USD/TRY awaits acceptance above 21-DMA on the road to recovery.
USD/TRY is posting small gains this final trading day of 2021, although remains below the 13.50 psychological barrier.
The pair pauses its four-day recovery rally, as investors adjust their positions heading into the yearly close. A volatile year for the lira, which sees the currency erode nearly 77% of its value against the US dollar amid uncertainty over the Turkish economic and financial policies.
The recent efforts by the Turkish central bank and the government to stem the decline in the lira have failed to create any confidence in the local currency. Earlier this week, the government announced that it will promote the conversion of gold savings into liras.
Meanwhile, “economists and opposition lawmakers called the policy easing recklessly given inflation had climbed above 21% and is expected to soar beyond 30% this month and in the months ahead, due primarily to the sharp lira depreciation,” per Reuters.
Looking at USD/TRY’s technical chart, the recent relief rally is running into the 21-Daily Moving Average (DMA) resistance, currently at 13.36.
A daily closing above the latter is critical to confirm a bearish reversal from multi-week troughs.
The 14-day Relative Strength Index (RSI) is trading above the midline, pointing to more gains on the table.
The December 21 highs of 14.14 will be probed by buyers on a sustained move higher.
Rejection at the 21-DMA could recall sellers, knocking down the currency pair towards the previous day’s low of 12.44, below which the 50-DMA at 11.86 will be tested again.
The next relevant support is seen at Monday’s low of 11.07 will get tested. The last line of defense for buyers is envisioned at 100-DMA at 10.23.
USD/TRY: Daily chart
- WTI bounces off intraday low but remains mildly offered on a day.
- China’s official PMIs came in better-than-expected in December.
- Omicron woes challenge bulls, geopolitical put a floor to downside.
- Year-end liquidity crunch, off in multiple markets to restrict intraday move.
WTI defends $76.00 during a corrective pullback from intraday low amid Friday’s sluggish Asian session. Even so, the energy benchmark portrays mild losses while justifying the technical details and paying a little heed to China PMI, as well as a few geopolitical catalysts.
China’s NBS Manufacturing Purchasing Managers' Index (PMI) grew past the 50.1 forecast and prior release to 50.3 in December. The Non-Manufacturing PMI rose to 52.7 versus 52.3 previous readouts but eased below 53.1 market consensus during the stated month.
Iran’s space launch derails previous optimism concerning the denuclearization deal and keeps the geopolitical fears over the key oil supplier on the table. Additionally, China and Hong Kong conveyed their dislike for the US push to release Hong Kong-based journalists, which in turn suggest the escalation of tension between the world’s top economies, indirectly signaling firmer oil prices amid supply fears.
It should be noted, however, that Saudi Arabia recently supported continuation to the OPEC+ plan and hints at further supply crunch amid a latest increase in output.
On a different page, the record high coronavirus cases challenge energy prices but the global policymakers’ cautious optimism, backed by scientific studies, favor the oil bulls. Additionally, the US policymakers remain hopeful of reaching an agreement over the Build Back Better (BBB) plan while also trying to placate fears over the Omicron and keeping the energy bulls positive.
Talking about the data, the US Initial Jobless Claims eased to 198K versus 208K expected during the week ended on December 24. Further, Chicago Purchasing Managers’ Index rose past 62.0 forecast to 63.1 for December.
Against this backdrop, the Wall Street benchmarks posted mild losses whereas the S&P 500 Futures decline 0.35% at the latest.
Moving on, a light calendar and off in multiple Asia-Pacific markets, as well as year-end holiday mood at the rest, could restrict short-term oil moves.
Technical analysis
A bearish candlestick formation near the monthly top joins failures to cross a three-week-old resistance line to keep WTI sellers hopeful.
However, 50-DMA and 100-DMA levels, respectively around $75.55 and $74.20, restrict short-term declines of the black gold. Also acting as a downside filter is the early December’s swing high near $73.20.
Meanwhile, an upside clearance of the stated resistance line of $77.70 will defy the bearish signals and track the upbeat MACD to direct oil bulls towards late November’s top near $79.00 and then to the 80.00 threshold.
WTI: Daily chart

Trend: Further weakness expected
| Time | Country | Event | Period | Previous value | Forecast |
|---|---|---|---|---|---|
| 01:00 (GMT) | China | Non-Manufacturing PMI | December | 52.3 | |
| 01:00 (GMT) | China | Manufacturing PMI | December | 50.1 | 50 |
| 18:00 (GMT) | U.S. | Baker Hughes Oil Rig Count | December | 480 |
- NZD/USD paid a little heed to China’s official PMI data for December.
- China’s NBS Manufacturing PMI came in upbeat but Non-Manufacturing PMI missed expectations.
- Sustained break of 100-SMA, previous resistance from November 15 keeps buyers hopeful.
- Bulls need to over 0.6860 to excel further, 0.6735 acts as extra support to watch.
NZD/USD takes rounds to 0.6830 during Friday’s Asian session. In doing so, the kiwi pair fails to cheer upbeat PMI data from China amid technical challenges and year-end liquidity crunch.
China’s NBS Manufacturing Purchasing Managers' Index (PMI) grew past the 50.1 forecast and prior release to 50.3 in December. The Non-Manufacturing PMI rose to 52.7 versus 52.3 previous readouts but eased below 53.1 market consensus.
NZD/USD struggles to overcome a three-month-old horizontal hurdle surrounding 0.6860 even as the bullish MACD signals, sustained break of the previous resistance line from mid-November and a clear run-up beyond 100-SMA favors the pair bulls.
It’s worth noting that the 0.6900 round figure, also comprising the late November’s swing high, acts as a validation point for a north-run towards the 0.7000 psychological magnet that also encompasses early November’s swing lows.
Alternatively, the resistance-turned-support line and the 100-SMA, around 0.6805 and 0.6780 in that order, restricts short-term downside of the kiwi pair.
Should the quote drops below 0.6780, a horizontal line from December 06, close to 0.6730 will stop the NZD/USD bears before directing them to 2021 bottom of 0.6701.
To sum up, NZD/USD trades near the key make or break point with buyers having an upper hand.
NZD/USD: Four-hour chart

Trend: Sideways
According to the latest report carried by Bloomberg Economics, global economic growth is expected to average annual growth of around 3.2% in the decade ahead.
The projected growth target is slightly below the average of 3.5% in the period from 2010-2019.
Key takeaways
“China will still outperform, though with growth on a slowing trajectory as debt, demographics and reduced catch-up space drag.”
“Burdened with aging populations, advanced economies are on a slowing path, with growth in the next decade expected to average 1.6%.”
Read: Forex Today: New Year’s Eve means more choppy trading ahead
The People’s Bank of China (PBOC) set the USD/CNY reference rate at 6.3757 on Friday while comparing to the previous fix and the previous close at 6.3674 and 6.3729 respectively.
- AUD/USD keeps the bounce off intraday low following China’s upbeat data.
- China NBS Manufacturing PMI improves to 50.3, Non-Manufacturing PMI drops below forecast in December.
- Off in Japan restricts bond moves, stock futures print mild losses.
- Omicron woes stay on the table, China increases hardships for Australia but year-end liquidity crunch limit market moves.
AUD/USD seesaws around 0.7255 after China released upbeat official PMI data for December during early Friday. Even so, mixed sentiment and off in major Asia-Pacific markets restrict the Aussie pair’s latest moves.
China’s NBS Manufacturing Purchasing Managers' Index (PMI) grew past 50.1 forecast and prior release to 50.3 in December. The Non-Manufacturing PMI rose to 52.7 versus 52.3 previous readouts but eased below 53.1 market consensus.
It’s worth noting that the year-end liquidity crunch is at its peak during the last day of 2021, with major Asia-Pacific markets off due to New Year’s Eve.
While the same restricts short-term moves of the AUD/USD, mixed concerns over the South African covid variant, namely Omicron, adds to the upside filters for the risk-barometer pair.
Australia’s populous state New South Wales (NSW) again reports a jump in the COVID-19 figures while Victoria also prints an all-time high of 5,919 cases and seven virus-linked death per ABC News. “NSW's daily COVID-19 case tally has nearly doubled for the second time in three days, with 21,151 infections and six deaths recorded,” said ABC News. Even so, the Australian Prime Minister decided to alter the definition of ‘close contact’ with the infected during the emergency National Cabinet Meeting, nothing more.
On the other hand, Reuters’ tally for the US seven-day average of new coronavirus cases refreshes record top for the second consecutive day with 290,000 cases at the latest.
Elsewhere, China’s plan to become self-reliant for iron ore, Australia’s biggest export earner, joins geopolitical tensions over Ukraine and the Sino-American tussles to weigh on the market sentiment.
Alternatively, US policymakers remain hopeful of reaching an agreement over the Build Back Better (BBB) while the global scientists still speak of lesser virus woes ahead.
That said, the Wall Street benchmarks posted mild losses whereas the S&P 500 Futures decline 0.35% at the latest.
Looking forward, an absence of major data/events and the year-end holiday mood will restrict short-term AUD/USD moves.
Technical analysis
A bearish daily candlestick, Gravestone Doji, at the monthly top joins monthly rising wedge’s resistance line and 50% Fibonacci retracement (Fibo.) of October-December downside to highlight 0.7275 as the key hurdle.
That said, 38.2% Fibo. level surrounding 0.7200 is short-term key support before a three-month-old horizontal area near 0.7175-70 will restrict any further downside.
The purchasing managers' index (PMI) for China's manufacturing sector expanded more than expected to 50.3 in December from 50.1 booked in November, the latest data published by the National Bureau of Statistics (NBS) showed Friday.
The actual data beat the consensus estimate of 50.1 by a small margin.
Meanwhile, the Non-Manufacturing PMI rose to 52.7 in the reported month from November’s reading of 52.3 and against the expectations of 53.1.
A reading above 50 indicates expansion, while a reading below suggests contraction.
Implications for AUD/USD
Mixed Chinese NBS PMIs served have limited impact on the aussie dollar, as AUD/USD keeps its range around 0.7250 amid thin year-end liquidity conditions.
- USD/CAD portrays a corrective pullback from multi-day bottom.
- A clear downside break of an ascending support line from November 10, 21-DMA favor bears.
- Monthly horizontal resistance adds to the upside barriers, 50-DMA lures sellers.
USD/CAD licks its wounds around 1.2750 during Friday’s Asian session, after dropping the most in a week the previous day.
While refreshing the multi-day low, the Loonie pair broke an ascending support line, now resistance, from November 10, which in turn joins descending Momentum line to favor sellers.
That said, 38.2% Fibonacci retracement of October-December upside, around 1.2705, can restrict the quote’s immediate declines before directing USD/CAD sellers towards the 50-DMA level of 1.2655.
However, a clear downside break of 1.2655 will need validation from seven-week-old horizontal support near 1.2600 before directing the quote further to the south.
Alternatively, recovery moves remain elusive below a confluence of the previous support line and 21-DMA, near 1.2800.
Also acting as a short-term key resistance is the horizontal area comprising multiple tops marked since December 03, close to 1.2845-50.
USD/CAD: Daily chart
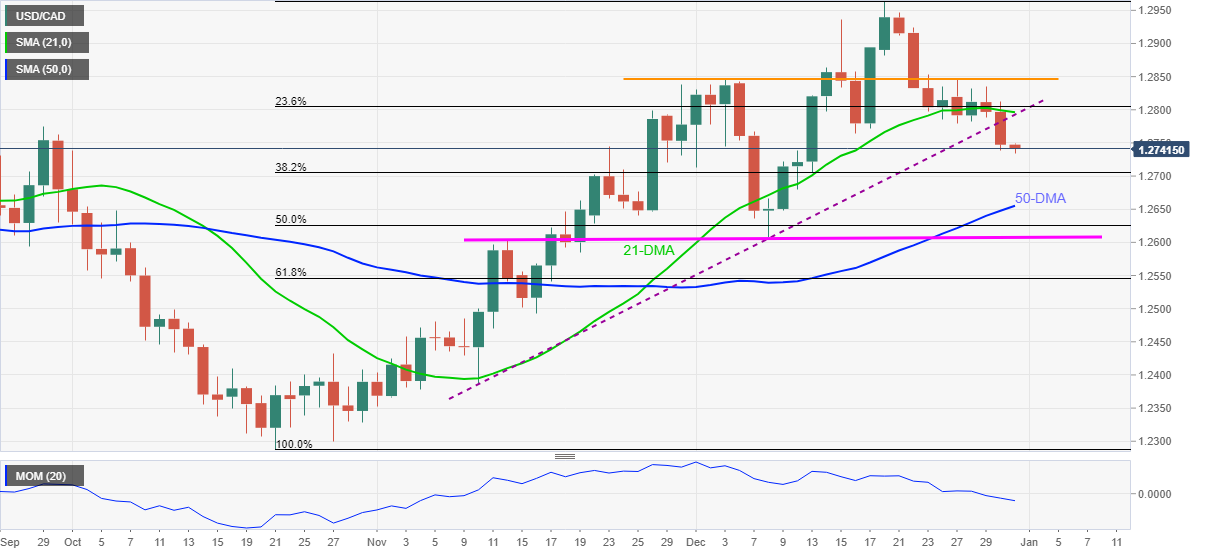
Trend: Further weakness expected
- USD/JPY pauses two-day uptrend after refreshing five-week top.
- Yields remain pressured, stock futures stay indecisive around a record high.
- Market players stay cautiously optimistic amid mixed concerns over Omicron, geopolitics and US stimulus.
- Light calendar, New Year’s Eve to restrict market moves.
USD/JPY bounces off intraday low to 115.05 as bulls take a breather during Friday’s Asian session, after a two-day run-up to refresh the monthly peak.
Holidays in Japan, Australia, Japan and New Zealand could be linked to the yen pair’s latest indecision. However, a lack of major data/events and mixed signals from the risk catalysts are likely to have a major part in the USD/JPY pair’s recently subdued performance.
An imbalance between the steadily rising covid cases and the global policymakers’ cautious optimism concerning the South African covid variant, namely Omicron takes the lead to challenge the traders. Japan reports a two-month high COVID-19 figure around 500 for the second consecutive day whereas Reuters’ tally for the US seven-day average of new coronavirus cases refreshes record top for the second consecutive day with 290,000 cases at the latest. Even so, only Canada’s Quebec has announced a total curfew to reject the year-end celebration while the rest are likely to welcome 2022 with mild activity restrictions.
Other than the virus woes, the geopolitics are also challenging the USD/JPY prices as the absence of breakthrough from recent talks between US Preside Joe Biden and his Russian counterpart Vladimir Putin joins Iran’s space launch and Sino-American tussles.
On a different page, the US policymakers remain hopeful of reaching an agreement over the Build Back Better (BBB) while Japanese diplomats cheer record budget and show readiness to battle the pandemic. It’s worth noting that authorities from Japan have recently suggested further easy money policies while citing the Omicron woes and rejecting inflation fears.
Amid these plays, the Wall Street benchmarks posted mild losses whereas the US 10-year Treasury yields consolidated the heaviest daily jump in three weeks, posted the previous day. That said, the S&P 500 Futures remain lackluster around 4,775 at the latest.
Moving on, a light calendar and sluggish year-end mood may restrict USD/JPY moves.
Read: USD/JPY 2022 Forecast: Japanese stagnation should sound all the alarms for those looking to buy the JPY
Technical analysis
Failures to cross November 25 low near 115.25 joins overbought RSI conditions to hint at a pullback in the USD/JPY prices. In doing so, the sellers need to conquer a two-week-old immediate support line, near 115.00, before targeting the mid-December tops near 114.25.
The South China Morning Post (SCMP) shares China’s 2021-25 raw material development plan while spotting negative news for the AUD/USD traders during early Friday morning in Asia.
“China will encourage domestic exploration of iron ore and use more scrap metals to reduce reliance on imports from countries like Australia, while streamlining production quotas for rare earth and tungsten, according to the government,” said the news.
Key quotes
Iron self-sufficiency would be ‘significantly’ increased by lifting the supply of scrap steel to more than 30 percent of the total, encouraging domestic mining and reducing steelmaking capacity.
China imported more than 80 percent of iron ore requirements last year, about 60 percent of which was from Australia.
Despite deteriorating diplomatic ties, Beijing has not made an effort to restrict Australian iron ore imports.
Market implications
As iron ore becomes Australia’s biggest export earner, the news should have weighed on the AUD/USD prices, currently sidelined around 0.7250. However, a lack of major data/events joins the year-end liquidity crunch to restrict market moves.
Read: AUD/USD: Gravestone Doji at monthly top probe bulls below 0.7300, China PMI eyed
| Pare | Closed | Change, % |
|---|---|---|
| AUDUSD | 0.72501 | 0.01 |
| EURJPY | 130.32 | -0.05 |
| EURUSD | 1.13246 | -0.18 |
| GBPJPY | 155.358 | 0.26 |
| GBPUSD | 1.35013 | 0.1 |
| NZDUSD | 0.68323 | 0.12 |
| USDCAD | 1.27378 | -0.37 |
| USDCHF | 0.9139 | -0.06 |
| USDJPY | 115.071 | 0.15 |
- Gold prices grind higher at weekly top, picking up bids at the latest.
- Risk catalysts dwindle amid geopolitical fears, Omicron woes and global leaders’ cautious optimism despite virus spread.
- Yields, equities confuse traders amid year-end liquidity crunch.
Gold seesaws around the weekly top, grinding at $1,815 during Friday’s Asian session, after rising the most in a day since December 22.
While a lack of major catalysts and thin end-of-year liquidity conditions challenge gold prices, the recently downside US dollar performance and mixed moves by the other risk catalysts keep traders directed towards the traditional haven.
The metal rose on Thursday even as the US Dollar Index recovered amid firmer data. The reason could be linked to the indecision over the Fed's next move and escalation of geopolitical tension, not to forget fears of the South African covid variant, namely Omicron.
That said, the US Initial Jobless Claims eased to 198K versus 208K expected during the week ended on December 24. Further, Chicago Purchasing Managers’ Index rose past 62.0 forecast to 63.1 for December.
Talking about the virus, Reuters tally for the US coronavirus numbers suggests a record number of newly reported cases, based on the seven-day average, while printing above 290,000 figures for the second consecutive day. “In Europe, where almost one million people have died of coronavirus over the past 12 months, traditional concerts and firework displays that typically draw thousands of people onto the streets were canceled in most major cities, including London, Paris, Zurich, Brussels, Warsaw and Rome,” said Reuters.
Elsewhere, the US policymakers remain hopeful of reaching an agreement over the Build Back Better (BBB) plan while also trying to placate fears over the Omicron.
It should be noted that the absence of breakthrough from recent talks between US Preside Joe Biden and his Russian counterpart Vladimir Putin joins Iran’s space launch and Sino-American tussles to weigh on the risk appetite.
Against this backdrop, the Wall Street benchmarks posted mild losses whereas the US 10-year Treasury yields consolidated the heaviest daily jump in three weeks, posted the previous day. That said, the S&P 500 Futures remain lackluster around 4,775 at the latest.
Looking forward, Friday is likely to be a dull affair for the global traders as most of them will be busy preparing for 2022, amid holidays in major Asia-Pacific markets. Adding to the trading filters is the absence of major data/events.
Technical analysis
Gold prices stay past the 200-SMA level of $1,801 after breaking fortnight-old support, now resistance near $1,820. However, the receding bearish bias of the MACD and steady RSI help the metal buyers to stay hopeful. In addition to the 200-SMA, the repeated bounce off 100-SMA, close to $1,793, also favors the gold bulls.
The same hints that the recovery gains momentum but the gold buyers await a clear upside break of $1,820, which in turn will direct the metal towards the 61.8% Fibonacci retracement (Fibo.) level of November-December downside, around $1,830.
However, the bullion's further upside will have only one hurdle, namely 78.6% Fibo. level near $1,851 before challenging the last monthly top near $1,877.
Meanwhile, a downside break of $1,792 will trigger a drop to $1,770 but a two-month-old horizontal support zone near $1,760 appears a tough nut to crack for gold bears.
Gold: Four-hour chart
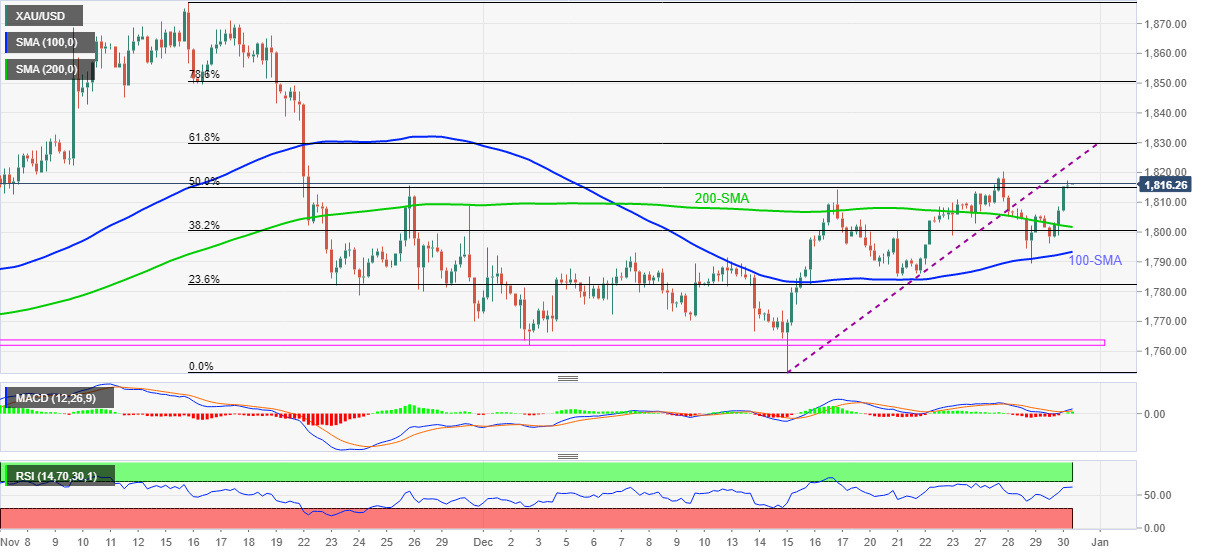
Trend: Further upside expected


© 2000-2026. Sva prava zaštićena.
Sajt je vlasništvo kompanije Teletrade D.J. LLC 2351 LLC 2022 (Euro House, Richmond Hill Road, Kingstown, VC0100, St. Vincent and the Grenadines).
Svi podaci koji se nalaze na sajtu ne predstavljaju osnovu za donošenje investicionih odluka, već su informativnog karaktera.
The company does not serve or provide services to customers who are residents of the US, Canada, Iran, The Democratic People's Republic of Korea, Yemen and FATF blacklisted countries.
Izvršenje trgovinskih operacija sa finansijskim instrumentima upotrebom marginalne trgovine pruža velike mogućnosti i omogućava investitorima ostvarivanje visokih prihoda. Međutim, takav vid trgovine povezan je sa potencijalno visokim nivoom rizika od gubitka sredstava. Проведение торговых операций на финанcовых рынках c маржинальными финанcовыми инcтрументами открывает широкие возможноcти, и позволяет инвеcторам, готовым пойти на риcк, получать выcокую прибыль, но при этом неcет в cебе потенциально выcокий уровень риcка получения убытков. Iz tog razloga je pre započinjanja trgovine potrebno odlučiti o izboru odgovarajuće investicione strategije, uzimajući u obzir raspoložive resurse.
Upotreba informacija: U slučaju potpunog ili delimičnog preuzimanja i daljeg korišćenja materijala koji se nalazi na sajtu, potrebno je navesti link odgovarajuće stranice na sajtu kompanije TeleTrade-a kao izvora informacija. Upotreba materijala na internetu mora biti praćena hiper linkom do web stranice teletrade.org. Automatski uvoz materijala i informacija sa stranice je zabranjen.
Ako imate bilo kakvih pitanja, obratite nam se pr@teletrade.global.
транcфери