- Analiza
- Novosti i instrumenti
- Vesti sa tržišta
Forex-novosti i prognoze od 28-12-2021
US inflation expectations, as measured by the 10-year breakeven inflation rate per the St. Louis Federal Reserve (FRED) data, stayed steady around the highest levels since December 08, at 2.50%, per the FRED website.
The firmer inflation expectations keep fears of the Fed’s early rate hike on the table, which in turn weigh on the market sentiment.
The risk-off mood also takes clues from the worsening virus conditions in the West amid the year-end holiday season.
As a result, the markets portray a mixed reaction to the risk-negative catalysts while keeping the bears hopeful.
That said, Wall Street benchmarks traded volatile as DJI managed to print a five-day uptrend but S&P 500 snapped a four-day winning streak even after refreshing the record top during early hours. On the same line, the US Treasury yields had an active Tuesday as a coupon for the two-year benchmark jumped to the highest since March 2020 but the 10-year Treasury yields remained lackluster around 1.48%, recently down to 1.477%.
Furthermore, Gold (XAU/USD) crossed the $1,814 hurdle to refresh the monthly top but posted the heaviest daily losses in a week, recently pressured around $1,805.
Read: Gold Price Forecast: Further XAU/USD declines await $1,805 break as yields dwindle
- Gold prices struggle to overcome the heaviest daily losses in a week, test short-term key support.
- Virus woes escalate and so do Fed rate-hike concerns but year-end holiday mood restricts market moves.
- Second-tier US data, risk catalysts may entertain momentum traders around monthly top.
- Gold Price Forecast: Losing steam but holding above $1,800.00
Gold (XAU/USD) remains pressured around $1,805 during Wednesday’s Asian session, after posting the biggest daily losses at five-week top.
The yellow metal took clues from the market’s indecision over the Fed’s next moves and worsening coronavirus conditions to reverse the gains near multiday high. Even so, thin end-of-year liquidity conditions challenge the bears even as the technical signals hint at the further downside of the yellow metal.
The UK reports the all-time high daily infections, above 122,000 a day after the authorities rejected any new activity restrictions during the rest of 2021. France joins the line with 179,807 new confirmed cases making it the world’s heaviest daily toll. Elsewhere, “The average number of new COVID-19 cases in the United States has risen 55% to over 205,000 per day over the last seven days,” according to a Reuters tally.
On the other hand, the US inflation expectations remain near the monthly high, per 10-Year Breakeven Inflation Rate numbers from the Federal Reserve Bank of St. Louis, which in turn keeps the hope of an early rate hike from the Fed on the table and weigh on gold prices.
Talking about data, US Housing Price Index eased below 1.2% forecast to 1.1% in October while S&P/Case-Shiller Home Price Indices stepped back from 19.5% prior to 18.4%, versus 18.5% market consensus. However, the Richmond Fed Manufacturing Index for December crossed the upwardly revised 12.00 figure with 16.00%.
Amid these plays, the US Treasury yields had a volatile day as a coupon for the two-year benchmark jumped to the highest since March 2020 but the 10-year Treasury yields remained lackluster around 1.48%, recently down to 1.477%.
It’s worth noting that Wall Street benchmarks traded volatile as DJI managed to print a five-day uptrend but S&P 500 snapped a four-day winning streak even after refreshing the record top during early hours. Nasdaq also closed negative for the first time in five days after poking the all-time high levels marked in November.
Considering the mixed markets and holiday mood, gold traders are likely to remain inactive. However, the latest rising wedge confirmation challenges the previous bullish consolidation. Hence, US Pending Home Sales and Goods Trade Balance for November, as well as risk catalysts, are important to watch for fresh impulse.
Technical analysis
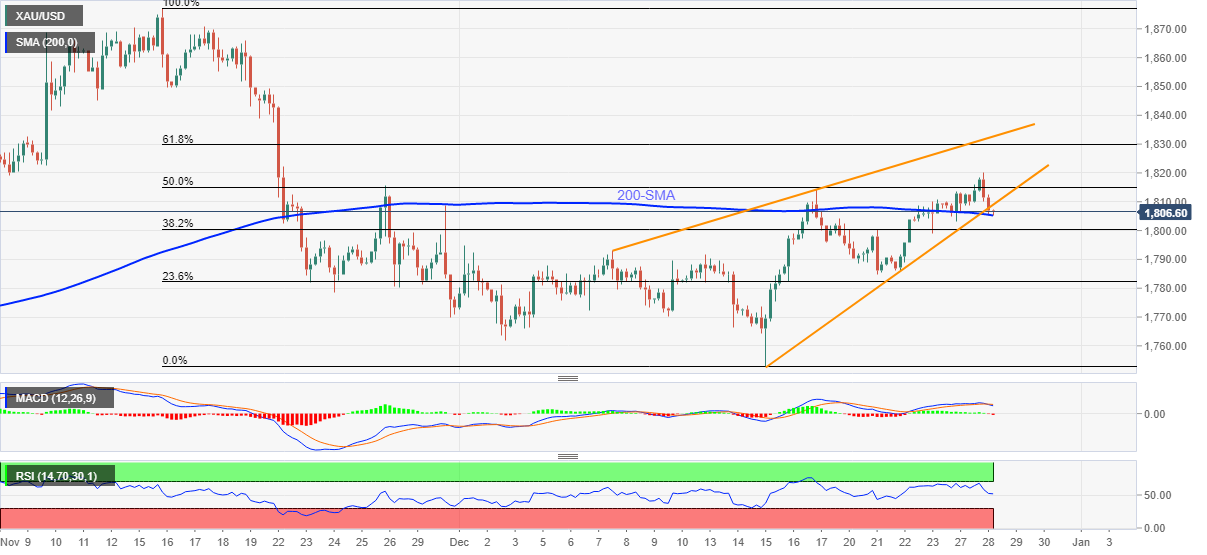
Gold prices confirmed a rising wedge bearish chart pattern the previous day on the four-hour play but the 200-SMA level near $1,805 probes the sellers.
Even so, bearish MACD signals and descending RSI line hint at the gold’s further weakness.
That said, the quote’s declines past $1,805 triggers a theoretical slump towards October’s low near $1,746. Though, the latest trough and the monthly bottom, respectively around $1,784 and $1,753, will challenge the metal’s further weakness.
Alternatively, gold buyers need to keep the reins beyond $1,810 to reject the latest bearish chart pattern confirmation.
Following that, the latest high near $1,820 and 61.8% Fibonacci retracement level of November-December downside, around $1,830, will gain the market’s attention.
Gold: Four-hour chart
Trend: Further weakness expected
- GBP/USD seesaws in a choppy range after stepping back from monthly top.
- UK, France reports record daily infections, US marks 55% average daily jump in cases in the last one week.
- EU’s Šefčovič terms UK’s threats to trigger Article 16 as "enormously disruptive", EU-UK agreed over fishing quota for 2022.
- Light calendar, year-end holiday mood to restrict moves, risk catalysts are the key.
GBP/USD treads water around 1.3430 during the initial Asian session on Wednesday, after reversing gains from the highest level since November 19 the previous day. The cable pair seems to track the US dollar moves while also taking clues from the headlines concerning Brexit and the South African covid variant, namely Omicron.
The US Dollar Index (DXY) posted the heaviest daily gains in a week while defending the 96.00 threshold, around 96.15 by the press time. In doing so, the greenback gauge benefits from the market’s rush to the USD amid mixed data and unclear moves of the equities, as well as US Treasury bonds.
Wall Street benchmarks traded volatile as DJI managed to print a five-day uptrend but S&P 500 snapped a four-day winning streak even after refreshing the record top during early hours. Nasdaq also closed negative for the first time in five days after poking the all-time high levels marked in November. That said, the US Treasury yields had a volatile day as a coupon for the two-year benchmark jumped to the highest since March 2020 but the 10-year Treasury yields remained lackluster around 1.48%.
Talking about data, the US Housing Price Index eased below 1.2% forecast to 1.1% in October while S&P/Case-Shiller Home Price Indices stepped back from 19.5% prior to 18.4%, versus 18.5% market consensus. However, the Richmond Fed Manufacturing Index for December crossed the upwardly revised 12.00 figure with 16.00%.
On a different page, the UK reports the all-time high daily infections, above 122,000 a day after the authorities rejected any new activity restrictions during the rest of 2021. France joins the line with 179,807 new confirmed cases making it the world’s heaviest daily toll. Elsewhere, “The average number of new COVID-19 cases in the United States has risen 55% to over 205,000 per day over the last seven days,” according to a Reuters tally.
In addition to the virus woes and indecisive markets, Brexit fears and Fed rate hike woes also weigh on the GBP/USD prices. Although the European Union (EU) and the UK agreed over fishing quotas for 2022, European Commission Vice President Maroš Šefčovič was recently spotted disliking the UK’s threat to use Article 16 by Politico. “British decision to activate Article 16 of the Northern Ireland Protocol would have "serious consequences" for Northern Ireland's economy, endanger peace in the region and constitute an "enormous setback" for EU-UK relations,” said the news while quoting the EU diplomat.
Given the mixed clues and inactive markets, the GBP/USD may grind higher while second-tier US data and risk catalysts may offer intermediate clues.
Technical analysis
GBP/USD clings to the 50-DMA while taking rounds to September’s lows, which in turn requires the bulls to post a fresh monthly high past 1.3460 to keep the reins. Following that, the mid-November swing high around 1.3515 will be in focus. On the contrary, monthly horizontal support near 1.3375 should lure the sellers during the cable pair’s pullback.
- The NZD/JPY trims some of its Monday’s gains, down 0.33%.
- Positive developments on the Covid-19 front increased risk appetite denting the Japanese yen prospects.
- NZD/JPY Price Forecast: The double-bottom in the daily chart targets 80.00.
The NZD/JPY retreats from monthly tops, trading at 78.05 during the day at press time. Early in the New York session, the market mood was upbeat, propelling the S&P 500 towards 4,800 to all-time highs. However, market conditions changed as the session progressed, with US equities finishing in the red, except for the Dow Jones Industrial.
Since Monday, the market has improved on the back of positive news on the Covid-19 front. Three studies, one in South Africa and two in the UK, showed that people vaccinated with at least two shots and who become infected with the Omicron variant were between 50% to 80% less subject to require hospitalization.
When the news crossed the wires, it was a green light for investors, which bought the dip, pushing equities worldwide to new highs. In the FX market, risk-sensitive peers gained versus the safe-haven status of the Japanese yen, until today, when a risk-off mood caused a dip, which could be viewed as an opportunity of opening fresh bets vs. the Japanese yen.
NZD/JPY Price Forecast: Technical outlook
The NZD/JPY daily chart shows a double-bottom formation. Furthermore, at press time, the “neckline” of the chart pattern confluences with the 200-day moving average (DMA) around the 77.96-78.03 range, which NZD bulls are likely to defend as the double-bottom targets 80.00.
To the upside, the NZD/JPY first resistance would be the 100-DMA at 78.32. A breach of the latter paves the way for further upside. The next line of defense for JPY bulls would be the 50-DMA at 79.00, followed by the double-bottom target at 80.00.
-637763294254967949.png)
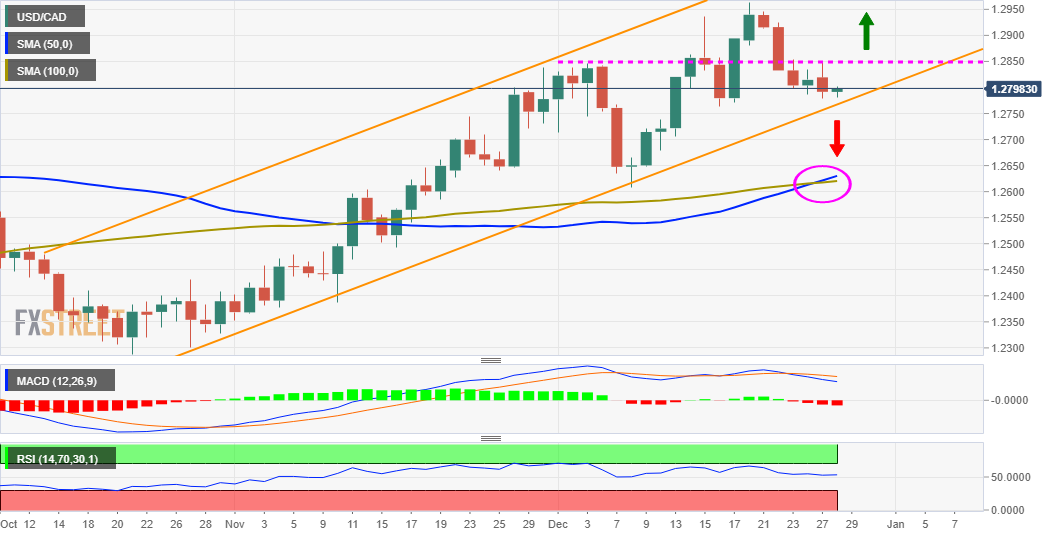
- USD/CAD holds onto latest rebound from 50-HMA, picks up bids of late.
- Firmer RSI favor buyers to mark another battle with one-week-old descending trend line.
- 200-SMA adds to the upside filters, 1.2780 level acts as extra support.
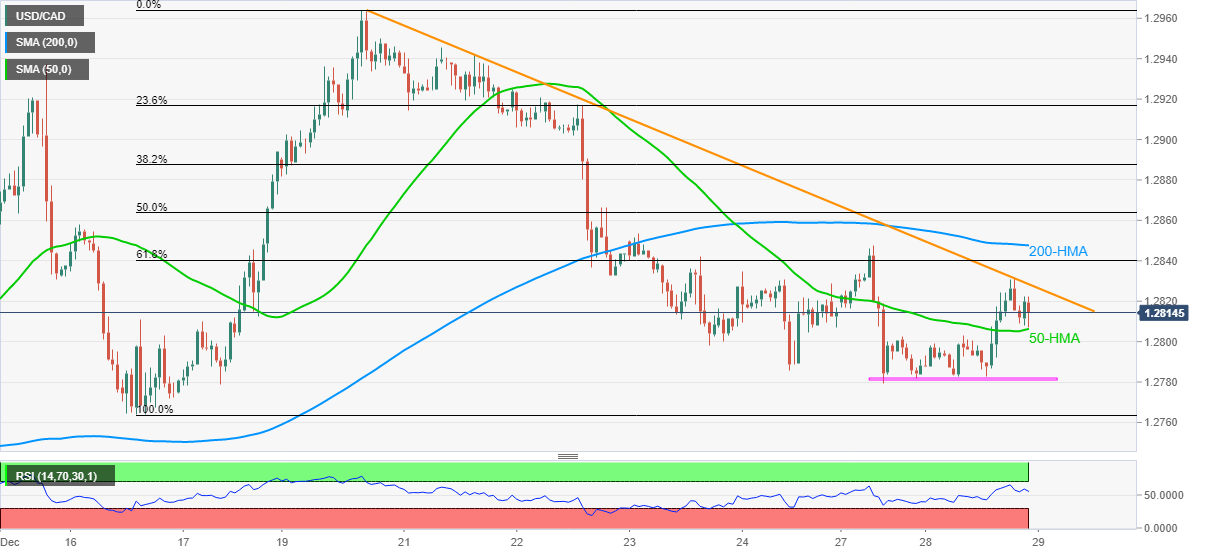
USD/CAD bounces off 50-HMA to defend the 1.2800 threshold, around 1.2820 during early Wednesday morning in Asia.
The loonie pair crossed the stated HMA the previous day but couldn’t cross a downward sloping resistance line from December 20.
Even so, a firmer RSI line and the quote’s rebound from the immediate moving average keep the buyers hopeful to overcome the 1.2830 hurdle.
Following that, the 200-HMA level of 1.2847 will precede 50% Fibonacci retracement of December 16-20 upside, near 1.2865 to limit short-term advances of USD/CAD.
On the contrary, a downside break of 50-HMA, around 1.2805 at the latest, will aim for the weekly horizontal support zone near 1.2780.
In a case where the USD/CAD sellers keep reins past 1.2780, the mid-month trough surrounding 1.2765 and 1.2715 levels may act as buffers before directing the bears towards the monthly low of 1.2607.
To sum up, USD/CAD prices are likely to recover but the bulls have a bumpy road ahead.
USD/CAD: Hourly chart
Trend: Further recovery expected
- AUD/USD holds lower ground following its U-turn from the highest levels since November 22.
- Mixed data from US, chatters surrounding Omicron triggered consolidation of recent gains amid thin end-of-year liquidity conditions.
- Australia, New Zealand begins trading week with no major data/events to track, second-tier US figures may entertain.
- Risk catalysts are crucial for short-term direction, an inactive day near the monthly top can’t be ruled out.
AUD/USD defends 0.7200 threshold despite reversing gains from a five-week top the previous day. That said, the quote seesaws around 0.7225-30 as Australia begins the holiday-shortened trading week on Wednesday.
In doing so, the Aussie pair tracks equities and gold prices amid generally lacklustre year-end trading sessions, with major attention on the South African covid variant, namely Omicron, as well as on the chatters surrounding the Fed’s rate hike concerns.
Wall Street benchmarks traded volatile as DJI managed to print a five-day uptrend but S&P 500 snapped a four-day winning streak even after refreshing the record top during early hours. Nasdaq also closed negative for the first time in five days after poking the all-time high levels marked in November. Moving on, Gold (XAU/USD) crossed the $1,814 hurdle to refresh the monthly top but posted the heaviest daily losses in a week.
Australia’s most populous state New South Wales (NSW) reports doubling of the covid infections for Tuesday, with 11,201 new infections and three virus-led deaths. Victoria also was in the line as ABC News stated, “Victoria has recorded 3,767 new local COVID-19 cases and five deaths, as testing centres continue to be overwhelmed early in the day.” This pushes the Pacific major to report the biggest daily jump in COVID-19 cases.
On the other hand, “The average number of new COVID-19 cases in the United States has risen 55% to over 205,000 per day over the last seven days,” according to a Reuters tally.
Elsewhere, US Housing Price Index eased below 1.2% forecast to 1.1% in October while S&P/Case-Shiller Home Price Indices stepped back from 19.5% prior to 18.4%, versus 18.5% market consensus. However, the Richmond Fed Manufacturing Index for December crossed the upwardly revised 12.00 figure with 16.00%.
Irrespective of the mixed data, the US inflation expectations remain near the monthly high, per 10-Year Breakeven Inflation Rate numbers from the Federal Reserve Bank of St. Louis, which in turn keeps the hope of early rate hike from Fed on the table and weigh on AUD/USD prices.
That said, the US Treasury yields had a volatile day as a coupon for the two-year benchmark jumped to the highest since March 2020 but the 10-year Treasury yields remained lacklustre around 1.48%.
Looking forward, a light calendar and year-end holiday mood may restrict AUD/USD moves while virus updates and Fed speculations will offer intermediate directions. On the data side, US Pending Home Sales and Goods Trade Balance for November are the keys to watch.
Technical analysis
Despite the recent pullback, AUD/USD prices stay above the mid-December tops surrounding 0.7225, as well as 38.2% Fibonacci retracement (Fibo.) of October-December declines near 0.7205, which in turn keeps buyers hopeful.
However, 50-DMA and 100-DMA, respectively near 0.7270 and 0.7290, challenge short-term advances of the pair ahead of flashing the 0.7300 threshold on the chart.
- On Tuesday, the shared currency lost 0.13% amid softer EUR.
- A risk-off market mood spurred the downfall of the EUR in the middle of the New York session.
- EUR/USD Price Forecast: Neutral-bearish though the break of the bottom-trendline of the bearish-pennant would accelerate the free-fall towards 1.1100.
The EUR/USD trims Monday’s gains as the New York session ends, trading at 1.1313 at the time of writing. Wall Street’s leading stock indices finished with losses, for the first time in five days, except for the Dow Jones Industrial, which gained 0.26%, finishing at 36,398.21.
As the end of the year approaches, price swings in the financial markets are exacerbated by thin liquidity conditions, sometimes leading to choppy trading. Since Monday, the US CDC decided to shorten quarantine time from 10 to 5 days to unfreeze domestic flights, exposing the US as the only country with those measures implemented. In France, the French Prime Minister Jean Castex said that work from home would be mandatory at least three times a week, while in the UK, PM Boris Johnson would not pull the trigger imposing restrictions, though he would be ready to act.
The positive news on that development is that a couple of studies in the UK add to the first one held in South Africa, saying that the Covid-19 Omicron variant, although highly transmissible, causes a mild illness. Additionally, people vaccinated who got infected with the new strain have a 50% to 80% probability of less likely being subject to hospitalization.
That said, amid a lack of macroeconomic information from the Eurozone and the US, the EUR/USD pair would lean in the US dollar dynamics and market sentiment.
EUR/USD Price Forecast: Technical outlook
The EUR/USD daily chart depicts the pair has a downward bias, as shown by the daily moving averages (DMAs) residing well above the spot price. Furthermore, the formation of a bearish-pennant exerts additional downside pressure on the EUR/USD pair, which targets 1.1100.
On the way south, EUR bull’s first line of defense would be 1.1300. A breach of the latter would expose the December 15 swing low at 1.1221, followed by a test of the November 24 YTD low at 1.1186, and then 1.1100.
-637763275492360784.png)
- EUR/CHF is eyeing a test of earlier monthly lows in the 1.0360s.
- Last week’s Swiss sight deposit data showed the SNB stepping up intervention
- It remains to be seen where their “line in the sand” is, but technicians may target an eventual move under 1.0300.
EUR/CHF edged lower on Tuesday, dropping from Asia Pacific session highs in the 1.0390s to current levels in the 1.0370s, as the pair eyes a test of monthly lows in the 1.0360s. EUR/CHF bulls will be disappointed by how the recent improvement in risk appetite over the course of the last week hasn’t translated into a sustained rebound or challenge of the December highs in the 1.0460s. It may well be that inflation differentials, where the value of the euro is being eroded at a faster rate than that of the Swiss franc, continue to gradually weigh on the pair, something the SNB pointed out earlier in the monthly.
Speaking of the SNB; Swiss sight deposit data released on Monday showed that the amount of cash held by domestic Swiss banks with the SNB rose to CHF 650B last week from CHF 645.7B the week before. The sharp rise above 650B last week comes after deposits had spent the prior six weeks ranging between a CHF 644B-647B range and will add to suspicions that the SNB has recently upped its forex interventions in order to curb CHF strength.
While it is unclear as to where the SNB’s new “line in the sand” is for EUR/CHF, the recent uptick in intervention suggests the bank likely doesn’t want to see the pair push substantially below December’s lows in the 1.0360s. From a technical perspective, the next key area of support for EUR/CHF is in the 1.0230s. It remains to be seen whether or not the SNB will allow the pair to fall to this level. Over the course of the rest of the week, trading conditions are likely to remain somewhat subdued with FX markets still in holiday mode.
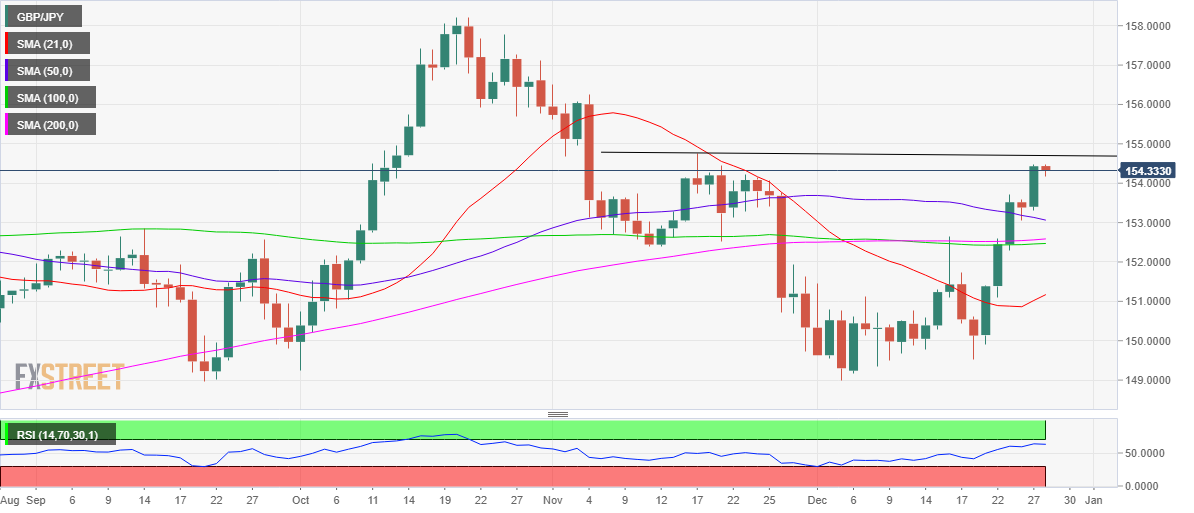
- GBP/JPY has dipped back from earlier highs above 154.50, but remains support above 154.00, well above last week’s sub-150.00 lows.
- The pair has been supported by a drastic improvement in the market’s overall appetite for risk as Omicron fears subside.
- Over the course of Q1 2022, BoE tightening and widening UK/Japan rate differentials could see the pair recover to 158.00.
GBP/JPY has pulled back from earlier session highs that saw the pair briefly surpass 154.50 for the first time since 17 November, and even then only come within a whisker of that day’s 154.74 high. GBP/JPY is now trading just above the 154.00 level having found decent buying interest at the big figure, having fallen back from earlier session highs as risk-sensitive currencies undergo a modest technical correction of their recent run of gains versus safe-haven currencies like the yen.
In the context of the recent run of gains experienced by GBP/JPY since last Monday’s lows, Tuesday’s very modest just over 0.1% reversal from highs is just that, very modest. The pair still trades more than 3.0% higher versus Monday’s sub-150.00 lows and an even healthier 3.5% up from December’s near-149.00 lows. The 148.50-149.00 area has proven to be a key zone since the start of Q2 2021 and seemingly lived up to expectations in December once more.
The main driver of the rally in GBP/JPY over the last slightly more than one week has been a drastic improvement in the market’s overall appetite for risk (US equities have soured to fresh record levels in a belated year-end Santa rally). As the Omicron variant spreads rapidly across the world, it appears to be living up to the “best-case scenario” of being very mild in comparison to prior strains, according to a succession of early studies. It hasn’t yet triggered a healthcare system threatening surge in hospitalisations anywhere in the world and, as a result, the UK government is holding off on imposing tougher curbs for now, as are other parts of the world.
Given the UK economy, an early Omicron epicentre in Europe was seen as particularly vulnerable to lockdowns/a spike in hospitalisations as recently as two weeks ago, the recent run of positive developments has seen GBP perform particularly well. A less concerning Omicron picture likely gives the BoE, who kicked off their rate hiking cycle earlier on in the month, the green light to continue hiking interest rates in February.
As the BoE/BoJ rate differential widens in the coming months, this could support further strides higher in GBP/JPY so long as risk appetite doesn’t take any further batterings. That suggests that the recent rebound from close to 149.00 to above 154.00 has legs to continue back towards October highs at 158.00 over the course of Q1 2022. Until the start of the new year, however, things may be subdued for the pair, with FX markets likely to remain to a large degree in holiday mode.
What you need to know on Wednesday, December 29:
The dollar received some market’s attention in the American afternoon, posting daily gains against most major rivals. Wall Street opened with a firm tone and flirted with all-time highs, but turned lower soon afterwards, with major indexes ending the day mixed. In the absence of relevant news, investors focused on mounting speculation the US Federal Reserve may raise rates as soon as in March 2022.
US government bond yields maintained a low profile, holding at the lower end of their weekly range. The yield on the 10-year Treasury note hit 1.455% and currently stands at around 1.47%.
EUR/USD pressures the 1.1300 level, while GBP/USD holds above 1.3400 after reaching a fresh monthly high of 1.3461. AUD/USD trades around 0.7220 while USD/CAD quotes at 1.2816 as commodities eased from fresh highs. The USD/JPY pair trades just below the 115.00 figure, maintaining its bullish stance.
Gold peaked at $1,820.25 a troy ounce, but trimmed intraday gains and closed in the red at 1,806. Crude oil prices rallied to fresh multi-month highs, with WTI reaching $76.89 a barrel.
Good news in the Brexit front provided support to the Pound Sterling, as the EU and the UK reached a deal to increase the UK workers’ quota from 50% to 70% in fishing vessels, starting April 2022.
Meanwhile, most European countries keep reporting record coronavirus contagions. However,
Top 3 Price Prediction Bitcoin, Ethereum, XRP: Cryptos struggle to hold holiday gains
Like this article? Help us with some feedback by answering this survey:
- The yellow metal slides some 0.32% during the New York session, despite unchanged US Treasury yields.
- The market mood switched towards a risk-off mode, boosting the greenback to the detriment of the precious metal.
- XAU/USD Price Forecast: In consolidation but slightly upwards, as bull’s target $1,834.
Gold (XAU/USD) vs. the US Dollar grinds lower during the New York session, trading at $1,805 at the time of writing. Before Wall Street opened, the market mood was upbeat, as US equity futures pointed to a higher open, as market participants’ worries on the newly discovered Covid-19 strain called Omicron eased. Alongside the aforementioned and some USD strength early in the New York open, put a lid on the yellow metal prices.
In the overnight session, the non-yielding metal rallied up to the R2 daily pivot at $1,819.73, dropping towards $1,800 despite the lack of movement in US T-bond yields. The US 10-year benchmark note is unchanged at 1.48%, failing to reflect the “hawkish” pivot by the Federal Reserve on its last monetary policy meeting, on December 15, were announced a faster reduction to its QE program, eyeing March 2022 as the end of the Covid-19 pandemic stimulus.
In the meantime, the US Dollar Index, which tracks the greenback’s performance against a basket of six rivals, rises 0.13%, up to 96.22,
An absent US macroeconomic docket has kept gold traders leaning on the dynamics of market mood and the USD. On Wednesday, the US docket will feature Pending Home Sales for November. By Thursday, Initial Jobless Claims and the Chicago PMI would be the last economic data revealed on the most significant economy worldwide.
XAU/USD Price Forecast: Technical outlook
Gold 4-hour chart depicts that the yellow metal is in consolidation, though tilted upwards, as the drop from December’s monthly high was capped by the 200-simple moving average (SMA) around $1,806, which acted as a dynamic support level.
To the upside, Gold’s first resistance level would be the December 28 daily high at $1,820. A breach of that level would expose the September 3 swing high at $1,834, followed by a November 22 daily high test at $1,849.
-637763184518044334.png)
- The Australian dollar sheds some of Monday gains, down 0.21%.
- Federal Funds Rates expectations increased to near 60%, as investors priced in a 25 basis points hike for the March meeting.
- AUD/USD Price Forecast: Monday’s rally stalled around the 50-DMA per the daily chart.
The AUD/USD trims some of its Monday’s gains, trading at 0.7224 during the New York session at the time of writing. The market sentiment is mixed-tilted downbeat as European indices finished the day in the green, while Wall Street’s ones fluctuate between gainers and losers across the pond.
In the last couple of hours, the market sentiment swang aggressively towards a risk-off mood, while the greenback with its US Dollar Index advances some 0.08%, sitting at 96.17, after reaching a daily high at 96.28, as Federal Funds Rate expectations have increased.
The CME’s FedWatch Tool, which reports market participants’ expectations for monetary policy, showed on Tuesday that for the March 2022 meeting, there’s a 57.3% possibility of a hike from 0-0..25% to 0.25-0.50%. Alongside Federal Reserve’s “hawkish” expectations, a diminish in investors’ risk appetite boosted the prospects of the USD vs. the AUD., which reached a daily high at 0.7263 before dropping as market conditions dampened.
AUD/USD Price Forecast: Technical outlook
The AUD/USD daily chart depicts that the overnight rally of the pair stalled around the 50-day moving average (DMA) 0.7270, to then retreat towards the 0.7220s area. Further, Tuesday’s price action is forming an inverted hammer candlestick with a “long wick” that shows AUD/USD traders rejecting higher prices, as selling pressure mounted around the 0.7260s area.
On the downside, the AUD/USD buyer’s first line of defense would be the 0.7200 figure. A breach of the latter would expose the September 30 swing low at 0.7169, followed by a test of the August 20 pivot low at 0.7105.
-637763137637224650.png)
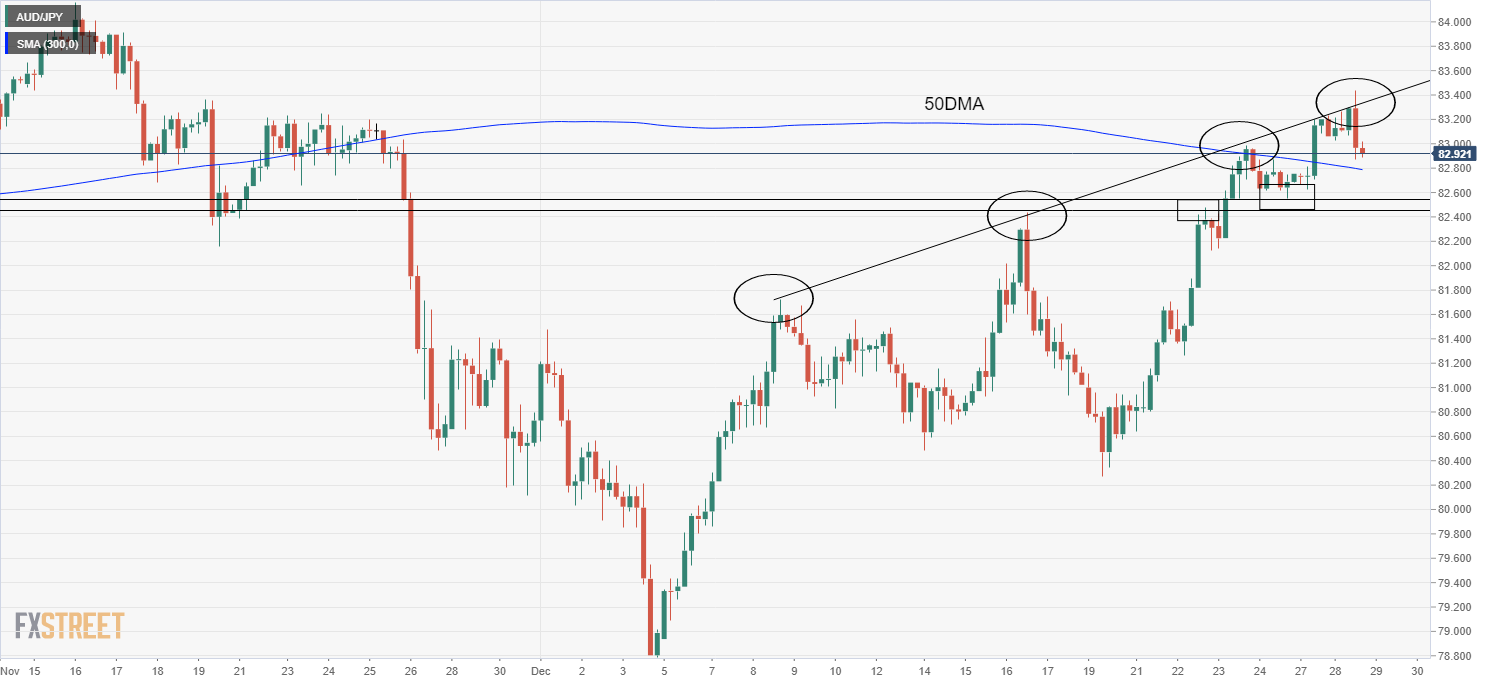
- AUD/USD has dipped under 83.00 as risk assets more broadly see technical corrections and after running into resistance at 83.50.
- But the pair may well find decent dip-buying interest above its 50 and 200DMAs, which would bode well for the bulls.
AUD/JPY has pulled back from earlier session highs close to the 83.50 level to back under the 83.00 mark again in recent trade as traders take profit on recent risk asset bets. Stocks and crude oil have also pulled back from earlier session highs as markets undergo a modest technical correction following recent risk-on driven moves.
While AUD/JPY now trades about 0.2% lower on the session, the pair continues to trade with on the week gains of nearly 0.5% and is still well over 3.0% up versus last Monday’s sub-80.50 lows. Recall that risk-assets like the Aussie have surged and safe-haven assets like the yen have suffered in recent days as Omicron fears have subsided. AUD has also had the added boost of strength in base metals and optimism that Chinese authorities will step in with more support for economic growth in 2022.
For now, AUD/JPY appears to be finding some support just above its 50-day moving average in the 82.80s. Should that level go, there is plenty more nearby support to the downside in the form of the 200DMA in the 82.60s and an important balance area (that has recently functioned as resistance then support) around 82.50. An uptrend has been capping the price action for AUD/JPY over the past few weeks and technical selling as the pair failed to break above this trendline earlier in the session likely has something to do with the recent pullback from highs.
But that doesn’t mean that AUD/JPY’s recent bullish run is over. If the pair can find good dip-buying interest and remain supported to the north of its 50 and 200DMAs, that bodes well that a move back towards 83.50 is on the cards. But technicians should be aware that for the rest of the week, FX markets may struggle to trade with much conviction given that many market participants in Australia, Europe and the US will be away for Christmas/New Year’s celebrations.
- The EUR/GBP slides some 0.05% during the New York session.
- A mixed-market mood keeps the pair seesawing between gaining/losing.
- EUR/GBP Price Forecast: Death-cross in the 4-hour chart pave the way for further losses.
The EUR/GBP extends its Monday’s losses, trading at 0.8423 during the New York session at the time of writing. The market sentiment is mixed, as US equity indices fluctuate between gainers and losers, though the S&P 500 printed an all-time high at 4,807, the Nasdaq retreats almost 1% at press time.
The Covid-19 outbreak continues. On Tuesday, cases worldwide reached a new daily high above 1.449 million cases amid the spread of the newly discovered strain called Omicron.
In the overnight session, the EUR/GBP remained subdued in the Asian session. But as European traders got to their desks, risk appetite weighed on the shared currency, which has been as of lately a safe-haven play, dipped as low as 0.8400, to then reverse its curse, stabilizing around the December 27 daily low at 0.8422.
EUR/GBP Price Forecast: Technical outlook
The EUR/GBP 4-hour chart depicts a formation of a falling wedge, but, at the same time, the 50-simple moving average (SMA) crossed below the 200-SMA, forming a death cross a bearish signal. Furthermore, the Relative Strength Index (RSI), a momentum indicator at 38.21 despite aiming up, stills in bearish territory, so a downward move is on the cards.
On the way down, the EUR/GBP’s first support would be the psychological 0.8400. A breach of the latter would expose the YTD low at 0.8380.
To the upside, EUR/GBP’s first resistance would be the December 28 daily high at 0.8430. A break of that level would open the door for further gains. The next line of defense for GBP bulls would be the December 24 daily high at 0.8463, followed by the December 23 daily high at 0.8497.
-637763097207174578.png)
- The S&P 500 is flat following Monday’s stunning 1.4% surge and has slipped back from earlier session highs above 4800.
- Receding Omicron-worries, signs of a bullish economy and positive seasonality are being cited as bullish factors helping equity market sentiment.
The S&P 500 is trading flat on Tuesday following Monday’s stunning 1.4% surge, with the index falling back from earlier session (and record) highs to the north of the 4800 level. That means the index is now nearly 6.0% up versus last Monday’s lows and with three and a half sessions left to go of the month, is on course to post a monthly gain of more than 5.0%. If the index was to close out the year at current levels, that would translate into gains of about 27%.
Traders have cited a cocktail of positives as behind the rally seen in equities this week. Firstly, concerns about the impact of the Omicron Covid-19 variant have eased substantially since last week as it becomes clear that the new variant is far milder than any prior variants and after new pills were approved in the US that will substantially lower Covid mortality. Secondly, analysts remain upbeat at the prospect for continued earnings growth in 2022 amid signs of underlying strength in the US economy. On Monday, traders were passing around a bullish report from Mastercard which had been released on Sunday and showed a very strong holiday shopping season in the US (sales were up 8.5% YoY between 1 November to 24 December), easing fears that the fast-spreading Omicron variant would hurt growth.
This has helped to ease concerns following news of store closures in New York and elsewhere as retailers look to avoid exposing staff to the Omicron variant. Apple said it had closed all of its 12 New York stores, with customers only able to pick up orders. That hasn’t fazed Apple investors, with AAPL shares up more than 2.0% on the week and back above $180, giving the company a market capitalisation of $2.96T. When the company does inevitably surpass the $3T mark, this will likely generate a lot of headlines. Back to reasons why broader equity market sentiment is buoyant, traders are also citing positive seasonality. According to Reuters citing CFRA Research data, going back to 1969, the S&P 500 has on average risen 1.3% over the course of the final five trading days and then into the first two trading days of each calendar year.
In terms of the other major US indices, the Nasdaq 100 index is a tad lower on the day trading in the mid-16,500s, having at one point been above 16,600 earlier in the session. The tech-heavy index trades just 1.4% below the record levels printed back in November just under 16,800 and is more than 6.5% above last week’s sub-15,600 lows. The Dow, meanwhile, is up about 0.4%, though was unable to hold above 36,500 and fell short of testing its early November highs at 36,565. The CBOE S&P 500 volatility index (or VIX) is stable just underneath the 18.00 level and close to its lowest point of the month. Recall that the index went as high as 35.00 earlier this month, its highest since January.
According to an article published by the Wall Street Journal (WSJ), US President Joe Biden is considering nominating former Fed board of governors member and former Treasury Department official Sarah Bloom Raskin for the role of vice chair for supervision of the banking system. For the other two board of governor seats that will some become available, Biden is reportedly considering Lisa Cook, a professor of economics and international relations at Michigan State University and Philip Jefferson, a professor at Davidson College in North Carolina.
The appointments will likely appeal to the progressive wing within the Democrat party who have decried the Fed's lack of diversity (in terms of gender and ethnicity). Lisa Cook and Philip Jefferson are both African American.
Market Reaction
There hasn't been any market reaction to the latest news of potential Fed board of governor nominees.
- US dollar gains momentums across the board on America hours; DXY gains 0.12%.
- Equity prices in Wall Street mostly in positive ground.
- EUR/USD breaks minor range, but remains sideways.
The EUR/USD weakened after the beginning of the American session and dropped to 1.1288, reaching the lowest level in six days. During the last hour, it trimmed losses rising back above 1.1300.
Stocks up, US yields down but off lows
In Wall Street, stocks are trading mostly higher amid optimism about the impact of Omicron following new announcements from the Centers for Disease Control regarding isolation guidelines. The Dow Jones gains 0.44% and the SP500 is rising 0.11%. The 10-year yield stands at 1.46%, modestly lower for the day. The rebound of the US dollar was helped by US yields that move of lows on American hours.
Economic data released on Tuesday showed the FHFA House Price Index rose 1.1% in October while the S&P CoreLogic/Case-Shiller index climbed 18.4% from a year ago in October (below the 19.1% of September).
EUR/USD still sideways
Despite hitting six-day lows, EUR/USD continues to move sideways without a clear direction. A consolidation under 1.1290 should expose the next support level at 1.1260. While on the upside, the euro needs to break above the 1.1350/60 barrier in order to clear the way to more gains.
Technical levels
- NZD/USD dipped back under 0.6800 in recent trade, though support has come in ahead of the 21DMA.
- The pair may struggle for conviction this week amid holiday thinned trading conditions.
- Next week’s heavy US data slate could offer FX markets some impetus.
NZD/USD has dipped back under the 0.6800 level in recent trade and now trades lower on the session by about 0.2%. The pair failed to emulate its risk-sensitive peers AUD/USD and GBP/USD, which both managed to eke out fresh December/multi-week highs earlier in the session. Indeed, during Asia Pacific trade, the kiwi couldn’t even reach 0.6830, meaning it didn’t even come close to testing this month’s 0.6867 highs set back on 1 December.
On the week, NZD now trades about 0.3% lower versus the US dollar, compared with the Aussie which is flat and sterling which is still 0.3% higher. Compared to last week’s lows, NZD/USD is just 1.3% higher, compared to AUD/USD and GBP/USD, both of which are about 2.0% higher.
For now, the 21-day moving average at 0.6785 is likely to provide a floor for NZD/USD, with FX markets likely to remain fairly rangebound for the rest of the session and perhaps week. Many European and US market participants are away this week for Christmas/New Year’s celebrations meaning thin liquidity and low volumes. FX markets are likely to find some more conviction next week when the economic calendar also spices up again. There isn't any notable data out of New Zealand for a few weeks, but the official December US labour market report and December US ISM PMI surveys are out next week.
Both should point to ongoing strength in the US economy that should vindicate the Fed’s recent guidance that three rate hikes are possible in 2022. NZD/USD failure to recover back to the north of recent December ranges suggests that in the new year when FX market volumes (and conviction) returns, the pair will be vulnerable to a correction lower towards December lows just above 0.6700.
- Silver surges some 0.22% amid lower US Treasury yields.
- The US Dollar Index advances 0.12%, clings to the 96.00 figure though fails to weigh on XAG/USD.
- XAG/USD Price Forecast: The break of a bullish-pennant pushed silver to the confluence of the 50 and the 100-DMA.
Silver (XAG/USD) advances for the second day in the week, above $23.00 for the first time in a month, during the New York session. At the time of writing, XAG/USD is trading at $23.11, up some 0.60%.
For the second consecutive day, precious metals led by gold and silver climbed as risk appetite improved, coupled with US dollar weakness, as the year-end looms. Nevertheless, the hawkish pivot by the Federal Reserve and the beginning of a faster bond-taper in the middle of January of 2022 put a lid on any silver upward movements, as per Fed policymakers expect at least three rate hikes, on the following year.
In the meantime, the US Dollar Index, which measures the value of the greenback against a basket of its peers, advances some 0.12% at 96.20. in the bond market, the 10-year benchmark note coupon falls one and a half base point sits at 1.465%, a tailwind for XAG/USD, as real rates head nowhere, with 10-year US TIPS at -1.083%.
Silver broke to the upside a bullish pennant of the 1-hour chart during the overnight session, reached a daily high around $23.41, and then retreated towards $23.09.
XAG/USD Price Forecast: Technical outlook
Silver’s daily chart depicts that the non-yielding metal has a neutral-bearish bias. The rally in the overnight session was capped by the confluence of the 50 and 100-day moving averages (DMAs) around the $23.33-45 area, and at press time, XAG bulls achieved to keep the price above the December 27 daily high, $23.09.
To the upside, XAG/USD’s first resistance would be the 100-DMA at $23.33, immediately followed by the 50-DMA at $23.43. A breach of that area would expose the November 25 daily high at $23.70.
On the other hand, the first support would be the December 27 daily high at $23.09. A break below that level would expose $23.00, followed by the December 24 cycle low at $22.59.
- EUR/JPY hit a one-month high at 130.22 before turning to the downside.
- Euro remains under pressure in American hours, as EUR/USD falls under 1.1300.
The EUR/JPY failed to hold above 130.00 and is falling on Tuesday, weakened by a decline of the EUR/USD that is trading under 1.1300. The euro lost momentum during the American session.
Retreat from monthly highs
After the beginning of the American session the EUR/JPY started to correct lower, before accelerating. Earlier on Tuesday, the EUR/JPY peaked at 130.22, the highest level since November 22. As of writing, it trades at 129.68, the daily low.
The decline of the EUR/USD under 1.1300 contributed to the slide of the euro. The pair is trading at 1.1290, breaking a three-day range that could point to further weakness ahead. The dollar gained momentum even amid risk appetite.
On Wall Street, the Dow has gained 0.43% and the S&P 500 0.10%, while the Nasdaq has dropped 0.12%. In Europe, most indices finished in green. Santa’s rally continues but the EUR/JPY has been unable to profit from it on Tuesday.
If the cross manages to regain an hold above the 130.00 area, the euro could look for further gains. On the downside, immediate support is seen at around 129.60, followed by 129.10.
Technical levels
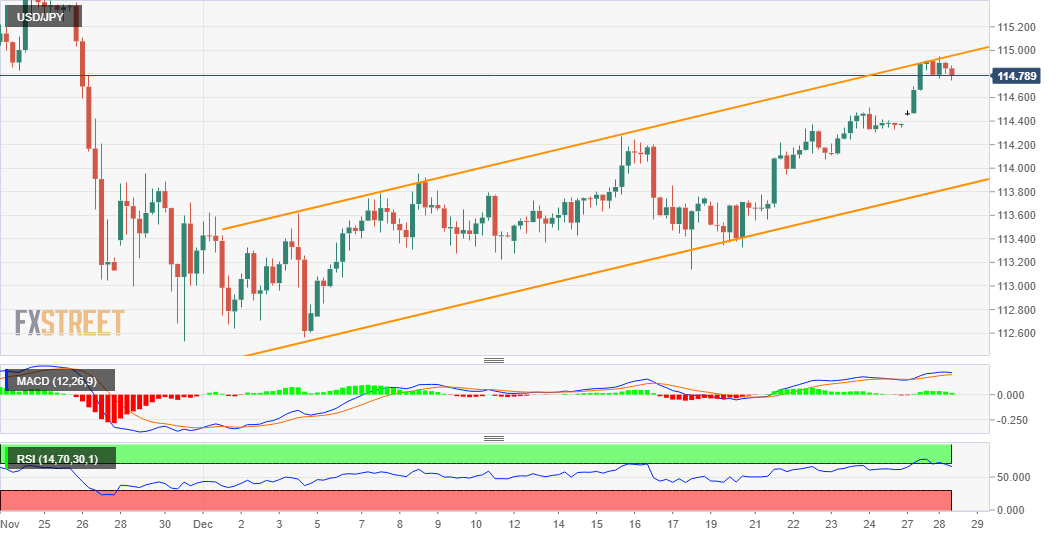
- USD/JPY is trading subdued just to the south of the 115.00 level after Monday’s surge above 114.50.
- A sychronised rally in risk assets on Monday weighed on the yen at the time.
- For USD/JPY to test annual highs at 115.50, longer-term US yields will likely need to recover some more.
USD/JPY is trading in subdued fashion this Tuesday underneath, but not far from, the 115.00 level after Monday’s risk-on fuelled surge that pushed it back to the north of the 114.50 level. The pair has eased back from Asia Pacific session highs in the mid-114.90s, but found decent support at 114.70 and is now trading in the 114.80s. FX market conditions are unusually subdued this Tuesday due to market closures in various parts of the world and generally thinned liquidity/volumes with many European and North American-based market participants away for ongoing Christmas and New Year’s celebrations.
Fuelling Monday’s rally from 114.30ish lows to session highs around 114.90 was a surge in US (and global) equities, as well as in crude oil and other commodity prices. Traders are feeling much more positive about the rapid spread of the highly transmissible Omicron Covid-19 variant across the globe as governments in Europe (UK, France, Spain) refrain, for now, from toughening Covid curbs with hospitalisation rates yet to rise. That has raised hopes that the variant will prove less disruptive than feared for the US (and global) economy over the coming months.
The surge in risk-on sentiment unsurprisingly hit demand for the safe-haven yen, which underperformed across the board at the time versus its G10 counterparts. But USD/JPY seems reluctant to push above 115.00 and on towards a test of its November highs at 115.50. That is because, despite the recent surge in stocks and other risk-sensitive assets, longer-term US bond yields are yet to join the party and start rising. The US 10-year yield on Tuesday continues to trade subdued underneath the 1.50% mark, leaving it still about 20bps below pre-Omicron levels. USD/JPY is highly correlated to the US 10-year yield, and so for the pair to test its annual highs around 115.50, the 10-year will likely need to rally, which seems unlikely to happen before 2022 with bond markets in holiday mode.
- WTI trades just above $76.00, supported as Omicron pessimism is priced out and amid supply outages.
- WTI only trades about $2.0 below pre-Omicron levels above $78.00, suggesting fears of economic disruption have mostly been priced out.
Oil prices have pared earlier gains with front-month WTI futures currently trading just above the $76.00 mark, after running into resistance at the 50-day moving average at $76.66 and at the $77.00 level earlier in the session. WTI continues to trade with substantial gains on the week of nearly $2.50 (over 3.0%), after surging above resistance in the $74.00 and $75.00 areas on Monday.
Crude oil prices have been moving higher in recent sessions in tandem with global equity markets and other risk assets as traders continue to price out Omicron-related pessimism. Studies last week showed infection with the new Covid-19 variant to be comparatively mild, thus reducing the pressure on governments to implement economically harmful lockdowns and oil-demand destroying travel restrictions. WTI is only trading about $2.0 below its pre-Omicron levels just above $78.00, indicative of the fact that most of associated fears of economic disruption have now been priced out.
Traders have also been citing supply disruptions in the likes of Ecuador, Libya and Nigeria as positive for oil prices this week, with producers in each of these nations declaring force majeures amid problems with maintenance and other issues. Coming up, US weekly private crude oil inventory numbers are out at 2130GMT ahead of the official EIA release at 1530GMT on Wednesday. A poll released by Reuters on Monday showed that inventories are expected to post a fifth successive draw (of slightly over 3.2M barrels). Beyond that, the next OPEC+ meeting (on 4 January) is fast approaching and traders will be on the lookout for any commentary from oil ministers/insight from inside sources.
- The USD/CAD pares some Monday losses, up some 0.09%.
- Despite recording a daily high of Covid-19 cases, around 1.4 million worldwide, investors’ mood is upbeat.
- High US crude oil prices failed to lift the CAD prospects.
- USD/CAD Price Forecast: Range-bound, though slightly tilted to the downside.
The USD/CAD bounces off weekly lows trading at 1.2804 during the New York session at the time of writing. Financial markets are in a risk-on mood as the S&P 500 approaches the 4,800 barrier, despite recording the largest increase of Covid-19 infections worldwide, topping 1.4 million. In the meantime, Western Texas Intermediate, US crude oil benchmark, which correlates with the Canadian dollar, advances some 0.97%, trading at $76.28 a barrel, failing to lift the loonie prospects.
In the meantime, the US Dollar Index, which measures the greenback’s performance against a basket of its rivals, remains unchanged at 96.10, underpinned by the US 10-year T-bond yield down one basis point, sitting at 1.464%.
Apart from this, the US Center for Disease Control and Prevention (CDC) announced reduced isolation time, from 10 to 5 days, a major change as the Omicron variant takes its toll in American citizens. On Monday in France introduced some restrictions, like working from home at least three times a week, while the UK stays put but ready to act if it is needed.
The USD/CAD remained subdued in the overnight session, within familiar levels as the lack of liquidity has kept most G8 currencies “trapped” in narrow ranges. In the case of the Loonie, the range has been 1.2780-1.2800, with the only macroeconomic data of importance to be released, the US Initial Jobless Claims, for the week ending on December 23. That said, USD/CAD traders would lean on market sentiment, commodity prices behavior in particular oil, and US dollar dynamics as the year-end looms.
USD/CAD Price Forecast: Technical outlook
The USD/CAD 1-hour chart depicts consolidation in the last two trading days, though the CAD strengthened on Monday, falling from 1.2846 to 1.2780s. The downward move stalled around the December 24 daily low at 1.2785, but on its way south pierced the 50-hour simple moving average (SMA).
At press time, the pair would find strong resistance at the confluence of the daily central pivot point and the 50-hour SMA at 1.2802. A break above that level would send USD/CAD to the 100-hour SMA at 1.2820, followed by the R1 daily pivot at 1.2826.
On the other hand, USD/CAD’s first line of defense to the downside would be the December 27 daily low at 1.2778, followed by the December 16 swing low at 1.2763. A breach of the latter would expose the S1 daily pivot at 1.2758, followed by the S2 pivot at 1.2734.
- GBP/USD hit its highest levels in over a month on Tuesday above 1.3450, despite UK Boxing Day market closures.
- The pair has been lifted in recent sessions as traders price out the most bearish UK Omicron lockdown scenarios.
GBP/USD has pushed to its highest level in more than a month on Tuesday, crossing above its 50-day moving average (currently at 1.3443) for the first time since October and surpassing 1.3450. On the day, the pair is trading with modest gains of between 0.1-0.2% as FX markets more broadly remain rangebound/subdued amid holiday-thinned trading conditions. Indeed, UK markets are currently shut for the Boxing Day bank holiday. The next key area of resistance that the sterling bulls will be eyeing is around the 1.3500 level.
The pair now trades more than 2.0% higher versus last Monday’s lows, a rally that has been driven by pricing out of some of the more bearish scenarios for the UK economy over the coming months. Robust evidence emerged last week from multiple scientific courses that the Omicron Covid-19 variant currently rampant in the UK is much less likely to result in severe disease versus the Delta variant. These studies, coupled with the fact that UK Covid-19 hospitalisation rates are yet to show any signs of a substantial pick up, means that the likelihood of the government significantly tightening pandemic-related curbs to slow transmission has greatly diminished.
A lockdown in England ahead of New Year’s Eve has been ruled out by the UK Health Secretary as the government continues to assess incoming data, though further restrictions could be imposed in January. FX market price action suggests markets are betting that new restrictions won’t be announced. GBP outperformance may continue if the UK Omicron hospitalisation data remains favourable and further restrictions unlikely. There is next to no important data out of the UK this week, suggesting the scope for further GBP/USD rebound is more limited than it otherwise would be, given expectations for markets set to remain subdued.
According to the latest data from the Federal Housing Finance Agency, the monthly House Price Index rose to 358.3 in October from 354.4 in September, a 1.1% MoM rise. That took the YoY rate of house price increase to 17.4% on the month.
The S&P/Case-Shiller Home Price Index, released by Standard & Poor's, showed prices rising at a YoY rate of 18.4% in October, slightly below the expected pace of 18.5% and a tad down from October's YoY rate of 19.1%.
- AUD/USD gained some follow-through traction on Tuesday and shot to a fresh monthly high.
- The risk-on mood undermined the safe-haven USD and benefitted the perceived riskier aussie.
The AUD/USD pair build on its intraday ascent through the early North American session and shot to the highest level since November 22, around the 0.7265 region in the last hour.
The pair attracted some dip-buying near the 0.7220 area on Tuesday and climbed further beyond the previous monthly swing high, around mid-0.7200s amid a softer tone surrounding the US dollar. The prevalent risk-on mood was seen as a key factor that weighed on the safe-haven greenback and continued benefitting the perceived riskier aussie.
The global risk sentiment remained well supported by reports that the new COVID-19 strain may be less severe than the previous Delta variant. Adding to this, studies that Omicron infections are less likely to lead to hospitalization helped ease fears over the economic impact of the continuous surge in new cases and further boosted investors' sentiment.
That said, the Fed's hawkish outlook, indicating at least three rate hikes next year, should act as a tailwind for the greenback and cap gains for the AUD/USD pair. Investors might also be reluctant to place aggressive bullish bets amid thin year-end trading conditions. This, in turn, warrants some caution before positioning for any further appreciating move.
Nevertheless, the AUD/USD pair remains on track to end the day in the green for the second successive day, also marking the fifth day of a positive move in the previous six sessions. Market participants now look forward to a relatively lighter US economic docket, featuring the release of the Richmond Manufacturing Index. This, along with the broader market risk sentiment, would drive the USD demand and assist traders to grab some short-term opportunities.
Technical levels to watch
- Spot gold prices moved to six-week highs despite risk-on markets as long-term US bond yields remain subdued.
- XAU/USD hit $1818, surpassing the December and late-November highs, up $30 from last week’s lows.
Spot gold (XAU/USD) prices hit six-week highs on Tuesday, surpassing December’s $1814.30 high and the 26 November high at $1815.57 to hit $1818. The safe-haven precious metal is rallying despite risk-on conditions in other asset classes such as stocks (US equities are trading at record highs in pre-market trade) and risk-sensitive commodities such as oil. Despite typical low volumes at this time of year owing to the Christmas/year-end holidays, traders have been aggressively pricing out bearish economic scenarios, with the fast-spreading Omicron Covid-19 variant looking mild, reducing lockdown risk in the US and elsewhere. This hasn’t weighed at all on gold, with the precious metal having now advanced about $30 or 1.7% from last week’s lows in the mid-$1780s.
XAU/USD has been taking its cue, as is normally the case, from FX and bond markets. In terms of the former, the dollar continues to trade close to the bottom of recent ranges, with the DXY subdued just to the north of the 96.00 level. Meanwhile, though short-end US yields have been picking up as traders price in the probability of an increasingly hawkish Fed (markets currently assign a roughly 50% chance of a rate hike in March), longer-term US yields remain subdued. The nominal US 10-year, for example, continues to trade under 1.50%, having been unable to move higher in tandem with stocks/oil as some might have anticipated. 10-year TIPS (real) yields, meanwhile, also remain subdued and within recent ranges underneath the -1.0% level.
Longer-term bond yields continue to tell a story of a subdued long-term outlook for the US economy, with growth and inflation reverting back to sub-trend levels over the coming years and monetary policy remaining reasonably stimulative in the long run. This could reflect a few things; 1) that markets are disappointed that Congress hasn’t yet passed the Biden administration’s Build Back Better spending package, 2) that traders are worried the Fed is going to tigthen too soon a stymie growth and 3) that the pandemic is set to weigh on economic activity for the foreseeable future. As long as longer-term US yields (real and nominal) remain subdued, this will support gold above the $1800s. The big threat to gold would be if this bearish long-term outlook for the US starts to improve.
In the immediate future, there is very little by way of US data this week that can shift the macro narrative. Next week will be much bigger on that front with the release of the December official jobs report and ISM surveys.
- USD/CHF came under renewed selling pressure and dropped to a fresh monthly low on Tuesday.
- The risk-on mood could undermine the safe-haven CHF and help limit deeper losses for the pair.
- A break below the 0.9155 area will validate 200-DMA breakdown and set the stage for further losses.
The USD/CHF pair maintained its offered tone heading into the North American session and was last seen trading near the monthly low, around the 0.9160 region.
Having faced rejection near the 0.9200 mark on the first day of the current week, the USD/CHF pair met with a fresh supply on Tuesday and now seems to have found acceptance below the 200-day SMA. The downtick lacked any obvious fundamental catalyst and could be attributed to subdued US dollar demand, though a combination of factors might help limit deeper losses.
Global risk sentiment remained well supported by reports that the new COVID-19 strain may be less severe than the previous Delta variant. Adding to this, a study that Omicron infections are less likely to lead to hospitalization helped ease fears over the economic impact of the continuous surge in new cases and further boosted investors' sentiment.
The upbeat market mood was evident from a generally positive tone around the equity markets, which tends to undermine demand for the safe-haven Swiss franc. The risk-on flow was reinforced by a modest uptick in the US Treasury bond yields. This, along with the Fed's hawkish outlook, could act as a tailwind for the greenback and the USD/CHF pair.
From a technical perspective, sustained weakness below a technically significant 200-day SMA could be seen as a fresh trigger for bearish traders. Some follow-through selling below the November monthly swing low, around the 0.9155 region, will reaffirm the negative bias and set the stage for a further near-term depreciating move for the USD/CHF pair.
Next on tap is the release of the Richmond Manufacturing Index from the US. Apart from this, the US bond yields will influence the USD price dynamics and provide some impetus to the USD/CHF pair. Traders will further take cues from the broader market risk sentiment to grab some short-term opportunities amid thin end-of-year liquidity conditions.
Technical levels to watch
- EUR/USD is trading in subdued fashion though remains well supported to the north of the 1.1300 level.
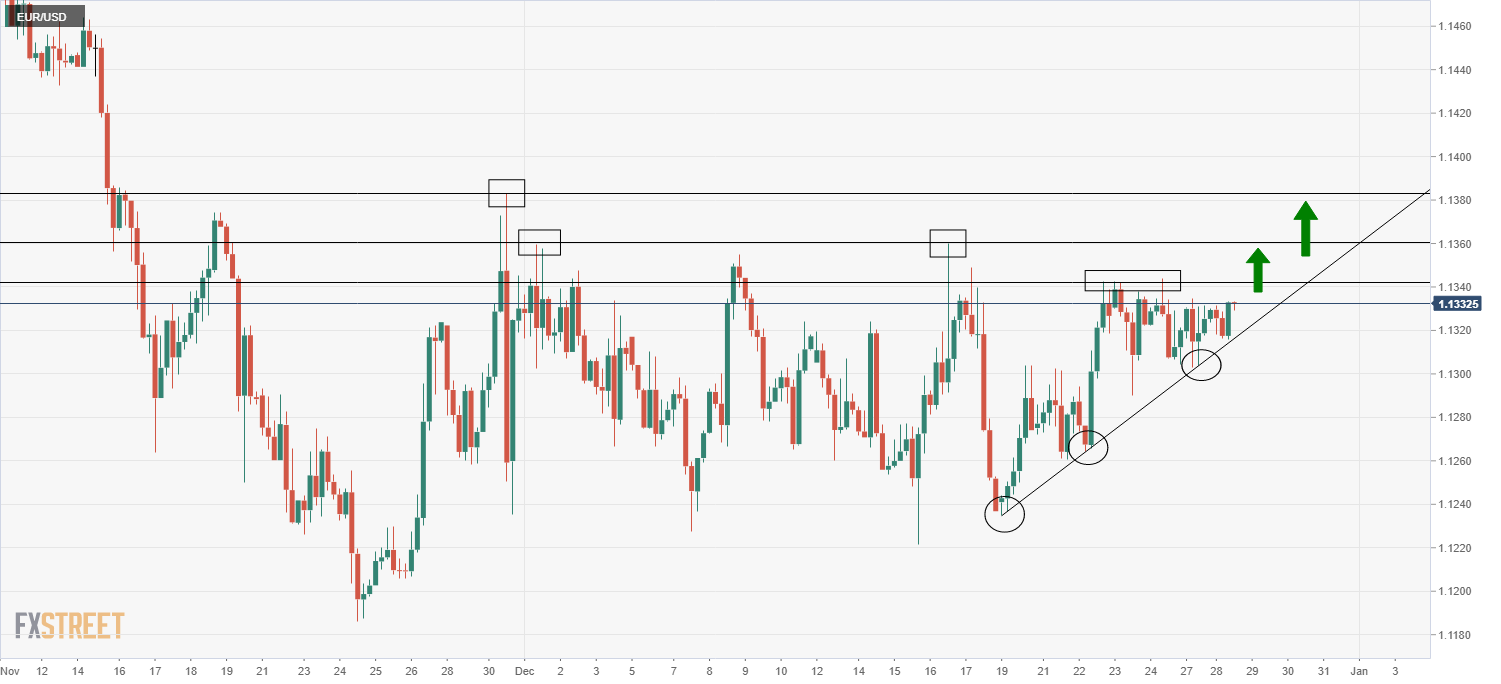
- The pair has formed an ascending triangle in recent sessions but is likely to remain within recent ranges into 2022.
EUR/USD is currently trading just below highs of the week in the 1.1330 area, amid subdued, holiday-thinned trading conditions. The pair has traded with a modestly positive trading bias this week amid broadly risk-on conditions (stocks and commodities have been moving higher), which seems to have weighed slightly on the buck and looks set to remain well supported above 1.1300. Indeed, this is where the 21-day moving average currently sits, with the moving average having offered good support in recent sessions.
As strategists had been expecting, EUR/USD continues to trade well within the 1.1240-1.1360ish range that has prevailed for most of the month. This range is likely to hold until 2022 gets underway and market participants return and volumes go back to normal. Indeed, the first week of January will be a big one with the release of the December US jobs report and ISM manufacturing and services PMI surveys all due. This week there is very little US data of note aside from the usual weekly jobless claims report on Thursday. The Eurozone economic calendar is a little more interesting with the preliminary estimate of December HICP scheduled for release on Thursday.
Looking at EUR/USD from a technical standpoint, the pair is eyeing a test of last week’s highs in the 1.1340s, a break above which would bring in focus a test of December highs in the 1.1360s-80s area. Indeed, the pair does appear to have formed an ascending triangle in the latter stages of the month, which often is indicative that a bullish break is in the offing. Should the recent upwards trendline be broken to the downside, this would be a bearish sign that EUR/USD may be headed back under the 1.1300 level.
- USD/TRY gained positive traction for the second successive day on Tuesday.
- The momentum allowed the pair to reverse a part of last week's steep slide.
- Concerns about Turkey's monetary policy continued undermining the lira.
The Turkish lira weakened for the second successive day against the US dollar and pushed the USD/TRY pair back closer to the 12.00 mark during the early part of the European session.
The momentum allowed the USD/TRY pair to move away from the lowest level since mid-November touched last week in reaction to the government's move to cover FX losses on certain deposits. President Tayyip Erdogan announced a scheme last Monday, under which the Treasury and central bank will reimburse losses incurred on converted lira deposits. This, in turn, led to a steep decline of more than 50% for the pair, though spot prices managed to find decent support ahead of the key 10.00 psychological mark.
Investors remain concerned over Turkey's monetary policy amid fears of spiralling inflation, which continued acting as a headwind for the lira and assisted the USD/TRY to attract fresh buying. The Central Bank of the Republic of Turkey (CBRT) has not been given a free hand, instead is forced to adopt President's belief that high-interest rates cause inflation. In fact, the CBRT has slashed its policy rates by 500 basis points to 14% since September despite the fact that the official inflation rate topped 21% in November.
Meanwhile, the uptick on Tuesday was sparked by the overnight comments from Turkey's Finance Minister Nureddin Nebati, saying that state banks and institutions did not sell dollars on the night that Erdogan made his announcement. That said, a softer tone surrounding the US dollar held back traders from placing aggressive bets and kept a lid on any further gains for the USD/TRY pair, at least for the time being. Nevertheless, the lira, at current levels, is still down nearly 40% YTD against the USD and seems vulnerable to depreciate further.
- USD/CAD staged a modest recovery from a near two-month-old ascending channel support.
- Bullish crude oil prices might underpin the loonie and cap any meaningful gains for the pair.
- A convincing break below the 1.2770-65 area will set the stage for a further near-term slide.
The USD/CAD pair staged a goodish bounce from a one-and-half-week low touched earlier this Tuesday and climbed to the 1.2800 mark during the first half of the European session.
From a technical perspective, the recent corrective slide from the YTD low found a decent support near the lower boundary of an upward sloping channel extending from late October. The mentioned support is currently pegged near the 1.2770-65 region, which should now act as a pivotal point for short-term traders.
Meanwhile, technical indicators on the daily chart – though have been retreating from higher levels – are still holding in the positive territory. This, in turn, supports prospects for additional gains. That said, bullish crude oil prices might continue to underpin the commodity-linked loonie and cap the USD/CAD pair.
Hence, any subsequent positive move is more likely to confront stiff resistance near the 1.2845-50 supply zone. A sustained strength beyond will reinforce the constructive set-up and prompt some near-term short-covering rally. The USD/CAD pair could then aim back to reclaim the 1.2900 round-figure mark.
The momentum could get extended towards the recent daily closing high, near the 1.2935-40 area, en-route the YTD high, around the 1.2965 region. Some follow-through buying will be seen as a fresh trigger for bullish traders and has the potential to lift the USD/CAD pair towards the key 1.3000 psychological mark.
On the flip side, a convincing break below the trend-channel support, around the 1.2770-65 region, could prompt aggressive technical selling and accelerate the slide towards the 1.2710-1.2700 zone. The corrective fall could further get extended towards the 50/100-day SMAs confluence, currently around the 1.2625-15 region.
USD/CAD daily chart
Technical levels to watch
- GBP/JPY is back in the red after Monday’s sharp rally.
- Omicron cases in the UK keep rising but no restrictions are likely.
- 154.70 is the level to beat for bulls, Monday’s low at 153.30 offers support.
GBP/JPY is posting small losses, retracing from six-week highs of 154.47, although bulls manage to defend the 154.00 level so far this Tuesday.
The cross turned south after facing rejection once again at 154.50, shrugging off the improvement in the market sentiment.
The pound draws support from the UK government’s dismissal of any lockdown restrictions likely to be imposed during the year-end holiday season to curb the growing risks from the Omicron covid variant contagion. The UK recorded 98,515 COVID cases and 143 deaths in the past 24 hours.
Meanwhile, a minor pullback in the USD/JPY pair, courtesy of the falling Treasury yields, exerts downward pressure on the cross.
From a short-term technical perspective, GBP/JPY’s 14-day Relative Strength Index (RSI) holds well above the midline, suggesting that the upside potential remains intact in the near term.
Therefore, bulls need to take out the horizontal trendline resistance at 154.70 to resume the recovery rally from sub-150.00 levels.
Acceptance above the latter will call for a test of the November 4 highs of 156.25. Ahead of that the spot will challenge the 155.00 round number.
On the flip side, buyers could find respite at Monday’s low of 153.30 if the pullback gathers steam.
Further south, the downward-sloping 50-Daily Moving Average (DMA) at 153.06 will challenge the bulls’ commitments.
GBP/JPY daily chart
GBP/JPY additional levels to watch
- USD/JPY struggled to capitalize on its early uptick and retreated from the monthly top.
- The ascending trend channel supports prospects for the emergence of some dip-buying.
- A sustained break below the 113.80-75 support is needed to negate the positive outlook.
The USD/JPY pair gained some positive traction and climbed to a fresh monthly high during the early part of the trading on Tuesday. Bulls, however, struggled to capitalize on the move and faced rejection near the key 115.00 psychological mark.
From a technical perspective, slightly overbought RSI on the 4-hour chart seemed to be the only factor that capped the upside near an ascending channel resistance extending from the monthly swing low. This should now act as a key pivotal point for traders.
Meanwhile, technical indicators on the daily chart are holding comfortably and are still far from being in the overbought territory. This, in turn, supports prospects for the emergence of some dip-buying and an eventual break through the trend channel.
Hence, any subsequent slide might still be seen as a buying opportunity and remain limited near the 114.35-30 horizontal support. The next relevant support is pegged near the 114.00 round-figure mark ahead of the lower boundary of the mentioned channel.
The latter is currently pegged near the 113.80-75 region, which if broken decisively might shift the near-term bias in favour of bearish traders and prompt some technical selling. The USD/JPY pair might then accelerate the fall towards the 113.10-113.00 region.
On the flip side, bulls are likely to wait for a sustained strength beyond the 115.00 mark before positioning for any further gains. The subsequent move up has the potential to lift the USD/JPY pair back towards November monthly swing high, around mid-115.00s.
The momentum could further get extended and allow bullish traders to aim back to reclaim the 116.00 round-figure mark for the first time since January 2017.
USD/JPY 4-hour chart
Technical levels to watch
The S&P 500 Index hit record highs on Monday. Strategists at UBS continue to see upside for equities.
Energy and financials set to outperform
“While volatility is to be expected, we believe a still-accommodative policy backdrop, along with solid economic and corporate fundamentals, should support further upside for equities.”
“We favor the likely winners from global growth, including energy and financials, balanced with exposure to more defensive sectors like healthcare.”
See – S&P 500 Index set to race higher above the 5000 level – Credit Suisse
Despite high US debt levels, with the Federal Reserve accelerating its tapering of bond purchases economists at UBS expect dollar appreciation to continue in 2022, as investors focus on divergent central bank policies.
Save a few more dollars
“We expect the US dollar to strengthen further in the year ahead as the Fed withdraws monetary accommodation faster than some other major central banks.”
“We hold a positive view on oil as demand hits new highs, and a negative view on gold against a backdrop of rising rates and a belief that inflation will fall.”
“While mindful of risks around COVID-19 variants and inflation, we keep a positive outlook on stocks for the start of 2022. Global economic growth is likely to remain above trend for the first half of 2022, monetary policy is still accommodative, even if emergency support measures are being scaled back, and we expect 10% growth in global corporate earnings in the year ahead.”
The Bank of Japan is on track to book the smallest amount of local equity purchase this year, much lower than last year’s record haul seen during the pandemic peak, according to data compiled by Bloomberg.
Key details
‘The BOJ purchased a total of 873.4 billion yen ($7.6 billion) in exchange-traded funds through Dec. 27.”
“That’s a fraction of the 7.1 trillion yen it bought last year to support the market and would be the smallest annual purchase since 2012.”
“Investors will now likely focus their attention on what the BOJ will do with the 50 trillion yen of ETFs it has accumulated over the years.”
Market reaction
USD/JPY is trading at 114.75, retreating from five-week highs of 114.94 reached earlier in the Asian trades.
The spot is down 0.07% on the day.
- GBP/USD was seen oscillating in a range near a five-week high through the early European session.
- Receding Omicron fears underpinned the sterling, though a modest USD strength capped the upside.
The GBP/USD pair consolidated its recent gains to a five-week high and remained confined in a narrow trading band, around the 1.3435 region through the first half of the European session.
The pair struggled to capitalize on the previous day's positive move and witnessed subdued/range-bound price action on Tuesday amid thin liquidity on the back of a bank holiday in the UK. The US dollar drew some support from the Fed's hawkish outlook, which, in turn, was seen as a key factor that acted as a headwind for the GBP/USD pair.
That said, sliding US Treasury bond yields, along with receding fears over the economic impact of the new strain kept a lid on any meaningful gains for the safe-haven greenback. Adding to this, more positive news concerning the Omicron variant continued underpinning the British pound and extended some support to the GBP/USD pair.
In the latest development, the UK health secretary Sajid Javid announced that there will be no further restrictions introduced in England before New Year. This added to the optimism led by reports that the new strain may be less severe than the previous Delta variant and a UK study that Omicron infections are less likely to lead to hospitalization.
Nevertheless, the fundamental backdrop supports prospects for an extension of the recent recovery from the vicinity of mid-1.3100s, or the YTD low touched earlier this month. Bulls, however, are likely to wait for a sustained strength beyond the 50-day SMA before positioning for a further near-term appreciating move amid absent relevant UK macro releases.
Meanwhile, the US economic docket features the release of the Richmond Manufacturing Index later during the early North American session. The data, along with the US bond yields and the broader market risk sentiment, might influence the greenback. This, in turn, should assist traders to grab some short-term opportunities around the GBP/USD pair.
Technical levels to watch
- Gold price rebounds to hit fresh five-week highs at $1,816.
- Record covid cases globally boost gold’s safe-haven appeal.
- Gold 2022 Outlook: Correlation with US T-bond yields to drive yellow metal.
Gold price is trading close to the highest levels in five weeks clocked at $1,816. The bright metal witnessed an influx of safe-haven flows after coronavirus cases globally jump nearly 50% from a month ago, hitting a pandemic record. Despite the recent upward trajectory, gold price is on track to book its first annual loss in three years. Meanwhile, weakness in the long-dated Treasury yields and the US dollar underpin the yellow metal amid the holiday season mood.
Read: Gold trading – Understanding the supply and demand for gold
Gold Price: Key levels to watch
The Technical Confluences Detector shows that the gold price is breaking higher after finally scaling above the critical resistance at $1,814, which was the December month high.
The immediate upside, however, appears capped by $1,817, where the pivot point one-day R1 converges with the pivot point one-week R1.
Up next, the pivot point one-day R2 at $1,820 emerges as a roadblock towards the powerful hurdle at $1,828. That level is the intersection of the pivot point one-day R3 and pivot point one-week R2.
On the flip, the previous strong resistance-turned support around $1,811 will limit any pullback in gold price.
The Fibonacci 38.2% one-day, SMA10 four-hour and the previous week’s high coincide at that point.
If the downside pressure intensifies, then bears could aim for the confluence of the Fibonacci 38.2% one-month, Fibonacci 23.6% one-week and SMA5 one-day around $1,805
The line in the sand for gold buyers is seen at $1,801, the meeting point of the Fibonacci 38.2% one-week, SMA50 one-day and SMA100 one-hour.
Here is how it looks on the tool

About Technical Confluences Detector
The TCD (Technical Confluences Detector) is a tool to locate and point out those price levels where there is a congestion of indicators, moving averages, Fibonacci levels, Pivot Points, etc. If you are a short-term trader, you will find entry points for counter-trend strategies and hunt a few points at a time. If you are a medium-to-long-term trader, this tool will allow you to know in advance the price levels where a medium-to-long-term trend may stop and rest, where to unwind positions, or where to increase your position size.
- EUR/USD remained confined in a three-day-old trading range through the early European session.
- Neutral oscillators warrant some caution for aggressive traders amid the end-of-year thin liquidity.
- A sustained move beyond the 1.1350-60 hurdle is needed to support prospects for further gains.
The EUR/USD pair extended its sideways consolidative price move on Tuesday and remained confined in a narrow trading band, above the 1.1300 mark through the early European session.
Looking at the broader picture, the EUR/USD pair, so far, has struggled to capitalize on its recent bounce from sub-1.1200 levels, or the YTD low touched in November. The 1.1350-60 region has been acting as a key hurdle since the beginning of this month, which should now act as a pivotal point for short-term traders.
A convincing breakthrough will set the stage for additional gains and push the EUR/USD pair beyond the 1.1400 round-figure mark, towards testing the next relevant hurdle near the 1.1440-45 region. The momentum could further get extended and allow bullish traders to aim back to reclaim the key 1.1500 psychological mark.
Meanwhile, neutral technical indicators on the daily chart haven't been supportive of any firm near-term direction and warrant some caution for aggressive traders. This further makes it prudent to wait for some follow-through buying beyond the mentioned barrier before positioning for a further near-term appreciating move.
On the flip side, the 1.1300 mark, closely followed by the 1.1280-75 region could protect the immediate downside ahead of the 1.1240 support zone. Some follow-through selling would be seen as a fresh trigger for bearish traders and drag the EUR/USD pair to the 1.1200 mark en-route the YTD swing low, around the 1.1185 region.
EUR/USD 4-hour chart

Technical levels to watch
In order to support small companies, the People’s Bank of China (PBOC) Governor Yi Gang said Tuesday, it will increase the re-financing quota for their support when necessary.
Additional quotes
“Expect to issue the first batch of carbon emission reduction funds to financial institutions by end of this year.”
‘Financial risks controllable overall. “
“Average interest rate of corporate loans at below 5%, hitting record low”.
Related reads
- PBOC pumps cash amid year-end liquidity demand
- PBOC: Will implement management system for real estate financing
Palladium has already established a top earlier in 2021. Looking ahead, strategists at Credit Suisse expect XPD/USD to extend its leg lower.
XPD/USD downtrend reinforced
“Palladium already completed a top in September following its break below the $2,203 January low and has now recently also removed its key uptrend from 2016 and 200-week average to further reinforce the downtrend.”
“We stay negative with support seen next at the 2020 low at $1,495, then the 61.8% retracement of the 2016/2021 bull trend at $1,432. Whilst we would look for this latter level to hold at first, a break can see support next at $1,268.”
- NZD/USD gained some positive traction on Tuesday and snapped two days of the losing streak.
- The underlying bullish sentiment in the markets acted as a tailwind for the perceived riskier kiwi.
- Subdued USD demand contributed to the intraday buying, though thin liquidity warrants caution.
The NZD/USD pair maintained its bid tone through the early European session and was last seen hovering near the daily top, around the 0.6815 region.
A combination of supporting factors assisted the NZD/USD pair to attract some buying on Tuesday and snap two successive days of the losing streak. The underlying bullish sentiment – as depicted by a generally positive tone around the equity markets – was seen as a key factor that benefitted the perceived riskier kiwi. Apart from this, subdued US dollar price action provided a modest lift to the major.
Investors turned optimistic amid reports that the new COVID-19 strain may be less severe than the previous Delta variant. Adding to this, studies indicated that Omicron infections are less likely to lead to hospitalization and helped ease fears about the potential economic fallout from the continuous surge in new cases. This, along with sliding US Treasury bond yields, kept the USD bulls on the defensive.
That said, the Fed's hawkish outlook should act as a tailwind for the greenback and keep a lid on any further gains for the NZD/USD pair. It is worth recalling that the so-called dot plot indicated that the Fed officials expect to raise the fed funds rate at least three times next year. Moreover, the end-of-year thin liquidity in the markets could further hold back traders from placing aggressive directional bets.
Hence, it will be prudent to wait for a strong follow-through buying before positioning for any further appreciating move amid absent relevant market-moving macro data. The US economic docket features the release of the Richmond Manufacturing Index, though might do little to provide any impetus. This, in turn, leaves the NZD/USD pair at the mercy of the broader market risk sentiment and the USD price dynamics.
Technical levels to watch
The S&P 500 has hit new all-time highs amid optimism about Omicron. There are three major drivers for the upbeat mood, but they could easily reverse and cause a nasty New Year's hangover, according to FXStreet’s Analyst Yohay Elam.
Omicron optimism
“Pressure on health systems is what triggers lockdowns imposed by authorities or consumers' avoidance of going out and spending. As Omicron is not causing such a burden on wards, the full reversal of markets from the blows suffered since late November is fully explained. However, the story is more complicated. It is unnecessary for people to need medical assistance for Omicron to incur economic damage. As seen over the Christmas weekend, thousands of flights were canceled due to aircrew testing positive or needing to isolate due to exposure to a sick person. That could broaden to additional industries, exacerbating staff shortages.”
China's U-turn
“China eased credit conditions, is set to loosen its grip on the construction sector and also wants to frontload stimuli. That is music to markets' ears. However, timing is everything. Authorities want its people to be cheerful ahead of the Winter Olympics in February, taking place around the Chinese New Year. Xi and his colleagues could return to cracking down once these key events are over. Markets may become aware of the calendar even before February.”
Fed-fest
“One of the reasons for the more recent cheer was that Powell refrained from signaling a rate hike in March, but probably later on. However, if core inflation remains high, the Fed could act sooner. Officials at the world's most powerful central bank could begin laying the ground for an early rate increase as early as next week. The US releases fresh employment figures, which could show robust hiring around the holidays and an increase in wage pressures. Higher pay is linked to future inflation.”
See – S&P 500 Index set to race higher above the 5000 level – Credit Suisse
USD/JPY is sitting at the highest levels in five weeks just shy of the 115.00 level. Bulls await a move beyond the latter to trigger a further upmove, FXStreet’s Haresh Menghani reports.
Well-established short-term bullish trend
“The recent move up witnessed since the beginning of this month has been along an upward sloping channel. This points to a well-established short-term bullish trend. The positive outlook is reinforced by technical indicators on the daily chart that are holding comfortably in the positive territory. The set-up supports prospects for a further near-term appreciating move.”
“The key 115.00 psychological mark, if cleared, will mark a fresh bullish breakout. The subsequent move up has the potential to lift the pair back towards November monthly swing high, around mid-115.00s, or the highest level since January 2017. Bulls might eventually aim to reclaim the 116.00 mark.”
“Any meaningful pullback now seems to find decent support near the 114.30 region. This is closely followed by the 114.00 mark and the 113.80-75 region. A convincing break below the latter would shift the bias in favour of bearish traders and prompt some technical selling.”
Gold bulls are re-attempting the key $1,814 hurdle amid buying resurgence. Acceptance above the latter is critical for further upside, FXStreet’s Dhwani Mehta report.
$1,814 remains a tough nut to crack for XAU/USD bulls
“The Fed speculation-led dynamics in the yields and the greenback will influence gold price in the coming days amid a lack of top-tier US economic news and holiday-thinned trading.”
“Bulls need a decisive break above the December highs of $1,814 to resume the recent uptrend. The next critical bullish target is envisioned at the $1,820 round number.
“Gold buyers remain hopeful so long as the mildly bullish 50-DMA at $1,803 is defended. A break below that level will expose the 200-DMA at $1,797. The 100-DMA at $1,791 is likely to offer strong support on additional declines.”
See – Gold Price Forecast: XAU/USD at risk of plunging below $1,500 – Credit Suisse
- USD/CAD struggled to capitalize on its attempted recovery move from over a one-week low.
- Bullish oil prices underpinned the loonie and capped gains amid subdued USD price action.
- Break below the ascending channel support will set the stage for additional near-term losses.
The USD/CAD pair surrendered modest intraday gains and was last seen trading in the neutral territory, around the 1.2785 region heading into the European session.
Following the previous day's dramatic turnaround from the 1.2845-50 region, the USD/CAD pair gained some positive traction during the early part of the trading on Tuesday. However, the attempted recovery from a one-and-half-week low lacked bullish conviction and ran out of steam near the 1.2800 round-figure mark.
WTI crude oil prices held steady near the monthly high, just below the $76.00/barrel mark amid hopes that the Omicron coronavirus variant will have a limited impact on fuel demand. This, in turn, continued underpinning the commodity-linked loonie and capped gains for the USD/CAD pair amid subdued US dollar price action.
The optimism led by reports that the new strain may be less severe than the previous Delta variant remained supportive of the prevalent risk-on environment. Moreover, studies that Omicron infections are less likely to lead to hospitalization further boosted investors' confidence and weighed on the safe-haven greenback.
Apart from this, a softer tone around the US Treasury bond yields kept the USD bulls on the defensive and acted as a headwind for the USD/CAD pair. That said, the Fed's hawkish outlook, indicating at least three rate hikes next year, should help limit the downside for the USD and lend some support to the USD/CAD pair.
Adding to this, the year-end thin liquidity could also hold back traders from placing aggressive directional bets. Even from a technical perspective, the USD/CAD pair, so far, has managed to defend support marked by the lower boundary of a two-month-old ascending channel, which should now act as a key pivotal point.
A bank holiday in Canada and a relatively lighter US economic docket – featuring the release of the Richmond Manufacturing Index – also warrants some caution. That said, the broader risk sentiment will drive the USD demand and provide some impetus to the USD/CAD pair. Traders will further take cues from oil price dynamics to grab some short-term opportunities.
Technical levels to watch
One-month risk reversal (RR) on Palladium (XPD/USD), a measure of the spread between call and put prices, prints a four-day downtrend heading into Tuesday’s European session, according to data source Reuters.
A call option gives the holder the right but not obligation to buy the underlying asset at a predetermined price on or before a specific date. A put option represents a right to sell.
That said, the daily difference between them drops to -0.010 after three days of a downtrend. Additionally portraying the bearish bias could be the weekly print that eases towards a third red mark.
The latest XPD/USD price moves seem to take clues from the RR as the commodity drops over 2.0% to $1,930 while reversing from a five-week top.
FX option expiries for December 28 NY cut at 10:00 Eastern Time, via DTCC, can be found below.
- EUR/USD: EUR amounts
- 1.1180 295m
- USD/JPY: USD amounts
- 113.75 760m
- 114.15 284m
- Silver grinds higher around monthly top, pauses rebound from three-month top.
- Bullish MACD signals, sustained break of 20-day EMA keep buyers hopeful.
- 61.8% Fibonacci retracement offers immediate support, double bottom around $21.40 is the key.
Silver (XAG/USD) seesaws around $23.00 during the pre-European session inaction on Tuesday.
The bright metal refreshed monthly top the previous day before easing from $23.11. The pullback moves remain present at the latest as a confluence of the 50-day EMA and an ascending resistance line from December 13 challenges the buyers.
Even so, a clear upside break of the 20-day EMA and bullish MACD signals favor the XAG/USD buyers amid the holiday season.
Hence, silver prices are likely to keep the recovery moves from the double bottoms marked during September and so far December around $21.40. However, the stated key resistance convergence near $23.15, offers a breathing space to the metal buyers.
Following that, the 50% Fibonacci retracement (Fibo.) of September-November upside, close to $23.40, adds to the upside filters.
Alternatively, the 61.8% Fibo. level near $22.95, restricts the quote’s immediate downside ahead of the 20-day EMA level of $22.78.
During the bullion’s weakness past $22.78, the early month’s swing high near $22.60 may offer an intermediate halt before directing silver bear to $21.40 key support.
Silver: Daily chart
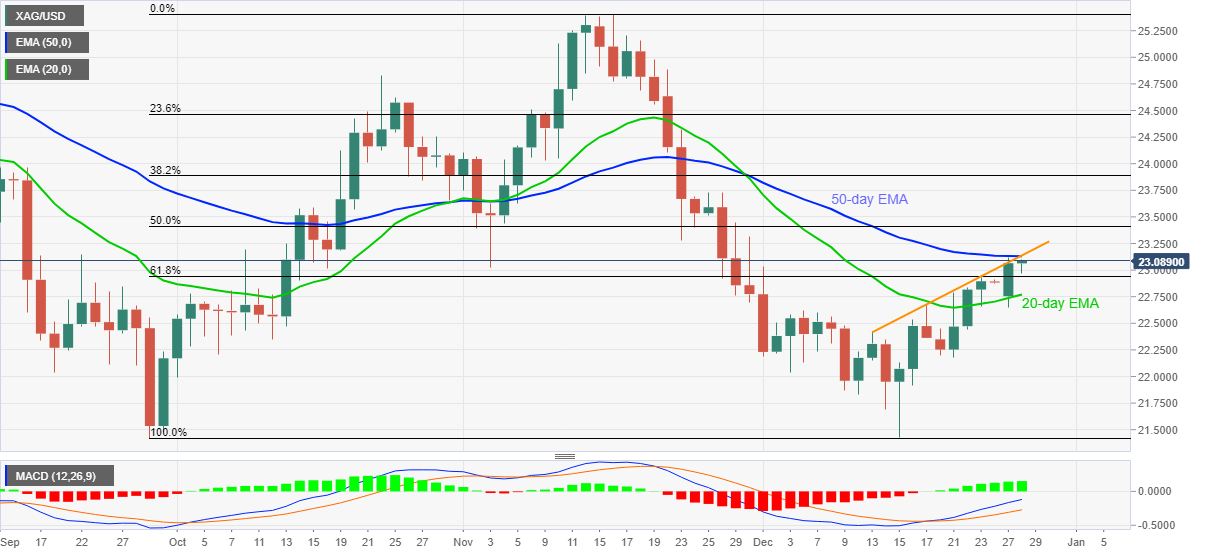
Trend: Further upside expected
Here is what you need to know on Tuesday, December 28:
After the record close on Wall Street indices overnight, a sense of caution has returned across the financial markets this Tuesday. Investors once again assess the risks of the Omicron covid variant on the economic growth, despite the robust holiday season sales in the US.
The Australian states of Victoria and Queensland posted record covid cases while the US The Centers for Disease Control and Prevention (CDC) cut the recommended isolation time for Americans with COVID-19 to five days from 10 days amidst the rapid spread of the new variant.
The latest regulatory tightening in China also tempered the investors’ sentiment, as the Asian equities traded mixed while the futures tied to the S&P 500 index retreated from record highs.
The US dollar index paused its sell-off, finding support from a spike in the shorter-maturity Treasury yields. The two-year yield jumped to 0.758%, the highest level since early March 2020, on rising bets of a March Fed rate hike, fuelled by the recovery optimism. Meanwhile, longer-dated rates on Treasuries held steady to lower.
EUR/USD is off the lows, keeping its range below 1.1350 following the last week’s rebound.
GBP/USD is consolidating near five-week highs below 1.3450 amid easing Omicron and Brexit fears. The UK government provided assurance of no fresh restrictions during the holiday season. Further, new post-Brexit fishing rules and the announcement of £75million funding for British ports and processing facilities underpin the pound.
USD/JPY is tracking the advance in the front-end yields, sitting at the highest levels in five weeks just shy of the 115.00.
Gold bulls are re-attempting the key $1,814 hurdle amid buying resurgence, acceptance above the latter is critical for further upside.
The barrel of West Texas Intermediate (WTI) is battling powerful 50-DMA resistance just below $76 after the previous week’s recovery gathered steam on Monday.
Bitcoin is snapping the recent bullish momentum, falling back below the $50,000 level.
- AUD/USD keeps the week-start optimism around monthly high, refreshes intraday top at the latest.
- US Treasury yields pare early Asian gains amid mixed concerns, Omicron-linked headlines.
- The Aussie government scrapped requirements for new interstate arrivals, NSW reports 6,062 COVID-19 infections and one virus-led death.
- Second-tier US data, risk catalysts are the key but year-end holiday mood to restrict market moves.
AUD/USD grinds higher near intraday top close to 0.7250 heading into Tuesday’s European session. In doing so, the Aussie pair stays firmer around the monthly high, rising for the second consecutive day.
The quote’s latest run-up could be linked to the U-turn in the US Treasury yields, which in turn weighed on the US dollar. The bond coupons started the day on a positive note amid hopes of strong US recovery before recently easing.
That said, the US 2-year Treasury yields jumped to the highest since March 2020 before recently easing to 0.75% while the 10-year counterpart stays pressured near 1.474% after the 1.7 basis points (bps) of a decline marked on Monday. The pullback in US bond coupons pushed the US dollar to reverse the early Asian bounce off the one-month-old support line.
Hopes of faster US recovery, backed by firmer retail sales during the holiday season and receding fears of Omicron, initially favored the Treasury bond yields and the US Dollar Index (DXY). However, an absence of fresh catalysts and a positive market mood dragged the greenback afterward.
Among the positive catalysts are the concerns over further stimulus from China and the US, as well as Australia’s repealing of interstate travel restrictions, favored the risk appetite. Easing tensions over Iran’s denuclearization talks and relating to the Russia-Ukraine tussles add to the risk-on mood.
On the contrary, hopes of the Fed’s rate hike in 2022 and a jump in the covid numbers in Australia’s most populous state New South Wales (NSW) challenge the AUD/USD bulls.
Considering the aforementioned catalysts, coupled with the recently mixed mood at the Reserve Bank of Australia (RBA), the analysts at Commonwealth Bank of Australia (CBA) offer an optimistic outlook for the AUD/USD prices while expecting the quote to reach 0.7800-0.8000 by Q4 2022.
Technical analysis
Tops marked during early December, surrounding 0.7225, restrict the immediate downside of the AUD/USD prices. However, bulls need validation from the 50-DMA level of 0.7272 for further dominance.
- EUR/GBP fades bounce off one-week low, retreats from intraday high of late.
- Downbeat RSI conditions, failures to cross weekly resistance line favor sellers.
- 200-SMA guards short-term upside, bears eye November’s low.
EUR/GBP pares intraday gains above 0.8400, declining to 0.8430 heading into Tuesday’s European session.
The cross-currency pair takes a U-turn from a one-week-old descending trend line, around 0.8440 by the press time, amid a sluggish RSI line.
It should be noted, however, be noted that a downward sloping support line from December 07, near 0.8410, will challenge the short-term EUR/GBP downside. Also likely to test the pair bears around 0.8410 is the RSI line’s nearness to the oversold territory.
Should the EUR/GBP bears keep reins past 0.8410, the 0.8400 threshold and November’s low near 0.8380 will be in focus.
Alternatively, recovery moves past 0.8440, comprising the nearby resistance line, will propel the quote towards the 61.8% Fibonacci retracement level of late November to early December upside, near 0.8465.
Even so, the 200-SMA level of 0.8481 will be a tough nut to crack for the EUR/GBP bulls before directing them to the 0.8500 round figure.
EUR/GBP: Four-hour chart
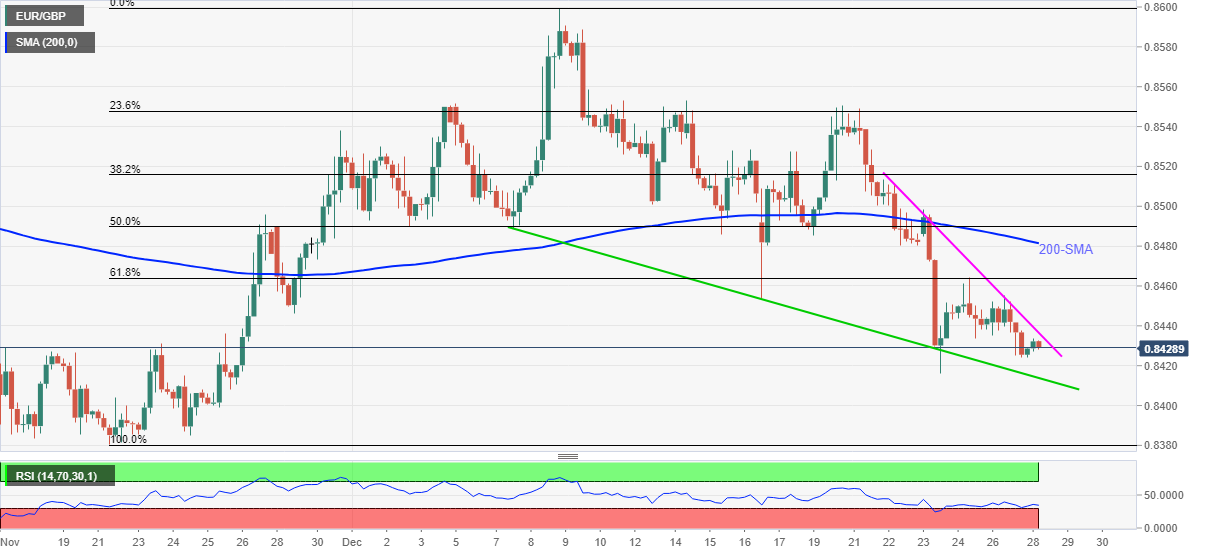
Trend: Further weakness expected
- Gold eases from one-week high to snap four-day uptrend.
- US Treasury yields stay firmer, German Bund coupons refreshed monthly top.
- Omicron cases remain high but fears recede on global studies, policymakers’ actions.
- Gold 2022 Outlook: Correlation with US T-bond yields to drive yellow metal
Gold (XAU/EUR) prints mild losses around €1,598, down 0.10% intraday heading into Tuesday’s European session. In doing so, the gold prices decline for the first time in five days while stepping back from a weekly high, flashed the previous day.
Although technical resistance could be more suitable to link the XAU/EUR pullback, firmer yields can be mentioned as the catalysts to weigh on the bullion.
That said, the US 2-year Treasury yields jumped to the highest since March 2020 before recently easing to 0.75% while the 10-year counterpart stays mostly inactive around 1.48% after the 1.7 basis points (bps) of a decline marked on Monday. On the other hand, the German Bund yields refreshed monthly peak with -0.22% figure the previous day, before closing around -0.238%.
Global traders seem to cheer the holiday mood while the latest positives concerning the South Africa-linked covid variant, namely Omicron, seems to add to the market optimism, challenging gold’s safe-haven demand. Also weighing on the gold are the escalating talks over the need for the monetary policy tightening at the European Central Bank (ECB) and the Federal Reserve (Fed), which in turn favor yields and weigh on gold.
The US Centers for Disease Control and Prevention’s (CDC) reduction in the isolation and quarantine period for the general population from the previous 10 to five and an 8.5% jump in US retail sales during the holiday season, per Mastercard, are the key catalysts. On the same line were hopes of US President Joe Biden’s Build Back Better (BBB) stimulus plan and receding fears of the Russia-Ukraine tension. Furthermore, headlines from the People’s Bank of China (PBOC) and the Chinese Finance Ministry, suggesting further easy money to help sustain the growth of the world’s second-largest economy, added to the risk-on mood.
Above all, the year-end holiday season and a light calendar restrict short-term market moves.
Technical analysis
Gold prices remain pressured between the monthly resistance line and an upward sloping trend line support from mid-December, respectively around €1,602 and €1,598.
It’s worth noting, however, that the bullish MACD signals and the quote’s refrain from breaking the short-term support line keep XAU/EUR buyers hopeful to cross the €1,602 nearby hurdle.
Following that, the late November’s peak near €1,610 and €1,633 resistance levels will be in focus ahead of last month’s top of €1,654.
Meanwhile, a downside break of €1,598 will quickly drag the quote to the 20-DMA level of €1,583.
Should gold prices remain weak past €1,583, a two-month-old horizontal area near €1,558 will lure the bears.
Gold: Daily chart
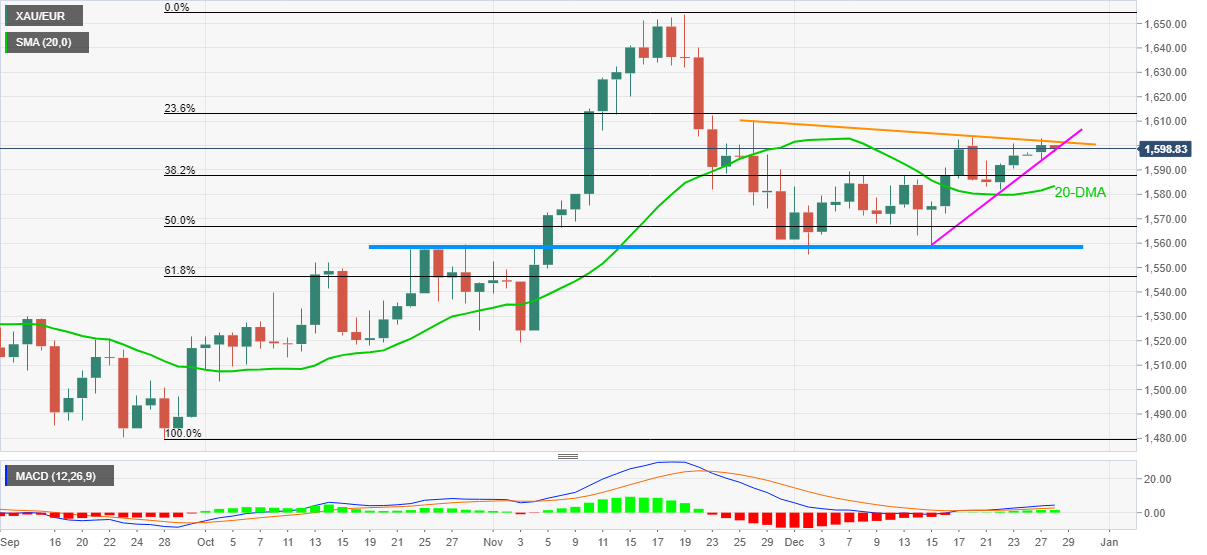
Trend: Sideways
- USD/INR licks its wounds after reaching monthly lows at 74.84.
- US dollar ‘s bound fails to deter INR bulls amid ongoing USD/INR downtrend.
- Daily technical setup points to more pain for USD/INR in the coming days.
USD/INR is trading below 75.00, consolidating Monday’s steep losses, despite a pause in the US dollar decline across the board.
The recovery in oil prices and easing Omicron fears fail to deter the INR bulls, as they remain on track to extend the correction from yearly highs of 76.59 reached on December 15.
Technically, USD/INR is poised for deeper losses after it closed Monday below the critical support of the 50-Daily Moving Average (DMA), now at 74.96.
The pair have opened Tuesday below the latter, keeping sellers hopeful for another downtick towards the 74.50 psychological level. The mildly bullish 100-DMA appears at that level.
Ahead of that barrier, bears may target the November 29 lows of 74.72.
The 14-day Relative Strength Index (RSI) is inching lower below the central line, backing the bearish momentum in the spot.
USD/INR: Daily chart
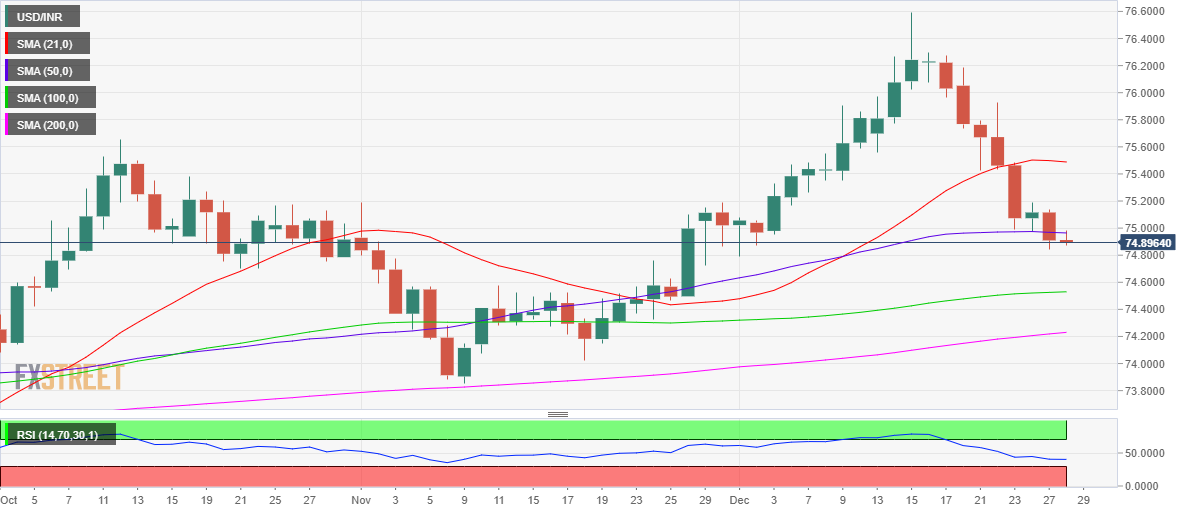
Meanwhile, any recovery attempt will be seen only on a sustained break above the 50-DMA support-turned-resistance.
The next upside hurdle for bulls is seen at Christmas Eve’s high of 75.18.
If that level is taken out, then a rally towards the horizontal 21-DMA at 75.49 cannot be ruled out.
USD/INR: Additional levels
- Asian equities trade mixed as off in Australia and light calendar elsewhere restrict market moves.
- Japanese data favors Nikkei 225, Evergrande jumps over 8.0% on hopes of recovery.
- Omicron fears ebb, stimulus hopes stay on the table but holiday mood restricts momentum.
Markets in the Asia-Pacific region fail to track Wall Street’s gains as an off in Australia favors the holiday mood during early Tuesday. In doing so, the investors fail to cheer upbeat headlines concerning Evergrande and from Japan as the US Treasury yields rebound.
That said, Japan’s Nikkei 225 rises 1.5% whereas the MSCI’s index of Asia ex-Japan shares rises 0.30% by the press time.
Hong Kong began the week’s trading with an uptick in Evergrande stocks on weekend news saying, the troubled China real-estate company resumed construction on nearly all of its projects with eyes on completing thousands of apartments before 2022 arrives. The stock jumped 10% initially before easing to $1.57, up 6.08% at the latest. The recent pullback in the quote could be linked to cautious sentiment ahead of two dollar-bond-coupon payments, due on Tuesday.
Elsewhere, the US 2-year Treasury yields jumped to the highest since March 2020 before stepping back to 0.75% amid hopes of faster economic recovery in the US, backed by upbeat retail sales during the holiday season and recent easing of the quarantine period for the general citizen from 10 days to five.
That said, New Zealand’s NZX remains directionless and so do stocks from China while South Korea and Indonesia print mild gains. Also on the positive side is India’s BSE Sensex, up 0.65% intraday by the press time.
It should be noted that Wall Street benchmarks posted notable gains the previous day but S&P 500 Futures print mild losses at the latest amid the market’s indecision.
Looking forward, the S&P/Case-Shiller Home Price Indices and House Price Index for October will precede the Richmond Fed Manufacturing Index for December to entertain intraday traders. However, major attention will be given to the Omicron headlines and risk catalysts mentioned above.
Read: US T-bond yields cling to 1.48%, S&P 500 Futures retreat from record high amid sluggish markets
- USD/CHF remains pressured around the lowest levels in three weeks.
- Failure to cross 61.8% Fibonacci retracement during previous bounce off the key support line joins firmer Momentum to favor sellers.
- 50-SMA, two-week-old descending trend line offers strong resistance near 0.9210.
USD/CHF remains on the back foot around 0.9175, after refreshing the multi-day low amid early Tuesday.
In doing so, the Swiss currency (CHF) pair retests an upward sloping trend line from early November, keeping the last week’s pullback from 61.8% Fibonacci retracement (Fibo.) of November’s upside.
Given the upbeat Momentum line and the quote’s failures to cross the key Fibo. level favor USD/CHF sellers to aim for the 78.2% Fibonacci retracement level of 0.9145. During the fall, the monthly low near 0.9165 and November 30 bottom of 0.9157 may offer intermediate halts.
If at all the USD/CHF bears refrain to step back from 0.9145, the previous monthly low of 0.9088 will be in focus.
Meanwhile, the 61.8% Fibonacci retracement around 0.9200 guards the quote’s short-term upside.
Following that, a convergence of the 50-SMA and descending trend line from mid-December challenges the USD/CHF bulls near 0.9210.
USD/CHF: Four-hour chart
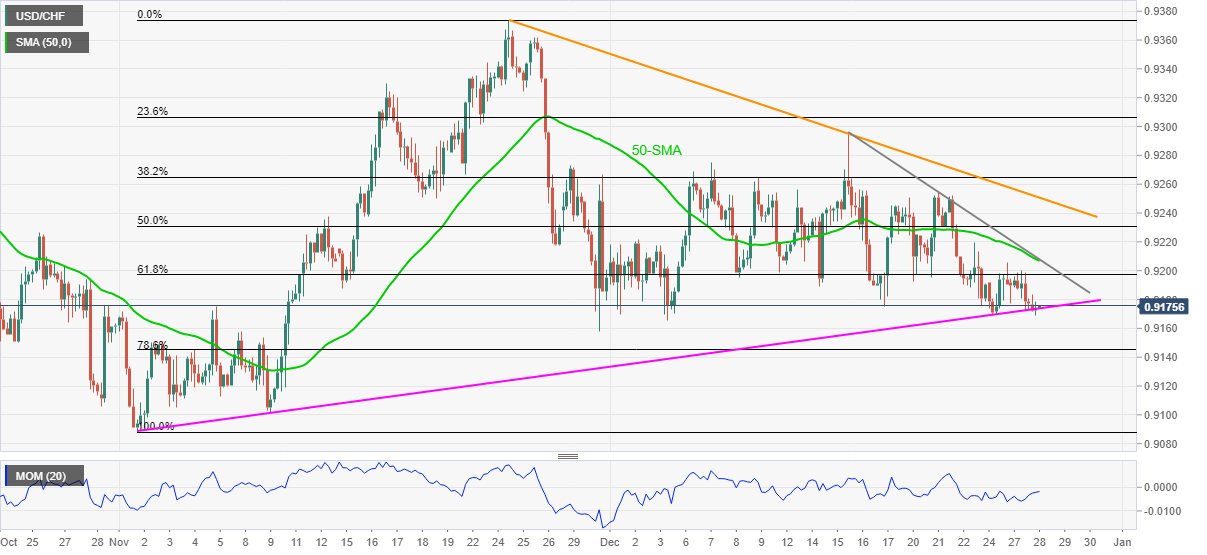
Trend: Further weakness expected
- EUR/USD stays pressured around intraday low, keeps short-term trading range intact.
- Jump in US 2-year Treasury yields to March 2020 levels underpin USD recovery amid sluggish session.
- Firmer US retail sales, US CDC announcement on quarantine details join Omicron news to favor greenback bulls.
- Lack of data/events signal further sideways grind during year-end holiday season, second-tier US data, risk catalysts eyed.
EUR/USD hovers around intraday low, consolidating the previous day’s gains above 1.1300 during early Tuesday morning in Europe. That said, the major currency pair seesaws around 1.1325 by the press time while keeping sideways grind established since last Wednesday.
Firmer prints of the US 2-year Treasury yields could be linked to the pair’s latest weakness as the US Dollar Index (DXY) tracked the short-term bond coupons to rebound. That said, the stated Treasury yields jumped to the highest since March 2020 before recently easing to 0.75%.
On the other hand, the 10-year counterpart stays mostly inactive around 1.48% after the 1.7 basis points (bps) of a decline marked the previous day. Moving on, the DXY bounces off the monthly support line to defend the 96.00 threshold.
It’s worth noting that an 8.5% jump in US retail sales during the holiday season, per Mastercard, joins comments from US Vice President Kamala Harris suggesting the use of her tie-breaking vote to pass President Joe Biden’s Build Back Better (BBB) stimulus plan favor USD bulls. On the same line could be the US Centers for Disease Control and Prevention’s (CDC) reduction in the isolation and quarantine period for the general population from the previous 10 to five.
Receding fears of the Russia-Ukraine tension and headlines from the People’s Bank of China (PBOC) and the Chinese Finance Ministry, suggesting further easy money to help sustain the growth of the world’s second-largest economy, also favored the risk appetite.
Above all, a rethink over the previous optimism surrounding the South African covid variant, namely Omicron, as well as an absence of major updates, seem to weigh on the EUR/USD prices during a sluggish session. However, the ECB v/s Fed battle can keep the bears hopeful.
Looking forward, the US S&P/Case-Shiller Home Price Indices and House Price Index for October will precede the Richmond Fed Manufacturing Index for December to entertain intraday traders. However, major attention will be given to the Omicron headlines and risk catalysts mentioned above.
Technical analysis
EUR/USD recently conquered a symmetrical triangle formation established since December 16. However, the quote’s successful trading above 200-SMA level of 1.1300 joins firmer RSI, not overbought, to keep the buyers hopeful.
- GBP/USD steps back from monthly high, pressured around intraday low of late.
- Bearish candlestick, chart pattern joins downbeat MACD signals to keep sellers hopeful.
- Bulls may aim for late November swing high on breaking wedge’s resistance.
GBP/USD justifies the bearish candlestick formation on the four-hour chart while taking offers around 1.3430, down 0.10% on a day heading into Tuesday’s London open.
The cable pair refreshed the five-week top the previous day before easing from 1.3448. In doing so, the quote portrayed Evening Doji star bearish candlestick formation while also forming the rising wedge pattern near the multi-day top.
Considering the bearish MACD signals favoring the downbeat hints from candlestick and chart pattern, GBP/USD is likely to witness further downside.
However, a clear break of 1.3415 will be clear for the quote’s theoretical south-run targeting the yearly low near 1.3170. During the fall, the 200-SMA level around 1.3325 can act as a buffer.
Alternatively, corrective pullback not only needs to refresh the intraday high past 1.3445 but should also cross the upper line of the stated wedge, near .3470, to reject the bearish calls.
In that case, GBP/USD bulls will aim for the highs marked during November 18 and 09, respectively around 1.3515 and 1.3610.
GBP/USD: Four-hour chart
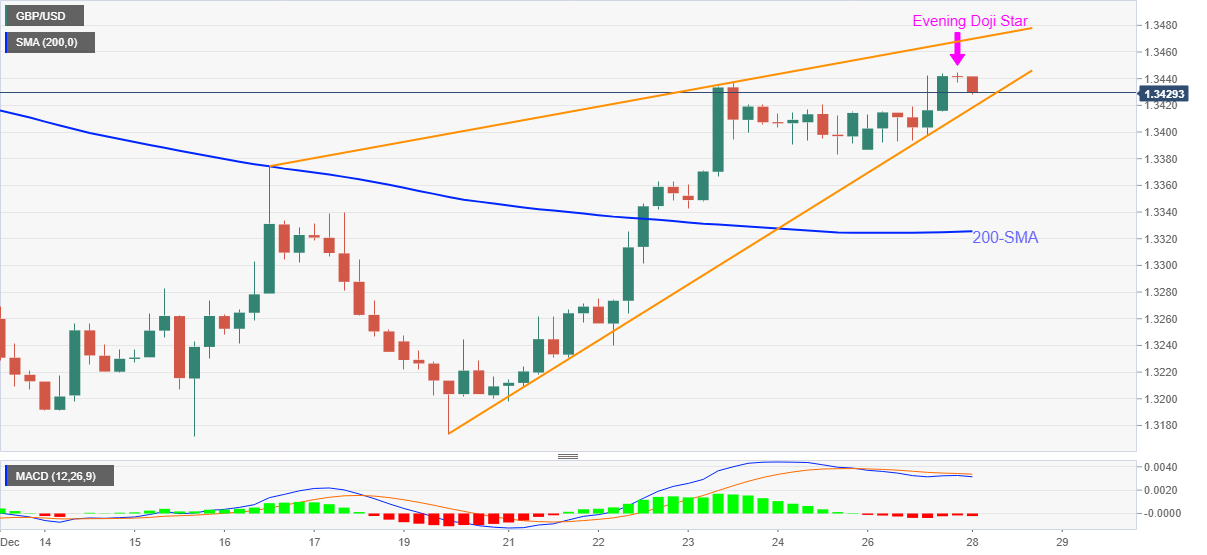
Trend: Further weakness expected
Analysts at Commonwealth Bank of Australia (CBA) offer an optimistic outlook for AUD/USD, expecting the major to rise all through 2022.
Key quotes
“The Aussie dollar is expected to rise over 2022 to reach US78-80 cents by the December quarter on the expectation that the Reserve Bank starts to ‘normalize’ interest rates.”
“A key uncertainty could be the outcome of the Federal election due in May. While the opposition Labor Party is currently well ahead in most opinion polls, a tight result or even a ‘hung’ parliament could potentially impact investor sentiment. But a center-left government, as evidenced in the US, could see a big boost to government spending.”
- AUD/USD Price Analysis: Indecisive below 50-DMA within a rising channel
- AUD/USD remains flatlined below 50-DMA despite an upbeat mood.
- Markets switch to wait-and-see mode amid thin trading conditions.
- The path of least resistance appears down for the aussie traders.
AUD/USD is fluctuating between gains and losses, as traders are unable to decide on a clear direction amid a pullback in the S&P 500 futures from record highs.
On the other side, easing Omicron covid variant fears keep the buoyant tone intact around the aussie.
With holiday-thinned market conditions, however, traders are likely to remain cautious before placing any directional bets on the major.
Looking at AUD/USD’s daily chart, the pair is on a gradual uptrend after bottoming out earlier this month at 0.6993.
In doing so, the aussie has formed a rising channel pattern, with Monday’s rally curtailed by 0.7285, where the channel resistance converged with the 50 and 100-Daily Moving Averages (DMA).
At the time of writing, AUD/USD is trading flat at 0.7235, with the immediate upside seen capped by the mildly bearish 50-DMA, now at 0.7272.
Further up, the confluence of the channel hurdle and 100-DMA at 0.7292 will come into play once again.
The 14-Day Relative Strength Index (RSI) has turned flat while holding above the midline, suggesting that the bullish bias remains well in the books. Although it may not be a smooth ride for AUD bulls.
AUD/USD: Daily chart
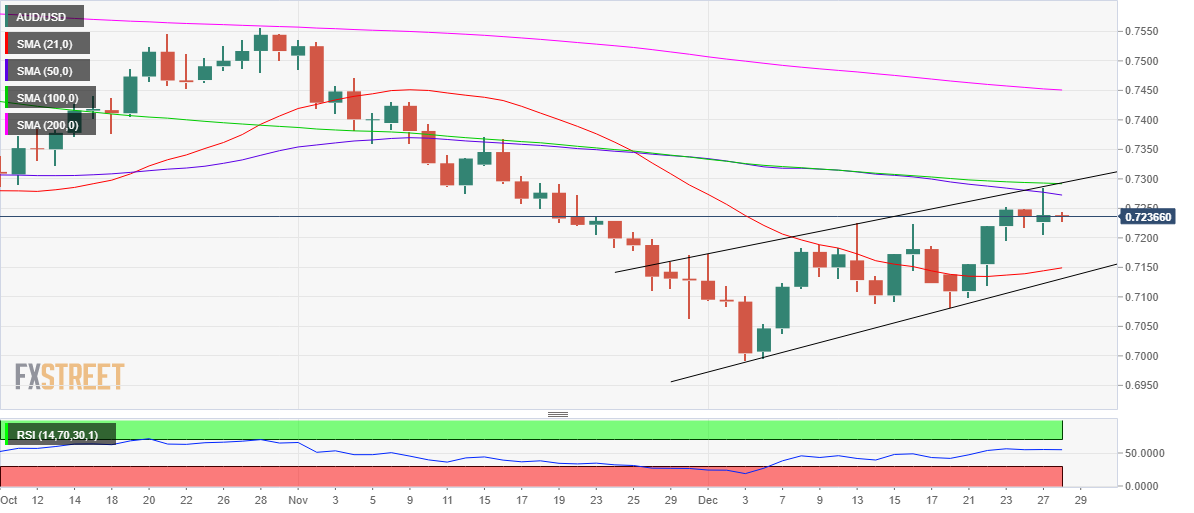
On the flip side, Thursday’s low of 0.7195 is the level to beat for AUD bears, below which the additional downside will open up towards the 21-DMA at 0.7149.
Selling resurgence could put the channel support of 0.7130 at risk. A sustained break below the latter will confirm a downside breakout from the rising channel, fuelling a fresh downswing towards 0.7100.
AUD/USD: Additional levels to consider
- NZD/USD remains pressured near intraday low during three-day downtrend.
- Bullish moving average crossover, firmer RSI keep buyers hopeful.
- Sellers remain cautious until witnessing 0.6775 break, bulls can aim for 200-SMA.
NZD/USD sellers dominate for the third consecutive day, down 0.15% intraday surrounding the daily lows close to the 0.6800 threshold during early Tuesday.
In doing so, the kiwi pair fails to track the bullish signals by the 50-SMA cross over the 100-SMA amid a firmer RSI line. The reason for the quote’s pullback could be linked to the failures to cross the 200-SMA.
Even so, the latest weakness remains elusive until staying beyond the SMA convergence near 0.6780-75.
Following that, the 0.6725 and the yearly low near 0.6700 may probe the NZD/USD bears before directing them to the November 2020 low near 0.6590.
Meanwhile, a clear upside break of the 200-SMA level of 0.6850 will need validation from September’s low near 0.6860 before convincing the NZD/USD bulls.
On a broader front, NZD/USD consolidates November’s losses amid a quiet session.
NZD/USD: Four-hour chart
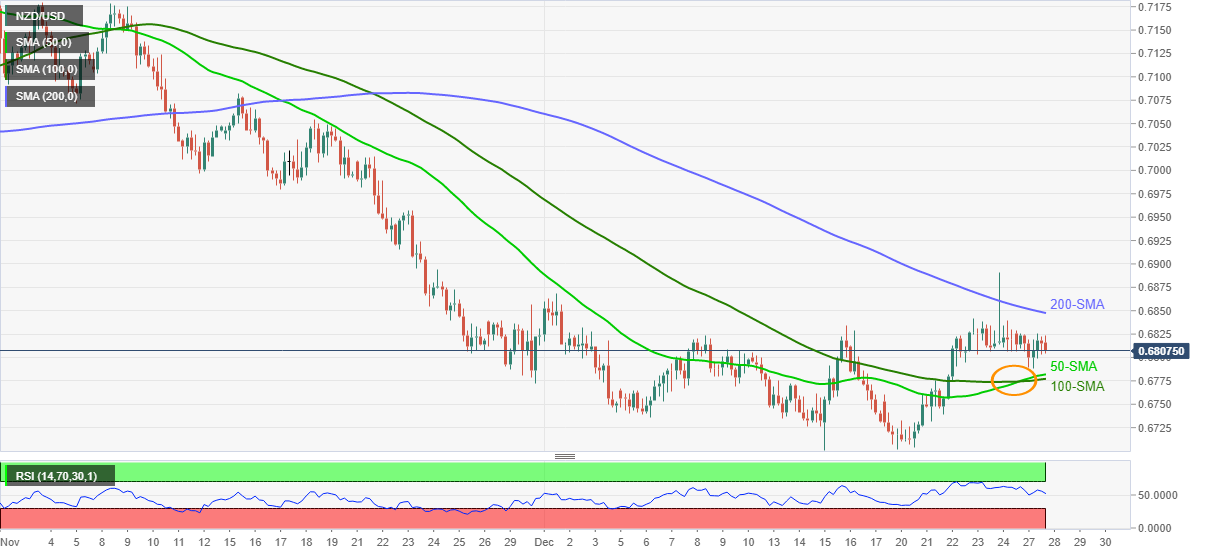
Trend: Limited downside expected
Commenting on the inflation outlook, the Japanese Finance Minister Shunichi Suzuki said that they are “not thinking recent inflation negatively affects the economy.”
“Important to promote wage raises by creating an environment where companies can transfer costs to prices,’ Suzuki added.
Market reaction
USD/JPY is unfazed around 114.90 on these comments, trading 0.06% higher on the day. Strong Japanese Industrial Production did little to help JPY bulls.
| Raw materials | Closed | Change, % |
|---|---|---|
| Brent | 78.52 | 3.6 |
| Silver | 23.058 | 1.17 |
| Gold | 1811.792 | 0.32 |
| Palladium | 1962.04 | 0.9 |
The People’s Bank of China’s (PBOC) liquidity injection jumped the most in two months, in the face of the year-end demand for cash from the banking system, per Bloomberg.
Key takeaways
“The PBOC added 200 billion yuan ($31 billion) of cash into the financial system through seven-day reverse repurchase agreements, more than offsetting the 10 billion yuan coming due.”
“The move came after an indicator for short-term borrowing costs soared the most in a year on Monday, a sign of liquidity shortages in the interbank market.”
Market reaction
USD/CNY is trading modestly flat around 6.3720, as of writing.
- US Treasury yields refrain from extending the previous day’s pullback from fortnight high.
- S&P 500 Futures seek fresh clues around all-time highs.
- News concerning US retail sales, stimulus and Omicron favored bulls earlier.
- Lack of major catalyst tests the market optimism amid holiday mood, US data eyed.
Market sentiment dwindles during early Tuesday, following an upbeat start to the week. The reason could be linked to traders’ rethink over the previously positive risk catalysts amid an absence of major data/events and holiday mood.
That said, the US 10-year Treasury yields seesaw around 1.48% after the 1.7 basis points (bps) of a decline the previous day whereas the S&P 500 Futures print mild losses around 4,775 after the Wall Street benchmark refreshed the record on Monday. It should be noted that the US 2-year Treasury yields printed the higest of 0.758% for the day, the highest since March 2020.
Strong holiday season US retail sales and studies showing fewer odds of hospitalization due to the Omicron covid variant offered a positive week-start to the traders after the Christmas holidays. On the same line were comments from US Vice President Kamala Harris who signaled to use her tie-breaking vote to pass President Joe Biden’s Build Back Better (BBB) stimulus plan. Furthermore, headlines from the People’s Bank of China (PBOC) and the Chinese Finance Ministry, suggesting further easy money to help sustain the growth of the world’s second-largest economy, also favored the risk appetite.
It’s worth noting that the US Centers for Disease Control and Prevention (CDC) followed the UK while reducing the isolation and quarantine period for the general population from the previous 10 to five.
On a different page, ongoing talks over Iran’s denuclearization and a global push for peace between Russia and Ukraine also seem to have offered relief to the markets.
Above all, markets remain dicey amid an absence of major data/events considering the year-end inaction and positioning. It should, however, be kept in mind that the Fed’s rate hike concerns may keep the US Treasury yields firmer, which in turn could help the US Dollar Index (DXY), up 0.05% intraday around 96.12 at the latest.
That said, the US S&P/Case-Shiller Home Price Indices and House Price Index for October will precede the Richmond Fed Manufacturing Index for December to entertain intraday traders. However, major attention will be given to the Omicron headlines and risk catalysts mentioned above.
- USD/TRY is building onto Monday’s 6% rebound as lira bulls give up again.
- Turkish Finance Minister said there were no interventions on Dec 20.
- USD/TRY eyes a daily closing above 50-DMA hurdle amid bearish RSI.
USD/TRY is posting small gains, looking to extend Monday’s rebound amid a renewed uptick in the US dollar across the board.
Despite the risk-on market mood due to ebbing Omicron worries, the greenback is attempting a tepid bounce, although the upside follow-through is likely to lack momentum amid subdued Treasury yields.
The main catalyst behind USD/TRY’s recent price action is the speculations surrounding the Turkish government’s intervention in the forex market to stem the lira’s downward spiral.
However, the spot rebounded 6% on Monday, as the lira lost ground once again after Turkey’s Treasury and Finance Minister Nureddin Nebati said that “there were no interventions that night, neither from public banks or anyone else.”
“Individuals raced that night to sell their dollars, thanks to the confidence created by our President Recep Tayyip Erdoğan,” he added.
Amidst the fx plays by the Turkish authorities, the Omicron covid variant-driven broader market sentiment will continue to have a significant bearing on the currency pair.
Looking at USD/TRY’s technical chart, the spot has once again found solid support at the critical 100-Daily Moving Average (DMA) support at 10.15.
Going forward, recapturing 50-DMA at 11.65 on a daily closing basis is critical for initiating any meaningful recovery towards the bearish 21-DMA of 13.43.
Alternatively, a sustained break below the 100-DMA will threaten the 200-DMA support at 9.29.
The 14-day Relative Strength Index (RSI) stays bearish below the midline, suggesting that the recovery momentum could likely remain short-lived.
USD/TRY: Daily chart
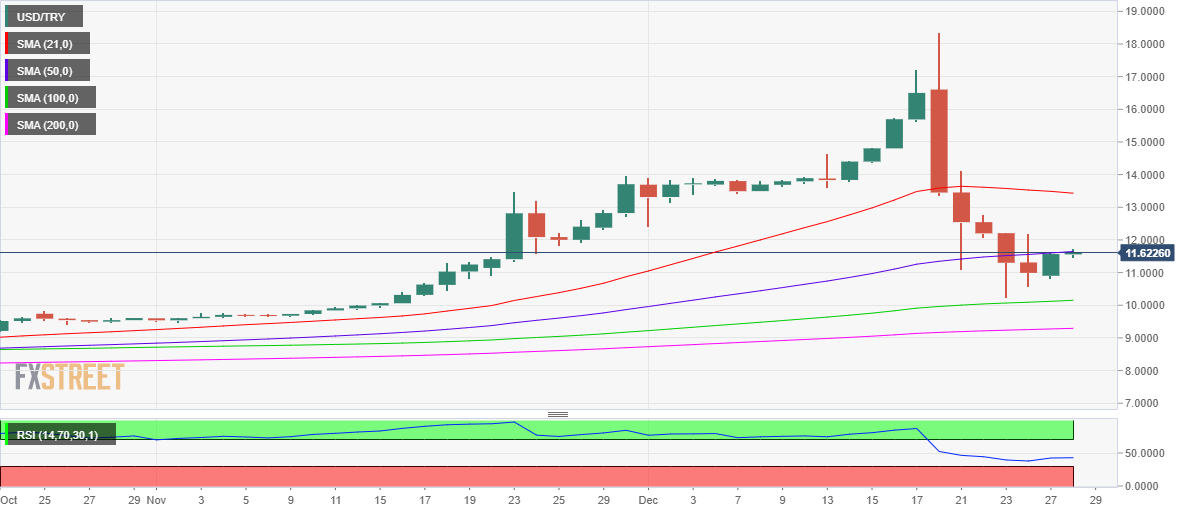
- DXY picks up bids to refresh intraday high.
- Omicron news, US retail sales updates and stimulus hopes favor sentiment.
- US Treasury yields challenge pullback from two-week top amid lack of major data/events.
- Second-tier data from the US, risk catalysts may entertain traders but no major surprise expected amid holiday mood.
US Dollar Index (DXY) refreshes intraday high to 96.12, up 0.05% on a day, during an inactive Asian session on Tuesday.
The greenback gauge tracks the US Treasury yields to consolidate the recent losses amid a lack of major catalysts. Even so, Omicron-linked optimism joins hopes of further stimulus to weigh on the quote.
That said, the US 10-year Treasury yields seesaw around 1.48% after the 1.7 basis points (bps) of a decline the previous day. It’s worth noting that the S&P 500 Futures also print mild losses around 4,775 after the Wall Street benchmark refreshed the record on Monday. The same adds to the DXY’s corrective pullback.
Talking about macros, markets remain hopeful of fewer hospitalizations due to the South African covid variant, namely Omicron, even as the global infections numbers rise faster. Also on the positive side were the strong US retail sales during the holiday season, via online, as well as a reduction in the isolation and quarantine period for the general population from the previous 10 to five by the US Centers for Disease Control and Prevention (CDC).
Elsewhere, the headlines from the People’s Bank of China (PBOC) and the Chinese Finance Ministry, suggesting further easy money to help sustain the growth of the world’s second-largest economy, also favored the risk appetite.
Furthermore, ongoing talks over Iran’s denuclearization and a global push for peace between Russia and Ukraine also seem to have offered relief to the markets.
It should be noted that the year-end holiday mood dominates in the markets and reduce the volatility. Even so, US housing and Richmond Fed Manufacturing data could entertain the traders while headlines concerning Omicron and other risk catalysts can offer extra directives.
Technical analysis
Although DXY bounces off the monthly support line, around 96.00 at the latest, the recovery moves remain capped by a descending trend line resistance from December 15, surrounding 96.35.
- WTI consolidates the biggest daily gains in three week to ease from one-month high.
- Bullish MACD signals, sustained trading beyond 100-DMA favor buyers.
- Two-month-old resistance line challenge further upside, bears need validation from $72.80.
WTI crude oil, also known as US oil, seesaws around monthly high, down 0.15% intraday near $75.55 during Tuesday’s Asian.
In doing so, the black gold eases from the 50-DMA after rising the most since December 06 the previous day.
Even so, firmer MACD signals and a clear upside break of the 100-DMA keep WTI bulls hopeful to overcome the $76.00 immediate hurdle.
Following that, a descending trend line from October 25, around $77.80, will be in focus as it holds the gate for the commodity’s further rally targeting the yearly top marked in November around $85.00.
Meanwhile, pullback moves may aim for the 100-DMA level of $74.00 and horizontal support from mid-September near $72.80.
In a case where oil bears break the $72.80 support, the odds of witnessing further downside towards the $70.00 threshold can’t be ruled out.
WTI: Daily chart
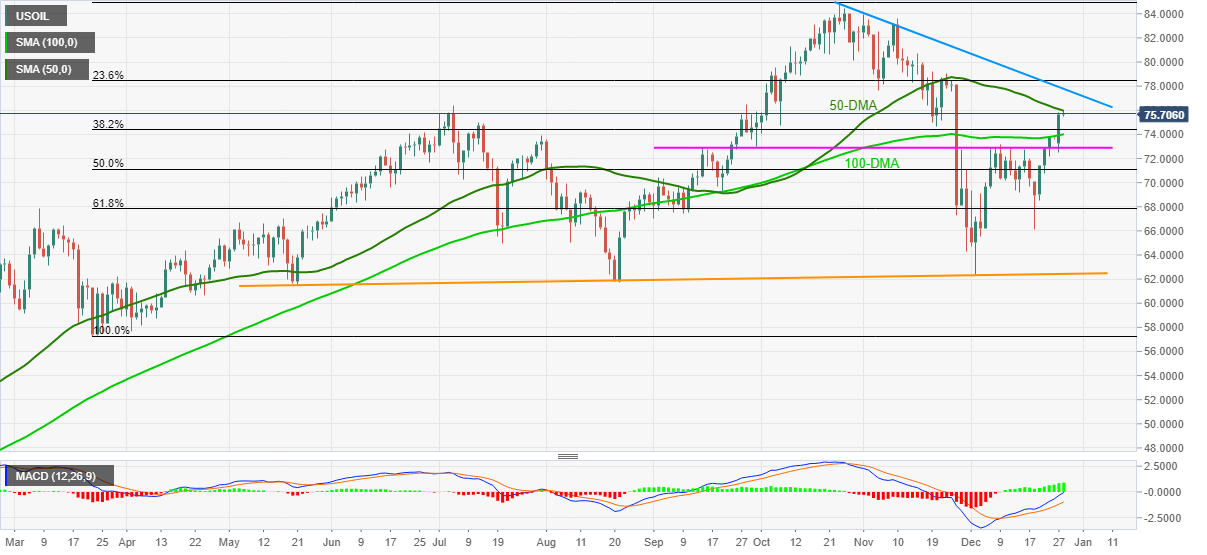
Trend: Further upside expected
| Time | Country | Event | Period | Previous value | Forecast |
|---|---|---|---|---|---|
| 14:00 (GMT) | U.S. | Housing Price Index, m/m | October | 0.9% | |
| 14:00 (GMT) | U.S. | Housing Price Index, y/y | October | 17.7% | |
| 14:00 (GMT) | U.S. | S&P/Case-Shiller Home Price Indices, y/y | October | 19.1% | 18.5% |
| 15:00 (GMT) | U.S. | Richmond Fed Manufacturing Index | December | 11 |
The People’s Bank of China (PBOC) set the USD/CNY reference rate at 6.3728 on Tuesday when compared to the previous fix and the previous close at 6.3686 and 6.3713 respectively.
"With 10 billion yuan worth of reverse repos maturing on Tuesday, china central bank injects 190 billion yuan on a net basis on the day," said Reuters concerning the PBOC announcements.
- USD/CAD grinds lower, close to one-week bottom amid inactive markets.
- Oil consolidates the biggest daily gains in three weeks as markets await fresh clues.
- US T-bond yields pause the previous day’s declines, stock futures ease.
- US housing, activity data will join API oil inventories and risk catalysts to direct short-term moves.
USD/CAD struggles to regain the 1.2800 threshold while licking the previous day’s wounds during Tuesday’s Asian session. The loonie pair seems to track the halt in risk-on mood as well as a pullback in prices of Canada’s main export item WTI crude oil to challenge the one-week-old downside from the yearly top.
A rethink over the previous optimism surrounding the South African covid variant, namely Omicron, as well as an absence of major updates, could be held responsible for the recent pause in the US dollar weakness. Even so, the holiday mood in the market joins a light news feed to challenge the pair’s momentum.
While portraying the mood, the S&P 500 Futures print 0.05% intraday loss even as the Wall Street benchmark refreshed all-time high. That said, the US 10-year Treasury yields seesaw around 1.48% after the 1.7 basis points (bps) of a decline the previous day.
Studies from South Africa and the UK, showing fewer odds of hospitalization due to the Omicron covid variant, eased market fears from the South African covid variant. Also on the positive side were comments from US Vice President Kamala Harris who signaled to use her tie-breaking vote to pass President Joe Biden’s Build Back Better (BBB) stimulus plan. Further, ongoing talks over Iran’s denuclearization and a global push for peace between Russia and Ukraine also seem to have favored the USD/CAD bears.
It’s worth noting that the jump in the virus cases and fears of a pullback in oil prices could challenge the USD/CAD sellers amid an absence of major catalysts. Even so, US housing and Richmond Fed Manufacturing data will precede the weekly prints of industry inventory figures from the American Petroleum Institute to direct short-term USD/CAD moves.
Technical analysis
A clear downside break of 21-DMA, around 1.2800 at the latest, directs USD/CAD bears towards an ascending support line from early November, surrounding 1.2755.
- EUR/USD stays sidelined around the upper line of eight-day-old symmetrical triangle.
- Firmer RSI, sustained trading beyond 200-SMA favor bullish bias.
- Monthly resistance line adds to the upside filters.
EUR/USD grinds higher past 1.1300, around 1.1330 during Tuesday’s Asian session.
In doing so, the major currency pair seesaws inside a symmetrical triangle formation established on December 16. However, the quote’s successful trading above 200-SMA and firmer RSI, not overbought, keep the buyers hopeful.
It should also be noted that an upside clearance of the stated triangle’s resistance line, near 1.1340 at the latest, will need validation from a descending trend line from November 30, surrounding 1.1350, to offer a smooth ride to the EUR/USD bulls.
During the same, the monthly peak of 1.1360 and late November’s top surrounding 1.1385 will act as buffers.
Alternatively, EUR/USD bears won’t be lured on a downside break of the triangle’s support, close to 1.1330, as the 200-SMA level of 1.1300 offers a tough nut to crack for seller’s entry.
Following that, 1.1260 and the monthly low around 1.1220 will be in focus.
EUR/USD: Four-hour chart
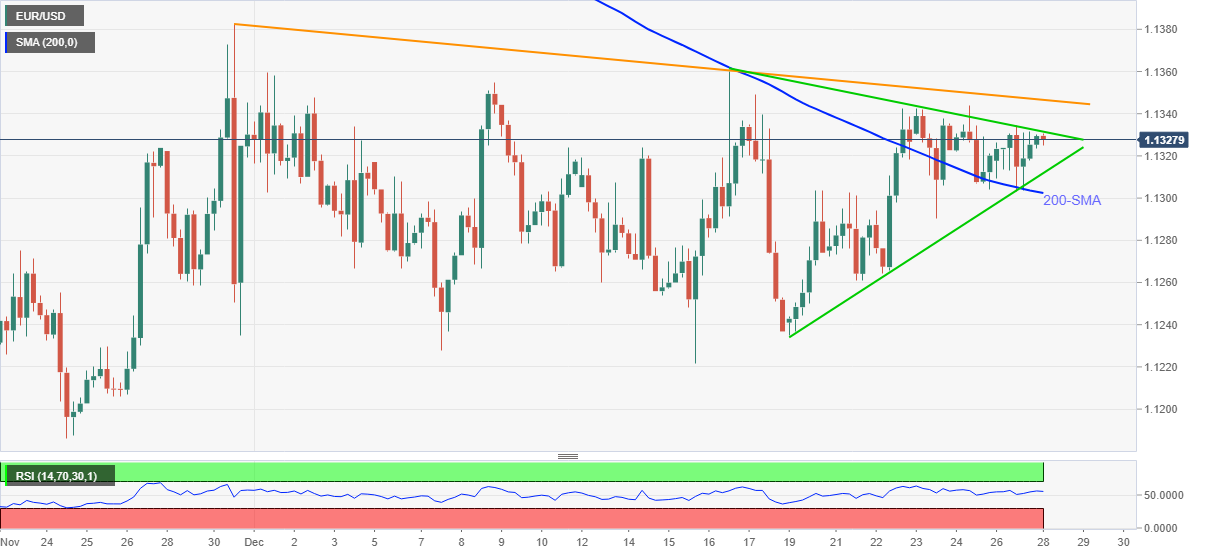
Trend: Further upside expected
- USD/JPY refreshes intraday low, consolidates biggest daily gains in three weeks.
- Japan’s Industrial Production rallied the most in 16 months during November.
- Japan government says industrial output shows signs of picking up.
- Market sentiment remains firmer amid easing Omicron fears, hopes of stimulus and holiday mood.
USD/JPY takes offers to renew intraday low around 114.75, down 0.10% on a day as Tokyo opens for Tuesday.
The yen pair buyers cheered risk-on mood the previous day to print the highest levels since late November. However, the recently mixed data and inaction in markets joined a rethink over the Omicron headlines to trigger the consolidation of the heaviest daily gains in three weeks.
Japan’s Unemployment Rate grew past 2.7% forecast and prior to 2.8% whereas Jobs/Applicants Ration reprint 1.15 figures versus 1.16 expected. Further, the preliminary readings of Industrial Production for November jumped the most since August 2020, up 7.2% MoM versus 4.8% market consensus and 1.8% anticipated numbers. The MoM readings for Industrial Production also provided an upside surprise with +5.4% figures compared to -5.0% expected and -4.1% previous readouts.
Following the strong Industrial Production data, Japan’s Government Official said, per Reuters, “Industrial output shows signs of picking up.” The diplomat also added, “While the chip shortage's impact on the supply chain is shrinking, it's still there.”
In addition to the upbeat Japanese data and comments from Tokyo, a rethink over the previous optimism surrounding the South African covid variant, namely Omicron, as well as an absence of major updates, might have also probed the USD/JPY bulls of late.
That said, studies from South Africa and the UK showing fewer odds of hospitalization due to the Omicron covid variant joined hopes of more stimulus from the US and China to favor the risk appetite on Monday. On the same line was the action by the US Centers for Disease Control and Prevention (CDC) that reduced the isolation and quarantine period for the general population from the previous 10 to five. Additionally, ongoing talks over Iran’s denuclearization and a global push for peace between Russia and Ukraine also seem to have offered relief to the markets.
Amid these plays, the US 10-year Treasury yields pause the previous day’s declines around 1.48% whereas S&P 500 Futures fail to copy Wall Street gains, down 0.14% intraday by the press time. At home, Japan’s Nikkei is up over 1.0% at the latest whereas the rest of the Asia-Pacific markets trade mixed.
Looking forward, an absence of major catalysts keep Omicron headlines on the driver’s seat before the US housing and Richmond Fed Manufacturing data could entertain the traders.
Technical analysis
A two-week-old ascending triangle formation restricts short-term USD/JPY moves between 115.00 and 114.50. Given the RSI’s nearness to the overbought conditions, a downside break of the triangle will gain a strong market reaction, likely directing the quote towards the monthly low near 112.56, versus the otherwise case.
| Pare | Closed | Change, % |
|---|---|---|
| AUDUSD | 0.72403 | 0.2 |
| EURJPY | 130.124 | 0.61 |
| EURUSD | 1.13266 | 0.12 |
| GBPJPY | 154.433 | 0.9 |
| GBPUSD | 1.34432 | 0.4 |
| NZDUSD | 0.68169 | -0.04 |
| USDCAD | 1.27852 | -0.15 |
| USDCHF | 0.91756 | -0.01 |
| USDJPY | 114.884 | 0.47 |


© 2000-2026. Sva prava zaštićena.
Sajt je vlasništvo kompanije Teletrade D.J. LLC 2351 LLC 2022 (Euro House, Richmond Hill Road, Kingstown, VC0100, St. Vincent and the Grenadines).
Svi podaci koji se nalaze na sajtu ne predstavljaju osnovu za donošenje investicionih odluka, već su informativnog karaktera.
The company does not serve or provide services to customers who are residents of the US, Canada, Iran, The Democratic People's Republic of Korea, Yemen and FATF blacklisted countries.
Izvršenje trgovinskih operacija sa finansijskim instrumentima upotrebom marginalne trgovine pruža velike mogućnosti i omogućava investitorima ostvarivanje visokih prihoda. Međutim, takav vid trgovine povezan je sa potencijalno visokim nivoom rizika od gubitka sredstava. Проведение торговых операций на финанcовых рынках c маржинальными финанcовыми инcтрументами открывает широкие возможноcти, и позволяет инвеcторам, готовым пойти на риcк, получать выcокую прибыль, но при этом неcет в cебе потенциально выcокий уровень риcка получения убытков. Iz tog razloga je pre započinjanja trgovine potrebno odlučiti o izboru odgovarajuće investicione strategije, uzimajući u obzir raspoložive resurse.
Upotreba informacija: U slučaju potpunog ili delimičnog preuzimanja i daljeg korišćenja materijala koji se nalazi na sajtu, potrebno je navesti link odgovarajuće stranice na sajtu kompanije TeleTrade-a kao izvora informacija. Upotreba materijala na internetu mora biti praćena hiper linkom do web stranice teletrade.org. Automatski uvoz materijala i informacija sa stranice je zabranjen.
Ako imate bilo kakvih pitanja, obratite nam se pr@teletrade.global.
транcфери