- Analiza
- Novosti i instrumenti
- Vesti sa tržišta
Forex-novosti i prognoze od 27-12-2021
- Gold grinds higher around one-week top, near to the key technical hurdle.
- Market sentiment improves on receding Omicron fears, stimulus hopes.
- S&P 500 refreshed all-time high, yields drowned DXY amid year-end holiday season.
- Gold Price Forecast: Optimism weighs on the greenback, December high at sight
Gold (XAU/USD) remains firmer around $1,812 during Tuesday’s Asian session, after refreshing the weekly peak the previous day. The yellow metal cheers the market’s risk-on mood, as well as downbeat US dollar prices, to keep buyers hopeful during the final days of 2021.
Easing fears of the South African covid variant and stimulus hopes could be cited as the major catalysts for the latest market optimism even as light calendar and holiday mood restricted the metal’s performance.
Traders believed in studies from South Africa and the UK showing fewer odds of hospitalization due to the Omicron covid variant to take a sigh of relief from the Omicron fears. Adding to the market optimism were the policymakers’ actions suggesting the receding challenges due to the virus outbreak. Recent, the US Centers for Disease Control and Prevention (CDC) reduced the isolation and quarantine period for the general population from the previous 10 to five.
Comments from US Vice President Kamala Harris who signaled to use her tie-breaking vote to pass President Joe Biden’s Build Back Better (BBB) stimulus plan also favored market sentiment. On the same line were headlines from the People’s Bank of China (PBOC) and the Chinese Finance Ministry that favored further easy money to help sustain the economic growth of Australia’s largest customer.
Additionally, ongoing talks over Iran’s denuclearization and a global push for peace between Russia and Ukraine also seem to have offered relief to the markets.
It should be noted that a downbeat print of the US Dallas Fed Manufacturing Index for December, 8.1 versus 13.2 expected and 11.8 prior, also weighed on the US dollar and favored the gold prices.
That said, Wall Street portrayed a positive start to the week with S&P 500 renewing all-time high while the US 10-year Treasury yields eased from the two-week high, down 1.7 basis points (bps) to 1.47%.
Given the holiday mood and an absence of major catalysts, Omicron headlines keep the driver’s seat. Also important are the US housing and Richmond Fed Manufacturing data.
Technical analysis
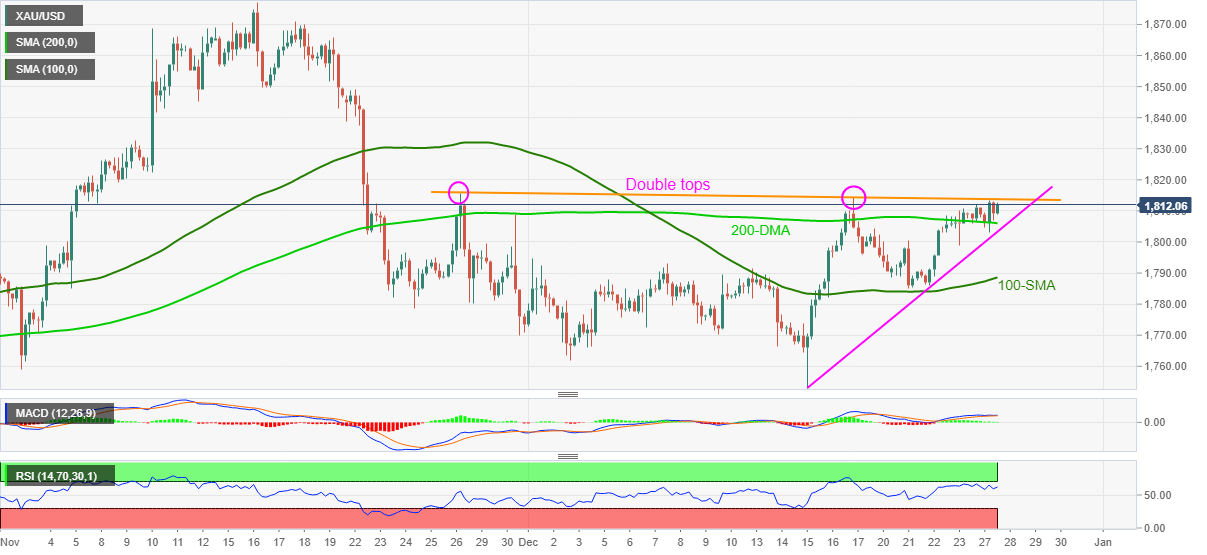
Gold prices seesaw around 200-SMA, also below the double tops marked during the last one month. The year-end inaction could well be perceived from the sluggish MACD signals and lackluster RSI near the overbought territory.
It should be noted, however, that the gold buyers keep the reins, as portrayed by a two-week-old ascending trend line. However, a clear upside break of $1,816 will become necessary for the bulls to aim for highs marked during July and September, around $1,834.
Alternatively, gold sellers need a clear downside break of a two-week-old ascending trend line, near $1,802, for re-entry. Adding to the support is the $1,800 threshold.
Following the quote’s weakness past $1,800, the 100-SMA level of $1,787 will act as a buffer before directing the gold bears to $1,765 and the monthly low near $1,753.
Gold: Four-hour chart
Trend: Further upside expected
- GBP/USD seesaws in a choppy range after refreshing multi-day top.
- Easing UK virus cases, government’s assurance of no fresh restrictions during 2021 favored bulls.
- Optimism over new post-Brexit fishing rules, announcement of £75million funding for British ports and processing facilities added to optimism.
- Second-tier US data to entertain traders, risk catalysts are the key.
GBP/USD takes rounds to the recently flashed monthly peak around 1.3440 during an inactive initial Asian session on Tuesday.
The cable pair refreshed the multiday high as upbeat market sentiment and positive news at home offered a double boost to the buyers. Even so, the year-end holiday season restricted the quote’s reaction to the positives.
After multiple days of above 100,000 covid infections, the UK reported 98,515 cases on Monday. Not only the easing of COVID-19 numbers but comments from British Health Secretary Sajid Javid also favored the GBP/USD prices. “The UK's government will not introduce new COVID-19 restrictions for England before the end of 2021,” per UK Health Minister Javid. The British authorities also stated that the ‘temporary’ lockdown restrictions could last until late March in the UK.
Elsewhere, Britain announced a £75million aid package to improve ports and processing facilities, as well as create jobs. The same relief measure joins the latest fishing rules stating the need for 70% British crew and 70% of fish that must be landed in UK ports.
It’s worth noting that studies from South Africa and the UK showing fewer odds of hospitalization due to the Omicron covid variant eased market fears from the South African covid variant. Also on the positive side were comments from US Vice President Kamala Harris who signaled to use her tie-breaking vote to pass President Joe Biden’s Build Back Better (BBB) stimulus plan. Further, ongoing talks over Iran’s denuclearization and a global push for peace between Russia and Ukraine also seem to have favored the GBP/USD buyers.
Against this backdrop, US equities closed higher while the US 10-year Treasury yields eased from the two-week high, dropping 1.7 basis points (bps) to 1.47%.
Looking forward, US housing and Richmond Fed Manufacturing data can offer intermediate relief to the cable pair but major attention will be given to Brexit and Omicron headlines.
Technical analysis
Successful trading beyond the 50-DMA level near 1.3440 becomes necessary for the GBP/USD bulls to aim for the late November’s swing high near 1.3515.
- On Monday, the GBP/JPY advanced some 0.68% amid a risk-on market mood.
- The British pound gained some 140 pips during the day.
- GBP/JPY Price Forecast. A golden cross in the 4-hour chart opened the door for further gains.
The British pound extends its rally against the safe-haven Japanese yen, trading at 154.43 during the day at the time of writing. Despite having thin liquidity conditions, the market sentiment is upbeat, as shown by US equities ending green.
That said, market participants did not account for another 1,000 flights canceled in the US on Monday, added to the 3,000 during the Christmas weekend, totaling around 4,000. Staff shortages, weather-related disruptions, and the fast-spreading Omicron Covid-19 strain disrupt flights during the year.
“As long as the Omicron variant continues to infect people who are vaccinated and quarantine restrictions remain in place, air travel is expected to be hit by staffing shortages,” per Reuters cited sources.
In the meantime, durIng the overnight session, the GBP/JPY rallied 140 pips, from 153.05 to 154.45. The upward move began right at the confluence of the 50-hour simple moving average (SMA) and the psychological 153.00 figure, spurring a rally amir appetite for riskier assets. That, in the end, propel risk-sensitive currencies like the GBP higher against safe-haven ones.
GBP/JPY Price Forecast: Technical outlook
The GBP/JPY 4-hour chart depicts a golden-cross formation, meaning that the 50-simple moving average (SMA) crossed over the 200-SMA, triggering a signal of buying the GBP.
That said, the first resistance would be the 61.8% Fibonacci retracement at 154.68. A break above that level would expose the November 4 daily high at 156.24, followed by the October 29 daily high at 157.09
On the other hand, the first support would be the 50% Fibonacci retracement at 153.59. A decisive breach of the latter would expose crucial support levels, like the 50-day moving average(DMA) at 153.00, followed by the confluence of the 100 and the 200-DMAs at 152.49.
-637762430141197764.png)
- AUD/JPY stays sidelined after refreshing the monthly high.
- Clear upside break of 50-DMA, firmer RSI hint at further advances of the quote.
- Late November swing highs challenge bulls, 100-DMA restricts the bear’s entry.
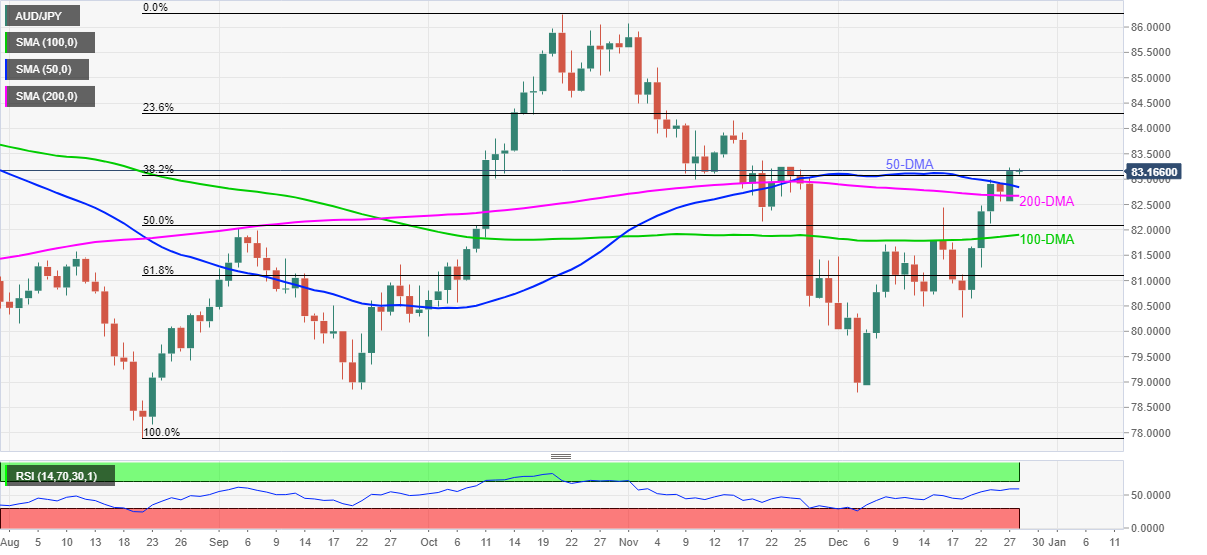
AUD/JPY bulls take a breather after renewing the monthly top near 83.20 during early Tuesday’s Asian session.
The cross-currency pair’s upside momentum gains support from the first daily closing beyond the 50-DMA in over a month and firmer RSI line, not overbought. However, tops marked during late November, around 83.40, seem to restrict the quote’s additional run-up.
Should the quote rises past 83.40, the 84.00 threshold and mid-November’s high near 84.15 will be in focus ahead of late October’s bottom of 84.60.
Meanwhile, pullback moves remain elusive until staying beyond the 50-DMA and the 200-DMA levels, respectively near 82.80 and 82.60.
Even so, the 100-DMA and 61.8% Fibonacci retracement of August-October upside, close to 81.90 and 81.10 in that order, will test the AUD/JPY bears before giving them the controls.
AUD/JPY: Daily chart
Trend: Further upside expected
- AUD/USD reversed Friday’s pullback to paint positive week-start, grinds higher around monthly peak.
- A jump in the covid cases, off in Aussie markets fail to tame the risk-on mood.
- Receding fears from Omicron, headlines from PBOC and US CDC favored bulls amid light calendar.
- Markets are off in Australia and hence risk catalysts can entertain traders ahead of the US session.
AUD/USD portrays the market’s risk-on mood while staying firmer around the monthly top, taking rounds to 0.7240 during early Tuesday morning in Asia.
While easing fears of the South African covid variant and stimulus hopes favored the bulls, holidays at home and a light calendar elsewhere restrict the Aussie pair’s performance of late.
With multiple studies from South Africa and the UK showing fewer odds of hospitalization due to the Omicron covid variant, global policymakers and traders took a sigh of relief from the fears emanating from the virus strain even as the cases rally in the West. The same helped the US Centers for Disease Control and Prevention (CDC) to follow the UK while reducing the isolation and quarantine period for the general population from the previous 10 to five.
Also on the positive side were comments from US Vice President Kamala Harris who signaled to use her tie-breaking vote to pass President Joe Biden’s Build Back Better (BBB) stimulus plan. On the same line were headlines from the People’s Bank of China (PBOC) and the Chinese Finance Ministry that favored further easy money to help sustain the economic growth of Australia’s largest customer.
Furthermore, ongoing talks over Iran’s denuclearization and a global push for peace between Russia and Ukraine also seem to have offered relief to the markets.
It should be noted that a downbeat print of the US Dallas Fed Manufacturing Index for December, 8.1 versus 13.2 expected and 11.8% added to the AUD/USD strength, via softer USD.
Alternatively, the virus infection continues to swirl at a faster pace with the UK and France hitting badly while a surge in the daily cases could be witnessed in Australia as well. “New South Wales (NSW) has recorded 6,062 COVID-19 cases and one death in the 24 hours to 8 pm yesterday. Hospitalizations have risen to 557, up from 521 in the previous reporting period,” said ABC News.
Amid these plays, US equities closed higher while the US 10-year Treasury yields eased from the two-week high, dropping 1.7 basis points (bps) to 1.47%.
Moving on, the holiday mood in Australia and an absence of major catalysts keep Omicron headlines on the driver’s seat before the US housing and Richmond Fed Manufacturing data could entertain the traders.
Technical analysis
Unless staying beyond September’s low surrounding 0.7170, AUD/USD remains capable of refreshing the monthly peak of 0.7253. However, the 50-DMA and 100-DMA hurdles, near 0.7280 and 0.7300 in that order, will challenge the bulls afterward.
- The NZD/USD slumps during the day some 0.04%.
- The New Zealand dollar falls on broad US Dollar strength across the board.
- The market sentiment is upbeat, despite the first Covid-19 Omicron-related death reported worldwide.
- NZD/USD Price Forecast: It has a downward bias, but a break below 0.6800 is needed to calm NZD bears.
The New Zealand dollar slides as Wall Street close approaches, trading at 0.6816 at the time of writing. US stock indices reflect the upbeat market mood, despite the spread of the newly discovered strain called Omicron worldwide. In the meantime, New Zealand’s neighbor Australia reported the first Covid-19 Omicron-related death, even though Australia would stick to its reopening plan.
The fall in the New Zealand dollar is linked to broad US dollar strength across the board. The US Dollar index, which measures the greenback’s value against a basket of its rivals, advances some 0.07% up to 96.09, a headwind for the NZD/USD pair, which sheds some of the last week’s gains.
In the meantime, the 10-yeat US Treasury yield sheds one basis point, down to 1.481%.
That said, an absent economic docket, as widely expected as financial markets enter the last week of the year, would keep NZD/USD traders lying on the dynamics of market sentiment, Covid-19 Omicron-related developments, and US fiscal policy pending to be approved by the US Congress.
NZD/USD Price Forecast: Technical outlook
The NZD/USD daily chart shows that the pair has a downward bias. The daily moving averages (DMAs) with a downslope reside above the spot price and would be challenging dynamic resistance levels to overcome.
That said, Monday’s price action is forming a hanging-man candlestick that has bearish implications. Nevertheless, the bottom-wick is a longer one, so NZD bears should be cautious in their attempt to sell the NZD/USD pair because the 0.6800 barrier has been unsuccessfully broken to the downside two previous days.
Nevertheless, the first support on the way south would be the 0.6800 figure. A breach of the latter would expose the December 23 daily low at 0.6795, followed by the December 22 low at 0.6739 and then the December 20 swing low at 0.6702.
-637762358253948643.png)
What you need to know on Tuesday, December 28:
Investors quietly returned from a long weekend, with a pitch of optimism amid reports suggesting that the Omicron variant is much less serious and less likely to end with hospitalizations than the previously known strains, despite being highly contagious, according to reports coming from the UK and South Africa.
Low volumes are the main theme this week, heading into the year-end. The American dollar shed some ground against most major rivals but advanced against the safe-haven yen. USD/JPY trades at 114.90, not far from the year high at 115.51.
The best performer was the British Pound, as GBP/USD reached a fresh December high of 1.3443. The USD/CAD pair fell to 1.2778, as the CAD was supported by higher oil prices and the positive tone of equities in the last trading session of the day.
The EUR/USD pair ticked higher within familiar levels, ending the day with modest gains at around 1.1320. The same goes for AUD/USD, which trades around 0.7240.
Gold prices ticked higher, and approached $1,814.23 a troy ounce, its December high. It finished the day at around $1.890.00. Crude oil prices were firmly up, with WTI trading at $75.50 a barrel.
Wall Street edged higher, with all the major indexes posting substantial gains. European indexes also traded with a positive tone, shrugging off the poor tone of their Asian counterparts.
US Treasury yields ticked lower amid the optimistic mood, with the 10-year bond yield holding below 1.50%.
Dogecoin presents buying opportunity before DOGE spikes to 0.38
Like this article? Help us with some feedback by answering this survey:
- France reintroduces restrictive Covid-19 measures amid the Omicron spread across the country
- The shared currency barely advanced some 0.05% during the New York session.
- A risk-on market mood weighed on the greenback vs. the Euro, despite the US Dollar Index advancing 0.10%.
- EUR/USD Price Forecast: Trapped in the 1.1300-50 range amid thin liquidity trading conditions.
The EUR/USD slightly advances during the New York session, trading at 1.1326 at the time of writing. As witnessed by US stock indices rising between 0.73% and 1.47%, the market mood is upbeat. Over the weekend, US airline companies canceled up to 3,000 flights amid personal shortage and a spike of Covid-19 cases in the US.
In the meantime, a report by Mastercard showed that US eCommerce sales jumped 11% on the 2021 holiday season, yet reinforcing the change of customers shopping habits.
In the last couple of hours, the French Prime Minister Jean Castex announced a series of measures imposed due to the ongoing spike of Covid-19 Omicron-related cases. The French PM said that people who have only three months after the second Covid-19 shot might be subject to a booster instead of four. From Monday and for the following three weeks, all public gatherings will be limited to 2,000 people, per Reuters.
Further added that home working would be mandatory three days per weak at least, and mask-wearing will become mandatory outdoors in city centers.
Market’s reaction
The EUR/USD barely blink, once the news crossed the wires, has remained seesawing around the 50-hour simple moving average (SMA) around the 1.1320-35 area, amid thin liquidity conditions as investors eye the end of the year.
EUR/USD Price Forecast: Technical outlook
The EUR/USD pair remained trapped around the 1.1300-50 area for the last two trading days, seesawing around the 50-hour SMA, as shown by the 1-hour chart. The pair has a slight-upward bias, though failure to break above the December 24 daily high at 1.1343 would open the door for further losses.
Nevertheless, in the event of breaking above the aforementioned, the next resistance would be the December 16 daily high at 1.1360. A decisive break of that level would expose the November 30 daily high at 1.1382, followed by the 1.1400 figure.
On the flip side, the first support would be the 100-hour SMA at 1.1313. A breach of the latter would expose the confluence of the 200-hour SMA and the psychological 1.1300 figure that once pierced would open the door towards the December 17 swing low at 1.1235.
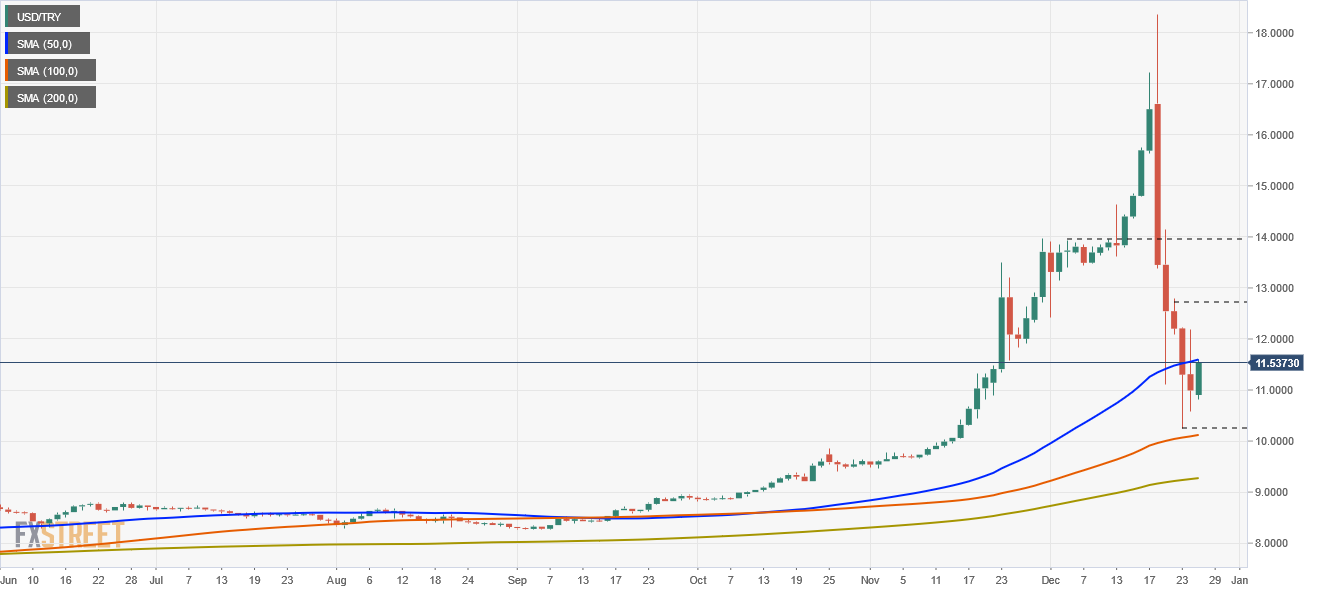
- The Turkish lira weakens some 5.11% against the greenback amid thin liquidity markets.
- USD/TRY Price Forecast: It has an upward bias, though a break above the 50-DMA is needed, to resume any moves towards 13.8000s.
The Turkish lira weakens through the day, trading at 11.4100 during the New York session at the time of writing. The market sentiment remains upbeat, with the S&P 500 printing all-time highs, despite the ongoing Omicron strain spread worldwide.
The US Dollar Index, which measures the greenback’s performance against a basket of rivals, edges up some 0.08%, sitting at 96.09.
In the meantime, Turkey’s banking watchdog filed criminal complaints against individuals who commented on the lira, including two former central bank governors. Furthermore, the regulator said that commentators attempted to manipulate exchange rate movements, violating an article of the banking law, according to Bloomberg
Doing a recap of the last week, President Recep Tayyip Erdogan announced extraordinary measures on December 20 to contain the Turkish lira’s losses against the greenback. Erdogan’s effort spurred a downward move from 18.2600 down to 13.0900.
USD/TRY Price Forecast: Technical outlook
The USD/TRY has an upward bias, despite the recent fall of 500-pips on measures implemented to stop the fall of the Turkish lira. The downward move was capped near the 100-day moving average (DMA) at 10.0890, bouncing off that level towards 11.3669, to then seesawed around the 50-DMA, unable of breaking to the upside.
To the upside, the USD/TRY first resistance level would be the 50-day moving average (DMA) at 11.5486. A breach of the latter would expose the December 24 daily high at 12.0550, followed by the December 22 high at 12.6800, and then the December 3 daily high at 13.8723.
- Western Texas Intermediate advances dome 2.66% during the New York session, exacerbated by thin trading liquidity conditions.
- The market sentiment is upbeat despite the Omicron variant worldwide outbreak.
- WTI Price Forecast: Tilted to the upside, though a break above the 50-DMA would open the path towards $79.00.
Western Texas Intermediate, also known as WTI, US crude oil benchmark, surged during the New York session, trading at $75.74 at the time of writing. A risk-on market mood keeps US equities and the black-gold advancing, despite the spread of the newly discovered Covid-19 variant called Omicron, which spurred the cancellation of flights on the Christmas weekend due to staff quarantine and shortages.
In the overnight session, WTI remained subdued around the $72.55-$73.50 range. However, in the last couple of hours, a spike of $2.5 is mainly attributed to thin liquidity trading conditions, which usually exacerbate any moves in the financial markets.
WTI Price Forecast: Technical outlook
The WTI daily chart depicts the black-gold has an upward bias. Through the day, oil pierced the 100-day moving average (DMA), leaving exposed the 50-DMA at $76.69. Nevertheless, the upward move was capped around the $76.00 figure, retreating some $0.25 to the current price.
To the upside, the first resistance would be the $76.00 threshold. A breach of the latter would expose the 50-DMA at $76.69, followed by the November 24 cycle high at $79.19.
On the other hand, the first support would be the $75.00 psychological level. A decisive break of that level would expose the 100-DMA at $74.18, followed by $74.00.
-637762222427252410.png)
- Euro up versus the yen for the fifth time out of the last six trading days.
- EUR/JPY breaks above 130.00 and rises above the 100-day SMA.
The EUR/JPY is rising sharply on Monday supported by the improvement in risk sentiment and the stability in US yields. The cross reached levels above 130.00 for the first time since mid-November.
More above 130.00?
The cross climbed to 130.09 and it remains firm above 130.00 as the rally from 127.50 (Dec 20 low) continues. The euro is now above the 100-day simple moving average and testing the 55-day SMA. A daily close clearly above 130.00 should sign more gains head. The next strong resistance stands at 130.75.
A decline back under 129.75 would alleviate the bullish pressure suggesting the euro is not ready yet for a run above 130.00.
Santa’s rally
The SP500 is up 0.90%, trading at record highs while the Nasdaq climbs 1.06%. At the same time crude oil gains 2.70%. The risk appetite across financial markets is helping the demand, favoring crosses like EUR/JPY.
Another key driver on Monday is the rally in USD/JPY. The pair is approaching 115.00. US yields remain mostly flat on Monday, weakening the yen that is also under pressure on the back of the risk sentiment.
Technical levels
- The S&P 500 rises some 0.75% as the New York session begins.
- As the Santa Rally extends, the Dow Jones and the Nasdaq surge between 0.39% and 1.16%.
- S&P 500 Price Forecast: It has an upward bias, as buyers have leaned to the 50 and the 100-DMA to open new buying positions, as shown by the daily chart.
The S&P 500 surges as Wall Street opens, up some 0.75%, sitting at 4,766.02 at the time of writing. The market sentiment has improved, despite worries about the Omicron variant triggering the cancellation of 3,000 plus flights on Christmas weekend due to quarantine measures and shortage of staff.
That said, the other two largest stock indices of Wall Street, the Dow Jones Industrial and the heavy-tech Nasdaq, are rising between 0.39% and 1.16%, currently at 36,089.50 and 16,496.92, respectively.
The largest stocks hit were airliners and cruisers, led by Delta Air Lines and United Airlines dipped 2.1% each, while American Airlines fell 2.4%. In the cruise line sector, Carnival fell 3.1%, followed by Royal Caribbean and Norwegian Cruise Line, each dropping 2.8% and 4%.
Sector-wise, the most significant gainers are technology, communication services, and consumer discretionary, gaining 1.42%, 1%, and 0.96%, each.
S&P 500 Price Forecast: Technical outlook
The S&P 500 has an upward bias from a technical perspective, as shown by the daily moving averages (DMAs) residing well below the index value, with the 50 and the 100-DMA acting as dynamic support levels.
Through the year, the 50-DMA was broken “strongly” around the middle of October, though bulls regained control and pushed the price higher. The 100-DMA was broken through the abovementioned date also, since then has been solid support in which equity bulls lean-to open fresh buying orders, pushing the index towards all-time highs.
To the upside, the first resistance would be 4,800. A breach of the latter would expose 4,900 and 5,000.
On the other hand, the first support would be the December 18 daily high at 4,749.73. A break below that level would expose the 50-DMA at 4,642.40, followed by the December 20 swing high at 4,527.82.
-637762181159538615.png)
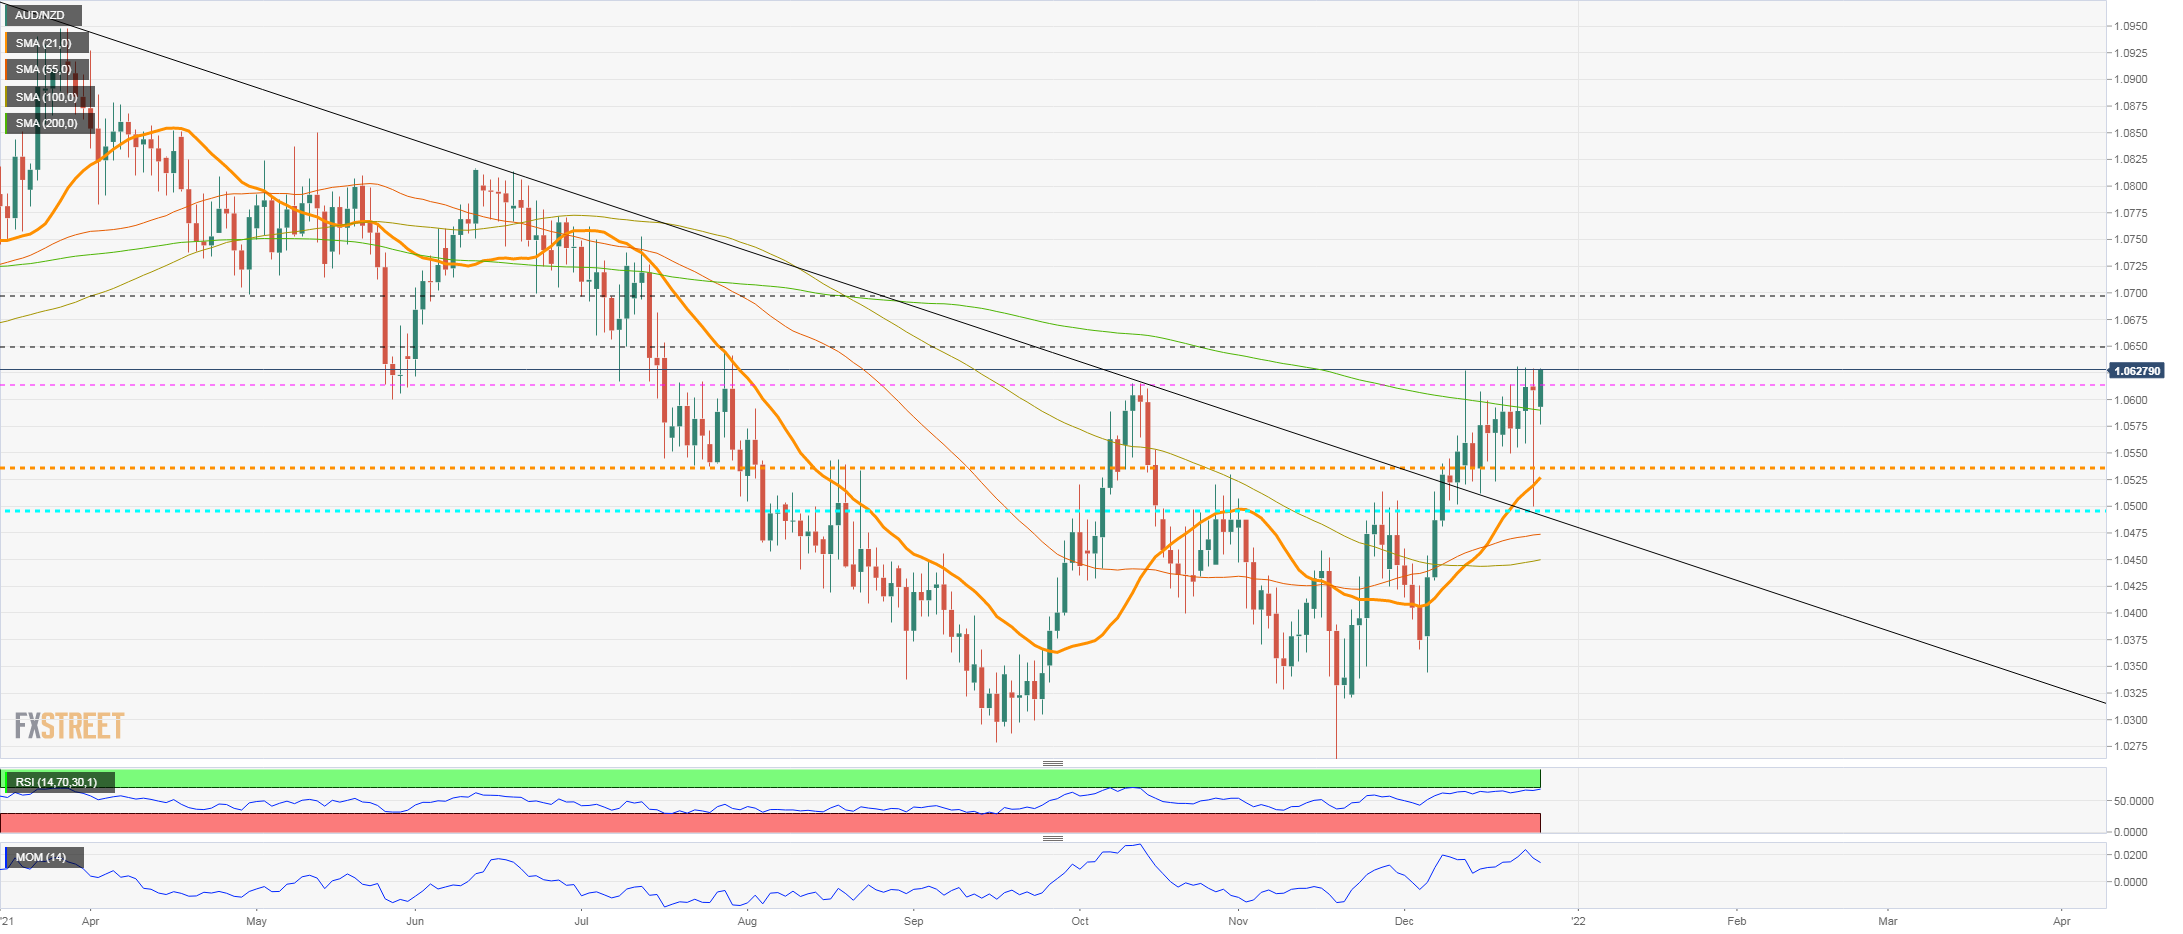
- Aussie holds bullish tone versus kiwi, facing resistance at 1.0630.
- More gains seem likely for AUD/NZD while above 1.0610.
- The correction could extend to 1.0535, slightly above the 20-day moving average.
The AUD/NZD is rising on Monday, testing the 1.0630 area of the recent top. A break higher should clear the way to more gains, with a target at 1.0650. The nest strong resistance stands slightly below 1.0700.
The daily RSI is near the 70 level, suggesting some potential exhaustion and Momentum is moving to the downside. Those indicators suggest moves between 1.0555 and 1.0630 could continue in the short term.
From the current level, a correction to the 1.0535/40 area, a horizontal level and also the 20-day moving average seems possible without affecting the positive outlook for the Aussie.
At the beginning of the month, it broke a downtrend line. Now key moving averages point north. A firm decline under 1.0500 could negate the bullish bias in AUD/NZD.
AUD/NZD daily chart
- The Mexican peso is among the worst performers on Monday.
- USD/MXN rises after three consecutive daily declines.
The USD/MXN posted on Friday the lowest close since mid-November. On Monday the pair is rising ending a three-day negative streak. The rebound is a normal correction so far, as the bias continues to point to the downside.
The Mexican peso remains unable to benefit on Monday from a weaker dollar amid a rally in Wall Street and in commodities. The WTI is rising 1.20% above $74.50, gold and silver trade at weekly highs, and the SP500 is up by 0.75% at a new record high.
The improvement in risk sentiment should weaken the USD/MXN but is not the case at the beginning of the last week of 2021. No relevant economic reports are due over the next days.
Short-term outlook
From a technical perspective, the bearish bias still prevails. The USD/MXN has a strong support around 20.45/50, a horizontal level and also the 100-day simple moving average. A break lower should add more negative pressure to the pair.
On the upside, the immediate resistance is located around 20.70 followed by the 20.90 region. Then comes 21.00, where the 20-day simple moving average stands. A daily close above should be a positive development for the dollar.
Technical levels
- XAU/USD advances some 0.09% as the last trading week of the year kicks in.
- The market sentiment is mixed, spurred by Omicron variant woes and transmissibility, despite being less lethal.
- XAU/USD Price Forecast: The weekly chart depicts a neutral bias, though a descending triangle has formed, threatening of pushing prices towards $1,5060s.
Gold (XAU/USD) vs. the greenback slightly advances during the New York session, trading at $1,809.01 at the time of writing. Omicron woes in the weekend spurred a cancellation of 3,000 plus flights, and thin liquidity conditions kept the market sentiment fluctuating between gainers and losers.
The yellow-metal rises despite broad US dollar strength
The US 10-year Treasury yield is flat, clinging to the 1.484% threshold, a tailwind for the non-yielding metal vs. the buck. At the same time, the US Dollar Index, which tracks the greenback’s value against a basket of its rivals, climbs some 0.15%, up to 96.17, staying above the 96.00 figure for the second consecutive week.
In the meantime, US Real-yields as of December 23 sit at -1.47%, flat following the footsteps of the US 10-year T-bond yield.
In the overnight session, the yellow-metal remained subdued in a $1,802-$1,812.40 narrow-range, at the lack of a catalyst, as the financial markets enter the last week of the year. Depicted by the 1-hour chart, XAU/USD’s downward move was capped by the double-zero psychological level and the 50-hour simple moving average (SMA), which lies around $1,807, pushing the non-yielding metal to current price levels
XAU/USD Price Forecast: Technical outlook
The weekly gold chart depicts that XAU/USD has a neutral, as shown by the weekly simple moving averages (SMAs) residing below the spot price. However, from the market-structure perspective, a series of successive lower-highs and higher-lows formed a descending triangle, a bearish formation, that in the event of breaking lower, would push gold prices to the 200-week SMA at $1,569.17, but it would face some hurdles on the way down.
The first support would be $1,721.52, followed by August 8 low at $1,687.19, followed by 2021 daily low at $1,676.70, and then the aforementioned 200-week SMA at $1,569.17.
-637762144060016375.png)
- A goodish pickup in the USD demand acted as a headwind for EUR/USD on Monday.
- The downside remains cushioned as investors seemed reluctant amid thin liquidity.
The EUR/USD pair remained on the defensive heading into the early North American session, albeit has managed to hold its neck above the 1.1300 round-figure mark.
Having failed to make it through the 1.1340-50 resistance zone on Friday, the EUR/USD pair witnessed a subdued/range-bound price action on the first day of a new week. The upside remains capped amid a goodish pickup in the US dollar demand, though the year-end thin liquidity helped limit any deeper losses.
The recent optimism led by reports that the Omicron variant might be less severe than previously feared was overshadowed by uncertainty over the economic impact of the continuous surge in new COVID-19 cases. This, in turn, drove some haven flows towards the greenback and acted as a headwind for the EUR/USD pair.
Apart from this, the Fed's hawkish outlook, indicating at least three rate hikes next year, further underpinned the greenback. Investors, however, seemed reluctant to place any aggressive directional bets amid absent relevant fundamental catalyst and a rather quiet trading activity due to the year-end holiday season.
Looking at the broader picture, the EUR/USD pair has been oscillating in a broader trading range since the beginning of this month. This further warrants some caution for aggressive traders and makes it prudent to wait for a convincing break through the mentioned before positioning for a firm near-term direction.
Technical levels to watch
- A combination of factors pushed USD/JPY to a fresh monthly high on Monday.
- A positive tone around the equity markets undermined the safe-haven JPY.
- A goodish pickup in the USD demand provided an additional boost to the pair.
The USD/JPY pair continued gaining traction through the mid-European session and shot to a fresh monthly high, around the 114.70-75 region in the last hour.
The US dollar made a solid comeback on the first day of a new trading week and remained well supported by the Fed's hawkish outlook, indicating at least three-rate hikes next year. Apart from this, a positive tone around the equity markets undermined the safe-haven Japanese yen and provided a goodish lift to the USD/JPY pair.
Looking at the broader picture, the recent move up witnessed since the beginning of this month has been along an upward sloping channel. This points to a well-established short-term bullish trend, which is reinforced by the fact that technical indicators on the daily chart are holding comfortably in the positive territory.
The set-up supports prospects for a further near-term appreciating move, though bulls are likely to wait for a sustained strength beyond the trend-channel resistance. The mentioned barrier, currently near the 114.85 region, is closely followed by the key 115.00 psychological mark, which if cleared will reaffirm the positive outlook.
The subsequent move up has the potential to lift the USD/JPY pair back towards November monthly swing high, around mid-115.00s, or the highest level since January 2017. The momentum could further get extended and allow bulls to aim back to reclaim the 116.00 round-figure mark.
On the flip side, the daily swing low, around the 114.30 region, now seems to protect the immediate downside ahead of the 114.00 mark. Any subsequent decline should find decent support near the lower boundary of the mentioned channel, currently around the 113.75 region, which should now act as a pivotal point for short-term traders.
USD/JPY 4-hour chart

Technical levels to watch
The People's Bank of China (PBOC) said on Monday that it will steadily implement a management system for real estate financing, as reported by Reuters.
Additional takeaways
"Will use multiple monetary policy tools in 2022 to keep liquidity reasonably ample."
"Will step up support for real economy."
"Will keep yuan exchange rate basically stable at reasonable and balanced levels."
"Will step up oversight of capital and platform companies."
"Will dispose risks at key institutions in a steady and orderly way."
"Will implement prudential management of the property financing policy in a prudent way."
"Will promote the healthy development of the property market, satisfy reasonable housing demand."
"Will launch financial infrastructure supervision measures, steadily promote opening up bond market."
"Will keep growth in money supply and social financing in line with nominal GDP growth."
- A combination of factors prompted fresh selling around AUD/USD on the first day of a new week.
- Omicron fears acted as a headwind for the perceived riskier aussie amid resurgent USD demand.
- Investors might refrain from placing aggressive bets amid the year-end thin liquidity conditions.
The AUD/USD pair extended its steady intraday descent and dropped to a two-day low, around the 0.7200 round-figure mark during the mid-European session.
The pair struggled to capitalize on its early uptick, instead met with a fresh supply near the 0.7240 region and turned lower for the second successive day on Monday. Uncertainty over the economic impact of the continuous rise in new COVID-19 cases overshadowed the recent optimism led by reports that the Omicron variant might be less severe than previously feared. This was evident from the cautious market mood, which, in turn, drove flows away from the perceived riskier aussie.
Meanwhile, worries that the fast-spreading variant and fresh restrictive measures could result in disrupted supply chains across industries provided a modest lift to the safe-haven US dollar. Apart from this, the Fed's hawkish outlook, indicating at least three rate hikes next year, underpinned the greenback. This was seen as another factor that exerted pressure on the AUD/USD pair and dragged spot prices away from a near one-month high, around mid-0.7200s touched last Thursday.
Traders, however, seemed reluctant to place aggressive bets amid the year-end thin liquidity in the markets and absent relevant market moving economic releases. This, in turn, could help limit any further downside for the AUD/USD pair, warranting some caution for aggressive bearish traders. Hence, it will be prudent to wait for a strong follow-through selling before confirming that the recent bounce from the key 0.7000 psychological mark, or the YTD low has run out of steam.
From a technical perspective, any subsequent slide below the 0.7200 mark is likely to find some support near the 0.7180 strong horizontal resistance breakpoint. A convincing break below would be seen as a fresh trigger for bearish traders and turn the AUD/USD pair vulnerable to accelerate the slide back towards challenging the 0.7100 round figure. Conversely, a sustained strength beyond the 0.7240-50 region should pave the way for a further near-term appreciating move.
Technical levels to watch
- USD/CAD gained some positive traction on Monday and was supported by a combination of factors.
- Worries that rising COVID-19 cases could dent fuel demand weighed on oil and undermined the loonie.
- The cautious market mood drove some haven flows towards the USD amid the Fed’s hawkish outlook.
The USD/CAD pair held on to its intraday gains through the first half of the European session and was last seen hovering near the daily top, around the 1.2825-30 region.
A combination of factors assisted the USD/CAD pair to attract some buying on the first day of a new week and recover further from a one-week low, around the 1.2785 region touched on Friday. Uncertainty over the economic impact of surging coronavirus cases fueled worries that the imposition of fresh restrictions could dent fuel demand. This was evident from a downtick in crude oil prices, which undermined the commodity-linked loonie and extended some support to the major.
On the other hand, the cautious market mood – as depicted by a softer tone around the equity markets – drove some haven flows towards the US dollar. Apart from this, the Fed's hawkish outlook, indicating at least three rate hikes next year, acted as a tailwind for the greenback. This, in turn, was seen as another factor that provided a modest lift to the USD/CAD pair. That said, retreating US Treasury bond yields kept a lid on any meaningful gains for the buck and the USD/CAD pair.
Investors also seemed reluctant to place aggressive directional bets amid absent relevant fundamental catalysts and the end-of-year thin liquidity in the markets. This makes it prudent to wait for a strong follow-through buying before confirming that the recent corrective slide from the YTD high has run its course. Nevertheless, the fundamental backdrop seems tilted in favour of bullish traders and supports prospects for a further appreciating move for the USD/CAD pair.
Even from a technical perspective, the recent move up witnessed over the past two months or so has been along an upward sloping channel. This further points to a well-established short-term bullish trend and validated the positive outlook. Hence, any meaningful dip could still be seen as a buying opportunity and is more likely to remain limited. A sustained break below the trend-channel support, currently around the 1.2760 area, is needed to negate the bullish bias.
Technical levels to watch
Gold has been contained in a sideways range from March, with reduced sensitivity to the USD, which has steadily appreciated from May. Strategists at Credit Suisse are on high alert for a potentially significant top in XAU/USD, which would open up the $1,565/61 zone.
Rising US Real Yields seen as a major negative driver for gold
“Whilst we believe further USD strength will be a headwind for gold, a key driver for remains US Real Yields. Our base case remains that US Real Yields are in the process of establishing yield bases and with rising Real Yields seen as a major negative driver for the yellow metal, we remain on high alert for a potentially significant top and breakdown in XAU/USD.”
“Below support at $1,759/54 is needed to clear the way for a retest of major support at $1,691/77 – the key lows for the year from March, April and August.”
“A break below $1,691/77 would see a large top and also a bearish ‘triangle’ continuation pattern established to mark a significant change of trend lower. If confirmed, we would expect this to act as the catalyst for a fall to the 50% retracement and 200-week average at $1,565/61 initially.”
“Whilst we would expect the $1,565/61 zone to hold at first, big picture, we would see scope for an eventual fall to $1,452/40.”
China will roll out fiscal policies proactively to stabilize economic growth in 2022, the country’s Finance Ministry said at its briefing on Monday.
“Fiscal expenditures will be kept up to bolster growth and the central government will step up transfers to local governments to support necessary spending,” the Ministry said.
The statement added, “China will maintain "overall social stability" ahead of the 20th congress of the ruling Communist Party next year.”
Related reads
- China’s Finance Ministry: Will 'appropriately' frontload infrastructure investments
- China's industrial profit growth tumbles as raw material prices fall
- USD/CHF gained some positive traction on Monday amid a goodish pickup in the USD demand.
- The cautious market mood underpinned the safe-haven CHF and kept a lid on any further gains.
- Investors seemed reluctant to place aggressive directional bets amid the year-end thin liquidity.
The USD/CHF pair maintained its bid tone through the early part of the European session, albeit seemed struggling to reclaim the 0.9200 round-figure mark.
Having shown some resilience below the 200-day SMA, the USD/CHF pair edged higher on the first day of a new week and reversed Friday's slide back closer to the monthly low, around the 0.9165-60 area. The uptick was exclusively sponsored by a goodish pickup in demand for the US dollar, which drew some support from the Fed's hawkish outlook.
Meanwhile, uncertainty over the economic impact of surging new COVID-19 cases overshadowed the recent optimism led by reports that the Omicron variant might be less severe than previously feared. This, in turn, tempered investors' appetite for perceived riskier assets, which benefitted the safe-haven Swiss franc and capped gains for the USD/CHF pair.
The flight to safety was reaffirmed by retreating US Treasury bond yields, which acted as a headwind for the USD and further held back bulls from placing aggressive bets around the USD/CHF pair. Traders also seemed reluctant amid the end-of-year thin liquidity conditions in the markets and absent relevant market moving economic releases.
The mixed fundamental backdrop warrants some caution before positioning for any further appreciating move. Even From a technical perspective, last week's sustained break below the 0.9200 mark favours bearish traders, making it prudent to wait for a strong follow-through to confirm that the recent slide from the 0.9250 supply zone has run its course.
Technical levels to watch
Analysts at Credit Suisse expect a more challenging risk backdrop in 2022 due to higher real yields, which will weigh on high-beta currencies, particularly AUD/USD.
AUD/USD is likely to come under pressure
“A further boost to the USD is also expected if US Real Yields establish bases as we expect, however, this should lead to a broadening of the USD rally as the risk backdrop becomes challenged, with AUD/USD likely to come under growing pressure.”
“We see scope for a move back to 0.6758, which is the 50% retracement of the 2020/21 upmove and potentially beyond given the size of the top, with next minor support at 0.6505/00.”
FX option expiries for December 27 NY cut at 10:00 Eastern Time, via DTCC, can be found below.
- EUR/USD: EUR amounts
- 1.1125 349m
- 1.1175 222m
- 1.1325 300m
MSCI EM has been in a clear medium-term downtrend since the peak in February 2021. In the view of economists at Credit Suisse, emerging market equities are likely to remain under pressure on both an absolute and relative basis during 2022.
EM equities have completed a clear bear “triangle” continuation pattern
“Weekly MACD momentum is now negative and the 200-day average has started to fall, having already been crossed by the 55-day average earlier this year. Furthermore, the market has completed a clear bear ‘triangle’ continuation pattern following the recent sustained break below the 12316 low of August, which suggests further weakness is likely.”
“We look for a break below the 38.2% retracement of the 2020/21 recovery at 1183 to open up a move to the January 2020 high at 1151 next and then the 50% retracement at 1101/00, where we would be alert for signs of a floor.”
“On a relative basis, the MSCI EM/DM Ratio remains in a clear medium-term downtrend and we expect that rising real yields and a stronger USD will continue to weigh on the market on both an absolute and relative basis.”
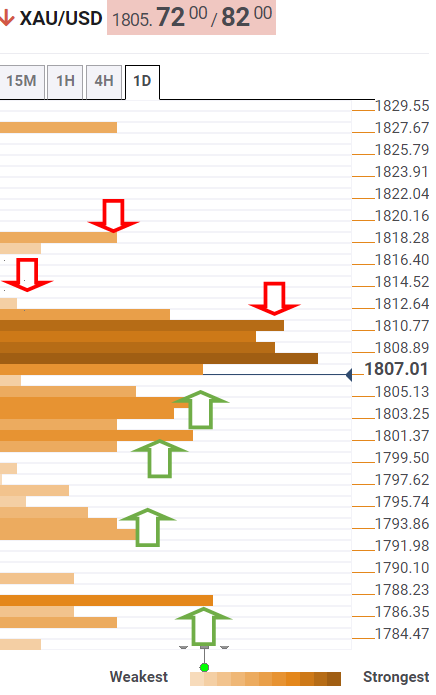
- Gold price is retreating from multi-day top but holds comfortably above $1,800.
- The US dollar rebound is weighing on gold but weaker yields could cap the losses.
- Gold awaits a sustained move above $1,815 amid favorable technicals.
Gold price extended the previous week’s upbeat momentum into a fresh on Monday, but bulls fail to sustain at higher levels amid a lack of fresh catalysts and thin liquidity. Gold price is easing from six-day highs, courtesy of the rebound in the US dollar across the board. However, weaker Treasury yields lend support to bulls, limiting the corrective decline in gold price. Looking ahead, gold price will remain at the mercy of year-end flows, dynamics in the dollar and the yields.
Read: Gold 2022 Outlook: Correlation with US T-bond yields to drive yellow metal
Gold Price: Key levels to watch
The Technical Confluences Detector shows that the gold price is turning south after facing a wall of resistances stacked up around $1,1812.
Around that price zone, the pivot point one-day R2, Fibonacci 161.8% one-day and the previous high four-hour coincide.
A sustained move above the latter is needed to take out the December month highs of $1,814.
Acceptance above the monthly peak will put the pivot point one-day R2 at $1,817 to test.
Alternatively, immediate support is aligned at $1,803, the confluence of the Fibonacci 38.2% one-month and SMA50 one-hour.
The next stop for gold sellers is seen at $1,800, the intersection of the SMA50 one-day, Fibonacci 38.2% one-week and SMA5 one-day.
If the selling pressure intensifies, then bears would target $1,792, the point of contact of the Fibonacci 61.8% one-week, SMA10 one-day and pivot point one-week S1.
The next line of defense for XAU bulls is seen at $1,789, where the SMA100 one-day appears.
Further down, the confluence of the Fibonacci 23.6% one-month and SMA100 four-hour at $1,787 will get tested.
Here is how it looks on the tool
About Technical Confluences Detector
The TCD (Technical Confluences Detector) is a tool to locate and point out those price levels where there is a congestion of indicators, moving averages, Fibonacci levels, Pivot Points, etc. If you are a short-term trader, you will find entry points for counter-trend strategies and hunt a few points at a time. If you are a medium-to-long-term trader, this tool will allow you to know in advance the price levels where a medium-to-long-term trend may stop and rest, where to unwind positions, or where to increase your position size.
- Receding Omicron fears assisted GBP/USD to gain some positive traction on Monday.
- A goodish pickup in the USD demand kept a lid on any meaningful gains for the major.
- The year-end thin liquidity conditions warrant caution before placing directional bets.
The GBP/USD pair quickly reversed an early European session uptick and was last seen hovering near the lower end of its daily trading range, just below the 1.3400 mark.
The British pound has been one of the top performers over the past one week or so amid more positive news concerning the Omicron variant of the coronavirus. In fact, reports suggested the new strain may be less severe than the previous Delta variant. Adding to this, a UK study indicated that Omicron infections are less likely to lead to hospitalization. This comes on the back of a surprise rate hike by the Bank of England, which, in turn, was seen as a key factor that continued lending some support to the GBP/USD pair.
That said, expectations that the UK government may opt to impose new restrictions – amid the fast spread of the Omicron variant in Britain – acted as a headwind for the sterling. This, along with a goodish pickup in the US dollar demand capped any meaningful upside for the GBP/USD pair. Uncertainty over the economic impact of the continuous rise in new COVID-19 cases tempered investors' appetite for riskier assets. This was evident from a softer tone around the equity markets, which benefitted the safe-haven greenback.
Apart from this, the Fed's hawkish outlook, indicating at least three rate hikes in 2022, underpinned the greenback and kept a lid on any further gains for the GBP/USD pair. Traders also seemed reluctant to place aggressive bets amid the year-end thin liquidity conditions and absent relevant market-moving economic releases, either from the UK or the US. This makes it prudent to wait for some follow-through buying before positioning for an extension of the recent bounce from the vicinity of mid-1.3100s, or the YTD low touched earlier this month.
Technical levels to watch
- EUR/USD holds above 21-DMA starting out a light week on Monday.
- US dollar attempts a bounce despite a corrective pullback in Treasury yields.
- The pair awaits a symmetrical triangle breakout on the daily sticks.
EUR/USD is moving back and forth in a 25-pips trading range so far this Monday, lacking a clear directional bias amid holiday-thinned markets and uncertainties surrounding the Omicron covid variant worldwide.
Thursday’s US PCE inflation is likely to back the Fed’s hawkish shift on rate hikes next year, underscoring the Fed-ECB monetary policy divergence. The ECB policymakers continue to rule out a 2022 rate hike.
Looking at EUR/USD’s daily chart, the price is extending its range play within a month-long symmetrical triangle formation.
Currently, EUR bulls remain hopeful so long as they defend the critical 21-Daily Moving Average (DMA) at 1.1300.
With the 14-day Relative Strength Index (RSI), however, inching lower below the 50.00 level, a downside breakout from the ongoing range trade cannot be ruled.
A sustained break below the 21-DMA could trigger a fresh sell-off towards the rising trendline support at 1.1242.
The triangle breakdown will get confirmed on a daily candlestick closing below the latter, opening floors towards the yearly lows of 1.1186.
EUR/USD: Daily chart

On the flip side, if the 21-DMA support holds, then bulls can re-attempt the falling trendline resistance at 1.1346.
A sustained move above the latter, EUR/USD will confirm an upside breakout from the symmetrical triangle formation.
Buyers could then initiate a fresh upswing towards the bearish 50-DMA at 1.1405.
EUR/USD: Additional levels to consider
Economists at Credit Suisse still see significant upside potential for USD/JPY after the completion of a major base above the 2019 and 2020 highs at 112.23/40. A further boost to the pair is also expected if US Bond Yields rise.
Rising US Yields should support broad-based USD strength
“We maintain our bullish outlook and look for the current range to be resolved higher, ideally early in Q1 2022 for a fresh leg higher to challenge its long-term downtrend from April 1990, now at 116.85.”
“Whilst we would be alert to a fresh phase of consolidation at 116.85 we look for a conclusive break later in the year, with resistance seen next at the 118.61/66 highs of December 2016 and with the ‘measured base objective’ ultimately at 122.90/123.00.”
“Rising US Bond Yields should also support the case for further USD/JPY strength as we continue to see a positively correlated relationship.”
- A combination of factors prompted some intraday selling around NZD/USD on Monday.
- The cautious market mood weighed on the perceived riskier kiwi amid a stronger USD.
- The year-end thin liquidity could hold traders from placing aggressive directional bets.
The NZD/USD pair surrendered its modest intraday gains and was last seen hovering near the daily low, just above the 0.6800 mark during the early European session.
The pair struggled to capitalize on its early uptick, instead met with some supply near the 0.6825 region and was weighed down by a combination of factors. Uncertainty over the economic impact of the continuous rise in new COVID-19 cases overshadowed the recent optimism led by reports that the Omicron variant might be less severe than previously feared. This, in turn, tempered investors' risk appetite and acted as a headwind for the perceived riskier kiwi.
Meanwhile, the cautious market – as depicted by a softer tone around the equity markets – drove some haven flows towards the US dollar, which was further underpinned by the Fed's hawkish outlook. It is worth recalling that the so-called dot plot indicated that the Fed officials expect to raise the fed funds rate at least three times next year. A stronger USD was seen as another factor that kept a lid on any meaningful upside for the NZD/USD pair.
The downside, however, remained cushioned, at least for the time being, as investors seemed reluctant amid the year-end thin liquidity conditions. Moreover, absent relevant market-moving economic releases warrant some caution before placing aggressive directional bets. Nevertheless, the fundamental backdrop seems tilted in favour of bearish traders. Hence, any attempted positive move might continue to confront stiff resistance ahead of mid-0.6800s.
Technical levels to watch
Economists at Credit Suisse look for the S&P 500 Index to move to 4970/5000, potentially as far as 5200.
Strength to not extend above 5200
“We look for an eventual move above 4744/50, which would also in our view complete a near-term bullish ‘triangle’ continuation pattern. We would expect this to then act as the catalyst for a fresh leg higher to trend resistance from April initially, currently seen at 4858 and eventually 4970/5000, a rise of around 6% from current levels.”
“We would not rule an overshoot towards 5200 (10% higher) but our bias at present is similarly not for a move beyond here.”
USD strength is set to broaden out. Economists at Credit Suisse expect the EUR/USD pair to move downward to 1.1019/02 and potentially beyond.
The EUR Effective Exchange Rate (ECB) can weaken further in its own right to test its 2020 low at 94.88
“We maintain our view for further EUR/USD weakness yet with our core objective remaining at 1.1019/02, the 78.6% Fibonacci retracement of the 2020/2021 bull trend and the ‘neckline’ to the base from April/May 2020 and now also the long-term uptrend from 2000. We continue to look for this to ideally hold for what we think could be a lengthy sideways ranging phase.”
The EUR Effective Exchange Rate (ECB) is currently consolidating at key support at the 38.2% retracement of the entire 2015/2020 bull trend but if this were to be conclusively removed this would suggest the EUR can weaken further in its own right to test its 2020 low at 94.88, a decline of 2.3% from current levels. This on its own would be sufficient to see EUR/USD down at 1.1019/02 but if the USD continues to strengthen in tandem this would suggest the broader risk would be for a move below 1.1000 post a consolidation phase, and a fall to potential trend support at 1.0800.”
Silver has extended its recent and definitive rejection of its key falling long-term 200-day moving average (DMA) for a retest of its major support at $21.68/42. A break below here would confirm a major top, clearing the way for a fall to the $17.00, strategists at Credit Suisse report.
Silver is seen on the cusp of establishing a major top
“A clear and ideally weekly close below $21.42 should confirm a major top, further reinforcing our existing negative view and confirm a change of trend lower for 2022. We would then look for a fall to the September 2019 high at $19.65 initially, then the 61.8% retracement of the 2020/2021 bull trend and ‘neckline’ to the prior long-term base at $18.69/64.
“Whilst we would expect $18.69/64 to hold at first, we would be biased to a break below here with support then seen next at $17/16.95.”
“A close above the $25.41 November high is not only needed to ease fears of a major top, but it would also see the metal back above its 200-DMA, clearing the way for strength back to the 2021 highs at $29.86/30.10.”
GBP/USD has lost its bullish momentum following last week's climb. Strong resistance seems to have formed at 1.3440, therefore, further gains are not expected while the cable trades below this level.
Pound rally loses steam
“In case profit-taking comes into play and starts weighing on stocks, we could see GBP/USD starting to edge lower amid renewed greenback strength.”
“Strong static resistance seems to have formed at 1.3440 and buyers are unlikely to show interest in the pair unless it managed to close a four-hour candle above that level. In case that happens, 1.3475 (static level) aligns as the next hurdle before 1.3500 (psychological level).”
“1.3320 (200-period SMA) and 1.3300 (psychological level, 50-period SMA) could be targeted if the pair drops below 1.3370 (lower limit of the range, former resistance) and flips that level into resistance.”
The Euro Stoxx 50 initially saw a very strong uptrend during the first half of 2022, before settling into a more mean-reverting phase during the second half of the year. Analysts at Credit Suisse expect European equity markets to also move higher in 2022 in absolute terms, however, they expect Europe to continue to underperform the broader Developed equity space.
Core trends still seen as higher
“Above the 4288 December high is needed to re-inject fresh upside momentum, with the next key resistance then seen at 4415, the 2021 YTD high. Above would then open the door further for a potential rise toward 4573, the key high of 2007.”
“Key price supports are seen initially at the 200-day average at 4110, ahead of the October low at 3966, before the July low at 3905 and then critically the May low at 3858. We see those levels as the key lines in the sand that need to hold to avoid a larger topping structure being established.”
“Despite the intact absolute uptrend, we expect European equities to continue to underperform versus MSCI World Developed and we do not expect a major change in this trend during 2022.”
Economists at Credit Suisse maintain their bullish USD outlook. They maintain a target of 97.73/80 for the US Dollar Index (DXY) but see risk now for a move beyond here in 2022.
Consolidation from late November is seen as a temporary pause
“The high-level consolidation from late November is seen as a temporary pause ahead of a resumption of its core uptrend to our 97.73/80 core objective – the 61.8% retracement of its 2020/2021 bear trend and June 2020 reaction high. Our bias remains for this to then cap to define the top of a potential consolidation phase.”
“We see the broader risk still higher and above 97.80 on a sustained basis post a consolidation phase should see the USD strengthen further, with resistance seen next at 98.65, ahead of the 100.56/93 zone.”
“Over the long-term, we would not even rule out a move to the top of its five-year range, seen starting at 102.50.”
Turkey's announcement of a bold new scheme to protect TRY deposits from FX risks seems to have turned the tide. However, economists at TD Securities believe USD/TRY has reached the bottom and expect the pair to enjoy considerable gains.
The nightmare after Christmas
“The lira has cumulatively appreciated ~57% vs USD from a record low at 18.3633 on 20 Dec. But have lira bears really capitulated? Momentum seems to be fading already.”
“We still lack evidence that investors (especially locals) have turned en masse to converting hard currency into lira. Rather, the latest information on reserve usage provides strong evidence that the CBRT has used the big guns, through both direct intervention and its swap program.”
“In the past month, the CBRT's gross reserves have dropped the most since March 2020. While this is immediately visible to all, the sizeable increase of the CBRT's swap program to new record highs, and its implications, are not.”
“Turkey’s macro-financial stability looks unsustainable. We think USD/TRY may soon be set for another steep climb.”
- A goodish pickup in the USD demand provided a modest lift to USD/JPY on Monday.
- The cautious mood could benefit the safe-haven JPY and keep a lid on further gains.
- Retreating US bond yields might also cap the upside amid the year-end thin liquidity.
The USD/JPY pair traded with a mild positive bias through the early European session and was last seen hovering near the monthly top, around mid-114.00s.
The pair managed to attract some buying on the first day of a new trading week and was supported by a goodish pickup in the US dollar demand. The Fed's hawkish outlook, indicating at least three rate hikes next year, turned out to be a key factor that extended some support to the greenback. That said, a combination of factors could hold back bulls from placing aggressive bets and cap the upside for the USD/JPY pair.
Despite reports that the Omicron variant might be less severe than previously feared, investors remain uncertain over the economic impact of the continuous surge in new COVID-19 cases. This, in turn, kept a lid on the recent optimistic move in the markets and should help revive demand for the safe-haven Japanese yen. This, along with retreating US Treasury bond yields, could act as a headwind for the USD and the USD/JPY pair.
Investors might also prefer to wait on the sidelines amid absent relevant market-moving economic releases and the end-of-year thin liquidity conditions. Hence, any subsequent move up is more likely to confront stiff resistance near the 114.80 region. This is closely followed by the key 115.00 psychological mark, which if cleared will be seen as a fresh trigger for bullish traders and pave the way for further gains.
Technical levels to watch
Following last week's rebound, EUR/USD seems to have settled above 1.1300 on Monday. According to FXStrteet’s Eren Sengezer, it would be surprising to see the pair make a decisive move in either direction.
Several key supports limit euro's downside
“The Relative Strength Index (RSI) indicator on the four-hour chart is moving sideways near 50, punctuating the pair's indecisiveness in the near-term.”
“Key support area seems to have formed near 1.1300, where the 200-period SMA, 100-period SMA and the 50-period SMA meet. In case a four-hour candle closes below that support, additional losses toward 1.1270 (static level) could be witnessed.”
“1.1340 (static level) aligns as first resistance before 1.1360 (post-ECB high on December 16).”
At the beginning of the new week, gold is staying quiet around $1,810. As FXStreet’s Dhwani Mehta notes, XAU/USD awaits a sustained move above $1,815 amid favorable technicals.
Gold yearns for acceptance above December highs amid bullish technical setup
“Gold bulls need to clear the December highs of $1,814 on a daily closing basis to extend the previous week’s rebound. The next critical target for bulls is pegged at the $1,820 round number.”
“The mildly bullish 50-DMA at $1,802 could limit any immediate downside move, below which the 200-DMA of $1,797 will be put to test. The 100-DMA at $1,790 is likely to challenge the bullish commitments should the bearish momentum accelerate.”
China’s Finance Ministry said in a statement on Monday, it will make infrastructure investments appropriately ahead of time.
Additional quotes
“Will resolutely curb increases in local government hidden debt in 2022.”
“Will make bigger efforts to cut taxes and fees in 2022.”
Market reaction
USD/CNY was last seen trading at 6.3718, up 0.07% on the day, as China’s industrial profits growth eases amid a fall in the raw material prices.
- USD/ZAR stays pressured around the lowest level since November 17, down for fourth consecutive day.
- Bearish MACD signals, clear downside break of two-month-old previous support line favor sellers.
- 100-DMA, six-month-old ascending trend line lure bears, upside momentum remains elusive below $16.15.
USD/ZAR remains on the back foot around a multi-day low, down 0.50% intraday close to $15.55 heading into Monday’s European session.
In doing so, the South African currency (ZAR) pair declines for the fourth consecutive day as the bears battle the resistance-turned-support and the 50-DMA level. Also favoring the pair sellers are the bearish MACD signals and failures to stay firmer beyond $16.00.
Even so, a daily closing below $15.54 becomes necessary for the USD/ZAR bears to extend the ruling towards September’s peak of $15.25.
Following that, the 100-DMA and upward sloping trend line from June, respectively around $15.15 and $14.80, will gain the market’s attention.
Should the quote bounce off $15.15-14 support confluence, the early December’s low near $15.66 the previous support line from October 20, close to $16.15, will challenge the USD/ZAR bulls.
In a case where the quote stays firmer beyond $16.16, the recently flashed multi-day high near $16.36 and the $17.00 round figure will be in focus.
USD/ZAR: Daily chart
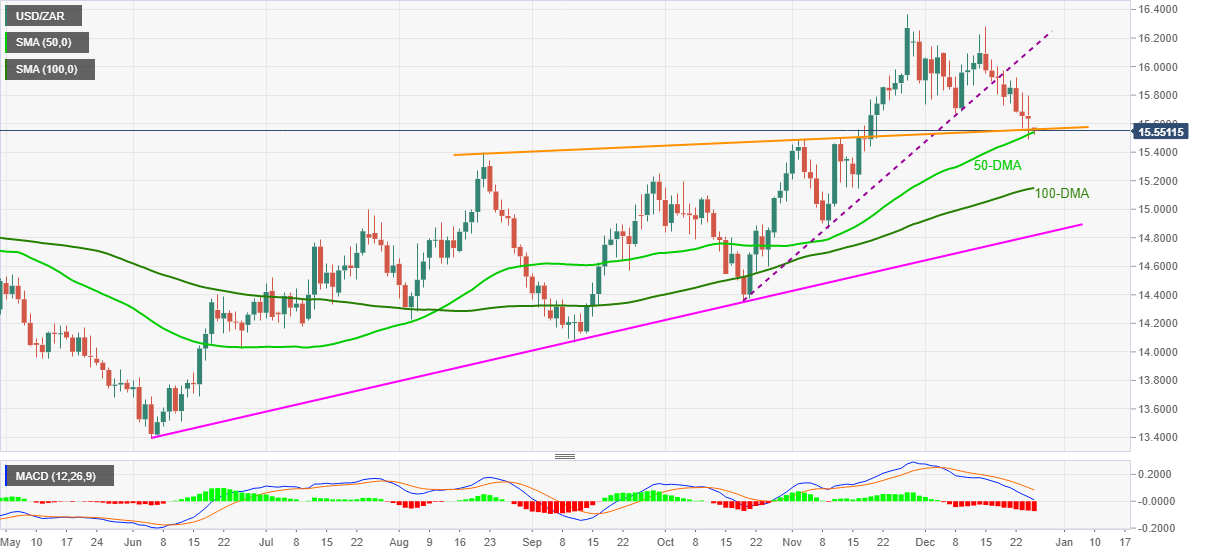
Trend: Further weakness expected
- A combination of factors failed to assist AUD/USD to capitalize on its modest uptick.
- Omicron fears acted as a headwind for the perceived riskier aussie amid stronger USD.
- The USD drew some support from the cautious mood and the Fed’s hawkish outlook.
The AUD/USD pair surrendered its modest intraday gains and dropped to a fresh daily low, around the 0.7225-20 region heading into the European session.
Despite reports that the Omicron variant might be less severe than previously feared, investors remain uncertain over the economic impact of the continuous rise in new cases. This, in turn, kept a lid on the recent optimistic move in the markets and acted as a headwind for the perceived riskier aussie. Apart from this, a goodish pickup in the US dollar demand attracted some selling near the 0.7240 region on Monday and contributed to the AUD/USD pair's modest downtick.
The cautious market mood extended some support to the safe-haven greenback amid the Fed's hawkish outlook. It is worth recalling that the so-called dot plot indicated that the Fed could hike interest rates at least three times next year to contain stubbornly high inflation. The expectations were reaffirmed by the US Personal Consumption Expenditures (PCE) Price Index, which accelerated to 5.7% YoY in November and marked the largest annual growth since 1982.
Meanwhile, the downside remains cushioned, at least for the time being, as investors seemed reluctant on the back of the year-end thin liquidity conditions. Moreover, there isn't any major market-moving economic data due for release on Monday, either from Australia or the US. This, in turn, warrants some caution for aggressive bearish traders and before confirming that the AUD/USD pair's strong recovery move from the key 0.700 psychological mark has run out of steam.
Technical levels to watch
Here is what you need to know on Monday, December 27:
Major currency pairs continue to fluctuate in extremely tight ranges to start the last week of the year as trading conditions remain thin. The only data featured in the US economic docket will be the Federal Reserve Bank of Dallas' Texas Manufacturing Survey for December but investors are unlikely to show any attention to this report.
The US Dollar Index, which tracks the greenback's performance against a basket of six rivals, is holding steady above 96.00 after losing more than 0.6% last week. The 10-year US Treasury bond yield is posting small daily losses but stays within a touching distance of 1.5%. Meanwhile, the US stock index futures trade flat in the early European session, failing to provide a hint on risk sentiment.
Following last week's rebound, EUR/USD seems to have settled above 1.1300 on Monday and it would be surprising to see the pair make a decisive move in either direction.
GBP/USD gained more than 100 pips and has gone into a consolidation phase around 1.3400. Over the weekend, the UK reported a daily record of more than 100,000 new coronavirus cases but British Prime Minister Boris Johnson dismissed additional restrictions until after New Year.
USD/JPY capitalized on the risk-positive market environment and closed the third straight week in the positive territory. Currently, the pair is moving sideways around 114.50.
After rising above the 200-day SMA on Monday, gold settled above $1,800 and spent the remainder of the week in a narrow band. At the beginning of the new week, the yellow metal is staying quiet around $1,810.
The barrel of West Texas Intermediate (WTI) gained nearly 5% and last week on easing concerns over a dismal demand outlook. On Monday, WTI is trading in the negative territory below $73.
Bitcoin stayed relatively quiet over the weekend and extends its sideways grind above $50,000 early Monday. Ethereum fluctuates around $4,000 for the fourth straight day.
- GBP/JPY retreats from intraday top but stays firmer around monthly high.
- Bulls remain hopeful to challenge mid-November tops until the quote stays above 152.55 support confluence.
GBP/JPY eases from daily highs to 153.35, staying firmer intraday, during early Monday morning in Europe.
The cross-currency pair snapped a three-day uptrend the previous day but stayed above 200-DMA and 38.2% Fibonacci retracement level of October-December declines.
The failures to break the 152.55 support level join bullish MACD signals to trigger another attempt towards breaking the 50% Fibo. level near 153.70.
Following that, the November 17 swing high close to 154.75, also including the 61.8% Fibonacci retracement level, will challenge the GBP/JPY buyers.
Alternatively, a clear downside break of 152.55 will aim for 151.70 and 23.6% Fibo. level of 151.17 before testing the previous resistance line from October, surrounding 150.40.
In a case where GBP/JPY sellers keep reins past 150.40, the 150.00 threshold and the yearly bottom of 148.45 will be on their radars.
GBP/JPY: Daily chart
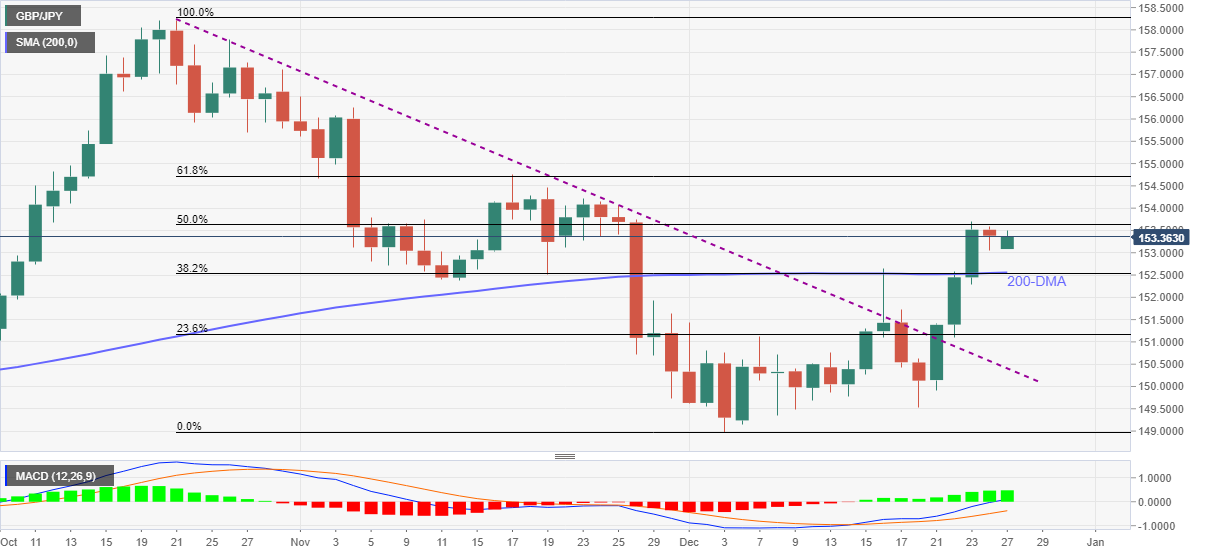
Trend: Further upside expected
- Gold remains mildly bid amid firmer US dollar, steady German yields.
- Holiday mood, light calendar restrict immediate moves but covid woes may weigh on the quote.
- French PM Macro’s speech, US second-tier data to watch for fresh impulse.
Gold (XAU/EUR) rises 0.18% intraday around €1,600 round figure heading into Monday’s European session. In doing so, the yellow metal prices rise for the fourth consecutive day while trading around the monthly peak.
Behind the moves could be the latest pullback in the EUR/USD prices amid Omicron fears and firmer US retail sales data. Adding to the XAU/EUR strength could be the pause in the German 10-year Treasury yields around the monthly top. On the same line are the escalating inflation chatters and optimism surrounding President Joe Biden’s Build Back Better (BBB) stimulus plan.
However, a record jump in the French daily covid infections, as well as a 45% hike in the virus-led hospitalizations on the monthly basis, challenges XAU/EUR buyers. Though, an 8.5% jump in US retail sales and US Vice President Kamala Harris’ readiness to tame inflation keeps the gold buyers hopeful.
Amid these plays, the US 10-year Treasury yields dropped 1.1 basis points (bps) to 1.482%, stepping back from a two-week high flashed the previous day, whereas the stock futures print mild gains by the press time.
Given the holiday mood in the markets, coupled with a lack of major data/events, XAU/EUR may extend the upward grind at a slower pace. Though, comments from French President Emmanuel Macron and risk catalysts mentioned above can offer intermediate direction.
Technical analysis
Gold (XAU/EUR) floats above the key SMAs amid the firmer Momentum line, suggesting another battle with the monthly resistance line near €1,602.
It’s worth noting that the monthly peak surrounding €1,603 and the late November’s swing high around €1,610 will act as extra hurdles to the north before the XAU/EUR bulls can eye €1,633 resistance level.
During the quote’s successful trading above €1,633, November’s peak of €1,6554 should return to the chart.
Meanwhile, pullback moves remain elusive until staying beyond the 100-SMA level of €1,582.
Should gold sellers manage to conquer €1,582 support, the monthly low near €1,555 will be in focus.
Overall, XAU/EUR remains in a recovery mode but the year-end inaction challenges the upside momentum.
XAU/EUR: Daily chart
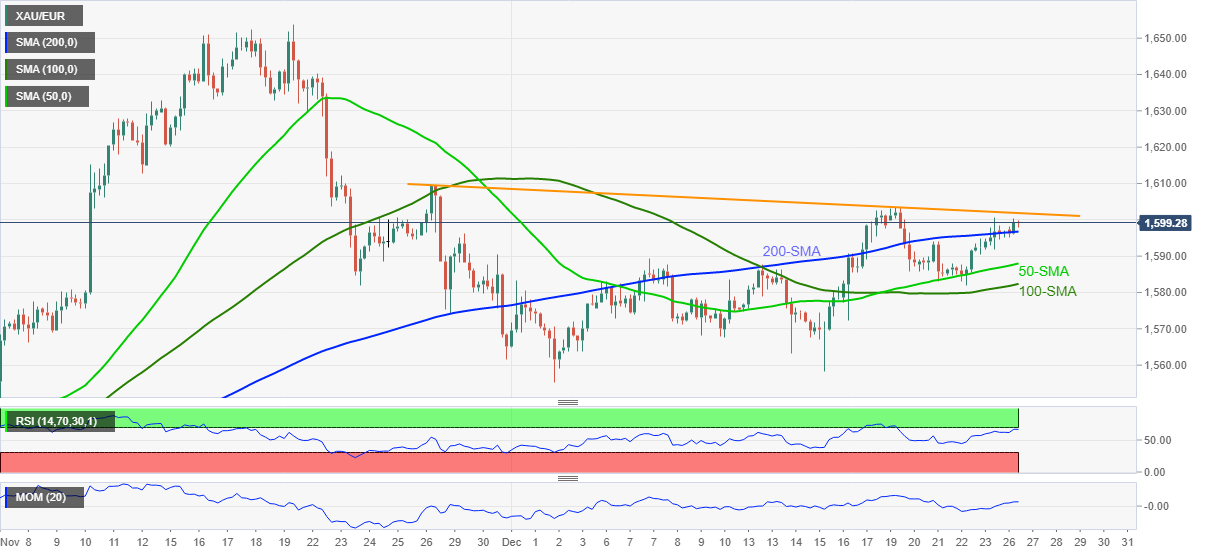
Trend: Further upside expected
- GBP/USD prints mild intraday losses inside bullish chart pattern.
- Successful trading above key HMAs, weekly support line keeps buyers hopeful.
- Confirmation of bulls flag exposes buyers towards November’s high.
GBP/USD retreats to 1.3405, down 0.07% intraday, during early Monday morning in Europe.
Even so, the cable pair stays inside a bull flag while keeping the previous day’s bounce off 50-HMA. Adding to the bullish bias is the weekly ascending trend line, rising 200-HMA and steady RSI.
However, a clear upside break of the flag’s resistance, around 1.3615 by the press time, will be important for the GBP/USD bulls to prosper.
Although the bullish flag confirmation hints at a theoretical target of 1.3665-70, tops marked during November 18 and 09, respectively around 1.3515 and 1.3610, can act as intermediate halts during the expected rise.
Meanwhile, the 50-HMA level near 1.3400 precedes the stated flag’s support line close to 1.3375 to restrict short-term GBP/USD declines.
In a case where the GBP/USD prices drop below 1.3375, an upward sloping support line from December 20 and 200-HMA, around 1.3345 and 1.3300 in that order, will be crucial to watch for clear direction.
GBP/USD: Hourly chart
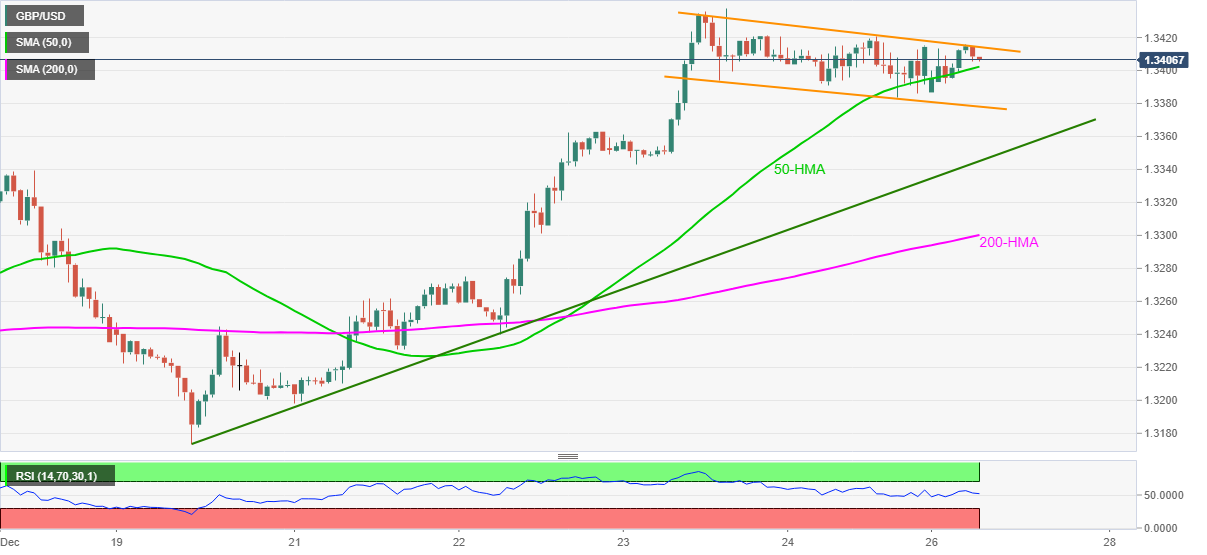
Trend: Further upside expected
The options market turns most bearish on the USD/CHF in a month, per the latest data from Reuters.
One-month risk reversal (RR) of USD/CHF, a gauge of calls to puts, snaps a four-day “zero figure” while declining the most since November 26, per Reuters. That said, the latest USD/CHF RR is -0.100 versus the -0.000 figure marked on Friday.
Although the RR suggests the market’s bearish bias, the USD/CHF prices keep the bounce off monthly low while rising for the second consecutive day, up 0.06% intraday near 0.9195 at the latest.
That said, the risk catalysts, mainly the Omicron woes and inflation chatters, direct short-term USD/CHF moves amid sluggish holiday-thinned trading sessions during the last days of 2021.
Read: US T-bond yields ease from two-week top, S&P 500 Futures defend 4,700 as Omicron, holidays play their roles
- USD/INR fades bounce off three-week low, prints mild losses on a day.
- Sustained break of 21-DMA, bearish MACD signals keep sellers hopeful.
- 100-DMA, ascending support line from September appears a tough nut to crack for sellers.
USD/INR remains pressured around a three-week low, down 0.07% intraday near 75.08 during early Monday morning in Europe.
That said, the Indian rupee (INR) pair’s failures to keep the previous day’s bounce off the 50-DMA joins bearish MACD signals and sustained trading below 21-DMA to favor the sellers.
However, a clear downside break of the 50-DMA level of 74.97 becomes necessary for the pair bears to extend the ruling. Even so, a convergence of the 100-DMA and an ascending support line from September 01, around 74.50, becomes strong support to watch during any further downside.
Also adding to the downside filters is the 61.8% Fibonacci retracement level of September-December upside, close to 74.30, followed by November’s low near 73.85.
On the contrary, recovery moves remain elusive until staying below 21-DMA level of 75.12, a break of which will direct USD/INR towards October’s peak of 75.65.
Following that, the 76.00 threshold and 76.30 may rest the pair buyers before directing them to the yearly high near 76.59.
USD/INR: Daily chart
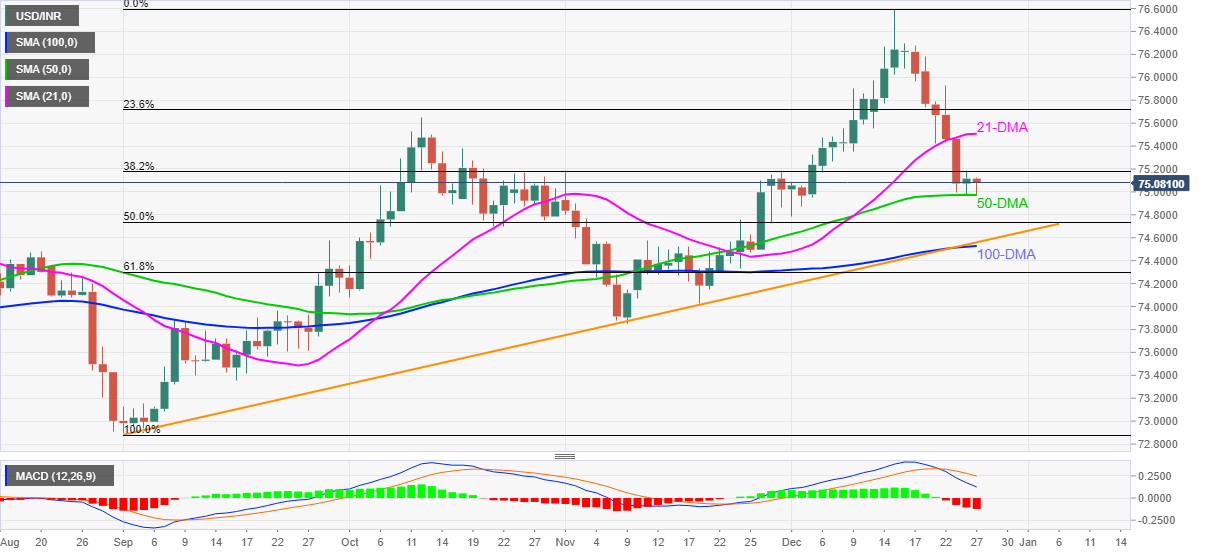
Trend: Further weakness expected
China's oil consumption is expected to peak at about 780 million tonnes per year by 2030, China National Petroleum Corp (CNPC) Economics & Technology Research Institute (ETRI) said on Sunday.
Key findings
“ETRI said diesel fuel, gasoline and kerosene consumption are forecast to peak sometime around 2025 at about 390 million tonnes per year. The strong petrochemical demand will support rising consumption through to 2030.”
“Overall oil demand will fall after 2030 as transportation consumption declines amid the electrification of vehicles while chemical demand remains stable during the period.”
“The ETRI also forecast the consumption of natural gas, a key bridge fuel during the energy transition and carbon reduction, will peak by 2040 at about 650 billion cubic metres per year.”
Related reads
- Japan offers oil from strategic reserves amid coordinated effort – Bloomberg
- WTI Price Analysis: 200-SMA pushes sellers towards $73.00
- USD/TRY is flatlined around 11.00, as bears test bullish commitments.
- Erdogan said forex 'bubble' has burst and country heading for stable summer.
- 100-DMA is the last line of defense for USD/TRY bulls, RSI stays bearish.
USD/TRY is fluctuating between gains and losses around 11.00 so far this Monday, as traders see a sense of calm after an unprecedented Christmas week for the Turkish currency.
The lira corrected sharply from all-time highs in the previous week, falling for the five straight days, courtesy of Turkey’s President Recep Tayyip Erdogan’s new economic plan to rescue the beleaguered currency.
His recent comments expressed confidence that his country was on a path to stability and the foreign exchange "bubble" had been busted.
Markets also digest comments from the country’s Treasury and Finance Minister Nureddin Nebati, as he conceded that the lira rally decimated small investors.
Holiday-thinned market conditions also leave USD/TRY ranging near recent multi-week lows of 10.24. Going forward, Turkey’s economic and political uncertainties could likely keep the lira’s recovery limited, with the greenback expected to hold firmer amid the Fed’s hawkishness.
Looking at USD/TRY’s technical chart, the spot is defending the critical 100-Daily Moving Average (DMA) support at 10.11, which is the line in the sand for bulls.
Daily closing below the latter will put the 200-DMA of 9.27 at risk. The 14-day Relative Strength Index (RSI) stays bearish below the midline, suggesting that there is more room to the downside.
On the flip side, recapturing 50-DMA at 11.59 is critical for initiating any meaningful recovery towards the 21-DMA of 13.45.
USD/TRY: Daily chart

- EUR/USD picks up bids to reverse early Asian session losses.
- France reports record covid infections, PM Macron to hold emergency meeting on Monday.
- US VP Harris stays hopeful over BBB, shows readiness to fight inflation.
- 4,500 flights canceled globally during Christmas weekend, Russia-Ukraine tension propel European gas woes.
EUR/USD grinds higher past 1.1300, picking up bids to 1.1325 during early Monday morning in Europe. In doing so, the major currency pair prints daily gains for the first time in three as the US Dollar Index (DXY) tracks downbeat T-bond yields amid a sluggish holiday period.
The US Dollar Index (DXY) drops 0.08% to 96.10 whereas the US 10-year Treasury yields dropped 1.1 basis points (bps) to 1.482%, stepping back from a two-week high flashed the previous day.
The reason could be linked to the market’s optimism concerning President Joe Biden’s Build Back Better (BBB) stimulus plan, backed by comments from US Vice President Kamala Harris, as well as hopes that the economic transition isn’t stopping due to the South African COVID-19 variant, namely Omicron. The reason could be linked to an 8.5% jump in the US retail sales during this year's holiday shopping season from Nov. 1 to Dec. 24, per Mastercard data.
It’s worth noting that previous studies showing lesser hospitalizations due to Omicron and upbeat developments at the medical front relating to the cure of the COVID-19 strain also weigh on the US Treasury yields and favor the EUR/USD prices.
However, a jump in the covid infections in France, which reported the all-time high daily infections during the weekend and a doubled rate of the covid-linked hospitalization in the last month, challenge the EUR/USD buyers. Also, the average number of new US coronavirus cases has risen 45% to 179,000 per day over the past week, per Reuters tally. The worsening of the virus conditions resulted in multiple travel bans during the holiday season and the same resulted in the 4,500 flight cancellations, per the report shared by Reuters.
Elsewhere, escalating geopolitical tension between Russia and the West, mainly with Europe, weigh on European gas supplies as Reuters quote data from German network operator Gascade to say, “The Yamal-Europe pipeline that usually delivers Russian gas to Western Europe was sending the fuel back to Poland for a sixth straight day on Sunday.”
Above all, holiday-thinned markets seem to care little for the risk-off mood amid a lack of major data/events, which in turn allows the EUR/USD to consolidate the yearly losses.
Moving on, comments from French President Emmanuel Macron and Dallas Fed Manufacturing Index for December, expected 13.2 versus 11.8 prior, may offer intermediate clues to the EUR/USD pair. it’s worth observing that the ECB v/s Fed battle can keep the EUR/USD pressured unless any surprises erupt, which is less likely during the rest of 2021.
Technical analysis
EUR/USD bounced off the 200-SMA on the four-hour chart, near 1.1305, the previous day but the virus-led market fears seem to weigh on the quote, joined by bearish MACD signals and multiple pullbacks below a downwards sloping trend line from November 30. Even so, a confluence of the 100-SMA and 50-SMA, around 1.1290-95, becomes a tough nut to crack for the pair sellers before targeting 1.1260 and the monthly low surrounding 1.1260.
Meanwhile, recovery moves remain elusive until staying under the stated resistance line, close to 1.1350 at the latest.
The Japanese Trade Ministry announced on Monday that the country is releasing oil from its national reserves in a coordinated effort with other nations to contain prices, per Bloomberg.
Key takeaways
“A government tender offered Oman crude from the strategic reserves in Shibushi for delivery between March and June.”
“The tender didn’t specify a volume, give a reason for the sale, or confirm it was part of a US-led initiative.”
This comes after Japan’s Trade Minister Koichi Hagiuda said last month that Japan would conduct the release as it replaces oil in its stockpiles.
Market reaction
Amid quiet markets and above headlines, WTI is trading under pressure just above the $73 mark, as of writing.
- USD/CAD refreshes intraday low, fades bounce off one-week low marked the previous day.
- RSI retreat, sustained trading below previous support line, SMAs keep sellers hopeful.
- 50% Fibonacci retracement limits immediate downside, 200-HMA acts as additional resistance.
USD/CAD sellers attack 1.2800, down 0.06% intraday near 1.2807 during early Monday. In doing so, the Loonie pair stretches the previous day’s pullback from 50-HMA amid RSI retreat.
Also favoring the bears is the quote’s sustained trading below the 200-HMA and previous support line from December 08.
That said, 50% Fibonacci retracement (Fibo.) of December 08-20 upside, near 1.2785 lures intraday sellers ahead of the mid-December’s swing low near 1.2760.
Adding to the downside filters is the 61.8% Fibo. level surrounding 1.2745 and the 1.2720-25 region.
Meanwhile, an upside clearance of the 50-HMA level of 1.2820 will aim for the 200-HMA level, at 1.2858 by the press time.
Even if the quote rises past 1.2858, the previous support line close to 1.2925 and the monthly peak of 1.2964, also the highest level in 2021, will challenge the USD/CAD buyers.
USD/CAD: Hourly chart
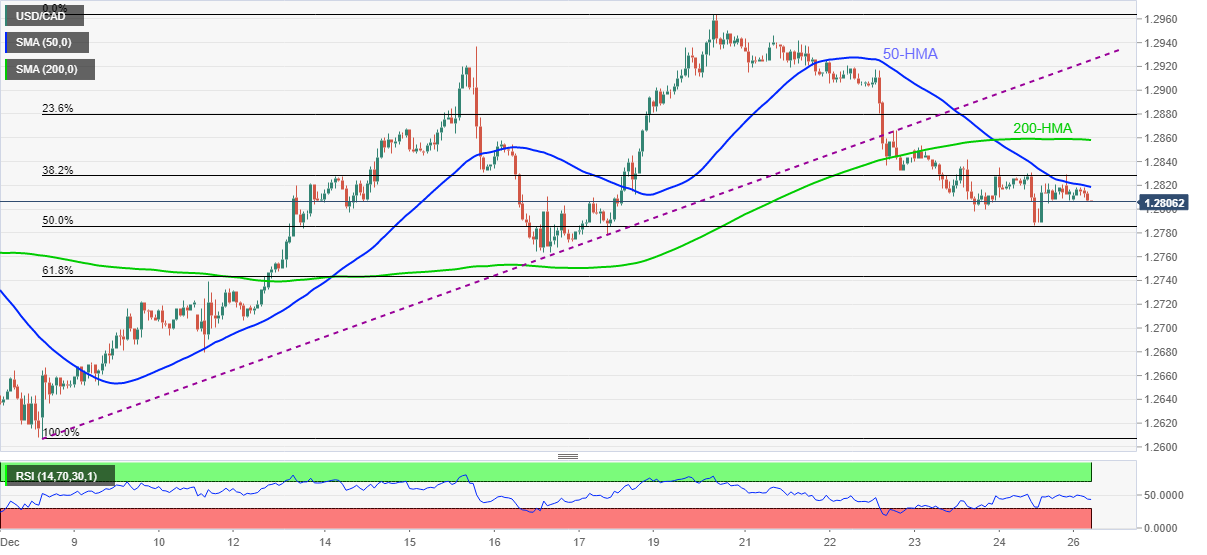
Trend: Further weakness expected
- US 10-year Treasury yields retreat from a fortnight high, S&P 500 Futures print mild gains.
- Omicron woes battle stimulus hopes, holiday season amid a sluggish session.
- Off in New Zealand, Australia, Canada and the UK add to the market’s inaction.
Risk sentiment dwindles during early Monday as global traders cheer the holiday mood during the final days of 2021.
In doing so, the market participants ignore recently escalating numbers of the South African COVID-19 variant, namely Omicron. The reason could be linked to the mixed updates over the US President Joe Biden’s Build Back Better (BBB) plan and geopolitical concerns surrounding Russia and Ukraine, not to forget upbeat retail sales figures from the US.
That said, the benchmark US 10-year Treasury yields dropped 1.1 basis points (bps) to 1.482%, stepping back from a two-week high flashed the previous day. On the contrary, the S&P 500 Futures rise 0.11% intraday around 4,720 by the press time.
The average number of new US coronavirus cases has risen 45% to 179,000 per day over the past week, per Reuters tally whereas the UK and France reported a fresh high of Covid-19 daily infections, respectively crossing 122,000 and 94,000 daily cases at the latest. Elsewhere, China reported 206 new COVID-19 cases for December 25 versus 140 the previous day while Australia’s most populous state New South Wales (NSW) unfortunately reported a new high in coronavirus infections, to 6,394, while ABC news cites 36% fall in tests.
The Omicron woes resulted in the cancellations of over 4,500 flights during the Christmas weekend. However, global policymakers remain hopeful to overcome the pandemic amid promising studies showing lesser hospitalizations.
Further, geopolitical Russia and Ukraine also gain the market’s attention after Moscow withdraw 10,000 tops from the border with Kyiv during Christmas. The TASS news agency also reported that Russia has received a NATO (North Atlantic Treaty Organization) proposal to commence talks on Moscow's security concerns on Jan. 12 and is considering it. Though, the pressure global policymakers trying to exert on Russia seems to fail to placate the tension.
Elsewhere, US Vice President Kamala Harris sounds hopeful over the passage of President Biden’s BBB stimulus plan despite Senator Joe Manchin’s rejection, while speaking on the CBS interview. Though, US VP Harris also cited inflation fears and showed readiness to tame them, which in turn favors the Fed’s hawkish view and underpin the market fears.
Additionally, a report from Mastercard, shared by Reuters, shows that the US retail sales rose 8.5% during this year's holiday shopping season from Nov. 1 to Dec. 24.
Looking forward, an off in major markets and the year-end holiday mood will restrict the momentum but US Dallas Fed Manufacturing Index for December, expected 13.2 versus 11.8 prior, may offer intermediate moves.
| Raw materials | Closed | Change, % |
|---|---|---|
| Brent | 75.56 | -1 |
- AUD/USD picks up bids to reverse early Asian losses, grinds around monthly top.
- Bulls eye another battle with resistance line from November 30, overbought RSI, bearish MACD test upside momentum.
AUD/USD refreshes intraday top near 0.7235, filling the week-start gap during early Monday.
In doing so, the Aussie pair again braces for the monthly upward sloping trend line resistance while keeping the sustained break above the key SMAs, namely the 200 and 10 ones.
It should be noted, however, as the MACD teases bears and RSI flirts with the overbought territory, which in turn hints at the limited upside exposure.
That said, a pullback towards the 200-SMA level surrounding 0.7180 and then to 100-SMA near 0.7135 can’t be ruled out. However, bears may wait for a clear break of horizontal support from November 30, close to 0.7090, for confirmation before challenging the yearly low of 0.6993.
On the flip side, an upside clearance of the stated resistance line, around 0.7255, will need validation from a November 12 low of 0.7274 before pulling the trigger for 0.7370.
AUD/USD: Four-hour chart
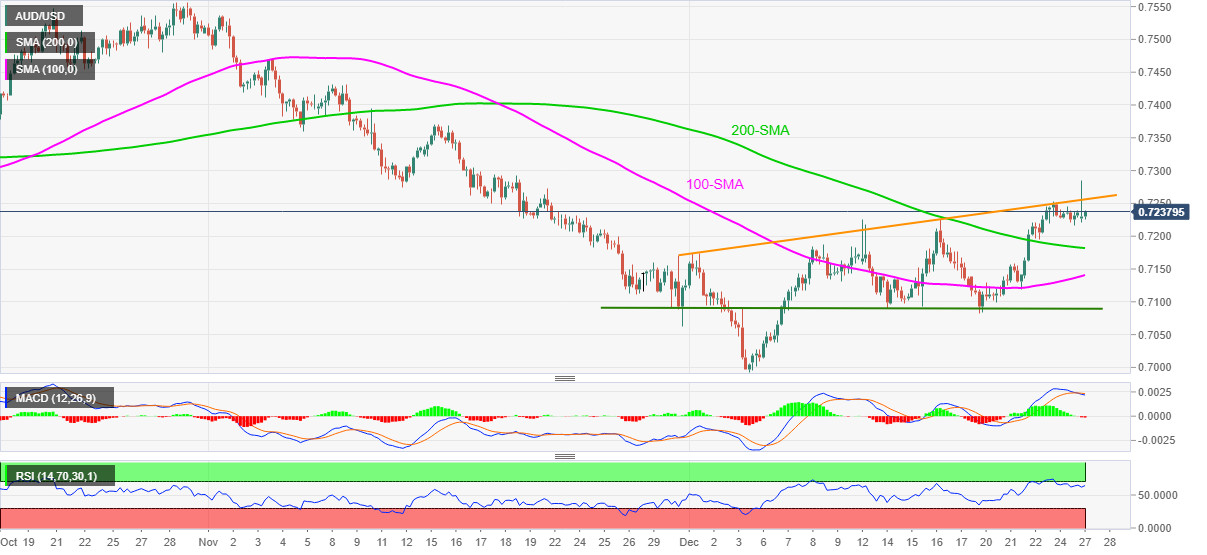
Trend: Limited upside expected
- NZD/USD fades bounce off intraday lows during a sluggish Asian session.
- China reports downbeat Industrial Profits, Omicron woes escalate.
- US T-bond yields weigh on DXY, US retail sales jump in holiday season.
- Holidays in New Zealand, UK, Canada and Australia restrict market moves.
NZD/USD struggles to defend the 0.6800 threshold, sluggish near 0.6820 during early Monday. In addition to the Boxing Day holiday in New Zealand, mixed updates over Omicron and geopolitics also challenge the Kiwi pair traders during the final days of 2021.
Among the negatives were fears of the covid infections and inflation. On the contrary, the positives include hopes of US stimulus and firmer US retail sales, not to forget global studies showing lesser odds of hospitalization due to the South African COVID-19 variant, namely Omicron.
China reported 206 new COVID-19 cases for December 25 versus 140 the previous day while New Zealand reported 34 cases for the day. Further, Australia’s most populous state New South Wales (NSW) unfortunately reported a new high in coronavirus infections, to 6,394, while ABC news cites a 36% fall in tests. Elsewhere, the average number of new US coronavirus cases has risen 45% to 179,000 per day over the past week, per Reuters tally whereas the UK and France reported a fresh high of Covid-19 daily infections, respectively crossing 122,000 and 94,000 daily cases at the latest.
In addition to the jump in cases, which led to cancellations of over 4,500 flights during the Christmas weekend, escalating tensions between Russia and Ukraine also weigh on the sentiment. Furthermore, US Vice President Kamala Harris’ comments citing inflation fears also weigh on the sentiment, as well as the NZD/USD prices.
On the contrary, US VP Harris sounds optimistic about getting President Joe Biden’s Build Back Better (BBB) plan despite the latest challenges raised by Senator Joe Manchin. On the same line were the receding fears of Omicron, mainly due to positive developments concerning the virus cure and studies showing less hospitalization due to the South African COVID-19 variant, also keep the NZD/USD buyers hopeful.
Against this backdrop, the US 10-year Treasury yields remain pressured around 1.48% whereas the S&P 500 Futures print mild gains at the latest.
It’s worth noting that downbeat prints of China’s Industrial Profit for November, 38.2% YTD and 9.0% YoY versus 42.2% and 24.60% respectively, exert additional downside pressure on the NZD/USD prices.
Moving on, the US Dallas Fed Manufacturing Index for December, expected 13.2 versus 11.8 prior, may offer intermediate moves to the NZD/USD prices, in addition to the risk catalysts, during a likely sluggish session.
Technical analysis
Despite the latest pullback, NZD/USD pair’s successful run-up beyond 20-DMA, backed by bullish MACD and steady RSI, favors the Kiwi pair buyers. However, a daily close beyond a three-month-old horizontal area, near 0.6855-60, puts a cap on the short-term advances.
Should the NZD/USD bulls manage to cross the stated key hurdle, 100-DMA and early October swing high near 0.6990 will be in the spotlight. On the contrary, a downside break of the 20-DMA, around 0.6785, won’t hesitate to challenge the yearly low of 0.6701.
- DXY fades bounce off monthly support line below 21-DMA.
- Downbeat Momentum, sustained break of two-month-old previous support line favor sellers.
- Two-week-old descending trend line adds to the upside filters.
US Dollar Index (DXY) remains on the back foot around 96.10, down 0.06% intraday, during early Monday.
The greenback gauge bounced off a one-week low the previous day while taking a U-turn from an upward sloping support line from November 30. However, the rebound couldn’t cross the immediate upside hurdle, namely the 21-DMA, which in turn joins the downbeat Momentum line to keep bears hopeful.
Adding to the bearish bias is the DXY’s sustained trading below the support-turned-resistance line from late October, as well as a descending trend line from December 15.
That said, a clear downside break of the immediate support line, near 96.00, becomes necessary for the US Dollar Index bears before eyeing the 38.2% Fibonacci retracement of October-November upside, near 95.53.
Alternatively, an upside clearance of the 21-DMA level of 96.21 will trigger short-term advances towards the fortnight-long resistance line near 96.40.
However, the previous support line and the last month’s top, respectively around 96.50 and the 97.00 threshold, will be tough nuts to crack for the DXY bulls.
DXY: Daily chart
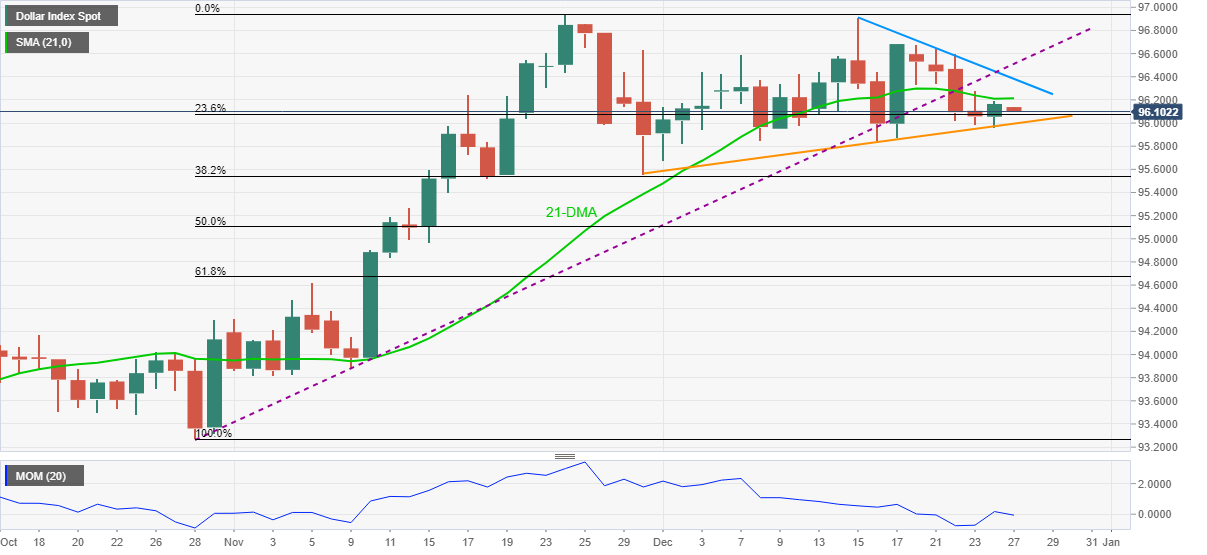
Trend: Further weakness expected
| Time | Country | Event | Period | Previous value | Forecast |
|---|---|---|---|---|---|
| 23:30 (GMT) | Japan | Unemployment Rate | November | 2.7% | 2.7% |
| 23:50 (GMT) | Japan | Industrial Production (MoM) | November | 1.8% | 4.8% |
| 23:50 (GMT) | Japan | Industrial Production (YoY) | November | -4.1% |
The People’s Bank of China (PBOC) set the USD/CNY reference rate at 6.3686 on Monday when compared to the previous fix and the previous close at 6.3692 and 6.3672 respectively.
In addition to the daily fix, Reuters also came out with the PBOC market actions while saying, "With 10 billion yuan worth of reverse repos maturing on Monday, China central bank injects 40 billion yuan on a net basis on the day."
- USD/JPY takes rounds to monthly high, bounces off intraday low.
- Japan Retail Trade rose 1.9% in October, versus 1.7% consensus.
- BOJ Summary of Opinions showed policymakers discussed inflationary pressure.
- Holiday season, mixed clues over Omicron and light calendar to limit market moves.
USD/JPY struggles for a clear direction during the initial Tokyo trading on Monday. In doing so, the yen pair portray the holiday mood at the desks while also paying a little attention to the domestic catalysts.
Japan’s Retail Trade for October grew past 1.7% market forecasts and 0.9% YoY prior to 1.9% while the seasonally adjusted figures grew to 1.2% versus 0.5% expected and downwardly revised 1.0% prior. It’s worth noting that Large Retailer Sales rose 1.4% against 0.0% consensus and 0.9% previous readouts during the stated month.
In addition to the Japanese data, the Bank of Japan’s (BOJ) latest Summary of Opinions was also released and was ignored by the USD/JPY traders. “Bank of Japan policymakers discussed recent rising inflationary pressures that could force them to alter their view the country remained vulnerable to the risk of deflation,” per the latest report shared via Reuters.
“In the next quarterly report due in January, it's necessary to examine whether the current assessment - that risks to prices are skewed to the downside - remains appropriate,” adds BOJ Summary of Opinions.
Elsewhere, Japan government shares upbeat employment reports concerning college graduates. “A total of 74.2 percent of those who graduated from college in Japan this March found jobs, down 3.5 percentage points from the previous year for the second straight yearly fall amid the coronavirus pandemic, according to government data,” said Kyodo News.
A mixed play of the risk catalysts and an absence of major traders due to the year-end holidays seem to have restricted the immediate USD/JPY moves. That said, the Omicron-linked fears battle optimism about overcoming the pandemic and recently firmer US data to challenge the USD/JPY traders.
That said, the average number of new US coronavirus cases has risen 45% to 179,000 per day over the past week, per Reuters tally whereas the UK and France reported a fresh high of Covid-19 daily infections, respectively crossing 122,000 and 94,000 daily cases at the latest.
On the positive side, a report from Mastercard, shared by Reuters, shows that the US retail sales rose 8.5% during this year's holiday shopping season from Nov. 1 to Dec. 24. Furthermore, US VP Harris sounds optimistic about getting President Joe Biden’s Build Back Better (BBB) plan despite the latest challenges raised by Senator Joe Manchin. Goldman Sachs raised doubt on the issue while saying, “While Congress is likely to approve some new spending on manufacturing and supply chain-related incentives, we no longer expect the Senate to pass the Build Back Better bill and the near-term spending it includes on the extension of the expanded child tax credit." Additionally, receding fears of Omicron, mainly due to positive developments concerning the virus cure and studies showing less hospitalization due to the South African COVID-19 variant, also keep the USD/JPY buyers hopeful.
Amid these plays, the US 10-year Treasury yields remain pressured around 1.48% whereas the S&P 500 Futures print mild gains by the press time.
Looking forward, US Dallas Fed Manufacturing Index for December, expected 13.2 versus 11.8 prior, may offer intermediate moves to the USD/JPY prices, in addition to the risk catalysts, during a likely sluggish session.
Technical analysis
Although a monthly resistance line guards short-term USD/JPY advances around 114.50, buyers remain hopeful until the quote stays beyond the 50-DMA level of 113.88.
- WTI remains pressured around monthly high, prints biggest daily loss in a week.
- Overbought RSI, failures to cross 200-SMA favor sellers.
- 50% Fibonacci retracement level, previous resistance line challenge bears.
WTI crude oil prices stay below 200-SMA, down 0.50% intraday around $73.30 during Monday’s Asian session. In doing so, the black gold teases 50% Fibonacci retracement (Fibo.) of November 09 to December 10 declines.
Given the receding bullish bias of MACD and overbought RSI, not to forget the quote’s failures to cross the 200-SMA, oil prices are likely to remain pressured towards the $73.00 threshold, also comprising the stated Fibo. level.
It should be noted, however, that the 38.2% Fibonacci retracement and the previous resistance line from early November, respectively around $70.50 and $69.70, will challenge the WTI bears afterward.
Alternatively, a clear upside break of the 200-SMA level of $73.40 will need validation from the monthly high of $73.85 before eyeing the 61.8% Fibo. level near $75.50.
During the commodity’s strength past $75.50, the late November’s high near $79.00 will be in focus.
WTI: Four-hour chart
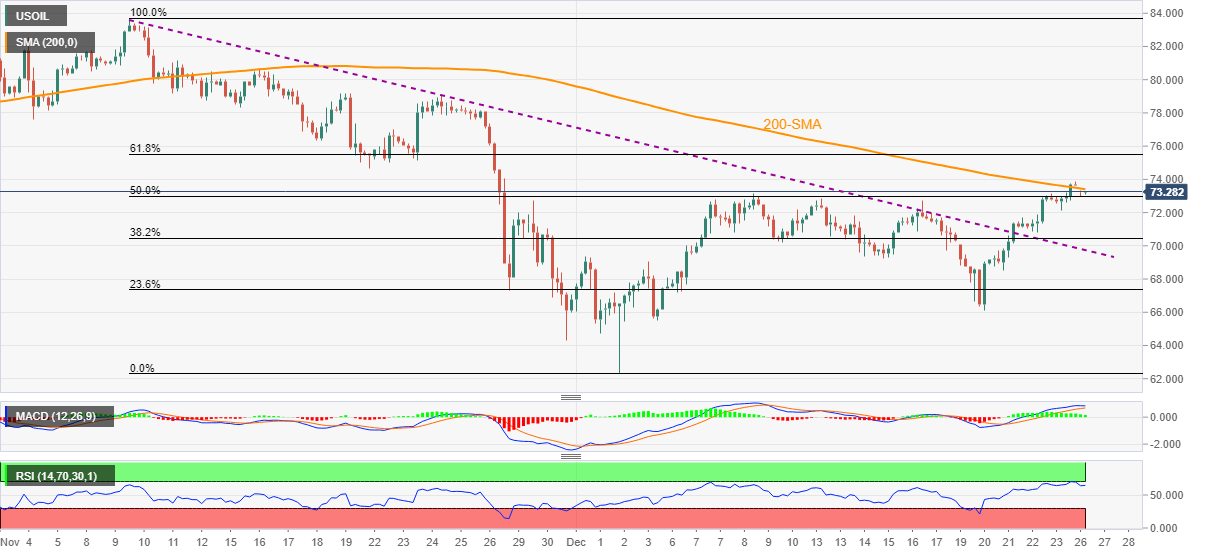
Trend: Further weakness expected
- Gold begins the week on a back foot, stays near the monthly high.
- Omicron woes weigh on holiday season, 4,500 flights canceled globally.
- US VP Harris sounds hopeful over BBB passage, US retail sales jump 8.5% during holiday season.
- Gold 2022 Outlook: Correlation with US T-bond yields to drive yellow metal
Gold (XAU/USD) struggles to defend the $1,800 threshold amid a sluggish Asian session on Monday. The yellow metal witnessed a lackluster session the previous day amid an offer in multiple global markets. However, the recent escalation in the virus fears, coupled with the geopolitical headlines, challenge gold buyers of late.
While the coronavirus cases jumped in the West and recalled major activity restrictions despite the holiday season, fears of the faster spread of the COVID-19 variant linked to South Africa, dubbed as Omicron, add to the market fears and weigh on gold prices. The average number of new US coronavirus cases has risen 45% to 179,000 per day over the past week, per Reuters tally whereas the UK and France reported a fresh high of Covid-19 daily infections, respectively crossing 122,000 and 94,000 daily cases at the latest.
The jump in the covid cases also brings the travel restrictions and limited activity during an otherwise heavy-spending time of the year. “Commercial airlines around the world canceled more than 4,500 flights over the Christmas weekend, as a mounting wave of COVID-19 infections driven by the Omicron variant created greater uncertainty and misery for holiday travelers,” mentioned Reuters.
On a different page, Russia-Ukraine tussles couldn’t benefit from Moscow’s withdrawal of 10,000 tops from drill near Kyiv, term as Christmas de-escalation by The Guardian. While US Vice President Kamala Harris said on the CBS interview that the US and Russia are in talks about Ukraine, German officials will hold a meeting with their Russian counterpart for the same on Monday.
It’s worth noting that studies showing lesser hospitalization due to Omicron and upbeat spending in the US keep the gold buyers hopeful. A report from Mastercard, shared by Reuters, shows that the US retail sales rose 8.5% during this year's holiday shopping season from Nov. 1 to Dec. 24.
Also positive for gold was US Vice President Harris’ optimism over getting President Joe Biden’s Build Back Better (BBB) plan despite the latest challenges raised by Senator Joe Manchin. Goldman Sachs raised doubt on the issue while saying, “While Congress is likely to approve some new spending on manufacturing and supply chain-related incentives, we no longer expect the Senate to pass the Build Back Better bill and the near-term spending it includes on the extension of the expanded child tax credit"
Amid these plays, the US 10-year Treasury yields remain pressured around 1.48% whereas S&P 500 Futures rise 0.20% intraday gains at the latest.
Moving on, a light calendar in the US, with only Dallas Fed Manufacturing Index for December, expected 13.2 versus 11.8 prior, could restrict short-term gold price moves.
Technical analysis
A clear run-up beyond 200-DMA keeps gold buyers hopeful to overcome a two-month-old horizontal hurdle surrounding $1,814-16 despite the holiday mood.
Following that, double-tops marked during July and September around $1,834 should return to the chart before the $1,850 threshold could challenge the bulls eyeing to cross November’s peak of $1,877.
Meanwhile, an ascending support line from August, around $1,778, adds to the downside filters below the 200-DMA level of $1,797.
In a case where gold bears remain dominant past $1,778, the $1,758 level may offer an intermediate halt before dragging the quote towards September’s low of $1,721 and the $1,700 round figure.
To sum up, gold prices grind higher but have a bumpy road to the north.
Gold: Daily chart
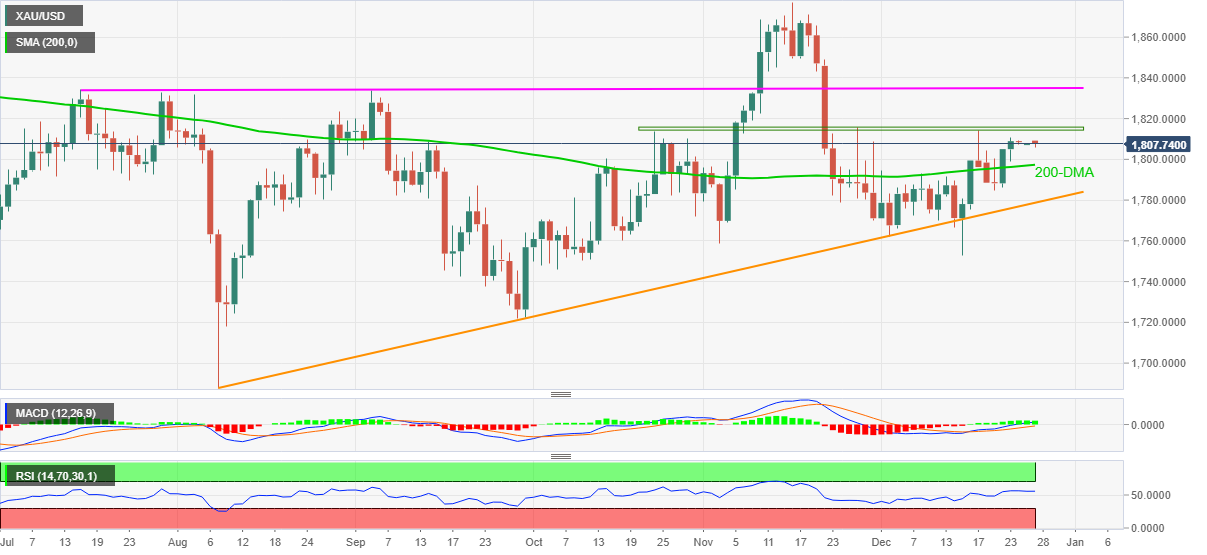
Trend: Further upside expected
| Pare | Closed | Change, % |
|---|---|---|
| AUDUSD | 0.72186 | -0.33 |
| EURJPY | 129.336 | -0.17 |
| EURUSD | 1.13143 | -0.07 |
| GBPJPY | 153.079 | -0.14 |
| GBPUSD | 1.33899 | -0.11 |
| NZDUSD | 0.68118 | -0.19 |
| USDCAD | 1.28147 | 0.07 |
| USDCHF | 0.91894 | 0.14 |
| USDJPY | 114.339 | -0.04 |


© 2000-2026. Sva prava zaštićena.
Sajt je vlasništvo kompanije Teletrade D.J. LLC 2351 LLC 2022 (Euro House, Richmond Hill Road, Kingstown, VC0100, St. Vincent and the Grenadines).
Svi podaci koji se nalaze na sajtu ne predstavljaju osnovu za donošenje investicionih odluka, već su informativnog karaktera.
The company does not serve or provide services to customers who are residents of the US, Canada, Iran, The Democratic People's Republic of Korea, Yemen and FATF blacklisted countries.
Izvršenje trgovinskih operacija sa finansijskim instrumentima upotrebom marginalne trgovine pruža velike mogućnosti i omogućava investitorima ostvarivanje visokih prihoda. Međutim, takav vid trgovine povezan je sa potencijalno visokim nivoom rizika od gubitka sredstava. Проведение торговых операций на финанcовых рынках c маржинальными финанcовыми инcтрументами открывает широкие возможноcти, и позволяет инвеcторам, готовым пойти на риcк, получать выcокую прибыль, но при этом неcет в cебе потенциально выcокий уровень риcка получения убытков. Iz tog razloga je pre započinjanja trgovine potrebno odlučiti o izboru odgovarajuće investicione strategije, uzimajući u obzir raspoložive resurse.
Upotreba informacija: U slučaju potpunog ili delimičnog preuzimanja i daljeg korišćenja materijala koji se nalazi na sajtu, potrebno je navesti link odgovarajuće stranice na sajtu kompanije TeleTrade-a kao izvora informacija. Upotreba materijala na internetu mora biti praćena hiper linkom do web stranice teletrade.org. Automatski uvoz materijala i informacija sa stranice je zabranjen.
Ako imate bilo kakvih pitanja, obratite nam se pr@teletrade.global.
транcфери