- Analytics
- News and Tools
- Market News
CFD Markets News and Forecasts — 07-12-2021
- GBP/USD consolidates recent losses, picks up bids around yearly low.
- Bearish chart pattern, absence of oversold RSI keep sellers hopeful.
- Key SMAs, monthly resistance line adds to the upside filters.
GBP/USD grinds lower despite picking up bids to 1.3250 during Wednesday’s Asian session.
The cable pair remains pressured for the last one week around the 20221 bottom. In doing so, it forms a bearish chart pattern called pennant and keeps the sellers hopeful. Also favoring the bears is an absence of the oversold RSI.
However, a clear downside break of 1.3220 becomes necessary for the GBP/USD sellers to aim for the theoretical target surrounding 1.2900.
During the fall, the yearly low near 1.3190 and the 1.3000 psychological magnet will act as intermediate halts.
Meanwhile, 50-SMA adds strength to the pennant’s resistance line, around 1.3290, to challenge the recovery moves.
Even if the quote rises past 1.3290, a convergence of the 100-SMA and one-month-old descending trend line near 1.3350 will be a tough nut to crack for the GBP/USD buyers.
To sum up, GBP/USD bears keep reins and await a clear break of 1.3220 for further dominance.
GBP/USD: Four-hour chart
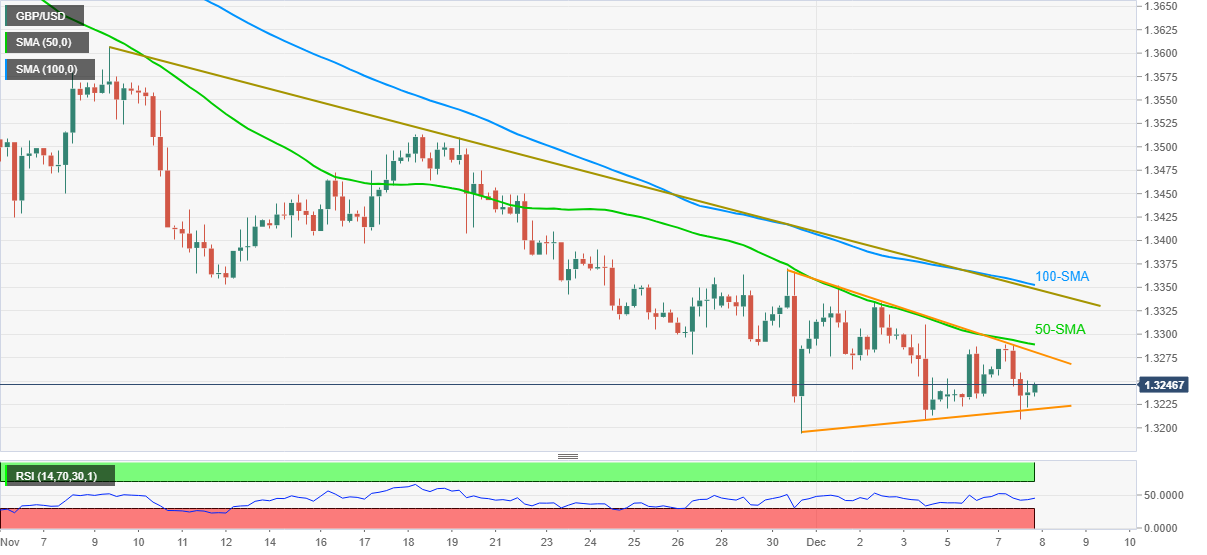
Trend: Bearish
- USD/CAD stays pressured near 12-day low after declining the most since late August.
- Oil retreats from weekly top despite price-positive EIA inventories.
- Risk-on mood, expectations of hawkish halt from BOC favor bears.
- Virus updates, China news are also important, US inflation is the key.
USD/CAD remains on the back foot around 1.2650, following the heavy fall to refresh a two-week low. That said, the quote seesaws of late as Asian traders brace for Wednesday’s Bank of Canada (BOC) Interest Rate Decision.
The Loonie pair dropped the most since August 23 on Tuesday as risk-on mood joins upbeat prices of Canada’s main export WTI crude oil.
Market sentiment improved amid receding fears of the South African coronavirus variant, dubbed as Omicron, as well as hopes of more stimulus from China after Beijing pledged to safeguard the financial system. Adding to the risk-on mood could be mixed data from the US and an absence of Fedspeak ahead of next week Federal Reserve (Fed) monetary policy meeting.
WTI cheered upward revision to 2022 demand forecast by the US Energy Information Administration (EIA) and growing tension between Russia and Ukraine. As per Reuters, “The Biden administration is in ‘intensive consultations’ with the new German government over its response if Russia invades Ukraine and believes Germany would be ready to take significant action if Russia launches an attack, a senior U.S. State Department official said on Tuesday.”
Elsewhere, firmer prints of Canada’s International Merchandise Trade for October and Ivey Purchasing Managers Index for November add to the Canadian dollar’s (CAD) strength.
Amid these plays, the US 10-year Treasury yields remained firmer the previous day while Wall Street benchmarks also had a good day for bulls.
Moving on, USD/CAD traders will pay close attention to how the BOC hints at the possible rate hike after the bond purchases were ended in October. That said, the benchmark interest rate is likely to remain unchanged at 0.25%.
“The BoC will maintain that the outlook is evolving in line with the October MPR, and we expect it to repeat that inflation strength is largely transitory,” said TD Securities ahead of the event.
Technical analysis
A clear downside break of 20-DMA level of 1.2680 and an ascending support line from November 16, now resistance around 1.2790, directs USD/CAD bears toward an upward sloping trend line from late October, near 1.2570.
As per the latest report from Reuters Tankan Survey, “Japanese manufacturers' business confidence index rose to a four-month high in December as supply constraints began to ease.”
The sentiment poll adds, “offering policymakers some hope the economy was headed for a moderate recovery.”
Key quotes
The monthly poll, which tracks the Bank of Japan's (BOJ) closely watched Tankan quarterly survey next due on Dec. 13, showed the manufacturers' sentiment index improved to 22 in December, following three straight months of declines to 13 in November. That compared with a reading of 18 in the BOJ's latest October survey.
Sentiment among non-manufacturers also improved in December, suggesting consumption was gradually recovering after the lifting of social curbs by end-September to contain the spread of coronavirus cases.
On outlook, both manufacturers and services companies were more optimistic, with the three-month forward index among manufacturers rising to 26 from 19 and for services companies to 21 from 15.
FX reaction
USD/JPY retreats from weekly top to 113.55 during the pre-Tokyo open trading amid Wednesday’s Asian session. The yen pair previously cheered the risk-on mood but the firmer US dollar challenges buyers of late.
Read: USD/JPY bears are moving in as the US dollar grows weary
- The NZD/USD begins the Asian session in the right foot, up some 0.46%.
- A candlestick morning-star formation in the daily chart opens the door for 0.6900.
The NZD/USD bounced off year-to-date lows, is rising as the Asian session begins, trading at 0.6789 during the day at the time of writing. On Tuesday in the overnight session, the NZD/USD pair dipped as low as 0.6736, then rallied on the back of positive omicron COVID-19 news, up to high 0.6770s. Then, through the rest of the day, the pair advanced steadily, leaving behind the 50 and the 100-hour simple moving average (SMA), below the spot price, but the upside move stalled around the R3 daily pivot point around 0.6784.
NZD/USD Price Forecast: Technical outlook
Daily chart
The NZD/USD chart depicts the pair has a downward bias after posting losses on 11 of the last 13 days. Furthermore, the 50-day moving average (DMA) crossed below the 100-DMA, leaving the DMA’s correctly positioned in bearish order with the 200 on top and the 50-DMA on the bottom. Nevertheless, as shown by the candlesticks, the price action of the last three days is forming a morning star, a chart pattern with bullish implications that would need another bullish candle to confirm its validity.
Hence, the bias in the near term is tilted to the upside. The first resistance would be 0.6800. The breach of the latter exposes crucial resistance levels, with the September 28 cycle low-turned-resistance at 0.6859, followed by the figure at 0.6900.
-637745129811412987.png)
1-hour chart
The NZD/USD broke to the upside of the 100-hour simple moving average (SMA) in the last four hours but stalled around 0.6785. As previously mentioned, the 50 and the 100-hour SMA’s lie below the spot price, so the upward bias is in place, but a break above the 200-hour SMA at 0.6802, could pave the way for further gains.
The first resistance on the way up would be the confluence of the 200-hour SMA and the R1 Wednesday’s daily pivot at 0.6806. A break above that level would expose the R2 pivot at 0.6827, followed by the R3 daily pivot at 0.6862.
-637745131577396817.png)
- WTI retreats from weekly high, prints mild gains as Asian session picks up.
- Upbeat sentiment, doubts over OPEC+ verdict favored oil buyers but firmer USD, EIA news probe advances.
- API Weekly Crude Oil Stock dropped more than -0.747M.
- EIA data, risk catalysts eyed, US inflation, China and Omicron are the key.
WTI crude oil prices ease from a weekly high to $71.50 after a two-day run-up, marking 0.40% intraday gains during early Wednesday morning in Asia. The black gold’s latest pullback part ways from the lesser-than-previous private oil stocks change figures from the American Petroleum Institute (API).
As per the latest API Weekly Crude Oil Stocks data for the period ended on December 03, the inventories shrank 3.089M versus the previous depletion of 0.747M.
The commodity prices jumped to more than a week’s high the previous day as the market’s risk appetite improved amid receding fears of the South African coronavirus variant, dubbed as Omicron. Adding to the market’s risk-on mood were hopes of China’s additional monetary policy easing after the People’s Bank of China’s (PBOC) Reserve Ratio Requirement (RRR) cut.
Furthermore, the US Energy Information Administration (EIA) energy demand forecast and firmer equities, not to forget the geopolitical tensions in the Middle East, could be cited as additional catalysts behind the commodity’s strength.
In the latest monthly Short-Term Energy Outlook (STEO) report, the EIA raised its forecast for 2022 world oil demand growth by 200K barrels per day (BPD) on Tuesday, and now demand growing 3.55M BPD YoY next year. The EIA STEO cut its forecast for 2021 world oil demand growth by 10K BPD to a 5.1M BPD YoY increase. Moving on, S&P 500 posted the biggest daily gains since March whereas Iran still refrains to abide by the nuclear deal.
Additionally, the US thinks over plans to manage the oil flows if Russia attacks Ukraine and the same fuel the oil prices. "The Biden administration is in 'intensive consultations' with the new German government over its response if Russia invades Ukraine and believes Germany would be ready to take significant action if Russia launches an attack, a senior U.S. State Department official said on Tuesday," per Reuters.
It’s worth noting, however, that the recently escalated tussles between the US and China join firmer US Treasury yields to challenge the oil prices.
Looking forward, weekly official oil inventory data from the US Energy Information Administration (EIA), -0.91M prior, will be important for fresh direction. Also on the radars will be macros from China and Omicron updates. However, more important will be Friday’s US Consumer Price Index (CPI) and the next week’s Fed meeting.
Technical analysis
A clear upside break of 200-DMA, around $70.00 by the press time, directs WTI crude oil prices towards a five-month-old horizontal resistance of around $74.80.
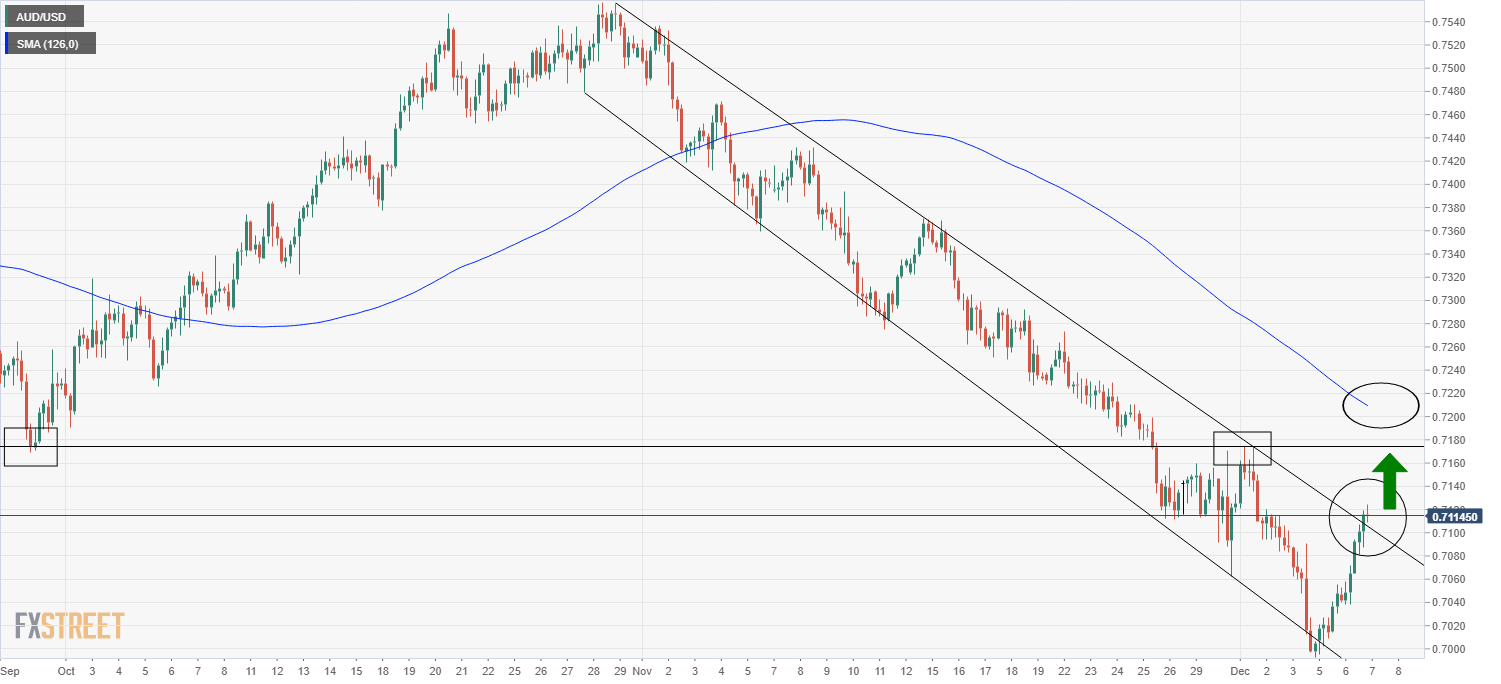
- AUD/USD is making its way through critical volumes towards 0.7025 breakout territory.
- Bulls are moving in on resistance in solid correction.
AUD/USD has been correcting in the wake of a positive risk environment this week. The pair is now loving in on critical resistance, piecing it in recent trade. This would now be expected to act as support for the forthcoming sessions.
AUD/USD H1 chart
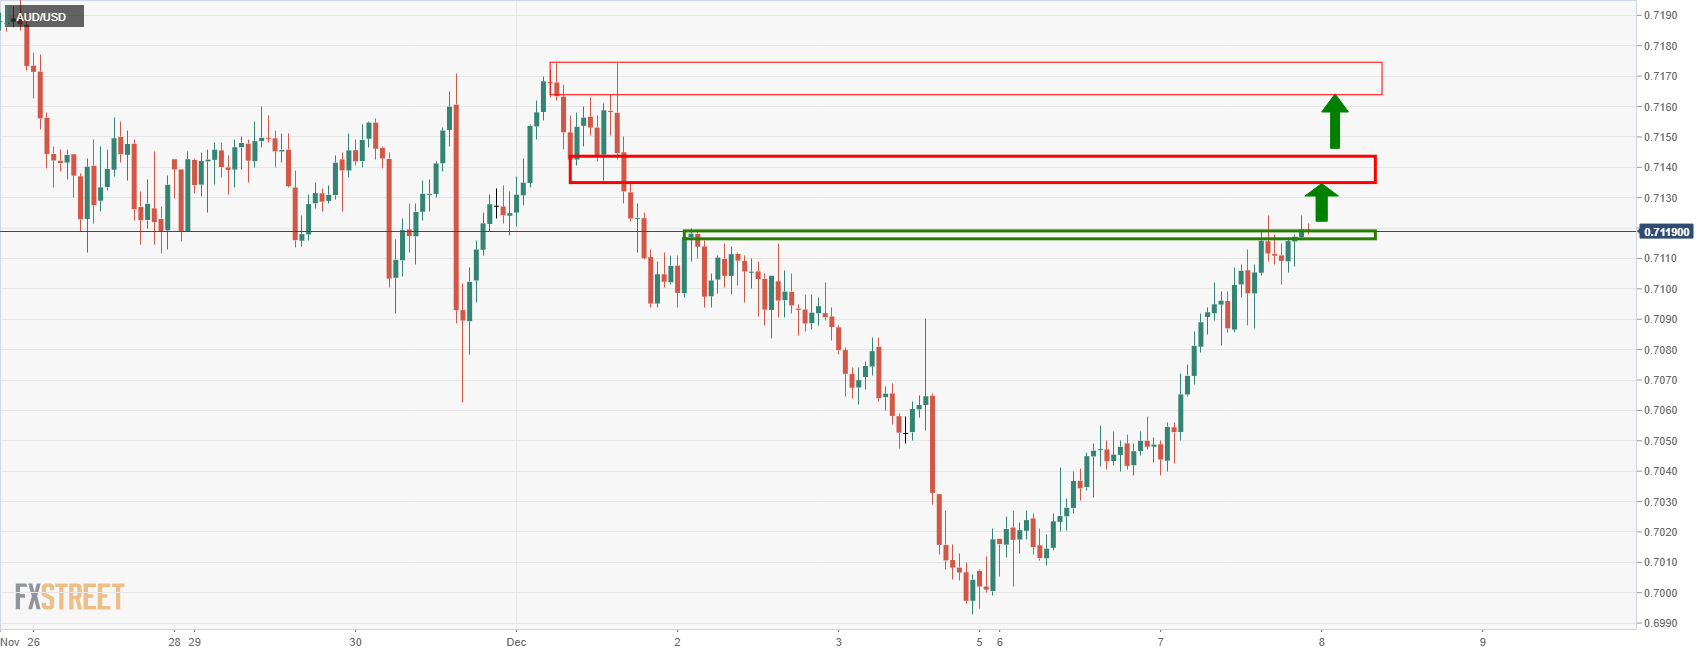
The bulls are engaging in this area and will likely push for a test to the midpoint of the 0.71 area. If this is broken, then 0.7180 will be the next likely target.
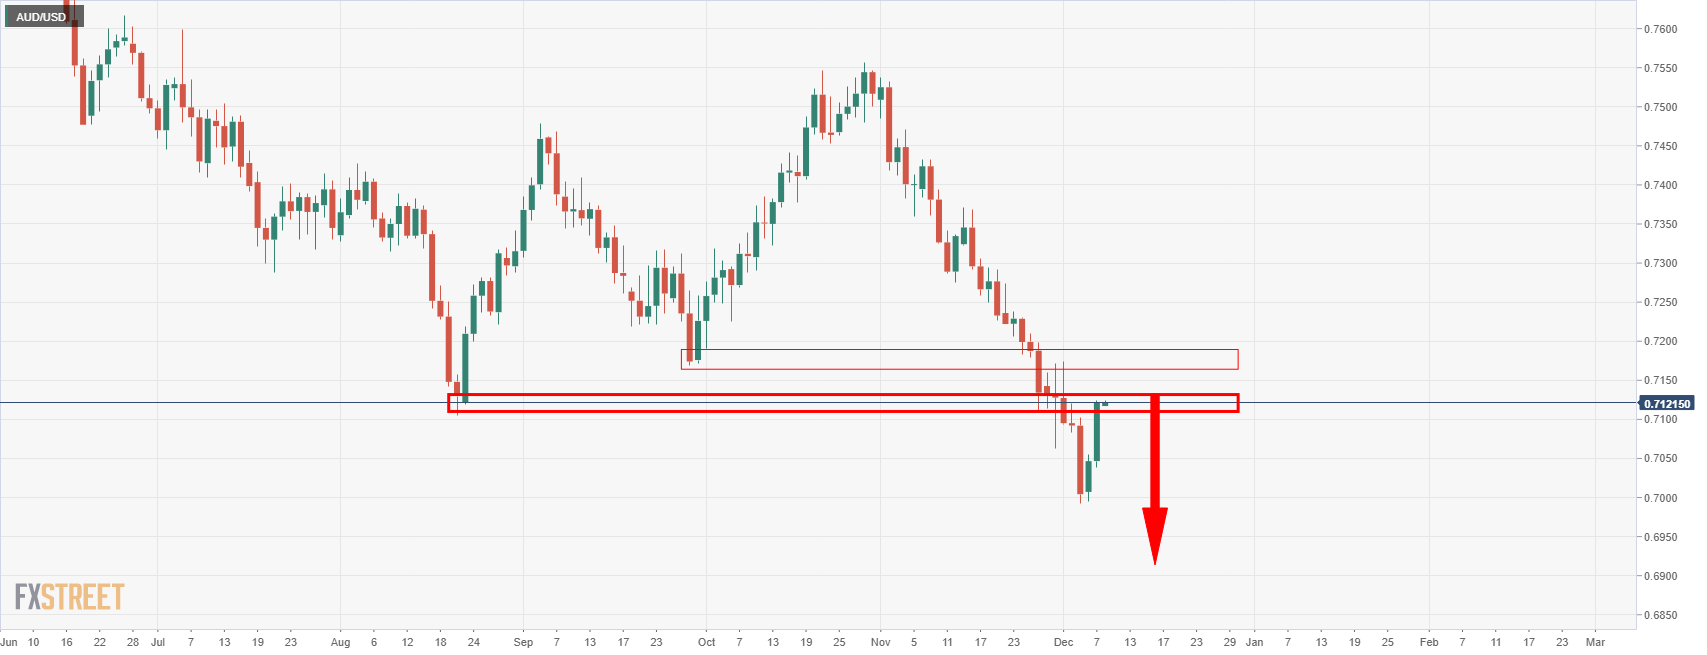
With that being said, the daily chart illustrates that there is a level of resistance here that could see the price rejected from.
- EUR/USD is testing bullish commitments and there are prospects of more to go to the downside.
- Bears are looking to the 1.12 figure as a target.
EUR/USD is attempting to correct higher but is facing pressure from the bears. The following is a top down analysis that arrives at a bearish conclusion while below weekly resistance.
EUR/USD weekly charts
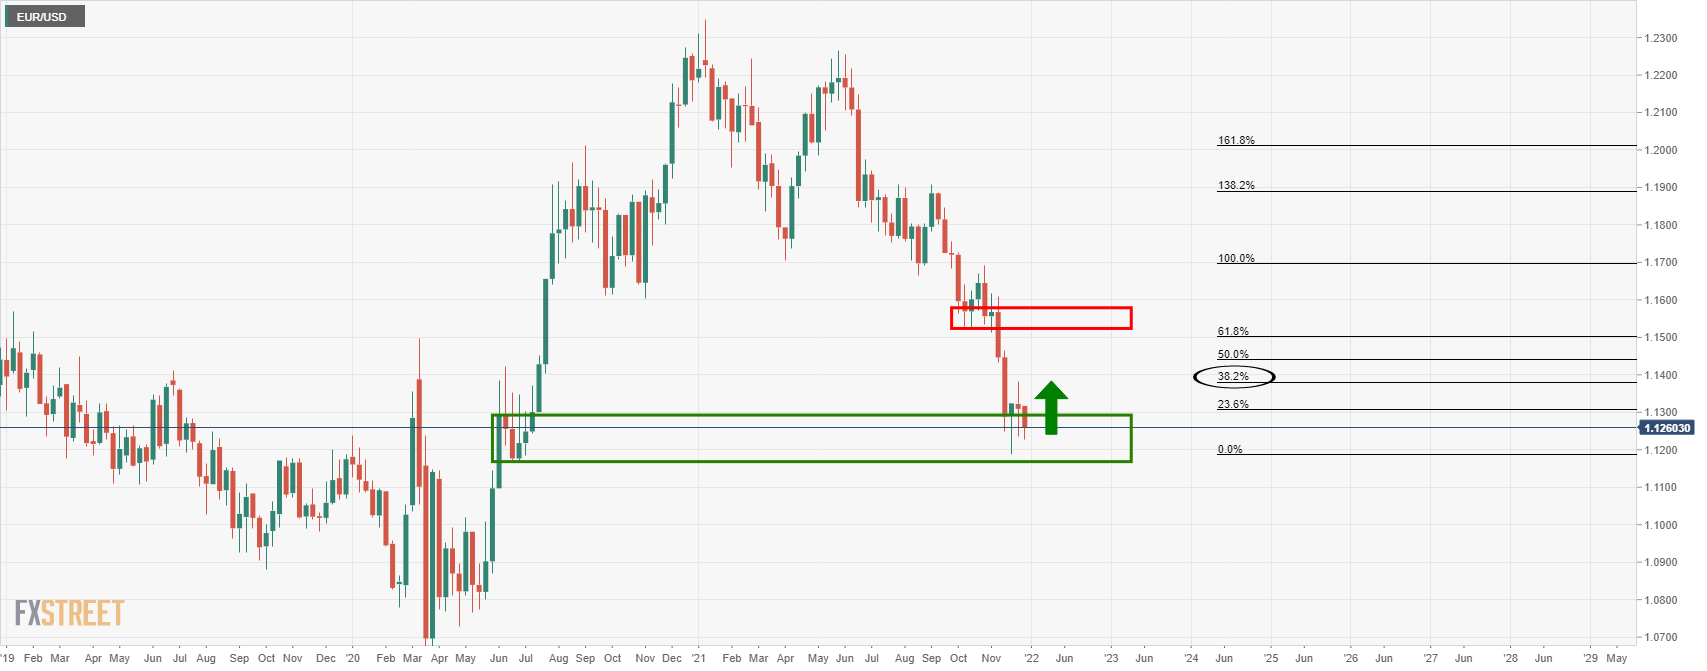
The weekly chart above sees the price attempting to dig deeper into the demand zone although the path of least resistance could well be for a bullish correction in the coming days.
EUR/USD weekly chart
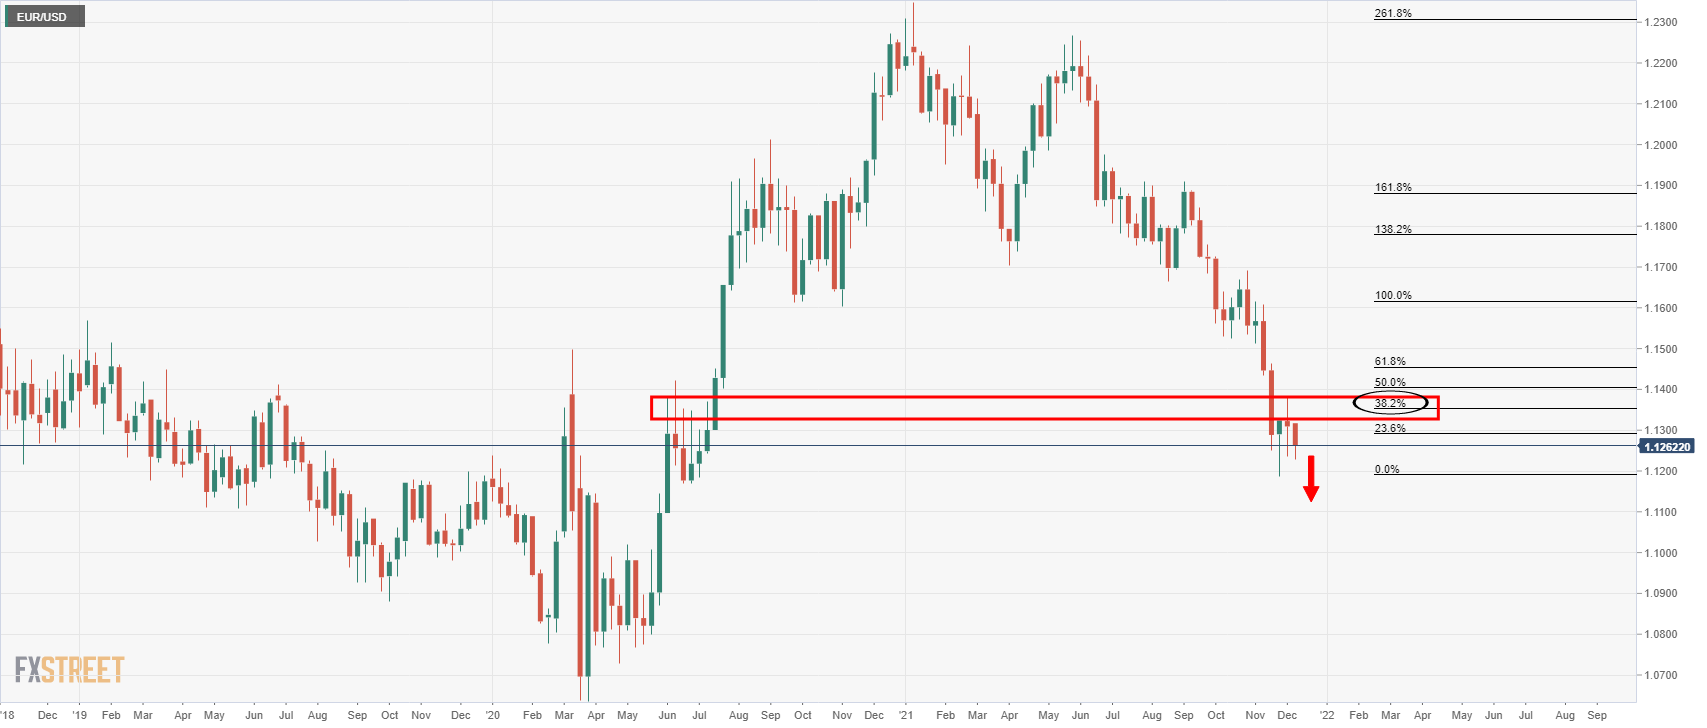
On the other hand, the outlook is bearish while below the resistance.
EUR/USD daily chart
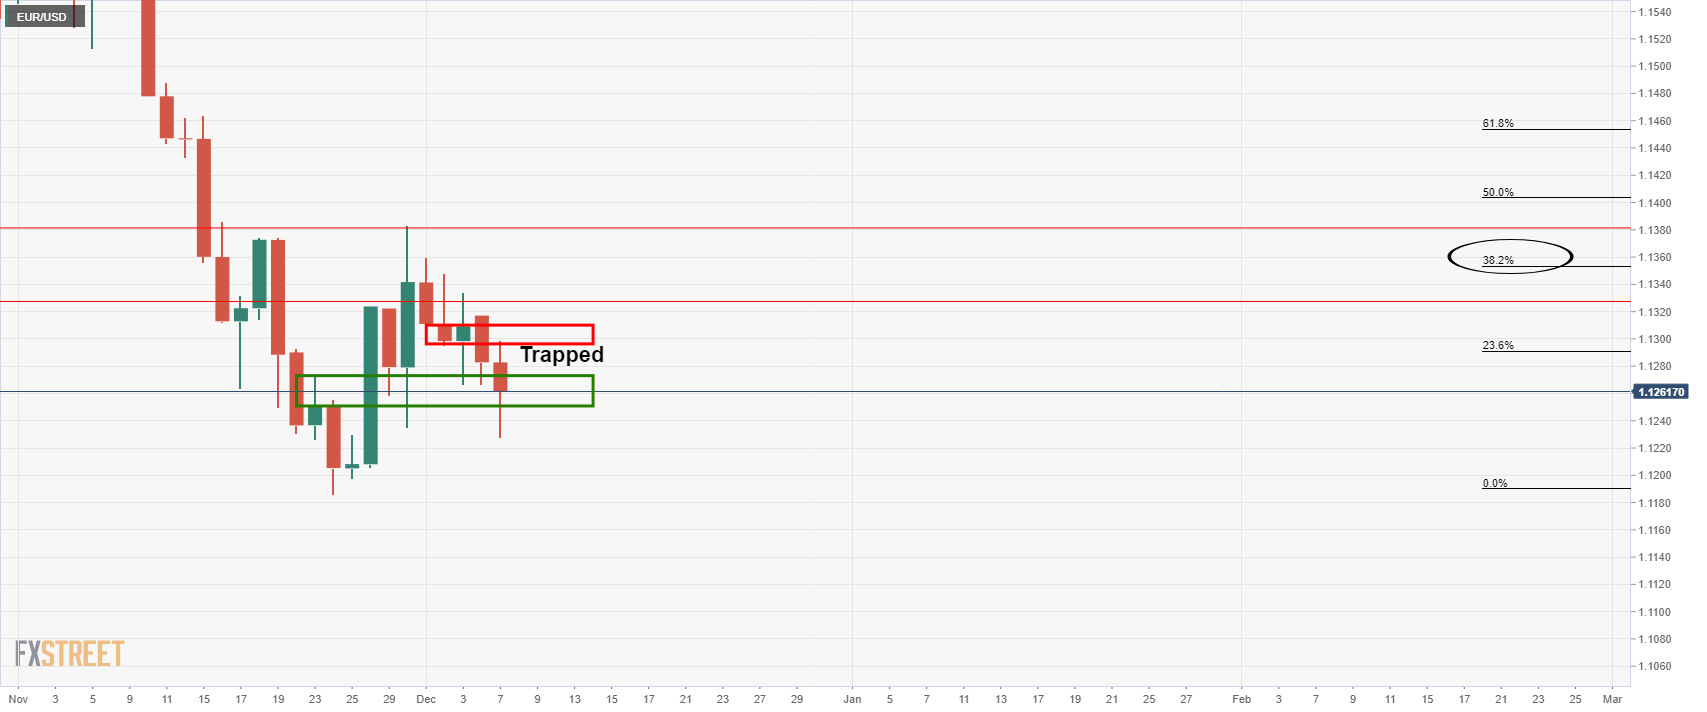
From a daily perspective, the price is trapped between the W-formation and the M-formation's necklines. A break of their of these areas would likely encourage flow into the direction of the price action and potentially lead to a breakout one way or another. 1.1250 and 1.1303 are support and resistance. Given that the lows of the day was 1.1227, there is a bias to the downside for the upcoming sessions.
EUR/USD hourly charts
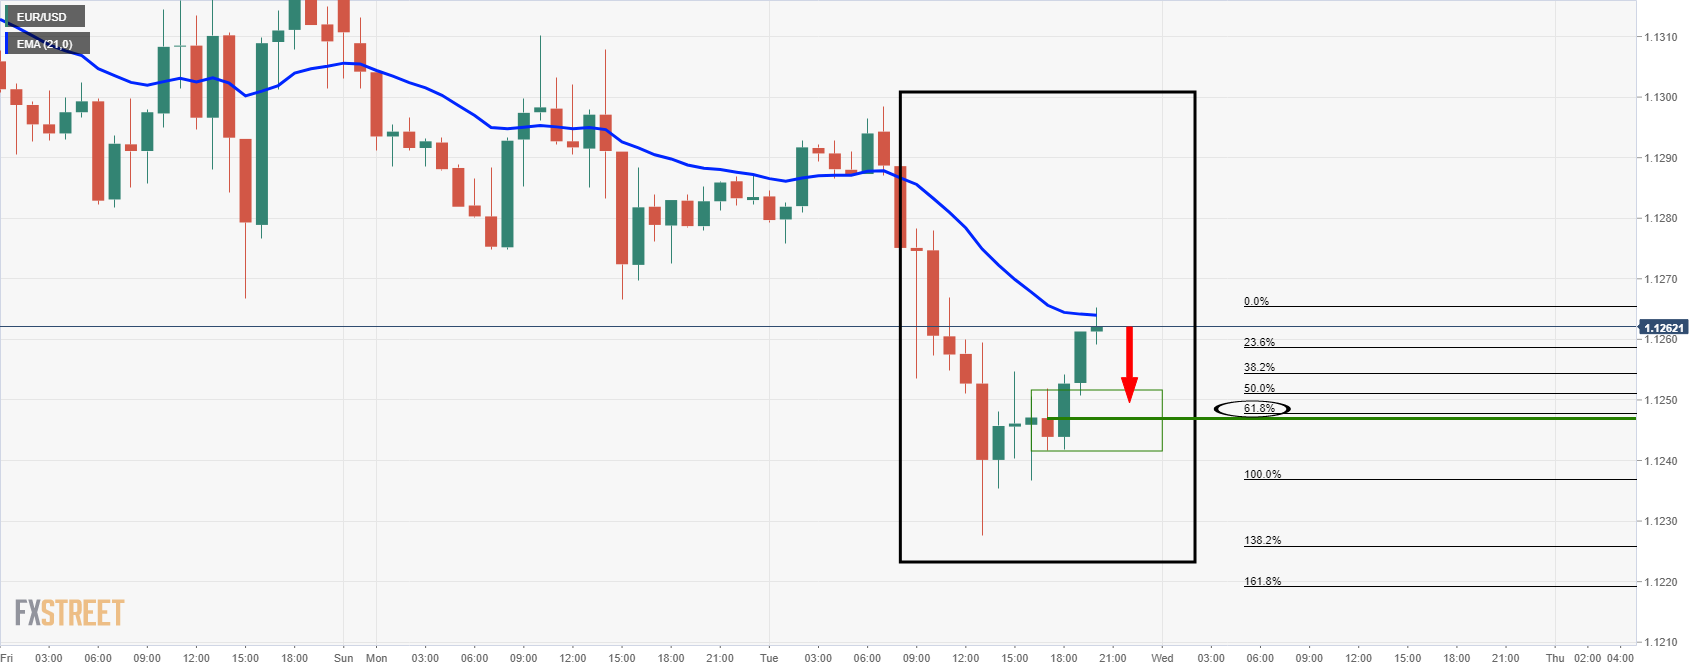
The price has formed a W-formation on the hourly time frame, as seen more clearly on a line chart as follows:
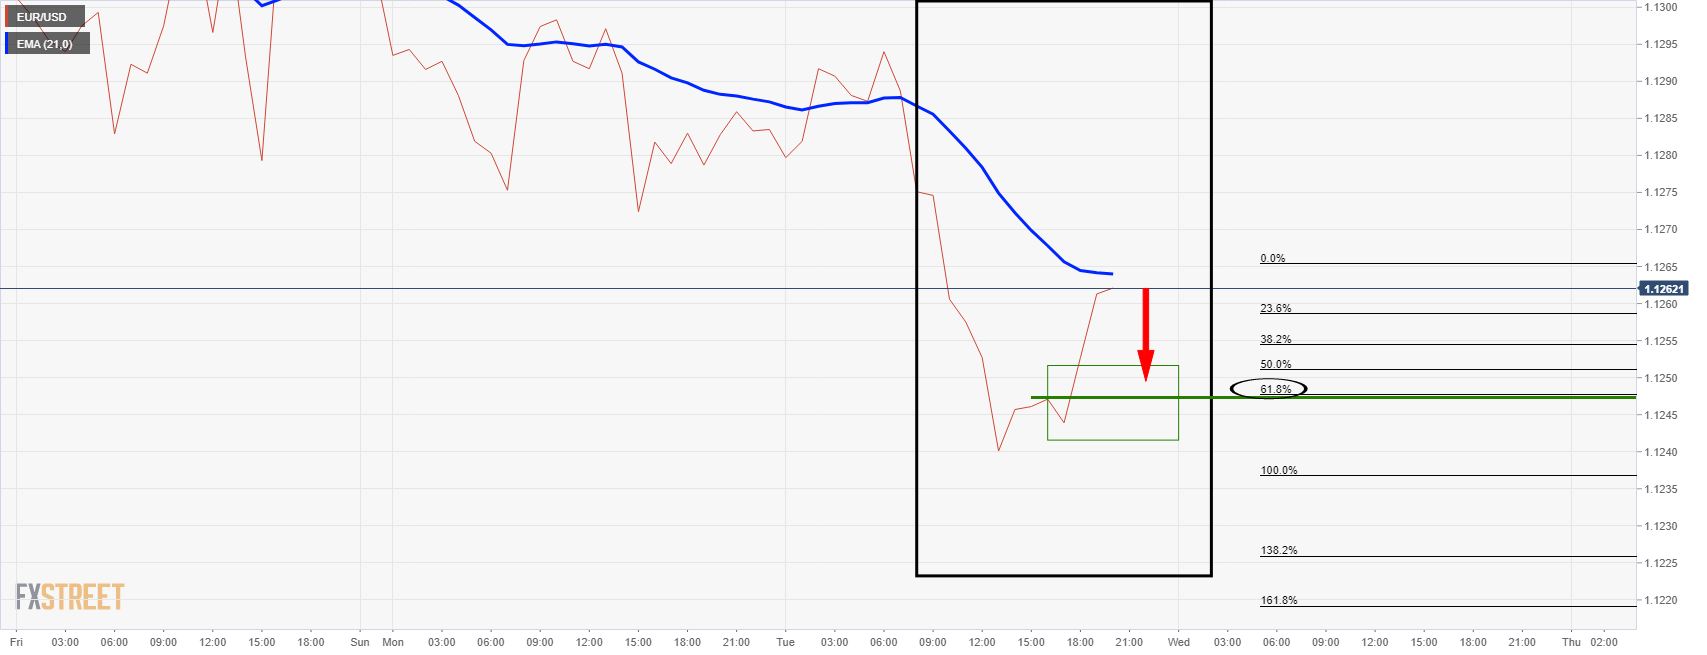
The W-formation is a reversion and bearish chart pattern. The price would be expected to move in on the neckline of the W-formation. This has a correlation with the 61.8% Fibonacci of the latest bullish hourly impulse near to 1.1245. A break there opens risk of a run towards 1.1202, or the -61.8% retracement of the recent bullish correction's range.
- AUD/JPY continues its impressive run of gains on the week on Tuesday that has taken it from under 79.00 to near 81.00.
- The pair was boosted by a risk-on/hawkish RBA combination.
AUD/JPY continued its impressive bounce that began on Monday through to the end of Tuesday US session. The pair has now bounced roughly 2.3% since the start of the week from under 79.00 to close to 81.00. The gains have been spurred so far this week as investors rush back into risk assets (like stocks, commodities and risk-sensitive currencies like the Aussie) as Omicron fears fade. The hawkish interpretation of many analysts, who read between the lines of the latest RBA monetary policy decision that the bank was opening the door to earlier rate hikes, also offered the Aussie support.
Whilst the recent run of gains is impressive, the pair still trades about 2.6% below its pre-Omicron emergence levels of close to 0.8300. But the fact that the pair was able to bounce so well at the September low around 79.00 is promising and if risk-on/hawkish RBA vibes continue, there is room for the pair to go higher. Technicians may target an eventual move back towards 82.00, which is roughly in line with the 50% Fibonacci retracement back from the October high to the August low, as well as the 21-day moving average.
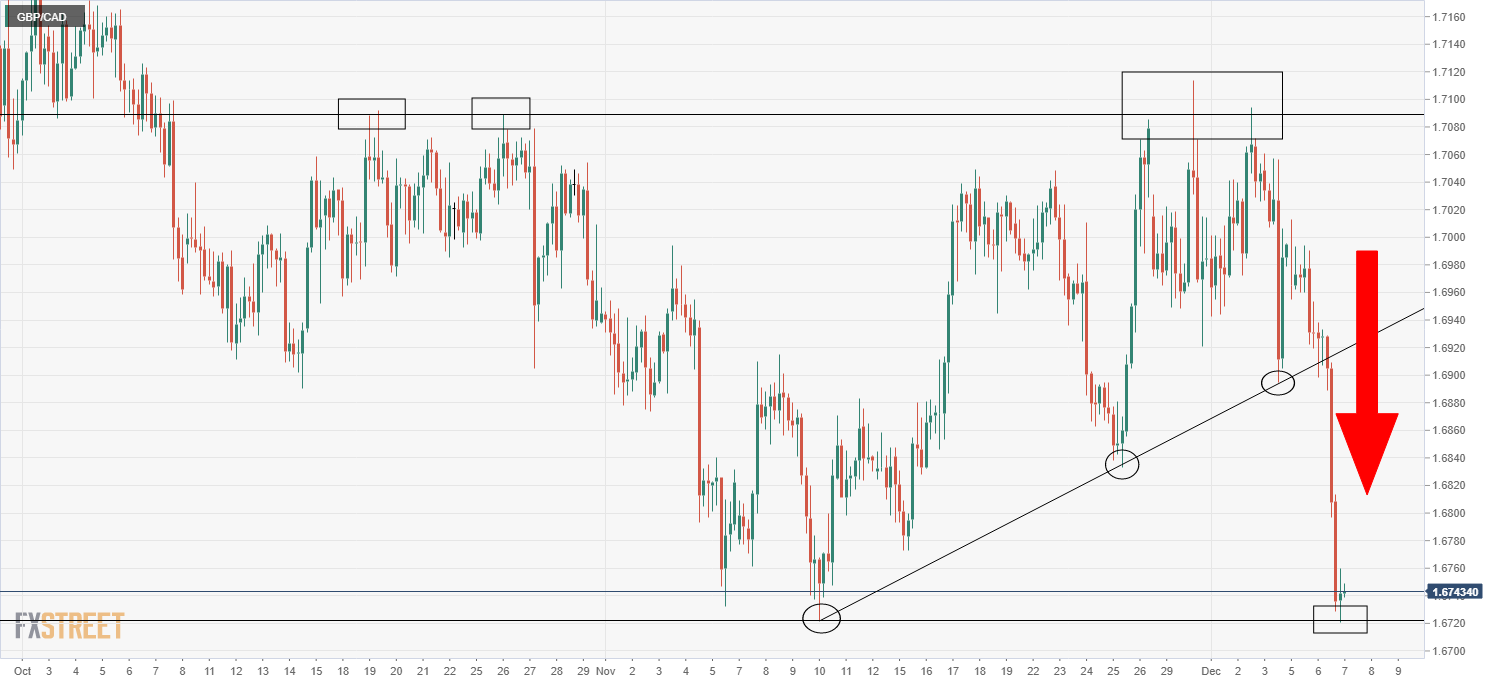
- GBP/CAD slumped from above 1.6900 to under 1.6750 on Tuesday for its worst one-day performance since April.
- A combination of technical selling, higher oil prices and central bank policy divergence drove the move.
GBP/CAD slumped to within a whisker of its lowest levels since March 2020 on Tuesday, slipping from above 1.6900 at the start of Asia Pacific trade to lows under 1.6750. In more recent trade, the selling pressure has abated and the pair has stabilised close to 1.6750, but is still down about 1.0% on the day and is down over 2.0% from last week’s highs just above 1.70. Tuesday’s drop is set to be the pair’s worst one-day performance since April.
The main catalyst for the move was a sharp rise in crude oil prices on the day amid a broadly risk-on market vibe that, net-net, benefitted the risk/commodity-sensitive loonie to a much greater degree than the pound. As Omicron-related fears have subsided in the market this week, risk-assets have broadly rallied, reflecting a positive shift in medium-term expectations for economic growth.
In FX markets, central bank divergence has also been an important play. Central banks have split themselves into two camps; those that do not see the emergence of Omicron as a risk worth altering their monetary tightening timeline for (like the Fed and RBA) and those that are more cautious. Communications from BoE officials in recent days has suggested that they are more likely to favour a patient approach to rate hikes in the coming month just in case Omicron weighs on the near-term economic outlook.
Money markets have largely priced out expectations for a rate hike next wee. The BoC, meanwhile, may want to instead follow in the footsteps of the Fed and acknowledge Omicron as a risk, but not one that materially alters its economic forecasts in light of last week’s stronger-than-expected jobs report. Technical selling was also a catalyst for the downside on Tuesday. The pair broke below an uptrend that had been supporting the price action going back to mid-November.
What you need to know on Wednesday, December 8:
Markets were more active on Tuesday, with optimism leading the way. Hopes that the Omicron coronavirus variant is milder and won’t interrupt the economic comeback sent global equities well into the green. Nevertheless, it’s too early to say how things will turn out with the new COVID-19 strain.
The EUR was the weakest USD rival, while the AUD and the CAD were the strongest. EUR/USD fell to 1.1227, its lowest for December, following the release of unimpressive EU data. The GBP/USD pair neared its yearly low, bouncing modestly ahead of the close to settle at around 1.13230.
EU data failed to impress, as the EU Q3 Gross Domestic Product was confirmed at 2.2% QoQ. On the other hand, the German ZEW showed that Economic Sentiment improved in Germany and the EU in December, although the assessment of the current situation plummeted to -7.4 vs the 5 anticipated by markets.
AUD/USD trades around 0.7110, underpinned by rallying equities and an optimistic RBA. USD/CAD is down to 1.2650, as oil prices kept rallying, with WTI near $72.00 a barrel.
The dollar advanced modestly against safe-haven CHF and JPY, with the pairs confined to tight intraday ranges.
Gold ticked higher but held within familiar levels at around $1,785 a troy ounce.
US Treasury yields surged on the back of the market’s optimism, with the 10-year Treasury note yielding 1.48% by the end of the day.
Top 3 Price Prediction Bitcoin, Ethereum, XRP: Crypto market dazed post flash crash
Like this article? Help us with some feedback by answering this survey:
- Despite a risk-on market mood, the shared currency losses ground against the safe-haven Japanese yen.
- The EUR/JPY faced strong resistance at 128.50, retreated around the S1 daily pivot at 127.66.
- EUR/JPY Price Forecast: Despite retreating, it seems poised to the upside, as the 50-hour SMA is about to cross over the 100-hour SMA.
The EUR/JPY retreats from daily highs around 128.47, trading at 127.9 during the New York session at the time of writing.
On Tuesday in the overnight session, the EUR/JPY surged up to the daily high at 128.50, twenty pips above the 200-hour simple moving average (SMA). However, as market sentiment improved due to factors like the omicron variant causing mild symptoms in people infected by, and the creation of an antibody boost effective against the newly discovered variant spurred a sell-off of EUR that sent the pair tumbling towards 127.60.
That said, at press time in the 1-hour chart, the EUR/JPY pair is facing strong resistance at the confluence of the 50, the 100-hour SMA’s, and the daily central pivot point at 127.87. During the New York session, the EUR/JPY pair has remained subdued, within a 21-pip range, but it is worth noting that most of the last eight 1-hour candles have a very long bottom wick, which shows that buying pressure, could be accumulating around that area.
In the outcome of breaking to the upside, the first resistance would be the December 6 high at 128.08. A breach of the latter would expose the 200-hour SMA at 128.14, followed by the R1 daily pivot at 128.24, and then the R2 daily pivot at 128.44.
On the flip side, in the case of falling further, the first support would be the S1 daily pivot at 127.66, followed by the December 6 low at 127.50 and then the S2 pivot at 127.29.
EUR/JPY 1-HOUR CHART
-637745040606427883.png)
Russia's Kremlin said on Tuesday that the talks held between US President Joe Biden and Russia President Vladimir Putin earlier in the day were open and business-like, according to Reuters. The Kremlin said that Putin told Biden about Ukraine's destructive attitude towards settlement in Eastern Ukraine and that it was wrong to put all of the responsibility on Russia's shoulders for current tensions. According to the statement put out by the Kremlin, the Ukraine crisis was the prevailing topic for discussion during the talks and Putin expressed concerns about Kyiv's allegedly provocative actions towards the Ukrainian region controlled by Russia-backed separatists (the Donbas region).
The Kremlin confirmed that Putin and Biden had agreed to continue contacts and have ordered subordinates to start consultations on "sensitive questions" around Ukraine. As expected, Putin told Biden he wanted reliable legally-binding guarantees ruling out any further Eastward expansion of NATO, as well as guarantees that offensive strike systems would not be deployed in countries close to Russia.
Separately, the US State Department said on Tuesday that it had intense consultation with the new German government over the response to a Russian invasion of Ukraine and that the US believes Germany will take significant action. It was earlier reported that an understanding was reached between US and German officials that the Nord Stream 2 pipeline would be shut down in response to any invasion.
Market Reaction
Judging by the reaction in FX markets, talks went as expected and did not yield any significant progress towards a de-escalation of tensions. USD/RUB continues to trade well within the 73.50-74.50ish range that has prevailed over the past week or so.
- GBP{/USD trapped within the 1.32's, eyes on a significant upside correction.
- The central bank divergences are laying into the hands of the GBP/USD bears.
GBP/USD is under pressure but remains within a 50 pip range with support within the 1.3200 vicinities. At the time of writing, cable is down some 0.25% trading between 1.3208 and 1.3289 on the day.
Risk sentiment rebounded further on Tuesday as markets become more optimistic that Omicron will not impede the global economic recovery. Also, pledges from China to support economic growth also helped alleviate some of the fears. Markets now expect further monetary policy easing in China after the People’s Bank of China said it will reduce bank reserve requirements.
The US dollar is holding up with the DXY index trading just shy of the one-week high of 96.592 printed earlier today. However, the pound is the worst-performing currency on the CSI for Tuesday as central bank divergence plays out.
While the Federal Reserve sent some hawkish signals of late despite the covid variant risks, as it is focused on spiking inflation. However, the Bank of England saw even some of its more hawkish voices such as Michael Saunders taking a more cautious tone. Saunders, one of two members of the nine-strong Monetary Policy Committee who voted to raise Bank Rate to 0.25% in November, said on Dec. 3 there "could be particular advantages in waiting to see more evidence" of Omicron's impact.
BoE expectations
The Bank of England is now expected to hold off again next week on becoming the world's first big central bank to raise interest rates from their pandemic lows. On Tuesday, investors were pricing in a roughly 50% chance of the BoE raising Bank Rate to 0.25% on Dec. 16, down from around 75% last week but higher than just a one-on-three chance immediately after the speech by Saunders on Friday.
This divergence in policy expectations may keep cable pinned to the floor in the 1.32 area in the run-up to the BoE meeting despite the upbeat risk sentiment. Meanwhile, a possible catalyst for volatility i the pair before then could come from the Dec 10 monthly Gross Domestic Product report for October.
''Manufacturing likely pulled down on growth with a relatively sharp fall, driven in part by a decline in motor vehicle production, but we see upside risks elsewhere (including for the Index of Services), as consumers pulled forward demand over fears of end-of-year shortages, '' analysts at TD Securities said. ''This would leave GDP growth roughly on track for the BoE's recent forecast of 1.0% QoQ.
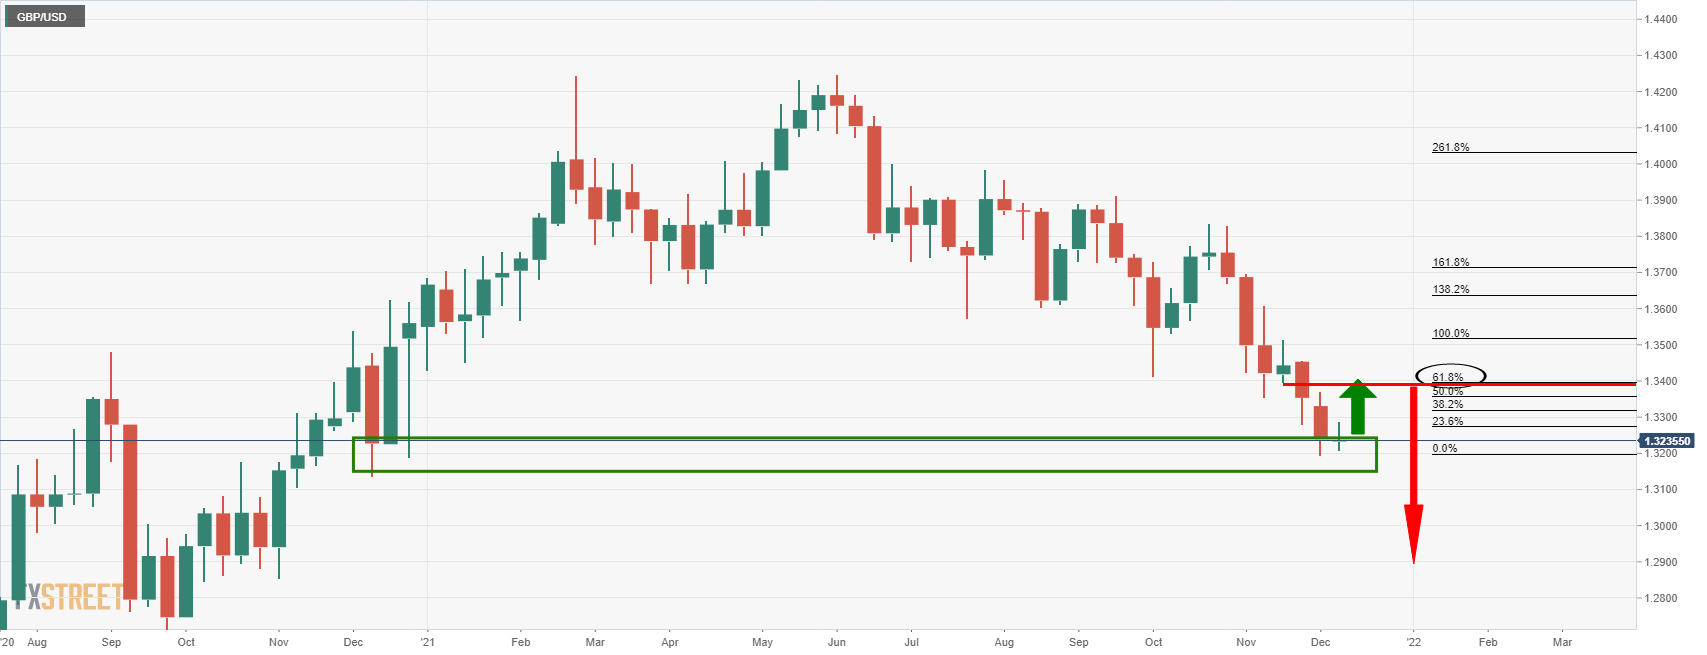
GBP/USD technical analysis
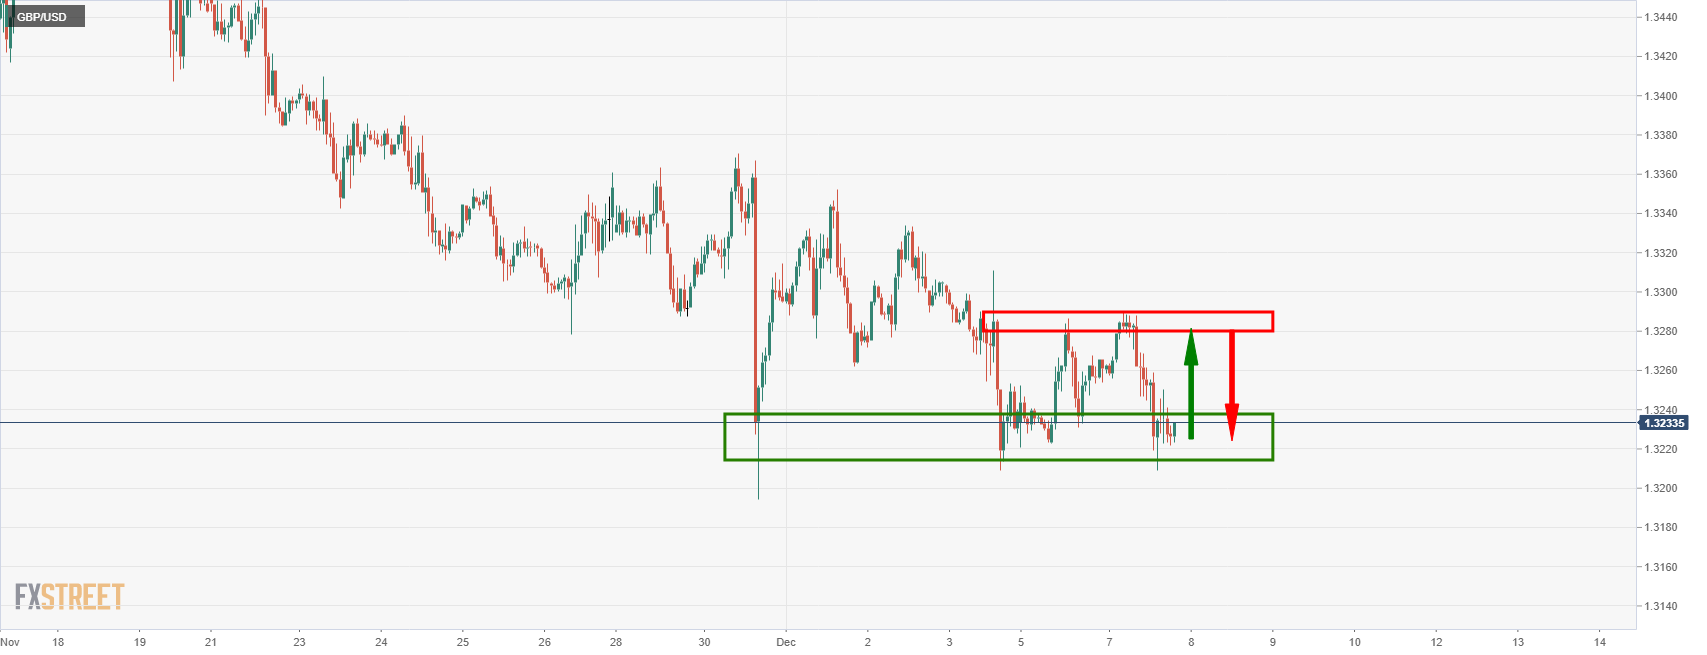
The price appears to be trapped in the 1.32's. From a longer-term perspective, the price could be headed for an upside correction prior to further downside. This opens prospects of a correction back to test the old support near the 61.85 Fibonacci retracement level around 1.34 the figure:
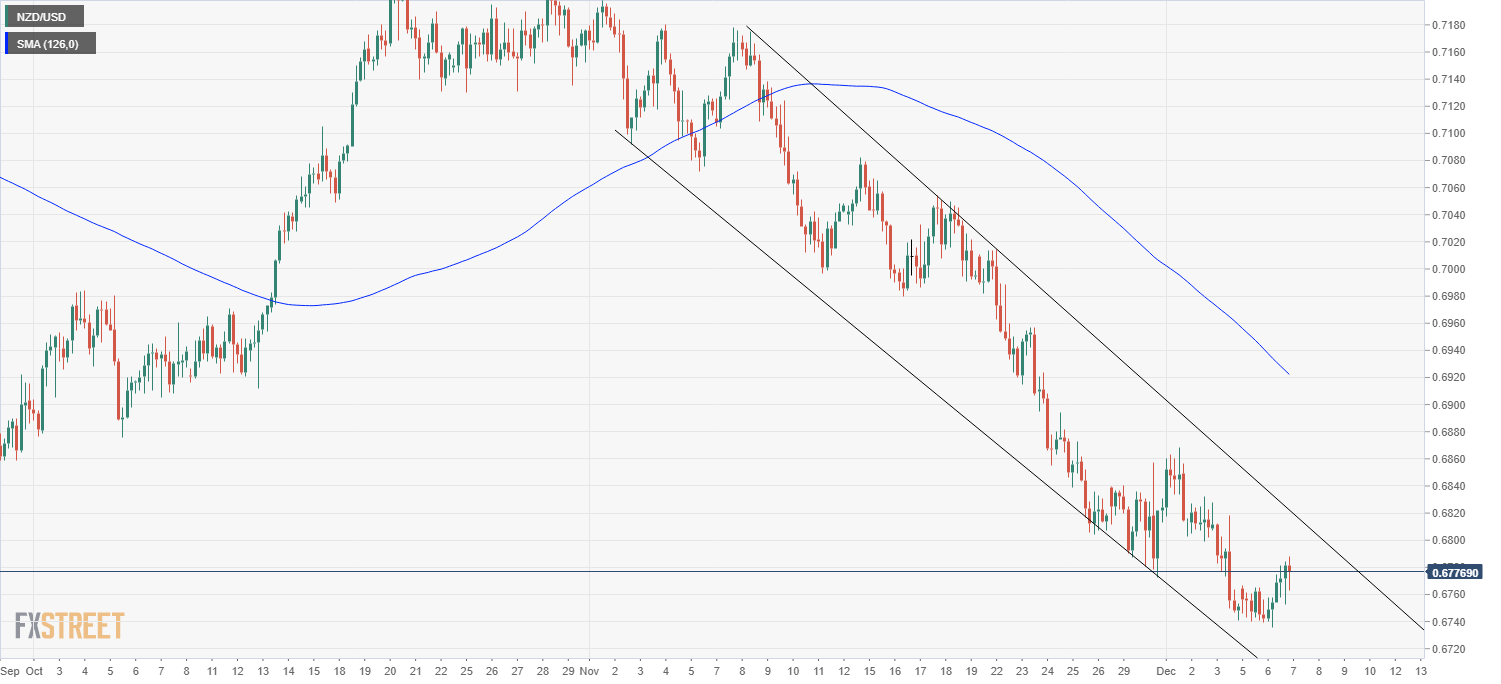
- NZD/USD recovered to the 0.6775 area on Tuesday amid a broad rally in risk appetite.
- But the kiwi continues to severely lag the Aussie and Loonie, weighed by unfavourable divergence in central bank policy expectations.
NZD/USD has seen a tentative rally on Tuesday, rebounding to around the 0.6775 area after printing fresh annual lows under 0.6740 earlier in the session. The broad risk-on market tone which is seeing global equities, commodities and risk/commodity-sensitive currencies perform well across the board is the main driver of the upside in the pair on Tuesday.
Looking ahead, there are no notable New Zealand economic events for the remainder of the week so focus will be on US-related themes and risk appetite. If the latter can remain supported as Omicron variant fears ease then that might be enough to keep NZD/USD from plunging back to annual lows under 0.6750. But is US macro data comes in strong and US inflation data hot (as is expected), this may keep USD underpinned in anticipation that the Fed will announce an acceleration of the pace of its QE taper next Wednesday.
Looking at the pair from a technical standpoint, the descending trendline that has guided NZD/USD lower in recent weeks looks to still be very much intact. “NZD rallies remain selling opportunities,” said analysts at ANZ.
NZD underperforms as markets dial down hawkish RBNZ bets
Tuesday’s recovery only amounts to an on-the-day gain of about 0.4%, which is not particularly impressive in light of the 0.9% and 0.8% gains being seen in the kiwi’s fellow non-US dollars the Aussie and the loonie. Equally, NZD’s on the week gains versus the US dollar only stand around 0.5%, versus a more than 1.6% gain for AUD and a roughly 1.4% gain for CAD.
Recent NZD underperformance versus its peers and the US dollar (NZD/USD is down over 5.5% since the start of last month) owes itself to divergence in central bank policy expectations. In the last few days, money markets have rebuilt hawkish bets for the Fed, BoC and RBA (with a surge of hawkish RBA bets coming in wake of Tuesday’s policy decision), but the same cannot be said for the RBNZ. Indeed, over the past few weeks, markets have been dialing down their hawkish RBNZ bets.
Since mid-November’s not as hawkish as expected RBNZ meeting, the implied yield on the December 2022 NZ Bank Bill future has dropped from above 2.8% to current levels in the 2.50s%. Over the same time period, the implied yield on the December 2022 three-month eurodollar future has remained steady close to 1.10%.
- Silver trims some of its Monday losses, up some 0.63%.
- Omicron coronavirus worries abate, as cases appear to cause mild symptoms.
- Investors pile towards riskier assets, putting a lid on an upward move in silver.
- XAGF/USD Price Forecast: Tilted to the upside but facing strong resistance around $22.60.
Silver (XAG/USD) advances during the New York session, paring Monday losses, trading at $22.54 at the time of writing. Financial market upbeat sentiment, attributed to reports that COVID-19 omicron variant cases only causes mild symptoms, spurred a rally on US stocks, the biggest since March. Also, Glaxo’s development of antibody treatment for COVID-19 showed that it is effective against the new coronavirus strain, abating investors’ worries of an economic slump.
The greenback rises, courtesy of higher US bond yields
In the meantime, US equities are printing gains while US bond yields are up. The 2s are rising four basis points up to 0.6792%, while the 10-year benchmark note is up to three basis points, sitting at 1.467%, a tailwind for the greenback. The US Dollar Index, which measures the buck’s performance against six peers, is up 0.11%, currently at 96.43.
Last week, Fed’s Chair Jerome Powell, alongside some US central bank policymakers, expressed that a faster bond-taper would be needed due to elevated prices. In fact, Chair Powell said that the word “transitory” has to be removed when speaking about inflation, reflecting that it is stickier than expected. That keeps XAG/USD traders focused on the Consumer Price Index for November, to be revealed on Friday.
In the overnight session, the white metal remained subdued, in a $22.23-47 range, fluctuating between the 100 and the 50-hour simple moving averages (SMA’s). In the last three hours or so, silver broke to the upside and left both previously mentioned SMA’s under the spot price at $22.39 and $22.38, respectively. Nevertheless, it failed to break above solid resistance at the December 6 high at $22.58, retreating towards $22.40s
XAG/USD Price Forecast: Technical outlook
Silver (XAG/USD) in the 1-hour chart depicts a bullish bias, attributed to the 1-hour 50 and 100-simple moving averages (SMA’s) residing below the spot price. Despite that fact, the non-yielding metal faces strong resistance at press time, at the confluence of the R1 daily pivot and the December 6 high at $22.58, a strong line of defense of USD bulls.
In the outcome of breaking to the upside, the first resistance would be $22.80, immediately followed by $23.00.
On the flip side, the first support would be the central daily pivot at $22.35. A break below that level would expose crucial support levels, as the S1 daily pivot at $22.10, followed by the psychological $22.00.
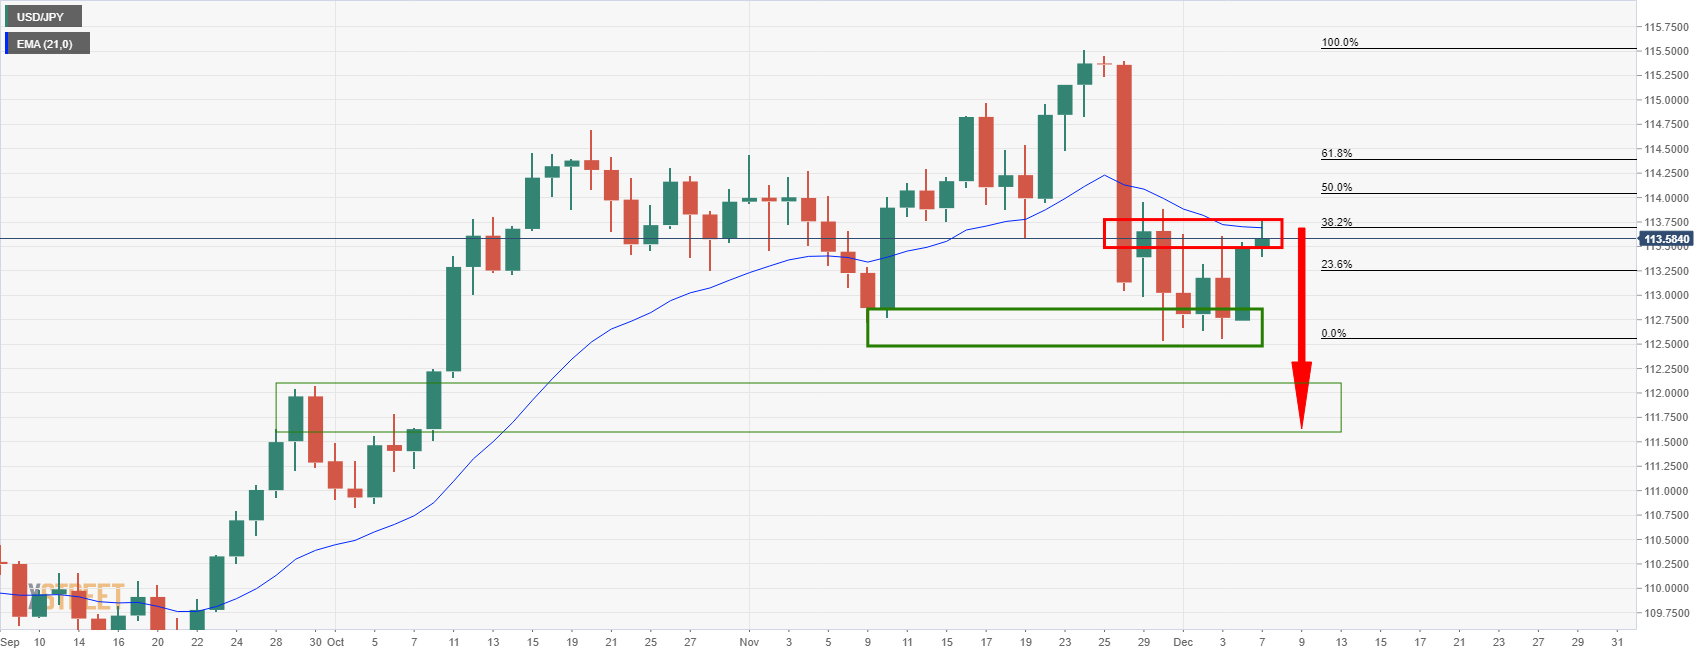
- USD/JPY is stalling on the bid although the backdrop is one of risk-on.
- USD/JPY bears are looking for a downside extension the daily time frame.
Risk has been on and Wall Street's main indexes were sharply higher in early trade on Tuesday following the gains in Asian stocks at the start of the week after a reserve ratio cut by China's central bank bolstered sentiment.
Easing Omicron COVID-19 variant worries and the timely booster shot of Chinese stimulus has helped lift riskier currencies and has weighed on the yen this week so far. However, the US dollar is growing weary in recent trade. Nevertheless, at the time of writing, USD/JPY is trading 0.2% higher at 113.72 within the 113.40 and 113.77 range of the day so far.
Markets have taken confidence from the reports in South Africa that Omicron cases there had only shown mild symptoms. The top US infectious disease official, Anthony Fauci, told CNN on Sunday "it does not look like there's a great degree of severity" so far.
Developments in China contributed to the risk-on tone, as the People's Bank of China (PBOC) said it would lower the amount of cash that banks must hold in reserve. This was its second such move this year. Investors are cheering the measure to release liquidity to support economic growth. The PBOC also cut the rates on its relending facility by 25 basis points to support the rural sector and small firms.
Data on Tuesday has also shown that the US trade deficit narrowed sharply in October as exports soared, potentially setting up trade to contribute to economic growth this quarter. The combination of these factors has helped the US dollar to firm versus its major currency peers, with the US dollar Currency Index DXY higher 0.21% at 96.499, just shy of the one-week high of 96.592 printed earlier today. Additionally, supporting the greenback, the US 10-year yield is higher by some 2.37% today, trading between 1.429% and 1.470%.
''We believe the underlying trend for a stronger dollar remains intact as the Fed is moving closer and closer to liftoff sooner than markets previously thought,'' analysts at Brown Brothers Harriman argued.
There will be no Fed speakers given the pre-FOMC blackout period so the focus will be on the US Consumer Price Index data on December 10. ''We expect inflation to slow significantly as fiscal stimulus fades and supply constraints ease, but we don't expect the data to be validating in the near term,'' analysts at TD Securities said. ''The CPI likely surged in Nov, with a drop in oil coming too late to avert another large gain in gasoline and core prices boosted by rapidly rising used vehicle prices and post-Delta strengthening in airfares and lodging.''
Russian tensions
Investors will also keep an eye on developments on the US-Russia diplomatic tensions, as Biden is reportedly considering sanctions on Russian banks if Russia invades Ukraine. Russia wants guarantees that Ukraine will not try to seize areas captured by Russian-backed separatists in 2014 and has warned the West not to cross "red lines" by adding Ukraine to Nato's military alliance. ''More than 90,000 Russian troops are believed to be massed near Ukraine's borders,'' the BBC reported.
The talks between the two nation's, leaders Vladimir Putin and US President Joe Biden, began at 10:07 US Eastern time (15:07 GMT; 18:07 Moscow time), the White House said. They were held on a secure video link set up under previous administrations but never used before, Russian news agency Tass said.
In a conference call on Monday night, the White House said the leaders of the US, UK, France, Germany and Italy had formed a joint strategy "to impose significant and severe harm on the Russian economy" should Russia launch an invasion. President Biden is expected to speak to the four European leaders again after his talks with Mr Putin.
The BBC has reported that ''possible measures include restrictions on Russia's banks converting roubles into foreign currencies, or even disconnecting Russia from the Swift global financial payment system, reports say.'' Bloomberg News reported that the US would seek to halt Russia's Nord Stream 2 pipeline to Germany.
USD/JPY technical analysis
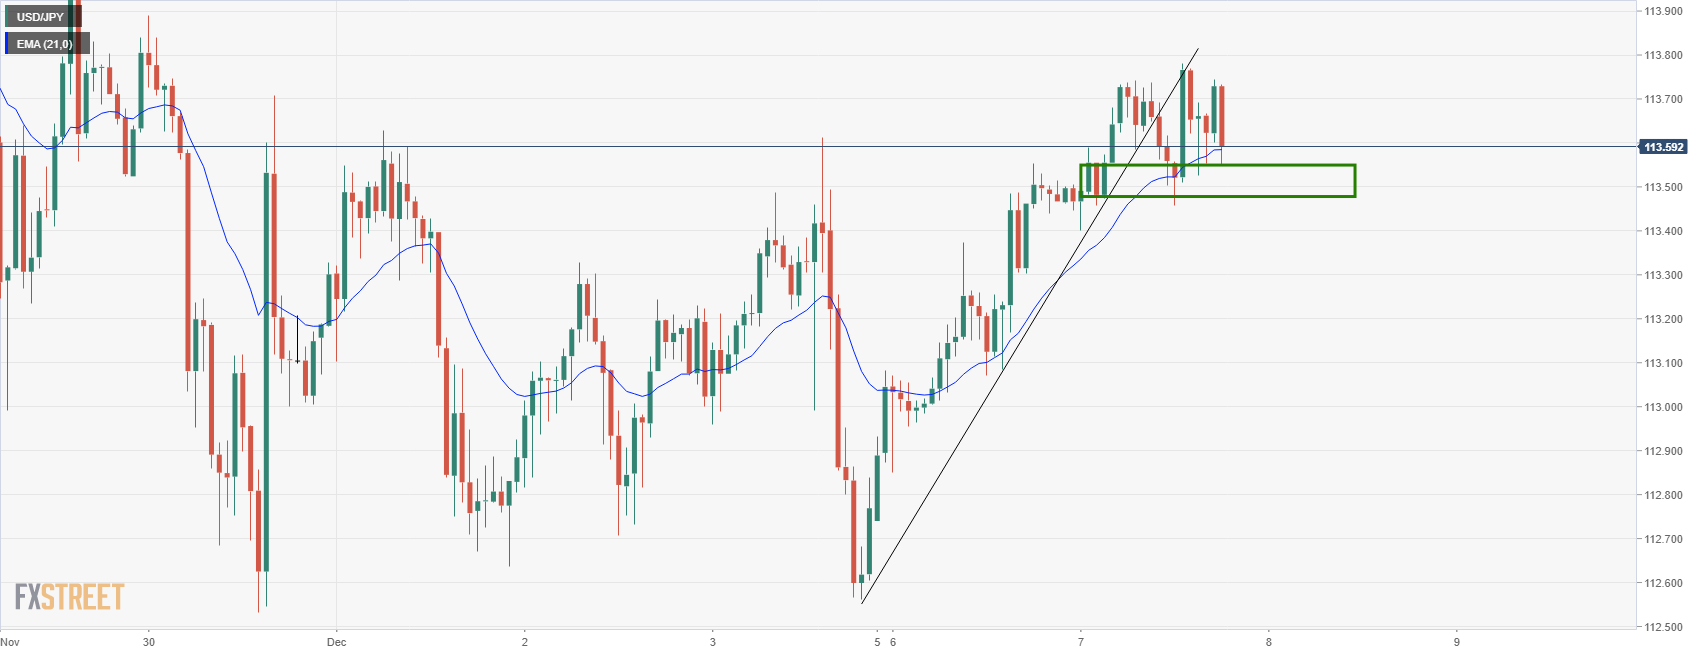
The price is unable to get over the counter trendline resistance or away from the 21-EMA on the hourly chart. The market is moving into a consolidation of US dollar strength and the yen is closing the gap on the Currency Strength Index on an hourly basis.
Moreover, from a daily perspective, the price is stalling at a 38.2% Fibo and could easily flip to the downside at this juncture:
- The USD/CHF continues advancing for the second straight day, up 0.09%.
- A risk-on market mood weakens safe-haven currencies except for the USD, which gains against the CHF.
- USD/CHF Price Forecast: Failure at 0.9268 would form a double-top pattern that would open the way for further losses.
The USD/CHF extends to two-consecutive days of gains, trading at 0.9265 during the New York session at the time of writing. In the overnight session, the USD/CHF edged lower to re-test the 200-hour simple moving average (SMA) around 0.9230s, then bounced off amid positive market mood, as the omicron variant, although contagious, cases linked to the newly discovered strain cause mild symptoms in patients. Additionally, treatment of an omicron-effective antibody boost created by Glaxo abates market participants’ worries, as global equities have risen on Tuesday.
Apart from that, the US Dollar Index, which tracks the greenback’s performance against a basket of rivals, advances 0,12%, sitting at 96.45, a tailwind for the USD/CHF, as safe-haven currencies, like the JPY and the CHF, weaken against the buck.
The US 10-year Treasury yield follows the DXY footsteps, rising almost two-basis points, up to 1.45%.
USD/CHF Price Forecast: Technical outlook
In the 1-hour chart, the USD/CHF is re-testing the November 30 high at 0.9266, resulting from a 100-pip upward move on that day. Furthermore, the December 6 high at 0.9268 coincided with the abovementioned, making that price level a crucial line of defense for CHF bulls.
At press time, the pair is testing the resistance abovementioned, which in the outcome of being broken would expose the figure at 0.9300. The breach of the latter would exert upward pressure on the pair. The following resistance would be the November 25 support-turned-resistance at 0.9324, followed by the November 26 high at 0.9360.
On the flip side, failure at 0.9260s would form a double top chart pattern that could send the USD/CHF tumbling lower. The first support would be the 200-hour SMA at 0.92323. A break of that level would expose crucial support areas like the confluence of the 50-hour SMA and the central daily pivot at 0.9229, followed by the 100-hour SMA at 0.9214.
-637744962691329608.png)
- AUD/USD has reclaimed 0.7100 status on Tuesday amid a broad surge in risk appetite.
- But strong Chinese trade data and hawkish interpretations of the latest RBA policy decision are also supporting the Aussie.
- AUD/USD is threatening to break to the north of a key descending trend channel.
The Aussie dollar has continued to power higher throughout the session on Tuesday, moving to the north of the $0.7100 level in recent hours as risk appetite has continued to improve. That marks a more than 1.5% recovery from last Friday’s lows of just under 0.7000, with 0.9% of those gains coming on Tuesday.
AUD/USD is now challenging the upper bounds of a descending trend channel that has been suppressing the price action going all the way back to early November. A break above this descending trendline, which the pair is currently flirting with just above 0.7100, would open the door to a sharp rally to the next area of resistance around 0.7170, ahead of the 21-day moving average just under 0.7220.
Driving the day
The main driver of the recovery in broad risk appetite on Tuesday appears to be markets pricing out prior pessimism about the impact of Omicron on the economic outlook in light of growing evidence that infections are comparatively “mild”. But sentiment is likely also receiving a helping hand as Chinese authorities signal intent to provide support to the economy in 2022.
After its 50bps reserve ratio requirement cut on Monday, which is expected to release CNY 1.2T in liquidity from the Chinese banking system, the PBoC cut rates on its re-lending facility by 25bps with the aim of supporting the rural sector and small firms. Meanwhile, the powerful Chinese politburo pledged on Tuesday to keep economic operations within a reasonable range in 2022, whilst also promoting healthy developments in the property sector.
Chinese economic optimism is helpful for the Aussie given that China is Australia’s largest export destination. On which note, the Aussie also got a boost from the release of strong November trade figures out of China during Tuesday’s Asia Pacific session. Both imports and exports beat expectations “thanks to stronger demand and easing semiconductor shortages”, said Capital Economics, who added that the emergence of Omicron might offer further support for Chinese exports in the near term.
Hawkish RBA
Perhaps the most important factor boosting AUD on Tuesday has been hawkish interpretations of the latest RBA rate decision. As expected the bank held interest rates at 0.1% and pledged to continue buying bonds at a A$4B weekly pace until February. But the bank, whilst conceding that Omicron was a risk to the outlook, said it did not think the new variant would derail the recovery.
“The RBA has clearly positioned itself among those central banks (like the Fed) that do not currently see the new variant as likely to truly dampen the recovery and policy plan,” said ING. “With still a lot of short positions to be unwound, this is a notion that can continue to offer support to the Aussie dollar in the coming weeks” the bank added.
Meanwhile, a reference to inflation being expected to sit within the bank’s 2.0-3.0% range in 2023 was removed from the statement, which some analysts saw as the bank opening the door to an earlier rate hike. Famed RBA watcher Terry McCrann said “it is clear Australia is moving closer to a rate rise, not just potentially in 2023 but possibly even relatively early next year.”
In its monthly Short-Term Energy Outlook (STEO) report, the US Energy Information Administration (EIA) raised its forecast for 2022 world oil demand growth by 200K barrels per day (BPD) on Tuesday, and now demand growing 3.55M BPD YoY next year. The EIA STEO cut its forecast for 2021 world oil demand growth by 10K BPD to a 5.1M BPD YoY increase.
Market Reaction
Crude oil prices have not reacted to the latest EIA STEO, but have been trading on the front foot throughout the day amid the broad risk-on market vibe.
The US trade balance deficit narrowed by $14.3 billion in October, which is only the second time such a gain has occurred in data going back to the early 1990s, explained analysts at Wells Fargo. They add the narrowing was driven by the largest gain in exports since coming out of lockdown in mid-2020, a welcomed development after imports have largely outpaced exports over the past year and a half.
Key Quotes:
“U.S. exports surged 8.1% in October outpacing a more-modest 0.9% gain in imports. This pop in exports caused the trade balance to narrow by $14.3 billion, a gain outpaced only once during the financial crisis of 2008 in data going back to the early-1990s. This narrowing left the U.S. trade balance at its lowest deficit in six months.”
“Throughout the pandemic, imports have rebounded much faster than exports as U.S. domestic demand has outpaced many international economies. While the trade balance has widened sharply since the onset of COVID, trade flows have been highly volatile from month-to-month. Our best read is that today's narrowing in the trade deficit is likely more a story of monthly volatility rather than the start of a sustained narrowing in the deficit.”
“We still believe imports should cool off a bit as domestic demand transitions back to services, but the timeline of this eventual reprieve has grown more uncertain due to potential hiccups in the sector associated with the Omicron variant.”
The Atlanta Fed's GDPNow estimate for the annualised QoQ pace of GDP growth in the US economy in Q4 fell to 8.6% on Tuesday from 9.7% last Wednesday (1 December). In light of releases from the US Census Bureau, the US Bureau of Economic Analysis, and the Institute for Supply Management, the nowcasts of fourth-quarter real personal consumption expenditures growth and fourth-quarter real gross private domestic investment growth decreased from 9.6% and 13.1%, respectively, to 8.6% and 11.3%, respectively. The next update to the forecast will be on Thursday.
Market Reaction
FX markets did not react to the latest update from the Atlanta Fed.
Data released on Tuesday, showed the trade surplus in Canada widened from CAD 1,86 billion to 2.09 billion in October. Analysts at the National Bank of Canada point out it is the highest level in 10 years.
Key Quotes:
“The merchandise trade surplus expanded at a pace consistent with consensus expectations in October and reached a 10-year high. This gain was explained by exports benefiting from higher commodity prices and increased demand while supply chain disruptions started to ease. The growth of both exports and imports to an all-time high were led by motor vehicles and parts as shortages of semi-conductor chips relented.”
“Exports of energy products were the second-largest contributor to the growth for trade in the month as they reached a record high at C$13.9 bln.”
“Largely because of lower supply chain disruptions, exports to the United States grew 6.9% to a record high of C$42.2 bln, while imports from our largest trade partner also surged (+9.1%) to their second highest print on record. As a result, the trade surplus with the U.S. remained essentially unchanged (C$-0.1 bln) from its highest level in 13 years in October.”
“A deterioration for the trade balance in November is likely due to the events of last month on the west coast of the country.”
According to analysts from Rabobank, the AUD/USD, encouraged by domestic data, should rise toward 0.73 in a three to six-month view. They don’t see the Reserve Bank of Australia asbeing in any rush to hike interest rates.
Key Quotes:
“The release of Australian Q3 GDP was old news even as it hit the newswire. The -1.9% q/q contraction referred to a period when many Australian were impacted by lockdowns and contrasts with the optimism for a strong bounce back starting in Q4. Despite a slow start to its vaccine rollout at the start of the year, the strength of recent progress on this front has underpinned confidence in the ability of the Australian economy to once again demonstrated that it can bounce back strongly from lockdowns. This, however, does not mean that the RBA will be in any rush to hike interest rates.”
“The RBA is not expecting underlying inflation to reach the middle of its target until the end of 2023 and Lowe maintains that the first increase in the Cash rate may not be before 2024. Even if this target slips, it is clear that the RBA will be well behind the Fed when it comes to hiking rates in the forthcoming cycle.”
“The downtrend in AUD/USD since the start of last month suggests that Lowe’s guidance on policy has had an impact. CFTC data suggest that speculators are holding sizeable short net AUD positions. In view of the RBA’s expectation that the Australian economy can bounce back sharply into 2022, we expect that better domestic data is likely to encourage a modestly better tone in AUD/USD on a 3 to 6 mth view back towards the 0.73 area.”
- Gold advances during the day, benefitted by US T-bond yields flat.
- Despite Fed’s recent hawkishness rhetoric, the non-yielding metal advances 0.45%.
- XAU/USD Price Forecast: Meanders above the 200-HSMA, as bull’s eye $1,800.
Gold (XAU/USD) recovers some of Monday’s losses, advances during the New York session, trading at $1,785 at the time of writing. As portrayed by global equity markets, the market sentiment is upbeat, pointing to the upside, due to positive news on the COVID-19 omicron variant. The newly discovered strain, albeit being more contagious, patients infected with it have shown only mild symptoms. Additionally, during the European session, an antibody treatment by Glaxo works on the omicron variant, easing investors’ worry about the possibility of an economic slowdown.
That said, US equity markets are rising between 1.55% and 3.02%. Meantime, US bond yields, which correlates inversely to the non-yielding metal, with the 10-year are flat at 1.44%, a headwind for the greenback, with the US Dollar Index, barely up 0.08%, sitting at 96.41.
Last week, Fed’s Chair Jerome Powell, alongside some US central bank policymakers, expressed that a faster bond-taper would be needed due to elevated prices. In fact, Chair Powell said that the word “transitory” has to be removed when speaking about inflation, reflecting that it is more stickier than expected. That keeps XAU/USD traders focused on the Consumer Price Index for November, to be unveiled on Friday.
XAU/USD Price Forecast: Technical outlook
In the 1-hour chart, XAU/USD seesawed around $1,772-$1,783, within a narrow-trading-range, as the 200, 50 and the 100-hour simple moving averages (SMA’s) lie at $1,784.27, $1,780.55 and $1,778.11, respectively. From a technical perspective, gold is neutral, though the fact that the 50-HSMA could cross over the 200-HSMA that would form a golden cross that could spur a gold rally.
However, in the short term, in the outcome of breaking above the 200-HSMA, the first resistance would be December 6 high at $1,787.64. The breach of the latter would expose the confluence of a downslope trendline and the R2 daily pivot level around $1,793, followed by an R3 daily pivot at $1,798.
On the flip side, a break below the 100-HSMA would open the door for further losses. The first support would be December 6 low at $1,775.63, followed by S1 daily pivot at $1,773.27, and then the S2 daily pivot at $1,768.44.
- Canadian dollar accelerates to the upside versus the US dollar.
- Stocks sharply higher in Wall Street, oil gains more than 3%.
- Key event ahead: Bank of Canada meeting on Wednesday.
The combination of a rally in crude oil prices, positive market sentiment and a weaker US dollar are pushing USD/CAD sharply lower, the day before the Bank of Canada meeting. The pair is trading near 1.2630, at the lowest level since November 25.
The pair is falling for the second day in a row and fell under the 20-day moving average for the first time in a month. It is down more than a hundred pips so far on Tuesday, having the worst day in weeks.
A stronger CAD before the BoC
The loonie is among the top performers of the American session, supported by many factors, including crude oil prices. The WTI barrel is up by 4.55% at $72.65. At the same time, the Dow Jones is up by 1.50% and the Nasdaq 2.83%.
Despite falling against the loonie, the dollar is up against CHF, EUR, GBP and JPY supported by higher US yields, ahead of next week FOMC meeting. This week's key economic number will be on Friday with US inflation figures.
In Canada, on Wednesday, the Bank of Canada will announce its decision on monetary policy. No change in interest rates is expected. Analysts at TD Securities look for a relatively quiet meeting, with limited scope for a meaningful change in tone. “The BoC will maintain that the outlook is evolving as expected and that inflation strength is largely transitory (…) A quiet BoC meeting shifts CAD drivers to the world at large. In turn, covid uncertainty, heightened risk aversion, and a relatively poor local growth and mobility backdrop should keep USD/CAD hanging around 1.28 for a bit longer.”
Technical levels
US National Institute of Allergy and Infectious Diseases Director Anthony Fauci said on Tuesday that the Omicron Covid-19 variant was "almost certainly" not more severe than the delta variant, according to AFP. These remarks come after Fauci was quoted on CNN over the weekend as saying that it does not look like Omicron has a "great degree of severity".
Market Reaction
US equities and other risk assets continue to surge as markets, in light of increasing evidence that this variant will not be as severe as delta, move to price out pessimism about the economic outlook.
- The S&P 500 surged around 2.0% on Tuesday to close to 4700, bringing it back to pre-Omicron levels.
- Investors rushed to price out prior pessimism about the economic outlook amid the emergence of Omicron, with symptoms looking mild.
US equity markets have been enjoying a broad-based rally on Tuesday as investors continue to price out the Omicron-related economic pessimism that had weighed heavily on the market in recent weeks. Over the past few days, information out of South Africa (the current epicenter of the Omicron Covid-19 variant outbreak) has continued to point to much milder symptoms associated with infection. This lowers the risk of a sharp spike in hospitalisations in the US (and elsewhere) that might weigh on economic growth in Q1 2022.
Thus, investors seem to have come around to the view that last wee’s panicked downside was an overreaction and have instead opted to pile back into risk in what some commentators called a “melt-up”. The S&P 500 currently trades roughly 100 points above Monday’s close at just under 4700 and is now trading back at pre-Omicron levels. The index trades just over 1.0% below record highs printed back on 22 November.
The Dow, meanwhile, was up 1.5% and also back to pre-Omicron levels, though still trade some 2.0% below early November’s record highs. The Nasdaq 100 was up closer to 3.0% despite a further rise in yields across the US treasury curve and leapfrogged the 16K level to hit 16.3K again. For reference, the index trades about 2.7% below November’s record highs just above 16.7K. The CBOE S&P 500 Volatility Index (often referred to as the VIX) was down more than 5.0 points to around 22.0 and near its lowest since the emergence of the Omicron variant.
Outperformance in tech stocks was helped by a surge in Intel’s shares price of more than 4.0% on Tuesday. Investors cheered the news that the co. plans to take its self-driving car unit public in mid-2022 at an estimated valuation of more than $50B. The news helped push the Philadelphia SE Semiconductor index higher by nearly 5.0%.
Ahead, US equity market focus is set to remain on the theme of Omicron. When cases start to spike in the US in the coming weeks, this might cause some volatility, especially if it sparks an overreaction from state governors/health authorities when reimposing economic restrictions. But so long as the severity of illness associated with infection doesn’t surprisingly worsen, investors will likely continue to assume that Omicron doesn’t pose a severe threat to the economic outlook. As long as investors remain confident in the health of the US economy, a high US inflation print on Friday (which would solidify expectations that the Fed will agree to accelerate their QE taper next year) shouldn’t cause equity markets any problems.
The Bank of Canada (BoC) will announce its monetary policy decisions on Wednesday, December 8 at 15:00 GMT and as we get closer to the release time, here are the expectations as forecast by the economists and researchers of seven major banks, regarding the upcoming announcement. No change is expected in the 0.25% overnight rate target but there is a big asterisk now relating to the uncertain impacts of Omicron.
ING
“No policy changes are expected after policymakers decided to end QE in October and brought forward guidance for the timing of the first rate hike to mid-2022. Given less spare capacity than most other economies, we immediately shifted to forecasting four 25bp rate hikes in 2022 after the October announcements, with one hike per quarter. We are reluctant to make any changes to this view right now given the uncertainty over Omicron, but the obvious risk is that the BoC ends up delaying the first hike until 2Q should consumer caution kick in on Covid anxiety. The BoC is also mulling changing its inflation target that could be more explicit about tolerating inflation overshoots in a move that would follow the US. However, the BoC already has a framework that is well understood and already contains flexibility so there seems little need for any radical changes.”
TDS
“We look for a relatively quiet BoC meeting, with limited scope for a meaningful change in tone. The BoC will maintain that the outlook is evolving as expected and that inflation strength is largely transitory. We do not expect any change to guidance, as the statement balances rising uncertainty over COVID-19 and supply chain disruptions from BC floods against labour market strength. A quiet BoC meeting shifts CAD drivers to the world at large. In turn, covid uncertainty, heightened risk aversion, and a relatively poor local growth and mobility backdrop should keep USD/CAD hanging around 1.28 for a bit longer.”
RBC Economics
“The BoC might still be able to point to pockets of weakness in labour markets—long-run unemployment is still elevated, for example. But arguments to keep policy interest rates at emergency low levels are getting thin. The BoC is expected to reiterate that, barring significant further disruptions from the new virus variant, the economy is on track to fully recover by mid-2022, and that interest rate hikes will be warranted at that point. We expect the first rate hike next year to come in April.”
NBF
“We had initially anticipated the rate announcement to be a rather muted affair, there being no accompanying Monetary Policy Report or press conference. But the release of November’s employment data laid waste to these expectations. The sheer strength of the report – 153K jobs were added in the month – calls for a change of tone at the BoC, especially in a context where inflation continues to drift further above the central bank’s target. While we still expect the BoC to maintain the overnight target rate at its lower bound, the language of the statement will have to be tweaked to take into account what has proven to be a much stronger recovery than what the central bank had expected just a few months ago. Granted, this renewed optimism could be tempered by growing uncertainty – the Bank is likely to mention the risks associated with the emergence of the Omicron variant – but that probably won't stop it from setting the stage for a possible rate hike in the first quarter of 2022. Barring a catastrophic surge in COVID-19 hospitalizations, the days of stable interest rate policy are numbered. We see the first BoC rate hike arriving by March of next year.”
Citibank
“We expect the BoC to leave rates unchanged at 0.25% though we will watch for signs the BoC could be considering a rate rise even earlier than the latest guidance for the ‘middle quarters of 2022’. After the hawkish October surprise, we expect a slightly hawkish tone to this meeting with risks tilted to an even more hawkish shift, with BoC perhaps signaling openness to a Q1 hike.”
BofA
“We expect the BoC to keep the policy rate at 0.25% and to maintain its current forward guidance. We expect liftoff in April. But a red-hot labor market means the risk is BoC moves the ‘live’ meetings forward to 1H from the middle quarters of 2022. Hawkish tone may not translate to further front-end selloff or CAD downside due to aggressive BoC pricing and global risks."
CIBC
“Bank of Canada’s meeting would be an opportunity to reinforce the message that rate hikes are on the table for no later than April 2022. It can offer up an even more positive outlook, and signal rate hikes are coming, but the language surrounding that forecast should sound much less certain until we have more information about Omicron, the mutated elephant in the room.”
- EUR/JPY continues to move in ranges, with a bearish bias.
- Dominant trend points to the downside, more losses seen under 127.50.
- Gains below 129.00 should be seen as corrective.
The EUR/JPY is rising on falling on Tuesday, giving back Monday’s gains. The euro peaked near 128.50, and then pulled back. It was unable to remain above 128.00, showing that it continues to face pressure.
The main trend is bearish and EUR/JPY looks poised to test the lower bottom area. The key level to watch on the downside is 127.50. A daily close below should point to more losses, with an immediate target at 127.00, followed by 126.70.
Technical indicators are giving mixed signs, affected by the consolidation moves in a small range. RSI is turning south, but Momentum keeps a positive slope. Despite being unable to confirm levels above 128.00, so far the decline has been limited.
If the euro, breaks and posts a close above 128.00, it would gain momentum for a test of 128.50. A daily close above 130.00 should be a potential sign the euro has probable established an interim bottom.
EUR/JPY daily chart
-637744883429120800.png)
- EUR/GBP is trading just under 0.8500 where it is finding support in the form of last week’s lows and the 50DMA.
- The pair has been weighed this week by improving risk appetite but faces high BoE and ECB policy uncertainty.
EUR/GBP is currently trading marginally lower on the session slightly to the south of the 0.8500 level, though support in the form of last week’s low at 0.8490 and the 50-day moving average at 0.8485 is keeping a floor under the price action for now. Risk appetite has been improving since the start of the week which generally favours the comparatively risk-sensitive GBP versus the euro. This has helped the pair reverse back under 0.8500 from this week’s opening levels near 0.8550.
Eurozone data
Eurozone data largely did not impact FX market sentiment on Thursday. German Industrial Production saw a much bigger than expected 2.8% bounce in October, though analysts warned that supply chain disruptions would continue to hamper the recovery in output in the months ahead. The December German ZEW survey was mixed, with current conditions (amid lockdowns) posting a surprise drop into negative territory versus overall economic sentiment posting a smaller than expected drop. Finally, the final estimates of Eurozone GDP growth and employment change in Q3 were left unchanged at 2.2% and 0.9% QoQ respectively.
Central bank uncertainty
Seeing EUR/GBP stall at resistance in the 0.8500 area is not to surprising given the current environment of uncertainty regarding ECB and BoE policy in the coming months. With regards to the Bank of England, the more cautious tone from policymakers on the risks posed by the Omicron outbreak has resulted in money markets pricing out a rate hike later this month. But traders, many of whom were wrong-footed when the bank opted to go against market expectations and not hike rates by 15bps last month, will be wary that another BoE surprise might be in store. Policymakers have unanimously signaled that rates will need to begin gradually rising in the coming months – it is just a question of when.
Meanwhile, ECB policymakers seem in two minds about what to do with the bank’s pre-pandemic Asset Purchase Programme when the PEPP expires in March. Prior orthodoxy had been that the APP would be bumped higher to make up for the ending of the PEPP next March. But amid high inflation and load calls from hawkish governing council members, ECB members seem to now be leaning towards leaving the APP unchanged.
Ahead
In terms of the rest of the week, euro traders will be on notice for a barrage of ECB speak on Wednesday and Friday, but there is otherwise not any further important data releases for the region. Sterling traders, meanwhile, will be keeping an eye on October's monthly GDP and economic activity numbers out on Friday.
- The NZD/USD pair is advancing 0.27%, amid a positive risk appetite.
- The omicron variant, even though highly transmissible, seems mild based on cases so far.
- NZD/USD Price Forecast: Tilted to the upside in the near term, but downside risks remain.
After reaching a new year-to-date low on Monday, the NZD/USD is staging a comeback on Tuesday’s New York session, trading around 0.6772 at the time of writing. The market sentiment is upbeat, as portrayed by global equity markets, which are making gains. Although the newly discovered omicron variant is more contagious than other strains, COVID-19 patients with that variant have only shown mild symptoms. Also, crossing the wires, an antibody treatment created by Glaxo works on the omicron variant, as reported by studies.
In the overnight session, the NZD/USD dipped to a new year-to-date low at 0.6735, then rebounded towards the 100-hour simple moving averages (SMA), dynamic resistance that stalled the upside move triggered by US dollar weakness. In the last couple of hours, the greenback regained some demand, pushing the pair towards the 50-SMA at 0.6754 to stabilize at current levels.
An absent economic docket in New Zealand and the US left the NZD/USD pair relying in the dynamics of market sentiment, the USD, and China’s news.
During the Asian session, China reported that its Exports increased by 22% dollar-denominated up to $326 billion, while imports grew almost 32% to about $254 billion. Estimates were in the range of 20.3% and 21.5%, respectively. According to sources cited by Bloomberg, “exports picked up in line with seasonality in November and suggest still pretty solid momentum in external demand.”
NZD/USD Price Forecast: Technical outlook
On the 1-hour chart, the NZD/USD pair is trading to the upside in the near term, but downside risks remain. The 100-SMA at 0.6782, which confluences around the R3 daily pivot level, could stall any upward move, as previously done three times throughout the day. That, alongside the 50-SMA at 0.6754, might keep the pair trading sideways due to the lack of a catalyst other than pure market sentiment.
In the event that it should break above the 100-hour SMA, the first line of resistance would be the 200-hour SMA at 0.6805. A breach of that level would expose the December 2 high at 0.6830.
On the other hand, a break below the 50-hour SMA would expose the year-to-date low at 0.6736, followed by the figure at 0.6700.
-637744861273573951.png)
- Ivey PMI stayed at 61.2 in November, indicating strong business conditions in Canada.
- USD/CAD was unreactive but continued to trade close to session lows in the mid-1.2600s, weighed amid risk-on and higher crude prices.
Canada's Ivey PMI, which is released by the Richard Ivey School of Business each month and captures business conditions in Canada, remains at 61.2 in November after also printing 61.2 in October. As with other PMI indicators, a result above 50 is generally associated with MoM growth in economic activity. Thus, Canada's Ivey PMI suggests business conditions in the country remained strong last month.
Market Reaction
USD/CAD did not see any notable reaction to the latest Ivey PMI data, just as it ignored positive trade figures earlier in the session. The pair is currently trading close to session lows in the 1.2660s just above the 21-day moving average at close to 1.2650 and is down about 0.7% on the day. Risk-on and an associated rebound in crude oil prices, as markets price out recent Omicron-related pessimism, is helping the loonie to appreciate on Tuesday ahead of Wednesday's BoC rate decision.
- EUR/USD dipped below 1.1250 in recent trade as risk appetite recovers and traders up their hawkish Fed bets.
- Bears will be eyeing a move back towards recent annual lows under 1.1200.
EUR/USD has been under pressure in recent trade as the market’s broader appetite for risk has continued to pick up. The pair slipped below 1.1250 in recent trade and even managed to momentarily eclipse last Tuesday’s post-hawkish Fed Chair Jerome Powell testimony lows at 1.1235. At its current levels, EUR/USD is now trading lower by about 0.4% on the day, making the euro the joint-worst performing G10 currency on the day alongside the Swedish krona. The bears will likely be looking for a retest of recent annual lows under 1.1200 in the coming sessions.
Driving the day
Improving risk appetite has been the major driver of EUR/USD downside move on Tuesday. Traders and analysts have been citing receding Omicron fears and Chinese stimulus hopes as driving the broad rebound in sentiment that saw the S&P 500 open 1.2% higher and the Stoxx 600 index trading nearly 2.0% higher on Tuesday. Market participants appear to be coming around to the idea that the Omicron variant causes milder symptoms than past Covid-19 variant, thus posing less of a threat to the economic outlook.
Thus, expectations for Fed monetary policy tightening in 2022 have broadly returned to pre-Omicron levels. The implied yield on the December 2022 three-month eurodollar future rose back to 1.05% on Tuesday, up from under 1.0% at the start of the week and as low as 0.8% at the end of December. In the absence of any important US data releases or Fed speak (Fed members are in blackout ahead of next week’s meeting), this recent repricing has clearly been a function of improvement in the market’s broader risk appetite.
Central bank policy divergence remains the main theme driving EUR/USD in the medium-term. Another rise in US Consumer Price Inflation (CPI) numbers at the end of the week ought to solidify market expectations for the Fed to agree to accelerate the pace of their QE taper from January, which could further weigh on EUR/USD. Recent ECB-related newsflow is noteworthy, however.
Hawkish ECB member Robert Holzmann recently remarked that inflation will probably exceed the bank’s 2.0% target in 2022, well above the bank’s current forecast of inflation of 1.7% next year. Fellow hawk Madis Muller also raised similar concerns. Meanwhile, according to ECB sources, policymakers at the bank are second-guessing prior commitments made to ongoing stimulus amid higher-than-expected inflation. Regarding QE, some policymakers are reportedly reluctant to commit to anything beyond the end of Q2 2022. If it does emerge that the ECB is not going to increase the APP to make up for the end of the PEPP in March next year, as seems increasingly likely, this may support the euro against the low-yielding yen and Swiss franc, but probably not against USD, given that the Fed will, in any case, remain well ahead of the ECB in terms of monetary normalisation.
USD/CAD has broken under 1.27. Economists at Scotiabank think the pair could plunge as low as the 1.2571 mark.
USD/CAD set to suffer additional losses
“Fundamental drivers suggest some modest scope at least for additional CAD gains in the near-term and should reinforce USD resistance around the 1.28 point.”
“After six solid weeks of USD gains, a fairly firm CAD reversal seems to be developing on the charts, even if it remains very early in the week to draw too many conclusions from the longer run charts. Shorter-term CAD technicals are clearly more positive, however; retracement potential extends to 1.2638 (38.2% Fibonacci retracement of the Oct/Dec USD rise) intraday, with the 50% retracement support at 1.2571 perhaps in reach over the next 24 hours or so.”
EUR/USD drifted into the negative territory for the second successive day on Tuesday. Economists at Scotiabank note that a slump below the 1.12 level would open up the 1.10 mark.
Initial resistance seen at 1.1280
“Downward pressure towards a retest of 1.12 remains firmly in place (albeit at a relatively slow pace).”
“The EUR faces limited support past the 1.12 area, with a break under the level liable to extend to 1.10.”
“Intraday resistance stands at ~1.1280 and then the 1.1300/10 zone stands as the main obstacle for the EUR.”
- GBP/USD witnessed an intraday turnaround from the vicinity of the 1.3300 mark on Tuesday.
- Hawkish Fed expectations continued underpinning the USD and exerted pressure on the pair.
- Some follow-through selling below the 1.3200 mark will set the stage for additional losses.
The USD caught some bids during the early North American session and dragged the GBP/USD pair to a fresh daily low, around the 1.3220-15 region in the last hour.
The pair struggled to capitalize on its modest intraday gains, instead met with a fresh supply near the 1.3290 area on Tuesday amid a modest pickup in the US dollar demand. Growing market acceptance that the Fed would hike interest rates sooner rather than later to contain stubbornly high inflation continued acting as a tailwind for the USD.
Apart from this, a further recovery in the US Treasury bond yields underpinned the buck and exerted downward pressure on the GBP/USD pair. Bulls failed to gain any respite from the prevalent risk-on mood – which tends to undermine the safe-haven greenback – and largely shrugged off the prospects for an imminent rate hike by the Bank of England.
With the latest leg down, the GBP/USD pair has now eroded a major part of the overnight recovery gains and moved well within the striking distance of the 1.3200 mark. A convincing break below the latter will be seen as a fresh trigger for bearish traders and set the stage for additional losses amid persistent Brexit-related uncertainties.
In the absence of any major market-moving economic releases, the USD price dynamics will continue to play a key role in influencing the GBP/USD pair and produce some short-term trading opportunities. Traders will further take cues from the US bond yields, developments surrounding the coronavirus saga and the broader market risk sentiment.
Technical levels to watch
AUD/CAD’s break under the base of the recent range around 0.91 likely condemns the AUD to more weakness moving ahead. Economists at Scotiabank expect the pair to drop towards 0.88.
Technical indicators are aligned bearishly for the AUD
“The daily, weekly and monthly DMI oscillators are aligned bearishly for the AUD which will limit its powers of recovery for now and maintain focus on the downside.”
“We expect solid resistance now on AUD gains to the 0.91 area and feel risks have tipped quite a bit more strongly towards a drop in the AUD to 0.88.”
- USD/JPY climbed to a one-week high on Tuesday and was supported by a combination of factors.
- The risk-on mood undermined the safe-haven JPY and extended some support to the major.
- Rising Fed rate hike bets, recovering US bond yields benefitted the USD and remained supportive.
The USD/JPY pair traded with a positive bias through the early North American session and was last seen trading around the 113.65-70 region, or a one-week high set earlier this Tuesday.
A combination of supporting factors assisted the USD/JPY pair to build on the previous day's positive move and gain some follow-through traction for the second successive day on Tuesday. Easing concerns about the economic fallout from the new Omicron variant remained supportive of the prevalent risk-on environment. This, in turn, undermined the safe-haven Japanese yen and acted as a tailwind for the major.
On the other hand, the US dollar drew some support from rising bets for a faster Fed liftoff and a further recovery in the US Treasury bond yields. In fact, the markets have been pricing in the possibility for an eventual Fed rate hike move in May 2022 amid worries about stubbornly high inflation. This provided an additional lift to the USD/JPY pair, though the uptick lacked strong bullish conviction.
The fundamental backdrop seems tilted in favour of bullish traders, though the lack of follow-through buying warrants some caution before positioning for any further appreciating move. In the absence of any major market-moving economic releases, the US bond yields would play a key role in influencing the USD price dynamics. Apart from this, the broader market risk sentiment should provide some impetus to the USD/JPY pair.
Technical levels to watch
- Canada posted a stronger than expected trade surplus in October.
- USD/CAD largely ignored the data, though the loonie continues to perform well on Tuesday amid risk-on and higher oil prices.
Canada's merchandise trade surplus with the world widened to C$2.09 billion in October from C$1.42 billion in September, monthly data published by Statistics Canada revealed on Tuesday. This reading beat market expectations for a surplus of C$2.00 billion. Canadian exports in October rose to C$56.18B from C$52.8B in September, whilst imports rose to C$54.9B from C$51.39B.
Market Reaction
The loonie largely ignored the strong trade figures. USD/CAD has been under selling pressure on Tuesday as the loonie benefits from risk-on vibes and higher oil prices ahead of Wednesday's BoC rate decision and the release of November Ivey PMI data later in the session. The pair is now trading under 1.2600 and is already down over 1.0% on the week.
- The US trade deficit shrunk in October, though not by quite as much as expected.
- The DXY did not react to the data, though did recently break back to the north of the 96.50 level.
The US goods and services trade deficit shrank to $67.1B in October from $81.4B in September, the US Census Bureau reported on Tuesday. That was larger than the expected trade deficit on the month of $66.8B. Monthly imports rose to $290.70B from $288.20B in September, whilst monthly exports surged to $233.60B in October from $206.80B the month prior.
Market Reaction
The DXY has moved to session highs above 96.50 in recent trade, though the bulk of this move happened prior to the data release and seems to be more a function of broader risk appetite.
European Central Bank governing council member Madis Muller said on Tuesday that it is not obvious that the bank should be adding to its Asset Purchase Programme purchase volumes beyond March in light of high inflation and the uncertainty outlook. It would not be wise to commit to any specific level of purchases for more than a few quarters ahead, he added.
Muller said that inflation will take longer to come down than expected and risks remain tilted to the upside, echoing the tone of other concerned ECB policymakers. Eurozone inflation may be above target next year, he added (a point which fellow ECB member Holzmann recently made) and that longer-term projections may need to be raised. Finally, Holzman said that each new wave of the pandemic has a lower impact on the economy and that the medium-term growth outlook for the Eurozone is broadly unchanged.
Market Reaction
The hawkish tone of remarks from ECB's Muller have been unable to give the euro a lift in recent trade, with the currency continuing to trade close to session lows in the 1.1250 area.
- WTI has continued to rally on Tuesday and was at one point probing $72.00.
- Receding Covid-19 fears, signs of strong demand and continued impasse in talks with Iran are all being cited as supportive.
The oil market’s impressive rebound has continued this Tuesday. After surging more than 5.0% on Monday from the $66.00s to the psychologically important $70.00 level, front-month WTI futures have pushed on to probe the $72.00 area on Tuesday. With WTI currently trading close to $71.50, that translates into on-the-day gains of nearly $1.50. WTI is now nearly up $10 from last week’s near-$62.00 lows. The next significant area of resistance for WTI is at $73.00 and then, above that, around $75.00. To the downside, any dips back towards the 200DMA at $70.00 remain subject to being bought.
Driving the day
Traders/analysts are citing receding Omicron fears, indicators of strong oil demand (the Saudis raised their official selling price to Asian customers over the weekend) and continued impasse in Iran/US/EU nuclear deal negotiations as supportive of the price action.
Referring to comments made by top US infectious disease expert Anthony Fauci on CNN over the weekend about the apparent mildness of Omicron infection symptoms, Jeffrey Halley, senior market analyst at OANDA, told Reuters that “the Fauci comments… saw more fast money returning to the long oil trade as markets started pricing a resumption of the global recovery and higher oil consumption”. “This (mildness of Omicron symptoms) lowers the probability of the worst-case scenario that the oil markets have been pricing in over the past couple of weeks” analysts at ANZ added.
Referring to Iran nuclear negotiations, CBA analysts Vivek Dhar said that while the talks could still find success when they recommence later this week, “markets may need to consider a more prolonged delay to Iranian oil exports”. This is a “positive for oil prices and supports OPEC+ plans to boost oil production through 2022” he added. Elsewhere, Chinese trade data overnight showed that imports had rebounded in November.
The S&P 500 has encouragingly stabilized above key support from its rising medium-term 63-day average, now seen at 4526. A close above 4608/13 is needed to increase the likelihood a more important low may be in place and core uptrend resumed, economists at Credit Suisse report.
Close below the 63-day average at 4526 to mark a more concerted correction lower
“A close above the 13-day exponential average and short-term downtrend at 4608/13 is needed to ease the pressure off the 63-day average and increase the likelihood a more important low may again be in place, with key price resistance still seen at 4653/55. Beyond this latter area is in our view needed to confirm the core uptrend has indeed resumed for a move back to the 4744/50 highs/Q4 objective.”
“Support moves to 4589/88 initially, then 4571, with the immediate risk seen higher whilst above 4541. A close below the 63-day average at 4526 remains needed to mark a more concerted correction lower with support then seen next at 4496/95 ahead of 4448/38.”
- A combination of supporting factors pushed AUD/USD higher for the second straight day.
- The perceived riskier aussie benefitted from the risk-on mood and RBA’s optimistic outlook.
- Hawkish Fed expectations continued underpinning the USD and might cap gains for the pair.
The AUD/USD pair shot to a three-day high during the mid-European session, with bulls looking to build on the momentum further beyond the 0.7100 round-figure mark.
The pair gained strong follow-through traction for the second successive day on Tuesday and built on the previous day's recovery move from the lowest level since November 2020. The prevalent risk-on environment, along with the Reserve Bank of Australia's upbeat outlook turned out to be a key factor that acted as a tailwind for the AUD/USD pair.
The market concerns about the economic fallout from the new variant of the coronavirus eased after reports indicated that Omicron patients had only shown mild symptoms. This was evident from a strong bullish trading sentiment around the equity markets, which, in turn, drove flows towards perceived riskier currencies, including the Australian dollar.
The aussie got an additional boost after the RBA indicated the Omicron variant outbreak was unlikely to derail the current economic recovery. This was seen as a hint that the RBA may raise interest rates sooner than expected and remained supportive of the strong intraday move up. That said, a stronger US dollar could cap any further for the AUD/USD pair.
The greenback continued drawing some support from firming expectations that the Fed would tighten its monetary policy sooner rather than later to contain stubbornly high inflation. This, along with a further recovery in the US Treasury bond yields, extended some support to the USD and might hold back bulls from placing aggressive bets around the AUD/USD pair.
Even from a technical perspective, RSI (14) on the 1-hour chart is pointing to overbought conditions and further warrants some caution. Hence, it will be prudent to wait for a sustained strength beyond the 200-hour SMA, currently around the 0.7110 region before confirming that the AUD/USD pair has bottomed out and positioning for any further appreciating move.
Technical levels to watch
- Spot gold continues to trade subdued in the $1780 area as real yields remain flat on the week.
- Markets are in wait-and-see mode ahead of Friday’s US Consumer Price Inflation report.
Spot gold (XAU/USD) prices have been subdued thus far this Tuesday and have continued to trade within this week’s $1775-$1785ish ranges. The broader market mood is one of risk on for a second consecutive day, with risk assets (stocks, oil) broadly building on Monday’s gains and this, for the most part, weighing on safe-haven assets (yen, bonds). Omicron-related fears have eased in recent days as more evidence has emerged from South Africa alluding to the variant’s comparative mildness versus previous Covid-19 variants. Traders are also citing easing from the PBoC this week and indications from Chinese authorities that they will step in to assure healthy growth in 2022 as positive for risk appetite.
For now, gold has been largely immune to the broad recovery in risk appetite this week, despite it typically being seen as a safe haven asset that should depreciate in value in such an environment. That’s probably because US real yields, with which spot gold has a close correlation, have remained subdued this week, despite a sharp rise in nominal yields. For reference, the 10-year TIPS yield is little moved on the week just under -1.0%, while the 5-year TIPS yield is also broadly flat and trading in the -1.50s% area.
Gold has a negative correlation to US real yields, which market participants use as a proxy for opportunity cost. As real yields rise, the opportunity cost of holding non-yielding gold rises with it, undermining demand for the precious metal. Real yields, gold and FX markets will be eyeing this week’s US Consumer Price Inflation (CPI) data for indications as to any potential policy changes the Fed might announce next Wednesday after the FOMC meeting.
At present, recent hawkish rhetoric from Fed Chair Jerome Powell and others on the FOMC has markets expecting that the bank will announce an acceleration of its QE taper this month. A further rise in CPI should confirm this. But, despite high inflation, bond markets remain unconvinced that the Fed’s plans on tightening monetary policy will be sufficient to get real yields back into positive territory. Should that start to change and real yields charge higher, gold could be headed back to a test of recent lows in the $1760 region.
Economists at Société Générale see little room for the USD/CNY to head lower to 6.30 by the year-end and expect the yuan to weaken afterwards. They expect the pair to reach the 6.50 level in the second half of 2022.
Weaker CNY call delayed, not dismissed
“We see a small window for the USD/CNY to head lower to 6.30 by the end of 2021. Our view remains that the CNY will weaken, given our expectations of a further slowdown in China’s growth and a strengthening USD next year.”
“Over the course of 2022, we expect the USD/CNY to bottom out and grind higher to 6.35 in 1Q, 6.45 in 2Q and reach a plateau of 6.50 in 2H.”
- USD/CAD witnessed heavy selling for the second successive day on Tuesday.
- Rallying oil prices underpinned the loonie and exerted pressure on the pair.
- A stronger USD did little to impress bullish traders or stall the ongoing slide.
The USD/CAD pair continued drifting lower through the mid-European session and dropped to over a one-week low, around the 1.2680 region in the last hour.
The pair extended the previous day's retracement slide from the vicinity of mid-1.2800s, or the highest level since September 20 and witnessed heavy selling for the second successive day on Tuesday. Crude oil prices built on the overnight strong rally and boosted the commodity-linked loonie, which, in turn, exerted heavy pressure on the USD/CAD pair.
Concerns about the impact of the new coronavirus variant on the global fuel demand eased after reports indicated that Omicron patients had only shown mild symptoms. Apart from this, stalled Iran nuclear talks delayed the return of additional crude supply and further underpinned the black gold amid the prevalent strong risk-on mood in the financial markets.
On the other hand, the US dollar continued drawing some support from firming expectations that the Fed would tighten its monetary policy sooner rather than later to contain stubbornly high inflation. This, along with a further recovery in the US Treasury bond yields, acted as a tailwind for the greenback, albeit did little to lend any support to the USD/CAD pair.
That said, extremely oversold conditions on the 1-hour chart warrant some caution before placing fresh bearish bets around the USD/CAD pair. Investors might also refrain from placing aggressive bets ahead of the Bank of Canada monetary policy meeting on Wednesday. This, in turn, supports prospects for the emergence of some buying and a modest intraday recovery.
Heading into the key central bank event risk, traders on Tuesday might take cues from the release of trade balance data from the US and Canada. This, along with Canadian Ivey PMI and oil price dynamics, will influence the loonie. On the other hand, the broader market risk sentiment will drive the USD demand and produce some trading opportunities around the USD/CAD pair.
Technical levels to watch
AUD/USD has experienced a steady decline since forming a high near 0.8000 in February 2021. As economists at Société Générale note, head and shoulders pattern points towards risk of persistent downward move to potentially 0.6660.
Near-term hurdle seen at 0.7250
“Interestingly, the pair has formed a Head and Shoulders pattern and is breaking below the neckline. The downward move has persisted towards November 2020 lows; large upside is not envisaged.”
“0.7250, which marks the 23.6% retracement of the recent decline, is likely to be a near-term hurdle.”
“The formation points towards risk of the downtrend continuing towards 0.6770 and perhaps even towards projections of 0.6660.”
GBP/CAD is struggling to extend gains through the 1.71 area that has served as a lid for this market since October. Economists at Scotiabank note that a break above here is crucial to see another leg higher.
GBP/CAD price action retains a positive undertone
“Short, medium and long-term oscillators are mixed which rather suggests the flattish range trade will extend a little longer.”
“We do note that there is a bit of an inverse Head & Shoulders ‘whiff’ to price action since October, which fits with our broader view that the pound’s bounce from the 1.67/1.68 zone could well extend. But that 1.71 resistance zone needs to be taken out sooner rather than later if the GBP is to progress.”
Slovak central bank Governor and European Central Bank governing council member Peter Kazimir crossed the wires in the last hour, saying that we should be wary of premature tightening.
Additional quotes:
- Medium to long term inflation risks skewed to the upside
- APP will be the key instrument in the future
- Important we do not tinker with the APP.
- We should not overcomplicate things with new envelopes or instruments.
- We should not make too long commitments on asset purchases.
- The current calibration of purchases is a good baseline for potential downside or upside deviations we may decide in the future.
Market reaction:
The comments did little to provide any meaningful impetus to the shared currency or lend any support to the EUR/USD pair, which was last seen hovering near a one-week low.
The upward move in GBP/USD petered out after two failed attempts to overcome 1.4240 earlier this year in February and June. A steady downtrend has taken shape from those levels. Economists at Société Générale note the prevalence of downward momentum and expect the cable to test the 1.3130/1.3000 support zone.
Overcoming 1.3800/1.3840 will denote the return of bullish momentum
“GBP/USD has now reached the weekly Ichimoku cloud and is within touching distance of the potential support zone at 1.3130/1.3000, representing projections for the downward move and close to the 38.2% retracement from 2020.”
“Defending the 1.3130/1.3000 zone could result in a bounce; however, the 200-DMA near 1.3800/1.3840 will be a crucial resistance level in the near-term. Overcoming this hurdle will be pivotal, as it will denote the return of bullish momentum.”
The EUR/USD pair has returned near 1.1160. Although the euro may see a minor recovery in the near-term, economists at Société Générale expect EUR/USD to nosedive towards 1.0840 on a break below 1.1160.
Break above 1.17 needed to denote a potential trend reversal
“An initial bounce is taking shape; however, signals of a trend reversal are still not visible.”
“The descending trend line at 1.1525/1.1600 should be a short-term resistance level. The pair has to establish itself back above graphical resistance of 1.1700, which consists of the low from last March and the October peak, to denote a potential trend reversal.”
“If the pair fails to form a base at current levels and the downtrend continues beyond 1.1160, the next potential objective is 1.1040, the 76.4% retracement from 2020, and perhaps even 1.0840.”
Economists at Crédit Agricole have assessed the USD’s outlook and see limited scope for further upside as a lot of positives seem to be in the price.
The USD Is still smiling
"The USD outlook in the near-term could continue to follow the logic of the so-called ‘USD smile’ – the currency can benefit from its status as a safe haven during bouts of risk aversion while attracting inflows from carry investors during periods of recovering risk appetite.”
“A drain of excess USD liquidity into year-end and Q122 can further give the currency a boost. That said, a lot of positives seem to be in the price of the overbought and overvalued USD.”
“The biggest losers can be the currencies of commodity importers and manufacturing exporters with relatively dovish central banks like the EUR, CHF and JPY. The EUR could further struggle as the French presidential elections come into view in Q122. That being said, we further note that the EUR and JPY are looking very undervalued already.”
The Australian dollar has continued to outperform at the start of this week following the Reserve Bank of Australia’s latest policy meeting. As the RBA is expected to speed up and potentially end QE as soon as at the February meeting, the aussie is set to enjoy further gains, economists at MUFG Bank report.
AUD boosted by an upbeat tone by the RBA
“The AUD has benefitted both from fresh policy stimulus in China and from heightened speculation that the RBA could bring an earlier end to their QE programme next year.”
“A decision by the Fed to speed up QE tapering alongside could encourage the RBA to speed up tapering plans as well early next year.”
“The tone of the statement does suggest that the RBA is expecting the Australian economy to continue recovering in the year ahead which will require a further withdrawal of policy stimulus.”
“The RBA’s plans for rate hikes only as early as 2023 are based on the important assumptions that underlying inflation remains low and wage growth modest. If these assumptions are challenged the RBA will come under more pressure to speed up rate hike plans.”
The US Dollar Index (DXY) formed a base near the 89.50 level and the breakout has resulted in a steady uptrend. Economists at Société Générale expect the DXY to climb as high as the 99.75 mark.
Bullish outlook while above the 95.10/94.50 suppot zone
“On longer-term charts, the price action since 2017 appears to be evolving along two converging trend lines, which denotes the DXY is still within a wide range, with limits at 89.50/89.20 and 103.00. These will be pivotal levels.”
“Shorter-term, the index is seeing an initial pullback; however, a multi-month trend line near 95.10/94.50, which marks the 23.6% retracement of the uptrend since January 2021, is a potential support level. As long as this holds, a deeper downtrend is not envisaged.”
“Defending the 95.10/94.50 zone could result in continuation of the upward move towards 97.70 and perhaps even towards 99.75, which marks the 76.4% retracement from 2020.”
Stronger dollar and rising concerns regarding the Omicron variant has driven the USD/INR back to above 75. Economists at Société Générale expect the pair to trade within a 75-77 range over 2022.
Rupee’s downtrend to linger in the medium-term
“In the medium-term, we expect the trend weakness vs the dollar to persist, as market expectations of a Fed rate hike increasingly gain momentum. However, we expect FX volatility to remain low, as the RBI’s own policy normalisation should mitigate some FX risks.”
“Equity flows, IPO-related flows and a prospective bond index inclusion should all remain supportive of the currency. We expect range-bound price action for the INR next year (75-77).”
The Canadian dollar has recovered some of its recent losses at the start of this week ahead of the Bank of Canada meeting on Wednesday. Omicron's emergence will mean the BoC will tread carefully, in the view of economists at ING, who expect only a limited impact on the loonie.
Expecting a limited impact on CAD
“We believe that a cautious approach this week by the BoC given the lingering uncertainty around the risks and economic impact of the new variant should not surprise the market and hit CAD as long as policymakers do not go as far as signalling there are risks of a deviation from current policy plans.”
“We think the BoC won't surprise markets and that CAD will be only marginally impacted by the policy meeting this week, leaving the currency almost solely driven by external factors for now.”
“Barring a major setback to the global economy due to the Omicron variant, we still expect USD/CAD to consistently trade below 1.25 in 2022.”
- EUR/USD drifted into the negative territory for the second successive day on Tuesday.
- Hawkish Fed expectations continued underpinning the USD and exerted some pressure.
- Encouraging German/Eurozone macro data failed to impress bulls or provide any impetus.
The EUR/USD pair dropped to over one-week low, around mid-1.1200s during the early European session, albeit quickly recovered a few pips thereafter. The pair was last seen trading around 1.1270 area, down only 0.10% for the day.
The pair struggled to capitalize on its modest uptick, instead met with a fresh supply near the 1.1300 mark and turned lower for the second successive day on Tuesday. This also marked the fourth day of a downtick in the previous five sessions and was sponsored by the emergence of some US dollar buying.
Investors have been pricing in the prospects for an eventual Fed liftoff in May 2022 amid worries about stubbornly high inflation. This, along with a further recovery in the US Treasury bond yields, continued underpinning the greenback and exerted some downward pressure on the EUR/USD pair.
Meanwhile, the risk sentiment remained well supported by easing fears about the economic fallout from the new Omicron variant of the coronavirus. This, in turn, held back traders from placing aggressive bullish bets around the safe-haven USD and helped limit the downside for the EUR/USD pair.
On the economic data front, German Industrial Production data, which recorded strong growth and jumped 2.8% MoM in October. Apart from this, the German and Eurozone ZEW Economic Sentiment Index surpassed market expectations and further extended some support to the shared currency.
That said, the EUR/USD pair's inability to gain any meaningful traction favours bearish traders and supports prospects for a further near-term depreciating move. Hence, a subsequent fall back towards testing sub-1.1200 levels, or the YTD low touched in November, remains a distinct possibility.
There isn't any major market-moving economic data due for release from the US on Tuesday, leaving the USD at the mercy of the US bond yields. Apart from this, the broader market risk sentiment will influence the USD price dynamics and produce some trading opportunities around the EUR/USD pair.
Technical levels to watch
- German ZEW Economic Sentiment arrived at 29.9 in December, down from 31.7 previous.
- The ZEW Current Situation for Germany came in at -7.4 in December vs. 12.5 in November.
- EUR/USD remains in the red below 1.1300 on mixed ZEW data.
The German ZEW headline numbers for December showed that the Economic Sentiment Index unexpectedly improved to 29.9 from 31.7 previous while beating estimates of 25.3.
Meanwhile, the Current Conditions sub-index slumped to -7.4 in December as against 12.5 recorded in the previous month and 5.0 expectations.
The Eurozone ZEW Economic Sentiment for December rose to 26.8 for the current month as compared to the 25.9 previous.
Separately, the third estimate of the bloc’s Q3 Gross Domestic Product (GDP) came in at 2.2% QoQ vs. 2.2% expected and 2.2% previous.
The Eurozone Employment Change for Q3 arrived at 0.9% QoQ vs. 0.9% expected.
FX market reaction
The euro remains pressured against the US dollar on the mixed ZEW Surveys. EUR/USD drops 0.12% on the day to trade at 1.1272, as of writing.
EUR/PLN has staged a pullback after facing resistance near the upper limit of a multi month channel at 4.7400 last month. Economists at Société Générale expect the pair to rebound towards 4.6460 as the 200-day moving average (DMA) at 4.57 holds.
200-DMA at 4.57 to act as first layer of support
“EUR/PLN is now drifting towards an ascending trend line drawn since June at 4.5700 which is also the 200-DMA. This is expected to act as first layer of support. Test of this level can result in a short-term rebound.”
“Holding above 4.5700, EUR/PLN is expected to bounce towards 4.6460, the 38.2% retracement of the pullback and 4.7050.”
- WTI recapture $71, as the upside extends above the 200-DMA.
- Iran crude supply delay and easing Omicron fears lift the black gold.
- US API data and covid updates in focus for fresh trading impulse.
WTI (NYMEX futures) is sitting at six-day highs above $71, helped by the improving risk appetite amid easing fears over the impact of the new Omicron covid variant on the economic growth.
Global scientists have downplayed the effects of the new variant, as being mild. The risk-on market profile is boding well for the higher-yielding black gold.
Another factor supporting oil prices is the delay in crude oil supplies from Iran after talks to revive the Iran nuclear deal stalled on Friday. Talks will continue, officials from Iran and Europe said, with the negotiations expected to resume in the middle of next week in Vienna.
Also, recapturing the critical 200-Daily Moving Average (DMA) at $69.94 has provided the much-needed boost to WTI bulls.
The focus now shifts towards the US weekly crude stockpiles data due to be released by the American Petroleum Institute (API) later this Tuesday. However, the risk trends will continue to remain the main market motor.
WTI: Technical levels to consider
- GBP/USD stalls its rebound just shy of 1.3300 in the European session.
- The US dollar drops amid an upbeat market mood while yields hold firmer.
- Rising Omicron cases in the UK offset encouraging Brexit news.
GBP/USD is paring back gains while heading towards 1.3250 in the European session, as rising cases of the new Omicron covid variant in the UK overshadows the broader market optimism.
The pound bears the brunt of the unstoppable growth in new infections, with 336 confirmed cases of the highly-mutated variant across the UK on Monday, a rise of 90 from Sunday.
The UK Health Secretary Sajid Javid said that “there is community transmission of the Omicron coronavirus variant in multiple regions of England.”
In light of this, cable traders have failed to capitalize on the prevalent risk-on sentiment, fuelled by the Chinese stimulus measures and easing fears over the new covid strain worldwide.
Markets have also ignored the latest positive developments on the Brexit front, as well as, the encouraging comments from the UK drugmaker GlaxoSmithKline.
The pharma giant said that the data was built on a promising signal published last week, underscoring the importance of Sotrovimab for the early treatment of COVID-19.
On the latest Brexit update, the UK is expected to offer France an olive branch to resolve the fishing row, per The Telegraph. British sources said an agreement could be reached on ‘replacement boats’, which would allow issuing of more permits to EU vessels.
Looking ahead, the Omicron stats from the UK will be closely eyed amid a data-dry calendar. The dynamics in the yields and the dollar could also impact the major.
GBP/USD: Technical levels to consider
Over the last week, things have gone from bad to worse for the Norwegian krone. However, economists at Nordea believe that we are near the top in both EUR/NOK and USD/NOK – NOK should strengthen when risk-sentiment improves and oil prices rise again.
Omicron will steer markets
“We believe the risk for the oil price is to the upside over the short-term as the cold weather should give oil demand an extra boost during the winter months. Higher oil prices will be good news for NOK.”
“There are signs that Omicron is milder compared to Delta strain and early indications suggest that vaccines are still effective against severe disease. If this is proven to be the case over the next few weeks, sentiment in financial markets should improve. Conversely, if Omicron is proven to be worse and/or vaccines to be ineffective, things could worsen a bit more.”
“Norges Bank’s rate meeting next week could impact the NOK. Some pundits have even gone so far as to question the December hike. We don’t share their view. As things look now, we believe Norges Bank will hike in December and publish a similar rate path as the one from September.”
EUR/USD keeps its recovery mode capped below 1.1300. Economists at ING believe that the world’s most popular currency pair could challenge the 1.1200 once again.
Limited upside potential
“It appears that the euro’s role as a funding currency is curbing the EUR/USD upside in the current market environment, as investors jump back into risk-on bets.”
“With the eurozone growth outlook already partly compromised by restrictions in Germany and other eurozone countries, and the European Central Bank sticking to a broadly dovish tone, the euro may be facing more pressure regardless of Omicron-related sentiment.”
“We could see EUR/USD re-test 1.1200 this week.”
AUD/USD has extended the bounce towards 0.7100 on the expected RBA rate decision. The Reserve Bank of Australia has clearly positioned itself among those central banks that do not currently see the new variant as likely to truly dampen the recovery and policy plans. Economists at ING expect the aussie to enjoy gains in the coming weeks.
Aussie boosted by RBA's optimism
“Being the most oversold currency in G10, we are likely seeing some substantial squeezing of AUD shorts, triggered by the more upbeat mood of markets about the Omicron variant, positive signs from the Chinese economy (RRR cut and eased real estate curbs) and a quite optimistic tone by the RBA.”
“The rate announcement saw no changes to the main policy tools. However, policymakers characterised the Omicron variant as a ‘source of uncertainty’ that ‘is not expected to derail the recovery’ and stressed instead a strong recovery in the jobs market. This is ultimately allowing markets to speculate that the RBA may follow the example of the Bank of Canada and abruptly end asset purchases (rather than simply tapering again) at the February meeting.”
“With still a lot of short positions to be unwound, this is a notion that can continue to offer support to the Australian dollar in the coming weeks.”
FX markets seem fatigued with the New Zealand “good news” story and are instead looking to downside risks as we head into 2022. These risks could challenge ANZ Bank’s forecasts calling for NZD/USD to level off at 0.72 in 2022.
Significant risks for the kiwi loom ahead
“As the positive impact of surprises fades, the NZD could well run into headwinds, and we acknowledge that our forecast calling for NZD/USD to appreciate towards 0.72 over 2022 could be challenged. The kiwi typically benefits from positive seasonality in December, but there’s no sign of that yet.”
“We are mindful of emerging downside risks – both local and global – as we head into 2022. The Omicron variant of COVID-19 is one such risk, but we are also mindful of the myriad headwinds facing the local housing market, the high degree of household leverage, elevated global asset prices, China’s real estate sector challenges, and generalised late-cycle risks at a time when central banks are starting to change their tune.”
“We actually think a lot needs to go right (and nothing to go wrong) for the RBNZ to be able to deliver another five hikes and get the OCR to 2.00%.”
After appreciating around mid-November to levels last seen in 2018, the Vietnamese dong has fallen nearly 1.8% over the last two weeks. Analysts at ANZ Bank believe that this does not mark a reversal in its strengthening trend, which will likely continue over 2022.
Inflow-led pressure on the dong set to increase
“As export earnings normalise and FDI flows strengthen in 2022, the inflow-led pressure on the dong will increase and further appreciation is likely.”
“The recent weakening in the dong does not mark a reversal of its strengthening trend, which we expect will continue over 2022.”
The euro has fallen sharply, as the market has repriced US rate expectations, and while a move to 1.10 is easy to imagine, something needs to change if we are to see the euro fall significantly below that level. Europe's greater vulnerability to China is the most likely catalyst, economists at Société Générale report.
How far can the euro fall? Ask the Chinese yuan
“The Omicron variant of COVID-19 is the only thing that seems able to stop the Fed pushing ahead with faster tapering of asset purchases and thereby buying themselves a cheap option to start hiking rates earlier. We expect three hikes in 2022 and by the time the first one materialises, the dollar should be stronger.”
“EUR/USD is likely to trade below 1.10 in 1H, but a move to 1.05 or below probably needs a significant rally in USD/CNY, which is a risk rather than a likely event in 2022.”
After a strong start to the quarter, the Canadian dollar is down 1% against the US dollar in the fourth quarter. Economists at the National Bank of Canada view the loonie as fundamentally undervalued and see scope for a rally over the coming months. They maintain their forecast calling for a USD/CAD rate of 1.20 in 2022.
CAD should do better in the lead up to BoC tightening
“The loonie looks to be undervalud by 10 cents. So, assuming that two-year interest rates differentials remain near current levels, we calculate that the current value of USD/CAD reflects WTI prices of only $42. That seems extreme unless of course global growth prospects deteriote markedly in the coming weeks due to the pandemic.”
“We see little reason to change our central bank’s mandate and recommend implementing the first of multiple rates hikes no latter than next March. On average, the loonie has been better bid in the lead-up to and in the early stages of BoC hiking cycles.”
“We remain comfortable with our current forecast calling for a USD/CAD rate of 1.20 in 2022.”
- NZD/USD staged a modest recovery from a fresh YTD low touched earlier this Tuesday.
- The risk-on mood benefitted the perceived riskier kiwi amid a modest USD weakness.
- Hawkish Fed expectations should limit the USD downside and cap gains for the major.
The NZD/USD pair built on its steady intraday recovery from the YTD low and climbed to a fresh daily high, around the 0.6775 region during the early European session.
Following an early dip to the lowest level since November 2020, the NZD/USD pair witnessed a short-covering move from the 0.6735 area and was supported by a combination of factors. The upbeat market mood undermined the safe-haven US dollar and was seen as a key factor that provided a modest lift to the perceived riskier kiwi.
The global risk sentiment stabilized amid the recent reports from South Africa that Omicron patients had only shown mild symptoms. This helped ease fears about the economic fallout from the new variant of the coronavirus and boosted investors' confidence, which was evident from a generally positive tone around the equity markets.
Meanwhile, the prospects for a faster policy tightening by the Fed might continue to act as a tailwind for the greenback and keep a lid on any further gains for the NZD/USD pair. Investors seem convinced that the Fed would be forced to adopt a more aggressive policy response to contain stubbornly high inflationary pressures.
Hence, any subsequent move up is more likely to face stiff resistance and runs the risk of fizzling out rather quickly near the 0.6800 mark. This makes it prudent to wait for a strong follow-through buying before confirming that the NZD/USD pair has bottomed out and positioning for any meaningful recovery in the near term.
Technical levels to watch
The bearish grip is still intact on the yellow metal. As FXStreet’s Dhwani Mehta notes, risks remain skewed to the downside amid ebbing Omicron fears.
Risk-on mood at full steam amid easing Omicron fears
“The risk-on flows remain in vogue, as China continues to pledge support measures to stimulate economic growth while global scientists and experts downplay risks from the new covid variant. The Reserve Bank of Australia’s (RBA) patient policy stance also added to the market’s optimism.”
“The bears defied the Golden Cross confirmation, as the powerful resistance (confluence of the 50, 100 and 200-DMAs) around $1,792 continues to cap the upside attempts. A daily closing above the key confluence will expose the $1,800 barrier. The further recovery could call for a retest of Wednesday’s high at $1,809, above which the previous month’s high at $1,814 will put to test.”
“On the downside, Friday’s low at $1,766 could come to the rescue of gold bulls, below which the crucial support is seen at the horizontal trendline at $1,760. Further south, the $1,750 psychological level will challenge the bullish commitments.”
- EUR/GBP witnessed some selling for the second successive day on Tuesday.
- Prospects for an imminent BoE rate hike acted as a tailwind for the sterling.
- A modest USD weakness benefitted the euro and helped limit the downside.
The EUR/GBP cross remained depressed heading into the European session, with bears awaiting sustained weakness below the key 0.8500 psychological mark.
The cross edged lower for the second successive day on Tuesday and might now be looking to extend the previous day's rejection slide from the vicinity of the 0.8500 psychological mark. In the absence of any negative Brexit-related headlines, the British pound's relative outperformance could be attributed to rising bets for an imminent rate hike by the Bank of England in December.
That said, a modest US dollar weakness extended some support to the shared currency. Apart from this, the UK-EU impasse over the Northern Ireland Protocol held back the GBP bulls from placing aggressive bets and helped limit any deeper losses for the EUR/GBP cross, at least for the time being. This, in turn, warrants some caution before positioning for any further depreciating move.
On the economic data front, German Industrial Production came in to show a growth of 2.8% in October, albeit did little to provide any impetus to the EUR/GBP cross. This further makes it prudent to wait for some follow-through selling below the 0.8490-85 horizontal support to confirm that the recent recovery move from the YTD low has run out of steam.
Tuesday's economic docket also features the release of the German and Eurozone ZEW Economic Sentiment Index. Apart from this, the final version of the Eurozone GDP print for the third quarter of 2021 will influence the common currency. Traders will further take cues from a fresh Brexit development to grab some short-term opportunities around the EUR/GBP cross.
Key technical levels
Industrial Production in Germany showed a solid rebound in October, the official data showed on Tuesday, suggesting that the recovery in the manufacturing sector is gaining momentum.
Eurozone’s economic powerhouse’s industrial output climbs by 2.8% MoM, the federal statistics authority Destatis said in figures adjusted for seasonal and calendar effects, vs. a 0.8% rise expected and -1.1% last.
On an annualized basis, the German industrial production fell by 0.6% in October versus +8.8% expected and a 1.0% decrease registered in September.
FX implications
The shared currency is little changed on the mixed German industrial figures.
At the time of writing, EUR/USD is trading at 1.1292, up 0.06% on the day, awaiting the German ZEW Survey.
About German Industrial Production
The Industrial Production released by the Statistisches Bundesamt Deutschland measures outputs of the German factories and mines. Changes in industrial production are widely followed as a major indicator of strength in the manufacturing sector. A high reading is seen as positive (or bullish) for the EUR, whereas a low reading is seen as negative (or bearish).
- USD/ZAR remains pressured around short-term key support joint comprising 13-day-old ascending trend line, 100-SMA.
- Bearish MACD signals keep sellers hopeful, ascending trend line from late October adds to the downside filters.
USD/ZAR bears battle crucial support convergence, down 0.41% intraday near $15.85 heading into Tuesday’s European session.
Given the bearish MACD signals and the South African currency (ZAR) pair’s failures to rebound, the quote is likely to conquer the confluence of 100-SMA and an ascending support line from November 17, around $15.85-80.
While the breakdown will quickly drag the USD/ZAR prices towards an ascending support line from late October, near $15.60, any further declines will be tough.
Also acting as extra support is the area comprising multiple tops marked since early November near $15.50.
On the flip side, corrective pullback needs to cross the weekly resistance line, around $15.85 by the press time, to recall the USD/ZAR buyers.
Following that the recently flashed multi-day peak of $16.36 and late October 2020 high near $16.50, will gain the market’s attention.
USD/ZAR: Four-hour chart
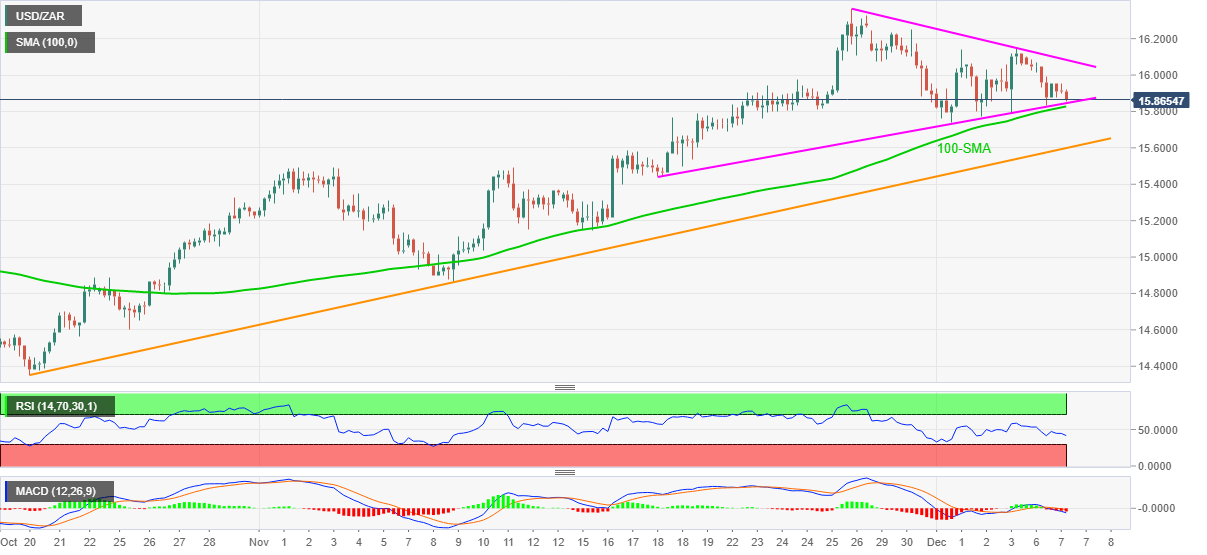
Trend: Further weakness expected
- USD/CAD prints two-day downtrend, refreshes intraday low at the latest.
- Risk-on mood, softer USD underpin WTI crude oil’s run-up to refresh weekly top.
- Canada trade numbers, PMIs join second-tier US data to decorate calendar.
- Risk catalysts are more important ahead of Friday’s US CPI.
USD/CAD takes offers to refresh day’s low around 1.2730, down 0.25% intraday heading into Tuesday’s European session. The Loonie pair reversed from late September highs the previous day but a lack of major catalysts and risk-on mood dragged the quote afterward.
Market sentiment improves amid an absence of notable virus-led deaths and expectations of finding a cure to the COVID-19 strain from South Africa, dubbed as Omicron. Adding to the risk-on mood is the People’s Bank of China’s (PBOC) Reserve Ratio Requirement (RRR) actions and Japan’s readiness for record stimulus.
It’s worth noting that Mixed trade numbers from China, global rating agency Moody’s stable outlook for Chinese financial institutions and cautious optimism conveyed by the Reserve Bank of Australia (RBA) add to the firmer sentiment.
To portray the mood, the US Treasury yields and the stock futures keep the week-start rebound but the US Dollar Index (DXY) eases of late, down 0.05% intraday around 96.20.
More importantly, firmer risk appetite and softer DXY favored Canada’s main export item WTI crude oil to rise to a one-week high, up 1.0% on a day around $70.40 by the press time. The same exerts additional downside pressure on the USD/CAD prices.
Looking forward, US trade numbers, Nonfarm Productivity and Unit Labour Cost will join the Canadian International Merchandise Trade and Ivey Purchasing Managers Index for November to direct short-term USD/CAD moves. Also important will be weekly private inventory data for oil. It should be observed, however, that qualitative catalysts will be more important for fresh impulse ahead of Friday’s US Consumer Price Index (CPI).
Technical analysis
Sustained break of a short-term rising channel formation joins bearish MACD signals to direct USD/CAD sellers towards the 100-SMA level surrounding 1.2690. Alternatively, corrective pullback not only needs to restore the channel formation, by rising back beyond 1.2790 but should also overcome the weekly descending resistance line, close to 1.2850, for conviction.
Here is what you need to know on Tuesday, December 7:
The risk tone remains firmer heading into the European open, reflective of the gains in the S&P 500 futures. The Asian stocks rebounded on China’s pledge to provide support measures to ramp up economic growth. Meanwhile, China’s troubled property sector stocks jumped after the Communist Party’s Politburo hinted at easing in curbs on the real estate industry.
After Monday’s Reserve Requirement Ratio (RRR) cut by the PBOC, the country’s central bank announced a cut on its relending facility rates by 25 basis points (bps) to support the rural sector and small firms, effective from Dec. 7, Securities Times reported on Tuesday.
The market optimism was further bolstered by the ebbing fears over the new Omicron covid variant, with scientists citing mild effects. South Africa is seeing no acceleration in new infections.
Policymakers worldwide are also downplaying the impact of the new variant on the economic recovery. The Reserve Bank of Australia (RBA) kept the key rate unchanged at a record low of 0.1% at its December meeting, although maintained a patient stance on the policy.
Across the G10 currencies space, AUD/USD extended the bounce towards 0.7100 on the expected RBA rate decision. China’s surge in imports also aided the upside in the aussie.
Meanwhile, EUR/USD keeps its recovery mode capped below 1.1300 amid firmer yields, as investors await the German Industrial data, ZEW Survey and Eurozone GDP revision for a fresh trading impetus. GBP/USD is consolidating the gains below 1.3300, underpinned by the upbeat mood.
USD/JPY is accelerating alongside the yields, looking to recapture 114.00. USD/CAD is weighed down by the retreat in the US dollar while the extended rally in WTI also exerts downside pressure on the pair.
Gold is heading back towards the four-week troughs of $1,761 amid an improved mood.
Bitcoin is looking to extend its recovery momentum beyond the $51,000 mark, as the crypto market finds its feet.
- AUD/USD gained traction for the second straight day after the RBA announced its policy decision.
- Overbought RSI on the 1-hour chart, bearish oscillators on the daily chart warrant caution for bulls.
- A sustained strength beyond the 0.7120 area is needed to confirm that the pair has bottomed out.
The AUD/USD pair built on the previous day's goodish rebound from sub-0.7000 levels, or the lowest level since November 2020 and gained traction for the second successive day on Tuesday. The prevalent risk-on mood in the markets turned out to be a key factor that continued acting as a tailwind for the perceived riskier Australian dollar.
The buying interest picked up pace after the Reserve Bank of Australia announced its policy decision and kept the official rate on hold at the historic low level of 0.10%. In the accompanying statement, the RBA hinted that bond-buying will end in February, which sets the stage for a hike in July and provided a modest lift to the aussie.
The momentum pushed the AUD/USD pair to a two-day high, around the 0.7085 region, and 100-hour SMA, paving the way for a further near-term appreciating move. That said, RSI on the 1-hour chart is already flashing overbought conditions and technical indicators on the daily chart are still holding deep in the bearish territory.
Hence, any subsequent move up is more likely to confront stiff resistance and meet with a fresh supply near the 0.7100 round-figure mark. This, in turn, should cap the upside near the 0.7120 region, which should act as a key pivotal point for the AUD/USD pair. A sustained strength beyond will negate the bearish bias and trigger a short-covering move.
The AUD/USD pair might then accelerate the momentum towards testing the next relevant hurdle near the 0.7170-75 region before aiming to reclaim the 0.7200 round-figure mark.
On the flip side, the daily swing low, around the 0.7040 region, now seems to protect the immediate downside. Any further downfall might continue to find decent support near the key 0.7000 psychological mark. A convincing breakthrough the latter will be seen as a fresh trigger for bearish traders and prompt aggressive technical selling.
The next relevant support is pegged near the 0.6930 region before the AUD/USD pair eventually drops to test the 0.6900 mark. Some follow-through selling has the potential to drag the pair further towards the 0.6800 mark en-route the 0.6765-60 region in the near term.
AUD/USD 1-hour chart
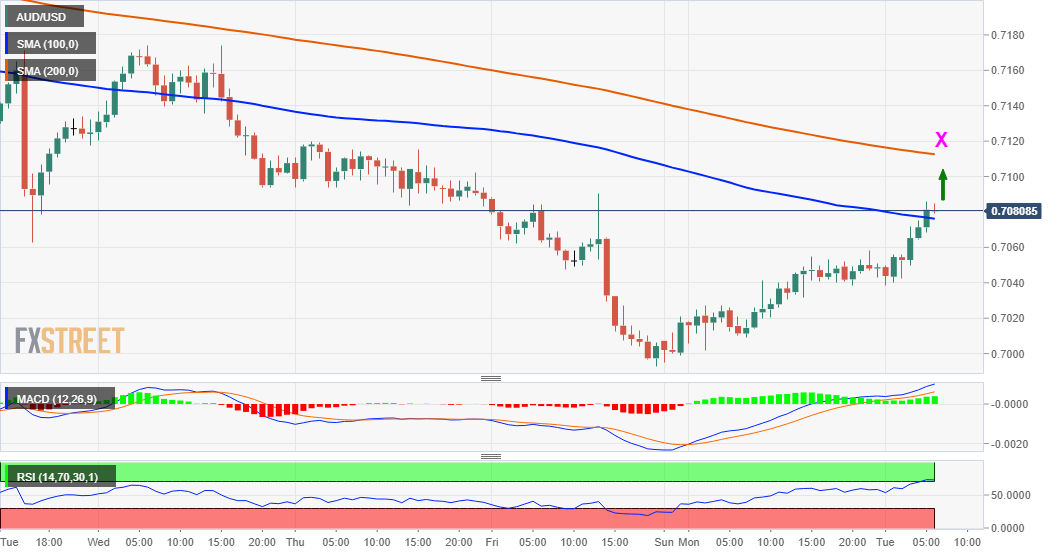
Key technical levels
- GBP/JPY takes the bids to refresh intraday high, extends bounce off two-month low.
- Firmer RSI, not overbought, joins trend line and 50-SMA break to favor bulls.
- Early November’s swing low, seven-week-old descending trend line in focus.
GBP/JPY stays on the front foot around 151.00, refreshing daily high with 0.37% intraday gains ahead of Tuesday’s London open.
In doing so, the cross-currency pair extends the previous day’s rebound from the lowest level since September while recently piercing the one-week-old descending trend line and 50-SMA.
Given the firmer RSI conditions, not overbought, favor the bullish impulse, the quote is likely to rise further beyond the 151.00 threshold.
That said, the 38.2% Fibonacci retracement (Fibo.) of the quote’s downside from late October joins the early November’s swing low to guard the immediate upside around 152.50.
Also acting as an important hurdle for the GBP/JPY advances is a descending resistance line from October 20, near 152.75.
Meanwhile, the corrective pullback may have to drop back below the 50-SMA and resistance-turned-support line, respectively around 150.90 and 150.55, before retesting the 150.00 round figure.
Should GBP/JPY bears manage to conquer the 150.00 psychological magnet, lows marked during September and July, around 148.95 and 148.45, should lure return to the charts.
GBP/JPY: Four-hour chart

Trend: Further recovery expected
- Gold stays indecisive despite keeping pullback from weekly top, bouncing off intraday low.
- Yields stay firmer even as Omicron fears recede, DXY snaps four-day uptrend.
- Risk catalysts will be focused ahead of Friday’s US CPI.
- Gold Price Forecast: Depressed amid a better market mood
Gold (XAU/USD) consolidates intraday losses while bouncing off the daily low to $1,779 during Tuesday’s early European morning. Even so, the bullion struggles for clear direction amid a lack of major data/events and cautiously optimistic markets ahead of the key US Consumer Price Index (CPI) data, up for publishing on Friday.
An absence of notable virus-led deaths and expectations of finding a cure to the COVID-19 strain seems to keep the market’s positive amid a lack of major data/events, especially after China and Aussie catalysts are out. On the same line were the People’s Bank of China’s (PBOC) Reserve Ratio Requirement (RRR) actions and Japan’s readiness for record stimulus.
While portraying the mood, the US Treasury yields and the stock futures keep the week-start rebound but the US Dollar Index (DXY) struggles to pick up, down 0.05% intraday around 96.23 at the latest.
The risk-on mood favors the gold prices but the recent pick-up in the US inflation expectations, as measured by the 10-year breakeven inflation rate per the St. Louis Federal Reserve (FRED) data, joins the firmer US yields to weigh on the gold prices.
However, a lack of major data/events may restrict short-term gold moves, at least ahead of Friday’s US Consumer Price Index (CPI) release. Following that, the next week’s Fed meeting will be crucial to watch.
Technical analysis
Having breached an ascending support line from late September, now resistance around $1,795, gold remains inside a two-week-old descending trend channel.
That said, the latest rebound fails to overcome the 50-SMA level of $1,785, suggesting another dip towards the channel’s support line, near $1,760. Adding strength to the $1,761 support is an upward sloping trend line from September.
It’s worth noting that gold buyers will have to cross the 200-SMA level surrounding $1,810 for conviction, even if they manage to cross the aforementioned hurdles, namely $1,785 and $1,795.
If at all the gold bulls manage to keep reins past $1,810, $1,817 and the early November’s swing high near $1,832 can test the upside moves before the tops marked during July and September close to $1,834.
Gold: Four-hour chart
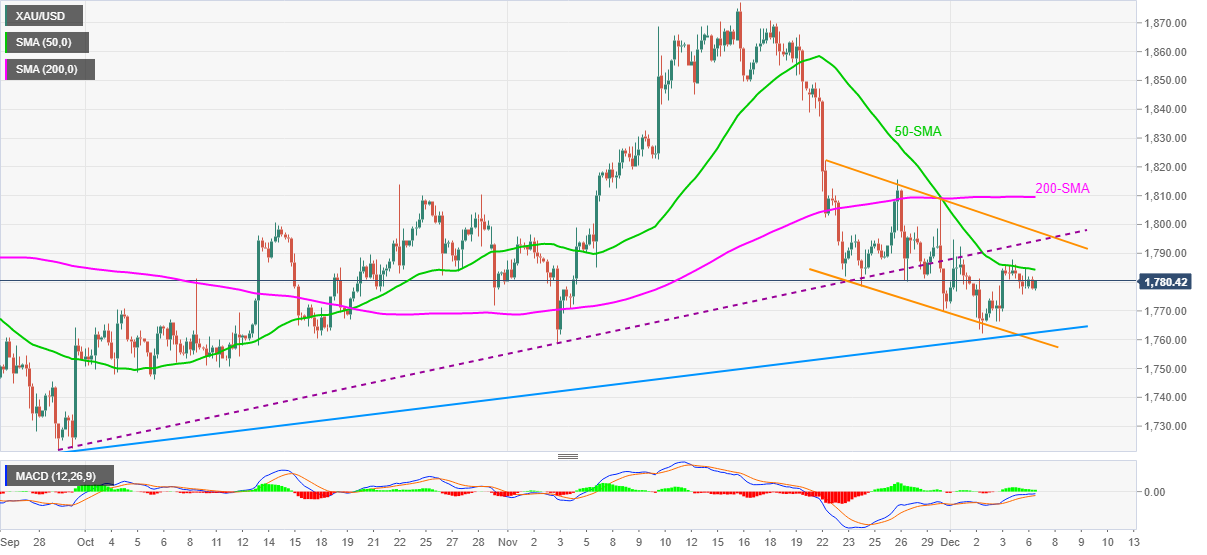
Trend: Further weakness expected
- USD/JPY gained positive traction for the second successive day on Tuesday.
- The risk-on mood undermined the safe-haven JPY and provided a goodish lift.
- A further recovery in the US bond yields remained supportive of the bid tone.
The USD/JPY pair edged higher through the Asian session and climbed to a one-week high, around the 113.70 region in the last hour.
The pair built on the previous day's positive move and gained some follow-through traction for the second successive day on Tuesday. The prevalent upbeat market mood undermined the safe-haven Japanese yen, which, in turn, was seen as a key factor that provided a modest lift to the USD/JPY pair.
The global risk sentiment stabilized amid reports that Omicron patients had only shown mild symptoms. This helped ease fears about the economic fallout from the new variant of the coronavirus and boosted investors' confidence, which was evident from a positive tone around the equity markets.
Bulls further took cues from a further recovery in the US Treasury bond yields, though a subdued US dollar price action might keep a lid on any further gains for the USD/JPY pair. The fundamental backdrop, however, favours bulls and supports prospects for a further near-term appreciating move.
Investors seem convinced that the Fed would be forced to adopt a more aggressive policy response to contain stubbornly high inflation. In fact, the markets have been pricing in the possibility of an eventual rate hike by May 2022, which should continue to act as a tailwind for the greenback.
There isn't any major market-moving economic data due for release from the US, leaving the USD/JPY pair at the mercy of the broader market risk sentiment. Apart from this, the US bond yields will influence the USD price dynamics and produce some meaningful trading opportunities around the major.
Technical levels to watch
- USD/INR takes a U-turn from two-month high, pressured around daily low at the latest.
- India FinMin official expects V-shaped economic recovery, RBI may cite Omicron fears to avoid repo hike.
- India reports lowest daily infections since May 2020, total active cases dropped to June 2020 levels.
- Upbeat market sentiment weigh on US dollar amid light calendar.
USD/INR struggles to extend the bounce off intraday low around 75.30, down 0.08% on a day during early Tuesday morning in Asia.
The Indian rupee (INR) pair cheers mildly positive sentiment, as well as optimism at home, to pause two-day advances by reversing from October 13 high.
Among the positives, comments from Indian Finance Ministry (FinMin) official, cited by NewsRise, were the major ones to weigh on the USD/INR prices. The Indian diplomat said, “Economy has seen v-shaped recovery, key parameters showing strong rebound.” It’s worth noting that the Indian policymakers are bracing for the listing of the domestic bonds to the global indices and the same keeps the investors at home hopeful enough to favor INR.
Elsewhere, India’s daily coronavirus infections rose by the least since May 2020 while the total active infections slumped to the lowest since June 2020, per official data cited by NewsRise and shared via Reuters.
It should be noted, however, that the Reserve Bank of India (RBI) is likely to mark the South African covid variant, dubbed as Omicron to step back from an anticipated cut in the repo hike. “The Reserve Bank of India will likely hold off on raising its key borrowing and lending rates on Wednesday, as it adopts a cautious tone amid the spread of the Omicron coronavirus variant, economists and market participants said,” per Reuters.
Also weighing on the USD/INR prices is the People’s Bank of China’s (PBOC) measures to safeguard the world’s second-largest economy from the virus woes and Japans’ readiness for record stimulus.
On the other hand, an absence of notable virus-led deaths and expectations of finding a cure to the COVID-19 strain seems to keep the sentiment brighter.
Against this backdrop, the US Treasury yields and the Asia-Pacific stocks keep the week-start rebound but the US Dollar Index (DXY) struggles to pick up.
Moving on, a light calendar ahead of Friday’s US Consumer Price Index (CPI) may challenge USD/INR moves but Wednesday’s RBI meeting will be important to watch.
Technical analysis
A clear daily break of the 75.20 horizontal resistance, now support comprising highs marked during October-November, keeps USD/INR buyers hopeful to refresh the yearly top beyond 75.65.
- USD/TRY prints four-day uptrend below weekly resistance line.
- Lower-high formation tests the bulls amid nearly overbought RSI.
- 50-HMA, short-term rising trend line challenges the bears.
USD/TRY stays firmer around $13.83, up 0.18% intraday during the four-day advances ahead of Tuesday’s European session.
Even so, the lower-high formation marked since last Thursday portrays the bull’s exhaustion amid the nearly overbought RSI conditions.
However, a convergence of the 50-HMA and an ascending trend line from last Wednesday, around $13.75, put a floor under the prices.
Should the quote drops below $13.75, the 200-HMA level of $13.06 and the $13.00 threshold will lure the USD/TRY bears.
Meanwhile, further advances look to the short-term resistance line near $13.95 and then to the $14.00 round figure before rallying to refresh the all-time high.
In doing so, the $15.00 round figure may gain the market’s attention before the ultimate psychological level of $20.00.
USD/TRY hourly chart
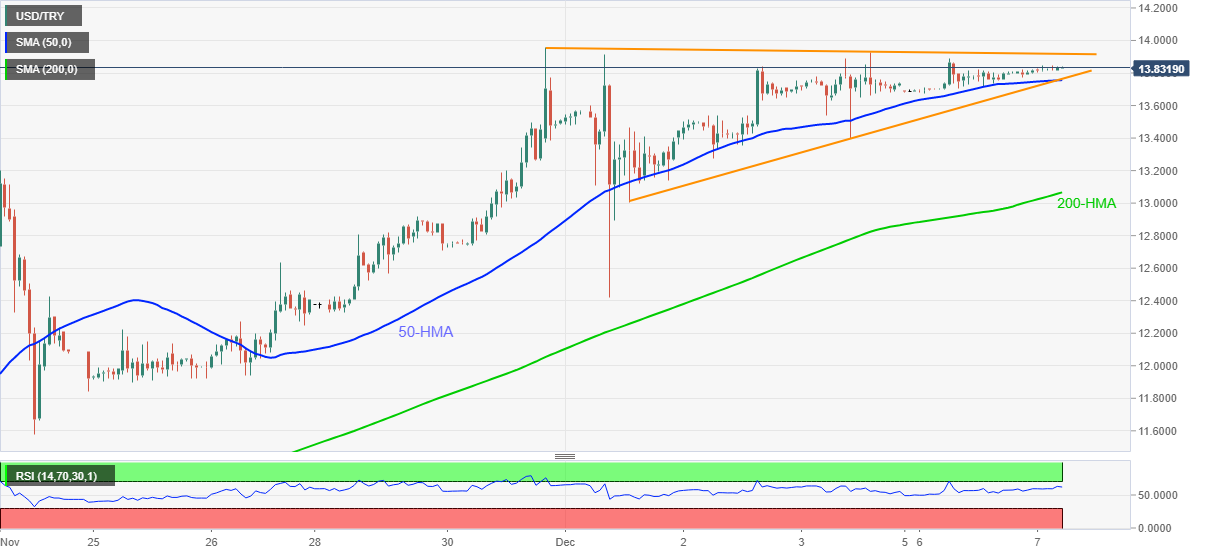
Trend: Pullback expected
- EUR/USD fades corrective pullback from weekly low, mostly steady.
- Yields stay firmer on cautious optimism surrounding Omicron, DXY eases.
- ECB’s Holzman renew inflation fears, German Factory Orders dropped in October.
- ZEW sentiment figures, Eurozone GDP may entertain traders, risk catalysts are the key.
EUR/USD takes a U-turn from intraday top of 1.1292, retreats to 1.1285 ahead of Tuesday’s European session. The major currency pair initially cheered the US dollar weakness amid a lack of major data/events. However, the recently firmer US Treasury yields seem to have weighed on the quote of late.
The pair’s early Asian run-up could be linked to the market’s reaction to the fresh inflation fears cited by the European Central Bank (ECB) officials after multiple policymakers attempt to defend easy money flows. Austrian central bank governor and European Central Bank governing council member Robert Holzmann said on Monday that it was very unlikely that inflation in the Eurozone would return to or fall below 2.0% in 2022, according to Reuters citing Handelsblatt.
It’s worth noting that the receding fears of the South African covid variant, dubbed as Omicron, also helped the EUR/USD prices to consolidate recent losses earlier. Omicron cases increase in Australia, China and India of late, joining the league of the UK, Europe and other Western leaders. However, an absence of notable virus-led deaths and expectations of finding a cure to the COVID-19 strain seems to keep the sentiment brighter.
On the contrary, a rebound in the US inflation expectations, as measured by the 10-year breakeven inflation rate per the St. Louis Federal Reserve (FRED) data, joins downbeat German Factory Orders for October, -6.9% m/m versus +1.8% prior, challenge EUR/USD bulls.
Amid these plays, the US Treasury yields and the stock futures keep the week-start rebound but the US Dollar Index (DXY) struggles to pick up.
Moving on, the second reading of the Eurozone Q3 GDP and October’s ZEW sentiment data for the bloc, as well as for Germany, will be crucial for the short-term EUR/USD forecast. Should the scheduled figures match downbeat forecasts, the pair has further south to go.
In addition to the scheduled data, virus updates and inflation headlines, as well as bond moves, will also be important to follow for clear direction.
Technical analysis
In addition to the EUR/USD downside break of a fortnight-old support-turned-resistance, as well as a falling channel formation, a bearish MACD signal also keep sellers hopeful. The current weakness, however, may take a breather around a fortnight-long horizontal zone surrounding 1.1235-30 before directing the EUR/USD bears to the yearly low near 1.1186. Alternatively, the stated channel’s resistance line around 1.1310 guards short-term advances of the EUR/USD pair.
- GBP/USD faces a stiff hurdle around 1.3290 on the road to recovery.
- The US dollar retreat keeps the downside cushioned amid the upbeat mood.
- Symmetrical triangle breakout needs confirmation on the four-hour chart.
GBP/USD is advancing towards 1.3300 so far this Tuesday, finding support from a renewed downside in the US dollar across the board amid an improving market mood.
Easing fears over the new Omicron covid variant, as its effects are seen as mild, keep the overall market sentiment buoyed.
Although the further upside appears uncertain amid cautious remarks from the Bank of England (BOE) policymakers, as they contemplate their rate hike plans amid the emergence of the new covid strain.
Also, capping the upside technically is the powerful resistance near the 1.3290-1.3295 price zone. The bearish 50-Simple Moving Average (SMA) aligns at that level.
A four-hourly candlestick closing above that level, GBP/USD will validate a symmetrical triangle breakout.
The 14-day Relative Strength Index (RSI) points higher above the midline, allowing room for more gains.
Buyers will then look to extend the rebound towards the 100-SMA at 1.3360.
GBP/USD: Daily chart
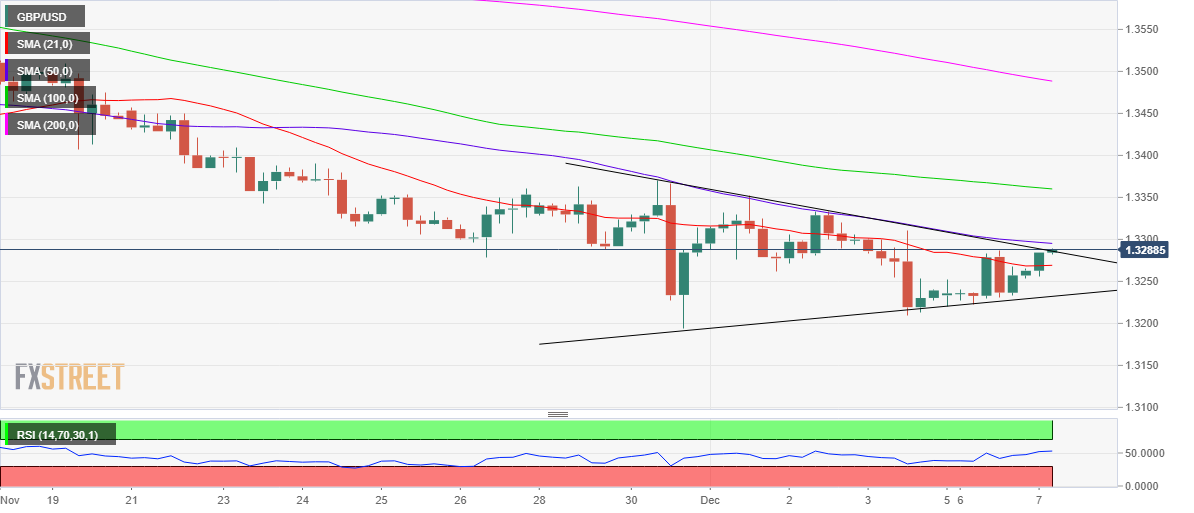
Alternatively, a failure to find acceptance above the aforesaid critical resistance, sellers will return to test the 21-SMA at 1.3269.
The next downside target for GBP bears is then seen at the 1.3250 psychological level. Further south, the triangle support at 1.3232 could be put to test.
GBP/USD: Additional levels to consider
- US 10-year Treasury yields remain mildly bid after recovering most of Friday’s losses, Asian stocks grind higher.
- Omicron fears recede despite increasing count, PBOC’s RRR cut and Japan stimulus hope add to the market’s cautious optimism.
- China trade numbers came in mixed, RBA cites limited economic risk from covid variant.
Market sentiment stays positive, despite lacking momentum, amid ebbing fears of the South African covid variant and expectations that the latest stimulus measures will protect economies, during early Tuesday.
While portraying the same, the US 10-year Treasury yields rise 1.5 basis points (bps) near 1.45% whereas the S&P 500 Futures print 0.30% intraday gains at the latest. Further, the MSCI’s index of Asia-Pacific shares outside Japan rises 0.90% on a day whereas Japan’s Nikkei rallies 2.0% heading into the European session.
Omicron cases increase in Australia, China and India of late, joining the league of the UK, Europe and other Western leaders. However, an absence of notable virus-led deaths and expectations of finding a cure to the COVID-19 strain seems to keep the market’s positive amid a lack of major data/events, especially after China and Aussie catalysts are out.
That said, China's Trade Balance eased below $82.75B forecasts to $71.72B while the Exports improved from 17.2% to 22.0%. However, notable was the jump in the Imports to 31.4% versus 19.5% market consensus and 20.6% previous readout. On the other hand, the RBA meets market expectations to keep the benchmark rate unchanged at 0.1% and the weekly bond purchases of $4.0 billion intact until at least mid-February 2022. The RBA also said, “The omicron strain is a new source of uncertainty, but it is not expected to derail the recovery.”
It’s worth noting the People’s Bank of China’s (PBOC) Reserve Ratio Requirement (RRR) actions join Japan’s readiness for record stimulus to propel stock in China and Tokyo. Further, Australia’s ASX 200 rises 1.0% whereas New Zealand’s NZX 50 marks 0.40% intraday gains as the Reserve Bank of New Zealand (RBNZ) policymakers cite inflation concerns.
Elsewhere, South Korea’s KOSPI and Indonesia’s IDX Composite tracked Chinese equities while India’s BSE Sensex rises 1.0% in hopes of inaction from the Reserve Bank of India (RBI).
Looking forward, a lack of major data/events will keep the markets calm, helping to extend the previous moves, ahead of Friday’s US inflation data.
Read: US inflation and Omicron impact seen as key factors for dollar
- AUD/JPY refreshes intraday high, prints two-day rebound from 15-week low.
- RBA keeps monetary policy unchanged, cites limited risk from Omicron.
- Convergence of previous support line, 61.8% Fibo. challenges recovery moves.
- Horizontal area from September holds the key to yearly bottom.
AUD/JPY extends Friday bounce off the lowest levels since late August after the Reserve Bank of Australia’s (RBA) monetary policy meeting on early Tuesday. That said, the cross-currency pair refreshes day’s top around 80.25 by the press time.
The RBA matches market expectations while keeping the benchmark rate unchanged at 0.1% and the weekly bond purchases of $4.0 billion intact until at least mid-February 2022. However, the Australian central bank’s comments favored AUD/JPY bulls. “The omicron strain is a new source of uncertainty, but it is not expected to derail the recovery,” said the latest RBA statement.
Read: RBA: Will not increase the cash rate until actual inflation is sustainably within the 2% to 3% target range
In addition to the RBA’s cautious optimism, the RSI rebound from oversold territory and the AUD/JPY pair’s ability to recover from a short-term horizontal area favors buyers.
At the latest, a confluence of the 61.8% Fibonacci retracement (Fibo.) of August-October upside and previous support line from August, around 81.05-10, seems to lure the AUD/JPY buyers.
Should the quote manages to rise past 81.10, the 100-DMA level of 81.78 will act as an additional check for the upside moves.
Alternatively, the resistance-turned-support from November 26, near 79.60, may test the AUD/JPY sellers ahead of the stated horizontal area near 78.85-80.
During the pair’s weakness past-78.80, the yearly low of 77.89 will be in focus.
AUD/JPY: Daily chart
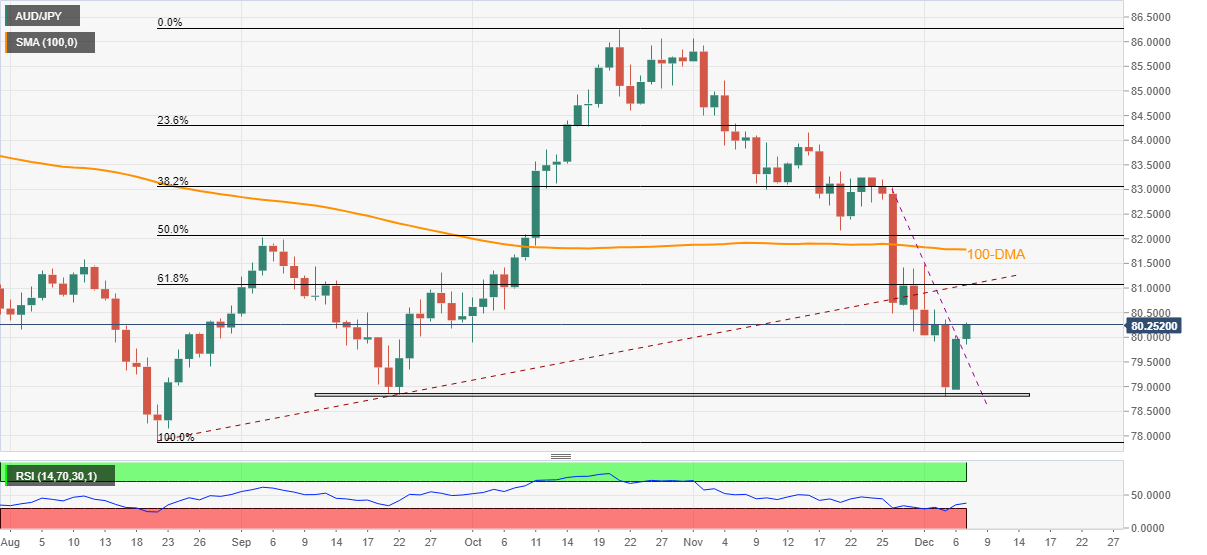
Trend: Further recovery expected
Moody’s Investors Service offers a stable outlook for China’s financial institution sector, courtesy of the country’s continued monetary policy support.
Additional takeaways
“Uneven adjustment risks among financial institutions in China and a prolonged downturn in the property sector stress could pose risks.”
“Low rates will pressure the investment returns of asset managers and insurers in China.”
This comes after Monday’s Reserve Requirement Ratio (RRR) cut by the PBOC.
Meanwhile, China's central bank announced a cut on its relending facility rates by 25 basis points (bps) to support the rural sector and small firms, effective from Dec. 7, Securities Times reported on Tuesday.
Market reaction
USD/CNY is trading at 6.3713, down 0.06% on the day.
- AUD/USD refreshes intraday top, holds onto the previous day’s rebound from 2021 low.
- RBA matches wide forecast of keeping benchmark and asset purchase intact, cites moderate risk from Omicron.
- China trade numbers came in mixed, PBOC action, Japan stimulus hopes keep markets optimistic amid receding Omicron fears.
- Risk catalysts will be eyed for fresh impulse amid no major data/events.
AUD/USD picks up bids to refresh the daily high around 0.7065, up 0.25% intraday, following the Reserve Bank of Australia’s (RBA) monetary policy meeting decision on early Tuesday.
The RBA proves right the market expectations while keeping the benchmark rate unchanged at 0.1% and the weekly bond purchases of $4.0 billion intact until at least mid-February 2022. However, the Australian central bank’s comments line, “The omicron strain is a new source of uncertainty, but it is not expected to derail the recovery,” seems to have underpinned the AUD/USD pair’s latest run-up.
Read: RBA: Will not increase the cash rate until actual inflation is sustainably within the 2% to 3% target range
Earlier in the day, China released November’s trade numbers while Australia reported the third quarter (Q3) House Price Index. China Trade Balance eased below $82.75B forecasts to $71.72B while the Exports improved from 17.2% to 22.0%. However, notable was the jump in the Imports to 31.4% versus 19.5% market consensus and 20.6% previous readout. That said, Australia’s House Price Index declined on QoQ, to 5.0% from 6.7%, but rose past-16.8% prior to 21.7% level on YoY.
Other than the mixed data and cautiously optimistic RBA, the risk profile also favored AUD/USD buyers before the RBA. Risk appetite benefits from the PBOC’s RRR cut that propelled multi-billion dollars into the markets. On the same line is Japan’s record stimulus to battle the covid-linked economics losses that reach the final stage of the rollout.
Market sentiment also improves at the week’s start even as the US Treasury yields remained firmer. The reason could be linked to the ex-Fed group of central bankers’ readiness to extend easy money policies due to the South African covid strain, dubbed as Omicron. Also positive was the absence of more virus-led deaths compared to the rapid increase in the virus variant, as well as global scientists’ hopes of finding a cure to the fresh challenge.
Amid these plays, US 10-year Treasury yields seesaw around 1.45% whereas stock futures and Asia-Pacific equities print mild gains at the latest.
Looking forward, a light calendar will restrict AUD/USD moves but the corrective pullback may extend until qualitative catalysts challenge the bulls.
Technical analysis
AUD/USD bounces off November 2020 bottom amid oversold RSI conditions. However, the corrective pullback remains inside a five-week-old descending trend channel.
While August 2021 bottom around 0.7105 lures short-term buyers, a convergence of the 10-DMA and upper line of the stated channel, near 0.7125, becomes a tough nut to crack for AUD/USD bulls. Adding to the upside filter is September’s low surrounding 0.7170, a break of which will open doors for the long-run targeting to cross the 0.7200 threshold.
Meanwhile, a downside break of the 0.6990 level will make the AUD/USD pair vulnerable to June 2020 swing lows of 0.6775. During the fall, the 0.6900 and the 0.6800 thresholds may act as buffers.
Following are the key headlines from the December RBA monetary policy statement, via Reuters, as presented by Governor Phillip Lowe.
Board is committed to maintaining highly supportive monetary conditions.
Will not increase the cash rate until actual inflation is sustainably within the 2% to 3% target range.
Australian economy is recovering from the setback caused by the Delta outbreak.
Household consumption is rebounding strongly and the outlook for business investment has improved.
The omicron strain is a new source of uncertainty, but it is not expected to derail the recovery.
Leading indicators point to a strong recovery in the labour market
By mid-February, the RBA will hold a total of $350 billion of bonds issued by the Australian government.
Economy is expected to return to its pre-delta path in the first half of 2022.
-
AUD/USD extends recovery towards 0.7100 on RBA’s cautious optimism
The Reserve Bank of Australia (RBA) board members decided to leave the official cash rate (OCR) unchanged at a record low of 0.10% during their December monetary policy meeting.
The board decided to maintain the interest rate on exchange settlement balances at zero percent.
The board decided to continue to purchase government securities at the rate of $4 billion a week until at least mid-February 2022.
A Reuters poll last week showed economists expect the first-rate hike in early 2023, though markets have fully priced in a hike as early as July next year.
AUD/USD reaction
The AUD/USD pair is trading close to daily highs of 0.7065 on the expected RBA decision.
The spot was last seen trading at 0.7059, up 0.11% on the day.
About RBA rate decision
RBA Interest Rate Decision is announced by the Reserve Bank of Australia. If the RBA is hawkish about the inflationary outlook of the economy and rises the interest rates it is positive, or bullish, for the AUD. Likewise, if the RBA has a dovish view on the Australian economy and keeps the ongoing interest rate, or cuts the interest rate it is seen as negative, or bearish.
- NZD/USD pares intraday losses after downtick to refresh 13-month low.
- Sustained trading below 15-week-old horizontal line, monthly descending resistance keeps sellers hopeful.
- Downward sloping support line from March offers key support ahead of late 2020 lows.
NZD/USD licks its wounds around 0.6750, following a brief decline to refresh multi-day low during early Tuesday.
The oversold RSI conditions favor the latest corrective pullback. However, bearish MACD signals and the pair’s failures to cross the 0.6860-65 resistance confluence, including a horizontal line from late August and a descending trend line from November 09, challenge buyers.
Ahead of the key 0.6865 resistance, the 10-DMA level surrounding 0.6805 can probe the NZD/USD rebound. If at all the pair buyers manage to cross the 0.6865 hurdle, a run-up to the 0.6900 round figure and then to the mid-November swing high near 0.7080 can’t be ruled out.
On the contrary, the latest multi-month bottom of 0.6736 will precede a downward sloping trend line from March 25, around 0.6700, to challenge the NZD/USD sellers.
Should NZD/USD bears dominate past-0.6700, lows marked during November and October of 2020, respectively around 0.6590 and 0.6550 will be in focus.
NZD/USD: Daily chart
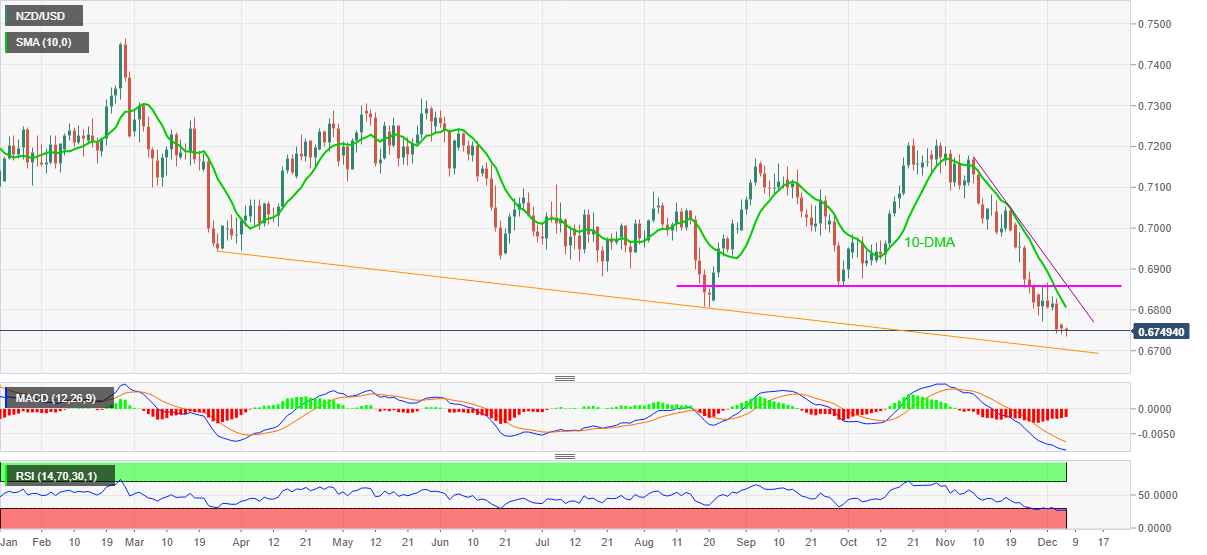
Trend: Further weakness expected
China's Trade Balance for November, in Yuan terms, came in at CNY460.68 billion versus CNY372.23 billion expected and CNY545.90 billion last.
The exports rose by 16.6% last month vs. 17.2% expected and 20.3% previous.
Imports increased by 26% vs. 9.4% expected and 14.5% prior.
In USD terms,
China reported a smaller-than-expected growth in the trade surplus, despite both imports and exports bettered expectations.
Trade Balance came in at +71.72B versus +82.75B expected and +84.54B previous.
Exports (YoY): +22% vs. +17.2% exp. and +27.1% prior.
Imports (YoY): +31.7% vs. +19.5% exp. and +20.6% last.
Additional takeaways
China Jan-Nov trade balance $ +581.71 billion
China Jan-Nov dollar-denominated exports +31.1% YoY, imports +31.4% YoY.
FX implications
AUD/USD ignores downbeat Chinese trade figures, keeping its rebound intact around 0.7050. The spot adds 0.06% on the day, currently trading at 0.7052, with all eyes on the RBA decision.
- Gold price picks up fresh bids but remains confined within a familiar range.
- Easing Omicron fears, Fed’s hawkish bets weigh on gold while USD recedes.
- Gold sellers eye $1,750 as Fed stays on tightening path.
Gold price is picking up from where it left on Monday, having witnessed a bearish start to a relatively quiet week. Easing concerns over the new Omicron covid variant combined with the faster-tapering expectations from the Fed next week are putting a lid on gold’s upside. Further, a strong technical hurdle around $1,792 and an upbeat market mood could also keep gold bulls at bay. All eyes remain on Friday’s US inflation data for the next direction in gold price.
Read: Gold Price Forecast: Depressed amid a better market mood
Gold Price: Key levels to watch
The Technical Confluences Detector shows that the gold price is trading just above the critical resistance now support at $1,780, where the SMA5 one-day, Fibonacci 38.2% one-week and one-day converge.
If gold bulls sustain above the latter, then a test of the $1,785 hurdle will be inevitable. That level is the confluence of the SMA50 four-hour and SMA200 one-hour.
Immediate upside will then be capped by the Fibonacci 23.6% one-month at $1,787.
Doors will further open up towards $1,792, the powerful supply zone comprising of the SMAs 50, 100 and 200 one-day. The Fibonacci 61.8% one-week also aligns at that point.
Buyers will look for fresh entries above the latter, with eyes on the $1800 level – the pivot point one-day R3.
On the flip side, a failure to resist above the aforesaid $1,780 barrier, will recall sellers to test the previous day’s low of $1,776. The SMA5 one-day appears at that level.
The next stop for gold bears is seen at $1,773, the Fibonacci 23.6% one-week, below which the pivot point one-day S2 at $1,769 could get tested.
Further south, a test of the November lows of $1,759 will be in the offing.
Here is how it looks on the tool
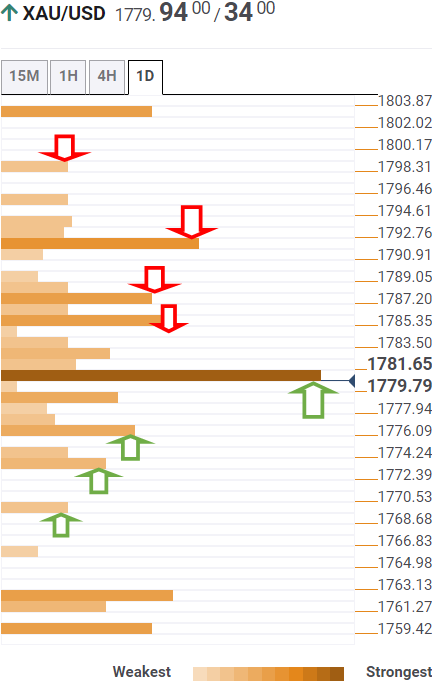
About Technical Confluences Detector
The TCD (Technical Confluences Detector) is a tool to locate and point out those price levels where there is a congestion of indicators, moving averages, Fibonacci levels, Pivot Points, etc. If you are a short-term trader, you will find entry points for counter-trend strategies and hunt a few points at a time. If you are a medium-to-long-term trader, this tool will allow you to know in advance the price levels where a medium-to-long-term trend may stop and rest, where to unwind positions, or where to increase your position size.
| Raw materials | Closed | Change, % |
|---|---|---|
| Brent | 73.84 | 3.1 |
| Silver | 22.384 | -0.71 |
| Gold | 1778.363 | -0.22 |
| Palladium | 1841.6 | 2.21 |
Analysts at Nomura remain outrightly bullish on the Canadian dollar in the first half of next year, recommending going short on AUD/CAD.
Key quotes
“We view CAD as an attractive currency among the G10 commodity-tied dollar bloc in H1 2022 for the following reasons: 1) we expect the Bank of Canada to lift off in mid-2022 or potentially earlier in view of high domestic inflation, and likely maintain its hawkish stance, 2) oil prices are likely to remain elevated in the first half of 2022 as the countries in OPEC+ are still cautious over increasing oil supply and will likely act accordingly to prevent the plunge in price, and 3) the Canadian economy is less vulnerable to China’s growth slowdown than the Antipodean economies.”
“Therefore, we recommend short AUD/CAD (entry: 0.9100, target: 0.8850) regarding the monetary policy divergence and tailwinds from the terms of trade.”
“However, we will not keep on holding this position in H2 2022, but rather reduce our conviction on long CAD. Even though the BoC rate hike is likely to occur earlier than major central banks around the globe, the market’s expectation on this rate hike is likely to be much priced in by then.”
Reserve Bank of New Zealand (RBNZ) Deputy Governor said that the central bank’s “job is to limit financial stability risks and keep overall inflation under control,” in his latest speech early Tuesday.
Additional comments
Central bankers must continue to look forward to "guard against the unpredictable”
Confident our financial stability approach has strengthened; the foundations are more solid.
Still work to do to strengthen regulated entities' resilience & compliance.
Next 10 years likely to see greater concentration on efficiency, industry dynamics and how financial institutions meet customer needs.
insurance affordability & risk-based pricing, open banking, & digital money are dynamic challenges sector and regulators will face.
RBNZ cannot alter the supply of land or buildings, and should not be held responsible for the housing market.
DTI restrictions are an important and probably better tool than LVRs.
RBNZ can lean against house prices by increasing cost & restricting availability of credit.
-
NZD/USD holds on firm grounds in risk-on environment
The Japanese government will stick to govt aim of achieving a primary budget surplus by fiscal 2025, the country’s Finance Minister Shunichi Suzuki said on Tuesday.
He said that his government is “not considering setting a different fiscal target to replace primary budget goal.”
Market reaction
USD/JPY is adding 0.06% so far, currently trading at 113.52 amid an upbeat market mood and firmer Treasury yields. Investors shrug off a slowdown in decline in the Japanese Overall Household Spending for October.
Alike every first Tuesday of the month, the Reserve Bank of Australia (RBA) is up for conveying the latest monetary policy meeting and Interest Rate Decision around 03:30 AM GMT.
The RBA is expected to keep the benchmark interest rate unchanged around 0.10% and mark no changes to its weekly bond purchase of $40 billion.
The recent weakness in the Aussie Q3 inflation data and firmer Wage Price Index seems to help the policymaker to maintain the status quo.
Though, fears emanating from the South African covid variant warrant AUD/USD traders to pay close attention to the RBA Rate Statement for clear directions, considering the Aussie pair’s oversold performance around the 2021 low.
Ahead of the event Westpac said,
As such, the focus will again be on the wording of the Governor’s decision statement, particularly any assessments of the latest round of economic data, including the Q3 national accounts, and the shifting external environment, particularly with respect to price inflation in developed economies. The Bank’s following meeting, on February 1 next year, will likely see more meaningful shifts with a scheduled review of the bond buying program expected to see purchases scaled back from $4bn/week to $2bn/week prior to a wind-down of the program by mid-May.
On the same line, FXStreet’s Valeria Bednarik says,
Most likely, the Reserve Bank of Australia will include a cautious note amid the newly discovered Omicron coronavirus variant, which led to travel restrictions in the country, although no fresh lockdowns were announced. Finally, the central bank has maintained an optimistic outlook of the economic progress within the ongoing pandemic, something that should not surprise investors.
How could the RBA decision affect AUD/USD?
AUD/USD pokes intraday high around 0.7055 ahead of the key RBA decision during early Tuesday. The Aussie pair seems to brace for the RBA’s likely downbeat comments amid cautiously optimistic markets. It should, however, be noted that Australia Health Minister Greg Hunt recently cheered the nation’s covid vaccine jabbing and hence hints at the firmer RBA statement.
That said, AUD/USD traders are likely to pay little attention to the RBA verdict unless the central bank cites any major catalysts or hints at February tapering of the bond purchases. Even so, optimism towards the national vaccination program may help the pair to keep the latest gains after the monetary policy decision.
Technically, AUD/USD keeps the bounce off November 2020 bottom amid oversold RSI conditions. However, the corrective pullback remains inside a five-week-old descending trend channel. While August 2021 bottom around 0.7105 lures short-term buyers ahead of the event, a convergence of the 10-DMA and upper line of the stated channel, near 0.7125, becomes a tough nut to crack for the bulls.
Key quotes
AUD/USD Price Analysis: Bulls look to test 0.71 the figure
AUD/USD bears are denied more downside, risk-on into RBA
Reserve Bank of Australia Preview: Market players looking for tightening hints
About the RBA interest rate decision
RBA Interest Rate Decision is announced by the Reserve Bank of Australia. If the RBA is hawkish about the inflationary outlook of the economy and rises the interest rates it is positive, or bullish, for the AUD. Likewise, if the RBA has a dovish view on the Australian economy and keeps the ongoing interest rate, or cuts the interest rate it is seen as negative, or bearish.
- USD/CHF refreshes intraday low while consolidating the biggest daily gains in a month.
- 100-SMA, 38.2% Fibonacci retracement of November’s upside challenge immediate advances.
- 200-SMA, monthly support line restrict short-term losses, Fibo. levels act as additional filters.
USD/CHF steps back from the weekly top while teasing intraday lows around 0.9250 during early Tuesday.
The Swiss currency (CHF) pair marked the biggest daily gains since early November the previous day but couldn’t overcome the confluence of 100-SMA and 38.2% Fibonacci retracement (Fibo.) of November 01-24 upside, around 0.9265.
The latest pullback eyes 50% Fibo. near 0.9230 but the 200-SMA level of 0.9210 will challenge the USD/CHF declines afterward.
Should the quote drops past 0.9210, the 61.8% Fibonacci retracement level and an ascending trend line from early November, around 0.9200 and 0.9175 in that order, will be crucial to watch.
Meanwhile, a clear upside break of the 0.9265 hurdle will need validation from the 0.9300 round figure and the November 17 peak of 0.9330 before directing the USD/CHF bulls to the previous month’s top near 0.9375.
Overall, USD/CHF may witness a short-term pullback but key supports to the south will challenge the bears.
USD/CHF: Four-hour chart
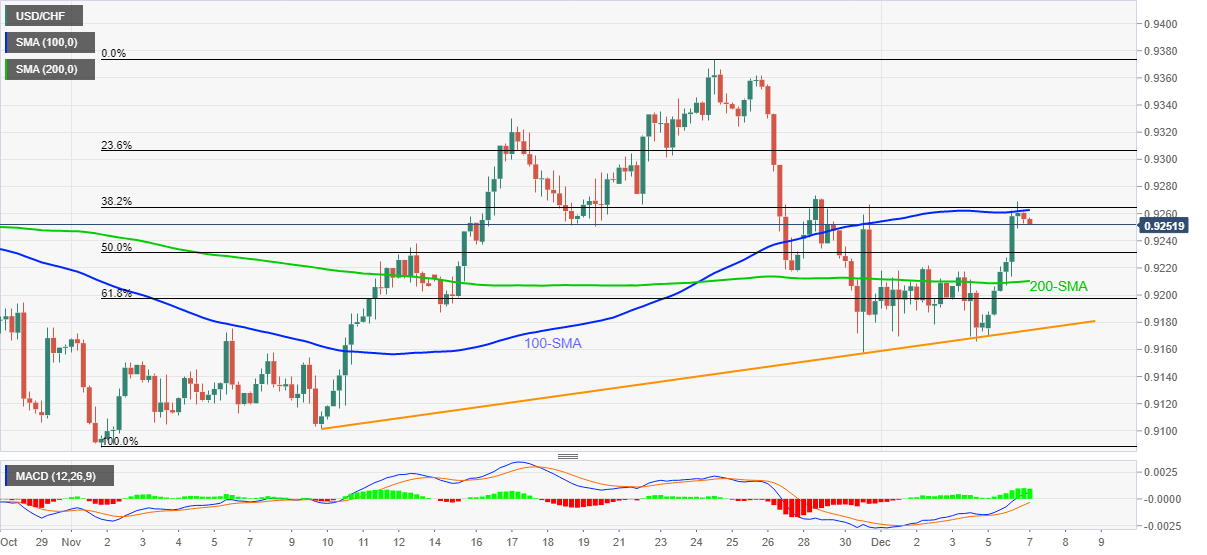
Trend: Pullback expected
- AUD/NZD better bid into the RBA today.
- The bulls are taking on the daily resistance that could act as support.
AUD/NZD is a touch higher on the day by some 0.1% following a stronger performance on Monday whereby the cross rallied from the 1.0350s to test and close above daily resistance near 1.0430.
Today’s Reserve Bank of Australia's meeting could set the scene for the foreseeable future and traders will be looking to see what the RBA might say about QE. Meanwhile, the risk-on driving forces surrounding the move higher in the Aussie were related to the better sentiment over the new covid-19 variant, Omicron.
The variant has now been detected in at least 24 countries around the world, according to the World Health Organization (WHO). However, since the WHO designated the new Covid omicron variant as being “of concern” less than two weeks ago, preliminary results are starting to emerge that are “a bit encouraging,” the White House’s chief medical advisor, Dr Anthony Fauci, said Sunday. The top US infectious disease official told CNN that "thus far it does not look like there's a great degree of severity to it," though he cautioned that it's too early to be certain.
As for the kiwi and its underperformance on Monday relative to the Aussie and CAD, analysts at ANZ bank explained that ''FX markets seem fatigued with the New Zealand “good news” story, and are instead looking to downside risks as we head into 2022.''
''These risks could challenge our published forecasts calling for NZD/USD to level off at 0.72 in 2022.''
RBA in focus
As for the RBA today, the central bank is expected to keep policy settings unchanged at its last meeting of 2021. ''As such, the focus will again be on the wording of the Governor’s decision statement, particularly any assessments of the latest round of economic data, including the Q3 national accounts, and the shifting external environment, particularly with respect to price inflation in developed economies,'' analysts at Westpac explained.
''The Bank’s following meeting, on February 1 next year, will likely see more meaningful shifts with a scheduled review of the bond-buying program expected to see purchases scaled back from $4bn/week to $2bn/week prior to a wind-down of the program by mid-May.''
AUD/NZD technical analysis
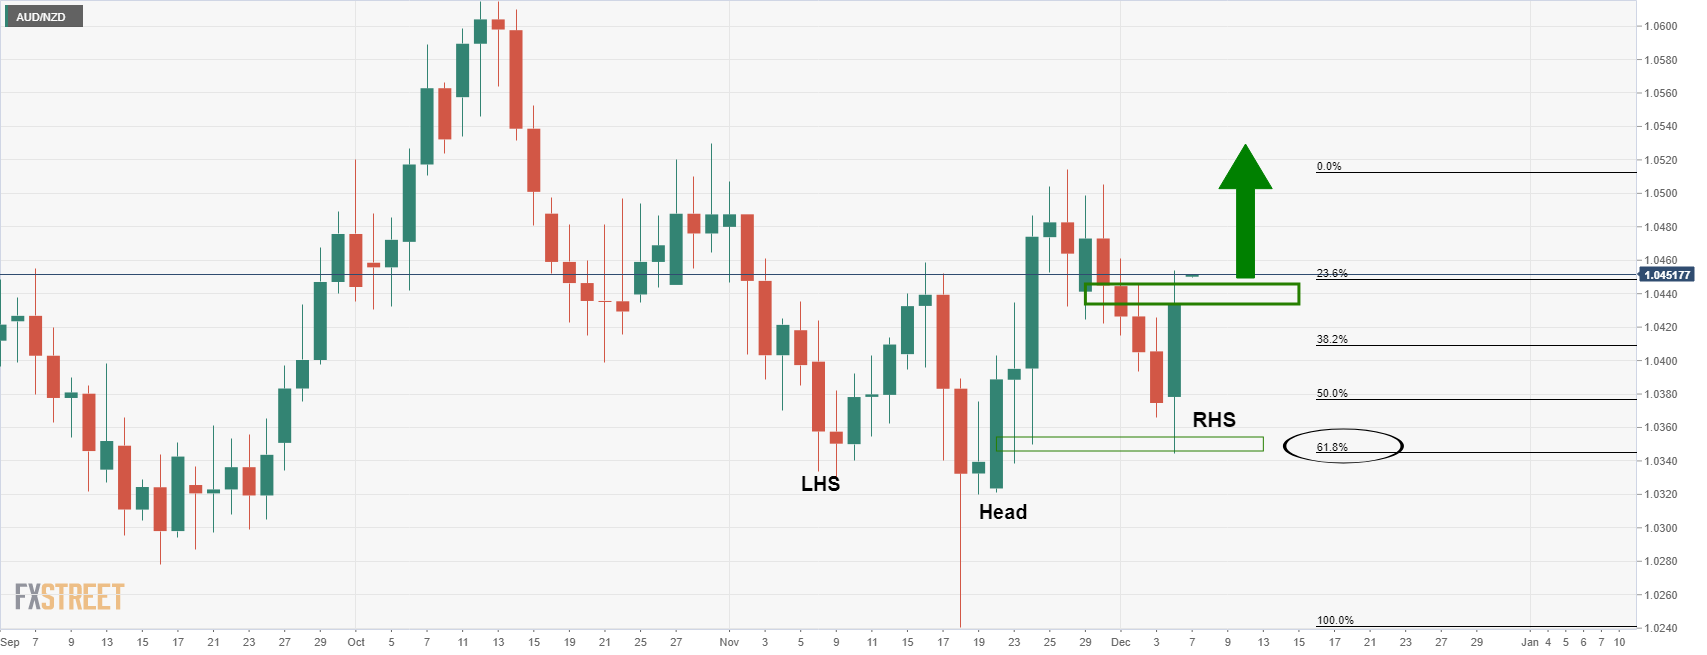
The inverse head and shoulders is a bullish chart pattern on this daily chart that could result in an upside continuation. The price has broken the daily resistance that would now be expected to act as a support on a retest leading into and around the RBA event today.
With that being said, much will depend on how the Aussie performs vs. a strong US dollar:
- AUD/USD Price Analysis: Bulls look to test 0.71 the figure
| Time | Country | Event | Period | Previous value | Forecast |
|---|---|---|---|---|---|
| 00:30 (GMT) | Australia | House Price Index (QoQ) | Quarter III | 6.7% | 5% |
| 03:00 (GMT) | China | Trade Balance, bln | November | 84.54 | 82.75 |
| 03:30 (GMT) | Australia | Announcement of the RBA decision on the discount rate | 0.1% | 0.1% | |
| 05:00 (GMT) | Japan | Leading Economic Index | October | 100.9 | 100.2 |
| 05:00 (GMT) | Japan | Coincident Index | October | 88.7 | |
| 06:45 (GMT) | Switzerland | Unemployment Rate (non s.a.) | November | 2.5% | 2.6% |
| 07:00 (GMT) | United Kingdom | Halifax house price index | November | 0.9% | |
| 07:00 (GMT) | United Kingdom | Halifax house price index 3m Y/Y | November | 8.1% | |
| 07:00 (GMT) | Germany | Industrial Production s.a. (MoM) | October | -1.1% | 0.8% |
| 07:45 (GMT) | France | Trade Balance, bln | October | -6.78 | -6.9 |
| 08:00 (GMT) | Switzerland | Foreign Currency Reserves | November | 922.97 | |
| 10:00 (GMT) | Eurozone | Employment Change | Quarter III | 0.7% | 0.9% |
| 10:00 (GMT) | Eurozone | ZEW Economic Sentiment | December | 25.9 | |
| 10:00 (GMT) | Germany | ZEW Survey - Economic Sentiment | December | 31.7 | 25.1 |
| 10:00 (GMT) | Eurozone | GDP (QoQ) | Quarter III | 2.1% | 2.2% |
| 10:00 (GMT) | Eurozone | GDP (YoY) | Quarter III | 14.2% | 3.7% |
| 13:30 (GMT) | U.S. | Nonfarm Productivity, q/q | Quarter III | 2.4% | -4.9% |
| 13:30 (GMT) | U.S. | Unit Labor Costs, q/q | Quarter III | 1.1% | 8.3% |
| 13:30 (GMT) | Canada | Trade balance, billions | October | 1.86 | 2 |
| 13:30 (GMT) | U.S. | International Trade, bln | October | -80.9 | -66.8 |
| 15:00 (GMT) | Canada | Ivey Purchasing Managers Index | November | 59.3 | |
| 20:00 (GMT) | U.S. | Consumer Credit | October | 29.91 | 25 |
| 23:50 (GMT) | Japan | Current Account, bln | October | 1033.7 | 1308.5 |
| 23:50 (GMT) | Japan | GDP, q/q | Quarter III | 0.4% | -0.8% |
| 23:50 (GMT) | Japan | GDP, y/y | Quarter III | 1.5% | -3.1% |
US inflation expectations, as measured by the 10-year breakeven inflation rate per the St. Louis Federal Reserve (FRED) data, consolidate pullback from the multi-day top marked during mid-November with an uptick to 2.44% by the end of Monday’s North American session, per the data source Reuters.
In doing so, the inflation gauge stays near the early October lows despite the recent bounce.
The uptick in the US inflation expectations could be linked to Friday’s hawkish Fedspeak, which in turn ignored the negative surprise of the US Nonfarm Payrolls (NFP) for November. The reason could be linked to the strong Unemployment Rate.
Even so, the market sentiment remains upbeat and the US Treasury yields are firmer as well.
For now, US inflation data for November, up for publishing on Friday will be crucial ahead of the next week’s Fed meeting.
Read: US inflation and Omicron impact seen as key factors for dollar
- WTI bulls take a breather following the biggest daily jump since late August.
- Firmer RSI line, sustained break of weekly resistance keep buyers hopeful.
- Monthly resistance line, 200-SMA will be tough challenges for upside momentum.
WTI prints mild gains around $69.80, after rising the most since August 23 the previous day. That said, the black gold battles 50-SMA while keeping an upside break of weekly resistance, now support.
Given the upward sloping RSI line, not overbought, joining the aforementioned price-positive technical catalysts, the WTI crude oil is likely to extend the latest run-up to the $70.00 threshold. However, the late November’s swing high near $72.75 will test the oil buyers afterward.
In a case where the commodity prices rally past $72.75, 50% and 61.8% Fibonacci retracements of October 25 to December 02 fall, respectively around $73.70 and $76.40, will be in focus.
Also adding to the upside filter is the 200-SMA level of $77.75, a break of which will recall the $80.00 to the chart.
On the flip side, the previous resistance line near $68.80 can lure the short-term sellers during the pullback moves.
Following that, multiple supports around $65.60-50 may entertain WTI bears below directing them to the recently flashed multi-day bottom surrounding $62.30.
WTI: Four-hour chart
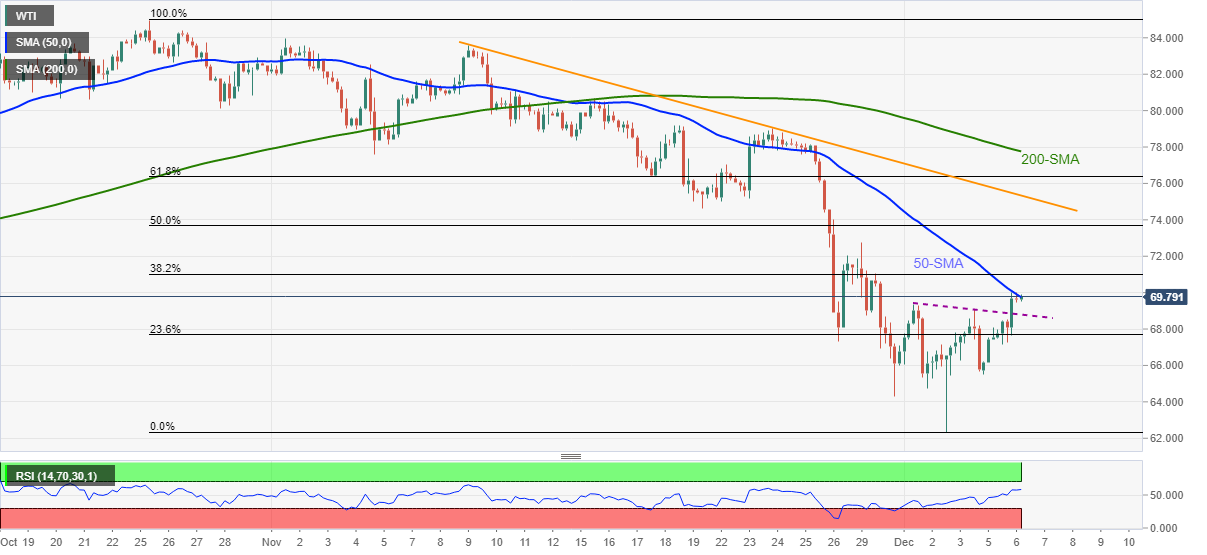
Trend: Further upside expected
In recent trade today, the People’s Bank of China (PBOC) set the yuan (CNY) at 6.3738 vs the last close of 6.3762.
About the fix
China maintains strict control of the yuan’s rate on the mainland.
The onshore yuan (CNY) differs from the offshore one (CNH) in trading restrictions, this last one is not as tightly controlled.
Each morning, the People’s Bank of China (PBOC) sets a so-called daily midpoint fix, based on the yuan’s previous day closing level and quotations taken from the inter-bank dealer.
“The rise in US house prices will slow to half its double-digit rate next year but still outstrip increases in consumer prices and wages, affordability would worsen over the next two to three years,” per the latest poll of property analysts from Reuters.
“Often viewed as the bedrock of financial wellbeing and consumer confidence, the U.S. housing market has not only weathered the pandemic-induced economic slowdown, it has outperformed the broader economy,” adds Reuters.
Key quotes
The S&P Case-Shiller index of 20 metropolitan areas has risen at a double-digit rate over the past 10 months, a pace the Nov. 17-Dec.6 polls of over 25 property analysts said would continue for the rest of the year to average at 16.8%.
That was expected to drop to 8.0% in 2022, according to the poll. Forecasts were in a 3-15% range.
Underscoring the strong demand for housing, U.S. existing home sales, which make up about 90% of U.S. home sales, were forecast to average at an over six million unit annualized rate until end 2022 at least.
However, higher consumer inflation and the U.S. Federal Reserve's recent overtures to tighten monetary policy earlier than expected are likely to rein in the pace at which prices have risen over the past year.
A lack of new supply, which has squeezed many new home buyers out of the market, will also remain a major challenge next year. Inventory levels are only about one-third of what is considered healthy.
When asked what will have the biggest impact on the U.S. housing market next year, all but one of the 27 analysts who answered an additional question chose either supply constraints (14) or higher interest rates (12).
Read: Weekly Column: How not to fight inflation – raise home building costs
- DXY fails to extend four-day uptrend following a bearish candlestick formation.
- Weekly resistance line, downbeat MACD signals also favor sellers.
- 20-DMA, five-week-old rising support line gain short-term seller’s attention.
US Dollar Index (DXY) begins Tuesday’s trading on a back foot, following a four-day run-up, around 96.28 by the press time.
In doing so, the greenback gauge justifies the previous day’s bearish candlestick formation while hugging tightly to a weekly resistance line. The bearish MACD signals also underpin the skepticism over the previous run-up.
The anticipated pullback, however, will be challenged by a 20-DMA level of 95.97, a break of which highlights an ascending support line from October 29, near 95.50.
Should the US Dollar Index breaks 95.50 support, it becomes vulnerable to test the early November tops near 94.60. During the fall, the 95.00 threshold can offer an intermediate halt.
Meanwhile, a clear upside break of the stated resistance line near 96.30 will need validation from 96.65 before directing DXY bulls towards the 97.00 psychological magnet.
To sum up, greenback bulls seem to have tired and hence the latest candlestick may play its role to trigger a pullback.
DXY: Daily chart
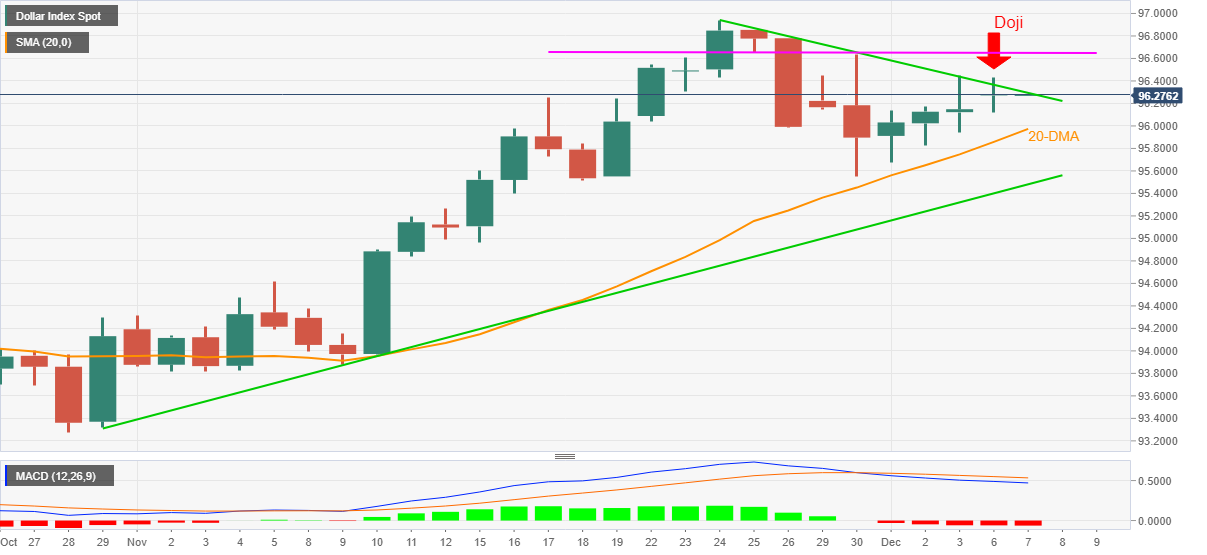
Trend: Pullback expected
- AUD/USD bears look to 0.68 the figure and bulls to 0.71 the figure.
- RBA event today will be key for the pair that is otherwise correcting in a semi-risk-on environment.
AUD/USD was a strong performer at the start of the week and benefitted from the risk-off unwind that occurred on the back of positive sentiment surrounding the covid headlines. These indicate the new variant is less severe.
Consequently, AUD/USD has taken on the mid-point of the 0.70 area and is now consolidating ahead of the Reserve Bank of Australia risk later today.
There is little chance of a continuation ahead of the event but every chance that volatility could arise around it. The following illustrates the bullish and bearish outcomes that could arise one way or the other from a technical perspective.
AUD/USD bullish prospects
From a long term analysis, the M-formation, which is a bullish reversion pattern, has been illustrated as follows:
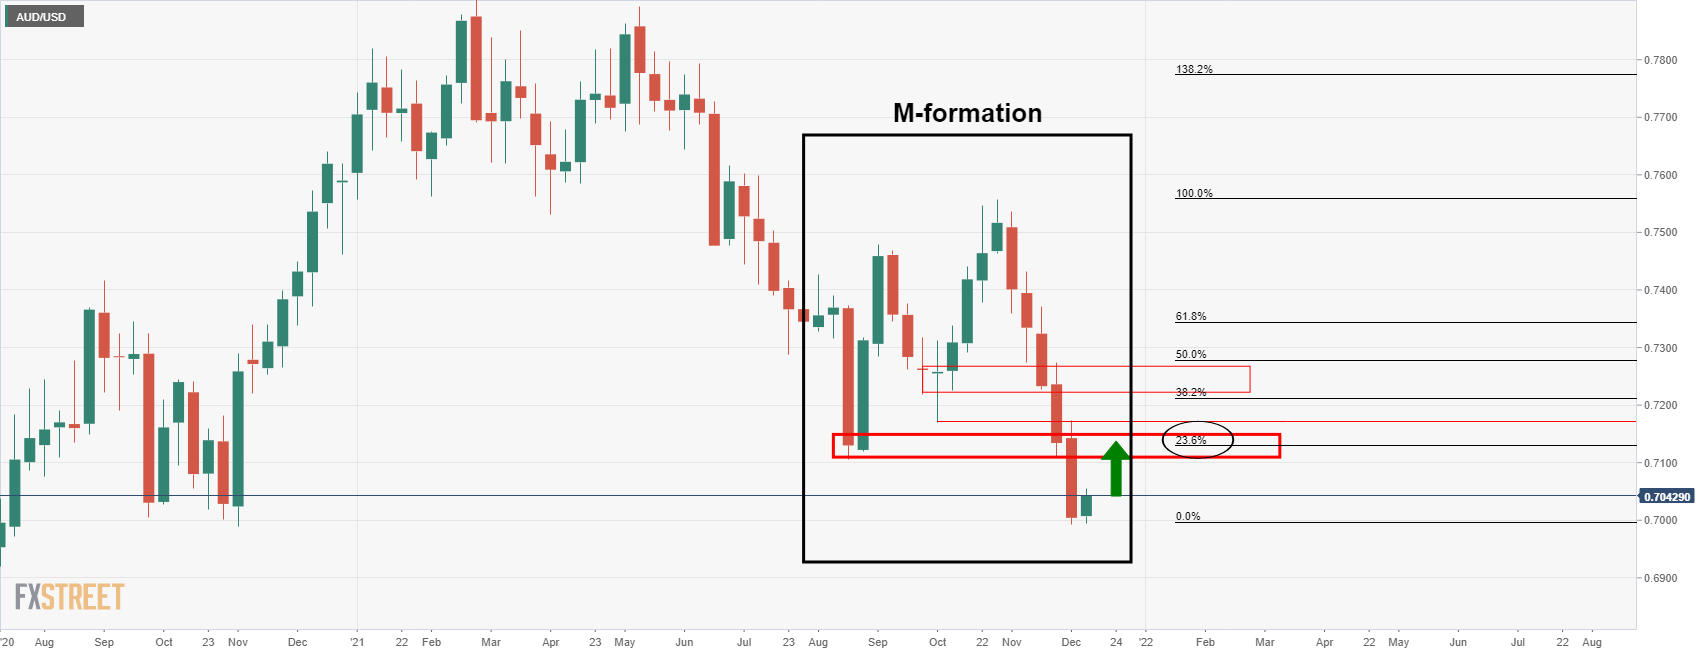
As seen, there is a structure between 0.7108/30 that the price could move into that has a confluence with the 23.6% Fibonacci retracement through 0.71 the figure near 0.7130.
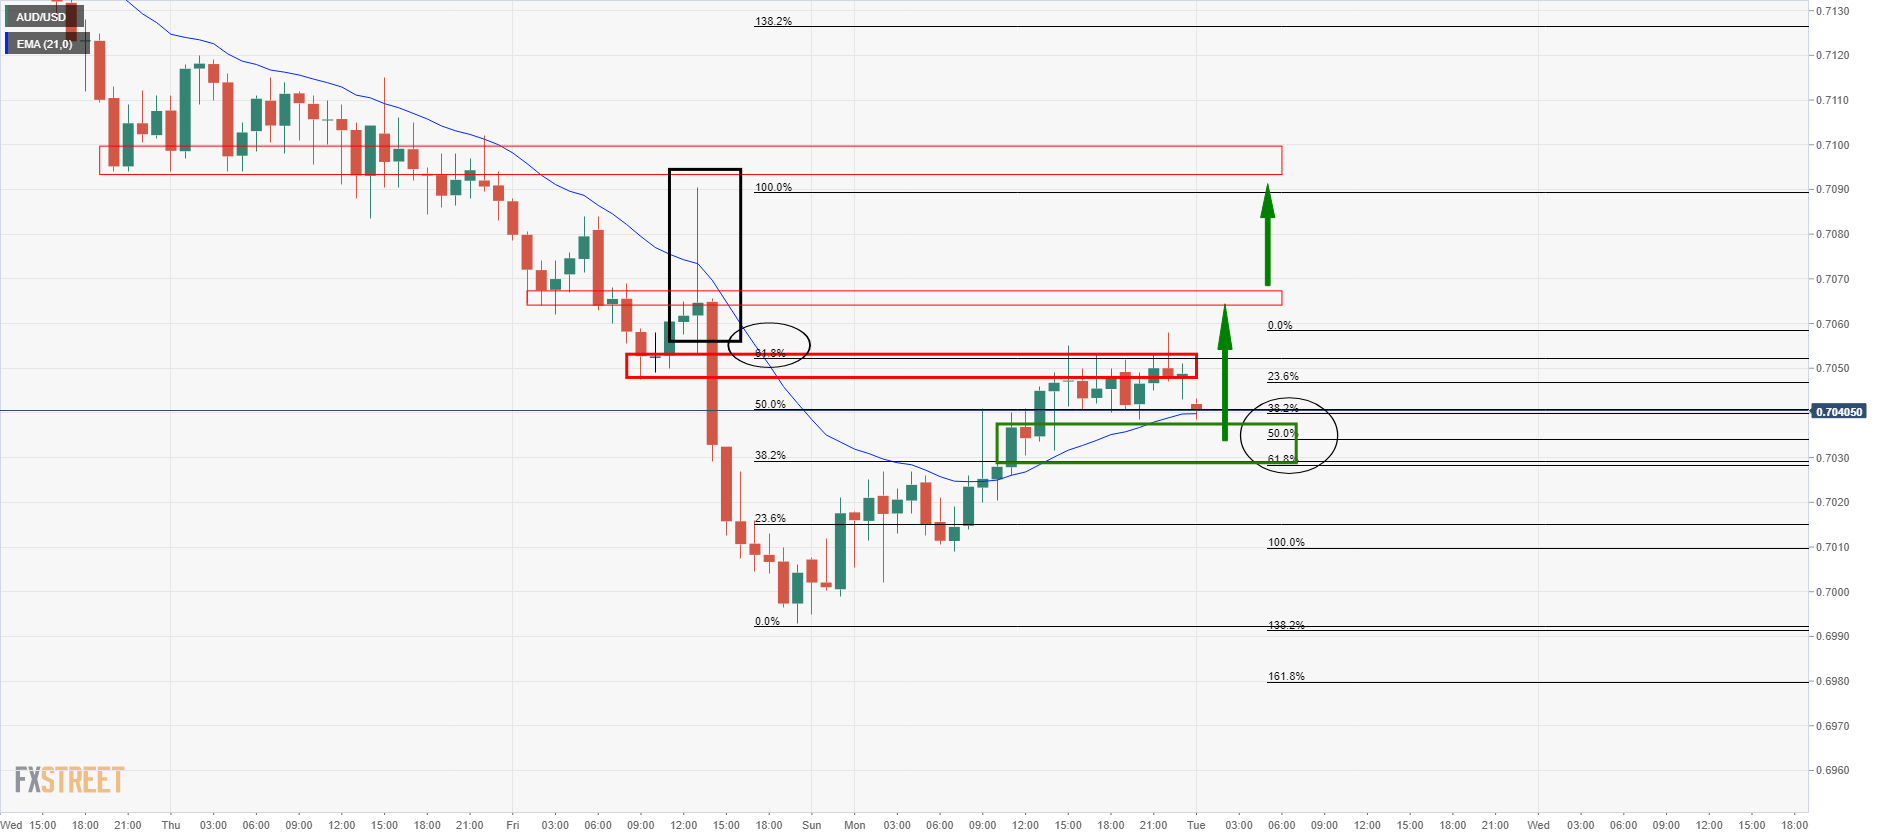
From an hourly perspective, the price has met resistance at the 61.8% Fibo of the prior hourly bearish impulse. The price is now correcting that rally to the 38.2% Fibonacci level near the 21-EMA. The support is located between here and the 61.8% of the latest bullish impulse. If this were to hold, then there are prospects of a continuation to the next layer of resistance near 0.7070. On a break of there, then there is space all the way to 0.71 the figure.
AUD/USD bearish outlook
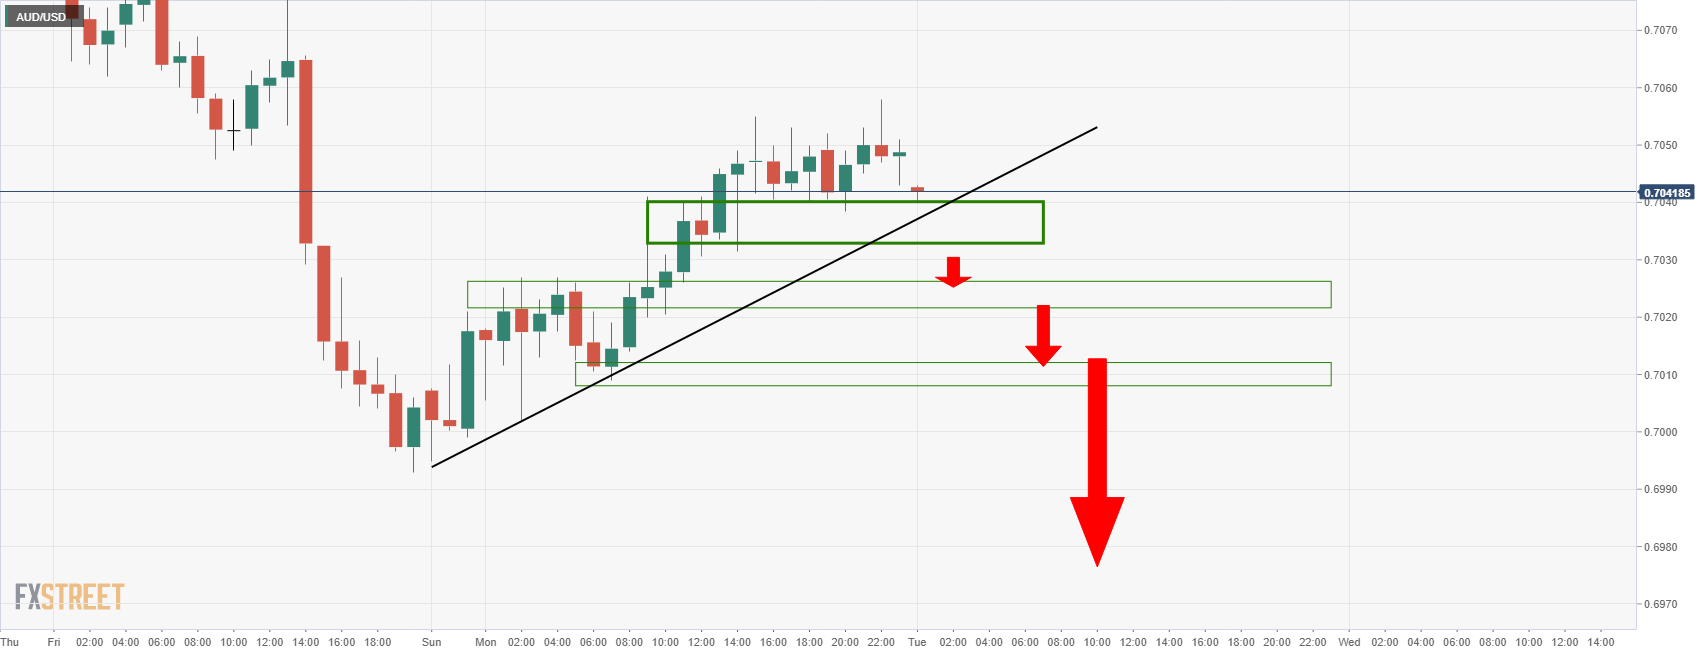
If the downside is not over, then the hourly chart's trajectory from a bearish perspective is layered with support as illustrated above. 0.7030 and 0.7010 could be levels of support that guard a breakout and a downside extension on the daily time frame:
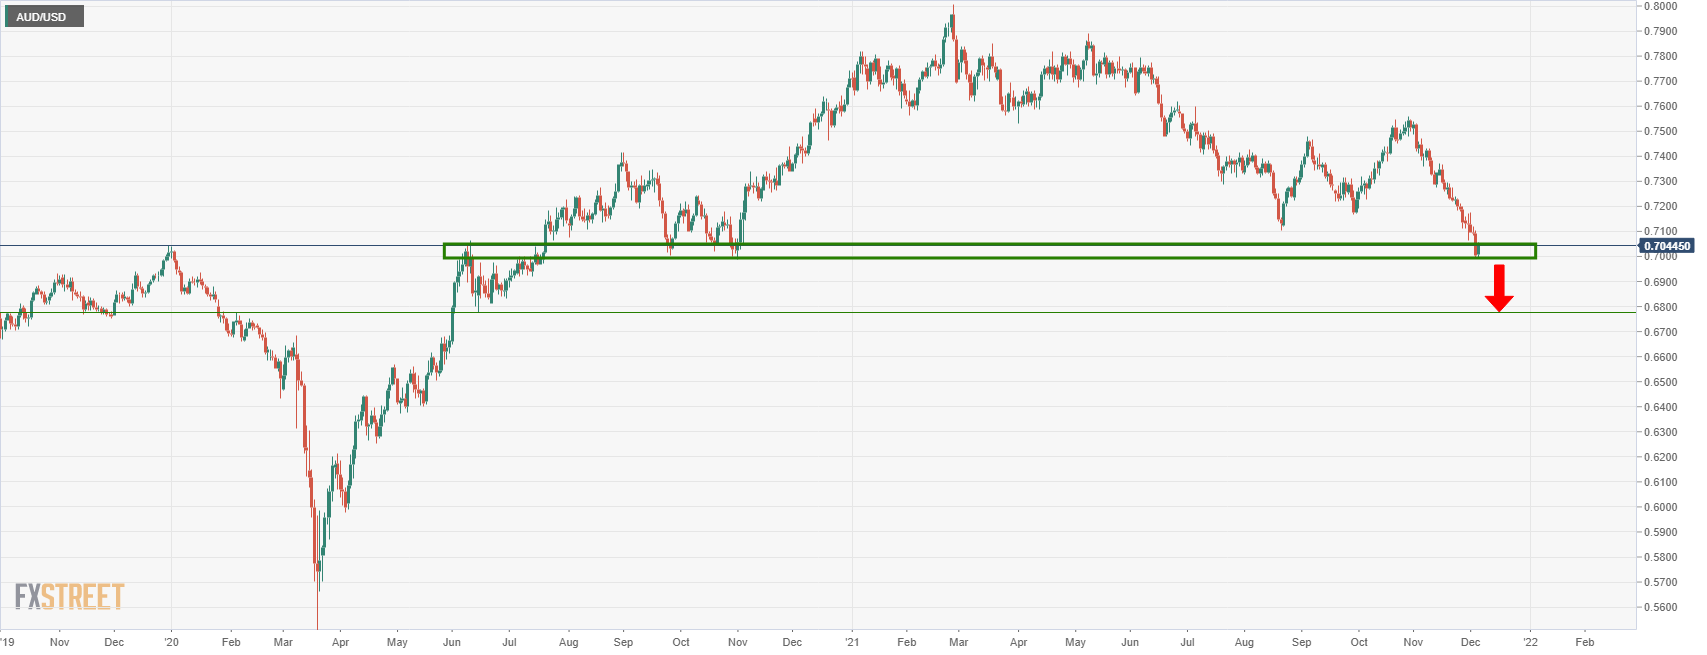
0.68 the figure could be targetted with 0.6780's acting as support below there.
- USD/JPY seesaws inside 10-pip range after a stellar rally.
- Yields, Wall Street cheered receding fears of Omicron, stimulus hopes amid a lack of Fed rate hike chatters.
- Japan’s PM Kishida’s readiness to recall lockdowns, if needed, joins mixed concerns over virus and pre-Fed mood to test bulls.
- Japan household spending posted a three-month downtrend in October.
USD/JPY struggles between 113.45 and 113.55 following the biggest daily jump since late November. That said, the yen pair seeks fresh catalysts to extend the run-up as Tokyo opens for Tuesday.
In addition to the absence of the market-moving factors, downbeat data from Japan and fresh fears of the South African covid variant, dubbed as Omicron, also weigh on the USD/JPY prices. Above all, steady US Treasury yields and inactive stock futures challenge the risk barometer pair’s latest moves.
Japan’s Overall Household Spending for October dropped for the third consecutive month, per YoY readings of -0.6% versus -1.9% prior. “Policymakers are hoping a rebound in domestic demand will support the economy as manufacturers navigate a global chip shortage and are hit by surging raw material prices,” Reuters said following the data release.
Elsewhere, Japan Prime Minister Fumio Kishida showed readiness to "prepare for the worst" in dealing with the Omicron variant of the coronavirus while still moving swiftly to get the economy back on track, per Kyodo News. It’s worth noting that Tokyo recently marked the third Omicron case while the overall COVID-19 infections eased.
On Monday, fears emanating from the coronavirus strain eased amid an absence of data supporting the previous woes citing heavy death toll and faster spread. Also favoring the risk-on mood were the hopes of finding a cure to Omicron. Additionally, consolidation of Friday’s heavy fall amid an absence of Fedspeak could also be cited as a positive catalyst for USD/JPY.
Looking forward, USD/JPY traders may witness lackluster moves amid a light calendar. Hence, headlines covering the coronavirus and inflation, as well as the performance of the US Treasury yields will be important to watch for fresh impulse.
Technical analysis
Although the previous resistance line from March restricts short-term downside around 112.50, 20-DMA surrounding 114.00 guards short-term upside of the USD/JPY prices.
| Pare | Closed | Change, % |
|---|---|---|
| AUDUSD | 0.70505 | 0.75 |
| EURJPY | 128.075 | 0.42 |
| EURUSD | 1.12843 | -0.17 |
| GBPJPY | 150.548 | 0.84 |
| GBPUSD | 1.32645 | 0.31 |
| NZDUSD | 0.67544 | 0.06 |
| USDCAD | 1.27545 | -0.51 |
| USDCHF | 0.92544 | 0.9 |
| USDJPY | 113.494 | 0.57 |
- USD/CAD grinds lower after the heaviest daily fall in two months.
- Clear break of three-week-old channel, bearish MACD signals favor sellers to aim for 100-SMA.
- 200-SMA, six-week-old support line challenge bears, bulls need validation from weekly resistance line.
USD/CAD remains on the back foot around 1.2760, following a downside break of a short-term rising channel formation.
In addition to the channel’s breakdown, bearish MACD signals also direct USD/CAD sellers towards the 100-SMA level surrounding 1.2690 during Tuesday’s Asian session.
It should be noted, however, that November 12 peak near the 1.2600 threshold may entertain the pair bears past 1.2690 but a convergence of the 200-SMA and an ascending trend line from October 27, near the 1.2555-45 zone, will be a tough nut to crack for USD/CAD bears.
Alternatively, corrective pullback not only needs to restore the channel formation, by rising back beyond 1.2790, but should also overcome the weekly descending resistance line, close to 1.2850, for conviction.
Following that, an upper line of the stated channel, surrounding 1.2920 and the 1.3000 psychological magnet will be in focus.
USD/CAD: Four-hour chart
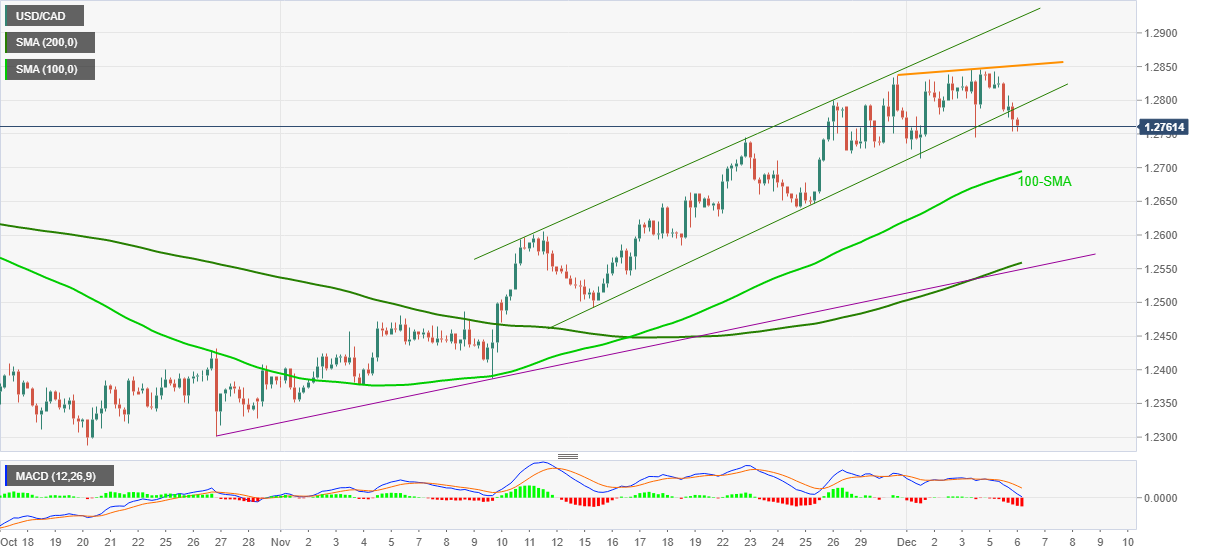
Trend; Further weakness expected


© 2000-2026. All rights reserved.
This site is managed by Teletrade D.J. LLC 2351 LLC 2022 (Euro House, Richmond Hill Road, Kingstown, VC0100, St. Vincent and the Grenadines).
The information on this website is for informational purposes only and does not constitute any investment advice.
The company does not serve or provide services to customers who are residents of the US, Canada, Iran, The Democratic People's Republic of Korea, Yemen and FATF blacklisted countries.
Making transactions on financial markets with marginal financial instruments opens up wide possibilities and allows investors who are willing to take risks to earn high profits, carrying a potentially high risk of losses at the same time. Therefore you should responsibly approach the issue of choosing the appropriate investment strategy, taking the available resources into account, before starting trading.
Use of the information: full or partial use of materials from this website must always be referenced to TeleTrade as the source of information. Use of the materials on the Internet must be accompanied by a hyperlink to teletrade.org. Automatic import of materials and information from this website is prohibited.
Please contact our PR department if you have any questions or need assistance at pr@teletrade.global.
transfers