- Analytics
- News and Tools
- Market News
CFD Markets News and Forecasts — 10-12-2021
- The US Dollar Index ended the week above the 96.00 threshold.
- The US 10-year Treasury yield finished flat, at 1.482%.
- DXY Technical outlook: An upside break above an ascending triangle target 98.00.
The US Dollar Index, also known as DXY, which measures the greenback’s performance against a basket of six rivals, slides 0.19%, sitting at 96.04 during the day as the New York session wanes, at the time of writing. The market sentiment was upbeat as the Wall Street session closed, with major US equities finishing in the green recorded gains between 0.60% and 1.13%.
In the US bond market, Treasury yields in the short-maturity of the curve fell with 2s, 5s, and 10s dropped between 1-3 basis points, ended at 0.6544%, 1.2467%, and 1.482%, each. In the long-term of the curve 20s and 30s, gained between 1-1.5 basis points, sat at 1.9138% and 1.88%, respectively.
Apart from that, the US dollar was left at the mercy of the US inflation figures. On Friday, the Department of Labor reported that the Consumer Price Index for November on an annual basis rose to 6.8%, in line with estimations, and higher than October’s reading at 6.2%. Further, the Core CPI, which excludes food and energy, rose to 4.9%, as foreseen though more elevated than October’s 4.6%
Later on the day, the University of Michigan Consumer Sentiment for December rose to 70.4 from 67.1 in November.
US Dollar Index (DXY) Price Forecast: Technical outlook
The US Dollar Index finished the week above the 96.00 figure for the second week in a row. The DXY is in a clear uptrend, and through the last couple of weeks, price action consolidated around the 95.50-96.50 range, forming an ascending triangle in an uptrend.
In the event of breaking to the upside of the formation, the ascending triangle target would be 98.00, but it would find some hurdles on the way up.
The first resistance would be 97.00, followed by June 30 high at 97.80, followed by the ascending triangle target at 98.00.
-637747711408984974.png)
- USD/JPY continues to trade close to the 113.50 level after seeing some post-US inflation data choppiness.
- The pair continues to track moves in the US 10-year yield and as long as that remains subdued, USD/JPY will struggle to recover.
USD/JPY was subdued on Friday, for the most part sticking within recent ranges and not deviating too far from the 113.50 area, which, alongside the 50-day moving average (currently at 113.60), has acted as something of a magnet to the price action these last few days. On the day, the pair is flat just under 113.50, having seen some choppiness after the release of US inflation data which confirmed the headline rate of CPI rising to a four-decade high at 6.8%, though judging by the market reaction, mny had been expecting higher.
The pair is on course to end the week around 0.6% higher and, indeed, Omicron uncertainty that had weighed on the pair and pushed back from recent peaks above 115.00 has faded somewhat this week. Market participants are now more comfortable in the knowledge that 1) the new variant is milder than delta and 2) the Fed is intent on pressing ahead with accelerating the removal of monetary stimulus as high inflation threatens labour market progress (according to them) and as the Omicron variant threatens exacerbating inflationary pressures further.
Whilst these notions are offering some support to risk appetite and the dollar against other G10 currencies, long-term US yields remain subdued and this is preventing USD/JPY from pushing on. With the US 10-year still under 1.50%, there are clearly significant worries that the ongoing presence of the pandemic will weaken long-term growth prospects, as might a faster pace of Fed monetary stimulus removal, thus meaning that in the long-run, the Fed has to stay comparatively more accommodative.
For USD/JPY to advance back towards recent highs around 115.00, some confidence in the long-term outlook for the US economy is going to have to come back. With Covid-19 cases in the US already on the rise into winter (following in the footsteps of Europe) prior to the emergence of Omicron, expect this trend to further accelerate in the coming months. That means lockdown-light could be coming back to some of the more pro-lockdown states, weighing on activity. This could underpin the yen versus the dollar in the near term, even in the face of a hawkish Fed pivot.
- A risk-on market mood boosts risk-sensitive currencies like the British pound, the JPY falls.
- Traders’ mood turned negative when the US inflation crossed the wires, thought later improved.
- GBP/JPY Price Forecast: Has a neutral-bullish bias, though downside risks remain.
The British pound pares some Thursday’s losses during the New York session gains 0.31%, trading at 150.45 at the time of writing. In the American session, a risk-on market mood kept safe-haven currencies like the JPY low. Also, major US equities are rising between 0.51% and 0.90%, while the US 10-year Treasury yield is flat at 1.485%.
Apart from that, the GBP/JPY pair fluctuated around the 149.75-150.25 range during the overnight session. When Wall Street opened, the cross-currency dropped from 150.20 to the bottom of the aforementioned range, as investors weighed the US inflation figures, which showed that the uptrend in elevated prices had not peaked yet. Then, once the report was dissected and market mood improved, that boosted risk-sensitive currencies, in this case, sterling, advancing sharply towards 150.34, as the European session ended.
GBP/JPY Price Forecast: Techincal outlook
The 1-hour chart at press time depicts that the GBP/JPY trades above the December 9 high, which lies at 150.31. The bias for the pair is neutral, as it has been in consolidation throughout the last three days, failing to print fresh daily highs/lows. However, the GBP bulls appear to be in control, as the hourly simple moving averages (SMAs) reside below the spot price.
To the upside, the first resistance would be the December 8 cycle high at 150.69, followed by the December swing high at 151.12.
On the flip side, the first support would be Friday’s low at 149.66. A breach of that level would expose crucial cycle lows, like December’s 8 at 149.34, followed by the December 3 pivot low at 148.97.
-637747660946443148.png)
- AUD/JPY strengthened a tad on Friday amid a more upbeat tone to markets.
- AUD/JPY appears to be forming a pennant and could break higher towards its 21DMA near 82.00.
AUD/JPY strengthened a tad on Friday amid a more upbeat tone to markets. US inflation data didn’t come in quite as high as some had feared it would, spurring a rally in US equities and commodities amid relief that the Fed wouldn’t be under quite so much pressure to rush its monetary tightening. At least, that is what some market commentators said, but the Fed will still be alarmed to see the YoY rate of Consumer Price Inflation hit 6.8%, a four-decade high, and will likely sound hawkish next week.
Anyway, it could have been worse (higher), hence the relief seen in risk assets that benefitted risk-sensitive AUD and hurt demand for safe-haven JPY. AUD/JPY thus managed to rally from earlier session lows under 81.00, but was unable to reclaim the 81.50 mark. At current levels in the 81.30s, it trades higher by about 0.3% on the day and is on course to close out the week with gains of about 3.0%, having reversed all the way higher from under 79.00.
The main driver of the upside this week, aside from the general improvement in risk tone and upside in commodities, was Tuesday’s not as dovish as expected RBA meeting, which some analysts interpreted as them opening the door to an earlier rate rise (perhaps as soon as mid-2022). In terms of the technicals, the pair broke to the north of an important recent downtrend that has been offering both support and resistance in recent weeks and then bounced off it on the retest, hence the up day on Friday. For now, AUD/JPY appears to be forming a pennant and could break higher towards its 21-day moving average just under 82.00 if risk appetite remains largely positive next week.
- EUR/JPY bounced back from sub-1.2800 lows on Friday to trade in the 128.30 area.
- Pandemic uncertainty is keeping the pair under pressure, as focus turns to next week’s ECB meeting.
EUR/JPY bounced back from sub-1.2800 lows on Friday to trade in the 128.30 area. The pair looks on course to end the week about 0.6% higher, having found solid support in the 127.50 area earlier in the week. EUR/JPY was at one point on Wednesday above 129.00, meaning that over the course of the last two days it has given back 50% of its weekly gains. A similar trend has been witnessed across JPY crosses, they continue to struggle to recovery to pre-Omicron levels. For EUR/JPY, that was above 129.00.
Why could this be the case? The uncertainty is far from over. Yes, it seems as though Omicron is much milder than delta. But there has also been plenty of evidence this week to suggest that it is significantly more transmissible (a Japanese study put it at 4.2 times more transmissible). That means that even if its infection to hospitalisation rate is (for example) five times lower than with the delta variant if it spreads to enough people simultaneously thanks to its high transmissibility, hospitals could still be overwhelmed. That means governments may still be inclined to tighten lockdowns as infection rates rise in the coming weeks and they will rise significantly. Many already are (most notably the UK government implementing its Covid-19 “Plan B”).
Thus, it remains difficult to predict how economic growth will progress over the coming quarter in Europe and elsewhere and this naturally favours the safe-haven yen. Despite elevated pandemic uncertainty, the ECB seems intent on ending its pandemic era emergency QE programme in March as planned, though sources this week indicated it may temporarily increase its pre-pandemic QE programme to ease rate of the decline in purchases so as to avoid any disorderly conditions in markets. Next week’s ECB meeting should shed light on its QE plans. For now, EUR/JPY will likely trade within recently established 127.50-129.00 ranges as uncertainty clears up.
- The EUR/USD trims some of Thursday’s losses, gains some 0.14% once the US inflation reaction settled down.
- US bond yield 2s drop, while the 10-year Treasury yield remains unchanged.
- EUR/USD Price Forecast: To remain within the 1.1300-20 range ahead into the weekend.
Once the European desks head into the weekend and the US inflation reaction settled down, the EUR/USD climbs 0.14%, trading at 1.1310 during the New York session at the time of writing.
Ahead of the Wall Street open, the US Bureau of Labor Statistics (BLS) reported that US inflation for November increased to 6.8%, as shown by the CPI annually based. Also, the Core CPI, which means inflation without volatile items like food and energy, rose to 4.9%, as foreseen by analysts.
Read more: EUR/USD heads for another weekly close around 1.1300
The US bond yields trim some earlier losses at press time, except for 2s, down two basis points at 0.6604%, a headwind for the greenback, with the US Dollar Index down 0.23%, sitting at 96.05. Meanwhile, the US 10-year benchmark note is flat at 1.482%, after dropping almost two basis points as market participants dug deep into the CPI report.
EUR/USD Price Forecast: Technical outlook
The 1-hour chart depicts the EUR/USD pair faded the upward move, around the 1.1324 area, nearby the November 26 high at 1.1331, retreated towards the 1.1310s. It is worth noticing that the last four 1-hour candles, rejected around 1.1320, leaving the aforementioned as solid resistance. However, the 50-hour simple moving average (SMA) at 1.1308 would help EUR bulls to keep the pair within the 1.1308-20 range.
To the upside, the first resistance would be 1.1320. A breach of the latter would expose the R1 daily pivot at 1.1331, followed by the December 9 high at 1.1345.
On the flip side, the confluence of the double-zero, the 200-hour SMA, and the central daily pivot around 1.1300-05 are the first support. In the event of breaking lower, the immediate support would be the 100-hour SMA at 1.1294, followed by the December 9 cycle low at 1.1278.
-637747619191114038.png)
- USD/CAD has swung either side of the 1.2700 level and currently trades around 1.2720, rouhgly flat on the day.
- The loonie was one of the underperforming G10 currencies on the day, the reasoning for which wasn’t clear.
Despite slightly higher crude oil prices on the day and the recent hawkish tone to remarks from BoC Deputy Governor Gravelle on Thursday, the loonie was one of the underperforming G10 currencies on Friday. USD/CAD spent the day undulating either side of the 1.2700 level, falling to lows of the day in line with the 21-day moving average at 1.2680 following not as hot as feared US inflation data, before then rebounding as high as the 1.2740 mark later in the session. At present, the pair is trading roughly flat in the 1.2720 area. On the week, however, the pair looks on course to post a loss of about 0.9%.
As to what drove, CAD underperformance, it's not entirely clear. Technical factors could be at play following the bounce from the 21DMA. Some have cited the BoC’s comparatively dovish stance versus the Fed when it comes to 1) seeing Omicron as a risk worth tweaking the policy path for and 2) with regards to the characterisation of inflation. For reference, while the reference to inflation as transitory was removed from the BoC’s latest statement on monetary policy, this isn't as aggressive as the Fed’s outright stance that the word transitory should be completely retired.
In terms of what's next for the USD/CAD, the pair is roughly at the mid-point between last week’s highs at 1.2850 and this week’s lows close to 1.2600. The focus next week will be on the US dollar side of the equation with the main event of the week being the FOMC meeting. Should the bank surprise with a more hawkish tone than expected on QE taper, inflation or rate hikes, USD/CAD’s risks would lay to the upside rather than the downside, even crude oil markets and risk appetite continue to recover from the recent Omicron-related knock.
UK Brexit Minister Lord David Frost said on Twitter on Friday that the UK and EU had made further limited progress on medicines but we have not reached agreement.
- After the US CPI report, the white metal trims some of Thursday’s losses, up 0.72%.
- Inflation in the US jumps to a 30-year high level not seen since 1982, close to 7%.
- Silver Price Forecast: Strong support around $22.00-15 might keep bulls in charge, though downside risks remain.
Silver (XAG/USD) pares some of Thursday’s losses during the New York session, up some 0.96% trading at $22.14 at press time. In the American session, the market sentiment switched towards a risk-on, with US equities rising, between 0.17% and 0.60%, while US Treasuries fell as investors trimmed bets on the pace of the Fed bond taper.
Early in the New York session, the US Department of Labor released the Consumer Price Index for November. Numbers came within expectations, with the headline on an annual basis at 6.8%, trailed by October’s 6.2% figure. Meanwhile, Core CPI, which excludes energy and food, rose 4.9%, higher than the October 3.6%. These figures have not been seen since 1982, and its upward move is attributed mainly to elevated prices in gasoline, shelter, food, and vehicles.
The data cemented the Fed’s expectations to trigger a faster QE’s reduction as expressed by policymakers led by Chair Powell in the last week. Some policymakers said that the central bank should decrease the amount by double the reported on November’s meeting, so in that scenario, the Federal Reserve would end its stimulus by the first quarter of 2022. That would leave some room for the US central bank in the case of needing to raise rates sooner than estimated.
In the meantime, US T-bond yields extend their fall, with 2s, 5s, and 10s, down between 2-4.0 basis points, sitting at 0.6483%, 1.2288%, and 1.465%, each. Moreover, following the US Treasuries footsteps, the US Dollar Index, which tracks the greenback’s performance against a basket of six rivals, slides 0.26%, down to 96.01, at press time.
XAG/USD Price Forecast: Technical outlook
The silver 1-hour chart shows a $0.30 spike once the US CPI headline news crossed the wires, printing a daily high of around $22.23. The 50-hour simple moving average (SMA) at $22.14 is under pressure at press time, but it has another support level around the area, with the central daily pivot at $22.07.
Silver’s first resistance would be the confluence of the 100-hour SMA and the R1 daily pivot around the $22.25-31, followed but the 200-hour SMA at $22.41. A breach of the latter would expose the December 9 high at $22.46.
On the flip side, the central daily pivot at $22.07 would be the first line of defense for the non-yielding metal bulls. A break below that level would expose $22.00, followed by the December 9 low at $21.85.
-637747569888482489.png)
- US equities gained across the board amid relief that US inflation didn’t again surprise on the upside.
- The S&P 500 gained about 0.5% and is back around 4690.
US equities gained across the board amid relief that the November US Consumer Price Inflation (CPI) report didn’t again surprise on the upside. The S&P 500 gained 0.5% to recover from Thursday’s 4667.40 close to around 4690. The Nasdaq 100 was up 0.7% and the Dow was up 0.25%. The VIX fell a further more than 2.0 points to under 19.50.
For reference, headline CPI came in at 6.8%, in line with expectations. Some had been expecting an upside surprise following remarks from US President Joe Biden who seemed to pre-emptively playdown inflation fears, which market participants took as an indication that Friday’s number would be higher than expectations. Note that Biden gets to see the important data releases one day early. Still, the headline rate of inflation was at its highest in nearly four decades.
According to JPM’s Jai Malhi, “today's rise in US inflation was broadly expected but it does confirm that price pressures continue to build but also broaden out”. “This release,” he continued, “won't deter (the Fed) from speeding up the (taper) process, allowing the central bank to raise rates earlier next year if required.” A recent poll conducted by Reuters showed the median expectation of poll participants was for the Fed to start hiking rates in Q3 2022, followed by a second hike in Q4. Most said the risk was that hikes would come earlier, rather than later.
Given a recent shift in Fed language that some analysts have pointed out, betting on a first hike in Q3 might be overly dovish. Rather than continuing to emphasise that raising interest rates too early was a threat to the labour market recovery in the US, the Fed has pivoted to calling inflation a threat to the recovery in the US.
By many metrics, claims some analysts, the US labour market is already pretty much back to full employment – just this week, weekly initial jobless claims fell to their lowest since 1969 at 184K and JOTLs data showed the number of job openings in October moved back above 11M again. The Fed may now see containing inflation as a way to protect recent labour market progress. If the Fed does surprise in 2022, this might make things difficult for growth/duration-sensitive stocks (like big tech) as yields are pushed higher.
According to the UK Health Secretary Agency, there is evidence of immune evasion with the Omicron Covid-19 variant, according to Reuters. The agency said that two experiments show Omicron to have decreased lab neutralisation by 20 to 40 fold compared to the original virus, and by 10 to 20 fold compared to the Delta variant.
The agency added that the booster increases protection against mild disease to around 70-75% in a real-world study looking at 581 people with confirmed Omicron infection. However, the agency said that it was seeing reduced vaccine effectiveness for both the AstraZeneca and Pfizer jabs against mild disease with Omicron.
Market Reaction
Markets did not react to the latest data from the UK Health Secretary Agency.
- The USD/CHF slides 0.28% during the New York session after US inflation peaked near 7%.
- A risk-off market mood boosts the Swiss franc, as the greenback falls underpinned by lower US bond yields.
- USD/CHF Price Forecast: Neutral bias, but a break under 0.9200 could send the pair tumbling towards 0.9165.
On Friday, after the US Labor Department reported that US CPI rose to the highest level since 1982, the USD/CHF edges down 0.32%, trading at 0.9206 during the New York session at the time of writing.
Market sentiment has worsened in the last couple of hours as investors dissected the last US inflation report. Asian and European equity indices finished in the red. Meanwhile, in Wall Street at the open, major indices rose. However, they are in the red in the last hour, except for the S&P 500 and the Nasdaq.
On Friday, the US Bureau of Labor Statistics (BLS) reported that the Consumer Price Index for November on a yearly basis reading came at 6.8%, as foreseen by analysts, though higher than October’s 6.2%. Further, the Core CPI for the same period, excluding volatile items like food and energy, came at 4.9%, as widely expected, trailed by October’s figure, which increased up to 4.6%.
USD/CHF Price Forecast: Technical outlook
The USD/CHF hourly chart depicts that the pair has a neutral bias. At press time, the spot price is approaching an upslope trendline around the 0.9200-05 area, a support level that, in the case of giving way, could send the pair towards the December 9 low at 0.9191.
To the upside, the USD/CHF is firmly pressured by the 200-hour simple moving average (SMA) at 0.9217, followed by the 50-hour SMA at 0.9236. Then the confluence of the central daily pivot and the 100-hour SMA, around 0.9228-36.
On the flip side, the 0.9200 figure is the first line of defense for USD bulls. The breach of that level exposes essential support levels, like the abovementioned December 9 low, followed by December 3 low at 0.9165.
-637747515573328389.png)
Analysts at MUFG Bank, favor a scenario with further weakens for the pound relative to the US dollar. They see GBP/USD could fall below 1.3000 for the first time in a year. They warn a surprise decision to hike rates from the Bank of England should trigger a bigger (bullish) GBP reaction especially as shorts have
been built up recently.
Key Quotes:
“We continue to favour further GBP weakness in the near-term especially against the USD, and expect cable to fall below the 1.3000 for the first time in just over a year. The timing of lift off for rate hikes by the BoE and Fed appears to be narrowing considerably if the BoE delays raising rates again while the Fed speeds up tightening plans.”
“One note of caution is that GBP shorts have already become a popular trade reaching their highest level in over 2 years amongst Asset Manager/Institutional and Leveraged Funds combined. As a result, a surprise decision by the BoE to raise rates would likely trigger a bigger GBP (bullish) reaction.”
“Omicron to make BoE more cautious over raising rates in near-term. A decision to leave rates on hold next week is better priced now which should help dampen negative GBP reaction. Dropping guidance for rate hikes in coming months would be bigger bearish surprise for GBP.”
With plenty of central bank meetings next week, including the Fed and the European Central Bank, analysts at MUFG Bank, see the euro set for further declines going forward. They look look for a test of the recent low at 1.1186.
Key Quotes:
“We see EUR/USD remaining under downward pressure and continue to expect a slow grind to the 1.1000 level. In less than 24hrs next week we are likely to see quite different communications from the Fed and ECB with the ECB determined to reinforce its current guidance of no rate hike until inflation is at 2% “durably” and well ahead of the end of the forecast period. The message will act to depress rate hike expectations in the aftermath of the meeting.”
“EUR/USD is set to retest the pre-Omicron low of 1.1186 helped by an ECB policy announcement that will reinforce the more dovish stance of the ECB relative to the Fed and other G10 central banks.”
Data released on Friday ahead of next week FOMC meeting showed US CPI reached the highest annual rate since 1982 at 6.8%. Analysts at Wells Fargo, pressures remain broad based, with supply chains still struggling to meet turbocharged demand for goods, and services inflation only recently beginning to reflect the pandemic's effects on housing costs. They expect the monthly trend in price gains to moderate ahead, but consider there is a lot of daylight between the current pace of inflation and the Fed's goal.
Key Quotes:
“Once again strength was broad based. The goods side of the economy continues to adapt to the massive shift in spending on "things", and services inflation pushed forward as travel-related prices rebounded and housing inflation climbed. While current strength continues to reflect the strains of the pandemic, that is likely to be little comfort to consumers seeing paychecks and savings stretch less.”
“We expect headline CPI to peak on a year-ago basis at about 7% in the first quarter before base effects get tougher come spring. Monthly gains should continue to trend lower as the acute pressures from goods inflation begins to ease up and offsets the emerging momentum in services inflation. However, another big wave of COVID cases this winter could delay relief by keeping goods demand turbo-charged and global supply lines strained.”
“Even as the monthly trend in price hikes moderates ahead, there is a lot of daylight between November's increase and the 0.2% monthly gains that would return inflation to a pace consistent with the Fed's target. We estimate that headline and core CPI will still be above 3% year-over-year this time next year. We therefore look for the Fed to announce accelerating its wind-down of asset purchases at its meeting next week and to then raise the fed funds rate 50 bps in the second half of 2022. Slower inflation next year is not the same as benign inflation, and we think the Fed will need to respond accordingly.”
- EUR/GBP has spent the majority of Friday’s session within a thin 0.8530-0.8550 range, though the pair is testing key support.
- Weaker than expected UK GDP numbers for October did not provide any lasting impetus.
EUR/GBP has had a subdued session on Friday, spending the majority of the session moving sideways within a 0.8530-0.8550ish range. In recent trade, it has pushed to fresh session highs just above 0.8550 but is only up about 0.1% on the day.
Weaker than expected UK GDP numbers (the economy grew just 0.1% MoM in October versus forecasts for 0.4% growth) did not provide the pair with any notable impetus. Still, analysts assess the data as likely further dampening expectations that the BoE will kick off its rate hiking cycle next week. According to Reuters, money market futures were now pricing in a 38% probability of a 15bps rate hike next week during the European morning, compared with 46% on Wednesday and nearly 70% at the start of last week.
Analysts had already been tweaking their BoE calls in wake of a dovish shift in the tone of policymakers, who have indicated they may prefer a more patient approach when it comes to raising rates in light of Omicron uncertainty. The government’s reaction to Omicron (increased curbs on the economy) will weigh on the economy and likely be noted as a downside risk by the bank. According to Commerzbank, “recent developments surrounding Omicron are now even causing doubts about a hike in February”. “If the market believes that a rate hike is only being postponed to February,” the bank continued, “sterling is unlikely to come under severe depreciation pressure… (but) if the BoE gives reasons to doubt this, sterling might depreciate further.”
EUR/GBP continues to probe a key area of support in the form of a downtrend that had been acting as resistance for much of the last three months but is now acting as support. To recap, EUR/GBP broke above this long-term downtrend on Wednesday in wake of rumours about the UK government’s impending announcement of a toughening of Covid-19 curbs. However, traders did not have the conviction to send the pair convincingly beyond early November highs in the 0.8590s, nor to meaningfully challenge the 0.8600 level, and thus selling pressure pushed the pair back under 0.8550 on Thursday, where it has traded ever since.
-637747501424392041.png)
The key event next week will be the FOMC meeting. According to analysts from TD Securities, the central bank will announce a faster QE tapering. They don’t see rate hikes until 2023.
Key Quotes:
“The taper pace will likely be doubled to $30bn per month, consistent with QE ending in March. Officials will likely also convey a more hawkish tone through the statement, the economic projections, and the dot plot. The median dot will probably show a 50bp increase in 2022. We expect enough slowing in inflation and growth to delay rate hikes until 2023, but, for now, strong data are encouraging hawkishness.”
“Scope for USD upside is capped given how much is priced in the front-end. As a practical matter however, a hawkish SEP, a faster taper and less threat from Omicron leave the USD in our good graces still.”
- The US Consumer Price Index (YoY) for November closes to 7%, ahead of the Fed’s last meeting of the year.
- The market sentiment is a mixed-bag, though risk-sensitive currencies like the GBP rise.
- GBP/USD Price Forecast: A triple-bottom in the 1-hour chart targets 1.3300.
The British pound is barely flat as Wall Street opens, up some 0.07%, trading at 1.3230 at the time of writing. The awaited US inflation figures were released, spurring a jump in US equity markets, despite the downbeat market sentiment in the Asian and European session.
Inflation in the US hits a 30-year high
Before the Wall Street open, the US Bureau of Labor Statistics (BLS) unveiled that the Consumer Price Index for November on a YoY reading increased by 6.8%, as foreseen by analysts, though higher than October’s 6.2%. Meanwhile, the Core Consumer Price Index for the same period, which excluded volatile items like food and energy, came at 4.9%, as widely expected, trailed by October’s figure, which increased up to 4.6%.
The high reading emphasized the posture adopted by the Federal Reserve. In the last week, Fed’s policymakers expressed the need to increase the QE’s reduction speed so that the central bank could have room to act as needed. Also, on Monday of the last week, Fed’s Chairman Powell pivot from a dovish stance to a hawkish one, as he reiterated that inflation is no longer transitory, and he coincides with Fed’s Bullard, Bostic, Daly, among others, that a faster bond taper is required.
In the meantime, after shrugging off the initial reaction to the inflation report, US T-bond yields extend their fall, with 2s, 5s, and 10s, down between 1.5-2.0 basis points, sitting at 0.6624%, 1.2386%, and 1.472%, respectively. Further, following the US Treausires footsteps, the US Dollar Index, which tracks the greenback’s performance against a basket of six rivals, slides 0.10%, down to 96.16, at press time.
GBP/USD Price Forecast: Technical outlook
The GBP/USD in the hourly chart shows that GBP buyers defended the 1.3187 level two-previous times in the last three days, meaning that once the downward move broke the 1.3200 figure, it was quickly rejected, reclaiming the 1.3200 handle. Consequently, that has formed a triple-bottom formation that has bullish implications.
At press time, the GBP/USD is also breaking above the confluence of the 50 and the 100-hour simple moving averages (SMA’s), another signal.
The first resistance level would be the R1 daily pivot at 1.3237. A breach of the latter would expose a confluence area around the R2 daily pivot and the 200-hour SMA in the 1.3255-60 range, that once broken, would give way to the R3 daily pivot at 1.3290.
On the flip side, the 1.3200 figure would be the first support. A break of the figure would expose the 1.3187 daily low, followed by the YTD low at 1,3160.
-637747488722204745.png)
- WTI briefly pushed back above $72.00 on Friday after not as high as feared US inflation triggered risk-on.
- Oil prices have since eased back but remain on course for their best week since August.
Oil prices have been choppy on Friday, though have for the most part traded on the front foot and are on course for their best weekly performance since August. Front-month WTI futures began the session in the low-$70.00s after profit-taking weighed on the price on Thursday but briefly surpasses $72.00 at one point earlier in the session.
At the time, a not as bad as feared US inflation report for November spurred some risk-on sentiment across markets which had clearly been positioning for an upside surprise on expectations. This favoured crude oil prices at the time. In the subsequent hours, prices have ebbed lower again and currently trade in the mid-$71.00s, with gains on the day of still more than $1.0.
At current levels, oil prices have eroded between 50-60% of their post-Omicron emergence decline. This recovery has been aided by growing confidence in the notion that the new Omicron variant is set to be far milder than past variants like delta. According to Commerzbank "the oil market has… rightly priced out the 'worst-case scenario' again, but it would be well advised to leave a certain residual risk to oil demand in place”.
That residual risk is a referral to the potential economically harmful reaction to Omicron that some governments might/already have taken. Travel restrictions and work-from-home directives are a direct threat to fuel demand and one that markets aren’t taking lightly after the UK upped its Covid-19 curbs by implementing “Covid-19 Plan B” earlier in the week. This seems to be what is preventing oil from emulating the US stock market and recovering back to its pre-Omicron levels.
Early data suggests the virus is significantly more transmissible than prior variants (a Japanese study put it as 4.2 times more transmissible than delta) so global infection rates are bound to surge. Market participants will be nervously watching hospitalisation rates, which have so far not shown signs of a significant rise in South Africa (the epicentre of the outbreak).
- EUR/USD moving sideways after US inflation numbers.
- Dollar losses momentum near the end of the week ahead of next week’s FOMC meeting.
- Euro about to post fourth consecutive weekly close near 1.1300.
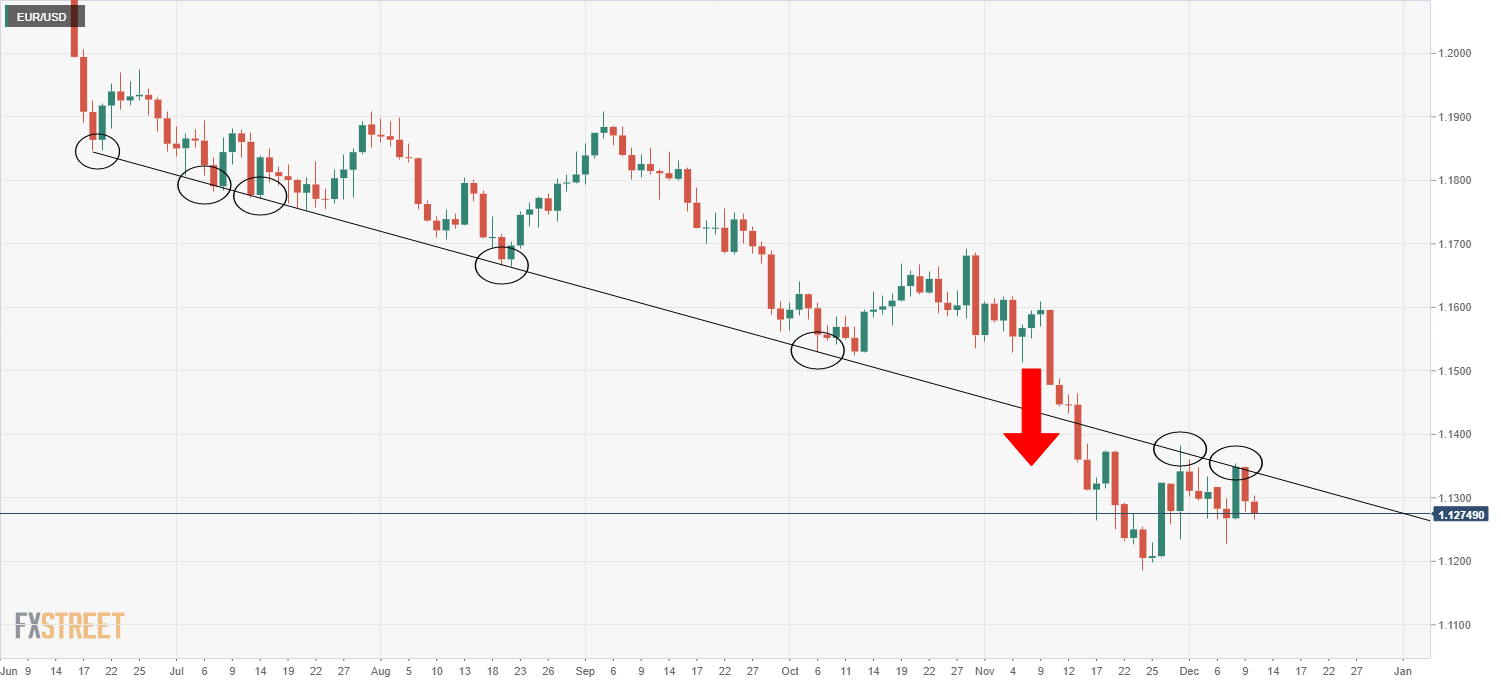
The EUR/USD peaked at 1.1309 after the release of US inflation data and then pulled back to 1.1270 only to rise back toward the 1.1300 area. The greenback lost momentum late on Friday, after data, amid lower US yields and higher equity prices.
Inflation numbers in the US showed the CPI reached at 6.8%, the highest level since 1982. A different report showed a larger-than-expected increase in Consumer Confidence to 70.4 in December, above the 67.1 expected.
Despite economic number, EUR/USD continues to move sideways, now for two weeks. The pair is about to post the fourth consecutive weekly close around 1.1300 (also the 20-day moving average). It is flat for the day and the week. The main trend is bearish but currently on a consolidation mode.
Key events for next week
In the Eurozone, analyst at ING point out that some signs of life from German industrial production in October will no doubt help the region as well, but broad concerns about input shortages and transportation problems remain. “While October might look reasonable, it doesn’t look like the sideways trend from recent months will end soon. More important perhaps is the December PMI, which will shed light on the impact of the 4th wave of the coronavirus on the economy. With some countries having introduced new restrictive measures, this is the one to look out for.”
In the US, the key event will be the FOMC meeting. Most market analysts expected the central bank to announce an acceleration in the tapering of the purchase program. Analysts also expect changes to rate hike expectation from the Fed staff. Recent inflation numbers, including today’s CPI, and recent comments from Chair Powell speaking no more about “transitory” inflation warrant some action next week that should have an impact across financial markets, including EUR/USD.
Technical levels
- The UoM Consumer Sentiment Index rose to 70.4 from 67.1 in December.
- The better than expected consumer numbers failed to move FX markets.
Consumer confidence in the US strengthened modestly in December with the University of Michigan's (UoM) preliminary estimate of the Consumer Sentiment Index rising to 70.4, up from 67.4 in November. This print came in above market expectations of 67.1.
Meanwhile, the preliminary estimate of the December Consumer Expectations index also rose to 67.8. Markets had expected the expectations focused index to drop to 62.0 from 63.5 in December. Finally, the Current Conditions Index rose to 74.6, up from 73.6 a month ago and above expectations for a drop to 71.0.
Market Reaction
The better than expected US consumer sentiment figures for December are reassuring but did not have any notable impact on FX markets. While better than expected, sentiment remains highly subdued by historical standards.
- US yields drop after US data helping Japanese yen across the board.
- USD/JPY remains sideways, testing the 113.30 area.
The USD/JPY is falling on Friday after and it is near the daily low located at the 113.30 region. Earlier the pair peaked at 113.79 before turning to the downside amid some dollar weakness following US data.
Yields down, yen up
The Japanese yen gained momentum across the board after the release of US CPI for November. The numbers came most in line with expectations, with the annual rate rising to 6.8%, the highest since 1982. Those numbers trigger a decline in US bond yields. The 10-year fell to 1.47% and the 30-year to 1.85%. Next week is the FOMC meeting.
“The concern at the Fed will be that high inflation today can fuel expectations of higher inflation tomorrow and the day after that and so on. This can then feed through into wage demands, and in an environment of decent corporate pricing power we see those costs post onto customers. The Fed will be keen to avoid this (or be seen willing to tolerate it), hence our expectations for a faster taper next week, with the programme concluding in February. We also expect them to signal the prospect of two rate hikes in their “dot plot”, up from the one they currently have”, commented analysts at ING.
Ahead of the end of the week, USD/JPY is near the 113.30 support area. A break lower could trigger more losses. The next support is seen at 113.05 and then 112.70. On the upside, 113.55 is the immediate resistance followed by the 113.80 zone.
Technical levels
- US inflation figures rose the most since the early 1980s, and gold spiked towards the 100-DMA around $1,790.
- On an annual basis, CPI for November rose 6.8%, while Core CPI came at 4.9%.
- XAU/USD Price Forecast: Strong support around $1,779 would keep gold prices within the $1,780-90 range.
Gold (XAU/USD) vs. the US Dollar is rallying during the New York session, up some 0.27%, trading at $1,780 at the time of writing. Inflation in the US climbed to its fastest annual rate since 1982. US equity futures reacted to the upside, while the US 10-year benchmark note fell to 1.47%, while the US Dollar Index held at the 96.00 threshold.
US Consumer Price Index hits the highest level since the early 1980s
On Friday, the US Bureau of Labor Statistics (BLS) reported that the Consumer Price Index for November annually based rose by 6.8%, in line with estimations, though higher than October’s 6.2%. Excluding volatile items like food and energy, the so-called Core Consumer Price Index for the same period came at 4.9%, as widely expected, trailed by October’s figure, which increased up to 4.6%.
The report further cemented the intentions of the Federal Reserve to increase the pace of the bond taper, as mentioned by US central banks policymakers in the last week. Led by Fed’s Chair Jerome Powell, he noted that favors a faster QE’s reduction and emphasized that he would “speak about it” at the next meeting, in the next week, on December 15-16.
In the overnight session ahead of the US Consumer Price Index, gold seesawed around $1,778, the central daily pivot point, followed by an $8 slide towards the December 9 daily low around $1,770. Once the inflation headline crossed the wires, gold printed a $19 spike up to $1,790, near the 100-day moving average (DMA), to retreat down to familiar levels around high $1,770s.
In the meantime, US bond yields got hit at the CPI release, though at press time, it seems that once market participants dissected the report, US bond yields in 2s, 5s, and 10s, are almost flat at 0.6825%, 1.2581%, and 1.48%, respectively. Following the US Treasuries path, the US Dollar Index also dropped, around the 96.00 figure, but it appears to have recovered previous losses, down 0.01%, sitting at 96.26.
XAU/USD Price Forecast: Technical outlook
In the hourly chart, gold is trading around the simple moving averages (SMA’s), which are in a narrow $2 range within the $1,779-82 area. Furthermore, the central daily pivot around $1,778.50 lies below that range, meaning it would be solid support for USD bulls to overcome.
The first resistance on the way up would be the December 9 high at $1,787. A breach of the latter would expose the confluence of the 100-day moving average (DMA), the R2 daily pivot, and the December 8 high around $1,792.
On the flip side, the central daily pivot at $1,778.50 would be the first support. If USD bulls push the price further down, that will expose the December 9 low at $1,773, followed by the S1 daily pivot at $1,769.
-637747452153924698.png)
Gold is on course to register its first annual decline in three years. With the Fed ready for policy rate lift-off and global liquidity conditions gradually tightening, headwinds from rising US real yields may result in a bearish tilt to gold’s medium-term outlook, rather than a complete reversal of the long-term uptrend, economists at ING report.
Real yields to rise, weighing on gold prices
“Gold still trades at a premium over fair value versus TIPS due to broadening US inflationary pressure and perhaps incorporating some risk premium from the uncertainties around the Omicron variant and geopolitical risks in eastern Europe. Looking ahead, we see the risk of the Fed concluding its QE tapering program in the first quarter of 2022 with at least two rate hikes in the second half of next year.”
“Like the Fed, we believe inflation will gradually slow through 2022 while nominal Treasury yields should rise as US monetary policy and global liquidity conditions gradually tighten. This should result in real yields starting to rise, and as a result, weigh on gold prices. However, the ultimate goal would be to get to a zero real rate in the 10yr, but it may not be until 2023 and beyond before that happens. This, compounded with some lingering risks on the virus front, may still offer some support to gold in the next few months.”
“We are of a directional bearish view towards gold for the medium-term, rather than a complete reversal of the long-term uptrend.”
See – Gold Price Forecast: XAU/USD points to downside, seen around $1,685 in 2022 – Citibank
Inflation in the US rose to 6.8% on a yearly basis in November from 6.2% in October. That was in line with the median economist forecast. Given how the USD traded ahead of this data, a softer tone could emerge. This has its limitations, however, as this number will do nothing to derail a hawkish Fed, economists at TD Securities report.
Fed forced into action
“Another very strong CPI report, although largely as expected this time. The total rose 0.8% MoM (6.8% YoY), while core rose 0.5% (4.9% YoY). The data add to the case for Fed officials to turn more hawkish at the FOMC meeting next week.”
“Given how the USD had traded ahead of this report, the absence of a positive surprise should lend some modest relief for USD bears. That said, this number will not do anything to derail a hawkish Fed at its upcoming meeting.”
“We are biased to fade USD/CAD above 1.27, while EUR/USD should struggle to re-test 1.1350, while USD/JPY should reflect Fed pricing (which has eased a little).”
- NZD/USD briefly pushed back above 0.6800 in wake of not as high as feared US inflation figures.
- Analysts said the market had been positioning itself for an upside surprise, hence the unwind of bullish dollar bets.
NZD/USD has been choppy in recent trade, rebounding from close to session lows around 0.6780 to momentarily back above 0.6800 in wake of a bad as feared increase in US Consumer Price Inflation in November. The pair has since dropped back to around the 0.6790 level, where it trades broadly flat on the day after failing to push above Asia Pacific session highs at 0.6806.
The move higher was a result of dollar weakness following the broadly as expected Consumer Price Inflation (CPI) figures, which saw the YoY rate of CPI hit near four-decade highs at 6.8%. Analysts noted that markets had appeared to be positioning themselves for an upside surprise in the run-up to the data, with some citing comments from US President Joe Biden on inflation on Thursday as hinting towards a higher-than-expected inflation reading. To recap, Biden commented on Thursday that some of the recent declines in energy prices would not have fed into the CPI yet - some saw this as him attempting to pre-emptively playdown fears about higher-than-expected inflation.
Thus, with inflation broadly failing to beat expectations, that was enough to see an unwind of bullish dollar bets. The Fed is still likely to view this data with extreme disappointment, however, and it will strengthen the hand of the more hawkish FOMC members pushing for faster monetary policy normalisation.
Back to the kiwi; again lags its fellow non-USD dollar peers (AUD and CAD) which could be a reflection of a significant slowdown in Manufacturing PMI to 50.6 in November from 54.3 the month prior. But alternative NZ data released on Friday was positive, with spending on electronic cards up 9.6% in November, suggesting consumption will drive a strong economic rebound in Q4. Ahead, NZD/USD traders should keep an eye on an eye on the release of the preliminary US University of Michigan Consumer Sentiment survey which is out at 1500GMT.
Otherwise, traders should watch the latest headlines on Omicron for further information on 1) transmissibility (seems very high), 2) vaccine effectiveness (still not clear, but they still seem somewhat effective) and 3) severity (illness associated with Omicron infection seems very mild versus delta).
GBP/USD is weaker on GDP miss. Econimists at Scotiabank believe the Bank of England (BoE) is set to hold next week, triggering a fall to 1.30 on the cable.
Another pass this month by the BoE
“The UK economy expanded by only 0.1% MoM in October versus a median projection of 0.4% owing to a strong decline in construction output and flat manufacturing activity amid supply shortages.”
“OIS pricing still sees a roughly 40% chance, but we think it is almost certain that the bank holds. Given Saunders’s (top hawk) comments earlier this week that he would perhaps prefer to wait for more evidence on the Omicron front before altering policy, the bank could go as far as voting unanimously for a hold.”
“We see near-term weakness in the GBP toward 1.30 (on a hawkish Fed and a BoE hold next week, as well as political risks) but with gains resuming in the new year ahead of the BoE’s hiking cycle.”
Here are the results of Deutsche Bank’s special 2022 global market survey conducted from December 6-9 2021. It is worth noting that respondents believe that Bitcoin is more likely to halve than double next year.
What will the S&P 500 return in 2022?
“S&P 500 expectations were moderate, an average return of +4.2% in 2022 would be the third-worst of the last decade, where the average return has been +14.6% a year if you include YTD numbers for 2021. 19% thought a negative return.”
When will the Fed end taper?
“More than 80% of respondents expect the Fed’s taper to end in H1 '22. A non-trivial amount of you (6%) think we’re set to have QE through the whole of the year.”
How many bps will the Fed hike in 2022?
“With the taper potentially out of the way, a solid majority expects two Fed rate hikes next year. This is a bit shy of market pricing, which has around 2.7 hikes.”
When will the next US recession occur?
“A majority (64%) expect the next US recession by 2024. Only 4% think we'll have one next year although we had a high number of don't knows.”
In 2022, Bitcoin is more likely to:
“62% of respondents think Bitcoin is more likely to halve than double. Unsurprisingly, the odds placed on Bitcoin halving increases in line with respondent's age. 56% of under 35s think its more likely to double, only 26% of over 55s share that opinion.”
EUR/USD has failed to regain 1.13 and is set to retain a soft undertone into the European Central Bank (ECB) meeting. Economists at Scotiabank expect the euro to dip under 1.12 and forecast the world’s most popular currency pair at 1.08 by end-2022.
EUR/USD to retest the 1.12 level
“Next week’s ECB meeting is expected to deliver details on the bank’s plans after the expiry of the PEPP in March, but the bank has already prepared markets for an expansion of the APP. Overall, it will maintain a highly accommodative stance that will weigh on the EUR in the quarters ahead as the Fed begins its hiking cycle and we now see the currency closing 2022 at 1.08.”
“The balance of today’s US CPI release and next week’s Fed and ECB meetings could easily see the EUR drop under 1.12 in the days ahead.”
According to Reuters, the Swiss government is considering a further tightening of Covid-19 curbs in order to snap a recent rise in infections. The government is considering imposing new rules to restrict indoor public access to vaccinated and naturally immune individuals, whilst indoor locations where masks cannot be worn would require negative tests for entry.
Alternatively, the government is considering shutting down locations such as bars, restaurants and nightclubs where masks cannot be worn. The government has also proposed limiting private gatherings to five persons whenever one of them, including children, is unvaccinated. The government also proposed a limit on all private gatherings regardless of vaccination status to just five people if further restrictions become necessary. A decision will be taken by and announced on the 14th of December.
Market Reaction
USD/CHF has not seen any reaction to the news.
- AUD/USD jumped to a fresh daily low in reaction to the US consumer inflation figures.
- The USD witnessed a typical "buy the rumour, sell the news" kind of a trade post-data.
- The risk-on mood further benefitted the perceived riskier aussie and remained supportive.
The AUD/USD pair gained some positive traction during the early North American session and shot a fresh daily high, around the 0.7180 region following the release of US consumer inflation figures.
The headline US CPI rose 0.8% MoM in November as against 0.7% anticipated and the yearly rate accelerated from 6.2% in October to 6.9%, marking the highest level since 1982. Adding to this, core inflation, which excludes food and energy prices, rose 0.5% MoM and 4.9% from a year ago, matching consensus estimates. The data reaffirmed expectations that the Fed would tighten its monetary policy sooner rather than later to contain stubbornly high inflation.
Given that investors have been pricing in the prospects for a faster policy tightening by the Fed, the US dollar witnessed a typical "buy the rumour, sell the news" kind of trade and weakened a bit. This, along with a generally positive tone around the equity markets, benefitted the perceived riskier aussie and provided a modest lift to the AUD/USD pair. That said, any meaningful positive move still seems elusive, warranting some caution for bullish traders.
As investors digest the latest macro data, the focus now shifts to the upcoming FOMC monetary policy meeting on December 14-15. Heading into the big central bank event risk, investors might refrain from placing aggressive bets. Nevertheless, the AUD/USD pair remains on track to end the week on a positive note and snap five successive weeks of the losing streak.
Technical levels to watch
- The headline rate of YoY CPI hit 6.8% in November, in line with expectations.
- The dollar dropped given markets had been positioning for an upside surprise prior to the release.
Inflation in the US, as measured by the Consumer Price Index (CPI), rose to 6.8% on a yearly basis in November from 6.2% in October, the US Bureau of Labor Statistics reported on Friday. That was in line with the median economist forecast. The MoM pace of price increases as per the CPI came in at 0.8%, above expectations for a MoM gain of 0.7%, but a slight deceleration from October's 0.9% MoM reading.
In terms of the Core CPI, that came in at 4.9% YoY, also in line with expectations and up from October's YoY reading of 4.6%. The MoM rate was in line with expectations at 0.5%, a slight deceleration from the 0.6% MoM rate of core price growth in October.
Market Reaction
The dollar has come under selling pressure in wake of the broadly as expected CPI figures, with the DXY dropping back towards 96.00 from above 96.40 prior to the data. Analysts noted that markets had appeared to be positioning themselves for an upside surprise in the run-up to the data, with some citing comments from US President Joe Biden on inflation on Thursday as hinting towards a higher than expected inflation reading. To recap, Biden commented on Thursday that some of the recent declines in energy prices would not have fed into the CPI yet - some saw this as him attempting to pre-emptively play down fears about higher than expected inflation.
- USD/CAD was seen oscillating in a narrow trading band above the 1.2700 mark on Friday.
- An uptick in crude oil prices underpinned the loonie and capped the upside for the pair.
- Hawkish Fed expectations, rising US bond yields extended some support to the greenback.
- Investors now look forward to the US consumer inflation figures before placing fresh bets.
The USD/CAD pair extended its sideways consolidative price moves through the early North American session and was last seen trading just above the 1.2700 mark.
A combination of diverging forces failed to assist the USD/CAD pair to capitalize on the post-BoC bounce from the 1.2600 neighbourhood, or a three-week low and led to a range-bound action on Friday. A modest uptick in crude oil underpinned the commodity-linked loonie and acted as a headwind for the major. Worries that the imposition of fresh COVID-19 could dent fuel demand, however, kept a lid on any meaningful gains for the black liquid.
On the other hand, the US dollar drew some support from a fresh leg up in the US Treasury bond yields, bolstered by the prospects for a faster policy tightening by the Fed. This, in turn, extended some support to the USD/CAD pair and helped limit the downside. Investors also seemed reluctant from placing aggressive bets and preferred to wait on the sidelines ahead of the US consumer inflation, which would influence the Fed's policy outlook.
The markets have been pricing in the possibility for an eventual Fed liftoff in May 2022 amid worries about the persistent rise in inflationary pressures. Hence, the latest US CPI report will be looked upon for fresh clues about the Fed's next policy move and strategy on interest rate hikes. This, in turn, will drive USD demand heading into the FOMC policy meeting on December 14-15 and provide a fresh directional impetus to the USD/CAD pair.
Technical levels to watch
- Spot gold has been ebbing lower ahead of the key US inflation report, with analysts suggesting markets are positioning for an upside surprise.
- XAU/USD hit fresh weekly lows in the low$1770s but is now back to flat on the day around $1775.
Spot gold (XAU/USD) prices have been ebbing lower in recent days the run-up to the all-important release of the November US Consumer Price Inflation report at 1330GMT. Spot prices dropped to fresh weekly lows in the low $1770s earlier in the session, though are now back to flat in the $1775 area. Still, that leaves prices now nearly $20 below earlier weekly highs, with the failure of spot prices to break above the 200-day moving average (which sits at around $1793) at the time seemingly encouraging technical selling.
Expectations are for the headlines rate of YoY inflation to rise to 6.8% in November, though pre-data price action has analysts suspecting that markets are positioning for an upside surprise. Short-end US yields have been on the front foot in recent days, with 2-year yields hitting a fresh post-pandemic high above 0.72% on Friday and real yields are also moving higher. This helped the dollar gain in the run-up to the data, and the stronger dollar/higher real yield combination has been weighing on gold.
Even if there isn't an upside surprise and inflation only rises marginally from October’s YoY rate of 6.2%, that should be high enough to keep the Fed highly concerned about the inflationary backdrop and on course to announce a quickening of its QE taper at its meeting next week. Bear in mind the Fed will also have been watching recent labour market signals, which have been mostly bullish/inflationary; last week’s official labour market report showed the unemployment rate dropping sharply to 4.2% in November, this week's weekly jobless claims data showed initial claims at their lowest since 1969 and JOLTs data for October showed jobs openings rising back above 11M to just below record highs. Many are, as a result, arguing that the US is at/very near full employment.
As far as gold is concerned, last month’s upside surprise was a bullish short-term catalyst as investors sought inflation protection until expectations for a more hawkish Fed (gold negative) took over. Traders are likely unsure how gold would react to another upside surprise this time around. If demand for inflation protection dominates, gold could be headed back to weekly highs and its 200DMA. If bets on a hawkish Fed shift dominate, gold could be headed under recent lows in the $1760s.
For gold, strategists at Société Générale are moderately bullish. They see the yellow metal at $1,900 in the base case outlook. Theirr upside economic scenario would be bearish for gold, with XAU/USD falling to $1,700. In the downside economic scenario, gold prices would jump to $2,100 by mid-2022.
Base case for 2Q22 (50% probability)
“Gold at $1,900. We are still slightly bullish on the near-term. Despite Powell’s renomination and his hawkish stance, our rates strategists do not expect interest rates hikes before 2Q22. This, combined with our economists’ above-consensus inflation forecast, points to negative real rates; a perfect mix of for gold. However, our view is mainly based on our expectation that ETF outflows will cease and we will begin to see some moderate inflows by year-end and into 2022. In 2H22, we expect inflation to retreat and interest rates to slowly increase on the back of QE tapering and potential Fed hikes. We expect rising real rates to become a strong headwind for gold only in 2H22.”
Upside scenario for 2Q22 (25% probability)
“Gold at $1,700. Our upside economic scenario would be bearish for gold as it assumes new COVID-19 strains are effectively combatted via high vaccination rates and drug treatments. This would reduce risk-off sentiment, which is detrimental for gold, but more importantly would lead to easing of restrictions and thus higher services consumption. The US employment rate or initial jobless claims continuing to drop toward pre-crisis levels could see the Fed bring forward interest rate hikes vs our base case. For this gold bearish scenario to materialise, inflation needs to be kept in check.”
Downside scenario for 2Q22 (25% probability)
“Gold at $2,100. Our downside economic scenario would be bullish for gold as central banks around the world would have to keep monetary policies highly accommodative for their economies to cope with renewed COVID-19 restrictions. We estimate that this lower-for-longer rates environment combined with high inflation would see gold prices jumping to $2,100 by mid-2022. Inflation is partly fuelled by supply-chain tightness and new restrictions would worsen the issue.”
- GBP/USD witnessed fresh selling on Friday and was pressured by a combination of factors.
- Diminishing BoE rate hike bets, softer UK macro data, Brexit woes weighed on the sterling.
- Rising US bond yields, hawkish Fed expectations underpinned the USD and exerted pressure.
- Investors look forward to the US consumer inflation figures for a fresh directional impetus.
The GBP/USD pair remained on the defensive heading into the North American session, albeit has managed to recover a few pips from the daily swing low. The pair was last seen hovering around the 1.3200 round-figure mark, down nearly 0.15% for the day.
Having recorded modest gains in the previous session, the GBP/USD pair met with a fresh supply on the last day of the week and was pressured by a combination of factors. Investors trimmed their bets for an imminent interest rate hike by the Bank of England in December after the UK announced fresh COVID-19 restrictions in the UK. This, along with persistent Brexit-related uncertainties and mostly disappointing UK macro data, acted as a headwind for the British pound.
The UK Office for National Statistics reported that the domestic growth slowed notably and rose only 0.1% in October, well below consensus estimates for a rise of 0.4% and 0.6% in the previous month. Adding to this, the total industrial output dropped 0.6% in October as against consensus estimates for a modest 0.1% increase. This, to a larger extent, overshadowed better-than-anticipated UK Trade balance data and did little to lend any support to the GBP/USD pair.
On the other hand, a fresh leg up in the US Treasury bond yields provided a modest lift to the US dollar, which remained well supported by expectations for a faster policy tightening by the Fed. This was seen as another factor that exerted some downward pressure on the GBP/USD pair. The downside, however, remains cushioned, at least for the time being, as investors preferred to wait for a fresh catalyst from the latest US consumer inflation figures.
Given that the markets have been pricing in the possibility for an eventual Fed liftoff in May 2022, the US CPI report will be looked upon for fresh clues about the Fed's strategy on interest rates. This will play a key role in influencing the USD price dynamics heading into the FOMC monetary policy meeting on December 14-15 and provide a fresh directional impetus to the GBP/USD pair.
Technical levels to watch
- EUR/USD has been ebbing lower since a failed attemtp to move back above 1.1300 as US inflation data is eyed.
- Analysts suggested pre-data USD strength suggests markets are positioning for an upside surprise.
- The latest ECB sources, as per MNI, were ignored by FX markets.
After failing an earlier attempt to get back above the 1.1300 level, EUR/USD has been ebbing lower in the run-up to US Consumer Price Inflation data at 1330GMT. The pair currently trades close to 1.1270, slightly above earlier session lows in the 1.1260s, and down about 0.2% on the session. The move is largely being driven by pre-data positioning in the US dollar, rather than any localised euro weakness. According to Chris Weston, head of research at Pepperstone, "judging by the way the dollar is trading ... I'd argue traders are positioning for a higher CPI print which cements a view that the Fed will increase the pace of tapering its QE programme.”
ECB sources per MNI that suggested the bank will bump up its Asset Purchase Programme from the current €20B per month in purchases to somewhere between €40B and €60B in purchases did not move the needle for the euro. Indeed, separate sources speaking to other newswires earlier in the week suggest something similar. Nonetheless, the question as to what the bank will do with its QE programme after the expiration of the PEPP in March remains the top theme for next week’s ECB meeting.
Market focus is now firmly on US inflation numbers and FX market volumes are unsurprisingly low as market participants keep their powder dry for now. In the run-up to the data, EUR/USD has been trading rangebound this week and has responded well to the technicals. To recap, the pair attempted to push back above a long-term downtrend that had been offering support until mid-November for the second time in as many weeks but again failed. Technically, that suggests the long-term momentum remains bearish. Traders will be keenly waiting to see if US inflation and next week’s Fed meeting adds further backing to the bearish narrative.
US CPI Overview
Friday's US economic docket highlights the release of the critical US consumer inflation figures for November, scheduled later during the early North American session at 13:30 GMT. The headline CPI is anticipated to edge lower 0.7% during the reported month from the 0.9% rise recorded in October. Conversely, the yearly rate is expected to show prices rising at their fastest pace since 1982 and accelerate to 6.8% in November from 6.2% previous.
Meanwhile, core inflation, which excludes food and energy prices, is projected to rise 4.9% from a year ago as against 4.6% in October.
As Joseph Trevisani, Senior Analyst at FXStreet, explains: “Recent results from producer prices, wages, employment and gasoline suggest that the surge in consumer prices is not abating. Higher material production costs and rising wages, which firms will quickly pass on to consumers, indicate that the upward pressure on retail prices has not slackened.”
How Could it Affect EUR/USD?
Ahead of the key release, the US dollar remained well supported by the prospects for an early policy tightening by the Fed amid rising inflationary pressures. A stronger print will reinforce expectations that the Fed would adopt a more aggressive policy response to contain stubbornly high inflation. This should result in higher US Treasury bond yields and a stronger USD.
Conversely, a softer print – though seems unlikely – might do little to prompt any aggressive USD selling heading into the FOMC monetary policy meeting on December 14-15. This, in turn, suggests that the path of least resistance for the EUR/USD pair is to the downside. Nevertheless, the data is set to infuse a fresh bout of volatility in the markets and produce some meaningful trading opportunities.
From current levels, the weekly swing low, around the 1.1230-25 region, might protect the immediate downside for the EUR/USD pair ahead of the YTD low – levels just below the 1.1200 mark. Some follow-through selling will be seen as a fresh trigger for bearish traders and turn the pair vulnerable to accelerate the slide to the 1.1145 intermediate support en-route the 1.1100 round figure.
On the flip side, momentum back above the 1.1300 mark might continue to confront some resistance near mid-1.1300s. This is followed by the recent swing high, around the 1.1380-85 area touched on November 30, which if cleared decisively could prompt some short-covering move. The EUR/USD pair might then surpass the 1.1400 mark and aim to test the next relevant hurdle near the 1.1440 region.
Key Notes
• US Consumer Price Index November Preview: Inflation is the new cause celebre
• US CPI Preview: Forecasts from nine major banks, more acceleration?
• EUR/USD Price Analysis: Struggle with 21-DMA continues ahead of US inflation
About the US CPI
The Consumer Price Index released by the US Bureau of Labor Statistics is a measure of price movements by the comparison between the retail prices of a representative shopping basket of goods and services. The purchasing power of USD is dragged down by inflation. The CPI is a key indicator to measure inflation and changes in purchasing trends. Generally speaking, a high reading is seen as positive (or bullish) for the USD, while a low reading is seen as negative (or Bearish).
According to Market News Internation (MNI) citing sources, the ECB is seen buying between €40 ad €60B in bonds per month after March, despite rising fears about inflation.
For reference, the ECB's Pandemic Emergency Purchase Programme (PEPP) is scheduled to finish at the end of March 2022 and ECB members have been keen to avoid a sudden, sharp drop-off in the volume of monthly bond purchases. Sources speaking with financial press earlier in the week suggested that an agreement was forming on boosting the bank's pre-pandemic Asset Purchase Programme (APP) in a temporary/time-limited manner from March.
ECB members are keen to avoid disorderly bond market developments (such as a significant widening in Eurozone bond yields spread), despite growing fears on the council about inflation perhaps running above target for longer than previously expected.
Market Reaction
EUR/USD has not seen much of a reaction to the latest sources and continues to trade subdued to the south of 1.1300 as markets await US inflation data at 1330GMT.
- USD/JPY gained some positive traction on Friday amid a modest USD strength.
- Hawkish Fed expectations, rising US bond yields acted as a tailwind for the USD.
- Geopolitical tensions could benefit the safe-haven JPY and cap any further gains.
- Traders might also wait for the US CPI report before placing fresh directional bets.
The USD/JPY pair edged higher through the mid-European session and climbed to a fresh daily high, around the 113.75-80 region in the last hour.
Following a brief consolidation during the first half of the trading action on Friday, the USD/JPY pair regained positive traction and was supported by a combination of factors. The prospects for a faster policy tightening by the Fed continued acting as a tailwind for the US dollar. Apart from this, a fresh leg up in the US Treasury bond yields further underpinned the greenback and provided a modest lift to the USD/JPY pair.
However, the cautious market mood – amid escalating geopolitical tensions – could extend some support to the safe-haven Japanese yen and cap gains for the USD/JPY pair. There are fears that Russia could invade Ukraine. The United States and its allies have warned Russia of tough sanctions if it again attacks its neighbour. This, along with anxiety ahead of the US consumer inflation figures, weighed on investors' sentiment.
The markets seem convinced that the Fed would adopt a more aggressive policy response to contain stubbornly high inflation and have been pricing in the possibility for an eventual liftoff in May 2022. Hence, the US CPI report will provide fresh cues about the Fed's near-term policy outlook and its strategy on interest rates. This will influence the USD price dynamics and provide a fresh directional impetus to the USD/JPY pair.
Even from a technical perspective, the recent two-way price moves witnessed over the past four trading sessions points to indecision among traders. This further makes it prudent to wait for a sustained strength beyond the 114.00 mark before placing fresh bullish bets around the USD/JPY pair and positioning for any meaningful upside.
Technical levels to watch
In the base-case scenario, Société Générale’s US-based rates strategists see the US 10-year Treasury yield at 1.95% by mid-2022. In the upside scenario, they see modest upside risk to their forecast of 2.20% by mid-2022. In the downside scenario, the 10-year Treasury yield would be at 1.30%.
Base case for 2Q22 (50% probability)
“10yT at 1.95%. We expect US GDP to grow by 3.4% in 2022 and 2.8% in 2023 after a strong 5.5% print in 2021. With the unemployment rate already down to 4.2%, we are close to full employment. Core CPI should moderate in 2H22 for an average of 3.3% for next year. In this context, we expect modestly higher yields ahead, with the 10yT yield at 1.95% by mid-2022.”
Upside scenario for 2Q22 (25% probability)
“10yT at 2.20%. If global economies are able to cope with new COVID-19 variants and rebound at a stronger pace, we see modest upside risk to our forecast. Inflation is a key metric. If it does moderate in 2Q and 3Q, the Fed might not be in a rush to raise rates. In the context of easier financial conditions and modest tailwinds from additional fiscal stimulus, a pick-up in US and global growth could support higher global bond yields.”
Downside scenario for 2Q22 (25% probability)
“10yT at 1.30%. A slower recovery owing to the risks associated with the pandemic and persistent inflation contributing to a slowdown in growth are likely catalysts for lower yields and flatter curves. The slowdown in China and higher probability of a hard landing are additional risks that might push investors toward the safety of Treasuries. In this context, yields could remain relatively unchanged over the coming months.”
The Mexican peso is among the top EM currencies this week with USD/MXN trading below 21.00. However, economists at Société Générale expect the pair to edge higher towards 22.70 as the 20.55 mark should cushion the pullback.
Pullback likely to remain contained
“USD/MXN is expected to inch higher towards September 2020 levels of 22.70.”
“Daily Ichimoku cloud at 20.55 should cushion pullback.”
- EUR/GBP regained some positive traction on Friday and recovered a part of the overnight losses.
- Reduced BoE rate hike bets undermined the British pound and provided a modest lift to the cross.
- A stronger USD weighed on the shared currency and held back bulls from placing aggressive bets.
The EUR/GBP cross traded with a mild positive bias through the first half of the European session, albeit seemed struggling to capitalize on the move beyond mid-0.8500s.
The cross attracted some buying on Friday and reversed a part of the previous day's sharp corrective slide from the vicinity of the 0.8600 mark, or over a two-month high. The British pound's relative underperformance comes amid diminishing odds for an imminent interest rate hike by the Bank of England (BoE).
Against the backdrop of persistent Brexit-related uncertainties, the imposition of fresh COVID-19 restrictions in the UK could force the BoE to delay its decision to hike interest rates. This, along with mostly disappointing UK macro releases undermined the sterling and provided a modest lift to the EUR/GBP cross.
The UK Office for National Statistics reported that the economic growth decelerated to 0.1% in October from a 0.6% rise reported in the previous month, missing expectations for a reading of 0.4%. Adding to this, the total industrial output dropped 0.6% in October as against a 0.1% increase anticipated and undermined the sterling.
Separately, the headline German CPI matched original estimates and fell 0.2% in November. The yearly rate stood at 5.2%, though did little to impress the euro bulls. The prevalent US dollar bullish sentiment exerted some pressure on the shared currency and kept a lid on any meaningful gains for the EUR/GBP cross.
This comes on the back of this week's rejection near a descending trend-line resistance extending from April swing high and warrants some caution for aggressive bullish traders. Hence, it will be prudent to wait for a strong follow-through buying before positioning for the resumption of a two-week-old upward trajectory.
Technical levels to watch
For copper, Société Générale strategists’ base case suggests a bearish outlook, pushing prices down to $7,500/t in 2Q22. In the upside scenario, the risk-on market sentiment would support copper and see prices wavering around $10,000/ in 2Q22. Finally, the downside economic scenario would see the price $1,000/t lower than in the base case.
Base case for 2Q22 (50% probability)
“Copper at $7,500/t. The copper market is reconnecting with its fundamentals and we expect it to be bearish in the short-term as Chinese copper demand should weaken due to the sharp slowdown in real estate construction and the continued COVID-19 zero-tolerance policies. The crux of our bearish short-term stance remains the prospect of 3.6mt of net mine supply flooding the market by 2023 and pushing prices down to $7,500/t in 2Q22. In the longer-term, both supply and demand outlook for copper are extremely bullish.”
Upside scenario for 2Q22 (25% probability)
“Copper at $10,000/t. The upside scenario would not be a game-changer for copper demand as the range of outcomes for the GDP path is narrower than in first wave, as economies have learned to live with covid. More importantly, households are likely to spend excess savings accumulated during the pandemic on services rather than goods. However, in this scenario, the risk-on market sentiment would support copper and see prices wavering around $10,000/ in 2Q22, slightly higher than current prices.”
Downside scenario for 2Q22 (25% probability)
“Copper at $6,500/t. The downside economic scenario based on new restrictions due to the Omicron variant would not be too detrimental to copper demand but would cause risk-off sentiment and see the price $1,000/t lower than in our base case. If restrictions further dampen global supply chains, which are already in dire shape, this would dent manufacturing activity and copper demand. On the other hand, it could also have some bullish impact in the event of mine disruptions due to COVID-19.”
International Monetary Fund's (IMF's) First Deputy Managing Director Geoffrey Okamoto offered his take on the likely impact of the new Omicron covid variant on the global economic growth forecasts.
Key quotes
"We project the global economic growth at 5.9 percent in 2021 and to decline to 4.9 percent next year. I think it is important to emphasize the possibility of a decline due to the Omicron variant,"
“A decline in the 2021 projection was in line with the decrease in the gross domestic product (GDP) in the third quarter of 2021 due to the spread of positive cases of the Delta variant around the world.”
“This crisis will have a prolonged effect on the economy and vulnerable groups since the Omicron variant had created a sense of uncertainty about the COVID-19 situation.”
Related reads
- Forex Today: Caution prevails ahead of all-important US inflation
- Caution on Omicron transmission claims
- AUD/USD oscillated in a narrow trading band through the early part of the European session.
- Hawkish Fed expectations, rising US bond yields underpinned the USD and capped the upside.
- Investors, however, seemed reluctant to place aggressive bets ahead of the key US CPI report.
The AUD/USD pair seesawed between tepid gains/minor losses through the early part of the European session and was last seen trading around mid-0.7100s.
Following the overnight pullback from a nearly two-week high, the AUD/USD pair witnessed a range-bound price action on Friday as investors await the US consumer inflation figures for a fresh impetus. The US CPI report is due for release later during the early North American session and will be looked upon for fresh clues about the Fed's near-term policy outlook.
The markets have been pricing in the prospects for an early policy tightening by the Fed amid worries about the persistent rise in inflationary pressures. A stronger print will reaffirm the hawkish Fed expectations, which, in turn, would result in a stronger US dollar and suggests that the AUD/USD pair's recent recovery from the YTD low has run out of steam.
In the meantime, the USD drew some support from a fresh leg up in the US Treasury bond yields. Apart from this, a generally weaker tone around the equity markets further benefitted the greenback's safe-haven status. Heading into the key data risk, the combination of factors might continue to cap any meaningful upside for the perceived riskier aussie.
Technical levels to watch
EUR/CZK failed to overcome the upper limit of a multi month descending channel near 25.75 resulting in retraction of recent gains – it has recently drifted towards 25.35. A break below here would open up the lower band of the channel at 25.16, analysts at Société Générale report.
Pullback to linger while below 25.52
“An initial bounce is under way, however, holding below 25.52, the 38.2% retracement of recent down move, the pullback is expected to persist.”
“In case last week low near 25.35 breaks, there would be a risk of deeper down move towards the lower band of the channel at 25.16.”
Following are the key takeaways of the Bank of England’s latest quarterly survey of public attitudes to inflation, conducted by Kantar on the central bank’s behalf.
UK public inflation expectations for the year ahead 3.2% in November vs 2.7% in August.
Longer-term UK public inflation expectations 3.1% in November vs 3.0% in August.
Sixty percent of respondents expected interest rates to rise over the next 12 months, up from 43% in August.
Meanwhile, next week's rate hike by the BOE is now off the table, according to the SONIA futures. The December 2022 pricing is now below the BOE projection from their last meeting at 0.87.
The new Omicron covid variant-led restrictions in the UK combined with the dovish comments from BOE hawk Michael Saunders have priced out a December rate hike.
At the press time, GBP/USD is struggling around 1.3200, with eyes on the yearly lows ahead of the US inflation data.
Today is a big day for the US rates market with the CPI data for November released. According to economists at MUFG Bank, if the US data go on surprising to the upside, the greenback is set to enjoy further gains.
CPI in focus ahead of FOMC next week
“The consensus print of a rise in the annual inflation rate to 6.8% will likely reinforce the current market pricing of potentially three rate hikes in 2022.”
“If today’s report sees a further notable shift in the underlying, less volatile components of inflation it will raise further concerns at the Fed that the move back lower will take longer.”
“Another bad inflation print would likely see investors reconsider the assumed peak for the fed funds rate and could prompt a further flattening of the yield curve with increased concerns over the need for more aggressive tightening cutting short the length of this economic expansion. However, it is hard to envisage a market panic today.”
“A higher than expected inflation print could well see some further bear flattening of the UST bond curve which would likely reinforce USD strength over the short-term.”
See – US CPI Preview: Forecasts from nine major banks, more acceleration?
For Brent, Société Générale strategists’ base case sees the price averaging $80/bbl by 2Q22. In the upside scenario, the gradual increase in demand should reach 2mbd above our base case by mid-2022, with prices jumping to $90/bbl. In the downside scenario, they expect 1.5mbd to be removed from demand, with prices dropping toward $70/bbl.
Base case for 2Q22 (50% probability)
“Oil at $80/bbl. Only a few restrictions are implemented and global oil demand returns to close to pre-COVID levels by mid-2022. The demand outlook seems bullish and the US SPR release is only a $1/bbl drop in the ocean. However, we expect OPEC+ to manage supply efficiently in 1H22 despite Iran supply not returning before mid-2022. This would keep the market in a slight 1mbd surplus in 1H22 and the OECD industry stock at 3 days of global consumption coverage below its 5-year average. Once uncertainties brought by Omicron dissipate, the relative market tightness and low inventories should keep prices at around $80/bbl in 1H22.”
Upside scenario for 2Q22 (25% probability)
“Oil at $90/bbl. The new restrictions to contain Omicron are swiftly lifted and the longer-standing restrictions are also lifted albeit gradually from the beginning of next year. We expect this scenario to be more beneficial for oil consumption than GDP growth as mobility increases and consumption becomes more focused on services. The gradual increase in demand should reach 2mbd above our base case by mid-2022, with prices jumping $15/bbl in the next six months.”
Downside scenario for 2Q22 (25% probability)
“Oil at $70/bbl. Current restrictions are significantly strengthened to avoid new variants from spreading. The impact on oil consumption is larger than the impact on GDP. However, we expect a much lower impact than from the first batch of restrictions, economies having learned to adapt to such measures. We expect 1.5mbd to be removed from demand; this is 10x lower than the demand destruction at the peak of the first batch of restrictions and would point to prices dropping toward $70/bbl.”
- EUR/USD closes Thursday below 21-DMA, caution for bulls.
- Cautious mood, dovish ECB and firmer Treasury yields weigh on the spot.
- Downside appears more compelling, with support at 1.1242 likely at risk.
EUR/USD is seeing some fresh selling pressure while trading below 1.1300 in the European session on Friday, as the bears extend control amid rebounding Treasury yields and risk-aversion.
The Fed-ECB monetary policy divergence continues to render negative for the euro, especially after the ECB is reportedly planning to boost its regular Asset Purchase Program (APP) at its next week’s policy meeting.
Meanwhile, the latest uptick in the yields is driving the greenback higher, exerting additional downside pressure on the main currency pair ahead of the US inflation release.
Technically, the spot is trading on the defensive below the 21-Daily Moving Average (DMA) at 1.1302 following Wednesday’s close below the latter.
The 14-day Relative Strength Index (RSI) continues to trade below the 50.00 level, keeping the EUR sellers cheerful.
Any pick-up in the downside momentum could put the rising trendline support of 1.1242 at risk.
Daily closing below the latter will expose the 1.1200 level. The next stop for EUR bears is seen at the yearly lows of 1.1185.
EUR/USD: Daily chart
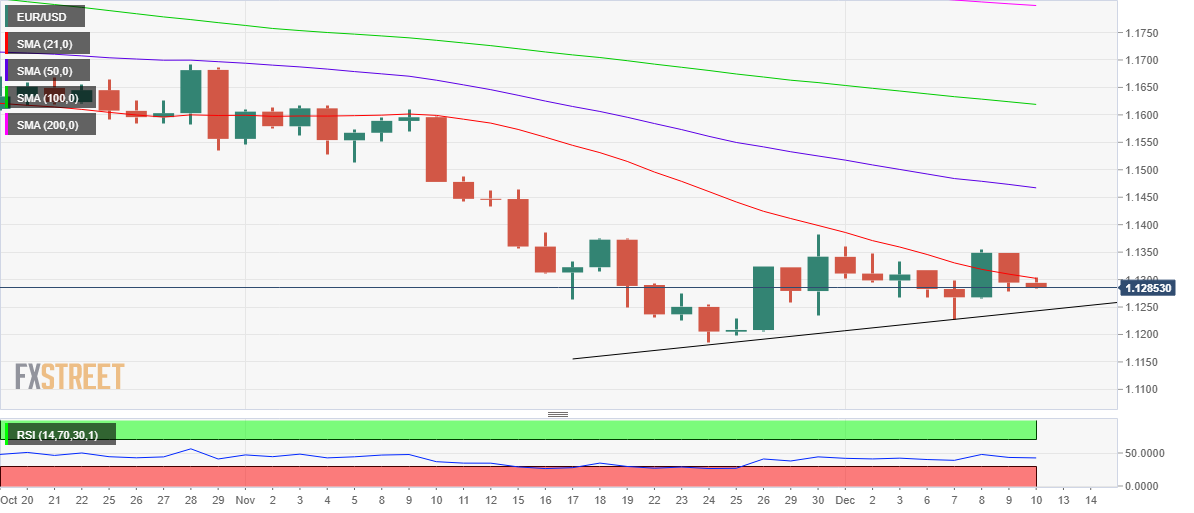
On the flip side, acceptance above the 21-DMA will call for a test of the 1.1350 psychological level.
Further up, buyers could look out for a rally towards the 1.1400 round number.
EUR/USD: Additional levels to consider
US 10-Year Treasury yields have staged a rebound after hitting 1.33% earlier this month. Now, it is re-attempting the 1.50% level. Economists at Société Générale expect the US Treasury yields to extend its advance on a break 1.60%.
Holding above 1.41% is crucial to extend the rebound
“Ongoing bounce could continue towards recent bearish gap near 1.60%. So long as it is not overcome, an extended uptrend may not materialize.”
“Defending last month low of 1.41% will be crucial for persistence in the rebound.”
The EUR/USD pair stalled at 1.1350 first and now marginally below 1.1300 again. In the view of economists at ING, we would need to see a clear hawkish twist by the European Central bank (ECB) to turn the tide for the slightly overvalued and not clearly oversold euro.
Hard to turn the tide
“EUR/USD may prove asymmetrically more sensitive to any hawkish surprise, whether that be on the timing of unwinding asset purchases or on staff projections), compared to signs of extra cautiousness. If, instead, we see no major surprises by the ECB, and given the Fed meeting risks prompting another spike in US short-term yields, we think EUR/USD may be set for another bad week.”
“EUR/USD is slightly overvalued according to our short-term fair value model, suggesting there is still room for the pair to catch up with the unfavourable widening of USD-EUR short-term rates.”
“We think that only a hawkish turn can significantly turn the tide for the euro at the moment. Otherwise, many factors are pointing to EUR/USD weakness as we end the year. A move beneath even the 1.1200 lows is entirely possible.
“One potential counter-argument is the seasonal tendency of the dollar to underperform in December, although that may require much calmer markets to materialise.”
At the moment, equity volatility is very high amid Omicron newsflow, a perception that the Fed has become more hawkish, tight liquidity, and end-of-year book cleaning and hedging. Economists at Société Générale forecast the VIX at 20 (-1.9%) in their base case scenario. In the upside scenario, the VIX would stabilise at 15 as volatility would be sold to chase the elevated implied-to-realised volatility premium while the VIX would rise to 35 in the downside scenario.
Base case for 2Q22 (50% probability)
“VIX at 20. We see the current volatility environment as transitory. We expect the disconnection between short-term realised volatility and the VIX to widen until the VIX starts normalising toward levels more in line with the true macro and micro economic landscape. The high level of uncertainty surrounding the rates complex could continue to act as an equity volatility suppressor through the channel of low stock correlation. The impact of rising inflation should not be too overstated as equity markets tend to be resilient in inflationary environments. We expect the VIX to move back toward 20.”
Upside scenario for 2Q22 (25% probability)
“VIX at 15. Equity volatility would normalise at a faster pace. This move would be driven by increasingly bullish sentiment, a return to fashion of short equity volatility strategies to harvest the hefty volatility premium (implied to realised spread), improved liquidity conditions and a low correlation between stocks in an environment of rising yields.”
Downside scenario for 2Q22 (25% probability)
“VIX at 35. With new lockdowns restraining economies worldwide, we see the VIX moving toward 35. A worsening credit environment would be the main transmission channel for risk repricing while rising hedging demand would impact skew and convexity. The expected drying up of liquidity in derivatives would act as an additional catalyst, in particular in European markets. In a second step, monetary and fiscal policy would likely come to the rescue and keep volatility at high but not crazy levels.”
Economists at Société Générale outline the impact of the base-case economic outlook (conviction level of 50%), the upside scenario (25%) and the downside scenario (25%) for the GBP/USD pair. In the base case scenario, the GBP would reach 1.30 against the USD. The upside scenario sees the GBP at 1.35 while in the downside scenario GBP/USD could fall to around 1.25.
Base case for 2Q22 (50% probability)
“GBP/USD at 1.30. In the normal course of events, EUR/GBP correlates positively with EUR/USD, with sterling doing better than the euro when the latter is falling against the dollar, and viceversa. The sterling rates market currently prices rates at 0.7% by mid-year, marginally below our 0.75% forecast, and on that basis, we don’t see much movement in EUR/GBP. Our 1.30 GBP/USD forecast reflects our 1.09 forecast for EUR/USD.”
Upside scenario for 2Q22 (25% probability)
“GBP/USD at 1.35. Although the natural bias is for EUR/GBP to rise when EUR/USD does, we suspect this wouldn’t be the case in 1H22. The better the prospects for escaping the clutches of COVID-19, the more aggressive the MPC can be, taking GBP/USD higher.”
Downside scenario for 2Q22 (25% probability)
GBP/USD at 1.25. A downside scenario decreases the chance of UK rate hikes and increases the chance that future rate hikes are priced out of the curve. Sterling loses any argument for strength relative to the euro other than the ‘normal’ beta with EUR/USD. GBP/USD could fall to around 1.25 as EUR/USD falls to 1.06, leaving EUR/GBP at 0.85.”
See: EUR/USD likely to plummet below 1.10 by mid-2022 – SocGen
All eyes are on US inflation for November. The US Bureau of Labor Statistics will release the Consumer Price Index (CPI) data on Friday, December 10 at 13:30 GMT and as we get closer to the release time, here are the forecasts by the economists and researchers of nine major banks regarding the upcoming US inflation data. The Consumer Price Index (CPI) is forecast to rise to 6.8% (YoY) from 6.2% in October. Meanwhile, Core CPI is expected to rise to 4.9% from 4.6%.
Nordea
“We expect core inflation to print at 5.1% with risk to the upside, while headline inflation prints at 6.6%, the highest since 1982.”
ING
“Rising gasoline, housing and second-hand car prices will be the big movers, but growing evidence of rising corporate pricing power is also likely to be evident in the form of broad-based 0.3%+ MoM readings for most components. This is likely to leave annual rates close to 7% for headline inflation with the potential for core inflation to beak above 5%. If this is the case and the scientific evidence on Omicron suggests it is a manageable threat, then the expectations of an acceleration in the Federal Reserve’s QE tapering at the December FOMC meeting will grow.”
RBC Economics
“US headline CPI inflation is primed to rise to 6.6% from a year ago in November. We expect that higher fuel prices and stronger used autos prices will put upward pressures on the monthly reading.”
NBF
“We expect the core index to have gained 0.5% MoM following a 0.6% advance the prior month. As a result, the annual core inflation rate could jump to a 30-year high of 4.9%. Headline prices could have increased at an even faster pace (+0.8% MoM, +6.9% YoY), helped by another sharp increase in seasonally-adjusted gasoline prices.”
Deutsche Bank
“We are anticipating that headline CPI will rise to +6.9%, which would be the fastest annual pace since 1982. And they see core inflation heading up to +5.1%, which would be the highest since 1990.”
Citibank
“US November CPI MoM – Citi: 0.9%, median: 0.7%, prior: 0.9%; CPI YoY – Citi: 6.9%, median: 6.7%, prior: 6.2%; CPI ex Food, Energy MoM – Citi: 0.7%, median: 0.5%, prior: 0.6%; CPI ex Food, Energy YoY – Citi: 5.1%, median: 4.9%, prior: 4.6%. We again expect a strong increase in prices in November with services prices likely to pick up broadly over the course of the next ~6 months that would reflect elevated inflation expectations and a persistently tight labor market putting upward pressure on wages.”
CIBC
“Overall, look for ex. food and energy inflation to rise to 4.8% YoY while adding support from food and energy back into the mix would see total inflation rise to 6.7% YoY. While we are slightly below the consensus forecast for monthly price increases, the pace of inflation will remain lofty, and is still in line with Powell’s comments regarding the price stability mandate having been met, suggesting little market reaction.”
SocGen
“We forecast a 0.7% MoM increase and a core increase of 0.4% for the November CPI.
ANZ
“We expect a solid rise in both the US core (0.6% MoM) and headline (0.8% MoM) CPI in November owing to strong demand and ongoing supply bottlenecks. Higher energy/gasoline prices will continue to make a significant contribution to headline inflation, while ongoing sharp increases in rent and owners’ equivalent rent will ensure that core inflation remains elevated. Powell says with inflation high and growth strong it is appropriate to hasten the pace of its tapering. This will give the Fed the flexibility to hike rates earlier than they might have anticipated should inflation remain stubbornly high into 2022.”
See – Gold Price Forecast: XAU/USD to surge higher above $1,792 on downbeat US CPI data
On Friday, AUD/USD is neutral in the mid-0.71s. Economists at Westpac believe this area is set to cap the aussie. They expect the pair to move back lower from here as now the Federal Reserve is set to accelerate taper in its next week’s meeting.
Fed’s taper to be accelerated, making room for rate hikes
“Sticking to the theme that the 0.7150/90 region should cap the aussie. The recent sharp bounce has worked off a very oversold technical position and that should open the way for AUD/USD to drift lower into next week’s raft of central bank meetings.”
“The default of Evergrande, though not new news, adds to the list of negatives including the very rapid spread of the Omicron variant; ongoing tension on the Russia/Ukraine border; weakness in Turkey/EM currencies; the likely more aggressive taper announcement and dot plots set to signal rate hikes next year from the Fed next week and the still strong USD all suggest that the aussie should weaken from the 0.7150/90 region.”
Economists at Société Générale outline the impact of the base-case economic outlook (conviction level of 50%), the upside scenario (25%) and the downside scenario (25%) for the USD/JPY pair. The base case would see USD/JPY at 116, the upside scenario sees the USD/JPY at 118 while the pair would reach 110 in the downside scenario.
Base case for 2Q22 (50% probability)
“USD/JPY at 116. We still expect US yields to rise along the length of the curve in 1H22, and we don’t expect much relief from pricey oil. In real terms, the yen is back at mid-1980s levels, which seems crazy, but the commodity price surge has had a big impact on the terms of trade, the growth outlook is not that bright, and being the world’s biggest international investor doesn’t help when the major deficit nations face an excess of global savings. USD/JPY seems likely, therefore, to go on edging higher for now.”
Upside scenario for 2Q22 (25% probability)
“USD/JPY at 118. The biggest potential upside risk for USD/JPY is that with COVID-19 contained thanks to continued progress on vaccination and vaccine/drug availability, global re-opening delivers an earlier-than-expected push higher in oil prices and US bond yields. Even without that, higher US yields, and increased confidence in Fed tightening, can trigger further upside in USD/JPY.”
Downside scenario 2Q22: (25% probability)
“USD/JPY at 110. A downside scenario would trigger a Fed policy rethink and, potentially, bigger downward revisions for global growth and hence resource prices. Both would lower USD/JPY, dragging it back into the 108-112 range where it was between March and September, consistent with a 20bp fall in 5y rates and/or Brent crude settling back into a $65-75/bbl range.”
Strategists at Société Générale see the EUR/USD at 1.09 in their base case outlook. In this scenario, the Fed rate-hiking cycle has started by mid-2022. In the upside scenario, the EUR/USD reaches 1.15, and in the downside, it reaches 1.06 as the Fed takes hikes off the table.
Base case for 2Q22 (50% probability)
“EUR/USD at 1.09. The Fed rate-hiking cycle has started by mid-year. While there are 110bp of hikes priced in for 2022/2023 (compared to 25bp from the ECB), we expect that by the time the Fed acts, there will be more priced into the US curve than is the case now and that EUR/USD will have fallen below 1.10.”
Upside scenario for 2Q22 (25% probability)
“EUR/USD at 1.15. The upside risk scenario for EUR/USD weighs two factors against each other. Firstly, it can bring forward forecasts of Fed tightening, as the economy does even better than expected. Secondly, it can have more influence on expectations of ECB tightening. It’s not just that a quicker escape from COVID-19 would have less impact on what is priced into the US curve than it would on the eurozone curve, it’s also that an ECB rate rethink could have a bigger psychological impact.”
Downside scenario for 2Q22 (25% probability)
“EUR/USD at 1.06. The downside scenario needs to be apocalyptic to take Fed rate hikes off the table in 2022. In the US, the danger is that from the current starting point of very strong nominal GDP growth, ‘bad Omicron’ increases inflationary pressures at the same time as growth slows. By contrast, the European recovery is lagging the US one and any talk of ECB tightening could vanish into fresh air. Throw in some risk aversion and we likely get a lower EUR/USD rate than our base case, though from here, the downside is limited.”
- GBP/USD struggled to capitalize on the overnight modest recovery gains from a one-year low.
- Reduced BoE rate hike bets, mostly disappointing UK macro data capped gains for the GBP.
- An uptick in the US bond yields, hawkish Fed expectations acted as a tailwind for the buck.
- Investors, however, preferred to wait on the sidelines ahead of the US consumer inflation.
The GBP/USD pair held on to its modest intraday gains near the 1.3220-25 region and had a rather muted reaction to the UK macro data dump.
The pair edged higher during the early part of the trading action on Friday and was looking to build on this week's recovery move from a one-year low, around the 1.3160 region touched on Wednesday. A subdued US dollar price action was seen as a key factor that extended some support to the GBP/USD pair, though a combination of factors kept a lid on any meaningful gains.
Expectations that the imposition of fresh COVID-19 restrictions in England could force the Bank of England to delay its decision to hike interest rates at its December policy meeting. This, along with persistent Brexit-related uncertainties, acted as a headwind for the British pound and held back traders from placing aggressive bullish bets around the GBP/USD pair.
In the latest Brexit development, French President Emmanuel Macron accused the current UK government of failing to keep its word on Brexit and fishing licences. Adding to this, Annick Girardin, France's sea minister warned on Thursday that it would call on the EU to go to litigation if the 53 licences awaiting UK approval are not granted by Friday evening.
On the economic data front, the UK monthly GDP print fell short of market expectations and showed a modest 0.1% growth in October. This marked a notable deceleration from the 0.6% rise reported in the previous month and was accompanied by the disappointing release of Industrial/Manufacturing Production data, which, in turn, did little to impress the GBP bulls.
On the other hand, a softer risk tone extended some support to the safe-haven US dollar amid an uptick in the US Treasury bond yields. This, along with hawkish Fed expectations, further underpinned the greenback and capped the upside for the GBP/USD pair. Investors also preferred to wait on the sidelines ahead of the US consumer inflation figures.
The markets have been pricing in the possibility for an early policy tightening by Fed amid worries about rising inflationary pressure. Hence, the market focus will remain glued to the US CPI report, which will influence the Fed's policy outlook. This will influence the near-term USD price dynamics and provide a fresh impetus to the GBP/USD pair.
Technical levels to watch
Gold is back in the red, looking to test the critical $1,760 support area, with all eyes on the US inflation numbers. Will US CPI drive gold price above the critical $1,792 resistance? A downbeat report could lift XAU/USD beyond this barrier, FXStreet’s Dhwani Mehta report.
Immediate support is seen at $1,773
“A downbeat US CPI report could weigh on the US dollar and the Fed’s hawkish bets, lifting XAU/USD finally above the powerful resistance – the confluence of the 100- and 200-Daily Moving Averages (DMA) at $1,792 on a sustained basis.”
“Only a daily closing above the key $1,792 confluence will open doors for further recovery, with the next immediate hurdle seen at 50-DMA, now at $1,796. The bulls will then target the $1,800 figure.”
“On the flip side, immediate support is seen at the previous day’s low of $1,773. The November 3 low at $1,766 could then be on buyers’ radars.
Gold bulls remain hopeful while above the horizontal trendline support pegged at $1,760.”
See – Gold Price Forecast: XAU/USD points to downside, seen around $1,685 in 2022 – Citibank
Britain’s industrial sector recovery lacked momentum in October, the latest UK industrial and manufacturing production data published by Office for National Statistics (ONS) showed on Friday.
Manufacturing output arrived at 0% MoM in October versus 0% expectations and -0.1% booked in September while total industrial output came in at -0.6% vs. 0.1% expected and -0.4% last.
On an annualized basis, the UK manufacturing production figures came in at 1.3% in October, missing expectations of 1.7%. Total industrial output rose by 1.4% in the tenth month of the year against a 2.2% reading expected and the previous 2.9% print.
Separately, the UK goods trade balance numbers were published, which arrived at GBP-13.934 billion in October versus GBP-14.059 billion expectations and GBP-14.736 billion last. Total trade balance (non-EU) came in at GBP-8.618 billion in October versus GBP-9.103 billion previous.
Related reads
- UK GDP expands 0.1% MoM in Oct vs. 0.4% expected
-
GBP/USD holds comfortably above 1.3200 mark, moves little post-UK macro data
- UK GDP arrived at 0.1% MoM in Oct vs. 0.4% expected.
- GBP/USD is little changed around 1.3215 on downbeat UK GDP.
The UK GDP monthly release showed that the economy expanded less than expected in October, arriving at 0.1% vs. 0.4% expectations and 0.6% previous.
Meanwhile, the Index of services (October) arrived at 1.1% 3M/3M vs. 1.6% prior.
The Cable keeps its range around 1.3215 despite the below forecasts UK growth numbers. The spot is modestly flat on the day.
About UK GDP
The Gross Domestic Product released by the National Statistics is a measure of the total value of all goods and services produced by the UK. The GDP is considered as a broad measure of the UK economic activity. Generally speaking, a rising trend has a positive effect on the GBP, while a falling trend is seen as negative (or bearish).
- A combination of factors failed to assist NZD/USD to capitalize on its early modest uptick.
- The cautious market mood capped the perceived riskier kiwi amid a subdued USD demand.
- Hawkish Fed expectations acted as a tailwind for the USD ahead of the key US CPI report.
The NZD/USD pair surrendered its modest intraday gains and dropped to a fresh daily low, around the 0.6785 region in the last hour.
The pair gained some positive traction during the Asian session on Friday, albeit struggled to capitalize on the move and drifted into the negative territory for the second successive day. A softer risk tone – as depicted by a negative mood in the equity markets – acted as a headwind for the perceived riskier kiwi.
Apart from this, a modest uptick in the US Treasury bond yields underpinned the safe-haven US dollar against the backdrop of hawkish Fed expectations. This was seen as another factor that prompted some intraday selling around the NZD/USD pair, though the downside is likely to remain cushioned ahead of the US consumer inflation.
The markets seem convinced that the Fed would adopt a more aggressive policy response to contain stubbornly high inflation. In fact, the money markets indicate the possibility of liftoff in May 2022. Hence, the US CPI report would influence the Fed's decision to taper its stimulus at a faster pace and set the stage for a rate hike.
Heading into the key data risk, investors might prefer to wait on the sidelines and refrain from placing aggressive directional bets. This, in turn, should help limit any deeper losses for the NZD/USD pair, at least for the time being, and warrants some caution before positioning for any further depreciating move.
Technical levels to watch
The Bank of Japan (BOJ) is likely to scale back pandemic-relief corporate funding programmes when they expire in March, Reuters reports, citing four sources familiar with its thinking, adding that the decision is expected as early as next week's meeting.
Additional headlines
“BOJ leaning toward ending loan programme targeting smaller firms when they expire in March 2022, but extend some portion to aid cash-strapped sectors.”
“BOJ leaning toward scaling back the corporate bond, commercial paper purchases that were ramped up as part of the pandemic-relief programme.”
Market reaction
USD/JPY is little affected by these headlines, as it trades at 113.54, up 0.06% on the day, as of writing.
Here is what you need to know on Friday, December 10:
Risk-aversion extends into the European session this Friday, as investors follow the cautious mood from Asia and the US overnight. Uncertainty over the new Omicron variant combined with concerns over the implications of the Fed’s faster tapering keeps the market unnerved.
The Asian equities are in the red while the S&P 500 futures are trading almost unchanged on the day. The US dollar eases across the board heading into the crucial US inflation release, which is expected to prompt the Fed to accelerate its pace of tapering next week. The US Treasury yields, however, rebound, with the 10-years’ re-attempting the 1.50% level.
Amidst other news, China’s indebted property sector concerns continue to escalate, as the real estate giant Evergrande Group was officially labeled as a defaulter. Meanwhile, the US Senate voted 59-34 to pass the bill to raise the debt ceiling next week.
Across the G10 fx space, the commodity currencies made a comeback, with AUD/USD emerging the strongest. The appreciation in the Chinese yuan, in the wake of policy support, underpins the aussie.
USD/CAD is holding the higher ground above 1.2700, as the US dollar and WTI trade on the back foot. The US oil tumbled towards $70 on Thursday amid China’s property sector woes and Omicron-led strict measures imposed in major economies.
USD/JPY is trading around 113.50, bouncing in tandem with the Treasury yields, as traders ignore a spike in the Japanese Wholesale price inflation.
EUR/USD is consolidating around 1.1300, vulnerable amid the Fed-ECB monetary policy divergence. The euro fell sharply after Reuters reported that the ECB is planning to boost its QE purchases when it meets next week.
GBP/USD is defending 1.3200, undermined by the Omicron and Brexit-led economic woes, which douse BOE’s December rate hike expectations. All eyes remain on the UK monthly GDP and Industrial Production data.
Gold is back in the red, looking to test the critical $1,760 support area, with all eyes on the US inflation numbers. The US Consumer Price Index (CPI) is seen higher at 6.8% YoY in November vs. 6.2% booked previously.
Bitcoin is attempting a bounce towards $50,000, as a fresh bid wave seems to have gripped the crypto market.
- USD/JPY extended its sideways consolidative price move for the fourth successive day on Friday.
- A softer risk tone benefitted the safe-haven JPY, though rising US bond yields extended support.
- Investors seemed reluctant and preferred to wait for the release of US consumer inflation figures.
The USD/JPY pair lacked any firm directional bias and remained confined in a narrow trading band near mid-113.00s heading into the European session.
The pair, so far, has struggled to gain any meaningful traction and extended its range-bound price action for the fourth successive day on Friday. A softer risk tone – amid mixed headlines on the Omicron variant of the coronavirus – benefitted the safe-haven Japanese yen. This, in turn, was seen as a key factor that capped the upside for the USD/JPY pair.
The downside, however, remains cushioned amid an uptick in the US Treasury bond yields. This, along with hawkish Fed expectations, acted as a tailwind for the US dollar and extended some support to the USD/JPY pair. Investors also seemed reluctant to place aggressive bets, rather preferred to wait on the sidelines ahead of the US consumer inflation figures.
The markets seem convinced that the Fed would tighten its monetary policy sooner rather than later to contain stubbornly high inflation and have been pricing in the possibility of liftoff in May 2022. Hence, the US CPI report, due later during the early North American session, will offer clues about the Fed's next policy move and strategy on interest rate hikes.
This will play a key role in influencing the USD demand and provide a fresh impetus to the USD/JPY pair heading into the FOMC monetary policy meeting on December 14-15. A stronger print will reinforce hawkish Fed expectations, which should be enough to provide a fresh lift to the greenback and set the stage for some meaningful upside for the major.
Technical levels to watch
- USD/CAD struggles to extend the previous day’s recovery moves, picks up bids of late.
- Mixed sentiment challenges traders, Omicron, Fed-linked chatters and China are in focus.
- US CPI will be crucial ahead of next week’s FOMC.
- BOC expected to keep inflation forecasts intact despite policymakers' fear of firmer price pressure.
USD/CAD pares intraday losses amid a sluggish European morning on Friday. Alike other major currency pairs, the Loonie also awaits the key US inflation figures for near-term direction. Also challenging the pair traders are the mixed signals concerning the Bank of Canada (BOC) and the Fed.
Although Reuters quotes a source to confirm no policy shift in the BOC strategy, as the central bank and finance ministry review the inflation target, the BOC Deputy Governor Toni Gravelle said on Thursday that concerns about upside inflation risks are heightened much more than usual.
On the other hand, the US Initial Jobless Claims dropped to the lowest levels since 1969, 184K versus 215K expected and 227K forecast, and raised odds of the faster tapering by the US Federal Reserve (Fed). Among the Fed hawks expecting more rate hikes in 2022 and 2023 are the leading banks that include Goldman Sachs, JP Morgan and Morgan Stanley. Though, a pullback in the US inflation expectations, as measured by the 10-year breakeven inflation rate per the St. Louis Federal Reserve (FRED) data seems to probe the Fed hawks.
Elsewhere, hopes of overcoming the South African covid variant Omicron with the existing vaccine boosters battle the latest lockdowns to weigh on the market’s mood. Further, looming defaults of China’s Evergrande and Kaisa join the Sino-American tension to add to the market’s risk-off mood.
It’s worth observing that WTI retreats towards $70.50, up 0.23% intraday at the latest, after declining the most in a week the previous day. The prices of Canada’s main export remain pressured by the downbeat mood and risk emanating from China, one of the world’s largest oil users.
Against this backdrop, the US Treasury yields and the Wall Street benchmarks posted losses the previous day, portraying the risk-off mood, while the latest corrective pullback in both the risk barometers remains less convincing to the traders.
Moving on, the US Consumer Price Index (CPI) for November and the preliminary Michigan Consumer Sentiment Index for December will be crucial to determine near-term USD/CAD moves. Also on the calendar is Canadian Capacity Utilization for Q3.
Read: US Consumer Price Index November Preview: Inflation is the new cause celebre
Technical analysis
Wednesday’s Dragonfly Doji directs USD/CAD buyers towards the yearly peak surrounding 1.2950.
- A softer risk tone assisted the safe-haven gold to regain positive traction on Friday.
- A subdued USD price action did little to provide any meaningful impetus to the metal.
- Hawkish Fed expectations should cap the upside ahead of the US consumer inflation.
Gold attracted some buying during the Asian session on Friday and recovered a part of the previous day's slide back closer to the weekly low. Mixed headlines on the Omicron variant of the coronavirus kept a lid on the recent optimism, which was evident from a softer tone around the equity markets. This, in turn, was seen as a key factor that assisted the safe-haven XAU/USD to regain some positive traction.
Meanwhile, the US dollar struggled to capitalize on the previous day's positive move and witnessed a subdued/range-bound price action on the last day of the week. This further acted as a tailwind for the dollar-denominated commodity, though the uptick lacked bullish conviction. Expectations that rising inflationary pressure would force the Fed to tighten its monetary policy sooner rather than later capped gains for the non-yielding gold.
Moreover, investors also seemed reluctant, rather preferred to move on the sidelines ahead of the US consumer inflation figures, due for release later during the early North American session. The US CPI report would influence the Fed's decision to taper its stimulus at a faster pace and its strategy on interest rate hikes. This will influence the USD demand and provide a fresh impetus to gold prices heading into the FOMC policy meeting on December 14-15.
Technical outlook
From a technical perspective, gold has been oscillating in a familiar trading band over the past two weeks or so. Given the recent sharp pullback from a multi-month high, around the $1,877 region, the range-bound price action could still be categorized as a bearish consolidation phase. The negative outlook is reinforced by the fact that spot prices have repeatedly failed to clear/find acceptance above a technically significant 200-day SMA. This, in turn, suggest that the near-term bias remains tilted firmly in favour of bearish traders.
That said, it will still be prudent to wait for a convincing break through the $1,773-72 area before positioning for a slide back towards testing the monthly swing low, around the $1,762 region. Some follow-through selling below the $1,759-58 zone will confirm a fresh bearish breakdown and drag gold prices further towards the next relevant support near the $1,750 level.
On the flip side, any subsequent move up might continue to confront stiff resistance near the $1,792-93 region (200-DMA). The mentioned barrier coincides with 100-day SMA and is closely followed by the $1,800 round-figure mark. A sustained strength beyond has the potential to lift spot prices to the next relevant resistance near the $1,810-15 supply zone en-route the $1,832-34 horizontal barrier. The latter should act as a key pivotal point for short-term traders.
Gold daily chart
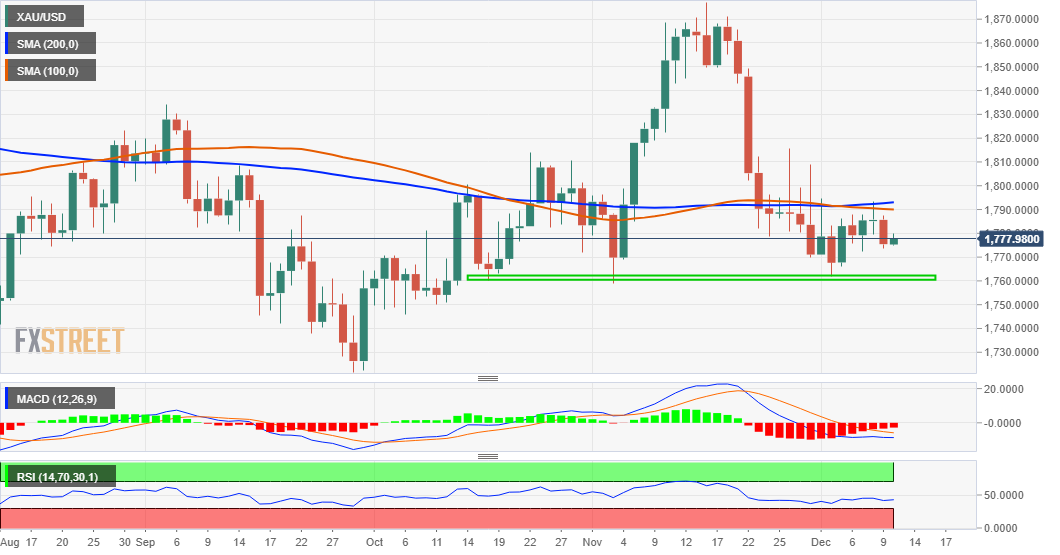
Key levels to watch
The UK Economic Data Overview
The British economic calendar is all set to entertain the cable traders during the dull hours of early Friday, at 07:00 GMT with October GDP figures for 2021. Also increasing the importance of that time are Trade Balance and Industrial Production details for the stated period.
Having witnessed a 0.6% run-up of economic activities in the previous month, market players will be interested in October’s monthly GDP figures to confirm the economic transition amid Omicron fears and fresh activity restrictions.
Forecasts suggest that the UK GDP will ease to 0.4% MoM in May versus +0.6% prior. GBP/USD traders also await the Index of Services (3M/3M) for the same period, +1.6% prior, for further insight.
Meanwhile, Manufacturing Production, which makes up around 80% of total industrial production, is expected to recover from -0.1% to +0.0% MoM in October. However, the total Industrial Production is expected to recover from -0.4% MoM to +0.1%.
Considering the yearly figures, the Industrial Production for October is expected to have eased to +2.2% versus +2.9% previous while the Manufacturing Production is also anticipated to have dropped to 1.7% in the reported month versus 2.8% last.
Separately, the UK Goods Trade Balance will be reported at the same time and is expected to show a deficit of £14.059 billion versus a £14.736 billion deficit reported in March.
Deviation impact on GBP/USD
Readers can find FX Street's proprietary deviation impact map of the event below. As observed the reaction is likely to remain confined around 20-pips in deviations up to + or -2, although in some cases, if notable enough, a deviation can fuel movements over 60-70 pips.

How could affect GBP/USD?
GBP/USD struggles for clear direction near the yearly low, defending 1.3200 level by the press time. The cable pair’s latest weakness could be linked to the latest fears that the Brexit-led economic woes will join the latest lockdown measures to push the Bank of England (BOE) further back from the rate hikes. The same contrasts to the escalating hawkish concerns over the Fed’s next step to exert additional downside pressure on the cable pair. However, the market’s wait for the US Consumer Price Index (CPI) data restricts the recent moves of the pair.
That said, today’s UK data dump may not offer much entertainment to the GBP/USD traders as US inflation gains major attention. Even so, softer data may not hesitate from dragging the quote towards a fresh yearly low.
Ahead of the release, TD Securities said,
We are looking for the UK economy to expand by 0.5% m/m in October (forecast: 0.4%), driven by the services sector at 0.6% m/m (market expectations: 0.4%). While last month saw a big boost in growth from health services, we expect strength in October to come from other service sectors, driven in part by the pulling forward of consumer demand over fears of end-of-year shortages. Manufacturing on the other hand likely weighed on growth with a relatively sharp fall of -1.0% (cosensus: 0.1%), driven in part by a decline in motor vehicle production. All in all, this would leave GDP growth roughly on track with the BoE's recent forecast of 1.0% q/q.
Technically, GBP/USD bears remain hopeful as a downward sloping trend line from October 28 restricts immediate upside around 1.3230.
Key notes
GBP/USD: Brexit, coronavirus tests rebound above 1.3200, UK GDP, US inflation eyed
GBP/USD Price Analysis: Bears looking for a discount and a break below 1.3205
About the UK Economic Data
The Gross Domestic Product released by the Office for National Statistics (ONS) is a measure of the total value of all goods and services produced by the UK. The GDP is considered as a broad measure of the UK economic activity. Generally speaking, a rising trend has a positive effect on the GBP, while a falling trend is seen as negative (or bearish).
The Manufacturing Production released by the Office for National Statistics (ONS) measures the manufacturing output. Manufacturing Production is significant as a short-term indicator of the strength of UK manufacturing activity that dominates a large part of total GDP. A high reading is seen as positive (or bullish) for the GBP, while a low reading is seen as negative (or bearish).
The trade balance released by the Office for National Statistics (ONS) is a balance between exports and imports of goods. A positive value shows trade surplus, while a negative value shows trade deficit. It is an event that generates some volatility for the GBP.
- AUD/USD remains sidelined after stepping back from two-week top.
- 10-DMA restricts immediate declines, 10-week-old horizontal area challenges buyers.
- Bullish MACD, RSI rebound from oversold territory favor upside momentum.
AUD/USD remains indifferent as global markets brace for all-important US inflation data during early Friday.
In doing so, the risk barometer pair seesaws between short-term key technical levels amid recently bullish bias, as portrayed by upbeat MACD signals and the firmer RSI line.
A clear upside break of 10-DMA and descending trend line from early November keep AUD/USD buyers hopeful. However, fresh buying seems to wait for a new weekly high, while also crossing the 21-DMA level surrounding 0.7190.
Following that, AUD/USD prices could aim for 0.7230 and early November’s swing low near 0.7275-80 but a convergence of the 100-DMA and 50-DMA around 0.7315-20 will be a strong resistance to watch afterward.
Meanwhile, pullback moves remain elusive beyond the 10-DMA level of 0.7105 and the previous resistance line near 0.7090, a break of which will open the door for 0.7045 and the 0.7000 support levels.
It’s worth noting that the AUD/USD pair’s weakness past 0.7000 will be challenged by the 0.7000-6990 key support zone, including lows marked during November 2020 and so far during December 2021.
AUD/USD: Daily chart
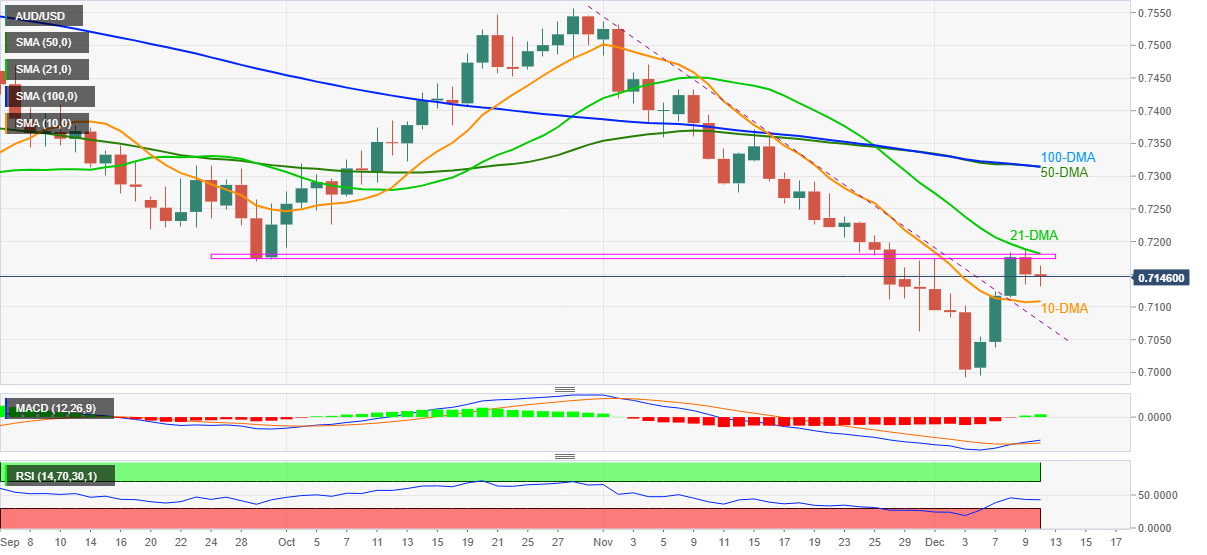
Trend: Further recovery expected
- EUR/USD grinds higher amid inactive Asian session after the heaviest fall in fortnight.
- Concerns over ECB’s extended bond purchase escalate versus likelihood of Fed’s faster tapering, more rate hikes.
- Yields snap three-week downtrend as traders await US CPI.
- ECB’s Lagarde, US Michigan Consumer Sentiment Index important too.
EUR/USD pares recently losses around 1.1300 during a sluggish Asian session on Friday.
The major currency pair dropped the most in two weeks the previous day as talks over the European Central Bank’s (ECB) support for extended easy money policies turned virus. Also exerting downside pressure on the quote was the risk-off mood amid mixed concerns and fears of hawkish Fed ahead of today’s US Consumer Price Index (CPI).
Following Bloomberg’s update suggesting that the ECB is up for tweaking the Pandemic Emergency Purchase Programme (PEPP) plan, Reuters said, “ECB policymakers leaning towards temporary, limited Asset Purchases Programme (APP) boost.” The news joins the return of the virus-led activity restrictions in the block to weigh on the regional currency.
On the contrary, the US Dollar Index (DXY) cheered from the market’s fears that the US Federal Reserve (Fed) can taper faster and announce more rate hikes amid firmer data and comparatively more challenges to inflation. Reuters cited the Biden administration signaling a higher price pressure while the US Initial Jobless Claims prints, the lowest since 1969, favored the hawkish hopes from the US central bank.
It’s worth noting, however, that the cautious optimism over Omicron vaccines and easing of the US inflation expectations, as measured by the 10-year breakeven inflation rate per the St. Louis Federal Reserve (FRED) data, seems to challenge EUR/USD bears of late.
Amid these plays, the US Treasury yields and the Wall Street benchmarks posted losses the previous day, portraying the risk-off mood, while the latest corrective pullback in both the risk barometers can’t be taken for the market’s optimism.
Moving on, final readings of Germany’s Harmonized Index of Consumer Prices for November, expected to remain unchanged at 6.0% YoY, will precede a speech from ECB President Christine Lagarde to entertain the EUR/USD traders. However, major attention will be given to the US consumer-centric data, namely the CPI and Michigan Consumer Sentiment Index.
Read: US Consumer Price Index November Preview: Inflation is the new cause celebre
Should the Fed versus ECB drama escalates, which is more likely, the EUR/USD will be vulnerable to refresh yearly low.
Technical analysis
Bullish MACD signals and firmer RSI favor the buyers but 21-day EMA, around 1.1340, acts as an immediate hurdle to recovery moves. Alternatively, a downside break of the three-week-old ascending triangle’s support, at 1.1240 by the press time, will initially attack the yearly low of 1.1186 during the theoretical slump towards 1.1050.
- USD/INR awaits fresh clues around multi-day top, stays mildly bid though.
- Sustained break of 75.65, bullish MACD signals keep buyers hopeful, overbought RSI condition probe further upside.
- Ascending trend line from July, 61.8% FE lures bulls, sellers await three-week-old support break.
USD/INR bulls take a breather around June 2020 levels, poked the previous day, as overbought RSI line tests immediate upside during early Friday.
Even so, a clear run-up beyond the double-tops marked in April and October, around 75.65, joins the bullish MACD signals to favor the bulls.
That said, the quote’s further upside eyes an upward sloping trend line from July, near 76.10, a break of which will direct Indian rupee (INR) sellers towards 61.8% Fibonacci Expansion (FE) of February-November moves, near 76.20.
Although the USD/INR prices are likely to reverse from 76.20, any further advances will be challenged by another ascending resistance line, from November 2020 near 76.50.
Alternatively, pullback moves remain elusive beyond a three-week-old support line, around 75.33 by the press time.
It should be noted, however, that a clear downside past-75.33 will direct USD/INR bears towards multiple tops marked since early November around 75.20 and then to the 75.00 threshold.
Overall, USD/INR remains in a bullish trajectory but overbought RSI may trigger pullback moves.
USD/INR: Daily chart

Trend: Further upside expected
- Asia-Pacific equities print mild losses amid anxious markets, light calendar at home.
- Omicron updates flash mixed signals but China financial market risk grows.
- Fed tapering, rate hike chatters swirl with eyes on US inflation.
Asian shares drift lower as global markets turn cautious ahead of the key US inflation data on Friday. Adding to the risk-off mood are the escalating calls for the Fed’s faster tapering and rate hikes even as inflation expectations fade rebound from a two-month low. It should be noted, however, that the mixed concerns over the South African variant of COVID-19 and a light calendar at home restrict the market moves of late. Additionally, the concerns surrounding Russia and Iran’s tussles with the US add to the trading filters.
While portraying the mood, the MSCI’s index of Asia-Pacific shares outside Japan drops 0.50% whereas Japan’s Nikkei 225 prints 0.65% intraday loss at the latest. Firmer prints of Japan’s Producer Price Index (PPI) in November could be cited as an additional burden on Tokyo-linked securities.
Fitch rang alarms over Evergrande and Kaisa’s likely default the previous day and the Chinese stocks couldn’t ignore the same while drowning stocks from Indonesia, South Korea and Pacific nations. It’s worth noting that India’s BSE Sensex drops 0.10% by the press time as INR eyes yearly bottom.
On a broader front, the US 10-year Treasury yields consolidate the previous day’s losses, up for the fourth day, while the S&P 500 Futures rise 0.15% at the latest.
Looking forward, markets are likely to witness a lackluster day ahead while waiting for the US Consumer Price Index (CPI) for November. However, fears over China’s financial market risk and Omicron could weigh on the risk appetite ahead of the data.
Read: US Treasury yields, S&P 500 Futures keenly await inflation signals
Indonesia's Retail Sales rebounded 6.5% on the year in October vs. a 2.2% drop seen in September, the latest survey conducted by Bank Indonesia (BI) showed on Friday.
The central bank predicts a 10.1% annual growth in retail sales in November.
FX implications
USD/IDR is off the two-day highs of 14,385 on the upbeat Indonesian data.
At the press time, USD/IDR is trading at 14,377.50, up 0.19% on a daily basis, extending its recovery momentum from weekly lows of 14,310.
- GBP/USD bulls are stepping in at a critical level on the charts.
- A break of 1.3205 is on the cards for the sessions ahead if bears commit below 1.3230s.
Cable is on moving in on critical resistance within a broader downtrend that would be expected to extend lower. The bears will likely be encouraged further on a break below 1.3205 in the coming sessions. The following illustrates the outlook in a top-down analysis starting with the daily chart:
GBP/USD daily chart

From a daily perspective, the price is retesting the old support which would be expected to hold and lead to a downside continuation into the 1.3230s.
GBP/USD H4 chart

The 4-hour time frame illustrates the resistance near the 61.8% Fibonacci retracement level in 1.3225 that guards the 1.3230s. If the price breaks there, then the downside potential becomes less imminent where a phase of consolidation would be expected into the US Consumer Price Index event.
GBP H1 chart

The hourly chart illustrates where the prospects are for slightly higher but should the bears commit, then a break below the hourly support of 1.3205 would probably be on the cards for the sessions ahead.
- USD/TRY treads water after two-day rebound from weekly low.
- Turkish FinMin promises fiscal discipline, sees lower budget deficit.
- Moody’s expects more inflation, another CBRT rate cut in December.
- Markets brace for US CPI amid mixed sentiment, Turkish Unemployment Rate will be important as well.
USD/TRY seesaws between $13.75-80 during an inactive Asian session on Friday.
In doing so, the Turkish lira (TRY) pair buyers take a breather following a two-day recovery from the weekly low as markets show a lack of confidence in buying the TRY despite hawkish comments from the Turkish policymakers of late.
On Thursday, Turkey’s new Finance Minister (FinMin) Nureddin Nebati tried following the previous day’s comments from President Tayyip Erdogan, to placate the pessimism surrounding the lira. The policymaker said, per Reuters, that the budget deficit would come in under 3.5% of GDP this year and would be managed with fiscal discipline.
Before him, global rating giant Moody’s said, “Turkey could see consumer price inflation surpass 25% in coming months with another potential interest rate cut in December adding to upside risks for its forecasts,” as per Reuters.
It’s worth noting that the anxiety over the US Federal Reserve’s (Fed) next policy step keeps the USD/TRY recently tight-lipped. Also adding to the trading filters is the mildly bid US Treasury yields and stock futures despite growing chatters over Fed rate hikes and Omicron.
That said, the pair traders will initially react to Turkey’s November Unemployment Rate, prior 11.5%, before waiting for the US Consumer Price Index (CPI) data. Should the scheduled US inflation figures arrive strong, the odds of Fed’s action could propel the USD/TRY towards refreshing the all-time high.
Read: US Consumer Price Index November Preview: Inflation is the new cause celebre
Technical analysis
Although the monthly resistance line, around $13.85, becomes the key hurdle for USD/TRY buyers, the pair bears are less likely to enter until the quote stays beyond the 12-day-old support line near $13.60.
- GBP/JPY hovers around intraday high, eyes first weekly gains in three.
- Firmer RSI hints at further recovery, 200-HMA strength to the triangle’s resistance.
- Bears can aim for yearly low but further downside becomes tough.
GBP/JPY struggles to defend the weekly gains, taking rounds to 150.10 during early Friday.
The cross-currency pair remained pressured during the last three days while consolidating the strong gains marked on Monday. The resulting moves portray a weekly symmetrical triangle to restrict the pair prices.
That said, the firmer RSI conditions and a sustained bounce off triangle support hints at a further run-up towards the pattern’s upper line, near 150.30 by the press time.
Given the 200-HMA level of 150.35 adding strength to the pair’s short-term resistance, GBP/JPY upside past 150.35 becomes difficult, a break of which will quickly fuel the pair towards a descending resistance line from November 28, around 150.75 at the latest.
Should the GBP/JPY bulls keep reins past 150.75, odds of witnessing a rally towards November 19 swing low near 152.50 can’t be ruled out.
On the flip side, pullback moves remain elusive beyond the triangle’s support line of 149.60. Also acting as immediate support is the 150.00 threshold.
If at all the GBP/JPY bears break the stated triangle towards the south, the latest low around 149.00 and the yearly trough surrounding 148.50 should lure the bears.
Though, any further downside past 148.50 will be challenged by the likely RSI conditions and December 2019 high close to 147.90.
GBP/JPY: Four-hour chart
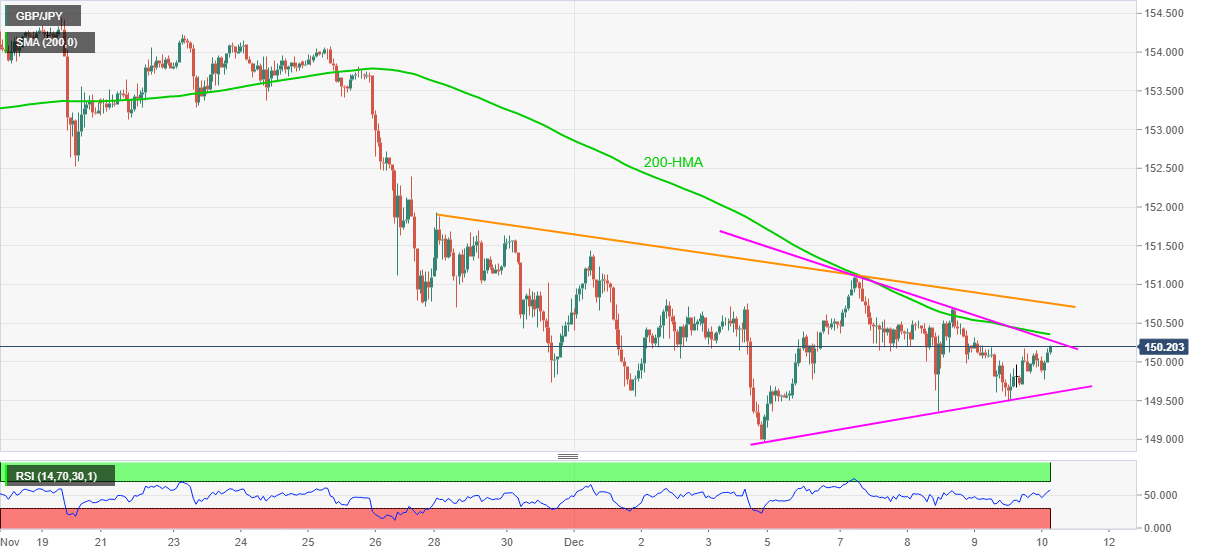
Trend: Sideways
- USD/CHF bulls are moving in to test important resistance.
- 0.9150 is being left behind and bulls are drifting higher in the 0.9200s with 0.9330 on the radar.
USD/CHF is firm in the Asian session as bulls commit to the prospects of a bullish breakout. The following illustrates the outlook on the daily and 4-hour charts where bulls have engaged towards a critical level of resistance.
USD/CHF daily chart
-637746997544247182.png)
From the 61.8% ratio, the price is moving higher following the strong rejection at the prior daily support. Should the bulls commit at this juncture, then a break of the resistance will open risk into the 0.93 areas.
USD/CHF H4 chart
-637747003242909011.png)
On the 4-hour chart, there is the potential for an inverse head & shoulders. The right-hand shoulder is potentially under construction where it meets the 21-EMA. 0.9270 will be the level to clear which could lead to a rally into the 0.9330s.
“The government must be mindful of downside risks to the economy from chip shortages and supply constraints,” Japanese Prime Minister Fumiko Ishida said on Friday.
He added that “the government had no intention of tweaking Japan's sales tax rate from the current 10%.”
Read: BOJ to hold back tweaking covid funding program next week – Bloomberg Survey
USD/JPY reaction
USD/JPY is bouncing back above 113.50 on the above comments and an uptick in the US Treasury yields. The spot flips to gains, adding 0.06% on the day.
| Raw materials | Closed | Change, % |
|---|---|---|
| Brent | 74.1 | -2.62 |
| Silver | 21.959 | -2.15 |
| Gold | 1775.133 | -0.44 |
| Palladium | 1803.04 | -2.6 |
The Bank of Japan (BOJ) is unlikely to make any alterations to its special covid funding program amid uncertainties posed by the new Omicron covid variant, the latest Bloomberg survey of 44 analysts showed on Friday.
Key takeaways
“Some 61% of 44 analysts surveyed by Bloomberg expect a partial extension of the Covid aid for businesses set to end in March.”
“Another quarter sees the program extended in the current form.”
“The BOJ won’t touch any of its main policy settings at the meeting, according to 91% of respondents.”
“With the omicron variant adding uncertainties to the outlook, a vast majority of surveyed economists expect a decision on the funding program to be made in January or March.”
“Some 47% of economists said they agree with Kuroda’s assessment that the yen’s current weakness is “certainly” positive for the overall economy.”
Related reads
- USD/JPY bulls looking for upside from daily support
- Japan Finance Minister Suzuki: Important to follow up on higher wages
- US 10-year Treasury yields seesaw after snapping three-day uptrend, S&P 500 Futures print mild gains.
- Omicron, China and geopolitics are all active catalysts but markets care for Fed rate hikes.
- Inflation expectations ease ahead of US CPI, Michigan Consumer Sentiment Index.
Global markets portray the typical pre-data anxiety during early Friday as traders await the key US data amid increasing chatters over the hawkish Fed actions.
While portraying the mood, the US 10-year bond coupon remains sidelined around 1.49% after reversing from a two-week top the previous day. Also showcasing the subdued markets is the 0.14 intraday gain of the S&P 500 Futures, as well as mixed performance of the Asia-Pacific stocks.
Having witnessed a slump in the US Initial Jobless Claims, global banks seem to turn more hawkish for the next week’s US Federal Reserve (Fed) monetary policy meeting. Among the hawks are the leading US banks including Goldman Sachs, Citibank, JP Morgan and Morgan Stanley. Also favoring the bulls are the latest shifts in the Fed Funds Futures suggesting sooner rate hikes.
On the contrary, the US inflation expectations, as measured by the 10-year breakeven inflation rate per the St. Louis Federal Reserve (FRED) data, snap a four-day recovery from early October lows while easing to 2.47% for Thursday, challenging the Fed hawks.
Elsewhere, chatters surrounding looming defaults of China’s Evergrande and Kaisa join the Sino-American tension to add to the risk catalysts. Further, the US support to Ukraine in a tussle with Russia and the Washington-Israel talks to convey Tehran’s diplomacy also weigh on the risk appetite.
However, increasing hopes that the South African covid variant, dubbed as Omicron, is less severe than the previous strains and the present booster shots of the vaccines are effective against the same keeps the investors hopeful.
That said, prices of commodities like gold, silver and crude oil recover but the US Dollar Index (DXY) remains lackluster of late.
Given the scheduled release of the US Consumer Price Index (CPI) and the preliminary reading of the Michigan Consumer Sentiment Index for November and December respectively, markets will remain sidelined ahead of releases. However, a negative surprise should boost market sentiment and equities but not the greenback.
Read: US Consumer Price Index November Preview: Inflation is the new cause celebre
- USD/JPY is consolidated within a key support structure.
- The US CPI today and the Fed next week are the key events into the year-end for the pair.
USD/JPY is flat in Tokyo trading around 113.40 within a range of between 113.33 and 113.49 for the session so far. Markets are consolidating with a defensive bias ahead of a very busy central bank schedule next week and the US Consumer Price Index today. Risk appetite softened in Europe and the US with equities closing lower. There has been a focus on the spread of the Omicron variant while traders try to second guess the Federal Reserve's next moves.
US bond yields fell overnight following three consecutive positive days. There is room for the 10-year yield to sink further according to the daily chart to between 1.47 and 1.45% and the concerns over the omicron impact on the economy is a driving force. The two-year government bond yields traded at 0.69%, and the 10-year government bond yields dropped from 1.52% to 1.49%.
US CPI eyed as an event risk
Meanwhile, tonight’s US CPI data should provide some guidance on inflation risks. Traders will be on the lookout for how well the Fed is calling it and whether the data aligns with the Fed’s hawkish views on inflation. CPI is expected to show a rise of 0.7% MoM, up 6.8% YoY, with core up 0.5% MoM (4.9% YoY). Analysts at Westpac explained that another substantial lift in consumer prices is anticipated in November as robust demand broadens the scope of inflation beyond the categories first associated with the reopening.
In other data, ''the tightness in the labour market is becoming more evident. Initial claims for the latest week rose 184k, the lowest increase since 6 September 1969, signalling labour hoarding amid strong demand for labour is at play,'' analysts at ANZ Bank noted. ''Available slack in the labour market is low and constrained by high levels of early retirees and ongoing jobs displacement (childcare etc) from the pandemic. Wage pressure look set to intensify further.''
The Fed next week will be the next major event before the holiday season kicks in and investors will want to see the outcome while looking to square the books before Christmas. The Fed could well open the gates to a rate rise as soon as the second quarter if needed which has the potential to underpin the greenback into year-end.
USD/JPY technical analysis

The daily chart shows that the price is correcting to the support of the W-formation's neckline. This would be expected to hold and lead to a bullish impulse in the coming sessions.
- EUR/JPY is testing critical hourly support in Asia.
- The bulls will look for a break of weekly resistance towards 129.80.
EUR/JPY is under pressure and testing a critical level of support on the hourly time frame. The bulls will need to break weekly resistance which will expose a low volume area into the late 129 area. The following illustrates the bias on the weekly and hourly charts.
EUR/JPY H1 char
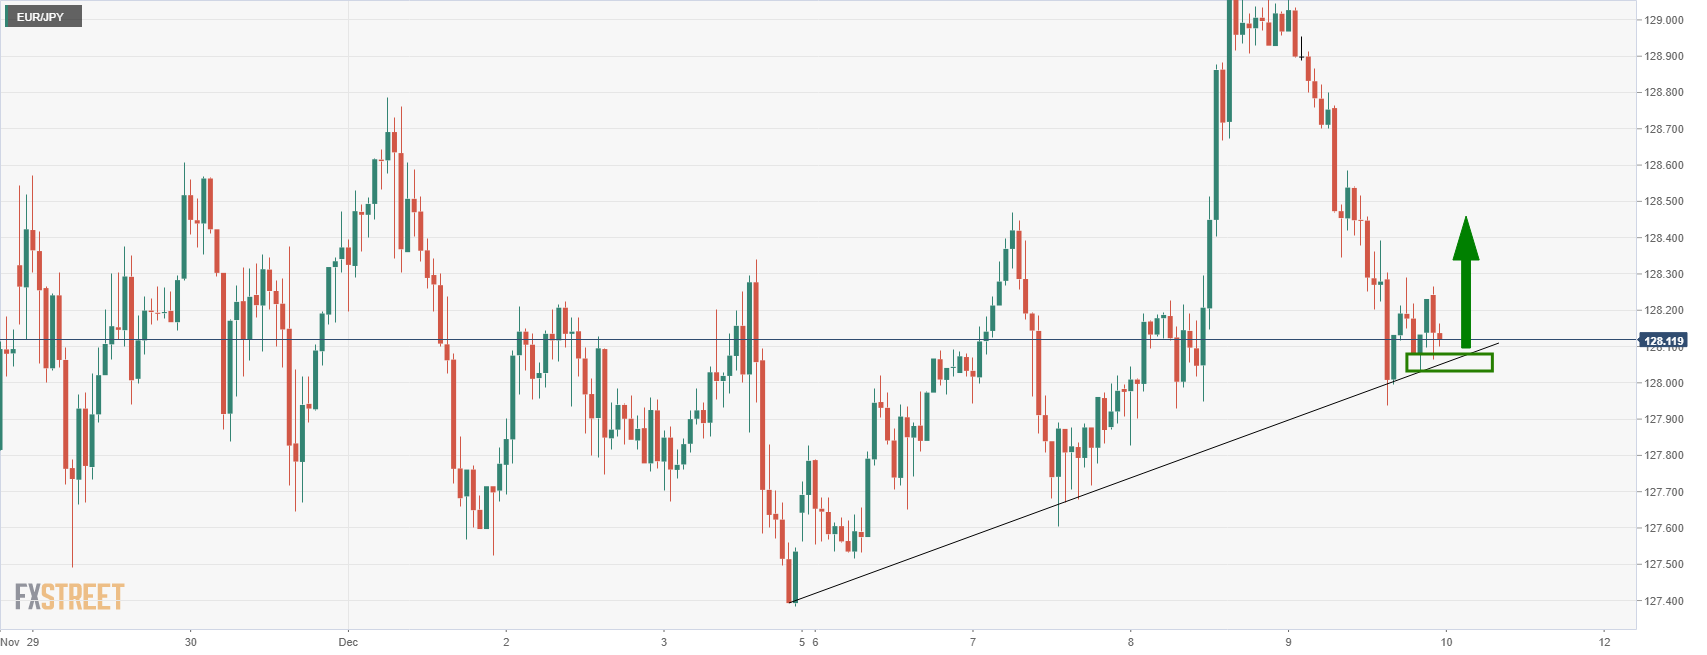
The price is testing dynamic support and a prior low which cold hold in the coming hours. Should the bulls commit here, then a bullish impulse would be the next expected outcome with 129.80 on the radar.
EUR/JPY weekly chart
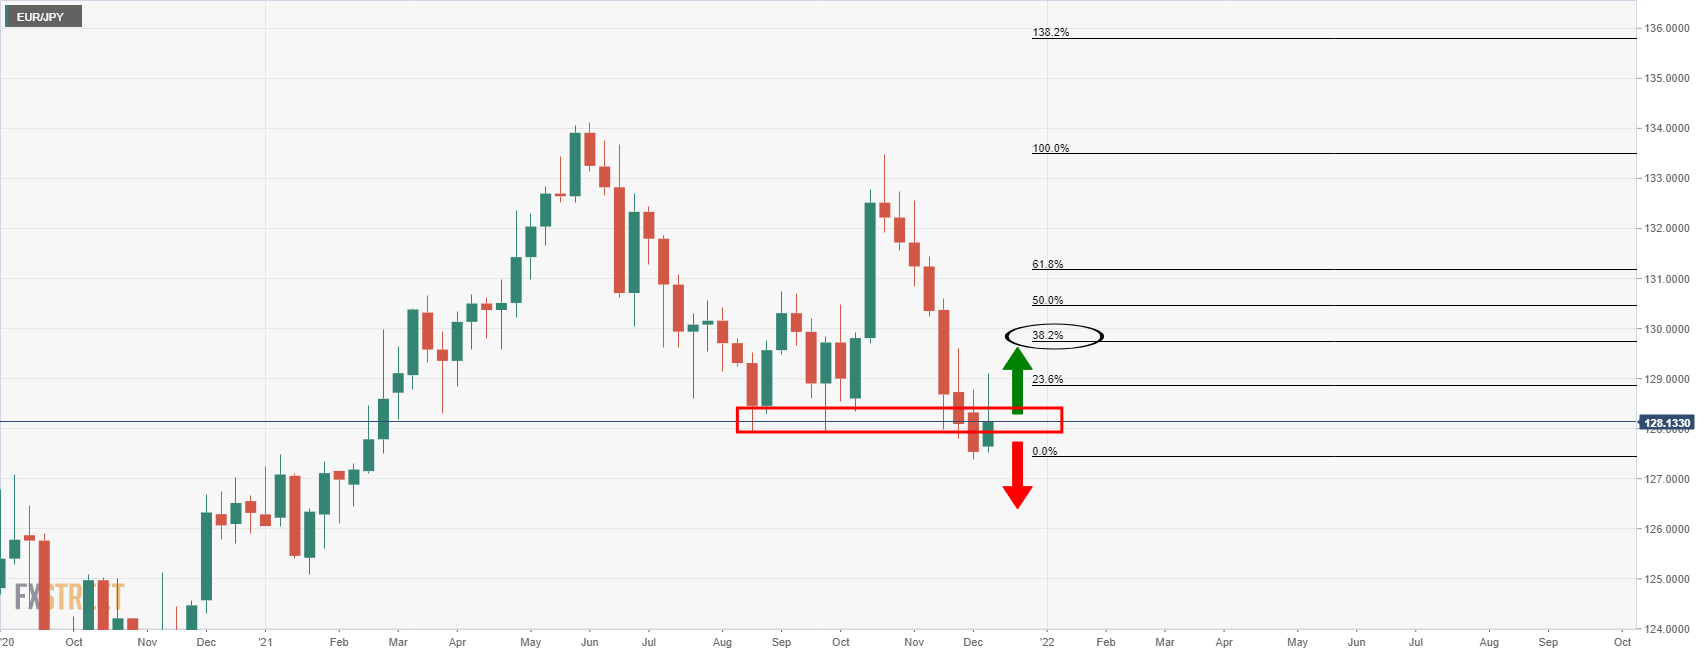
The weekly outlook is meanwhile bullish as the price attempts to correct. The wick will be compelling for next week but the bulls will need to break this current resistance. Consolidation and a failure in this area will shift the bias to the downside again.
According to analysts at Citigroup, the US Federal Reserve (Fed) is likely to announce an acceleration in the reduction of its bond-buying programme from January when they meet next week to decide on the policy stance.
Key quotes
“There are broad expectations that the December 15 FOMC meeting will see an acceleration of tapering from January, which would see purchases end as soon as March. The timeline is consistent with pricing in US swap markets in terms of rate hikes that could follow.”
“The market reaction depends on the context - the Fed won't be dovish but we think much of their hawkishness is now priced in.”
- Silver pare losses at six-week low, snaps two-day downtrend.
- Monthly descending trend line, oversold RSI hints at the corrective pullback towards 50-SMA, Bears eye yearly low.
Silver (XAG/USD) picks up bids to $22.00, consolidating recent losses around a multi-day low. That said, the commodity snaps a two-day downtrend during early Friday.
Although the metal dropped to the fresh low since September 30, oversold RSI conditions and a downward sloping trend line from early November limits the immediate downside around $21.80.
However, recovery moves remain elusive until crossing $23.00, comprising November 03 low.
The latest run-up may aim for a 50-SMA level of $22.45 while 61.8% Fibonacci retracement (Fibo.) of September-November upside, near $22.95, will act as an extra filter to the north.
Alternatively, a downside break of the stated support line near $21.80 will poke September’s low, also the 2021 bottom surrounding $21.40.
In a case where the silver prices remain weak past $21.40, the $20.00 psychological magnet will be in focus.
Silver: Four-hour chart
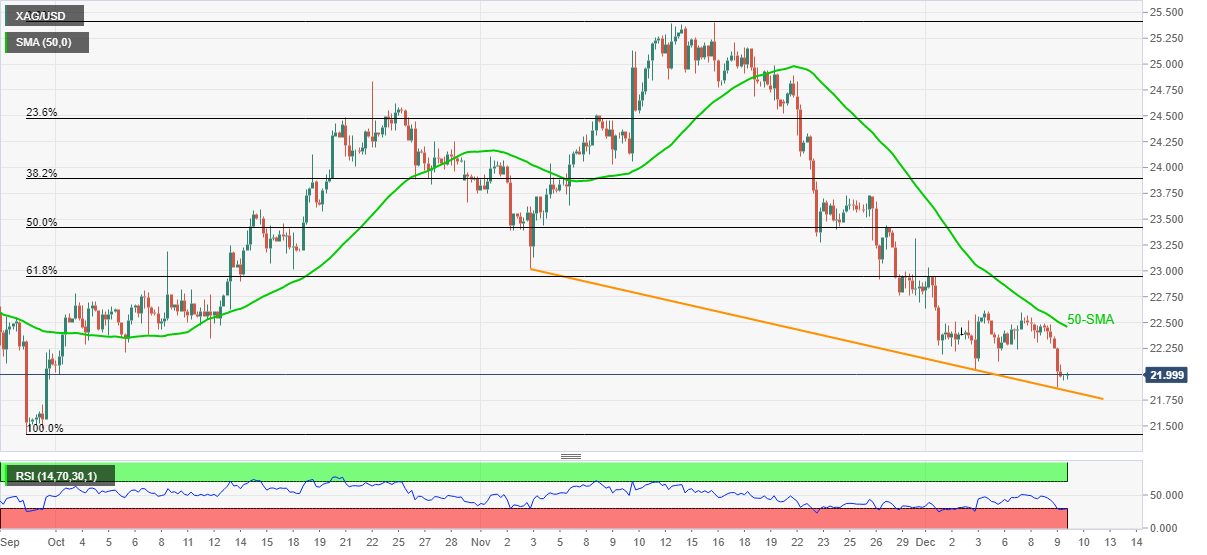
Trend: Corrective pullback expected
Japan’s Finance Minister Shunichi Suzuki said on Friday, “it is important to follow up on the implementation of wage hikes along with the country's growth strategy.”
Earlier on, a Bank of Japan (BOJ) official noted that an upward pressure in wholesale inflation is broadening.
These comments come after the country’s wholesale price inflation jumped to a record high of 9% YoY in November amid supply bottlenecks and rising raw material costs.
Market reaction
USD/JPY is posting small losses amid a broadly weaker US dollar and upbeat Japan’s data. The spot was last seen trading at 113.35, down 0.06% on a daily basis.
- DXY struggles to extend biggest daily gains in two weeks.
- Yields, stock futures dwindle amid Fed rate hike, China-linked chatters,
- US Initial Jobless Claims dropped to the lowest since 1969, inflation expectations ease.
- US CPI eyed, Omicron, geopolitics important too.
US Dollar Index (DXY) pokes intraday low of 96.20, consolidating the previous day’s heavy gains during early Friday. However, the greenback gauge marks dismal moves on a daily basis, down 0.02% at the latest, as market players turn cautious ahead of the key US inflation data.
DXY jumped the most since November 24 the previous day as risk-off mood underpinned the US dollar’s safe-haven demand. While geopolitics and Fed-linked headlines were the key to weigh on the risk appetite, Omicron and firmer US data offered extra burden on the sentiment, favoring the USD in turn.
That said, the US Treasury yields and the Wall Street benchmarks posted losses the previous day, portraying the risk-off mood, while the latest corrective pullback in both the risk barometers can’t be taken for market’s optimism amid a light calendar in Asia.
The US Initial Jobless Claims dropped to the lowest levels since 1969, 184K versus 215K expected and 227K forecast, and raised odds of the faster tapering by the US Federal Reserve (Fed). Among the Fed hawks expecting more rate hikes in 2022 and 2023 are the leading banks that include Goldman Sachs, JP Morgan and Morgan Stanley.
However, a pullback in the US inflation expectations, as measured by the 10-year breakeven inflation rate per the St. Louis Federal Reserve (FRED) data seems to have weighed the DXY recently. The inflation expectations snap a four-day recovery from early October lows while easing to 2.47% for Thursday, signaling odds of a negative surprise for the Fed hawks.
It’s worth noting that chatters surrounding looming defaults of China’s Evergrande and Kaisa join the Sino-American tension to add to the risk catalysts, helping the DXY to stay firmer. On the same line was the US support to Ukraine in a tussle with Russia and the Washington-Israel talks to convey Tehran’s diplomacy.
Alternatively, the market’s anxiety over the scheduled data and fears that the worsening virus woes may probe Fed actions challenge the DXY bulls of late.
Looking forward, the US Consumer Price Index (CPI) and the preliminary reading of the Michigan Consumer Sentiment Index will be crucial to forecast short-term DXY moves.
Read: US Consumer Price Index November Preview: Inflation is the new cause celebre
Technical analysis
A fortnightly symmetrical triangle restricts short-term US Dollar Index moves between 95.95 and 96.50.
| Time | Country | Event | Period | Previous value | Forecast |
|---|---|---|---|---|---|
| 07:00 (GMT) | Germany | CPI, m/m | November | 0.5% | -0.2% |
| 07:00 (GMT) | Germany | CPI, y/y | November | 4.5% | 5.2% |
| 07:00 (GMT) | United Kingdom | Manufacturing Production (YoY) | October | 2.8% | 1.7% |
| 07:00 (GMT) | United Kingdom | Manufacturing Production (MoM) | October | -0.1% | 0% |
| 07:00 (GMT) | United Kingdom | Industrial Production (YoY) | October | 2.9% | 2.2% |
| 07:00 (GMT) | United Kingdom | Industrial Production (MoM) | October | -0.4% | 0.1% |
| 07:00 (GMT) | United Kingdom | GDP m/m | October | 0.6% | 0.4% |
| 07:00 (GMT) | United Kingdom | GDP, y/y | October | 5.3% | 4.9% |
| 07:00 (GMT) | United Kingdom | Total Trade Balance | October | -2.8 | |
| 13:00 (GMT) | United Kingdom | NIESR GDP Estimate | November | 1% | 1.3% |
| 13:30 (GMT) | Canada | Capacity Utilization Rate | Quarter III | 82% | 83% |
| 13:30 (GMT) | U.S. | CPI, m/m | November | 0.9% | 0.7% |
| 13:30 (GMT) | U.S. | CPI excluding food and energy, m/m | November | 0.6% | 0.5% |
| 13:30 (GMT) | U.S. | CPI excluding food and energy, Y/Y | November | 4.6% | 4.9% |
| 13:30 (GMT) | U.S. | CPI, Y/Y | November | 6.2% | 6.8% |
| 15:00 (GMT) | U.S. | Reuters/Michigan Consumer Sentiment Index | December | 67.4 | 67.1 |
| 18:00 (GMT) | U.S. | Baker Hughes Oil Rig Count | December | 467 | |
| 19:00 (GMT) | U.S. | Federal budget | November | -165 | -195 |
In recent trade today, the People’s Bank of China (PBOC) set the yuan (CNY) at 6.3702 vs the last close of 6.3778.
About the fix
China maintains strict control of the yuan’s rate on the mainland.
The onshore yuan (CNY) differs from the offshore one (CNH) in trading restrictions, this last one is not as tightly controlled.
Each morning, the People’s Bank of China (PBOC) sets a so-called daily midpoint fix, based on the yuan’s previous day closing level and quotations taken from the inter-bank dealer.
- WTI remains pressured after declining the most in over a week.
- Steady RSI, downside break of 61.8% Fibonacci retracement keeps sellers hopeful.
- $73.75-80 becomes a tough nut to crack for oil buyers.
WTI crude oil prices grind lower around $70.40-50, up 0.10% intraday during early Friday.
The black gold posted the biggest daily losses in eight days the previous day, breaking 61.8% Fibonacci retracement (Fibo.) of August-October upside. However, the 200-DMA challenges the commodity sellers of late.
Given the steady RSI and the quote’s hesitance in breaking the 200-DMA, prices are likely to recover should they bounce back beyond the stated Fibonacci retracement level of $70.60.
Following that, 50% Fibo. level of $73.35 may lure WTI bulls but a confluence of 100-DMA and descending trend line from November 10, near $73.75-80, will be a strong resistance to watch.
Alternatively, a daily closing below 200-DMA level of $70.00 will trigger a slump targeting an area comprising multiple supports around $67.50-30.
During the WTI oil bear’s dominance past $67.30, the recent low of $62.35 and August month’s bottom surrounding $61.75 will be in focus.
WTI: Daily chart
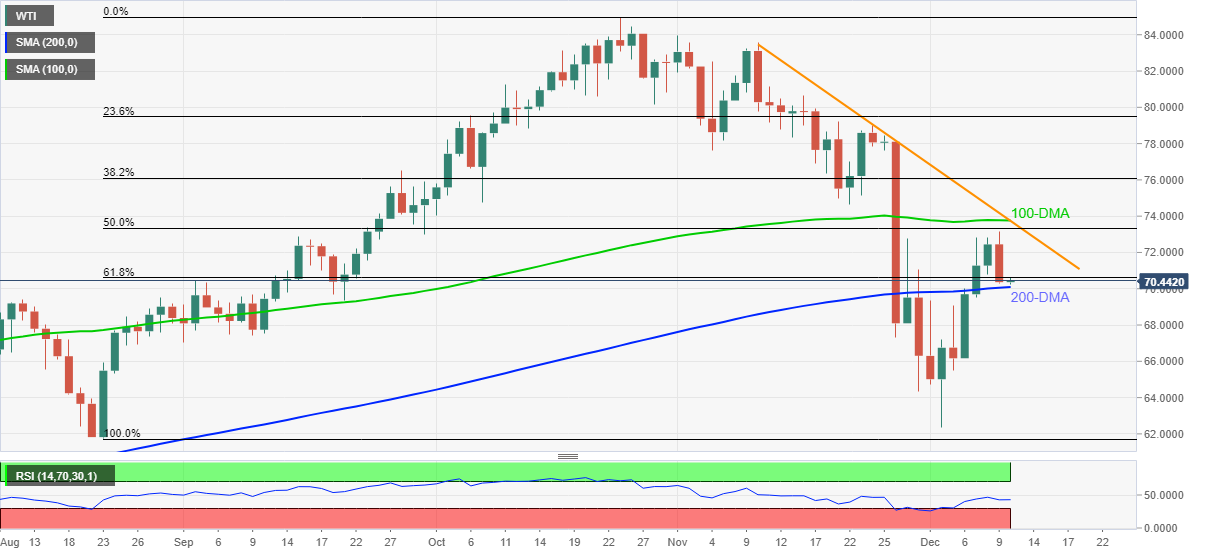
Trend: Recovery expected
- AUD/USD remains indecisive after reversing from two-week top.
- Market sentiment dwindles amid a light calendar but bears have the upper hand.
- Fed rate hike chatters, China news and Omicron updates are important too.
- US inflation expectations snap four-day rebound ahead of CPI release.
AUD/USD seesaws inside a 10-pips trading range surrounding 0.7150 during Friday’s Asian session.
The risk barometer pair portrays the market’s cautious mood ahead of the key US inflation data. The mixed catalysts and light calendar add to the trader’s indecision.
Having snapped a three-day uptrend the previous day, the US 10-year Treasury yields remain lackluster around 1.487% at the latest. Also portraying the sluggish markets is the S&P 500 Futures that rise 0.10% while the Wall Street benchmarks closed in the red.
A Japanese study saying Omicron is four-time more transmissible than the other covid strains join the return of virus-led lockdowns in Europe and the UK, as well as protective measures in parts of the US, to renew COVID-19 fears. On the contrary, global policymakers followed scientists suggesting three vaccine shots as effective against the virus variant.
On a different page, major setbacks for the Beijing Olympics 2022 join rating giant Fitch’s negative comments over China’s Evergrande and Kaisa to mark challenges for Australia’s largest customer, namely China.
Additionally, the US support to Ukraine in a tussle with Russia and the Washington-Israel talks to convey Tehran’s diplomacy also challenge the risk appetite.
It should be observed that the US Initial Jobless Claims dropped to the lowest levels since 1969, 184K versus 215K expected and 227K forecast. This helps major US banks, including Goldman Sachs, JP Morgan and Morgan Stanley to push for more rate hikes during 2022 and 2023.
Moving on, a lack of major data/events in Asia and the importance of today’s US Consumer Price Index (CPI) for November ahead of next week’s Federal Open Market Committee (FOMC) meeting will keep AUD/USD traders on the sidelines. It should be observed that the US inflation expectations, as measured by the 10-year breakeven inflation rate per the St. Louis Federal Reserve (FRED) data, snap four-day recovery from early October lows while easing to 2.47% for Thursday, signaling odds of a negative surprise for the Fed hawks.
Read: US Consumer Price Index November Preview: Inflation is the new cause celebre
Technical analysis
Although 21-DMA joins September lows to challenge AUD/USD bulls, a clear upside break of 10-DMA and descending trend line from early November keeps buyers hopeful. Also favoring the bulls is the RSI recovery from oversold territory.
However, fresh buying seems to wait for a fresh weekly high of 0.7188, while also successfully crossing the 21-DMA level surrounding 0.7180.
Meanwhile, pullback moves remain elusive beyond the previous resistance line near 0.7090, a break of which will open the door for 0.7045 and the 0.7000 support levels.
- Gold remains pressured around weekly low after two-day downtrend.
- Yields, S&P 500 Futures print mild gains but cautious mood ahead of US CPI restricts market moves.
- Omicron, geopolitics act as extra catalysts to watch, US Michigan Consumer Sentiment Index too.
- Gold Price Forecast: Lower in range as caution persists
Gold (XAU/USD) struggles for clear direction after a two-day downtrend to the weekly low, taking rounds to $1,775 during Friday Asian session. The metal dropped the most in a week the previous day as market sentiment soured while the pre-data anxiety seems to restrict the metal’s latest moves.
Increasing chatters over the Fed’s faster tapering and rate hikes joined mixed updates concerning the South African covid variant, namely Omicron, as well as geopolitical fears surrounding China and Iran, to weigh on the market sentiment the previous day. Firmer US Jobless Claims and Russia-Ukraine tussles were also in the line to roil the mood and drag gold prices.
US Initial Jobless Claims dropped to the lowest levels since 1969, 184K versus 215K expected and 227K forecast, raising odds of the faster tapering by the US Federal Reserve (Fed) ahead of today’s key inflation data and the next week’s Federal Open Market Committee (FOMC) meeting.
On a different page, the return of lockdowns in Europe and the UK, as well as protective measures in parts of the US, renew COVID-19 fears even as global policymakers followed scientists suggesting three vaccine shots as effective against the virus variant. The fears could be linked to the Japanese study saying Omicron is four-time more transmissible than the other covid strains. It’s worth noting that US support to Ukraine and major setbacks for the Beijing Olympics 2022 join the Washington-Israel talks to convey Tehran’s diplomacy to underpin the risk-off mood.
Further, Fitch termed China’s Evergrande as “restricted default” and pushed the People’s Bank of China (PBOC) to raise the reserve requirement ratio (RRR) on banks' foreign currency holdings.
While the US Treasury yields and the Wall Street benchmarks posted losses the previous day, portraying the risk-off mood, the latest corrective pullback in both the risk barometers can’t be taken for market’s optimism amid a light calendar in Asia.
Looking forward, gold traders will pay close attention to the risk-averse catalysts considering the bearish chart pattern, called head-and-shoulders, which in turn highlight today’s US Consumer Price Index (CPI) as the key factor to follow.
Read: US Consumer Price Index November Preview: Inflation is the new cause celebre
Technical analysis
Gold is up for confirming head-and-shoulders bearish chart pattern on the four-hour play, highlighting the $1,760 neckline for the bears. Also favoring the sellers are the MACD signals and RSI retreat.
A clear downside break of $1,760 will theoretically back the slump towards mid-$1600s. However, $1,745 and $1,720 may test the bears before directing them to the $1,700 threshold. Adding to the downside filters is the yearly low of $1,676.
On the contrary, a convergence of the previous support line from late September, 50% Fibonacci retracement (Fibo.) of September 29 to November 16 upside and 100-SMA will challenge the gold buyers around $1,800.
Should the metal prices rise past $1,800, the $1,815, $1,833 and $1,850 levels may entertain gold bulls ahead of November’s peak of $1,877.
To sum up, gold bears are flexing muscles ahead of the key weekly event with eyes on $1,760.
Gold: Four-hour chart
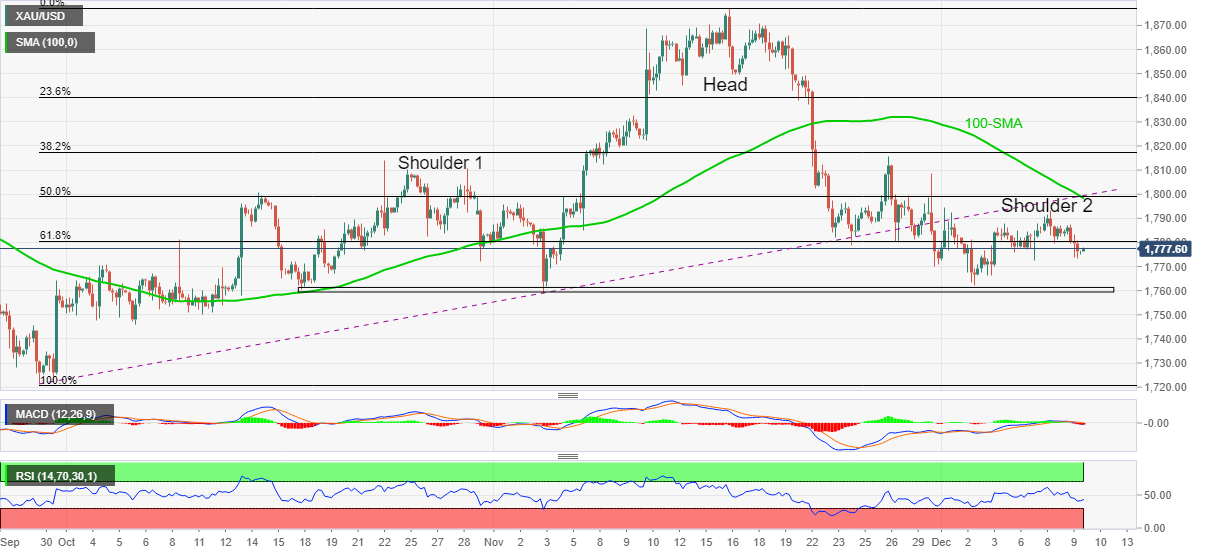
Trend: Further weakness expected
| Pare | Closed | Change, % |
|---|---|---|
| AUDUSD | 0.71467 | -0.35 |
| EURJPY | 128.123 | -0.59 |
| EURUSD | 1.12925 | -0.44 |
| GBPJPY | 149.987 | -0.04 |
| GBPUSD | 1.32195 | 0.14 |
| NZDUSD | 0.67938 | -0.17 |
| USDCAD | 1.27105 | 0.5 |
| USDCHF | 0.92381 | 0.48 |
| USDJPY | 113.457 | -0.17 |
Morgan Stanley (MS) joins the group of bulls expecting more and faster Fed rate hikes, per the latest note published Thursday night.
The US banker fetched their initial rate hike calls forward while saying, “We now expect the FOMC to begin raising interest rates in September next year, two quarters earlier than previously anticipated.”
Key quotes
Although the contours of our outlook for inflation and labor markets has not changed, aspects of the Fed’s reaction function may have.
In our outlook, we see the FOMC pausing on rate hikes in the third quarter of 2023 in order to initiate a balance sheet rundown.
Strategists lifted higher their 2022 forecast for the US two-year yield from 1.0% to 1.25%, to incorporate earlier rate hikes.
The strategists kept their 10-year yield forecast at 2.10% for the end of 2022. They forecast the yield to reach 1.75% in the first quarter, 1.90% in the second quarter, then 2% in the third quarter.
Read: US Consumer Price Index November Preview: Inflation is the new cause celebre


© 2000-2026. All rights reserved.
This site is managed by Teletrade D.J. LLC 2351 LLC 2022 (Euro House, Richmond Hill Road, Kingstown, VC0100, St. Vincent and the Grenadines).
The information on this website is for informational purposes only and does not constitute any investment advice.
The company does not serve or provide services to customers who are residents of the US, Canada, Iran, The Democratic People's Republic of Korea, Yemen and FATF blacklisted countries.
Making transactions on financial markets with marginal financial instruments opens up wide possibilities and allows investors who are willing to take risks to earn high profits, carrying a potentially high risk of losses at the same time. Therefore you should responsibly approach the issue of choosing the appropriate investment strategy, taking the available resources into account, before starting trading.
Use of the information: full or partial use of materials from this website must always be referenced to TeleTrade as the source of information. Use of the materials on the Internet must be accompanied by a hyperlink to teletrade.org. Automatic import of materials and information from this website is prohibited.
Please contact our PR department if you have any questions or need assistance at pr@teletrade.global.
transfers