- Analytics
- News and Tools
- Market News
CFD Markets News and Forecasts — 08-12-2021
- GBP/USD fades corrective pullback from 2021 bottom, down for third consecutive day.
- EU barred UK from Horizon research scheme on ‘trust’ issues, Christmas spirit challenged on Brexit deadlock.
- Britain announced fresh virus-led activity restrictions called “plan B”.
- Second-tier US data, risk catalysts are important for near-term directions.
GBP/USD hovers around 1.3200 following a failed attempt to bounce off the 2021 bottom, marked the previous day, during the initial Asian session on Thursday.
The cable pair refreshed multi-day low after the UK announced fresh measures to tame the spread of the coronavirus. Also adding to the quote’s weakness were the Brexit headlines and firmer US Treasury yields.
Having witnessed a doubling of the COVID-19 variant cases in 2-3 days, UK PM Boris Johnson announced that the UK will move to Covid-19 "plan B". The fresh measures include guidance to work from home, face mask requirements for visiting public venues and push for the National Health Services (NHS) Covid Pass.
On the other hand, concerns that the Brexit tussle between the European Union (EU) and the UK is likely to weigh on the supply-chains and roil Christmas gained momentum. The latest Brexit-negative headlines were shared by The Telegraph that said, “The United Kingdom has been shut out of the Horizon research scheme because the European Union does not "trust" the British Government.” The UK news adds, “The British access to the £77billion program was confirmed during the Brexit negotiations but has been pushed back after the two sides locked horns over key issues this year.”
It’s worth noting that the firmer US Treasury yields, backed by upbeat second-tier US employment-linked data, exert additional downside pressure on the GBP/USD prices. Also favoring the bears were fears emanating from the latest diplomatic tensions between the US and Russia, as well as Sino-American tussles.
While Brexit and the covid headlines are the keys to determining short-term GBP/USD moves and are likely to keep the bears hopeful, Friday’s US Consumer Price Index (CPI) data and other risk catalysts are important to watch as well.
Technical analysis
A downward sloping trend line from late October directs GBP/USD prices towards December 2020 lows near 1.3130.
“Bolstering Taiwan's self-defenses is an ‘urgent task’ and an essential feature of deterring China,” said US Assistant Secretary of Defense for Indo-Pacific Security Affairs Ely Ratner in testimony at a Senate Foreign Relations Committee hearing, per Reuters.
“In addition to the provision of defensive arms and services to Taiwan, the department remains committed to maintaining the capacity of the United States to resist the resort to force or other forms of coercion that may jeopardize the security of the people on Taiwan,” adds the Pentagon's top official for Asia on Wednesday per Reuters.
US Defence Official Ratner also said, “China’s coercive air and maritime campaigns around Taiwan increase the likelihood of miscalculation.”
FX implications
The news should have joined the fresh Omicron fears, due to the reintroduction of the virus-led activity restrictions in Europe, to probe the AUD/USD bulls.
Read: AUD/USD hovers below 0.7200 as RBA’s Lowe cheers digital payments, China inflation eyed
- EUR/USD seesaws after rising the most in two weeks.
- Clear break of 1.1285-90 resistance confluence, now support, joins bullish MACD signals to favor buyers.
- Six-week-old descending trend line, monthly horizontal area restrict immediate upside.
EUR/USD grinds higher around the weekly top following the biggest daily jump in a fortnight, taking rounds to 1.1350-40 during the early Asian session on Thursday.
The major currency pair’s latest run-up could be linked to a successful break of the 100-SMA and a downward sloping trend line from early November, around 1.1285-90, amid bullish MACD.
However, multiple tops marked since November 15, as well as descending resistance line from October 28, challenge the pair bulls around 1.1385-90.
Should the quote rises past-1.1390, EUR/USD bulls will eye the 5% Fibonacci retracement of late October-November declines, around 1.1440, ahead of challenging the early November lows near 1.1515.
Alternatively, pullback moves remain less harmful until staying beyond the aforementioned resistance-turned-support area near 1.1290-85.
Following that, 1.1230 and the 1.1200 threshold may entertain EUR/USD traders before targeting the fresh low of the year, currently around 1.1185.
EUR/USD: Four-hour chart
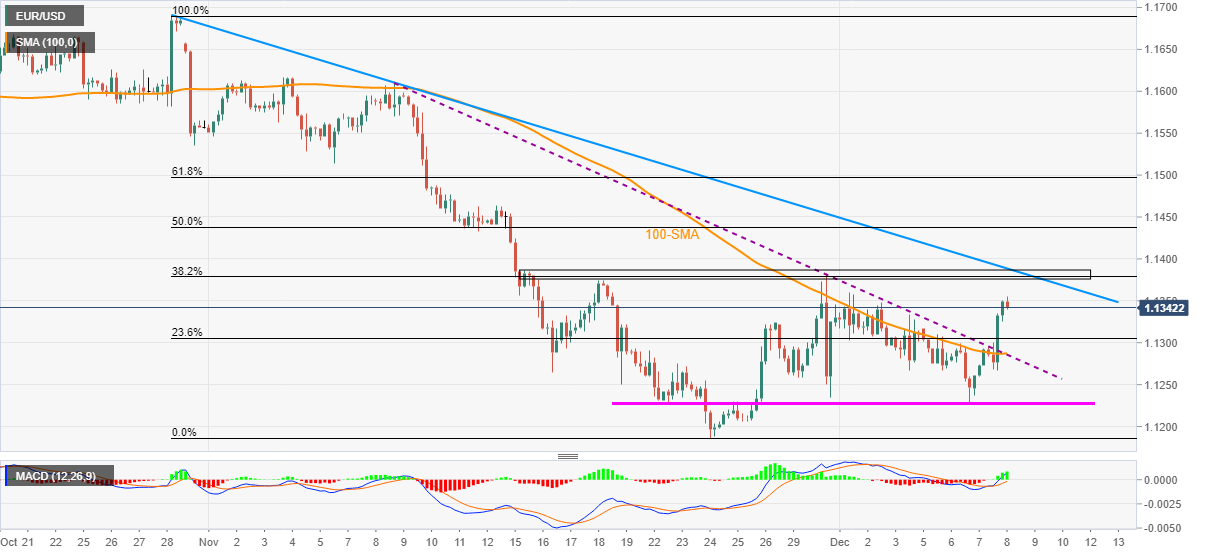
Trend: Further upside expected
- The NZD/JPY extends its three-day rally amid risk-on market sentiment.
- A seven-month-old downslope trendline around 77-30-50 would be difficult resistance for NZD bulls.
- NZD/JPY Price Forecast: It has an upward bias, though it needs a sustained break from a seven-month-old downslope resistance trendline.
As the Asian Pacific session begins, the NZD/JPY starts in the right foot up some 0.49%, trading at 77.40 during the day at the time of writing. The equity markets in New York ended in the green, reflecting the positive tone in the financial markets. Also, major Asian stock indices point towards a positive open, carrying on some of Wall Street’s sentiment.
On Wednesday, the NZD/JPY pair remained subdued throughout the Asian and the early European sessions, within the 76.70-77.20 range. However, as American traders got to their desks, the risk-sensitive New Zealand dollar rallied from 76.65 to 77.55.
NZD/JPY Price Forecast: Technical outlook
The NZD/JPY has an upward bias, though it faces strong resistance at a seven-month-old downslope trendline around 77-30-50, which would be a problematic resistance area to overcome. Despite the abovementioned, the “spark” for NZD bulls to break to the upside could be that the 50-hour simple moving average (SMA) is about to cross over the 200-hour SMA, forming a golden-cross, which in this case, would propel the New Zealand dollar upwards.
In that outcome, the NZD/JPY first resistance area would be the R1 daily pivot level at 77.70. A breach of the latter could send the pair towards the 200-day SMA, at 78.07, immediately followed by the 100-day SMA at 78.26.
On the other hand, failure to break the trendline would exert downward pressure on the NZD/JPY pair. The first support would be the central daily pivot at 77.20, followed by the confluence of the 50 and the 200-hour SMA’s around 77.00, which could be challenging support to break. Nevertheless, a break of the latter would expose the S1 daily pivot at 76.85.
-637746009277251954.png)
- AUD/USD grinds higher around two-week top, little changed on RBA Governor’s speech.
- RBA’s Lowe teases retail digital currency, review crypto-assets, stablecoins.
- Markets sentiment remains divided amid mixed concerns over Omicron, geopolitics and Beijing.
- China CPI, PPI can offer immediate direction, risk catalysts are the key.
AUD/USD bulls take a breather following a three-day uptrend to a fortnight top, taking rounds to 0.7170 during early Thursday morning in Asia. Mixed updates concerning Omicron troubled the pair traders but cautious optimism saved the bulls.
That said, the risk barometer pair paid a little heed to the latest comments from RBA Governor Philip Lowe but keeps the previous day’s break of the key technical levels, suggesting the further upside is on the table.
RBA’s Lowe justified the title of his speech, “Payments: The Future?,” as he spoke nothing of the economy nor the Aussie central bank’s next move at the latest. The policymaker said, “Both the regulators and the government understand this and are seeking to put in arrangements that encourage innovation and competition and make sure we have a secure and efficient system.” RBA’s Lowe adds, “There is no strong public policy case for an RBA-backed retail digital currency but a policy case could emerge quickly as technology, consumer preferences change.”
Earlier in the day news broke that Australia’s Deputy Prime Minister Barnaby Joyce tested positive for coronavirus while he was on a trip to the US.
The Aussie pair cheered US dollar weakness and firmer equities as early studies showed that the South African covid variant, dubbed as Omicron, is comparatively less harmful than the previous variants of the virus. Adding to the optimism were headlines from Pfizer signaling strong immunity for those who had taken three shots of the vaccines and previously tested positive to COVID-19.
However, re-introduction of the virus-led activity restrictions in Germany, France and the UK joined the tussles between the US and Russia, as well as the Sino-American tensions, to weigh on the risk appetite, which in turn probes AUD/USD bulls.
It’s worth noting that firmer readings of the US Job Openings and Labour Turnover Survey (JOLTS) renewed hopes of the faster Fed tapering ahead of Friday’s US Consumer Price Index (CPI) and underpinned the US Treasury yields.
Amid these plays, the Wall Street benchmarks posted mild gains while the US 10-year Treasury yields grew 4.8 basis points (bps) by the end of Wednesday’s North American session. Further, gold prices dropped after refreshing the weekly top.
Moving on, China’s CPI and Producer Price Index (PPI) details for November will be the key for AUD/USD traders, considering Sino-Aussie trade ties. Amid the mixed forecasts and the People’s Bank of China’s (PBOC) readiness to safeguard the economy from financial and covid-linked risks, the pair is more likely to react positively to the outcome, except for any strong negative surprises.
In addition to China data, risk catalysts and second-tier US jobs figures may entertain the AUD/USD traders.
Technical analysis
AUD/USD stays above a six-week-old previous resistance line and the 100-SMA, respectively near 0.7100 and 0.7165. However, the RSI line touches the overbought territory on four-hour (4H) play, suggesting a pullback. Should bulls keep reins, the 0.7200 round figure may offer an intermediate halt during the run-up to 50% Fibonacci retracement (Fibo.) level of October-December downside, around 0.7275.
- The USD/CHF edges down amid risk-on market mood, which usually favors the greenback.
- The US Dollar Index failed to reclaim the 96 figure, which sits at 95.94 as the New York session winds down.
- USD/CHF Price Forecast: The near-term is tilted to the downside, though a break under 0.9200 is needed.
- USD/CHF Price Analysis: Double-top chart pattern around 0.9260s looms
The USD/CHF slides as the New York session wanes, down some 0.43%, trading at 0.9206 during the day at the time of writing. The market sentiment is upbeat, as portrayed by US stock indices posting gains between 0.31% and 1.18%, as omicron worries abate. Pfizer and BioNTech SE said that early lab studies demonstrated that a third dose of the COVID-19 vaccines neutralizes the variant.
In the meantime, the US Dollar Index, which tracks the greenback’s performance against a basket of six rivals, declines sharply, down some 0.44%, sitting at 95.94, a headwind for the USD/CHF pair, which usually rises amid risk-on market conditions.
During the overnight session, the USD/CHF dropped from daily highs around 0.9250s, courtesy of a technical double-top chart pattern, down to 0.9194, the double’s top target. Then the USD/CHF reclaimed the 0.9200 figure on profit-taking.
USD/CHF Price Forecast: Technical outlook
The USD/CHF hourly chart shows the pair in the near-term has a downward bias, as Wednesday’s price action broke crucial support levels, like the hourly-simple moving averages (SMA’s), daily pivot points, and the December 2 cycle high resistance-turned-support at 0.2121.
At press time, the USD/CHF is exchanging hands below Wednesday’s S2 daily pivot around 0.9207.
In the outcome of extending the slide further down, the first support would be the daily low at 0.9194. The USD/CHF, the next stop on the way down, would be Wednesday’s S2 daily pivot at 0.9184, and then December 6 swing low at 0.9172.
On the other hand, a sustained break above 0.9207 would push the pair towards the 200-hour SMA at 0.9220, followed by the confluence of Wednesday’s S2 daily pivot and December 7 low around the 0.9225-30 range.
-637745984996728332.png)
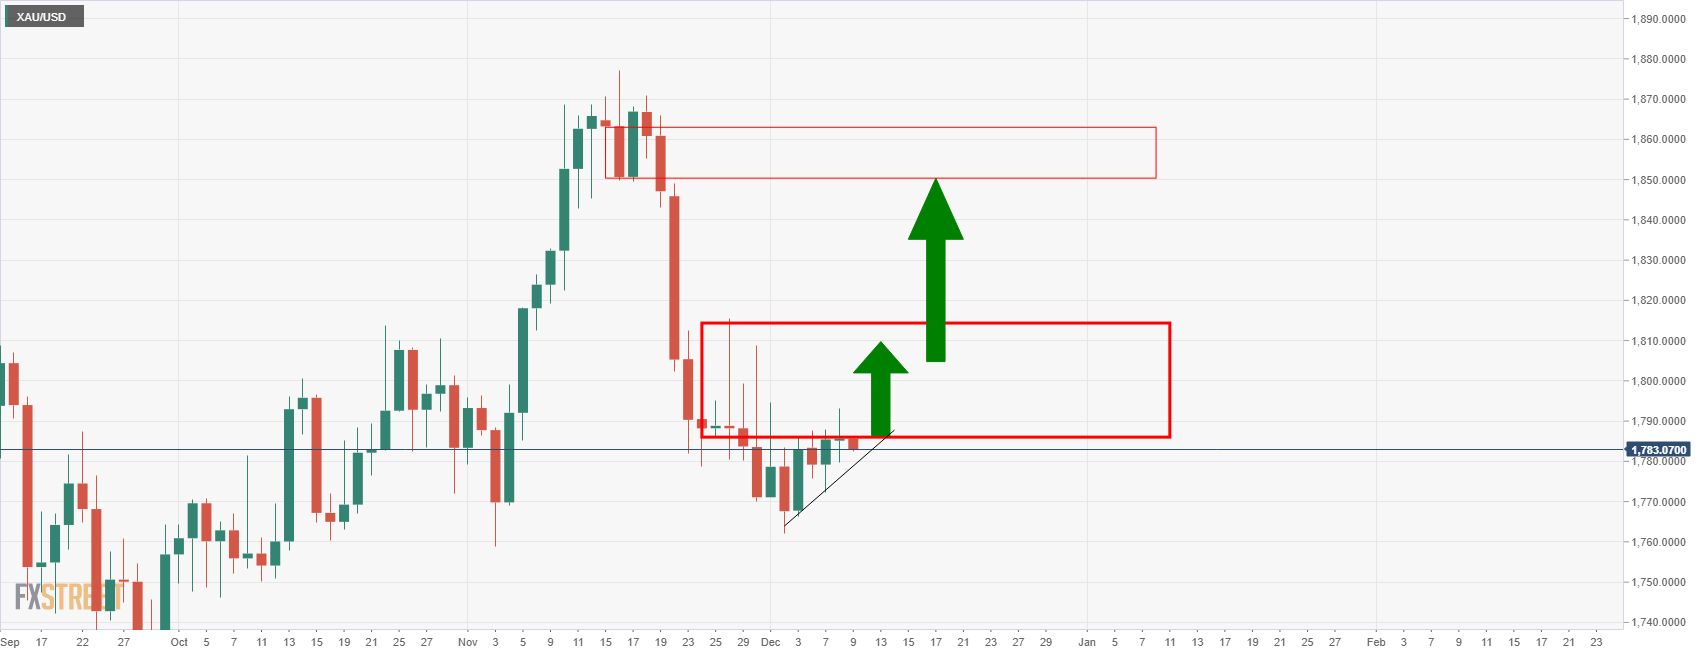
- Gold is flat and sideways in consolidating markets awaiting a catalyst.
- US CPI and central banks are in focus while the greenback disconnects with US yields.
Gold, XAU/USD, is consolidating in the $1,779 and $1,793 range with markets trying to assess the outlook with regards to inflation, central banks and the uncertainty surrounding the Covid-19 variant.
In the Federal Reserve's blackout period, gold prices were little changed on Wednesday while the US dollar slid and offset firmer US Treasury yields ahead of this week's US Consumer Price Index. Investors are likely squaring their positions in the run-up to the key data.
''We expect inflation to slow significantly as fiscal stimulus fades and supply constraints ease, but we don't expect the data to be validating in the near term,'' analysts at TD Securities said.
''The CPI likely surged in Nov, with a drop in oil coming too late to avert another large gain in gasoline and core prices boosted by rapidly rising used vehicle prices and post-Delta strengthening in airfares and lodging.''
The data will be important for traders as the monitor for an acceleration in the pace of tapering by the Federal Reserve, potentially to start as soon as this month.
Hawks may call for a March hike if US November inflation data comes in higher than expected on Friday. Clues as to the probability of a March hike will then be provided by the Fed next week (Dec. 15), when it is expected to announce an accelerated tapering of its bond purchases. Meanwhile, the benchmark US Treasury yields climbed, dimming gold's appeal with the narrative shifting back to central banks' tightening policy, which was likely to boost the US dollar.
''With inflation prints expected to remain elevated in the early months of the year, the market's pricing for Fed hikes could still become more aggressive, but we expect that it will ultimately prove to be far too hawkish,'' analysts at TD securities argued.
''In fact, with both an accelerated taper and more than three rate hikes already priced in for 2022, the balance of risks for gold positioning remains to the upside, as geopolitical risks and virus risk could catalyze a positioning reshuffling.''
Gold technical analysis
The price of gold is stuck in familiar territory and the monthly chart illustrates that space is running out for the bulls. A break of the symmetrical triangle opens the risk of a breakout to the downside which could be potentially significant if $1,700 gives out.
From a daily perspective, the price needs to break beyond the $1,810 level for space to $1,850.
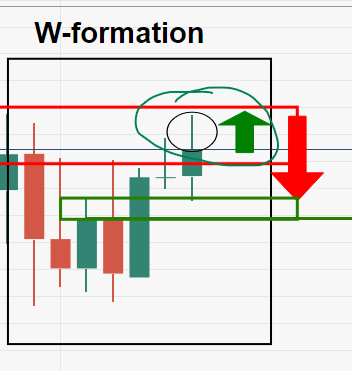
- AUD/JPY bulls could be tiring at this juncture.
- The bears are looking to the W-formation's neckline as a target for the days ahead.
AUD/JPY has performed well on the bid this week and there could be more to go. However, the W-formation on the daily chart is a compelling feature that could play out in a downside correction for the days ahead.
AUD/JPY daily chart
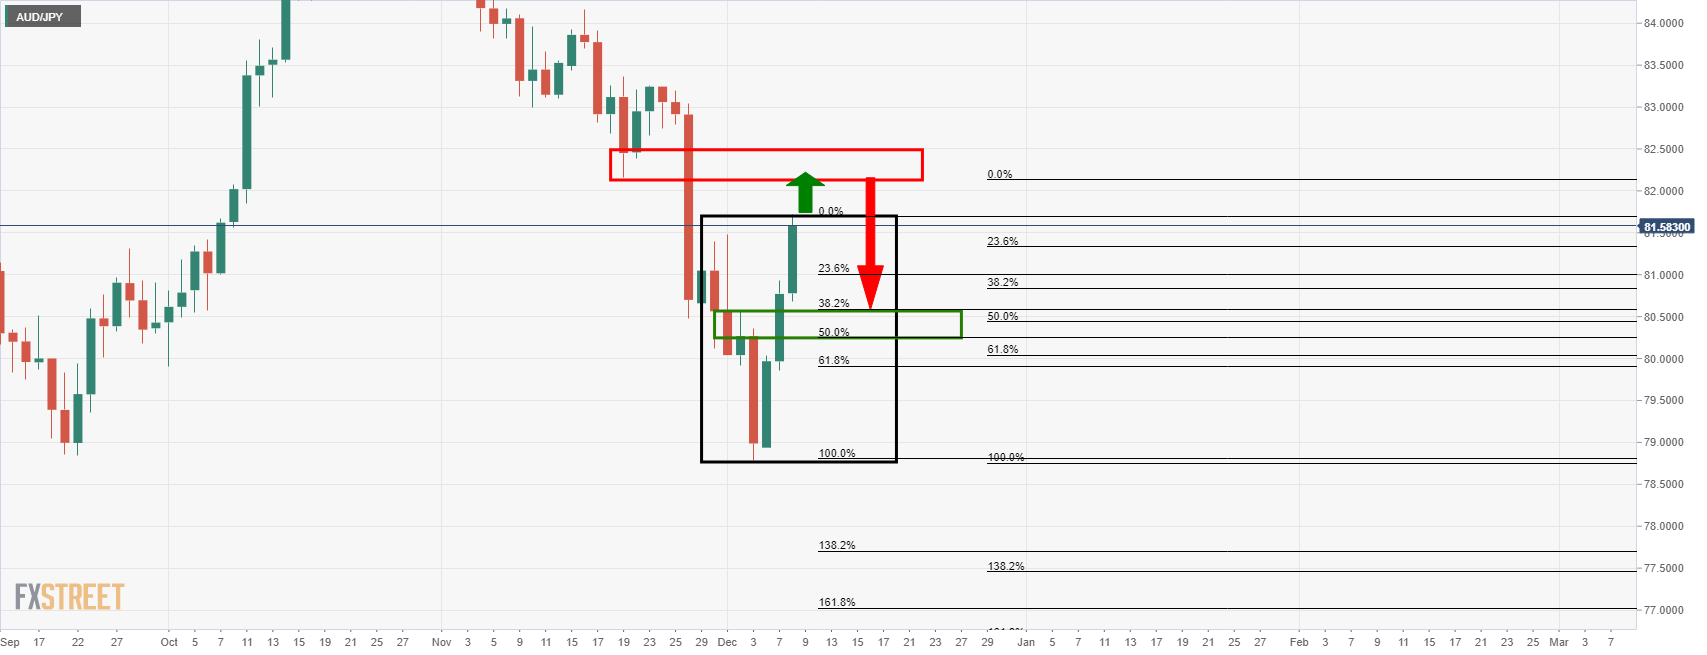
While there is room to go until the next presumed resistance area, around 82.1580, the price is leaving a W-formation. This is a reversion pattern that has a high completion rate in that the price would be expected to retreat in due course and restest the neckline of the W-pattern. This is between the wick of Dec 2 and the opening of the same candle 80.5630 and 80.2452.
AUD/JPY H1
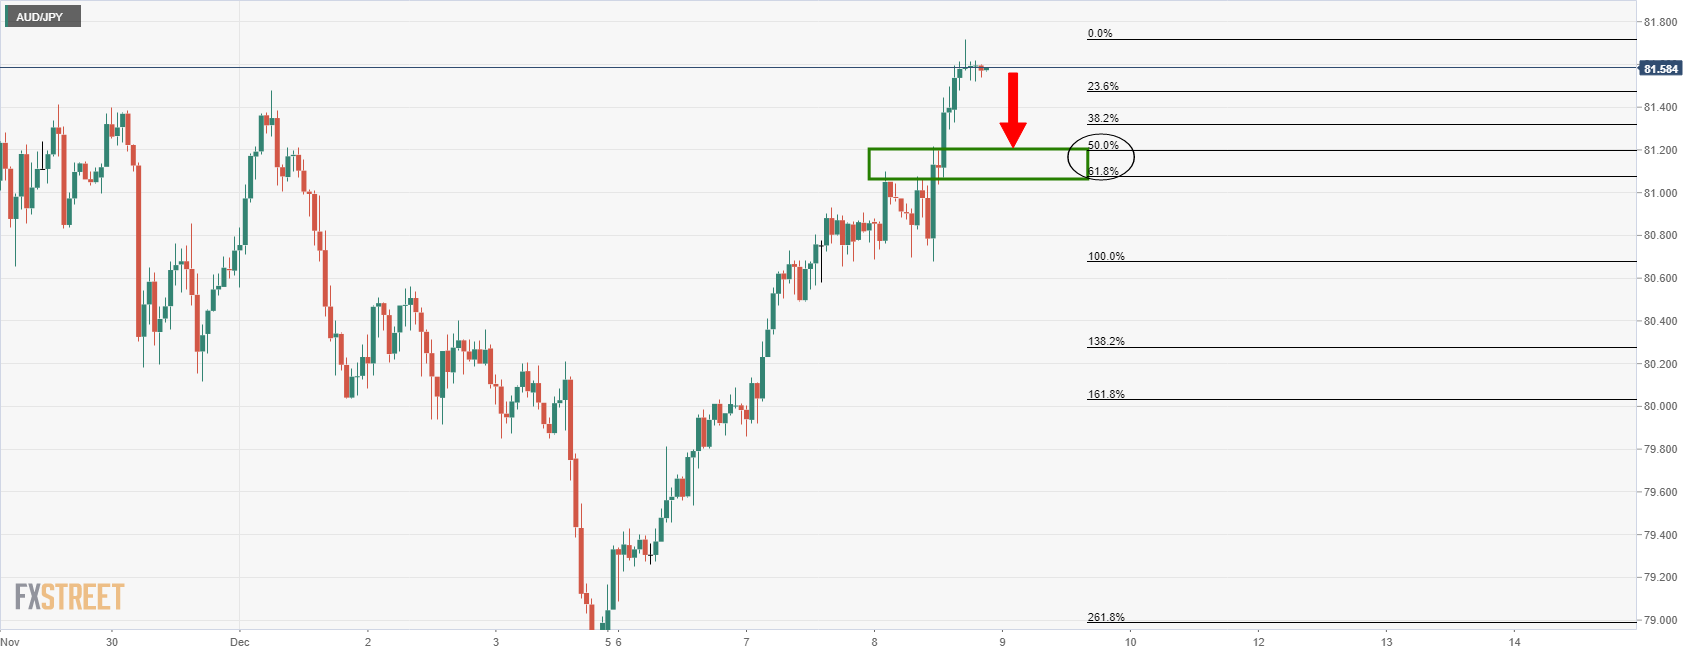
The hourly chart has a confluence between the old resistance structure and the 50% / 61.8% ratios on the downside. This would be expected to hold initial tests. However, a break there will open the prospects of a downside continuation to target the daily W-formation's neckline.
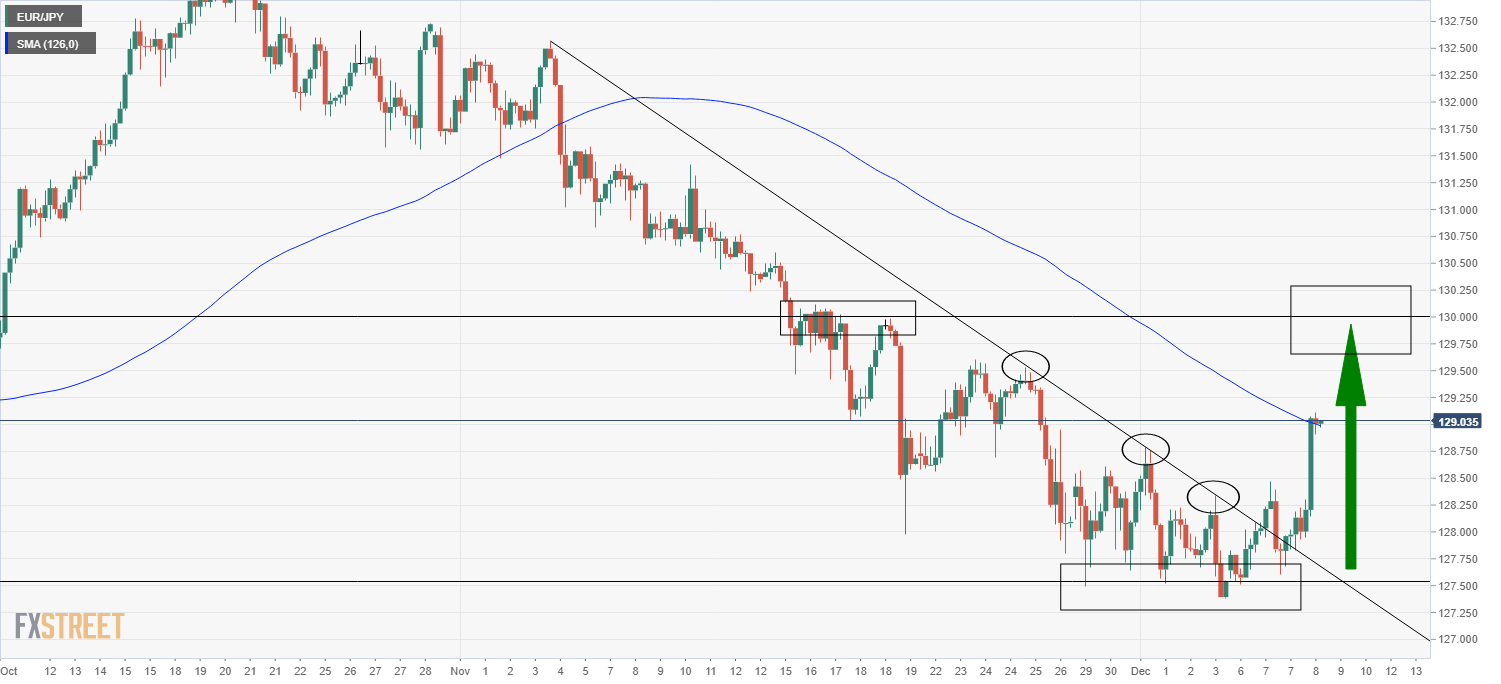
- EUR/JPY pushed higher on Wednesday, rallying from the low 128.00s to the 129.00 level, where it now tests its 21DMA.
- A break above the 129.00 area could see technical buying accelerate, pushing the pair on towards resistance around 130.00.
EUR/JPY lept higher on Wednesday and is now probing its 21-day moving average at around the 129.00 level. That means the pair is trading up nearly 0.9% on the day, which would mark its best performance going all the way back to September. Technical buying seemed to be the main factor boosting pair on Wednesday, with it having recently broken to the north of a key downtrend.
The break above the downwards trendline that had been suppressing the price action going all the way back to early November suggests a medium-term shift in EUR/JPY’s momentum. Should the pair manage to break above its 21DMA, that would suggest a move towards the next key area of resistance around 130.00 is on the cards. Conversely, failure to break above the 21DMA/129.00 area would suggest a move back towards recent lows around 127.50 likely, amid a lack of notable support to prevent such a drop.
Short-term momentum indicators suggest that the pair hasn’t quite yet passed into overbought territory. On the four-hour candlesticks, EUR/JPY’s 14-period Relative Strength Index has risen to around 67.0, just below the 70.0 level classically associated with conditions having become overbought. Perhaps the pair can continue to push higher and break above the current resistance, before then seeing some profit-taking.
- AUD/USD rose above a key area of resistance around 0.7170 to the 0.7180 area, up over 0.8% on the day.
- The pair has been supported by technical buying, favourable moves in commodities and recent hawkish RBA vibes.
- But short-term momentum indicators suggest the rally is getting a little overstretched.
AUD/USD has extended on its recent run of gains in recent trade, with the rally accelerating as the pair breached a key level of resistance around 0.7170. AUD/USD now trades close to the 0.7180 mark, up about 0.8% on the day, and extending its gains on the week to now more than 2.5%.
Recall that on Tuesday the pair broke to the north of a long-term descending trend channel that had been suppressing the price action going all the way back to early November. Well, Wednesday has seen an apparent extension of the technical buying, though the bulls are yet to push Aussie back to within reach of its 21-day moving average, which currently resides just above 0.7200.It may be a struggle for the Aussie to continue its sharp rally into the end of the week. On the four-hour candlesticks, AUD/USD’s 14-period Relative Strength Index has rapidly reversed from under 30 (oversold) as recently as last Friday to now above 70 (overbought). This may be taken as a profit-taking signal that slows the current rally.
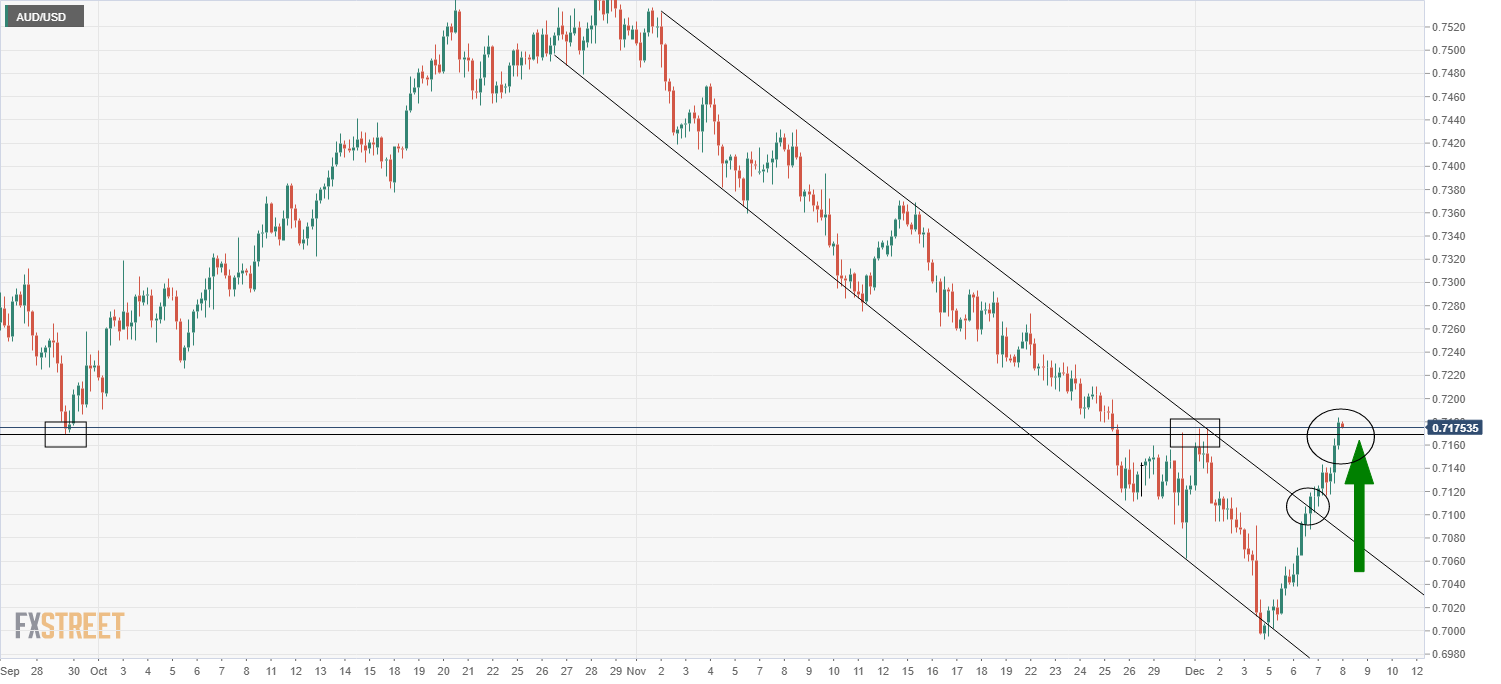
Bullish fundamentals also helping
Commodity prices remain buoyant, with oil and copper prices up more than 1.0% on the spot market, boosted following this week’s strong China import figures and amid efforts by the PBoC to further ease financial conditions. This has continued to provide tailwinds for the Aussie, while Tuesday’s RBA meeting is likely adding to the bullish mix.
The meeting was interpreted hawkishly many analysts; according to JPM, “the commentary supports a significant drop in purchases in February, by emphasising the weight of actions already taken, and linking the path to other central banks also hastily moving toward the exit”. “The language suggests a sudden end to QE (quantitative easing) in February remains possible, but still not base case since it is probably preferable to finish a little after the Fed” the bank added. Ahead, AUD traders will be focused on monetary policy remarks from RBA Governor Philip Lowe during the coming Asia Pacific session.
What you need to know on Thursday, December 9:
The dollar found some temporal strength during London trading hours but finished the day down against most major rivals. The greenback fell despite European and American indexes closed mostly in the red, and while government bond yields extended gains to fresh weekly highs. Some profit-taking and the notion that the Fed may speed up tapering may have been behind the market’s behaviour.
Trading has been choppy throughout the day, as investors struggle to digest coronavirus developments. France, the UK and Germany had announced restrictive measures amid an escalation of contagions in Europe. On the other hand, Pfizer said that a booster jab of its coronavirus vaccine is effective against the Omicron variant. Early studies suggest that those that got covid plus two shots or those getting the third those are highly protected against the heavily mutated strain.
The EUR/USD pair recovered up to the 1.1350 region, while the AUD/USD pair nears 0.7200, despite scarce macroeconomic calendars.
Plan B: the UK Prime Minister announced what he called “plan B” to contain the latest coronavirus outbreak. Boris Johnson noted that the number of new cases are doubling every 2-3 days, and announced some restrictive measures. From Friday 10 December, face coverings will become compulsory in most public indoor venues, while from Monday 13 December, those who can will be advised to work from home.
Finally, and subject to parliamentary approval, an NHS Covid Pass will become mandatory to enter any crowd gathering. GBP/USD plummeted to a fresh 2021 low of 1.3244 ahead of the event, although, given the broad dollar’s weakness, the pair finished the day around 1.3230.
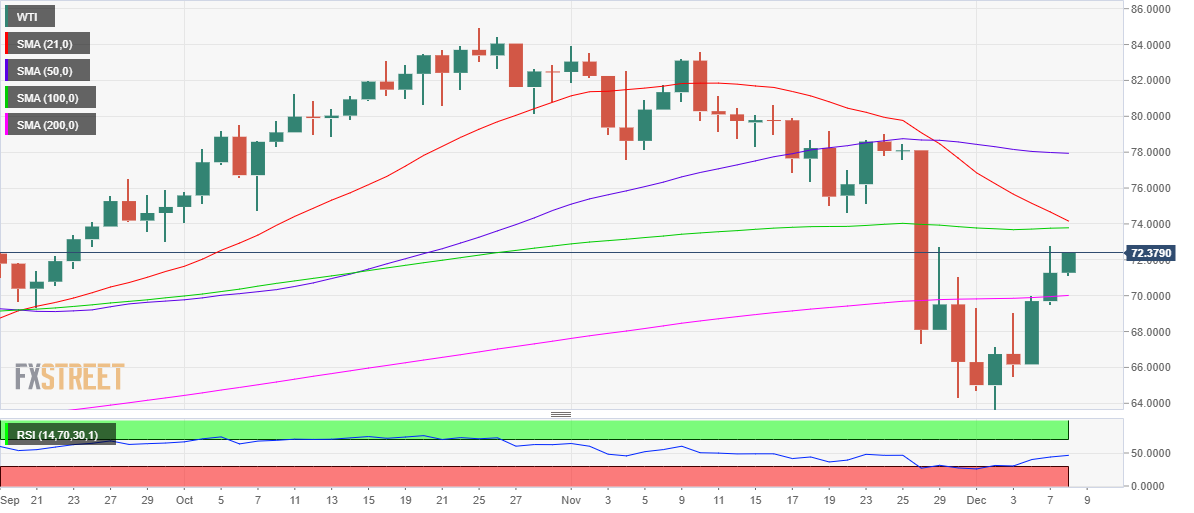
Gold keeps ranging within familiar levels, now trading around $1,786.00 a troy ounce. Rude oil prices ticked marginally higher, with WTI now at $72.40 a barrel.
Bitcoin needs support to hold, so that bulls can reclaim $50,000
Like this article? Help us with some feedback by answering this survey:
- NZD/USD bulls monitoring for a bullish trigger to target 0.69 the figure.
- All eyes are turning towards the central banks and critical US data on Friday.
NZD/USD is trading bid on the day and has rallied over 0.4% in the wake of renewed weakness in the US dollar. At the time of writing, NZD/USD is trading around 0.6813 and close to the session's high of 0.6818.
The pair rallied from a low of 0.6766. However, the bulls could be looking to take profit ahead of the close on the approach to the 0.6820 level. This could equate to a meanwhile correction ahead of the day's close, as illustrated below.
''Volatility remains elevated as the drip of news around Omicron continues,'' analysts at ANZ Bank explained. ''It’s too soon to be definitive around the impact of the variant, and this will make for choppy trading conditions for some time yet.''
US CPI eyed
Meanwhile, the central banks are coming back into focus as traders get set for the US Consumer Price Index this Friday. ''We expect inflation to slow significantly as fiscal stimulus fades and supply constraints ease, but we don't expect the data to be validating in the near term,'' analysts at TD Securities said.
''The CPI likely surged in Nov, with a drop in oil coming too late to avert another large gain in gasoline and core prices boosted by rapidly rising used vehicle prices and post-Delta strengthening in airfares and lodging.''
The data will be important for traders as the monitor for an acceleration in the pace of tapering by the Federal Reserve, potentially to start as soon as this month. This is almost being treated as a foregone conclusion, analysts at ANZ Bank explained.
''But a strong CPI number could ramp up expectations of a hike in Q2 next year. The Kiwi may soften on this, given the NZD rates curve may struggle to price in more, while other markets could move up in sync with Fed pricing.''
NZD/USD technical analysis
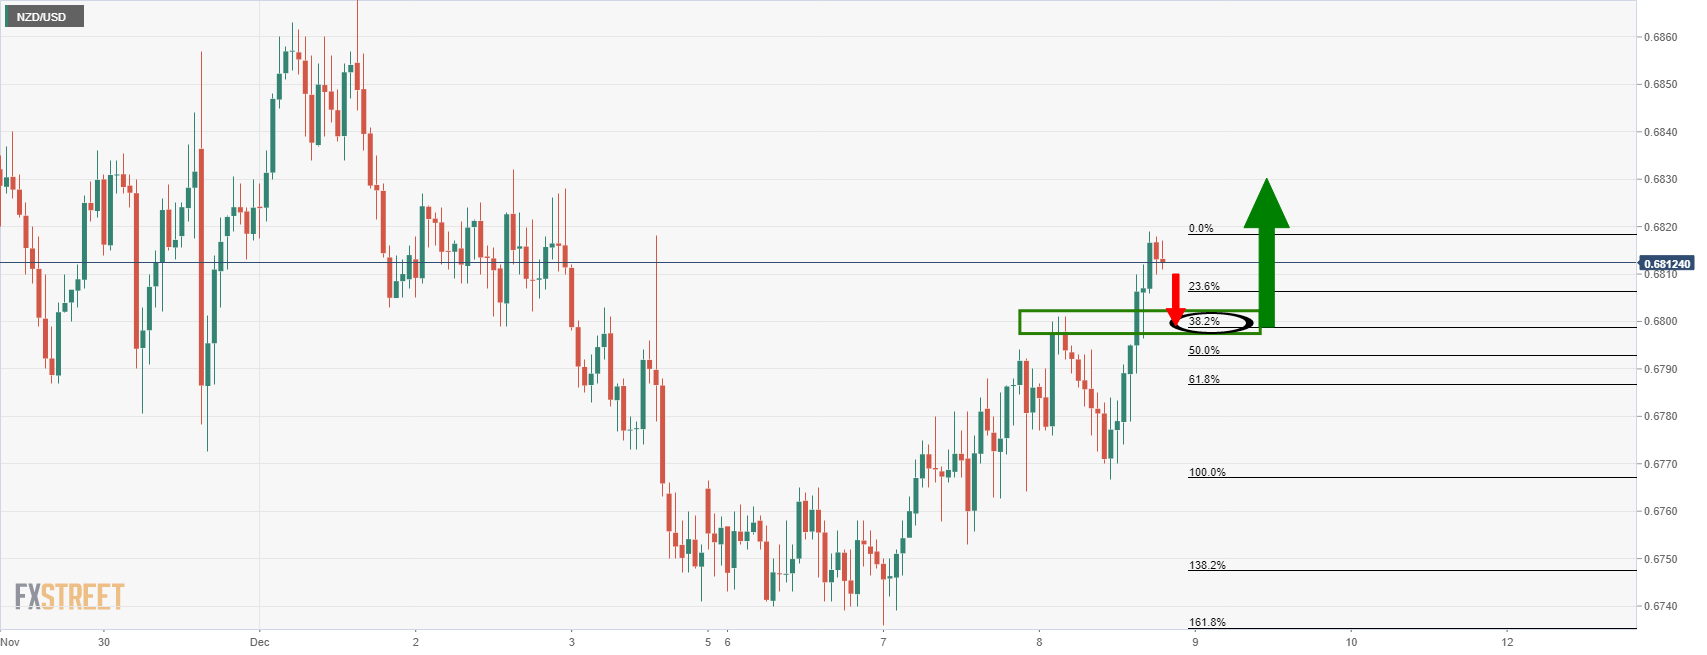
The price has rallied just shy of its daily ATR of around 60 pips within the day's range of 52 pips. This leaves the bias to the downside for a correction towards the old highs that meet the 50% retracement level near 0.68 the figure.
Should this area of support hold and lead to a subsequent drift higher, the bulls could well be encouraged to add or join the northerly trajectory for a higher high in the forthcoming sessions.
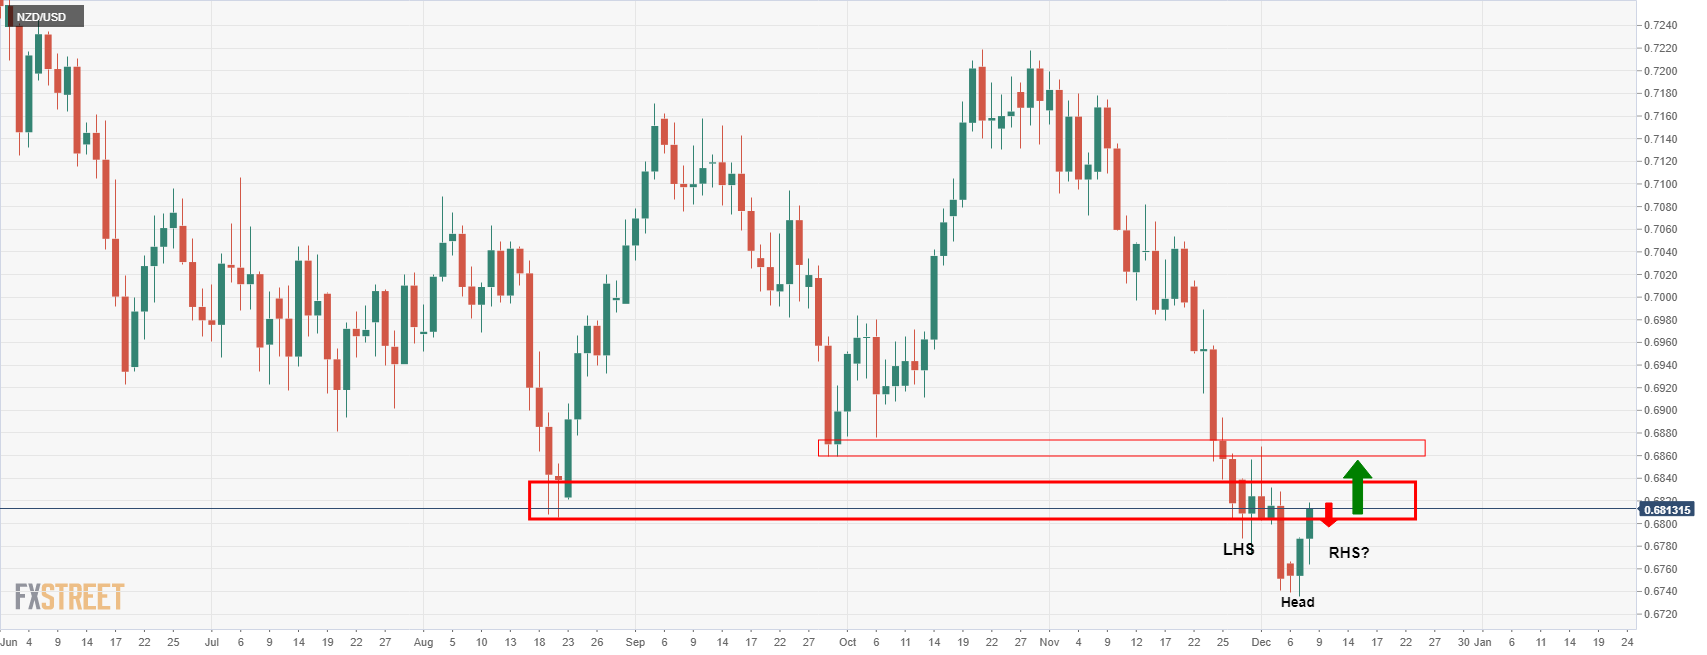
From the daily chart's perspective, the price is meeting some resistance. This could lead to a bullish inverse head and shoulders should the vicinity of the 0.68 figure, (or as low as the 0.6770s) hold on a retest. In doing so, the bulls would be looking to test the late Sep lows of 0.6859/00 on a bullish breakout.
- Silver edges lower during the session, down some 0.22%.
- The market sentiment is mixed, despite good news on the omicron variants and the effectiveness of the vaccines.
- XAG/USD Price Forecast: Range-bound amid the lack of a catalyst.
Silver (XAG/USD) is barely down during the New York session, trading at $22.46 at the time of writing. The market sentiment is mixed, with European equities fishing the day with losses, whereas US equities are rising, except for the Dow Jones Industrial, losing 0.13%. Upbeat news regarding vaccine effectiveness against the omicron variant improved market sentiment. Early lab studies made by two of the most successful COVID-19 vaccines showed that a third shot neutralizes the omicron variant.
In the overnight session, XAG/USD price action remained subdued, within the $22.29-55 range, but lack of a catalyst might keep the non-yielding metal fluctuating around the hourly 50 and 100-simple moving averages.
In the meantime, the 10-year US Treasury yield advances two and a half basis points, sitting at 1.50%, failing to drag the greenback, with the US Dollar Index back below the 96 handle, down 0.50%, at 95.89.
In the last week, Federal Reserve policymakers led by US central bank Chair Jerome Powell expressed the need for a faster Quantitative Easing reduction so that the Fed could have enough room to maneuver. Further, Chair Powell said that inflation is no longer “transitory,” which investors perceived as hawkish rhetoric.
That said, XAG/USD traders have their eyes on Friday, when the Consumer Price Index (CPI) for November will cross the wires. The CPI is, expected at 6.8% on an annual basis, while the monthly headline is estimated at 0.7%.
XAG/USD Price Forecast: Technical outlook
Silver (XAG/USD) in the 1-hour chart depicts a range-bound trading environment, even though the 1-hour 50 and 100-simple moving averages (SMA’s) reside below the spot price. Additionally, the $22.45 price level is a strong resistance that the non-yielding metal cannot overcome, which could open the way for further losses.
Failure a the abovementioned level would open the way for further losses. The first support would be the confluence of the 50 and the 100-hour SMA’s, around $22.39-40. A break of that area would exert downward pressure on the white metal, exposing the S1 daily pivot point at $22.25, followed by the December 7 low at $22.21, and then the S2 daily pivot point at $22.05.
On the flip side, In the outcome of breaking to the upside, the first resistance would be the December 7 cycle high at $22.58. The breach of the latter could send silver advancing sharply towards $22.80, immediately followed by $23.00.
-637745906200147592.png)
- USD/JPY bulls moving in and eye a restest towards 115.20.
- On the downside, 112.50 is an important level worth noting.
USD/JPY has corrected to into hourly support which gives rise to bullish prospects for the sessions ahead. The following illustrates, in a top-down analysis, the potential for a restest of the 114 area towards 115.20.
USD/JPY weekly chart
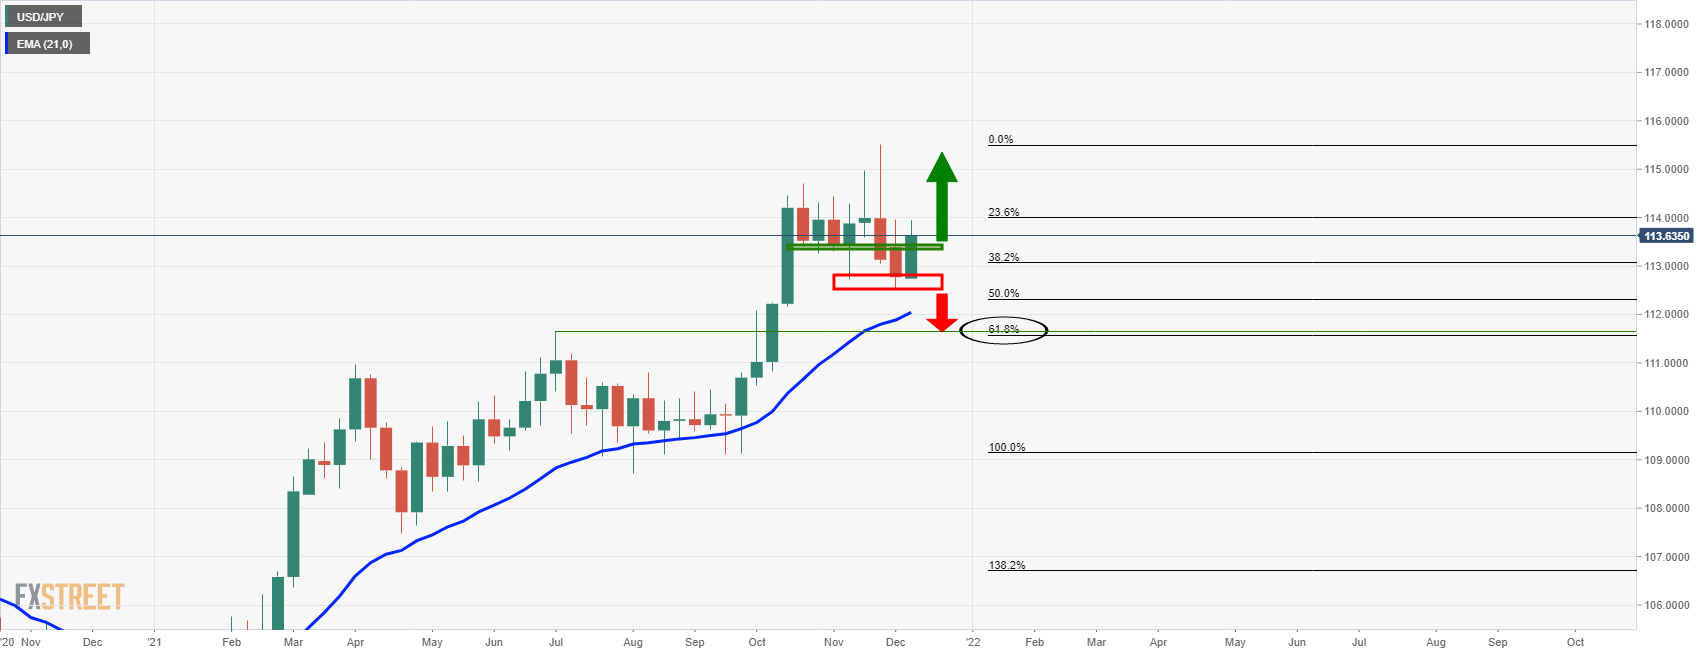
As per the weekly chart, the price has cleared last week's opening level and the prior week's support. This has given the bulls the edge and an upside continuation could be expected for the forthcoming days. A bullish close for the week will underpin the bullish bias.
With that being said, a break of the lows, near 112.50, will likely give rise to a downside continuation. This will bring in the July highs near 111.65 that have a confluence with the 61.8% Fibonacci retracement of the bullish weekly impulse and the 21-EMA.
USD/JPY daily chart
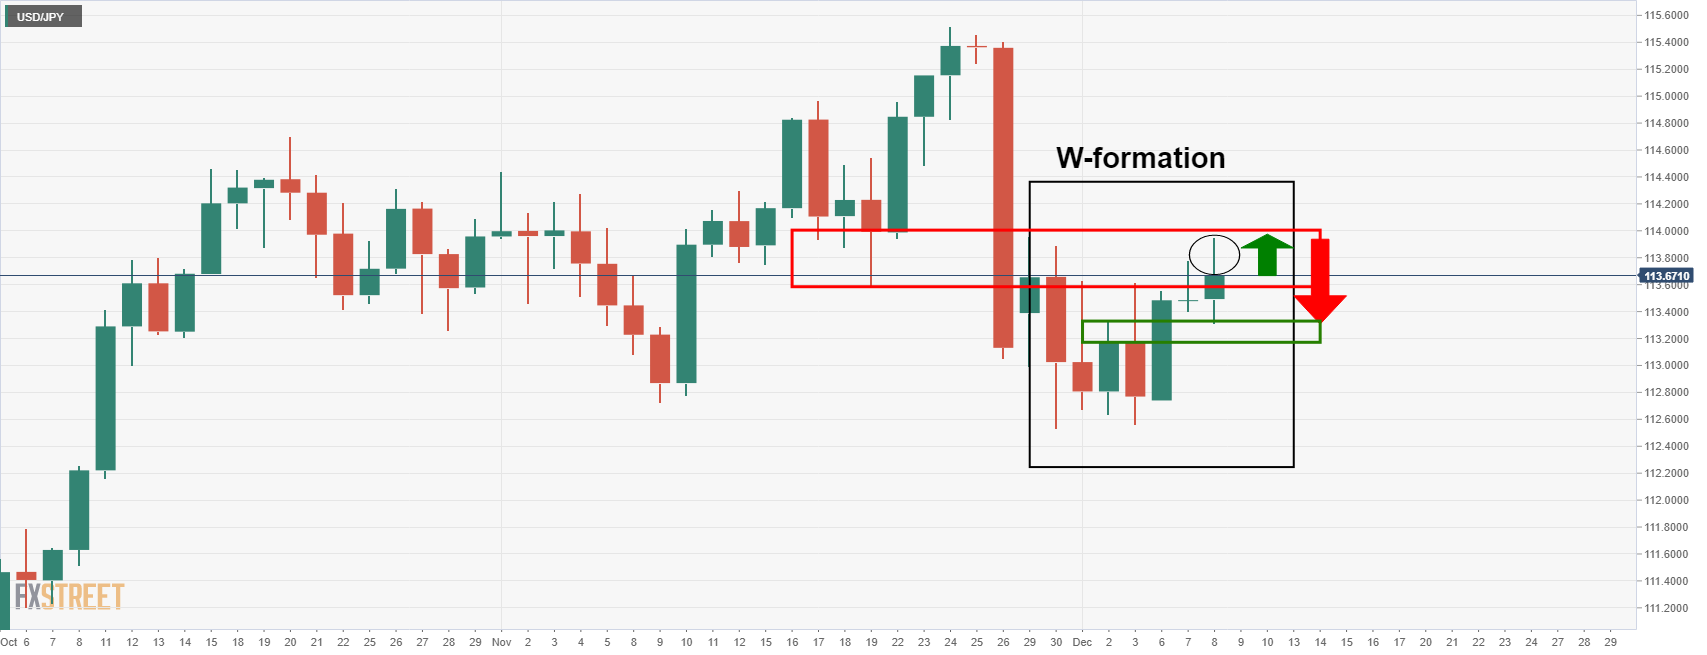
The daily chart is showing that the price has formed a W-formation, more easily visualized on a line chart, as follows:
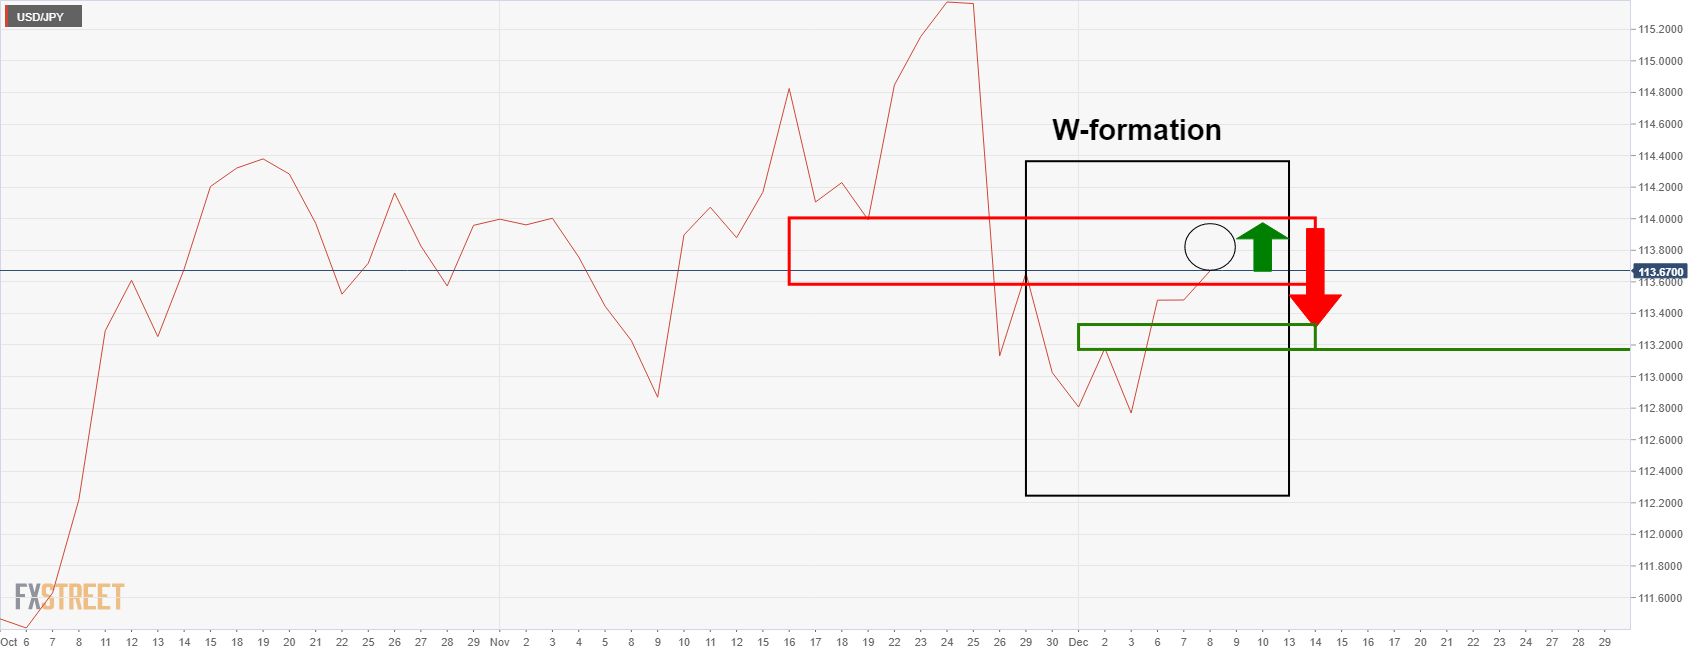
The W-formation is a reversion bearish pattern, and the price would be expected to retest the neckline of the W which comes in near 113.20/35 (including the Dec 2 wick) in this specific case.
However, there is potential for the wick of today's business and candle to be filled on the lower time frames as the eclipse in the above images show:
This gives rise to the potential for a restest of the resistance in the forthcoming sessions as follows:
USD/JPY H1 chart
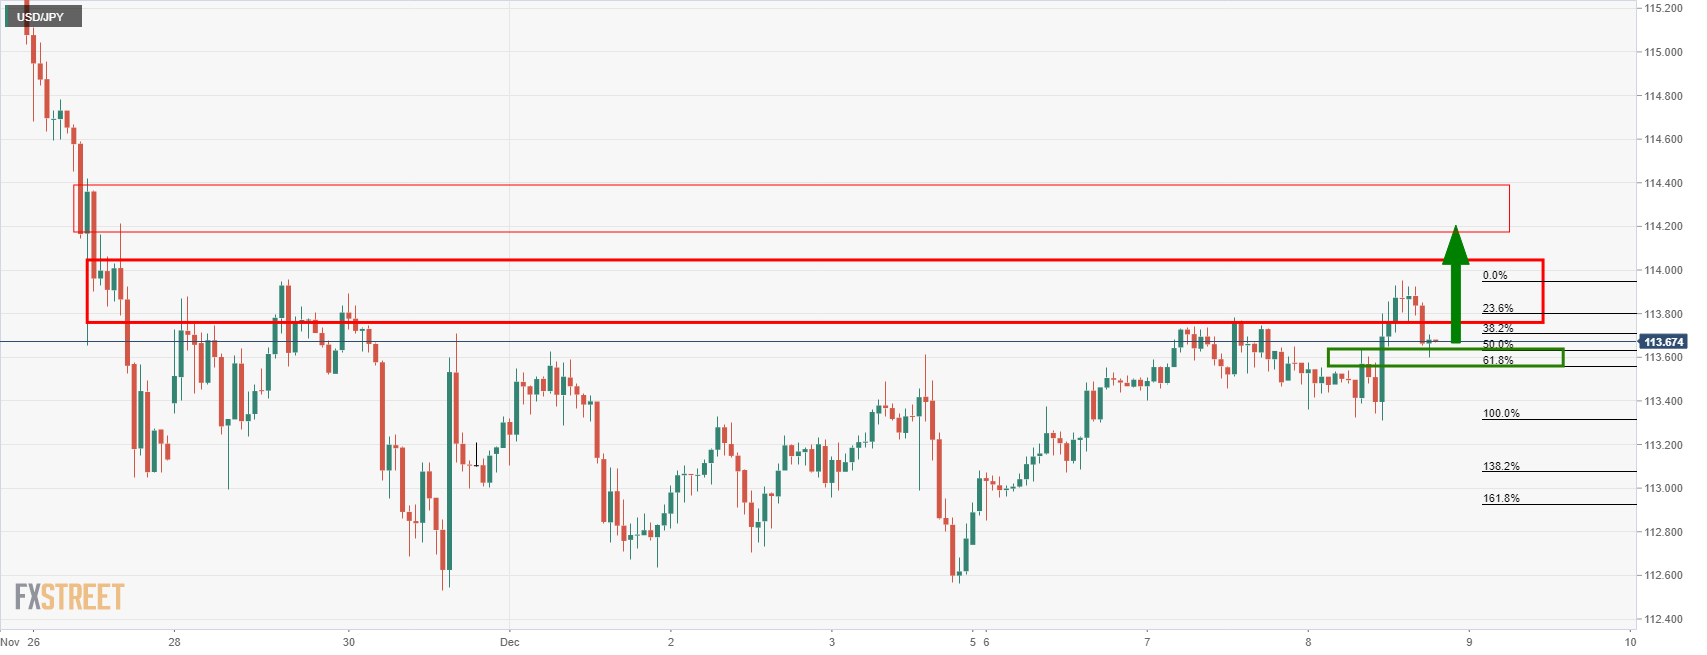
The latest hourly bearish candle, however, was a strong move and close, so the bulls would be prudent to wait on the sidelines to see how the price action develops over the coming hours. If the price recovers significantly, the imbalance on the daily chart's prior sell-off is with noting for upside potential to clear through low supply area between 114 and 115.20.
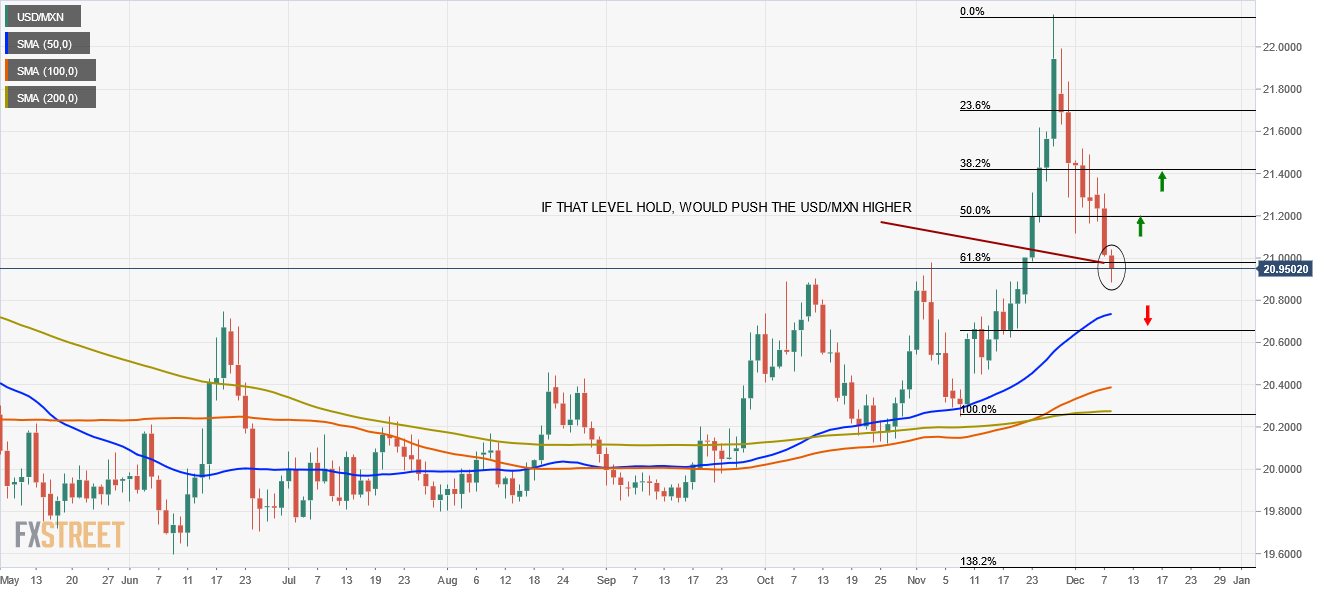
- The USD/MXN extends weekly fall, down for the third consecutive day.
- A mixed-market sentiment favors risk-sensitive currencies like the Mexican Peso to the detriment of the US dollar.
- USD/MXN Price Forecast Has an upward bias unless MXN bulls hold the exchange rate under 21.00.
The USD/MXN is falling during the New York session, down some 0.47%, trading at 20.95 at the time of writing. The market sentiment is mixed, as European equity indices ended the day in the red, while US equities are rising across the pond, except for the Dow Jones, which is down 0.15%.
In the overnight session, upbeat news regarding vaccine effectiveness against the omicron variant improved market sentiment. Early lab studies made by two of the most successful COVID-19 vaccines showed that a third shot neutralizes the omicron variant. That enhanced risk appetite toward riskier assets, favoring risk-sensitive currencies like the Mexican Peso, rising almost half-percent against the greenback.
That said, the Mexican Peso remained subdued in the overnight session, seesawing around 21.00, though, at the overlap of the European and the American session, the Mexican Peso strengthened, dipping to a fresh weekly low at 20.8840. In the meantime, the US Dollar Index, which tracks the greenback’s performance against a basket of its rivals, slides almost 0.50%, sitting at 95.88, a headwind for the USD/MXN pair.
An absent Mexican and US economic docket would leave USD/MXN traders leaning to market sentiment dynamics and the US Consumer Price Index for November, to be released on Friday.
USD/MXN Price Forecast: Technical outlook
The USD/MXN daily chart shows that the pair has an upward bias, as demonstrated by the daily moving averages (DMA’s), which reside well above the spot price with a slight horizontal slope. The pair bounced at the October 12 high previous resistance-turned-support level at 20.9002, some 400 pips away from the 61.8% Fibo retracement. However, USD bulls would need a daily close above 21.00 to resume the uptrend.
In that outcome, the first resistance would be the 50% Fibo retracement at 21.2006. A clear break of the latter would expose the 38.2% Fibo retracement at 21.4252, followed by a weekly high at 21,6338.
On the other hand, if the USD/MXN posts a daily close below the 61.8% Fibo retracement, that would open the door for further losses. The first support would be the 50-DMA at 20.7256, followed by the 78.6% Fibo retracement at 20.6564.
As expected, UK PM Boris Johnson announced that the UK will move to Covid-19 "plan B". Guidance to work from home has thus been reintroduced, face mask requirements will now be expanded to most public venues and the NHS will make the NHS Covid Pass mandatory for entry into nightclubs, venues and places with large crowds.
Businesses will have one week's notice to adhere to the NHS Covid Pass requirements. If it becomes clear that the booster shots are capable of holding the Omicron variant at bay, Johnson added, then we will be able to move forward as before.
As the WHO warns Europe once again at the epicentre of the pandemic, the UK's prime minister, Boris Johnson will address the united kingdom in a press conference that is scheduled to start anytime now.
The spread of the more infectious Delta variant, an increase in communal activity, a return to the workplace and now the new Omicron variant has resulted in a sharp increase in the disease.
The WHO's technical lead on Covid-19, Maria Van Kerkhove, said over the past four weeks cases across Europe had soared over 55%, despite an "ample supply of vaccines and tools", and colleague Dr Mike Ryan said Europe's experience was a "warning shot for the world".
It came as Germany recorded more than 37,000 daily Covid cases on Friday, a record high for the second day running. The incidence rate per 100,000 people is now higher than it was in April, at 169,9, but well below the level in the UK.
Public health officials are worried that the fourth wave of infection could lead to a large number of deaths and pressure on the European health system.
Those who have not been vaccinated are seen at particular risk.
The UK is ramping up its Covid vaccine booster campaign - part of an attempt to reduce the impact of the new Omicron variant, currently spreading across a number of countries.
Almost 20 million boosters or third doses have been given so far.
Watch Live: Downing Street Covid-19 Omicron Update
Speakers: - Prime Minister Boris Johnson - Sir Patrick Vallance, Chief Scientific Officer - Prof Chris Whitty, Chief Medical Officer, England
Market implications
The pound is attempting to correct the dominant downtrend vs the greenback on Wednesday. However, the market would be expected to flip if the outcome of the address to the nation will require social distancing restrictions, for say, for the unvaccinated, partially vaccinated or even all members of the population.
- Technical buying has buyed EUR/USD on Wednesday, sending it back towards 1.1350.
- EUR/Usd has run into strong resistance, however, in the form of a key long-term downtrend.
EUR/USD was boosted primarily by technical buying on Wednesday, as the pair broke above a week-long downtrend to pop above the 1.1300 level again, surpass its 21-day moving average at 1.1327 before stabilising around 1.1350. At current levels, the pair is up an impressive 0.75% on the day.
Risk appetite was a little weaker on the session, with US and European equities slipping amid mixed headlines about the efficacy of existing vaccines versus the new, fast spreading Omicron variant of Covid-19. This weighed ever so slightly on USD Short-Term Interest Rate (STIR) market pricing of Fed rate hikes in 2022 (the implied yield on the December 2022 three-month eurodollar future fell about 2bps but remained close to recent highs). This seems to be weighing a tad on the buck, aiding EUR/USD.
EUR/USD has now run into resistance in the form of a descending trend line that had acted as support for EUR/USD throughout the summer months and into October. The pair broke below this trendline in November and it now appears to be acting as resistance in the 1.1350 area. A break above this trendline would likely see EUR/USD extend its gains towards last week’s highs in the 1.13828 area.
Elevated volatility expected
FX market volatility has been elevated in recent weeks amid heightened uncertainty regarding Omicron. As more and more reports emerged of its apparent mildness, the rally in equity markets this week may have some thinking that “concerns about Omicron are now over”. But it remains to early to say whether this is the case. Even if the infection is mild, if enough people are infected at the same time, only a small hospitailisation percentage would be enough to overwhelm healthcare systems in some countries. That means lockdown risk remains on the table, as was seen on Wednesday with the UK.
That means FX market volatility may remain elevated in the next few days and EUR/USD could continue to see unusually high levels of choppiness, even if it would normally be expected for FX markets to be more rangebound ahead of key US inflation data. The fact that the Fed, BoE and ECB all decide on policy next week is another reason why FX market volatility is likely to remain high in the coming weeks. The Deutsche Bank Currency Volatility Index remains above 7.0, well above its 5.7-6.5ish range throughout Q2 and Q3 this year, though it has pulled back a tad from recent highs at 7.40.
- The British pound moderately edges down, some 0.08% amid a risk-on market sentiment.
- In the overnight session, the GBP/USD pair fell to a new year-to-date low at 1.3160 amid imposing COVID-19 restrictions in the UK.
- GBP/USD Price Forecast: Has a downward bias, but a break of 1.3256 might add upward pressure on the pair.
The British pound recovers from year-to-date lows around 1.3160, trading at 1.3233 during the New York session at the time of writing. At press time, the market sentiment is upbeat, as positive news from the overnight session concerning the vaccine effectiveness against the newly discovered omicron strain shows that a third shot neutralizes the omicron variant, per reported by lab studies made by two COVID-19 vaccines makers.
In the overnight session, the GBP/USD dipped as low as 1.3160, as reports about the imposition of fresh COVID-19 measures in the UK could be effective as soon as tomorrow. That, alongside no advancement in Brexit negotiations, has put a lid on the pair amid a scale back by money market futures, which now expect that the Bank of England (BoE) would maintain rates unchanged, amid dovish expressions by “hawkish” BoE Saunders, on December 3. Saunders said there “could be particular advantages in waiting and seeing more evidence” of the COVID-19 omicron impact.
An absent economic docket from the UK and the US would leave GBP/USD traders leaning in market sentiment and the US Consumer Price Index for November to be featured on Friday of this week.
GBP/USD Price Forecast: Technical outlook
The 1-hour chart depicts that the GBP/USD keeps headed south, as the hourly simple moving averages (SMA’s) remain above the spot price. The dip to a new year-to-date low coincided with a fall in the Relative Strength Index (RSI) down to 26, within oversold conditions, which propelled a bounce that pierced December 7 low at 1.3209, though stalled 15-pips below the central daily pivot point, which lies at 1.3246.
However, GBP bulls would need to reclaim at least the 100-hour SMA at 1.3256, which, once achieved, would expose crucial resistance areas to the upside. The first resistance would be the confluence of the 200-hour SMA and the R1 daily pivot around 1.3284, followed by the figure at 1.3300
On the flip side, the first line of defense for pound bulls would be the December 7 cycle low at 1.3209. A breach of the latter could send the pair tumbling towards the confluence of the S2 daily pivot and the new YTD low at 1.3160, followed by the S3 daily pivot at 1.3124.
- US equity markets are choppier on Wednesday amid more mixed headlines regarding Omicron/lockdowns.
- The S&P 500 ran into resistance at 4700 and has dropped back in the 4680s as a result.
- All three major US bourses still trade with substantial on-the-week gains, however.
US equity markets have been indecisive thus far during Wednesday’s session, with the S&P 500 index currently trading about 0.1% lower in the 4680s having earlier found resistance ahead of the 4700 mark. The Nasdaq 100 and Dow indices were down 0.4% each. That still leaves all three of the major US indices higher on the week by more than 3.0%. The VIX was down by about 0.30 points to close to 21.50 and continues to edge lower towards pre-Omicron levels around 20.0.
Driving the day
This week’s equity rally stalled on Wednesday as markets digested conflicting headlines regarding the effectiveness of major vaccines versus the Omicron Covid-19 variant, as well news that the UK is set to reimpose some lockdown restrictions to tackle the fast-spreading variant, triggering fears parts of the US might follow suit.
Starting with the former, late on Tuesday, a study was released by scientists in South Africa showing that two doses of the Pfizer/BioNTech vaccine was only partially able to neutralise Omicron. However, Pfizer and BioNTech released a separate study this morning which essentially suggested that a third booster dose would restore vaccine efficacy back in line with the efficacy that two doses had against prior Covid-19 strains.
Meanwhile, the FT reported on Wednesday that UK PM Johnson is on the verge of announcing the implementation of “Plan B” Covid-19 restrictions. This could include the requirement of vaccine passports for access to large venues, as well as a recommendation to work from home, all in an attempt to slow the spread of the Omicron Covid-19 variant.
Turkish President Recep Erdogan said on Wednesday that volatility in markets will stop eventually. Moreover, Erdogan said that the price hikes stemming from rising energy costs would soon stabilise and asked Turks to be patient and trust the government over the new economic model. The current price hikes in Turkey, he added, are being caused by greed and higher import prices.
Market Reaction
The lira has not reacted to the latest batch of comments from Turkish President Erdogan, where he reiterated his support for his unorthodox monetary policy where he pressures the CBRT into rate cuts.
- The USD/CAD trims some of Tuesday’s losses up some 0.05%.
- The BoC kept its cash rate unchanged at 0.25%, as expected by investors.
- USD/CAD Price Forecast: Tilted to the downside, but risks to the upside remain.
The USD/CAD is modestly down during the New York session, trading at 1.2654 at the time of writing, after the Bank of Canada (BoC) maintained the Bank Rate unchanged at 0.25%, as market participants expected.
Market Reaction
As witnessed by the 1-hour chart, the USD/CAD pair spiked towards 1.2652, fading the upward move, retreating below the December 7 low around 1.2635,to then rebound where it hovers at press time.
In its statement, the Bank of Canada (BoC) said that it expects CPI inflation to remain elevated in the first half o 2022 but awaits it would moderate by the second half, towards 2%. Furthermore, commented that CPI is elevated, and “the impact of global supply constraints is feeding through to a broader range of goods prices.”
Regarding the economic outlook, the BoC said that the economy had “considerable momentum” into the Q4, including the improvement in the labor market, which brought the employment rate back to its pre-pandemic level. However, floods in British Columbia and uncertainty from the omicron variant “could weigh on growth by compounding supply chain disruptions, cutting demand for some services.”
The BoC commented that “in view of ongoing excess capacity,” the Canadian economy would continue to require monetary policy support and emphasized that they are “committed to holding the rate” until economic slack is absorbed. According to the BoC October projection, that will happen sometime in the middle quarters of 2022.
USD/CAD Price Forecast: Technical outlook
In the 1-hour chart, the USD/CAD has a downward bias, as shown by the hourly simple moving averages (SMA’s) residing well above the spot price. Furthermore, a substantial consolidation around the December 7 low at 1.2635, previous support-turned-resistance, as shown by seven candles rejected by the previously mentioned resistance.
Nevertheless, in the outcome of breaking to the upside, the first resistance would be the daily high at 1.2663. A clear break of that level would expose key resistance levels, with the central daily pivot at 1.2679, followed by the 50-hour SMA at 1.2688, and then the R1 daily pivot at 1.2723.
On the other hand, if 1.2635 holds, that would exert downward pressure on the pair, exposing essential support areas. The first support would be the figure at 1.2600, followed by the S1 daily pivot at 1.2591, and the S2 daily pivot at 1.2547.
- Crude oil stocks saw a smaller than expected draw of only 0.24M barrels.
- Oil prices slipped as a result, with WTI dipping under $72.00.
Commercial crude oil inventories in the US fell by 0.24 million barrels in the week ending December 3, a weekly report published by the US Energy Information Administration (EIA) revealed on Wednesday. This was less than the expected draw of 1.705 million barrels.
Distillate stocks saw a larger than expected build of 2.7M barrels (forecasts were for a 1.6M barrel build). Gasoline stocks also saw a larger than expected build of 3.9M barrels (forecasts were for a 1.8M barrel build).
Market Reaction
Oil prices dipped lower in response to the smaller than expected headline draw and big gasoline and distillate inventory build. WTI slipped back under $72.00.
The Narodowy Bank Polski (NBP), Poland's central bank, raised its benchmark interest rate by 50bps as expected to 1.75% on Wednesday. It also raised each of its other interest rates by 50bps; the discount rate on bills of exchange was lifted to 1.85% from 1.35%, the Lombard rate was lifted to 2.25% from 1.75%, while the deposit rate was lifted from 0.75% to 1.25%.
- The AUD/USD is up almost 2%, after Friday’s low at 0.6993.
- A risk-on market mood favors risk-sensitive currencies, so the Australian dollar rises.
- AUD/USD Price Forecast: Tilted to the upside but facing strong resistance in the 0.7140-50 range.
The Australian dollar continues its advance during the week, up 1.9% from Friday’s low at 0.6993, trading at 0.7148, during the New York session at the time of writing. In the overnight session, upbeat news regarding vaccine effectiveness against the omicron strain maintained the appetite for riskier assets. Early lab studies about two of the most successful vaccines showed that a third dose of the COVID-19 vaccine neutralizes the omicron variant.
That said, during the Asian and European sessions, the AUD/USD extended its gains, trading above Tuesday’s high 0.7122, though stalled around the confluence of October 23, 2020, high and the R1 daily pivot around the 0.7157-47.
On Tuesday, the Reserve Bank of Australia (RBA) kept its cash rate on hold at 0.10% and said it would continue its QE program until at least the middle of February, as reported by the central bank.
RBA Governor Philip Lowe commented that RBA’s board would not increase the cash rate unless inflation is sustainably within the 2-3% target range. He further said that “The economy is expected to return to its pre-Delta path in the first half of 2022.” Regarding the omicron variant, Lowe added that it is a new source of “uncertainty, but it’s not expected to derail the recovery.”
The AUD/USD reacted to the upside. However, it seems that USD bulls took some profits as the market waits for the US Consumer Price Index for November to be released on Friday after Fed policymakers further emphasized the need for a faster bond taper, led by Fed’s Chair Jerome Powell.
AUD/USD Price Forecast: Technical outlook
In the 4-hour chart, the AUD/USD is trading within the 50 and the 100-simple moving average (SMA), at 0.7123 and 0.7171, respectively. Despite trading below the 200-SMA, the break of a month and a half downslope trendline coinciding with the Australian dollar breaking to the upside of the 50-SMA has the pair bias as bullish. However, a clear break of the 100-SMA could pave the way for further gains.
In that outcome, the first resistance would be 0.7200. The breach of the latter would expose a five-month upslope trendline, previous support-turned-resistance around 0-7266-80, immediately followed by the 200-SMA at 0.7302.
- JOLTS Job-Openings rose back above 11M in October.
- The DXY was unmoved by the data, which underscored the notion of a tight US labour market.
The number of job openings on the last business day of October jumped to 11.033 million, the US Bureau of Labor Statistics announced in its latest Job Openings and Labor Turnover Summary (JOLTS) on Wednesday. This reading came in above market expectations for 10.369 million and was sharply up from September's 10.602 million reading, which was revised up from 10.438 million.
Market Reaction
The DXY did not see any notable reaction to the latest JOLTs data. The data should underpin the Fed’s view that the labour market in the US is currently very tight. If Friday’s key US inflation report also comes in hot, this will support market expectations for the bank to agree on accelerating its QE taper when it meets next week.
The Bank of Canada on Wednesday announced that it had decided to leave its benchmark interest rate unchanged at 0.25%, as most economists, analysts, and traders had been expecting. CAD Short-Term Interest Rate (STIR) markets had priced in a modest 16% chance that the bank would hike interest rates by 25bps to 0.50%.
Market Reaction
The loonie has seen an initially negative reaction to the decision, perhaps as the small minority of hawkish bets on a 25bps rate hike were priced out. USD/CAD is now trading in the 1.2630s, up from around 1.2610 prior to the decision.
Key takeaways from policy statement as summarized by Reuters
"The BoC repeated that it sees slack being absorbed sometime in the middle quarters of 2022."
"The Omicron variant of Covid-19 and British Columbia floods could weigh on growth by compounding supply chain disruptions, cutting demand for some services."
"The bank continues to expect CPI inflation to remain elevated in H1 2022 and ease back towards 2% in H2."
"Persistent supply bottlenecks continued to inhibit growth in some areas of GDP in Q3, including non-commodity exports and business investment."
"Recent economic indicators suggest the economy had considerable momentum going into Q4; employment "essentially back to pre-pandemic level," wage growth has picked up."
"CPI inflation is elevated and the impact of global supply constraints is feeding through to a broader range of goods prices."
"Housing activity had been moderating but appears to be regaining strength, notably in resales."
"The effects of these constraints on prices will likely take some time to work their way through, given existing supply backlogs".
"In view of ongoing excess capacity, the economy continues to require considerable monetary policy support."
"Accommodative financial conditions are still supporting economic activity globally."
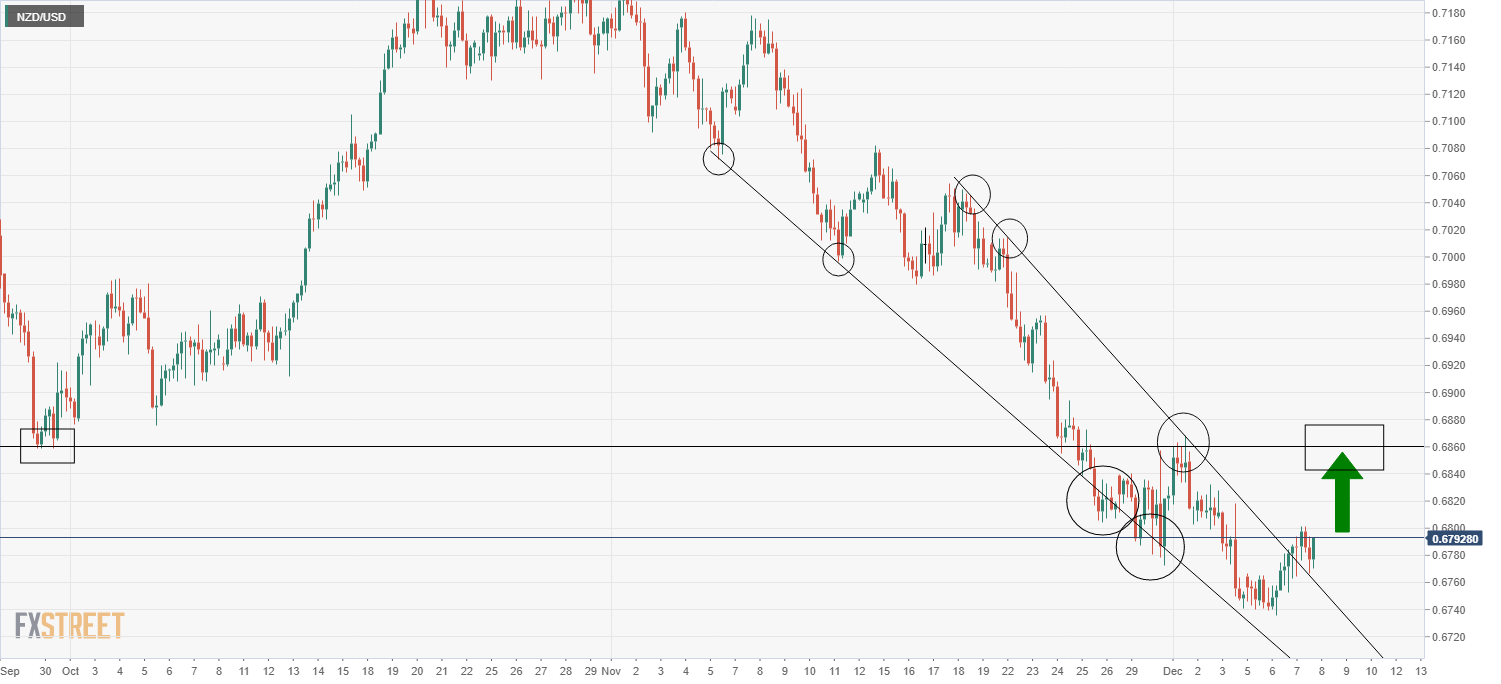
- NZD/USD has been going sideways on Wednesday, with broader risk appetite choppier/more mixed.
- Whilst some of the short-term technicals look favourable, NZD/USD may continue to struggle against the tide of a bullish USD environment.
Amid a choppier feel to broader market sentiment on Wednesday as markets take a breather from recent risk-on flows amid mixed vaccine efficacy versus Omicron headlines and worries about tougher Covid-19 curbs, NZD/USD has been going sideways. The pair has for the most part stuck within a 0.6760-0.6800 range, and at current levels in the 0.6780s, is broadly flat on the day. The kiwi has this week seen a comparatively modest recovery from annual lows printed last week under 0.6750 and is up just 0.6% on the week versus weekly gains of more than 2.0% for AUD and about 1.7% for the loonie.
But from a technical perspective, things have brightened this week for NZD/USD. The pair gently pushed to the north of a negative trend channel that had been capping the price action going all the way back to early November. NZD/USD’s 14-session RSI also recently recovered from oversold territory (i.e. below 30), which some technicians may use as a signal that NZD/USD is overdue a period of consolidation/profit-taking on recent shorts. If the pair can break to the north of of resistance in the 0.6800 area, a move towards the next key area of resistance around 0.6850 may be o the cards.
But from a fundamental’s standpoint, other traders might be more cautious. US JOLTs Job-Opening numbers for October will be released at 1500GMT and should confirm that demand for labour (i.e. the number of job openings) remained well above the number of unemployed persons. This should underpin the Fed’s view that the labour market in the US is currently very tight. If Friday’s key US inflation report also comes in hot, this will support market expectations for the bank to agree on accelerating its QE taper when it meets next week.
Markets are betting that the annual rate of US Consumer Price Inflation will rise to 6.8% in November and some analysts have speculated that a print above 7.0% would push the Fed into indicating rate hikes as soon as the end of Q1 2022. The notions of a hot US labour market and inflationary environment contributing to an increasingly hawkish Fed policy stance may continue to weigh on NZD/USD in the days ahead. The pair could soon be headed for a retest of recent lows under 0.6750.
- Oil prices are choppy on Wednesday amid conflicting headlines on vaccine efficacy and worries about tighter Covid-19 curbs.
- But oil prices remain significantly higher on the week amid optimism that Omicron will be mild.
Oil prices have been choppier on Wednesday than the previous two days. Front-month WTI futures have undulated within a $71.00-$72.70ish range over the past few hours, swinging between gains and losses. The most recent uptick in volatility at the time of the CME oil pit open at 1400GMT (when volumes typically surge) saw WTI slump back under the $72.00 to around $71.75, where it trades broadly flat on the day. But the week, WTI continues to trade with gains of more than $5.0 (nearly 8.0%) and the gains versus last week’s near-$62.00 lows now stand at over $9.00 or nearly15%.
Oil markets have been driven higher this week by hopes that the new Omicron Covid-19 variant is milder than prior variants, thus presenting less of a threat to the global economic recovery. Headlines regarding the efficacy of vaccines has been mixed over the last 24 or so hours. Late on Tuesday, a study was released by scientists in South Africa showing that two doses of the Pfizer/BioNTech vaccine were only partially able to neutralise Omicron. However, Pfizer and BioNTech released a separate study this morning which essentially suggested that a third booster dose would restore vaccine efficacy back in line with the efficacy that two doses had against prior Covid-19 strains.
Risk appetite and crude oil markets have been choppy as a result of the conflicting stories, whilst oil markets have also taken notice of headlines in the UK suggesting that new Covid-19 curbs are on the verge of being introduced. One of them will include the recommendation to work from home, which of course dampens the near-term outlook for demand for fuel in the UK if fewer people are travelling. The UK doesn’t make up a large enough portion of daily global crude oil consumption for this to really matter, but the fear is that states in the oil guzzlings US may follow suit.
Looking ahead, oil traders will be watching the release of official weekly US inventory numbers at 1530GMT. Private weekly US inventory data showed a slightly larger than expected draw in crude oil stocks of around 3.1M barrels.
BoC Monetary Policy Decision – Overview
The Bank of Canada (BoC) is scheduled to announce its monetary policy decision this Wednesday at 15:00 GMT and is expected to leave the key interest rate target at the rock-bottom level of 0.25%. In the absence of the post-meeting press conference, the focus will be on the accompanying rate statement for fresh clues about the central bank's outlook on interest rates. The market bets for a possible rate hike in Q1 have been increasing, suggesting that there is a risk of disappointment if the Canadian central bank maintains its current monetary policy stance.
Analysts at Citibank offered their take on the upcoming meeting and wrote: “We expect the BoC to leave rates unchanged at 0.25% though we will watch for signs the BoC could be considering a rate rise even earlier than the latest guidance for the ‘middle quarters of 2022’. After the hawkish October surprise, we expect a slightly hawkish tone to this meeting with risks tilted to an even more hawkish shift, with BoC perhaps signaling openness to a Q1 hike.”
How Could it Affect USD/CAD?
Heading into the key event risk, bullish crude oil prices acted as a tailwind for the commodity-linked loonie and dragged the USD/CAD pair to a near three-week low on Wednesday. A more hawkish shift should provide an additional boost to the Canadian dollar and set the stage for an extension of the pair's corrective pullback from a multi-month high touched last week.
Given the aggressive market pricing for an early rate hike, a mention of the risks associated with the emergence of the new Omicron variant of the coronavirus would be enough to weigh on the Canadian dollar. This, along with the underlying bullish sentiment surrounding the US dollar, will set the stage for the resumption of the USD/CAD pair's uptrend witnessed since October.
Key Notes
• Bank of Canada Interest Rate Decision: Mr. Macklem goes first
• BoC Preview: Forecasts from seven major banks, inching ever closer to rate hikes
• USD/CAD Analysis: Corrective pullback stalls near 38.2% Fibo., focus shifts to BoC
About the BoC Interest Rate Decision
BoC Interest Rate Decision is announced by the Bank of Canada. If the BoC is hawkish about the inflationary outlook of the economy and raises the interest rates it is positive, or bullish, for the CAD. Likewise, if the BoC has a dovish view on the Canadian economy and keeps the ongoing interest rate, or cuts the interest rate it is seen as negative, or bearish.
- EUR/GBP lept above 0.8550 to its highest levels since mid-November, with the pound hit in anticipation of further UK Covid-19 curbs.
- The pair’s rally has thus far been halted at the 200DMA, but bulls are eyeing a move to 0.8600.
EUR/GBP has seen substantial upside on Wednesday, rising to the north of the 0.8550 mark for the first time since mid-November as sterling slipped to its weakest level of the year so far against the US dollar. The pair is currently testing its 200-day moving average at 0.8559, having backed of from earlier session highs close to 0.8570.
Whilst the bulk of the move has been triggered by concerns about the UK government implementing tighter Covid-19 curbs, technical buying is likely also playing a role. EUR/GBP broke to the north of a descending trendline that has been in play since early October and a break above the 200DMA would likely usher in further buying pressure to send the pair back to its November high just shy of 0.8600.
Driving the day
The pound is being weighed on by the prospect of the reimposition of Covid-19 curbs that, according to analysts, clouds the outlook for the UK economy and may delay the BoE’s monetary tightening plans. The FT reported that UK PM Johnson is on the verge of announcing the implementation of “Plan B” Covid-19 restrictions, including the requirement of vaccine passports for access to large venues, as well as a recommendation to work from home, all in an attempt to slow the spread of the Omicron Covid-19 variant.
According to MUFG, “a further tightening of restrictions with people being asked to work from home will dampen the growth outlook… (and) means that the Bank of England is even more likely to hold off from raising rates until February”. By contrast to policymakers at the Fed and ECB, BoE members have expressed comparatively higher levels of concern about the potential impact of the spread of the Omicron variant on the economy. Last week, one of the bank’s most hawkish members Michael Saunders suggested a more patient approach to rate-setting might be warranted in order to wait for more data on the new variant.
- The risk-on mood undermined the safe-haven USD and assisted EUR/USD to gain traction.
- The euro further benefitted from some cross-driven strength stemming from EUR/GBP.
- The lack of any strong follow-through buying warrants some caution for bullish traders.
The EUR/USD pair held on to its modest intraday gains heading into the North American session, with bulls now awaiting a sustained move beyond the 1.1300 round-figure mark.
The pair managed to regain some positive traction on Wednesday and built on the previous day's late rebound from a one-and-half-week low, around the 1.1230-25 region. An extension of the recent rally in the equity markets undermined the safe-haven US dollar and extended some support to the EUR/USD pair.
The global risk sentiment remained well supported by easing fears about the potential economic fallout from the new Omicron variant of the coronavirus. The upbeat market mood got an additional boost after Pfizer said the third dose of their COVID-19 vaccine neutralized the Omicron variant in lab tests.
The shared currency further benefitted from some cross-driven strength stemming from a sharp spike in the EUR/GBP cross, triggered by reports about the imposition of fresh COVID-19 restrictions in the UK. That said, hawkish Fed expectations helped limit the USD losses and capped gains for the EUR/USD pair.
Investors seem convinced that the Fed would tighten its monetary policy sooner rather than later to contain stubbornly high inflation. In fact, the money markets have been pricing in the possibility of an eventual liftoff in May 2022, which should continue to act as a tailwind for the greenback.
The focus now shifts to Friday's release of the US consumer inflation figures, which would influence the Fed's decision to taper its stimulus at a faster pace and set the stage for an interest rate hike. This will drive the USD demand and provide a fresh directional impetus to the EUR/USD pair.
This makes it prudent to wait for a sustained strength beyond the 1.1300 mark before placing fresh bullish bets around the EUR/USD pair. In the absence of any relevant market-moving economic releases, developments surrounding the coronavirus saga will be looked upon for some trading opportunities.
Technical levels to watch
- Spot gold tested its 200DMA above $1790 earlier in the session but has since slipped back to the mid-$1780s.
- The precious metal is in wait-and-see mode ahead of Friday’s key US inflation numbers.
Spot gold (XAU/USD) prices have been choppy in recent trade, attempting, but eventually failing to break to the north of the 200-day moving average at $1792.00. Spot prices have since reversed lower from these earlier session highs to the mid-$1780s region, where they trade roughly flat on the day. Broader risk appetite has turned choppier again on Wednesday after 1) news broke that the UK is on the verge of announcing new Covid-19 related restrictions and 2) a study on blood samples out of South Africa showed two shots of the Pfizer/BioNTech vaccine to only be partially effective versus the new Omicron variant.
However, in response to the South African study, Pfizer and BioNTech released their own study this morning claiming that the current booster vaccine lifts vaccine efficacy back to levels comparable with the efficacy of two doses versus the original Covid-19 variant. Conditions in global equity markets have been choppy, with European indices and US index futures swinging between gains and losses, though this hasn’t translated into any major safe-haven bid, thus why gold is flat.
Gold’s subdued mood is in fitting with the price action in FX and US government bond markets; the DXY is currently flat in the low 96.30s, broadly in line with where it has traded for the past five sessions, while the US treasury yield curve is flat on Wednesday. US JOLTs Job-Opening numbers for October will be released at 1500GMT and should confirm that demand for labour (i.e. the number of job openings) remained well above the number of unemployed persons. This should underpin the Fed’s view that the labour market in the US is currently very tight and support market expectations for the bank to agree on accelerating its QE taper when it meets next week.
However, the most important data this week, both for XAU/USD and in terms of Fed monetary policy expectations, will be Friday’s US Consumer Price Inflation report for November. Recall that October’s report, which came in well above expectations at 6.2% YoY, triggered demand for inflation protection in the form of US government TIPS bonds and precious metals. Traders will be on notice for the possibility that another upside surprise triggers a similar reaction. However, analysts also note that another upside surprise (say, above 7.0% YoY) might be interpreted as exerting more pressure on the Fed to bring forward their rate hike timeline, which could be a negative for gold, if it resulted in real yields moving higher.
- GBP/JPY dropped sharply in reaction to reports about fresh COVID-19 restrictions in the UK.
- A positive risk tone undermined the safe-haven JPY and assisted the cross to pare losses.
- Diminishing odds for an imminent BoE rate hike support prospects for a further downfall.
The GBP/JPY cross recovered around 100 pips from the daily swing low, albeit struggled to capitalize on the move and was last seen trading around the 150.00 mark, down 0.10% for the day.
The cross witnessed aggressive selling during the mid-European session and dived to the 149.35 area amid reports about the imposition of fresh COVID-19 restrictions in the UK. This comes on the back of persistent Brexit-related uncertainties and dashed hopes for an imminent interest rate hike by the Bank of England, which, in turn, weighed heavily on the British pound.
Meanwhile, the global risk sentiment got a strong boost after Pfizer said that the third dose of their COVID-19 vaccine neutralized the Omicron variant in lab tests. This was evident from a sharp intraday rally in the equity markets, which undermined demand for the safe-haven Japanese yen and assisted the GBP/JPY cross to attract some buying at lower levels.
The attempted recovery, however, ran out of steam near the 150.35 region, warranting some caution for bullish traders. Even from a technical perspective, the GBP/JPY cross has been oscillating in a range over the past one week or so. Given the recent sharp fall, the range-bound price action might be categorized as a bearish consolidation phase.
Nevertheless, it will still be prudent to wait for a strong follow-through selling and a sustained break below the trading range support before positioning for any further depreciating move. In the absence of any major market-moving economic releases, developments surrounding the coronavirus saga might continue to influence the GBP/JPY cross.
Technical levels to watch
- GBP/USD witnessed aggressive selling in reaction to reports of fresh COVID-19 restrictions in the UK.
- The latest development might have dashed hopes for a BoE rate hike and weighed heavily on the GBP.
- A turnaround in the risk sentiment benefitted the safe-haven USD and contributed to the selling bias.
The GBP/USD pair witnessed aggressive selling during the mid-European session and dived to a fresh one-year low, closer to mid-1.3100s in the last hour, albeit quickly recovered a few pips thereafter.
Following the previous day's modest rebound, the GBP/USD pair came under some renewed bearish pressure on Wednesday and prolonged its bearish trend witnessed since late October. The British pound weakened across the board in reaction to reports about the imposition of fresh COVID-19 restrictions in the UK, which could take effect as early as tomorrow.
This, along with the UK-EU impasse over the Northern Ireland Protocol, seem to have dashed hopes for an imminent interest rate hike by the Bank of England later this month. This, in turn, weighed heavily on the sterling. The sharp intraday fall could further be attributed to some technical selling on a sustained break below the 1.3200 round figure.
Meanwhile, the latest development took its toll on the global risk sentiment, which was evident from a turnaround in the equity markets. Adding to this, the prospects for a faster policy tightening by the Fed drove some flows towards the safe-haven greenback. This further contributed to the GBP/USD pair's fall of around 100 pips from the daily swing high.
The latest leg down validated the recent breakdown through a downward sloping channel and might have already set the stage for additional losses. That said, RSI on short-term charts are already flashing or are on the verge of breaking into the oversold territory. This, in turn, assisted the GBP/USD pair to quickly recover over 50 pips from the vicinity of mid-1.3100s.
In the absence of any major market-moving economic releases, either from the UK or the US, fresh developments surrounding the coronavirus saga will play a key role in influencing the GBP/USD pair. Traders will further take cues from the broader market risk sentiment, which will drive the USD demand and produce some short-term opportunities.
Technical levels to watch
- A combination of factors dragged USD/CAD to a three-week low on Wednesday.
- Crude oil shot back above the $72.00/barrel mark and underpinned the loonie.
- Retreating US bond yields weighed on the USD and contributed to the downtick.
- Investors now look forward to the BoC policy decision for a fresh trading impetus.
The USD/CAD pair reversed an early European session uptick and dropped to a near three-week low, around the 1.2625-20 region in the last hour.
The pair struggled to capitalize on its attempted recovery, instead met with a fresh supply near the 1.2665 area and turned lower for the third successive day on Wednesday. Crude oil prices reversed an intraday dip and climbed back above the $72.00/barrel mark easing concerns about the impact of the new coronavirus variant on the global fuel demand. This, in turn, underpinned the commodity-linked loonie and exerted some downward pressure on the USD/CAD pair.
On the other hand, the US dollar was pressured by retreating US Treasury bond yields and a generally positive risk tone. This was seen as another factor that contributed to the USD/CAD pair's modest intraday downtick. That said, a combination of factors acted as a tailwind for the greenback and should help limit the downside for the USD/CAD pair. This warrants some caution for aggressive bearish traders and before positioning for any further downfall.
Investors seem convinced that the Fed would tighten its monetary policy sooner rather than later to contain stubbornly high inflation. In fact, the money markets indicate a high possibility for an eventual liftoff in May 2022. Hence, the market focus will remain glued to Friday's release of the latest US consumer inflation figures. The CPI report will drive the USD demand in the near term and provide a fresh directional impetus to the USD/CAD pair.
Traders also seemed reluctant, rather preferred to wait on the sidelines ahead of the Bank of Canada monetary policy meeting. The outcome is scheduled to be announced later during the early North American session. This, along with oil price dynamics, will influence the Canadian dollar and produce some meaningful trading opportunities around the USD/CAD pair amid absent relevant market moving economic releases.
Technica levels to watch
Turkey’s President Recep Tayyip Erdogan said that the country “will bring inflation, exchange rate down through low-interest rates” while speaking in an interview with NTV.
Additional comments
"Absolutely" does not believe in high-interest rates.
Stockpiling to blame for inflation, threatens more severe punishments
Central bank forex reserves not an issue, hopefully to increase in coming period.
Believes turkey will reverse "attack on currency.”
Market reaction
USD/TRY spiked to daily highs of 13.7245 on these comments, as the Turkish lira loses 1.41% on the day.
- WTI price is looking to retest weekly tops above $72.
- Omicron optimism and China stimulus back the higher-yielding oil.
- WTI could rise towards $74 before the bear cross gets confirmed.
WTI (NYMEX futures) is trading with moderate gains on Wednesday, looking to extend the recent recovery rally amid easing fears over the negative effects of the new Omicron covid variant on global economic growth.
Further, a fall in the American Petroleum Institute’s (API) weekly crude stockpiles also underpins the sentiment around the black gold. However, the main driver remains the escalating geopolitical tensions between the US and Russia over the Ukraine invasion matter.
At the time of writing, the US oil is flirting with daily highs near $72.10, up 0.40% on the day.
Meanwhile, WTI’s daily technical setup shows that the price has the room to rise towards a powerful resistance zone around the $74 mark, where the bearish 21-Daily Moving Average (DMA) and horizontal 100-DMA converge.
However, if the 21-DMA crosses the 100-DMA for the downside on a daily closing basis, then that would confirm a bear cross.
The Relative Strength Index (RSI) edges higher but remains below the midline, suggesting the bearish risks still persist.
A rejection at a higher level could recall the sellers for a retest of the daily lows at $71.11, below which the 200-DMA support at $70.00 could be challenged.
Alternatively, immediate resistance is seen at Tuesday’s high of $72.81. The next relevant upside target for bulls is pegged at the $74 level.
WTI: Daily chart
WTI: Additional levels to watch
- Gold price hits fresh weekly highs as the US dollar drops with Treasury yields.
- Omicron covid optimism and pre-US inflation anxiety downs the USD.
- Gold sellers eye $1,750 as Fed stays on tightening path.
The optimism around the less severe effects of the new Omicron covid variant continues to play out so far this week, downing the safe-haven US dollar. In lieu of this, gold price clinched fresh weekly highs, also benefiting from the weakness in the Treasury yields. Investors eagerly await Friday’s US inflation data for fresh trading impulse. Hotter US inflation is likely to seal in the Fed’s faster tapering, which could impede gold’s renewed upside.
Read: Gold Price Forecast: XAU/USD at a critical juncture, awaits US inflation for next big move
Gold Price: Key levels to watch
The Technical Confluences Detector shows that the gold price is facing strong offers at $1,792, the powerful supply zone comprising of the SMAs100 and 200 one-day and the Fibonacci 61.8% one-week.
A firm break above the latter is awaited to extend the recovery momentum towards the $1800 level – the pivot point one-day R2.
The next critical upside hurdle is seen around $1,805, where the Fibonacci 38.2% one-month aligns.
On the flip side, immediate support is envisioned at the Fibonacci 23.6% one-day of $1,785.
If the selling pressure intensifies, then sellers would target the intersection of the Fibonacci 38.2% one-day and SMA10 one-day at $1,782.
Gold bears will need to crack the fierce support at $1,779, the confluence of the Fibonacci 61.8% one-day and SMA5 one-day, to open up the further downside.
Further south, $1,772 will be the level to beat for gold sellers. That level is the convergence of the previous day’s low and the Fibonacci 23.6% one-week.
Here is how it looks on the tool
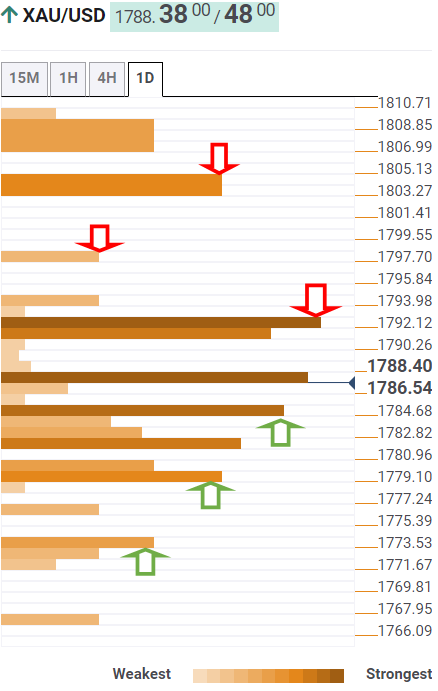
About Technical Confluences Detector
The TCD (Technical Confluences Detector) is a tool to locate and point out those price levels where there is a congestion of indicators, moving averages, Fibonacci levels, Pivot Points, etc. If you are a short-term trader, you will find entry points for counter-trend strategies and hunt a few points at a time. If you are a medium-to-long-term trader, this tool will allow you to know in advance the price levels where a medium-to-long-term trend may stop and rest, where to unwind positions, or where to increase your position size.
European Central Bank (ECB) Vice President Luis de Guindos made some comments on the inflation outlook during his appearance on Wednesday.
Key quotes
“The current higher phase of inflation could last longer than earlier thought. “
“No evidence of second-round inflation effects.”
“Bottlenecks are likely to shift growth.”
Related reads
- ECB’s Kazaks sets high bar for Omicron-driven extra stimulus – Bloomberg
- EUR/USD Price Analysis: Rebound remains capped below 21-DMA
In order to ramp up emergency stimulus, the new Omicron covid variant must have a significant damaging impact on the euro area economy, European Central Bank (ECB) Governing Council member Martins Kazaks said in a Bloomberg interview on Wednesday.
Key quotes
“At the current moment, we don’t know how the omicron variant will develop.”
“Unless it spills over into significant and large negative revisions to the outlook for growth, I don’t see that March -- which the market has been expecting for some time and which we’ve been communicating in the past -- should be changed.”
“If in February we see that it’s painful then, of course, we can change our views and that’s the issue of flexibility.”
“In my view, it’s possible both to restart PEPP or increase the envelope if it turns out to be necessary.”
“To exactly what level will it land in 2023-24, of course, there’s lots of uncertainty.”
“With little evidence that soaring prices are triggering wage increases that would risk entrenching faster inflation, “my baseline remains that it slides to below 2%.”
Market reaction
EUR/USD shrugs off these comments, as it continues to trade in a familiar range below 1.1300. The spot is up 0.16% on the day.
- EUR/USD rises for the first time in three days but 21-DMA offers stiff resistance.
- Falling Treasury yields keep EUR bulls hopeful amid a quiet session.
- The EUR bulls need to defend the 1.1232 support on the daily sticks.
EUR/USD is attempting a bounce from weekly lows of 1.1227, although sellers continue to lurk at 1.1300 amid a lack of relevant economic data.
The main currency pair is hovering just shy of the 1.1300 mark, adding 0.23% on the day, as the risk-on flows driven US dollar weakness aids the rebound. Also, the renewed downside in the US Treasury yields adds to the dollar’s pullback, benefiting EUR/USD’s recovery.
Despite the uptick, EUR bulls remain cautious amid the divergent monetary policy outlook between the Fed and ECB, with Friday’s US inflation data likely to bolster the Fed’s tapering expectations.
From a short-term technical perspective, the spot is advancing but remains capped between the 21-Daily Moving Average (DMA) at 1.1315 on the upside.
Meanwhile, the downside remains cushioned by the rising trendline support on the daily sticks at 1.1232.
The 14-day Relative Strength Index (RSI) is trading flatlined below the 50.00 level, suggesting the risks remain skewed to the downside.
Therefore, daily closing below the abovementioned critical support will open floors for a retest of 1.1200.
The next stop for EUR bears is seen at the yearly lows of 1.1185.
EUR/USD: Daily chart
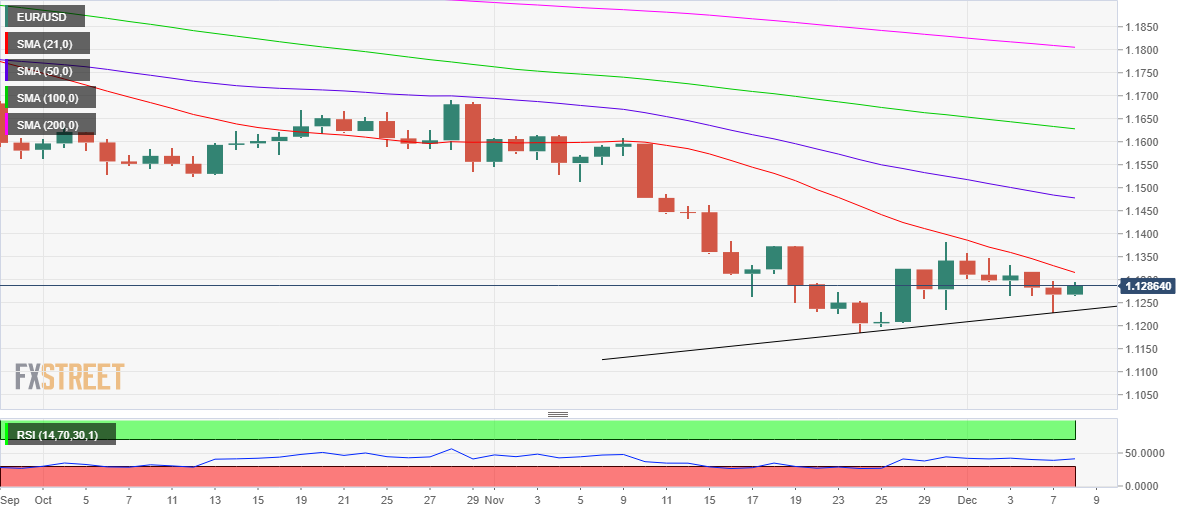
On the flip side, recapturing the 21-DMA is critical for unleashing the recovery towards the 1.1350 psychological level.
Further up, the 1.1400 round figure could be put to test.
EUR/USD: Additional levels to consider
- AUD/USD struggled to preserve/capitalize on its early move to a one-week high.
- Rising geopolitical tensions acted as a headwind for the perceived riskier aussie.
- Retreating US bond yields undermined the USD and could help limit the downside.
The AUD/USD pair surrendered its intraday gains to a one-week high and was last seen hovering near the lower end of its daily trading range, around the 0.7120-15 region.
The pair built on this week's strong recovery from the lowest level since November 2020 and gained some follow-through traction during the early part of the trading action on Wednesday. The uptick was supported by a modest US dollar weakness, though lacked follow-through buying and ran out of steam ahead of mid-0.7100s.
Relations between the US and Russia took a turn for the worse after US President Joe Biden threatened to impose economic and other measures on Russia if it invades Ukraine. This, in turn, kept a lid on the recent optimistic move in the financial markets and acted as a headwind for the perceived riskier Australian dollar.
Meanwhile, reviving safe-haven demand led to a fresh leg down in the US Treasury bond yields, which undermined the US dollar and helped limit the downside for the AUD/USD pair. That said, the prospects for a faster policy tightening by the Fed support prospects for the emergence of some USD dip-buying and warrant caution for bulls.
The markets have been pricing in the possibility for an eventual Fed liftoff in May 2022 amid worries about the persistent rise in inflationary pressures. Hence, the focus shifts to the release of the US CPI report on Friday, which will influence the Fed's policy outlook and provide a fresh directional impetus to the AUD/USD pair.
In the meantime, the US bond yields will drive the USD demand and produce some short-term trading opportunities around the AUD/USD pair. Apart from this, traders will further take cues from geopolitical developments and the broader market risk sentiment amid absent relevant market moving economic releases from the US.
Technical levels to watch
- A combination of factors prompted some selling around USD/JPY on Wednesday.
- Reviving safe-haven demand underpinned the JPY and exerted some pressure.
- Retreating US bond yields weighed on the USD and contributed to the selling bias.
- Hawkish Fed expectations should help limit the USD fall and lend some support.
The USD/JPY pair remained on the defensive through the early European session and was last seen trading with modest intraday losses, just below mid-113.00s.
The pair witnessed some selling on Wednesday and snapped two consecutive days of the winning streak that pushed spot prices to a one-week high, around the 113.75-80 region touched on Tuesday. Rising geopolitical tensions kept a lid on the recent optimistic move in the financial markets and benefitted the safe-haven Japanese yen.
The US recently announced that it would boycott the Winter Olympics in Beijing to protest China's alleged violations of human rights and actions against Muslims in Uyghur. Similarly, relations between the US and Russia took a turn for the worse after US President Joe Biden threatened to impose economic and other measures on Russia if it invades Ukraine.
Bearish traders further took cues from retreating US Treasury bond yields, which undermined the US dollar. The USD downside, however, remained cushioned, at least for the time being, amid the prospects for a faster policy tightening by the Fed. This, in turn, warrants some caution positioning for any meaningful decline for the USD/JPY pair.
Investors seem convinced that the Fed would be forced to adopt a more aggressive policy response to contain stubbornly high inflation. Hence, the market focus now shifts to the release of the US CPI report on Friday, which will influence the near-term USD price dynamics and provide a fresh directional impetus to the USD/JPY pair.
In the meantime, traders will take cues from the broader market risk sentiment to grab some short-term opportunities. Apart from this, the US bond yields will drive the USD demand and further provide some impetus to the USD/JPY pair amid absent relevant market moving economic releases.
Technical levels to watch
- Palladium consolidates recent gains after four-day uptrend, refreshes intraday low at the latest.
- 10-DMA, bullish MACD signals challenge sellers, five-month-old resistance line adds to the upside filters.
Palladium (XPD/USD) stays pressured around an intraday low of $1,851.70, down 0.37% on a day as European traders brace for Wednesday’s bell.
In doing so, the bullish prices print daily losses for the first time in three days while stepping back from a one-week high. The pullback moves could also be linked to the quote’s failures to cross the 20-DMA level.
Even so, XPD/USD trading beyond 10-DMA and bullish MACD signals keep buyers hopeful of overcoming the immediate hurdle, namely the 20-DMA level of $1,871.
Following that, the $1,900 threshold and late October’s swing low surrounding $1,955 may tet the bulls before directing them to the $2,000 psychological magnet.
During the palladium’s run-up beyond the $2,000 mark, a multi-day-old resistance line near $2,072 and a two-month-old horizontal area surrounding $2,175 will be crucial to watch.
Alternatively, a downside break of 10-DMA level of $1,800 will re-open doors for the XPD/USD sellers to aim for the yearly low of around $1,695.
In a case where palladium bears dominate past $1,695, a March 2020 low of $1,494 should gain the market’s attention.
Palladium: Daily chart
Trend: Further recovery expected
FX option expiries for December 8 NY cut at 10:00 Eastern Time, via DTCC, can be found below.
- EUR/USD: EUR amounts
- 1.1305 345m
- 1.1350 423m
- USD/JPY: USD amounts
- 112.30 477m
- 113.00 723m
- 113.80 524m
- 114.00 535m
- AUD/USD: AUD amounts
- 0.6900 742m
- USD/CAD: USD amounts
- 1.2670 463m
- USD/ZAR seesaws around weekly bottom, pauses two-day declines.
- South African GDP snapped four-quarter advances with -1.5% figures for Q3 2021.
- Risk-on mood, softer yields and receding fears of Omicron keep sellers hopeful.
USD/ZAR takes rounds to $15.85-80, down 0.05% while challenging the previous two-day downtrend during early Wednesday morning in Europe. The South African currency (ZAR) pair struggles to cheer the broad US dollar weakness as the national GDP flashed negative surprise the previous day.
That said, South African GDP for Q3 2021 dropped for the first time in four quarters, down -1.5% QoQ versus -1.2% expected and +1.2% prior, as bearing the double whammy of coronavirus and political trauma in the nation. “South Africa's economy contracted 1.5% in the third quarter compared with the previous three months, as some of the worst unrest of the post-apartheid era in July hurt sectors like agriculture, manufacturing and trade,” said Reuters.
On the other hand, diplomats from Cape Town recently rejected the proposal to change the national constitution to explicitly allow the expropriation of land with no compensation. “Redressing them has been a flagship promise of the ruling African National Congress (ANC) but little progress has been made on it nearly three decades since the end of apartheid,” per Reuters.
Alternatively, receding fears of the South African covid variant, dubbed as Omicron, joins hopes of more stimulus from China and Japan to favor risk-on mood and weigh on the US dollar. Though, geopolitical and financial headlines concerning Russia and China keep traders cautious amid a lackluster day.
That said, the US 10-year Treasury yields drop 1.5 basis points (bps) to 1.465% while the stock futures remain mildly bid at the latest.
Looking forward, market sentiment remains as the key catalyst for USD/ZAR traders ahead of Friday’s US Consumer Price Index (CPI).
Technical analysis
While a clear downside below 10-DMA and weekly resistance line, around $16.00, direct USD/ZAR to the south, an ascending trend line from October 20, close to $15.65 at the latest, becomes key for the pair sellers to watch before taking fresh entries.
- GBP/USD gained some positive traction on Wednesday amid a modest USD weakness.
- The prevalent risk-on mood, retreating US bond yields weighed on the safe-haven USD.
- Hawkish Fed expectations should help limit the USD fall and cap the upside for the pair.
The GBP/USD pair traded with a mild positive bias heading into the European session and was last seen hovering around mid-1.3200s, up only 0.10% for the day.
Having found some support ahead of the 1.3200 mark on Tuesday, the GBP/USD pair managed to regain some positive traction on Tuesday and was supported by a modest US dollar weakness. Against the backdrop of the upbeat market mood, retreating US Treasury bond yields acted as a headwind for the safe-haven greenback and extended some support to the major.
The global risk sentiment remained well supported by easing concerns about the negative impact of the new coronavirus variant on the economic recovery. This comes on the back of reports, indicating that indicated that Omicron patients had only shown mild symptoms. This led to a strong rally in the global equity markets over the past two trading sessions.
That said, rising geopolitical tensions kept a lid on the recent optimistic moves, which along with the prospects for a faster policy tightening by the Fed should help limit the USD losses. Apart from this, the UK-EU impasse over the Northern Ireland Protocol held back traders from placing aggressive bullish bets and capped gains for the GBP/USD pair.
Investors seem convinced that the Fed would be forced to adopt a more aggressive policy response to contain stubbornly high inflation. Hence, the market focus will remain glued to the release of the latest US CPI report on Friday, which will influence the near-term USD price dynamics and provide a fresh directional impetus to the GBP/USD pair.
In the meantime, the broader market risk sentiment and the USD price dynamics would play a key role in driving the USD and provide some trading opportunities around the GBP/USD pair. In the absence of any relevant market-moving economic releases, it will be prudent to wait for a strong follow-through buying before positioning for any further gains.
Technical levels to watch
Here is what you need to know on Wednesday, December 8:
Increasing scientific evidence that the new Omicron covid variant is less aggressive and, therefore, could pose limited risk to the global economic recovery continues to underpin the market mood. The Asian stocks tracked the rally in Wall Street overnight while the S&P 500 futures advanced 0.40% so far.
South African hospitals continue to hint that Omicron has milder symptoms. Additionally, a South African Study showed that the Pfizer vaccine provides partial protection against the new strain. The scientist noted, “study shows a 40-fold reduction in neutralization capacity of Pfizer vaccines vs. Omicron.
China’s policy support to boost economic growth and help the country’s distressed property sector also keep the upbeat tone intact for the third day in a row.
The risk-on flows dulled the US dollar’s appeal as a safe haven, fuelling a relief rally across the fx board. The US Treasury yields softened amid pre-inflation data anxiety, adding to the weight on the buck.
Against this backdrop, EUR/USD outperformed and almost tested 1.1300, as the rebound extends despite the mixed German ZEW data and ECB-speak.
GBP/USD is consolidating its bounce around 1.3250, as bulls remain cautious amid rising Omicron cases in the UK. The Kingdom reported 101 new cases of the Omicron variant, taking the total cases to 437, as of Tuesday. Additionally, the Brexit stalemate will likely cap the further upside in cable.
AUD/USD is holding onto the latest upside but remains capped below 0.7150 despite the yuan hitting three-year highs against the greenback.
USD/JPY is battling 113.50 amid softer yields and the dollar. USD/CAD is posting small gains around 1.2650 amid a pullback in WTI prices, ahead of the key Bank of Canada (BOC) decision. The BOC is expected to keep the key rate unchanged at 0.25% amid rising inflation.
The US oil fails to take advantage of the US-Russia geological tensions, especially after President Joe Biden warned his Russian counterpart of ‘strong measures’ amid Ukraine invasion fears.
Gold is testing the critical $1,792 barrier, at fresh weekly highs.
Bitcoin is battling $50,000, as bulls contemplate the next move amid news that Google disrupted a massive botnet used by hackers to mine crypto using the Bitcoin blockchain.
- EUR/GBP pokes intraday high, snaps two-day downtrend.
- Steady RSI line favor recovery moves towards 10-week-old resistance line.
- Key Fibonacci retracement levels, 200-DMA act as additional resistances.
EUR/GBP prints the biggest daily gains of the week, up 0.14% intraday around 0.8525 heading into Wednesday’s London open.
The cross-currency pair dropped to a one-week low the previous day before bouncing off 50-DMA and 38.2% Fibonacci retracement (Fibo.) of September-November declines.
Although the firmer RSI line favors the latest recovery, a clear break of the 50% Fibo. level near 0.8520 becomes necessary for the bulls to keep reins.
Following that, a descending trend line from late October and 61.8% Fibonacci retracement level, respectively around 0.8545 and 0.8555, will challenge the EUR/GBP buyers.
It should be noted, however, that the pair’s run-up beyond 0.8555 will need validation from the 200-DMA level of 0.8560.
Alternatively, a daily closing below the 50-DMA level around 0.8480 will highlight multiple supports around 0.8460 and 0.8420 for EUR/GBP sellers.
However, the pair’s weakness past-0.8420 will be challenged by November’s low of 0.8380, which is also the lowest level since early 2020.
EUR/GBP: Daily chart
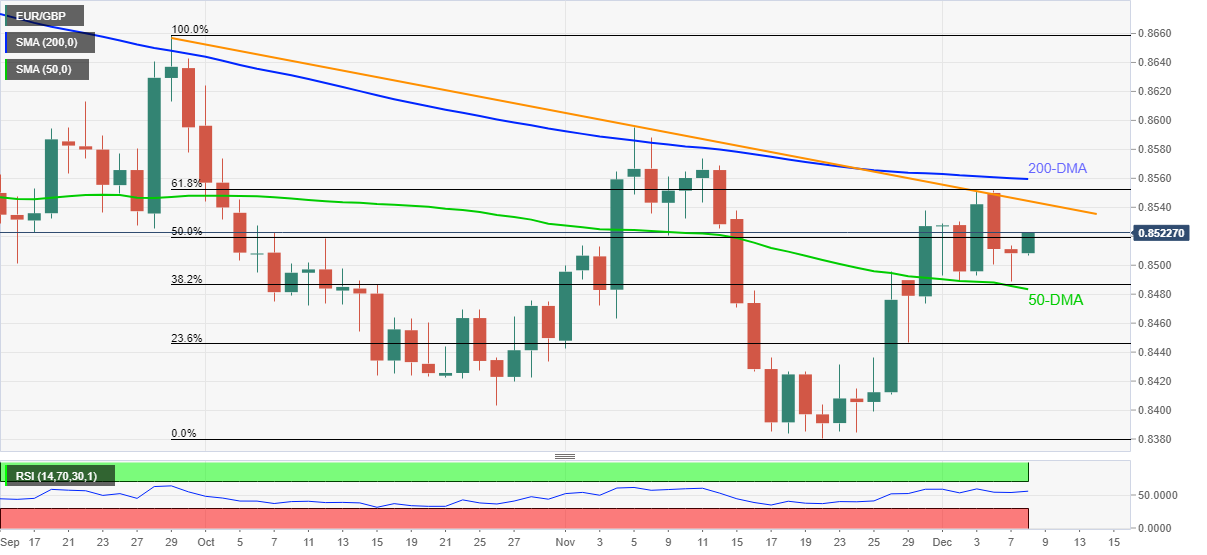
Trend: Further recovery expected
- Gold gained traction for the second successive day and shot to a one-week high on Wednesday.
- Retreating US bond yields weighed on the USD and drove flows towards the non-yielding metal.
- Rising geopolitical tensions further benefitted the safe-haven metal and contributed to the uptick.
- The market focus now shifts to the release of the latest US consumer inflation figures on Friday.
Gold edged higher for the second successive day and climbed to a one-week high, around the $1,790 region during the early part of the trading action on Tuesday. Retreating US Treasury bond yields undermined the US dollar and turned out to be a key factor that benefitted the dollar-denominated commodity. Apart from this, rising geopolitical tensions further underpinned the safe-haven precious metal and contributed to the uptick.
The US recently announced that it would boycott the Winter Olympics in Beijing in protest of China's alleged violations of human rights and actions against Muslims in Uyghur. Similarly, relations between the US and Russia took a turn for the worse after US President Joe Biden threatened to impose strong economic and other measures on Russia if it invades Ukraine. This kept a lid on the recent optimistic moves in the financial markets.
Investors abandoned all concerns about the impact of the new coronavirus variant on economic recovery after reports indicated that Omicron patients had only shown mild symptoms. This was evident from a strong two-day rally in the equity markets, which tends to drive flows away from traditional safe-haven assets. Nevertheless, gold, so far, has managed to hold in the positive territory, with bulls awaiting a sustained move beyond the 200-day SMA.
The focus now shifts to the latest US consumer inflation figures, due for release on Friday. The data would influence the Fed's decision to taper its stimulus at a faster pace and set the stage for an eventual interest rate hike in 2022. It is worth mentioning that the money markets have been pricing in the possibility of liftoff in May. Hence, the US CPI report will play a key role in influencing the near-term trajectory for the non-yielding gold.
In the meantime, developments surrounding the coronavirus saga would be looked upon for some impetus. Apart from this, traders will take cues from the US bond yields, which will drive the USD demand and produce short-term opportunities around gold amid absent relevant market-moving economic releases from the US.
Technical outlook
From a technical perspective, bulls might wait for a sustained move beyond a technically significant 200-day SMA before positioning for any further appreciating move. The mentioned barrier coincides with 100-day SMA. A convincing breakthrough the mentioned confluence hurdle should push spot prices beyond the $1,800 mark, towards the next relevant resistance near the $1,810-15 supply zone. The momentum could further get extended towards the $1,832-34 strong horizontal barrier, which should act as a key pivotal point for short-term traders.
On the flip side, the $1,783 area now seems to protect the immediate downside ahead of the overnight swing low, around the $1,772 region. This is followed by support near the $1,762 zone (monthly low), below which the XAU/USD could accelerate the fall towards the $1,752-51 support.
Gold daily chart
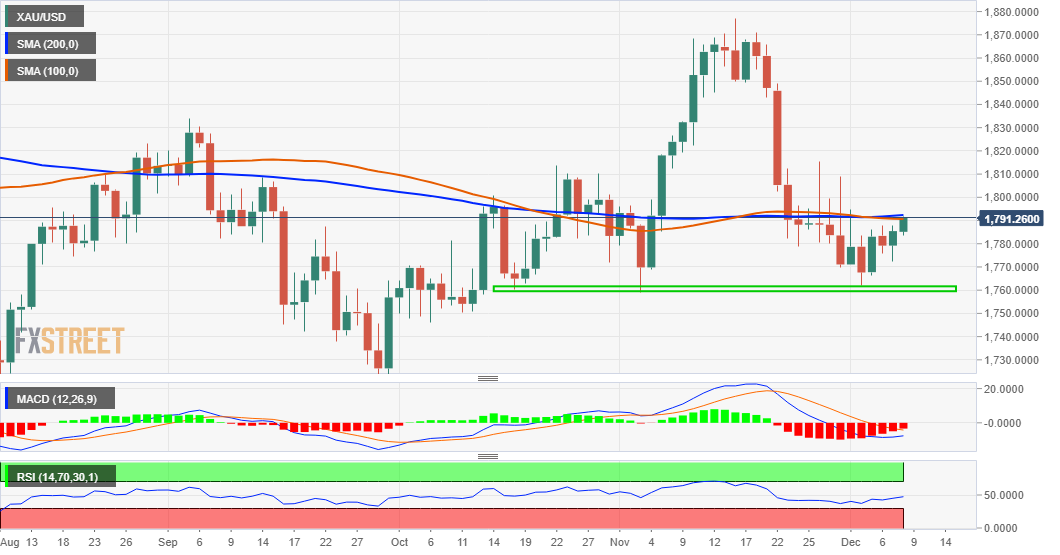
Key levels to watch
The Bank of Japan (BOJ) Deputy Governor Masayoshi Amamiya is back on the wires, via Reuters, commenting on the central bank’s pandemic emergency stimulus and the new Omicron covid variant.
Key quotes
Must be flexible on timing for deciding on fate of BOJ’s pandemic-relief programmes.
BOJ will decide either in Dec or January on whether to extend deadline for pandemic-relief programmes.
Omicron variant heightening uncertainty for Japan’s economic outlook.
Our baseline view is that Japan’s economy will show clearer recovery in first half of next year.
Undecided on whether to end or expand pandemic-relief programmes upon march deadline, will closely watch BOJ tankan, other data on corporate funding.
Japan's base money growth may slow if at some point BOJ ends pandemic-relief loan programmes.
Reviewing, ramping up BOJ’s pandemic-relief progammes is a possibility depending on financial conditions at the time.
Market reaction
USD/JPY was last seen trading at 113.45, down 0.07% so far.
- USD/IDR prints three-day downtrend, remains pressured around intraday low.
- Indonesia Consumer Confidence jumps to highest since early 2020.
- Softer yields, risk-on mood also exert downside pressure.
USD/IDR stays depressed near $14,330 while declining for the third consecutive day, down 0.14% intraday, ahead of Wednesday’s European session.
Although broad US dollar weakness could be linked to the Indonesian rupiah (IDR) pair’s declines, firmer consumer sentiment data from Indonesia also favored the pair sellers of late.
That said, the nation’s Consumer Confidence Index jumped to 118.5 during November, versus October 113.4, to print the highest level since January 2020. The sentiment gauge portrays “improving perception of economic conditions amid a rise in incomes and job opportunities, the central bank said in a report on Wednesday,” per Reuters.
On the other hand, receding fears of the South African coronavirus variant, dubbed as Omicron, join Japan and China’s readiness to safeguard respective economies to favor risk appetite. It’s worth noting that geopolitical tensions between the Washington and Kremlin, as well as the US-China tussles, join fears of Chinese real-estate companies’ default to probe the optimists and challenge USD/IDR bears.
Against this backdrop, the US 10-year Treasury yields drop 1.7 basis points (bps) to 1.463% at the latest while S&P 500 Futures and Asia-Pacific stocks remain positive by the press time.
Moving on, risk catalysts are the key for intraday traders of the USD/IDR pair while inflation data from China and the US, scheduled for release on Thursday and Friday respectively, will be important to watch afterward.
Technical analysis
A clear downside break of the 200-DMA, around $14,365 at the latest, keeps USD/IDR sellers hopeful to aim for the late November’s swing low surrounding $14,170.
- USD/TRY consolidates recent losses inside bearish chart pattern.
- Receding bullish bias of MACD, downside break of 5-DMA suggest pullback.
- 10-DMA adds strength to $13.25 support level, weekly resistance line offers extra hurdle to the north.
USD/TRY hovers around $13.55, up 0.55% intraday during early Wednesday morning in Europe.
The Turkish lira (TRY) pair dropped the most in a week the previous day while breaking the 5-DMA support. That said, the quote remains inside a two-week-old rising wedge bearish formation.
Also keeping the pair sellers hopeful is the receding bullish bias of the MACD and overbought RSI conditions.
Even so, the 10-DMA toughens the $13.25 support and challenge short-term sellers, a break of which will confirm the bearish chart pattern suggesting a slump towards sub $11.00 region.
During the fall, a November 24 low of $11.57 may offer an intermediate halt whereas October’s peak surrounding $9.40 will lure the USD/TRY bears afterward.
On the contrary, a clear upside break of 5-DMA, around $13.65 at the latest, will push the pair towards a one-week-old descending trend line near $13.90.
In a case where the USD/TRY rises beyond $13.90, the $14.00 round figure and the upper line of the stated wedge close to $14.50, will be in focus.
USD/TRY: Daily chart
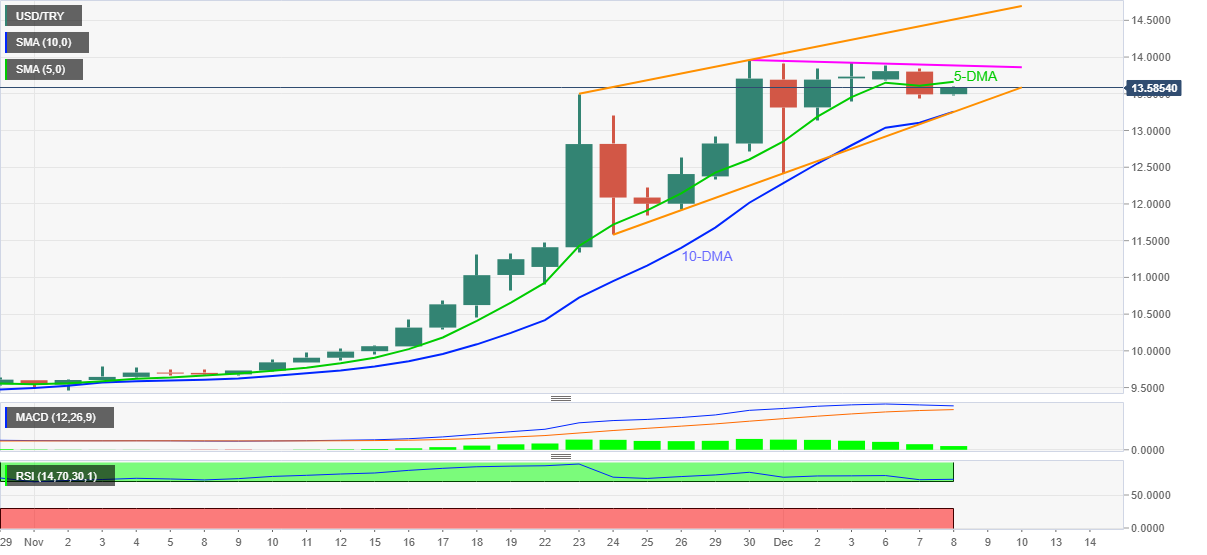
Trend: Pullback expected
- EUR/USD rises the most in a week, off late November bottom.
- Yields weigh amid geopolitical, financial chatters but Omicron, stimulus keep markets hopeful.
- ECB seems divided over easy money after mixed data, absence of Fedspeak adds to the bullish bias.
- US inflation becomes the key, risk catalysts can entertain bulls meanwhile.
EUR/USD grinds higher around the intraday top of 1.1293, up 0.20% on a day, heading into Wednesday’s European session. The major currency pair benefits from the US dollar pullback, underpinned by the softer Treasury yields amid a lack of major catalysts.
The US Dollar Index (DXY) snaps a five-day uptrend, down 0.14% intraday around 96.17 by the press time. That said, the US 10-year Treasury yields drop 1.7 basis points (bps) to 1.463% at the latest while retreating from a weekly high.
An absence of Fed rate hike signals, due to the generally observed silent period before the next week’s Federal Open Market Committee (FOMC) and Friday’s US Consumer Price Index (CPI) seems to weigh on the US Treasury yields of late, which in turn weigh on the US dollar. Also exerting downside pressure on the pair is the market’s risk-on mood that reduces the greenback’s safe-haven demand.
The receding fears of the South African coronavirus variant, dubbed as Omicron, join policymakers’ readiness to safeguard respective economies of China and Japan to favor risk appetite. On the other hand, geopolitical tensions between the Washington and Kremlin, as well as the US-China tussles, join fears of Chinese real-estate companies’ default to probe the optimists and challenge EUR/USD buyers.
Additionally supporting the EUR/USD bulls could be the European Central Bank (ECB) policymakers’ indecision over the next moves. ECB governing council member Madis Muller said on Tuesday that it is not obvious that the bank should be adding to its Asset Purchase Programme purchase volumes beyond March in light of high inflation and the uncertain outlook. On the same line were comments from Slovak central bank Governor and European Central Bank governing council member Peter Kazimir who said, per Reuters, “We should be wary of premature tightening.”
It’s worth noting that the policymaker from Germany and recently mixed data challenge the ECB doves hence raising doubts on the EUR/USD run-up.
Moving on, a lack of major data/events highlights risk catalysts as the key for the near-term trade direction. Important among them are headlines from China and Russia, as well as concerning Omicron.
Technical analysis
EUR/USD rebound needs validation from the 10-DMA level surrounding the 1.1300 to aim for a five-week-old resistance line near 1.1380. In absence of this, the pair remains directed towards the 1.1230 and the yearly low of 1.1186.
- USD/INR refreshes intraday high, pokes weekly top following RBI decision.
- RBI matches market forecasts of no change in policy rates, Governor Das sounds optimistic.
- Market sentiment remains firm amid receding fears from Omicron, hopes of more stimulus.
- Headlines from China, Russia test bulls but softer yields, Wall Street gains underpin optimism.
USD/INR rakes the bids to renew daily high around 75.46 following the Reserve Bank of India (RBI) Interest Rate Decision on early Wednesday.
The Indian central bank kept the benchmark interest rate (Repo) and Reverse Repo rate unchanged at 4.0% and 3.35% respectively, matching market consensus. It’s worth noting that some analysts on the street cited mild chances of a hike in the Reverse Repo rate ahead of the event. Additionally, the RBI also kept Marginal Standing Facility (MSF) and Bank Rate unchanged.
Following the monetary policy decision, RBI Governor Shaktikanta Das said, “Prospects of economic activity steadily improving,” per Reuters. “Stance accommodative as long as necessary to revive growth on a durable basis,” adds RBI’s Das.
Other than the RBI verdict, risk-on mood and downbeat US Treasury yields were trying the challenge the latest run-up in the USD/INR prices.
An absence of the Fed rate hike chatters, mainly due to the silent period before the next week’s Federal Open Market Committee (FOMC) and Friday’s US Consumer Price Index (CPI). On the other hand, receding fears of the South African coronavirus variant, dubbed as Omicron, join policymakers’ readiness to safeguard respective economies of China and Japan to favor risk appetite.
Alternatively, geopolitical tensions between the Washington and Kremlin, as well as the US-China tussles, join fears of Chinese real-estate companies’ default to probe the optimists and limit the USD/INR downside.
Amid these plays, the US 10-year Treasury yields drop 1.7 basis points (bps) to 1.463% at the latest while retreating from a weekly high whereas the S&P 500 Futures rise 0.40% intraday by the press time. It’s worth noting that Wall Street benchmarks rallied the previous day with the S&P 500 marking the best run-up since March.
Moving on, a lack of major data/events may challenge the USD/INR pair traders, highlighting the risk catalysts to be watched for fresh impulse. However, Thursday’s inflation data from China, followed by the US CPI, will be crucial to follow ahead of the next week’s Fed meeting.
Technical analysis
Although 75.50 guards the immediate upside of the USD/INR prices, comprising mid-October tops, bullish bias remains intact until the quote drops back below a seven-week-old horizontal area near 75.20.
- NZD/USD extends the previous day’s rebound to refresh one-week high.
- Clear break of three-week-old descending trend line, bullish MACD and firmer RSI favor bulls.
- Weekly support line, October 2020 high will challenge bears.
NZD/USD pierces 50-SMA to refresh weekly top around 0.6800 during early Wednesday.
The kiwi pair’s latest run-up could be linked to the sustained break of a descending trend line from November 18. Also favoring the pair buyers are the bullish MACD signals and firmer RSI line, not overbought.
It should be noted, however, that a clear run-up past 50-SMA level of 0.6805 becomes necessary for the NZD/USD prices to aim for a 10-week-old horizontal area surrounding 0.6860-65, a break of which will recall the 0.6900 threshold to the charts.
Should NZD/USD fades upside momentum, the previous resistance line near 0.6785 will precede the recent lows near 0.6735 and the 0.6700 round figure to lure the short-term sellers.
Additionally, the quote’s bearish impulsive past-0.6700, it becomes vulnerable to slump towards the November 2020 lows near 0.6590 will be in focus.
To sum up, NZD/USD rebound need validation before convincing the bulls.
NZD/USD: Four-hour chart
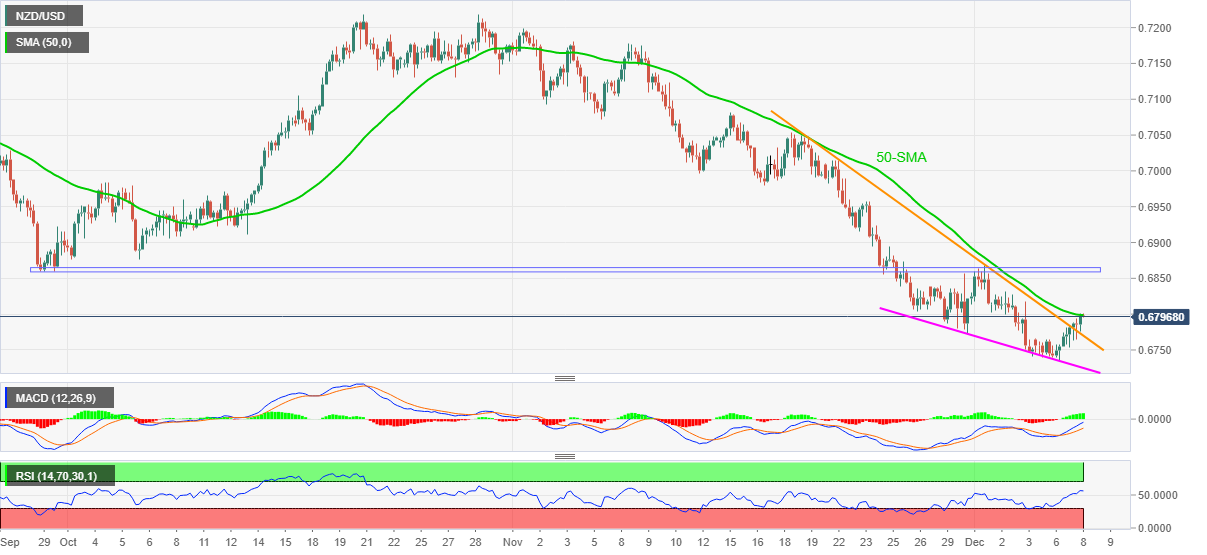
Trend: Further upside expected
- Asian equities remain amid optimism surrounding Omicron, stimulus.
- Sino-American tussles, Russia-Ukraine tension weigh on yields, Evergrande, Kaisa also challenge optimists.
- Japan’s Q3 GDP eases, US pushes for faster debt ceiling extension.
- S&P 500 rose the most since March, yields refreshed weekly top before the latest pullback.
Asian shares print gains during early Wednesday amid the market’s hopes to overcome the South African covid variant with the available resources. Adding to the firmer sentiment could be comments from Japan and China showing readiness to safeguard financial markets from coronavirus and default risks.
That said, the MSCI’s index of Asia-Pacific shares outside Japan rises over 0.45% intraday while Japan’s Nikkei 225 gains 1.5% heading into the European session.
As Japanese policymakers battle over multi-billion dollars of the aid package, the easing of the Q3 GDP figures adds strength to the government pushing for easy money. The same could be said for China as Evergrande and Kaisa defaults loom. As a result, stocks in China and Pacific markets are mostly up amid stimulus hopes.
South Korea’s KOSPI and Indonesia’s IDX Composite tracks China but fears of Sino-American tussles, following the major boycott of Beijing Olympics 2022, probe the bulls. Also challenging the market sentiment is the US-Russia tussles over Ukraine as US President Joe Biden warns Russia of sanctions and helps Ukraine with military power if Kremlin invades Kyiv.
Furthermore, India’s BSE Sensex rises 1.30% at the latest as markets brace for the Reserve Bank of India’s (RBI) inaction.
Elsewhere, the US 10-year Treasury yields decline two basis points (bps) to 1.47% at the latest while retreating from a weekly high whereas the S&P 500 Futures print rise 0.20% intraday at the latest. It’s worth noting that Wall Street benchmarks rallied the previous day with the S&P 500 marking the best run-up since March.
Considering a lack of major data/events, Asia-Pacific markets will Thursday’s China inflation data and Friday’s US Consumer Price Index (CPI) for clear direction. Meanwhile, geopolitical headlines and company-specific news from China, coupled with the Omicron updates, will entertain the traders.
Read: Yields decline, S&P 500 Futures print mild gains on mixed concerns
- USD/CAD runs hard into support territory on the weekly and daily time frames.
- Bulls could be looking for an entry should the price start to correct and eye 1.2750.
USD/CAD has dropped this week all the way to the 38.2% Fibonacci retracement of the prior bullish impulse. Moving into the daily time frame, the area has been a significant zone for where transactions took place and it could therefore be expected to act as a support. The following illustrates the price action and confluences of technical influences that could lead to a correction towards 1.2750 in the coming days.
USD/CAD weekly chart
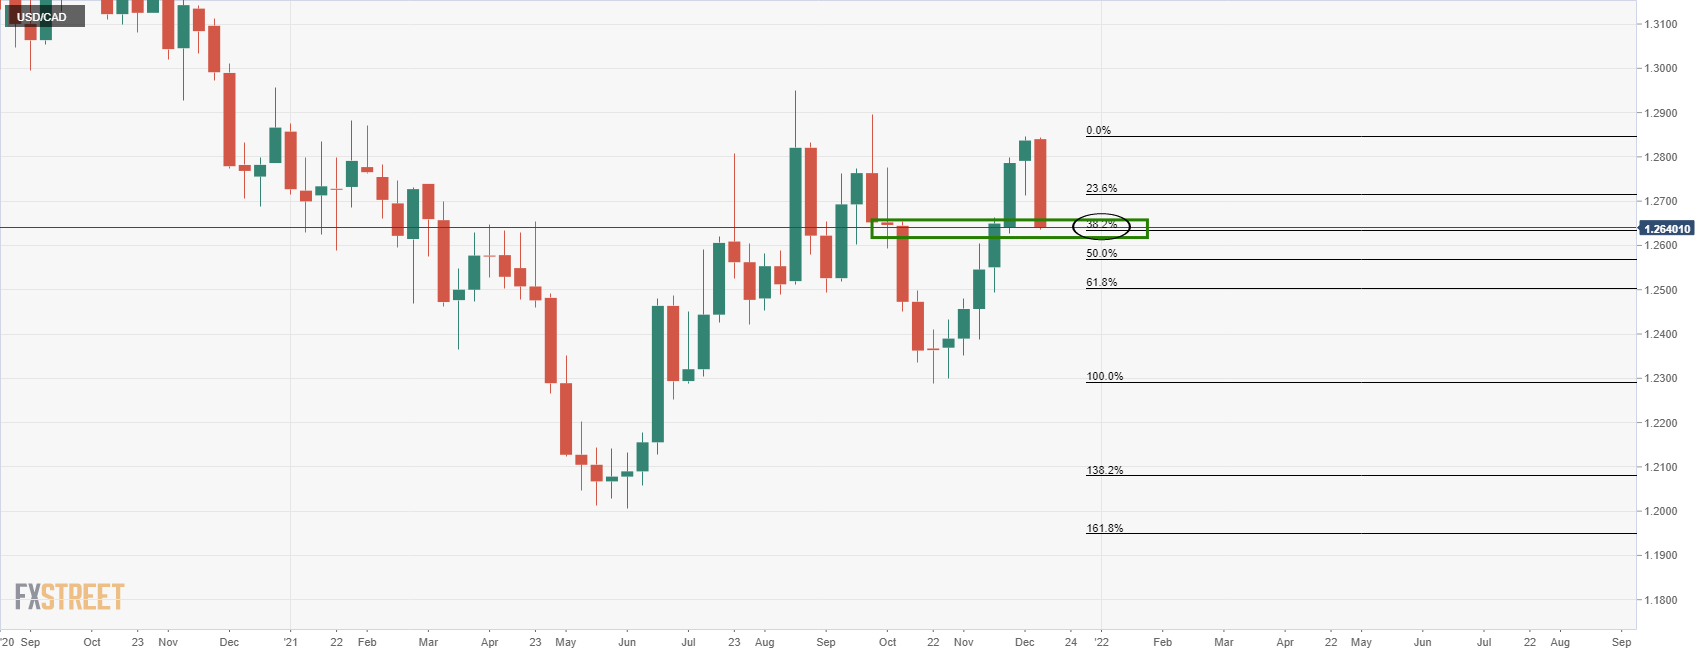
The daily chart illustrates the support more clearly and a correction from here could target a 50% mean reversion near 1.2740 in the coming days:
USD/CAD daily chart
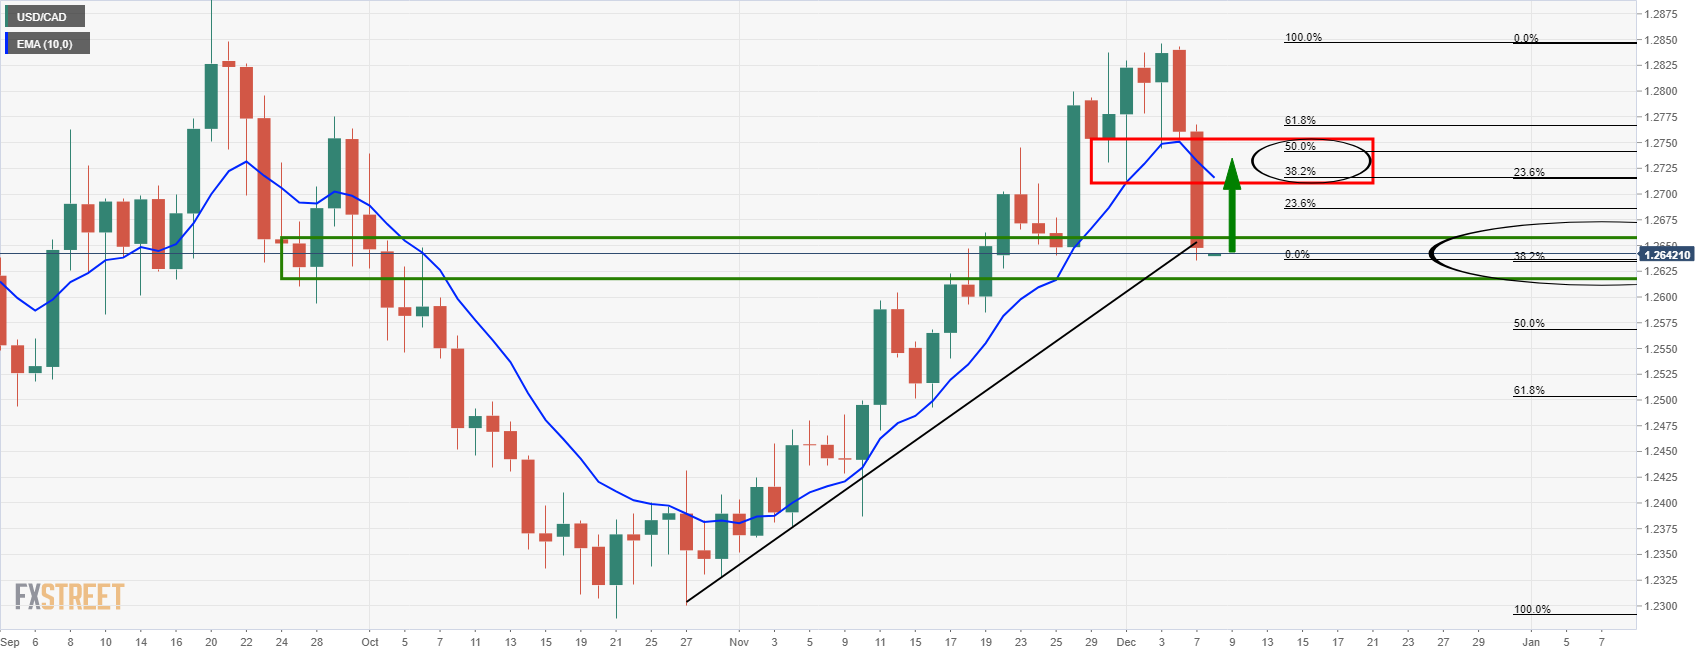
The expected resistance zone also has the 10-EMA in confluence which would be expected to reinforce that area on initial tests.
- AUD/USD prints three-day rebound from yearly bottom, rises one-week high at the latest.
- Clear break of 10-DMA, descending trend channel favor buyers.
- RSI, MACD conditions add to the bullish bias targeting 10-week-old horizontal resistance.
- Lows marked during November 2020, December 2021 offer strong support.
AUD/USD takes the bids to refresh weekly high around 0.7145 during early Wednesday. In doing so, the Aussie pair justifies the upside break of the key 0.7110 resistance confluence, now support, amid firmer sentiment.
Given the receding bearish bias of the MACD and RSI’s rebound from the oversold area, the quote is likely to extend recovery from a horizontal area including lows marked during November 2020 and so far during December 2021, near 0.6990.
Hence, the AUD/USD bulls are set to battle the 0.7170 resistance that encompasses September lows and last week’s tops. However, the quote’s further upside will need validation from bottoms marked during late August and September, close to 0.7225-30.
Meanwhile, pullback moves will aim for the 0.7000 threshold but the rock-solid support near 0.6990 will challenge the AUD/USD bears afterward.
In a case where the pair drops past-0.6990, it becomes vulnerable to slump towards June 2020 swing lows of 0.6775. During the fall, the 0.6900 and the 0.6800 thresholds may act as buffers.
AUD/USD: Daily chart
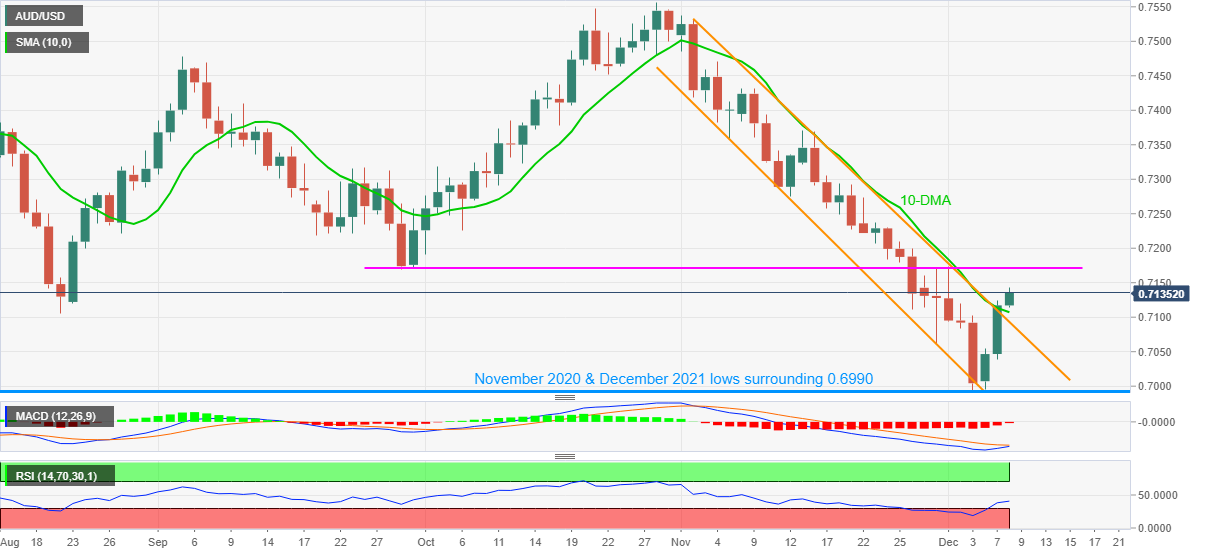
Trend: Further upside expected
- GBP/USD bulls are in play and testing the resistance in the 1.3250s.
- The US dollar is on the back foot as risk appetite picks up again.
At the time of writing, GBP/USD is printing back in the green at 1.32537 after climbing from a low of 1.3231 to a high of 1.3254 in Asia so far. The US dollar is sliding and trades down some 0.11% as measured against six major rival currencies in the DXY index.
The Benchmark 10-year and 30-year US Treasury yields have pulled back from their one-week highs hit on Tuesday and are sliding further in Asia which is pressuring the greenback. Most other asset classes are in the green with Japanese shares rebounding as investors stay hopeful that the Omicron coronavirus variant may be less disruptive for the global economy than initially feared.
South Africa was the first country to detect the Omicron variant, since then it has dealt with a massive surge in coronavirus cases. But in the last few days, the trend gave the impression that the situation was improving. For many, this has been highly encouraging. However, levels in testing are not constant so the data is hard to ratify. Nevertheless, the signs, so far, are that the variant is not any more severe than other variants of covid-19 and for now, markets are cheering that.
BoE eyed
Meanwhile, traders are looking to the Bank of England that is now expected to hold off again next week on becoming the world's first big central bank to raise interest rates from their pandemic lows. On Tuesday, investors were pricing in a roughly 50% chance of the BoE raising Bank Rate to 0.25% on Dec. 16 This lower from around 75% last week but higher than just a one-on-three chance immediately after the speech by MPC's Michael Saunders on Friday.
Saunders, one of two members of the nine-strong Monetary Policy Committee who voted to raise the Bank Rate to 0.25% in November, said on Dec. 3 there "could be particular advantages in waiting to see more evidence" of Omicron's impact.
Key data on Dec 10
Looking ahead for the week, the domestic date on Dec 10 monthly will be the Gross Domestic Product report for October. ''Manufacturing likely pulled down on growth with a relatively sharp fall, driven in part by a decline in motor vehicle production, but we see upside risks elsewhere (including for the Index of Services), as consumers pulled forward demand over fears of end-of-year shortages, '' analysts at TD Securities said. ''This would leave GDP growth roughly on track for the BoE's recent forecast of 1.0% QoQ.
On the same day, the US Consumer Price Index (CPI) report is due and economists in a Reuters poll forecast November CPI at 0.7%.
- USD/CNH takes offers to refresh multiday low, down for second consecutive day.
- RSI, Momentum hints at further weakness before the bounce.
- Channel’s support, yearly bottom act as the key levels for bears to watch, 20-DMA guards immediate upside.
USD/CNH stands on the slippery ground near $6.3590, down 0.10% intraday as the quote drops to the fresh low since November 16 during early Wednesday.
In doing so, the Chinese offshore yuan (CNH) remains on the back foot inside a downward sloping trend channel established since October 19.
Given the descending RSI and Momentum line, not oversold, USD/CNH has some room to the south before hitting the likely reversal points.
Among them is the support line of the stated channel, around $6.3545, followed by the yearly low of $6.3524.
In a case where USD/CNH bears dominate below $6.3524, the bottom of the year 2018 near $6.2355 will be in focus.
Alternatively, 20-DMA level of $6.3815 guards immediate upside ahead of the channel’s upper line, close to $6.3970.
Should the USD/CNH breaks $6.3970, the $6.4000 threshold will challenge the bulls ahead of directing them to the descending resistance line from April, near $6.4620.
USD/CNH: Daily chart
Trend: Further weakness expected
| Raw materials | Closed | Change, % |
|---|---|---|
| Brent | 75.32 | 2.43 |
| Silver | 22.491 | 0.46 |
| Gold | 1784.053 | 0.29 |
| Palladium | 1839.6 | -0.23 |
- USD/CHF is losing grip of the mid point of the 0.92 area.
- USD is on the backfoot, but markets are keeping an eye on the SNB.
- Markets will be looking to the US JOLTS and then Consumer Price Index as another potential catalyst.
USD/CHF is a touch lower in Asia, trading down 0.1% at the time of writing after travelling between a low of 0.9237 and a high of 0.9250 so far on the day. The is scope for further downside to test the 0.9220 support area with the US dollar under some pressure ahead of key US data later in the week.
Meanwhile, the broader theme is risk-on with investors cheering comments from the weekend that cases in South Africa, where the Omicron variant was expected to have originated, showed milder symptoms. The top US infectious disease official, Anthony Fauci, said "it does not look like there's a great degree of severity" so far. This has been supporting risk appetite which led to an unwind in the Swiss franc at the start of the week. The US dollar caught a bid as well which propelled USD/CHF to 0.9275.
However, the heat in the dollar has cooled in recent trade and it is treading water in the middle of its range over the past 2-1/2 weeks near 96.20. as measured by six currencies in the dollar index, DXY. There is scope for lower levels, however, as the euro, the component of the index with the largest share, is on a tear higher. EUR/USD has rallied from a New York session low of 1.1227 to a high of 1.1283 in Asia.
Eyes on SNB
Meanwhile, the Swiss National Bank (SNB) is following the Swiss franc's exchange rate "very closely" to monitor its impact on the economy. Markets are hesitant to chase the strength in the swiss franc due to the prospects of the central bank intervening. Governing board member Andrea Maechler told recently stated that the SNB remains ready to intervene when necessary,
"At the SNB, we're always ready to intervene in foreign exchange markets if needed," Maechler said during the interview with RTS' TV programme Forum. "We don't target a specific exchange rate, neither a specific level nor a specific rate versus the euro or the dollar, but we follow it very closely to see the impact on the economy."
The Swiss franc hit its highest level against the euro six years earlier this week, albeit without signs of the currency interventions the SNB has often undertaken at such moments in the past. Maechler said it was difficult for the economy to deal with sudden changes in the exchange rate, while gradual adjustments were easier to handle. "An exchange rate is a value versus a foreign currency so it also depends on the inflation we have here in Switzerland versus the inflation abroad," she said.
"Inflation signals that the economy is on the path towards recovery. From that point of view, we see it with great optimism," she said. "The question is how fast it goes up and currently we see a certain inflationary pressure. The question is whether this is temporary or the beginning of a big upwards movement."
It was not the central bank's role to react to "each and every shock", she added. She explained it is there to maintain inflation within the SNB's 0% to 2% target range over a mid-term horizon of two to three years.
Looking ahead for the week, the JOLTS report on US job openings is due later Wednesday and this should provide further evidence of a tightening labour market, potentially adding fodder for bets on earlier Fed tightening, which could boost the dollar. Money markets are currently fully priced for a quarter-point rate increase by June. On December 10, markets will be looking to the US Consumer Price Index as another potential catalyst.
''We expect inflation to slow significantly as fiscal stimulus fades and supply constraints ease, but we don't expect the data to be validating in the near term'', analysts at TD Securities said. ''The CPI likely surged in Nov, with a drop in oil coming too late to avert another large gain in gasoline and core prices boosted by rapidly rising used vehicle prices and post-Delta strengthening in airfares and lodging.''
- US 10-year Treasury yields snap two-day uptrend to ease from weekly top.
- S&P 500 Futures track Wall Street benchmark that jumped the most since March.
- Geopolitical news challenges Omicron-linked optimism, financial market fears also test optimists.
- Light calendar, market’s wait for US CPI can trouble momentum traders.
Risk appetite sours during early Wednesday as geopolitical risks emanating from China and Russia weigh on the previous optimism amid a light calendar day.
To portray the mood, the US 10-year Treasury yields decline two basis points (bps) to 1.47% at the latest while retreating from a weekly high. On the other hand, the S&P 500 Futures print rise 0.20% intraday and the stocks in Asia-Pacific are also trading mixed at the latest.
Among the key-risk headlines were those conveying the latest jitters between the US and Russia, as well as Sino-American tussles. Adding to the market’s fears were chatters over the reliability of the Chinese financial markets considering the heavyweights’ looming debt payment.
Starting with the Washington-Kremlin tussle, President Joe Biden warns Russia of sanctions and helps Ukraine with military power if Kremlin invades Kyiv. “The Biden administration is in ‘intensive consultations’ with the new German government over its response if Russia invades Ukraine and believes Germany would be ready to take significant action if Russia launches an attack, a senior U.S. State Department official said on Tuesday,” said Reuters.
Moving on, the American boycott of the 2022 Beijing Olympics doesn’t bode well with China as the dragon nation hints at consequences due to the same. Additionally, global financial markets turn cautious as Evergrande and Kaisa are approaching bond payment deadlines after barely paying the interests.
On the contrary, Japan’s optimism for more stimulus and Beijing’s readiness to safeguard the financial markets join the receding fears of the South African coronavirus variant, dubbed as Omicron, to favor the market sentiment.
That said, a cautious mood may challenge optimists ahead of Friday’s US Consumer Price Index (CPI), which in turn highlights risk catalysts as the key factor to watch clear direction.
Read: Forex Today: Optimism leads, but would it last?
- Gold prices grind higher around weekly top, eyes to snap three-week downtrend.
- DXY pullback stops sellers even as market sentiment dwindles of late.
- Yields step back, stock futures print mild gains amid fresh challenges to risk appetite ahead of the key US CPI.
- Gold Price Forecast: Consolidative phase continues, 1,758.80 still at sight
Gold (XAU/USD) picks up bids around $1,787 during early Wednesday, after refreshing the weekly high the previous day.
The yellow metal previously cheered the risk-on mood but the latest challenges to sentiment confront US Dollar Index (DXY) pullback to test the gold traders. That said, the yellow metal remains on the way to snap a three-week downtrend while keeping the previous week’s bounce off the monthly bottom.
DXY drops 0.08%, the first daily loss in six days while tracking the softer US bond coupons. The US 10-year Treasury yields decline two basis points (bps) to 1.47% at the latest while retreating from a weekly high. However, the S&P 500 Futures print mild gains and the stocks in Asia-Pacific are also trading mixed as traders jostle with contrasting news.
The receding fears of the South African coronavirus variant, dubbed as Omicron, joined policymakers’ readiness to safeguard respective economies of China and Japan to favor risk appetite previously. However, geopolitical tensions between the Washington and Kremlin, as well as the US-China tussles, joins fears of Chinese real-estate companies’ default to recently weighing on risk appetite.
That said, the US marks its dissent over the Russia-Ukraine tension by warning the Kremlin of sanctions, in addition to backing Ukraine with military power, if the two countries indulge in a war. “The Biden administration is in ‘intensive consultations’ with the new German government over its response if Russia invades Ukraine and believes Germany would be ready to take significant action if Russia launches an attack, a senior U.S. State Department official said on Tuesday,” said Reuters.
On a different page, China hints at consequences for the US, per local media, after Washington boycotts the 2022 Beijing Olympics. It’s worth noting that the reports of partial payment to Evergrande bondholders and looming payment for Kaisa raise fears in the Chinese markets, challenging global sentiment as well.
While challenges to risk appetite tests gold buyers, in contrast to the softer yields favoring prices, a lack of major data/events keeps the commodity traders looking for more macros for clear direction ahead of Friday’s US Consumer Price Index (CPI).
Technical analysis
In contrast to the latest performance, technical patterns challenge gold buyers as it remains below the previous support line from September 30 amid bearish MACD signals.
Also favoring gold sellers is the bearish play of the moving average crossover, popularly known as the bear cross, portrayed by the 50-day EMA’s piercing off 200-day EMA.
That said, gold’s fresh declines may initially look to a seven-week-old horizontal area surrounding $1,762-60. Though, the $1,750 round figure and September’s low near $1,721 will question the metal’s further downside.
Alternatively, recovery moves will initially aim for the weekly top near $1,787 but the support-turned-resistance will challenge the gold buyers around $1,795.
Even if the bullion manages to cross the $1,795 hurdle, the stated EMA’s will act like a tough nut to crack for the gold bulls near the $1,800 threshold.
Gold: Daily chart
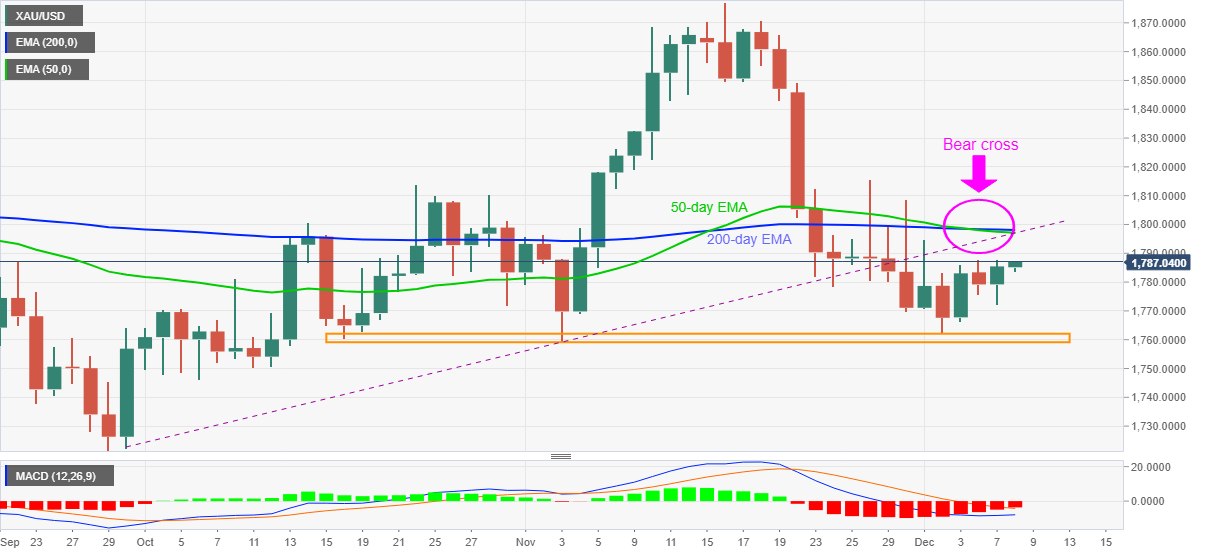
Trend: Further weakness expected
Bank of Japan's Masayoshi Amamiya said that Japan’s economy has stagnated but is expected to show clearer recovery through next year.
The comments follow today's Gross Domestic Product (GDP) that, quarter-on-quarter basis, fell 0.9%, slightly worse than the initial reading and median forecast for a 0.8% drop.
Japan's economy shrank 3.6% in the third quarter, worse than the initial estimate of a 3.0% contraction, revised government data showed on Wednesday, posting a decline as private spending took a hit from a resurgence in COVID-19.
Separate data due on Dec. 10 at 8:50 a.m. (Dec. 9 at 2350 GMT) is expected to show wholesale inflation accelerated further to a new 40-year high, according to Reuters. ''The corporate goods price index likely gained 8.5% in November from a year earlier, after rising 8.0% in October.''
USD/JPY analysis
-
USD/JPY tracks yields to snap two-day uptrend around 113.50
From a daily perspective, the price is stalling at a 38.2% Fibo and could easily flip to the downside at this juncture:
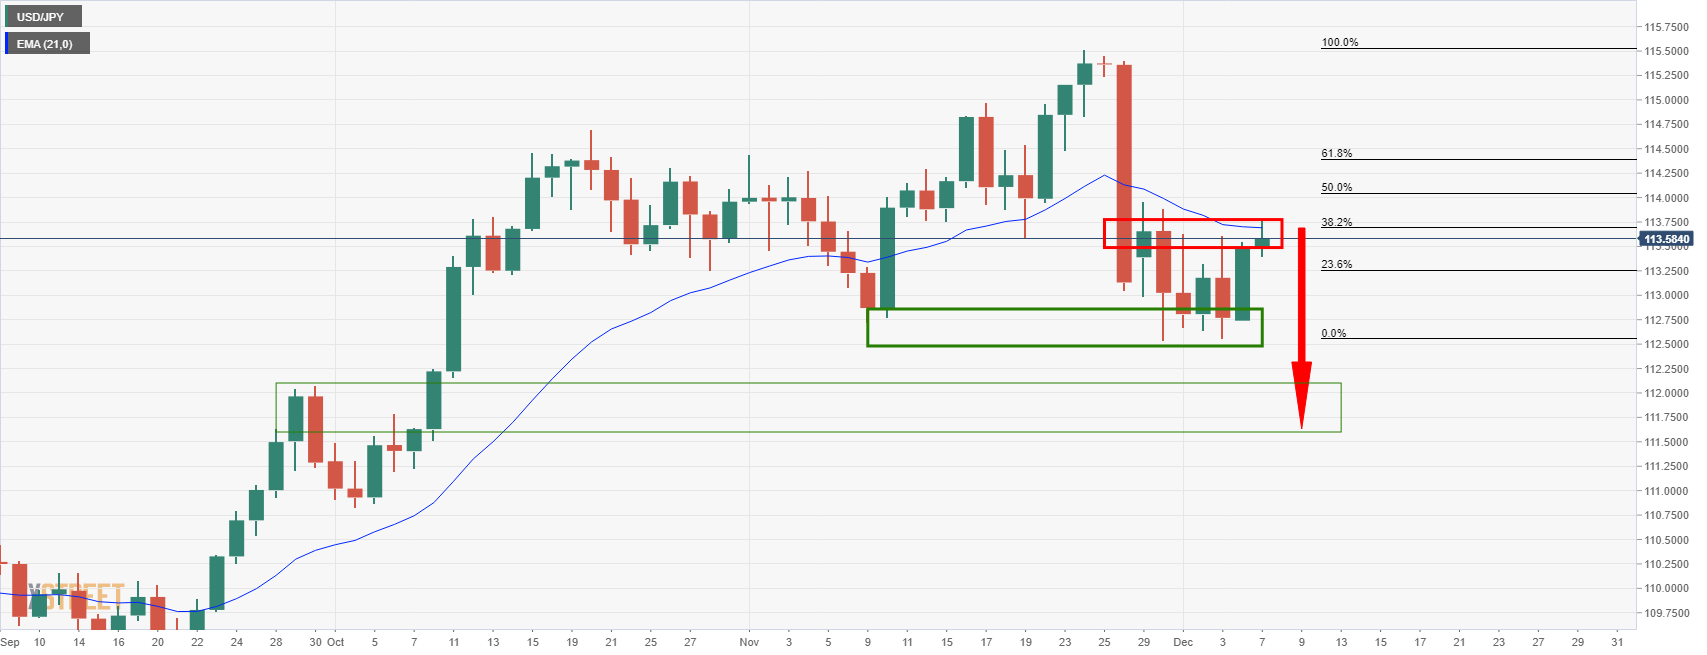
| Time | Country | Event | Period | Previous value | Forecast |
|---|---|---|---|---|---|
| 05:00 (GMT) | Japan | Eco Watchers Survey: Current | November | 55.5 | |
| 05:00 (GMT) | Japan | Eco Watchers Survey: Outlook | November | 57.5 | |
| 06:30 (GMT) | France | Non-Farm Payrolls | Quarter III | 1.1% | |
| 15:00 (GMT) | U.S. | JOLTs Job Openings | October | 10.438 | 10.369 |
| 15:00 (GMT) | Canada | Bank of Canada Rate | 0.25% | 0.25% | |
| 15:30 (GMT) | U.S. | Crude Oil Inventories | December | -0.91 | -1.705 |
| 22:00 (GMT) | Australia | RBA's Governor Philip Lowe Speaks | |||
| 23:50 (GMT) | Japan | BSI Manufacturing Index | Quarter IV | 7% |
In recent trade today, the People’s Bank of China (PBOC) set the yuan (CNY) at 6.3677 vs the last close of 6.3658.
About the fix
China maintains strict control of the yuan’s rate on the mainland.
The onshore yuan (CNY) differs from the offshore one (CNH) in trading restrictions, this last one is not as tightly controlled.
Each morning, the People’s Bank of China (PBOC) sets a so-called daily midpoint fix, based on the yuan’s previous day closing level and quotations taken from the inter-bank dealer.
- DXY snaps five-day uptrend, refreshes intraday low at the latest.
- Yields ease as virus-linked optimism fades, geopolitical tensions erupt.
- Financial market risk from China adds strength to the sour sentiment.
US Dollar Index (DXY) steps back from the week’s high, pressured around intraday low near 96.25 during Wednesday’s Asian session. The greenback gauge tracks US Treasury yields to the south amid fresh challenges to the market sentiment, as well as due to the absence of major catalysts at home.
Recently probing market optimists are the geopolitical headlines concerning the rift between the Washington and Kremlin, as well as the US-China tussles. Adding to the market fears could be the doubts over Chinese real-estate giants.
Russian refrain to make peace with Ukrain irritates the US as President Joe Biden warns Russian counterpart Vladimir Putin of sanctions and helps Ukraine with military power if Kremlin invades Kyiv. “The Biden administration is in ‘intensive consultations’ with the new German government over its response if Russia invades Ukraine and believes Germany would be ready to take significant action if Russia launches an attack, a senior U.S. State Department official said on Tuesday,” said Reuters.
On a different page, the US boycott of the 2022 Beijing Olympics doesn’t bode well with China as the dragon nation hints at consequences for America due to the same, per Chinese media. Additionally, the market’s optimism also fades amid doubts over China’s struggling real-estate firms’, Evergrande and Kaisa, capacity to pay the looming debt after barely paying the interests.
Alternatively, receding fears of the South African coronavirus variant, dubbed as Omicron keeps markets hopeful.
Amid these plays, the US 10-year Treasury yields snap two-day uptrend around 1.47%, down two basis points (bp), whereas S&P 500 Futures struggle to follow its Wall Street benchmark that rallied the most since March.
It’s worth noting that the mixed second-tier data from the US also weigh on the DXY ahead of the key US Consumer Price Index (CPI) for November, up for publishing on Friday. Before that, the risk catalyst is important to determine near-term US Dollar Index moves.
Technical analysis
Despite the latest pullback, DXY bulls remain hopeful until the quote drops below the six-week-old support line near 94.90.
- EUR/USD is attempting to move higher despite the bearish prospects on the hourly chart.
- Risk-on themes are making their way through to Asian markets on Wednesday.
The greenback in sliding in Asia and the euro has extended gains on a strong hourly impulse that started in the early hours of the Nother American session on Tuesday. Concerns over the severity of the omicron virus strain continued to fade which supported riskier asset classes. China also announced measures to boost economic growth which lifted stocks and fed through into the forex space.
At the time of writing, the single currency is on the front foot vs the greenback, printing a fresh corrective high in Tokyo of 1.1277. The US dollar index is down on the day and extending its losses from overnight despite the Federal Reserve Chair Jerome Powell's hawkish stance.
Meanwhile, US stocks rallied the most in nine months, with major averages rising at least 2% on hopes that the omicron variant will not derail global growth. Consequently, US treasuries fell, causing two-year yields to reach their highest level since March 2020. The CBOE volatility index also fell five points to 22 as the risks of the covid variant abate.
In terms of data, the US trade deficit shrank, while third-quarter productivity fell. Private consumption was the most important driver of the eurozone's most recent economic expansion. In the eurozone, Industrial Production in Germany outperformed in October gaining 2.8% MoM. However, the ZEW Survey of Expectations for December weakened from the previous month but was stronger than expected.
US CPI eyed
Looking ahead for the week, the US Consumer Price Index will be key. ''We expect inflation to slow significantly as fiscal stimulus fades and supply constraints ease, but we don't expect the data to be validating in the near term,'' analysts at TD Securities explained. ''The CPI likely surged in Nov, with a drop in oil coming too late to avert another large gain in gasoline and core prices boosted by rapidly rising used vehicle prices and post-Delta strengthening in airfares and lodging.''
EUR/USD technical analysis
From a daily perspective, the price is trapped between support and resistance with 1.1300 the upside target, as per the following line chart's analysis:
One-month risk reversal (RR) of silver (XAG/USD) struggles to portray any clear trend on the daily basis with the latest 0.0000 figures. However, the spread between call and put prices remains firm on the weekly, up 0.125, following a three-week downtrend.
The same hints at the absence of bearish bias for silver, as far as the options market is concerned. Though, the bulls are yet to retake control.
Looking at the prices, XAG/USD picks up bids to $22.53, up 0.09% intraday during Wednesday’s Asian session. That said, the bright metal prints a 0.13% weekly loss while trading around the lowest levels since late September after declining for consecutive three weeks.
It’s worth noting that the recent challenges to the market sentiment underpin the US dollar strength but an absence of Fedspeak ahead of next week’s Federal Open Market Committee (FOMC), as well as Friday’s US Consumer Price Index (CPI), challenges the silver traders.
- USD/JPY steps back from weekly top, refreshes intraday low.
- US Treasury yields drop, stock futures dwindle as geopolitical headlines weigh on previous optimism.
- Japan Q3 GDP came in softer, Tankan Survey portrays optimism for December.
- Qualitative catalysts will be important for clear direction amid a lack of major data/events.
USD/JPY stays pressured around the daily bottom of 113.35 as markets in Tokyo open for Wednesday. In doing so, the yen pair declines for the first time in two days, down 0.05% of late, as fresh challenges to the sentiment weigh on US bond coupons.
Among the key-risk catalysts are the geopolitical tensions between the Washington and Kremlin, as well as the US-China tussles. Adding to the sour sentiment could be the chatters surrounding the fears of Chinese real-estate companies’ default.
US President Joe Biden warns Russia of sanctions and helps Ukraine with military power if Kremlin invades Kyiv. “The Biden administration is in ‘intensive consultations’ with the new German government over its response if Russia invades Ukraine and believes Germany would be ready to take significant action if Russia launches an attack, a senior U.S. State Department official said on Tuesday,” said Reuters.
Further, the US boycott of the 2022 Beijing Olympics doesn’t bode well with China as the dragon nation hints at consequences due to the same. Additionally, the market’s optimism also fades amid doubts over China’s struggling real-estate firms’, Evergrande and Kaisa, capacity to pay the looming debt after barely paying the interests.
It’s worth noting that Japan’s optimism for more stimulus and receding fears of the South African coronavirus variant, dubbed as Omicron keeps USD/JPY buyers hopeful. On the same line is China’s readiness for safeguarding the financial system from default and covid risks.
Talking about data, Japan’s Q3 GDP dropped below -0.8% initial forecast to -0.9% while Tankan Manufacturers’ survey for December was quite optimistic, citing manufacturers’ gauge refreshing four-month high.
While portraying the market mood, the US 10-year Treasury yields snap two-day uptrend around 1.47%, down two basis points (bp), whereas S&P 500 Futures struggle to follow its Wall Street benchmark that rallied the most since March.
Given the lack of interesting data/events on the calendar, risk-related headlines are important for the USD/JPY traders to watch for fresh impulse.
Technical analysis
Tuesday’s Doji below 20-DMA level of 113.95 directs USD/JPY towards the previous resistance line from March, around 112.60 at the latest.
- AUD/USD grinds higher at weekly top following two-day uptrend.
- Yields retreat, US stock futures stay mildly bid on mixed concerns.
- US-Russia, Sino-American stories battle receding fears from Omicron.
- Light calendar, market’s wait for Friday’s US CPI highlights risk catalysts for fresh impulse.
AUD/USD eases to 0.7120, following an uptick to refresh weekly top during the early Asian session on Wednesday.
While fresh challenges to the market’s previous risk-on mood could be cited as testing the bulls, the Aussie pair’s technical breakout of the key hurdle keeps buyers hopeful amid a likely quiet session with no major data/events.
The US warns Russia of sanctions and helps Ukraine with military power if Kremlin invades Kyiv. “The Biden administration is in ‘intensive consultations’ with the new German government over its response if Russia invades Ukraine and believes Germany would be ready to take significant action if Russia launches an attack, a senior U.S. State Department official said on Tuesday,” said Reuters.
Elsewhere, the US boycott of the 2022 Beijing Olympics doesn’t bode well with China as the dragon nation warns Washington of consequences due to the same. Additionally, the market’s optimism also fades amid concerns over China’s struggling real-estate firms like Evergrande and Kaisa.
On the contrary, receding fears of the South African coronavirus variant, dubbed as Omicron, as well as hopes of more stimulus from China, keeps AUD/USD buyers hopeful.
Against this backdrop, the US 10-year Treasury yields snap two-day uptrend around 1.47%, down two basis points (bp), whereas S&P 500 Futures struggle to follow its Wall Street benchmark that rallied the most since March.
Moving on, a lack of major data/events will keep risk catalysts on the driver’s seat. That said, the latest risk-off factors may trigger consolidation of the AUD/USD gains due to the pair’s risk barometer status.
Technical analysis
AUD/USD pierced the key hurdle to the north around 0.7110, comprising 10-DMA and the upper line of a five-week-old descending channel.
That said, the receding bearish bias of MACD signals and RSI rebound from oversold area back the pair’s recovery moves from a horizontal area including lows marked during November 2020 and so far during December 2021, near 0.6990.
Hence, the AUD/USD bulls are set to battle the 0.7170 resistance that encompasses September lows and last week’s tops.
| Pare | Closed | Change, % |
|---|---|---|
| AUDUSD | 0.71184 | 0.94 |
| EURJPY | 127.961 | -0.03 |
| EURUSD | 1.12687 | -0.12 |
| GBPJPY | 150.36 | -0.07 |
| GBPUSD | 1.32419 | -0.14 |
| NZDUSD | 0.6787 | 0.49 |
| USDCAD | 1.26389 | -0.89 |
| USDCHF | 0.92474 | 0 |
| USDJPY | 113.552 | 0.08 |
- AUDNZD bulls are taking charge for a test of 1.05 the figure.
- The daily inverse head and shoulders in compelling.
AUD/NZD is on the move in Asia and the price is on the verge of a breakout. The following illustrates the bullish bias from both a longer-term and short term perspective.
AUD/NZD daily & weekly chart
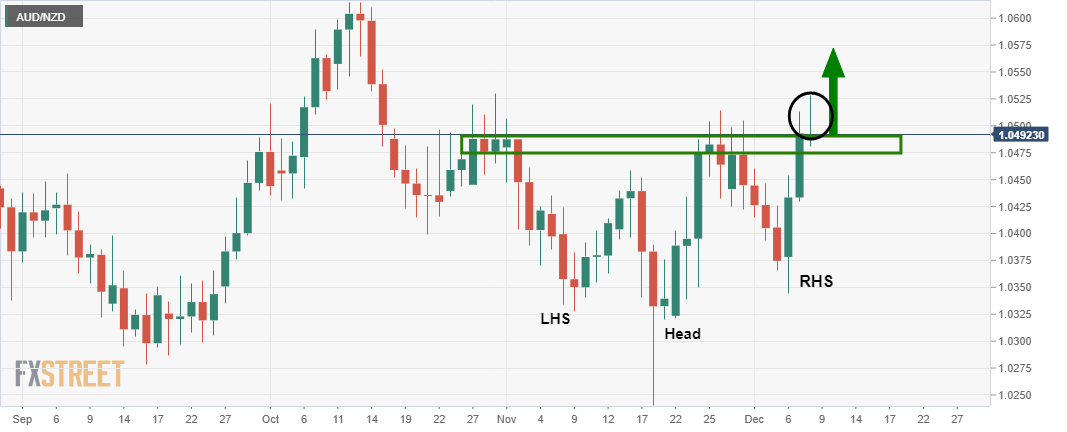
The price is completing am inverse head and shoulders on the daily time frame and has penetrated the weekly chart's M-formation's neckline:
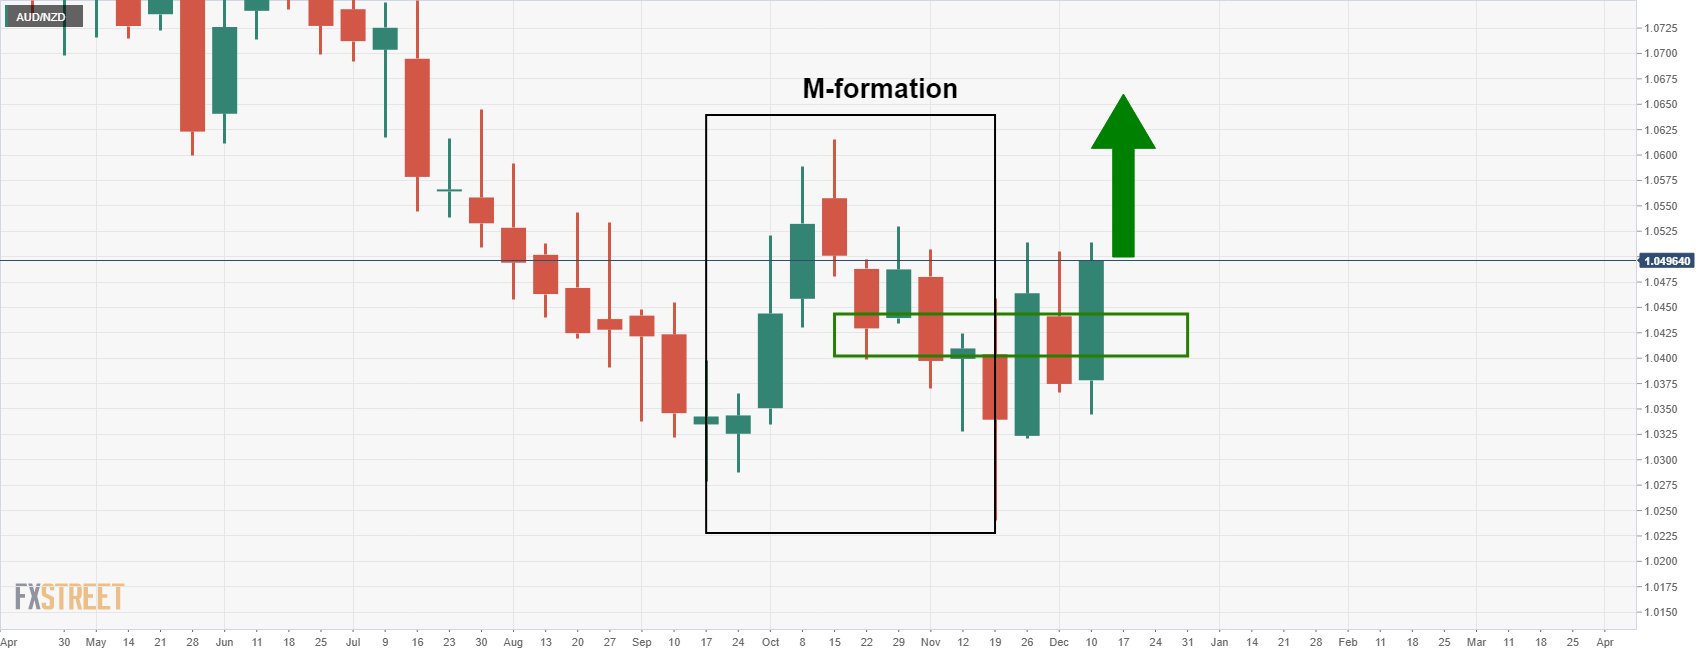
The daily chart illustrates the bullish wick that has been left in the prior day's close which would be expected to be filled in in the coming sessions as per the lower time frame's price action:
AUD/NZD H1 chart
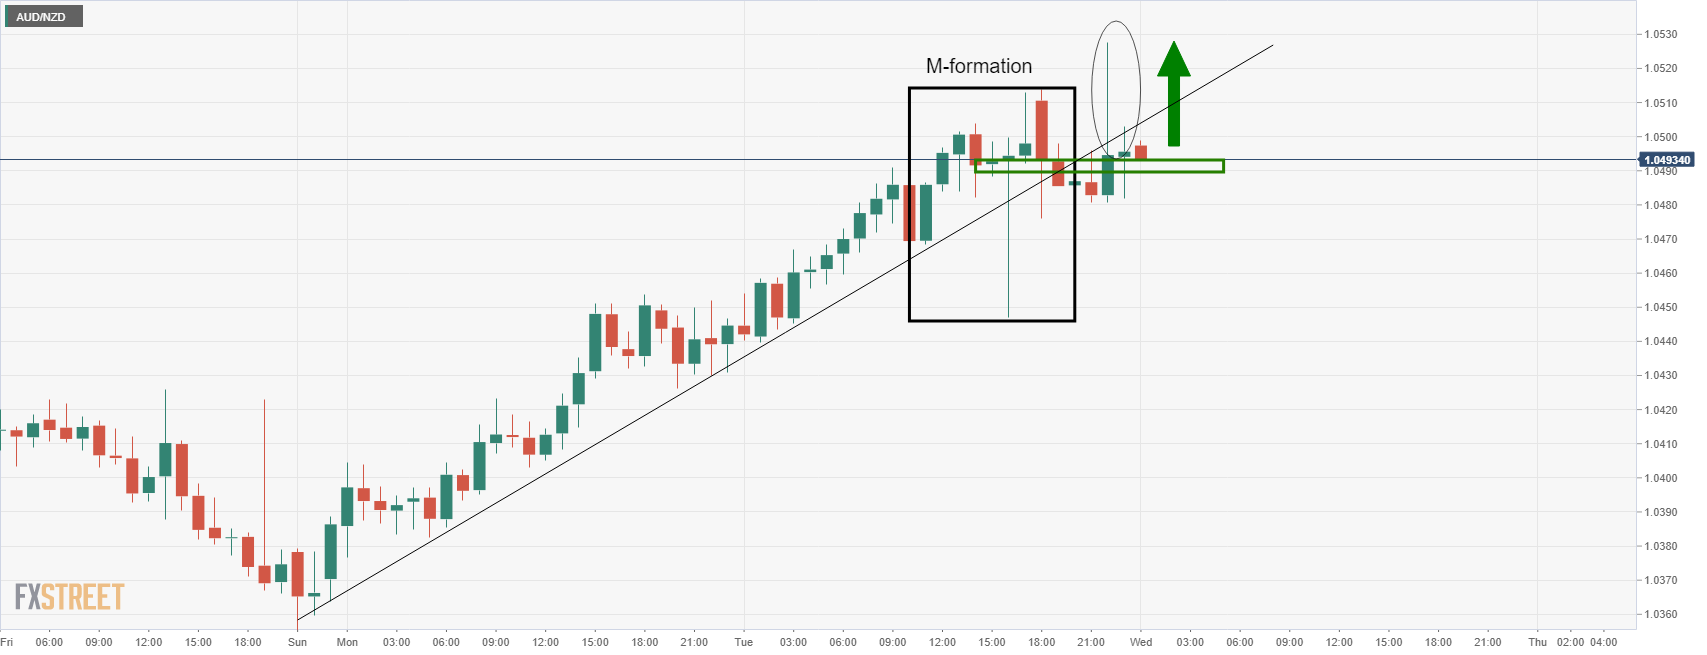
On the hourly chart, the price has formed a bullish structure above what was the prior resistance in the M-formation's neckline. The counter trendline is all that stands in the way of the price fulling the wick.
- GBP/JPY dribbles inside a small range after stepping back from weekly high.
- Brexit optimism fades, US-Russia tension, fears from China challenge previous optimism.
- Japan’s Q3 GDP , Tankan survey flashed upbeat results for December.
- Brexit, Omicron updates are the key for fresh impulse.
GBP/JPY holds onto the previous day’s pullback from a one-week high inside a choppy range above 150.00, around 150.35 during Wednesday’s Asian session.
The cross-currency pair refreshed weekly top the previous day amid the market’s optimism but Brexit concerns and a lack of major data/events weighed on the quote afterward. Adding to the bearish bias are the recently down US Treasury yields and challenges to risk appetite.
Among the key risk catalyst is the fears of a prolonged Brexit deadlock as the UK’s readiness to resolve fishing tussles with France couldn’t please the European Union (EU) to step forward and help overcome the Northern Ireland (NI) border issue. It’s worth noting that the bloc’s monetary help to the Northern Ireland of late is being considered escalating tension among the old neighbors.
Elsewhere, the US warns Russia of sanctions and helps Ukraine with military power if Kremlin invades Kyiv. In addition to the fears emanating from the US-Russia story, the market’s optimism also fades amid concerns over China’s struggling real-estate firms like Evergrande and Kaisa. Furthermore, China’s dislike of the US boycott of the 2022 Beijing Olympics also tests risk appetite.
That said, the global markets previously cheered receding fears of the South African coronavirus variant, dubbed as Omicron, as well as hopes of more stimulus from China. On the same line was the absence of Fedspeak ahead of the next week’s Federal Open Market Committee (FOMC) meeting.
Talking about data, Japan’s Q3 GDP dropped below -0.8% initial forecast to -0.9% while Tankan Manufacturers’ survey for December was quite optimistic.
Against this backdrop, US 10-year Treasury yields snap two-day uptrend around 1.47%, down one basis point (bp), whereas S&P 500 Futures struggle to follow its Wall Street benchmark that rallied the most since March.
Moving on, a light calendar probes momentum traders but risk catalysts can trigger GBP/JPY moves and hence become worth observing.
Technical analysis
GBP/JPY seesaws between September’s low near 148.95 and 200-day EMA level surrounding 151.00 with a bearish bias.


© 2000-2026. All rights reserved.
This site is managed by Teletrade D.J. LLC 2351 LLC 2022 (Euro House, Richmond Hill Road, Kingstown, VC0100, St. Vincent and the Grenadines).
The information on this website is for informational purposes only and does not constitute any investment advice.
The company does not serve or provide services to customers who are residents of the US, Canada, Iran, The Democratic People's Republic of Korea, Yemen and FATF blacklisted countries.
Making transactions on financial markets with marginal financial instruments opens up wide possibilities and allows investors who are willing to take risks to earn high profits, carrying a potentially high risk of losses at the same time. Therefore you should responsibly approach the issue of choosing the appropriate investment strategy, taking the available resources into account, before starting trading.
Use of the information: full or partial use of materials from this website must always be referenced to TeleTrade as the source of information. Use of the materials on the Internet must be accompanied by a hyperlink to teletrade.org. Automatic import of materials and information from this website is prohibited.
Please contact our PR department if you have any questions or need assistance at pr@teletrade.global.
transfers