- Analytics
- News and Tools
- Market News
CFD Markets News and Forecasts — 21-11-2022
- AUD/USD sellers take a breather around one-week low, pausing four-day downtrend.
- Reserve Bank of Australia’s latest Meeting Minutes, statements from officials favor AUD/USD bears but pre-event anxiety test downside moves.
- China-linked fears, altered expectations for Federal Reserve’s next move exert downside pressure on the risk-barometer pair.
- RBA Governor Philip Lowe’s dovish remarks could add strength to the bearish bias.
AUD/USD seesaws around 0.6600 as bears await more clues to extend the four-day downtrend during early Tuesday.
In doing so, the Aussie pair awaits the scheduled speech from the Reserve Bank of Australia’s (RBA) Governor Philip Lowe. the fresh COVID-19 fears and bearish bias at the Australian central bank keep the bears hopeful.
Reserve Bank of Australia Governor Philip Lowe could favor AUD/USD sellers
Ever since the Reserve Bank of Australia (RBA) disappointed markets with a smaller rate hike in October, the bearish bias for the AUD/USD mounted. Adding strength to the downside fears were the latest comments from the RBA policymakers and the Minute Statement of the Aussie central bank’s recent meeting.
In his latest comments, Reserve Bank of Australia (RBA) Deputy Governor Michele Bullock said, “We have already raised rates aggressively.” On the same line were the latest statements from the RBA Minutes stating, “No pre-set path -considered 50bps hike, saw stronger case for 25bps in November.”
It should be noted that the RBA surprised markets by announcing a 25 basis points (bps) of a rate hike in October and maintained the same pace of interest rate increase during the latest monetary policy.
Given the latest updates from the Reserve Bank of Australia, Governor Philip Lowe is less likely to turn hawkish and hence the AUD/USD bears have a hope to keep the reins.
Coronavirus woes also tease the Aussie bears
Considering Australia’s trade ties with China, a fresh jump in the Covid numbers from the major customer weighs on the AUD/USD prices of late. “China's capital warned on Monday that it was facing its most severe test of the COVID-19 pandemic, shutting businesses and schools in hard-hit districts and tightening rules for entering the city as infections ticked higher in Beijing and nationally,” said Reuters. It should be noted that China reported the highest daily coronavirus numbers since April as per the latest readings of 26,824.
United States-China optimism probe AUD/USD sellers
After the previous week’s meeting between United States President Joe Biden and his Chinese counterpart Xi Jinping, officials from the Washington and Beijing appear to braced for a more cordial relations going forward. In this regard, the Wall Street Journal (WSJ) reported that China is turning to an old friend in corporate America to bolster communications with the United States, as President Xi Jinping tries to stabilize the bilateral relationship while gearing up for greater competition between the two powers. It’s worth noting, however, that the Sino-American tussles over Taiwan and the latest controls on technology from the Washington seem to challenge the optimism surrounding the friendship among the world’s top two economies.
Federal Reserve bets are also important
Other than RBA Governor Lowe and the COVID-19 updates, also the likely ties between the United States and China, concerns surrounding the United States Federal Reserve’s (Fed) next move also appear as the key catalyst to watch for the AUD/USD pair traders.
Recently firmer prints of the US Retail Sales and Producer Price Index (PPI) for October underpinned the hawkish bets on the Fed’s next move. However, Atlanta Federal Reserve President Raphael Bostic and Cleveland Fed President Loretta Mester appeared less hawkish in their latest speeches. That said, downbeat prints of the Chicago Fed National Activity Index for October, to -0.05 compared to 0.17 prior, also challenged the US Dollar bulls.
AUD/USD technical analysis
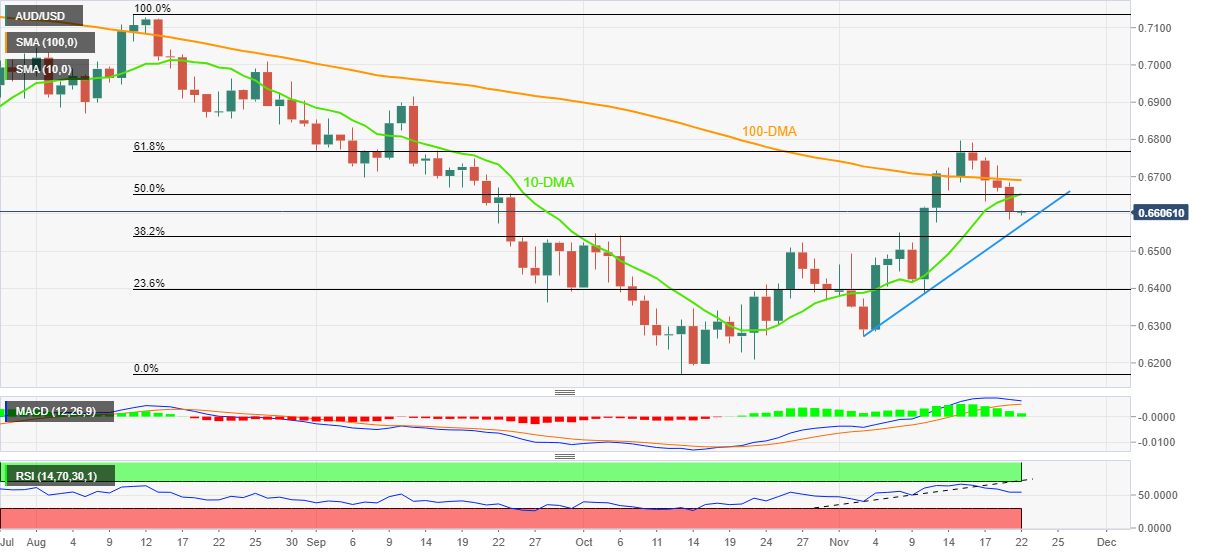
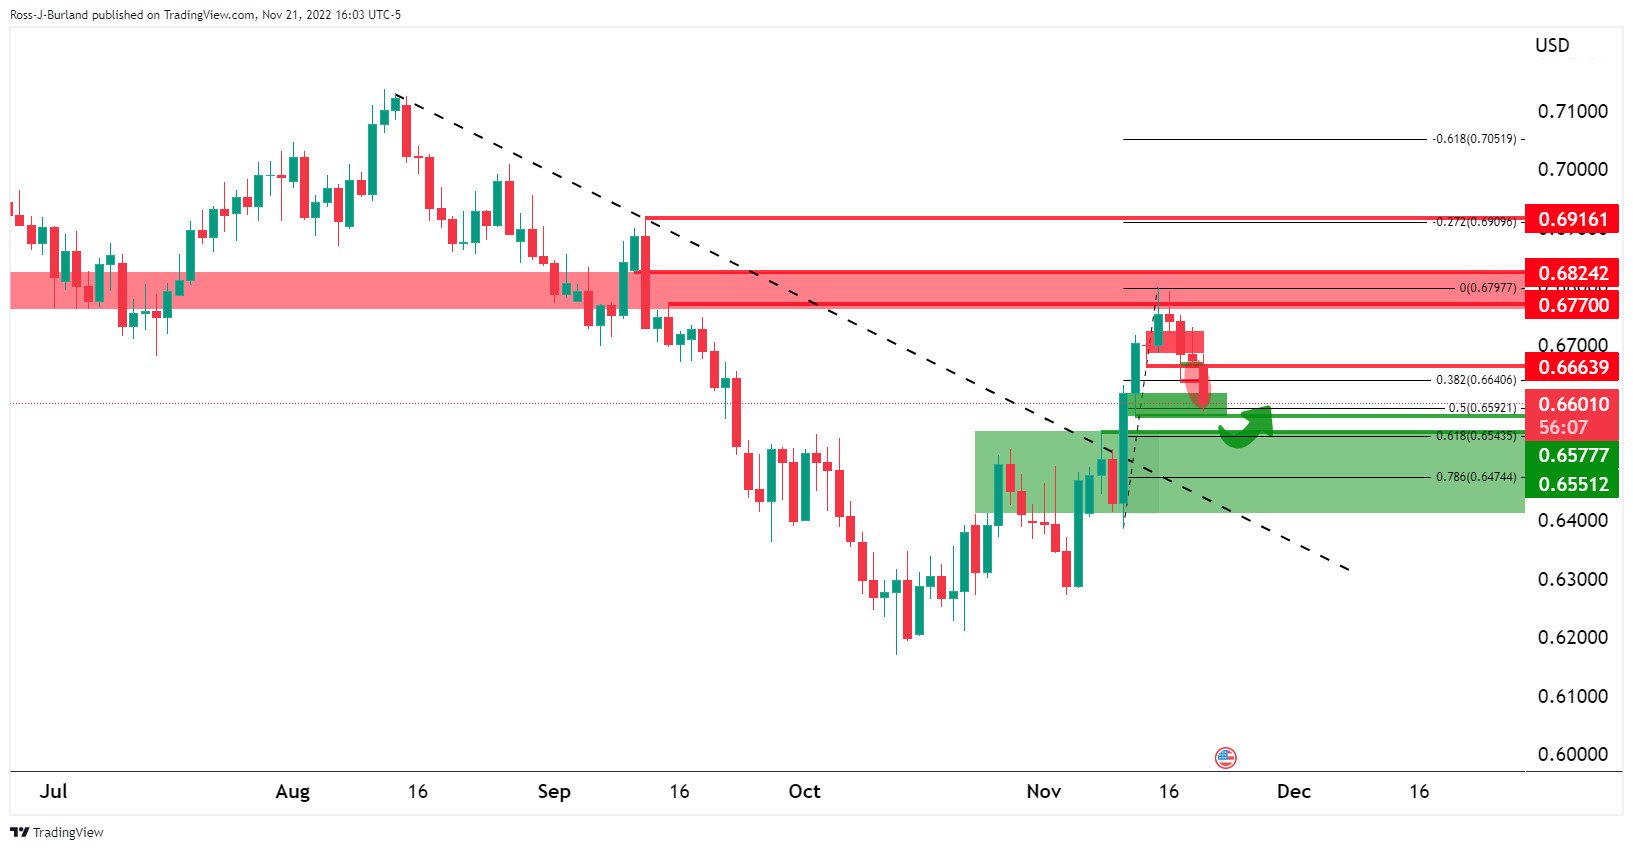
The AUD/USD pair’s first daily closing below the 10-Day Moving Average (DMA) in 13 days joins receding bullish bias of the Moving Average Convergence and Divergence (MACD) indicator, as well as a retreat of the Relative Strength Index (RSI) placed at 14, to keep the bears hopeful.
That said, an upward sloping support line from November 03, close to 0.6570 by the press time, lures the AUD/USD bears ahead of multiple supports marked near the 38.2% Fibonacci retracement levels of the Aussie pair’s August-October downturn, around 0.6540.
It’s worth noting that the late October’s swing high near 0.6520 appears the last defense of the AUD/USD pair buyers before directing the quote towards the 23.6% Fibonacci retracement level surrounding 0.6400.
Alternatively, the 10-DMA and the 100-DMA restrict short-term AUD/USD upside near 0.6655 and 0.6690 in that order. Adding strength to the 0.6655 hurdle is the 50% Fibonacci retracement level.
Even if the quote crosses the 0.6690 hurdle, the 0.6700 round figure and 61.8% Fibonacci retracement near 0.6770, also known as the Golden Ratio, becomes necessary to convince the AUD/USD pair buyers.
Overall, AUD/USD is on the bear’s radar but the road to the south is a bumpy one.
AUD/USD: Daily chart
Trend: Limited downside expected
- Loonie trimmed losses after the USD/CAD tested the 1.3495 two-week high.
- US Dollar was underpinned by risk aversion amidst growing concerns over China’s Covid-19 outbreak.
- Federal Reserve officials favor slowing rate hikes pace, but pausing is not an option.
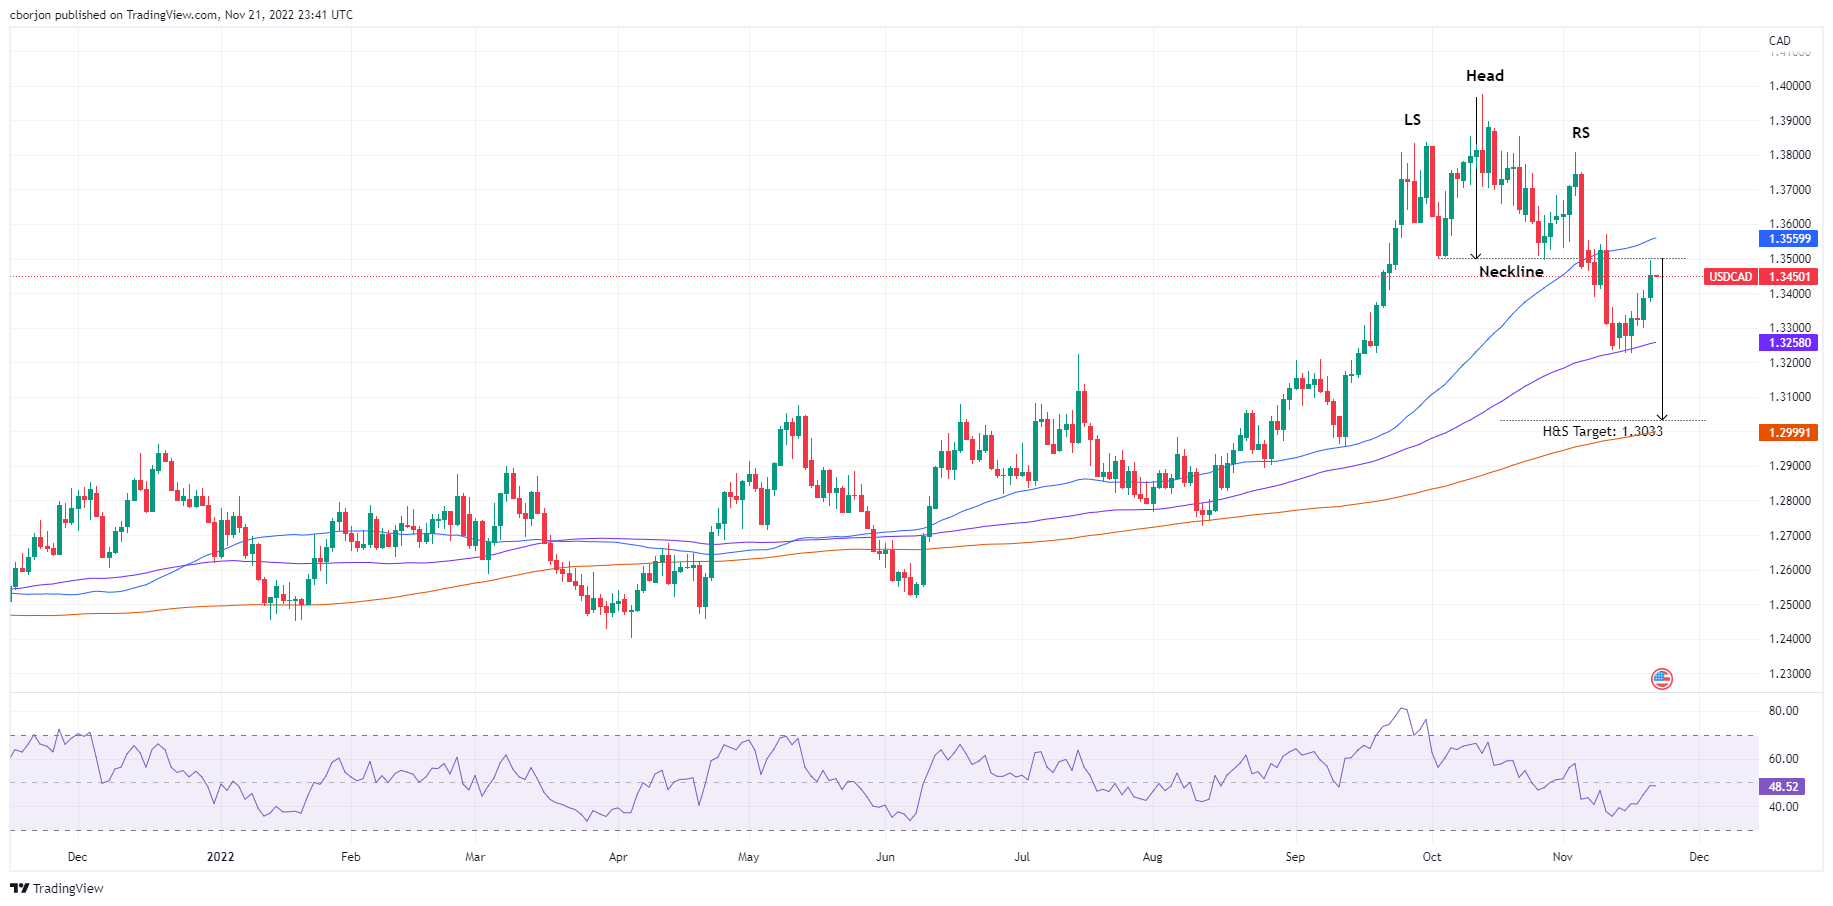
- USD/CAD Price Analysis: Rejection at the head-and-shoulders neckline to exacerbate a fall toward 1.3300.
The Loonie (CAD) weakened against the US Dollar (USD) as market sentiment shifted sour on renewed fears over China’s Covid-19 outbreak, causing the death of three, sparking a flight to safety, while Covid cases topped April’s 2022 number. Additional factors like sliding crude Oil prices due to increasing production rumors, and overall US Dollar strength, weighed on the Loonie. Hence, the USD/CAD rallied towards the head-and-shoulders neckline, registering a new two-week high at 1.3495 before retracing to current exchange rates. At the time of writing, the USD/CAD trades at 1.3452.
Loonie weakens on sour sentiment due to China’s Covid-19 outbreak
Wall Street finished Monday’s session in the red. Increasing cases in China spurred risk aversion on speculations that Chinese authorities could reinstate restrictions. Covid-19 cases jumped in Beijing, while schools moved back to online education until further notice. It should be noted that Chinese authorities relaxed quarantine times for inbound travelers, cheered by investors, with equities extending their gains. Nevertheless, last week’s news, with Beijing, reporting more than 20,000 cases, weighed on risk-perceived currencies like the Loonie. Therefore, the USD/CAD edged toward the head-and-shoulders chart pattern neckline at around 1.3495.
Crude oil prices tumbled, weighing on the CAD
Additionally, the Loonie dropped, weighed by falling crude Oil prices, notably Western Texas Intermediate (WTI), on an article published by the Wall Street Journal (WSJ). The report cited delegates saying that Saudi Arabia is looking to boost Oil production by 500K BPD ahead of the Russian oil embargo imposed by European countries. Later, the Saudi Energy Minister Prince Abdulaziz bin Salman, denying those affirmations, commented, “if there is a need to take further measures by reducing production to balance supply and demand, we always remain ready to intervene.”
USD/CAD trimmed some of its earlier gains on those comments, retreating from 1.3495 towards 1.3431 before consolidating around 1.3450s ahead of Tuesday’s Asian session.
Federal Reserve officials underpinned the US Dollar
Elsewhere, Federal Reserve officials continued to express their commitment to cubing inflation toward their 2% goal. Still, they said that the pace of hikes could moderate as soon as the December meeting. However, St. Louis Fed President James Bullard spooked investors, saying rates are not “sufficiently restrictive” and adding that he expects the Federal Funds rate (FFR) to peak at around 5% to 5.25%. Echoing some of his comments was San Francisco’s Fed President Mary Daly, saying that policymakers need to be mindful of the lags of monetary policy. She added that she sees rates peaking at least at around 5%.
Of late, Cleveland’s Fed President Loretta Mester added herself to the chorus of officials that won’t slow down the rhythm of interest rate hikes while emphasizing that the “I don’t think we’re anywhere near to stopping,” pushing back against pausing.
Even though the US Dollar strengthened on those comments, the USD/CAD remained comfortably around the 1.3300-1.3400 range before climbing to new two-week highs
USD/CAD Price Analysis: Technical outlook
The USD/CAD daily chart portrays the head-and-shoulders chart pattern remains in play, albeit the pair edged toward the neckline around 1.3495. Once the price hit that threshold, Loonie buyers stepped in, dragging the USD/CAD lower, toward 1.3450s. At the same time, the Relative Strength Index (RSI) turned flat, at bearish territory, suggesting that even though the USD/CAD edged higher, sellers remain in charge.
Therefore, the USD/CAD first support would be 1.3400. Break below will expose the November 21 low at 1.3373, followed by the psychological 1.3300 mark. On the flip side, the USD/CAD key resistance levels are the head-and-shoulders neckline around 1.3500, followed by the 50-day Exponential Moving Average (EMA) at 1.3559, followed by 1.3600.
- AUD/NZD is showing some signs of a reversal above 1.0800 ahead of RBA Lowe’s speech.
- The RBNZ is expected to hike its OCR by 75 bps to 4.25%.
- A bigger rate hike announcement by RBNZ will widen RBNZ-RBA policy divergence ahead.
The AUD/NZD pair is displaying an inventory accumulation phase in a range of 1.0810-1.0830 in the early Tokyo session. The asset is showing topsy-turvy moves as investors have shifted their focus toward the speech from Reserve Bank of Australia (RBA) Governor Philip Lowe. While the interest rate decision by the Reserve Bank of New Zealand (RBNZ) on Wednesday will be the crucial trigger for the cross ahead.
For making an informed decision, investors are awaiting the speech from the RBA policymaker. The speech will provide interest rate guidance to combat the historic surge in inflationary pressures. The inflation rate reached 7.3% in the third quarter, which forced the Australian central bank to lift its price growth guidance to 8.0%. However, the RBA continued its rate hike pace at 25 basis points (bps) to keep economic prospects solid along with the agenda of bringing price stability.
On the kiwi front, the announcement of the monetary policy by the Reserve Bank of New Zealand (RBNZ) will escalate RBNZ-RBA policy divergence. RBNZ Governor Adrian Orr has already announced five consecutive 50 basis points (bps) rate hikes to 3.5% and has no intention to pause rate hikes amid mounting price pressures.
A Reuters poll on RBNZ’s rate hike projections claims an increment in the Official Cash Rate (OCR) by 75 bps this time. An occurrence of the same will push the OCR to 4.25% and extremely diverge from RBA’s policy structure.
The move could strengthen the New Zealand Dollar ahead but will leave less room for more rate hikes by the Reserve Bank of New Zealand. Also, this will shift more responsibilities on economic dynamics to play ahead.
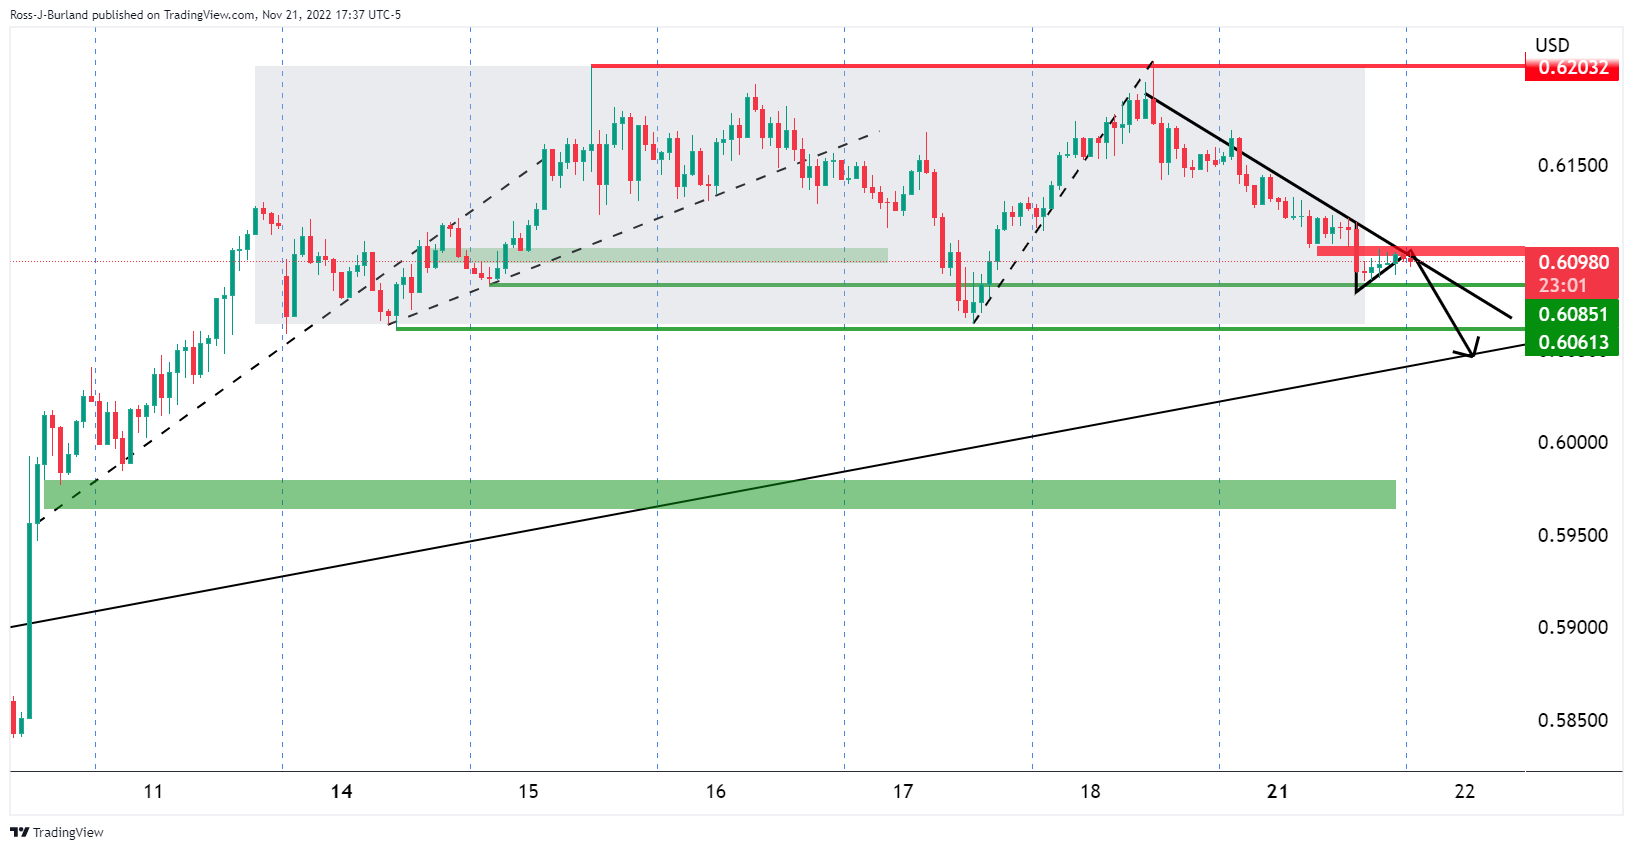
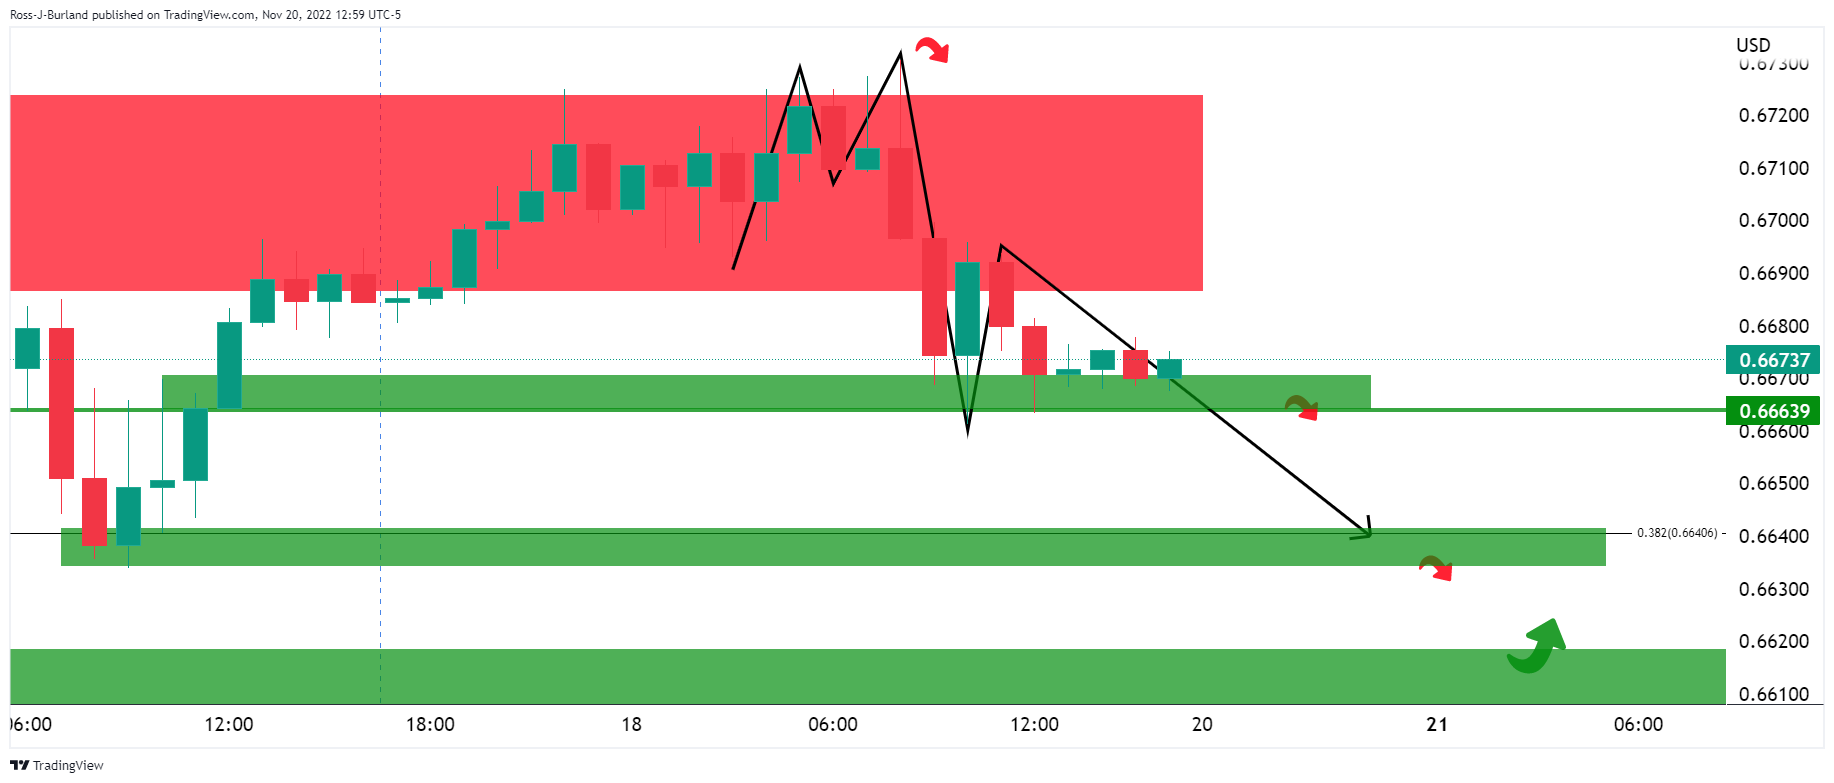
- NZD/USD bears are in play but a move to 0.6130 cannot be ruled out.
- Beware eye the daily trendline support, but 0.5970s could come under pressure.
As per the prior analysis, NZD/USD Price Analysis: Bears move in from key highs for the week, the pair is pressured on the front side of the bearish micro trend which leaves the focus on the downside for the day ahead:
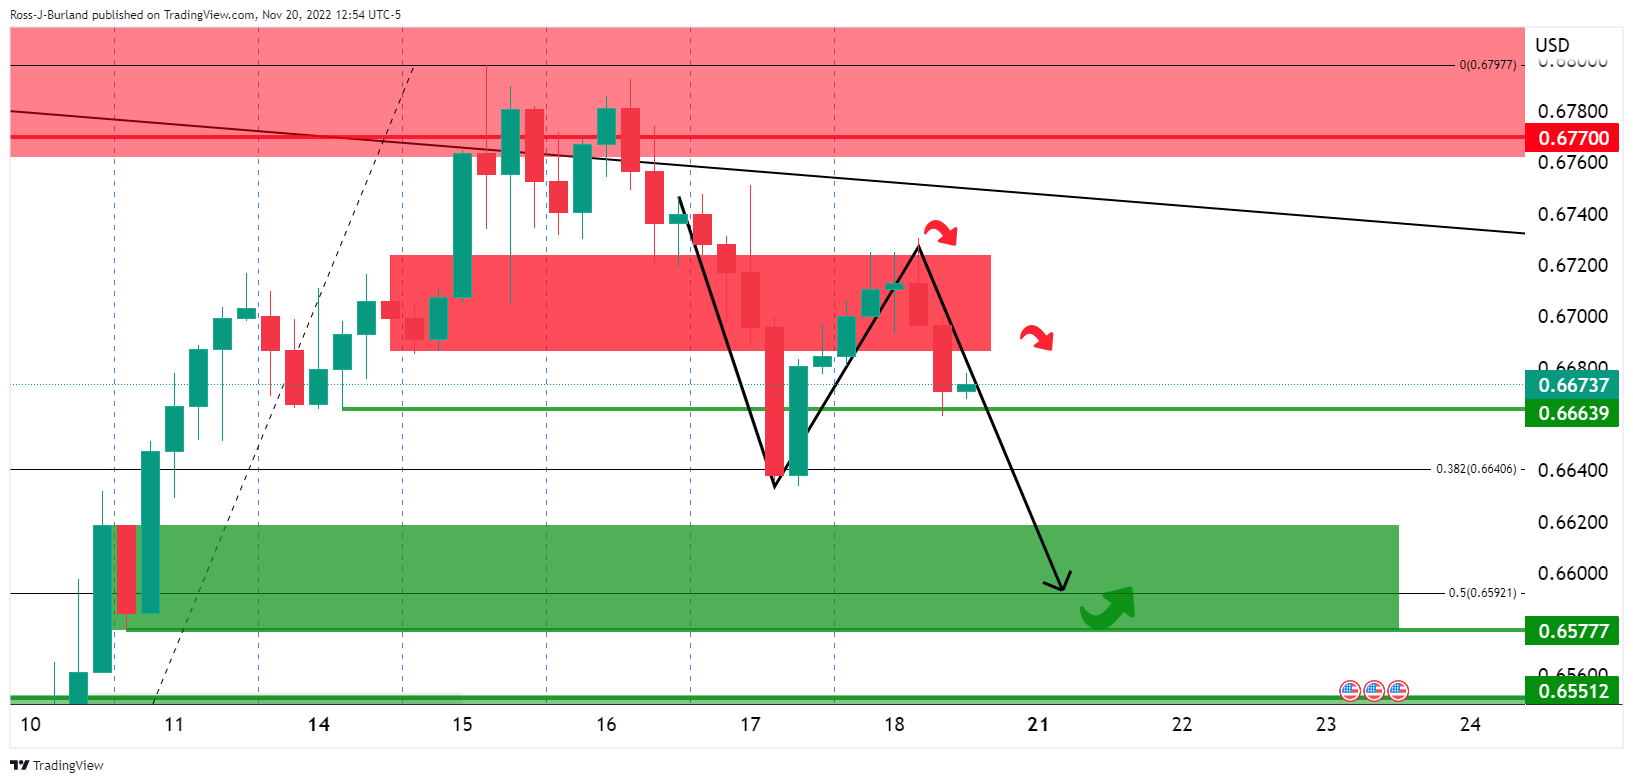
NZD/USD H1 charts
NZD/USD H1 zoomed in:
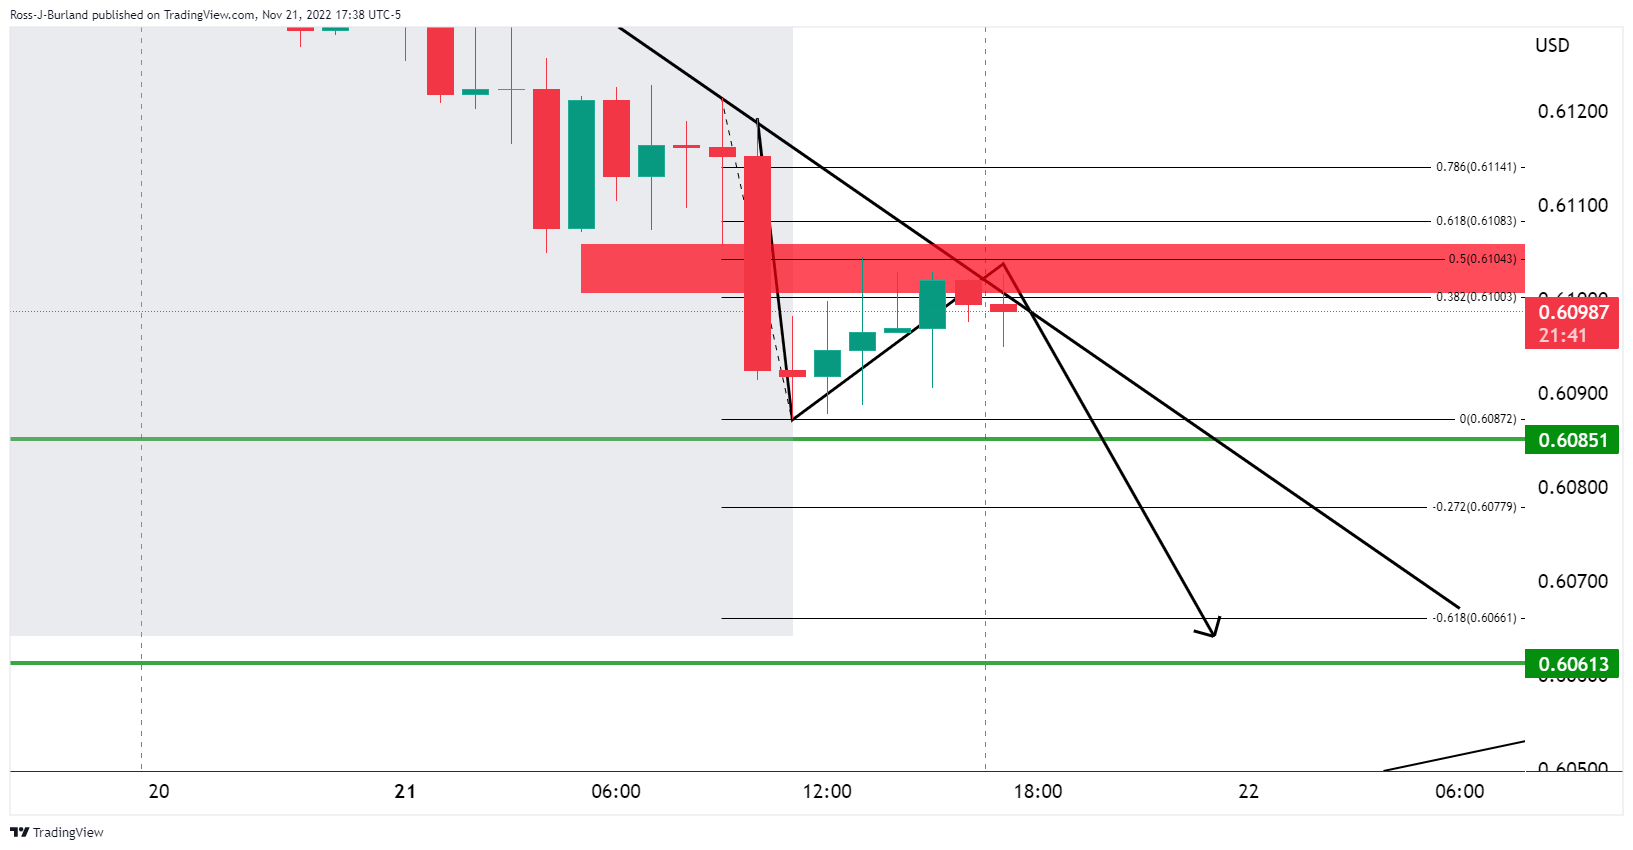
The price has been in a phase of distribution on the front side of a bullish dominant trend but there is the risk of a move lower:
NZD/USD M15 chart
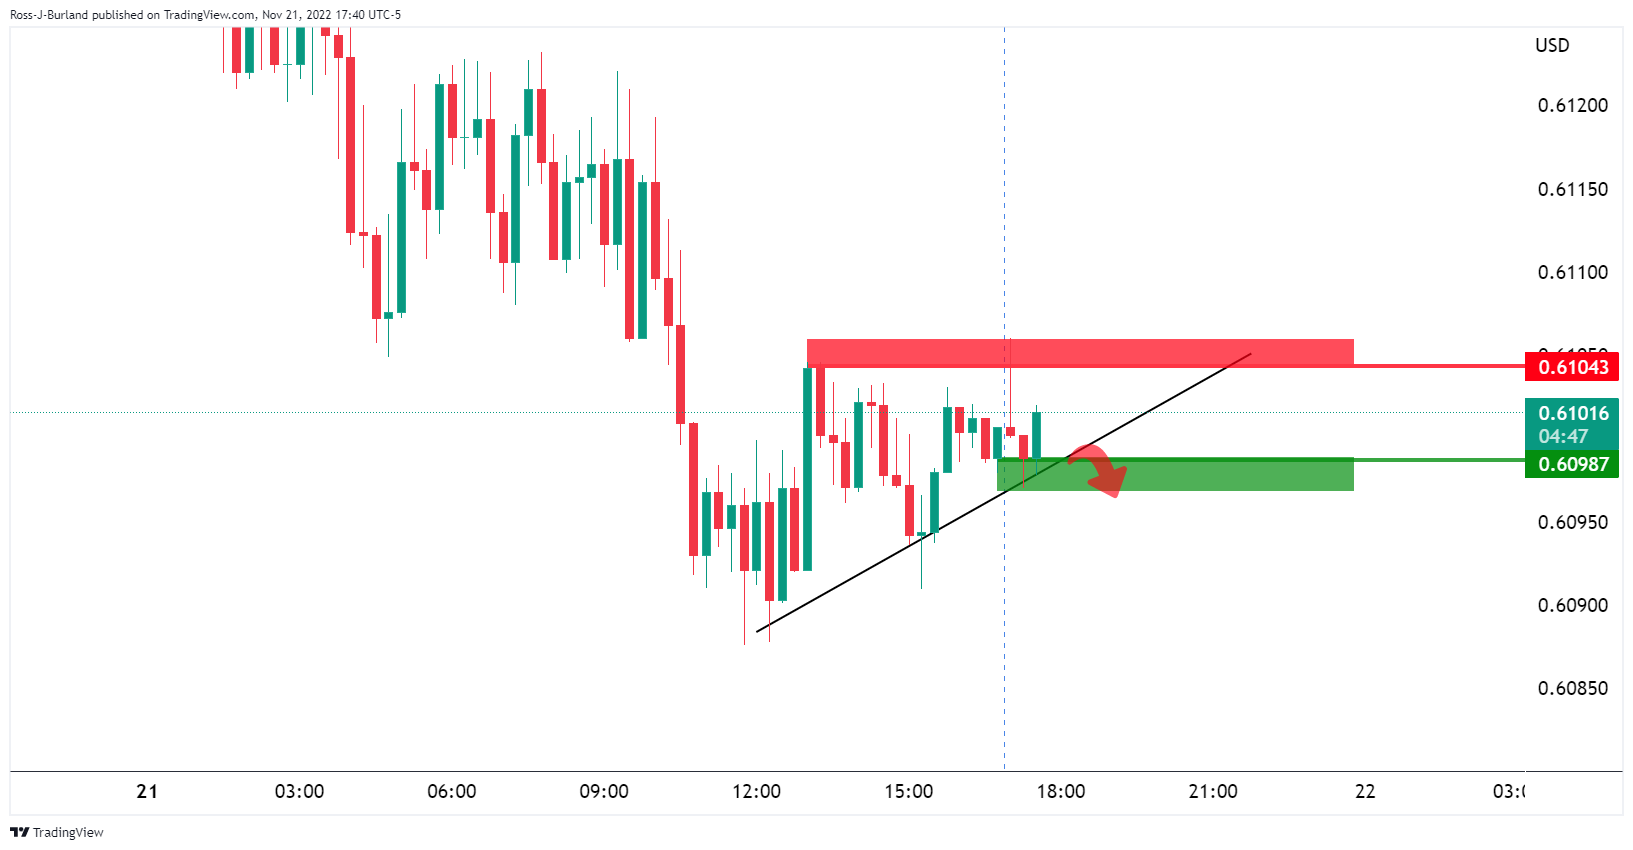
The triangle is a bearish technical pattern and a break of structure below 0.6100 opens the risk of a move to the 0.5970s. If the pattern were to fail, however, then a move into the 0.6130s could be on the cards prior to the next move lower as per the daily chart:
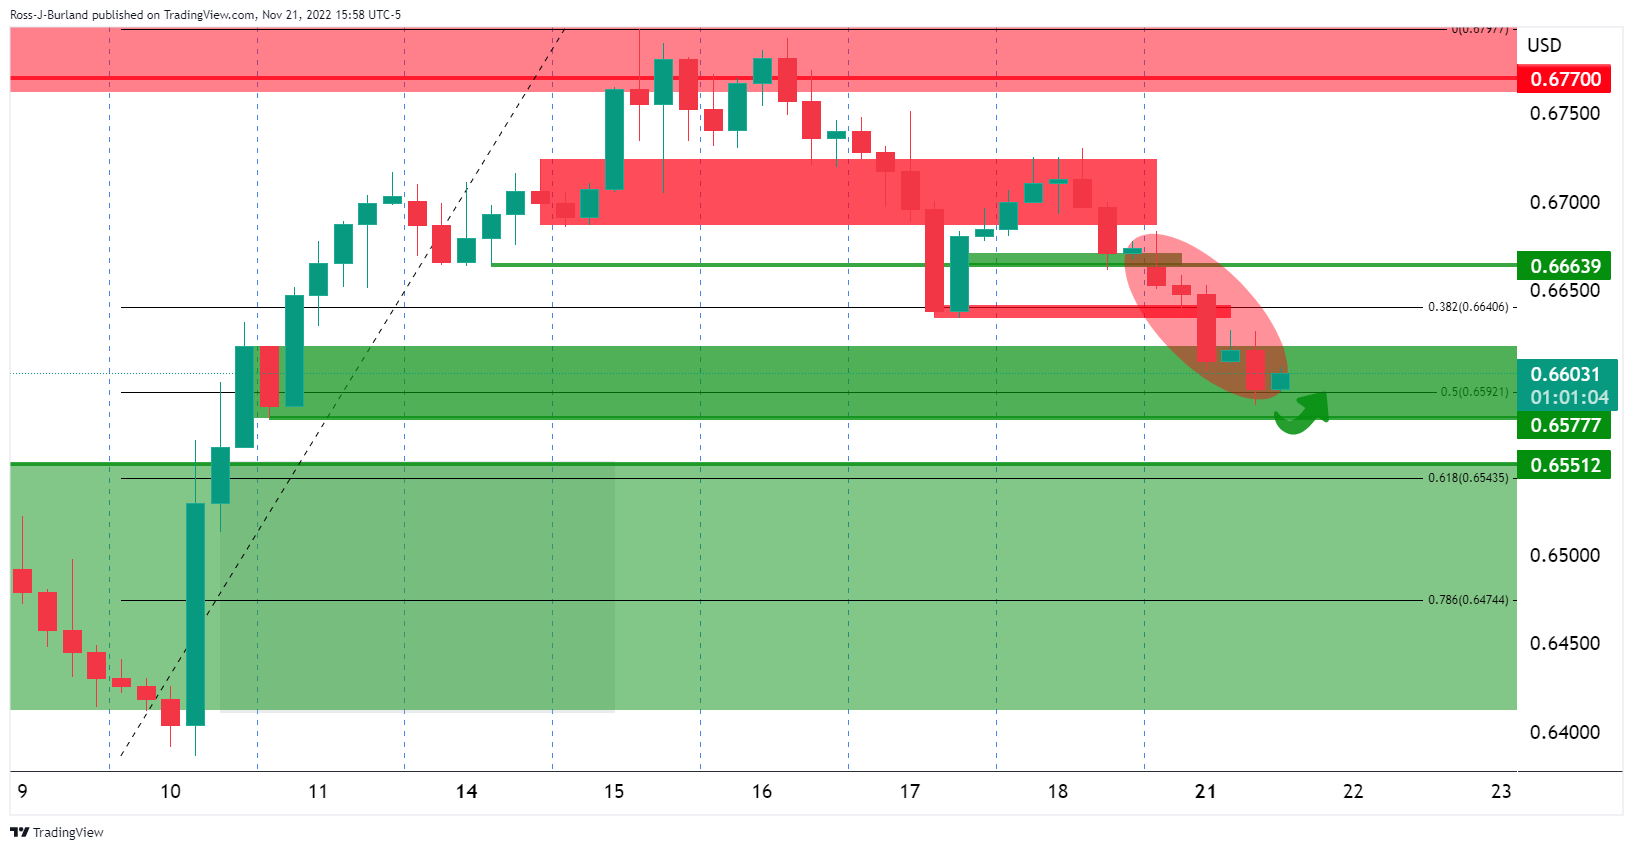
NZD/USD daily chart
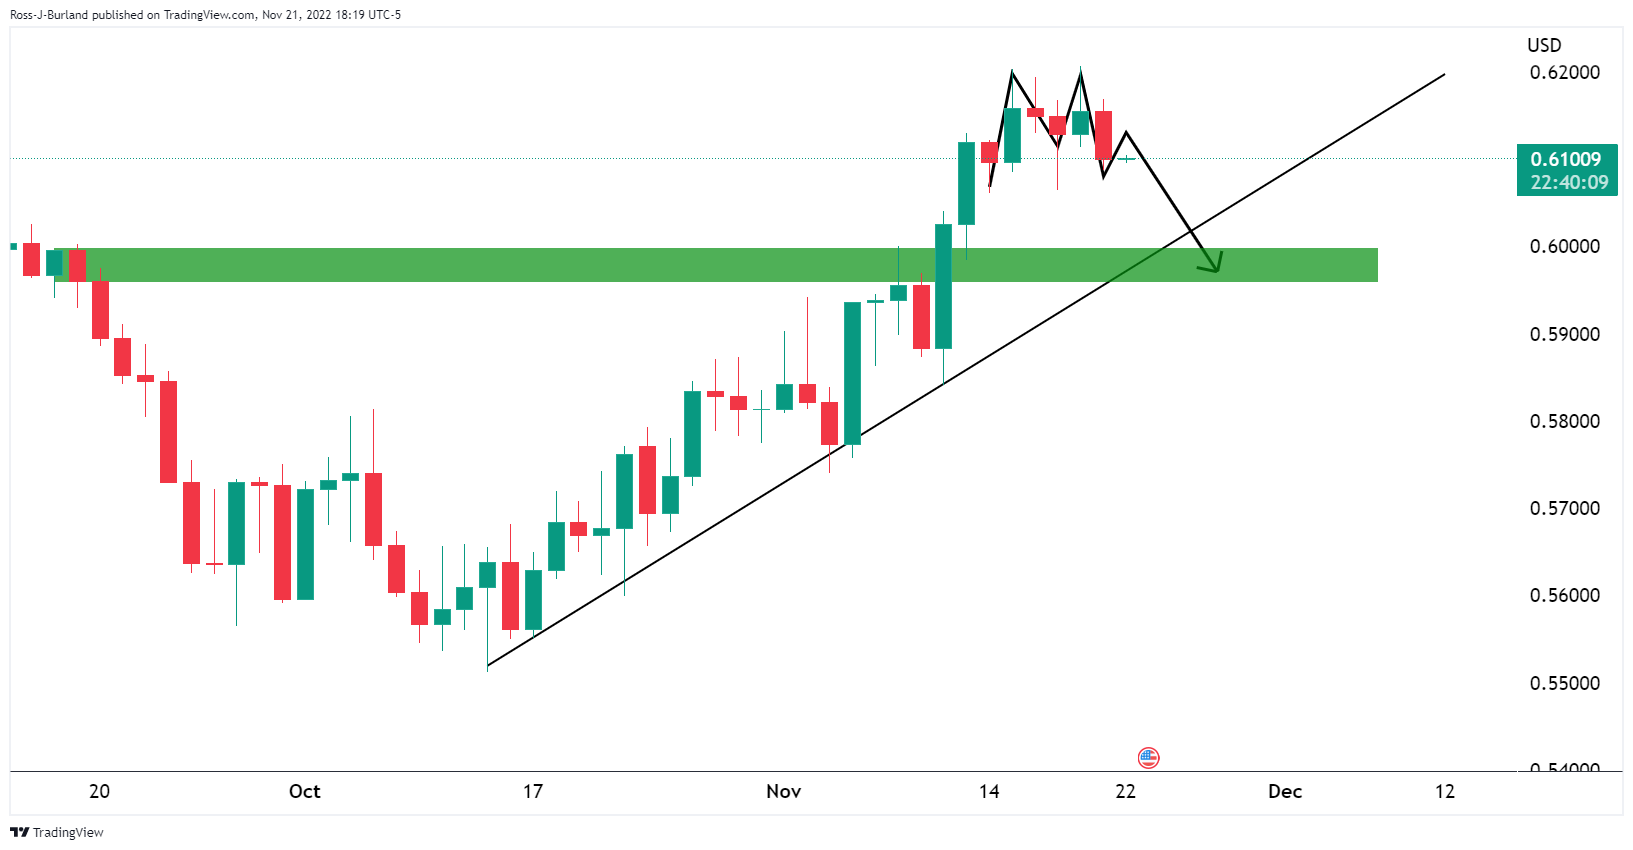
The M-formation is a topping pattern that would be expected to see the price rejected by the neckline.
US inflation expectations rose for the first time in two weeks as traders reassess the previously put bets on the Federal Reserve’s (Fed) next move.
That said, the inflation precursors, as per the 10-year and 5-year breakeven inflation rates per the St. Louis Federal Reserve (FRED) data, rebound from the lower levels since October 06 to 2.34% and 2.31% in that order as per the latest prints published on late Monday.
The revival in the US inflation precursor justifies the US Dollar’s latest run-up even if the Fed policymakers flashed mixed signals in their latest appearances.
US Dollar Index (DXY) rose the most in November the previous day, ended Monday around 107.80, even if Atlanta Federal Reserve President Raphael Bostic and Cleveland Fed President Loretta Mester appeared less hawkish.
While firmer inflation expectations keep the USD bulls hopeful, this week’s preliminary readings of the monthly activity data and the Federal Open Market Committee (FOMC) Meeting Minutes will be crucial for clear directions.
Also read: EUR/USD eyes 1.0200 as risk aversion underpins the US Dollar
- AUD/JPY is oscillating in a narrow range below 94.00 as investors are awaiting a speech from RBA’s Lowe.
- Mixed responses from the risk profile are also keeping the risk-sensitive assets on the sidelines.
- Japanese administration has announced fresh stimulus to support economic prospects.
The AUD/JPY pair is displaying a sideways performance in the early Asian session as investors are awaiting a speech from Reserve Bank of Australia (RBA) Governor Philip Lowe for making an informed decision. Mixed responses from the risk profile are also keeping the risk-sensitive assets on the sidelines.
The speech from RBA Governor will guide the likely monetary policy action ahead. Inflation pressures are displaying a historic surge led by significant price growth from service providers. The RBA is continuously hiking its Official Cash Rate (OCR) in each monetary policy.
Recently, the Australian central bank trimmed its rate hike pace to 25 basis points (bps). In response to that, RBA policymakers cited that interest rates have already been increased significantly and consideration of monetary policies on monthly intervals provides an edge to go parallel with the pace of other central banks in no time.
Apart from the interest rate guidance, investors will also focus on remarks about declining real estate prices. Rising interest obligations have compelled home buyers to postpone their demand, which is resulting in a vulnerable housing market.
On Monday, the risk barometer remained solid despite an unchanged monetary policy by the People’s Bank of China (PBOC). The PBOC kept its Prime Lending Rates (PLRs) stable, knowing the fact that Covid-19 infections are galloping and the real estate sector is extremely vulnerable. Investors should be aware of the fact that Australia is one of the leading trading partners of China and PBOC’s monetary policy stance has a significant impact on Aussie dollar.
On the Tokyo front, an announcement of fresh stimulus to support growth prospects could impact the Japanese yen. Japanese Finance Minister Shunichi Suzuki said in a statement on Monday, his government will guide economic and fiscal policy in a "responsible" manner. He urged a swift adoption of more spending measures, worth $207 billion, backed mostly by new debt issuance.
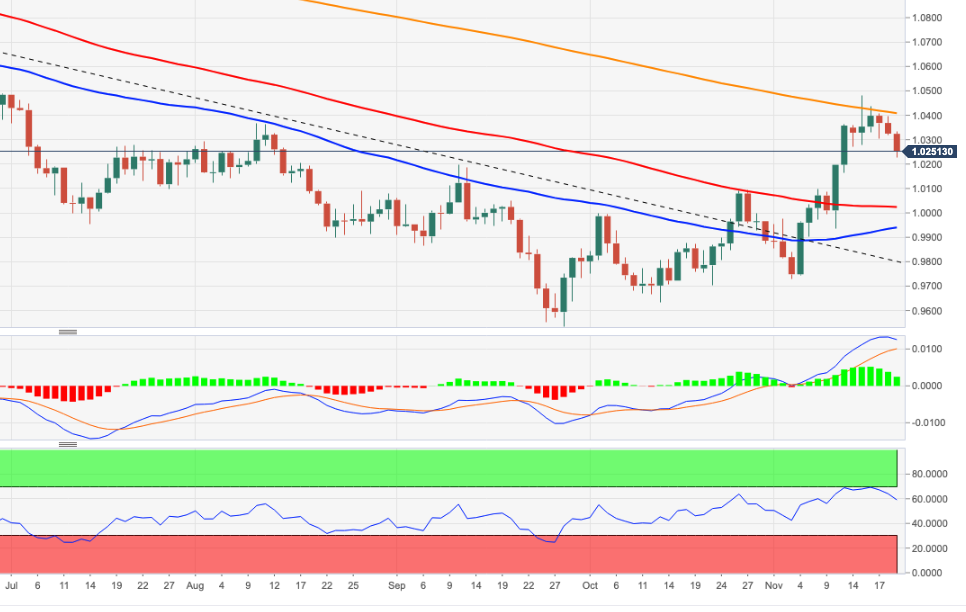
- USD/CHF seesaws near the highest levels in over a week.
- Risk aversion underpins the US Dollar’s haven demand.
- Coronavirus woes, Fed concerns weigh on the sentiment ahead of important data/events.
USD/CHF treads water around the weekly high near 0.9600, probing bulls after six-day advances, as traders seek fresh clues during Tuesday’s Asian session.
The major currency pair’s latest inaction could also be linked to the cautious mood ahead of Wednesday’s key data/events, as well as recently mixed signals from the US Federal Reserve (Fed) policymakers.
Fresh fears of the Coronavirus outbreak and remembrance of the Covid-led woes marked in early 2020s pushed traders towards the US Dollar in search of risk safety. Also likely to have favored the greenback are the firmer prints of the US Retail Sales and Producer Price Index (PPI) for October which underpinned the hawkish bets on the Fed’s next move.
Even so, Atlanta Federal Reserve President Raphael Bostic and Cleveland Fed President Loretta Mester appeared less hawkish in their latest speeches. That said, downbeat prints of the Chicago Fed National Activity Index for October, to -0.05 compared to 0.17 prior, also challenged the US Dollar bulls.
However, US Dollar Index (DXY) rose the most in November the previous day amid a surge in China’s Coronavirus cases and the first virus-linked deaths in Beijing since May.
Against this backdrop, Wall Street closed in the red and the US Treasury yields were firmer too, which in turn favored the US Dollar buyers and propelled the USD/CHF prices.
That said, a lack of major data/events and the market’s consolidation ahead of the key catalysts, scheduled for release on Wednesday, might challenge the USD/CHF pair buyers amid a likely sluggish Tuesday. It’s worth noting that hawkish comments from the Swiss National Bank (SNB) officials, published in the last week, also challenge the pair buyers of late. Though, the risk catalysts and the mood of traders will be crucial for near-term directions.
Technical analysis
Despite the latest inaction, the USD/CHF pair remains on the way to challenging the 200-DMA hurdle, around 0.9635 by the press time, unless dropping back below the downward-sloping trend line from November 04, close to 0.9400 at the latest.
- The formation of a symmetrical triangle indicates a consolidation ahead.
- Overlapping short-to-medium-term EMAs signals a volatility contraction.
- Quiet market mood is keeping the risk-perceived assets in a rangebound structure.
The GBPUSD pair turned sideways in the early Tokyo session after attempting a rebound below the critical support of 1.1800. The Cable is looking to extend its recovery above 1.1820 as risk-perceived currencies are gaining some traction in a quiet market mood.
Meanwhile, the US dollar index (DXY) is hovering around 107.80 after a bullish Monday. Apart from that, the 10-year US Treasury yields also rebounded to near 3.83% despite bleak chances of continuation of the 75 basis points (bps) rate hike structure by the Federal Reserve (Fed).
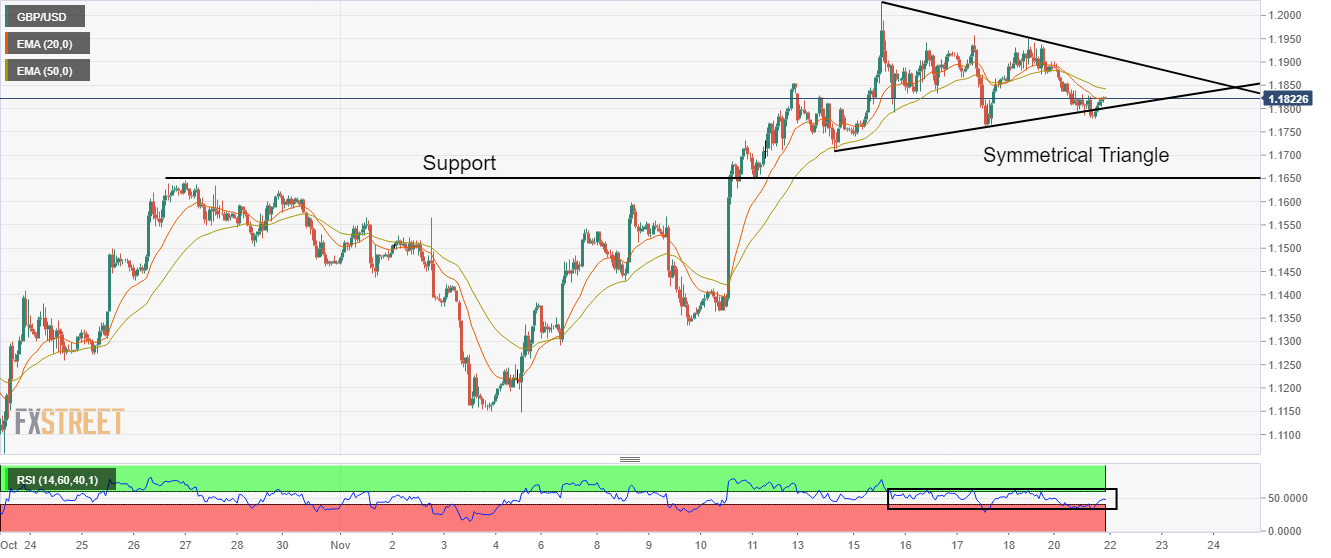
A formation of a Symmetrical Triangle on an hourly scale is indicating a volatility contraction. The upward-sloping trendline of the chart pattern is placed from November 14 low at 1.1710 while the downward-sloping trendline is plotted from November 15 high at 1.2029. A breakout of the same will result in wider ticks and heavy volume.
The 20-and 50-period Exponential Moving Averages (EMAs) are overlapping with each other, which signals a consolidation ahead.
Meanwhile, the Relative Strength Index (RSI) (14) has shifted into 40.00-60.00, which indicates the unavailability of a fresh trigger for decisive action ahead.
Going forward, a break above Friday’s high at 1.1950 will drive Cable towards November 15 high at 1.2029, followed by the round-level resistance at 1.2100.
On the flip side, a drop below Monday’s low at 1.1780 will drag the asset toward November 14 low at 1.1710. A slippage below November 14 low will expose the asset to the horizontal support plotted from October 27 high at 1.1646.
GBPUSD hourly chart
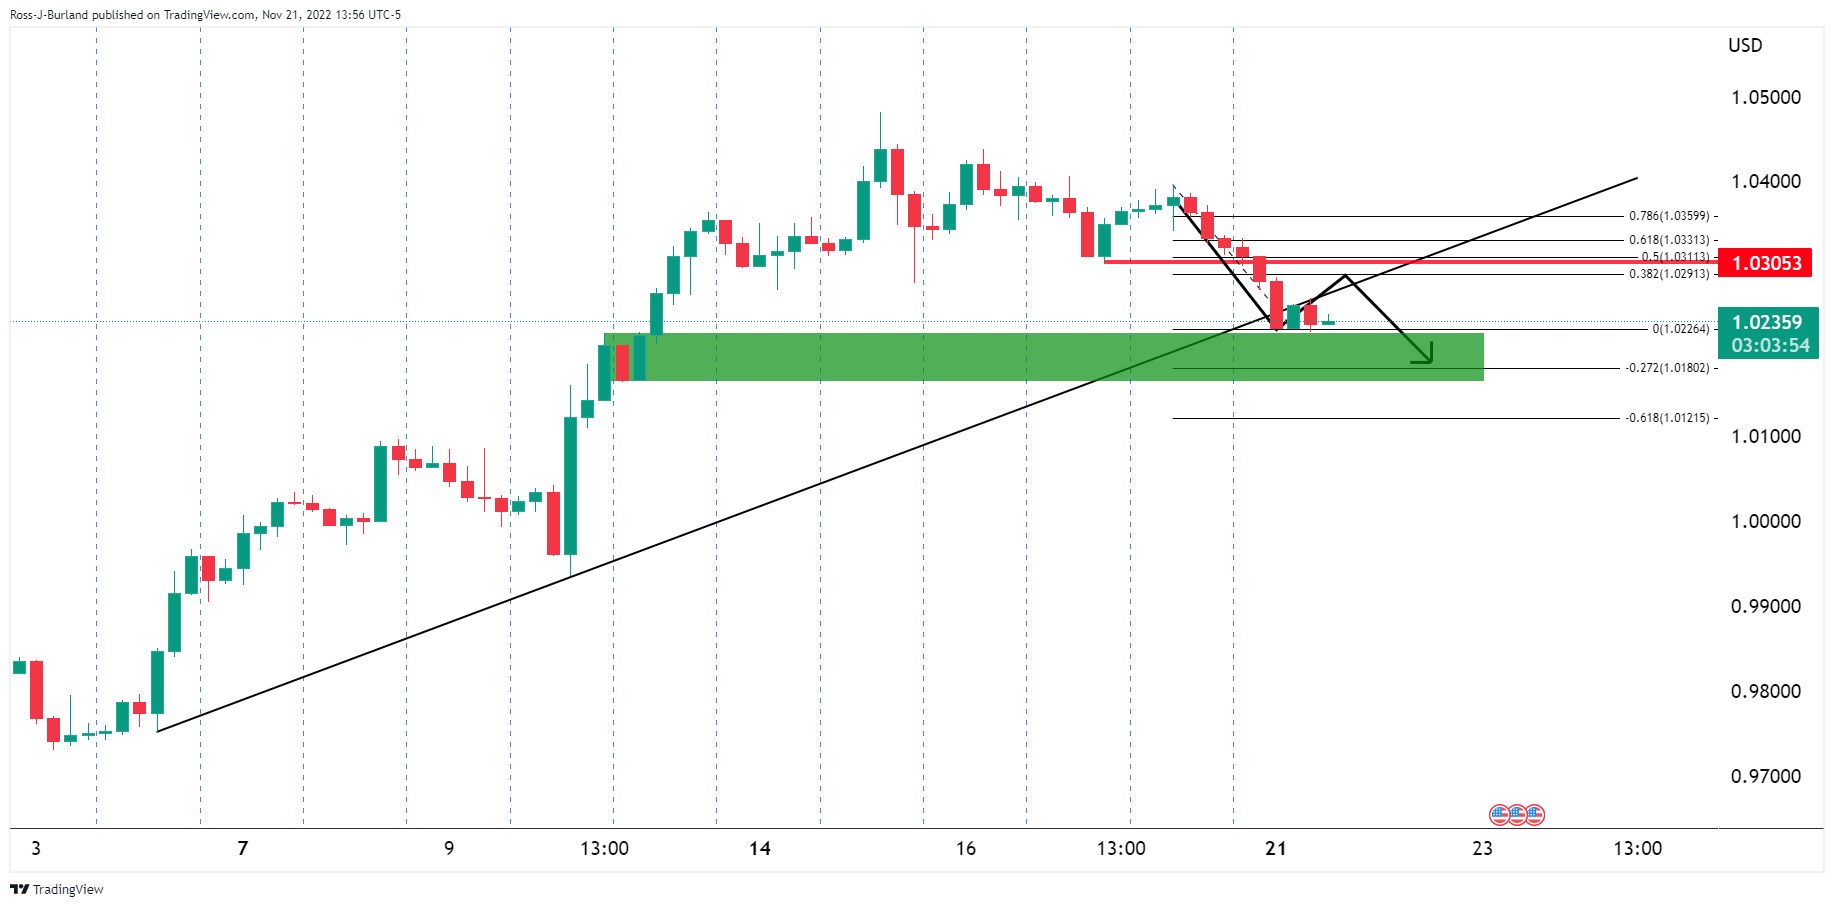
- EUR/USD holds lower ground near one-week low after breaking a fortnight-old support line.
- Hawkish comments from the ECB policymakers battled softer German PPI to favor confuse traders.
- Worsening Covid conditions in China, indecision over Fed’s next move and US data favored the US Dollar.
- Risk catalysts are the key ahead of Wednesday’s key data, FOMC Minutes.
EUR/USD struggles around mid-1.0200s after breaking a short-term key support during three-day downtrend in the last. The pair bears take a breather around a one-week low amid a lack of major data/events during Tuesday’s Asian session but broad US Dollar demand and breaking of the previously important support keeps sellers hopeful.
That said, the US Dollar Index (DXY) rose the most in November the previous day as market’s sentiment soured amid fresh fears of the Coronavirus. Adding strength to the greenback’s safe haven demand were mixed signals from Eurozone data and the European Central Bank (ECB) policymakers. Furthermore, anxiety ahead of this week’s preliminary readings of the monthly activity data and the Federal Open Market Committee (FOMC) Meeting Minutes.
China reported a jump in the daily Covid cases and two virus-led deaths on Monday, which in turn raised doubts on the Chinese government’s easing of activity controls. The same renews the virus woes that drowned global markets previously.
Elsewhere, ECB Chief Economist Philip Lane favored further rate hikes and expected the likely recession to be short-lived. On the same line, Government Council member Robert Holzmann favored 75 basis points (bps) of rate hike for December whereas policymaker Mario Centeno raised doubts on such a move.
It should be noted that Cleveland Federal Reserve (Fed) Bank President Loretta Mester appeared less hawkish whereas the previous US data raised expectations of a 75 bps move from the Fed and favored the US Dollar bulls.
Elsewhere, the Chicago Fed National Activity Index fell to -0.05 compared to 0.17 prior whereas Germany’s Producer Price Index (PPI) for October eased to 34.5% versus 41.5 expected and 45.8% prior.
Amid these plays, Wall Street closed in the red and the US Treasury yields were firmer too, which in turn favored the US Dollar buyers and weigh on the EUR/USD prices.
Moving on, Eurozone Consumer Confidence for November, expected -26 versus -27.6 prior will be important for fresh impulse but major attention should be given to the risk catalysts ahead of a busy Wednesday.
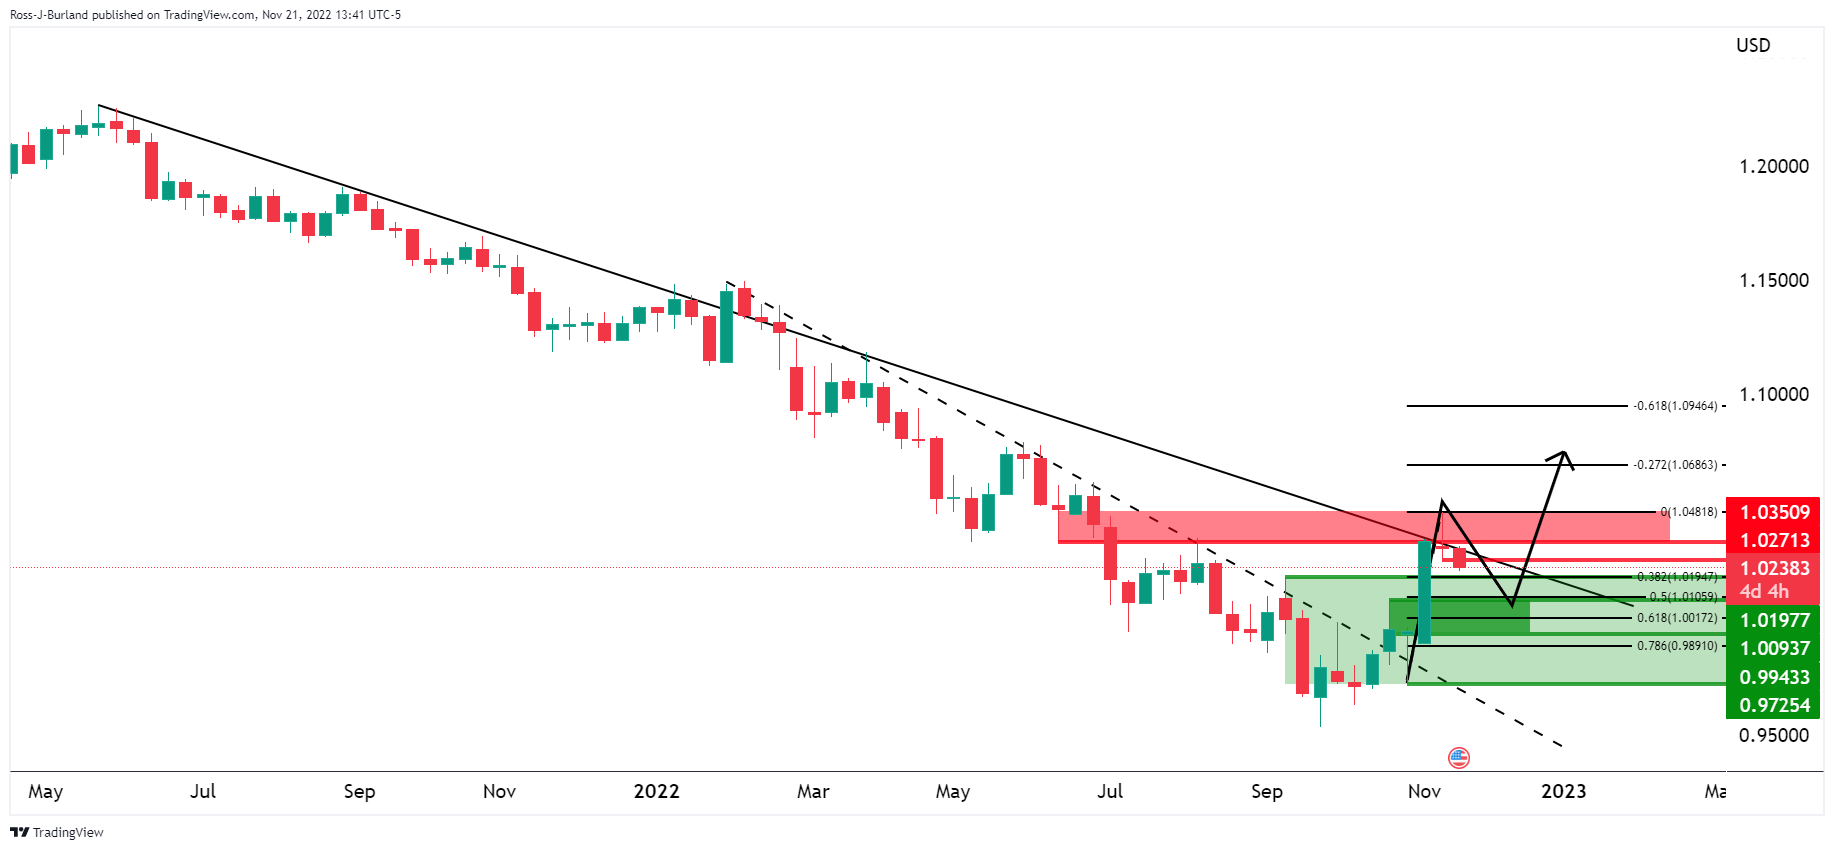
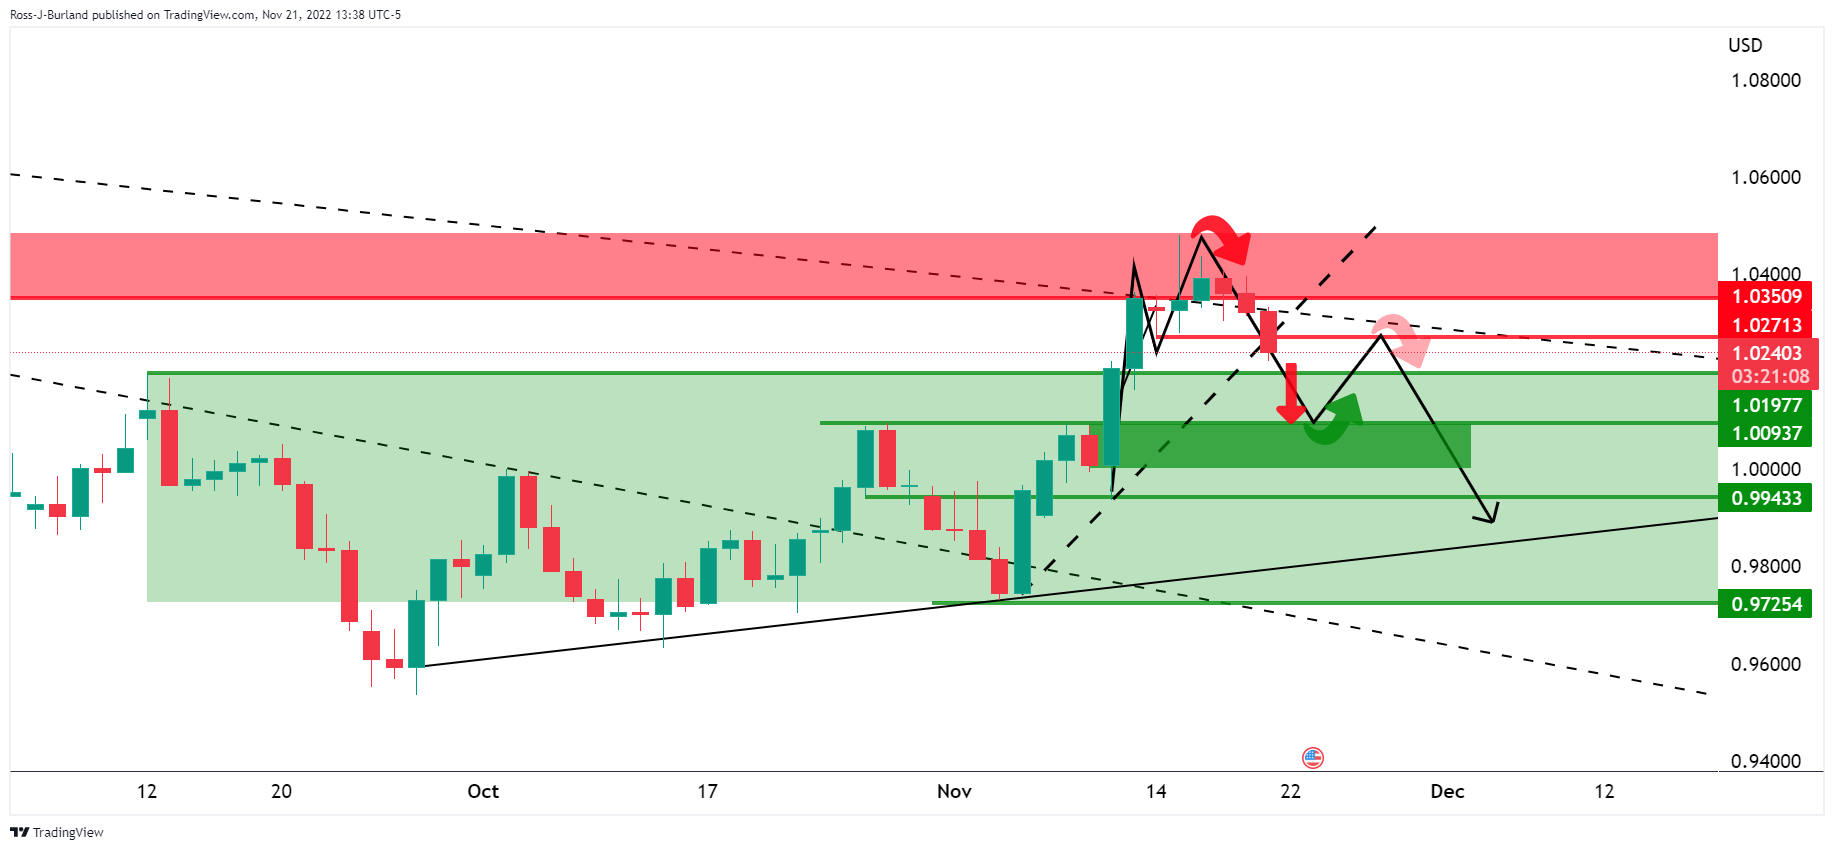
Technical analysis
A clear downside break of a two-week-old ascending trend line and the 10-Day Moving Average (DMA), currently around 1.0285, directs EUR/USD bears towards September’s peak surrounding 1.0200.
“Central banks are snapping up gold this year, but it is uncertain which ones are behind most of that shopping spree, fueling speculation that China is a big player,” reported Nikkei Asia.
The news quotes multiple analysts to also mention, “Seeing how Russia has been hit by monetary sanctions by the West, China and some other countries must be hurrying to reduce dependence on the dollar.”
Key quotes
Central banks bought a net 399.3 tonnes of gold in the July-September period, more than quadrupling on the year, according to the November report by industry group the World Gold Council. The latest amount marks a steep jump from 186 tonnes in the preceding quarter and 87.7 tonnes in the first quarter, while the year-to-date total alone surpasses any full year since 1967.
Buyers such as the central banks of Turkey, Uzbekistan and India reported purchases of 31.2 tonnes, 26.1 tonnes and 17.5 tonnes, respectively. The problem is that such specified buying adds up only to roughly 90 tonnes -- meaning it is unclear who bought the remaining roughly 300 tonnes net.
“China likely bought a substantial amount of gold from Russia,” said market analyst Itsuo Toshima.
China has made similar moves in the past. After staying mum since 2009, Beijing stunned the market in 2015, disclosing it had boosted gold holdings by about 600 tonnes. It has not reported any activity since September 2019.
The People's Bank of China likely bought a portion of the Central Bank of the Russian Federation's gold holdings of over 2,000 tonnes, Toshima said.
China has been unloading U.S. bonds. It sold $121.2 billion in U.S. debt , the equivalent of roughly 2,200 tonnes of gold, between the end of February -- immediately after Russia's first attack on Ukraine -- and the end of September, according to the U.S. Treasury Department.
Chinese imports of gold from Russia surged in July, soaring more than eightfold on the month and roughly 50 times the year-earlier level, according to China's customs authorities.
Central banks generally do not unload their gold holdings in the market, meaning the more they buy the precious metal, the stronger support this will give its price.
Gold remains pressured
The news should have favored the Gold price but the metal stays depressed at around $1,740 by the press time.
Also read: Gold Price Forecast: XAUUSD sees an establishment below $1,740 as DXY extends rally
- Gold price is likely to shift its business below $1,740.00 amid the risk-off market mood.
- The US Treasury yields have rebounded despite less-hawkish commentary from Fed’s Mester.
- Fed’s Mester has supported the view of a slowdown in the rate hike pace ahead.
Gold price (XAUUSD) is oscillating below the critical support of $1,740.00 in the early Asian session. The precious metal is declining gradually amid a global correction in risk-perceived assets. Weaker economic projections due to a significant fall in consumer spending have raised concerns. S&P500 dropped on Monday amid anxiety ahead of the release of the US Durable Goods orders data.
The US dollar index (DXY) has reached near the round-level resistance of 108.00 as investors turned risk-averse due to the absence of a key trigger for decisive action. Meanwhile, the 10-year US Treasury yields have rebounded to 3.83% despite a less-hawkish commentary from Cleveland Federal Reserve (Fed) Bank President Loretta Mester. Fed policymaker is of the view that it makes sense to slow down the pace of rate hikes a bit in an interview with CNBC.
He further added that “We have had some good news on the inflation front, but need more and sustained good news”. However, he doesn’t see any pause in the rate hike cycle yet.
Going forward, the show-stopper event this week will be the US Durable Goods Orders data. The economic catalyst is seen stable at 0.4%.
Gold technical analysis
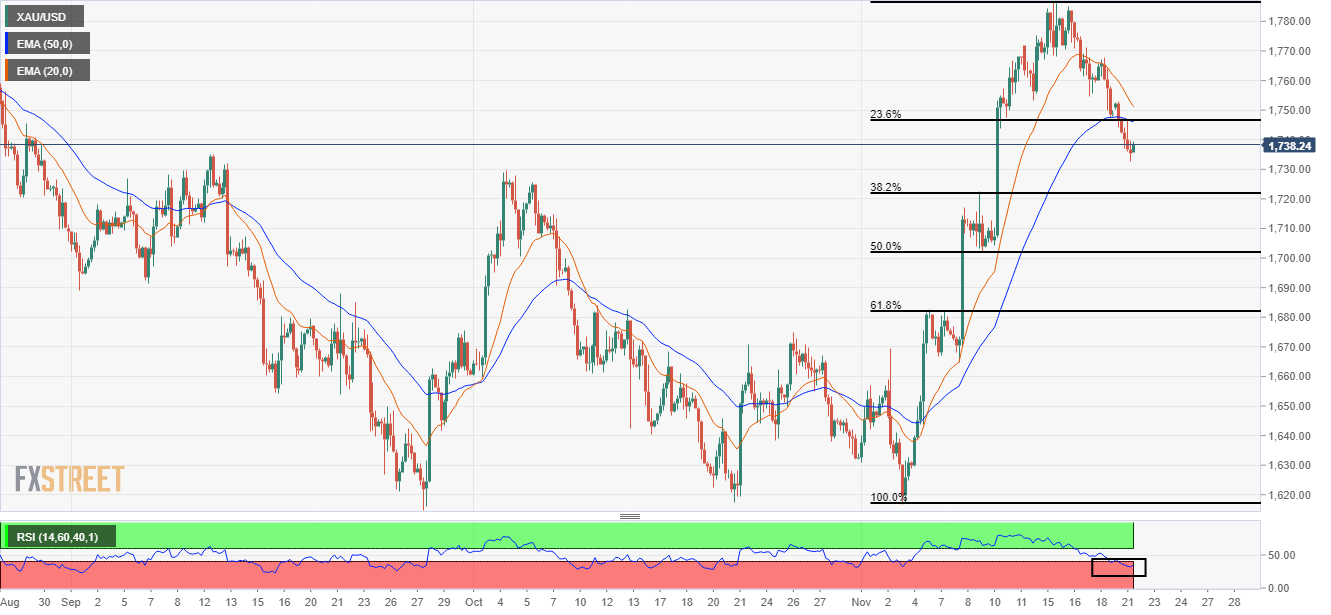
On a four-hour scale, the gold price has dropped below the 23.6% Fibonacci retracement (placed from November 3 low at $1,616.39 to November 15 high at $1,786.55) at $1,746.67. The asset has dropped below the 20-and 50-period Exponential Moving Averages (EMAs) at $1,751.40 and $1,746.67 respectively, which adds to the downside filters.
Meanwhile, the Relative Strength Index (RSI) (14) has shifted into the bearish range of 20.00-40.00, which indicates more weakness ahead.
Gold four-hour chart
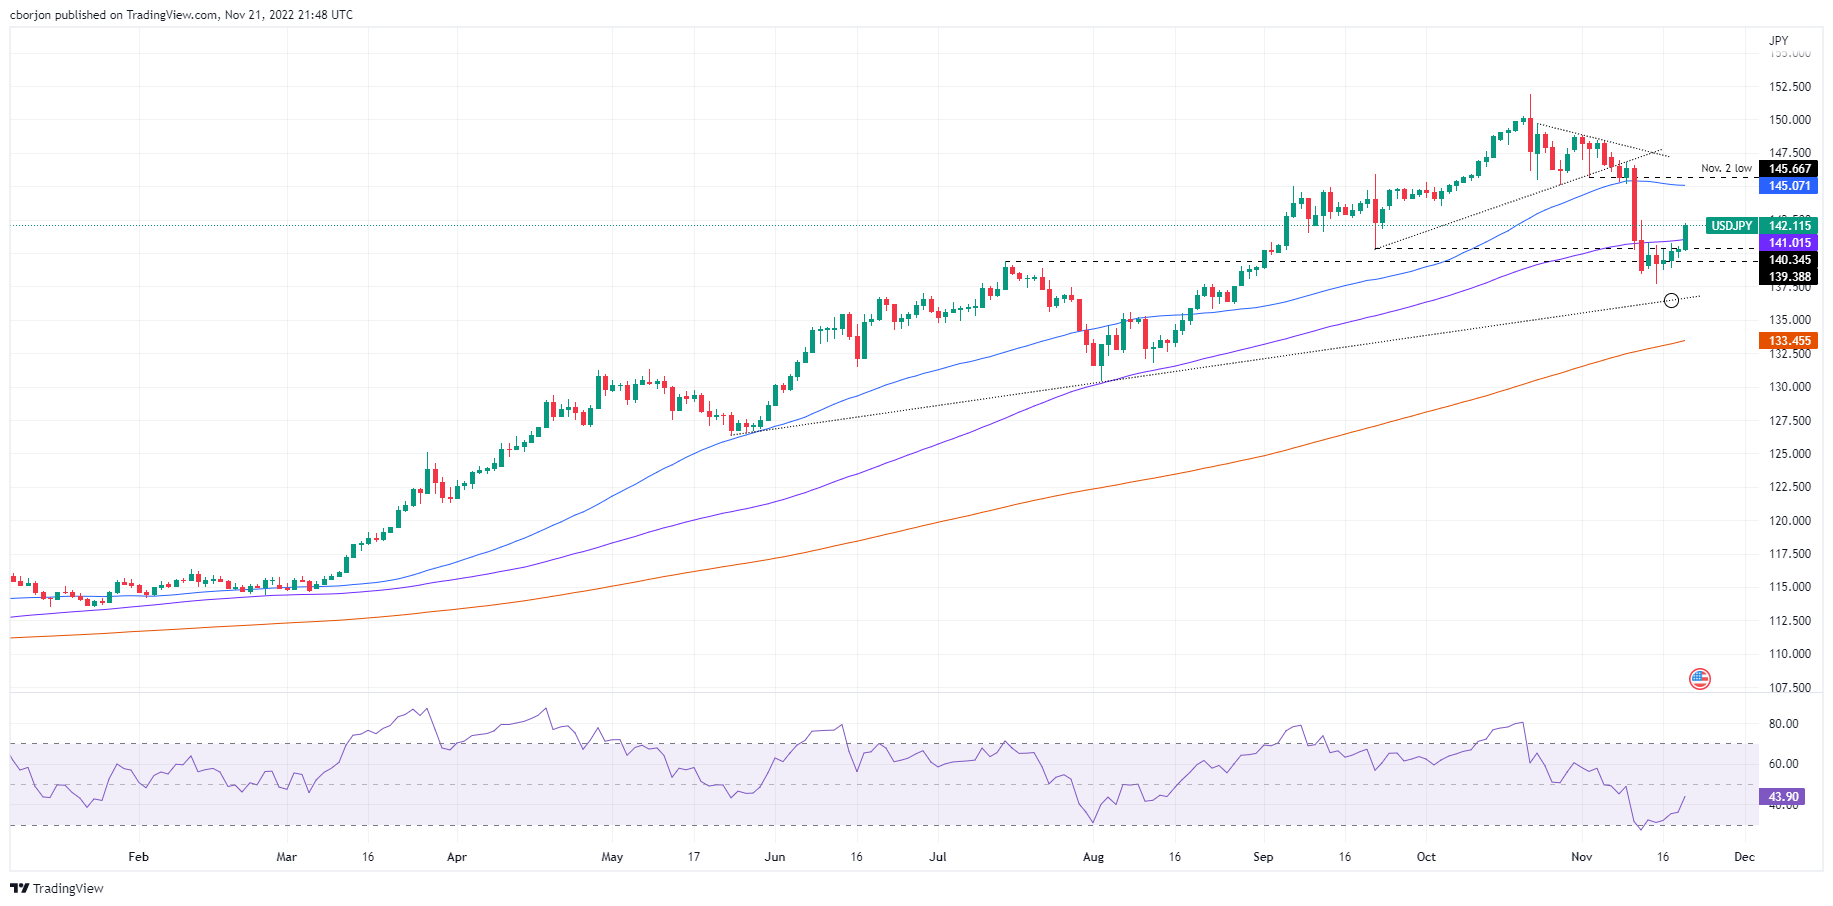
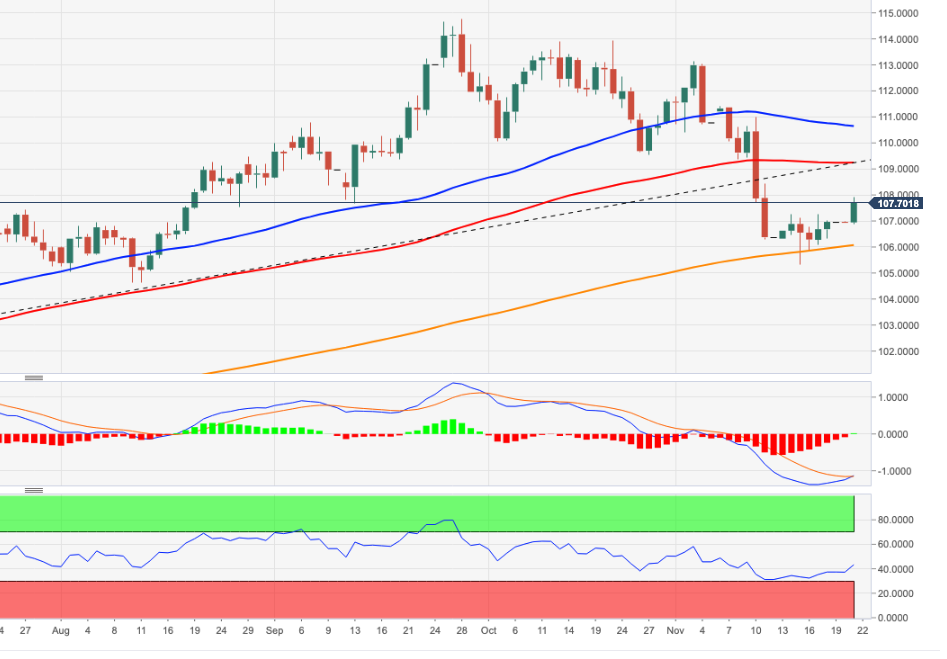
- USD/JPY recovered the 142.00 psychological level as buyers piled around the 140.00 figure.
- If the USD/JPY clears 143.00, a rally to the 50-day EMA is on the cards.
- USD/JPY Price Analysis: Upward biased, though buyers lack momentum, as shown by the RSI.
The USD/JPY bounces from below the 100-day Exponential Moving Average (EMA) and advances sharply above the 142.00 psychological level for the first time after dropping to three-month lows of 137.65 in the last week. Factors like sentiment, a buoyant US Dollar (USD), and reclaiming the 100-day EMA bolstered the USD/JPY. Hence, the USD/JPY is trading at 142.03, above its opening price by 1.21%, after hitting a daily low of 140.15.
USD/JPY Price Analysis: Technical outlook
The USD/JPY daily chart portrays the pair as neutral-to-upward biased once buyers reclaimed the 100-day EMA. Of note, on its way north, the Relative Strength Index (RSI) aims upwards, accelerating towards the 50-midline, which, once crossed, suggests that buyers are in charge. USD/JPY key resistance levels in the daily chart are November 11, high at 142.48, followed by the psychological 143.00 figure, ahead of the 50-day EMA at 145.07.
On the other hand, the USD/JPY first support would be the 142.00 mark. A breach of the latter will expose the 100-day EMA at 141.01, followed by September 22 swing low at 140.34, ahead for the MTD low of 137.65.
USD/JPY Key Technical Levels
- AUD/USD is correcting into daily support with eyes on 0.6550.
- Price remains in bullish territories while on the back side of the bearish trend.
As per the prior analysis, AUDUSD Price Analysis: Bears eye a breakout to the downside for the opening sessions, the price has indeed moved lower as the following illustrates.
AUD/USD prior analysis
The hourly M-formation was compelling and argued for a downside continuation having already corrected into the bearish impulse and resistance. The AUDUSD H4 chart looked like this:
AUDUSD update
The four-hour chart shows the price meeting the 50% mean reversion of the following daily chart's prior bullish impulse:
The price has been attempting to break higher on the back side of the bear trendline but it has met resistance and is now correcting into daily support with eyes on 0.6550.
- Albeit plunging below $76.00, WTI stages a comeback, trimming earlier losses to 0.51%
- Saudi officials denied news that OPEC considered increasing oil production.
- WTI Price Analysis: A candlestick hammer in the daily chart can propel oil prices higher.
Western Texas Intermediate (WTI) remains negative during the North American session after hitting a daily low of $75.30 per barrel on rumors that the Organization of the Petroleum Exporting Countries (OPEC) was considering an increase in its oil production, as reported by the Wall Street Journal (WSJ). Another factor that weighed on crude oil demand was China’s Covid-19 outbreak, causing three deaths in the last week, augmenting speculations that China’s oil need will diminish. Therefore, WTI exchanges hand at $79.88 per barrel.
According to OPEC delegates cited by the WSJ, Saudi Arabia considered boosting crude oil output by 500,000 barrels ahead of the oil embargo imposed on Russian oil. Once the headline crossed wires, WTI slashed 3.6% of its value, collapsing towards its daily low of $75.30, before recovering some ground as the Saudi Energy Minister Prince Abdulaziz bin Salman, denying those affirmations
Prince Abdulaziz bin Salman said, “if there is a need to take further measures by reducing production to balance supply and demand, we always remain ready to intervene.”
Aside from this, China’s Covid-19 cases are increasing to levels last seen in April 2022, according to Goldman Sachs. Sentiment shifted sour on fears that Chinese authorities reimposing lockdowns could slow down the global economy, weighing, and denting crude oil’s demand.
Oil traders should be aware that OPEC and its allies (OPEC+)will meet on December 4 to lay the ground for January 2023, one day before the Russian oil embargo and G7 oil price cap begins.
Also read:
- Saudi Arabia eyes OPEC+ production increase – WSJ
- Saudi Energy Minister Abdulaziz: The current OPEC+ deal continues to the end of 2023
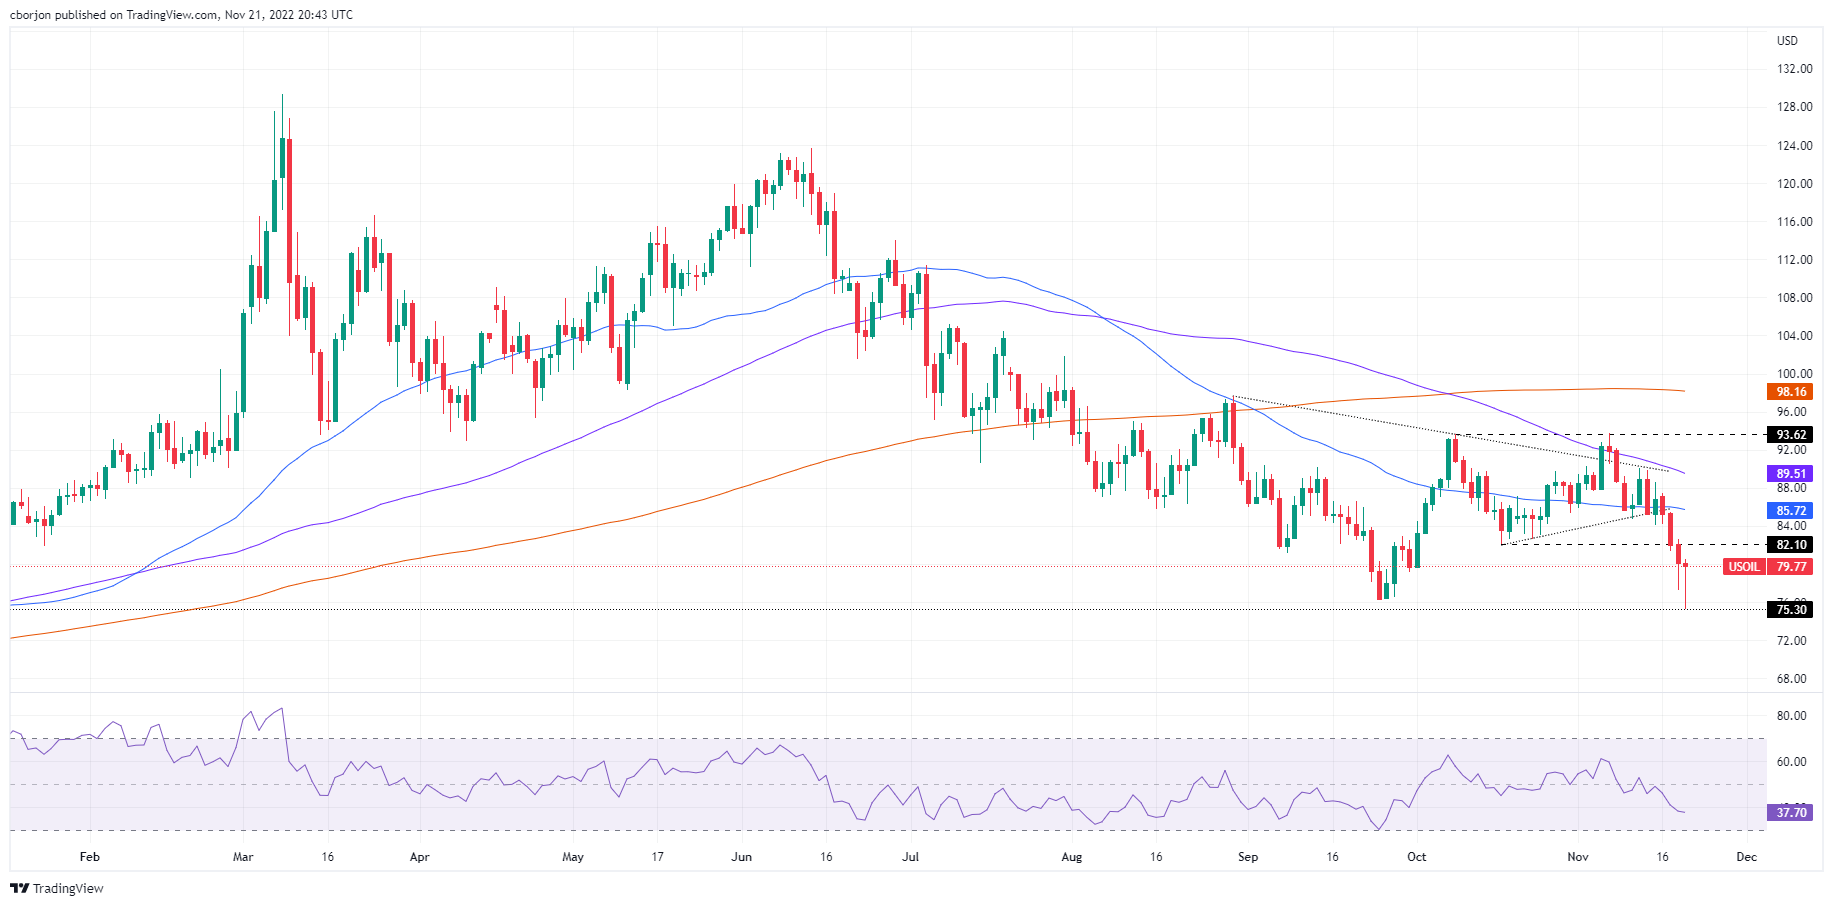
WTI Price Analysis: Technical outlook
WTI daily chart suggests that oil prices fell short of the 2022 YTD low of around $74.30 PB and are staging a comeback, nearly $80.00 PB. Notably, Monday’s price action formed a massive hammer candlestick, suggesting that WTI could rally in the near term, but firstly, buyers need to reclaim $80.00.
If that scenario plays out, WTI’s first resistance would be October’s 18 swing low-turned-resistance at $82.10, followed by the 50-day Exponential Moving Average (EMA) at $85.72 and the 100-day EMA at $89.51. On the flip side, WTI’s key support levels are the September 26 daily low at $76.28, the November 21 swing low at $75.30, and the YTD low of $74.30.
In a CNBC interview, Federal Reserve Bank of Cleveland President Loretta Mester said it makes sense to slow down a bit the pace of rate hikes.
Key comments
Can now be very deliberate in setting policy.
Need to be more judicious in balancing risks.
Not anywhere near to stopping rate hikes though.
We've had some good news on inflation front, but need more and sustained good news.
Am very grateful we've seen some encouraging signs on inflation.
We are beginning to see our actions working.
Question is how do we calibrate policy to get back to 2% inflation goal.
Getting back to 2% will take some time, we need to do more work.
I don't think market expectations of fed funds rate is really off.
I do think we need to get into restrictive territory, right now we are just barely there.
Rate path will depend on the economy.
We are moving into a different cadence on policy, letting data guide us.
I will be listening to my contacts, as their feedback is more forward looking.
I think we can slow down from 75 at dec meeting.
But we need to let economy tell us going forward the pace of hikes after that.
If we don't see meaningful progress on inflation next year, we will need to react.
Journey back to 2% will have some pain involved.
If we don't see meaningful progress on inflation next year, we will need to react.
Journey back to 2% will have some pain involved.
Very much monitoring balance sheet runoff impact on financial market functioning.
We have said we will be flexible on balance sheet if conditions change; so far no reason to change.
I don't have a recession in my forecast.
But with below-growth trend, there are risks an unexpected shock could send us into recession.
But right now the focus is on getting inflation down.
US dollar update
The US Dollar DXY dropped to a fresh low of 106.28 on Friday, extending the post-CPI dump into a fresh layer of potential support. On Monday, the greenback as measured by the DXY index is up 0.85% at the time of writing at 107.87. The catalyst for the move can be partly put down to a risk-off start to the week due to fresh COVID-19 curbs in China that have fuelled worries over the global economic outlook.
Further to earlier comments, San Francisco Federal Reserve President Mary Daly said on Monday that she is not prepared to say what hike the Fed should do at December Federal Open Market Committee.
Further comments
Not taking anything off the table for Dec.
At some point, it will be right for Fed to slow the rate hike pace.
Can hike beyond 5% if inflation data doesn’t cool.
US Dollar update
The US Dollar advanced against most major currencies on Monday due to fresh COVID-19 curbs in China fuelled worries over the global economic outlook and boosting the greenback, which is seen as a safe haven in times of stress:
-
US Dollar bulls bounce back to life, eye 50% mean reversion and beyond
What you need to take care of on Tuesday, November 22:
The American Dollar edged higher on Monday, helped by a negative shift in the market’s sentiment. Risk aversion dominated financial markets after China’s National Health Commission reported two deaths of Covid-19 patients in Beijing, while the country reported over 26,000 new contagions on Sunday. Stay-at-home orders were issued in different regions, spurring concerns about a potential global economic setback amid the country’s strict covid policy.
The EUR/USD pair trades not far above a daily low of 1.0222, while GBP/USD barely holds above the 1.1800 figure. Germany published the October Producer Price Index (PPI), which unexpectedly contracted by 4.2% MoM. The annual figure was up by 34.5%, well below the previous 45.8%. It is the first sign of easing inflation in the EU.
European Central Bank (ECB) Executive Board member Philp Lane was on the wires and said that any recession in the Union would be mild and short-lived. He also noted that the ECB would hike rates again in December, progressing towards the levels needed. Government Council member Robert Holzmann said if the current situation persists, they will go for a 75 bps hike in December. Finally, ECB policymaker Mario Centeno noted that many conditions exist for rate increases to be less than 75 basis points in December.
Commodity-linked currencies ended the day with losses against the greenback. The AUD/USD pair trades around 0.6600, while USD/CADstands at 1.3440, down from an intraday high of 1.3416.
The Japanese yen was among the weakest US Dollar rivals, ending the day at around 142.05. In the meantime, the USD/CHF pair recovered to the 0.9590 price zone.
Gold fell for a fourth consecutive day, settling at around $1,738 a troy ounce. Crude oil prices, on the other hand, plunged ahead of the US opening amid market talks suggesting some OPEC members were considering a production increase of up to 500,00 barrels per day. The news was later denied by the Saudi Energy Minister, who said the current OPEC+ deal would continue until the end of 2023. Crude oi prices trimmed early losses and finished the day pretty much unchanged, with WTI now trading at $80 a barrel.
The week will be mostly light regarding macroeconomic releases, focusing on the FOMC Meeting Minutes to be out on Wednesday.
Like this article? Help us with some feedback by answering this survey:
- NZD/USD bears move in on paring back in global risk appetite.
- Fed minutes will shed light on the FOMC's deliberations.
NZD/USD is pressured at the start of this week due to a stronger US dollar that is bouncing back from a number of red days following a period of accumulation at the depths of November's sell-off. At the time of writing, DXY, an index that measures the US Dollar vs. a basket of currencies is higher by 0.77% and has sent the Kiwi down to a low of 0.6087 from the day's high of 0.6169.
The catalyst for the move can be partly put down to a risk-off start to the week due to fresh COVID-19 curbs in China that have fuelled worries over the global economic outlook.
- China doctors have made a stark warning to Pres. Xi
''The Kiwi slipped overnight amid a broad paring back in global risk appetite as equities nudged lower and the USD regained some of its lost safe-haven appeal,'' analysts at ANZ Bank explained. ''There didn’t seem to be a lot behind the moves, with little data or news to digest. But we suspect we could be in for a bit of volatility in coming days, with the RBNZ MPS due tomorrow, followed by a handful of global PMI data prints, and then the Fed minutes.''
''The MPS could be the real wildcard, even if the market gets the 75bp hike analysts are looking for, and that’s because there is a very wide range of views around where the RBNZ might project the OCR to peak (currently 4.1%). This is likely to be what determines where key short-end swap rates go, and by extension and correlation, where the Kiwi goes.''
FOMC minutes eyed
For the week ahead, the Fed minutes will shed light on the FOMC's deliberations regarding the expected downshift in the pace of rate increases. ''With that said, policymakers will also emphasize that the terminal rate is likely edging higher vs prior expectations as the labor market remains overly tight. In terms of the data, we look for the mfg PMI to recede modestly, staying above the 50 level in November,'' analysts at TD Securities said.
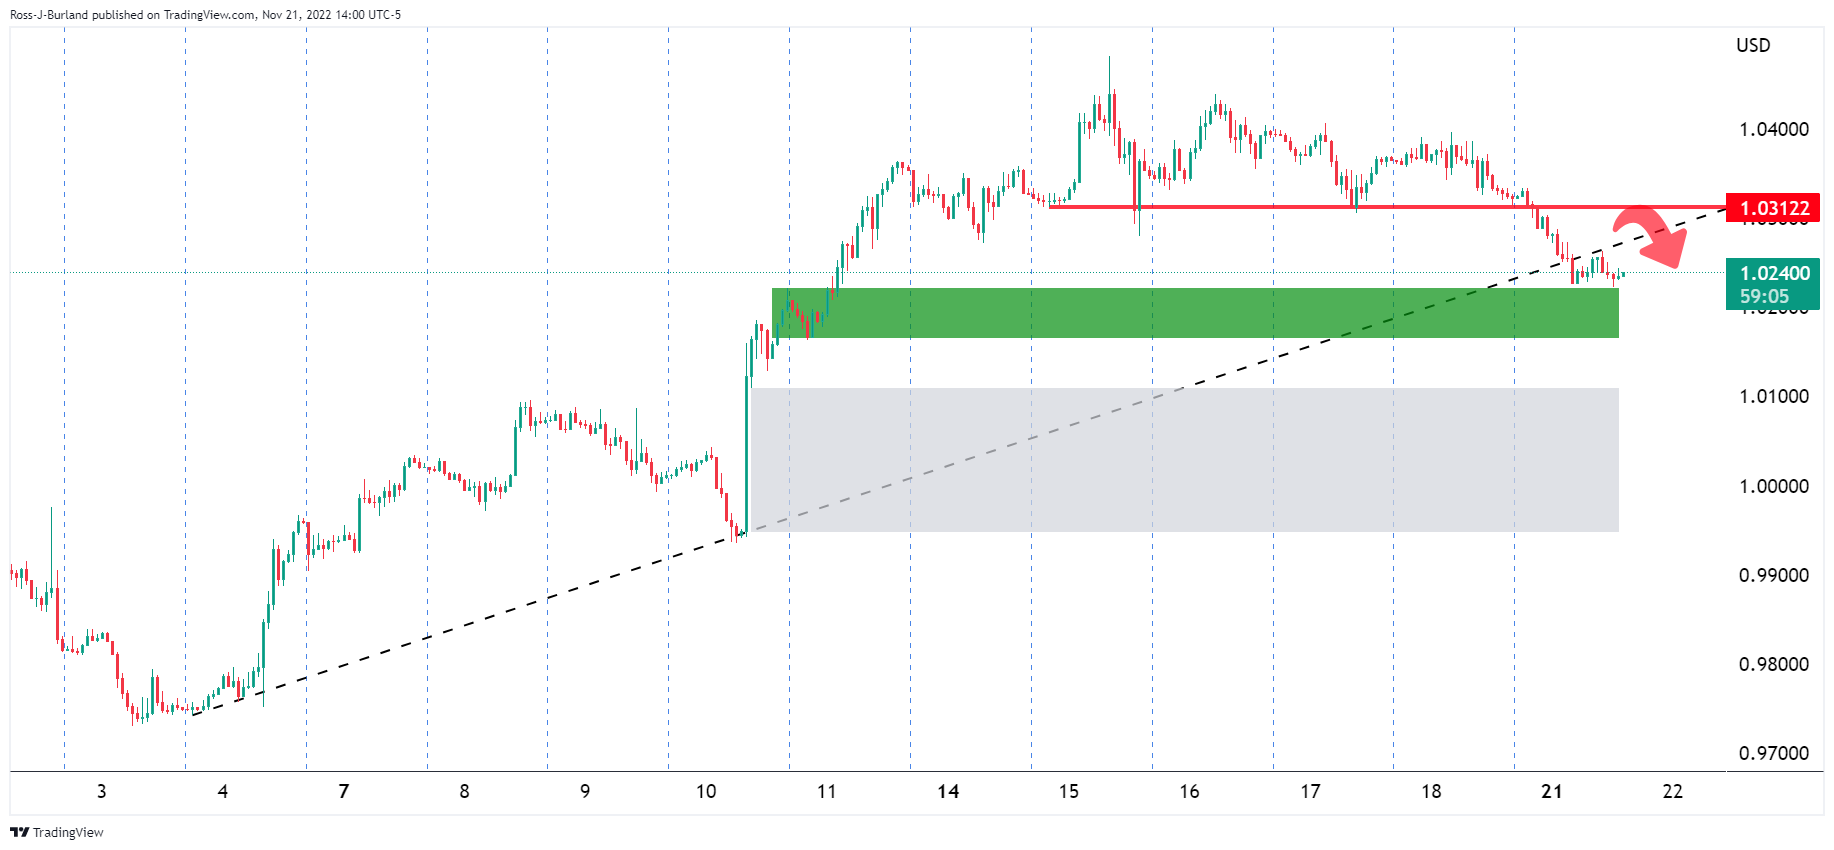
- EUR/USD bears are lurking below 1.0300 and eye a fast break below support.
- The bulls are gathering at 4-hour support in the meanwhile.
EUR/USD is under pressure at the start of the week and the highs appear to be locked in following a break of structure at 1.0270 as the following technical analysis will show with 1.0200 in focus:
EUR/USD weekly chart
The weekly chart sees the price attempting to break the dominant trendline resistance, but so far, the bulls are lacking conviction. A pullback is underway and there are prospects of a correction to the support structure.
EUR/USD daily chart
The daily charts show that the price is cracking the structure of 1.0270 on the backside of the micro trendline that has been broken. This gives rise to a downside continuation into support.
EUR/USD H4 chart
The 4-hour chart sees the price collected at support already. A correction could play out in the meantime for the restest of the counter trendline.
EURUSD H1 chart
The hourly chart shows a large imbalance of bids and offers below the current support structure that will likely be mitigated quickly in a sharp drop below the current support.
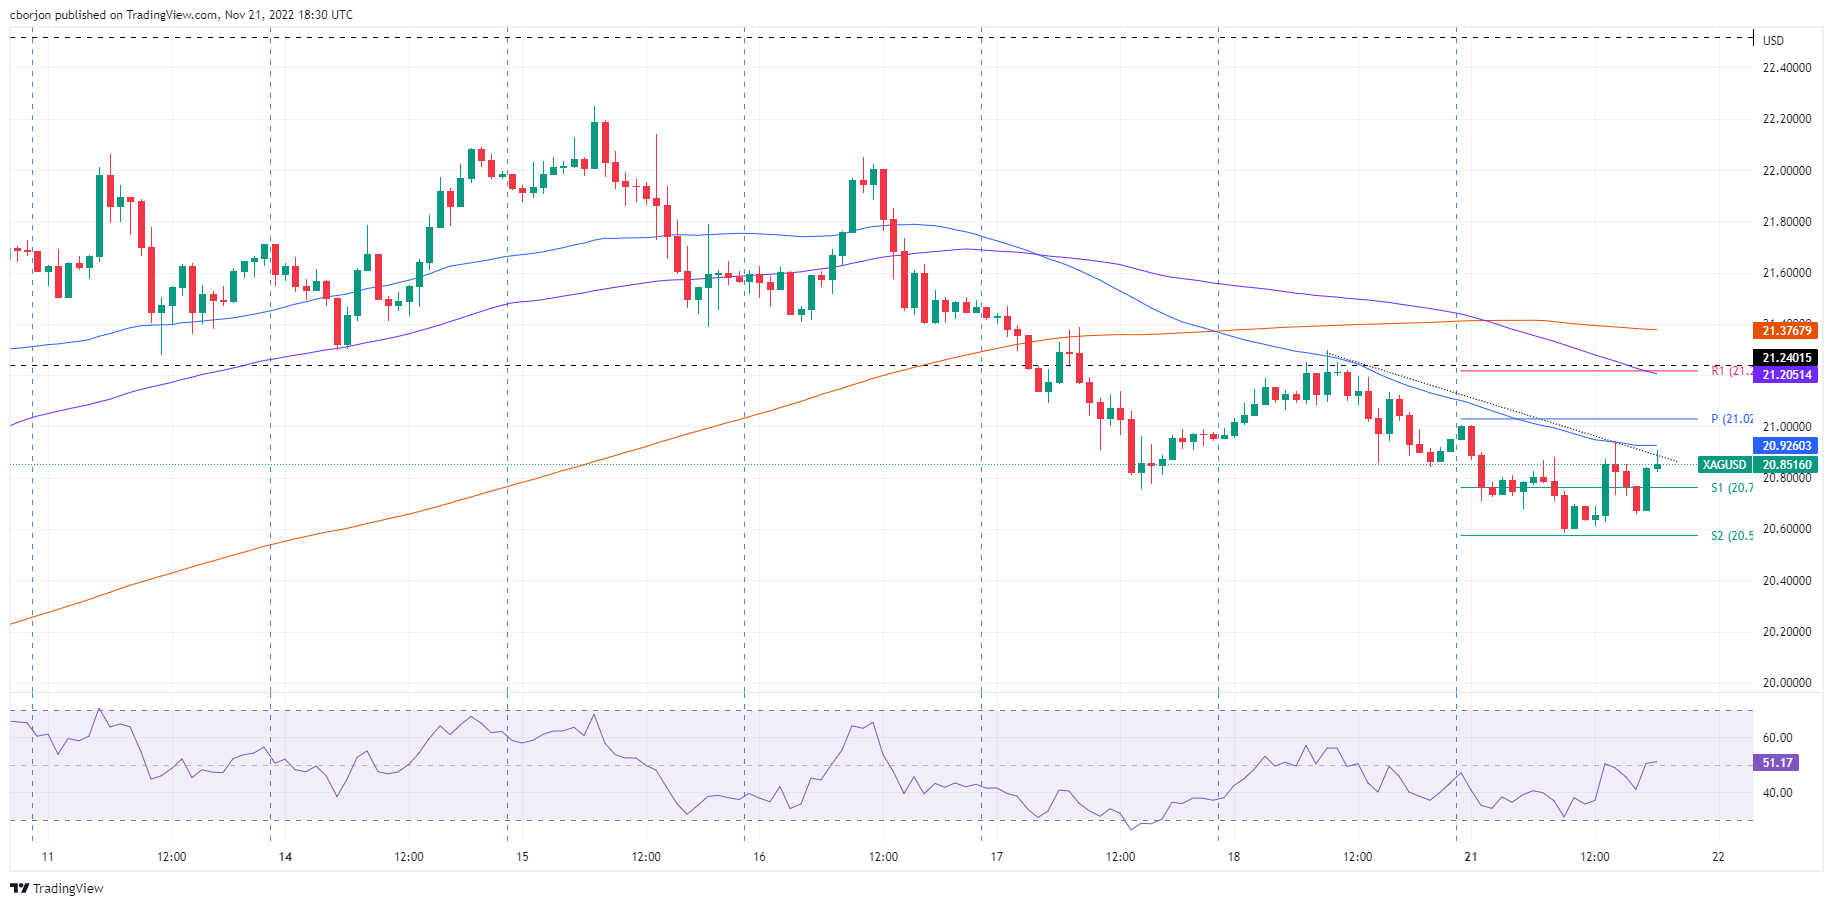
- Silver Price forms a candlestick hammer in the daily chart after hitting a two-week low at around $20.50s.
- The Relative Strength Index on the hourly chart crossed the 50-midline, bolstering XAG.
- If XAG/USD breaks above $20.90s, Silver will rally toward $21.00; otherwise, it will consolidate around $20.50.
Silver Price prolongs its losses after rallying to a multi-month high around $22.25, and plunges below the 200-day Exponential Moving Average (EMA), as broad US Dollar (USD) strength weighs on the white metal. Hence, the XAG/USD is trading at $20.85, beneath its opening price by 0.56%, after hitting a daily high of $21.00 a troy ounce.
Silver Price Analysis: Technical outlook
From a technical perspective, the XAG/USD is neutral-to-upward biased, as shown by the daily chart. On Monday, the XAG/USD broke below the October 4 swing high of $21.24, exacerbating a fall below the $21.00 mark. Even though the white metal achieved a fresh two-week low of $20.58, the Silver Price is forming a hammer, meaning that buyers stepped in around $20.50 as they prepare to assault the 200-day ENA at $21.41.
In the near term, the XAG/USD hourly chart portrays Silver bottoming around the S2 daily pivot around $20.60, further supported by the Relative Strength Index (RSI), crossing above the 50-midline. At the same time, the XAG/USD tests the confluence of a resistance trendline and the 50-hour EMA around $20.92, which, once cleared, will expose the $21.00 psychological price level.
That said, the XAG/USD first resistance would be the previously mentioned confluence, followed by $21.00, the intersection of the R1 daily pivot, and the 100-hour EMA at $21.20. On the flip side, the XAG/USD first support would be the S1 pivot at $20.76, followed by the S2 daily pivot at $20.57.
Silver Key Technical Levels
- US Dollar bulls emerge at key support and eye a 50% mean reversion.
- Risk-off tones are benefiting the safe haven US Dollar ahead of key data and FOMC minutes.
The US Dollar, as measured by the DXY index, is up 0.85% at the time of writing. The index, which measures the US Dollar vs. a basket of currencies, is correcting a small portion of the November sell-off and is on track for a break above 108 the figure having made a high of 107.993 so far. The catalyst for the move can be partly put down to a risk-off start to the week due to fresh COVID-19 curbs in China that have fuelled worries over the global economic outlook.
- China doctors have made a stark warning to Pres. Xi
Boosting the US Dollar, the new cases and warnings by health officials to the government have cast doubt on hopes that the government could soon ease its tough restrictions.
The rebound in the greenback follows the sharp selloff over the last few weeks that saw the Dollar Index DXY fall by as much as 4.7% in November. Speculators’ net long USD index positions have declined in a moderate fashion at the same time a drop occurred in the spot market that followed the softer-than-expected print for US CPI inflation data. Additionally, net EUR long positions continued to grow and are now three times larger than their levels in mid-October. This gives room for corrections in the euro that support the prospects of a recovery in the US Dollar that remains up 12% for the year.
FOMC minutes eyed
For the week ahead, the Fed minutes will shed light on the FOMC's deliberations regarding the expected downshift in the pace of rate increases. ''With that said, policymakers will also emphasize that the terminal rate is likely edging higher vs prior expectations as the labor market remains overly tight. In terms of the data, we look for the mfg PMI to recede modestly, staying above the 50 level in November,'' analysts at TD Securities said.
US Dollar technical analysis
The DXY index has started to correct the prior bearish daily impulse and is headed towards a 50% mean reversion of the last leg of the M-formation. If, however, the resistance of the counter-trendline and neckline of the M-pattern hold, the downside will remain in focus and a test of 104.70 could play out.
Reuters reports that San Francisco Federal Reserve President Mary Daly said on Monday the real-world impact of the U.S. central bank's interest rate hikes is likely greater than what its short-term rate target implies.
In prepared remarks for an address to the Orange County Business Council in California, Daly said some researchers have found "the level of financial tightening in the economy is much higher than what the (federal) funds rate tells us."
Key notes
Compared to the current target rate, she added, "financial markets are acting like it is around 6%."
Daly said "it will be important to remain conscious of this gap between the federal funds rate and the tightening in financial markets. Ignoring it raises the chances of tightening too much."
Daly said the next stage for the Fed will be "in many ways more difficult." She added that officials will need to be "mindful" of their choices and said "adjusting too little will leave inflation too high.
"Although one month of data does not a victory make, the latest inflation report had some encouraging numbers, including a long-awaited decline in goods price inflation," she added.
Real-world impact of fed rate hikes likely higher than what current rate target implies.
Financial markets priced like fed funds rate at 6%, not 3.75%-4.00%.
Fed must be mindful of risk of tightening policy too much.
Fed has more work to do when it comes to rate hikes.
Fed policy is in modestly restrictive territory.
US dollar updated
The US Dollar, as measured by the DXY index, is up 0.85% at the time of writing. The index, which measures the US Dollar vs. a basket of currencies, is correcting a small portion of the November sell-off and is on track for a break above 108 the figure having made a high of 107.993 so far.
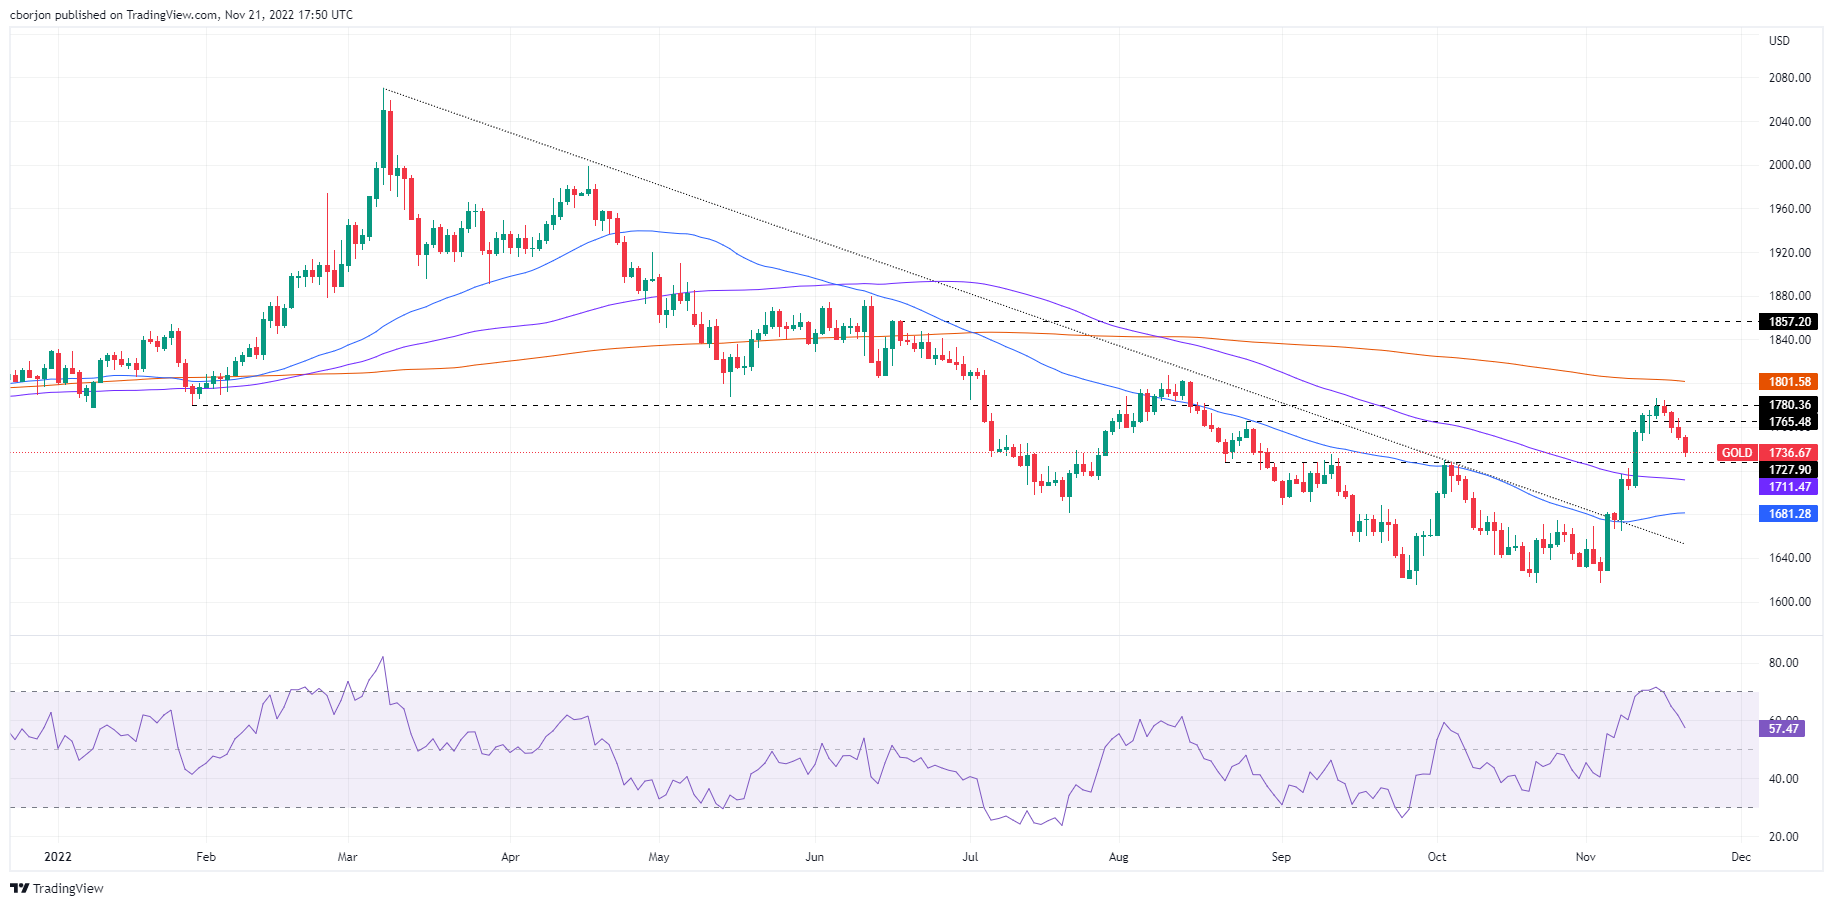
- Gold Price drops close to 0.80% on a strong US Dollar.
- Last week Federal Reserve’s hawkish commentary still weighed on investors’ mood.
- Gold Price Forecast: Supported around $1727, if broken, will expose the 100-DMA.
Gold Price grinds lower amidst a risk-off impulse, which triggered a flight to safe-haven assets. The US Dollar (USD) remains underpinned by investors’ concerns that the recent Covid-19 outbreak in China could spur authorities to reimpose restrictions. Therefore, the precious metals segment is down, as shown by the XAU/USD trading at $1735, below its opening price by 0.87%.
Buoyant US Dollar weighs on Gold Prices on sour sentiment
Sentiment remains negative, as shown by Wall Street posting losses between 0.32% and 1.08%. The financial markets narrative has not changed since October’s Consumer Price Index (CPI) report from the United States (US), which cooled down, while the Producer Price Index (PPI) followed suit. Even though both reports showed that prices are stabilizing, speculations that the Federal Reserve (Fed) might pause hiking rates were used to spur a rally in equities, which weighed on the US Dollar. However, last week’s solid US Retail Sales data increased the likelihood that the Fed would continue tightening conditions.
In that regard, US Federal Reserve officials continued to express their commitment to bringing inflation toward their 2% goal, but they said that the pace of hikes could moderate as soon as the December meeting. However, St. Louis Fed President James Bullard spooked investors, saying rates are not “sufficiently restrictive” and adding that he expects the Federal Funds rate (FFR) to peak at around 5% to 6%. Echoing some of his comments was Atlanta’s Fed President Raphael Bostic, adding that he supports slowing the rhythm of interest-rate increases and foresees 75 to 100 bps additional tightening to the FFR.
Data-wise, the US economic calendar featured the Chicago National Activity index falling to negative territory in October, to -0.05 from 0.17 in September, which triggered to reaction in the XAU/USD. In the meantime, the US Dollar Index, a measure of the buck’s value against its peers, extends its gains by 0.93%, at 107.967, registering a fresh one-week high.
Elsewhere, US Treasury bond yields are extending their gains, particularly the 10-year benchmark note rate yielding 3.818%, underpinning the USD. Another headwind for Gold Prices is Real yields, which are calculated by the US 10-year nominal yield minus inflation expectations for the same period, which remains positive at 1.71% as of last Friday’s close.
Ahead into the week, the US docket will feature Fed regional manufacturing indices alongside further Fed speaking.
Gold (XAU/USD) Price Forecast: Technical outlook
Gold Price remains neutral-to-upward biased, comfortably above the $1700 psychological level, though the Relative Strength Index (RSI) slope aims downward, accelerating towards its midline. If RSI’s central line is crossed, it will exacerbate XAU/USD’s fall towards the 100-day Exponential Moving Average (EMA) at $1711, ahead of the abovementioned $1700 figure. XAU/USD key resistance levels lie at $1750, followed by November’s high of $1786, ahead of the $1800 mark.
Following earlier rumors, Saudi Energy Minister Abdulaziz bin Salman Al-Saud said the current OPEC+ deal continues to the end of 2023.
Key notes
The current cut of 2 million bpd will be maintained until the end of 2023.
If additional measures are required to balance supply and demand, we will be ready to intervene.
Energy market update
Meanwhile, a sour note amid growing fears that China could reinstate its strict zero-COVID policy has weighed on risk appetite at the start of the week. Due to the rising infections in China, Goldman Sachs has slashed its forecast for Brent crude oil prices in the fourth quarter to US$100 per barrel from its prior US$110 estimate.
"China's Covid cases are at Apr-22 highs, yet, the new policy reaction function is unknown. However, the logic of exponential virus spread, means further lockdowns will likely be required, if full reopening is not feasible. Therefore, we cautiously lower our expectations for China demand by 1.2 mb/d in 4Q22, equivalent to the effective cut recently implemented by OPEC+, the group's first successful preemptive curtailment," the investment bank explained.
"The net impact is a c.1.5 mb/d loosening of 4Q22 balances, lowering our 4Q22 Brent forecasts by $10/bbl, to $100/bbl. Markets have instead priced a c.2 mb/d softening over the next 3 months, as these fundamental developments occurred during a seasonally low liquidity period."
- AUD/USD plunges below 0.6600 as sentiment dampened.
- Recently, China’s Covid-19 outbreak kept investors worried about speculations that the Government would reimpose restrictions.
- Traders’ focus turns to Reserve Bank of Australia Governor Philippe Lowe speaking on Tuesday.
The Australian Dollar (AUD) fell for the fourth straight day in a risk-off mood after news broke that the latest China Covid-19 outbreak caused three deaths during the weekend, as authorities eased some restrictions. Hence, speculators seeking safety bolstered the US Dollar (USD) amid growing concerns about reimposing lockdowns. The AUD/USD is trading at 0.6590 after hitting a daily high of 0.6683.
Sentiment bolstered the US Dollar on safe-haven flows
Wall Street denotes investors’ worries about China being hit by a Covid outbreak, extending its losses in the day. A light economic calendar in the United States (US) witnessed the Chicago National Activity index falling to negative territory in October, to -0.05 from 0.17 in September. Although the US October CPI and PPI reports were softer-than-expected, a solid US Retail Sales report increased the chances that the Fed will continue tightening monetary conditions.
During the last week, a slew of Federal Reserve (Fed) officials expressed the need to ease the pace of interest rate hikes but mentioned that they’re not pausing. St. Louis Fed President James Bullard said rates are not “sufficiently restrictive” and foresees the Federal Funds rate (FFR) to peak at around 5% to 6%.
The Atlanta Fed President Raphael Bostic noted that the supports slowing the rhythm of interest-rate increases and foresees 75 to 100 bps additional tightening to the FFR.
Elsewhere, the US Dollar Index (DXY), a measure of the buck’s value against a basket of six currencies, climbs sharply by 0.80%, at 107.823, a headwind for the Australian Dollar.
Aside from this, an absent Australian economic calendar leaves AUD/USD traders leaning on market sentiment, battered by China‘s news. It should be noted that the People’s Bank of China (PBoC) kept the Loan Prime Rate (LPR) unchanged at 3.65%, while Iron Ore prices added another piece of the puzzle that is weighing on the Australian Dollar.
Ahead into the week, the Reserve Bank of Australia (RBA) Governor Philip Lowe will cross wires on Tuesday, delivering a speech at the Annual Committee for Economic Development of Australia Dinner. He is expected to reiterate the RBA’s commitment to tame inflation, though it is not likely to rock the boat. On the US front, the economic calendar will feature the Richmond Fed Manufacturing Index alongside further Fed speaking.
AUD/USD Key Technical Levels
USD/CHF has maintained its rejection from 0.9372/55. A sustained close below here remains needed to confirm weakness over the next month, according to economists at Credit Suisse.
200DMA at 0.9629 ideally holds any further upside
“USD/CHF has extended its rejection of the key support zone at 0.9372/55. Whilst this development stays in line with improving near-term momentum and we see scope to extend this recovery for now, our broader bias remains negative, and we continue to look for an eventual turn back lower.”
“Immediate support is found at 0.9500/9496 and then at 0.9475/71, though a stable close below the major support zone at 0.9372/55 remains seen as needed to confirm weakness over the next month and open the door to 0.9322/12.”
“A close above the 200-day average at 0.9629 would raise a question mark over our broader bearish bias, with next resistance above here then seen at 0.9683/9700.”
AUD/USD has not followed through on the recent break above 0.6725. However, analysts at Credit Suisse see the current pause as a correction ahead of further upside.
Near-term consolidation now seen as likely
“Our bias is for the current pause to extend short term. However, with medium-term MACD still rising and with a small top in the USD in place, we think the risk remains pointed to the upside over the next one month.”
“We continue to look for an eventual and sustained close above 0.6725 and then above the recent high at 0.6797 after this pause, which would then be seen to expose the 200 -day average at 0.6943.”
“Immediate support is seen at the 13-day exponential average at 0.6607 and then below at 0.6577, though below the recent low and the neckline to the recent base at 0.6552/47 remains needed to raise thoughts of a more significant near-term move lower.”
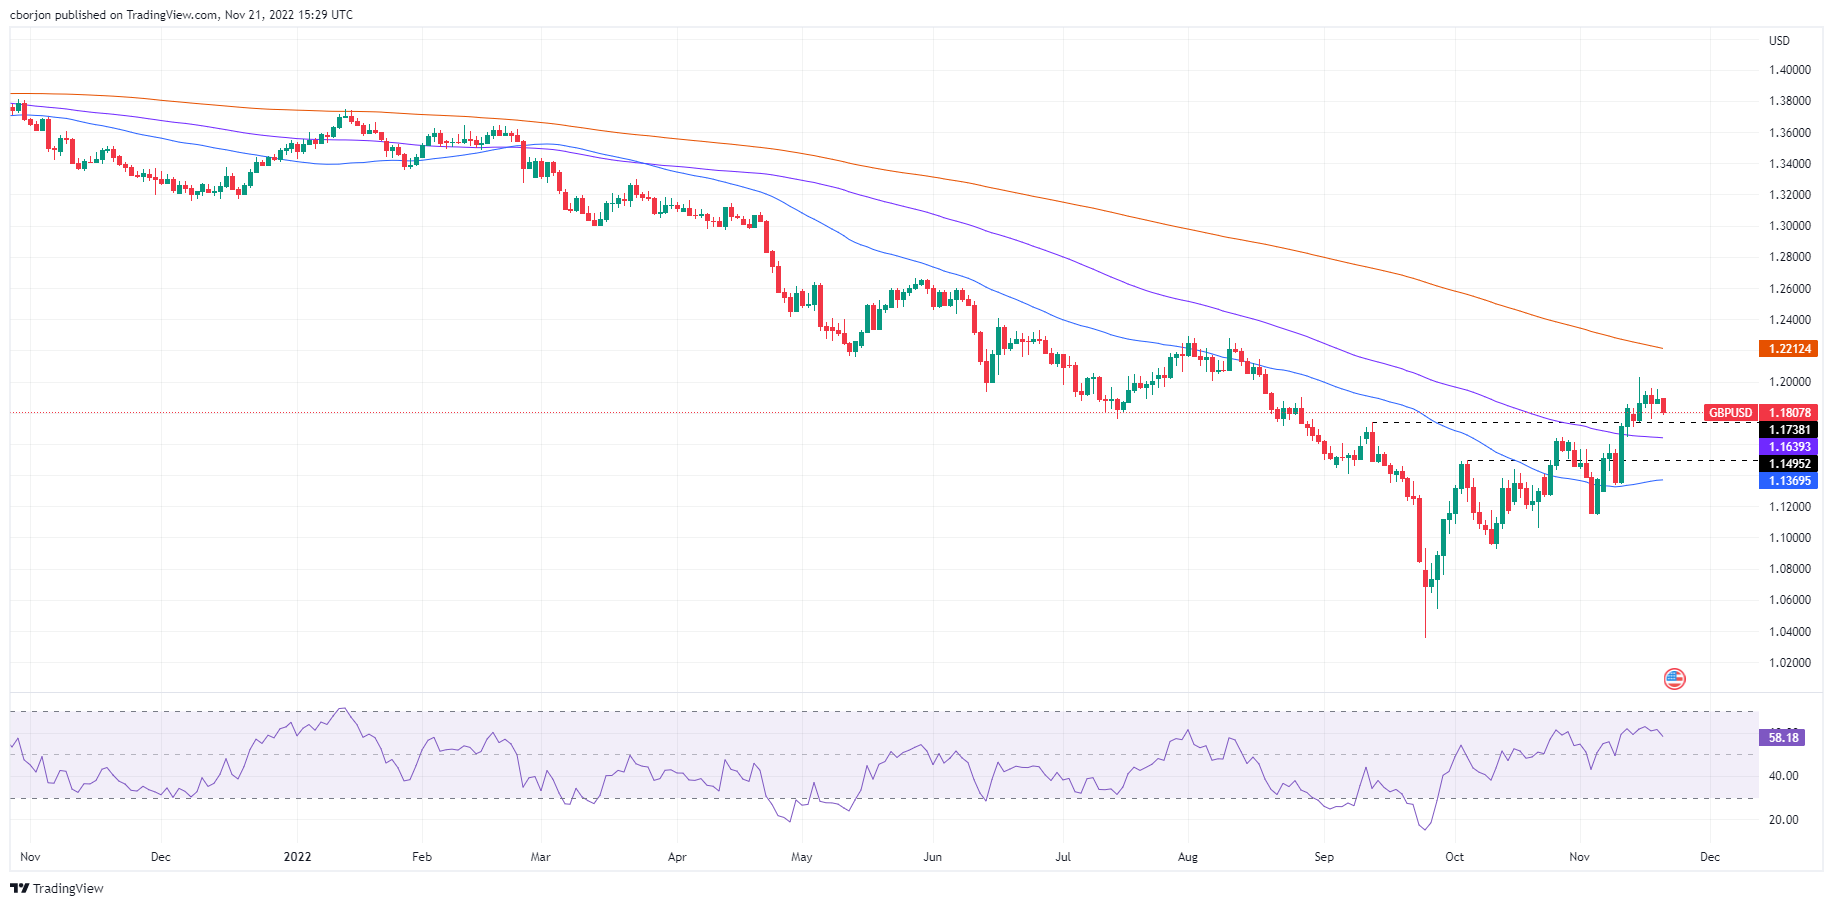
- GBP/USD drops below 1.1900, eyeing 1.1800, blamed on risk aversion.
- Amidst a light calendar, Federal Reserve commentary to give direction to the GBP/USD.
- GBP/USD to consolidate around 1.1800-1.2000 amid the lack of catalyst.
The Pound Sterling (GBP) strumbled sharply below the 1.1900 figure in the North American session amid risk aversion as China’s Covid-19 crisis worsens, reporting its first related death in six months, increasing worries of lockdowns in the second largest economy. In the last week, hawkish Federal Reserve (Fed) rhetoric weighed on investors, which lifted global equities from their yearly lows. At the time of writing, the GBP/USD is trading at 1.1816, beneath its opening price by 0.60%.
Risk aversion weighed on the British Pound
Equities remain downbeat, hit hard by China’s Covid-related news that three people died during the weekend, sparking fears that authorities could reimpose strict measures to curb the outbreak. The economic docket in the United States (US) revealed the Chicago National Activity index fell into negative territory in October, to -0.05 from 0.17 in September. Aside from this, even though US October CPI and PPI reports were softer-than-expected, a solid US Retail Sales report increased the chances that the Fed will continue tightening monetary conditions.
In the meantime, the US Dollar Index, a greenback gauge against a basket of currencies, jumped 0.62%, at 107.646 was a headwind for the GBP/USD.
On the United Kingdom (UK) side, the Office for Budget Responsibility (OBR) foresees a drop of 1.4% in GDP for 2023, worst than the estimated 1.8% growth in March. Meanwhile, expectations that the Bank of England (BoE) would tighten monetary policy
What to watch
Ahead in the week, the UK economic docket Is light, awaiting S&P Global/CIPS PMIs on Wednesday. Across the pond, the US calendar will feature further Fed speaking.
GBP/USD Price Analysis: Technical outlook
After rallying towards fresh three-month highs above 1.2000, the GBP/USD retraces toward testing the September 13 swing high-turned-support at 1.1738. However, until GBP sellers clear the 1.1800, the major might consolidate in the 1.1800-1.2000, awaiting a fresh catalyst.
GBP/USD key resistance levels lie at 1.1900, followed by the 1.2000 psychological level. On the flip side, the GBP/USD first support would be the 1.1800 mark, which, once cleared, would expose the abovementioned 1.1738, followed by the 100-day Exponential Moving Average (EMA).
EUR/USD slide edges under 1.03 support zone. Economists at Scotiabank believe that the pair could extend its slump to 1.0100/05.
Risk of EUR/USD rally extending towards the low 1.05 removed for now
“Loss of support around 1.0310 has condemned the EUR to some short-term (at least) weakness and removed the risk of its rally extending towards the low 1.05 for now.”
“We still think better EUR support will emerge on dips but that could mean near 1.02 or – at worst – nearer more solid, short-term support at 1.0100/05.”
“Resistance is 1.0300/05.”
- The selling pressure remains well and sound around EUR/USD.
- The dollar trades in multi-session highs when tracked by the DXY.
- The Chicago Fed National Activity Index worsened in October.
Bears keep controlling the mood in the risk complex and keep EUR/USD depressed in the 1.0250 region at the beginning of the week.
EUR/USD drops to 2-week lows
EUR/USD maintains the corrective downside well in place for yet another session and threatens to challenge the key support around the 1.0200 neighbourhood sooner rather than later.
Indeed, in quite an uneventful session, the greenback extends the recent bounce backed by the recent hawkish message from some Fed speakers, which lent renewed oxygen to both the buck and yields, while at the same time mitigated the optimism around a potential Fed’s pivot.
Earlier in the calendar, German Producer Prices contracted 4.2% MoM in October and rose 34.5% vs. the same month of 2021. In the US data space, the Chicago Fed National Activity Index dropped to -0.05 in October (from 0.17).
What to look for around EUR
EURUSD sees its downside exacerbated to the area of 2-week lows on the back of the resumption of the bid bias in the greenback.
In the meantime, the European currency is expected to closely follow dollar dynamics, geopolitical concerns and the Fed-ECB divergence. In addition, markets repricing of a potential pivot in the Fed’s policy remains the exclusive driver of the pair’s price action for the time being.
Back to the euro area, the increasing speculation of a potential recession in the region - which looks propped up by dwindling sentiment gauges as well as an incipient slowdown in some fundamentals – emerges as an important domestic headwind facing the euro in the short-term horizon.
Key events in the euro area this week: Flash EMU Consumer Confidence (Tuesday) EMU, Germany Advanced PMIs (Wednesday) – Germany IFO Business Climate, ECB Accounts (Thursday) – Germany Final Q3 GDP Growth Rate, GfK Consumer Confidence (Friday).
Eminent issues on the back boiler: Continuation of the ECB hiking cycle vs. increasing recession risks. Impact of the war in Ukraine and the persistent energy crunch on the region’s growth prospects and inflation outlook. Risks of inflation becoming entrenched.
EUR/USD levels to watch
So far, the pair is retreating 0.69% at 1.0251 and a breach of 1.0021 (100-day SMA) would target 0.9935 (low November 10) en route to 0.9730 (monthly low November 3). On the other hand, the next hurdle emerges at 1.0406 (200-day SMA) ahead of 1.0481 (monthly high November 15) and finally 1.0500 (round level).
USD/CAD has extended its rejection from 1.3225/03. However, analysts at Credit Suise continue to look for an eventual break below this level.
Weakness to be eventually reasserted
“Whilst we see room for the recovery to extend further reinforced by daily MACD turning higher and daily RSI unwinding from oversold levels, this move higher is seen as a near-term correction within the broader bearish environment.”
“Our bias is for the weakness to be eventually reasserted, though with a break below 1.3298 needed to retest the still intact key support at 1.3225/03, a stable close below which would signal further setback to 1.3021/1.2986.”
“We look for the neckline to the recent top and the recent price high at 1.3493/1.3571 to ideally provide a better near-term ceiling to prevent a stronger recovery.”
According to the Wall Street Journal (WSJ), Saudi Arabia is eyeing an OPEC+ production increase ahead of the embargo and price cap on Russian oil.
An increase of up to 500,000 barrels a day is now under discussion for OPEC+’s December 4 meeting, the WSJ reported, citing delegates.
Market reaction
Crude oil prices came under heavy bearish pressure on this headline and the barrel of West Texas Intermediate (WTI) was last seen trading at $77.20, where it was down 3.6% on a daily basis.
USD/SGD has stayed within a relatively narrow range at either side of 1.37 over the past week. For the week ahead, economists at MUFG Bank see the pair within a range of 1.3638 and 1.3864 with slight upside bias
Still positive outlook
“For the week ahead, we continue to see elevated inflation amid subdued industrial production growth for October. Overall, these may provide near-term supports for the SGD for the coming week.”
“For USD/SGD, we see the pair within a range of 1.3638 and 1.3864 with slight upside bias.”
Economist at UOB Group Lee Sue Ann reviews the announcement of the UK’s Autumn Statement.
Key Takeaways
“Following weeks of speculation, UK Chancellor of the Exchequer Jeremy Hunt delivered his long-awaited Autumn Statement on Thu (17 Nov). Nicknamed the “memorial service for Trussonomics”, Hunt’s sweeping GBP55bn fiscal plan was based around 3 priorities – stability, growth and public services – as he sought to restore credibility under the new Prime Minister Rishi Sunak’s government.”
“Meanwhile, the independent Office for Budget Responsibility (OBR) now estimates that the UK economy is in recession and that GDP will contract by 1.4% in 2023, while inflation is predicted to hit 9.1% this year and 7.4% next year.”
“We maintain our view of a 50bps move at its 15 Dec monetary policy meeting. But we think the BOE still has a little way to go, given that Hunt as decided to delay much of the pain from the fiscal consolidation, which means that fiscal policy will do little to fight inflation.”
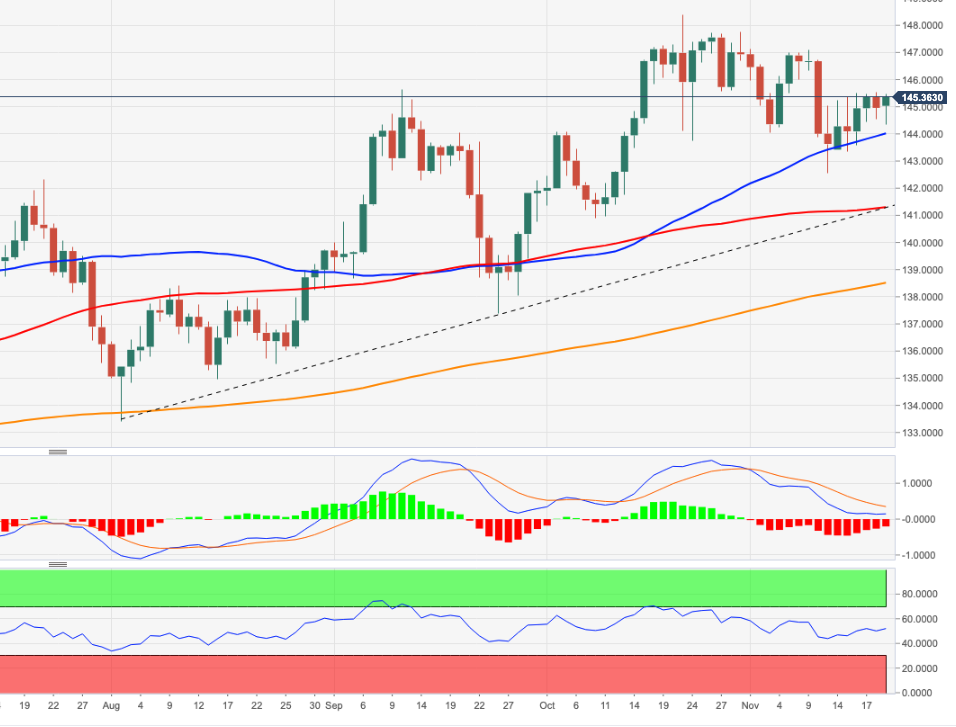
USD/JPY continues its rebound. Economists at Credit Suisse expect the pair to extend its rebound to the 13-day exponential average at 142.18/20.
Support seen at 139.63, then 138.63
“We see scope for a deeper recovery, whilst still maintaining our broader negative outlook. Resistance is seen at the falling 13-day exponential average at 142.18/20, which we look to try and cap on a closing basis. Above can see a deeper recovery back to the 38.2% retracement of the October/November fall at 143.12/17, but with fresh sellers expected here.”
“Below 139.63 is needed to ease the immediate upside bias. Big picture, we look for an eventual sustained move below 138.63 for a fall back to 137.69 and eventually what we expect to be much better support at the 200-day average at 133.48.”
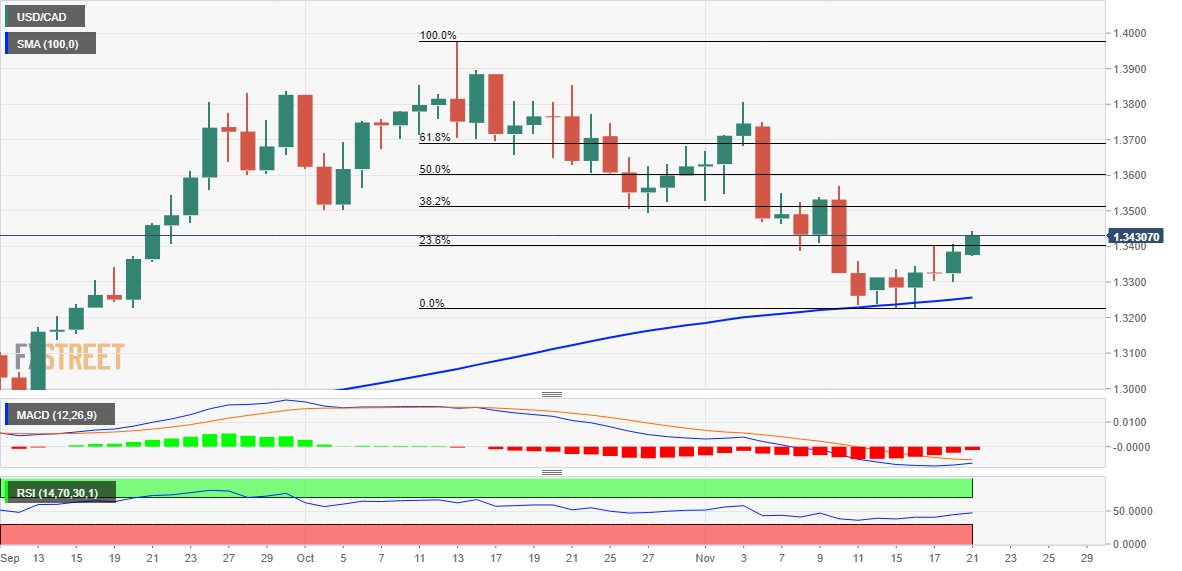
- USD/CAD climbs to over a one-week high and draws support from a combination of factors.
- Bearish oil prices undermine the Loonie and act as a tailwind amid sustained USD buying.
- Sustained strength beyond the 1.3400 mark might have set the stage for additional gains.
The USD/CAD pair builds on last week's bounce from the 100-day SMA support, or a two-month low, and gains some follow-through traction on Monday. The pair maintains its bid tone through the early North American session and is currently trading near a one-and-half-week high, just below mid-1.3400s.
Crude oil prices languish near the lowest level since September 28 amid concerns that the worsening COVID-19 situation in China will dent fuel demand. This, in turn, undermines the commodity-linked Loonie and acts as a tailwind for the USDCAD pair amid the ongoing US Dollar recovery from a three-month low.
From a technical perspective, sustained strength beyond the 23.6% Fibonacci retracement level of the corrective slide from over a two-year peak could be seen as a trigger for bullish traders. This, in turn, remains supportive of the intraday positive move and supports prospects for a further near-term appreciating move.
That said, oscillators on the daily chart - though have been recovering from the negative territory - are yet to confirm a bullish bias and warrants caution. Hence, any subsequent move up might attract some sellers near the 1.3500 psychological mark and remain capped near the 50-day SMA support breakpoint, around mid-1.3500s.
On the flip side, the 1.3400 resistance breakpoint now seems to protect the immediate downside. The next relevant support is pegged near the 1.3325 region. This is closely followed by the 1.3300 mark, which if broken might expose the 100 DMA support, currently around the 1.3255-1.3250 area, or the monthly low touched last week.
USD/CAD daily chart
Key levels to watch
- EUR/USD accelerates the decline and retargets 1.0200.
- The loss of 1.0200 exposes a probable drop to 1.0020.
EUR/USD adds to the ongoing retracement and loses ground for the third session in a row on Monday.
A deeper pullback could breach 1.0200 and thus pave the way for extra losses to the 100-day SMA around 1.0020. South of this level, a potential visit to the parity zone could return to the radar.
In the meantime, the 200-day SMA, today at 1.0406, continues to cap occasional bullish attempts.
EUR/USD daily chart
- Chicago Fed's National Activity Index fell into negative territory in October.
- US Dollar Index clings to strong daily gains above 107.50.
The Federal Reserve Bank of Chicago's National Activity Index (CFNAI) declined to -0.05 in October from 0.17 in September.
"The CFNAI Diffusion Index, which is also a three-month moving average, decreased to +0.13 in October from +0.25 in September," the publication further read. "Forty-five of the 85 individual indicators made positive contributions to the CFNAI in October, while 40 made negative contributions."
Market reaction
This data failed to trigger a noticeable market reaction. As of writing, the US Dollar Index was up 0.75% on the day at 107.77.
- DXY adds to the ongoing rebound and approaches 108.00.
- Further upside could see the 100-day SMA near 109.20 revisited.
DXY advances for the third session in a row and trades at shouting distance from the key barrier at 108.00 on Monday.
The continuation of the uptrend targets the temporary hurdle at the 100-day SMA, today at 109.18, prior to the resistance line around 109.70. The surpass of the latter could prompt gains to pick up pace in the short-term horizon.
While above the key 200-day SMA at 105.11, the outlook for the index should remain constructive. This region is also reinforced by the November low at 105.34 (November 15).
DXY daily chart
- USD/JPY surges past the 141.00 confluence and rises to over a one-week high on Monday.
- Strong follow-through USD buying remains supportive amid the Fed-BoJ policy divergence.
- The mixed technical setup warrants some caution before positioning for any further gains.
The USD/JPY pair gains strong positive traction on Monday and recovers further from its lowest level since August 29 touched last week. Spot prices climb to over a one-week high during the early North American session, with bulls now looking to build on the momentum further beyond the 142.00 mark.
The worsening COVID-19 situation in China and the imposition of fresh lockdowns fuel worries about a deeper economic downturn. This, in turn, boosts the US Dollar's status as the global reserve currency. This, along with a big divergence in the monetary policy stance adopted by the Federal Reserve and the Bank of Japan, provides an additional lift to the USD/JPY pair.
From a technical perspective, a sustained strength above the 141.00 confluence support breakpoint, turned resistance, was seen as a key trigger for intraday bulls. The said handle comprises the 100-day SMA and the 50% Fibonacci retracement level of the August-October rally. This should now act as a pivotal point and determine the near-term direction for the USD/JPY pair.
Meanwhile, oscillators on the daily chart - though have been recovering from lower levels - are still holding in the bearish territory. This warrants caution before positioning for a further appreciating move. Hence, any subsequent move-up is more likely to remain capped near the 142.45-142.50 resistance. That said, some follow-through buying should pave the way for additional gains.
The USD/JPY pair might then accelerate the recovery momentum towards reclaiming the 143.00 mark, above which bulls could aim to test the 38.2% Fibo. level, around the 143.50 region.
On the flip side, the 141.00 round figure now seems to protect the immediate downside ahead of the 140.80-140.75 region. The next relevant support is pegged near the 140.25-140.20 horizontal zone. This is closely followed by the 140.00 psychological mark. A convincing break below the latter will negate any near-term positive outlook and shift the bias back in favour of bearish traders.
USD/JPY daily chart
-638046331248292342.png)
Key levels to watch
GBP/USD strength has stalled. Nevertheless, analysts at Credit Suisse stay bullish for an eventual test of the key long-term 200-Day Moving Average, currently seen at 1.2216.
Move above 1.1952/58 needed to reassert an upward bias again
“We see scope for further consolidation and potentially a pullback also. With key resistance from the 55DMA and downtrend from February broken though, our bias remains to view this as a temporary pause only.
“Support is seen at 1.1762 initially, below which can see a retreat to next support at the 13DMA and price support at 1.1718/10, which we look to ideally hold. Should weakness extend, we would see scope for a test of the 1.1647 August high, but with fresh buyers expected to be seen here, if reached.”
“Above 1.1952/58 is needed to reassert an upward bias again for a test of what we see as more important resistance at the 200DMA of 1.2216, then potentially the 50% retracement of the 2021-2022 fall at 1.2298.”
Markets Strategist at UOB Group Quek Ser Leang notes a sustained move above 15,745 seems out of favour for the time being.
Key Quotes
“We expected USD/IDR to weaken further last week. However, USD/IDR rose to a high of 15,700. While overbought, the advance is not showing any signs of weakness just yet.”
“For this week, USD/IDR could rise above 15,745 but in view of the overbought conditions, it is unlikely to be able to maintain a foothold above this level (next resistance is at 15,810). Support is at 15,600, a breach of the next support at 15,550 would indicate that the current upward pressure has eased.”
- EURJPY fades Friday’s drop amidst erratic performance.
- Immediately to the upside comes the monthly highs near 147.00.
EURJPY resumes the upside above the key 145.00 mark at the beginning of the week.
If the corrective bounce becomes more serious, then the cross should face initial resistance at the so far November high at 147.11 (November 9). Above the latter, the door could open to a more meaningful move to the 2022 peak at 148.40 (October 21).
In the longer run, while above the key 200-day SMA at 138.47, the constructive outlook is expected to remain unchanged.
EUR/JPY daily chart
USD/CAD clings to gains above 1.3400. However, economists at Scotiabank expect the mid-1.24s to cap the advance.
Firm resistance seen at 1.3495
“Corrective USD gains have extended to near the mid-1.34 zone where we do think there is a reasonable technical case for the rebound to stall. This is where the 61.8% retracement of the sell-off from 1.3575 and short-term bull potential from the rebound from the low 1.32s converge.”
“There is firm resistance above the market at 1.3495 (bear breakdown point) should gains extend.”
EUR/USD remains capped as expected below the 200-Day Moving Average on a closing basis, currently seen at 1.0409. Analysts at Credit Suisse see scope for a deeper setback to the 38.2% retracement of the rally from September at 1.0120.
Resistance at 1.0409 is expected to cap for now
“EUR/USD remains capped as expected by key resistance from its falling long-term 200DMA, currently seen at 1.0409, and with a minor top now seen in place, we continue to see scope for a deeper setback from here.”
“Support is seen next at the rising 13DMA at 1.0211, a close below which would be seen to clear the way for a test of the October/November reaction highs at 1.0197/95. We continue to look for a floor here. Should weakness directly extend, this would raise the prospect of further weakness, with support then seen next at the 38.2% retracement of the September/November rally at 1.0120.”
“Resistance is seen at 1.0334 initially, with a close above the 200DMA at 1.0409 needed to clear the way for further strength back to the 1.0481 high and eventually the 38.2% retracement of the entire 2021-2022 fall at 1.0612/15.”
- AUD/USD drops to a one-week low on Monday amid strong follow-through USD buying.
- China’s COVID-19 woes, geopolitical risks boost demand for the safe-haven greenback.
- The setup supports prospects for a further near-term depreciating move for the major.
The AUD/USD pair extends last week's retracement slide from the vicinity of the 0.6800 mark, or over a two-month high and attracts some follow-through selling on Monday. The pair maintains its offered tone through the early North American session and is currently placed near a one-week low, just above the 0.6600 round-figure mark.
The US Dollar gains traction for the third straight day and builds on its bounce from the lowest level since August 12, which, in turn, is seen exerting downward pressure on the AUD/USD pair. The better-than-expected US Retail Sales data released last week cast doubts on the peak inflation narrative. Moreover, hawkish signals from several Fed officials suggest that the US central bank might still be far from pausing its policy-tightening cycle and acts as a tailwind for the greenback.
Apart from this, the prevalent cautious market mood provides an additional lift to the safe-haven buck. Investors remain concerned about headwinds stemming from the worsening COVID-19 situation in China and the imposition of fresh lockdowns in several financial hubs - including the capital Beijing and the economic centre Shanghai. Furthermore, fears of a potential escalation in the Russia-Ukraine conflict take its toll on the global risk sentiment and further weigh on the risk-sensitive Aussie.
Meanwhile, worries about a slowdown in economic activity contribute to the ongoing fall in copper prices, which is seen as another factor denting demand for the resources-linked Australian Dollar. Apart from this, speculations that the Reserve Bank of Australia (RBA) will stick to its dovish course favour the AUD/USD bears. Hence, a subsequent fall below the 0.6600 mark, towards testing the 0.6560-0.6550 strong horizontal support breakpoint, looks like a distinct possibility.
Technical levels to watch
China rising new daily Covid cases could pose a downside risk to Yuan. But economists at MUFG Bank expect the USD/CNY pair to move in the range of 7.00-7.15 in the near term.
Lack of direction, range bound
“While the ease of Covid policy is a positive development, the challenge actually become larger for both national and local governments in the near-term in terms of containing the rising outbreak of Covid cases around the country, as China’s health authorities stressed that the 20-point playbook of new Covid-19 policy ‘does not mean we can slacken our response or even simply end Covid-19 restrictions and lie flat’.”
“Renewed geopolitical concerns and the Dollar’s move driven by Fed’s potential rate hike pace would imply a volatile USD/CNY pair.”
“We see two-way risks at this point and expect USD/CNY to move in the range of 7.00-7.15 in the near term. Having said that, as we are holding positive view for China’s medium growth (5.1% for 2023), and think that the government is determined to boost growth for medium term, we keep our medium call of USD/CNY to reach 6.65 by the end of 2023.”
USD/MYR is now predicted to remain side-lined between 4.5200 and 4.6400 in the near term, according to Markets Strategist at UOB Group Quek Ser Leang.
Key Quotes
“We highlighted last Monday (14 Nov, spot at 4.5840) that the uptrend in USD/MYR has ended. We added, ‘the pullback has room t extend but a sustained decline below 4.5500 is unlikely’. The anticipated weakness exceeded our expectations as USD/MYR plummeted to 4.4950 before rebounding. The rebound amid oversold conditions suggests USD/MYR is unlikely to weaken further.”
“This week, USD/MYR is more likely to trade sideways between 4.5150 and 4.6400.”
USD/IDR has moved in a bid tone over the past week, stabilising close to the 15,700 level after being as low as close to 15,400 on 11 November. Economists at MUFG Bank see the pair within a range of 15,640 to 15,800 for the week ahead.
BI hikes to continue
“Bank Indonesia has hiked policy rates by 50 bps. We expect BI to hike a few more times in the coming meetings. We now forecast the 7-day reverse repo rate to end 2022 at 5.50% (with some chance of 5.75%) and to reach 6.00% sometime in Q1-2023.”
“We see USD/IDR within a range of 15,640 to 15,800 for the week ahead, slightly biased on the upside.”
“For end-2022, we forecast the pair at 15,700 as the USD finds some stability after prior strength.”
- Gold price continues losing ground for the fourth straight day and drops to over a one-week low.
- Strong follow-through US Dollar buying is seen as a key factor exerting pressure on the commodity.
- The cautious market mood could offer some support to the safe-haven XAU/USD and limit losses.
Gold price extends last week's retracement slide from a three-month top and remains under some selling pressure for the fourth successive day on Monday. The steady downfall drags the XAU/USD to a one-and-half-week low, around the $1,737 region, during the mid-European session and is sponsored by strong follow-through US Dollar buying.
The worsening COVID-19 situation leads to the imposition of fresh lockdowns in several financial hubs - including the capital Beijing and the economic centre Shanghai - and fuels worries about a deeper economic downturn. This, in turn, boosts the greenback's status as the global reserve currency and is seen as a key factor weighing on the Dollar-denominated Gold price.
The greenback is further underpinned by the recent hawkish signals from several Federal Reserve, which suggested that the US central bank might still be far from pausing its policy-tightening cycle. Adding to this, the better-than-expected US Retail Sales figures released last week cast doubts on the peak inflation narrative and support prospects for additional Fed rate hikes.
In fact, the current market pricing indicates a greater chance of a 50 bps lift-off at the next FOMC policy meeting in December. This further contributes to driving flows away from the non-yielding Gold price. That said, the cautious market mood might hold back bearish traders from placing aggressive bets around the safe-haven XAU/USD and limit losses, at least for the time being.
In the absence of any major market-moving economic releases, the mixed fundamental backdrop warrants some caution before positioning for any further intraday depreciating move. Market participants might also prefer to wait for a fresh catalyst from the FOMC meeting minutes on Wednesday and other key US macro data to determine the near-term trajectory for Gold price.
Technical levels to watch
The momentum behind the USD’s strength is fading as the Fed’s hiking cycle comes to an end, with volatility likely subsiding. Economists at HSBC expect the USD to weaken against major currencies in 2023.
Interest rate volatility could subside, removing a key tailwind for the USD
“USD yields remain elevated, but the speed of further gains is likely to slow from here. The Fed has lifted rates by 375 bps since March 2022, and we expect two more 50 bps rate hikes in December 2022 and February 2023, followed by a long pause. This may curb rate volatility and remove a key leg of support for the USD.”
“Global growth momentum is starting to show signs of petering out. If this shows further signs of moderating, then it should imply an even less potent USD, all things being equal. We realise that there are still plenty of concerns in the global economy, including hard-landing risks or the over-tightening by major central banks that could cause meaningful volatility in financial markets and a more powerful USD temporarily. But many of these concerns are well factored in by markets.”
“Risk appetite may be supported by a stabilisation in US yields alongside a bottoming in global growth dynamics, which could further weigh on the USD.”
“The extreme levels of USD overvaluation are unlikely to remain justified, and we expect a choppy outlook for the currency over the next few months, followed by a weakening path from 2Q23 onwards.”
Indian Rupee declined 1.1% against the US Dollar last week. In the opinion of economists at MUFG Bank, INR could recover some ground in the next few days.
US data likely to be main driver
“As suggested by the recent October trade print, with persisting external sector risks, the INR is likely to remain under pressure due to potential even larger current account deficit and potential worsening yield spread between India and the US, as the degree of India’s rate hike likely smaller than US’s with its CPI inflation is approaching the upper bank of inflation target range.”
“This week, no major data release for India, the release of US initial jobless claims, S&P global US manufacturing and services PMIs likely affect USD/INR movement.”
“With US data likely strengthening the view of US’s growth deceleration, INR may recover a bit this week.”
Markets Strategist at UOB Group Quek Ser Leang notes USD/THB seems to have moved into a consolidation theme as of late.
Key Quotes
“Our view for SGD/CNH to ‘trade with a downward bias’ last week was incorrect as it edged to a high of 5.2114 last Friday (18 Nov 2022). Upward has improved, albeit not by much.”
“For this week, SGD/CNH is likely to edge higher but any advance is expected to face solid resistance at 5.2250. On the downside, a breach of 5.1600 (minor support is at 5.1720) would indicate that the current mild upward pressure has eased.”
Chinese Covid concerns blacken Monday’s mood, but improving European data and a desire to reduce positions should see the Dollar slipping backwards by mid-week, in the opinion of Kit Juckes, Chief Global FX Strategist at Société Générale.
China reported its first Covid deaths in months
“My bigger concern is whether the driver of recent (relative) Dollar weakness is made up of (reasonable) hopes that the pace of Fed rate hikes is set to slow, hard landings can be avoided and we are heading to a more investment-friendly market backdrop in the first half of 2023, or if market participants are simply looking at end-of-year position adjustments (cutting back on long dollar positions) and finding a story (soft landing, risks reduced etc) which fits the price action. I doubt we’ll learn much on this Monday morning, after China reported its first Covid deaths in months, and reopening chatter hit a pothole.”
“The Chicago Fed Index is this afternoon’s data ‘highlight’ but the split of FOMC speakers pushing ‘higher for longer’ relative to those who think there’s less than 1% more coming in hikes, will be more interesting in the days ahead.”
“Still, in the background, there’s more room for optimism about Europe’s prospects than in the US and if the Dollar does have a really good start to the week, that may provide room for a slower, less exciting fall back in the days ahead, particularly if we see improving PMIs on Wednesday.”
- EUR/USD accelerates losses to the 1.0230/25 band on Monday.
- The dollar gathers further traction and climbs to multi-day highs.
- Germany Producer Prices surprised to the downside in October.
The selling pressure keeps ruling the sentiment around the European currency and drags EUR/USD to fresh 2-week lows near 1.0220 on Monday.
EUR/USD weaker on USD-buying
EUR/USD extends the leg lower for the third session in a row and prints new multi-session lows at the same time, following another positive day in the dollar, which appears bid across the board and underpinned by higher US yields.
The late pick-up in the demand for the greenback comes in response to recent hawkish Fedspeak as well as some scaling back of the possibility of a 50 bps rate hike at the Fed’s December gathering in favour of another 75 bps move.
In the euro calendar, German Producer Prices contracted at a monthly 4.2% in October and rose 34.5% from a year earlier. Across the pond, the only release of note will be the Chicago Fed National Activity Index.
What to look for around EUR
EUR/USD sees its downside exacerbated to the area of 2-week lows on the back of the resumption of the bid bias in the greenback.
In the meantime, the European currency is expected to closely follow dollar dynamics, geopolitical concerns and the Fed-ECB divergence. In addition, markets repricing of a potential pivot in the Fed’s policy remains the exclusive driver of the pair’s price action for the time being.
Back to the euro area, the increasing speculation of a potential recession in the region - which looks propped up by dwindling sentiment gauges as well as an incipient slowdown in some fundamentals – emerges as an important domestic headwind facing the euro in the short-term horizon.
Key events in the euro area this week: Flash EMU Consumer Confidence (Tuesday) EMU, Germany Advanced PMIs (Wednesday) – Germany IFO Business Climate, ECB Accounts (Thursday) – Germany Final Q3 GDP Growth Rate, GfK Consumer Confidence (Friday).
Eminent issues on the back boiler: Continuation of the ECB hiking cycle vs. increasing recession risks. Impact of the war in Ukraine and the persistent energy crunch on the region’s growth prospects and inflation outlook. Risks of inflation becoming entrenched.
EUR/USD levels to watch
So far, the pair is retreating 0.82% at 1.0238 and a breach of 1.0021 (100-day SMA) would target 0.9935 (low November 10) en route to 0.9730 (monthly low November 3). On the other hand, the next hurdle emerges at 1.0406 (200-day SMA) ahead of 1.0481 (monthly high November 15) and finally 1.0500 (round level).
In its latest review of the French economy, the International Monetary Fund (IMF) said on Monday, they maintained their French Gross Domestic Product (GDP) for this year and the next.
Key takeaways
Staff recommends a modest fiscal tightening in France of 0.25 percentage points of GDP relative to 2022.
France should begin fiscal consolidation next year and put public debt on firmly declining path.
Better to focus energy support in france by accelerating phase-out of price controls and increasing aid to those most in need.
Projects french budget deficit to fall in the medium term but to remain above its debt-stabilizing level.
Sees 2022 French GDP growth at 2.5%, 2023 growth at 0.75%.
Market reaction
At the time of writing, EURUSD is licking its wounds at around 1.0235, down 0.85% on the day. China’s covid curbs-induced flight to safety is driving the US Dollar through the roof so far this Monday.
The sharp sell-off of the US dollar last week has subsided. Renewed gains versus GBP are certainly plausible after the Autumn Statement highlighted a macroeconomic outlook considerably worse than elsewhere, economists at MUFG Bank report.
GBP depreciation expected
“Renewed US Dollar strength seems likely as the Fed continues to push a hawkish stance as they play down the idea of an end to the monetary tightening cycle. So, more challenging market conditions still lie ahead for the Pound, against the Dollar for sure but more broadly as well.”
“The out-performance of the Pound last week is unlikely to last. The Autumn Statement contained no surprises but did highlight the relatively poor macro backdrop that will result in renewed GBP depreciation ahead.”
USDCNH continues to be seen within the 7.0600-7.2100 range in the short-term horizon, comment UOB Group’s Economist Lee Sue Ann and Markets Strategist Quek Ser Leang.
Key Quotes
24-hour view: “We expected USD to ‘trade sideways between 7.1200 and 7.1700’ last Friday. USD subsequently traded within a range of 7.1143/7.1615. The underlying tone has firmed somewhat and we expect USD to edge higher today. However, any advance is expected to face strong resistance at 7.1620. Support is at 7.1300, a breach of 7.1150 would indicate the current mild upward pressure has eased.”
Next 1-3 weeks: “We continue to hold the same view as last Friday (18 Nov, spot at 7.1460) where USD has likely moved into a consolidation phase. We expect USD to trade sideways for now, likely to be between 7.0600 and 7.2100.”
XAUUSD ended up closing the week little changed above $1,750. The minutes of the Federal Reserve’s October policy meeting and PMI surveys could impact the US Dollar’s (USD) valuation and influence Gold’s action, FXStreet’s Eren Sengezer reports.
Gold to turn south If China decides to re-introduce strict measures
“S&P Global will publish the preliminary Manufacturing and Services PMI surveys for November. In case the Services PMI falls further in early November, the US Dollar could struggle to find demand and allow XAUUSD to stretch higher.”
“The US Federal Reserve (Fed) will publish the minutes of the October policy meeting. If the Fed’s publication confirms policymakers’ intention to opt for a smaller rate increase in the last policy meeting of the year, XAUUSD could gain traction.”
“Market participants will pay close attention to developments surrounding China’s zero Covid policy, given the country is a major consumer of the yellow metal. If China decides to re-introduce strict measures next week, Gold price is likely to turn south.”
- EURGBP surrenders its modest intraday gains and hangs near a two-week low.
- Friday’s breakdown below a two-week-old trading range favours bearish traders.
- Sustained strength beyond the 0.8800 mark is needed to negate the negative bias.
The EURGBP cross struggles to capitalize on its modest intraday uptick and meets with a fresh supply in the vicinity of the 0.8700 mark on Monday. The cross slides to the 0.8675-0.8670 area, or over a two-week low, during the first half of the European session and seems vulnerable to sliding further.
The British Pound's relative outperformance comes amid growing acceptance that the Bank of England will lift borrowing costs further to combat stubbornly high inflation. That said, a bleak outlook for the UK economy should keep a lid on any meaningful gains for the Sterling. Apart from this, talks for a more aggressive policy tightening by the European Central Bank lend support to the shared currency and help limit losses for the EURGBP cross.
From a technical perspective, Friday's sustained break below a two-week-old trading range support could be seen as a fresh trigger for bearish traders. Furthermore, oscillators on the daily chart have just started drifting in the negative territory and support prospects for further losses. Hence, some follow-through decline towards challenging the 100-day SMA support, currently near the 0.8610-0.8600 region, looks like a distinct possibility.
This is followed by the October monthly swing low, around the 0.8570 region, which if broken decisively will set the stage for a further near-term depreciating move. The EURGBP cross might then accelerate the downward trajectory towards testing the next relevant support near the 0.8500 psychological mark.
On the flip side, the 0.8700 round-figure mark now seems to have emerged as an immediate strong resistance. Any subsequent move-up could attract fresh sellers near the 0.8735-0.8740 region. This, in turn, should cap the EURGBP cross near the 0.8770-0.8775 supply zone. Some follow-through buying beyond the 0.8800 mark will negate the negative outlook and shift the near-term bias in favour of bullish traders, setting the stage for additional gains.
EURGBP daily chart
-638046207032190306.png)
Key levels to watch
Will the US Dollar continue to weaken? Economists at Standard Chartered expect the USD to take a pause, or even potentially stage a near term rebound, over the next few weeks.
Raising the odds of a near term bounce
“A still-strong US job market and retail sales continue to point to underlying economic strength. Fed policymakers have also consistently highlighted the need to keep hiking rates for now. These argue USD strength is not yet complete.”
“From a technical perspective, USD looks oversold, and EUR & GBP (key DXY constituents) look overbought. This raises the odds of near term consolidation and, potentially, a bounce higher should Nov labour market and inflation data surprise to the upside.”
- Silver remains under some selling pressure on Monday and drops to a nearly two-week low.
- The mixed technical setup warrants some caution before placing aggressive bearish bets.
- A sustained strength beyond the $22.00 mark is needed to negate near-term negative bias.
Silver comes under some renewed selling pressure on Monday and extends last week's retracement slide from the $22.25 area or its highest level since June 7. The white metal remains depressed through the first half of the European session and is currently placed around the $20.75-$20.70 region or a nearly two-week low.
From a technical perspective, the recent repeated failures to find acceptance above the $22.00 mark favours bearish traders. Furthermore, a subsequent weakness back below the very important 200-day SMA supports prospects for an extension of the corrective decline. That said, oscillators on the daily chart are still holding in the positive territory and warrant some caution.
Hence, any further downfall is more likely to find decent support near the $20.40-$20.35 region. This is followed by the $20.00 psychological mark, which if broken decisively will add credence to the near-term negative outlook. The XAGUSD might then turn vulnerable to test the $19.60 resistance break point before dropping to the $19.15-$19.10 support en route to the $19.00 mark.
On the flip side, attempted recovery might now confront stiff resistance near the $21.00 round figure. Any subsequent move-up is more likely to attract fresh sellers and remain capped near the $21.40-$21.50 area (200 DMA). The latter should act as a pivotal point, which if cleared decisively will negate any near-term negative outlook and shift the bias back in favour of bullish traders.
The upward trajectory might then lift the XAGUSD further beyond the $21.70 intermediate hurdle, towards reclaiming the $22.00 mark. Bulls might eventually aim to challenge the multi-month high, around the $22.25 region.
Silver daily chart
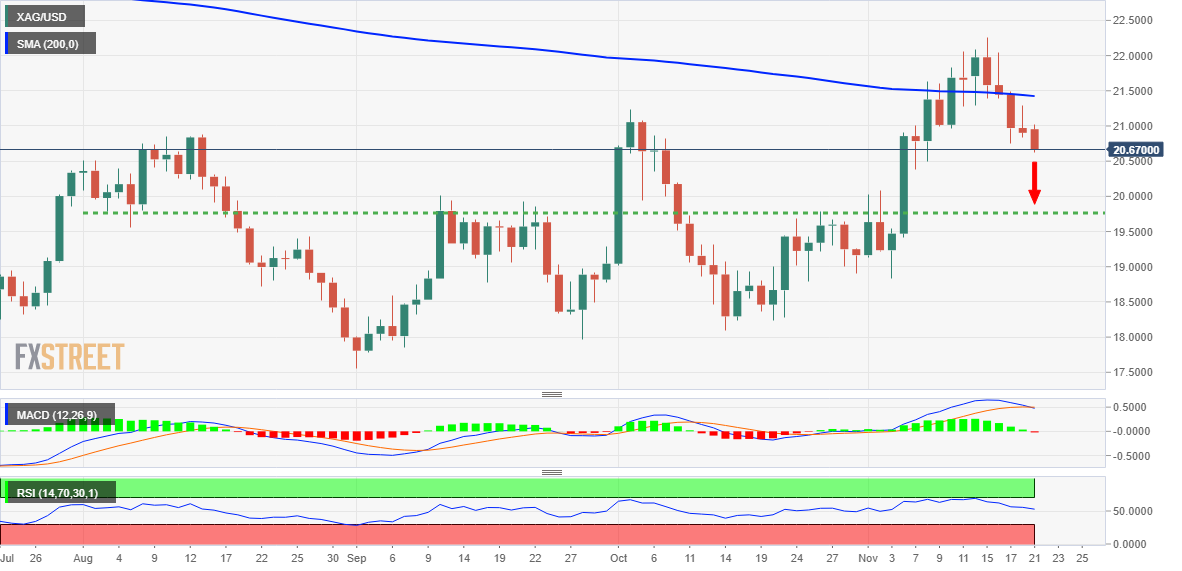
Key levels to watch
In an MNI interview on Monday, European Central Bank (ECB) Chief Economist Philip Lane said that the central bank will consider reducing its pace of rate increases at its December 15 meeting.
Key quotes
"One platform for considering a very large hike, such as 75 basis points, is no longer there.”
"The more you've already done on a cumulative basis, that changes the pros and cons of any given increment.”
"We will have to look at it in terms of the inflation outlook that we have in December and take into account that we are at a different point now, and also to recognize that there are lags in the transmission process."
"Trying to jump forward to February, to March, to May or June next year, I think it's too early to have very strong views at this point. The logic of a pause for the ECB, we're not at that point.”
"The exact allocation [of rate hikes] across different meetings is a secondary issue. But the more we've already done, the less we need to do."
Market reaction
The Euro remains heavily sold-off into broad US Dollar strength while investors assess the latest dovish remarks from the ECB official. The EURUSD pair is losing 0.84% on the day, trading at 1.0234, as of writing.
EURUSD continues to edge lower in quiet markets. Economists at ING think a move to 1.02 is on the cards.
PMIs in focus this week
“In addition to the continued wall of European Central Bank speakers, this week will see the advanced November PMIs for the eurozone, Germany and France. The composite PMIs are expected to be in contraction territory for all three and be a reminder that at some point the ECB will probably call time on its tightening cycle.”
“Our view is that the ECB hikes 50 bps on 15 December (59bp priced in the markets) and then finishes the cycle with a 25 bps hike in February. In other words, we look for the cycle to conclude at 2.25% rather than the 2.90% area priced for the markets in late summer.”
“In the short term, EURUSD has just sunk below support at 1.0270 and we would not rule out it drifting towards the 1.0200 area near term.”
- NZDUSD meets with a fresh supply on Monday amid some follow-through USD buying interest.
- COVID-19 hitters, geopolitical risks benefit the greenback and weigh on the risk-sensitive Kiwi.
- The downside seems limited ahead of the RBNZ decision and the FOMC minutes on Wednesday.
The NZDUSD pair comes under some selling pressure on the first day of a new week and moves further away from a nearly three-month high - levels just above the 0.6200 mark touched on Friday. The pair remains depressed through the early part of the European session and is currently flirting with the daily low, around the 0.6120 region.
The US Dollar builds on last week's recovery from its lowest level since August 12 and gains traction for the third successive day, which, in turn, is seen weighing on the NZDUSD pair. The better-than-expected US Retail Sales released on Thursday cast doubts on the peak inflation narrative. Furthermore, hawkish signals from several Fed officials suggest that the US central bank is still far from pausing its policy-tightening cycle and continues to act as a tailwind for the buck.
Apart from this, a generally weaker tone around the equity markets provides an additional lift to the safe-haven greenback and drives flows away from the risk-sensitive Kiwi. The market sentiment remains fragile amid worries about headwinds stemming from a new COVID-19 outbreak in China and the imposition of economically-disruptive lockdowns. Apart from this, fears of a potential escalation in the Russia-Ukraine conflict temper investors' appetite for perceived riskier assets.
The fundamental backdrop favours the USD bulls and supports prospects for additional intraday losses for the NZDUSD pair. Traders, however, might prefer to move to the sidelines ahead of this week's key event risks. The Reserve Bank of New Zealand is scheduled to announce its policy decision on Wednesday, which will be followed by the release of the FOMC meeting minutes. This, in turn, warrants some caution for aggressive bearish traders and positioning for a further depreciating move.
Technical levels to watch
Analysts at Goldman Sachs provide a grim outlook on global equity markets through 2023.
Key quotes
"We continue to think that the near-term path for equity markets is likely to be volatile and down before reaching a final trough in 2023."
Goldman Sachs 2023 forecasts: “S&P 500 at 4,000; Stoxx Europe 600 at 450; Japan's Topix at 2,100; MSCI ex-Japan Asia Pacific at 550.”
- The index adds to the rebound past the 107.00 mark.
- US yields extend the march north amidst recent hawkish Fedspeak.
- The Chicago Fed Index will be the sole release later in the NA docket.
The greenback, in terms of the USD Index (DXY), extends the move higher and advances to new multi-day peaks well north of 107.00 the figure at the beginning of the week.
USD Index bolstered by Fedspeak, looks to FOMC Minutes
The index posts gains for the third session in a row on Monday and manages to extend further the recent breakout of the 107.00 barrier, always sustained by the renewed bounce in US yields and hawkish comments from Fed’s rate setters.
Indeed, both the dollar and yields saw their upside reinvigorated in response to recent comments from FOMC’s Waller, Bullard and Collins, which at the same time poured cold water over the potential emergence of pivot in the Fed’s policy in the relatively near term.
Later in the US data space, the Chicago Fed National Activity Index will be the only scheduled release on Monday, whereas investors’ attention is expected to be on the publication of the FOMC Minutes of the November event on Wednesday.
What to look for around USD
The dollar remains well bid and pushes the index well past the 107.00 hurdle at the beginning of the week.
While hawkish Fedspeak maintains the Fed’s pivot narrative in the freezer, upcoming results in US fundamentals would likely play a key role in determining the chances of a slower pace of the Fed’s normalization process in the short term.
Key events in the US this week: Chicago Fed National Activity Index (Monday) – MBA Mortgages Applications, Building Permits, Durable Goods Orders, Initial Jobless Claims, Flash Manufacturing/Services PMIs, Final Michigan Consumer Sentiment, New Home Sales, FOMC Minutes (Wednesday).
Eminent issues on the back boiler: Hard/soft/softish? landing of the US economy. Prospects for further rate hikes by the Federal Reserve vs. speculation of a recession in the next months. Fed’s pivot. Geopolitical effervescence vs. Russia and China. US-China persistent trade conflict.
USD Index relevant levels
Now, the index is gaining 0.55% at 107.56 and faces the next up barrier at at 109.18 (100-day SMA) seconded by 110.73 (55-day SMA) and then 113.14 (monthly high November 3). On the other hand, the breakdown of 105.34 (monthly low November 15) would open the door to 105.11 (200-day SMA) and finally 104.63 (monthly low August 10).
Oil prices extend losses after closing below $90/bbl on Friday. A break under September lows and projections of $83.70/83.00 could deepen the down move, strategists at Société Générale report.
Inability to reclaim the 50 DMA would denote risk of extension in decline
“Brent has once again given up the 50 DMA ($92.50) and is approaching the low of September near $83.70/83.00 which is also a projection. This is a potential support zone which can lead to a bounce. However, inability to reclaim the 50 DMA would denote risk of extension in decline.”
“Break below $83.70/83.00 could deepen the down move towards $77.50, the 50% retracement of the rise since 2020 and $73.00.”
Former Bank of Japan (BoJ) board member and the central bank’s Deputy Governor candidate Sayuri Shirai urged the BoJ to adjust interest rates more flexibly in response to cyclical economic swings.
Additional quotes
“The Bank of Japan must thoroughly examine its stimulus programme.”
“With Japan's economy lacking momentum, the BOJ will likely need to keep interest rates ultra-low even after the term of dovish Governor Haruhiko Kuroda ends in April.”
"The most important thing the BOJ's new leadership must do is to clarify and simplify its policy communication.”
"The BOJ must take steps to enhance the flexibility of monetary policy. Any steps it takes for this purpose would be different from sharp interest rate hikes.”
“The review would help the BOJ lay the groundwork for a tweak to its monetary framework.”
Market reaction
At the time of writing, USDJPY is holding gains above 141.00, adding 0.50% on the day.
After a wild ride since the late summer, Sterling could now begin to take less of the limelight. GBPUSD could move back lower to the 1.1700/10 area this week, in the view of economists at ING.
Sterling could take a welcome back seat
“EURGBP is softening as the Euro seems to be taking the larger strain of the softer China view. However, 0.8665 should be good intra-day support. We are more bearish on GBPUSD. And unless Wednesday's FOMC minutes throw up some dovish surprises, GBPUSD could drift back to the 1.1700/1710 area this week.”
“Our year-end GBPUSD target remains a reasonably aggressive 1.10 – largely on the back of renewed Dollar strength.”
USDJPY faces further range bound trading, likely between 138.50 and 142.50, in the next weeks, suggest UOB Group’s Economist Lee Sue Ann and Markets Strategist Quek Ser Leang.
Key Quotes
24-hour view: “Last Friday, we held the view that USD ‘is unlikely to advance further’ and we expected it to ‘trade between 139.50 and 140.80’. USD subsequently traded within a narrower range than expected (139.62/140.50). Momentum indicators are mostly neutral and we expect USD to trade sideways today, likely within a range of 139.65/140.60.”
Next 1-3 weeks: “Our update from last Friday (18 Nov, spot at 140.30) still stands. As highlighted, USD appears to have moved into a consolidation phase and is likely to trade within a range of 138.50/142.50 for the time being.”
- GBPUSD comes under fresh selling pressure on Monday amid some follow-through USD buying.
- China’s COVID-19 woes and geopolitical risks turn out to be key factors benefiting the greenback.
- A bleak outlook for the UK economy undermines the Sterling and contributes to the offered tone.
The GBPUSD pair kicks off the new week on a weaker note and remains under some selling pressure through the early European session. The pair is currently placed near the lower end of its daily trading range, though manages to hold its neck above the 1.1800 round-figure mark.
A combination of supporting factors assists the US Dollar to capitalize on last week's bounce from over a three-month low, which, in turn, exerts some downward pressure on the GBPUSD pair. The better-than-expected US Retail Sales released on Thursday cast doubts on the peak inflation narrative. Adding to this, hawkish signals from several Fed officials suggest that the US central bank is still far from pausing its policy-tightening cycle. This, along with the prevalent cautious market mood, is seen benefitting the safe-haven greenback.
The recent surge in COVID-19 cases in China and the imposition of fresh lockdowns in several financial hubs - including the capital Beijing and the economic centre Shanghai - fuel worries about a deeper global economic downturn. Furthermore, fears of a potential escalation in the Russia-Ukraine conflict temper investors' appetite for riskier assets and drive some haven flows towards the USD. The British Pound, on the other hand, is pressured by a bleak outlook for the UK economy, further contributing to the offered tone surrounding the GBPUSD pair.
In fact, the UK Office for Budget Responsibility (OBR) last week projected the UK GDP to slump by 1.4% next year as compared to a growth of 1.8% forecast in March. This overshadows expectations that the Bank of England will continue raising rates to combat stubbornly high inflation. The fundamental backdrop suggests that the path of least resistance for the GBPUSD pair is to the downside and supports prospects for an extension of the intraday downfall.
There isn't any major market-moving economic data due for release on Monday, either from the UK or the US, leaving the GBPUSD pair at the mercy of the USD price dynamics. Later during the North American session, traders might take cues from a scheduled speech by San Francisco Fed President Mary Daly. This, along with the broader risk sentiment, will influence the USD price dynamics and might allow traders to grab short-term opportunities around the major.
Technical levels to watch
The Dollar is continuing to crawl higher after its sharp sell-off earlier this month. Economists at ING expect USD Index (DXY) to trade a 107.00-107.50 range.
FOMC minutes in focus this week
“Wednesday will see the release of the minutes of the 2 November FOMC meeting. The minutes could pose a risk that the current Dollar correction extends. But assuming there are no big surprises – e.g. 'many participants wanting to take stock of the tightening undertaken so far', we would expect the Dollar to find support on dips.”
“Today's session should be reasonably quiet, too. DXY probably trades a 107.00-107.50 range.”
“Upside risks could emerge from rising US Treasury yields were this week's $120bn of US Treasury issuance to demand concessionary pricing.”
In light of advanced figures from CME Group for natural gas futures markets, open interest reversed two daily builds in a row on Friday and decreased by around 4.2K contracts. In the same line, volume dropped for the second consecutive day, this time by almost 40K contracts.
Natural Gas still faces resistance around the 200-day SMA
Prices of natural gas back-pedalled four sessions in a row with gains at the end of last week against the backdrop of diminishing open interest and volume. That said, the door now appears open to the continuation of the upside in the very near term and always with the target at the 200-day SMA, today around $6.87 per MMBtu.
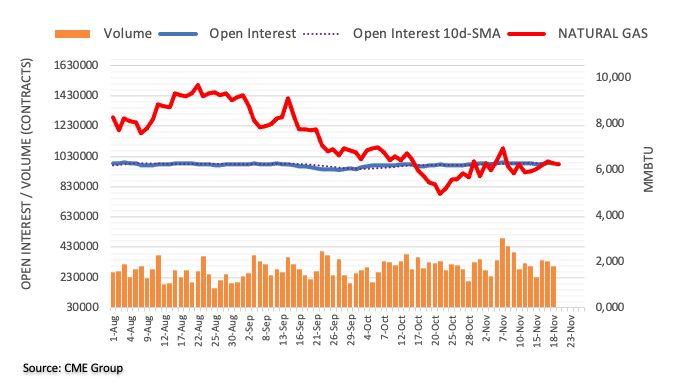
NZDUSD regained 0.62 for a short period but closed back in the mid-0.61s. This week is all about the RBNZ – economists at ANZ Bank expect them to be hawkish, supporting the Kiwi.
This week is all about the RBNZ
“We expect a 75 bps hike from the RBNZ and a higher track, with no let-up in their erstwhile hawkish tone. The global growth outlook may be turning, and US CPI may have peaked, but given local data and the three-month gap, we think it’s too soon to switch from the front foot to the back foot, so to speak.
“We expect a hawkish tone to be NZD-positive, but are mindful of US Fed minutes also due this week. They could be hawkish/upbeat too, so we may be in for volatility.”
“Support 0.5875/0.6000 Resistance 0.6235/0.6470/0.6575”
AUDUSD remains side-lined within the 0.6590-0.6800 range in the next few weeks, comment UOB Group’s Economist Lee Sue Ann and Markets Strategist Quek Ser Leang.
Key Quotes
24-hour view: “Our expectation for AUD to ‘retest the 0.6635 level’ did not materialize as it traded in a quiet manner between 0.6662 and 0.6730. The underlying tone still appears to be soft and we expect AUD to edge lower. However, any decline is unlikely to break 0.6635 (minor support is at 0.6660). On the upside, a breach of 0.6735 would indicate that the current mild downward pressure has eased.”
Next 1-3 weeks: “There is not much to add to our update from last Friday (18 Nov, spot at 0.6685). As highlighted, AUD appears to have moved into a consolidation phase and is likely to trade between 0.6590 and 0.6800 for the time being.”
When and how rapidly the British economy will recover is relevant for the evaluation of Sterling. Therefore, economists at Commerzbank expect GBP weakness ahead.
The British malaise
“A country that does not attract investment will be unable to grow as rapidly as regions where total capital is growing or maintained at constant levels medium- to long-term. And if growth is smaller real exchange rates towards dynamic currency areas are also likely to principally fall.”
“Quite apart from what the Bank of England will do or avoid in the foreseeable future due to the weak economy and quite apart from what British chancellors got wrong or will get right now, in the future or in the past, this factor in itself points towards Sterling weakening.”
“One thing seems to be reasonably clear after all: this government is not likely to reverse the decision in favour of a hard Brexit in a major way. I am not an expert on British politics, but it seems to me that no Tory government will be able to move away from a hard Brexit without having to fear losing votes.”
CME Group’s flash data for crude oil futures markets noted traders scaled back their open interest positions by nearly 12K contracts on Friday, partially reversing the previous build. Volume, instead, rose for the second day in a row, this time by more than 133K contracts.
WTI: The September low near $76.00 comes next
Prices of the WTI remained under pressure on Friday and closed the third consecutive session with losses. The leg lower, however, came amidst shrinking open interest and another daily build in volume. That said, while a short-term rebound seems probable in the very near term, there is also scope for the continuation of the underlying downtrend with the immediate support at the September low near the $76.00 mark per barrel.
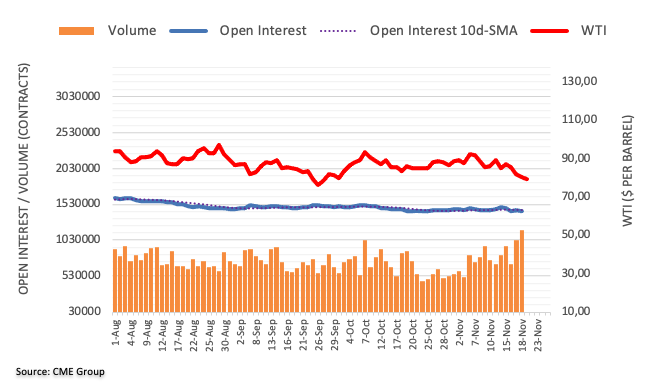
EURUSD is back below 1.03, USD Index (DXY) above 107 – The US Dollar is recovering. The extension of the recovery hinges on how large the share of trend followers was in the USD trend, economists at Commerzbank report.
EURUSD’s trend ended around 1.04
“All those who had only jumped on the bandwagon of the major slide in USD over the past two weeks because they were following the trend usually give up their USD positions as soon as the trend ends (which it did at EURUSD levels around 1.04 last week).”
“How far this recovery of the US currency has to run will depend on how large the share of these trend followers was in the USD trend.”
“Please, dear readers, so not expect that as an analyst looking at fundamental reasons, I would be able to give even a half-way reliable estimate of this share. To be able to do that I would need data that is not available: data on who had previously entered USD sales and for what reasons.”
Economists at Goldman Sachs expect the US to narrowly avoid a recession next year as Europe's economy contracts. Meanwhile, China's GDP is forecast to increase slowly during the first half of 2023 and then accelerate as covid restrictions are reduced.
A mild recession in Europe
“We expect global growth of just 1.8% in 2023, as US resilience contrasts with a European recession and a bumpy reopening in China.”
“The US should narrowly avoid recession as core PCE inflation slows from 5% now to 3% in late 2023 with a ½pp rise in the unemployment rate. To keep growth below potential amidst stronger real income growth, we now see the Fed hiking another 125bp to a peak of 5-5.25%. We don’t expect cuts in 2023.”
“The Euro area and the UK are probably in recession, mainly because of the real income hit from surging energy bills. But we expect only a mild downturn as Europe has already managed to cut Russian gas imports without crushing activity and is likely to benefit from the same post-pandemic improvements that are helping avoid US recession. Given reduced risks of a deep downturn and persistent inflation, we now expect hikes through May with a 3% ECB peak.”
“China is likely to grow slowly in H1 as an April reopening initially triggers an increase in covid cases that keeps caution high, but should accelerate sharply in H2 on a reopening boost. Our longer-run China view remains cautious because of the long slide in the property market as well as slower potential growth (reflecting weakness in both demographics and productivity).”
- USDCAD climbs to a one-and-half-week high and is supported by a combination of factors.
- Bearish oil prices undermine the Loonie and act as a tailwind amid sustained USD buying.
- The fundamental and technical set-up supports prospects for a further appreciating move.
The USDCAD pair builds on last week's bounce from the 100-day SMA support and gains some follow-through traction on Monday. The momentum lifts spot prices to a one-and-half-week top, around the 1.3425 area, during the early European session and is sponsored by a combination of factors.
Crude oil prices languish near the lowest level since September 28 touched on Friday amid concerns that the worsening COVID-19 situation in China will dent fuel demand. This, in turn, is seen undermining the commodity-linked Loonie and acting as a tailwind for the USDCAD pair amid a further US Dollar recovery.
The market sentiment remains fragile amid worries about economic headwinds stemming from the imposition of fresh COVID-19 lockdowns in China. Apart from this, fears of a potential escalation in the Russia-Ukraine conflict temper investors' appetite for riskier assets and benefit the safe-haven greenback.
Furthermore, the better-than-expected US Retail Sales data released on Thursday cast doubt on the peak inflation narrative. Moreover, hawkish signals from several Fed officials suggest that the US central bank is still far from pausing its rate-hiking cycle and providing an additional boost to the buck.
The fundamental backdrop seems tilted in favour of the USD bulls and supports prospects for a further intraday appreciating move for the USDCAD pair. Even from a technical perspective, sustained strength and acceptance above the 1.3400 round-figure mark adds credence to the bullish outlook for the major.
Hence, a subsequent move towards reclaiming the 1.3500 psychological mark, en route to the 50-day SMA support breakpoint, currently around mid-1.3500s, looks like a distinct possibility. In the absence of any major market-moving economic data, the USD and oil price dynamics will influence the USDCAD pair.
Technical levels to watch
In the opinion of UOB Group’s Economist Lee Sue Ann and Markets Strategist Quek Ser Leang, GBPUSD could navigate within a range bound theme before attempting a move higher.
Key Quotes
24-hour view: “We highlighted last Friday that ‘the price movements appear to be part of a broad consolidation’ and we expected GBP to ‘trade between 1.1790 and 1.1950’. GBP subsequently traded within a narrower range than expected (1.1859/1.1950). The price actions still appear to be part of a consolidation and we expect GBP to trade between 1.1820/1.1940 today.”
Next 1-3 weeks: “Our latest narrative was from last Wednesday (16 Nov, spot at 1.1880) where GBP could consolidate first before making another push higher but the chance of a break of 1.2100 does not appear to be high. While there is no change in our view, upward momentum is beginning to wane. However, only a break of 1.1790 (‘strong support’ level previously at 1.1750) would indicate that GBP is not advancing further.”
Open interest in gold futures markets shrank for the 5th consecutive session on Friday, this time by around 2.2K contracts according to preliminary results from CME Group. Volume followed suit and went down by around 30.6K contracts, reaching the third daily drop in a row.
Gold faces interim support around $1,710
Gold prices dropped for the third straight session at the end of last week. The downtick was on the back of diminishing open interest and volume and hints at the idea that extra weakness looks not favoured in the very near term. Next on the downside comes the 100-day SMA, today at $1,712 per ounce troy.
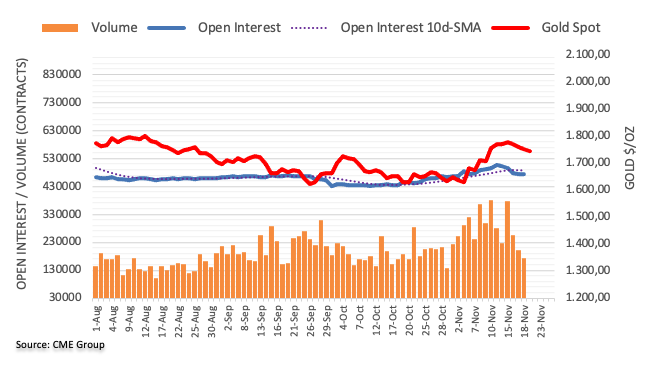
Economists at Goldman Sachs predict India's economic growth to slow next year, as consumer demand is likely to weaken from higher borrowing costs and fading benefits from pandemic reopening.
Key quotes
“Gross domestic product (GDP) may expand by 5.9% in the calendar year 2023 from an estimated 6.9% this year.”
"Growth will likely be a tale of two halves, with a slower first half as the reopening boost fades, and monetary tightening weighs on domestic demand.. In the second half, growth is likely to re-accelerate as global growth recovers, drag from net exports diminishes, and investment cycle picks up.”
“See a pickup in investment cycle toward the second half of 2023 aiding India's growth rebound.”
“Upside risks to inflation means the Reserve Bank of India will likely raise the benchmark interest rate by 50 basis points in December and another 35 basis points in February, to hit a terminal rate of 6.75%.”
Gold price is extending the previous week’s corrective mode from three-month highs at $1,787. In the view of FXStreet’s Dhwani Mehta, XAUUSD appears a ‘buy the dips’ trade amid a potential bull flag on the daily chart.
XAUUSD needs a daily close above $1,762 to confirm a bull flag
“Gold price remains a ‘buy the dips’ opportunitiy for traders, with a daily close needed above the falling trendline resistance at $1,762 to validate a bull flag formation. Ahead of that level, the $1,750 psychological level will be put to test. The next upside target for XAUUSD is envisioned at the multi-month highs at $1,787.”
“Alternatively, strong cushion is aligned at the falling trendline support at $1,738. A sustained move below the latter will invalidate the bullish thesis, opening the further downside toward the mildly bearish 100-Daily Moving Average (DMA) at $1,712.”
- USDJPY scales higher for the fourth straight day and climbs to a one-week high on Monday.
- Some follow-through USD buying remains supportive amid the Fed-BoJ policy divergence.
- A sustained move beyond the 141.00 mark is needed to support prospects for further gains.
The USDJPY pair gains some positive traction for the fourth straight day on Monday and climbs to a one-week high during the early European session. The pair is currently placed just below the 141.00 mark, with bulls still awaiting a sustained move back above the 100-day SMA support breakpoint.
The US Dollar builds on its recovery from the lowest level since August 12 - touched in the aftermath of softer US consumer inflation figures last week - and acts as a tailwind for the USDJPY pair. The better-than-expected US Retail Sales data released on Thursday cast doubts on the peak inflation narrative. Adding to this, hawkish signals from several Fed officials suggest that the US central bank is still far from pausing its policy-tightening cycle. This is seen as a key factor that continues to lend some support to the greenback.
The Japanese Yen, on the other hand, is undermined by a more dovish stance adopted by the Bank of Japan (BoJ). In fact, BoJ Governor Haruhiko Kuroda reiterated on Friday that the central bank will stick to its monetary easing to support the economy and achieve the 2% inflation target in a sustained, stable fashion. This is seen as another factor pushing the USDJPY pair higher. That said, a softer risk tone helps limit deeper losses for the safe-haven JPY and might keep a lid on any meaningful upside for the major, at least for the time being.
The market sentiment remains fragile amid concerns about economic headwinds stemming from the worsening COVID-19 situation in China and the imposition of fresh lockdowns in several financial hubs. Adding to this, fears of a potential escalation in the Russia-Ukraine conflict temper investors' appetite for riskier assets. Even from a technical perspective, the recent repeated failures near the 141.00 support breakpoint warrant some caution for aggressive bullish traders and positioning for any further near-term appreciating move for the USDJPY pair.
Technical levels to watch
Here is what you need to know on Monday, November 21:
After having closed the last two trading days of the previous week in positive territory, the US Dollar Index started the new week on a bullish note and climbed to a fresh 10-day high above 107.50. The risk-averse market environment helps the US Dollar (USD) preserve its strength early Monday as the benchmark 10-year US Treasury bond yield holds steady at around 3.8%. Later in the session, the Federal Reserve Bank of Chicago's National Activity Index for October will be the only data featured in the US economic docket. Investors will continue to pay close attention to comments from central bankers.
On Saturday, Atlanta Federal Reserve President Raphael Bostic said he was ready to move away from a 75 basis points (bps) rate hike at the last policy meeting of the year. These comments, however, failed to influence the market pricing of the next Federal Reserve (Fed) rate hike. According to the CME Group's FedWatch Tool, the probability of a 50 bps rate increase in December stands at 80%, virtually unchanged from last week.
Meanwhile, optimism about China moving away from the zero-Covid policy continues to fade. Over the weekend, China reported Covid deaths for the first time since May. Additionally, several districts in Beijing shut schools amid the rising number of cases while Guangzhou ordered a five-day lockdown of its Baiyun district. Hong Kong's Hang Seng Index was last seen losing nearly 2% on the day and the Shanghai Composite Index was down 0.5%. Reflecting the souring market mood, US stock index futures are down between 0.3% and 0.3%.
Pressured by the renewed USD strength, EURUSD broke below 1.0300 and extended its slide toward 1.0250 early Monday. On Friday, "As the stance of monetary policy tightens further, it will become more likely that the pace of increases will slow," European Central Bank (ECB) policymaker Klaas Knot said.
GBPUSD registered modest gains last week but started the new week on the back foot. At the time of press, the pair was pushing lower toward 1.1800, losing more than 0.5% on the day.
After failing to make a decisive move in either direction last week, USDJPY gained traction during the Asian trading hours on Monday and climbed toward 141.00. The Japanese cabinet has compiled a spending plan worth 29 trillion Japanese Yen (USD207.37 billion), backed by new debt of about 23 trillion Japanese Yen. Japanese Finance Minister Shunichi Suzuki said that the government will guide economic and fiscal policy in a "responsible" manner.
Gold price extended its slide early Monday and broke below $1,750 following Friday's sharp decline. Concerning coronavirus news from China seem to be weighing on XAUUSD at the beginning of the week.
Bitcoin came under renewed selling pressure on Sunday and lost more than 2%. BTCUSD continues to edge lower toward $16,000 in the early European morning. Ethereum broke below $1,200 on Sunday and fell over 6%. ETHUSD was last seen losing more than 1% on the day at around $1,100.
FX option expiries for Nov 21 NY cut at 10:00 Eastern Time, via DTCC, can be found below.
- EURUSD: EUR amounts
- 1.0100 543m
- 1.0115-20 313m
- 1.0200-05 853m
- 1.0225 638m
- 1.0280 486m
- USDJPY: USD amounts
- 140.00 1.1b
- USDCHF: USD amounts
- 0.9525 1.0b
- AUDUSD: AUD amounts
- 0.6575 277m
- 0.6800 286m
- USDCAD: USD amounts
- 1.3300 554m
- 1.3345-50 255m
- 1.3370-75 375m
- EURGBP: EUR amounts
- 0.8650 251m
- 0.8730 200m
- 0.8770 210m
- 0.8800 248m
- 0.8850 299m
- EURCHF: EUR amounts
- 0.9490 300m
UOB Group’s Economist Lee Sue Ann and Markets Strategist Quek Ser Leang note EURUSD needs to clear 1.0415 to challenge 1.0480.
Key Quotes
24-hour view: “We highlighted last Friday that there was limited downside risk for EUR and we expected it to ‘trade between 1.0315 and 1.0415’. EUR subsequently traded within a narrower range than expected (1.0311/1.0395). The underlying tone has softened somewhat and EUR is likely to edge lower today. However, any decline is unlikely to break the support at 1.0280 (next support is at 1.0240). Resistance is at 1.0360, followed by 1.0395.”
Next 1-3 weeks: “There is no change in our view from last Friday (18 Nov, spot at 1.0360). As highlighted, in order to keep the current upward momentum going, EUR has to break and remain above 1.0415 soon or the chance of it rising to 1.0480 will decrease quickly. Conversely, a break of 1.0280 (no change in ‘strong support’ level) would suggest that EUR is not advancing further.”
Japanese Finance Minister Shunichi Suzuki said in a statement on Monday, his government will guide economic and fiscal policy in a "responsible" manner.
He urged a swift adoption of more spending measures, worth $207 billion, backed mostly by new debt issuance.
Additional comments
"The environment surrounding Japan's economy remains severe.”
"There's also a concern about global recession," he said. "We must overcome this crisis."
His comments come as the Japanese cabinet has compiled a spending plan worth 29 trillion Japanese Yen (USD207.37 billion), backed by new debt of about 23 trillion Japanese Yen.
Market reaction
At the time of writing, USDJPY is testing daily highs at 140.63, up 0.20% on the day. The strength in the pair could be linked to the unrelenting buying interest seen around the US Dollar, as investors rush to safry amid increasing covid cases and restrictions in China.
- Gold price is expected to decline further to near $1,740.00 as the risk-off profile is gaining more traction.
- The DXY has refreshed its weekly high at 107.40 and has not displayed any sign of exhaustion yet.
- An upbeat US Durable Goods Orders data will create more troubles for Fed policymakers.
Gold price (XAUUSD) has turned sideways after dropping to near $1,743.00 in the early European session. The precious metal witnessed selling pressure after surrendering the crucial support of $1,750.00 as the risk aversion theme was underpinned by the market participants. The absence of potential triggers indicates that weekly anxiety is impacting risk-sensitive assets.
The US dollar index (DXY) has refreshed its weekly high at 107.40 and has not displayed any sign of exhaustion yet. Meanwhile, the 10-year US Treasury yields have tumbled to near 3.79% as investors don’t see a continuation of bigger rate hikes by the Federal Reserve (Fed) ahead.
This week, the ultimate event will be the release of the US Durable Goods Orders data, which is due on Wednesday. The economic data is expected to expand by 0.4%, similar to the prior advancement. Fed chair Jerome Powell is going through sleepless nights deriving a strategic plan to trim consumer spending. An absence of a decline in Durable Goods Orders data won’t be able to compel manufacturers to trim the prices of end goods. This might weigh more pressure on the gold prices ahead.
Gold technical analysis
Gold price has witnessed a steep fall after a breakdown of the Head and Shoulder chart pattern on an hourly scale. The precious metal has dropped to near the 200-period Exponential Moving Average (EMA) around $1,744.50, therefore a decisive move is expected ahead.
Meanwhile, the Relative Strength Index (RSI) (14) has shifted into the bearish range of 20.00-40.00, which indicates that the downside momentum has been triggered.
Gold hourly chart
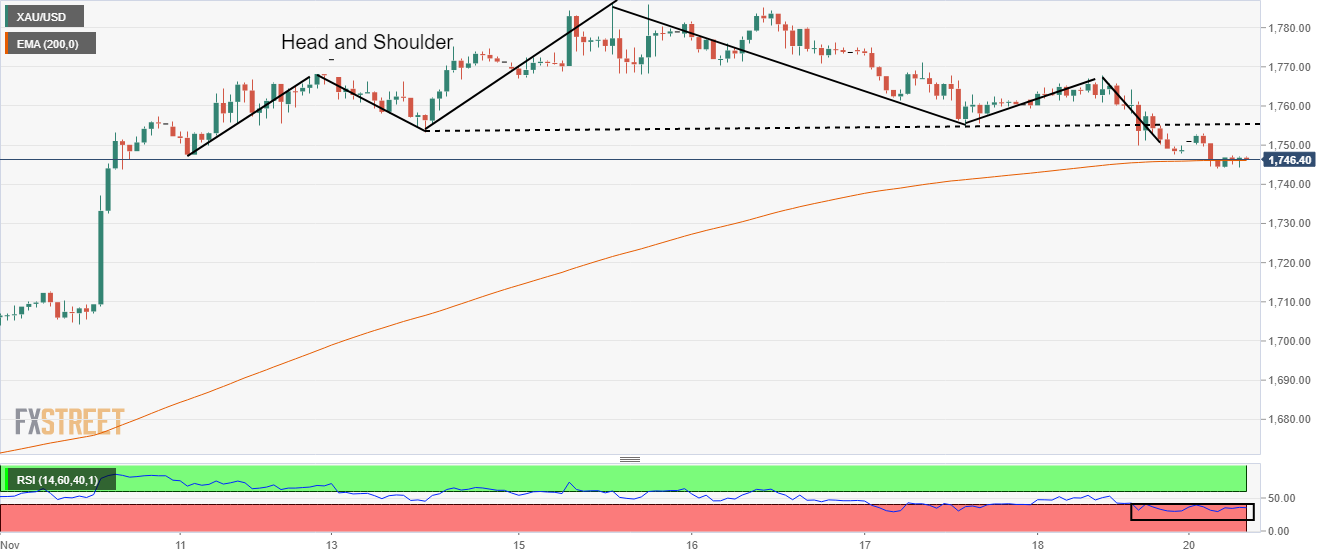
Perry Warjiyo, Bank Indonesia (BI) Governor offered a grim outlook on the economy during his appearance before the Parliament on Monday.
Key quotes
“Indonesia's annual economic growth may slow to 4.37% next year partly due to the impact of domestic monetary tightening.”
“Predicting economic indicators was difficult due to volatility in the global economy.”
“Numbers could be discussed further with lawmakers.”
“Headline inflation forecast was of 6.11% for end-2022 and 3.61% for end-2023 at the hearing.”
His presentation showed the figure for 2022's inflation was BI's forecast as of Nov. 3.
Market reaction
Amid the downbeat economic forecasts from the central bank Governor, USDIDR is keeping its range near three-week highs of 15,713. The pair is adding 0.14% on the day, last seen trading at 15,707.50.
- An H&S formation has bolstered signs of a bearish reversal head.
- A test of 200-EMA indicates that the asset is at a make or a break level.
- The RSI (14) has shifted into the bearish range of 20.00-40.00, which signals more weakness ahead.
The AUDUSD pair has dropped to near 0.6640 in the Asian session as a sheer decline in risk appetite has impacted risk-perceived assets. The asset is declining after facing barricades around 0.6720 as the US dollar index (DXY) added gains further. The DXY has refreshed its weekly high at 107.38 and is expected to add more gains ahead.
S&P500 futures have surrendered the majority of Friday’s gains in the Tokyo session. While the 10-year US Treasury yields have dropped below 3.80%.
On an hourly scale, the asset has formed a Head and Shoulder (H&S) pattern that signals a bearish reversal. The chart pattern indicates a prolonged consolidation, which results in sheer momentum after a breakdown of the neckline placed around 0.6630.
The 50-period Exponential Moving Average (EMA) at 0.6687 has tilted towards the south, which adds to the downside filters. Also, the 200-period Exponential Moving Average (EMA) has been challenged at 0.6645, which will keep the asset on the tenterhooks.
Meanwhile, the Relative Strength Index (RSI) (14) has shifted into the bearish range of 20.00-40.00, which indicates that the downside momentum has been triggered.
Going forward, a breakdown of the H&S neckline at 0.6630 would confirm the bearish reversal, which will drag the asset towards November 8 high at 0.6550, followed by November 10 low around 0.6400.
On the flip side, a break above Friday’s high at 0.6730 will negate the H&S formation and will drag the asset towards Tuesday’s high around 0.6800 and the round-level resistance at 0.6900.
AUDUSD hourly chart
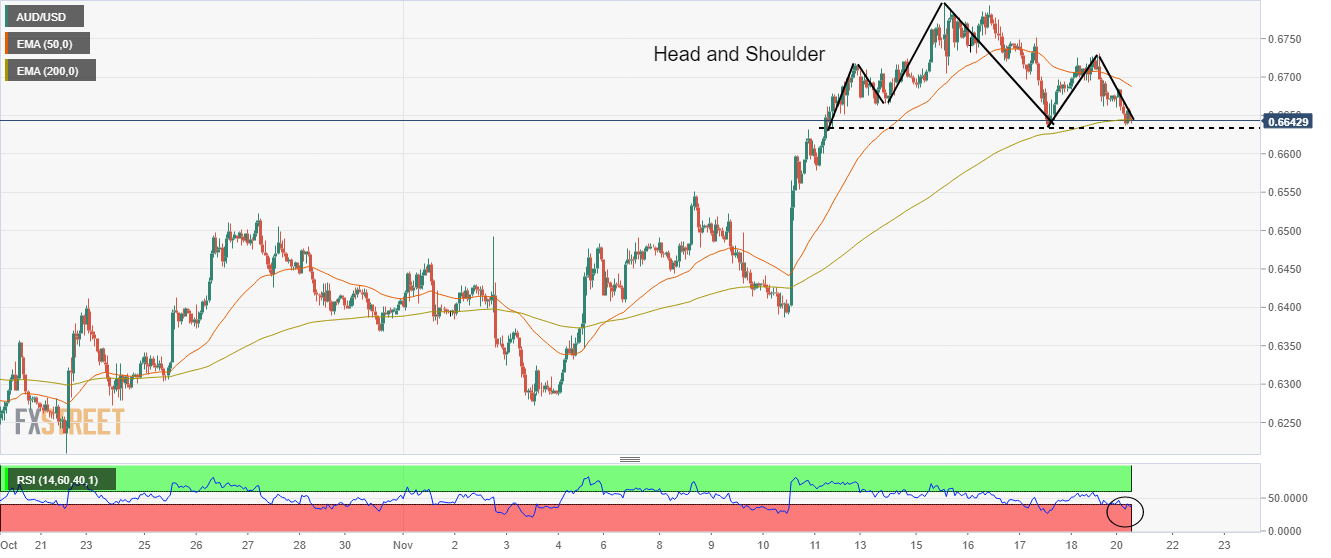
China’s Securities Journal said in their latest editorial piece, citing experts, in order to stabilize economic growth and maintain price stability, monetary policy will further enhance forward-looking, flexibility and effectiveness.”
Additional takeaways
“Increase support for policy-oriented developmental financial instruments, and promote more effective investment to accelerate implementation within the year. Continue to make efforts to "wide credit", stimulate the vitality of micro-entities, and boost market confidence.”
“Improve the forward-looking effectiveness of policies.”
- EURUSD is looking for an establishment below 1.0300 as risk-off sentiment has escalated.
- The DXY has crossed a two-day high of around 107.24 as investors have hidden behind safe-haven assets.
- As per the consensus, the Eurozone Consumer Confidence will improve to -26
.The EURUSD pair has witnessed a steep fall after dropping below the immediate support of 1.3134 in the Tokyo session. The asset has slipped below the round-level support of 1.0300 and is now facing barricades around the same. A significant decline in the risk appetite of investors is impacting risk-sensitive assets.
S&P500 futures have sensed selling pressure in early trade after failing to carry-forward positive sentiment witnessed on Friday. Meanwhile, the US dollar index (DXY) is has overstepped a two-day high of around 107.24. A rebound in the risk-off profile is appealing for safe-haven assets. However, the returns on US government bonds have continued their downside journey. The long-term US Treasury yields have dropped to nearly 3.79% as chances for 75 basis points (bps) rate hike by the Federal Reserve (Fed) are not appealing anymore.
Also, Atlanta Fed President Raphael Bostic cited that the central bank is ready to "move away" from three-quarter-point rate hikes at the Fed's December meeting, reported Reuters. He further added that Fed's target policy rate will add no more than another percentage point to tackle inflation. After that, the Fed would need to pause and "let the economic dynamics play out," given that it may take what he estimates as anywhere from 12 to 24 months for the impact of Fed rate increases to be "fully realized."
On the Eurozone front, investors are awaiting the release of the Eurozone Consumer Confidence, which is due on Tuesday. As per the consensus, the economic data will improve to -26.0 vs. the prior release of -27.6. This might support the shared currency bulls ahead.
- China’s weaker economic prospects led by rising Covid-19 infections are weighing on oil prices.
- An unchanged PBOC’s monetary policy has also dampened expectations of a recovery in oil.
- Expectations for the less-hawkish Fed’s policy are failing to support black gold.
West Texas Intermediate (WTI), futures on NYMEX, have faced barricades while attempting to cross the psychological resistance of $80.00 in the Asian session. Earlier, the asset made an effort for a rebound after refreshing the seven-week low at $77.58. The oil prices could test their two-month low of around $76.17 as the Chinese administration has resorted to Covid-19 restrictions again due to accelerating infections.
Last week, the Chinese government decided to remove restrictions on the movement of men, materials, and machines to resume normal business activities. However, a steep rise in Covid-19 cases dented the market mood. Investors are in dilemma whether to turn risk-averse due to accelerating Covid-19 cases or pour liquidity as restrictions on the movement of men, materials, and machines are waiving now.
To contain the Covid-19 outbreak, the administration has announced China’s southern metropolis of Guangzhou has been locked down for five days. The city of 19 million has become the epicenter of China’s latest Covid outbreak which is the worst since the start of the pandemic to have hit Guangzhou. Also, Guangzhou city is an economic powerhouse for China and a global manufacturing hub.
Apart from that, the maintenance of status quo by the People’s Bank of China (PBOC) may also hurt oil prices. The PBOC was expected to sound dovish as deteriorating economic prospects and vulnerable real estate demand were demanding an expansionary monetary policy.
Meanwhile, expectations of less-hawkish monetary policy by the Federal Reserve (Fed) are not supporting oil prices. The Fed is looking to trim consumer spending as it could be the only measure that can dilute mounting inflationary pressures. Also, major economies are expecting a recession situation as supportive to curtail price pressures.
- USDCHF is struggling to overstep a 10-day high at 0.9570 as focus shifts to US Durable Goods Orders data.
- The US Treasury yields are facing pressure amid less-hawkish commentary from Fed’s Bostic.
- Sustainability in the US Durable Goods Orders data may compel the Fed to sound hawkish again.
The USDCHF has advanced gradually to a near 10-day high of around 0.9570 in the Asian session. The asset is struggling to extend gains ahead as investors are shifting their focus toward the release of the US Durable Goods Orders data, which is due on Wednesday.
The market participants are favoring a risk-aversion theme despite the unavailability of any potential trigger. The US dollar index (DXY) has sensed hurdles around a two-day high at 107.24, however, the upside is still favored. S&P500 futures have witnessed enough heat in Tokyo after a positive functioning on Friday. Meanwhile, the 10-year US Treasury yields have tumbled below 3.80% as investors are not expecting a continuation of bigger rate hike announcements by the Federal Reserve (Fed).
As price pressures have shown immense signs of exhaustion and consumer spending has been trimmed in the US economy, investors believe that ultra-hot inflation is cooling down. Atlanta Federal Reserve (Fed) President Raphael Bostic believes that the spell of 75 basis points (bps) rate hike is terminated and a lower rate hike will be cited in December monetary policy by the US central bank, as reported by Reuters.
Going forward, investors will keep an eye on US Durable Goods Orders data. As per the projections, the economic data is seen stable at 0.4%. Sustainability in the Durable Goods Orders data in times when interest rates are accelerating could create more troubles for Fed chair Jerome Powell. The Fed has been working on keeping the overall demand on a low profile to cool down inflation. This also indicates that households are resorting to higher interest obligations to address their need for durable goods.
On the Swiss franc front, SNB Chairman cleared that monetary policy is still expansionary and ''we have most likely to adjust monetary policy again.'' The Swiss central bank is entitled to bring the inflation rate in the 0-2% range and in response to that current monetary policy is restrictive enough to perform the job.
- GBPUSD kicks off the week on the wrong footing amid resurgent US Dollar demand.
- Risk aversion weighs negatively on the Pound Sterling ahead of BoE-speak.
- GBPUSD buyers stay hopeful amid bullish RSI, eyes on 1.2128 rising wedge hurdle.
GBPUSD is staying pressured toward 1.1800 after facing rejection at the 1.1900 hurdle, as the US Dollar bulls flex their muscles amid the return of risk-off flows. Markets turn risk-averse following escalating tensions surrounding the renewed lockdowns in China amid surging covid cases. Investors flock to safety in the US Dollar in times of panic while moving away from risk-sensitive currencies such as the Pound Sterling.
Also, the Brtish Pound remains undermined by the UK Autumn Budget, which failed to impress amid recession warnings. Meanwhile, the GBPUSD pair also remains influenced by the commentaries from the US Federal Reserve (Fed) policymakers, who continue to push for higher terminal rates, helping the US Dollar stay afloat.
The focus now shifts toward the Bank of England (BoE) Deputy Governor Jon Cunliffe’s speech due later this Monday, as the United States economic docket lacks any high-tier data releases.
From a short-term technical perspective, GBPUSD is extending its consolidative phase between the 1.2000 and 1.1750 price range, awaiting a fresh impetus for a range breakout.
The bias remains skewed to the upside, as the 14-day Relative Strength Index (RSI) holds comfortable above the midline, despite the latest minor retreat.
Also, the bullish 21-Daily Moving Average (DMA) is looking to cut the horizontal 100DMA from below, adding credence to the bullish potential.
Buyers need to take out the intraday high at 1.1901 to revive the uptrend toward 1.1950 – the psychological level.
The next upside barrier is seen at the previous week’s high at 1.2028, above which a fresh rally toward the upper boundary of a five-week-old rising wedge, at 1.2128, will be challenged.
GBPUSD: Daily chart
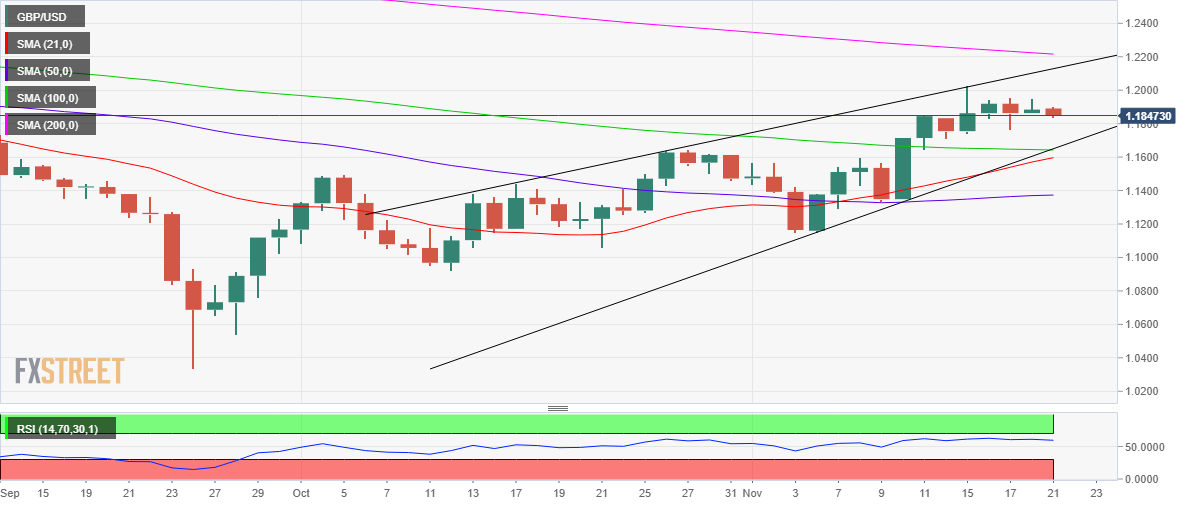
On the flip side, Thursday’s low at 1.1762 will come to the immediate rescue of GBPUSD bulls, below which strong support awaits at around 1.1650, which is the confluence of the 100DMA and the lower boundary of the wedge formation.
Daily closing below the latter will validate the wedge breakdown, initiating a fresh downtrend toward 1.1000.
GBPUSD: Additional technical levels
- Gold price is extending its bearish streak at the start of the week.
- Hawkish Federal Reserve commentary and China’s covid woes boost the US Dollar.
- Gold price looks vulnerable following a weekly close below the $1,750 level.
Gold price is testing weekly lows below $1,750, in a negative start to the week. The bright metal is extending its losing streak into a fourth straight trading day this Monday, as the US Dollar continues its recovery momentum, drawing the latest support from broad risk-aversion. Investors remain wary amid China’s covid restrictions and hawkish Fed outlook on the terminal rates. Two covid deaths reported in Beijing combined with a five-day lockdown in Guanzhou has once again spooked markets. Meanwhile, Atlanta Federal Reserve President Raphael Bostic said on Saturday that he feels the Fed's target policy rate needs to rise no more than another percentage point to tackle inflation. Looking ahead, markets await the Federal Reserve November meeting minutes for fresh hints on the central bank’s policy outlook.
Also read: Gold, Chart of the Week: XAUUSD bears are moving in, focus is on $1,750, then $1,720
Gold Price: Key levels to watch
The Technical Confluence Detector shows that the gold price is flirting with the SMA10 one-day at $1,745 following a weekly close below the $1,750 psychological barrier.
A breach of the pivot point one-day S1 at $1,742 is likely to open floors for a test of the $1,736 demand area. That zone is the convergence of the pivot point one-day S2 and the pivot point one-week S1.
The last line of defense for gold buyers is seen at $1,730, which is the previous month’s high.
On the flip side, the immediate resistance is aligned at the previous day’s low of $1,748, above which the $1,750 level will be retested.
Acceptance above the latter will threaten the Fibonacci 23.6% one-day resistance at $1,753.
Gold bulls need to take out the powerful resistance at around $1,755, which is the confluence of the Fibonacci 38.2% one-day and SMA50 four-hour.
Here is how it looks on the tool
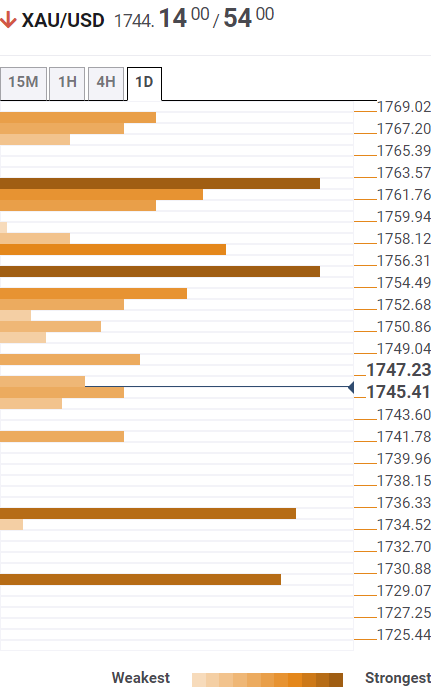
About Technical Confluences Detector
The TCD (Technical Confluences Detector) is a tool to locate and point out those price levels where there is a congestion of indicators, moving averages, Fibonacci levels, Pivot Points, etc. If you are a short-term trader, you will find entry points for counter-trend strategies and hunt a few points at a time. If you are a medium-to-long-term trader, this tool will allow you to know in advance the price levels where a medium-to-long-term trend may stop and rest, where to unwind positions, or where to increase your position size.
| Raw materials | Closed | Change, % |
|---|---|---|
| Silver | 20.894 | -0.38 |
| Gold | 1748.75 | -0.66 |
| Palladium | 1941.66 | -3.21 |
- USDJPY bulls are moving in with eyes on the 61.8% ratio.
- There are prospects for a significant bullish correction in the days ahead.
USDJPY remains on the front side of the trend in the main, albeit breaking down into test the 140/137s. There are prospects of a deeper move on a break below the current trendline as the following will illustrate from a bearish perspective:
USDJPY daily chart

So long as the price stays on the front side of the daily trendline, there will be prospects for a significant bullish correction in the days ahead.
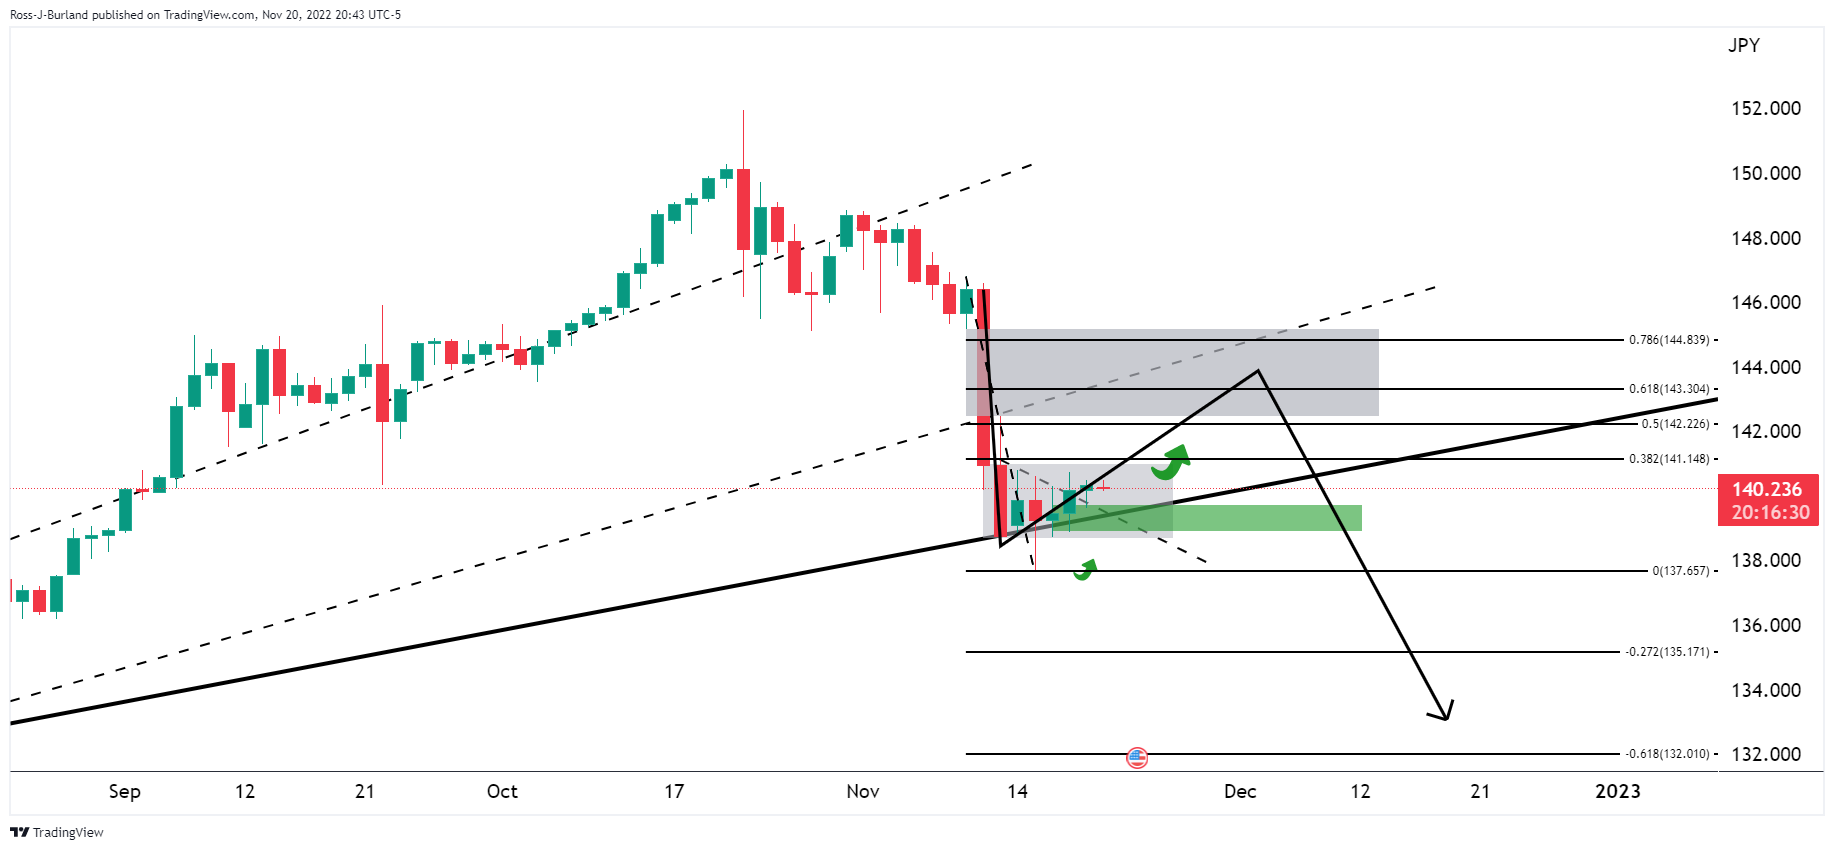
The 61.8% ratio is in sight within a price imbalance area.
- AUDUSD has resurfaced after slipping below 0.6660 despite unchanged PBOC’s monetary policy.
- Led by rising Covid-19 cases and weaker real estate demand, the PBOC was expected to sound dovish.
- Going forward, the speech from RBA’s Lowe will be of utmost importance.
The AUDUSD has retreated after dropping below the immediate support of 0.6660 despite the People’s Bank of China (PBOC) keeping its stance on interest rates ‘unchanged’.Earlier, the asset witnessed selling pressure while attempting to cross the immediate hurdle of 0.6680 in the Tokyo session.
Led by rising infections of Covid-19 and vulnerable real estate demand in China, the PBOC was expected to sound ‘dovish’ on its Prime Lending Rates (PLRs). The domestic catalysts have weakened economic projections extremely, therefore a rate cut was in consideration. An absence of expansionary measures in the monetary policy has brought volatility in the Australian dollar, being a leading trading partner of China.
Last week, the release of upbeat Australian employment data delighted the Reserve Bank of Australia (RBA). As per the Australian Bureau of Statistics, the economy managed to make fresh additions in the payroll market by 32.2k vs. the consensus of 15k and the prior release of 0.9k. Also, the Unemployment Rate was trimmed to 3.4% vs. the expectations of 3.6% and the former figure of 3.5%. This might support the RBA in hiking its Official Cash Rate (OCR) unhesitatingly.
Meanwhile, the US dollar index (DXY) has established above the round-level hurdle of 107.00 and has accelerated to near Tuesday’s high of 107.24. A rebound in the negative market sentiment is impacting the risk-perceived currencies. The 10-year US Treasury yields have dropped further below 3.81% as chances of the continuation of 75 basis points (bps) rate hike spell by the Federal Reserve (Fed) have trimmed vigorously.
Going forward, investors will focus on the speech from RBA Governor Philip Lowe, which will be delivered on Tuesday. RBA Governor may dictate the likely monetary policy actions ahead.
In recent trade today, the People’s Bank of China (PBOC) set the yuan (CNY) at 7.1256 vs. the estimate of 7.1203.
About the fix
China maintains strict control of the yuan’s rate on the mainland.
The onshore yuan (CNY) differs from the offshore one (CNH) in trading restrictions, this last one is not as tightly controlled.
Each morning, the People’s Bank of China (PBOC) sets a so-called daily midpoint fix, based on the yuan’s previous day's closing level and quotations taken from the inter-bank dealer.
The People's Bank of China leaves the one- and five-year Loan Prime Rate (LPR) setting unchanged at 3.65% and
4.30% respectively as expected considering last week's MFL rate was also left uncganged.
- USDCAD is looking to recapture 1.3400 as the risk-aversion theme gathers momentum.
- An expected contraction in Canadian Retail Sales will trim medium-term inflation expectations.
- Rising Covid-19 infections in China have impacted oil prices.
The USDCAD pair has rebounded after a corrective move to near 1.3370 in the Asian session. The asset has displayed recovery following the footprints of the US dollar index (DXY) a subdued performance at the oil counter. The DXY is attempting to establish above the critical hurdle of 107.00 as the risk profile is supporting the risk-averse theme.
S&P500 futures have witnessed some losses in early Tokyo after a positive Friday. The 500-stock basket ended flat last week due to the unavailability of any potential triggers. The 10-year US Treasury yields are expected to remain on tenterhooks amid less-hawkish guidance from Atlanta Federal Reserve (Fed) President Raphael Bostic.
Fed policymaker believes that the spell of 75 basis points (bps) rate hike is terminated and a lower rate hike will be cited in December monetary policy by the US central bank, as reported by Reuters. He further added that the Fed would pause hiking interest rates sooner and sees room for a mere 100 bps expansion ahead. A mild decline has been observed in 10-year US Treasury yields to near 3.81%.
Meanwhile, Lonnie investors are awaiting the release of the Retail Sales data, which is due on Tuesday. The economic data is expected to scale into negative territory at 0.7% vs. the prior expansion of 0.7%. A significant contraction in Retail Sales indicates that consumer spending is going through rough times, which will curtail mounting inflationary pressures.
On the oil front, oil prices have rebounded after a vulnerable show but are prone to the further downside amid rising cases of Covid-19 inflections in China. Going forward, the monetary policy of the People’s Bank of China (PBOC) will remain in focus. Being a leading oil importer, economic prospects in China have a serious impact on oil prices.
- EURUSD is on the verge of a breakout below 1.0300.
- Bulls could be gathered near 1.0150 on the way down.
EURUSD is pressured into a key trendline on the hourly chart and could be on the brink of a significant downside correction. The focus is on the US Dollar and net positioning turned net short in the latest week for the first time since mid-July 2021, according to calculations by Reuters and US Commodity Futures Trading Commission data released on Friday. This gives plenty of room for a move into shorts while
EURUSD H1 chart
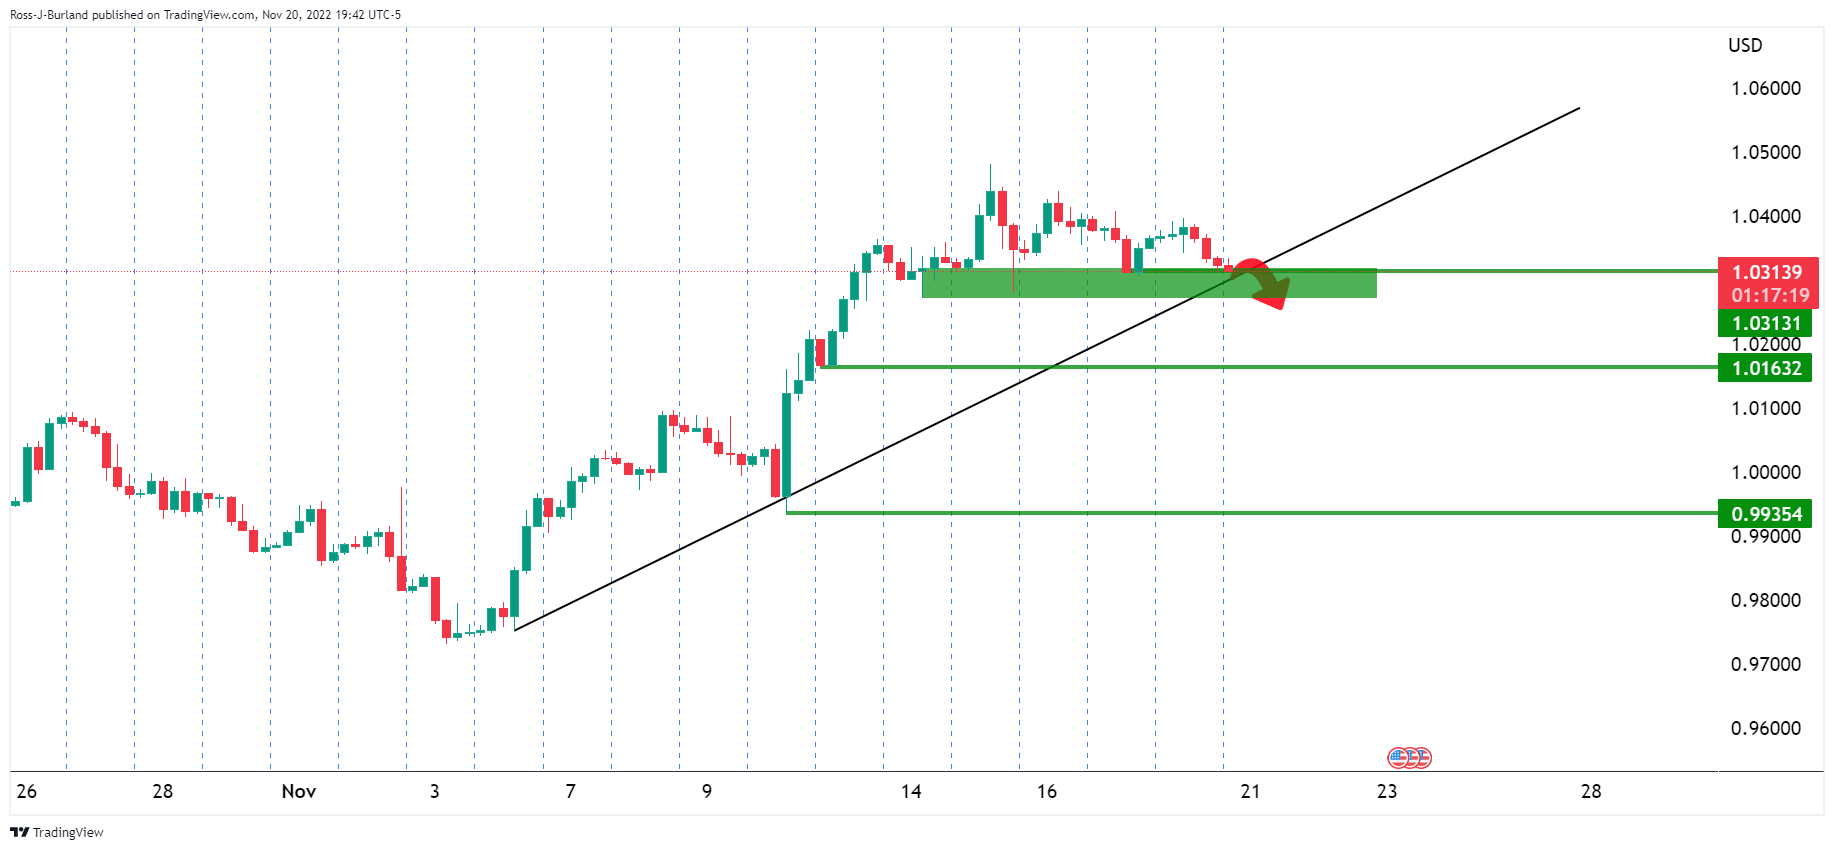
The support structure is being tested which opens the risk of a move to the midpoint of 1.0100. A break there opens the prospects of a move below 1.0000.
EURUSD daily chart
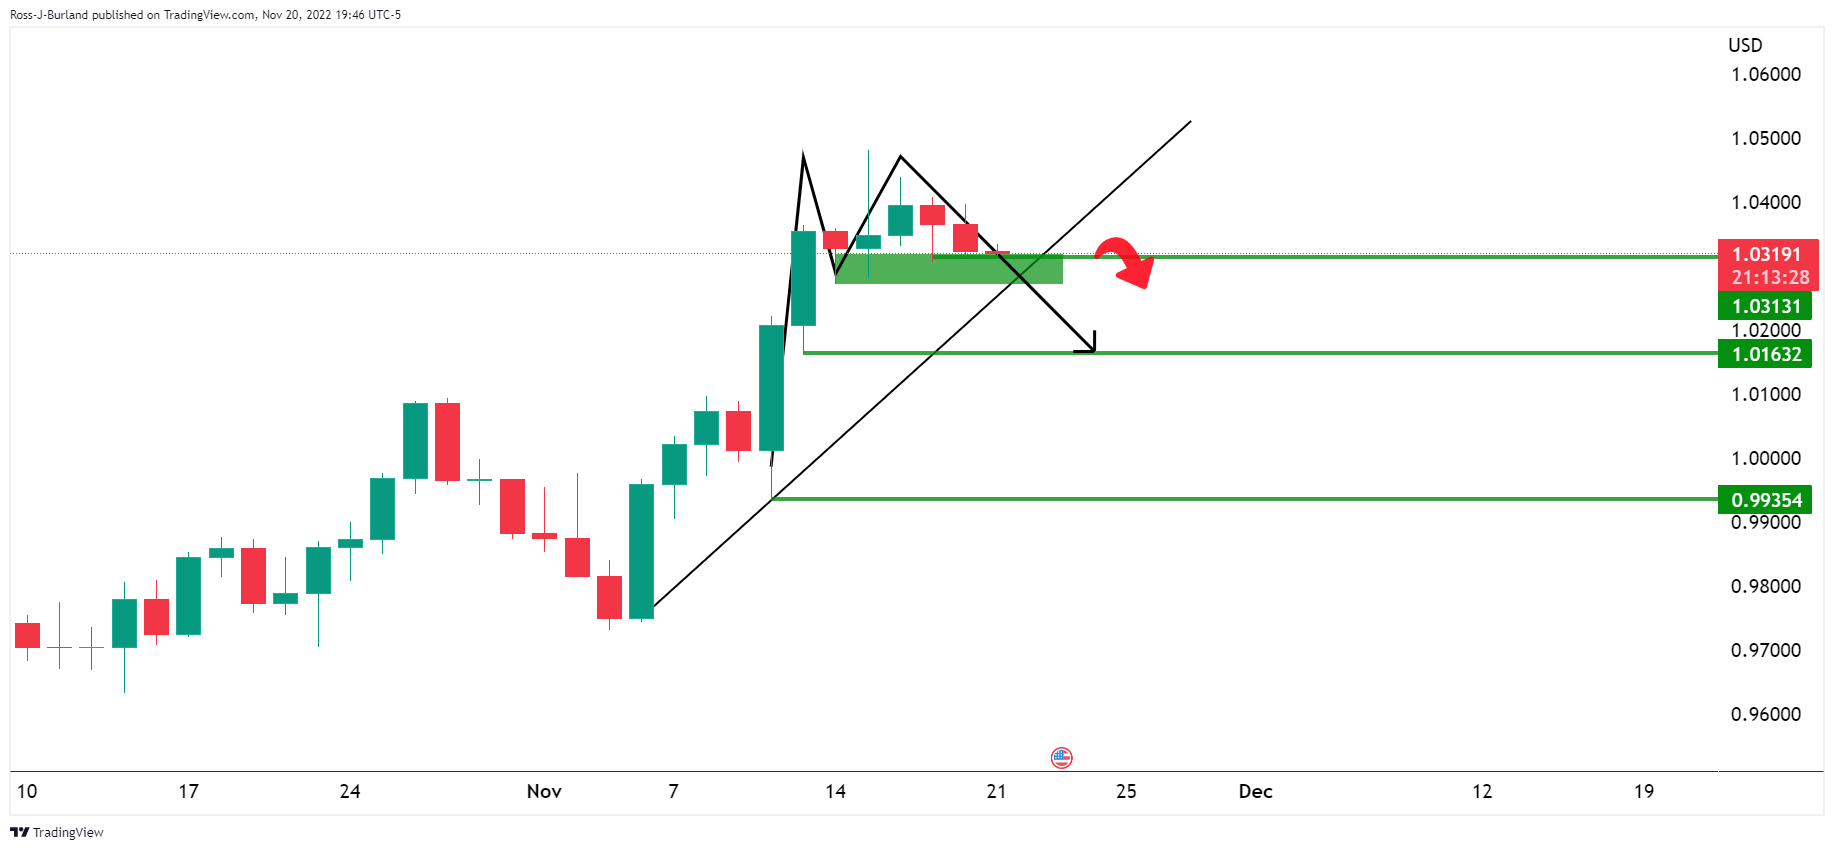
The daily chart shows that there is space into 0.9930s but the M-formation that is forming could hamstring any attempt of a breakout with 1.0150 a first target
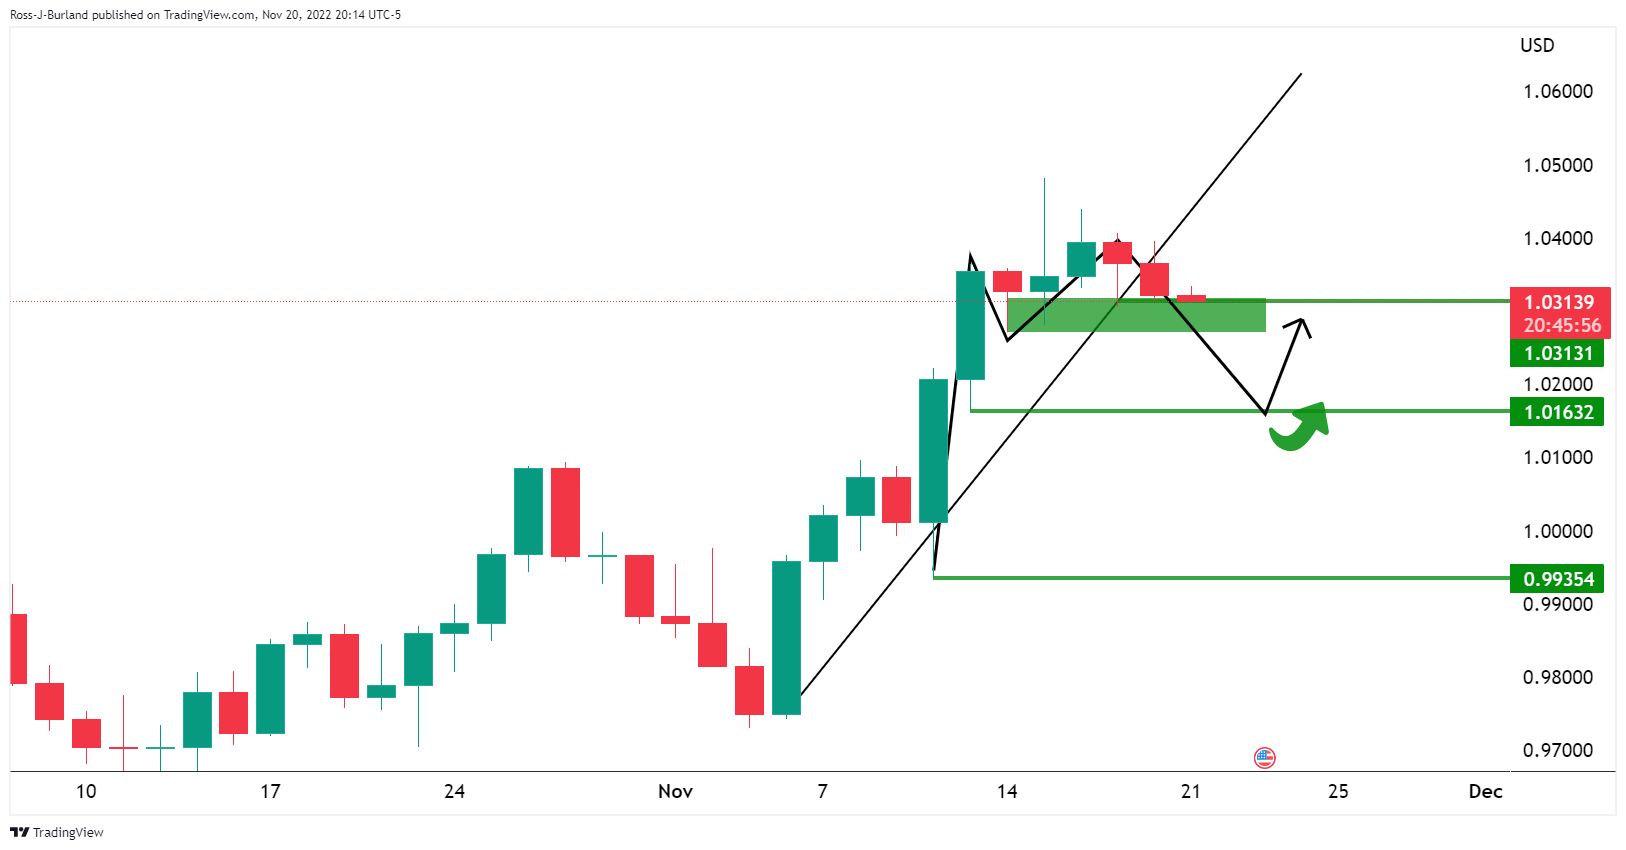
- NZDUSD is hovering around 0.6160 as investors await the People’s Bank of China’s monetary policy.
- Federal Reserve policymaker Bostic doesn’t see a continuation of the 75 bps rate hike regime in the December meeting.
- The Reserve Bank of New Zealand may shift to a 75 bps rate hike to curtail the historic surge in inflationary pressures.
- NZDUSD is aiming to recapture 0.6200 as the Reserve Bank of New Zealand’s bigger rate hike will trim Fed-RBNZ policy divergence.
NZDUSD is displaying a sideways performance around 0.6160 in the early Tokyo session as investors are awaiting the release of the interest rate decision by the People’s Bank of China (PBOC). While the ultimate trigger that will guide decisive action will be the announcement of the monetary policy by the Reserve Bank of New Zealand (RBNZ) this week.
NZDUSD is looking to recapture the critical resistance of 0.6200 after a decline on Friday as escalating tensions between North Korea and the United States forced market participants to safeguard themselves behind the US Dollar Index (DXY). The US Dollar picked bids around 106.40 and accelerated to near the round-level resistance of 107.00. At the press time, the US Dollar is struggling around 107.00 amid a quiet market mood.
The returns on US government bonds are expected to face immense pressure on commentary from Federal Reserve (Fed) President Raphael Bostic over interest rate guidance. Federal Reserve policymaker cited on Saturday that the central bank is ready to "move away" from three-quarter-point rate hikes at the Fed's December meeting, reported Reuters. He further added that Fed's target policy rate will add no more than another percentage point to tackle inflation.
US Durable Goods Orders data hogs limelight
This week, the release of the US Durable Goods Orders data will be of utmost importance. The economic data is seen stable at 0.6%. Consistency in the demand for durable goods is a cause of worry for Federal Reserve chair Jerome Powell and his teammates. The Federal Reserve is developing strategies to bring a slowdown in the overall demand so that manufacturers and service providers would leave with no incentive of keeping price growth stable or higher. Also, sustainability in demand for durable goods in times of accelerating interest rates is exposing the economy to economic turmoil. Households are banking upon higher interest obligations led by restrictive monetary policy by the Federal Reserve. This could result in an increment of the bank’s delinquency cost ahead.
In case of a better-than-expected release of the US Durable Goods Orders data, the Federal Reserve will be required to continue its bigger rate hike regime. This may support the US Dollar to register more gains ahead.
Reserve Bank of New Zealand may shift to a 75 bps rate hike ahead
To tackle the historic surge in inflationary pressures, the Reserve Bank of New Zealand is continuously hiking its Official Cash Rate (OCR). Reserve Bank of New Zealand Governor Adrian Orr has already announced five consecutive 50 basis points (bps) rate hikes to 3.5% and has no intention to pause in near future. Although, the policymaker is expected to go for a bigger extent to safeguard New Zealand Dollar and seal inflation as early as possible. 60% of economists polled at Reuters favored a shift in monetary policy rate hike regime to 75 bps to curtail the significant surge in the inflation rate to 7.2%. Contrary to its neighboring country Australia whose Reserve Bank of Australia (RBA) has trimmed its rate hike pace to support the prices of the real estate market and consumer spending, the kiwi central bank looks set to push its interest rate to 4.25%.
The move could strengthen the New Zealand Dollar ahead but will leave less room for more rate hikes by the Reserve Bank of New Zealand. Also, this will shift more responsibilities on economic dynamics to play ahead.
Rising Covid-19 cases call for a dovish People’s Bank of China policy
Easing in Covid-19 restrictions in China has not started yet and the numbers of infections are sky-rocketing. Investors are in dilemma whether to turn risk-averse due to accelerating Covid-19 cases or pour liquidity as restrictions on the movement of men, materials, and machines are waiving now. This has trimmed economic projections ahead. Adding to that, vulnerable real estate demand has also impacted market sentiment. This may compel the People’s Bank of China to sound dovish while announcing the monetary policy on Monday. Also, a dovish commentary on interest rate guidance will cheer the market mood.
Investors should be aware of the fact that New Zealand is a leading trading partner of China and an expansionary monetary policy by the People’s Bank of China will strengthen New Zealand Dollar bulls ahead.
NZDUSD Technical Outlook
-638045878857442933.png)
NZDUSD is attempting to cross the supply zone placed in a narrow range of 0.6163-0.6200 on a daily scale. The 20-and 50-period Exponential Moving Averages (EMAs) have delivered a bullish cross around 0.5880, which adds to the upside filters. While the 200-period EMA at 0.6200 still needed to be conquered for a sheer rally.
The Relative Strength Index (RSI) (14) has shifted into the bullish range of 60.00-80.00, which indicates that bullish momentum has been activated.
| Index | Change, points | Closed | Change, % |
|---|---|---|---|
| NIKKEI 225 | -30.8 | 27899.77 | -0.11 |
| Hang Seng | -53.12 | 17992.54 | -0.29 |
| KOSPI | 1.58 | 2444.48 | 0.06 |
| ASX 200 | 16.1 | 7151.8 | 0.23 |
| FTSE 100 | 39 | 7385.5 | 0.53 |
| DAX | 165.48 | 14431.86 | 1.16 |
| CAC 40 | 68.34 | 6644.46 | 1.04 |
| Dow Jones | 199.37 | 33745.69 | 0.59 |
| S&P 500 | 18.78 | 3965.34 | 0.48 |
| NASDAQ Composite | 1.1 | 11146.06 | 0.01 |
| Pare | Closed | Change, % |
|---|---|---|
| AUDUSD | 0.66709 | -0.15 |
| EURJPY | 144.866 | -0.25 |
| EURUSD | 1.03235 | -0.36 |
| GBPJPY | 166.767 | 0.29 |
| GBPUSD | 1.18842 | 0.19 |
| NZDUSD | 0.61538 | 0.56 |
| USDCAD | 1.33863 | 0.47 |
| USDCHF | 0.95369 | 0.2 |
| USDJPY | 140.328 | 0.1 |
China’s southern metropolis of Guangzhou has been locked down for five days. The city of 19 million has become the epicenter of China’s latest Covid outbreak and is the worst since the start of the pandemic to have hit Guangzhou. The city is the capital of Guangdong province, which is a major economic powerhouse for China and a global manufacturing hub.
China had recently stepped up to ease zero-COVID measures and bail out its property sector but local authorities nationwide are under pressure to ramp up Covid control measures despite mounting public frustration. China’s doctors have warned that the nation is not to relax lockdown measures, in an article by the Financial Times: China’s doctors warn ‘we’re not ready’ as threat of covid ‘exit wave’ stymies reopening ambitions.


© 2000-2026. All rights reserved.
This site is managed by Teletrade D.J. LLC 2351 LLC 2022 (Euro House, Richmond Hill Road, Kingstown, VC0100, St. Vincent and the Grenadines).
The information on this website is for informational purposes only and does not constitute any investment advice.
The company does not serve or provide services to customers who are residents of the US, Canada, Iran, The Democratic People's Republic of Korea, Yemen and FATF blacklisted countries.
Making transactions on financial markets with marginal financial instruments opens up wide possibilities and allows investors who are willing to take risks to earn high profits, carrying a potentially high risk of losses at the same time. Therefore you should responsibly approach the issue of choosing the appropriate investment strategy, taking the available resources into account, before starting trading.
Use of the information: full or partial use of materials from this website must always be referenced to TeleTrade as the source of information. Use of the materials on the Internet must be accompanied by a hyperlink to teletrade.org. Automatic import of materials and information from this website is prohibited.
Please contact our PR department if you have any questions or need assistance at pr@teletrade.global.
transfers