- Analytics
- News and Tools
- Market News
CFD Markets News and Forecasts — 17-11-2022
- USDCAD bulls remain in play but there are risks of a break below 1.3300.
- Bulls need to clear 1.3380 for the prospects fo a firmer run to 1.3550.
As per the prior day's bullish thesis, USDCAD Price Analysis: Bulls moving in and eye a 38.2% Fibo, the price indeed moved in on the targetted area. However, the bears were quick to pounce on the rally and we are back to square one as the following illustrates:
it was explained that the Bank of Canada next meets on December 7 and a 25 bp hike to 4.0% is expected and that there is a long time between now and then that gave rise to prospects of a meanwhile correction as follows:
USDCAD weekly chart
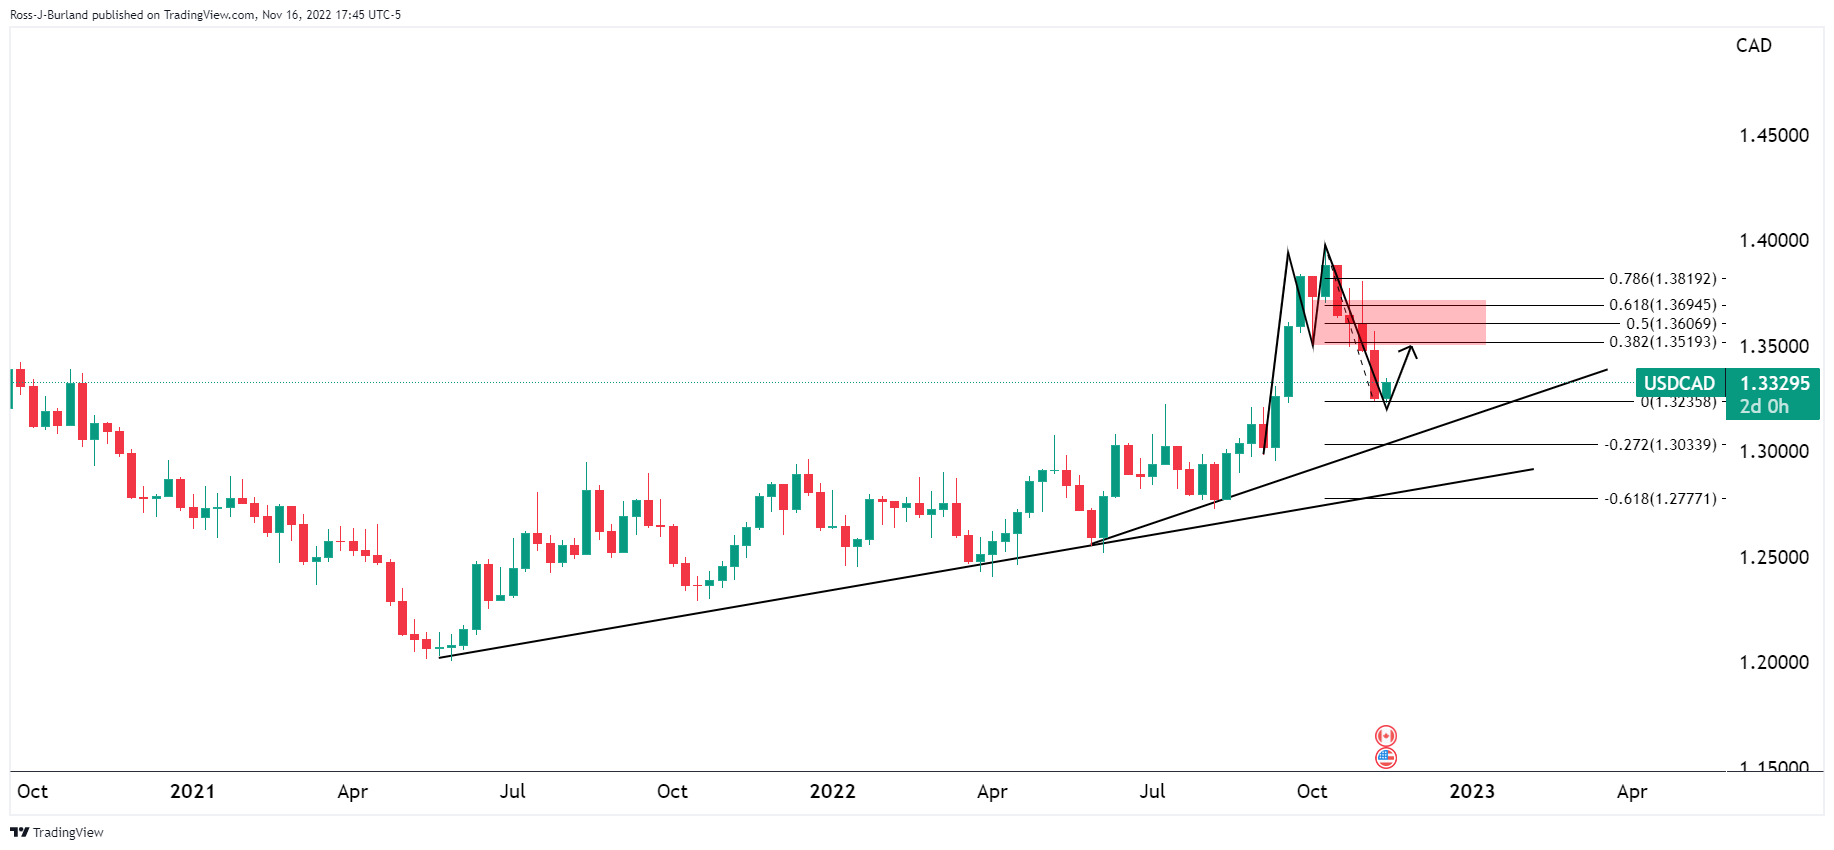
The M-Formation was a compelling bullish feature, but it was also explained that there could still be some downside to come:

A break of the support was eyed as a catalyst that would open up the way to dynamic trendline support.
However, the bulls were firming and the 38.2% Fibonacci was eyed for the remainder of the week:
USDCAD update
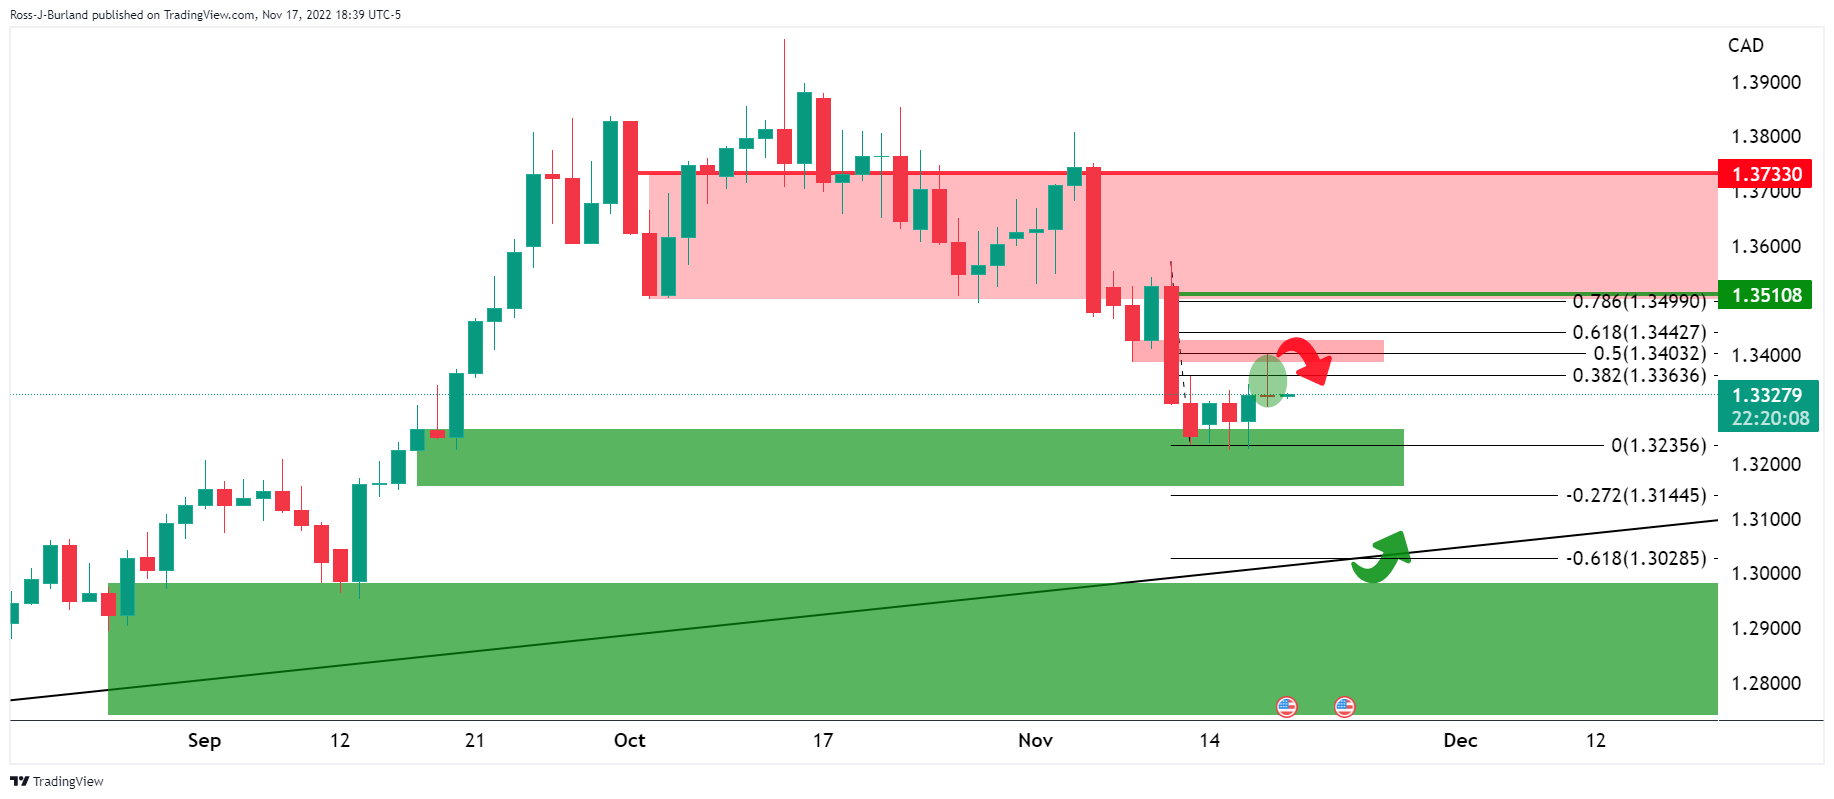
We have seen that move already. Until a break of 1.33 the figure, the emphasis remains on the upside as per the hourly chart:
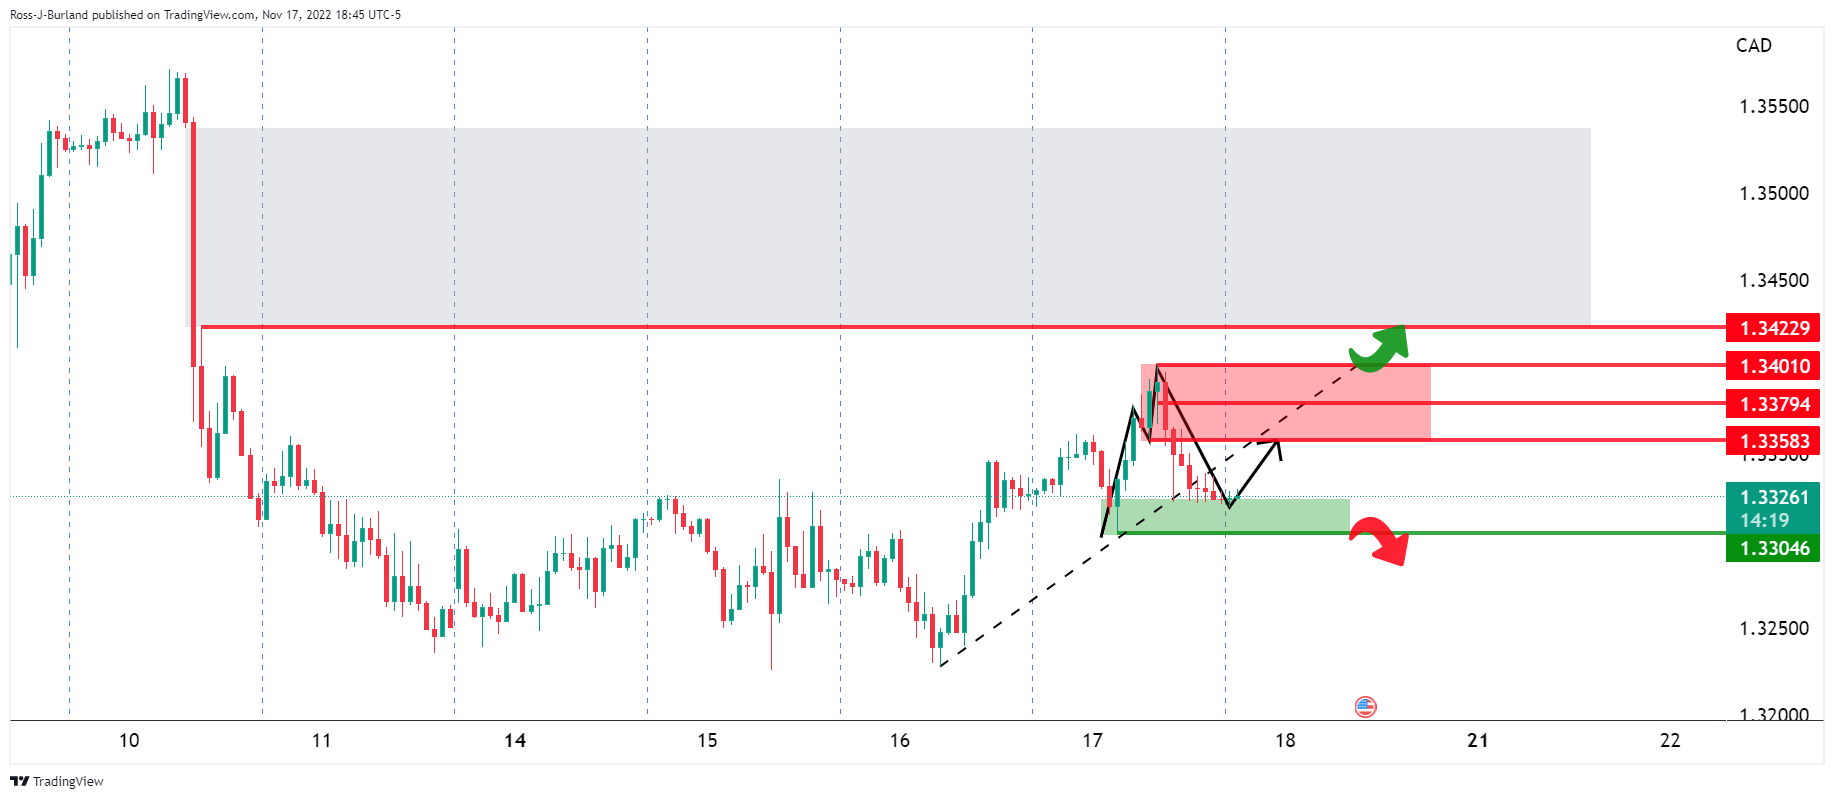
The M-formation is a reversion pattern and so long as the bulls can get above 1.3380 and then 1.3420, there will be prospects of a move into the price imbalance and 1.3550 will be vulnerable.
- NZDUSD remains sidelined after bouncing off a one-week-old horizontal support.
- Sluggish oscillators, bullish chart pattern keeps buyers hopeful but 0.6160 holds the key for the bull’s conviction.
- 200-HMA, fortnight-old ascending trend line restricts immediate downside.
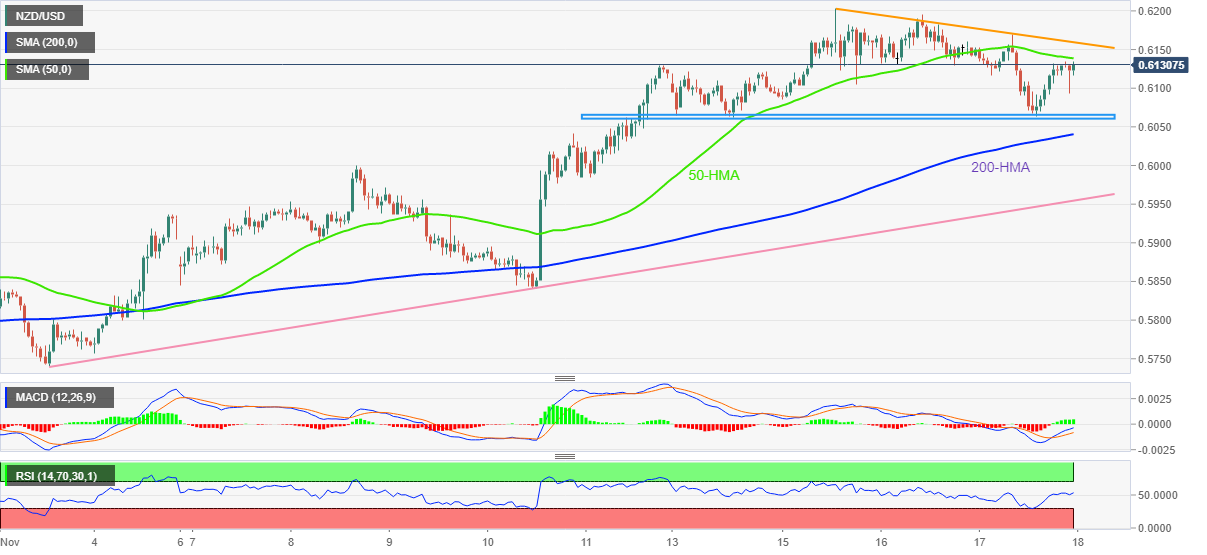
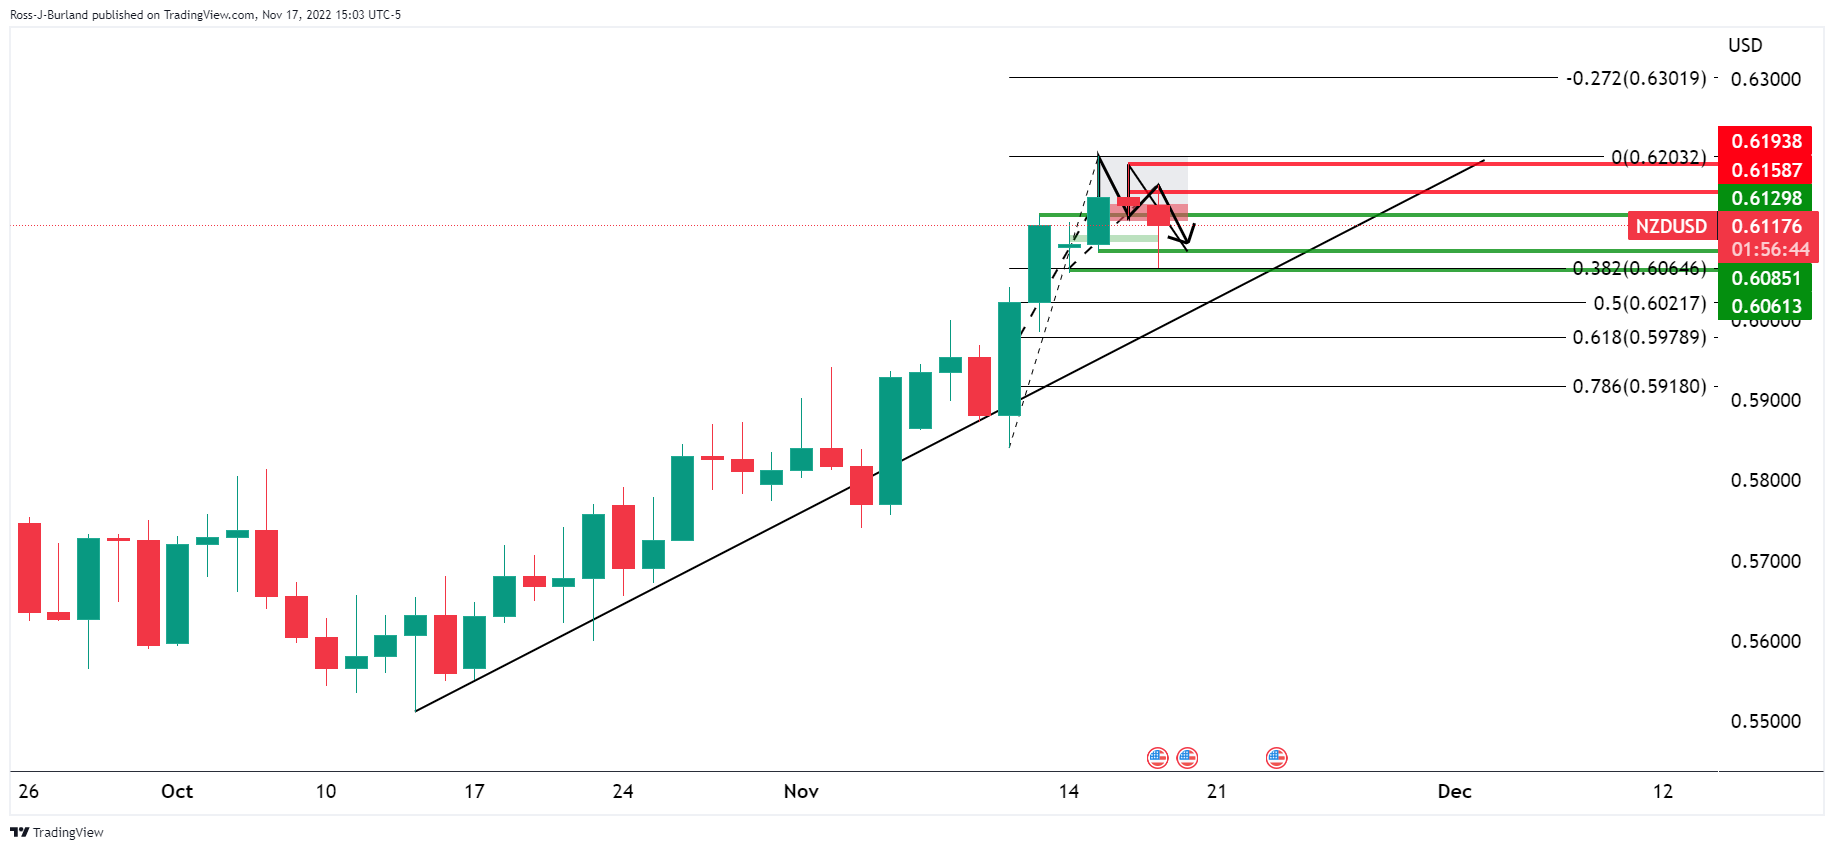
NZDUSD seesaws around 0.6130, challenging a two-day downtrend, as traders struggle for fresh clues inside a one-week-old descending triangle bullish formation during early Friday.
In doing so, the Kiwi pair makes rounds to the 50-HMA amid the inactive performance of the Relative Strength Index (RSI) placed at 14, as well as the Moving Average Convergence and Divergence (MACD).
With this, the Kiwi pair is likely to remain sidelined during the five-week uptrend, despite the latest pullback.
However, a downside break of the stated triangle’s support area, near 0.6060, won’t hesitate to recall the NZDUSD bears.
Following that, the 200-HMA and a two-week-long ascending support line, respectively around 0.6040 and 0.5955, could challenge the quote’s further downside.
Meanwhile, the 50-HMA level surrounding 0.6140 restricts the immediate upside of the NZDUSD pair.
Even so, the stated triangle’s top line near 0.6160 appears crucial to convince the pair buyers in retaking control. Also acting as an upside filter is the monthly high near 0.6205.
Overall, NZDUSD buyers are likely to keep the reins despite the latest pullback in prices.
NZDUSD: Hourly chart
Trend: Limited recovery expected
- AUDUSD braces for the first weekly loss in five, remains sidelined of late.
- Hawkish Fedspeak, risk aversion propelled US Treasury yields and US Dollar.
- Headlines surrounding China, Russia exert additional downside pressure on the Aussie pair.
- Mixed US data, firmer Australia jobs report failed to impress buyers.
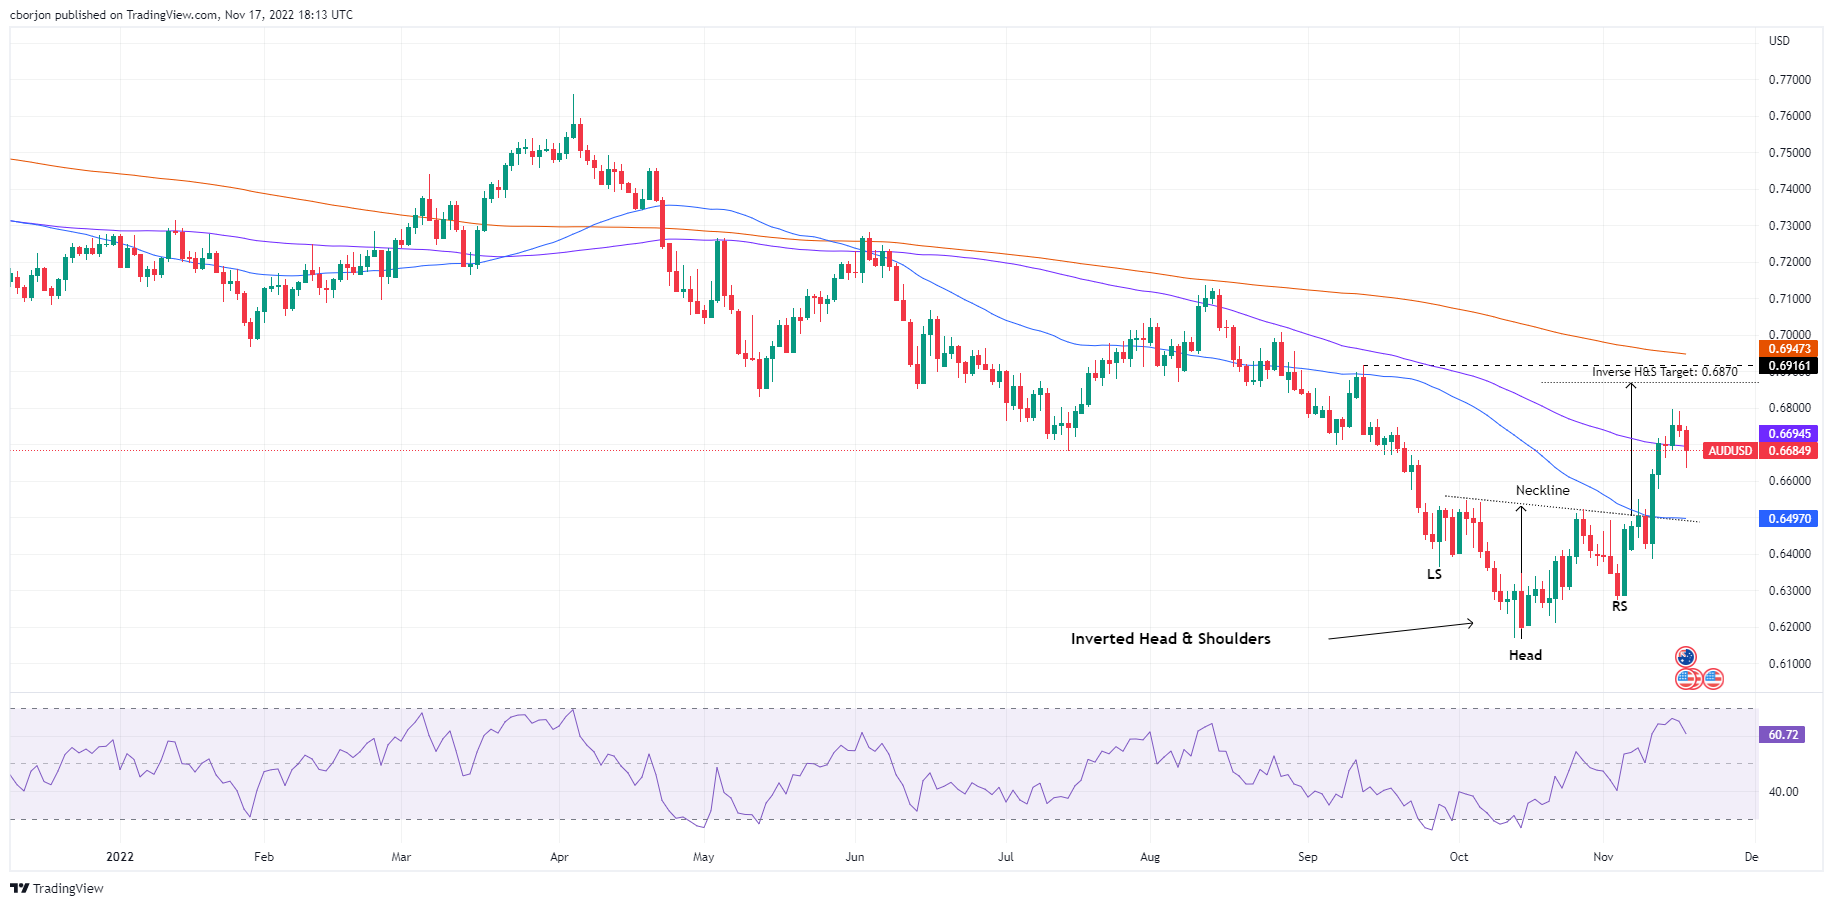
AUDUSD treads water around 0.6690 after a two-day downtrend as bears seek more clues to snap a four-week uptrend. That said, a light calendar on Friday also challenges the Aussie pair sellers during the Asian session. Even so, the US Dollar’s rebound, backed by the firmer Treasury yields, joins the market’s sour sentiment to keep the pair sellers hopeful.
US Dollar Index (DXY) eyes a recovery from the three-month low marked earlier in the week on recently hawkish comments from the US Federal Reserve (Fed) officials, as well as firmer top-tier data from the United States. In doing so, the greenback ignores Thursday’s mixed figures of the second-tier statistics.
Strong prints of the US Retail Sales and Producer Price Index (PPI) for October seemed to favor the Fed hawks. That said, St. Louis Federal Reserve President James Bullard said on Thursday that the US Federal Reserve's (Fed) monetary policy is not yet in a range estimated to be sufficiently restrictive to reduce inflation. On the same line were the latest comments from Minneapolis Federal Reserve Bank President Neel Kashkari. “With inflation still high but a lot of monetary policy tightening already in the pipeline, it's unclear how high the US central bank will need to raise its policy rate,” said Fed’s Kashkari.
Talking about the data, US Philadelphia Fed Manufacturing Index fell to -19.4 versus -6.2 market forecasts and -8.7 prior. Further, Housing Starts declined by 4.2% MoM in October following September's 1.3% contraction whereas Building Permits fell by 2.4%, compared to a 1.4% increase recorded in the previous month. Additionally, the Jobless Claims eased to 222K for the week ended on November 11 versus 225K expected and upwardly revised 226K prior.
At home, Australia’s Employment Change jumped by 32.2K versus 15K market forecasts and 0.9K prior whereas the Unemployment Rate dropped to 3.4% from 3.5% previous readings and 3.6% expected. The employment statistics gained an additional edge to lure buyers, especially after the strong Wage Price Index was published. However, the previously dovish statements from the Reserve Bank of Australia (RBA) officials seemed to have kept the AUDUSD buyers on the board.
Elsewhere, fresh tension between Russia and Ukraine due to missile strikes on Poland, as well as the increasing Covid counts in China also weighed on the market’s sentiment and the risk-barometer pair.
While portraying the mood, Wall Street closed in the red while the US 10-year Treasury yields bounced off a six-week low.
Moving on, a lack of major data/events could allow bears to take a breather but the risk-off mood and hawkish Fed concerns may push the AUDUSD price toward the weekly loss.
Technical analysis
As the retreat in the RSI (14) backing the Aussie pair’s U-turn from the 61.8% Fibonacci retracement level of the August-October downside, around 0.6770, the odds of the quote’s downside break of the 100-day EMA support, near 0.6670 at the latest, are too high.
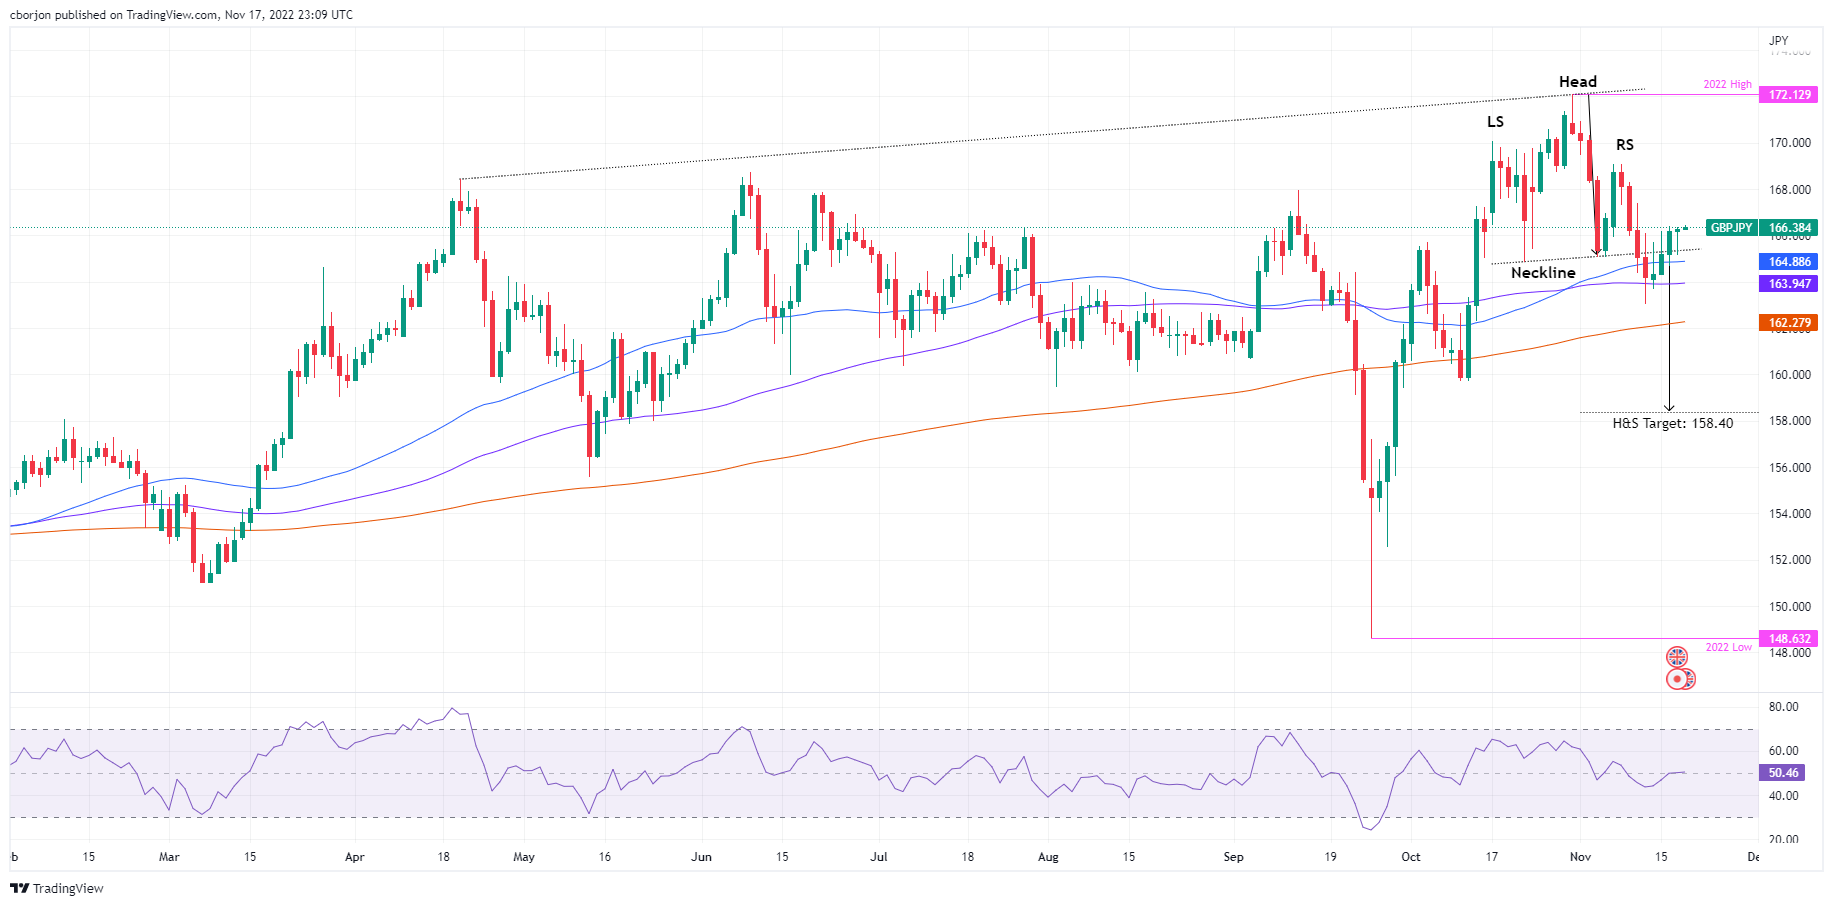
- The GBPJPY extended its gains and reached a fresh weekly high of around 166.45.
- For the GBPJPY buyers to invalidate the head-and-shoulders pattern, they must reclaim 169.00.
- GBPJPY's fall below 165.30 would keep the head-and-shoulders pattern in play.
The GBPJPY rises for the fourth consecutive day, threatening to invalidate a head-and-shoulders chart pattern formed in the daily chart, as the exchange rate surpasses the neckline as the cross pushes above the 165.00 mark. At the time of writing, the GBPJPY is trading at 166.37, above its opening price by 0.10%, after hitting a daily low of 165.17.
GBPJPY Price Analysis: Technical outlook
The GBPJPY shifted from neutral-to-downward to upward-biased once the cross-currency pair achieved two conditions: reclaimed the 50-day Exponential Moving Average (EMA) and broke above the head-and-shoulder pattern neckline, which is still in play. That said, the GBPJPY consolidates on top of the neckline but remains unable to crack the weekly high of 166.40. The Relative Strength Index (RSI) is almost flat ath the 50-midline, suggesting the pair would remain sideways.
Therefore, the GBPJPY's first resistance area would be the 166.45 area. Once cleared, the next supply zone would be the 167.00 psychological level, followed by the November 8 swing high at 169.08, invalidating the head-and-shoulders chart pattern.
On the flip side, if GBPJPY sellers want to reclaim the head-and-shoulders neckline, they need to break below 165.30. A breach of the latter would send the pair diving to the 165.00 figure, followed by key support levels, like the 50-day EMA at 164.88 and the 100-day EMA at 163.94.
GBPJPY Key Technical Level
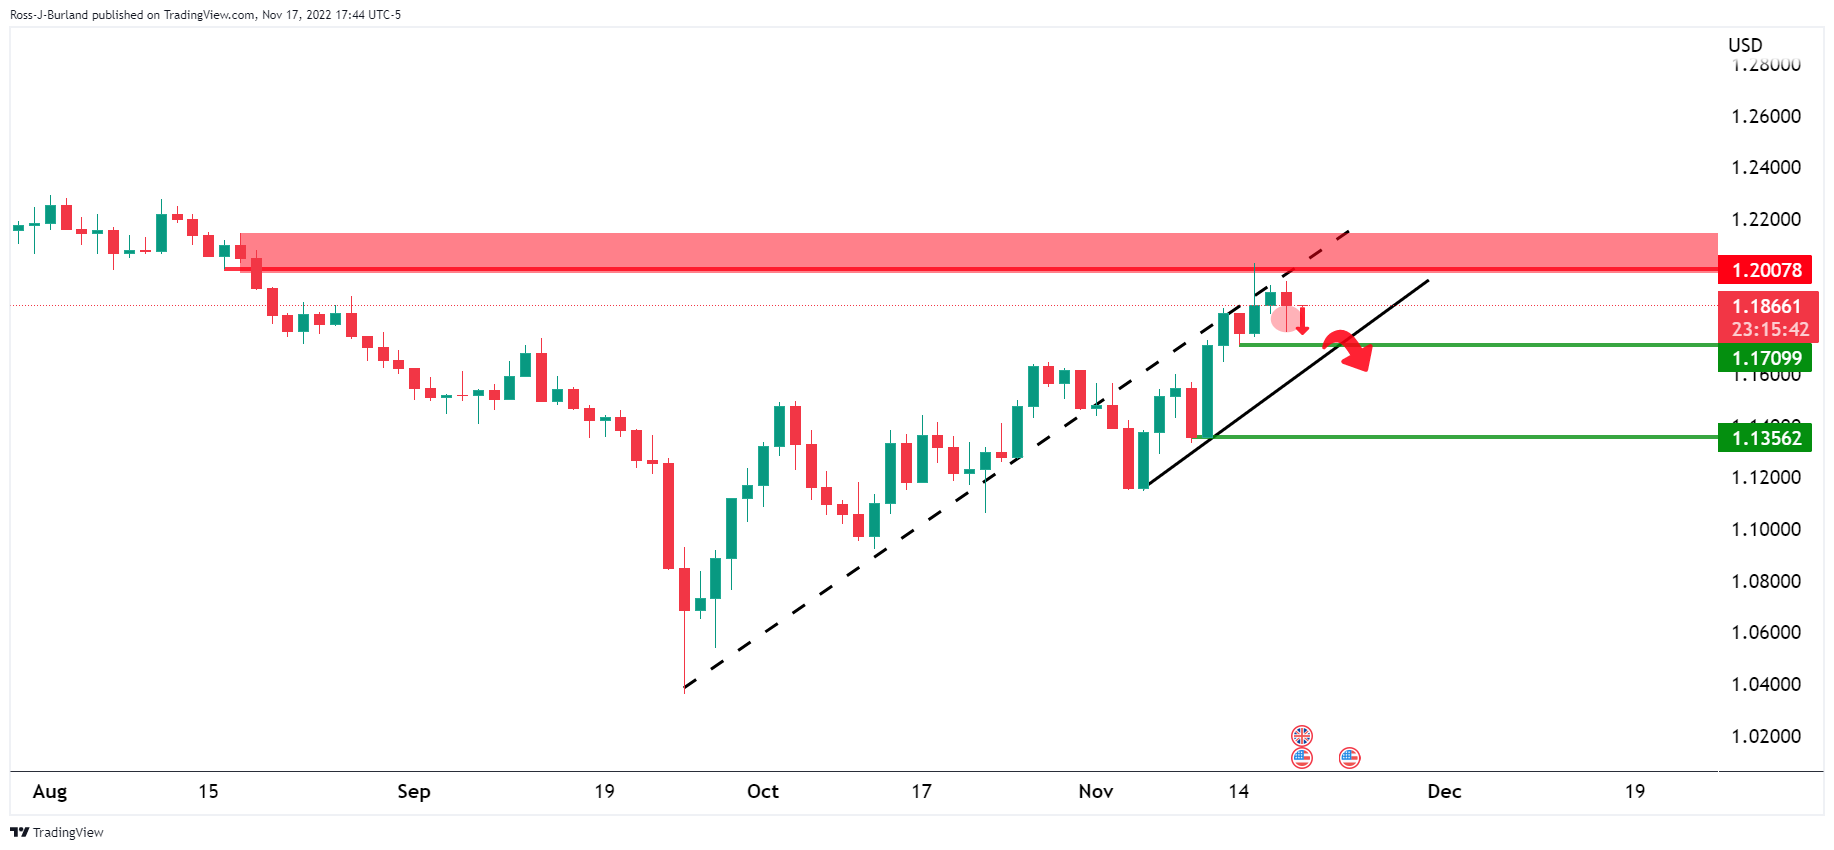
- GBPUSD made a break below the structure and the W-formation is a reversion pattern.
- Bears are coming back in at the counter-trendline resistance and eye a target of 1.1700 with 1.1650 below there.
GBPUSD was pressured on Wednesday as US Treasury yields moved higher and investors eyed hawkish comments from Federal Reserve officials. Meanwhile, the Pound came under pressure due to the UK government's latest budget. When marrying the technicals, there is a bearish outlook for Cable as the following illustrates:
GBPUSD daily chart
Wednesday was a red day, leaving a bearish wick on the charts which is essentially a lower time frame business that is vulnerable to a correction, as per the following 15-min chart:
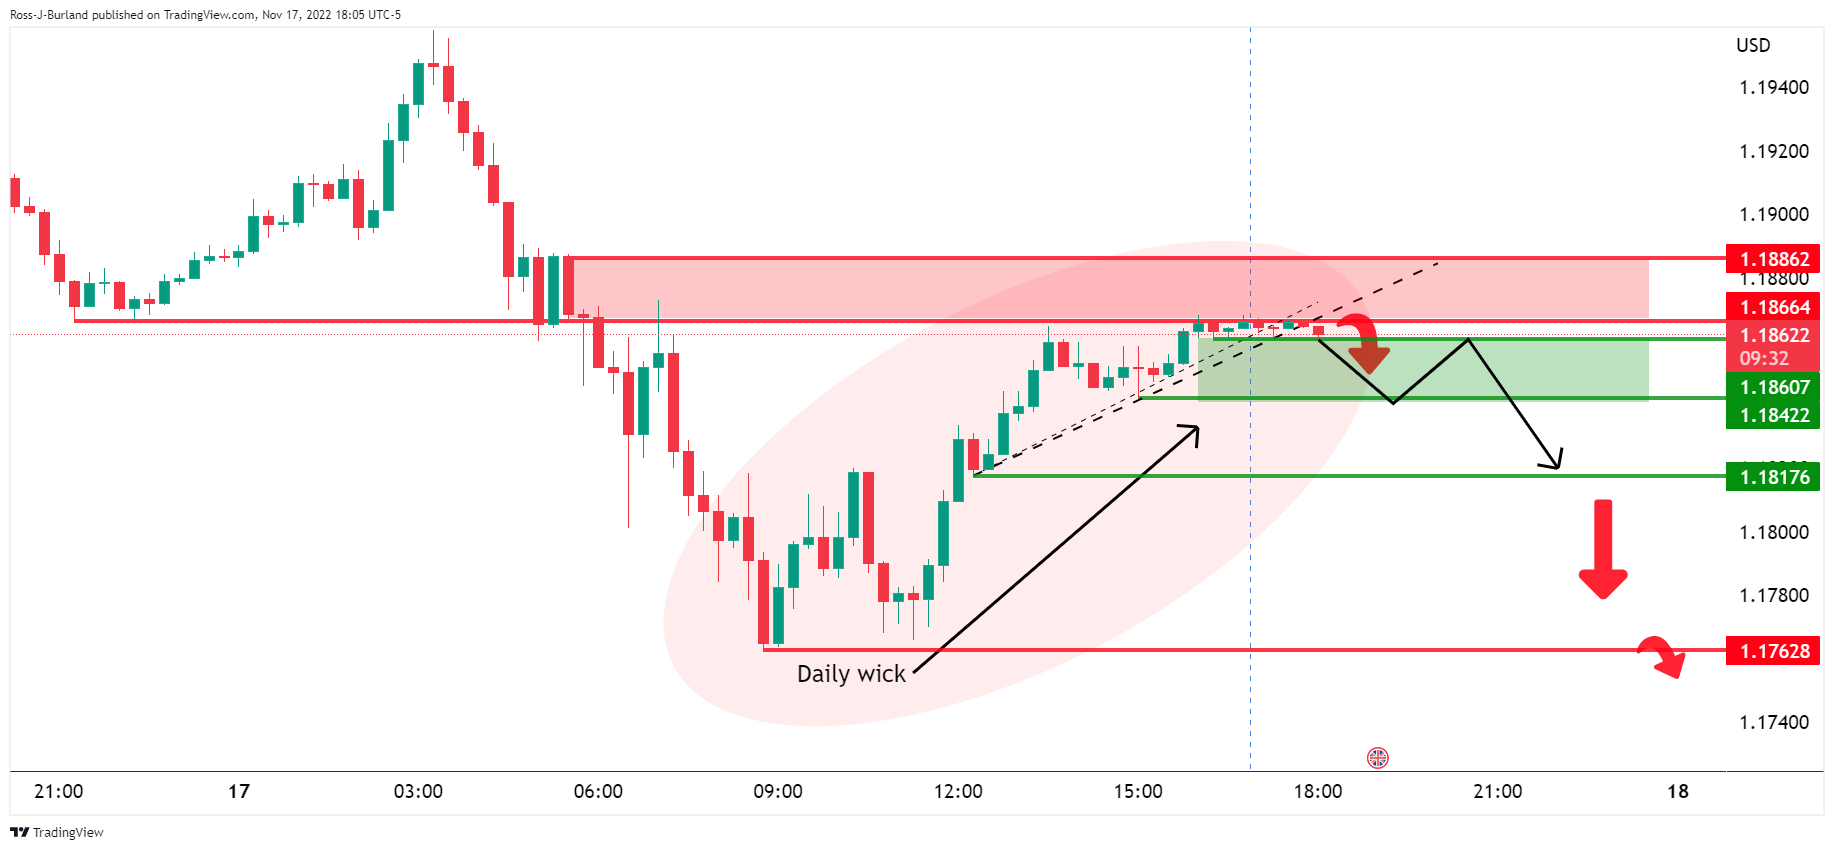
GBPUSD H1 charts
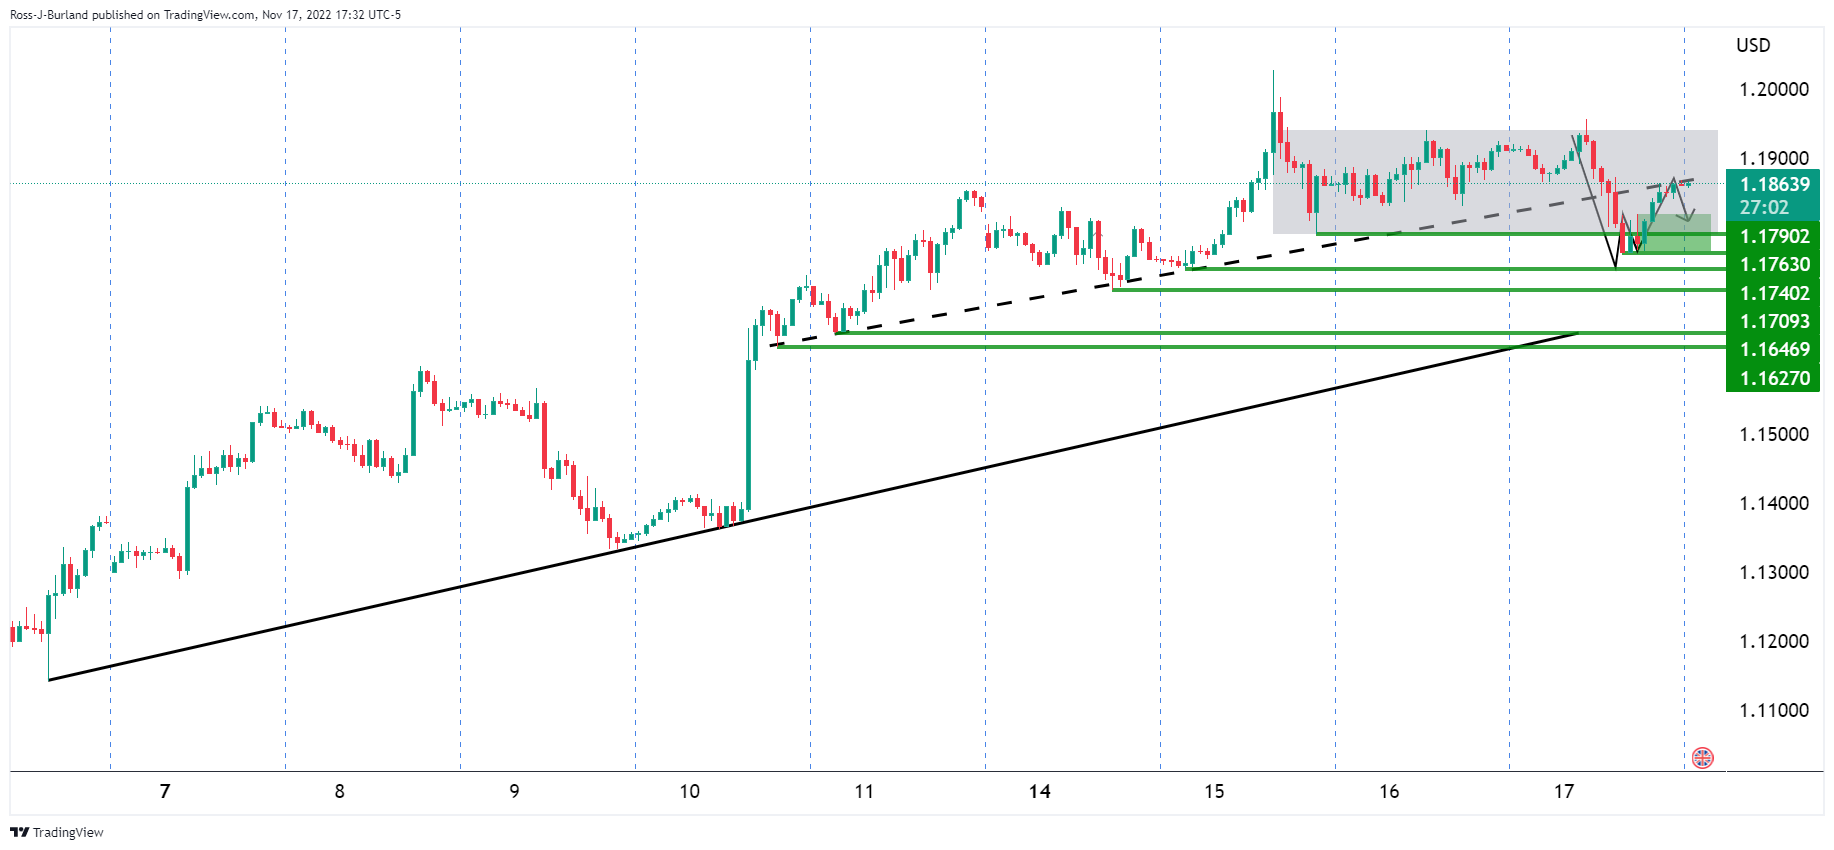
GBPUSD H1 zoomed in:
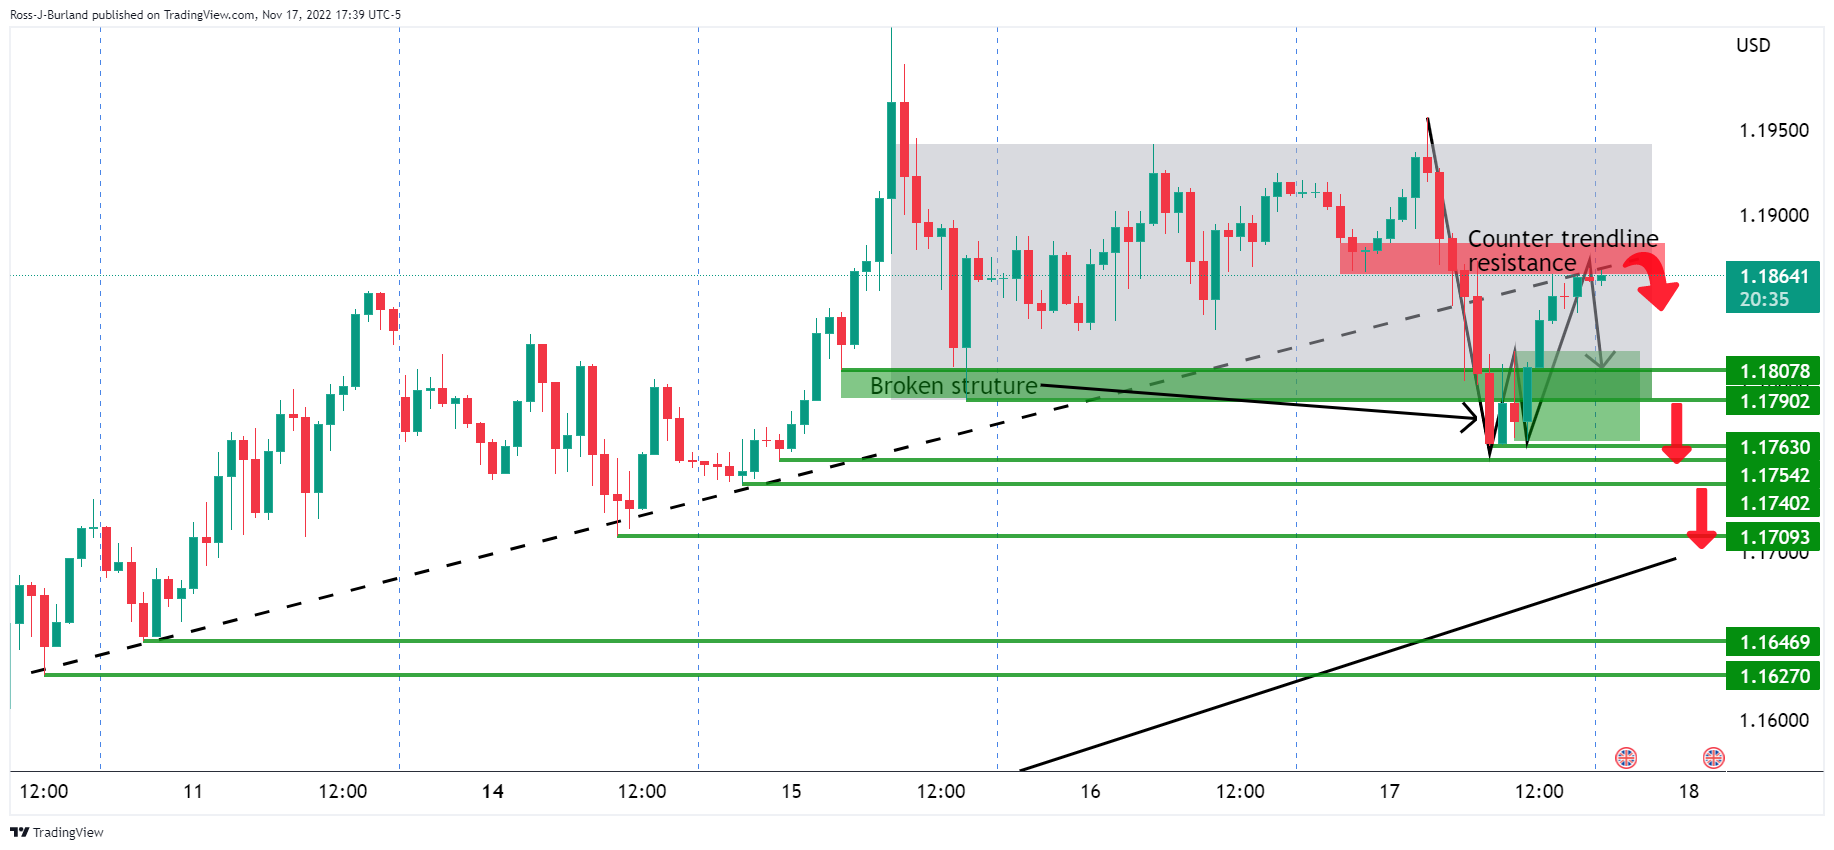
The trapped volume up top needs the price to continue higher, but those longs could be out of luck as the retest of the counter-trendline could prove to be a failed effort if the bears commit over the course of the next day and final sessions of the week. We have seen a break of structure already and the W-formation is a reversion pattern that would be expected to hamstring the price to the downside for a target of 1.1700 and 1.1650 below there.
- EURUSD seesaws around a two-week-old ascending support line.
- Repeated failures to cross 200-DMA, overbought RSI conditions favor sellers.
- Bulls need validation from the monthly top to retake control.
EURUSD flirts with a fortnight-old support line as pares the fifth consecutive weekly gain around 1.0360 during Friday’s Asian session. In doing so, the major currency pair portrays an inability to cross the 200-DMA despite multiple attempts during the week.
Not only the failure to cross the key Daily Moving Average (DMA) but the overbought RSI conditions and receding bullish bias of the MACD also keep EURUSD bears hopeful.
It’s worth noting that a clear break of the immediate support line, near 1.0350 by the press time, needs to crack the 61.8% Fibonacci retracement level of May-September downside, around 1.0300, to convince EURUSD bears.
Following that, a slump toward September’s high of 1.0198 appears imminent. However, multiple levels around 1.0100 could challenge the pair sellers afterward.
If at all the EURUSD drops below 1.0100 support, a convergence of the 100-DMA and 38.2% Fibonacci retracement level, near 1.0020, will be the last defense of the buyers.
Alternatively, recovery moves not only need to cross the 200-DMA resistance surrounding 1.0415 but should also refresh the monthly high, currently around 1.0480, to convince EURUSD bulls.
In that case, a run-up towards the late June swing high around 1.0615 can’t be ruled out.
EURUSD: Daily chart
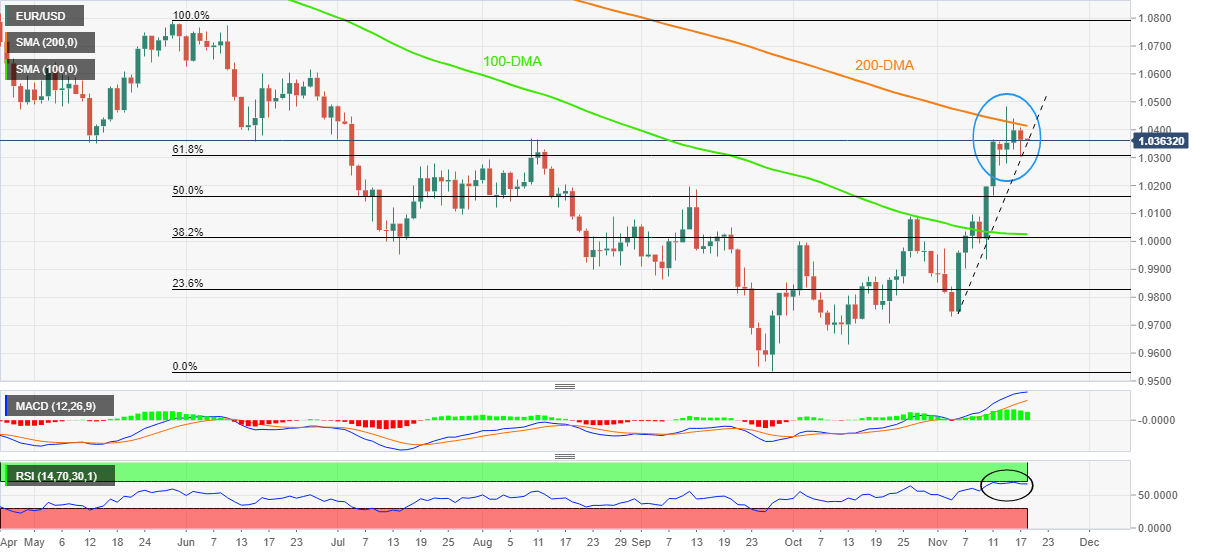
Trend: Further weakness expected
- Gold price remains set to snap two-week uptrend, pressured of late.
- Federal Reserve talks, Russia-Ukraine tussles and Covid woes underpin US Dollar demand.
- Data from United States came in softer but failed to weigh on the greenback.
- Light calendar needs XAUUSD traders to rely on risk catalysts for fresh impulse.
Gold price (XAUUSD) stays bearish around $1,760, after a two-day downtrend, as sellers cheer the US Dollar’s rebound despite softer economics from the United States. In doing so, the precious metal bears observe the recently hawkish comments from the US Federal Reserve (Fed) officials, as well as the risk-negative catalysts, while bracing for the first weekly loss in three.
Federal Reserve officials recall Gold price sellers
Although the latest second-tier data from the United States came in mixed, mostly softer, the Federal Reserve policymakers’ resistance to reiterate the statements favoring the 50 bps rate hike in December favored the US Dollar and triggered the recent sell-off in the Gold price.
“US Federal Reserve's (Fed) monetary policy is not yet in a range estimated to be sufficiently restrictive to reduce inflation,” St. Louis Federal Reserve President James Bullard said on Thursday.
On the same line were the latest comments from Minneapolis Federal Reserve Bank President Neel Kashkari. “with inflation still high but a lot of monetary policy tightening already in the pipeline, it's unclear how high the US central bank will need to raise its policy rate,” said Fed’s Kashkari.
Talking about Thursday’s data from the United States, Philadelphia Fed Manufacturing Index fell to -19.4 versus -6.2 market forecasts and -8.7 prior. Further, Housing Starts declined by 4.2% MoM in October following September's 1.3% contraction whereas Building Permits fell by 2.4%, compared to a 1.4% increase recorded in the previous month. Additionally, the Jobless Claims eased to 222K for the week ended on November 11 versus 225K expected and upwardly revised 226K prior.
It’s worth noting that the previously released United States Retail Sales and Producer Price Index (PPI) for October could be linked to the Fed officials’ hawkish comments as both of them offered a positive surprise.
Risk catalysts also underpinned US Dollar demand and lured XAUUSD bears
Market’s fears also highlighted the US Dollar’s safe-haven demand and weighed on the Gold price. Among the major ones was the fresh tension between Russia and Ukraine due to missile strikes on Poland, as well as the increasing Covid counts in China.
Recently, Ukrainian President, Volodymyr Zelenskyy rejected the blames for the missile strike that hit a Polish city and killed two people. The North Atlantic Treaty Organization (NATO) believes Russia was responsible even if the initial findings suggested that the missile likely coming from Ukraine’s defense.
On the other hand, China’s Coronavirus numbers reach more than a year’s high but the Dragon Nation eased a few of the virus-led activity controls. As a result, markets are worried about a fresh, as well as fierce, wave of the disease that drowned the global economy in the last two years. It’s worth noting that China is among the world’s top Gold consumers and hence and negatives from it should weigh on the XAUUSD prices.
Nothing major to challenge Gold price downside
Given the lack of major data/events, the Gold price could extend the latest weakness unless risk appetite improves notably, which is less likely. That said, the market’s recent risk-aversion could be witnessed via downbeat prints of Wall Street, despite the late rebound, as well as a recovery in the US Treasury yields.
Gold price technical analysis
A clear downside break of a two-week-old ascending trend line joins the RSI retreat from the overbought territory to keep Gold sellers hopeful of the precious metal’s further decline. Adding strength to the bearish bias could be the quote’s U-turn from the 61.8% Fibonacci retracement level of the June-September downturn.
That said, a 50% Fibonacci retracement level surrounding $1,746 and tops marked during September and October around $1,730 could restrict immediate downside.
However, a convergence of the 100-DMA and 38.2% Fibonacci retracement, around $1,715-13, could restrict the Gold price downside afterward.
Meanwhile, the 61.8% Fibonacci retracement and the aforementioned support line, now resistance, could restrict short-term recovery of the yellow metal around $1,779 and $1,786 in that order.
Above all, a horizontal area comprising the 200-DMA and multiple levels marked since May, near $1,805-08, appears a tough nut to crack for the Gold bulls.
Overall, the Gold price returns to the bear’s table after a fortnight holiday.
Gold price: Daily chart
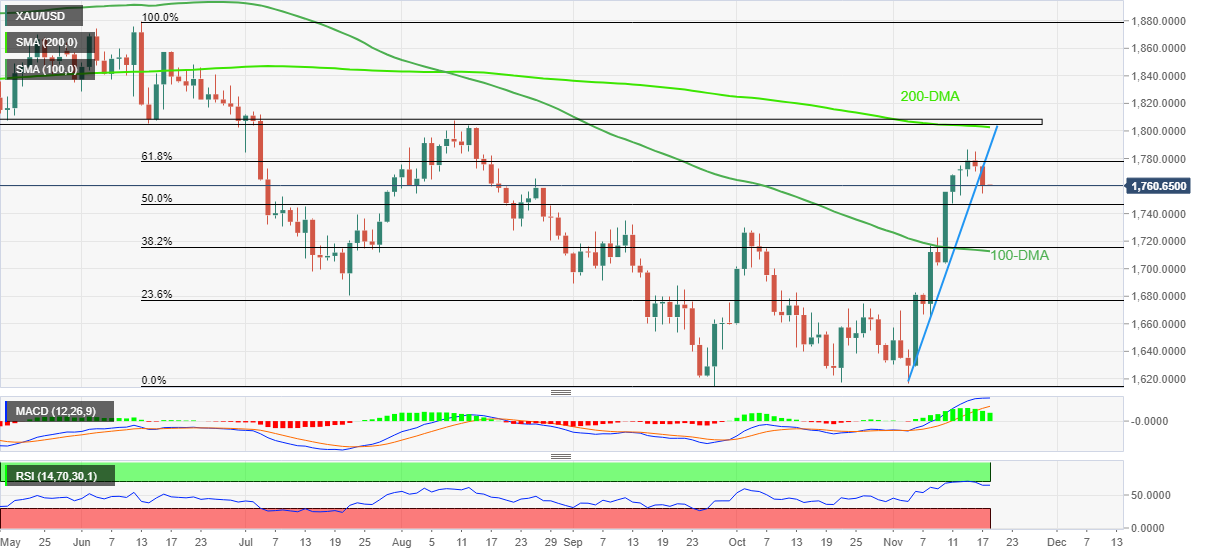
Trend: Further weakness expected
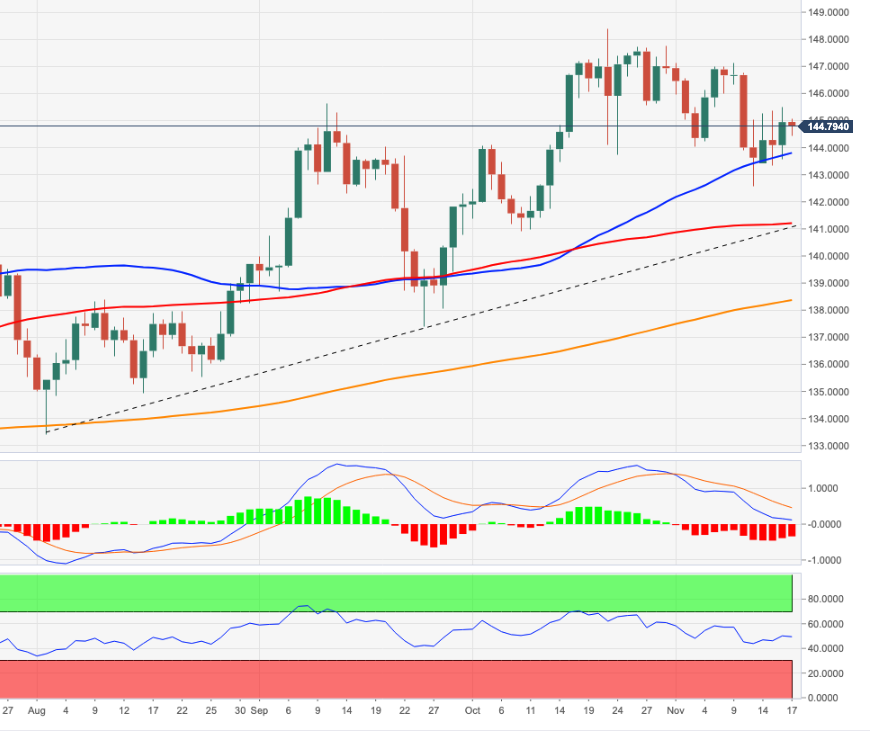
- The USDJPY tumbled below the 100-day EMA and recorded a three-month-low of around 137.65.
- The USDJPY has been building a bottom around eh 137.60-140.80 area for the last five consecutive days.
- The Relative Strength Index exiting from oversold conditions suggests an upward correction likely.
The USDJPY consolidated below the 100-day Exponential Moving Average (EMA), after dropping from YTD highs reached in October at 151.94. Still, since then, the US Dollar (USD) depreciated almost 8% against the Japanese Yen (JPY) in nearly a month. At the time of writing, the USDJPY is trading at 140.15, above its opening price by 0.49%, after hitting a daily low of 138.87.
USDJPY Price Analysis: Technical outlook
During the week, the USDJPY remains trapped in a narrow 137.50-140.80 range so far, after diving towards a fresh three-month low at around 137.65, reached on November 15, it formed a hammer. Since then, the USDJPY recorded two successful days without reaching lower lows below 138.70 and climbed towards the 100-day Exponential Moving Average (EMA) at 140.89. However, unless USD buyers reclaim the latter, the major bias would remain neutral to downwards.
That said, the USDJPY's first support would be the November 16 daily low at 138.72. A breach of the latter will expose key support levels like the weekly low at 137.65. Once cleared, the next support would be a three-month-old upslope support trendline that passes around 137.48, immediately followed by the 200-day Exponential Moving Average (EMA).
On the other hand, the USDJPY's first resistance would be the 100-day EMA at 140.89. A break above will expose the November 11 daily high at 142.48, followed by the 50-day EMA at 145.13.
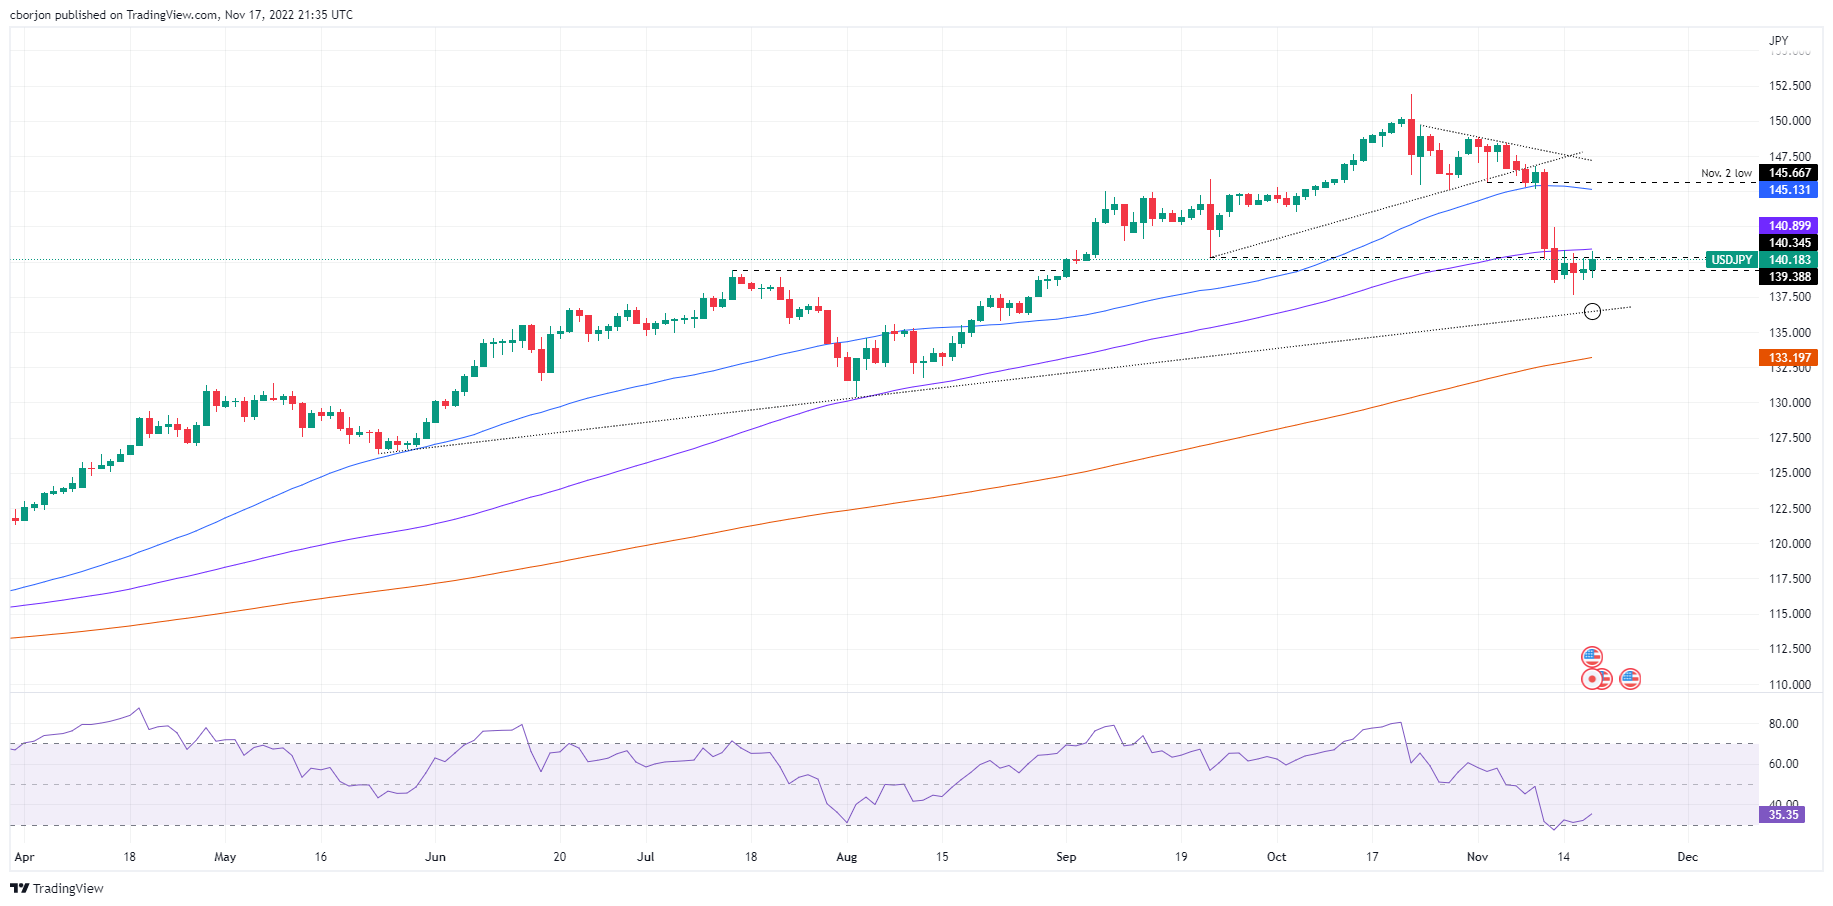
USDJPY Key Technical Levels
A Reuters poll sees the Reserve Bank of New Zealand hiking by 75Bps next week.
Stubbornly high inflation expectations reinforced the case for more aggressive rate hikes from the Reserve Bank of New Zealand.
The latest central bank survey showed that inflation expectations moved higher across the curve and the market is pricing higher rates, expecting a larger increment of 75 basis points next week after delivering a half-percentage point increase in October.
Meanwhile, RBNZ officials have been outspoken of late, explaining that high inflation and a tight labor market in the country call for demand to be cooled, though they flagged downside risks to the global economy.
NZDUSD update
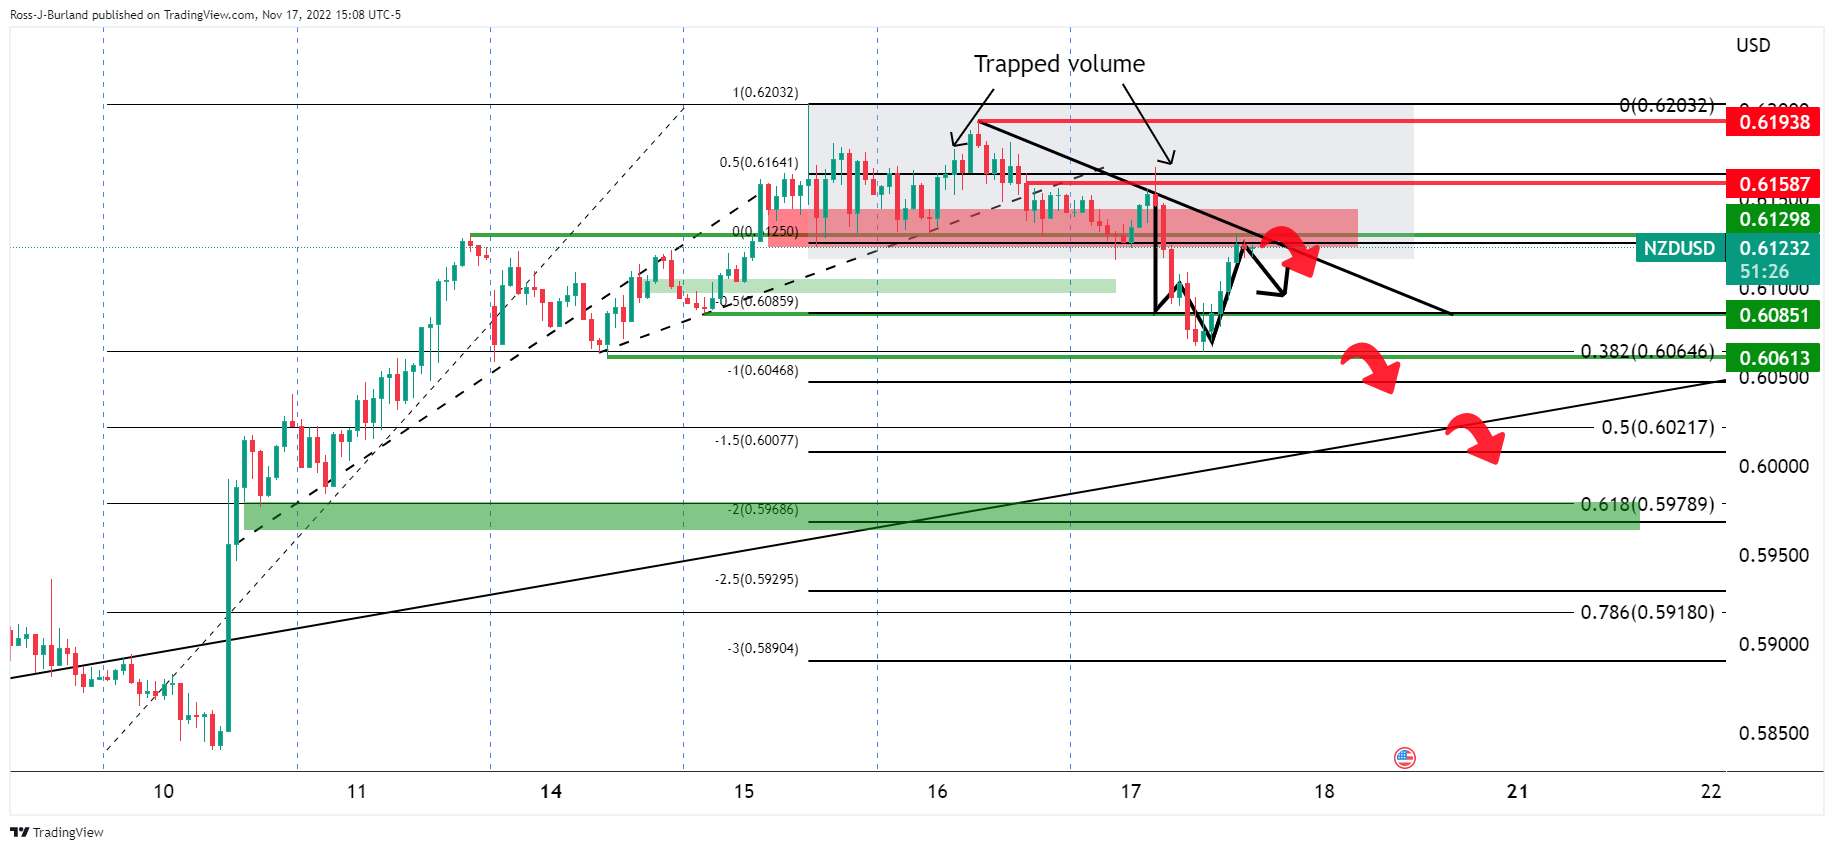
- With the price on the front side of the bearish trendline.
- W-formation is a reversion pattern that would be expected to be a drag on the recent rally.
- A retest of the lows could see a push below and on to the 61.8% golden ratio that aligns with prior support in a 200% measured expansion of the trapped volume up top.
- NZDUSD bears could be about to sink in their teeth again.
- Central bank sentiment is the key driving force as the US Dollar attempts to correct.
NZDUSD has corrected the session's sell-off. The bird rallied from a low of 0.6064 and is testing 0.6120 towards the close on Wall Street. However, longs are still trapped up high near the pair's strongest levels in nearly three months.
The day was mixed on Thursday and two-way business made for a range of between 0.6064 and 0.6167. The US Dollar was supported by stronger-than-expected US Retail Sales data on Wednesday and hawkish remarks from Federal Reserve speakers. However, sentiment and Fed rhetoric have been mixed as data continues to conflict from one day to the next, clouding the path for interest rates.
Tuesday's producer price inflation data was below expectations and this mirrored last week's cooler-than-expected consumer price inflation, signaling that it was not a one-off. This in turn has been fueling hopes that the US Federal Reserve can slow aggressive rate hikes that had sent the US Dollar higher. However, Fed Governor Christopher Waller came to the bull's rescue again when he said the Fed will still need increases into next year although. St Louis Fed President James Bullard spoke at the start of the New York day and said rates should lift to at least 5%-5.25% which is 25bp higher than he previously stated. He also indicated that rates will need to be between 5 to 7% to be sufficiently restrictive to curb inflation.
The US dollar index, DXY, and US yields were firmer on the hawkish sentiment. DXY was recently up 0.4% sitting at 106.70 and between the day's range of 106.1 and 107.24. The 2-year yield sat comfortably around 4.45% and 2% higher on the day. Nev3ertheless, there was a late session dip in both US yields and the greenback which made way for a recovery in the Kiwi.
RBNZ to hike 75bps
Domestically, stubbornly high inflation expectations reinforced the case for more aggressive rate hikes from the Reserve Bank of New Zealand. The latest central bank survey showed that inflation expectations moved higher across the curve and the market is pricing higher rates, expecting a larger increment of 75 basis points next week after delivering a half-percentage point increase in October. RBNZ officials have been outspoken of late, explaining that high inflation and a tight labor market in the country call for demand to be cooled, though they flagged downside risks to the global economy.
NZDUSD technical analysis
As per the prior sessions' bearish thesis, NZDUSD bears eye a break below 0.6130, the pair dropped to target:
Prior analysis:
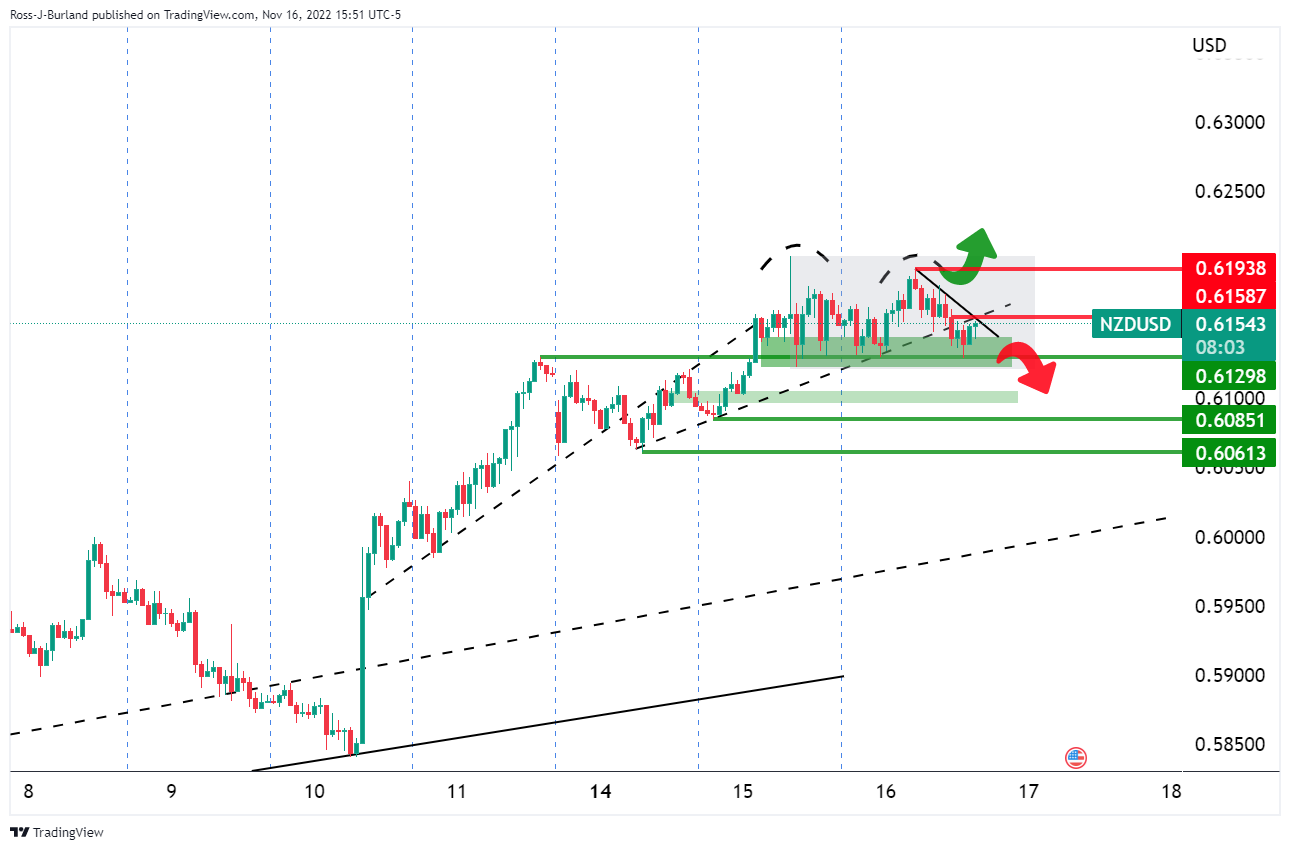
The price was topping out on the time frames as per the hourly chart above and the 4-hour chart below:
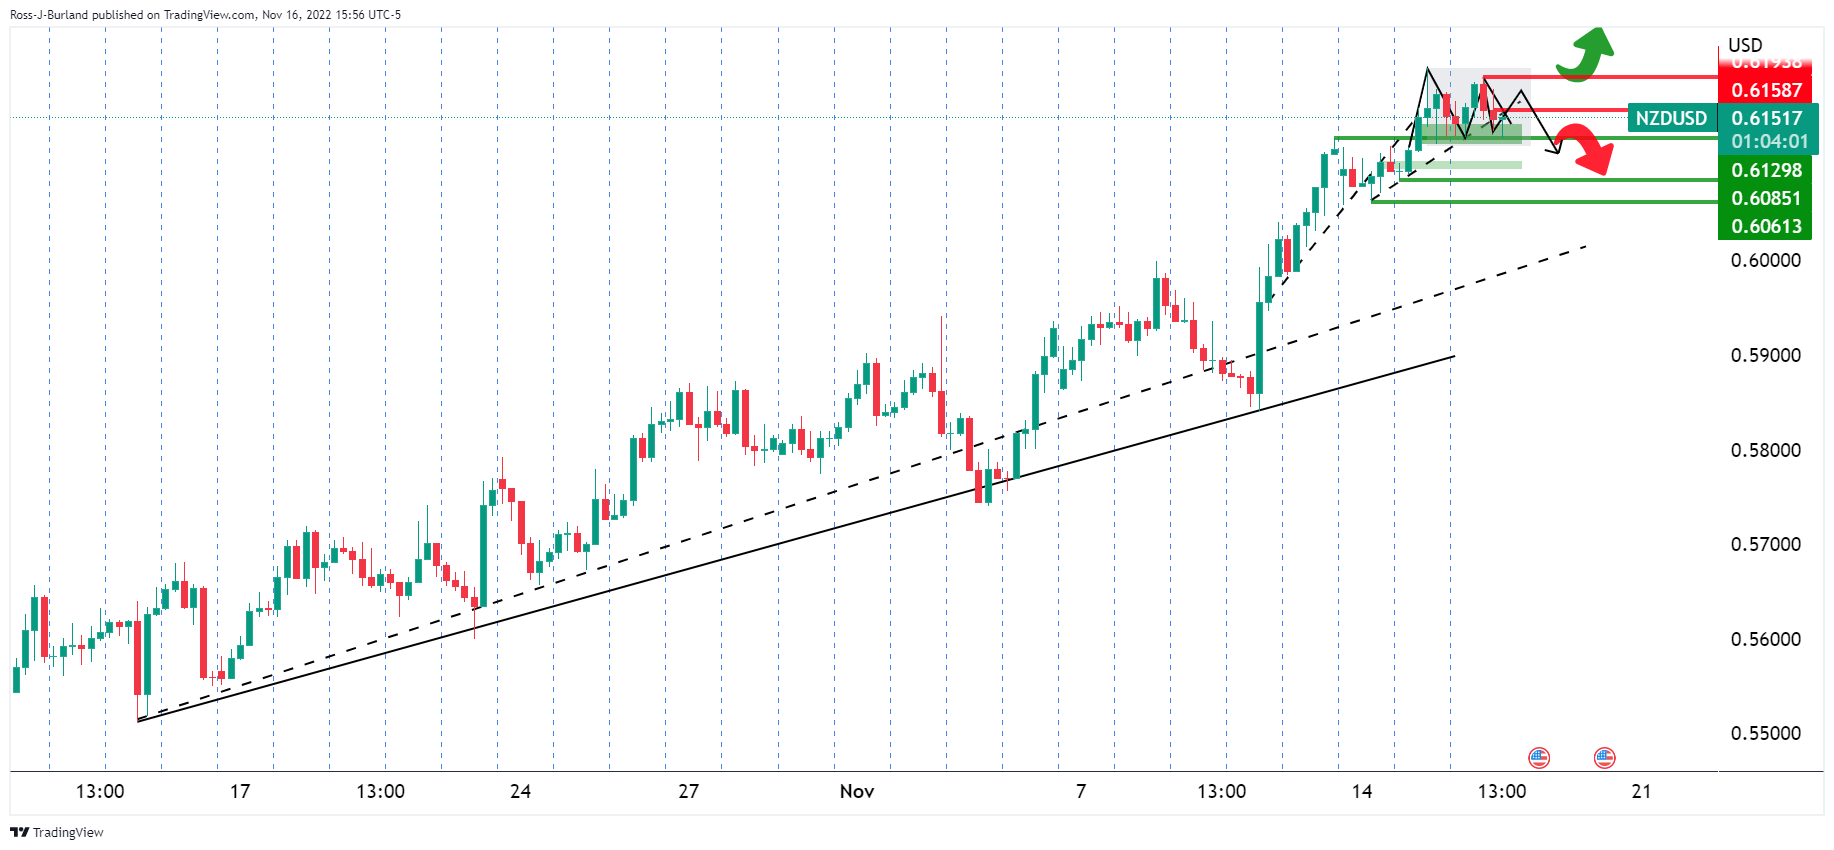
On the 4-hour chart, however, there were prospects of a triple-top scenario as illustrated above.
NZDUSD update
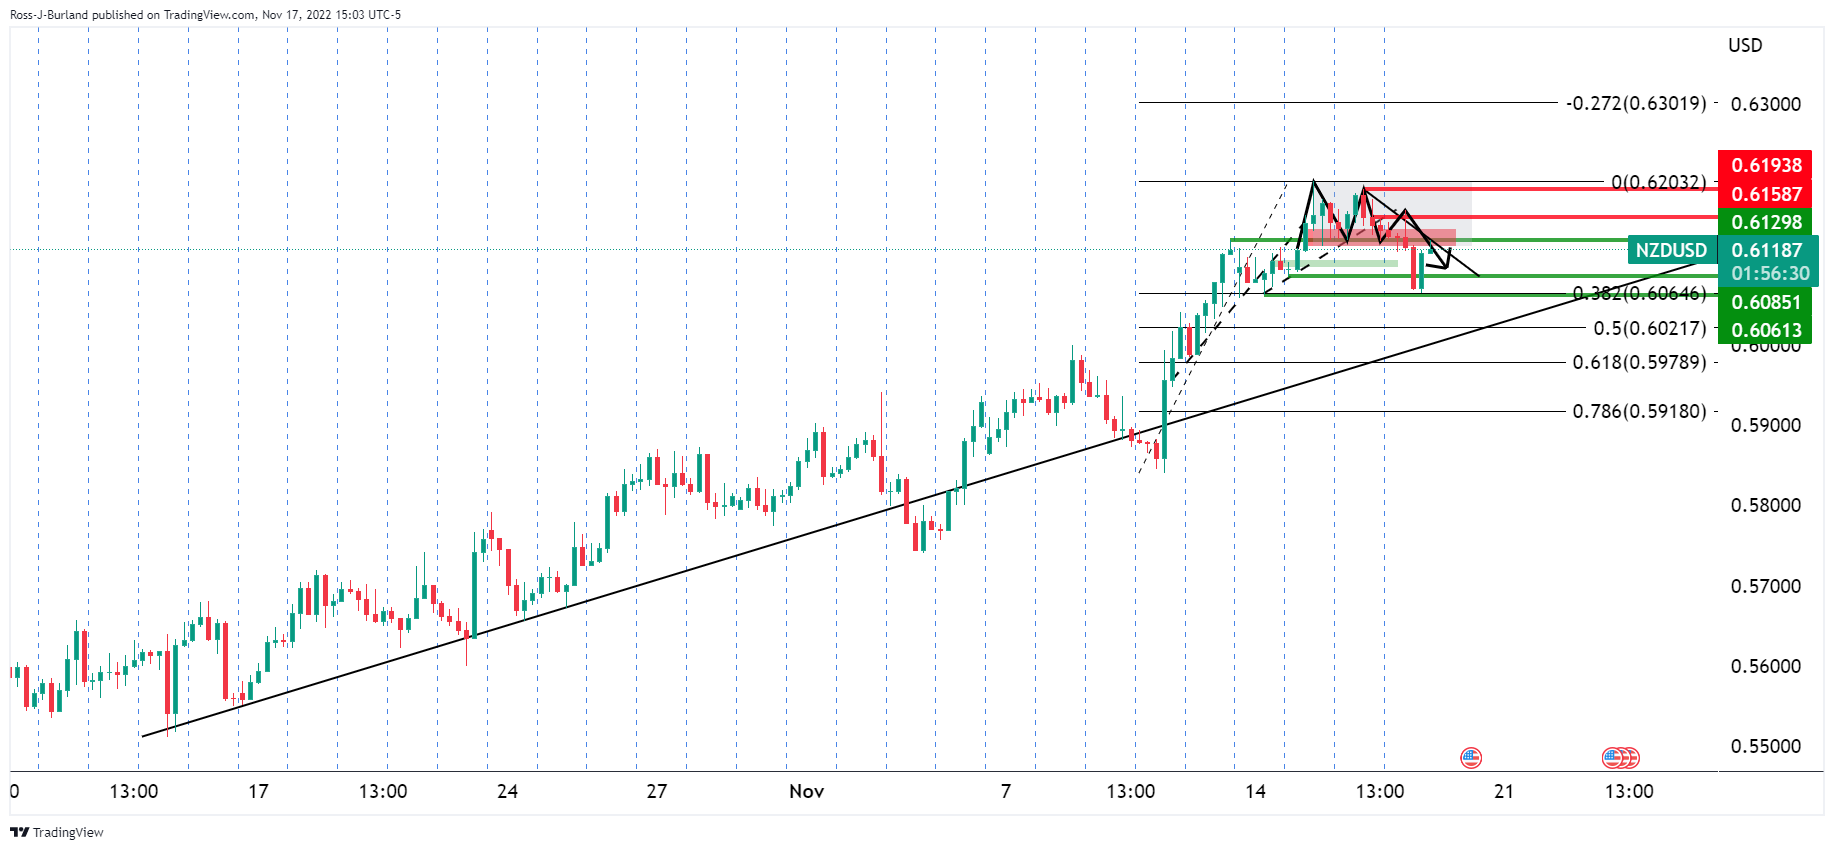
H4 H&S played out.
As illustrated, the H&S played out but the daily 38.2% Fibonacci has supported a bounce back into the breakout territory. However, this might just give the trapped longs up top a lifeline and their subsequent breakeven stop losses could eventuate a move to the downside again when coupled with fresh sellers taking advantage of the discount:
With the price on the front side of the bearish trendline, the W-formation is a reversion pattern that would be expected to be a drag on the recent rally. A retest of the lows could see a push below and on to the 61.8% golden ratio that aligns with prior support in a 200% measured expansion of the trapped volume up top.
What you need to take care of on Friday, November 18:
The market mood remained sour, which help the US Dollar to recover some of the ground lost earlier in the week. Nevertheless, the greenback posted uneven and modest advances across the FX board, as speculation the US Federal Reserve will soon pivot weighed more.
Generally speaking, the dismal sentiment could be attributed to renewed concerns related to the Ukraine-Russia war and tensions with Western nations following the latest developments in Polonia. Ukrainian President, Volodymyr Zelenskyy, said that Ukraine was not to blame for the missile strike that hit a Polish city, killing two people. NATO believes Russia was responsible, despite the missile likely coming from Ukraine’s defence.
Meanwhile, in China, the coronavirus outbreak worsens. The country reports increased cases on a daily basis, although at the same time, the government eased some restrictions for close contacts and travellers. Nevertheless, potential supply-chain issues are back on the table, with all that that means for the global economy.
Stocks in Asia and Europe closed in the red, triggering substantial losses on Wall Street. However, US indexes bounced back ahead of the close and finished the day little changed.
Further support for the greenback came from government bond yields. At the end of the day, the 10-year Treasury note offers 3.76%, while the 2-year one pays 4.46%. The advance is more notorious at the shorter end of the curve, a warning for those betting against the American currency.
US House Speaker Nancy Pelosi announced Thursday she would not seek reelection to her congressional leadership role as the top House Democrat after midterm elections showed Republicans seized control of the House.
EURUSD finished the day in the 1.0360 price zone, recovering again from near the 1.0300 threshold, a sign that bulls are not giving up. EU inflation was downwardly revised from 10.7% to 10.6% in October, still at record highs.
The UK government presented a fiscal plan after the obstreperous failure of former Prime Minister Liz Truss’s mini-budget. Finance Minister Jeremy Hunt outlined spending cuts and tax hikes worth £55 billion. “We need fiscal and monetary policy to work together,” he said. “That means the government and the Bank working in lockstep. It means, in particular, giving the world confidence in our ability to pay our debts.” GBPUSD sunk to 1.1762 but recovered roughly 100 pips ahead of the close.
The AUDUSD pair trades around 0.6690, down for the day, while USDCAD hovers around 1.3300. A steep decline in crude oil prices partially weighed on the Loonie, as WTI trades at $82.20 a barrel.
Gold extended its weekly decline and settled at $1,760 a troy ounce.
The crypto scandal related to the FTX collapse keeps spreading like wildfire among exchanges. The market has just seen the tip of the iceberg, although the market remains pretty stable after the initial impact.
Like this article? Help us with some feedback by answering this survey:
Reuters reported that ''Minneapolis Federal Reserve Bank President Neel Kashkari on Thursday said that with inflation still high but a lot of monetary policy tightening already in the pipeline, it's unclear how high the US central bank will need to raise its policy rate.''
''It is the Fed's job to bring inflation down by restraining demand through higher borrowing costs, he told the Minnesota Chamber of Commerce in an event webcast by the regional Fed bank.''
"It's an open question of how far we are going to have to go with interest rates to bring that demand down in the balance," he said.
US Dollar update
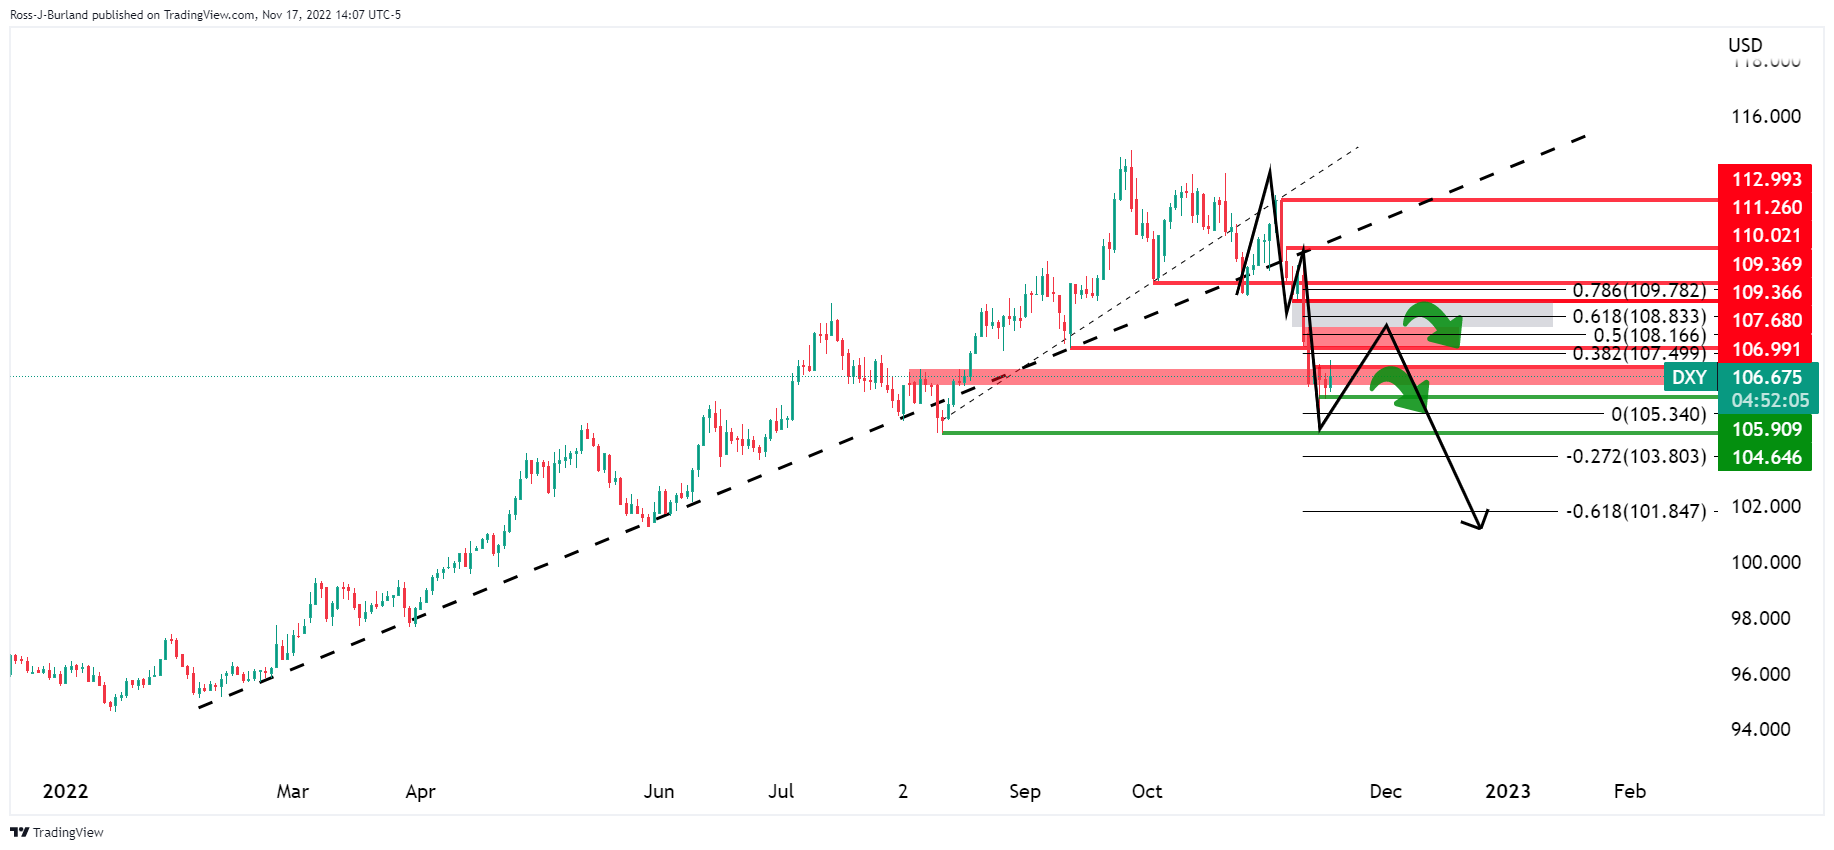
The bulls are moving in on the back side of the trend, but they need to get above 107.00 to target the 109.00s or face prospects of further supply and a breakout below 105.90 that will look to test the 104.64 August lows.
- US Dollar got underpinned by Federal Reserve policymakers, hawkish speaking.
- US economic data was mixed as the housing market plunged while unemployment claims decelerated.
- Swiss National Bank Maechler: “To continue rate hikes if inflation projections remain above target.”
- USDCHF remains bearish-biased, though a break of 0.9600 would exacerbate a rally to the 200-DMA.
The USDCHF extended its weekly rally, to four consecutive days, after registering a new seven-month-old low around 0.9356 on Monday. However, hawkish commentary by US Federal Reserve (Fed) speakers shifted sentiment sour for the benefit of the US Dollar (USD). Hence, the USDCHF is trading at 0.9518, above its opening price by 0.86%.
Fundamentally speaking, nothing has changed. The Federal Reserve would continue on its upward trajectory, hiking rates, after the St. Louis Fed President James Bullard said that rates are not “sufficiently restrictive,” as he foresees the Federal Funds rate (FFR) to peak at around the 5% to 7% range. On Wednesday, the San Francisco Fed President Mary Daly said that pausing hikes “was off the table.”
Data-wise, the housing market continued to weaken, even though speculations that a Fed pause might occur increased due to US equities pairing some of its year losses. Housing Starts plunged 4.2% in October, on a monthly pace, below September’s 1.3% contraction. Building Permits followed suit, dropping 2.4%, below 1.4$ September’s increase.
Of late, US Initial Jobless Claims for the last week decelerated to 222K, beneath estimates of 225K. At the same time, Continuing claims advanced 13K to 1.51 million, flashing signs that the labor market is easing.
Aside from this, the Switzerland National Bank (SNB) Governor, Andrea Maechler, is crossing newswires. She said that inflation in Switzerland is no longer “shock driven” and added that the SNB would continue to lift rates if inflation projections remained above the central bank’s target.
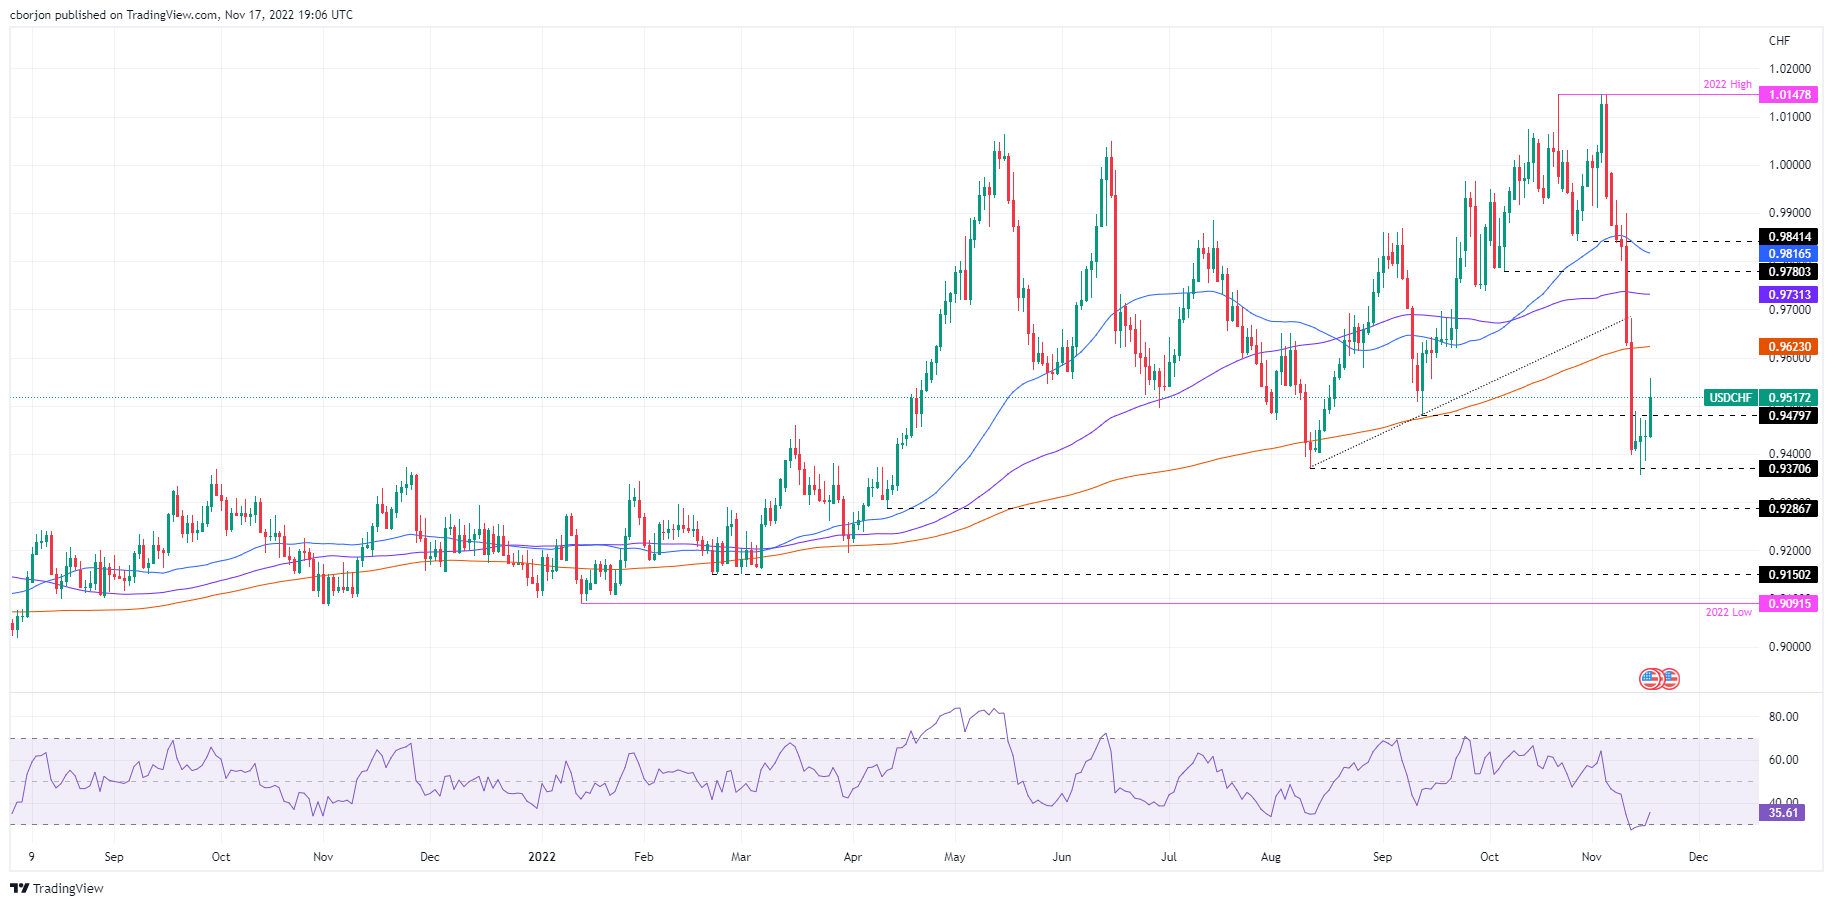
USDCHF Price Analysis: Technical outlook
All that said, the USDCHF recovered from last week’s losses and is up in the week 1.13%. Nevertheless, the USDCHF is bearish-biased once it cleared the 200-day Exponential Moving Average (EMA) at 0.9623. Still, it could be subject to a correction, as the Relative Strength Index (RSI) pulled out from oversold conditions, exacerbating a rally above 0.9500.
That said, the USDCHF’s first resistance would be 0.9600, ahead of the 200-day EMA at 0.9623. On the flip side, USDCHF key supports are the 0.9500 psychological figure, followed by the September 13 daily low at 0.9479, ahead of the August 11 swing low at 0.9370.
The Swiss National Bank will continue to raise rates if see inflation projections above target, SNB governing board member Andrea Maechler said on Thursday.
The battle against inflation has not been won despite a dip in Swiss inflation to 3.0% in October from 3.3% in September, Maechler told Swiss business newspaper L'Agefi said last week.
In its latest inflation forecast, the SNB expects inflation to decline to 2% by the third quarter of 2023, the top end of its price stability goal which it defines as inflation of 0-2%.
Key notes
- Inflation started with shocks but it's no longer shock-driven and has the risk of being more persistent.
- Will continue to raise rates if see inflation projections above target.
- Important we maintain our focus on achieving price stability.
- We are willing to intervene in the FX market by buying or selling as necessary, but not yet ready to reduce our balance sheet.
USDCHF update
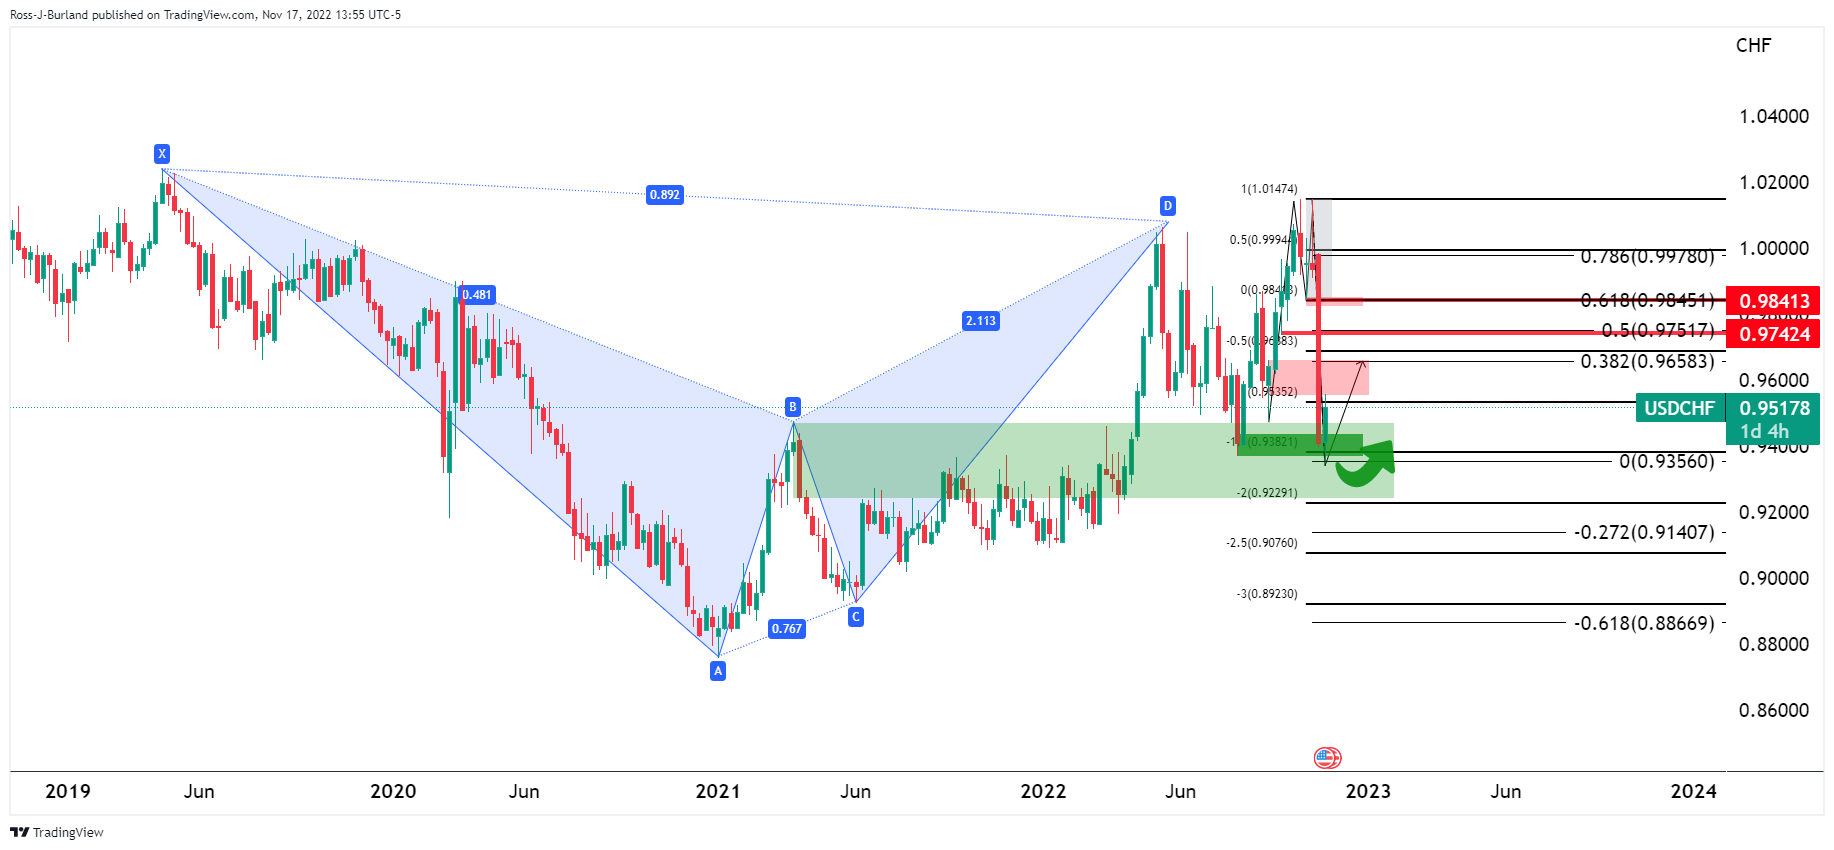
The price is correcting the prior bearish impulse after a 150% expansion of the prior consolidative tops from the harmonic patterns neckline support area on the weekly chart.
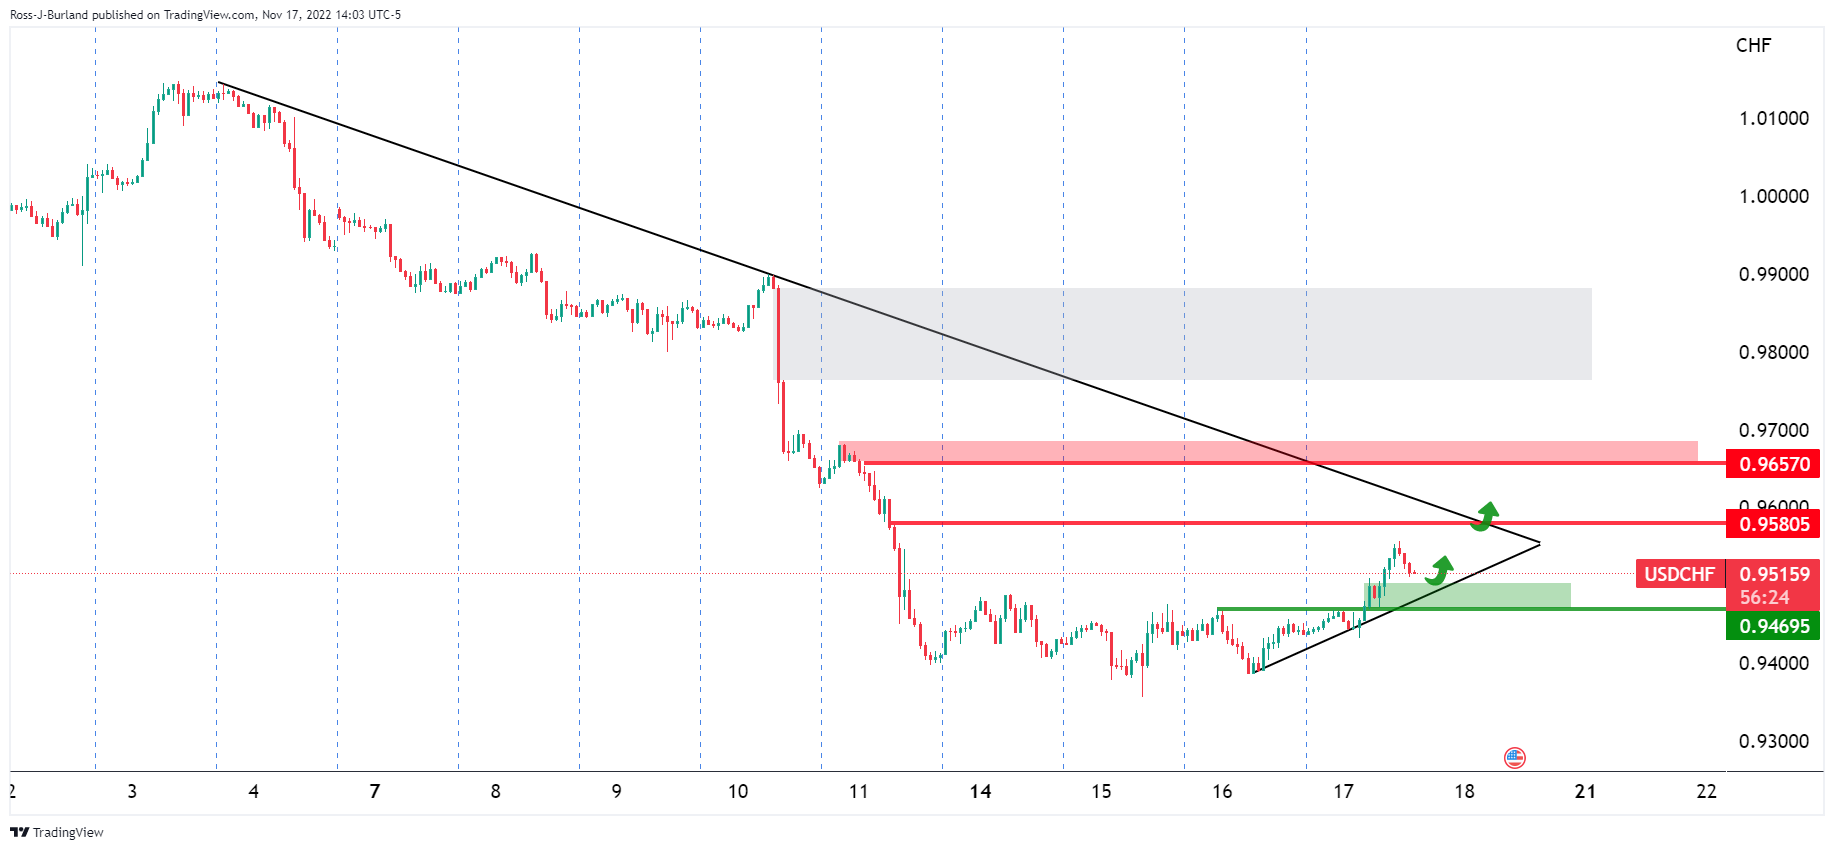
On the hourly chart, the bulls have broken structure and eye a correction to test the trendline resistance with eyes on 0.9580, 0.9650 / 0.9700.
- WTI bulls are moving in from the lows and eye the 38.2% ratio.
- Bears look for a discount to run deeper towards $78.00.
As per the prior analysis, WTI bears are pressuring the bulls below critical resistance, break of $84.00 on the cards, and the price of oil dropped on Thursday into low-hanging fruit below 84.00 following a build-up of longs.
WTI prior analysis
The price was shown to be on the back side of the monthly trendline and was being rejected on a restest:
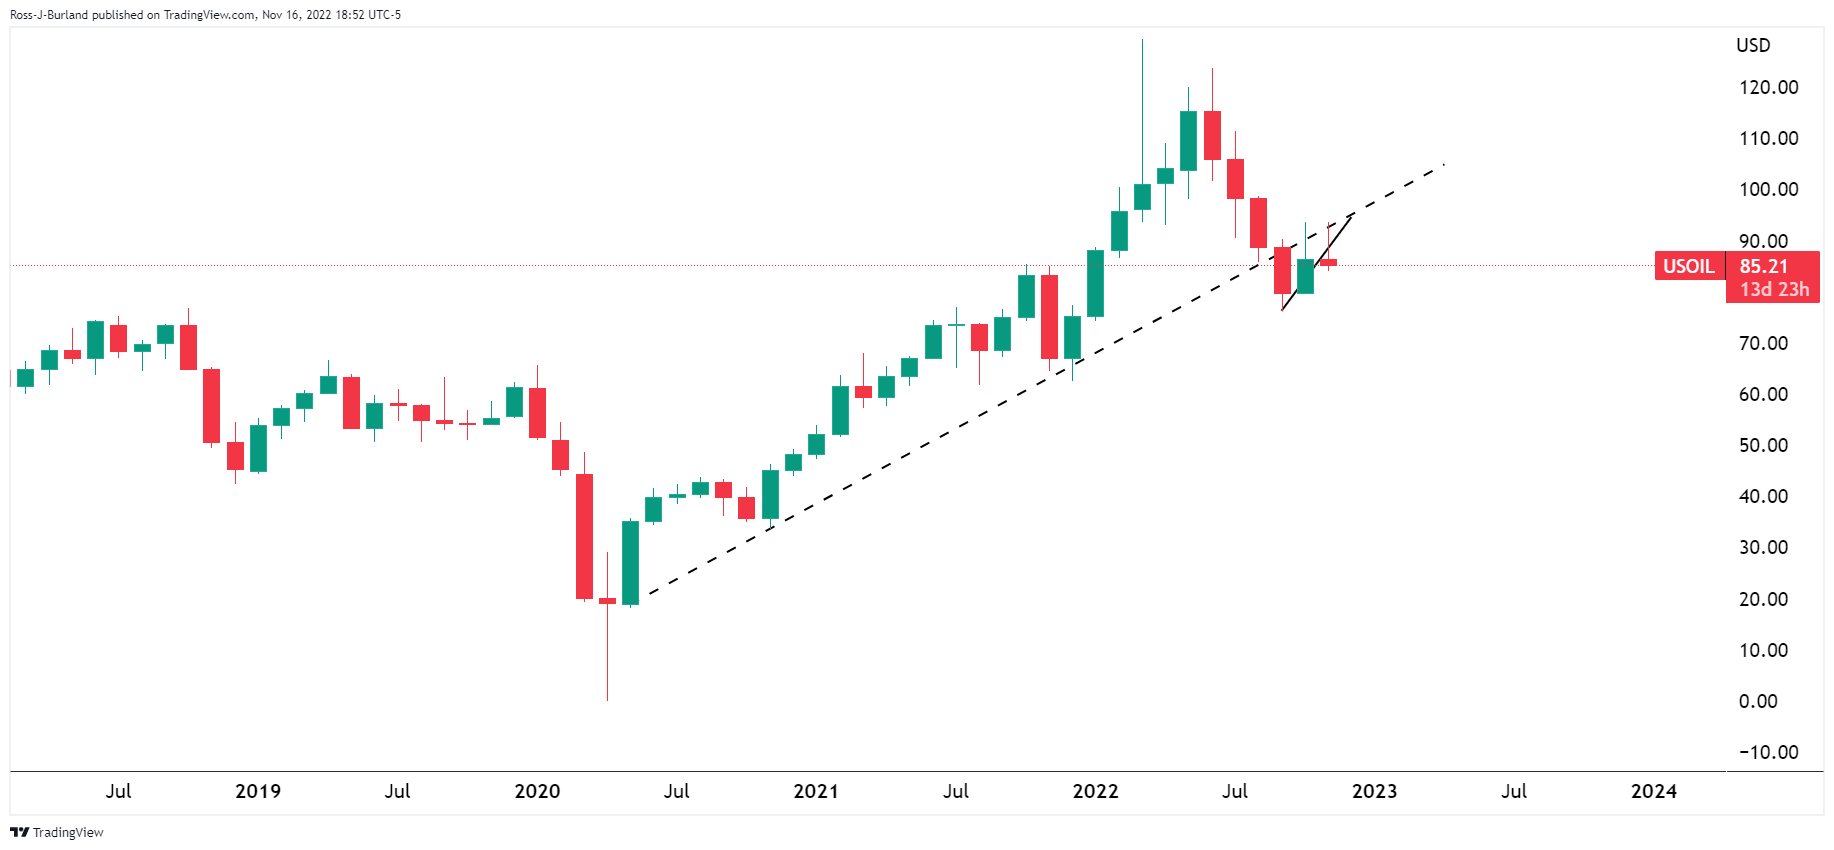
The price was looking to be on the verge of completing an M-formation below the locked-in highs below horizontal resistance:
A bearish H&S pattern had emerged on the daily chart with the right-hand shoulder on the backside of the micro trendline:
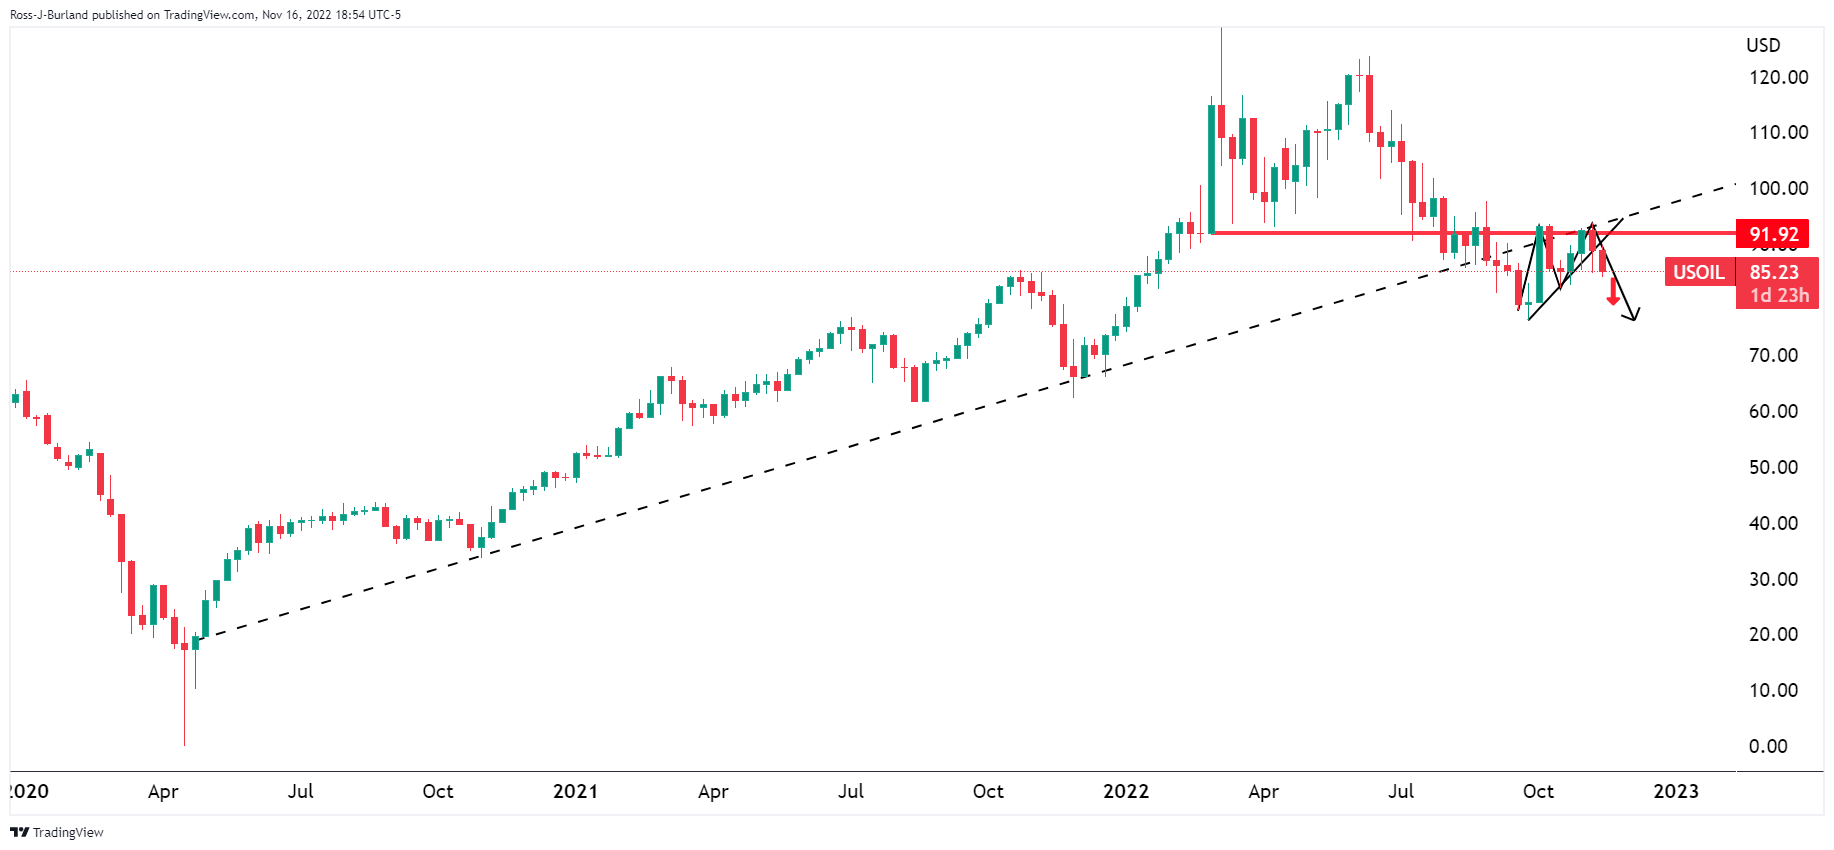
Zoomed in:
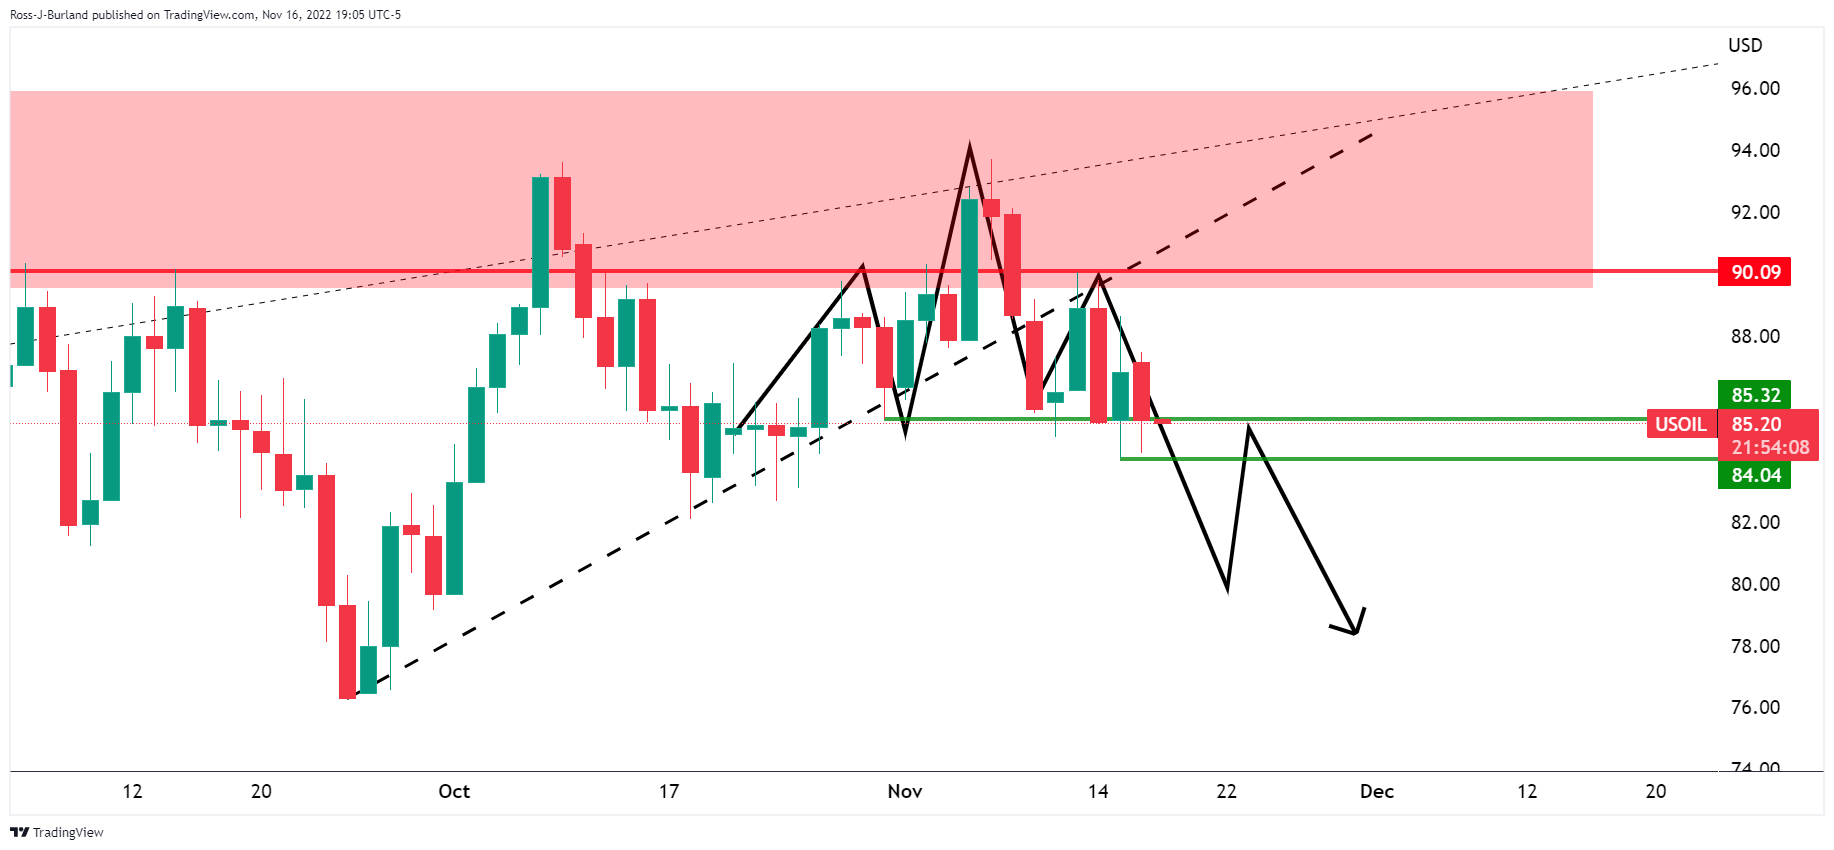
A move below $84 the figure was required to shift the bias fully:
WTI update
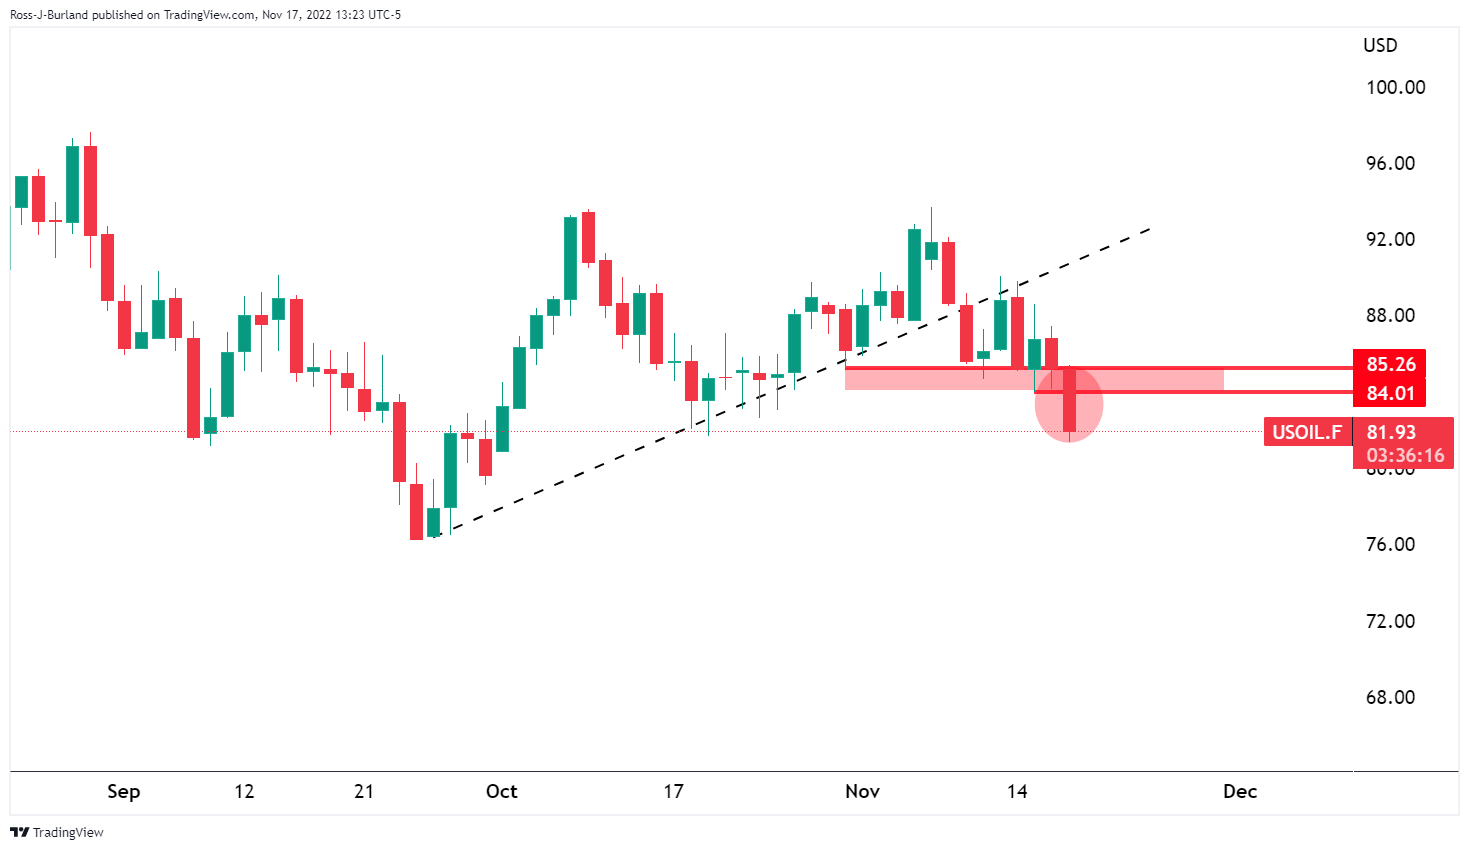
As illustrated, the price has indeed followed the projected trajectory on Thursday. Bears can now target lower into the origin of the prior bullish trend:
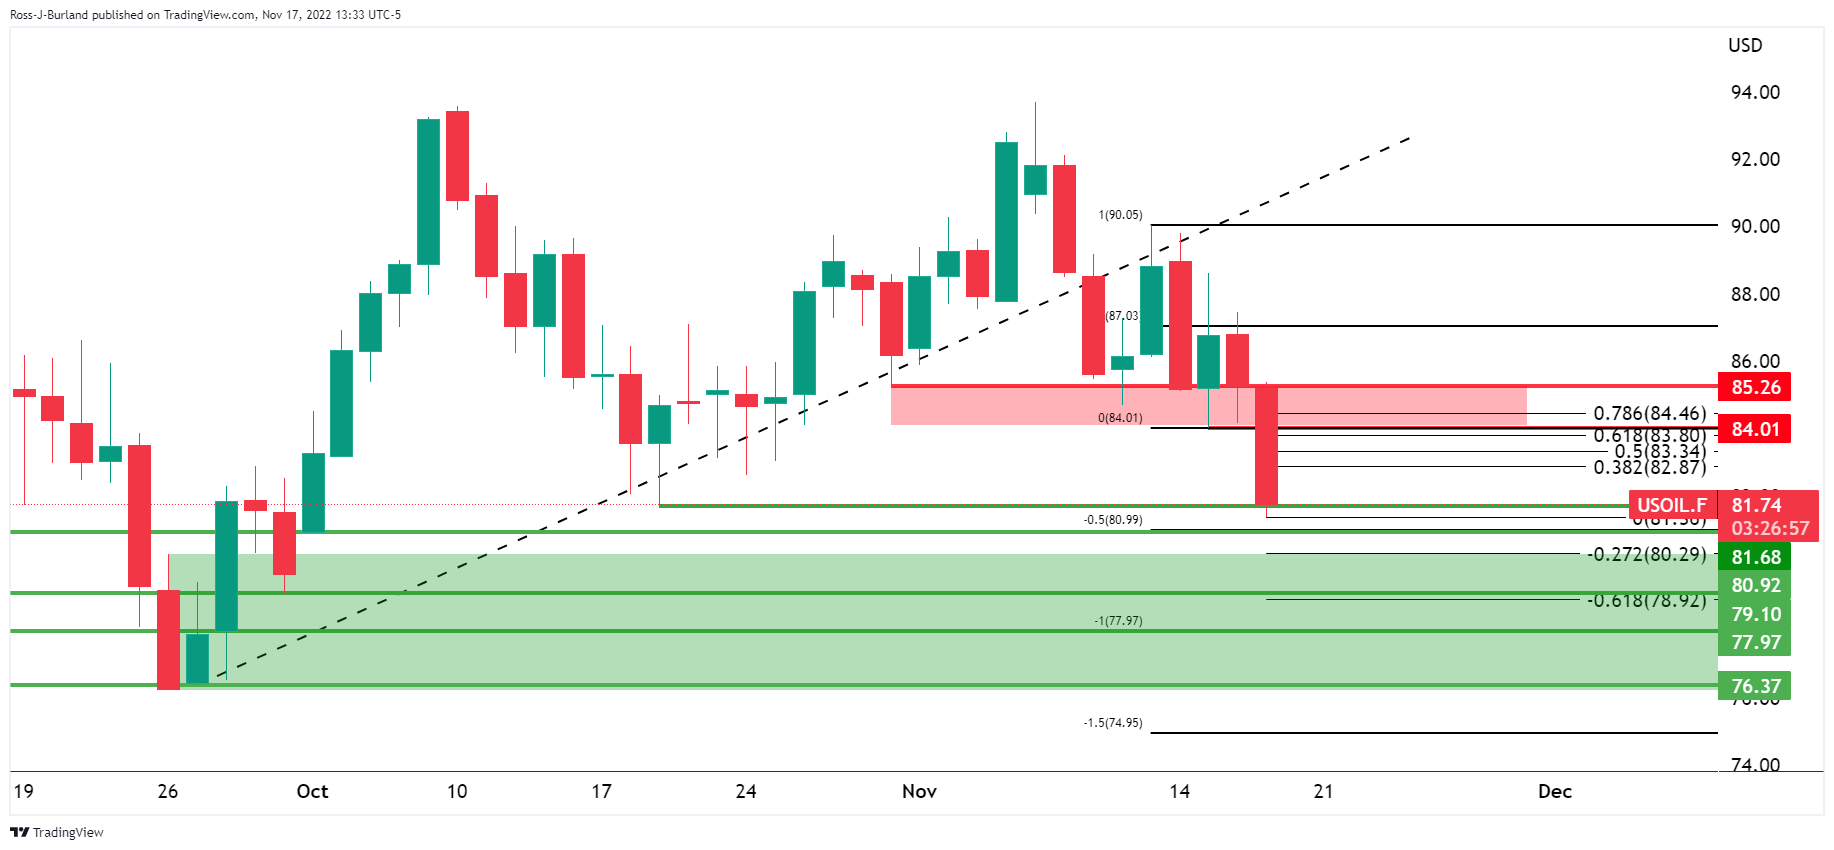
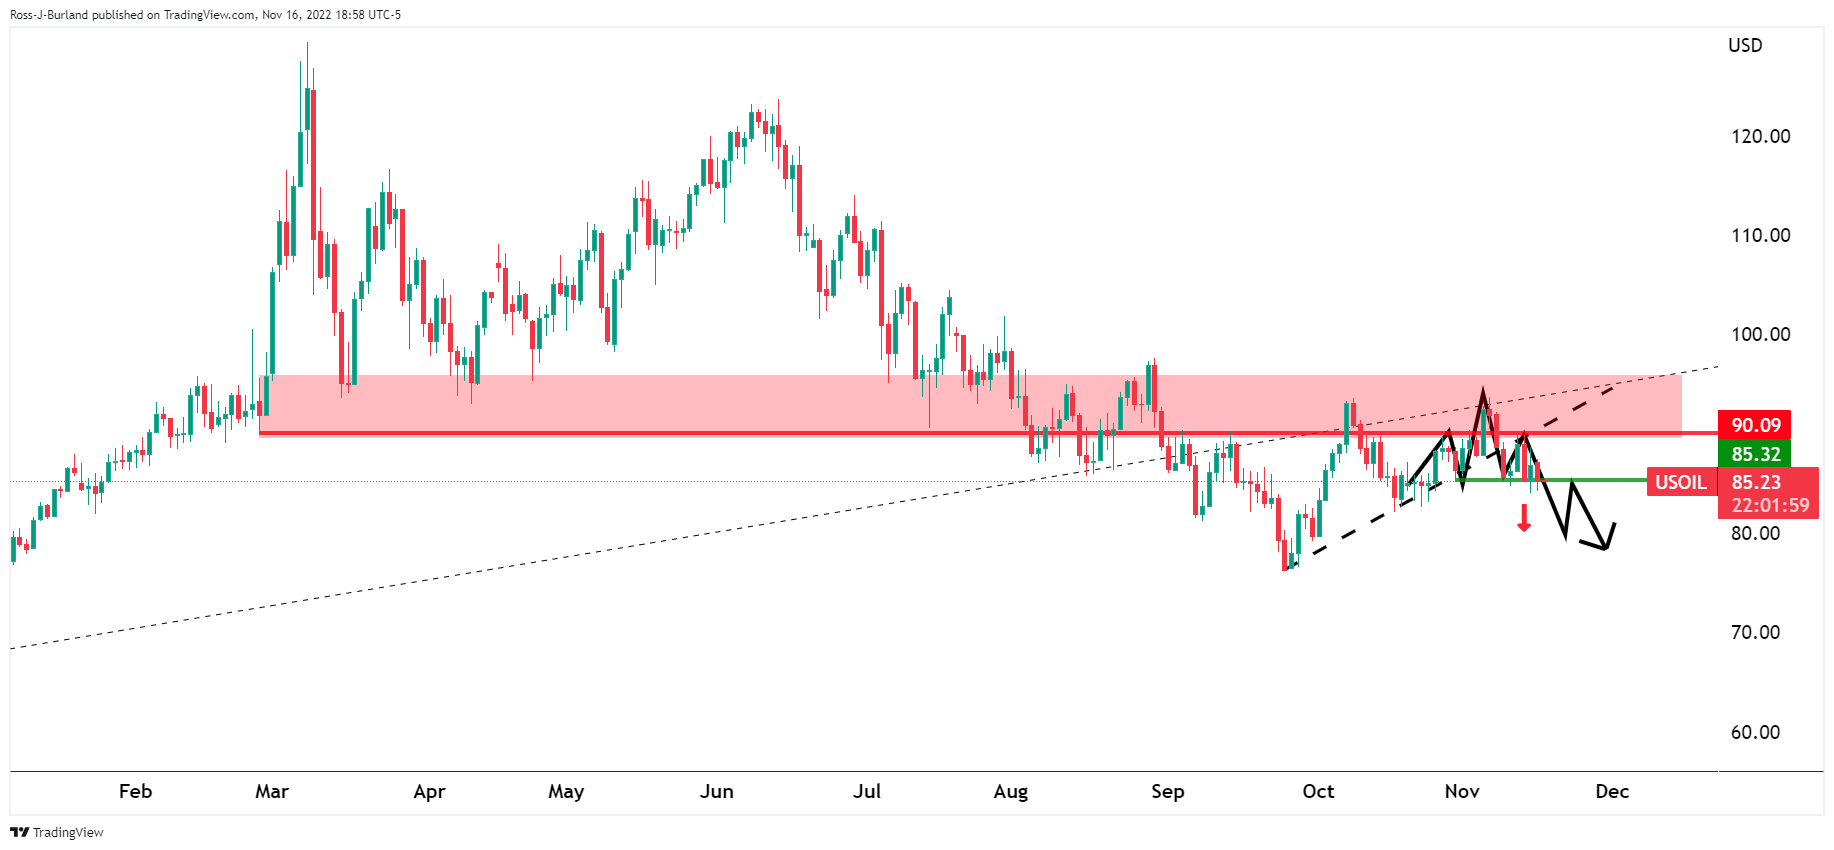
WTI H1 chart
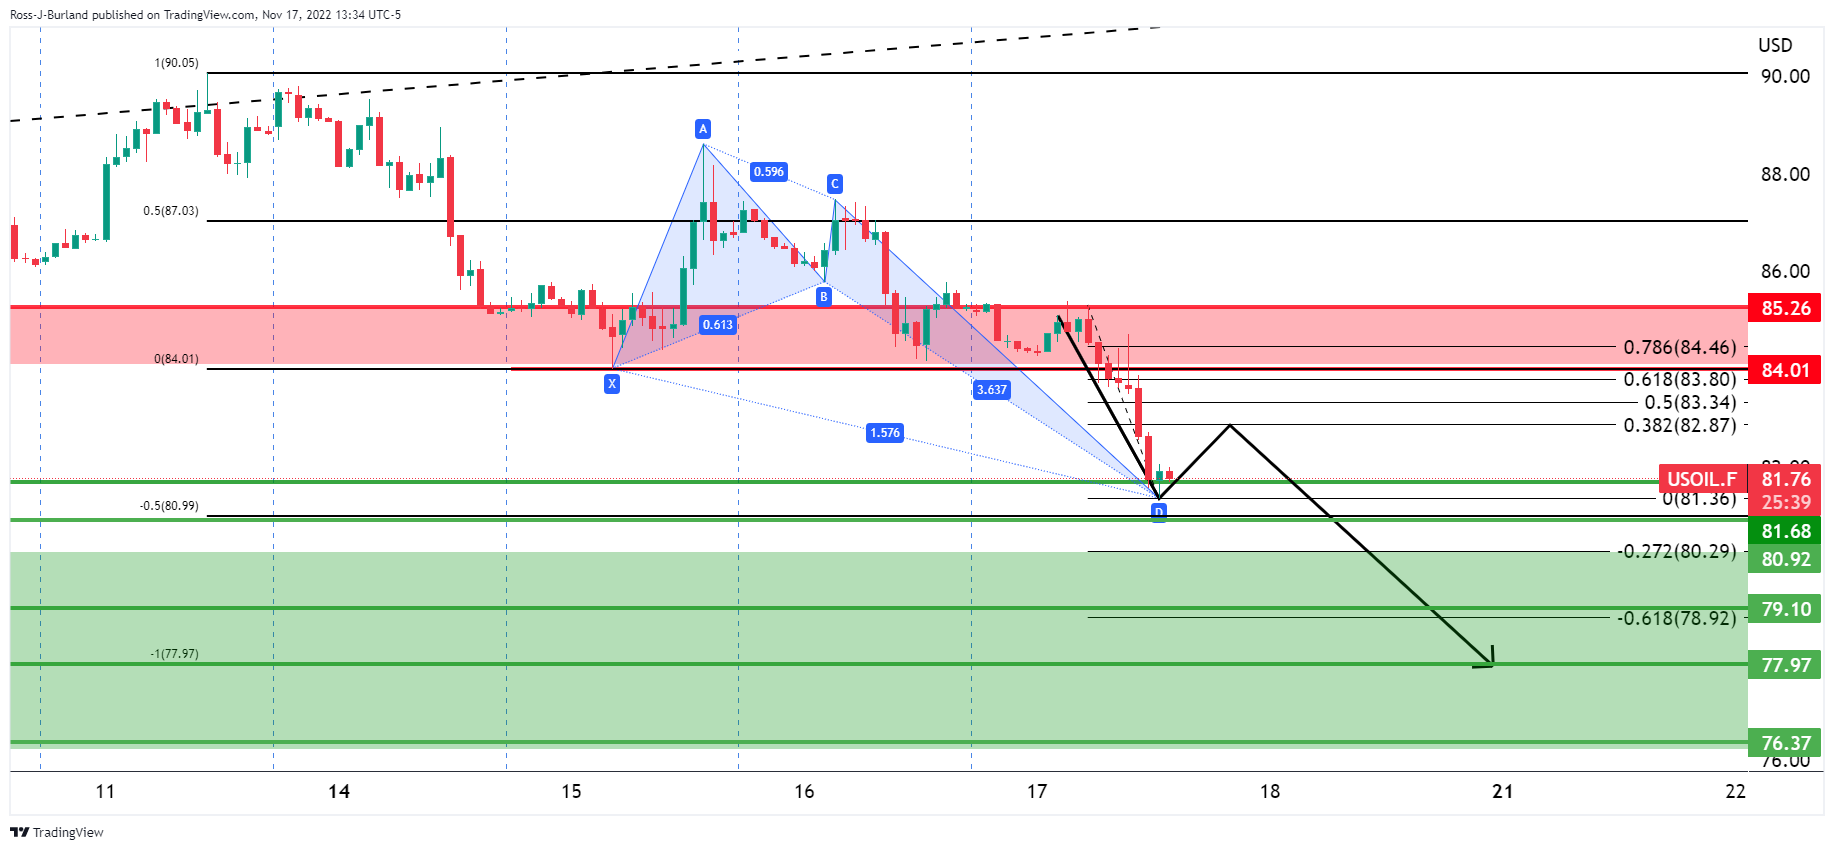
From an hourly perspective, drawing the expansion of the prior consolidative range, a full 100% measured move aims for a test of $78.00. However, a correction could be in order given the Grab harmonic pattern. A 38.2% Fibonacci retracement of the bearish impulse comes in near $82.90.
- Fed speakers hawkish commentary shifted sentiment sour and bolstered the US Dollar.
- Risk aversion weighed on risk-perceived currencies in the FX space, like the Australian Dollar.
- US housing data disappoints, contrary to unemployment claims, which dropped below estimates, suggesting the tight labor market.
- AUDUSD Price Analysis: Remains neutral-to-upward biased, but the pullback could extend towards 0.6500 before resuming the uptrend.
The Australian Dollar (AUD) plunged against the US Dollar (USD), blamed on Federal Reserve (Fed) policymakers’ hawkish commentary, which turned traders’ sentiment sour, as shown by US equities falling. The AUDUSD is trading at 0.6688, below its opening price by almost 1%, after hitting a daily high of 0.6751.
Federal Reserve’s hawkish commentary boosted the US Dollar
On Thursday, the St. Louis Fed President James Bullard commented that monetary policy is not “sufficiently restrictive,” adding that rates need to rise higher, within the 5% to 7% area, which spooked investors. Of late, the Cleveland Fed President Loretta Mester echoed his comments, saying that inflation is too high.
Meanwhile, a tranche of mixed economic data from the United States (US) was revealed on Thursday. Housing Starts for October shrank more than September’s 1.3% contraction, and Building Permits plummeted 2.4% MoM in October, against a 1.4% expansion in September
Regarding the labor market, US Initial Jobless Claims for the week ended on November 12 fell by 222K, below the 225K expected and lower than the previous week’s 226K. Contrarily Continuing Claims rose 13K, to 1.51 million, in the week ended on November 5, increasing for the fifth straight week, an uptrend signing that Americans are out of work for longer.
Elsewhere, the US Dollar Index, a gauge of the buck’s value against a basket of six currencies, remains above its opening price by 0.58%, at 106.902 underpinned by high US Treasury yields, with the US 10-year note rate raising nine bps, at 3.781%, after hitting a weekly low of 3.671%.
Australia’s employment data warrants further RBA action
Earlier in the Asian session, Australia’s employment figures beat estimations. The Employment Change indicator rose by 32.2K, above estimates of 15K, while the unemployment rate fell to 3.4%, below forecasts of 3.5%. According to TD Securities analysts: “The stronger-than-expected jobs report should also dampen hopes for any imminent pause from the Reserve Bank of Australia (RBA) after RBA Deputy Governor’s Bullock commented that the peak of the inflation cycle is near. As such, we continue to look for the Bank to proceed with 25bps hikes till Q1 next year.”
AUDUSD Price Analysis: Technical outlook
Given the backdrop, the AUDUSD plunged below 0.6700, extending its losses beyond the 100-day Exponential Moving Average (EMA) at 0.6694. although the inverted head-and-shoulders pattern is intact, the Relative Strength Index (RSI) peaking around 66, and with its slope aiming lower, suggests buying pressure is fading. If sellers clear the neckline at around the confluence of the 50-day EMA at 0.6495, it would invalidate the pattern; otherwise, the chart pattern remains in play.
AUDUSD key support levels lie at the weekly low at 0.6633, followed by the 0.6600 psychological figure, ahead of the 0.6500 mark. On the flip side, the AUDUSD’s first resistance would be the 100-day EMA at 0.6694, followed by the weekly high at 0.6797, ahead of the 0.6800 figure.
- EURUSD bears are eyeing a break of key daily trendline support from the critical resistance area.
- US Dollar bulls are moving in on hawkish Fed prospects.
EURUSD is battling back, down some 0.5% still, however, having fallen from a high of 1.0406 to a low of 1.0305. US Treasury yields increased on Thursday as investors bet on a relatively hawkish Federal Reserve.
The greenback was pressured in recent days due to last week's and this week's inflation data missing the mark vs. expectations. This had fanned the flames of the expectations of a Fed pivot while some of the Federal Reserve commentaries that accompanied the data implied that it could soon slow the pace of its interest rate hikes. However, a switch in sentiment on Thursday gave rise to a bid in the greenback once again.
A number of other Fed officials, including Raphael Bostic, Michelle Bowman, James Bullard, Philip Jefferson, Loretta Mester, and Neel Kashkari, were all lining up to speak toward the end of the week. To start the day, Fed's Bullard said that policy is not getting in a range to be sufficiently restrictive and that hikes to date had only made a limited effect on observed inflation. He also said that signs of disinflation are tentative at best, but he is hopeful for 2023. He sees a minimum level for restrictive policy between 5% – 5.25%.
US Dollar bulls move in
Consequently, it was a bearish start to the day with US benchmarks in the red, US yields higher along with a firmer US Dollar. The dollar index
DXY, which measures the currency against six major peers, was recently up 0.50% at 106.81 in midday trade. The index has traveled between a range of 106.098 and 107.240 on the day. However, the index remains in bearish territories while below 107.00. After hitting a 20-year high in late September the index had lost more than 8% when it touched its most recent intraday low on Tuesday.
EURUSD & DXY technical analysis
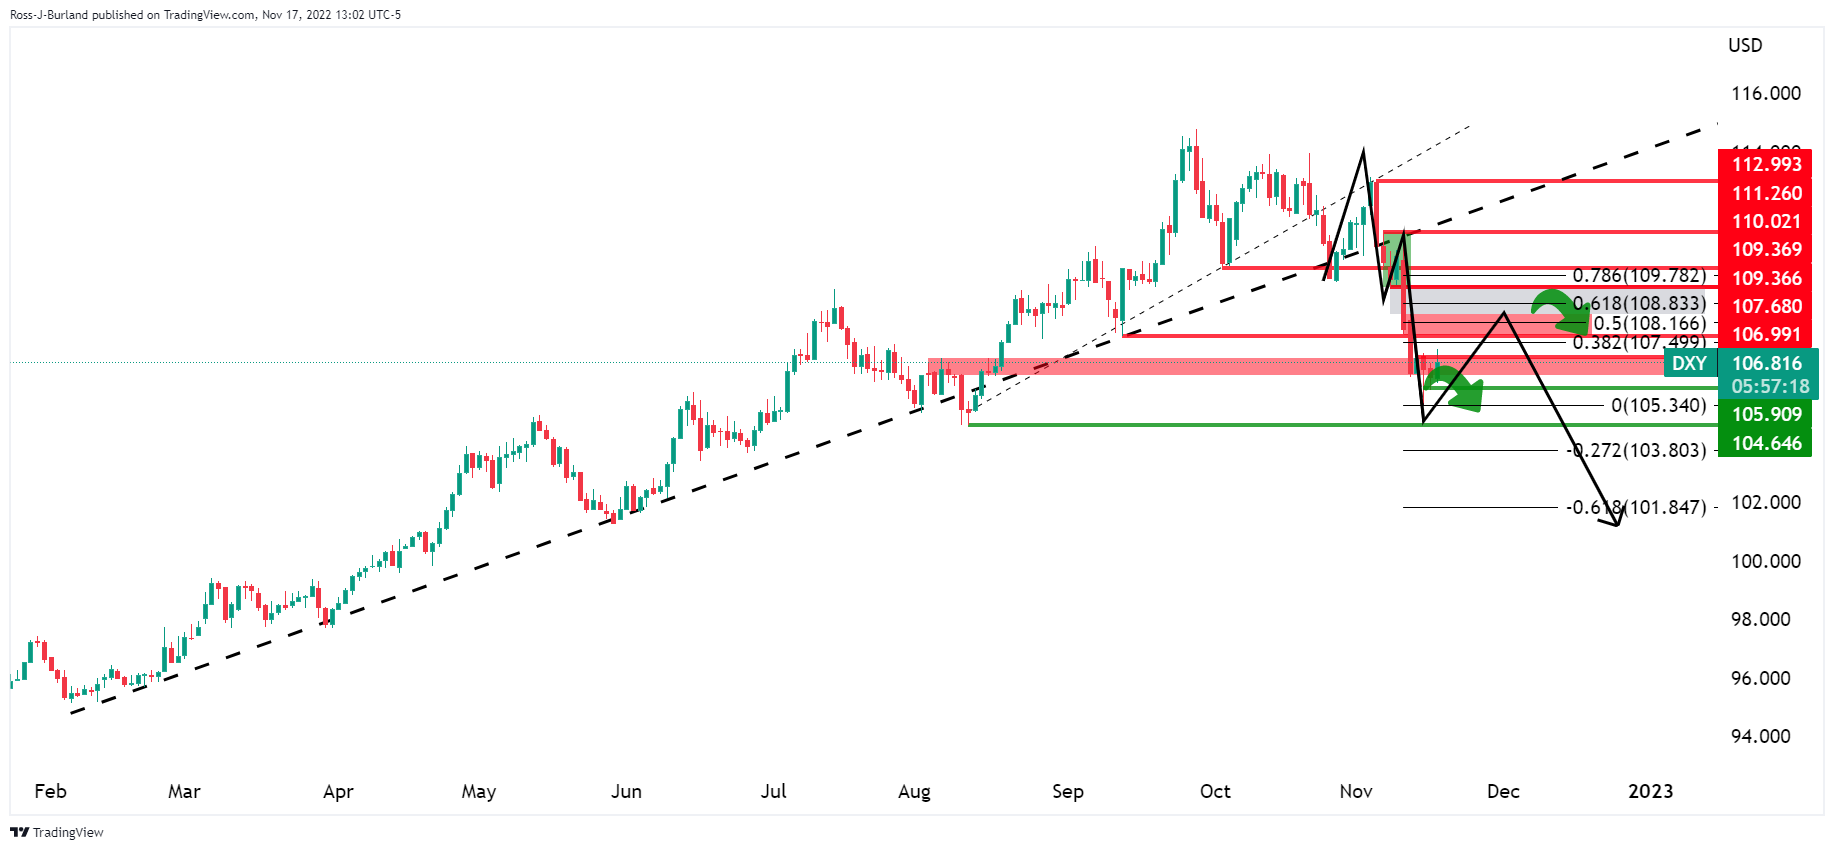
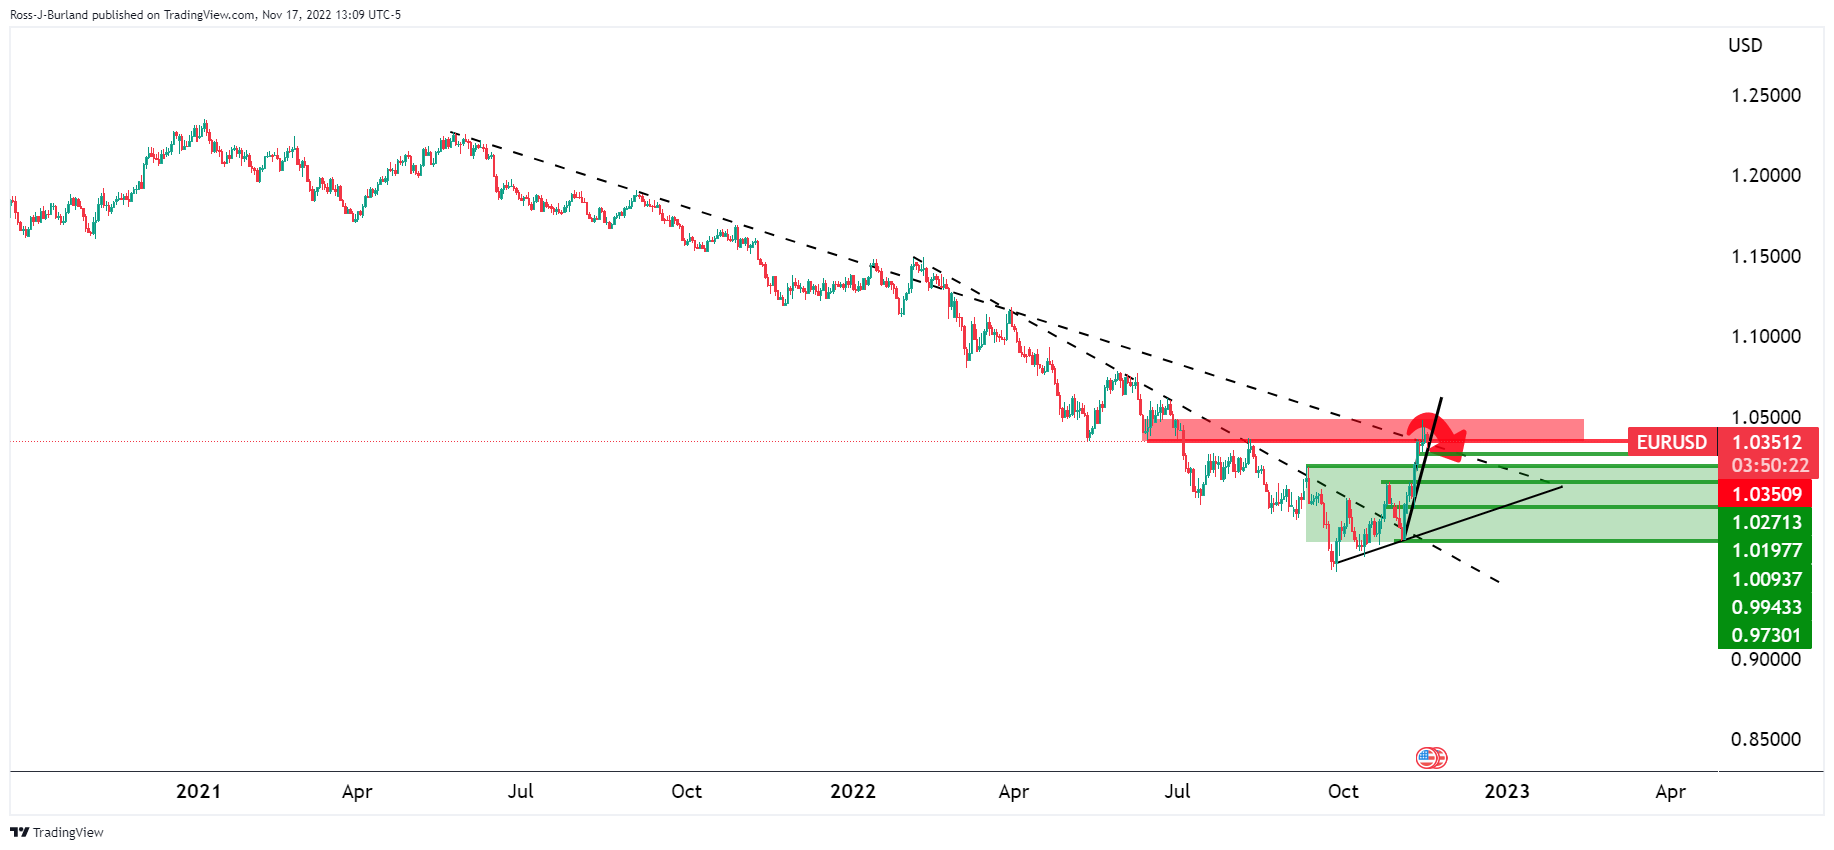
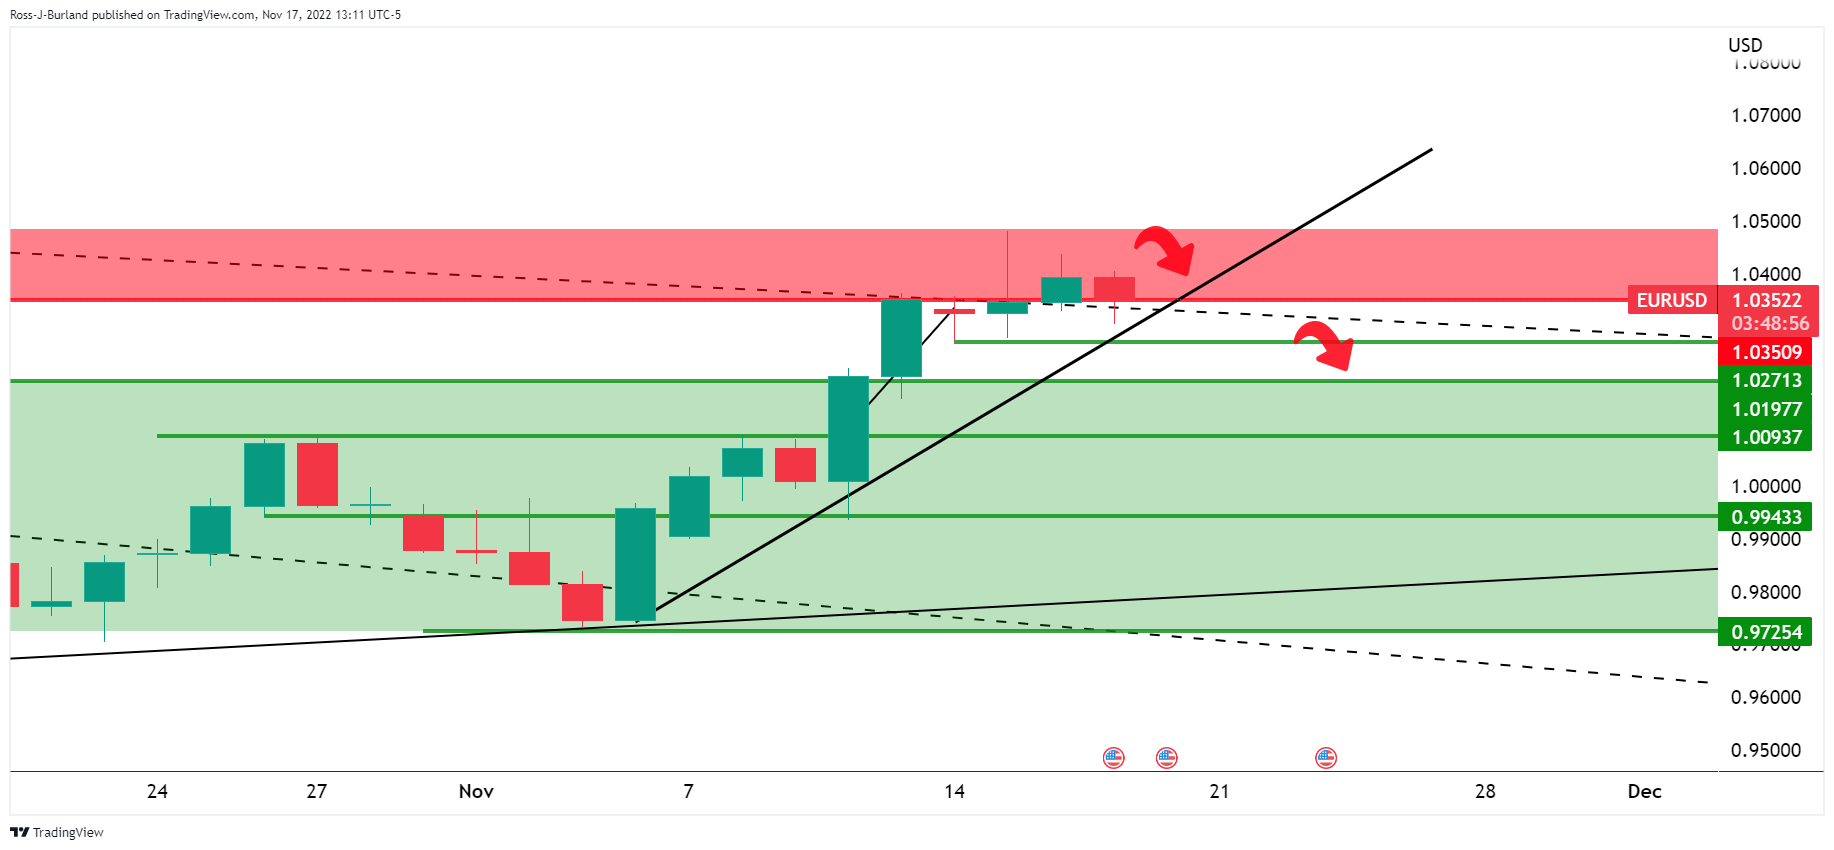
The daily chart shows the price below a key trendline and within an M-formation. The correction is underway, however. While below 107.00, the outlook remains bearish but a break of there opens the risk of a deeper bullish correction towards 108.80.
This leaves the outlook for EURUSD correctively bearish below 1.0270:
It has been reported that House Speaker Nancy Pelosi, who became Speaker of the House in 2007, announced that she will step down from her congressional leadership role, ending a two-decade streak as the top House Democrat. This follows signs that the Democrats will narrowly lose their House majority to Republicans following the midterm elections. She will remain a Congress member where she has been since 1987.
CNBC reported that ''current House Minority Leader Kevin McCarthy, R-Calif., is considered the top candidate to become speaker in the next Congress. On Tuesday, McCarthy won a party vote to become the GOP nominee for speaker, though he secured fewer votes than the 218 he will need when the full House casts its leadership votes in early January.''
- Hawkish commentary by Federal Reserve officials underpinned the US Dollar.
- US economic data was mixed as unemployment claims dropped, while housing data paints a gloomy scenario.
- Wednesday’s Canadian Consumer Price Index failed to underpin the Loonie.
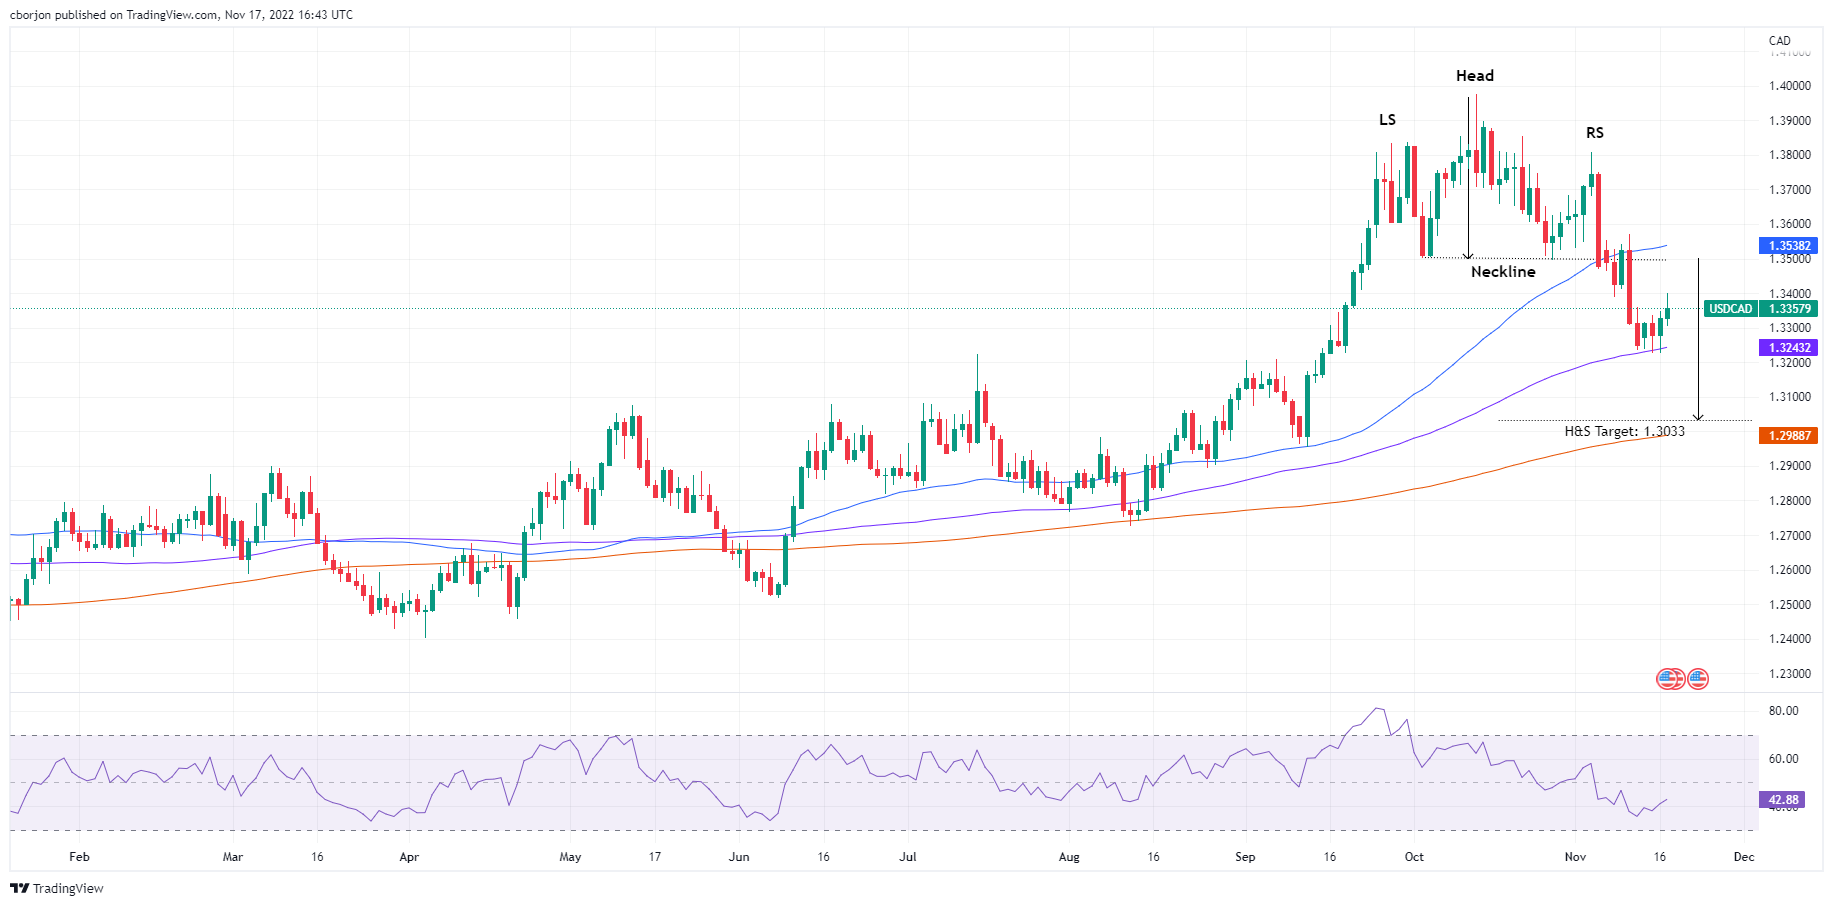
- USDCAD Price Analysis: The head-and-shoulders pattern is intact unless exchange rates clear 1.3500.
The Loonie (CAD) weakened against the US Dollar (USD) after Federal Reserve policymakers expressed that inflation remains too high and rates need to be above the 5% threshold, undermining investors’ sentiment. Factors like Wednesday’s solid Retail Sales report in the United States (US) and Thursday’s claims for unemployment dropping below estimates justify further Fed tightening. At the time of writing, the USDCAD is trading at 1.3355.
Federal Reserve’s hawkish commentary undermined XAUUSD
US equities were rattled by Fed officials reiterating the need to tackle inflation, led by the St. Louis Fed President James Bullard. Bullard commented that the policy rate is not “sufficiently restrictive” and said that the Federal Funds rate (FFR) would be in the area between 5% to 7%, which spooked investors once the headline crossed wires. Cleveland’s Fed President Loretta Mester echoed his comments, saying that inflation is too high.
US housing market deteriorated further, while Initial Jobless Claims dropped
The US economic calendar was busy, with Housing Starts for October contracting 4.2% MoM beneath the last month’s 1.3% contraction, blamed on the Federal Reserve tightening monetary conditions. Building Permits for the same period shrank 2.4% MoM vs. September’s 1.4% increase.
Later, US Initial Jobless Claims for the week ended on November 12 dropped 222K, below estimates of 225K and the previous week’s 226K. Contrarily Continuing Claims rose 13K, to 1.51 million, in the week ended on November 5, increasing for the fifth straight week, an uptrend signing that Americans are out of work for longer.
Aside from this, the US Dollar Index, a gauge of the buck’s value against a basket of six currencies, remains above its opening price by 0.78%, at 107.109, underpinned by high US Treasury yields, with the US 10-year note rate raising nine bps, at 3.771%, after hitting a weekly low of 3.671%.
Canada’s CPI failed to underpin the Loonie
An absent Canadian economic docket left the Loonie adrift to the dynamics of the US Dollar and Wednesday’s Consumer Price Index (CPI) report. Canada’s CPI was unchanged at 6.9% YoY in October, blamed on higher energy and food prices. Core inflation edged up, suggesting that the Bank of Canada (BoC) would not decelerate its tightening pace. According to TD Securities analysts, “We don’t think this report is enough to single-handedly tip the scales towards a 50bp hike in December and continue to look for a 25bps at the upcoming meeting.
USDCAD Price Analysis: Technical outlook
The USDCAD daily chart portrays the major as neutral biased. Traders should be aware the head-and-shoulders chart pattern is intact unless the USDCAD clears the 1.3500 mark. However, if USD buyers breach the psychological 1.3400 figure, a re-test of the neckline around 1.3500 is likely. Nevertheless, at the time of typing, the USDCAD retraced after testing the 1.3400 mark. USDCAD key resistance lies at 1.3400, followed by the neckline at 1.3500. On the flip side, USDCAD’s first support would be 1.3300, followed by the solid demand zone at the 100-day Exponential Moving Average (EMA) at 1.3243, followed by the 1.3200 mark.
In 2023, the Canadian Dollar may emerge as a more attractive pro-cyclical bet. Economists at ING believe that the USDCAD pair could plunge to the 1.25 level.
Overall commodity picture should prove rather supportive for the CAD in 2023
“We expect Brent to average slightly above $100/bbl next year, and Western Canadian Select around $85/bbl. Along with our expectations for higher gas prices, the overall commodity picture should prove rather supportive for the CAD in 2023.”
“In our base-case scenario, where global risk sentiment gradually recovers but two major risk-off forces – Ukraine/Europe and China – remain, CAD would be in an advantageous position, since Canada has much more limited direct exposure to China and Europe compared to other commodity exporting economies.”
“Accepting the downside risks stemming from the housing market and/or a further deterioration in risk sentiment, we see room for a descent in USDCAD to the 1.25 level towards the end of 2023.”
Brasilian President-elect Lula is likely to be less orthodox than what Lula was during his two-term presidency between 2003 and 2011, according to analysts from Brown Brother Harriman. They point out USDBRL coudl rise to 5.7240, it if breaks above 5.52.
Key Quotes:
“Reports suggest he favors leftist Fernando Haddad for Finance Minister. While no final decision has been made, unnamed sources say the former mayor of Sao Paulo is the front-runner. If so, it would be a bad signal as markets were hoping for a more orthodox choice with market experience and credibility. To make matters worse, Lula said the government needs to start talking about “social responsibility rather than fiscal responsibility.” Reports suggest Lula is unlikely to announce any members of his cabinet until early December, after he returns from planned trips to Egypt and Portugal.”
“Lula 2.0 is likely to be less orthodox than Lula 1.0.”
“USD/BRL tested the July high near 5.5140 and a break above would target the January high near 5.7240.”
- Mexican Peso erases weekly gains versus US Dollar.
- A decline in equity markets weighs on emerging market currencies.
- Slides in USDMXN seem limited while above 19.30.
The USDMXN rose from 19. 30 and peaked at 19.47, the highest level in three days during Thursday’s American session, boosted by a stronger US Dollar and a deterioration in risk sentiment.
US Dollar up across the board
Economic data from the US released on Thursday showed an unexpected decline in the Philly Fed to -19.4 in November from -8.7. In a different report, Continuing Jobless Claims rose to the highest level since April. Housing Starts and Building Permits dropped in October, although numbers came in above expectations.
The Dollar Initially it dropped but then recovered strength boosted by higher US yields and also risk aversion. In Wall Street, the Dow Jones is falling by 0.60%, the Nasdaq drops by 0.80% and the S&P 500 by 0.98%. The deterioration in risk sentiment weighs on emerging market currencies with the Mexican Peso no among the worst performers.
Trend still favors the MXN
Despite rising on Thursday, USDMXN remains with a bearish bias. In the short-term it continues to consolidate after finding support above 19.30. A firm break lower would open the doors to further losses targeting 19.15 initially and then 19.00/05.
On the upside, initial resistance emerges at 19.50 and then a stronger area at 19.60. A daily close above would alleviate the bearish bias, suggesting a test of 19.80.
Technical levels
- Hawkish commentary by Federal Reserve officials undermines Gold Prices.
- Unemployment claims in the United States diminished compared to last week’s data.
- The US housing market continues to deteriorate as the Federal Reserve aggressively tightens.
- Gold sliding below $1753 would pave the way toward the 100-DMA.
Gold Price drops, eyeing a test of the weekly lows around $1753, following hawkish Federal Reserve (Fed) commentary, amidst a tranche of United States (US) economic data released that underpinned the US Dollar (USD). Also, a jump in US Treasury bond yields weighed on the yellow metal. At the time of writing, XAUUSD is trading at $1759.40, below its opening price by 0.80%, after hitting a daily high of $1774.81.
Federal Reserve’s hawkish commentary undermined XAUUSD
Sentiment shifted sour as Fed policymakers emphasized the need to tackle inflation, led by the St. Louis Fed President James Bullard. Bullard said, “Even under these generous assumptions, the policy rate is not yet in a zone that may be considered sufficiently restrictive.” In his presentation, he showed charts that showed rates might be “sufficiently restrictive” at around 5% to 7% and called his colleagues to raise rates further if they’re to achieve the Fed’s 2% goal.
US Initial Jobless Claims retraced
Data-wise, a busy economic calendar in the United States would entertain Gold traders, led by unemployment claims and housing data. Initial Jobless Claims for the week ended on November 12 dropped 222K, below estimates of 225K and the previous week’s 226K. Contrarily Continuing Claims rose 13K, to 1.51 million, in the week ended on November 5, increasing for the fifth straight week, an uptrend signing that Americans are out of work for longer.
The US housing market continues to cool down
In the housing market segment, Housing Starts for October tumbled, shrinking 4.2% below September’s 1.3% contraction, as further interest-rate hikes by the Fed keep pouring cold water into an already battered housing market. Building Permits decreased by 2.4%, while the previous month’s data was upward reviewed to a 1.4% increase.
The US Dollar Index, a gauge of the buck’s value against a basket of peers, remains above its opening price by 0.62%, at 106.948, snapping two days of consecutive losses. The US 10-year Treasury bond yield, a headwind for the non-yielding metal, jumps nine bps, at 3.781%, after hitting a weekly low of 3.671%.
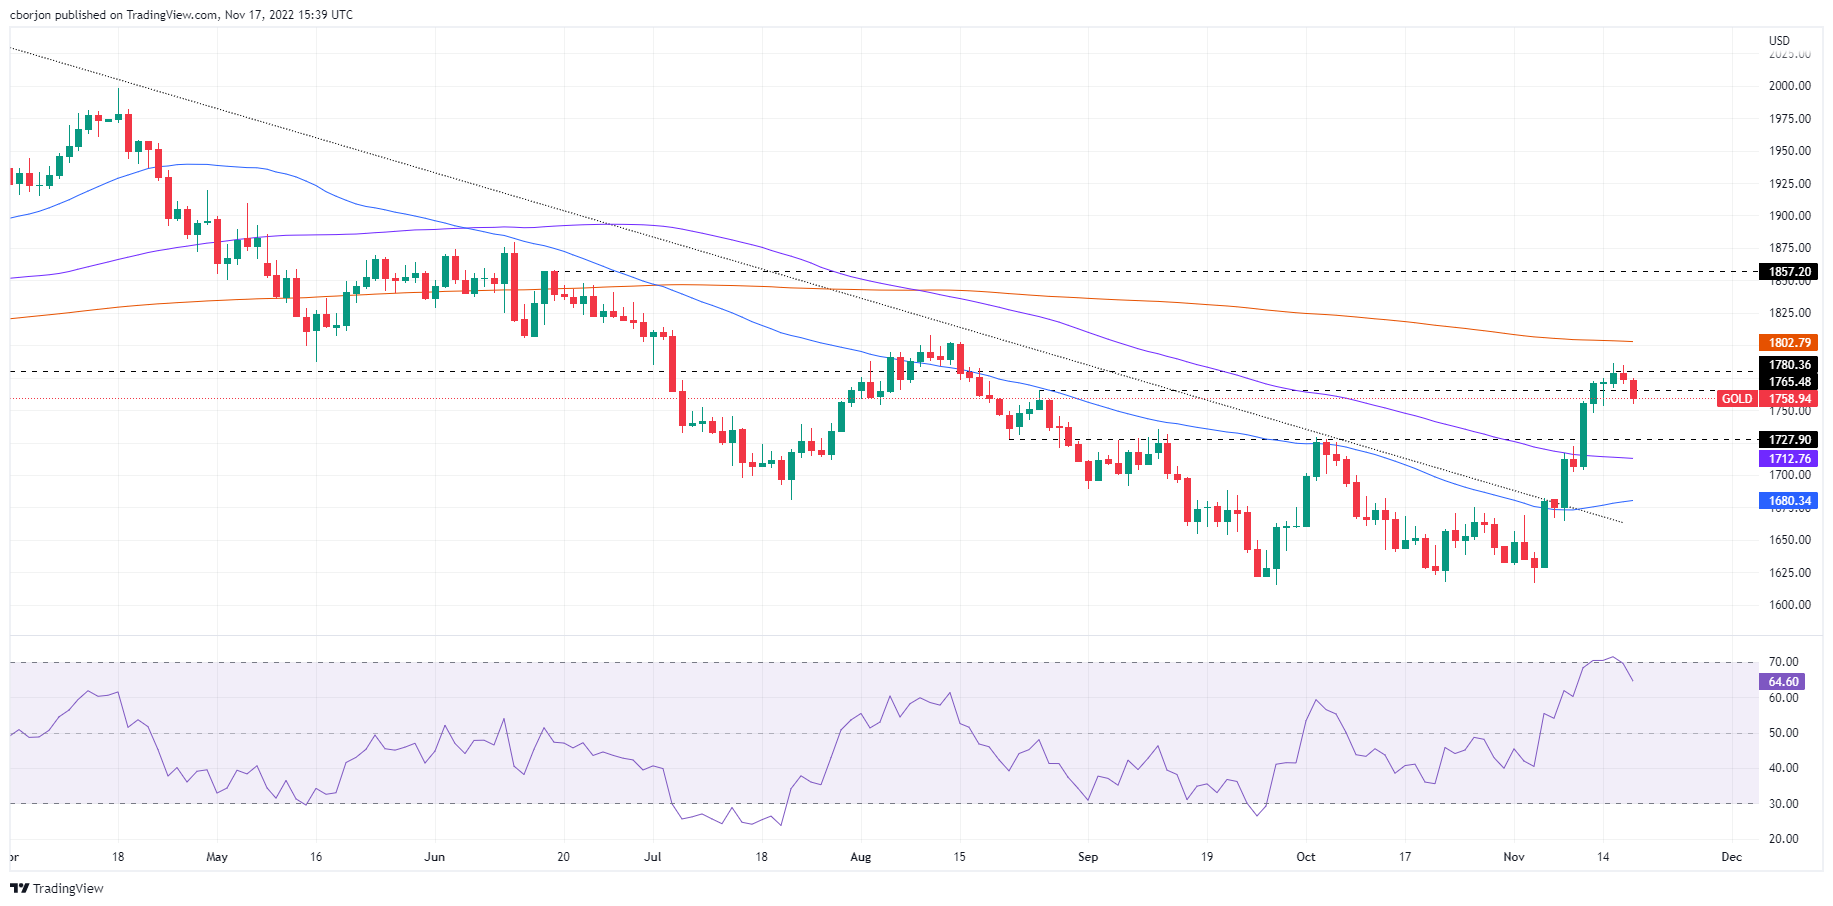
Gold Price Analysis: Technical outlook
From a technical perspective, the XAUUSD remains neutral-to-upward biased, struggling to crack the $1787 barrier. The XAUUSD drop toward the weekly low at $1753, exposing the yellow metal to selling pressure. The Relative Strength Index (RSI), exiting from oversold conditions, cements the sellers’ case to push prices lower. Therefore, the XAUUSD’s first support would be the weekly low at $1753, followed by the September 12 swing high at $1735.10, and immediately followed by the 100-day Exponential Moving Average (EMA).
Sterling has stabilised as the newly appointed government is working to restore fiscal credibility. However, the growth backdrop provides little incentive to buy sterling which may underperform on the crosses, economists at ANZ Bank report.
Policy settings are not going to be growth positive in the short term
“Policy settings are not going to be growth positive in the short term, even if many of the planned spending cuts may be pushed back until after the next election, which must be held no later than January 2025.”
“From a growth perspective it is difficult to get excited about Sterling’s prospects. We think this is particularly the case on the crosses as we expect the Pound’s fortunes against the USD will be determined more by the direction of the USD than GBP.”
“We think selling rallies in GBP versus EUR and AUD as UK growth suffers and politicians grapple to find a coherent vision of the UK’s economic future could prove rewarding in coming months.”
In the view of economists at ING, the Swedish Krona may struggle to enter a sustained uptrend next year given its elevated exposure to the eurozone’s growth story.
Eurozone exposure a drag on SEK
“We see some room for EURSEK to move lower throughout the year – also considering that we estimate the pair to be around 9.0% overvalued. However, the high risk of a prolonged energy crisis in the eurozone means that SEK is significantly less attractive than other pro-cyclical currencies next year.”
“Incidentally, SEK is highly correlated to the US tech stock market, which looks particularly vulnerable at the moment.”
“A return to 10.00 or below would likely require a significant improvement in European sentiment.”
- The index extends the rebound past the 107.00 barrier.
- Higher US yields also prop up the uptick in the dollar.
- The Philly Fed index worsened to -19.4 for the current month.
The greenback regains poise and advances to the area above the 107.00 barrier, near weekly tops, when measured by the USD Index (DXY) on Thursday.
USD Index: Upside bolstered by higher yields
The index attracts renewed buying interest and advances to multi-day peaks north of the 107.00 hurdle following a soft tone in the risk-linked galaxy, while extra help also comes from the US debt market.
On the latter, yields across the curve seem to have woken up and manage to leave behind several sessions in the red – especially in the belly and the long end of the curve, all against the backdrop of somewhat consolidated speculation of a Fed’s pivot in its monetary policy.
In the US docket, Initial Jobless Claims rose by 222K in the week to November 12, Housing Starts contracted 4.2% MoM in October, or 1.425M units, and flash Building Permits contracted 2.4% from a month earlier, or 1.526M units.
Additionally, the always relevant Philly Fed Manufacturing Index deteriorated to -19.4 for the current month.
What to look for around USD
The index regained upside momentum and trespasses the key 107.00 barrier on Thursday.
In the meantime, the greenback is expected to remain under the microscope amidst persistent investors’ repricing of a probable slower pace of the Fed’s rate path in the upcoming months.
Key events in the US this week: Building Permits, Initial Jobless Claims, Housing Starts, Philly Fed Index (Thursday) - CB Leading Index, Existing Home Sales (Friday).
Eminent issues on the back boiler: US midterm elections. Hard/soft/softish? landing of the US economy. Prospects for further rate hikes by the Federal Reserve vs. speculation of a recession in the next months. Fed’s pivot. Geopolitical effervescence vs. Russia and China. US-China persistent trade conflict.
USD Index relevant levels
Now, the index is gaining 0.63% at 106.95 and faces the next resistance at 109.13 (100-day SMA) seconded by 110.81 (55-day SMA) and then 113.14 (monthly high November 3). On the other hand, the breakdown of 105.34 (monthly low November 15) would open the door to 105.00 (200-day SMA) and finally 104.63 (monthly low August 10).
- Pound among worst performers in G10 space after Autumn budget.
- US Dollar remains strong despite mixed US economic data.
- GBPUSD trims weekly gains on Thursday, and backs away from three-month highs.
The GBPUSD pair dropped further during the American session and bottomed at 1.1760. It then trimmed losses rising back toward 1.1800. It is losing more than a hundred pips on Thursdays, after US data and UK’s budget presentation.
Pound falls after Autumn Budget
On Thursday in the United Kingdom, Chancellor of the Exchequer, Jeremy Hunt presented the Autumn Statement, the budget of the Primer Minister Rishi Sunak. The budget was largely as expected by analysts. Hunt presented an increase in taxes of £55 billion and spending cuts in order to restore the UK’s fiscal reputation after a chaotic September and October.
“The UK government announced the largest tax increases and spending cuts in a decade, becoming the first major Western economy to start sharply limiting its spending growth after years of ramped-up fiscal stimulus during the pandemic and recent energy subsidies,” reported the WSJ. The pound hit fresh daily lows across the board during the presentation but falling at a moderate pace.
Dollar holds its strength after US data
Economic data from the US showed an unexpected decline in the Philly Fed to -19.4 in November from -8.7. Continuing Jobless Claims rose to the highest level since April. Housing Starts and Building Permits dropped less than expected. The US Dollar initially doped after the reports, trimming gains but after a few minutes it resumed the upside, hitting fresh daily highs.
The DXY is hovering around 107.00, up 0.69% for the day. US yields are higher with the US 10-year bond yield at 3.79% and the 2-year note at 4.44%.
GBPUSD upside limited while under 1.1950
For the third consecutive day, GBPUSD failed to hold above 1.1950 and pulled back. The pound needs to post a daily close above that could open the doors for a recovery of 1.20 and more. The next critical target is the 200-day Simple Moving Average at 1.2240.
If the ongoing correction extends, the area around 1.1740 emerges as a strong support that should favor a rebound. The following support is seen at 1.1640. A slide below would target the 20-day SMA at 1.1560.
Technical levels
St. Louis Federal Reserve President James Bullard said on Thursday that a minimum level for a restrictive Federal Reserve (Fed) policy rate would be 5% to 5.25%, as reported by Reuters.
Additional takeaways
"Once disinflationary process begins it could proceed rapidly as businesses compete to keep market share."
"Recent Retail Sales suggests household spending cushion remains, a slowdown for the coming Christmas shopping season would be fine."
"October inflation data was encouraging but could easily go the other way next time, inflation is still bad."
"Any signs of disinflation so far are tentative at best but hope 2023 will be the year when it happens."
"Not seeing much cooling in the labor market."
"Fed will want to err on the side of keeping rates higher for longer to avoid mistakes of the 1970s."
"Housing is showing impact of monetary policy, but also boomed unexpectedly during the pandemic."
Market reaction
The US Dollar Index edged slightly lower in the last hour but it was still up 0.6% at 106.90 at the time of press.
What is the outlook for long-term returns? In the view of David M. Lebovitz, Global Market Strategist at JP Morgan, markets offer the best potential long-term returns in more than a decade.
Expectations for asset returns have markedly improved
“The combination of higher yields and lower valuations – both of which have materialized in the wake of extreme shifts in the macro landscape this year – now suggest that markets offer the best potential long-term returns in more than a decade.”
“The swift normalization of interest rates this year left bonds once again as a plausible source of income and diversification. Higher risk-free rates have also translated to improved credit return forecasts, with spread assumptions remaining relatively stable.”
“On the equity side, current valuations present an attractive entry point, with public equity returns notably higher across the board. Meanwhile, alternatives still offer alpha, inflation protection, and diversification benefits, but manager selection will be key.”
“With the US Dollar more overvalued than at any time since the 1980s, FX translation will be a significant component of forecast returns.”
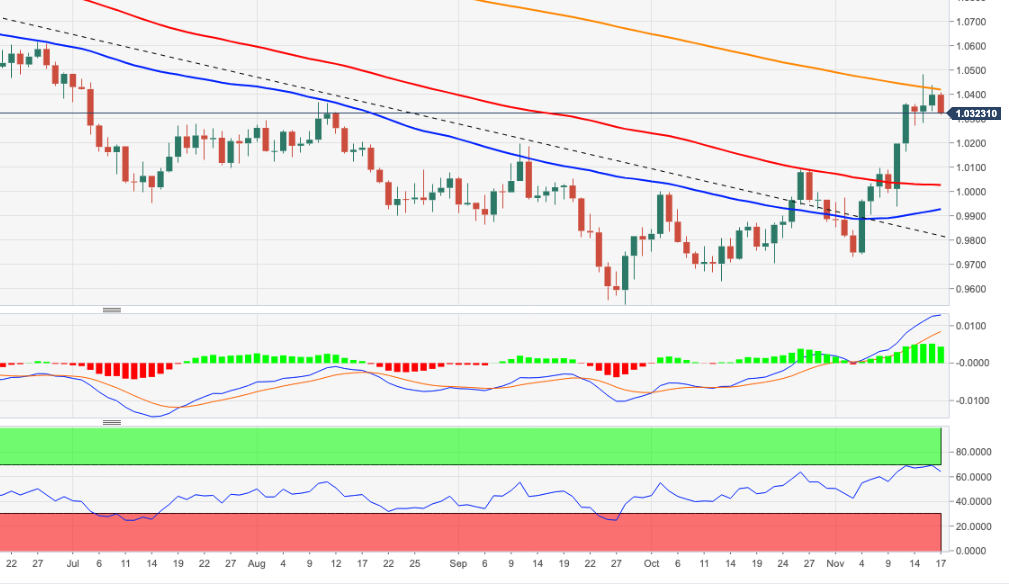
- EURUSD corrects moderately lower following recent strength.
- The next support comes at the 100-day SMA near 1.0020.
EURUSD comes under pressure after two daily gains in a row and retreats to the low-1.0300s on Thursday.
The inability of the pair to close above the 1.0400 level coupled with the proximity of the overbought territory seems to have sparked some correction in the pair. Against that, extra losses carry the potential to drag spot to as low as the 100-day SMA, today at 1.0024. The loss of this region could put a test of the parity zone back on the radar.
So far, while below the 200-day SMA, the outlook for the pair remains bearish.
EURUSD daily chart
- Philadelphia Fed Manufacturing Index fell sharply in November.
- US Dollar Index clings to strong daily gains slightly above 107.00.
The Federal Reserve Bank of Philadelphia's Manufacturing Business Outlook Survey's diffusion index for current general activity dropped to -19.4 in November from -8.7 in October. This print came in worse than the market expectation of -6.2.
"The employment index declined but continued to suggest overall hiring, and the price indexes continued to suggest overall increases," the publication further read. "Although the survey’s future indexes rose slightly, they continued to suggest that the firms expect overall declines in activity and new orders six months from now."
Market reaction
The US Dollar (USD) preserves its strength despite the disappointing data and the US Dollar Index was last seen rising 0.75% on the day at 107.08.
- AUDUSD attracts fresh sellers on Thursday amid a strong pickup in the US Dollar demand.
- Rebounding US Treasury bond yields, the risk-off impulse boosts the safe-haven Greenback.
- The fundamental backdrop supports prospects for a further depreciating move for AUDUSD.
The AUDUSD pair comes under heavy selling pressure on Thursday and extends the overnight retracement slide from the vicinity of the 0.6800 mark, or over a two-month high. The intraday downfall remains uninterrupted through the early North American session and drags spot prices to a fresh weekly low, around the 0.6635 region in the last hour.
Resurgent US Dollar demand prompts aggressive selling around AUDUSD
The US Dollar makes a solid comeback on Thursday and moves away from its lowest level since August 12 touched earlier this week, which, in turn, is seen exerting downward pressure on the AUDUSD pair. The upbeat release of Retail Sales figures from the United States on Wednesday cast doubts on the peak inflation narrative. The positive consumption data forces market participants to scale back their bets for a less aggressive policy tightening by the Federal Reserve (Fed). This is evident from a goodish pickup in the US Treasury bond yields and helps revive the USD demand.
The USD bulls further took cues from St. Louis Fed President James Bullard's hawkish remarks, saying that the policy is not yet in a range estimated to be sufficiently restrictive to reduce inflation. The USD maintains its bid tone following the release of better-than-expected housing market data and Initial Jobless Claims, which offset the Philly Fed Manufacturing Index. Traders now look forward to speechs by other regional Fed Presidents - Raphael Bostic, Loretta Mester and Neel Kashkari - for a fresh impetus.
Risk-off impulse contributes to the sharp intraday downfall
Apart from this, a fresh wave of the global risk-aversion trade - as depicted by a steep intraday fall in the equity markets - provides an additional boost to the safe-haven Greenback. The market sentiment remains fragile amid concerns over economic headwinds stemming from a new COVID-19 outbreak in China - the world's second-largest economy. Adding to this, the risk of a further escalation of geopolitical tensions - amid the protracted Russia-Ukraine war - temper investors' appetite for riskier assets and contributed to driving flows away from the risk-sensitive Australian Dollar.
AUDUSD seems vulnerable to extending the corrective decline
The resources-linked Aussie is further pressured by the ongoing slide in Copper prices, weighed down by growing worries about a deeper global economic downturn. The combination of the aforementioned factors overshadows mostly upbeat Australian employment details released earlier this Thursday. Market players seem convinced that the data was not strong enough for the Reserve Bank of Australia to shift from its dovish course. This, in turn, suggests that the path of least resistance for the AUDUSD pair is to the downside and any attempted recovery might still be seen as an opportunity for bearish traders.
AUDUSD technical outlook
From a technical perspective, repeated failures near the 0.6800 mark over the past two trading sessions seem to have prompted traders to unwind their bullish positions around the AUDUSD pair. A subsequent fall below the previous weekly low, around the 0.6665-0.6660 area, might have already set the stage for deeper losses. Hence, some follow-through weakness towards the 0.6600 mark, en route to the 0.6560-0.6550 strong horizontal resistance breakpoint, now looks like a distinct possibility.
On the flip side, any meaningful recovery attempted now seems to confront stiff resistance and runs the risk of fizzling out near the 0.6700 round figure. That said, a sustained strength beyond might trigger a short-covering rally and lift spot prices towards the 0.6735-0.6740 region. Bulls might then aim back towards conquering the 0.6800 mark, which should act as a pivotal point and help determine the next leg of a directional move for the AUDUSD pair.
AUDUSD key levels to watch
- Initial Jobless Claims in the US fell by 4,000 in the week ending November 12.
- US Dollar Index stays in positive territory near 107.00.
There were 222,000 initial jobless claims in the week ending November 12, the weekly data published by the US Department of Labor (DOL) showed on Thursday. This print followed the previous week's print of 226,000 and came in slightly better than the market expectation of 225,000.
Further details of the publication revealed that the advance seasonally adjusted insured unemployment rate was 1% and the 4-week moving average was 221,000, an increase of 2,000 from the previous week's revised average.
"The advance number for seasonally adjusted insured unemployment during the week ending November 5 was 1,507,000, an increase of 13,000 from the previous week's revised level," the DOL further noted in its publication.
Market reaction
The US Dollar Index clings to strong daily gains at around 107.00 after this data.
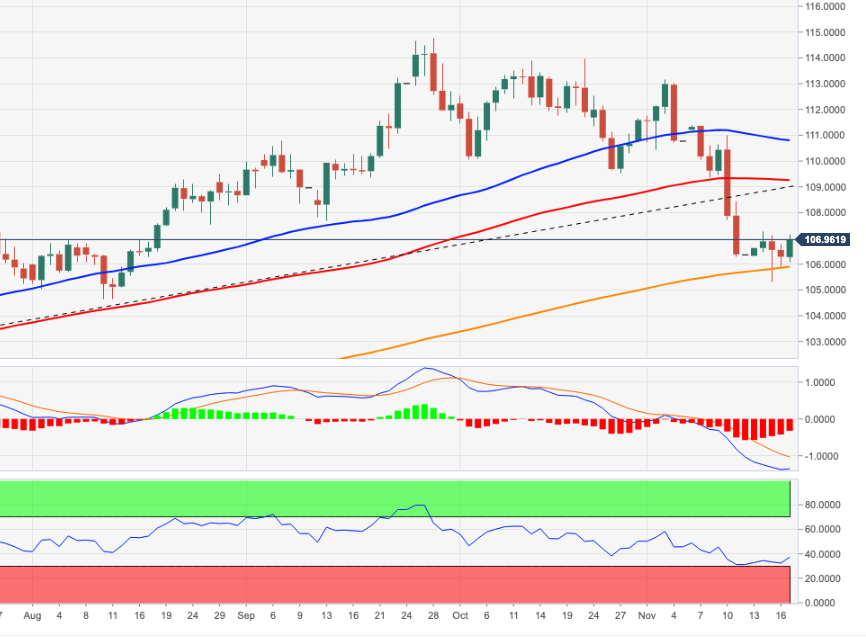
- DXY gives some signs of life and reclaims 107.00 and above.
- Immediately to the downside emerges the 200-day SMA at 105.00.
DXY reverses two daily drops in a row and manages to reclaim the area above the 107.00 mark on Thursday.
Despite the bounce, the index still remains under scrutiny. That said, a breach of the November low at 105.34 (November 15) should prompt DXY to extend losses to the critical 200-day SMA, today at 105.00. The loss of this important region could put a potential drop to the August low at 104.63 (August 10) back on the radar.
Below the 200-day SMA, the dollar’s outlook should shift to negative.
DXY daily chart
- Housing Starts and Building Permits in the US declined in October.
- US Dollar Index clings to strong daily gains slightly below 107.00.
The monthly data published by the US Census Bureau revealed on Tuesday that Housing Starts declined by 4.2% on a monthly basis in October following September's 1.3% contraction.
In the same period, Building Permits fell by 2.4%, compared to a 1.4% increase recorded in September.
Market reaction
With the initial reaction, the US Dollar Index, which tracks the US Dollar's (USD) performance against a basket of six major currencies, retreated from the daily high it set at 107.13. As of writing, the index was up 0.6% on the day at 106.90.
Gold remains under some selling pressure for the second successive day on Thursday. The pain trade could extend further, in the view of strategists at TD Securities.
Low bar for additional short covering
“We still see risks that the pain trade in precious metals could extend further, as positioning risks remain skewed to the upside in Gold.”
“A series of key trend reversal thresholds associated with substantial short covering flow remain just north of the $1,800 mark, which points to a low bar for additional short covering.”
“Return on patience is elevated for those looking to fade the recent rally.”
The Canadian Dollar weakens on soft risk appetite. However, the technical picture suggests risks for the USDCAD pair are tilted to the downside, economists at Scotiabank
Negative technical factors
“USDCAD sentiment remains heavily influenced by choppy risk sentiment but our fair value estimate for spot currently (1.3389) suggests that the market is about where it should be, all things (equities, volatility, spreads, commodities) considered.”
“USDCAD has effectively triggered a minor double bottom at 1.3230 on the move above 1.3330 which paves the way for a further squeeze up to the 1.3430 into the end of the week. Broader patterns remain negative for the USD (the daily Head and Shoulders formation remains in play), however, and we still favour looking to fade USD rallies.”
The US Federal Reserve's (Fed) monetary policy is not yet in a range estimated to be sufficiently restrictive to reduce inflation, St. Louis Federal Reserve President James Bullard said on Thursday, as reported by Reuters.
Additional takeaways
"Fed rate hikes to date have had only limited effect on observed inflation."
Even dovish assumptions about the state of monetary policy warrant further rate increases."
"Monetary rule would set lower bound on restrictive policy of around 5%, versus current Fed target rate range of 3.75% to 4%."
"Range of restrictive policy estimates could be lower if inflation falls, markets expect disinflation in 2023."
"Caution warranted given markets, Fed, have been expecting inflation to fall for more than a year."
Market reaction
The US Dollar Index continues to push higher heading into the American session and was last seen gaining 0.8% on the day at 107.12.
- GBPUSD comes under heavy selling pressure and is weighed down by a combination of factors.
- A goodish pickup in the US bond yields, the risk-off mood revive demand for the safe-haven USD.
- A gloomy outlook for the UK economy undermines the GBP and contributes to the intraday slide.
The GBPUSD pair meets with a fresh supply following an early uptick to the 1.1955-1.1960 region and the intraday selling picks up pace during the mid-European session. The pair is currently flirting with the daily low, with bears now awaiting a sustained break below the 1.1800 round figure mar.
The initial leg of the intraday downfall was sponsored by the emergence of some buying around the US Dollar, which is drawing some support from a goodish pickup in the US Treasury bond yields. The British Pound, on the other hand, weakens across the board after UK Finance Minister Jeremy Hunt presents the Autumn Budget to the Parliament. The combination of the aforementioned factors exerts downward pressure on the GBPUSD pair.
Wednesday's upbeat US Retail Sales data forces market participants to scale back their bets for a less aggressive policy tightening by the Federal Reserve. Moreover, the US central bank is expected to hike interest rates by a relatively smaller 50 bps at the next meeting in December. This, in turn, acts as a tailwind for the US bond yields, which, along with a generally weaker risk tone, offers some support to the safe-haven USD.
The GBP bulls, meanwhile, seem rather unimpressed by Chancellor Jeremy Hunt's £55 billion fiscal plan. Adding to this, the Office for Budget Responsibility (OBR) says that the economy is already in a recession. The OBR now expects the UK GDP to slump by 1.4% next year as compared to a projection for growth of 1.8% in the previous outlook published in March. This is seen as another factor weighing on the Sterling Pound.
With the latest leg down, spot prices have now retreated over 225 pips from a nearly two-month high touched earlier this week and seem vulnerable to depreciating further. Next on tap is the US economic docket, featuring the Philly Fed Manufacturing Index and Weekly Initial Jobless Claims. Apart from this, speeches by a slew of influential FOMC members, will influence the USD and provide some impetus to the GBPUSD pair.
Technical levels to watch
S&P 500’s strength has stalled at the 38.2% retracement of the 2022 fall at 3999. However, analysts at Credit Suisse still expect a break in due course and another short-term leg higher to test tough resistance at the 200-Day Moving Average, currently at 4073.
3860/46 to hold to maintain the potential for a test of the 200DMA
“Whilst further consolidation below 3999 should be allowed for, or even a 1-2 day deeper correction lower, our bias remains to look for a sustained move above here in due course for another short-term leg higher to test what we see as more significant resistance from the long-term 200DMA, currently seen at 4073, where we would then look for better sellers to show.”
“Support is seen at 3953/49 initially, below which would confirm a deeper 1-2 day setback to the 3912 recent high, potentially even the recent price gap and broken 63-day average at 3860/46. However, we look for this to hold to maintain the potential for a test of the 200DMA. Below though would be a strong signal that this bear market rally is over for a resumption of the broader downtrend.”
- EURJPY fades part of Wednesday’s uptick and drops from 145.00.
- The 3-month support line near 141.00 holds the downside.
EURJPY comes under pressure soon after surpassing the key 145.00 barrier on Thursday.
If the corrective bounce gathers extra steam, then the cross should face initial resistance at the so far November high at 147.11 (November 9). The surpass of this level could open the door to a more meaningful move to the 2022 peak at 148.40 (October 21).
In the meantime, further gains look in store in the near term as long as the cross navigates above the 3-month support line near 141.20. This area of contention is also propped up by the October lows in the 141.00 region.
In the longer run, while above the key 200-day SMA at 138.33, the constructive outlook is expected to remain unchanged.
EURJPY daily chart
EURUSD faltered around 1.0400 and is edging lower on Thursday. Still, economists at Scotiabank expect the pair to target the 1.05 mark.
Minor EUR dips remain a buy from a technical perspective
“EUR gains have stalled and there is scope for losses to extend modestly as spot consolidates the sharp advance seen over the past week.”
“Intraday support is 1.0295/00. Resistance is 1.04.”
“Broader trend signals remain EUR-bullish and we think that minor EUR dips remain a buy from a technical perspective.”
“We target a test of the low 1.05 zone (50% Fibonacci retracement of the 2022 decline).”
UK Finance Minister Jeremy Hunt is presenting the Autumn Budget to parliament.
Key takeaways
"Will cap increase in rents on public housing to maximum 7%."
"Will raise minimum wage by 9.7%."
"Hourly rate of minimum wage will rise to 10.42 sterling."
"Will raise working-age and disability benefits in line with inflation."
"Rise in benefits will cost 11 billion sterling."
"Will increase pension credit by 10.1%."
"Will increase state pension in line with triple lock."
Market reaction
GBPUSD stays under modest bearish pressure and was last seen trading at 1.1830, where it was down 0.65% on a daily basis.
- USDJPY gains some positive traction amid a modest USD uptick, though lacks follow-through.
- A goodish pickup in the US bond yields helps revive the USD demand and acts as a tailwind.
- The risk-off mood underpins the safe-haven JPY and caps any meaningful gains for the major.
The USDJPY pair continues to show resilience below the 139.00 round figure and regains some positive traction Thursday. The momentum lifts spot prices to a fresh daily top during the mid-European session, with bulls still awaiting a convincing breakout through the 140.00 psychological mark.
The intraday uptick is sponsored by the emergence of some buying around the US Dollar, bolstered by a goodish pickup in the US Treasury bond yields. Wednesday's upbeat US Retail Sales data forces market participants to scale back their bets for a less aggressive policy tightening by the Federal Reserve and acts as a tailwind for the US bond yields.
Moreover, the US central bank is expected to hike interest rates by a relatively smaller 50 bps at the next meeting in December. In contrast, the Bank of Japan remains committed to its ultra-loose monetary policy, marking a big divergence in comparison to a more hawkish Fed. This, in turn, weighs on the Japanese Yen and further offers support to the USDJPY pair.
That said, a bout of global risk-aversion trade - as depicted by a generally weaker tone around the equity markets - seems to underpin the safe-haven JPY. This is holding back traders from placing aggressive bullish bets around the USDJPY pair, making it prudent to wait for strong follow-through buying before confirming that spot prices have formed a bottom.
Even from a technical perspective, the USDJPY pair, so far, has struggled to move back above the 141.00 confluence support breakpoint. The said handle should now act as a pivotal point and help determine the near-term trajectory for the USDJPY pair. Traders now look to the US macro releases - the Philly Fed Manufacturing Index and the usual Weekly Initial Jobless Claims.
Apart from this, speeches by a slew of influential FOMC members, along with the US bond yields, will drive the USD demand. Furthermore, the broader market risk sentiment might also contribute to producing short-term trading opportunities around the USDJPY pair.
Technical levels to watch
GBPUSD has been recovering on the expectation of more credible UK fiscal plans and the softer Dollar. Nonetheless, economists at ING expect the pair to reverse back lower to the 1.10 zone.
UK economy to contract every quarter in 2023
“We doubt 2023 will prove the year of a benign Dollar decline. And the risk is that the Fed keeps rates at elevated levels for longer. Given Sterling’s large current account deficit and its transition to high beta on the external environment, we think it is too early to be expecting a sustained recovery here.”
“We favour a return to the 1.10 area into year-end as the government introduces Austerity 2.0 and the Bank of England cycle is repriced lower.”
“We look for the UK economy to contract every quarter in 2023 – making it a very difficult environment for Sterling.”
“GBPUSD realised volatility is now back to levels seen during Brexit and our market call for 2023 is that these types of levels will become more, not less, common.”
UK Finance Minister Jeremy Hunt is presenting the Autumn Budget to parliament.
Key takeaways
"Will continue to maintain defence spending at least 2% of GDP."
"Will raise schools budget with extra 2.3 billion sterling per year."
"Will delay implementation of social care reforms by 2 years."
"Will raise NHS budget by 3.3 billion sterling in each of next 2 years."
"Tax as a percentage of GDP will rise by just 1% over next 5 years."
"Maintaining tax thresholds for another 2 years."
"We will grow public spending by less than GDP."
"We will raise resource spending by 1% a year in real terms."
"Overall spending on public spending will rise in real terms over next 5 years."
Market reaction
GBPUSD has managed to rebound from the daily low it touched at 1.1800 and was last seen trading at 1.1865, where it was still down 0.35% on the day.
UK Finance Minister Jeremy Hunt is presenting the Autumn Budget to parliament.
Key takeaways
"Just under half of the £55 billion consolidation coming from tax, and just over half from spending."
"We have not raised headline rates of taxation."
"We will retain the employment allowance at its new, higher level of £5,000."
"Any windfall tax should be temporary and not deter investment."
"From January next year to March 2028, will increase a windfall tax on oil and gas firms to 35%, from 25%."
"Will extend windfall tax to electricity generation firms."
"Temporary levy on electricity generators will be 45%."
UK Finance Minister Jeremy Hunt is presenting the Autumn Budget to parliament.
Key takeaways
"OBR sees CPI of 9.1% in 2022 (March forecast 7.4%)."
"OBR sees CPI of 7.4% in 2023 (March forecast 4.0%)."
"OBR sees GDP growth of 4.2% in 2022, -1.4% in 2023, +1.3% in 2024, +2.6% in 2025 and +2.7% in 2026."
"Our priorities are stability, growth and public services."
"Our plan also leads to a shallower downturn, higher long-term growth."
"Inflation figures show we must continue relentless fight to bring it down, including important commitment to rebuild public finances."
"OBR expects rise in unemployment from 3.6% today to 4.9% in 2024 before falling to 4.1%."
"Two new fiscal rules: Underlying debt must fall as percentage of GDP by fifth year in rolling period. Second is public sector borrowing, over the same period, must be below 3% of GDP."
"Today’s statement delivers a consolidation of £55 billion and means inflation and interest rates end up significantly lower."
"In the short term, as growth slows and unemployment rises, we will use fiscal policy to support the economy."
Economists at the Bank of America Global Research discuss EURUSD's technical outlook. In their view, a dip towards parity followed by a bounce to 1.0350/75 would confirm a head and shoulders top.
New highs in RSI are a favorable condition for a bottom pattern to form
“A technical bottom pattern would go a long way in supporting the potential for further gains in the EURUSD next year. One pattern to be on watch for is a head-and-shoulders bottom. If we assume the neckline of the pattern is 1.0350, then the left shoulder and head of the pattern have already formed. While below this, the right shoulder may begin to form.”
“A dip near parity (the next few weeks) and then a rally above the proposed neckline at 1.0350/1.0375 would confirm a head-and-shoulders bottom. The bullish pattern measurements would imply a majority of the 2021-22 decline could be retraced, such as 1.0750, 1.0935/1.10 and possibly the 1.12s. The new highs in Relative Strength Index (RSI) are a favorable condition for a bottom pattern to form.”
UK Finance Minister Jeremy Hunt is presenting the Autumn Budget to parliament.
Key takeaways
"Our plan will tackle the cost of living crisis, rebuild economy."
"We will take difficult decisions to tackle inflation."
"Bank of England (BOE) has done an outstanding job, has my whole-hearted support."
"We will not change BOE remit."
"Unfunded tax cuts are as risky as unfunded spending."
Market reaction
The Pound Sterling stays on the back foot as Hunt presents the budget. As of writing, GBPUSD was trading at 1.1845, where it was down 0.6% on a daily basis.
Canadian Annual Consumer Price Index (CPI) stayed unchanged at 6.9% as expected. The continued risks of inflation are likely to keep the Bank of Canada busy, according to economists at Commerzbank.
Recent data on the economy, labour and property market was more robust than expected
“The overall rate remained stable at 6.9%, the core rates rose slightly as expected. The continued risks of inflation are likely to keep the Bank of Canada busy.”
“A step of at least 25 bps seems to be expected for the coming meeting in December, with some clearly expecting a bigger step. That is hardly surprising, as recent data on the economy, labour and property market was more robust than expected. The market seems to have partially priced in a 50 bps rate step.”
GBPUSD has gone into a consolidation phase near 1.1900. Economists at Société Générale expect the pair to see further gains towards the 1.2250/1.2300 resistance area.
Defending 1.1640/1.1600 could result in continuation of the up move
“Daily MACD has entered positive territory pointing towards prevalence of upward momentum in short-term.”
“Defending 1.1640/1.1600, the 23.6% retracement of recent rebound could result in continuation of the move.”
“The pair is likely to head higher towards projections near 1.2070. The 200-DMA and August high at 1.2250/1.2300 is expected to be an important resistance zone.”
- USDCAD gains traction for the second straight day and is supported by a combination of factors.
- Weaker oil prices undermine the Loonie and act as a tailwind amid a pickup in the USD demand.
- Traders now look forward to the US macroeconomic releases and Fedspeak for a fresh impetus.
The USDCAD pair builds on the overnight goodish rebound from the 100-day SMA support and edges higher for the second successive day on Thursday. The pair maintains its bid tone through the first half of the European session and is currently trading around mid-1.3300s, just a few pips below the weekly high touched earlier today.
Crude oil prices remain depressed near the monthly low, which, in turn, undermines the commodity-linked Loonie and acts as a tailwind for the USDCAD pair amid a modest pickup in the US Dollar demand. A new COVID-19 outbreak in China raises concerns over slowing fuel demand in the world's largest crude oil importer. This, to a larger extent, overshadows worries about tight global supplies and continues to weigh on the black liquid.
The USD, on the other hand, attracts some haven flows in the wake of a fresh leg down in the equity markets. Furthermore, Wednesday's upbeat US Retail Sales data might have forced investors to scale back their bets for a less aggressive policy tightening by the Fed. This is evident from an uptick in the US Treasury bond yields, which is seen as another factor benefitting the greenback and offering additional support to the USDCAD pair.
Apart from the aforementioned fundamental factors, the overnight failure near a technically significant 100-day SMA prompts traders to lighten their bearish bets around the USDCAD pair. Bulls, however, might wait for some follow-through strength beyond the 1.3360 area before positioning for any further intraday gains. Next on tap is the US economic docket, featuring the Philly Fed Manufacturing Index and the usual Weekly Initial Jobless Claims.
Traders will further take cues from speeches by a slew of influential FOMC members. This, along with the US bond yields and the broader risk sentiment, will drive the USD demand and provide some impetus to the USDCAD pair. Apart from this, oil price dynamics should also contribute to producing short-term trading opportunities around the major.
Technical levels to watch
Recent sharp appreciation trend of the Yuan against the Dollar is unlikely to be sustained in the near term, according to economists at MUFG Bank. USDCNY is set to move between the range of 7.00-7.15.
Upside risk for revaluation of CNY ahead
“COVID-19 management can be a challenging task, driving up the volatility of the Yuan in the near term, so, we see a volatile USDCNY to move in the range of 7.00-7.15.”
“With a clear determination of government in boosting Chinese economy and optimizing covid policies, we are holding a positive view for China’s medium growth (5.1% for 2023), and expect USDCNY to decline to 6.65 by the end of 2023.”
- EURUSD comes under pressure after faltering around 1.0400.
- The greenback recovers ground lost amidst higher yields.
- EMU final CPI figures showed the CPI rose 10.6% YoY in October.
Sellers now regain the upper hand and drag EURUSD well back below the 1.0400 region on Thursday.
EURUSD looks to US data, risk trends
EURUSD now trades on the defensive following two consecutive daily pullbacks on the back of some recovery in the greenback. On the latter, the USD Index looks to put further distance from recent lows in the 105.30 region (November 15) and climbs past the 106.50 region so far.
The corrective move in the pair is so far accompanied by another downtick – the fourth in a row – in the German 10-year bund yields.
In the domestic calendar, final inflation figures in the euro area saw the CPI rise 10.6% in the year to October and 5% when it comes to the Core CPI.
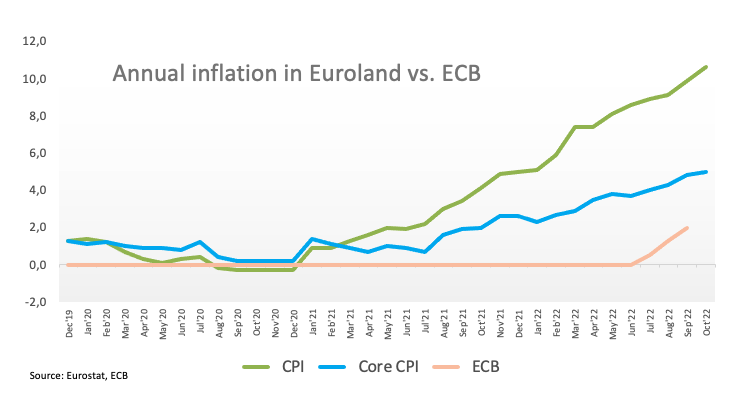
Across the ocean, weekly Initial Claims come first along with the Philly Fed Manufacturing Index, Building Permits and Housing Starts. Additionally, FOMC’s M.Bowman (permanent voter, centrist) and P.Jefferson (permanent voter, centrist) are also due to speak.
What to look for around EUR
EURUSD remains unable to print a daily close above the key 1.0400 mark so far, sparking some selling pressure as a consequence.
In the meantime, price action around the European currency is expected to closely follow dollar dynamics, geopolitical concerns and the Fed-ECB divergence. In addition, markets repricing of a potential pivot in the Fed’s policy has become the exclusive source of the sharp advance in the pair in recent sessions.
Back to the euro area, the increasing speculation of a potential recession in the region - which looks propped up by dwindling sentiment gauges as well as an incipient slowdown in some fundamentals – emerges as the main headwinds facing the euro in the short-term horizon.
Key events in the euro area this week: Final EMU Inflation Rate (Thursday) - ECB C.Lagarde (Friday).
Eminent issues on the back boiler: Continuation of the ECB hiking cycle vs. increasing recession risks. Impact of the war in Ukraine and the persistent energy crunch on the region’s growth prospects and inflation outlook.
EURUSD levels to watch
So far, the pair is retreating 0.28% at 1.0364 and a breach of 1.0024 (100-day SMA) would target 0.9925 (low November 10) en route to 0.9730 (monthly low November 3). On the other hand, the next up barrier comes at 1.0481 (monthly high November 15) seconded by 1.0500 (round level) and finally 1.0614 (weekly high June 27).
- Annual HICP in the Euro area climbed to 10.6% in October.
- EURUSD continues to trade in negative territory below 1.0400.
Annual inflation in the Euro area, as measured by the Harmonised Index of Consumer Prices (HICP), rose to 10.6% (final) in October from 9.9% in September. This reading came in slightly below the flash estimate and the market expectation of 10.7%.
The Core HICP, which excludes volatile food, energy, alcohol and tobacco prices, stood at 5% on a yearly basis in October, matching the initial estimate.
Market reaction
These figures don't seem to be having a noticeable impact on the Euro's (EUR) performance against its major rivals. As of writing, EURUSD was down 0.27% on the day at 1.0365.
EURUSD reined in below 200-Day Moving Average at 1.0419 after ECB reported yesterday that it may step down pace to 50 basis points in December. Therefore, the path for a higher Euro may be blocked, economists at Société Générale report.
Core inflation probably will fall back before mid-2023
“The likelihood of a step-down to 50 bps after two successive 75 bps increases in September and October would frankly not come as a huge surprise. Inflation in the euro area may not have peaked, and we are sceptical that core inflation will fall back before mid-2023, but price expectations have drifted lower over the past week in lock step with the US.”
“The forward curve to which President Lagarde has alluded in the past to acknowledge/adjust rate expectations fell below 60 bps for the December council meeting after US CPI one week ago. Yesterday markets shaved another 4.5 bps off to 55.8 bps before the ECB headlines crossed. With the report in hand, today could bring further convergence towards 50 bps and block the path for a higher Euro.”
“We are not rushing to take profits, but the failure of EURUSD to take out the 200DMA after a second day of trying suggests the buying has probably run its course.”
- GBPUSD comes under some selling pressure amid a modest pickup in the USD demand.
- An uptick in the US bond yields and the cautious market mood benefits the greenback.
- The downside seems limited as traders keenly await the UK government’s financial plan.
The GBPUSD pair retreats sharply from the daily high and drops to the lower end of its intraday range, around the 1.1870 region during the first half of the European session.
The US Dollar gains some positive traction and reverses the previous day's modest losses, which turns out to be a key factor exerting some pressure on the GBPUSD pair. Wednesday's upbeat US Retail Sales data might have forced investors to scale back their bets for a less aggressive policy tightening by the Fed. This is evident from an uptick in the US Treasury bond yields, which, along with the cautious market mood, offers some support to the safe-haven greenback.
Investors now seem concerned that a new COVID-19 outbreak in China will further dent economic activity amid rapidly rising borrowing costs. Apart from this, persistent geopolitical tension takes its toll on the global risk sentiment. That said, growing acceptance that the Bank of England will continue raising borrowing costs to combat stubbornly high inflation could act as a tailwind for the Sterling. This, in turn, should help limit any deeper losses for the GBPUSD pair.
Traders might also prefer to wait for the UK government's financial plan before placing aggressive bets and positioning for a firm near-term direction. Chancellor Jeremy Hunt will unveil his Autumn Statement later today and is expected to reduce the size of the fiscal gap. This will play a key role in driving the sentiment surrounding the British Pound. Apart from this, traders will take cues from the US macro data to grab short-term opportunities around the GBPUSD pair.
Thursday's US economic docket features the release of the Philly Fed Manufacturing Index and the usual Weekly Initial Jobless Claims later during the early North American session. This, along with speeches by a slew of FOMC members and the broader market risk sentiment, will influence the USD price dynamics and provide some meaningful impetus to the GBPUSD pair.
Technical levels to watch
Economists at Standard Chartered expect the Central Bank of the Republic of Türkiye (CBRT) to further cut the one-week repo rate to 9.0% on 24 November.
Easing cycle to continue amid rising risks
“We expect the CBRT to cut its weekly repo rate by a further 150 bps to 9.0% at its 24 November meeting.”
“We now expect the CBRT to cut the one-week repo rate by another 250 bps by end-2022 to 8.0% (10.0% prior).”
See: USDTRY to leapfrog to 27 or higher before emergency hikes stabilize the Lira – TDS
The Dollar has entered a consolidative mode. Today, several FOMC policymakers will be delivering speeches. Economists at ING favour further USD consolidation.
Softer Renminbi helps support the Dollar
“We note the rise in USDCNH which may be giving the Dollar a little support. Somewhat conversely, the better news out of China seems to be giving the local banks some problems. Here, retail investors have en masse withdrawn from Chinese bond markets in favour of equities, prompting authorities to check with local banks whether they have sufficient liquidity to meet these withdrawals.”
“For today, we have five Fed speakers. Market pricing for the 14 December FOMC meeting is settling on a 50 bps hike – such that any further reference to that today need not demand a much weaker Dollar.”
“Our slight bias near term is that long Dollar position adjustment may have a little further to run, but that something like the 105 area in DXY proves a 4Q22 base.”
The prospect for extra downside in USDCNH seems to have lost some traction as of late, comment UOB Group’s Economist Lee Sue Ann and Markets Strategist Quek Ser Leang.
Key Quotes
24-hour view: “Yesterday, we held the view that USD ‘is likely to trade with an upward bias but is not expected to break 7.0850’. However, USD rose more than expected as it soared to a high of 7.1110. The advance appears to be running ahead but there is room for USD to test 7.1200 first before the risk of a pullback increases. We do not expect a sustained advance above 7.1200. On the downside, a break of 7.0800 (minor support is at 7.0950) would indicate that the current upward pressure has subsided.”
Next 1-3 weeks: “Two days ago (15 Nov, spot at 7.0465), we highlighted that there is room for USD to drop further to 7.0130 but oversold short-term conditions could lead to consolidation first. We added, “only a break of 7.1200 would indicate that USD is not weakening further”. Yesterday, USD rose to a high of 7.1110. Downward momentum has waned and the chance of further USD weakness has diminished. Looking ahead, a break of 7.1200 would indicate that USD has moved into a consolidation phase.”
- EURGBP falls to a one-week low on Thursday, though shows resilience below the 0.8700 mark.
- The formation of a rectangle warrants some caution before placing aggressive directional bets.
- Investors now await the UK government’s financial plan to determine the near-term trajectory.
The EURGBP cross comes under some selling pressure on Thursday and extends the overnight pullback of over 50 pips from the 0.8775 region. The downfall drags spot prices to a one-week low during the first half of the European session, though bulls show some resilience below the 0.8700 round-figure mark.
The British Pound's relative outperformance comes amid growing acceptance that the Bank of England will continue raising borrowing costs to combat stubbornly high inflation. The bets were reaffirmed by the release of hotter-than-expected UK consumer inflation print, which accelerated to a 41-year high in October. This, in turn, is seen as a key factor exerting some downward pressure on the EURGBP cross.
The downside, however, remains cushioned as traders seem reluctant and prefer to move to the sidelines ahead of the UK government's financial plan. Furthermore, talks for a more aggressive policy tightening by the European Central Bank, along with the prevalent US Dollar selling bias, underpin the Euro. The combination of the aforementioned factors further contributes to limiting losses for the EURGBP cross.
From a technical perspective, the recent range-bound price action witnessed over the past two weeks or so constitutes the formation of a rectangle pattern on short-term charts. This marks a consolidation phase and points to indecision over the next leg of a directional move for the EURGBP cross. Moreover, neutral technical indicators on the daily chart haven't been supportive of a firm near-term direction.
Hence, it will be prudent to wait for a sustained break through the trading range before confirming the near-term trajectory for the EURGBP cross. In the meantime, the 0.8700-0.8690 region might continue to protect the immediate downside. A convincing break below will mark a bearish breakdown and drag spot prices back towards the 100-day SMA support, currently pegged around the 0.8610-0.8600 zone.
On the flip side, the 0.8775-0.8780 area might continue to act as a strong immediate hurdle. Some follow-through buying could lift the EURGBP beyond the 0.8800 mark, towards testing the trading range resistance, around the 0.8820-0.8825 region. A sustained strength beyond the latter will be seen as a fresh trigger for bullish traders and set the stage for a further near-term appreciating move.
The EURGBP cross might then accelerate the momentum towards the 0.8850-0.8860 resistance zone. The subsequent positive move has the potential to lift spot prices to the 0.8900 mark. The momentum could further get extended towards an intermediate resistance around the 0.8945-0.8950 en route to the next major hurdle near the 0.9000 psychological mark.
EURGBP 4-hour chart
-638042729900913481.png)
Key levels to watch
Chancellor Jeremy Hunt is under particular scrutiny when he delivers his statement to the House of Commons today. Although the Autumn Statement could regain market confidence, GBP negative arguments remain valid, economists at Commerzbank report.
Hunt’s scope to face down the looming recession with fiscal measures is very limited
“Hunt will mainly have to try today to justify the advance confidence the gilt and Sterling traders have shown in him. And that in turn means: Hunt’s scope to face down the looming recession with fiscal measures is very limited.”
“A recession that cannot be cushioned with fiscal measures will be deeper. And that in turn is likely to make it even more difficult for the Bank of England to fight inflation at the same time.”
“As understandable as it is that the FX market is trading Sterling at higher levels since Kwarteng’s plans have been consigned to the dustbin of disastrous economic plans and as much as jubilation could be caused today by Hunt avoiding these same mistakes one should nonetheless consider that the GBP negative arguments remain valid.”
EURUSD remains in corrective mode. In the view of economists at ING, Euro could be dragged around by Sterling as focus shifts to UK Autumn Budget.
1.0270-1.0500 remains expected near-term trading range
“Euro is not reacting much to press reports of the ECB favouring a 50 bps over a 75 bps hike in December. Notably, the FX options market has shown no more signs of distress – i.e. investors are not scrambling to buy euro call options – and one can argue that this makes the 1.05 area a slightly firmer ceiling for 4Q22.”
“Expect EURUSD to be dragged around by GBPUSD today – just as it was in September. 1.0270-1.0500 remains our expected near-term trading range for EURUSD.”
- The index navigates the lower end of the range near 106.00.
- US yields look steady around Wednesday’s close across the curve.
- Weekly Claims, Philly Fed Index next on tap in the US docket.
The USD Index (DXY), which gauges the greenback vs. a bundle of its main competitors, alternates gains with losses just above the 106.00 region on Thursday.
USD Index focuses on upcoming data
The index continues to struggle to leave behind the recent weakness and gyrates around the low-106.00s against the backdrop of a mild bias towards the risk-associated universe.
The offered stance in the buck so far comes pari passu with the lack of traction in US yields across the curve, at a time when investors seem to have practically digested the likeliness of a discussion of a pivot at the next Fed event on December 14.
In the US data space, usual Initial Claims are due seconded by the Philly Fed Manufacturing Index, Building Permits and Housing Starts. In addition, FOMC’s M.Bowman (permanent voter, centrist) and P.Jefferson (permanent voter, centrist) are also due to speak.
What to look for around USD
Price action around the dollar remains depressed and relegates the index to navigate in the area of multi-month lows near the 106.00 zone.
In the meantime, the greenback is expected to remain under the microscope amidst persistent investors’ repricing of a probable slower pace of the Fed’s rate path in the upcoming months.
Key events in the US this week: Building Permits, Initial Jobless Claims, Housing Starts, Philly Fed Index (Thursday) - CB Leading Index, Existing Home Sales (Friday).
Eminent issues on the back boiler: US midterm elections. Hard/soft/softish? landing of the US economy. Prospects for further rate hikes by the Federal Reserve vs. speculation of a recession in the next months. Fed’s pivot. Geopolitical effervescence vs. Russia and China. US-China persistent trade conflict.
USD Index relevant levels
Now, the index is retreating 0.04% at 106.24 and the breakdown of 105.34 (monthly low November 15) would open the door to 105.00 (200-day SMA) and finally 104.63 (monthly low August 10). On the other hand, the next up barrier aligns at 109.13 (100-day SMA) seconded by 110.81 (55-day SMA) and then 113.14 (monthly high November 3).
The continuation of the downtrend in USDJPY should not be ruled out in the near term, suggest UOB Group’s Economist Lee Sue Ann and Markets Strategist Quek Ser Leang.
Key Quotes
24-hour view: “We highlighted yesterday that USD “could continue to trade in a volatile manner between 138.35 and 140.35”. USD subsequently traded within a narrower range than expected (138.72/140.29). The price actions are likely part of a consolidation and we expect USD to trade within a range of 138.90/140.20 today.”
Next 1-3 weeks: “There is not much to add to our update from yesterday (16 Nov, spot at 139.35). As highlighted, further USD weakness is not ruled out, but the solid support at 137.60 may not come into view so soon, if at all. On the upside, a break of 140.80 (no change in ‘strong resistance’ level from yesterday) would indicate that USD is unlikely to weaken further.”
- AUDUSD attracts some dip-buying on Thursday, though the lacks follow-through.
- Bets for smaller rate hikes by the Fed and a positive risk tone weigh on the buck.
- China’s COVID-19 woes and a dovish RBA stance should cap any further upside.
The AUDUSD pair reverses its intraday dip to sub-0.6700 levels and climbs back closer to the top end of its daily range during the early European session. The pair is currently placed just below mid-0.6700s and for now, seems to have stalled its pullback from a two-month high touched earlier this week.
The US Dollar continues with its struggle to register any meaningful bounce from its lowest level since August 12, which, in turn, is seen as a key factor offering support to the AUDUSD pair. Investors now seem convinced that the Federal Reserve will soften its hawkish stance to avoid recession. This, along with a goodish recovery in the US equity futures, undermines the safe-haven greenback and benefits the risk-sensitive Aussie.
That said, concerns about economic headwinds stemming from a new COVID-19 outbreak in China might keep a lid on any optimistic move in the markets. Furthermore, Wednesday's upbeat US Retail Sales data might have forced investors to scale back their bets for a less aggressive policy tightening by the Fed. This, along with the risk of a further escalation of geopolitical tensions, could act as a tailwind for the buck and cap the AUDUSD pair.
Adding to this, a rather muted reaction to the mostly upbeat Australian employment details suggests that the path of least resistance for the AUDUSD pair is to the downside. In fact, the official data showed that the number of employed people in Australia rose by 32.2K in October, beating expectations for a reading of 15K. Moreover, the domestic jobless rate dropped to a nearly five-decade low level of 3.4% during the reported month.
Investors, however, seem convinced that the figures were not strong enough for the Reserve Bank of Australia to shift from its dovish course. Hence, any subsequent move-up might continue to attract some sellers at higher levels and runs the risk of fizzling out quickly. That said, a sustained move beyond the 0.6800 mark will negate the negative outlook and trigger a fresh bout of a short-covering move around the AUDUSD pair.
Moving ahead, traders now look forward to the US economic docket - featuring the release of the Philly Fed Manufacturing Index and Weekly Initial Jobless Claims. Apart from this, speeches by a slew of influential FOMC members will drive the USD demand and provide some meaningful impetus to the AUDUSD pair. This, along with the broader risk sentiment, might contribute to producing short-term trading opportunities around the major.
Technical levels to watch
CME Group’s flash data for natural gas futures markets noted open interest rose by around 3.7K contracts following three consecutive daily pullbacks on Wednesday. In the same line, volume went up by around 114.3K contracts after two daily drops in a row.
Natural Gas keeps the target at the 200-day SMA
Wednesday’s gains in prices of natural gas were against the backdrop of increasing open interest and volume, which is indicative that the continuation of the rebound looks in place for the time being. Against that, the next upside target for the commodity appears at the 200-day SMA, today around $6.85 per MMBtu.
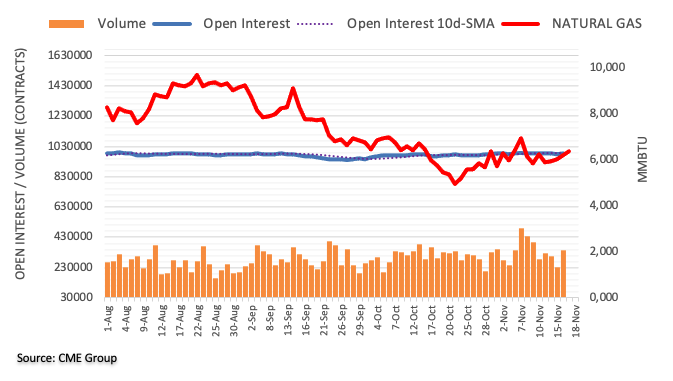
The Kiwi seems comfortable in the high-0.61s. Can it advance to fair value and benefit from China reopening? Analysts at ANZ Bank discuss the NZDUSD outlook.
Technicals still look reasonably bullish
“Now that there is growing confidence that the USD cycle has peaked, our focus is on the NZD’s gap to fair value (which we see at ~0.65), on the RBNZ – who look well placed to close the gap on US interest rates, and on China’s re-opening, which ought to be good for commodities. But it’s complex given late-cycle fears the Fed’s still fairly resolute tone.”
“Technicals still look reasonably bullish, in our view.”
“Support 0.5875/0.6000 Resistance 0.6235/0.6470/0.6575”
The USD Index (DXY) has been trading sideways since the start of the week. In the opinion of economists at Commerzbank, the slide in USD is likely to have come to an end.
Levels around 1.04 are the new comfort level in EURUSD
“The slide in USD can be seen to be over now. It is possible that some people haven’t noticed that it is over and are only holding USD shorts because they think that other market participants were still selling the greenback (one should never underestimate stupidity!) but it is unlikely.”
“Levels around 1.04 are the new comfort level in EURUSD. It seems to me that the scenario of an inflation which central banks cannot get under control seems to have been priced out as a result.”
“Further USD weakness might follow at a later stage once inflation starts turning globally and a more or less rapid return to inflation targets (or at least close to these levels) seems more likely.”
“In the meantime, it has become a generally accepted fact that both the Fed and the ECB are likely to reduce the speed of its key rate hikes. If that were to happen this will take place on both sides of the Atlantic and thus almost in synchronicity, and as a result, the slowing should be more or less neutral for EURUSD.”
In the opinion of UOB Group’s Economist Lee Sue Ann and Markets Strategist Quek Ser Leang, NZDUSD faces extra advances while above the 0.6200 level in the short-term horizon.
Key Quotes
24-hour view: “Yesterday, we expected NZD to consolidate between 0.6100 and 0.6180”. NZD subsequently traded within a range of 0.6129/0.6190 before closing at 0.6146 (-0.19%). We continue to expect NZD to consolidate even though the slightly weak underlying tone suggests a lower range of 0.6100/0.6180.”
Next 1-3 weeks: “After NZD soared to 0.6204 and pulled back, we highlighted yesterday (16 Nov, spot at 0.6135) that NZD has to move and stay above 0.6200 within these 1-2 days of the chance of further NZD strength will diminish quickly. There is no change in our view. On the downside, a breach of 0.6070 (no change in ‘strong support’ level from yesterday) would indicate that NZD is not ready to break clearly above 0.6200 (next resistance is at 0.6250).”
Considering advanced results from CME Group for crude oil futures markets, traders scaled back their open interest positions for the second day in a row on Wednesday, this time by around 26.8K contracts. In the same direction, volume left behind two consecutive daily builds and went down by more than 246K contracts.
WTI looks supported around $84.00 so far
Wednesday’s negative price action in crude oil was in tandem with diminishing open interest and volume and suggests that further decline is not favoured in the very near term. Against that, the WTI could move into a consolidative phase while a decent support seems to have emerged around the $84.00 mark per barrel so far.
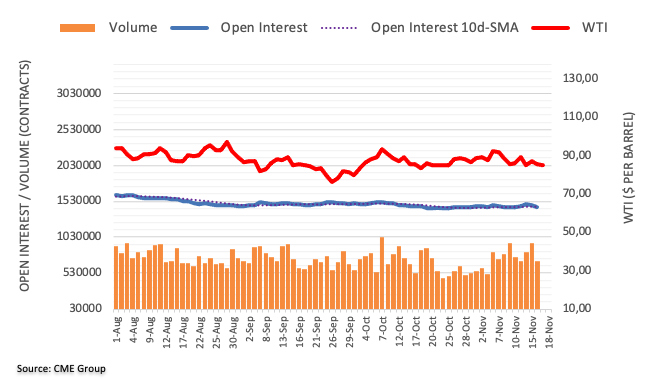
Today's FX highlight will be the UK's Autumn Statement. Given that the UK's bond market has largely regained its composure from the sell-off in September, analysts at ING struggle to see what upside there is for Sterling today. Positioning could be the wild card, however.
EURGBP should find support near 0.86/87
“Investor views of UK fiscal credibility have largely returned to pre-Truss levels, where the 10-year German Bund-Gilt spread is now 115 bps (versus 228 bps in September) and the UK's 5-year sovereign CDS has narrowed to 27 bps from 52 bps. Arguably then, the positive re-assessment of the UK fiscal position has largely taken place and suggests that GBP does not have to rally a lot more on a credible budget.”
“A credible budget will deliver substantial fiscal tightening and cement views of a multi-quarter UK recession and one in which the Bank of England will continue to hike rates into 2023. As a pro-cyclical currency, this cannot be a good environment for Sterling.”
“We expect GBPUSD to be unable to hold any gains above 1.20 and prefer sub 1.15 levels before year-end. Equally, EURGBP should find support near 0.86/87.”
“The only thing going for Sterling is buy-side positioning. It is hard to see what Sterling positives the market could take from today's budget – but there is an outside risk that investors have some residual Sterling shorts to cover. Near-term outside risk is a very painful Sterling short-squeeze taking GBPUSD to 1.23. However, that squeeze should not last long.”
- Silver drops to a one-week low on Thursday, though finds support ahead of the $21.00 mark.
- The mixed technical setup warrants some caution before placing aggressive directional bets.
- A convincing break below the $21.00 mark is needed to support prospects for further losses.
Silver extends this week's retracement slide from over a five-month high and remains under some selling pressure for the third successive day on Thursday. The white metal, however, finds some support ahead of the $21.00 mark and recovers a part of its intraday losses to a one-week low. The XAGUSD steadily bounces to the $21.35-$21.40 region during the early European session, though lacks follow-through and still seems vulnerable.
Repeated failures to find acceptance above the $22.00 round figure and a subsequent slide back below the 200-hour SMA suggest that the recent rally might have run out of steam. A sustained break below the $21.00 mark will reaffirm the negative bias and pave the way for a slide towards the next relevant support near the $20.40-$20.35 region. The corrective decline could get extended and drag spot prices to the $20.00 psychological mark.
That said, oscillators on the daily chart - though have been retreating - are still holding comfortably in bullish territory. This might hold back traders from placing aggressive bearish bets around the XAGUSD and help limit deeper losses, at least for the time being.
Meanwhile, on the upside strength beyond the $21.40-$21.50 immediate hurdle might attract some sellers near the $21.70 horizontal barrier and remain capped around the $22.00 round-figure mark. This is closely followed by the multi-month peak, around the $22.25 region, which if cleared will set the stage for additional gains. The XAGUSD might then accelerate the momentum to the $22.50-$22.60 supply zone and eventually reclaim the $23.00 mark.
Silver 1-hour chart
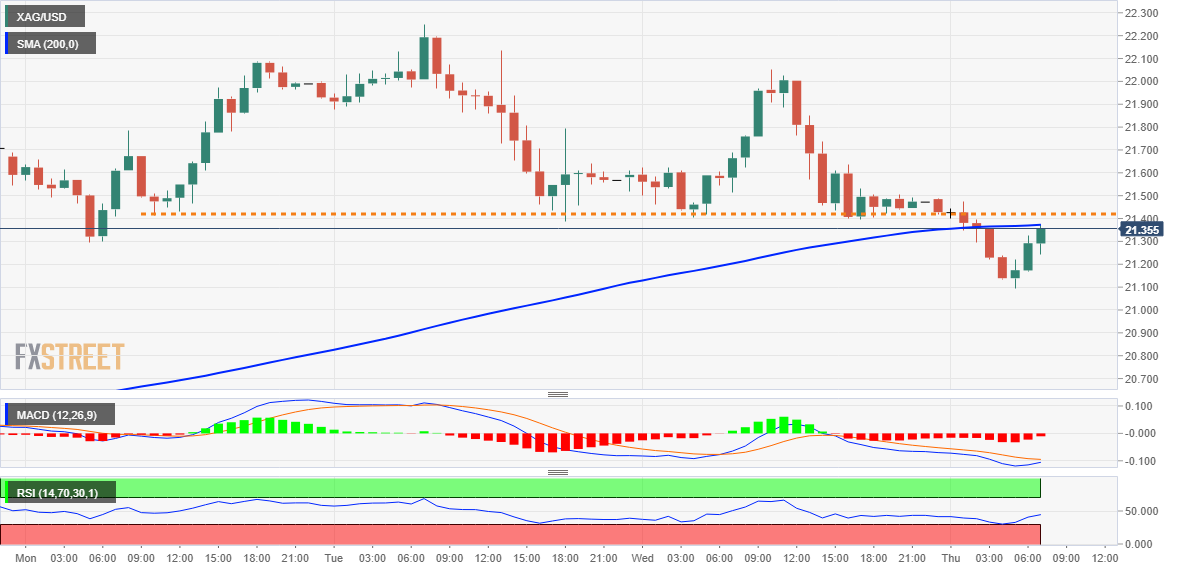
Key levels to watch
Aussie jobs beat expectations in headline and Unemployment Rate. Thus, economists at ANZ Bank expect the RBA to deliver a 25 basis points hike next month.
Strong Australia employment statistics
“A solid labour market result in October combined with the strong Q3 wage data yesterday points to another 25 bps hike by the RBA at its December meeting.”
“Employment rose 32K, driven by a jump in full-time employment (+47K). This exceeded the estimated 23K population increase in the month, reflecting higher immigration.”
“Unemployment and underemployment each edged down 0.1ppt to 3.4% and 5.9% respectively, taking underutilisation to 9.3%, the lowest in 40 years.”
Economists at TD Securities think the Chinese Yuan is likely to maintain downward trajectory versus the US Dollar. USDCNY is set to reach 7.40 by the end of the year.
It is hard to be optimistic on CNY
“Without a clear roadmap out from its zero-COVID strategy, it is hard to be optimistic on CNY, with growth prospects increasingly dim and the PBoC keeping to an accommodative monetary policy stance to support growth.”
“We expect a further depreciation of the CNY in the months ahead and see USDCNY ending at 7.40 by end 2022 though we expect some outperformance relative to forwards.”
Here is what you need to know on Thursday, November 17:
Although geopolitical tensions seem to have escalated, investors remain cautious early Thursday and major currency pairs trade in tight ranges. The US Dollar Index holds steady above 106.00 and the 10-year US Treasury bond yield stays calm at around 3.7%. Eurostat will release the final October Core Harmonized Index of Consumer Prices (HICP) and British Chancellor Jeremy Hunt will present the Autumn Budget to parliament. In the second half of the day, October Housing Starts, Building Permits and the weekly Initial Jobless Claims will be featured in the US economic docket. In the second half of the day, several FOMC policymakers will be delivering speeches as well.
Despite the better-than-expected Retail Sales data from the US, safe-haven flows continued to dominate the financial markets on Wednesday. Although Wall Street's main indexes turned south after the opening bell, the US Dollar struggled to benefit from the souring market mood as investors continued to price in a smaller rate increase in December. According to the CME Group FedWatch Tool, the probability of a 50 basis points Federal Reserve hike currently stands at 85%.
During the Asian trading hours, the data from Australia showed that the Unemployment Rate edged lower to 3.4% in October from 3.5% in September. This reading came in better than the market expectation of 3.6%. Further details of the jobs report revealed that Employment Change was +32.2K, compared to analysts' estimate of 15K. AUDUSD declined to the 0.6700 area with the initial reaction but managed to erase a large portion of its daily losses heading into the European session.
Statistics Canada reported on Wednesday that the Annual Consumer Price Index (CPI) stayed unchanged at 6.9% as expected. USDCAD showed no immediate reaction to the inflation data but falling crude oil prices allowed the pair to close in positive territory above 1.3300. At the time of press, the pair was trading flat on the day at around 1.3330.
While testifying before the UK Treasury Select Committee, Bank of England (BOE) Governor Andrew Bailey said that they will still likely increase rates further but noted that they were observing signs that supply chain shock was starting to fade. GBPUSD ended up posting small daily gains on Wednesday before going into a consolidation phase near 1.1900 on Thursday. British Chancellor Jeremy Hunt said that they need tax hikes and spending cuts to weather the economic storm. Hunt is widely expected to announce a package of tax increases worth £25 billion and spending cuts of £35 billion in the Autumn Budget.
EURUSD stays quiet below 1.0400 early Thursday. European Central Bank (ECB) Vice President Luis de Guindos said on Wednesday that the "balance sheet reduction must be implemented with prudence" and added that they were planning to start with a passive quantitative tightening.
USDJPY is having a difficult time making a decisive move in either direction and moving sideways in a narrow range below 140.00. Bank of Japan (BoJ) Governor Haruhiko Kuroda said earlier in the day that they were expecting CPI growth to fall below 2% in the next fiscal year with "cost-push" factors tapering off.
Gold snapped a four-day winning streak on Wednesday and continued to edge lower early Thursday. XAUUSD trades below $1,770 as the 10-year US T-bond yield holds steady.
Bitcoin extends its sideways grind near $16,500 and Ethereum is down more than 1% at around $1,200.
In light of the recent price action, GBPUSD could now attempt some consolidation in the short term, according to UOB Group’s Economist Lee Sue Ann and Markets Strategist Quek Ser Leang.
Key Quotes
24-hour view: “We highlighted yesterday that GBP ‘is unlikely to strengthen further’ and we expected it to ‘trade sideways between 1.1800 and 1.1950’. GBP subsequently traded within a narrower range than expected (1.1834/1.1942). The underlying tone has firmed somewhat and GBP could edge higher today. However, any advance is likely limited to a test of 1.1970. Tuesday’s high at 1.2027 is not expected to come under challenge. Support is at 1.1850, but only a break of 1.1800 would indicate that the current mild upward pressure has eased.”
Next 1-3 weeks: “Yesterday (16 Nov, spot at 1.1880), we indicated that GBP could consolidate for a couple of days first before making another push higher. We added, “the chance for a clear break of the next major resistance at 1.2100 does not appear to be high now”. There is no change in our view. It is worth noting that 1.2027 is already a rather solid resistance level. On the downside, a break of 1.1750 (no change in ‘strong support’ level from yesterday) would indicate that the rally in GBP is ready to take a breather.”
- GBPJPY is seen oscillating in a narrow trading band around the 166.00 mark.
- Expectations for further rate hikes by the BoE continue to lend some support.
- Bulls now await the UK government's financial plan before placing fresh bets.
The GBPJPY cross struggles to gain any meaningful traction and seesaws between tepid gains/minor losses through the early European session on Thursday. The cross is currently placed near the top end of its weekly range, just above the 166.00 mark, awaiting the UK government's financial plan before the next leg of a directional move.
Chancellor Jeremy Hunt will unveil his Autumn Statement later today and is expected to reduce the size of the fiscal gap. This will play a key role in influencing the sentiment surrounding the British Pound and help determine the near-term trajectory for the GBPJPY cross. In the meantime, growing acceptance that the Bank of England will continue raising borrowing costs to combat stubbornly high inflation acts as a tailwind for the Sterling.
The bets were reaffirmed by Wednesday’s release of hotter-than-expected UK consumer inflation figures, which showed that the headline CPI accelerated to a 41-year high of 11.1% in October. Furthermore, BoE Governor Andrew Bailey said on Wednesday that Britain's very tight labour market was a key reason why further interest rate increases were likely. This, along with a softer Japanese Yen, continues to lend some support to the GBPJPY cross.
The initial market reaction to the latest geopolitical development fades rather quickly after early findings point to the missile that hit Poland on Tuesday being accidentally fired by Ukrainian forces. Apart from this, a more dovish stance adopted by the Bank of Japan is seen undermining the safe-haven JPY. In fact, Governor Haruhiko Kuroda said on Thursday that it is important to continue monetary easing to support the economy.
The fundamental backdrop supports prospects for a further near-term appreciating move for the GBPJPY cross, though bulls prefer to wait on the sidelines ahead of the key event risk. This makes it prudent to wait for some follow-through buying before positioning for additional intraday gains. That said, any meaningful downtick could attract some buyers near the 100-day SMA support, which should now act as a key pivotal point.
Technical levels to watch
Open interest in gold futures markets shrank by more than 16K contracts on Wednesday, extending the downtrend for the third session in a row according to preliminary readings from CME Group. Volume followed suit and dropped by around 123.2K contracts.
Gold: Further upside targets the 200-day SMA
Gold prices corrected from recent peaks and printed humble losses on Wednesday. The downtick, however, was on the back of a marked pullback in open interest and volume, leaving the prospects for a deeper retracement diminished in the very near term. The continuation of the recent upside should meet the next hurdle of note at the critical $1,800 mark per ounce troy, which coincides with the equally relevant 200-day SMA ($1,802).
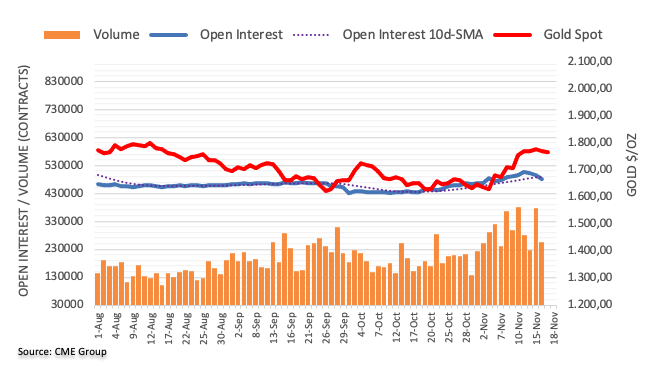
- USDIDR prints four-day uptrend, seesaws around intraday high of late.
- Bank Indonesia is likely to increase benchmark rate by 50 bps.
- Upside break of fortnight-old resistance line could refresh multi-month high.
- 21-DMA, ascending trend line from late September restrict short-term downside.
USDIDR grinds higher as it braces for the Bank Indonesia (BI) Rate announcement during early Thursday, poking one-week high near $15,700 during a four-day uptrend by the press time.
The BI is ready to announce this year’s fourth rate hike to tame the inflation fears in the Asian economy. That said, the Indonesian central bank is likely to lift the rate by 50 bps to 5.25%, a three-year high during today’s monetary policy meeting.
As a result, a downward-sloping resistance line from November 04, around $15,720 by the press time, gains major attention as a successful break of which could quickly refresh the multi-month high marked earlier in November at around $15,745.
In that case, the $16,000 threshold may entertain USDIDR bulls before directing them to the yearly 2020 peak surrounding $16,740.
Alternatively, pullback moves remain elusive unless breaking the 21-DMA support near $15,615.
Even so, a seven-week-old ascending support line could challenge the USDIDR bears near $15,425.
It should be noted that an ascending trend line from August 2022, close to $15,160 at the latest, appears the last defense of the USDIDR bulls.
USDIDR: Daily chart
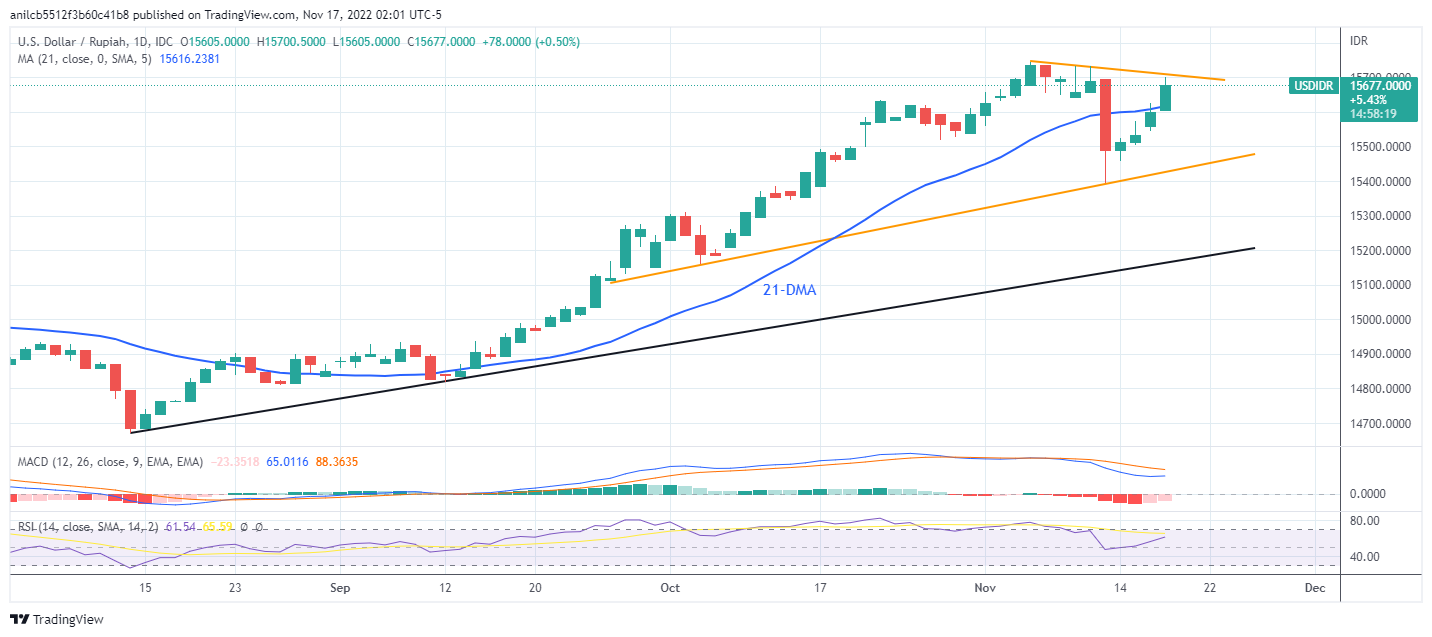
Trend: Further upside expected
Gold retreats further from a multi-month top. The yellow metal could extend its slide on a break under $1,745, FXStreet’s Haresh Menghani report.
100-hour SMA near the $1,768 region seems to cap the immediate upside
“The weekly low, around the $1,753 region, might protect the immediate downside ahead of the $1,745 area below which Gold is likely to extend the ongoing corrective pullback. The next relevant support is pegged near the 200-hour SMA, currently around the $1,732-$1,731 region, also marking a strong horizontal resistance breakpoint. Some follow-through selling could drag the XAUUSD towards the $1,720 level, or the 38.2% Fibo. level, en route to the $1,700 mark.”
“The 100-hour SMA, currently near the $1,768 region, now seems to cap the immediate upside. A sustained strength beyond has the potential to lift Gold back towards the multi-month peak, around the $1,783-$1,786 region. Bulls might then aim to reclaim the $1,800 psychological mark. The said handle coincides with a technically significant 200-day SMA, which if cleared decisively should pave the way for a further appreciating move.”
UOB Group’s Economist Lee Sue Ann and Markets Strategist Quek Ser Leang note further upside in EURUSD is expected to meet a strong hurdle around 1.0480.
Key Quotes
24-hour view: “We highlighted yesterday that the outlook for EUR is mixed and we expected it to ‘trade in a choppy manner between 1.0270 and 1.0420’. However, EUR rose to a high of 1.0438 before easing off. The price actions appear to be part of a consolidation and we expect EUR to trade sideways between 1.0340 and 1.0440 today.”
Next 1-3 weeks: “Our update from yesterday (16 Nov, spot at 1.0350) still stands. As indicated, as long as the ‘strong support’ level at 1.0260 (level was at 1.0230 yesterday) is not taken out, EUR could continue to advance. However, Tuesday’s high of 1.0480 is acting as a solid resistance and EUR may find this level difficult to break.”
- Gold price pares intraday losses, keeps the previous day’s pullback from three-month high.
- Sluggish sentiment, US Dollar rebound also favor XAUUSD bears.
- Multiple hurdles around $1,770-80 challenge gold price upside as bulls run out of steam.
Gold price (XAUUSD) holds onto the recent pullback from a multi-day high, despite the latest bounce off intraday low, as a firmer US Dollar joins mixed sentiment to challenge the commodity buyers of late. In doing so, the precious metal takes clues from increasing Covid woes in China and the recently firmer US data, namely the Producer Price Index (PPI) and Retail Sales for October, which raised doubts about the US Federal Reserve’s (Fed) east rate hikes. Also weighing on the gold price are the fears of the US political deadlock as Republicans are up for winning a majority in the House of Representatives while the Democratic Party holds control of the Senate. It should be noted, however, that an absence of major data/events could allow the XAUUSD to pare recent losses in case of surprises.
Also read: Gold Price Forecast: XAUUSD bulls lose grip as investors reassess future Fed rate hikes
Gold Price: Key levels to watch
The Technical Confluence Detector shows that the gold price retreats from a jungle of resistance below $1,778 as it pares the biggest weekly gains since March 2020.
Among them, a convergence of the previous high on weekly and Pivot Point One-Day S1, as well as the 100-HMA, restricts the immediate upside of the gold price at around $1,769.
Following that, the middle band of the Bollinger on the four-hour play joins the Pivot Point One-Month R2 and Fibonacci 23.6% on D1 to highlight $1,773 as a tough nut to crack for the XAUUSD bulls.
It’s worth noting that the $1,778 level appears the last defense of the gold bears. That said, the hurdle encompasses Fibonacci 38.2% on D1.
Alternatively, Pivot Point One-Day S2 and lower Bollinger on the hourly play restrict the immediate downside of the yellow metal near $1,762.
In a case where the gold price breaks $1,762 support, a slump to the Pivot Point One-Day S3, near $1,754, appears imminent before directing the XAUUSD bears towards Fibonacci 23.6% on Weekly formation, at $1,744.
Here is how it looks on the tool
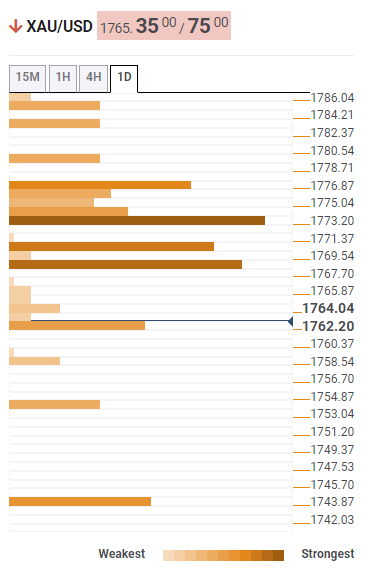
About Technical Confluences Detector
The TCD (Technical Confluences Detector) is a tool to locate and point out those price levels where there is a congestion of indicators, moving averages, Fibonacci levels, Pivot Points, etc. If you are a short-term trader, you will find entry points for counter-trend strategies and hunt a few points at a time. If you are a medium-to-long-term trader, this tool will allow you to know in advance the price levels where a medium-to-long-term trend may stop and rest, where to unwind positions, or where to increase your position size.
- NZDUSD has picked bids from 0.6120 amid obscurity in the market sentiment.
- The DXY is displaying a volatile performance and has surrendered intraday gains.
- The 10-year US Treasury yields have eased to 3.71% despite hawkish commentary from Fed’s Daly.
The NZDUSD pair has witnessed buying interest after dropping to near 0.6120 in the Asian session. The asset has picked bids as the US dollar index (DXY) has turned volatile after facing selling pressure around the critical hurdle of 106.60. Market mood is displaying mixed cues as DXY has witnessed offers despite mounting geopolitical tensions between North Korea and the US.
It could be possible that market participants must be awaiting further development on North Korea-US noise for making informed decisions. The DXY has surrendered the majority of its intraday gains and is likely to remain on tenterhooks as US economic calendar has nothing much to offer this week.
Meanwhile, S&P500 futures are displaying topsy-turvy moves amid ambiguity in the risk impulse. The returns generated by long-term US government bonds have trimmed to 3.71% after printing an intraday high of 3.73%. Higher interest rate guidance by San Francisco Federal Reserve (Fed) President Mary Daly has failed to strengthen US yields.
Fed policymaker has considered a range of 4.75% - 5.25% as reasonable for the policy rate end-point. She further added that the central bank wants to see a slowdown in the economy to cool down the red-hot inflation.
On the NZ front, accelerating Covid-19 infections have not impacted the kiwi dollar much. Gita Gopinath, the first Deputy Managing Director of the International Monetary Fund (IMF), at the Caixin Summit, cited that “Calibrating China's zero-COVID strategy to mitigate the country's economic impact will be critical to sustain and balance the recovery,” This might impact recovery in the antipodean ahead.
- USDJPY struggles to consolidate the biggest weekly loss since October 2008, sidelined of late.
- BOJ officials defend easy money policies despite showing readiness to act.
- US 10-year Treasury yields snap three-day downtrend, two-year bond coupons extend previous day’s rebound.
- US Dollar cheers firmer Treasury yields, sour sentiment to pare weekly loss.
USDJPY remains sidelined around 139.40 despite the latest pullback from the intraday high during early Thursday morning in Europe. In doing so, the Japanese Yen pair portrays the market’s inaction, as well as mixed comments from the Bank of Japan (BOJ) policymakers.
Earlier in the day, BOJ Governor Haruhiko Kuroda mentioned, “(It is) Important to continue monetary easing to support the economy.” On the same line, Senior BOJ Executive Director Shinichi Uchida stated that it is too early to discuss an exit from monetary stimulus. However, BOJ Deputy Governor Hiroshi Nakaso mentioned that the central banks must remove emergency support measures once financial crises are over to avoid causing a moral hazard in the market.
On the other hand, the US 10-year Treasury yields print the first daily gains in four around 3.71% while the two-year bond coupon rise for the second consecutive day to 4.37% by the press time.
It’s worth noting that the recently firmer US data, namely the Producer Price Index (PPI) and Retail Sales for October raised doubts about the US Federal Reserve’s (Fed) next moves and underpin the US Dollar’s recovery moves. That said, US Dollar Index (DXY) snaps a two-day downtrend as it prints mild gains around 106.50 by the press time.
Amid these plays, S&P 500 Futures and equities in the Asia-Pacific zone grind lower of late and propel the USDJPY prices due to the US Dollar’s safe-haven demand.
Furthermore, China’s covid woes and geopolitical concerns surrounding Russia joined a wider trade deficit in Japan during October to also favors the USDJPY buyers of late.
Looking forward, USDJPY traders should pay attention to the risk catalysts amid a lack of data ahead of the US Weekly Jobless Claims and Philadelphia Fed Manufacturing Survey for November. Should the numbers arrive firmer, the US Dollar recovery is likely to persist.
Technical analysis
Despite the latest inaction, the USDJPY pair’s sustained trading below an upward-sloping resistance line from March, previous support around 141.45, keeps the bears hopeful of renewing the monthly low, currently around 137.65.
Short bets on major Asian currencies were scaled back amid hopes the region's economic outlook would benefit from China easing its COVID-19 restrictions and that the Federal Reserve would temper its rate hikes, a Reuters poll showed on Thursday.
Additional findings
Bearish positions in China's Yuan and Thailand's Baht were at their lowest since April, while market participants turned marginally bullish on the Singapore Dollar, a fortnightly poll of 11 analysts showed.
A major catalyst behind the return of some optimism was the weakness in the US Dollar after recent data gave the strongest signs yet that U.S. inflation was slowing, which helped temper expectations of further outsized Fed rate hikes.
Short bets on the South Korean Won, which typically responds sharply to the greenback's moves, were also at their lowest level since July 2021.
Short positions on the Malaysian Ringgit fell to levels last seen in June, while those in Indonesia's Rupiah and the Philippine Peso were at their lowest since August.
Also read: Asian Stock Market: Indices face turbulence as market mood sours, oil bleed
- A rebound in the risk-off market mood has strengthened the Greenback bulls.
- A usual test of the breakout region of the accumulation phase will offer a bargain buy to the market participants.
- Advancing 20-EMA adds to the upside filters.
The USDCAD pair has shifted its auction profile above the critical hurdle of 1.3350 in the early European session. The asset has witnessed a decent buying interest as investors have turned cautious amid escalating geopolitical tensions between North Korea and the US. The major has refreshed it's weekly high above 1.3360 led by a steep fall in oil prices.
The US dollar index (DXY) has witnessed marginal selling pressure while struggling to cross the critical hurdle of 106.60. While the S&P500 futures have shown some recovery after easing entire gains recorded in early Asia.
On an hourly scale, the asset has delivered a breakout of the accumulation phase that signals the transfer of inventory from retail participants to institutional investors. A usual test of the breakout region around 1.3336 would be an optimal opportunity for investors to initiate longs.
The 20-period Exponential Moving Average (EMA) at 1.3325 is advancing, which adds to the upside filters.
Meanwhile, the Relative Strength Index (RSI) (14) has shifted into the bullish range of 60.00-80.00, which indicates that upside momentum has been activated.
Should the asset corrects marginally to near the breakout region around 1.3336, investors will consider this a bargain buy and will initiate fresh longs. This will drive the asset towards November 8 low at 1.3387, followed by November 10 high at 1.3571.
On the contrary, the Loonie bulls could regain control if the asset drops below the round-level support of 1.3300, which will drag the asset towards Wednesday’s low at 1.3246 and September 1 high around 1.3200.
USDCAD hourly chart
-638042606302305985.png)
“Chinese regulators asked banks to report on their ability to meet short-term obligations after a rapid selloff in bonds triggered a flood of investor withdrawals from fixed-income products, according to people familiar with the matter,” reported Bloomberg during early Thursday.
The news also mentioned that the unscheduled regulatory queries coincided with the biggest slump in China’s short-term government debt since mid-2020.
Bloomberg also mentioned that the rout, spurred by a shift toward riskier assets including stocks, prompted retail investors to pull money from wealth-management products, fueling a spiral of price declines and accelerating withdrawals. “Losses also spread to top-rated corporate bonds, stoking a record surge in yields this week,” adds the news.
Also read: USDCNH leans bullish above 7.1300 on upbeat options market signals
- EURUSD remains pressured around intraday low after snapping two-day uptrend.
- Fears of political deadlock in the United States, Covid woes from China underpin US Dollar’s safe-haven demand.
- Upbeat US Retail Sales for October also weigh on Euro.
- Final readings of Eurozone Inflation, second-tier US data could entertain traders.
EURUSD holds lower ground as sellers attack short-term key support around 1.0370 while heading into Thursday’s European session. In doing so, the Euro's value against the US Dollar drops for the first time in three days.
Strong United States data tease Euro sellers
Having witnessed firmer prints of the US Producer Price Index (PPI) for October, a three-year high in US Retail Sales for the said month raised doubts about the US Federal Reserve’s (Fed) dovish bias. As a result, the Fed policymakers have recently been less supportive of the easy rate hike chatters, which in turn exerts downside pressure on the EURUSD pair.
Mixed comments from European Central Bank officials strengthen bearish bias
On Wednesday, European Central Bank (ECB) policymaker Pablo Hernandez de Cos backed further rate increases but Vice President Luis de Guindos teased passive quantitative tightening. Further, ECB Governing Council member Ignazio Visco noted that the case for implementing a less aggressive approach was "gaining ground".
Challenges to sentiment also weigh on EURUSD
A likely tug of war between the US Republicans and Democrats due to the mixed results of the Midterm Elections seems to weigh on the sentiment of late. “Republicans were projected to win a majority in the U.S. House of Representatives on Wednesday, setting the stage for two years of divided government as President Joe Biden's Democratic Party held control of the Senate,” said Reuters.
Additionally, a multi-day high of Covid numbers in China also weighs on the risk appetite and underpins the US Dollar’s safe-haven demand. “Calibrating China's zero-COVID strategy to mitigate the country's economic impact will be critical to sustain and balance the recovery,” said Gita Gopinath, the first Deputy Managing Director of the International Monetary Fund (IMF), at the Caixin Summit on Thursday.
While portraying the mood, the US 10-year Treasury yields print the first daily gains in four around 3.71%. It should be observed that the S&P 500 Futures and equities in the Asia-Pacific zone grind lower of late.
Eurozone inflation, US second-tier data will be in focus
The final readings of the Eurozone inflation data for October, expected to confirm the 10.7% initial forecasts per the Harmonized Index of Consumer Prices (HICP) measure, will offer immediate directions to the Euro bears.
Following that, the US Weekly Jobless Claims and Philadelphia Fed Manufacturing Survey for November will be important to watch for the EURUSD pair traders.
Given the recent shift in the market’s sentiment amid a light calendar, as well as the firmer US Bond coupons, the EURUSD bears are likely to keep the reins unless the scheduled data points surprise traders.
EURUSD price technical analysis
EURUSD sellers poke 21 Simple Moving Average (SMA) support around 1.0370 amid bearish signals from the Moving Average Convergence and Divergence (MACD) indicator. Also adding strength to the Euro’s bearish bias is the retreat of a Relative Strength Index (RSI), located at 14, from the overbought territory.
That said, a clear downside break of 1.0370 could quickly drag Euro towards the 50-SMA support near 1.0210.
However, the previous resistance line from October 04, around 1.0185 at the latest, could challenge the Euro bears afterward.
Alternatively, Euro bulls need validation from a two-day-old descending resistance line, around 1.0400 at the latest.
Following that, the EURUSD run-up towards the monthly high near 1.0481 can’t be ruled out.
EURUSD: Four-hour chart
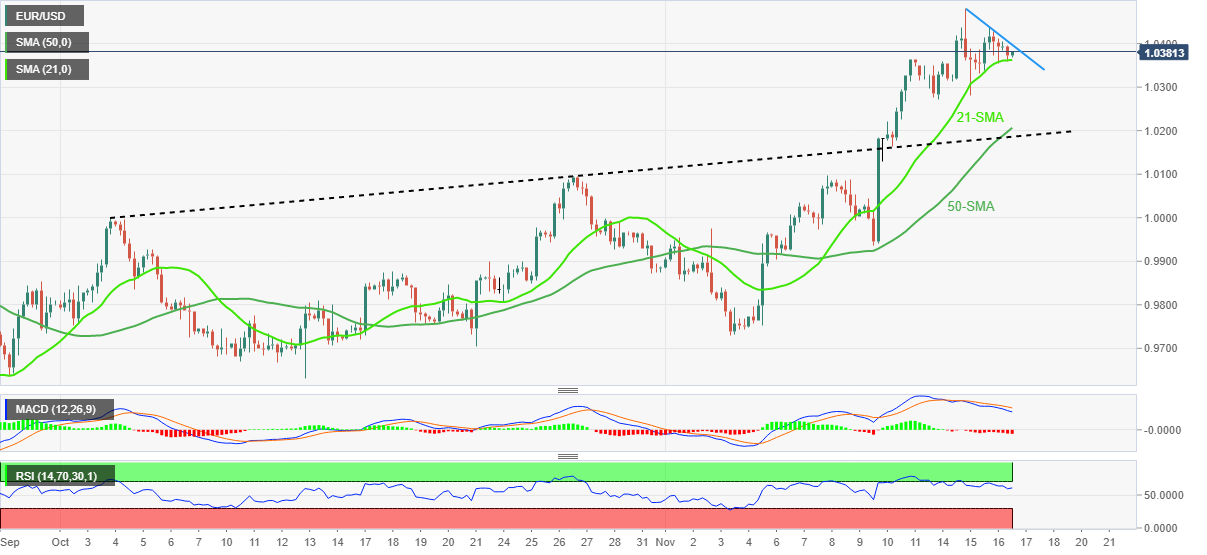
Trend: Further downside expected
- Asian equities have corrected significantly amid escalating geopolitical tensions.
- The DXY has been strengthened post the upbeat Retail Sales data.
- Accelerating Covid-19 cases in China have impacted oil prices significantly.
Markets in the Asian domain are facing an intense sell-off amid mounting tensions between North Korea and the US. Rising drills by the US army along with South Korea and Japan in the Kim Jong-un region have received a fierce response. In the Asian session, North Korea warned on Thursday of "fiercer military responses" to U.S. efforts to boost its security presence in the region with its allies, says Reuters.
This has strengthened the risk-off mood in the global markets and risk-perceived currencies are facing severe heat.
At the press time, Japan’s Nikkei225 dropped 0.40%, ChinaA50 plunged 1.65%, Hang Seng nosedived 2.56%, and Nifty50 eased 0.23%.
In addition to the cautious market mood, a release of better-than-projected US Retail Sales data has also supported the US dollar index (DXY). The economic data rose by 1.3% in October against the projections of 0.9% and flat performance in September. Despite higher payouts after adjusting for inflation impact, consumer demand has been ‘resilience’ due to higher dependency on credit card borrowing.
Analysts at Wells Fargo are of the view that robust consumer demand gives businesses no incentive to forgo price increases, thereby making the task of getting inflation in check more difficult for Federal Reserve policymakers.”
Meanwhile, sky-rocketing Covid-19 cases in China have dampened the market mood. The optimism derived from easing curbs has faded dramatically. Also, Gita Gopinath, the first Deputy Managing Director of the International Monetary Fund (IMF), at the Caixin Summit, cited that “Calibrating China's zero-COVID strategy to mitigate the country's economic impact will be critical to sustain and balance the recovery,”
On the oil front, rising numbers of Covid-19 infections have also weakened oil prices. It is worth noting that China is a leading importer of oil and weaker demand projections from the dragon economy are sufficient to impact oil prices.
- The Greenback bulls will get strengthened after an upside break of the accumulation phase.
- A Spring formation around 0.9400 to remain a major support area ahead.
- The 20-and 50-EMAs are on the verge of delivering a bull cross.
The USDCHF pair has extended its recovery after overstepping the immediate hurdle of 0.9458 in the Tokyo session. The asset has been underpinned as investors have preferred to turn risk-averse amid geopolitical tensions between North Korea and the US. North Korea warned on Thursday of "fiercer military responses" to U.S. efforts to boost its security presence in the region with its allies, says Reuters.
Meanwhile, the US dollar index (DXY) is aiming to test Wednesday’s high around 106.78. The 10-year US Treasury yields have shown a mild recovery to near 3.73%.
USDCHF has delivered a breakout of the inventory accumulation phase in which inventory shifts from retail participants to institutional investors. Earlier, the asset rebounded after forming a Spring around 0.9400 support. This marks a selling climax, followed by a responsive buying action.
The 20-and 50-period Exponential Moving Averages (EMAs) are on the verge of delivering a bearish crossover of around 0.9450. Meanwhile, the Relative Strength Index (RSI) (14) is attempting to shift into the bullish range of 60.00-80.00.
Going forward, a decisive move above Monday’s high at 0.9489 will drive the asset towards November 10 low at 0.9630, followed by November 9 low at 0.9800.
On the flip side, a drop below Spring formation around 0.9400 will drag the pair towards January 31 high at 0.9343. Slippage below the latter will drag the major towards March 31 low around 0.9200.
USDCHF hourly chart
-638042568289947991.png)
- GBPUSD bounces off intraday low but snaps two-day uptrend.
- Bearish RSI divergence, lower-high formation teases sellers.
- Weekly support line, 100-HMA challenges immediate downside.
GBPUSD pares the first daily loss in three around 1.1880 heading into Thursday’s London open. In doing so, the Cable pair bounces off the intraday low but stays on the seller’s radar while printing a bearish divergence on the Relative Strength Index (RSI) placed at 14.
The higher-low on prices don’t accompany the RSI conditions and joins the three-day formation of lower highs to keep the GBPUSD bears hopeful as they await the UK’s Autumn Statement.
However, an upward-sloping trend line from the last Thursday restricts the quote’s immediate downside to around 1.1860.
Following that, the 100-HMA level of 1.1817 could act as an extra downside filter before directing the GBPUSD sellers towards the 200-HMA surrounding 1.1645.
It’s worth noting that a two-week-old ascending trend line, around 1.1630 by the press time, could challenge the Cable pair’s weakness past 1.1645.
On the contrary, recovery moves need to cross the recent swing high of around 1.1925 to defy the lower-high formation and direct buyers toward the monthly peak of 1.2030.
In a case where GBPUSD remains firmer past 1.2030, the August month high near 1.2280 could gain the market’s attention.
GBPUSD: Hourly chart
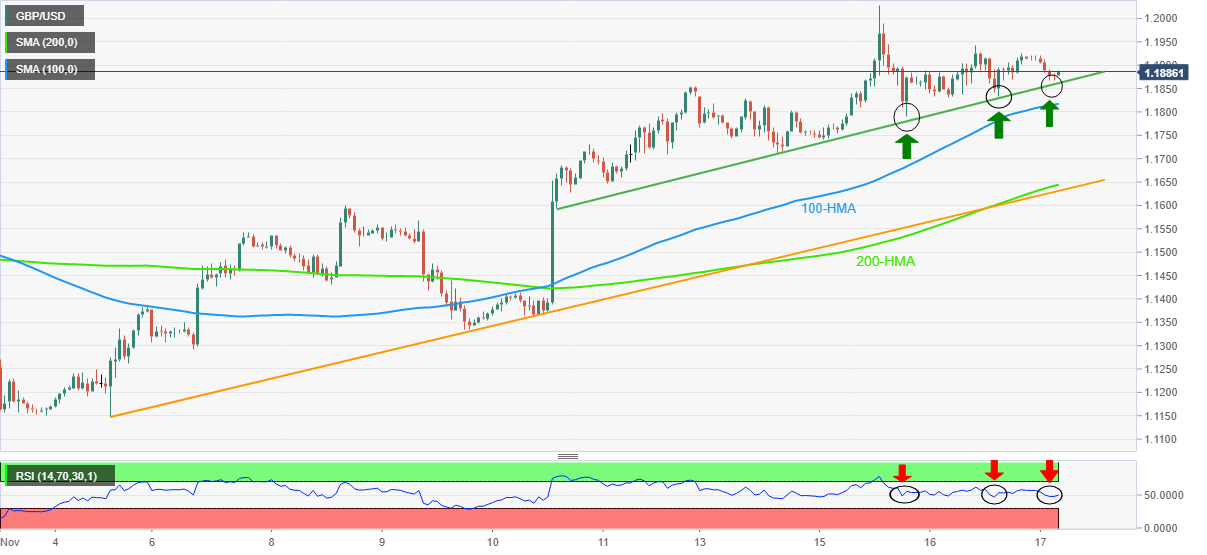
Trend: Further weakness expected
- USDINR rises for the fourth consecutive day despite easing from intraday high of late.
- China-linked fears join a rebound in the US Treasury yields to favor bulls.
- Sluggish markets and lack of major data/events challenge upside momentum.
USDINR retreats from intraday high but flashes a four-day winning streak around 81.55 during early Thursday. In doing so, the Indian Rupee (INR) pair fails to cheer downbeat oil prices amid the recent rebound in the US Dollar.
That said, US Dollar Index (DXY) snaps a two-day downtrend as it prints mild gains around 106.50 by the press time. In doing so, the greenback’s gauge versus six major currencies traces the recently firmer US Treasury yields. The benchmark US 10-year Treasury yields rose 1.2 basis points (bps) to 3.70% while printing the first positive in four days by the press time.
Elsewhere, looming concerns over China’s economic growth and challenges for Asia also exert downside pressure on the INR. “Calibrating China's zero-COVID strategy to mitigate the country's economic impact will be critical to sustain and balance the recovery,” said Gita Gopinath, the first Deputy Managing Director of the International Monetary Fund (IMF), at the Caixin Summit on Thursday.
Additionally, fears of slower growth and recently easy inflation from India, as well as political jitters, keep USDINR buyers hopeful.
It should be noted that the WTI crude oil prices drop 1.0% to $83.80 during a two-day downtrend while S&P 500 Futures lack clear directions. Also, MSCI’s index of Asia-Pacific shares outside Japan drops 1.7% while easing from the two-month high flashed the previous day.
Moving on, risk catalysts may direct the gold price amid a lack of major data events ahead of the US Weekly Jobless Claims and Philadelphia Fed Manufacturing Survey for November.
Technical analysis
USDINR bulls need a daily closing beyond the 50-DMA hurdle of 81.55, as well as a successful break of the 21-DMA resistance of 81.95, to keep the reins.
“Financial market stability is the most important factor to consider when it comes to exit,” mentioned Bank of Japan’s (BOJ) executive director Shinichi Uchida early Thursday.
The Senior BOJ Official also mentioned that a rate hike before balance sheet adjustment possible in an exit.
Earlier in the day, BOJ Governor Haruhiko Kuroda also defended the Japanese central bank’s easy-money policy while stating, “(It is) Important to continue monetary easing to support economy.”
Additionally, Deputy Governor Hiroshi Nakaso mentioned that the central banks must remove emergency support measures once financial crises are over to avoid causing moral hazard in the market. “Investors have come to assume that central banks will always come to the rescue when financial markets destabilise because of the massive monetary support deployed during the COVID-19 crisis,” stated BOJ’s Nakaso in a seminar hosted by the University of Tokyo and International Monetary Fund.
USDJPY prints two-day uptrend
Given the dovish comments from the BOJ officials, as well as the firmer US Treasury yields, USDJPY picks up bids to print mild gains around 139.60.
Also read: USDJPY Price Analysis: Bears eye a breakout of the daily coil
- Gold price has tumbled to near $1,763.00 as the risk-on profile has faded.
- Geopolitical tensions between North Korea and the US have improved safe haven’s appeal.
- Fed Daly’s hawkish commentary has supported the US Treasury yields.
Gold price (XAUUSD) has witnessed a steep fall after surrendering the critical support of $1,770.00 in the Asian session. The precious metal has tumbled to near $1,763.00 as investors are turning risk-averse after North Korea warns the US that it will face ruthless military activity against its joint drills in its region.
North Korea's foreign minister, Choe Son Hui, slammed a recent trilateral summit between the United States, South Korea, and Japan, during which the leaders criticized Pyongyang's weapons tests and pledged greater security cooperation, as reported by Reuters. This has triggered the risk of geopolitical tensions, which has improved the appeal for safe-haven assets.
The entire recovery witnessed in S&P500 futures in Asia has faded now as investors’ risk appetite has trimmed. Meanwhile, the 10-year US Treasury yields have rebounded to 3.72% as San Francisco Fed President Mary Daly hiked its interest rate guidance. Fed policymaker has considered a range of 4.75% - 5.25% as reasonable for the policy rate end-point. She further added that the central bank wants to see a slowdown in the economy to cool down the red-hot inflation.
Gold technical analysis
Gold price has delivered a downside break of a Rising Wedge chart pattern that indicates exhaustion in the upside momentum. The 20-and 50-period Exponential Moving Averages (EMAs) are on the verge of delivering a bearish crossover of around $1,772.90. Meanwhile, the Relative Strength Index (RSI) (14) has shifted into the bearish range of 20.00-40.00, which indicates more downside in the asset ahead.
Gold hourly chart
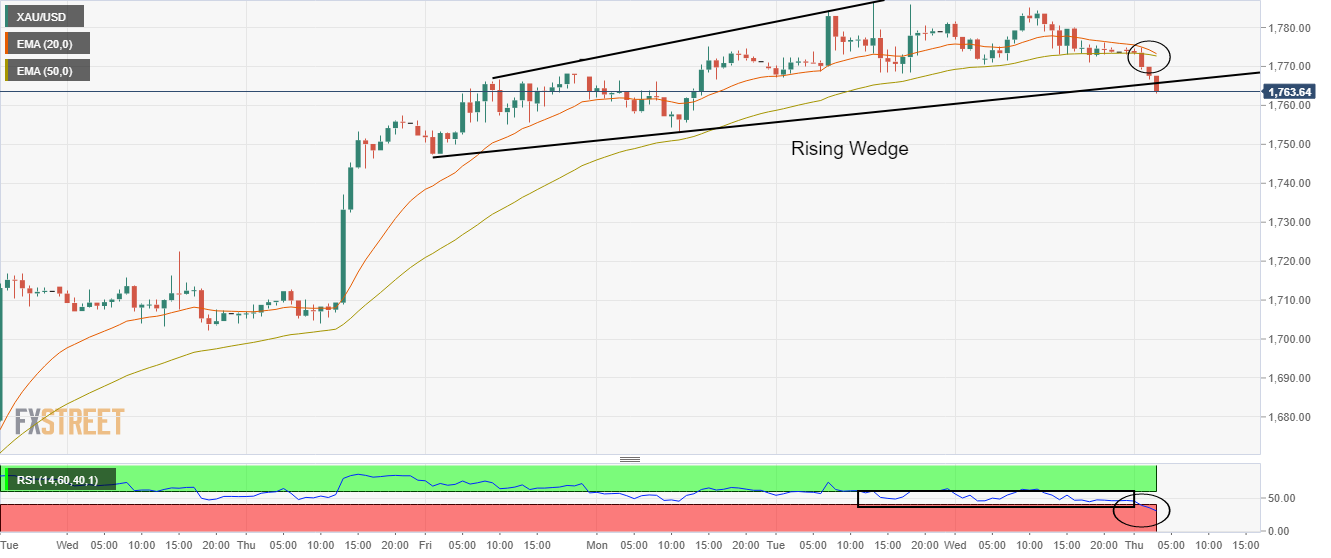
“Calibrating China's zero-COVID strategy to mitigate the country's economic impact will be critical to sustain and balance the recovery,” said Gita Gopinath, the first Deputy Managing Director of the International Monetary Fund (IMF), at the Caixin Summit on Thursday.
IMF’s Gopinath also added, via video call, that For China, inflation and weakening growth allow for greater support for vulnerable households, which together with strengthening social safety nets would promote consumption.
Earlier in the day, the People's Bank of China (PBOC) released its third quarter (Q3) Monetary Policy Report (MPR). “Will increase the intensity of prudent monetary policy instead of issuing excessive currency, strengthen cross-cycle adjustment to balance short-term and long-term needs, economic growth and price stability, as well as the internal and external environment,” mentioned the PBOC’s MPR.
Also read: PBOC: Will monitor and make appropriate responses to keep price level stable
USDCNH prints three-day uptrend
The news adds strength to the US Dollar’s latest rebound and weighs on the Chinese Yuan. As a result, the USDCNH pair picks up bids to extend the week-start rebound from the monthly low.
Also read: USDCNH leans bullish above 7.1300 on upbeat options market signals
- A shift of market sentiment into a negative trajectory has weakened risk-perceived currencies.
- The breakdown of the symmetrical triangle and activation of negative divergence has underpinned the Greenback.
- The 20-EMA is acting as a major hurdle for the asset.
The AUDUSD pair has delivered a downside break of the consolidation formed in a narrow range of 0.6716-0.6750 in the Tokyo session. The asset has sensed selling pressure as investors’ risk appetite has trimmed dramatically.
A recovery experienced in S&P500 futures in Asia is fading now. Meanwhile, the US dollar index (DXY) is oscillating near its immediate hurdle of 106.60. The 10-year US Treasury yields have also recovered to near 3.73%.
On an hourly scale, the asset has witnessed an expansion in volatility after a downside break of the Symmetrical Triangle formed around Tuesday’s high at 0.6800. Earlier, the major displayed a loss in the upside momentum after a formation of bearish negative divergence. The asset was continuously forming higher highs while the momentum oscillator, Relative Strength Index (RSI) (14) formed a lower high. Also, the RSI (14) has shifted into the bearish range of 20.00-40.00, which indicates that the downside momentum has been activated.
The asset has also surrendered the cushion of the 20-period Exponential Moving Average (EMA), which signals that the short-term trend is bearish now.
A decisive move below the round-level support of 0.6700 will rag the asset towards Monday’s low at 0.6663, followed by November 8 high at 0.6550.
On the flip side, the Aussie bulls could regain traction if the asset recaptures Tuesday’s high near 0.6800. An occurrence of the same will drive the asset towards September 13 high around 0.6900 and a psychological resistance of 0.7000.
AUDUSD hourly chart
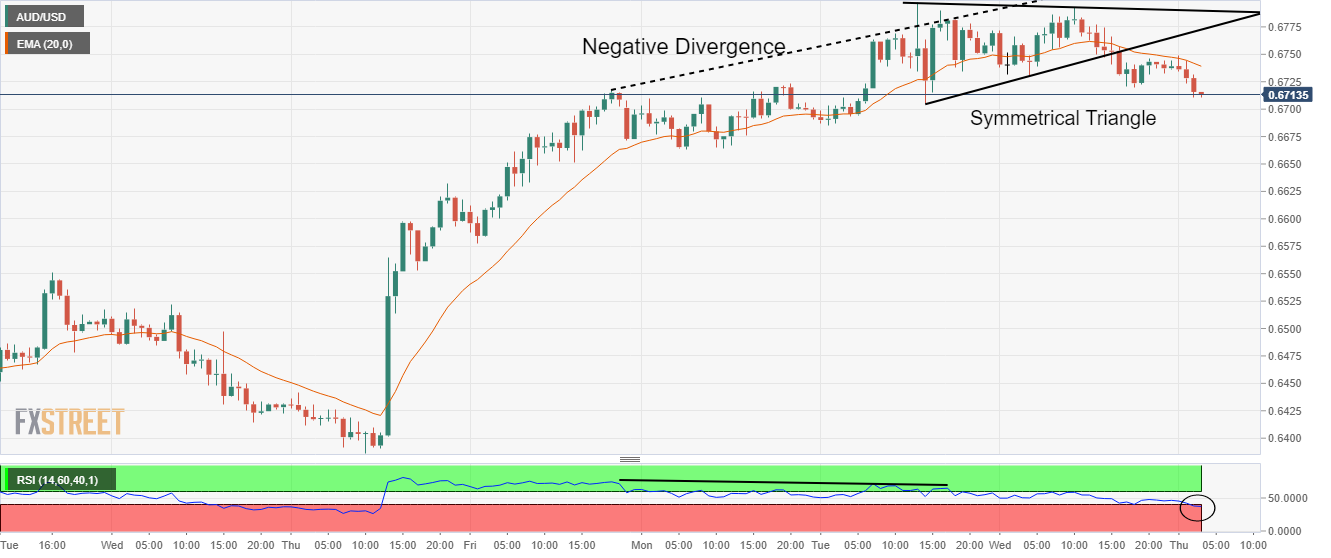
- EURUSD remains pressured around intraday low, snaps two-day uptrend.
- Downside break of immediate support line joins bearish oscillators to keep sellers hopeful.
- Bullish triangle challenges the downside bias beyond 1.0290 support.
EURUSD justifies immediate support break to welcome bears after a two-day uptrend. That said, the Euro pair drops 0.25% intraday as sellers flirt with the 1.0370 level during early Thursday.
Not only a downside break of a two-day-old ascending trend line but bearish MACD signals and the RSI (14) retreat also favor the EURUSD sellers.
However, a bullish triangle formation is in play since Monday and keeps the buyers hopeful unless the quote breaks the 1.0290 support level comprising the lower line of the stated pattern.
It should be noted that the 100-HMA offers immediate support near the 1.0340 level while a rejection of the bullish triangle could quickly drag the quote toward the 200-HMA support of 1.0180.
Even so, an upward-sloping support line from November 04, close to 1.0145 by the press time, could act as the last defense of EURUSD bears.
Alternatively, the pair buyers need to witness an upside break of the nearby support-turned-resistance line, near 1.0380, to retake control.
Following that, the aforementioned triangle’s resistance line around 1.0410 will be crucial as a clear upside break of the same will confirm the bullish chart pattern and challenge the monthly peak of 1.0480.
EURUSD: Hourly chart
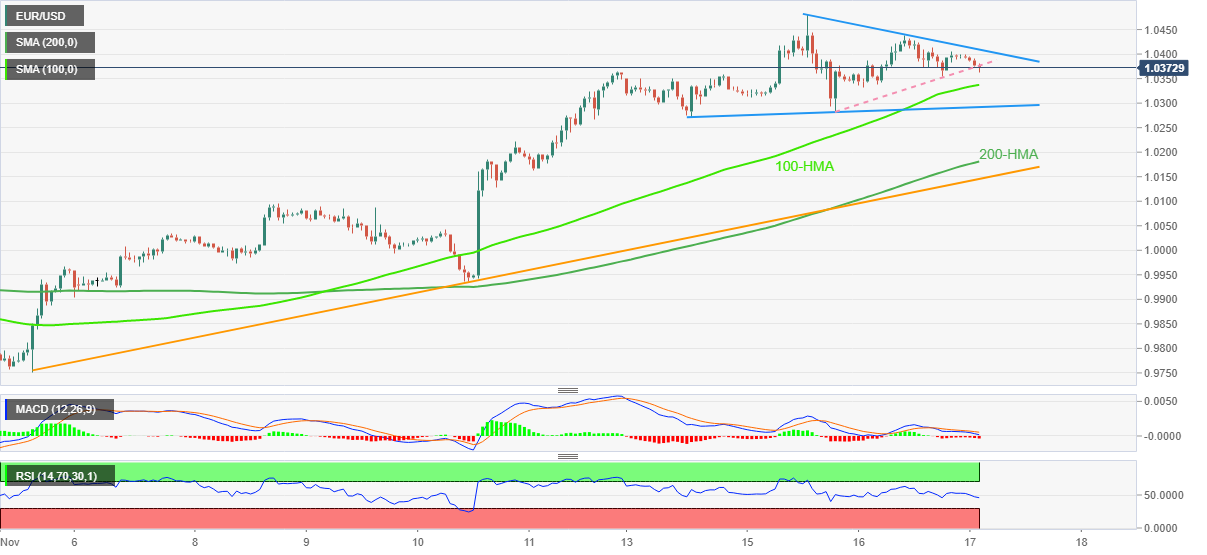
Trend: Limited downside expected
| Raw materials | Closed | Change, % |
|---|---|---|
| Silver | 21.462 | -0.32 |
| Gold | 1773.44 | -0.25 |
| Palladium | 2067.27 | -1.17 |
USDCNH remains firmer around the intraday high of 7.1380 while extending the week-start rebound from the monthly low during early Thursday. In doing so, the offshore Chinese Yuan (CNH) pair justifies the bullish signals from the options market.
That said, a one-month risk reversal (RR) ratio, a gauge of calls versus put, rose for the second consecutive day to 0.040 by the end of Wednesday’s North American trading session.
It’s worth noting that the weekly RR is still negative, at -0.050, and challenges the USDCNH buyers amid dicey markets.
The pair’s latest upside could also be linked to the US Dollar’s recovery moves and the Covid fears from China.
Furthermore, the recently released quarterly monetary policy statement from the People’s Bank of China (PBOC) also allows the USDCNH bulls to keep the reins.
Also read: PBOC: Will monitor and make appropriate responses to keep price level stable
- Silver price remains pressured around intraday low, prints three-day downtrend.
- 200-DMA break, easing bullish bias of MACD keeps sellers hopeful.
- XAGUSD bulls have a bumpy road ahead unless crossing June’s peak.
Silver price (XAGUSD) takes offers to refresh intraday low near $21.35 during the three-day downtrend amid early Thursday.
In doing so, the bright metal justifies the previous day’s downside break of the 200-DMA, as well as the receding bullish bias of the Moving Average Convergence and Divergence (MACD) indicator.
With this, the XAGUSD bears are all set to retest the resistance-turned-support line stretched from early August, around $21.20. Also increasing the importance of the stated support is the previous monthly high.
Should the commodity prices remain bearish past $21.20, the $21.00 round figure and August month’s high near $21.85 will be on the silver bear’s radar.
It should be noted that the 61.8% Fibonacci retracement level of the metal’s downside between June and September, around $20.60, could act as the last defense of the XAGUSD bears before directing them to the $20.00 key support comprising 50% Fibonacci retracement level.
Meanwhile, recovery moves remain elusive unless the quote stays below the 200-DMA level of $21.45.
Even so, the $22.00 threshold and the monthly high near $22.25 could challenge the silver buyers before highlighting June’s monthly top surrounding $22.50.
Silver price: Daily chart
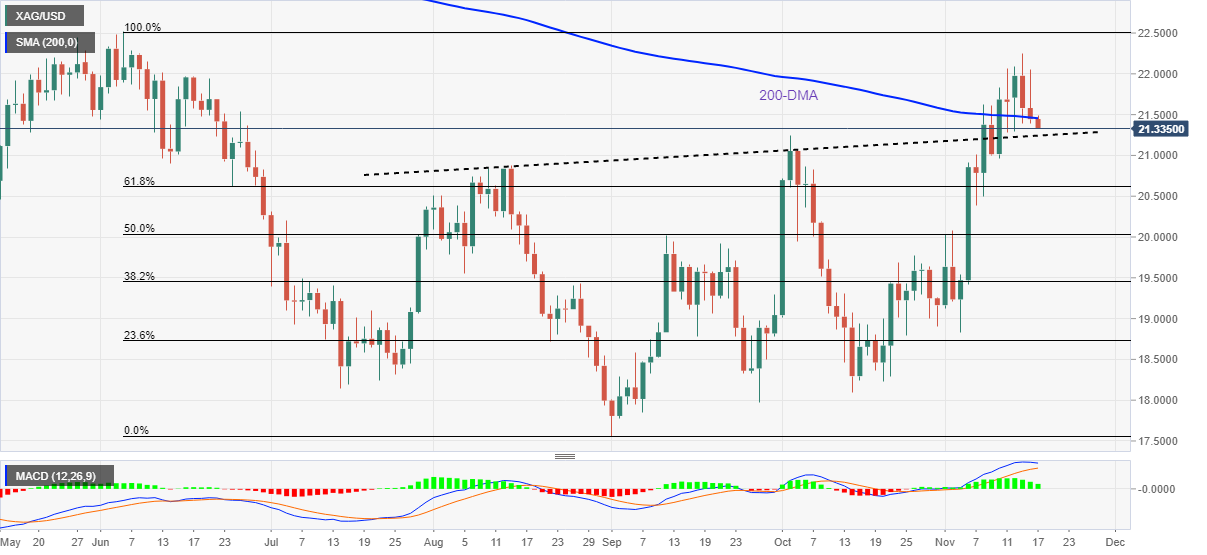
Trend: Further downside expected
- GBPUSD renews intraday low amid market’s cautious mood ahead of the key UK event.
- British government’s ability to tame economic fears and filling the hole in government finances will be keenly watched.
- US Dollar’s corrective bounce acts as an extra filter for trading.
- Second-tier US data, risk catalysts are also important for intraday directions.
GBPUSD takes offers to renew intraday low around 1.1880 during early Thursday. In doing so, the Cable pair registers the first daily loss in three, so far, while justifying the market’s cautious mood ahead of the UK’s key Autumn Statement.
The UK’s new government has bigger challenges than its predecessors as Prime Minister Rishi Sunak is more inclined towards placating the economic woes by announcing relief measures like easing energy bills, increasing the minimum wage and trying to keep tax hikes less problematic. That said, UK’s Chancellor Jeremy Hunt, on the other hand, is more interested in forming a tax structure that can fill the multi-billion British Pounds (GBP) worth of the hole.
It’s worth noting that Rishi Sunak’s less compulsive efforts to tighten the Bank of England’s (BOE) monetary policies, versus Liz Truss’ strong push for higher rates, also challenge the BOE hawks and weigh on the GBPUSD prices.
Even so, BOE Governor Andrew Bailey showed readiness to announce more rate hikes during Wednesday’s testimony. Also keeping the GBPUSD buyers hopeful is the mostly downbeat comments from the US Federal Reserve (Fed) policymakers despite strong US Retail Sales data.
On Wednesday, US Retail Sales growth rose by 1.3% MoM in October versus 1.0% expected and 0.0% prior. On the other hand, Kansas City Fed President Esther George and Fed Governor Christopher Waller both favored smaller increases in the benchmark rates going forward whereas San Francisco Fed President Mary Daly mentioned challenges to the US economic growth.
Elsewhere, Covid woes in China and fears of political deadlock in the US challenges the market sentiment and tease the GBPUSD sellers ahead of the key UK Autumn Statement. Ahead of the fiscal policy announcements, the Financial Times (FT) said, “Hunt’s Autumn Statement will intensify the financial hardship facing millions of Britons and begin years of austerity in public services, but the chancellor will claim the pain is necessary to curb soaring prices and restore faith in Britain.”
Technical analysis
Nearly overbought RSI conditions join the trader’s failure to cross a five-month-old resistance line, around 1.2025 by the press time, to challenge GBPUSD buyers. The pair’s downside, however, remains elusive unless the quote breaks the 100-DMA support near 1.1650.
- USDJPY bears are licking their lips within the coil.
- Bulls need to move in and take out horizontal resistance or face a downside breakout.
USDJPY stays relatively flat for Thursday following a consolidative day on Wednesday where the price traveled between a high of 140.29 and a low of 138.72, now trading back at 139.50.
The US Dollar has been under pressure, however, falling from elevated levels on the sentiment that the Federal Reserve will be forced to pause its rate hikes. As interest rate differentials with other countries narrow, the US Dollar would be expected to continue to slide. The sentiment is fueling the downside potential for USDJPY as the following technical analysis will illustrate:
USDJPY daily chart
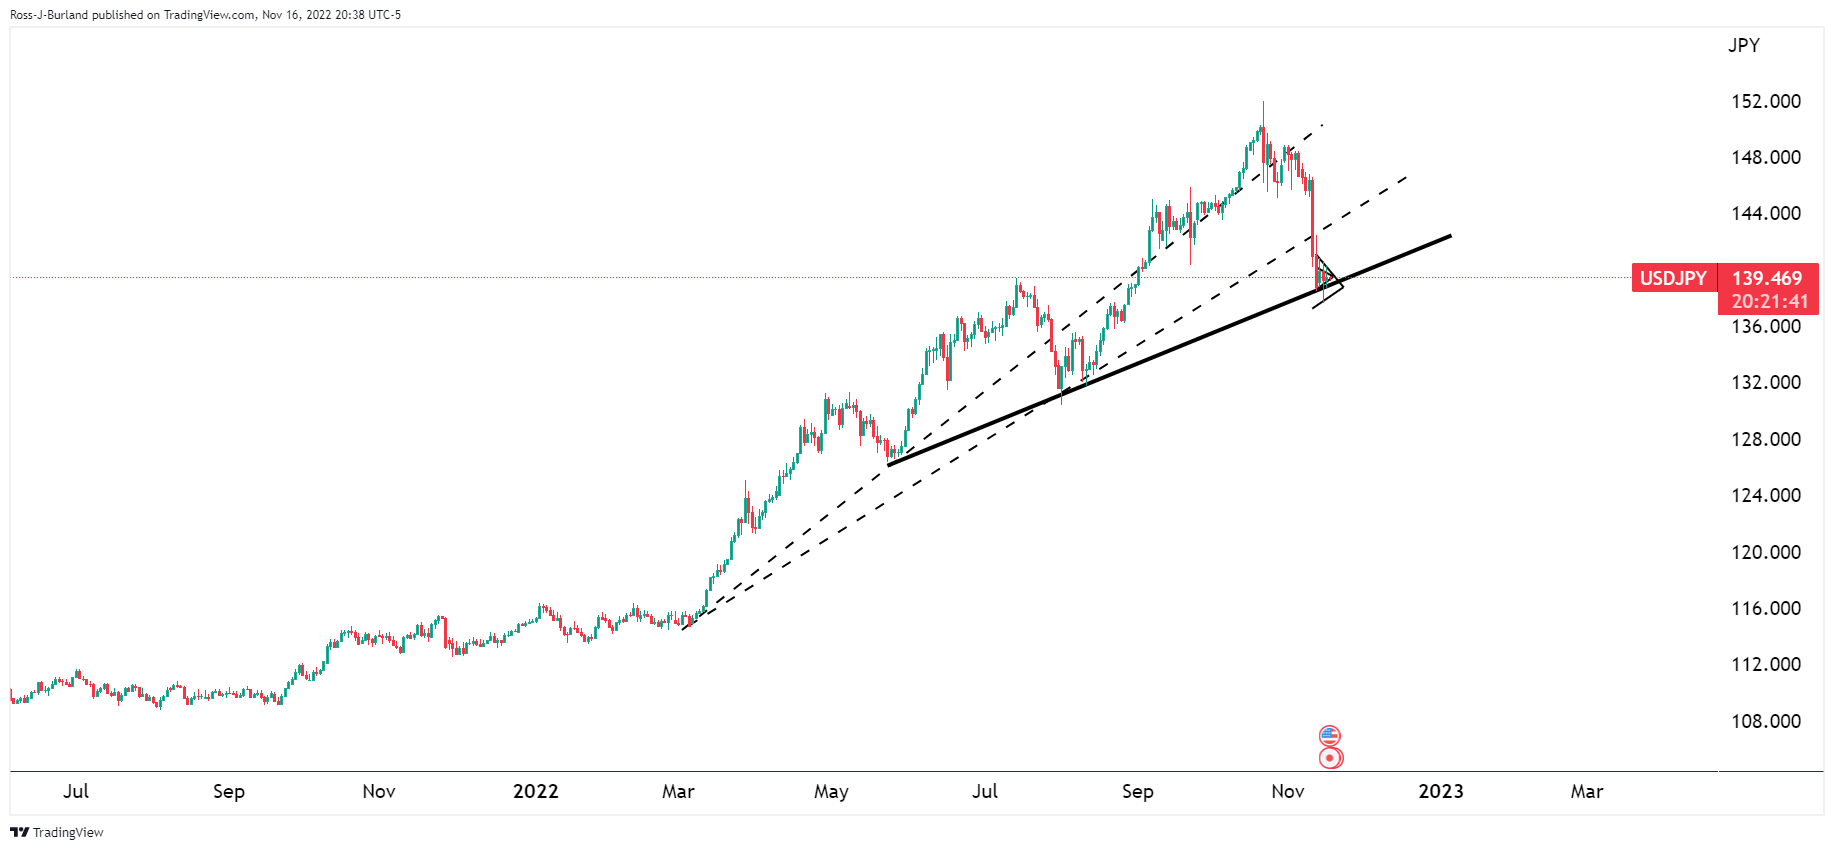
USDJPY is meeting fresh dynamic support and is coiled into a bearish continuation triangle on the daily chart. Being on the back side of the prior trendlines is bearish.
USDJPY H1 chart
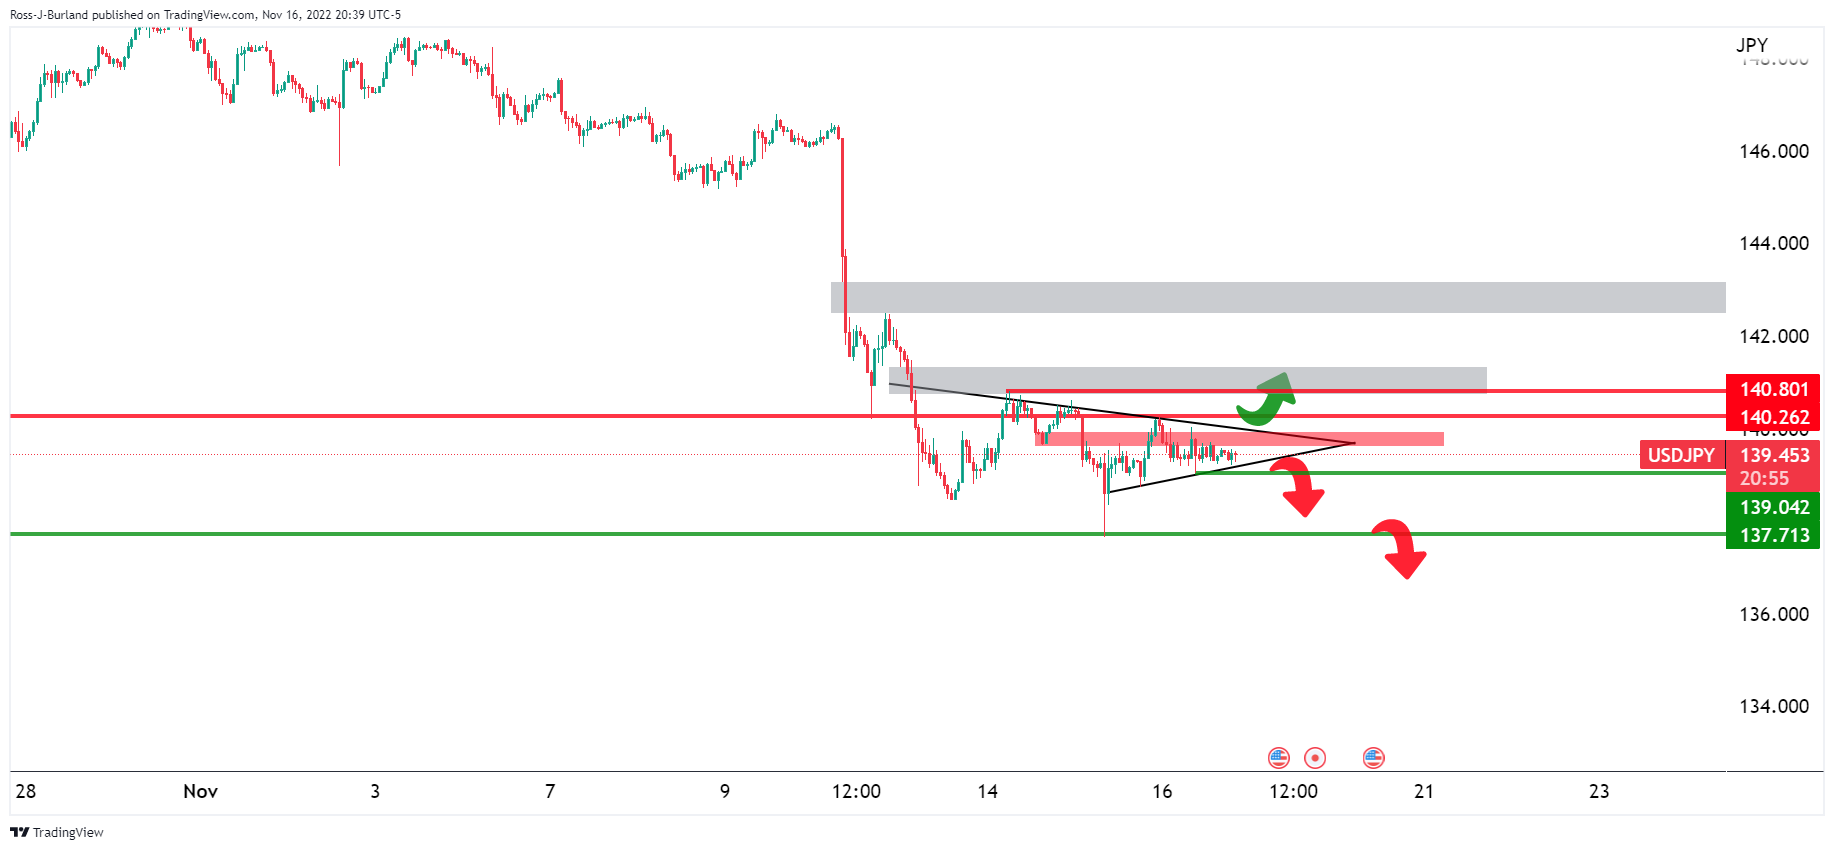
The bulls need to get above horizontal resistances while the bears are seeking a break of support outside of the coil.
USDJPY M15 chart
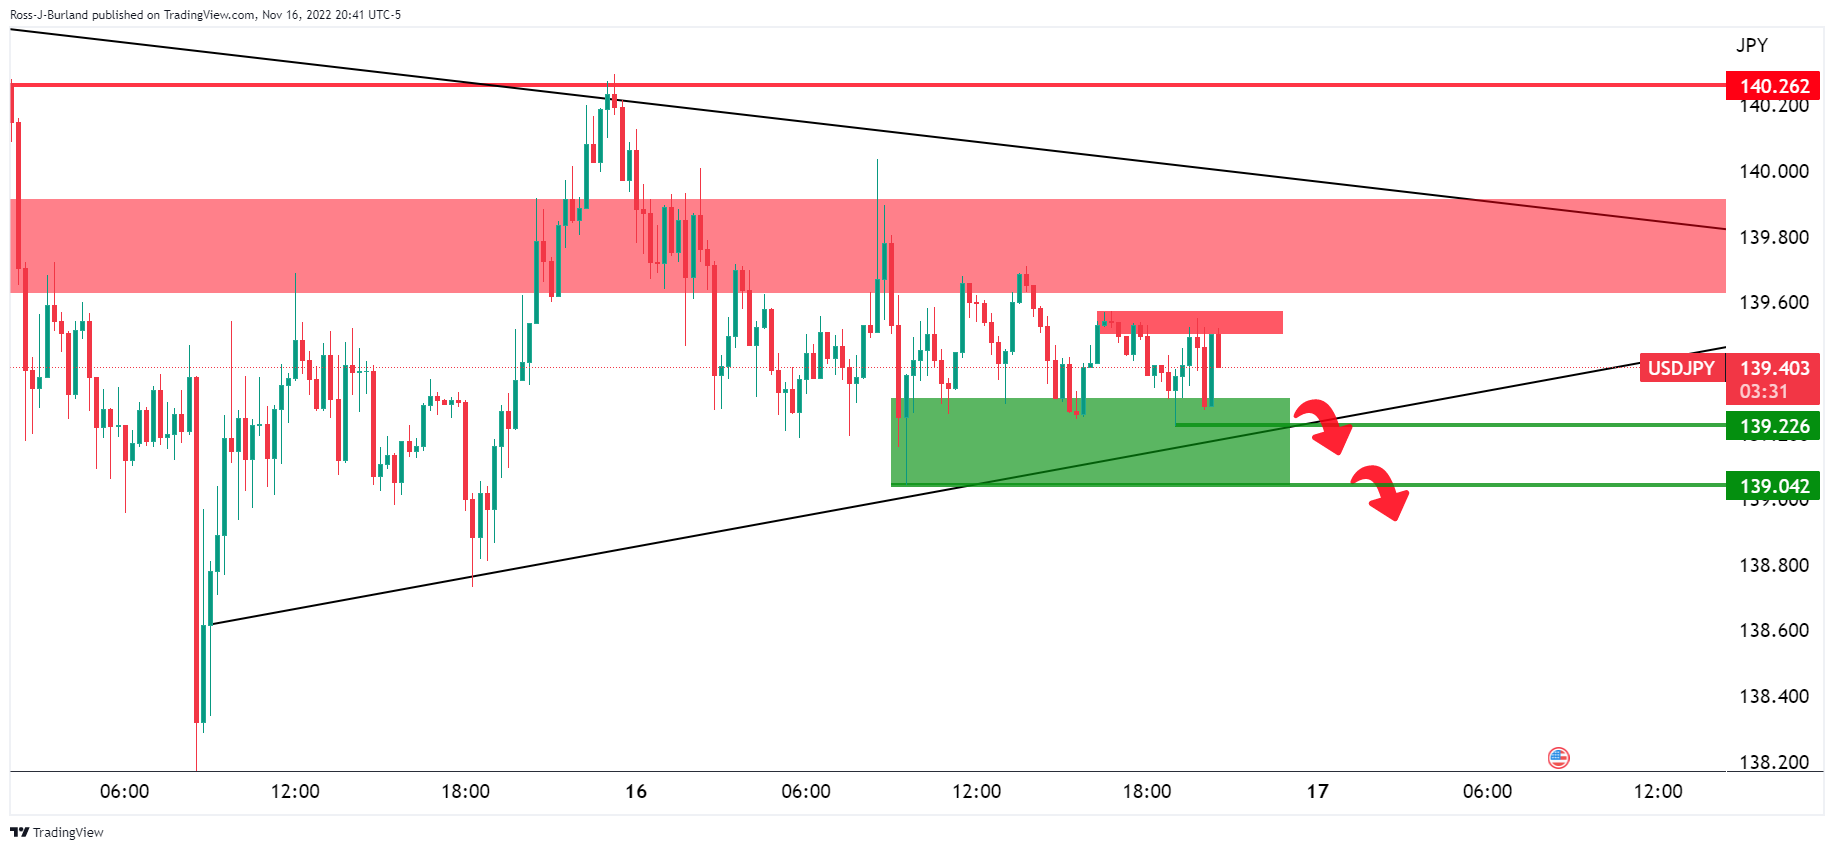
The 16-min charts show the price sticking to a tight consolidation which potential means a breakout is imminent.
In the latest Q3 Monetary Policy Report published on its website, the People's Bank of China (PBOC) said it “will monitor the potential for rising inflation, especially changes on the demand side, and continue to consolidate the favorable conditions for increasing domestic grain production and smooth operation of the energy market, and make appropriate responses to keep the price level basically stable.”
Additional takeaways
“Will increase the intensity of prudent monetary policy instead of issuing excessive currency, strengthen cross-cycle adjustment to balance short-term and long-term needs, economic growth and price stability, as well as the internal and external environment.”
“Will also adhere to the market's decisive role in the formation of the exchange rate, strengthen expectations management, and maintain the basic stability of the yuan at a reasonable and balanced level.”
Market reaction
As investors digest the PBoC Monetary Policy Report and a weak setting of the yuan fix, USDCNY is advancing 0.40% on the day to extend the rebound from two-month lows of 7.0248. The pair is rising to near 7.1200, at the time of writing.
- USDCAD is aiming to shift its business above 1.3350 despite a recovery in risk-on profile.
- Long-term US yields are prone to more downside as Fed’s George sees slowdown in Fed’s rate hike pace from CY2022.
- Oil prices are falling amid accelerating Covid-19 cases in China and no signs of further sanctions on Russia.
The USDCAD pair is displaying a volatility contraction in a range of 1.3314-1.3345 in Asia after a vertical rally from key support around 1.3230. The asset is hovering around its weekly high and is looking to add more gains as oil prices have faced immense pressure. Contrary to the bullish bets on USDCAD, positive market sentiment is regaining traction.
S&P500 futures are recovering after registering losses on Wednesday. The 500-stock basket witnessed a sell-off as FMCG-to-retail chain operator Target Corporation (NYSE:TGT) projected a bleak outlook on consumer spending. The US dollar index (DXY) is displaying a subdue performance after a mild recovery from 106.20. Russia-Poland noise-led rally in the DXY could get concluded as clouds of uncertainty have faded.
Meanwhile, the 10-year US Treasury yields have rebounded marginally to near 3.71% after dropping below 3.7% earlier. The pullback move seems less confident as the odds for a fifth consecutive 75 basis points (bps) rate hike by the Federal Reserve (Fed) are extremely poor. As per the CME FedWatch tool, the odds signaling a 75 bps rate hike stands at 17%.
The commentary from Kansas City Fed President Esther George has delighted the need for recession to tame inflationary pressures. In an interview with the Wall Street Journal, Fed policymaker argued that bringing inflation down without causing a recession might not be feasible. He further advocated for a slowdown in the pace of rate hike increases from CY2022.
On the Loonie front, declining oil prices have brought volatility for the Canadian dollar. Easing Covid-19 curbs in China have failed to support oil prices as infected cases are skyrocketing. Also, clarity over the Russia-Poland noise has trimmed the chances of immediate sanctions on Russia by the trading bloc.
Japanese Finance Minister Shunichi Suzuki said in a statement on Thursday, specific monetary policy is up to the Bank of Japan (BoJ) to decide.
Suzuki added that it is “important for government, BoJ to closely exchange opinions.”
Related reads
- BoJ’s Kuroda: CPI growth will fall below 2% next fiscal year as cost- push factors taper off
-
USDJPY Price Analysis: Bears eye a breakout of the daily coil
- AUDNZD grinds higher after bouncing off the previous resistance line.
- Bullish MACD signals, strong Australia employment data for October favor pair buyers.
- Sellers need validation from 1.0880 to aim for late April’s low.
AUDNZD remains on the front foot around 1.0970-75 while cheering firmer prints of Australian employment statistics on early Thursday. In doing so, the cross-currency pair also defends the previous day’s rebound from the resistance-turned-support.
Australia’s Employment Change jumped by 32.2K versus 15K market forecasts and 0.9K prior whereas the Unemployment Rate dropped to 3.4% from 3.5% previous readings and 3.6% expected.
Given the bullish MACD signals and the pairs’ sustained break of a seven-week-old descending trend line, not to forget the latest economics from Australia, the AUDNZD pair is likely to remain firmer.
However, the 200-DMA level surrounding 1.1015 appears a tough nut to crack for the AUDNZD bulls.
Following that, a run-up towards the 61.8% Fibonacci retracement level of the pair’s April-September upside, near 1.1080, can’t be ruled out.
On the contrary, pullback moves need to provide a daily closing below the previous resistance line, around 1.0920 by the press time, to convince sellers.
Even so, a horizontal area comprising multiple levels marked since late April, around 1.0880, could challenge the AUDNZD bears before directing them to the April 25 low of 1.0824.
AUDNZD: Daily chart
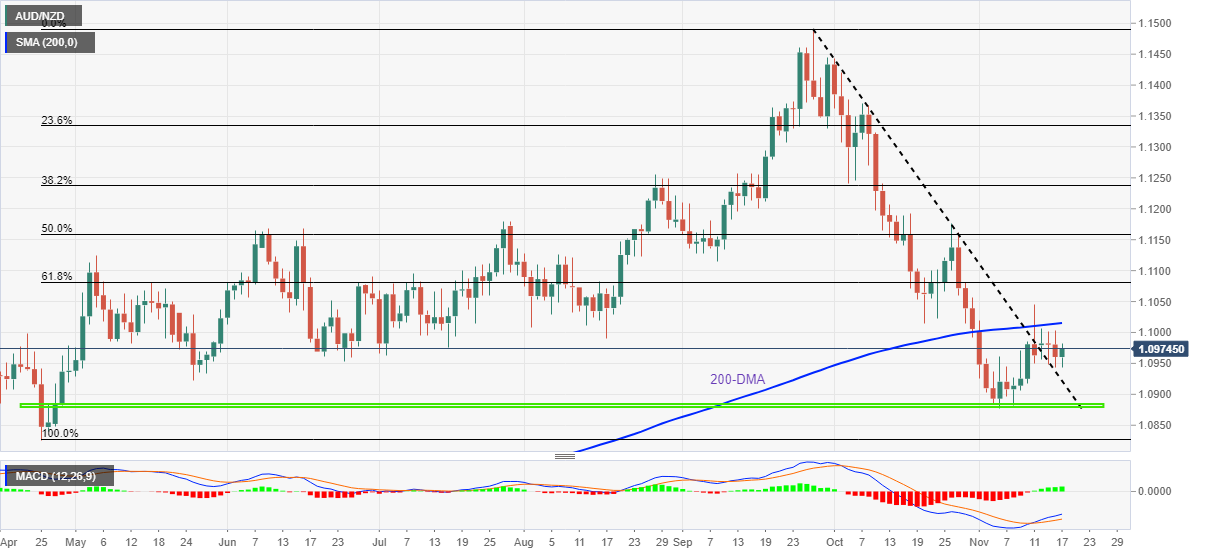
Trend: Further recovery expected
In recent trade today, the People’s Bank of China (PBOC) set the yuan (CNY) at 7.0655 vs, the previous fix of 7.0363 and prior close of 7.0990).
About the fix
China maintains strict control of the yuan’s rate on the mainland.
The onshore yuan (CNY) differs from the offshore one (CNH) in trading restrictions, this last one is not as tightly controlled.
Each morning, the People’s Bank of China (PBOC) sets a so-called daily midpoint fix, based on the yuan’s previous day's closing level and quotations taken from the inter-bank dealer.
Bank of Japan (BoJ) Governor Haruhiko Kuroda said on Thursday, CPI growth will fall below 2% next fiscal year as cost-push factors taper off.
Additional comments
Recent price hikes due to cost-push factors.
Possible to achieve sustainable, stable inflation goal even thought it may take time.
Important to continue monetary easing to support economy.
Will closely coordinate with government to conduct appropriate policy.
Enhancing labor productivity is important more than ever to raise per-capita GDP growth.
Market reaction
USD/JPY is off the highs, trading at around 139.40, losing 0.09% on the day.
- Gold price remains pressured after reversing from three-month high the previous day.
- Mildly bid US Dollar, firmer Treasury yields favor XAUUSD bears amid sluggish sentiment.
- Downside break of fortnight-old bullish channel teases sellers.
Gold price (XAUUSD) holds onto the previous day’s bearish bias around $1,773 despite sluggish markets on early Thursday. The yellow metal’s latest weakness could be linked to the US Dollar’s rebound, as well as a technical breakdown.
US Dollar Index (DXY) snaps a two-day downtrend as it seesaws around 106.40 by the press time. In doing so, the greenback’s gauge versus six major currencies traces the recently firmer US Treasury yields. The benchmark US 10-year Treasury yields rose 1.2 basis points (bps) to 3.70% while printing the first positive in four days by the press time.
The upbeat prints of the US Retail Sales for October and mixed comments from the US Federal Reserve (Fed) policymakers seem to underpin the DXY’s latest rebound, which in turn weighs on the gold price.
That said, US Retail Sales growth rose by 1.3% MoM in October versus 1.0% expected and 0.0% prior. On the other hand, Kansas City Fed President Esther George and Fed Governor Christopher Waller both favored smaller increases in the benchmark rates going forward whereas San Francisco Fed President Mary Daly mentioned challenges to the US economic growth.
Elsewhere, the Covid woes in China and a tug of war between the US Republicans and Democrats in the Midterm Elections seem to keep the traders on their toes
While portraying the mood, the S&P 500 Futures print mild gains but the Asia-Pacific equities trace mixed by the press time.
Looking forward, the aforementioned risk catalysts may direct the gold price amid a lack of major data events ahead of the US Weekly Jobless Claims and Philadelphia Fed Manufacturing Survey for November.
Technical analysis
Gold price justifies the rejection of a two-week-long bullish channel by printing mild losses. Also keeping the sellers hopeful are bearish MACD signals and the RSI’s retreat from the overbought territory.
However, a one-week-old ascending support line near $1,767 restricts the quote’s immediate downside, a break of which could quickly drag the pair toward the 50-SMA level surrounding $1,737.
It’s worth noting, however, that the six-week-old horizontal support zone between $1,730 and $1,722 could challenge the XAUUSD bears afterward.
Alternatively, an upside break of the $1,787 hurdle could reverse the latest bearish signal and direct gold buyers toward the $1,800 threshold. Following that, August month’s high near $1,808 could act as the last defense of the XAUUSD bears.
Gold price: Four-hour chart
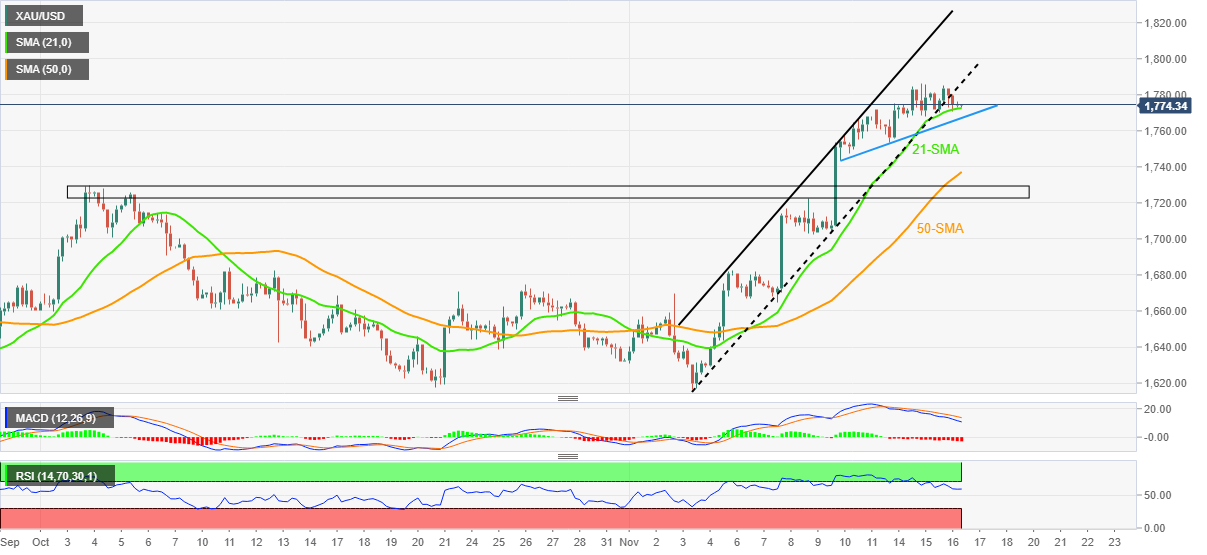
Trend: Pullback expected
- AUDJPY is hovering around 94.00 as solid Australian job data has failed to cheer bulls.
- The Employment Change has accelerated by 32.2k while the Unemployment Rate has declined to 3.4%.
- External demand shocks and Covid-19 infections are responsible for a surprise downside in Japan’s GDP.
The AUDJPY pair has remained hovering around 94.00 despite the release of upbeat Australian employment data. As per the Australian Bureau of Statistics, the economy has managed to make fresh additions in the payroll market by 32.2k vs. the consensus of 15k and the prior release of 0.9k. Also, the Unemployment Rate has been trimmed to 3.4% the expectation of 3.6%, and the former figure of 3.5%.
Better-than-projected Australian employment data is going to delight the Reserve Bank of Australia (RBA) ahead. This will support RBA Governor Philip Lowe to continue its rate hike regime unhesitatingly. Considering the RBA minutes released this week, the central bank will continue with 25 basis points (bps) rate hike structure as policymakers believe that the Official Cash Rate (OCR) has already been hiked in a short span of time.
However, the inflation rate has not topped yet as a historic surge in price growth witnessed in the third quarter indicates its persistent nature. The Australian inflation rate escalated to 7.3%, crossing the consensus of 7.0%. This forced the RBA to lift its interest rate guidance to 8.0%. A tight market is also responsible for sky-rocketing price pressures as households have enough means for spending.
The heated risk profile is expected to cool down as the Russia-Poland noise has almost terminated and see no developments further.
On the Tokyo front, a surprising downside in the Gross Domestic Product (GDP) is haunting investors. Japan’s third-quarter GDP contracted by 0.3% vs. the expectation of an expansion of 0.3%. Comments from UOB over GDP contraction that “We were surprised by the q/q contraction in 3Q as we underestimated the impact of stronger inflation, the wave of COVID-19 infections in summer, and a significant weakening of the yen that amplified the country’s already ballooning import bill” could punish the Japanese yen ahead.
- AUDUSD ticked to refresh intraday high before being sidelined on upbeat Aussie jobs report for October.
- Australia Employment Change rose by 32.2K, Unemployment Rate declined to 3.4%.
- Sluggish markets, mixed Fedspeak challenge momentum traders.
- Second-tier US data, risk catalysts will be crucial for clear directions.
AUDUSD renews its intraday high around 0.6750 after Aussie employment data printed upbeat outcomes for October.
The employment statistics gained an additional edge to lure buyers, especially after the previous day’s strong Wage Price Index from Canberra. It should be noted, however, that sluggish markets and recently dovish signals from the Reserve Bank of Australia (RBA) seem to challenge the pair buyers of late.
That said, Australia’s Employment Change jumped by 32.2K versus 15K market forecasts and 0.9K prior whereas the Unemployment Rate dropped to 3.4% from 3.5% previous readings and 3.6% expected.
Also read: Aussie jobs beats expectations in headline and Unemployment Rate, AUD bullish
Elsewhere, a tug of war between the US Republicans and Democrats in the Midterm Elections seems to keep the traders on their toes as President Joe Biden’s Party wins House control by a narrow margin whereas Donald Trump braces for 2024 elections with the aim to be the US President.
Additionally, mixed comments from the US Federal Reserve (Fed) officials also weigh on the market sentiment, despite strong US Retail Sales. Kansas City Fed President Esther George and Fed Governor Christopher Waller both favored smaller increases in the benchmark rates going forward whereas San Francisco Fed President Mary Daly mentioned challenges to the US economy growth.
It’s worth observing that worsening Covid conditions in China and an absence of imminent tussle between the West and Russia, due to the Poland fiasco, also challenge the market’s mood.
Above all, hopes of slower rate hikes and a lack of major negatives, at least for now, keep the stock buyers cautiously optimistic in Asia while the US Treasury yields remain pressured.
Having witnessed the initial reaction to Australia’s monthly jobs report, the AUDUSD pair traders should pay attention to the risk catalysts amid mixed concerns in the market.
In doing so, Covid headlines from China, the Russia-Ukraine tension and comments from the Federal Reserve officials will be crucial. Additionally important will be the second-tier US data like the Weekly Jobless Claims and Philadelphia Fed Manufacturing Survey for November.
Technical analysis
Despite the latest pullback, a downward sloping trend line from late April, previous resistance around 0.6730, precedes the 100-DMA level of 0.6700 to challenge short-term AUDUSD downside.
The Unemployment Rate release by the Australian Bureau of Statistics has beaten expectations as has the Employment and Full-time employment data as follows:
- Employment Rate: +32.2K (vs. +15K expected).
- Unemployment Rate 3.4% (vs. 3.6% expected).
- Australia Full-Time employment +47.1k s/adj.
- Australia participation rate +66.5 pct, s/adj (Reuters poll: +66.6 pct).
The Australian Dollar has shown a mixed reaction to the data. Technically, the price is on the front side of a dominant daily resistance:
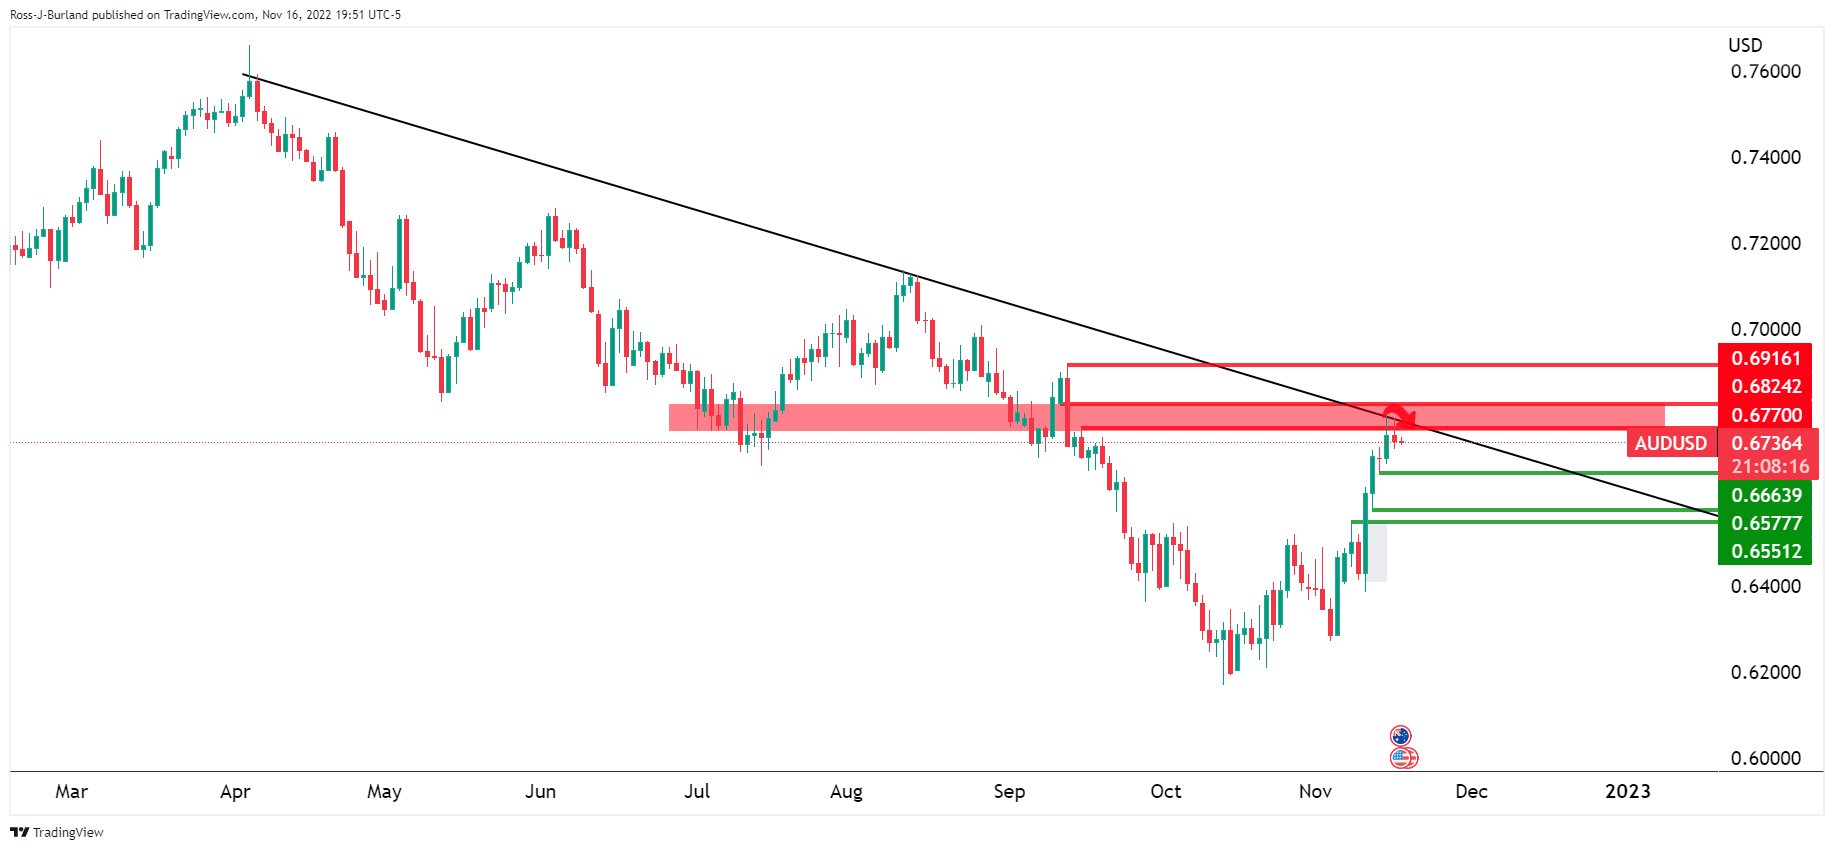
About Aussie jobs data
The Australian Bureau of Statistics (ABS) publishes an overview of trends in the Australian labour market, with the unemployment rate a closely watched indicator. It is released about 15 days after the month end and throws light on the overall economic conditions, as it is highly correlated to consumer spending and inflation. Despite the lagging nature of the indicator, it affects the Reserve Bank of Australia’s (RBA) interest rate decisions, in turn, moving the Australian dollar. Upbeat figure tends to be AUD positive
- EURGBP is expected to decline to near 0.8700 ahead of the UK Autumn Budget release.
- The BOE needs to plan more rate hikes to safeguard the economy from inflation shocks.
- A recession situation in Eurozone would be preferable to scale down inflationary pressures.
The EURGBP pair is displaying back-and-forth moves in a narrow range of 0.8717-0.8728 in the Tokyo session. The asset is expected to continue its downside momentum after a downside break towards the round-level support at 0.8700 as a significant surge in the UK inflation rate has triggered odds of further policy tightening by the Bank of England (BOE). Also, investors are focused on the release of the UK Autumn Budget.
The headline UK Consumer Price Index (CPI) has jumped to 11.1% vs. the projection of 10.7%. A historic surge in inflationary pressures led by accelerating oil prices and a tight labor market has cleared that a peak for price growth is still ahead. The absence of exhaustion signs in the price rise index creates pressure on the Bank of England (BOE) policymakers to multiply interest rates further.
Meanwhile, the focus on UK Autumn Budget is also keeping the Euro bulls at the back foot. UK Prime Minister Rishi Sunak and Chancellor Jeremy Hunt are entitled to fill the GBP 60bln financial hole that could be achieved by sheer fiscal tightening measures. Investors are awaiting the extent of spending cuts and tax hikes to determine the scale of the decline in consumer spending.
On the Eurozone front, European Central Bank’s (ECB) policymaker Pablo Hernandez de Cos said on Wednesday that the inflation spike is proving highly persistent and has also broadened, as reported by Reuters. ECB policymaker further added that balance sheet reduction in the euro area should be very gradual and predictable. And, a recession situation would trim the inflationary pressures vigorously.
| Index | Change, points | Closed | Change, % |
|---|---|---|---|
| NIKKEI 225 | 38.13 | 28028.3 | 0.14 |
| Hang Seng | -86.64 | 18256.48 | -0.47 |
| KOSPI | -2.88 | 2477.45 | -0.12 |
| ASX 200 | -19.4 | 7122.2 | -0.27 |
| FTSE 100 | -18.21 | 7351.19 | -0.25 |
| DAX | -144.48 | 14234.03 | -1 |
| CAC 40 | -34.44 | 6607.22 | -0.52 |
| Dow Jones | -39.09 | 33553.83 | -0.12 |
| S&P 500 | -32.94 | 3958.79 | -0.83 |
| NASDAQ Composite | -174.75 | 11183.66 | -1.54 |
North Korea Foreign Minister says ''US allies' increased 'extended deterrence' will result in our stronger military activities.''
More to come ...
- EURUSD remains sidelined around a 4.5-monnth high, pauses two-day uptrend.
- Market sentiment remains dicey even as geopolitical fears recede.
- Strong US data, Covid woes challenge optimists even as Fed policymakers favor 50 bps rate hike in December.
- Upbeat Eurozone inflation could keep buyers on the table, second-tier US data is also important to watch.
EURUSD steadies near 1.0390-400 as buyers run out of steam during early Thursday, following a two-day uptrend.
The major currency pair’s latest inaction could be linked to the dicey market conditions, as well as mixed comments from the European Central Bank (ECB) and the US Federal Reserve (Fed) policymakers. Adding strength to the EURUSD pair’s inaction could be a cautious mood ahead of the final readings of the Eurozone inflation data for October, expected to confirm the 10.7% initial forecasts per the Harmonized Index of Consumer Prices (HICP) measure.
On Wednesday, the news that Russian-made rockets were fired at Poland and killed two people initially soured sentiment. The same triggered emergency meetings of the North Atlantic Treaty Organization (NATO) and the Group of Seven (G7), which in turn favored the US Dollar (USD) due to its safe-haven appeal. However, the updates shared by the Associated Press (AP) quoted an anonymous US official’s findings while mentioning that the missile may have been fired by Ukraine, which in turn allowed Moscow the criticize Kyiv for the same and worsen the mood.
Elsewhere, US Retail Sales growth rose by 1.3% MoM in October versus 1.0% expected and 0.0% prior. The details suggest that the Retail Sales ex Autos also grew 1.3% MoM compared to 0.4% market consensus and 0.1% previous readings. Further, US Industrial Production contracted by 0.1% in October versus 0.2% forecast and 0.1% prior (revised from 0.4%).
It should be noted that Kansas City Fed President Esther George and Fed Governor Christopher Waller both favored smaller increases in the benchmark rates going forward. However, there was a mismatch in the comments from the ECB policymakers and hence the EURUSD seemed to struggle of late. That said, ECB policymaker Pablo Hernandez de Cos backed further rate increases but Vice President Luis de Guindos teased passive quantitative tightening. Further, ECB Governing Council member Ignazio Visco noted that the case for implementing a less aggressive approach was "gaining ground".
Again this backdrop, Wall Street closed in the red but the US Treasury yields struggle to stage recovery. That said, the S&P 500 Futures print mild losses by the press time, after reversing from the monthly high the previous day.
Moving on, second-tier US data and the risk catalysts are important for near-term directions but major attention will be given to the Eurozone inflation and comments from the central bank policymakers as the EURUSD bulls take a breather.
Technical analysis
Sustained trading beyond six-month-old horizontal support, previous resistance around 1.0370-55, keeps EURUSD buyers hopeful even as the 200-DMA challenges the upside momentum near 1.0420.
| Pare | Closed | Change, % |
|---|---|---|
| AUDUSD | 0.67398 | -0.26 |
| EURJPY | 145.034 | 0.65 |
| EURUSD | 1.03919 | 0.41 |
| GBPJPY | 166.299 | 0.72 |
| GBPUSD | 1.19154 | 0.46 |
| NZDUSD | 0.61465 | -0.11 |
| USDCAD | 1.33299 | 0.39 |
| USDCHF | 0.94492 | 0.42 |
| USDJPY | 139.57 | 0.23 |
- WTI has been in the hands of the bears mid-week.
- A bearish H&S pattern has emerged on the daily chart with the right-hand shoulder on the backside of the micro trendline.
West Texas Intermediate (WTI) is around flat on the day so far following a consolidative and inside day on Wednesday. NATO said there was no evidence a missile that landed near a Polish village and killed two was a deliberate attack. The consensus is that it likely came from a Ukrainian air-defense system firing during Russian attacks and this has been easing concerns of an expanding war.
The Druzhba pipeline, which carries Russian oil into Europe was shut down earlier this week after Russian artillery damaged its infrastructure. However, the power supply is said to have been restored, analysts at ANZ Bank said. This is allowing oil delivers to countries such as Hungary, the Czech Republic, and Slovakia. ''Initial concerns of further disruptions in the Middle East also eased. An oil tanker was hit by a projectile in the Gulf of Oman, although damage was limited.''
Nevertheless, the analysts at ANZ Bank also said that the market is still facing supply-side issues. ''Germany warned it can’t rule out temporary supply bottlenecks when a ban on imports on Russian crude starts next month. OPEC also appears to be reducing output in line with its agreement to cut production. Tanker tracker data shows that OPEC shipments were significantly more than 1mb/d in the first 15 days of November, according to Petro-Logistics. Markets found some support from EIA’s weekly inventory report. Commercial stockpiles reached 5,400kbbl last week.''
WTI technical analysis
The following illustrates a multi-time-frame bearish bias on the monthly, weekly, and daily charts.
The price is now on the back side of the monthly trendline and is being rejected on a restest.
The price could be on the verge of completing an M-formation below the locked-in highs below horizontal resistance.
A bearish H&S pattern has emerged on the daily chart with the right-hand shoulder on the backside of the micro trendline.
Bears broke the prior structure of 85.32 but have been unable to follow through. A move below $84 the figure is now required to shift the bias fully.
- US Dollar Index remains sidelined after bouncing off 200-DMA.
- Bearish MACD signals keep sellers hopeful but nearly oversold RSI favor the rebound from the key DMA.
- DXY bulls remain cautious unless crossing the previous support line from May.
US Dollar Index (DXY) seesaws around 106.30 as the 200-DMA challenges the bears early Thursday.
In doing so, the greenback’s gauge versus the six major currencies makes rounds to the 61.8% Fibonacci retracement level of the DXY’s May-September upside, close to 106.45.
Given the nearly oversold RSI conditions and the quote’s repeated failure to break the 200-DMA support, currently around 105.90, the US Dollar Index may witness recovery moves targeting the 107.00 threshold.
However, the weekly high near 107.30 and the 50% Fibonacci retracement level surrounding the 108.00 round figure could challenge the DXY bulls afterward.
It’s worth noting that the upside momentum remains elusive unless the quote stays successfully beyond the support-turned-resistance line from late May, around 108.80 at the latest.
On the flip side, a daily closing below the 200-DMA level near 105.90 could aim for the latest swing low near 105.30 before targeting August month’s bottom of 104.63.
In a case where the DXY remains bearish past 104.60, the lows marked during late June and May, respectively near 103.40 and 101.30, will gain the market’s attention.
US Dollar Index: Daily chart
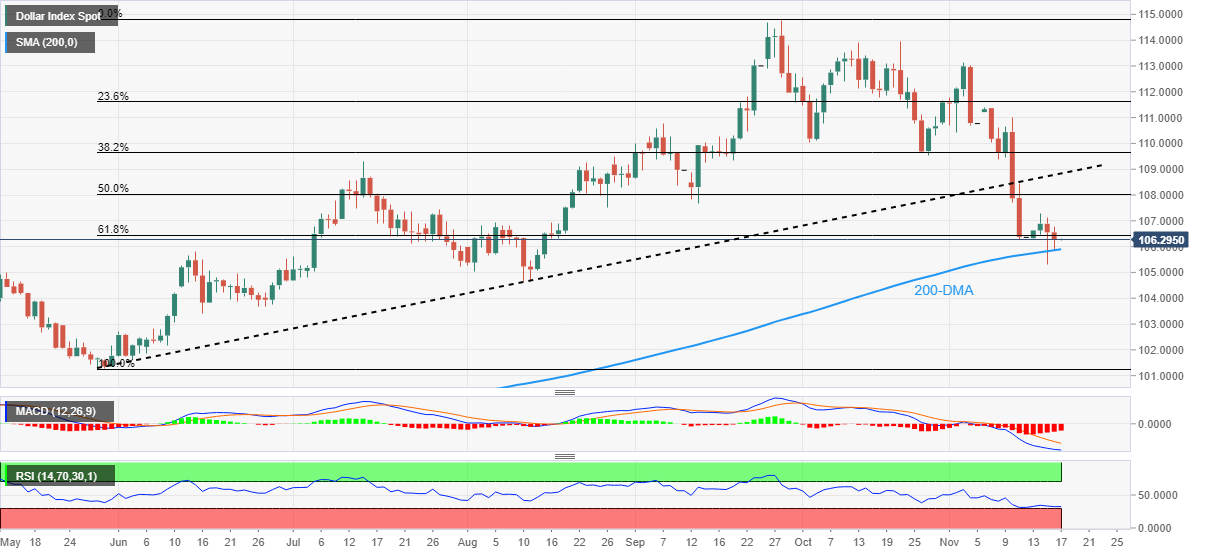
Trend: Further recovery expected
- The formation of the Tweezer Tops candlestick pattern indicates temporary exhaustion in the upside momentum.
- A rangebound structure near the 200-EMA on a lower timeframe depicts a make or a break opportunity.
- The asset is auctioning above the 61.8% Fibo retracement at 0.6100.
The NZDUSD Pair is walking on thin ice around the immediate support of 0.6140 in the early Asian session. The asset has turned sideways amid ambiguity in the market mood. S&P500 was punished after Target Corporation (NYSE:TGT) projected a bleak outlook. Also, the US dollar index (DXY) struggled as fears over the Russia-Poland noise got vanished.
Meanwhile, the 10-year US Treasury yields are facing immense pressure as investors are betting over a less-aggressive approach adaptation by the Federal Reserve (Fed) ahead. The long-term yields have dropped below 3.7%.
NZDUSD daily chart
-638042399545119016.png)
On a daily scale, the asset is displaying signs of loss in the upside momentum. The major has formed a Tweezer Tops candlestick pattern, which indicates the availability of significant offers at elevated levels. In the candlestick formation, the highs of both candlesticks remain almost the same and the formation of long wicks is bolstering the strength-losing structure.
Also, the pair has climbed above the 61.8% Fibonacci retracement (placed from the August 12 high at 0.6470 to October 13 low at 0.5512) at 0.6100, which generally leads to a corrective move before an impulsive rally.
NZDUSD 15-minute chart
-638042399641952058.png)
On a 15-minute chart, the asset is oscillating in a range of 0.6130-0.6160 around the 200-period Exponential Moving Average (EMA). The Relative Strength Index (RSI) (14) is hovering in a 40.00-60.00 range, which indicates that investors are awaiting a potential trigger for a decisive move.
For an upside move, the asset has to cross the round-level resistance of 0.6200, which will drive the asset near August 25 high at 0.6250, followed by July 22 high at 0.6304.
On the contrary, the Kiwi bulls could lose strength if the asset drop below Wednesday’s low at 0.6129, which will drag the asset toward Tuesday’s low at 0.6085. A slippage below the latter will drag the asset toward November 10 high at 0.6041.


© 2000-2026. All rights reserved.
This site is managed by Teletrade D.J. LLC 2351 LLC 2022 (Euro House, Richmond Hill Road, Kingstown, VC0100, St. Vincent and the Grenadines).
The information on this website is for informational purposes only and does not constitute any investment advice.
The company does not serve or provide services to customers who are residents of the US, Canada, Iran, The Democratic People's Republic of Korea, Yemen and FATF blacklisted countries.
Making transactions on financial markets with marginal financial instruments opens up wide possibilities and allows investors who are willing to take risks to earn high profits, carrying a potentially high risk of losses at the same time. Therefore you should responsibly approach the issue of choosing the appropriate investment strategy, taking the available resources into account, before starting trading.
Use of the information: full or partial use of materials from this website must always be referenced to TeleTrade as the source of information. Use of the materials on the Internet must be accompanied by a hyperlink to teletrade.org. Automatic import of materials and information from this website is prohibited.
Please contact our PR department if you have any questions or need assistance at pr@teletrade.global.
transfers