- Analytics
- News and Tools
- Market News
CFD Markets News and Forecasts — 22-03-2024
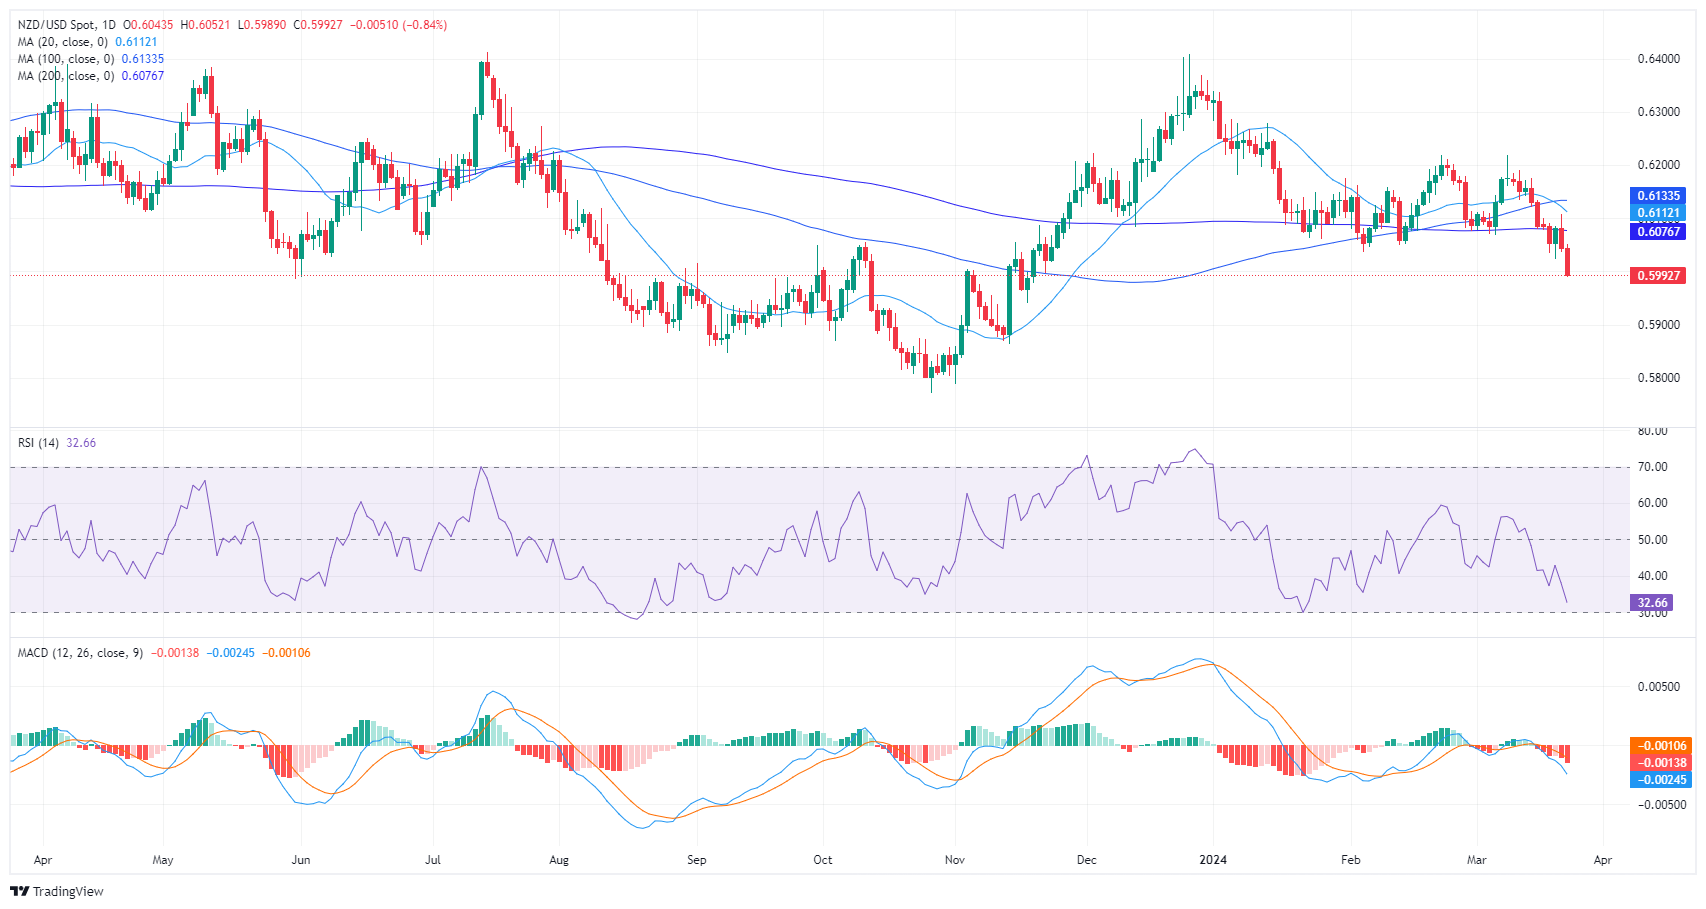
- Indicators flash oversold conditions on the daily chart.
- Contrarily, hourly chart indicators suggest a slow return of bullish impulse as the bears might have run out of steam.
In Friday's session, the NZD/USD declined just below the 0.6000 threshold, illustrating a bearish outlook as sellers continue to dominate the market. The pair is positioned below its primary Simple Moving Averages (SMAs), further backing the bearish perspective. Technical indicators hint at a strengthening sellers' command but indicators lay in oversold terrain, a typical signal, and the buying momentum might recover.
On the daily chart, the Relative Strength Index (RSI) for the NZD/USD pair resides in negative territory presently, indicating a prevailing downtrend as sellers dominate the market. The RSI was reported at 33, bordering on oversold conditions, a potential indication for future corrective movement. The Moving Average Convergence Divergence (MACD) histogram exhibits rising red bars, also confirming the negative momentum.
NZD/USD daily chart
Moving to the hourly chart, the RSI levels convey a relatively similar scenario. The value last rested at 28, corroborating its presence in the oversold territory. Contrarily, the MACD on the hourly chart displays rising green bars, hinting at a creeping positive momentum.
NZD/USD hourly chart
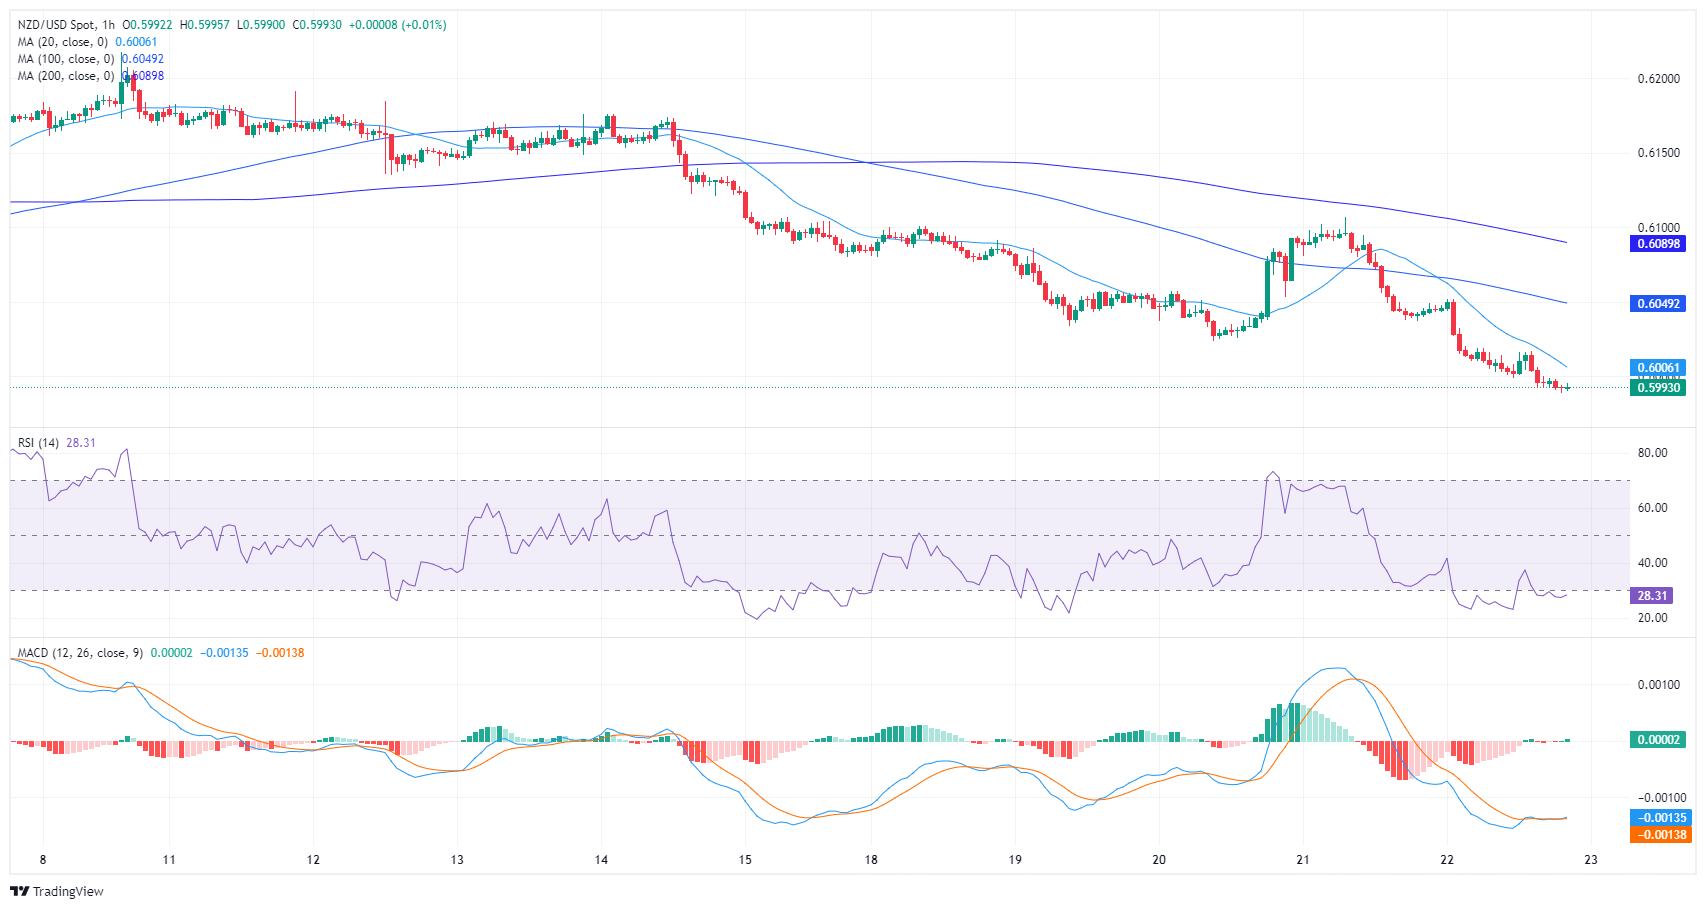
In essence, while the daily chart discloses a persisting bearish momentum, hourly indications of rising positive momentum in the MACD histogram may signal a reprieve from selling pressure. Looking at the broader trend, the pair is below the 20, 100, and 200-day Simple Moving Averages (SMAs), further implying a bearish outlook.
- Euro sheds 1.3% top-to-bottom in broad-market pullback into USD.
- Upbeat German data couldn’t keep the Euro afloat.
- US GDP and PCE inflation to be key data prints next week.
The EUR/USD lost further ground on Friday, as investors shrugged off above-forecast German economic data to bid up the US Dollar across the board. Mid-tier German sentiment indicators all came in well above expectations as consumer, investor, and business sentiment all improve. However, middling to soft economic data from Europe remains a key stumbling block for overly bullish confidence.
Federal Reserve (Fed) Chairman Jerome Powell delivered a speech while attending a Fed Listens event in Washington, DC. Still, the Fed head was careful to avoid discussing any monetary policy issues, leaving rate-cut-hungry investors with little new to chew on heading into the weekend.
Next week, US Gross Domestic Product (GDP) figures on Thursday and a Personal Consumption Expenditure (PCE) Price Index print slated for Friday will dominate market focus. Market participants hoping for Fed rate cuts sooner rather than later will be hoping for US growth to continue easing. The Core MoM PCE Price Index, the Fed’s favored inflation metric, is expected to tick down to 0.3% from 0.4%.
EUR/USD technical outlook
EUR/USD rose into a weekly high of 1.09426 on Thursday, before extending a backslide into the 1.0800 handle ahead of the Friday market close. The pair shed nearly 1.3% top-to-bottom, stumbling into the Euro’s lowest bids since the beginning of March.
Daily candlesticks have fallen back into the 200-day Exponential Moving Average (EMA) near 1.0820, and the way is open for a continued slide into the last swing low near 1.0750.
EUR/USD hourly chart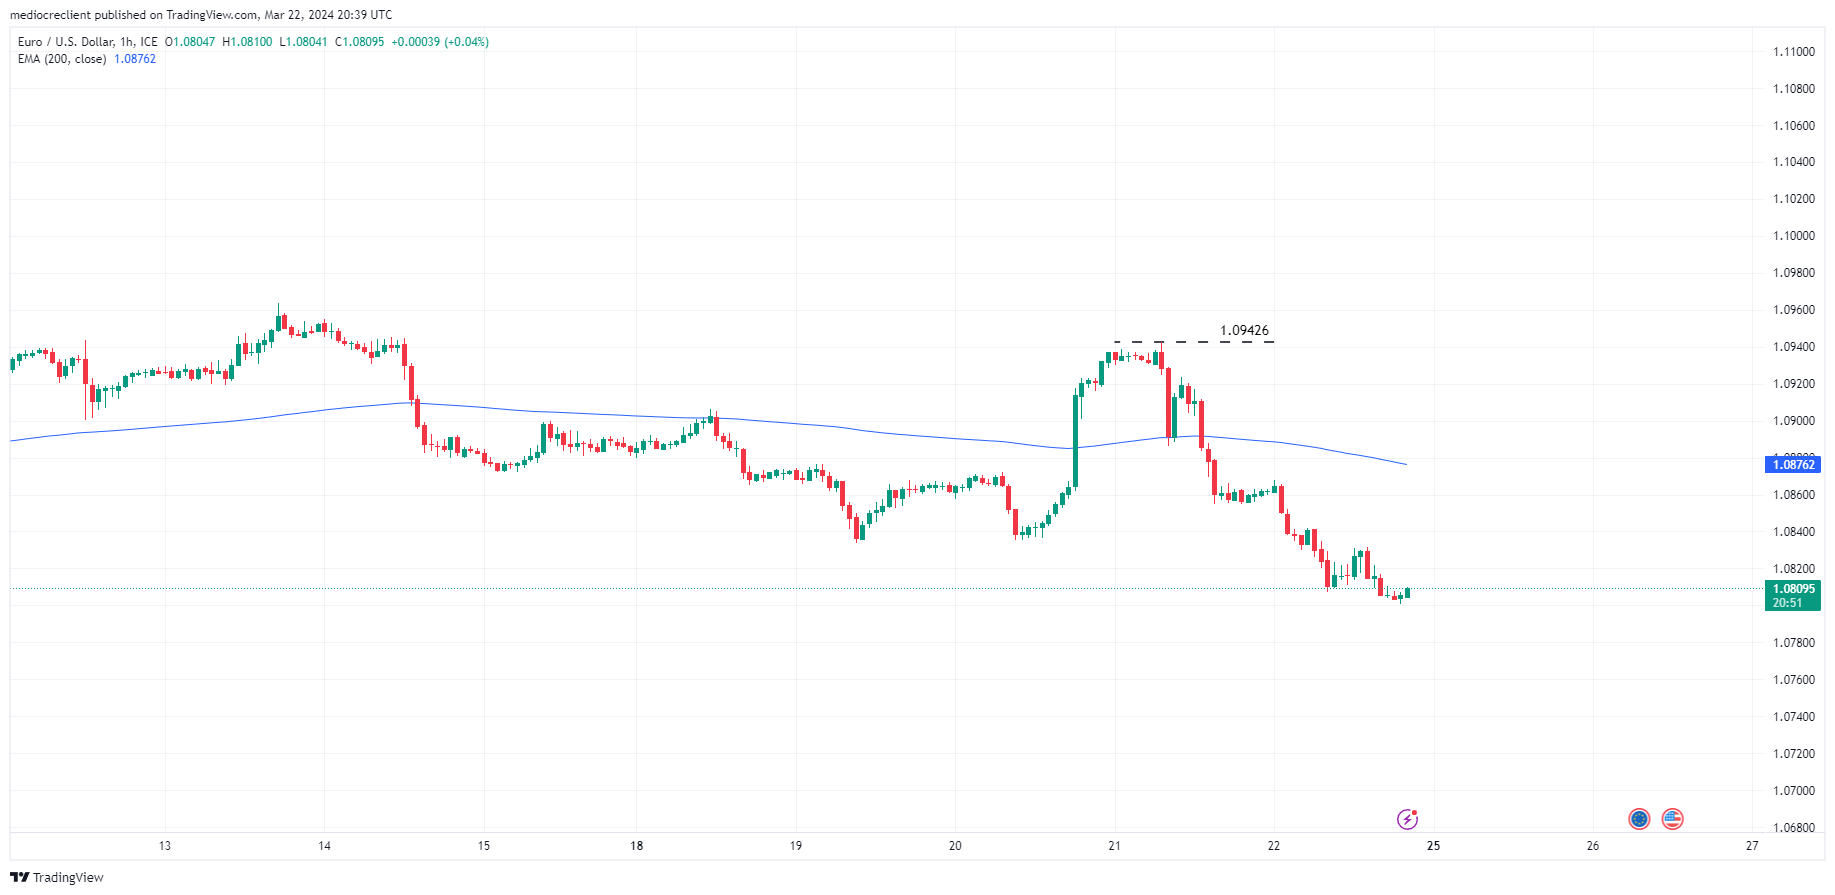
EUR/USD daily chart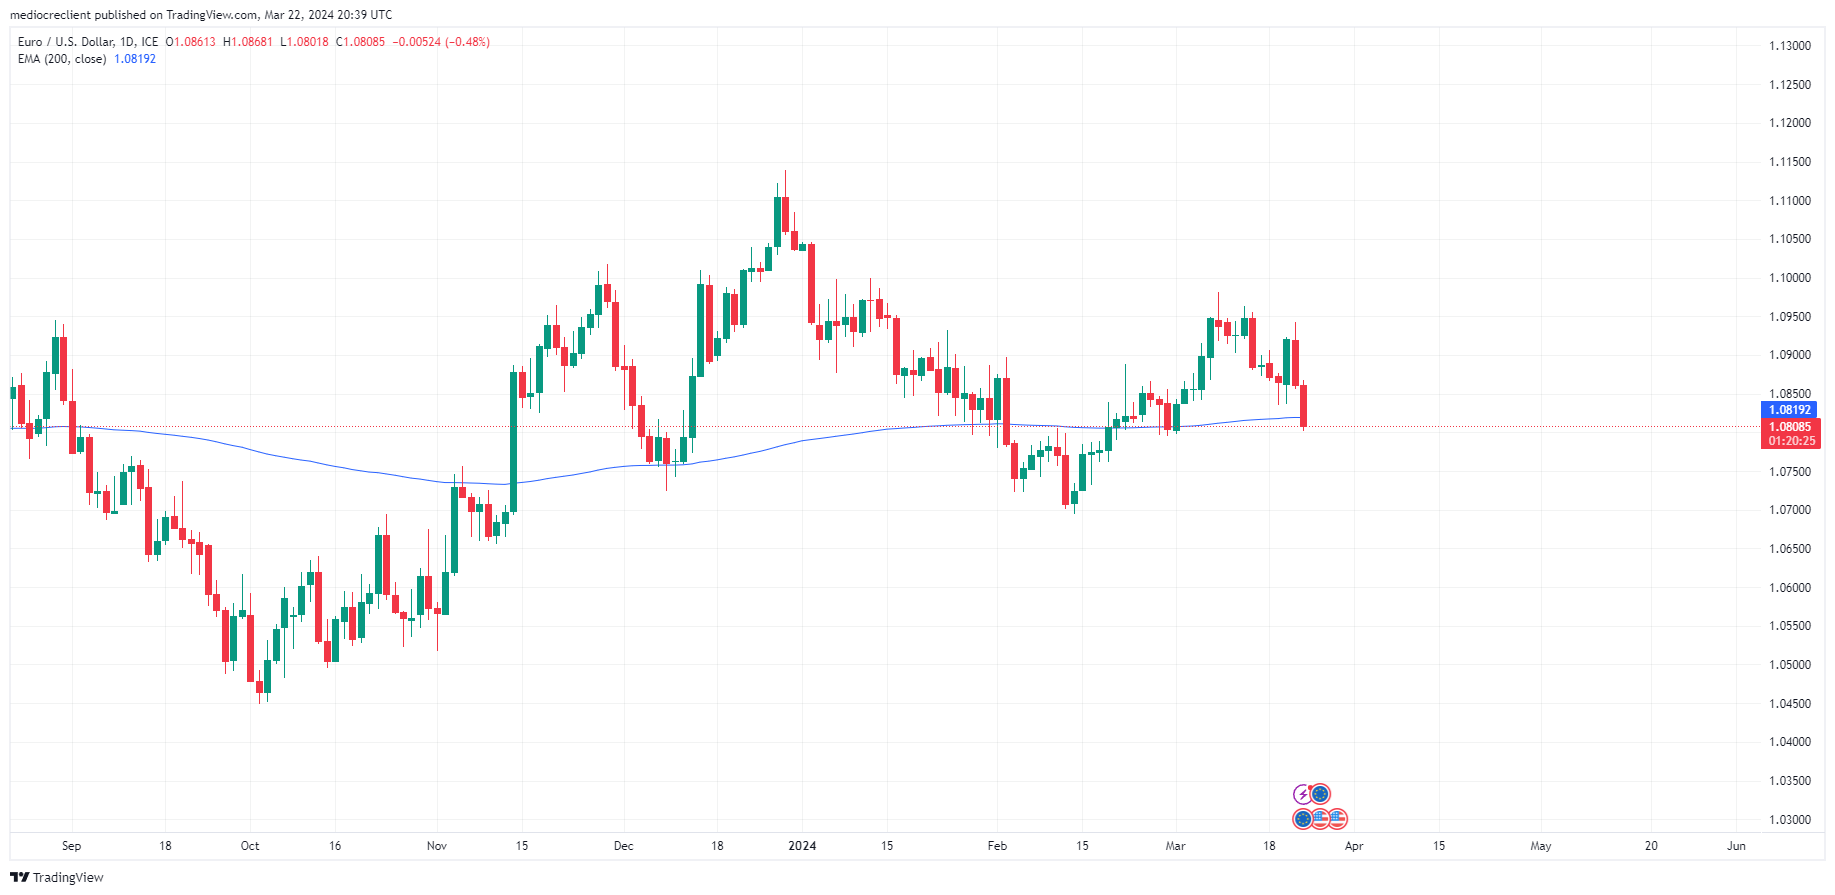
Euro FAQs
The Euro is the currency for the 20 European Union countries that belong to the Eurozone. It is the second most heavily traded currency in the world behind the US Dollar. In 2022, it accounted for 31% of all foreign exchange transactions, with an average daily turnover of over $2.2 trillion a day. EUR/USD is the most heavily traded currency pair in the world, accounting for an estimated 30% off all transactions, followed by EUR/JPY (4%), EUR/GBP (3%) and EUR/AUD (2%).
The European Central Bank (ECB) in Frankfurt, Germany, is the reserve bank for the Eurozone. The ECB sets interest rates and manages monetary policy. The ECB’s primary mandate is to maintain price stability, which means either controlling inflation or stimulating growth. Its primary tool is the raising or lowering of interest rates. Relatively high interest rates – or the expectation of higher rates – will usually benefit the Euro and vice versa. The ECB Governing Council makes monetary policy decisions at meetings held eight times a year. Decisions are made by heads of the Eurozone national banks and six permanent members, including the President of the ECB, Christine Lagarde.
Eurozone inflation data, measured by the Harmonized Index of Consumer Prices (HICP), is an important econometric for the Euro. If inflation rises more than expected, especially if above the ECB’s 2% target, it obliges the ECB to raise interest rates to bring it back under control. Relatively high interest rates compared to its counterparts will usually benefit the Euro, as it makes the region more attractive as a place for global investors to park their money.
Data releases gauge the health of the economy and can impact on the Euro. Indicators such as GDP, Manufacturing and Services PMIs, employment, and consumer sentiment surveys can all influence the direction of the single currency. A strong economy is good for the Euro. Not only does it attract more foreign investment but it may encourage the ECB to put up interest rates, which will directly strengthen the Euro. Otherwise, if economic data is weak, the Euro is likely to fall. Economic data for the four largest economies in the euro area (Germany, France, Italy and Spain) are especially significant, as they account for 75% of the Eurozone’s economy.
Another significant data release for the Euro is the Trade Balance. This indicator measures the difference between what a country earns from its exports and what it spends on imports over a given period. If a country produces highly sought after exports then its currency will gain in value purely from the extra demand created from foreign buyers seeking to purchase these goods. Therefore, a positive net Trade Balance strengthens a currency and vice versa for a negative balance.
- GBP/JPY retreats to 190.69, down 0.61%, missing the 194.00 psychological level.
- Uptrend signaled, with 190.75 support possibly curbing losses.
- Overcoming 191.00 resistance key to approach near 193.00 highs.
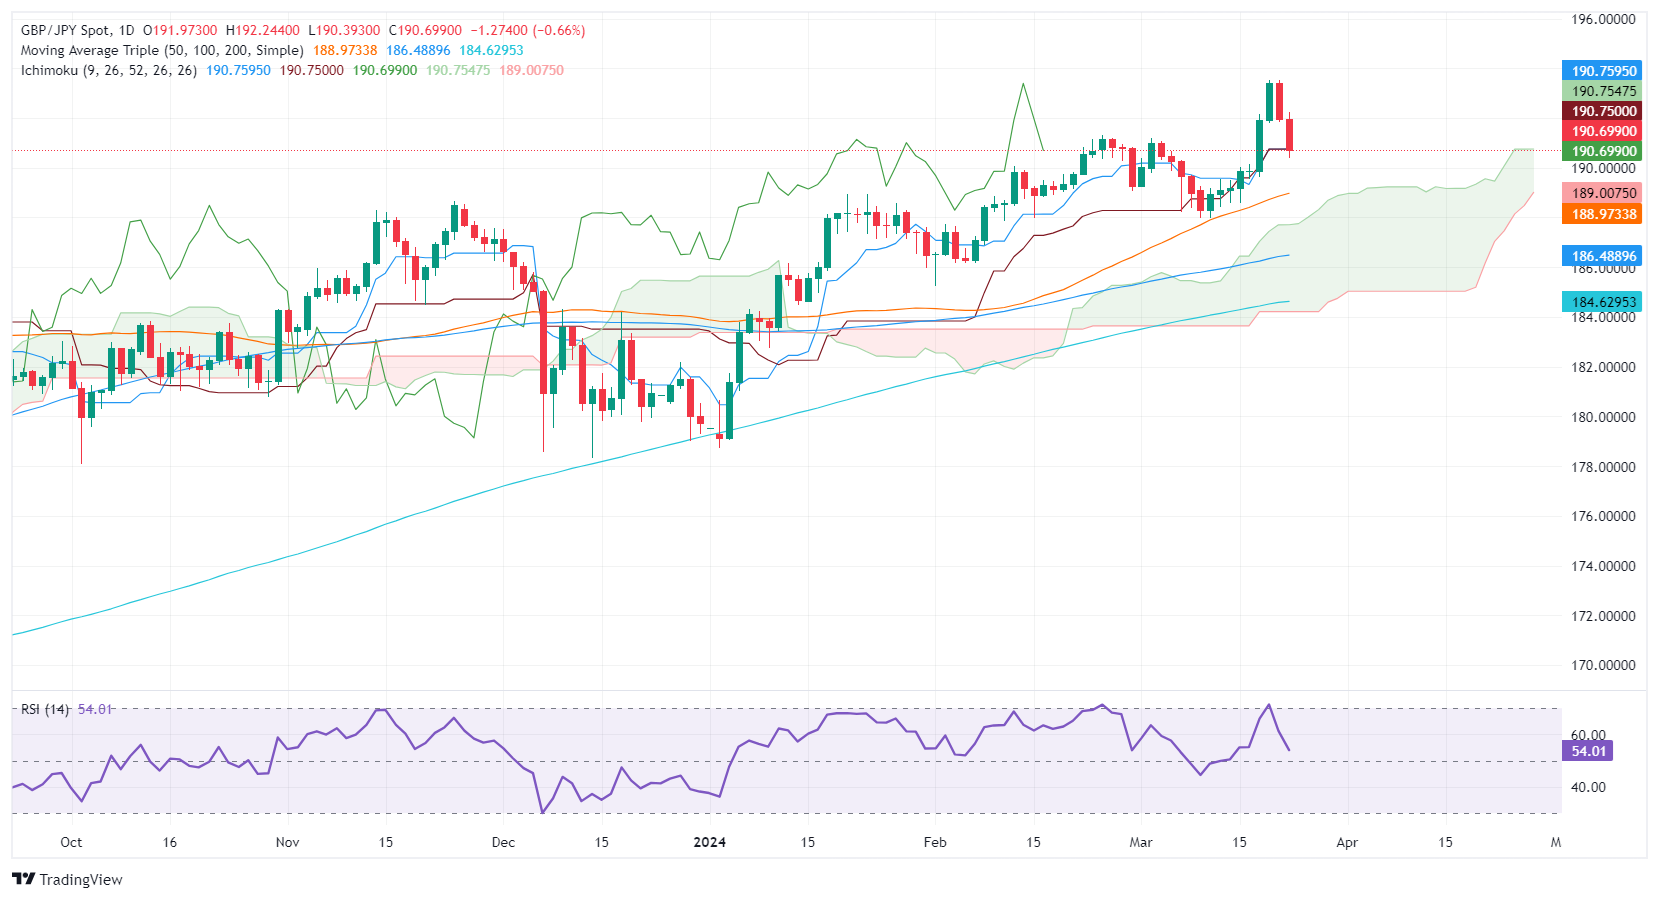
The GBP/JPY retreats deeper below the 190.00 figure after hitting a 9-year high of 193.55, as buyers fail to push through the latter and aim toward the 194.00 mark. At the time of writing, the pair traded at 190.69, down 0.61%.
GBP/JPY Price Analysis: Technical outlook
Despite falling, the GBP/JPY remains upward biased despite posting losses. The confluence of the Tenkan and Kijun-Sen at 190.75 capped the pair’s slide, but downside risks remain. If sellers push the exchange rate below the latter, the pair could aim for 190.00. Further losses are seen below that level, as the 189.00 psychological figure would be up next.
However, the path of least resistance is upwards, and if they reclaim the 191.00 figure, look for further gains. The next resistance would be today’s high at 192.23, followed by the 193.00 mark.
GBP/JPY Price Action – Daily Chart
- The daily chart reveals an overall positive trend but indicators took a big hit on Friday.
- The hourly RSI hints at a possible short-term upswing following a plunge into the oversold territory.
- The pair might side-ways trade to consolidate Friday’s movements..
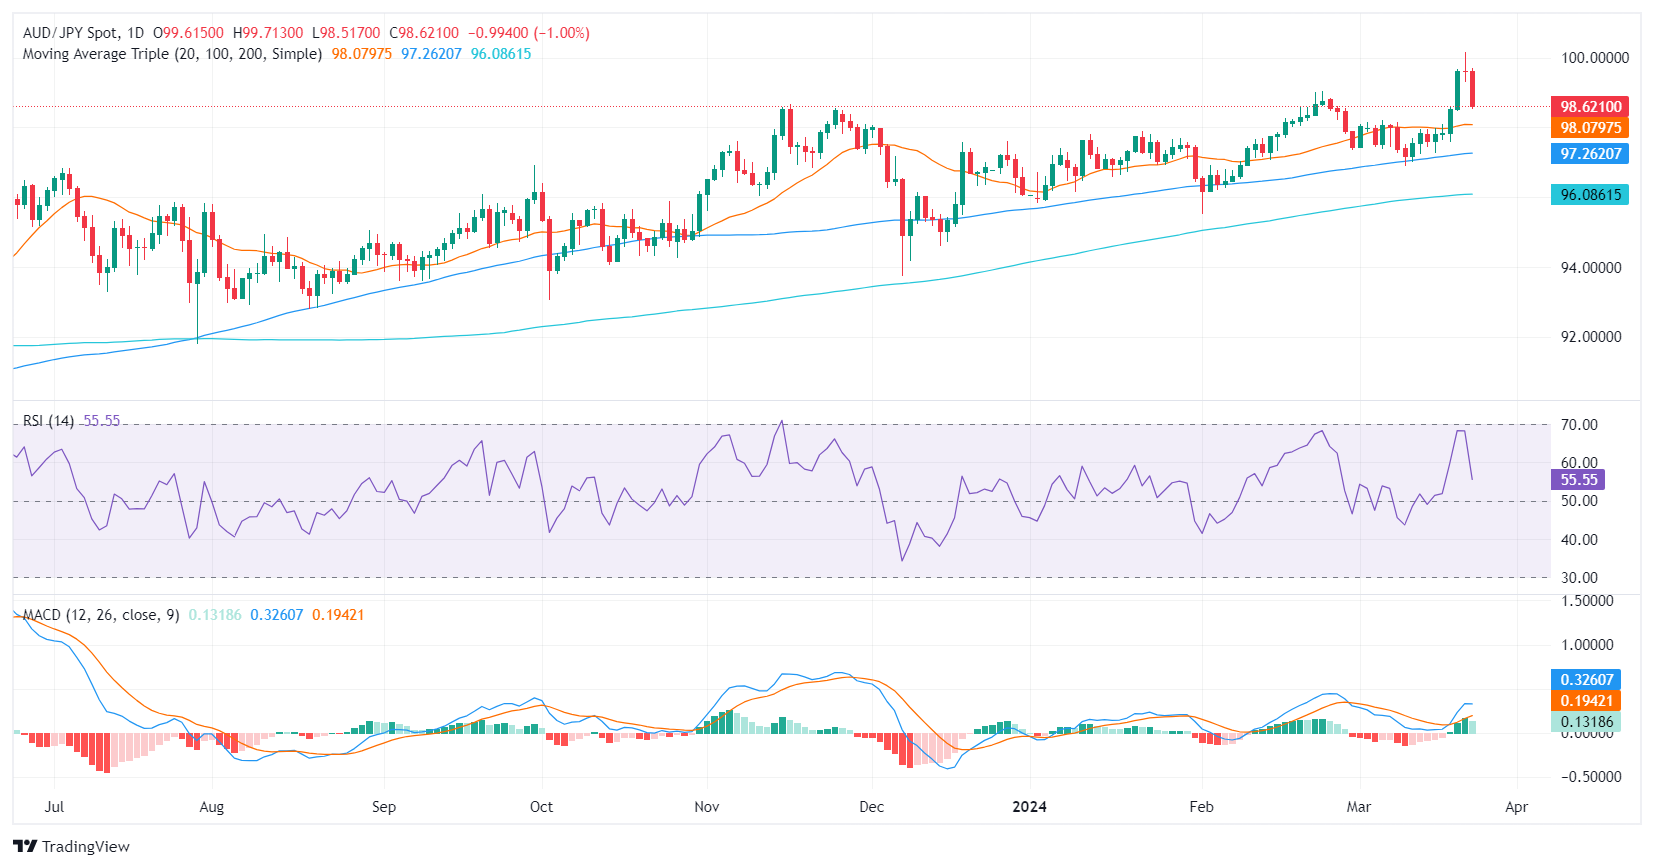
The AUD/JPY pair is currently trading at 98.60, showing a substantial decrease of nearly 1%. Despite this decline, the broader trend continues to show positivity, with bulls maintaining their control. In addition, as the downward movements might be over-extended, the pair may enter a consolidation phase.
On the daily chart, the technical outlook for the AUD/JPY pair suggests a positive trend. The latest Relative Strength Index (RSI) reading resides in the positive territory, aligning with the recent upward momentum. Having peaked near overbought conditions earlier in the week, the RSI has now pulled back to a moderate level, pointing towards potential consolidation. Concurrently, the Moving Average Convergence Divergence (MACD) paints a contrasting picture, showing decreasing green bars that signify a slowdown in positive market momentum.
AUD/JPY daily chart
Switching to the hourly chart, the last session's RSI plunged deep into the oversold territory, which could hint at a potential short-term correction upwards. Despite the sharp drop in the RSI, the MACD histogram displays flat green bars, implying stagnating bullish momentum on hourly timeframes.
AUD/JPY hourly chart
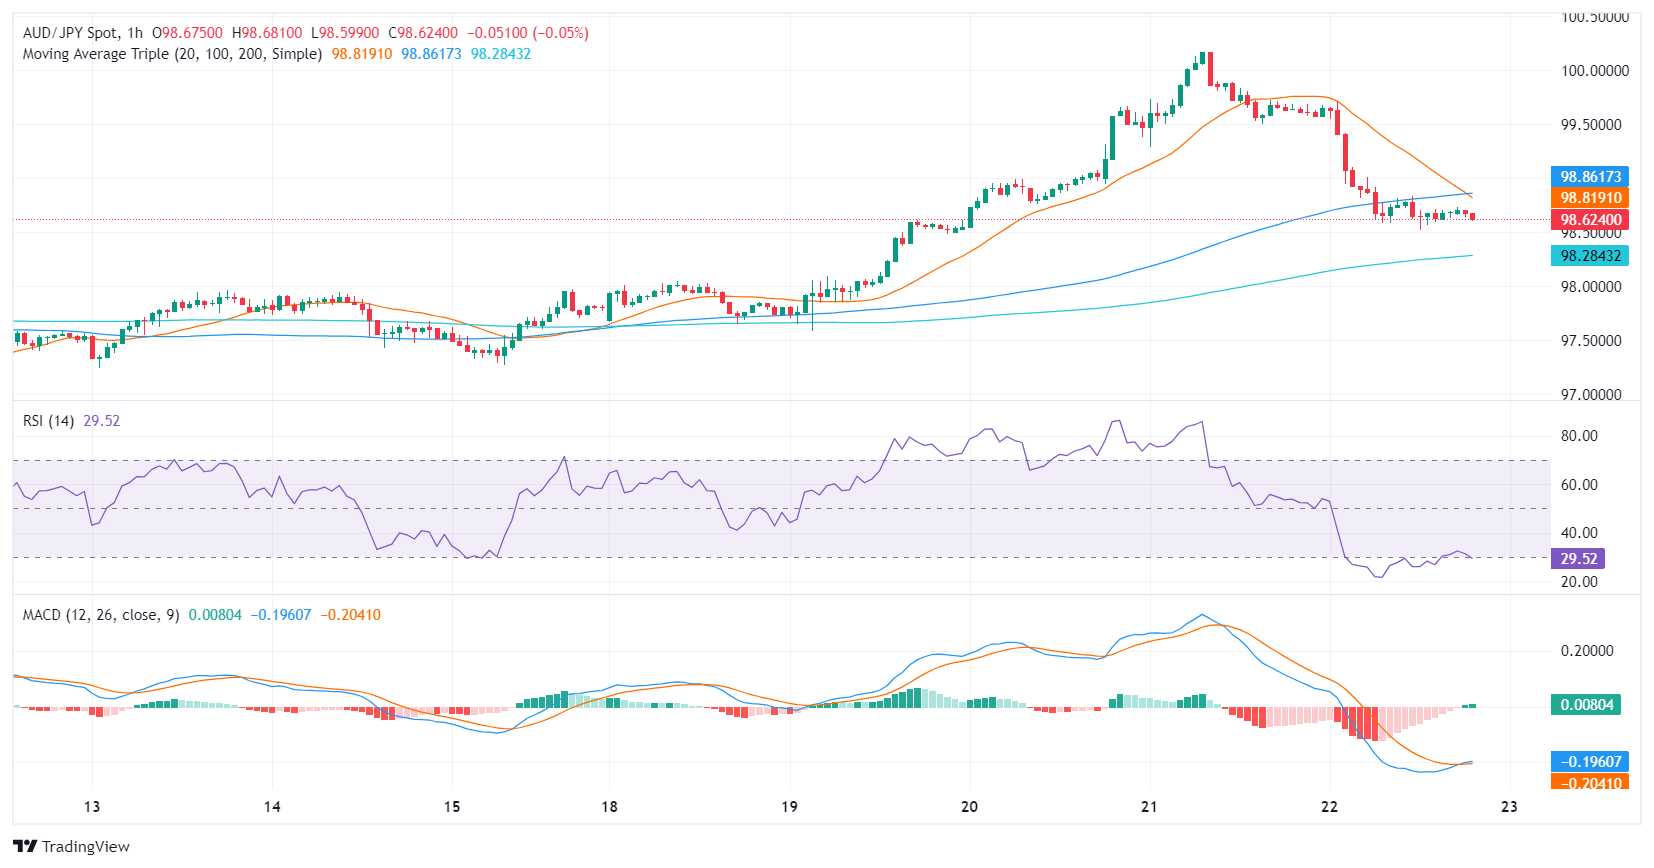
The next target for the sellers is the 20-day Simple Moving Average (SMA) at 98.10. Below that the 100 and 200-day SMAs will act as strong supports in case the downside pressure persists but if the bulls defend this level, the overall trend will remain positive.
- Gold prices see second day of decline, falling to $2,159 after peaking at an all-time high of $2,223.
- The Federal Reserve's dovish stance on interest rates keeps US yields down, except for US Dollar.
- Odds for Fed rate cut in June remain above 70% via CME FedWatch Tool.
Gold prices drop for the second consecutive day on Friday after hitting an all-time high of $2,223 on Thursday. Renewed demand for the Greenback amid falling US Treasury bond yields surprised traders and weighed on the yellow metal. At the time of writing, XAU/USD trades at $2,159, losing 0.90%.
The Federal Reserve's March meeting emphasized the need for policymakers to lower interest rates despite the latest two inflation reports suggesting that it´s reaccelerating. This sponsored XAU/USD’s leg up to new all-time highs, but it was short-lived.
On Thursday, traders booked profits, triggering a decline of $36 as the yellow metal finished the day with losses of 0.22%.
US Treasury yields failed to climb even though the Greenback is on a two-day rally. It gained 0.47% and was up at 104.45 late in Friday’s North American session. The lack of economic data on the calendar has kept the markets slightly calm ahead of the weekend.
Daily digest market movers: Gold price dips despite falling US yields
- Jerome Powell emphasized that the Fed had made progress on tempering inflation. Despite printing two straight months of higher prices, that hasn’t changed the Fed’s outlook for price stability.
- Fed policymakers kept the Dot Plot unchanged for 2024. Still, the 2025 Dot Plot was revised up from 3.6% to 3.9%.
- For 2024, the Federal Open Market Committee (FOMC) forecasts that the economy will grow 2.1%, up from 1.4%, while the Unemployment Rate will remain at 4%.
- Inflation figures in the United States, measured by the Fed’s favorite gauge for inflation, the Personal Consumption Expenditures (PCE), are now the focus. They are expected to be at 2.4%, while core PCE is projected at 2.6%, up from 2.4%.
- During the March 18 to 22 week, the US docket revealed that the jobs market is solid. However, the economy faces challenges like the slowdown revealed by S&P Global PMIs data. However, the housing market has been mildly recovering, and Housing Starts, Building Permits and Existing Home sales improved.
- According to the CME FedWatch Tool, expectations for a June rate cut stand at 75%.
Technical analysis: Gold traders' failure at $2,200 exposes $2,180 mark
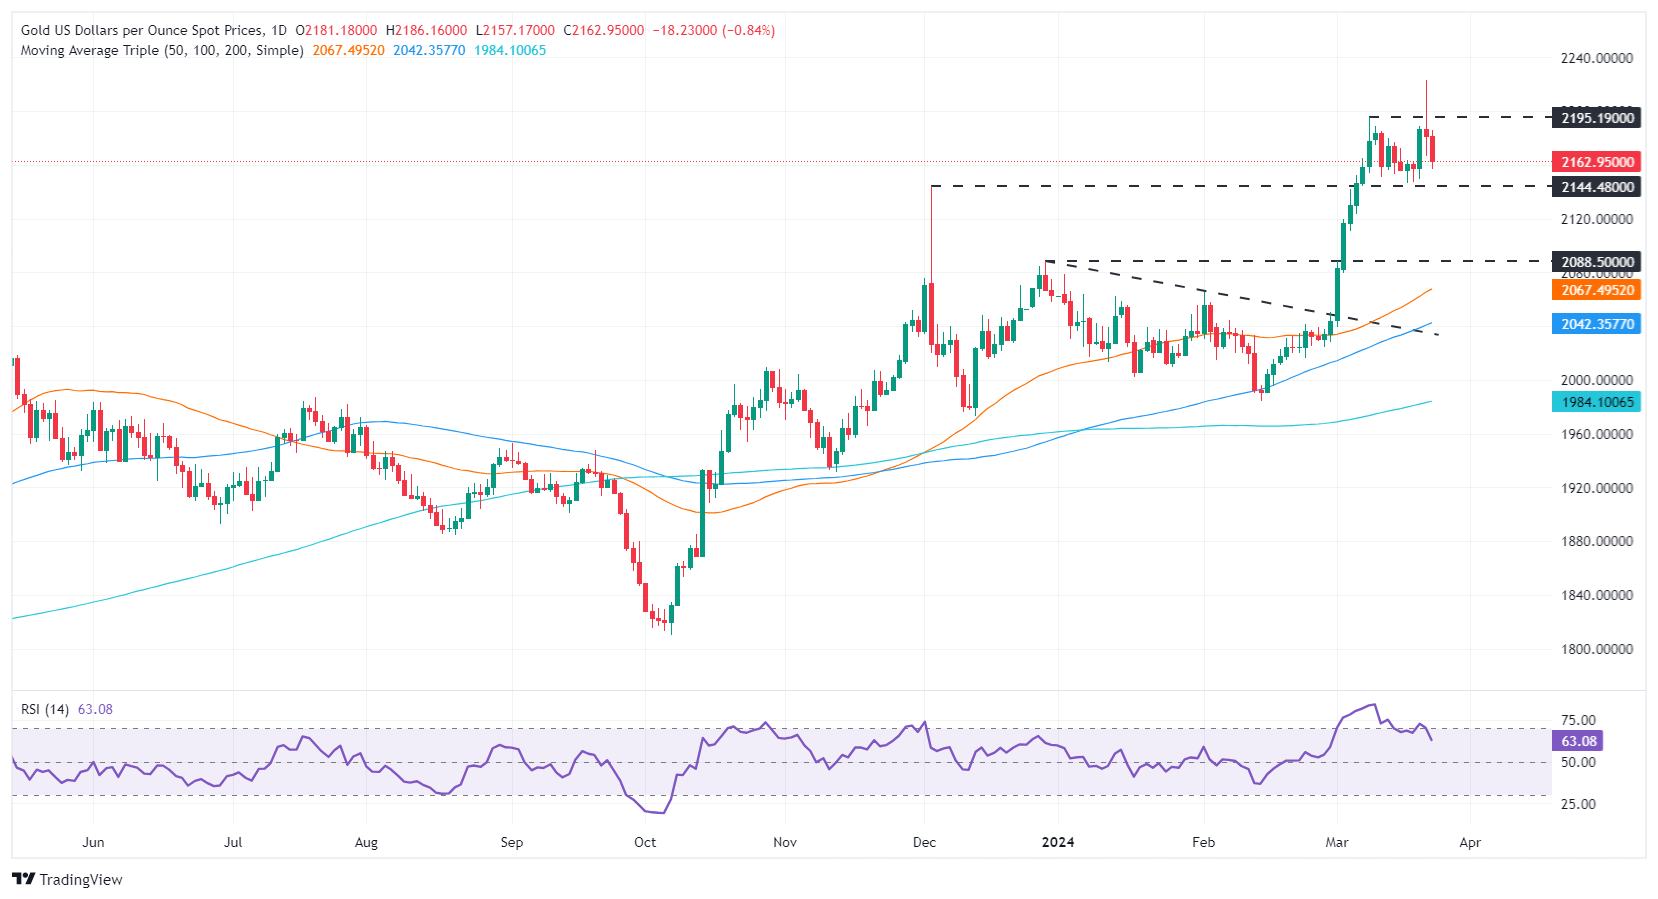
From a technical standpoint, XAU/USD is consolidating above $2,150, hoovering around that area for the last eleven days. Nevertheless, if sellers stepped in, dragging Gold prices below the aforementioned barrier, a fall toward the December 28 high-turned-support at $2,088 is on the cards. However, on its way down, key support levels must be broken, like the December 4 high, which turned support at $2,146, before challenging the $2,100 figure.
On the flip side, if buyers push prices toward $2,200, that will expose the current all-time high at $2,223 before aiming toward $2,250.
Gold FAQs
Gold has played a key role in human’s history as it has been widely used as a store of value and medium of exchange. Currently, apart from its shine and usage for jewelry, the precious metal is widely seen as a safe-haven asset, meaning that it is considered a good investment during turbulent times. Gold is also widely seen as a hedge against inflation and against depreciating currencies as it doesn’t rely on any specific issuer or government.
Central banks are the biggest Gold holders. In their aim to support their currencies in turbulent times, central banks tend to diversify their reserves and buy Gold to improve the perceived strength of the economy and the currency. High Gold reserves can be a source of trust for a country’s solvency. Central banks added 1,136 tonnes of Gold worth around $70 billion to their reserves in 2022, according to data from the World Gold Council. This is the highest yearly purchase since records began. Central banks from emerging economies such as China, India and Turkey are quickly increasing their Gold reserves.
Gold has an inverse correlation with the US Dollar and US Treasuries, which are both major reserve and safe-haven assets. When the Dollar depreciates, Gold tends to rise, enabling investors and central banks to diversify their assets in turbulent times. Gold is also inversely correlated with risk assets. A rally in the stock market tends to weaken Gold price, while sell-offs in riskier markets tend to favor the precious metal.
The price can move due to a wide range of factors. Geopolitical instability or fears of a deep recession can quickly make Gold price escalate due to its safe-haven status. As a yield-less asset, Gold tends to rise with lower interest rates, while higher cost of money usually weighs down on the yellow metal. Still, most moves depend on how the US Dollar (USD) behaves as the asset is priced in dollars (XAU/USD). A strong Dollar tends to keep the price of Gold controlled, whereas a weaker Dollar is likely to push Gold prices up.
- Dow Jones trims recent gains as US equities churn.
- DJIA eases back after failing to capture 39,900.00
- Markets hit a wide range heading into the Friday close.
The Dow Jones Industrial Average (DJIA) is testing into the low side around half a percent as US equities drift in multiple directions on Friday. US markets are running the gamut to wrap up the trading week, with the DJIA testing down, the NASDAQ Composite lifting around a third of a percent on the day and the S&P 500 stuck near the day’s opening bids.
Most of the US equity market’s major sectors are in the red on Friday, with Real Estate down around 1%, closely followed by the Financial Sector which is in the red by 0.8%. The Communications Services and Technology Sectors are up around 0.8% apiece on the day as telecoms and digital services rebound from recent selling pressure.
Dow Jones news
Nike Inc. (NKE) is leading the charge down the Dow Jones index, tumbling around 6 percent after reporting slowing sales in China, despite beating expectations on their top and bottom lines in their latest quarter.
Apple Inc. (AAPL) is up 0.8% on the day as the stock recovers from recent selling. Investors pared back on exposure to Apple recently after it was announced the company was being sued by the US Department of Justice for anti-competitive practices and monopolization in the cellphone market with their iPhone products.
Investors will be pivoting to next week’s US Gross Domestic Product (GDP) figures slated for next Thursday. US GDP growth in Q4 is expected to hold steady at 3.2%. Next Friday also brings the latest print of the Federal Reserve’s (Fed) preferred inflation metric, the Personal Consumption Expenditure (PCE) Price Index. Median market forecasts expect MoM Core PCE in February to tick down to 0.3% from the previous 0.4%.
Dow Jones Industrial Average technical outlook
It’s been a stellar week for the Dow Jones, with the index climbing nearly 3% bottom-to-top from the week’s early low bids near 38,760.79. The index broke into new all-time highs twice in two days, etching in a fresh record peak at 39,889.05 before settling into a tight range near 39,600.00 ahead of Friday’s closing bell.
The DJIA is on pace to close in the green for a fifth consecutive month, and the index is up around 2.9% from the last swing low into 38,500.00. The Dow Jones is trading deep into bull country, with price action well above the 200-day Simple Moving Average (SMA) at 38,257.84.
Dow Jones Industrial Average 5-minute chart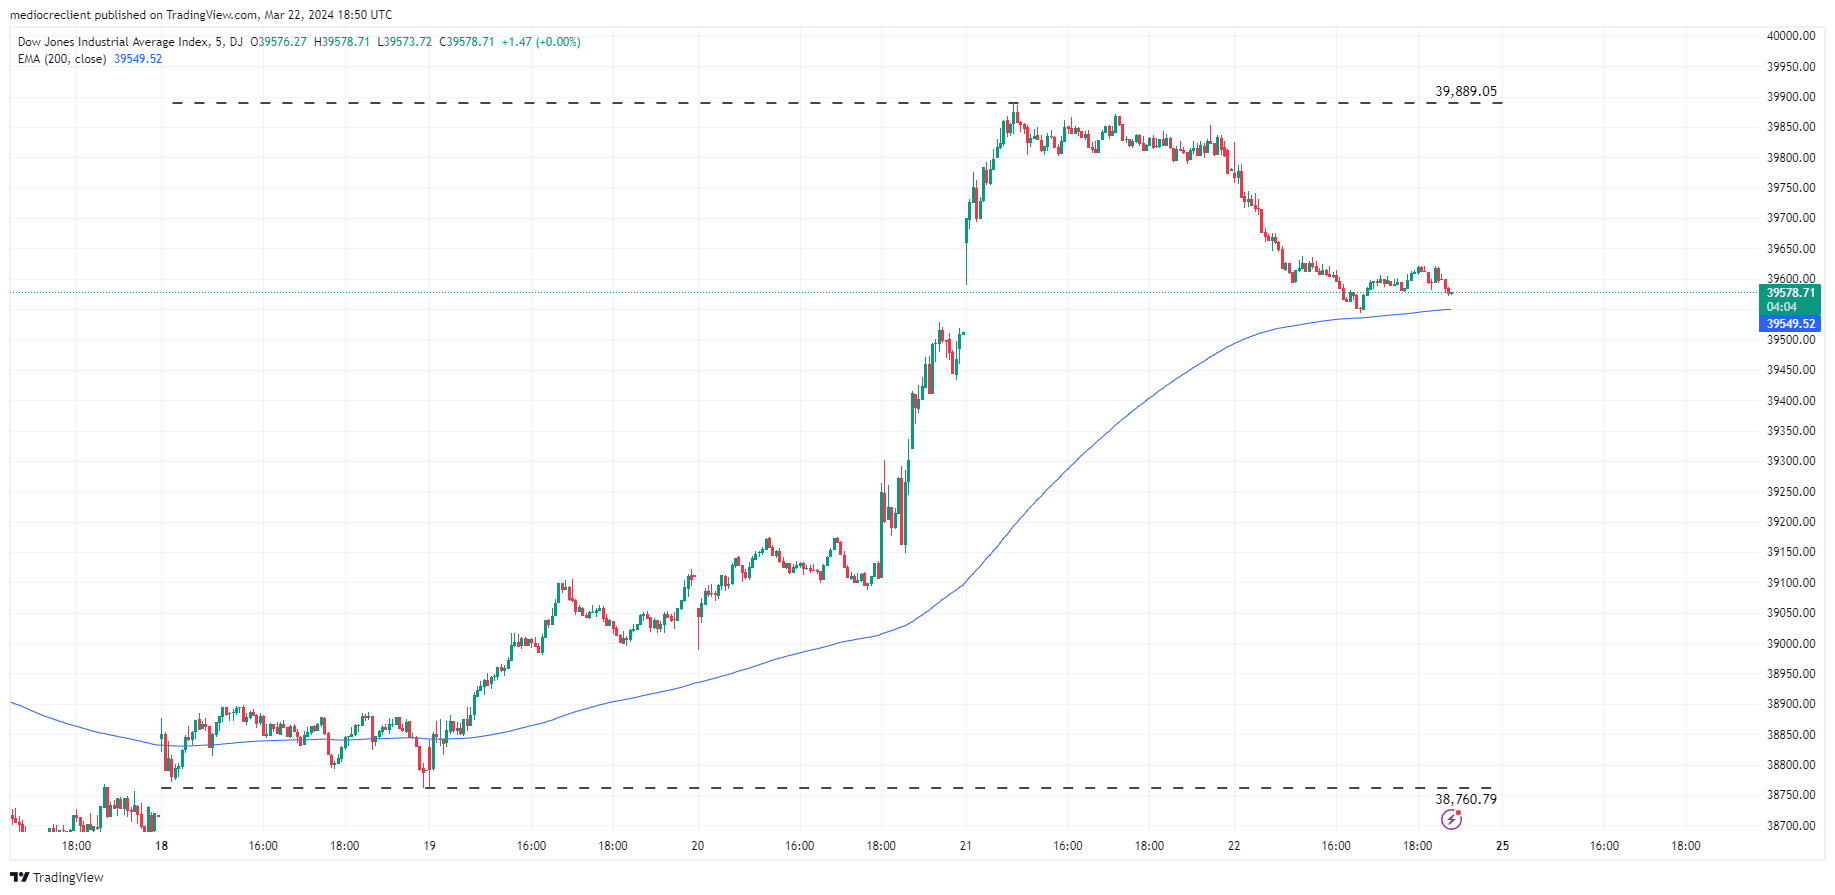
- Bearish pressure intensified on the daily chart, and the pair lost the 20-day SMA.
- As the pair lies deeply oversold on the hourly chart, buyers might start taking profits.
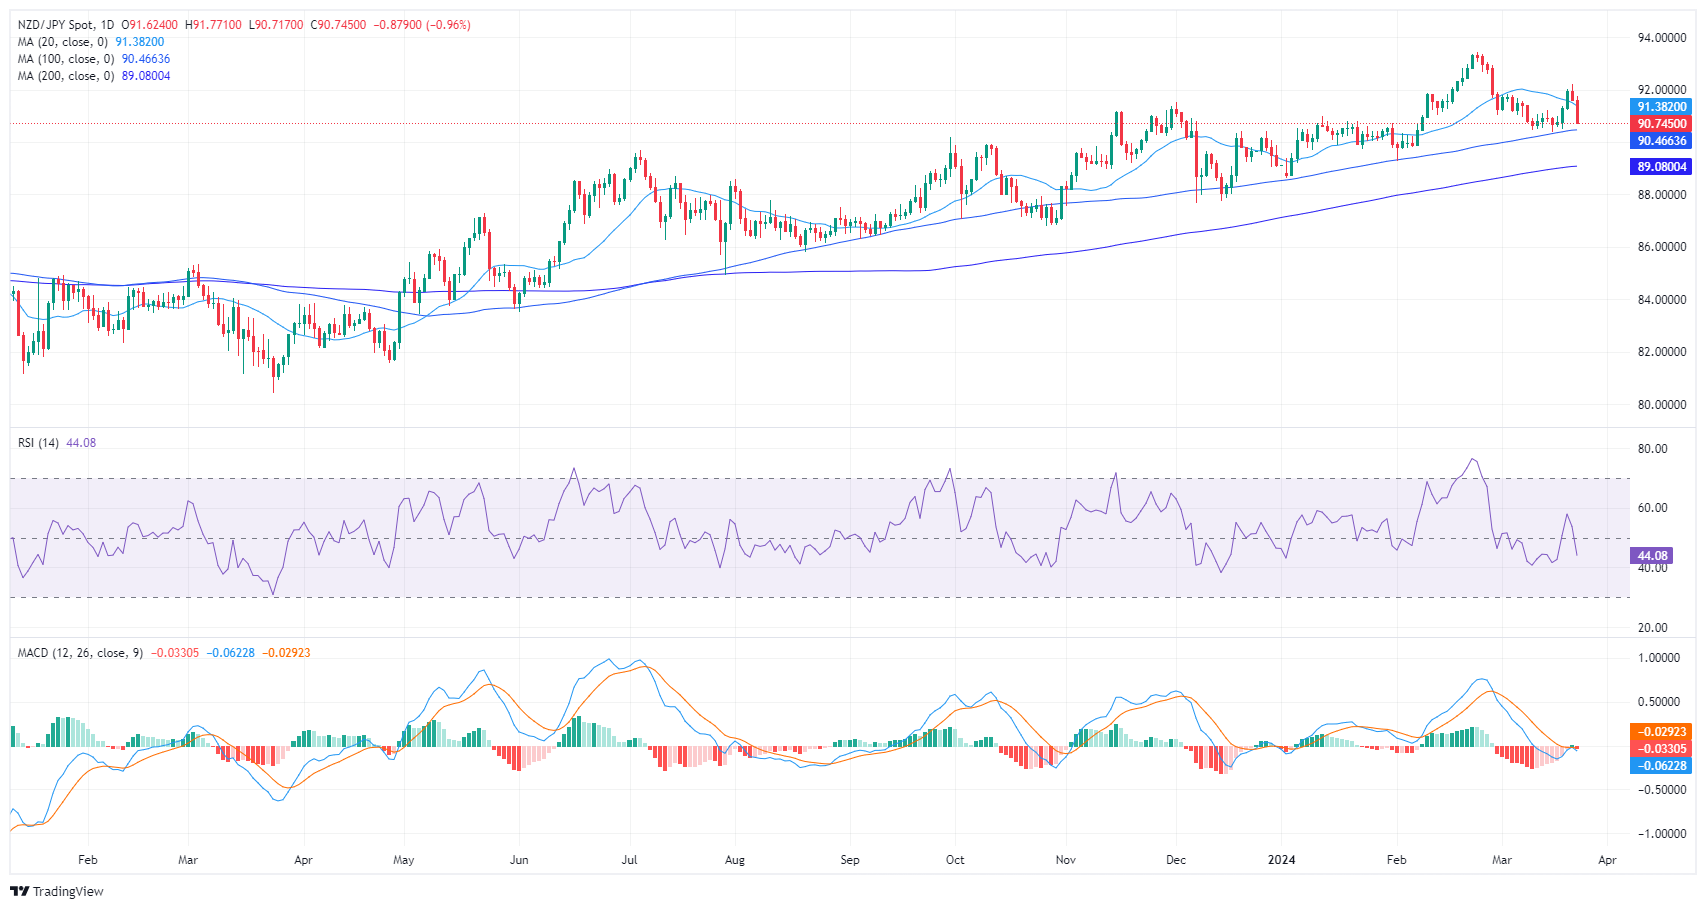
The NZD/JPY pair is trading at 90.748, marking a significant dip of 0.98%. Despite the presence of strong selling pressure, the pair persistently resides above its 100 and 200-day Simple Moving Averages (SMAs). This suggests a dominant bullish force in long-term time frames. But the fact the sellers conquered the 20-day average, paints the short-term outlook with a negative tone.
Based on the indicators of the daily chart, some important dynamics can be observed. The Relative Strength Index (RSI), currently at 43, resides in the negative territory. This position, coupled with its falling, suggests a dominance of sellers in the market for now. In addition, the Moving Average Convergence Divergence (MACD) histogram reveals rising red bars, further substantiating the negative momentum.
NZD/JPY daily chart
Shifting to the hourly chart, the RSI shows a value of 23, indicating that the pair is deeply oversold. Compared to the daily chart, an amplified negative trend is apparent. However, the MACD on this shorter time frame similarly showcases flat red bars, emphasizing the current bearish momentum but a less intense grip which might suggest that the pair might start consolidating.
NZD/JPY hourly chart
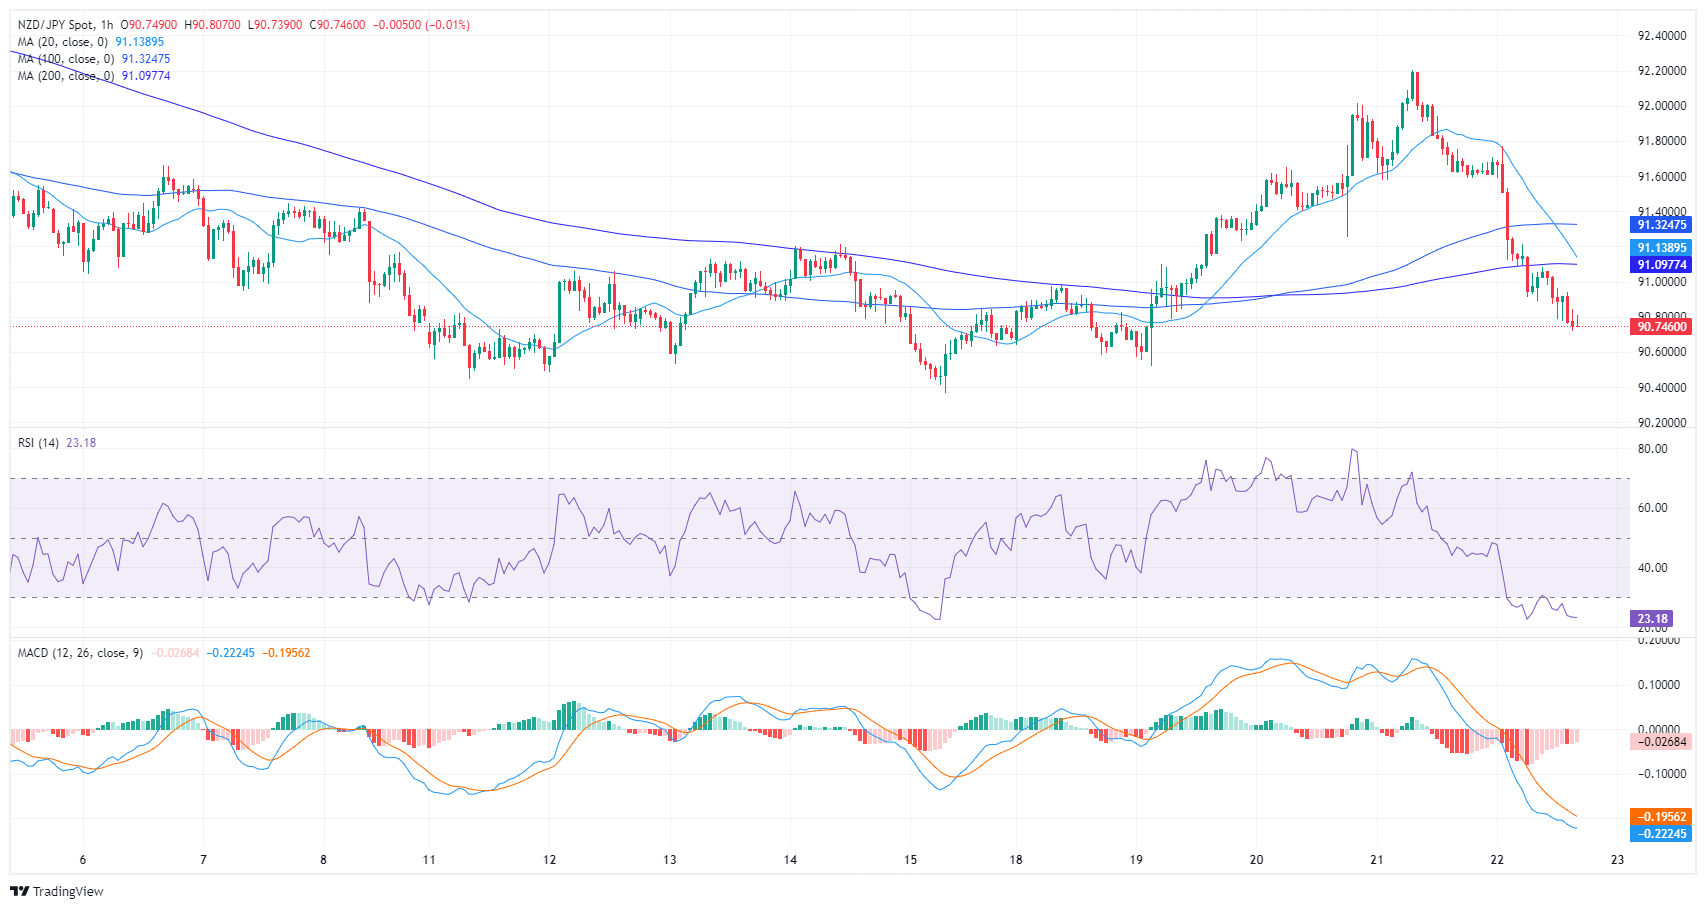
If the bulls want to maintain the overall bullish trend, they must defend the 100 and 200-day SMAs. In case lost, the bearish pressure might intensify further. In the meantime, they could act as a support for sellers to consolidate their downward movements.
The Dollar ended its second straight week of gains on the back of the broad-based knee-jerk in US yields across the curve, reclaiming the area beyond the 104.00 barrier and maintaining the risk complex under further pressure. The Fed and the BoE delivered dovish holds, while the BoJ came up with a dovish hike (after 17 years).
The USD Index (DXY) extended its constructive bias and surpassed the 104.00 hurdle, leaving behind at the same time the key 200-day SMA. In the upcoming week, the Chicago Fed National Activity Index and New Home Sales are due on March 25. Next on tap are Durable Goods Orders, the FHFA House Price Index, and the always relevant Consumer Confidence tracked by the Conference Board on March 26. On March 28, the final Q4 GDP Growth Rate is due, seconded by Pending Home Sales, Initial Jobless Claims and the final Michigan Consumer Sentiment print. On March 29, the PCE takes centre stage along with Personal Income, Personal Spending and Trade Balance results.
EUR/USD accelerated its decline and challenged the 1.0800 region towards the end of the week amidst the intense buying bias in the Dollar. On March 26, Germany’s GfK Consumer Confidence is due seconded by the final Consumer Confidence, Economic Sentiment, and Industrial Sentiment, all in the broader euro bloc. Germany’s Retail Sales and the labour market report are expected on March 28.
In line with the bearish tone in the broad risk complex, GBP/USD came under further downside pressure and put the 200-day SMA near 1.2590 to the test at the end of the week. In the UK, the final Q4 GDP Growth Rate is due on March 28.
USD/JPY extended its strong upside momentum and maintained the trade above the 151.00 mark on Friday, always amidst the persistent depreciation of the Japanese currency. The BoJ will release its Minutes on March 25 ahead of the Summary of Opinions and Foreign Bond Investment figures on March 28. Finally, Housing Starts, Retail Sales, Industrial Production and the Unemployment Rate are all due on March 29.
AUD/USD kept the pessimism well in place in the second half of the week, revisiting the vicinity of the 0.6500 neighbourhood. The RBA’s Consumer Inflation Expectations are due on March 25, ahead of Westpac’s Consumer Confidence Index on March 26. On March 27, Westpac’s Leading Index and the Monthly CPI Indicator will come ahead of Housing Credit and Retail Sales on March 28.
Anticipating Economic Perspectives: Voices on the Horizon
- Fed’s Cook and Bostic speak on March 25 along with BoE’s Mann.
- RBA’s Connolly is due to speak on March 26
- FOMC Waller and BoJ Tamura speak on March 27.
- Chief Powell speaks on March 29.
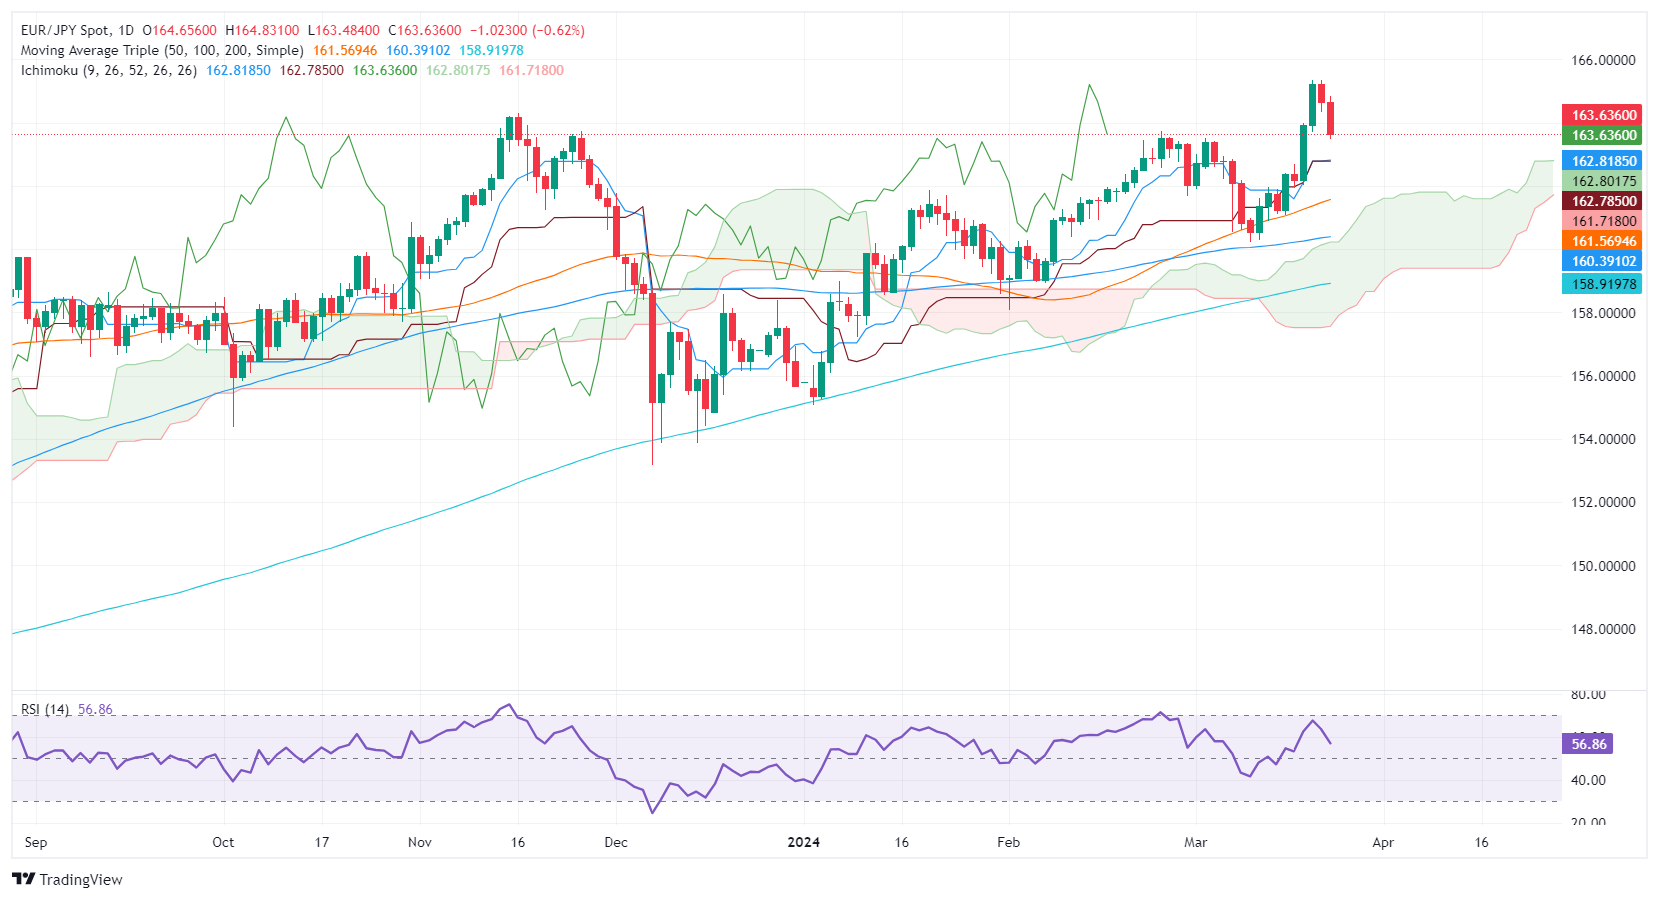
- EUR/JPY dips to 163.59, marking consecutive losses after reaching peak levels not seen in 16 years.
- Technical indicators suggest potential for further retreat, with immediate support eyed at the 163.00 mark.
- A rebound towards 164.00 could rekindle momentum towards the year's high, with traders monitoring critical technical thresholds.
The EUR/JPY registered back-to-back losing sessions after hitting 16-year highs of 165.35. It dropped 0.64% in the mid-North American session and trades at 163.59. The market mood remains upbeat as Wall Street posts solid gains, but in the FX space, the Japanese Yen and the US Dollar remained bid.
EUR/JPY Price Analysis: Technical outlook
From a technical standpoint, the cross-pair is subdued after trading volatile during the last four days. However, a daily close below the March 20 low of 163.78 can sponsor a test of the 163.00 mark. The further weakness lies below the latter, as the Tenkan-Sen emerges at 162.82, followed by the Senkou Span A at 162.79 and the Kijun Sen at 162.78.
On the other hand, if EUR/JPY buyers move in and push prices toward 164.00, that could sponsor a leg up to 165.00, ahead of re-testing the year-to-date (YTD) high of 165.35.
EUR/JPY Price Action – Daily Chart
- The Canadian Dollar gives up further ground to the Greenback.
- Canada Retail Sales ease from previous figures but less than expected.
- Next week: Canada & US GDP figures to drive USD/CAD.
The Canadian Dollar (CAD) shed further weight against the US Dollar (USD) on Friday as market participants readjust their Greenback exposure in quiet Friday trading. Investors have pared back nearly all of the gains made during the midweek splurge sparked by rate cut bet hopes after the Federal Reserve (Fed) nodded toward higher odds of rate cuts to come.
Canada revealed a slight slide in Retail Sales figures in January. Fed Chairman Jerome Powell made few waves during his first public appearance since Wednesday’s Federal Open Market Committee (FOMC) press conference. Next week, Gross Domestic Product (GDP) figures from Canada and the US are expected but not until Thursday.
Canadian economic calendar events remain thin on the data docket until then, and next week will close out with another print of the Fed’s preferred inflation gauge, the Personal Consumption Expenditure (PCE) Price Index on Friday.
Daily digest market movers: CAD slips further as Greenback extends
- The Canadian Dollar is down around half of a percent against the US Dollar on Friday.
- Canadian MoM Retail Sales in January declined, but less than expected, printing at -0.3% versus the forecast of -0.4%. Canadian Retail Sales in December grew 0.9%.
- MoM Core Retail Sales, or Retail Sales excluding Automobiles, grew 0.5%, keeping well above the forecast of -0.4% but cooling slightly from the previous month’s 0.6%.
- Fed Chair Powell spoke at a Fed Listens event in Washington, DC. Markets monitored the speech for any qualifications or adjustments to the Fed head’s stance compared to Wednesday’s rate call, but Powell avoided discussing monetary policy.
- Next week:
- Canadian GDP is expected to tick upwards to 0.4% from 0.0%.
- US GDP is expected to stand pat at 3.2% in Q4.
- US (PCE) Price Index is expected to tick down to 0.3% from 0.4% MoM.
US Dollar price today
The table below shows the percentage change of US Dollar (USD) against listed major currencies today. US Dollar was the weakest against the Japanese Yen.
| USD | EUR | GBP | CAD | AUD | JPY | NZD | CHF | |
| USD | 0.50% | 0.48% | 0.54% | 0.82% | -0.17% | 0.85% | 0.12% | |
| EUR | -0.50% | -0.02% | 0.06% | 0.32% | -0.67% | 0.35% | -0.37% | |
| GBP | -0.48% | 0.02% | 0.08% | 0.34% | -0.65% | 0.38% | -0.36% | |
| CAD | -0.56% | -0.06% | -0.07% | 0.28% | -0.73% | 0.29% | -0.43% | |
| AUD | -0.81% | -0.32% | -0.35% | -0.28% | -0.99% | 0.03% | -0.70% | |
| JPY | 0.17% | 0.66% | 0.65% | 0.72% | 0.98% | 1.03% | 0.29% | |
| NZD | -0.86% | -0.36% | -0.39% | -0.29% | -0.02% | -1.02% | -0.73% | |
| CHF | -0.10% | 0.39% | 0.38% | 0.45% | 0.71% | -0.27% | 0.74% |
The heat map shows percentage changes of major currencies against each other. The base currency is picked from the left column, while the quote currency is picked from the top row. For example, if you pick the Euro from the left column and move along the horizontal line to the Japanese Yen, the percentage change displayed in the box will represent EUR (base)/JPY (quote).
Technical analysis: Canadian Dollar gives up against Greenback, slumps back to familiar lows
The Canadian Dollar (CAD) fell into recent lows against the US Dollar on Friday, extending Thursday’s decline as the broader market scooped the safe-haven Greenback up once more after Wednesday’s overly enthusiastic plunge. The USD/CAD pair is back into the 1.3600 region and challenging the week’s technical highs.
USD/CAD is running up against a supply zone between 1.3600 and 1.3620, and the pair has completely pared away the Greenback’s midweek plunge, climbing nearly 1.2% bottom-to-top from Thursday’s early bottom bids of 1.3451. Despite consolidation, USD/CAD is on pace to set fresh highs for 2024 north of 1.3613, the fresh high set early this week.
USD/CAD continues to churn close to the 200-day Simple Moving Average (SMA) near 1.3488, and bidders will be looking to price in a technical floor from the 1.3500 handle. On the downside, the last swing low into 1.3450 will be the level to beat for short sellers looking to force the Greenback lower once more.
USD/CAD hourly chart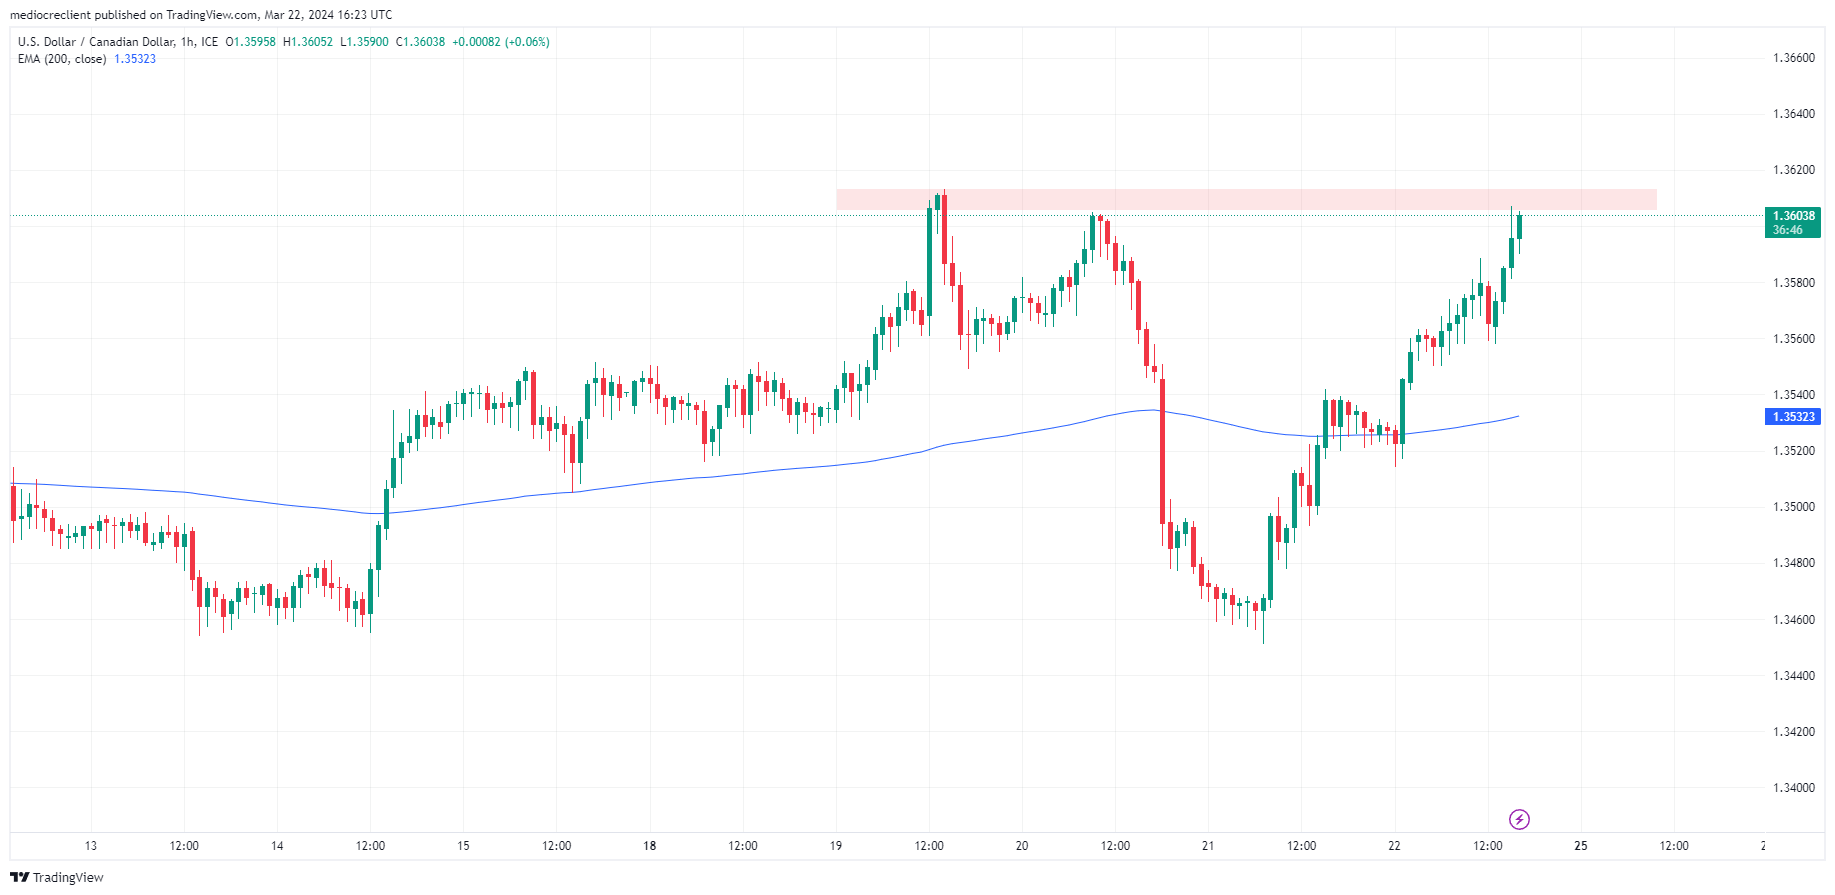
USD/CAD daily chart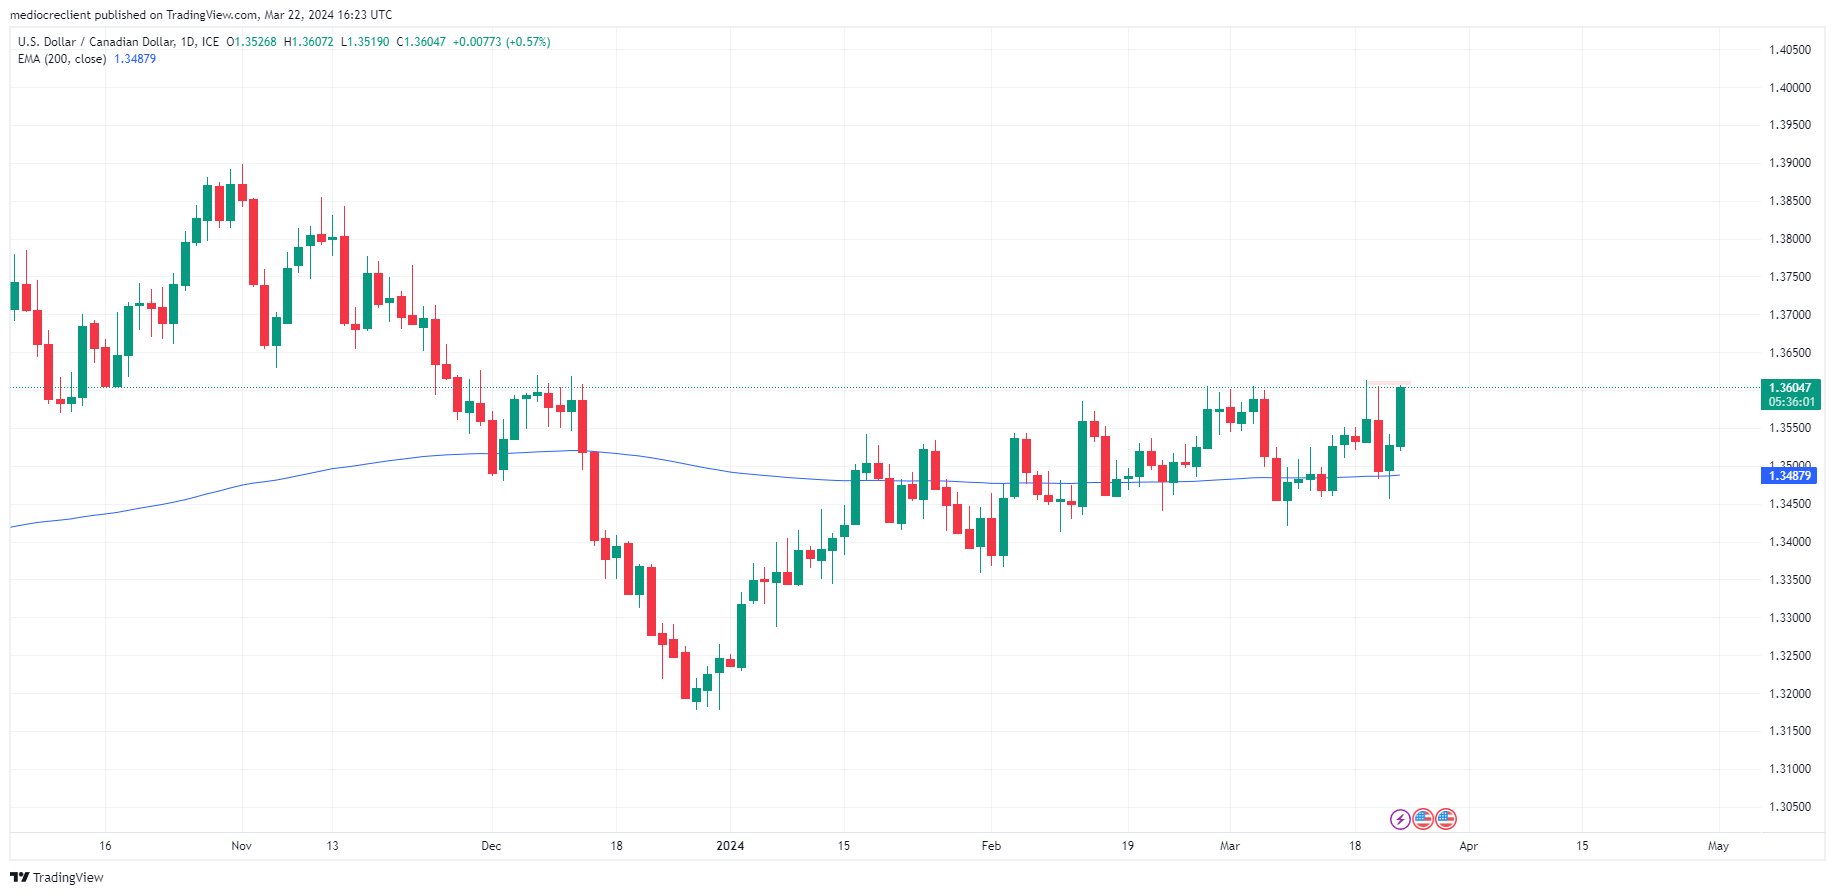
Canadian Dollar FAQs
The key factors driving the Canadian Dollar (CAD) are the level of interest rates set by the Bank of Canada (BoC), the price of Oil, Canada’s largest export, the health of its economy, inflation and the Trade Balance, which is the difference between the value of Canada’s exports versus its imports. Other factors include market sentiment – whether investors are taking on more risky assets (risk-on) or seeking safe-havens (risk-off) – with risk-on being CAD-positive. As its largest trading partner, the health of the US economy is also a key factor influencing the Canadian Dollar.
The Bank of Canada (BoC) has a significant influence on the Canadian Dollar by setting the level of interest rates that banks can lend to one another. This influences the level of interest rates for everyone. The main goal of the BoC is to maintain inflation at 1-3% by adjusting interest rates up or down. Relatively higher interest rates tend to be positive for the CAD. The Bank of Canada can also use quantitative easing and tightening to influence credit conditions, with the former CAD-negative and the latter CAD-positive.
The price of Oil is a key factor impacting the value of the Canadian Dollar. Petroleum is Canada’s biggest export, so Oil price tends to have an immediate impact on the CAD value. Generally, if Oil price rises CAD also goes up, as aggregate demand for the currency increases. The opposite is the case if the price of Oil falls. Higher Oil prices also tend to result in a greater likelihood of a positive Trade Balance, which is also supportive of the CAD.
While inflation had always traditionally been thought of as a negative factor for a currency since it lowers the value of money, the opposite has actually been the case in modern times with the relaxation of cross-border capital controls. Higher inflation tends to lead central banks to put up interest rates which attracts more capital inflows from global investors seeking a lucrative place to keep their money. This increases demand for the local currency, which in Canada’s case is the Canadian Dollar.
Macroeconomic data releases gauge the health of the economy and can have an impact on the Canadian Dollar. Indicators such as GDP, Manufacturing and Services PMIs, employment, and consumer sentiment surveys can all influence the direction of the CAD. A strong economy is good for the Canadian Dollar. Not only does it attract more foreign investment but it may encourage the Bank of Canada to put up interest rates, leading to a stronger currency. If economic data is weak, however, the CAD is likely to fall.
- Investors continue to bet on the easing cycle beginning by June, led by incoming data.
- The Greenback is holding resilient despite the Fed’s somewhat dovish guidance and falling US Treasury yields.
- Next week, the US will release PCE figures from February.
The US Dollar Index (DXY) is currently trading at a robust 104.428, marking the highest level since mid-February. Notably, the ongoing data continues to set expectations for the commencement of the Federal Reserve (Fed) easing cycle, which most agree will kick off in June. The Fed rejected higher inflation results, and Chairman Jerome Powell reassured markets that the bank won't react hastily to two consecutive months of increased inflation figures. In addition, the interest rate projections from 2024 didn’t change.
The US economy is holding resilient with a strong labor market and inflation remaining sticky. Next week, February’s Personal Consumption Expenditures (PCE) will provide additional guidance to markets.
Daily digest market movers: DXY continues rising on quiet Friday
- The resilience of the US Dollar is evident despite market expectations for dovish movements as continuous gains are noted.
- The Fed has reported generally stronger US data with Fed officials erring on the side of caution against easing too furiously or prematurely.
- Jerome Powell was on the wires earlier in the sessions but didn’t provide any highlights. Barr and Bostic will deliver speeches during the American session.
- US Treasury bond yields are declining with the 2-year trading at 4.60%, the 5-year at 4.19%, and the 10-year at 4.21% with all three seeing sharp declines.
DXY technical analysis: DXY stands robustly with consistent buying momentum
The indicators on the daily chart reflect a bullish momentum. The Relative Strength Index (RSI) is on a positive slope, residing in positive territory. This illustration signifies the ongoing strength of buyers, implying the potential for further appreciation in the near term.
Simultaneously, the Moving Average Convergence Divergence (MACD) is showcasing ascending green bars. This increasing bullish divergence advises that upward momentum is augmenting and that the probability of a bullish push is rising.
Examining the broader scale of technical elements, the DXY's positioning above the convergence of its 20, 100 and 200-day Simple Moving Averages (SMAs) near 103.50-103.70 reinforces a bullish bias on larger time frames.
US Dollar FAQs
The US Dollar (USD) is the official currency of the United States of America, and the ‘de facto’ currency of a significant number of other countries where it is found in circulation alongside local notes. It is the most heavily traded currency in the world, accounting for over 88% of all global foreign exchange turnover, or an average of $6.6 trillion in transactions per day, according to data from 2022. Following the second world war, the USD took over from the British Pound as the world’s reserve currency. For most of its history, the US Dollar was backed by Gold, until the Bretton Woods Agreement in 1971 when the Gold Standard went away.
The most important single factor impacting on the value of the US Dollar is monetary policy, which is shaped by the Federal Reserve (Fed). The Fed has two mandates: to achieve price stability (control inflation) and foster full employment. Its primary tool to achieve these two goals is by adjusting interest rates. When prices are rising too quickly and inflation is above the Fed’s 2% target, the Fed will raise rates, which helps the USD value. When inflation falls below 2% or the Unemployment Rate is too high, the Fed may lower interest rates, which weighs on the Greenback.
In extreme situations, the Federal Reserve can also print more Dollars and enact quantitative easing (QE). QE is the process by which the Fed substantially increases the flow of credit in a stuck financial system. It is a non-standard policy measure used when credit has dried up because banks will not lend to each other (out of the fear of counterparty default). It is a last resort when simply lowering interest rates is unlikely to achieve the necessary result. It was the Fed’s weapon of choice to combat the credit crunch that occurred during the Great Financial Crisis in 2008. It involves the Fed printing more Dollars and using them to buy US government bonds predominantly from financial institutions. QE usually leads to a weaker US Dollar.
Quantitative tightening (QT) is the reverse process whereby the Federal Reserve stops buying bonds from financial institutions and does not reinvest the principal from the bonds it holds maturing in new purchases. It is usually positive for the US Dollar.
- Mexican Peso strengthens as USD/MXN declines below key support level after recent central bank rate announcements.
- Banxico's split decision to cut rates to 11.00% provides a nuanced outlook, contributing to the Peso's resilience.
- Mexico's economic performance shows contraction in January and high inflation data.
- Banxico underscores a data-dependent approach, aiming for a 3% inflation target by the second quarter of 2025.
The Mexican Peso stages a comeback on Friday against the US Dollar (USD) after both central banks, the Federal Reserve (Fed) and the Bank of Mexico (Banxico), decided to respectively hold and cut interest rates amid their separate disinflation evolutions. Nevertheless, the emerging market currency stood afloat, perhaps on the Banxico vote split, providing a more balanced tone at the Governing Council. The USD/MXN trades at 16.70, sliding 0.18%.
Economic data from Mexico revealed on Friday that the economy shrunk in January from December, while the mid-month inflation report rose above estimates on a monthly basis and in the 12 months to March.
Elsewhere, Banxico’s decision to lower interest rates was not felt by the USD/MXN exchange rate, although the interest rate differential between the Mexican Central Bank and the Fed contracted. Banxico’s Governing Council reduced the main reference rate to 11.00%, though they emphasized that it would be data-dependent in future monetary policy meetings.
The Bank of Mexico expressed that policy remains restrictive, that the disinflation process would continue, and expects to reach its goal of 3% in the second quarter of 2025.
Daily digest market movers: Mexican Peso strengthens despite rate differential reduction
- Inflation in Mexico exceeded estimates of 4.45%, increased by 4.48%, while core figures jumped above the consensus of 4.62% YoY and rose by 4.69%, revealed the National Statistics Agency (INEGI) on Friday. Besides that, Economic Activity plunged -0.6% MoM, below estimates of a 0.3% expansion, and slowed compared to December, below estimates of 2.6%, down to 2%.
- The outlook in Mexico suggests the economy is stagnating. A weak retail sales report, private spending falling sharply, and a contraction in economic activity justified Banxico’s rate cut. Nevertheless, they face stubbornly stickier inflation, keeping policymakers on their toes.
- Mexico’s retail sales fell by 0.6% MoM in January, missing estimates of 0.4% expansion but better than December’s data. Yearly figures plummeted from -0.2% to -0.8 %, smashing projections for a 1.2% expansion.
- Aggregate Demand rose by 0.3% QoQ in Q4, up from 0%. On an annual basis, it decelerated from 2.7% to 2.6%.
- Private Spending on a quarterly basis slowed from 1.2% to 0.9%. On a yearly basis, it improved from 4.3% to 5.1%.
- Traders are digesting the latest monetary policy decision by the Federal Reserve, which held rates unchanged and maintained their projections for three 25 bps rate cuts toward year end. Despite revising the federal funds rate (FFR) level upward to 3.9%, the Fed’s decision was perceived as dovish.
- After the Fed’s decision, money market traders see a 73.2% chance of the Federal Reserve cutting rates by a quarter of a percentage point.
Technical analysis: Mexican Peso treads water as USD/MXN accelerates to 16.80
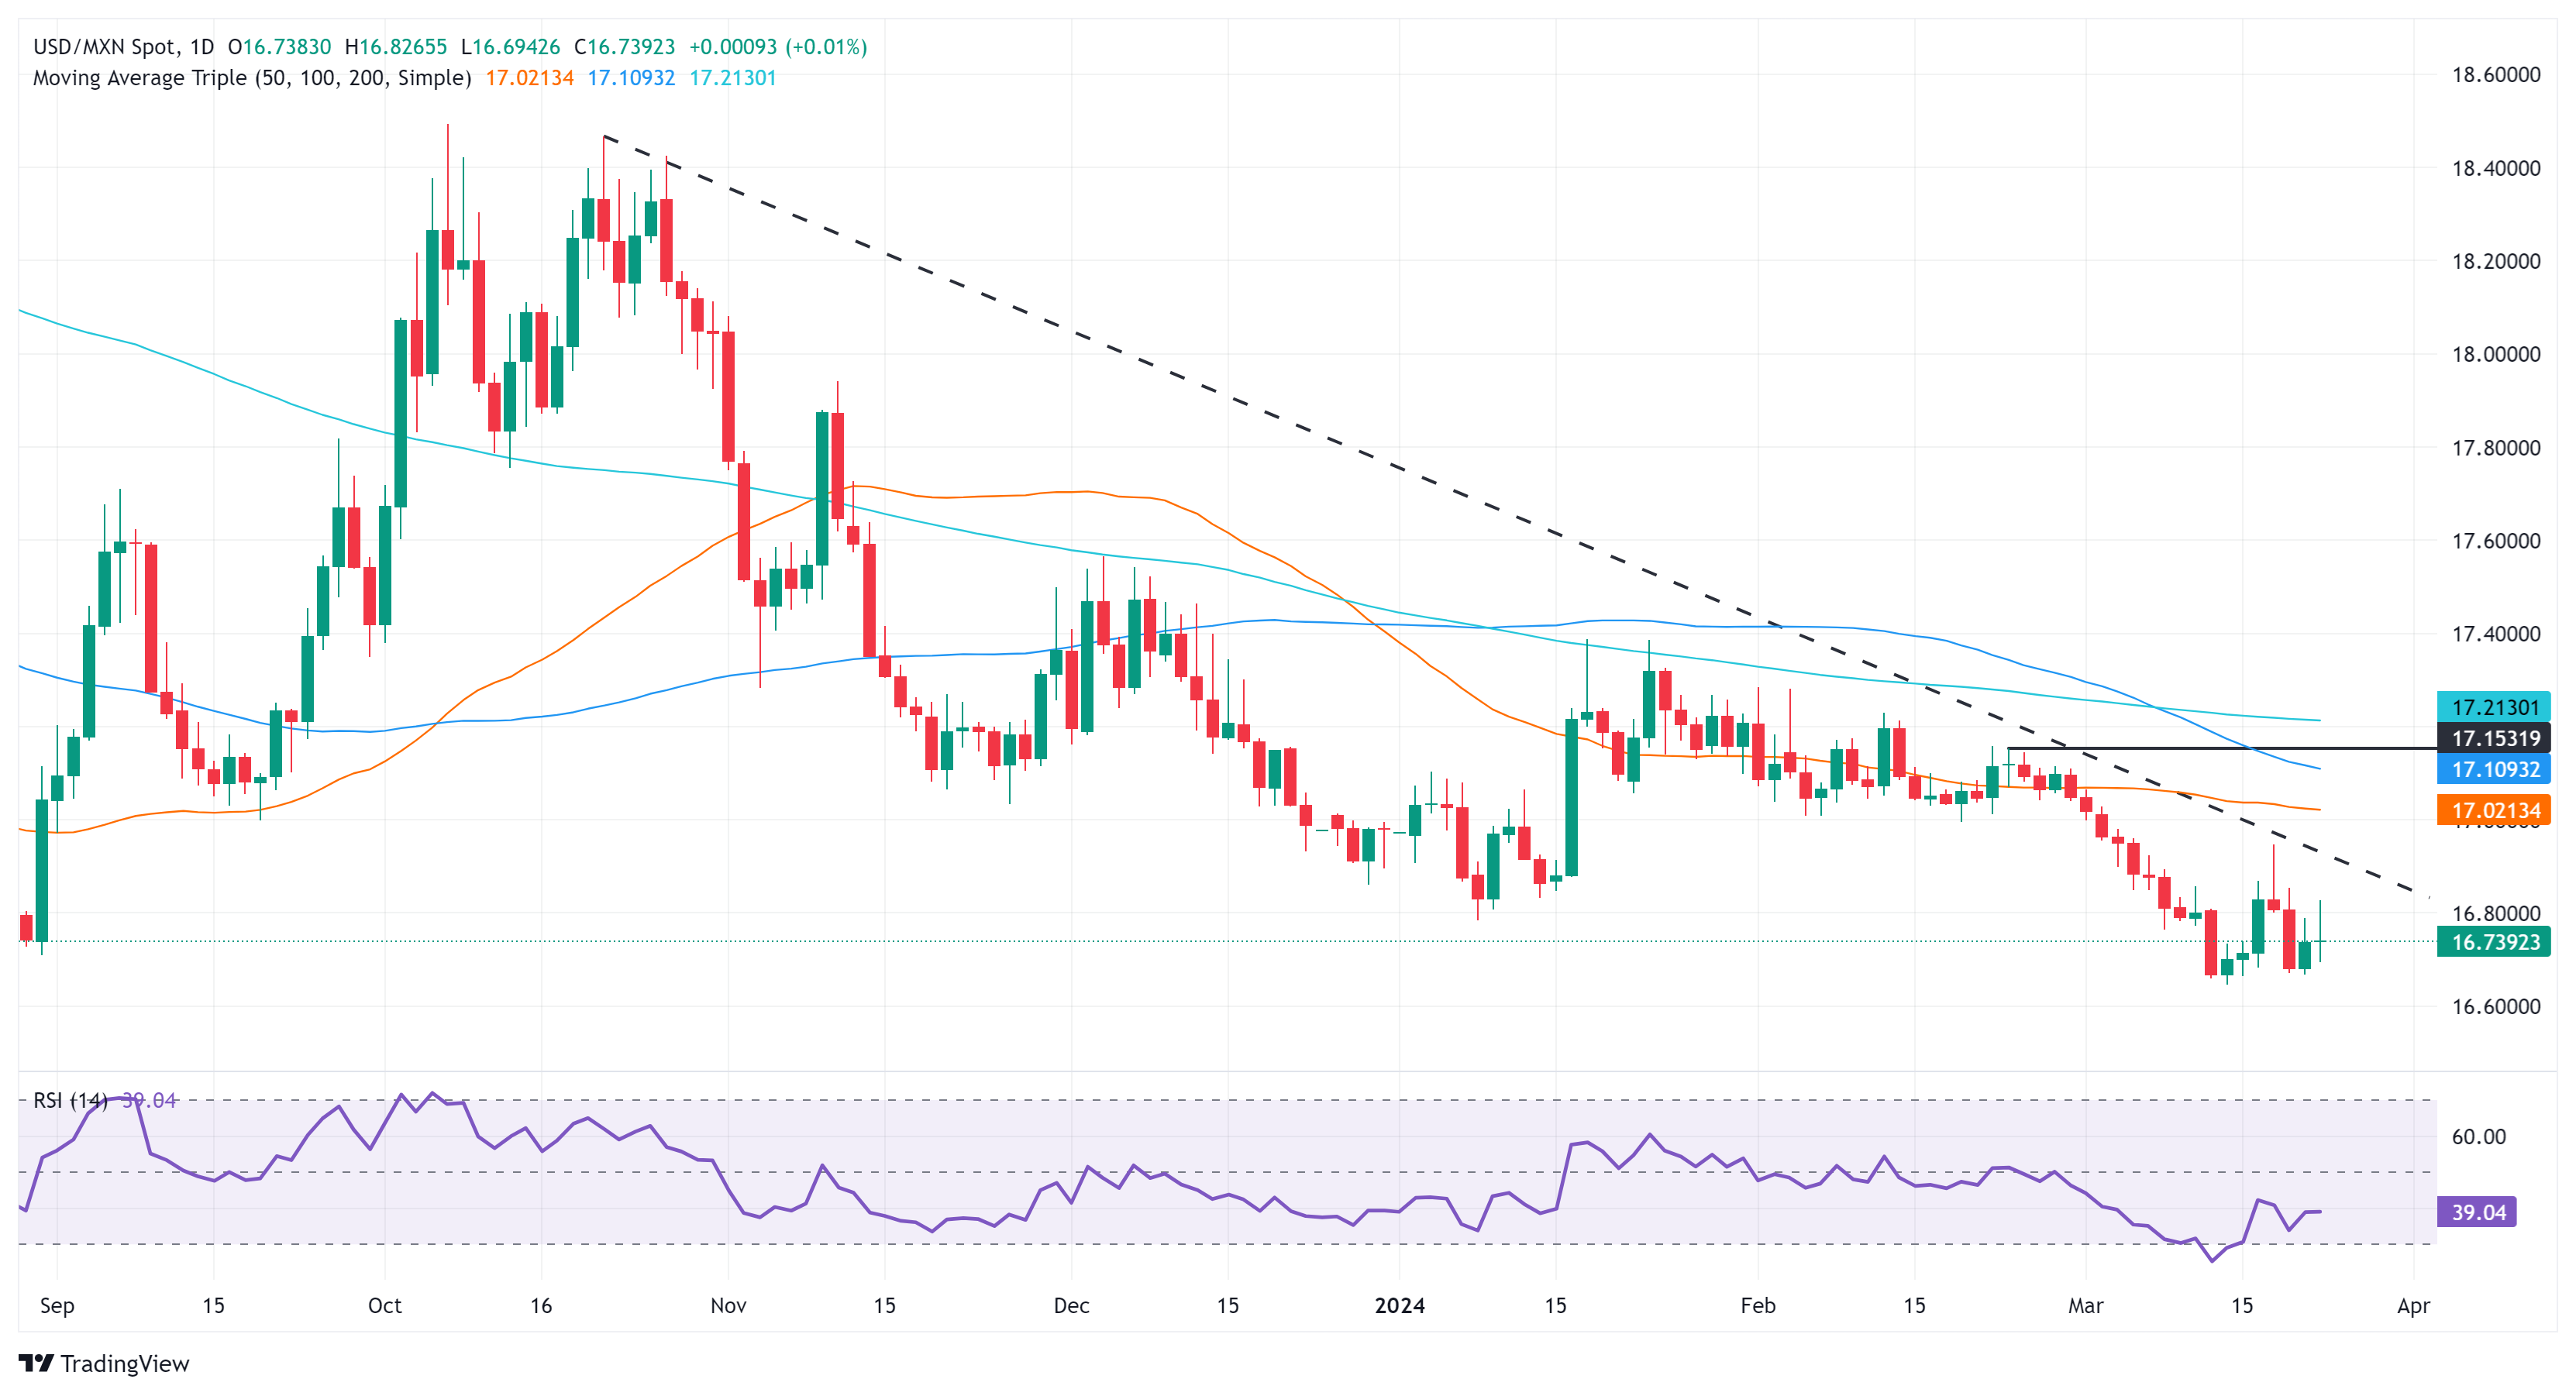
The USD/MXN daily chart suggests that buyers are losing momentum, with the pair posed to test lows last seen in 2015. Buyers' failure to conquer the 17.00 figure following Banxico’s rate cut suggests supply is higher than demand. In that scenario, the exotic pair's first support level would be the current year-to-date low of 16.64, followed by last year’s cycle low at 16.62 and October 2015’s of 16.32.
For a bullish scenario, traders must reclaim the current week’s high of 16.94, ahead of the 17.00 figure. Up next lie key dynamic resistance levels like the 50-day Simple Moving Average (SMA) at 17.01, the 100-day SMA at 17.11 and the 200-day SMA at 17.20.
USD/MXN Price Action – Daily Chart
Mexican Peso FAQs
The Mexican Peso (MXN) is the most traded currency among its Latin American peers. Its value is broadly determined by the performance of the Mexican economy, the country’s central bank’s policy, the amount of foreign investment in the country and even the levels of remittances sent by Mexicans who live abroad, particularly in the United States. Geopolitical trends can also move MXN: for example, the process of nearshoring – or the decision by some firms to relocate manufacturing capacity and supply chains closer to their home countries – is also seen as a catalyst for the Mexican currency as the country is considered a key manufacturing hub in the American continent. Another catalyst for MXN is Oil prices as Mexico is a key exporter of the commodity.
The main objective of Mexico’s central bank, also known as Banxico, is to maintain inflation at low and stable levels (at or close to its target of 3%, the midpoint in a tolerance band of between 2% and 4%). To this end, the bank sets an appropriate level of interest rates. When inflation is too high, Banxico will attempt to tame it by raising interest rates, making it more expensive for households and businesses to borrow money, thus cooling demand and the overall economy. Higher interest rates are generally positive for the Mexican Peso (MXN) as they lead to higher yields, making the country a more attractive place for investors. On the contrary, lower interest rates tend to weaken MXN.
Macroeconomic data releases are key to assess the state of the economy and can have an impact on the Mexican Peso (MXN) valuation. A strong Mexican economy, based on high economic growth, low unemployment and high confidence is good for MXN. Not only does it attract more foreign investment but it may encourage the Bank of Mexico (Banxico) to increase interest rates, particularly if this strength comes together with elevated inflation. However, if economic data is weak, MXN is likely to depreciate.
As an emerging-market currency, the Mexican Peso (MXN) tends to strive during risk-on periods, or when investors perceive that broader market risks are low and thus are eager to engage with investments that carry a higher risk. Conversely, MXN tends to weaken at times of market turbulence or economic uncertainty as investors tend to sell higher-risk assets and flee to the more-stable safe havens.
AUD/USD has traded in the 0.6500 range through March – with a short rise above 0.6600. Economists at the National Australia Bank analyze the pair’s outlook.
Aussie still expected to appreciate
Our expectation for an appreciation above 0.7000 in H2 2024 is contingent on the reversal of the broad strength shown by the USD over the past year or so. In part, this will be reflected by the Fed beginning to ease rates in June – well ahead of an easing by the RBA and a gradual pickup in global growth in 2025.
We see the Aussie ending the year around 0.7200 before driving higher over 2025 – reaching 0.7800 by Q4.
Norges Bank maintained the policy rate as expected but we got a slightly hawkish surprise. Economists at ING analyze Norwegian Krone’s (NOK) outlook after the central bank decision.
Norges Bank’s cautious tone on policy and focus on the domestic currency performance offer a good basis
Norges Bank remained generally hawkish as it kept rate projections unchanged and signalled rate cuts should only start in the autumn, and will be gradual.
We have continued to hear Governor Ida Wolder Bache sounding rather concerned about the weak NOK-higher inflation risks if rates are cut too soon. Indeed, the soft performance of Krone since the start of the year does not give her reasons to sound more relaxed on this topic.
We continue to see good upside potential for NOK once USD rates start moving lower, with Norges Bank’s cautious tone on policy and focus on the domestic currency performance offering a good basis.
The Fed is aiming for three rate cuts, in the view of economists at Rabobank.
The Fed will halt its cutting cycle during the course of 2025
March’s meeting strengthened our expectation that the FOMC will make three rate cuts this year. By stressing the other possible reason to cut, a weakening labor market, it is clear that the Fed is aiming for three rate cuts, either because of greater confidence that inflation is sustainably heading toward 2% or because unemployment rises.
Nevertheless, there remains a narrow path to the FOMC remaining on hold for longer. There is still a risk that the Committee starts its cutting cycle later than June. However, we continue to pencil in the first rate cut in June. Once started, we expect the Fed to continue with one cut of 25 bps per quarter until a rebound in inflation caused by a universal import tariff imposed by a new Trump administration will cause the Fed to halt its cutting cycle during the course of 2025.
- USD/JPY forms a bearish candlestick pattern at the multi-year highs.
- A bearish close on Friday would enhance the possibilities of a pullback.
- The BoJ has historically intervened to strengthen JPY in the 151.000s, indicating more downside pressure likely.
USD/JPY has formed a bearish Hanging Man Japanese candlestick pattern (circled) at key chart highs in the 151.000s on Friday, suggesting a heightened risk of a short-term reversal and pullback.
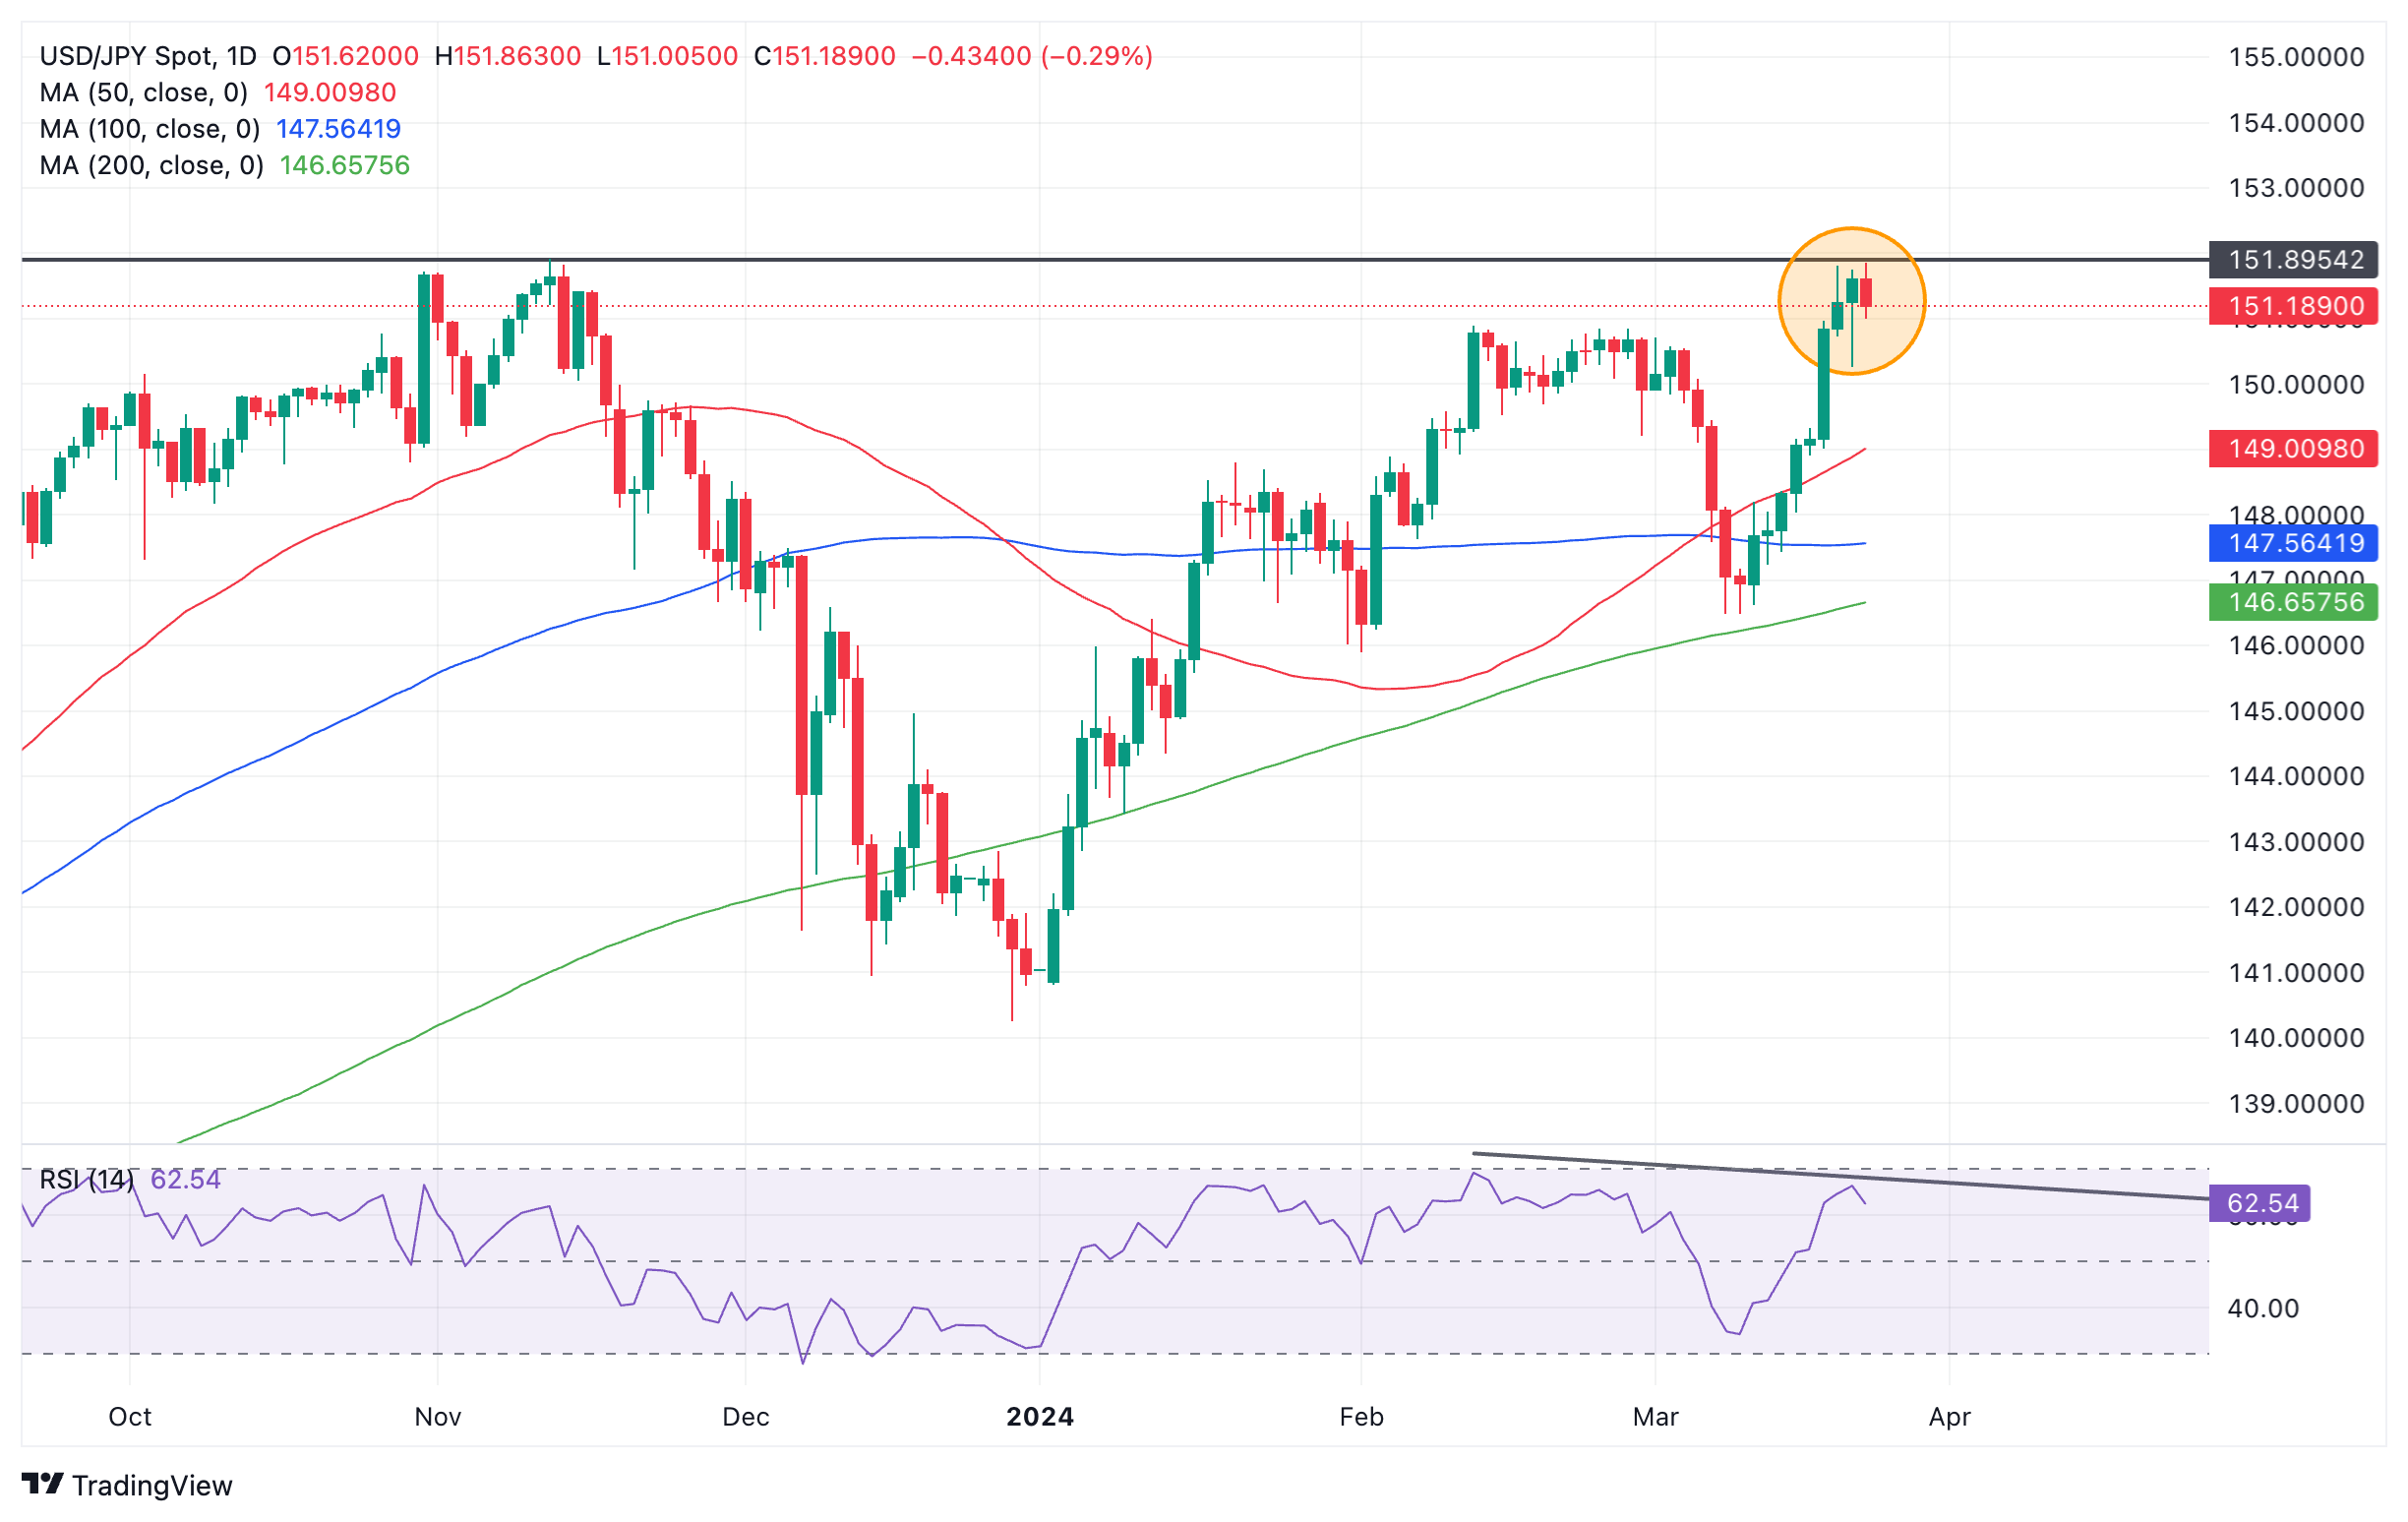
US Dollar versus Japanese Yen: Daily chart
The combination of the fact that the pair has tested the level of the 2023 high and formed the bearish pattern increases the possibility of a decline following on.
If Friday ends as a bearish red candlestick this will add confirmation to the Hanging Man formed on Thursday, and further increase the odds of more downside.
Japanese candlesticks are only short-term reversal patterns, however, so the move lower may be short-lived.
The fact that the 151.000s represents a zone in which the Bank of Japan (BoJ) has been known to intervene to strengthen the Yen in the past, further increases the chances of imminent weakness for the pair.
A pullback might be expected to go as low as support at the 50-day Simple Moving Average (SMA) situated at 149.009.
Alternatively, a recovery and clear break above 152.000 would suggest bulls continue to have the upper hand and the BoJ is reluctant or unable to intervene sufficiently to move the exchange rate.
Such a move, however, would be unlikely to rise much higher given the forces pitched against it, with a possible target at the next whole number of 153.000.
Banxico announced its latest rate decision on Thursday, March 21, when it decided to cut rates for the first time since 2021. USD/MXN barely moved on the decision. Economists at Rabobank analyze the pair’s outlook.
Support at 16.60 to hold
Banxico cut the overnight policy rate 25 bps to 11.00% on Thursday, March 21. The decision revealed a 4 to 1 split with Irene Espinosa dissenting in favor of a no-change decision. The accompanying inflation forecasts were largely unchanged except for a 0.1ppt upward revision to the 2024 headline CPI forecast which was raised from 3.5% to 3.6%. Inflation up, rates down.
Our forecast for the end of year policy rate is unchanged at 9.50% as we are now assuming 25 bps cuts at every meeting; previously, we had expected a pick up to 50 bps clips in Q4.
USD/MXN hardly moved in response to the decision given it was largely priced in. We continue to see 16.60 as key support on the downside, while marked MXN weakness is unlikely given the current carry environment.
- Silver price rises up and tips the top of a long-term range before reversing lower.
- It has formed a Bearish Japanese candlestick pattern, enhancing the reversal thesis.
- A move back down to a cluster of MAs in the 23.000s is foreseen subject to a continuation of the weakness.
Silver price (XAG/USD) is trading in the $24.750s on Friday, after touching the top of a multi-month range at roughly $25.700 and reversing lower.
Silver formed a Bearish Engulfing Japanese candlestick pattern on the daily chart on Thursday, which reinforces the reversal and suggests more downside in the short-term.
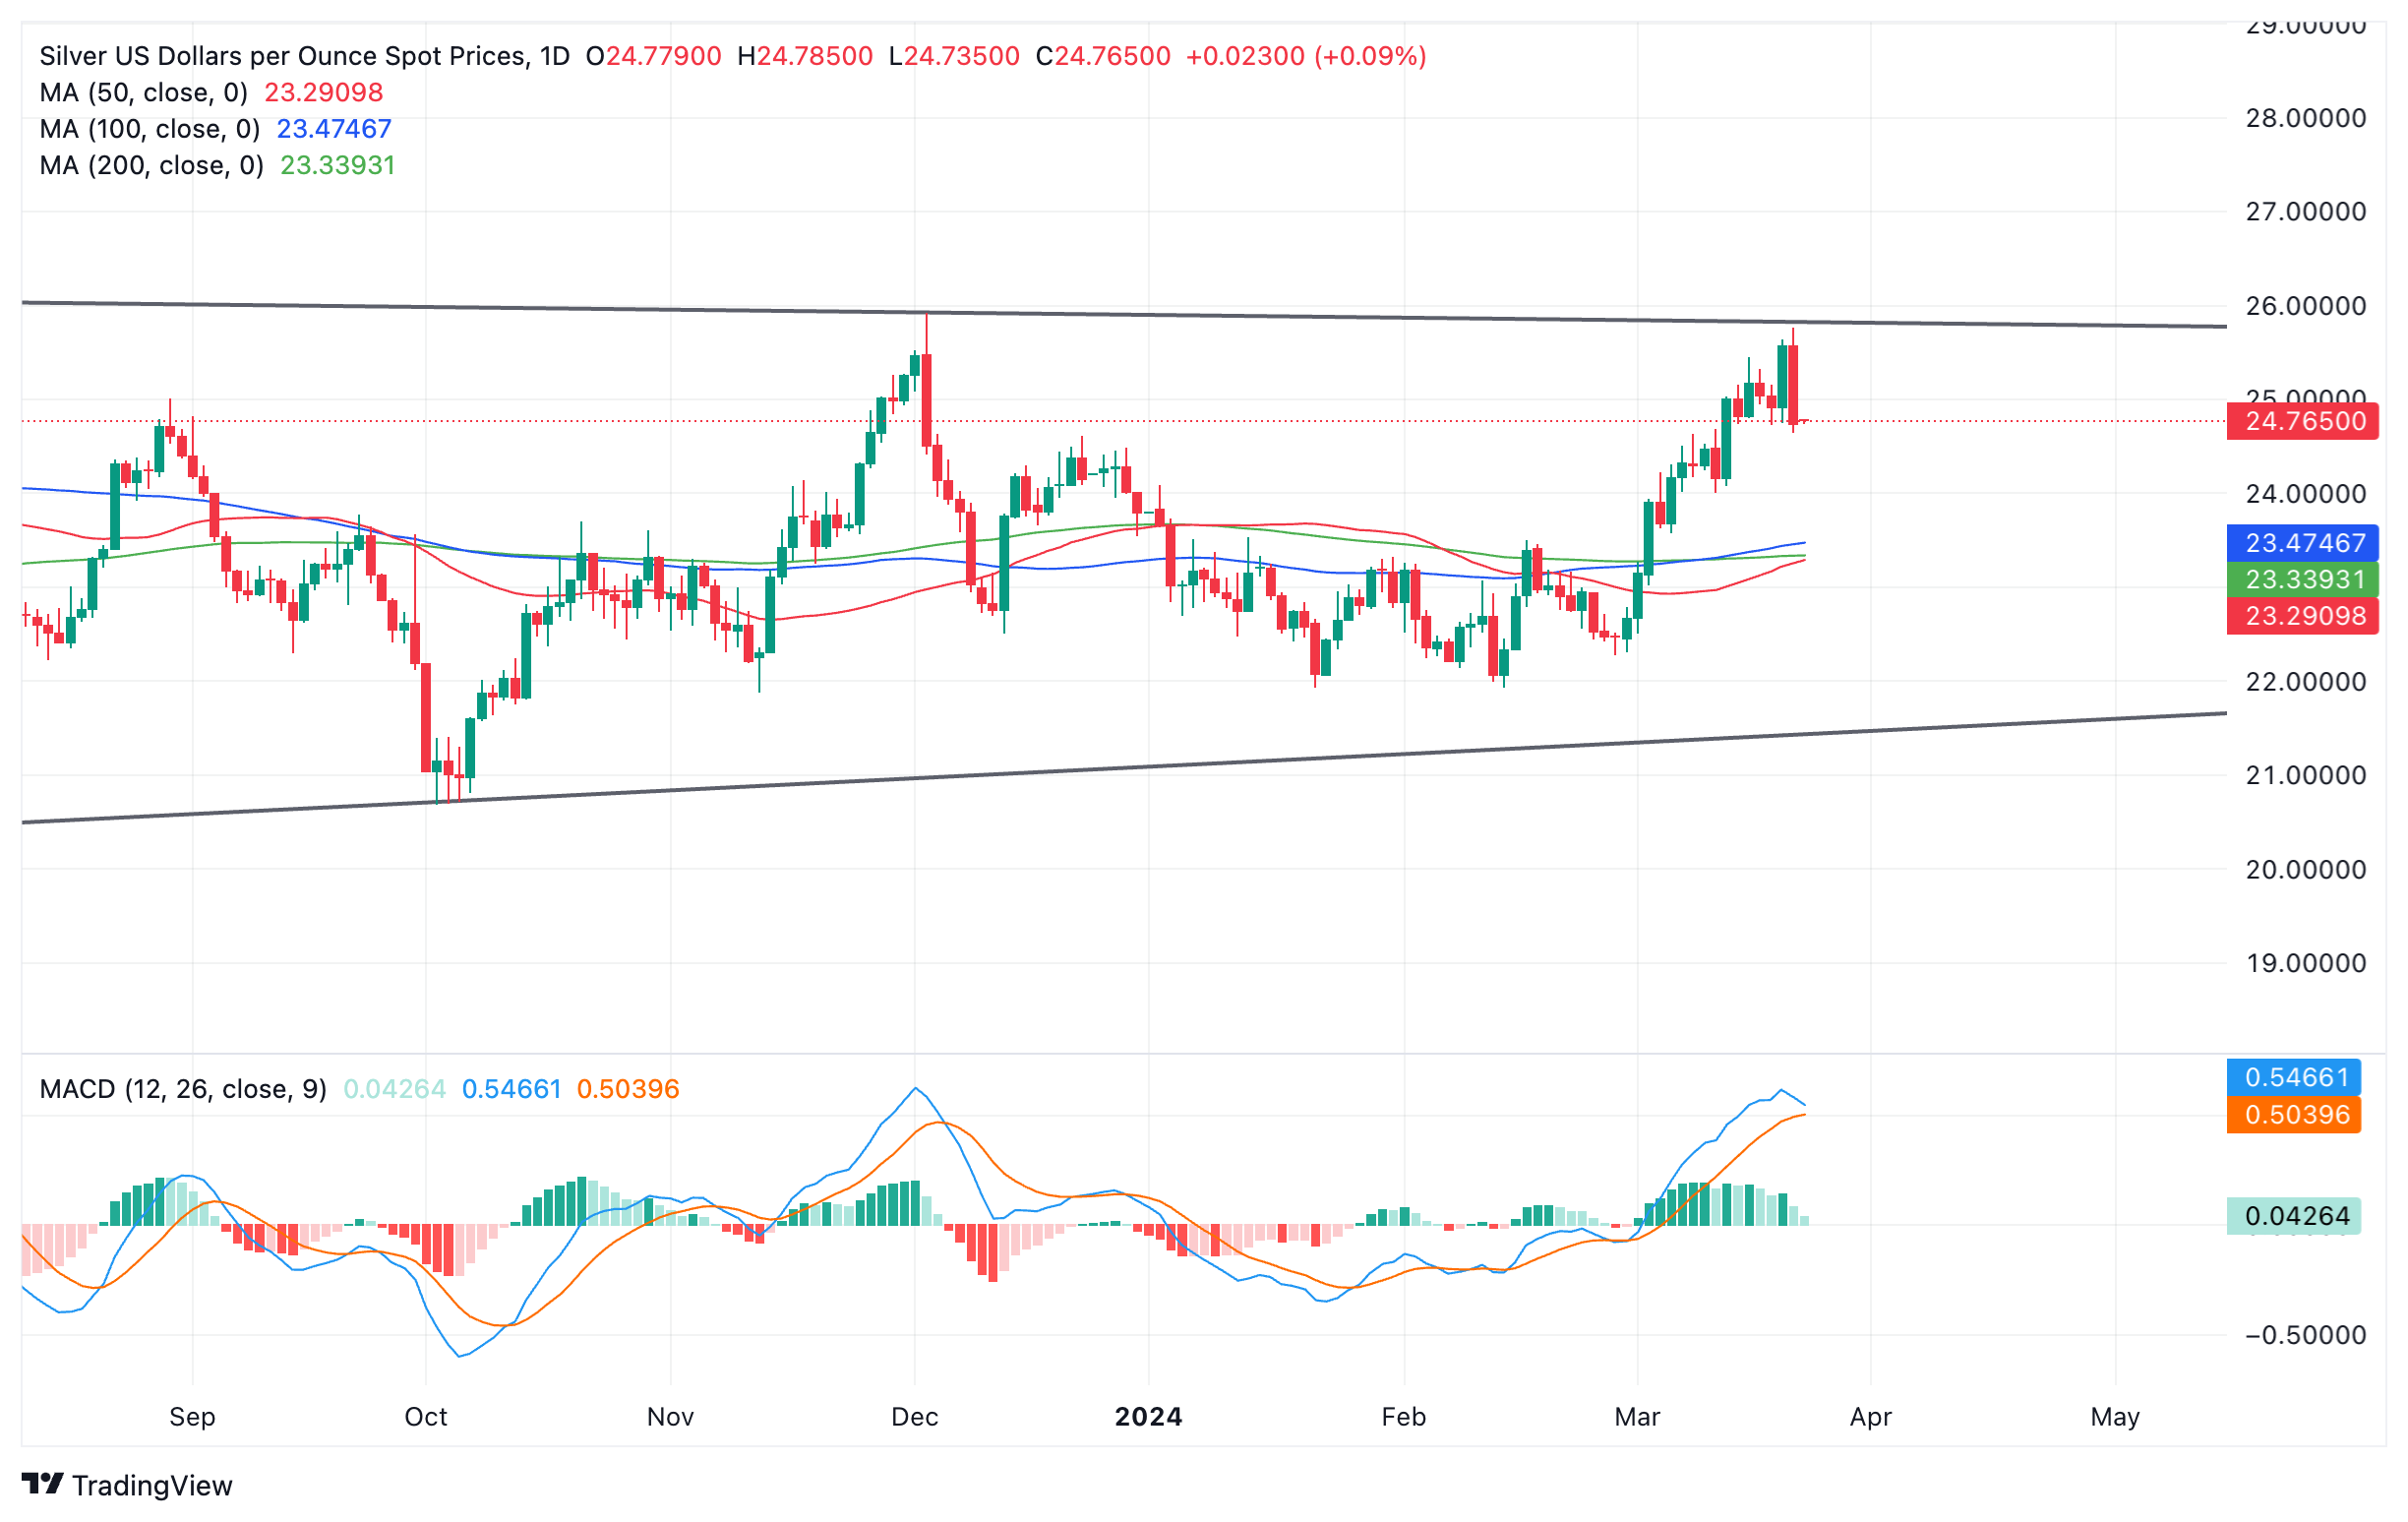
Silver versus US Dollar: Daily chart
The Moving Average Convergence/ Divergence (MACD) momentum indicator is threatening to cross below its signal line, adding credence to the bearish reversal. The MACD is a particularly reliable indicator within range-bound markets and a cross would provide a good sell signal.
If the pair breaks below 24.405 it will probably continue south to a potential target at the cluster of major moving averages, in the lower 23.000s, starting with the 100-day Simple Moving Average (SMA) at 23.475.
A break back above the 25.770 highs of Thursday, however, would indicate a probable extension of the uptrend.
A decisive break above the range highs would indicate even more bullish momentum higher. Such a move would be expected to then reach a conservative target at the 0.618 extrapolation of the height of the range from the breakout point higher, and a target at 28.524.
The US Dollar (USD) lost ground after the Fed decision. Economists at Commerzbank analyze Greenback’s outlook.
A rate cut for 2024 could still fall by the wayside, which would be Dollar-positive
I don't think that much has changed in the end: June is moving back into focus as the first rate cut date instead of July, and will probably stick there, although the Fed will still remain data-dependent. And in the longer term, the interest rate level will probably be even higher than previously assumed. That speaks more in favor of the Dollar. The market now seems to see it that way also after the economic data surprised on the positive side this week.
Moreover, the Fed can hardly surprise on the dovish side now, the market now is focused on June again, unless the data virtually collapses in the coming weeks and argues for even earlier rate cuts, which in my opinion is an unrealistic scenario. However, if inflation remains stubbornly high beyond the first two months of the year, i.e. if the ‘bumps’ turn into plateaus, a rate cut for 2024 could still fall by the wayside, which would be Dollar-positive.
Unfortunately, however, like the Fed, we will only be smarter in the further course of time. So let's wait for the data and comments from FOMC members in the coming weeks. However, we may also have to prepare ourselves for a ‘bumpy road’ in the Dollar.
- USD/CAD climbs to 1.3570 amid firm US Dollar.
- The appeal for the US Dollar strengthens on upbeat US economic outlook.
- The Canadian Dollar weakens as BoC rate cut bets escalate.
The USD/CAD pair jumps to 1.3570 in the early New York session on Friday. The Loonie asset advances as appeal for the US Dollar strengthens on expectations that the Federal Reserve (Fed) needs not to rush for rate cuts.
The consumer price inflation in the United States economy is sticky and the US economic outlook is upbeat due to robust consumer spending and steady labor market conditions. This allows the Fed to observe more data for months before shifting to rate cuts.
This has dampened market sentiment. S&P 500 opens on a slightly bearish note amid caution that the Fed will not start reducing interest rates until it gains greater confidence that inflation will decline to the desired rate of 2%. The US Dollar Index (DXY), which tracks the value of the US Dollar against six major currencies, refreshes monthly high at 104.44.
Meanwhile, the Canadian Dollar weakens on expectations that the Bank of Canada (BoC) will start reducing interest rates. The speculation over BoC rate cuts deepen as the consumer price inflation for February remains softer than expectations.
In February, the annual headline Consumer Price Index (CPI) grew at a slower pace of 2.8% than expectations of 3.1% and the former reading of 2.9%. On a monthly basis, the headline CPI rose by 0.3% against the expectation of 0.6%. The Bank of Canada’s (BoC) preferred inflation measure, which strips of eight volatile items grew at a steady pace of 0.1% on a month-on-month basis. The underlying inflation decelerated to 2.1% from 2.4% in January.
- USD/CHF rises up and achieves the first price target for range breakout.
- The pair is now pulling back and RSI is threatening to exit overbought increasing bearish pressure.
- USD/CHF is in a solid uptrend so should continue higher to next target after the correction.
The USD/CHF is trading in the upper 0.8900s after breaking out of the top of a range it had been yo-yoing in since Valentine’s Day, and rallying higher.
The pair has now risen up and met the conservative target for the breakout at 0.8984 and is pulling back.
The technical method for establishing targets from range breakouts is by taking the 0.618 Fibonacci of the height of the range and extending it from the breakout point higher.

US Dollar versus Swiss Franc: 4-hour chart
The next target is at 0.9052, the full height (1.000 ratio) of the range extrapolated higher.
There is likely to be a correction before the next target is achieved, however, given the Relative Strength Index (RSI) is threatening to exit overbought territory on the current bar. Such an exit would provide a sell signal and reinforce the view that a correction is evolving.
If the current 4-hour period ends bearishly the exit from overbought will be confirmed. This would increase the chances of a continuation of the pullback, potentially to a target at the midpoint of the breakout rally, situated at 0.8930.
Beyond that, the pair is overall seen continuing the short-term uptrend that formed prior to the range.
It would take a break back below 0.8729 to suggest a short-term trend reversal and the start of a deeper slide.
The first target for such a move would be the 0.618 Fib. extrapolation of the height of the range at 0.8632, followed by the full extrapolation at 0.8577, which is also close to the 0.8551 January 31 lows, another key support level to the downside.
The BoE vote that revealed the two voters for a hike previously abandoning that stance has fuelled renewed GBP selling. Economists at MUFG Bank analyze Pound’s outlook.
BoE shifts a little more toward a first rate cut
BoE left policy rate on hold for fifth consecutive meeting at 5.25%.
The overall message from the statement suggests as before – that returning inflation to target is proceeding but the point of being in a position to ease the monetary stance has not arrived.
The vote did highlight progress with an 8-1 vote as both Jonathan Haskel and Catherine Mann dropped their votes to hike. That alone justifies some increased probability of an earlier than we expect rate cut in June although whether the BoE ultimately moves in June or August remains a close call. We maintain our view of 100 bps of cuts this year.
The Pound could suffer further over the short term if the market's conviction on a June rate cut grows further and with that the potential extent of rate cuts in total delivered this year.
The Federal Reserve (Fed) left policy rates unchanged, as expected. Economists at Wells Fargo analyze the Fed’s outlook.
An announcement to slow the pace of quantitative tightening is coming at the May 1 meeting
As was widely expected, the FOMC left the fed funds target range unchanged at 5.25%-5.50% after its March meeting.
The Summary of Economic Projections showed that the vast majority of the Committee continues to believe some easing of policy will be appropriate this year. The median projection for the federal funds rate at year-end was unchanged from December's projection at 4.625%. However, the distribution of expectations shifted higher for 2024 and the median dot for 2025 and 2026 moved up 25 bps, implying an incrementally more hawkish outlook. Notably, the median ’longer-run’ dot also moved higher.
We continue to look for the FOMC to start reducing the fed funds rate at its June 12 meeting. However, the risks to our outlook are skewed toward the FOMC beginning to ease a little later in the summer or potentially proceeding at a slower pace that leads to less than the 100 bps of easing we project through the end of this year.
While risks to the FOMC beginning to cut the fed funds rate skew toward later in the year, balance sheet normalization looks likely to occur somewhat earlier. We think an announcement to slow the pace of quantitative tightening is coming at the May 1 meeting, although we would not be surprised if it slipped to the following meeting on June 12.
Gold rose to a new record high of $2,200 after the Fed meeting. Strategists at Commerzbank analyze the yellow metal’s outlook.
The rally on the Gold market is likely to be over for the time being
Unless US economic and inflation data disappoint across the board in the coming weeks and continue to push down US interest rate expectations, the rally should now begin to run out of steam.
ETF investors also appear to be starting to rethink their position: For the past few days, significant inflows have been recorded again for the first time since last autumn. On the other hand, short-term oriented financial investors were already very optimistic in the previous week. If they have increased their long positions even further in the course of the recent rise, there is a risk of a setback.
China's presumably lower Gold imports from Hong Kong meanwhile should not be taken too seriously, nor should the recently disappointing Swiss gold exports in February. After all, they follow high imports in January and are presumably distorted by the New Year celebrations.
- AUD/USD pitches back down to the base of its range after US data eclipses Aussie employment figures.
- The rapid reversal is surprising since the Australian data was stellar whilst the US data was unremarkable.
- A deeper analysis of the Australian jobs data might reveal why its upside influence was so ephemeral.
AUD/USD is trading back down at the bottom or its multi-week range in the lower 0.6500s on Friday, after positive US data led to a reversal in the pair from its 0.6634 Thursday highs.
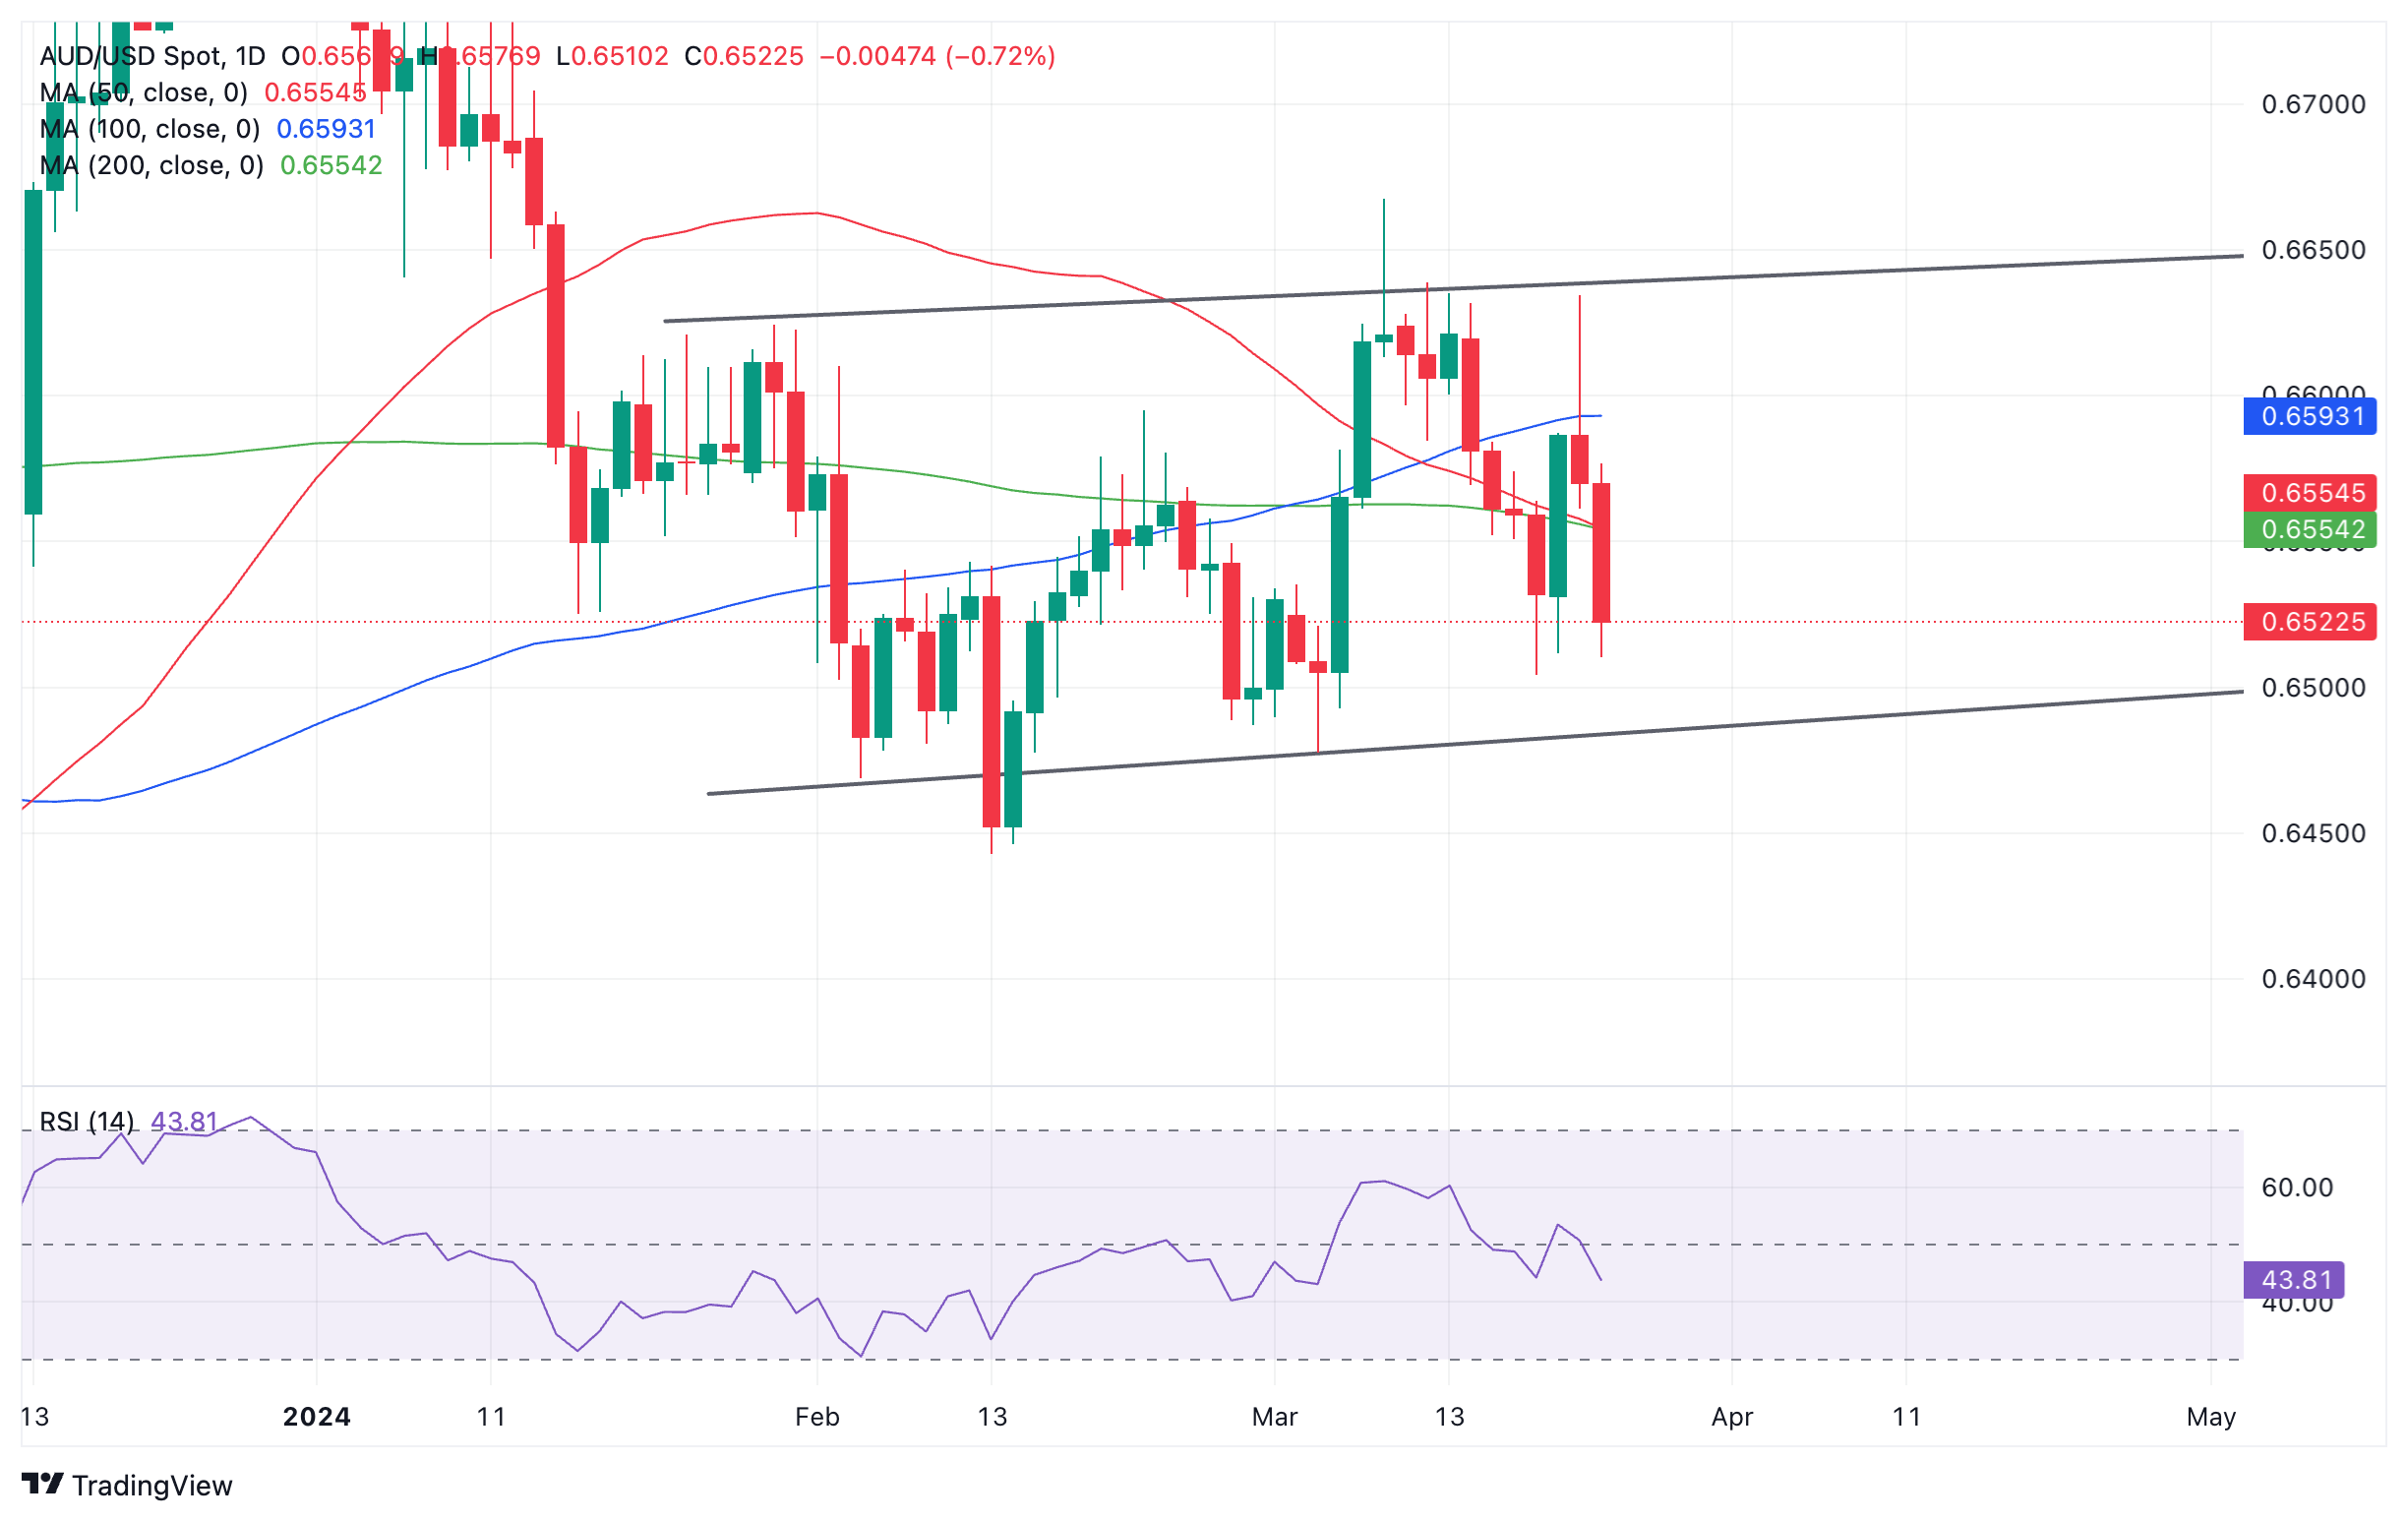
Australian Dollar versus US Dollar: Daily chart
Although the US data was positive it was not remarkable. When compared to the Australian employment data that preceded it and led to such a strong surge higher in the AUD/USD on Thursday morning, it could be said to be at best mediocre.
How is it, then, that in the case of the AUD/USD pair, the US data led to such a sharp reversal lower?
US data downs the Aussie
A look at the US data in detail only intensifies the mystery further. The S&P Global US Composite PMI actually came out lower in March than the previous month, and Services PMI undershot expectations.
Whilst Manufacturing PMI beat expectations at 52.7 – making the US one of the few developed countries with an expansionary Manufacturing sector – the data hardly warranted the strong move up in the US Dollar (USD).
Granted, the other releases at the time – Initial Jobless Claims and the Philadelphia Fed Manufacturing Index – also painted a positive picture of the state of the US economy, these are still considered only at best rather minor data points.
Australian employment – a true renaissance?
Australian employment data, on the other hand, released a few hours before the US data came out, appeared at least on the surface stellar by comparison.
The Unemployment Rate fell to 3.7% from 4.1% in February, and the number of new employees hit 116,500, a number well above the average. Both data points beat expectations of 4.0% and 40,000 respectively.
A deeper dig into Australia’s labor market statistics and seasonal effects, however, suggests the incredible data in February obscured a much more modest underlying trend.
The Unemployment Rate, for example, may have fallen sharply in february but it was “around where it had been six months earlier,” according to Bjorn Davis, head of Statistics at ABS.
In terms of the unusually high Employment Change figure of 116.5K, Davis says this smooths out to a much more modest level when taken alongside the 62,000 fall in employed people in December and weaker-than-usual 15,000 rise in January. Taking the three months losses and gains together smooths the overall three-month change to a more modest 70,000 more people employed overall in February, compared to November 2023.
The data shows a lag effect because a larger-than-average number of people were waiting to start a job in December and January, that they subsequently went on to begin in February, boosting that month’s statistics.
That said, that data was still better than usual. The increase in people working from January to February was still above average, according to Davis.
“In 2022 and 2023, around 4.3 percent of employed people in February had not been employed in January. In 2024, this was higher, at 4.7 percent, and well above the pre-pandemic average for 2015 to 2020 of around 3.9 percent."
Nevertheless, a deeper understanding of the underlying statistics of February’s Australian employment release goes some way to explaining why the reaction in the Australian Dollar was a) not stronger, and b) so easily toppled by subsequent mediocre US data.
The depreciation of the US Dollar (USD) in response to the FOMC press conference by Fed Chair Powell has not lasted long. Economists at MUFG Bank analyze Greenback’s outlook.
DXY to remain in a 102-00-105.00 trading range
The price action for the Dollar continues to point to the prospect of the Dollar remaining in a relatively tight trading range.
There is a strong expectation implied in forward market pricing of a synchronised easing of monetary policy this year, at least amongst the key central banks. The Fed, ECB, BoE, BoC, and SNB are all priced at about 20 bps of easing by June and have similar cumulative amounts of easing priced for 2024 as a whole (75-95 bps). It points to DXY for now remaining in a 102-00-105.00 trading range that has prevailed so far this year.
- USD/JPY falls to 151.00 even though the appeal for the US Dollar is upbeat.
- The USD Index refreshes monthly high on upbeat US economic outlook.
- Japan’s hot inflation for February has improved the credibility of BoJ’s shift to policy normalization.
The USD/JPY pair slips to 151.00 in Friday’s late European session. The Japanese Yen has been underpinned against the US Dollar as Japan’s hot February inflation data improved investors' confidence in the Bank of Japan’s (BoJ) decision to pivot to policy normalization. The asset faces pressure despite the buoyant US Dollar amid a significant improvement in the United States economic outlook.
The Statistics Bureau of Japan reported that Japan’s annual National headline Consumer Price Index (CPI) grew at a stronger pace of 2.8% compared to the prior release of 2.2%. BoJ’s preferred inflation measure that excludes fresh food rose by 2.8%, as expected, compared to the former reading of 2.2%. Price pressures remaining consistently above the 2% target will allow the BoJ to maintain interest rates positive despite maintaining an accommodative stance.
Also, increasing speculation about Japan’s government intervening in the FX domain provides support to the Japanese Yen. Japan's Finance Minister Shunichi Suzuki said that currencies must move in a stable manner and that he is closely watching foreign exchange moves with a high sense of urgency.
Meanwhile, the US Dollar Index (DXY) refreshes its monthly high at 104.44 as investors hope that rate cuts by the Federal Reserve (Fed) won’t be so aggressive due to the upbeat US economic outlook. The outlook for the US economy improved after the Federal Reserve (Fed) upwardly revised growth forecasts for 2024. The Fed sees the US Gross Domestic Product (GDP) growing by 2.1%, up from the 1.4% it projected in December.
USD/CAD’s solid rebound from the mid-1.3400 area is extending. Economists at Scotiabank analyze the pair’s outlook.
There is little reason to expect gains to stop here
There is little reason to expect gains to stop here.
Trend momentum readings are edging bullish on the intraday and daily DMI oscillators and there is no obvious resistance above the market until the low 1.3600 area.
Support is at 1.3550 and 1.3515.
See: USD/CAD could head higher towards 1.3730 once a break above 1.3620 materializes – SocGen
- The US Dollar jumps higher for the second day in a row.
- Traders are challenging the Fed's dovish stance, casting doubts over its forecasts of three rate cuts for this year.
- The US Dollar Index snaps firmly above 104.00 and breaks substantial support levels.
The US Dollar (USD) is basking in the glory of re-founded belief from traders. Whereas last year markets were challenging the US Federal Reserve (Fed) by pricing in more rate cuts than what the dot plot suggested, investors are now defying the US central bank in the other direction. Markets are expanding their positions in the Greenback with the idea that the Fed will not cut interest rates three times as it projected on Wednesday, but at most two, as economic data signals the US economy is still growing at a healthy pace.
On the economic data front, there is no top data expected to be released this Friday. However, markets will head into the weekend with three US Federal Reserve speakers lined up. First and foremost will be the Fed Chairman Jerome Powell, who will deliver a speech at around 13:00 GMT.
Daily digest market movers: Fed should stop pleasing the markets
- US sanctions risk trickling down into China’s tech market, with a substantial sell-off in the sector and triggering a weaker Yuan against most G7 peers. Views that China is losing grip on its economic recovery is starting to spread among investors and hedge funds.
- Three Fed speakers are lined up for this Friday to close off the week:
- Fed Chairman Jerome Powell is expected to make remarks at 13:00 GMT.
- Fed’s Vice Chair for Supervision Michael Barr will speak around 16:00 GMT.
- Atlanta Fed President Raphael Bostic closes off the US calendar officially at 20:00 GMT with remarks.
- Equities are very mixed, with Chinese indexes falling more than 1% in the Shenzhen index while the Hang Seng is down over 2%. European equities have taken over the negative tone, though down by half of a percent. US equities have not decided yet what to do and are flat.
- According to the CME Group’s FedWatch Tool, expectations for the Fed’s May 1 meeting are at 91.0% for keeping the rate unchanged, while chances of a rate cut are at 9%.
- The benchmark 10-year US Treasury Note trades around 4.24%, the lower end of this week.
US Dollar Index Technical Analysis: pendulum swinging the other way
The US Dollar Index (DXY) must be thinking markets have gone crazy with their 180 degree shift after the Fed meeting. Markets were positioned for several and early interest-rate cuts back in December, but these aspirations have been tuned down quite a lot. The stand-off with the Fed could not be bigger: while Wednesday’s dot plots showed Fed officials are still expecting three rate cuts for this year, markets are pricing in only two cuts and very late in the year.
The DXY is heading for those highs of February, after a fresh high for March was posted this Friday morning. On the upside, 104.96 remains the first level in sight. Once above there, the peak at 104.97 from February comes into play ahead of the 105.00 region with 105.12 as the first resistance.
Support from the 200-day Simple Moving Average (SMA) at 103.71, the 100-day SMA at 103.52, and the 55-day SMA at 103.58 are getting a fresh chance to show their importance. The 103.00 big figure looks to remain unchallenged for now after the decline from the Fed meeting got turned around way before reaching it.
US Dollar FAQs
The US Dollar (USD) is the official currency of the United States of America, and the ‘de facto’ currency of a significant number of other countries where it is found in circulation alongside local notes. It is the most heavily traded currency in the world, accounting for over 88% of all global foreign exchange turnover, or an average of $6.6 trillion in transactions per day, according to data from 2022. Following the second world war, the USD took over from the British Pound as the world’s reserve currency. For most of its history, the US Dollar was backed by Gold, until the Bretton Woods Agreement in 1971 when the Gold Standard went away.
The most important single factor impacting on the value of the US Dollar is monetary policy, which is shaped by the Federal Reserve (Fed). The Fed has two mandates: to achieve price stability (control inflation) and foster full employment. Its primary tool to achieve these two goals is by adjusting interest rates. When prices are rising too quickly and inflation is above the Fed’s 2% target, the Fed will raise rates, which helps the USD value. When inflation falls below 2% or the Unemployment Rate is too high, the Fed may lower interest rates, which weighs on the Greenback.
In extreme situations, the Federal Reserve can also print more Dollars and enact quantitative easing (QE). QE is the process by which the Fed substantially increases the flow of credit in a stuck financial system. It is a non-standard policy measure used when credit has dried up because banks will not lend to each other (out of the fear of counterparty default). It is a last resort when simply lowering interest rates is unlikely to achieve the necessary result. It was the Fed’s weapon of choice to combat the credit crunch that occurred during the Great Financial Crisis in 2008. It involves the Fed printing more Dollars and using them to buy US government bonds predominantly from financial institutions. QE usually leads to a weaker US Dollar.
Quantitative tightening (QT) is the reverse process whereby the Federal Reserve stops buying bonds from financial institutions and does not reinvest the principal from the bonds it holds maturing in new purchases. It is usually positive for the US Dollar.
GBP/USD remains weak. Economists at Scotiabank analyze the pair’s outlook.
Price action retains a soft look
Sterling remains soft, with market sentiment still quite sour after Thursday’s BoE policy decision. Rates were left on hold, as expected, but the voting split (showing the MPC’s two more hawkish members recalibrating their vote to hold, from hike) has lifted speculation that lower rates may come sooner rather than later. Market betting on a June hike has perked up but a full cut is still not priced into OIS until August.
Daily trend support has broken (now resistance near 1.2690) and spot is testing its 200-DMA (1.2593). A retest of the low/mid-1.2500 zone looks likely.
- The New Zealand Dollar is trading lower in most pairs as the country’s economic growth stutters.
- Bearish technicals, showing a breakout from a price pattern, add fuel to the fire.
- The US Dollar strengthens on strong data, pushing NZD/USD down a step lower.
The New Zealand Dollar (NZD) is trading lower in most pairs, and is down by over half a percent against the US Dollar (USD) at just above 0.6000 on Friday, as a sluggish economic outlook weighs on the NZD.
New Zealand Dollar hit by negative GDP
The New Zealand Dollar is undermined by negative growth in New Zealand.
Recent data showed the New Zealand economy pitched into a technical recession in the fourth quarter of 2024. New Zealand Gross Domestic Product (GDP) shrank by 0.1% in Q4 when economists had expected a 0.1% rise, according to Statistics New Zealand. This followed a 0.3% contraction in Q3 – two quarters of negative growth mark a recession.
Despite the dismal growth data, the Reserve Bank of New Zealand (RBNZ) has not said it is ready to cut interest rates to try to stimulate growth. Inflation still remains relatively elevated at 4.7% in Q4, even though it fell from 5.6% previously and is slowly trending lower.
In an interview with Reuters this month, Reserve Bank of New Zealand Deputy Governor Christian Hawkesby said that interest rates, at a 15-year high of 5.5%, need to stay restrictive for some time.
Reuters places the consensus estimate for the RBNZ making an initial interest-rate cut in August.
Recent comments from The New Zealand finance minister, Nicola Willis, however, suggest the government may wish for interest rates to come down to help stimulate growth. Growth would be “significantly slower” than previously expected, said the minister, as higher interest rates had already dampened economic activity.
Part of the reason for the slowdown is China, which has experienced its own economic slowdown after years of stellar growth. China is New Zealand’s largest trading partner and a key market for New Zealand dairy goods, the country’s main export.
USD claws back losses on robust data
NZD/USD – the number of US Dollars one New Zealand Dollar can buy – has been especially hit after US PMI data on Thursday showed both the US services and manufacturing sectors remain in expansion territory in March – a comparatively robust result compared to most other developed nations.
The US S&P Global Composite PMI came out at 52.2, holding above the 50 level that distinguishes expansion from contraction.
US Manufacturing PMI came out at 52.5, beating estimates and previous figures, and Services PMI came out at 51.7 in March, still in growth territory, despite falling below estimates.
Other US data on Thursday showed the Philadelphia Fed Manufacturing Survey came out higher than estimated at 3.2, and Initial Jobless Claims at 210K were lower than the 215K forecast.
Overall, the data supported the US Dollar and helped it claw back losses after the Fed’s dovish meeting on Wednesday, where it continued to stubbornly hold onto the view that it expects to cut interest rates by three times in 2024.
Technical Analysis: New Zealand Dollar continues breakout from wedge pattern
NZD/USD continues its sharp decline after breaking out of the bottom of a long-term range.
The pair is in an established short-term downtrend and likely to form progressively lower peaks and troughs. Given the old adage that “the trend being your friend,” this suggests more downside as probable.
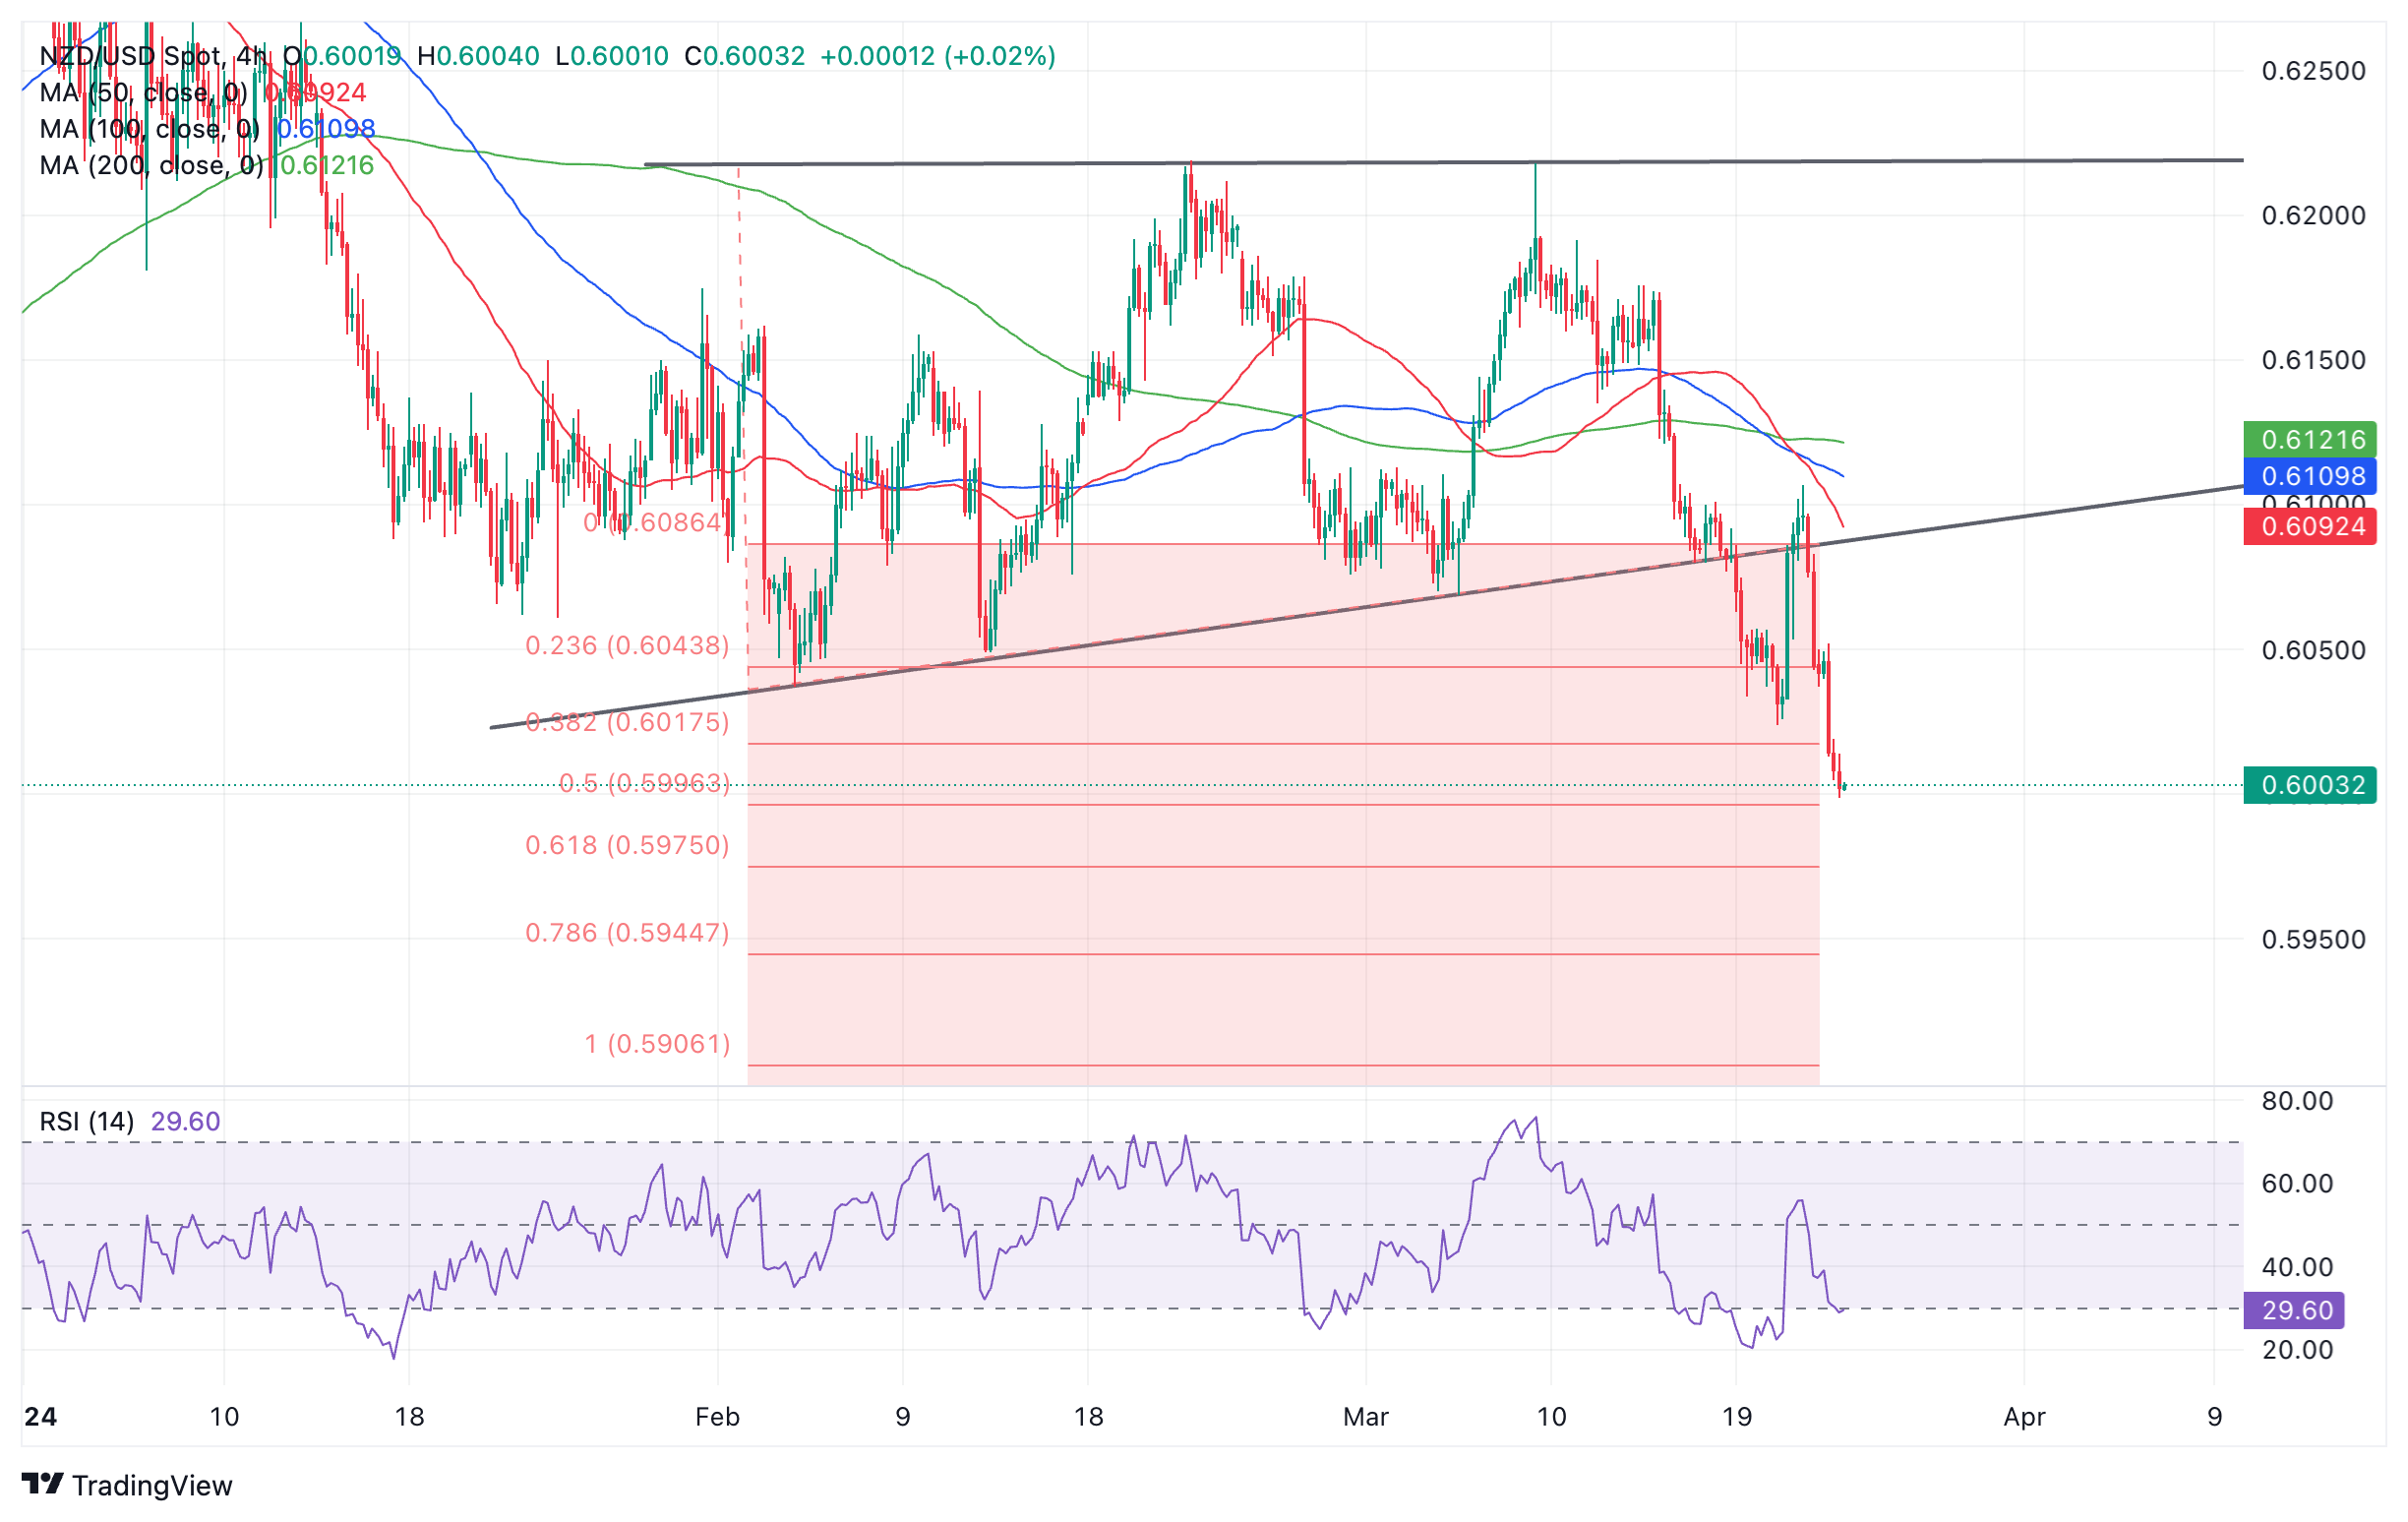
New Zealand Dollar versus US Dollar: 4-hour chart
NZD/USD is showing bullish convergence with the Relative Strength Index (RSI) momentum indicator, however. Convergence occurs when price makes a lower low but the RSI fails to. It indicates a possibility the pair could pull back, although the entrenched downtrend is likely to resume eventually.
The breakout from the long-term range is likely to extend further. According to technical analysis theory, the height of the range provides a guide as to how much lower the pair could go. In the case of NZD/USD it suggests more downside is on the horizon.
The 0.618 Fibonacci ratio of the height of the range extrapolated from the breakout point lower provides an initial target at 0.5975. The full ratio provides a further target at around 0.5906.
Only a break above the 0.6107 highs would bring into doubt the bearish bias.
European Central Bank (ECB) President Christine Lagarde told European Union leaders on Friday that they expect the decline in the Euro area's inflation to continue, per Reuters.
Lagarde added that the growth is projected to pick up in the course of 2024, mainly driven by increasing purchasing power. She further noted that the economic resilience requires higher productivity, which needs higher capital investment.
Market reaction
These comments failed to trigger a noticeable reaction and EUR/USD was last seen losing 0.4% on the day at 1.0815.
The powerful USD rally that drove markets on Thursday has extended further. Economists at Scotiabank analyze Dollar’s outlook.
There appears to be very little in the way of some additional USD progress
Despite the focus on central bank prospects, broader Dollar gains are moving a little ahead of shifts in interest rates. US 2Y yields are around 3 bps lower on the session today which is bit more than other markets (ex UK). Still, investors have warmed to the goldilocks economic picture the Fed outlined earlier this week and there appears to be very little in the way of some additional USD progress at least at this point.
Rather than heading towards a 102.00 handle, the DXY now looks poised to retest its February high around 105.00. Rates or spreads may need to shift more significantly in the USD’s favour for gains to extend much beyond there, however.
- EUR/JPY is showing acute bearish divergence on the weekly chart compared to 2023.
- This indicates the potential for a pullback on the horizon.
- A negative close next week would provide further evidence of a correction forming.
EUR/JPY is in a long-term uptrend distinguished by the rising peaks and troughs in price on the weekly chart.
The pair’s price has formed a bearish divergence with the Relative Strength Index (RSI) in the current week when compared with the similar high in November 2023.
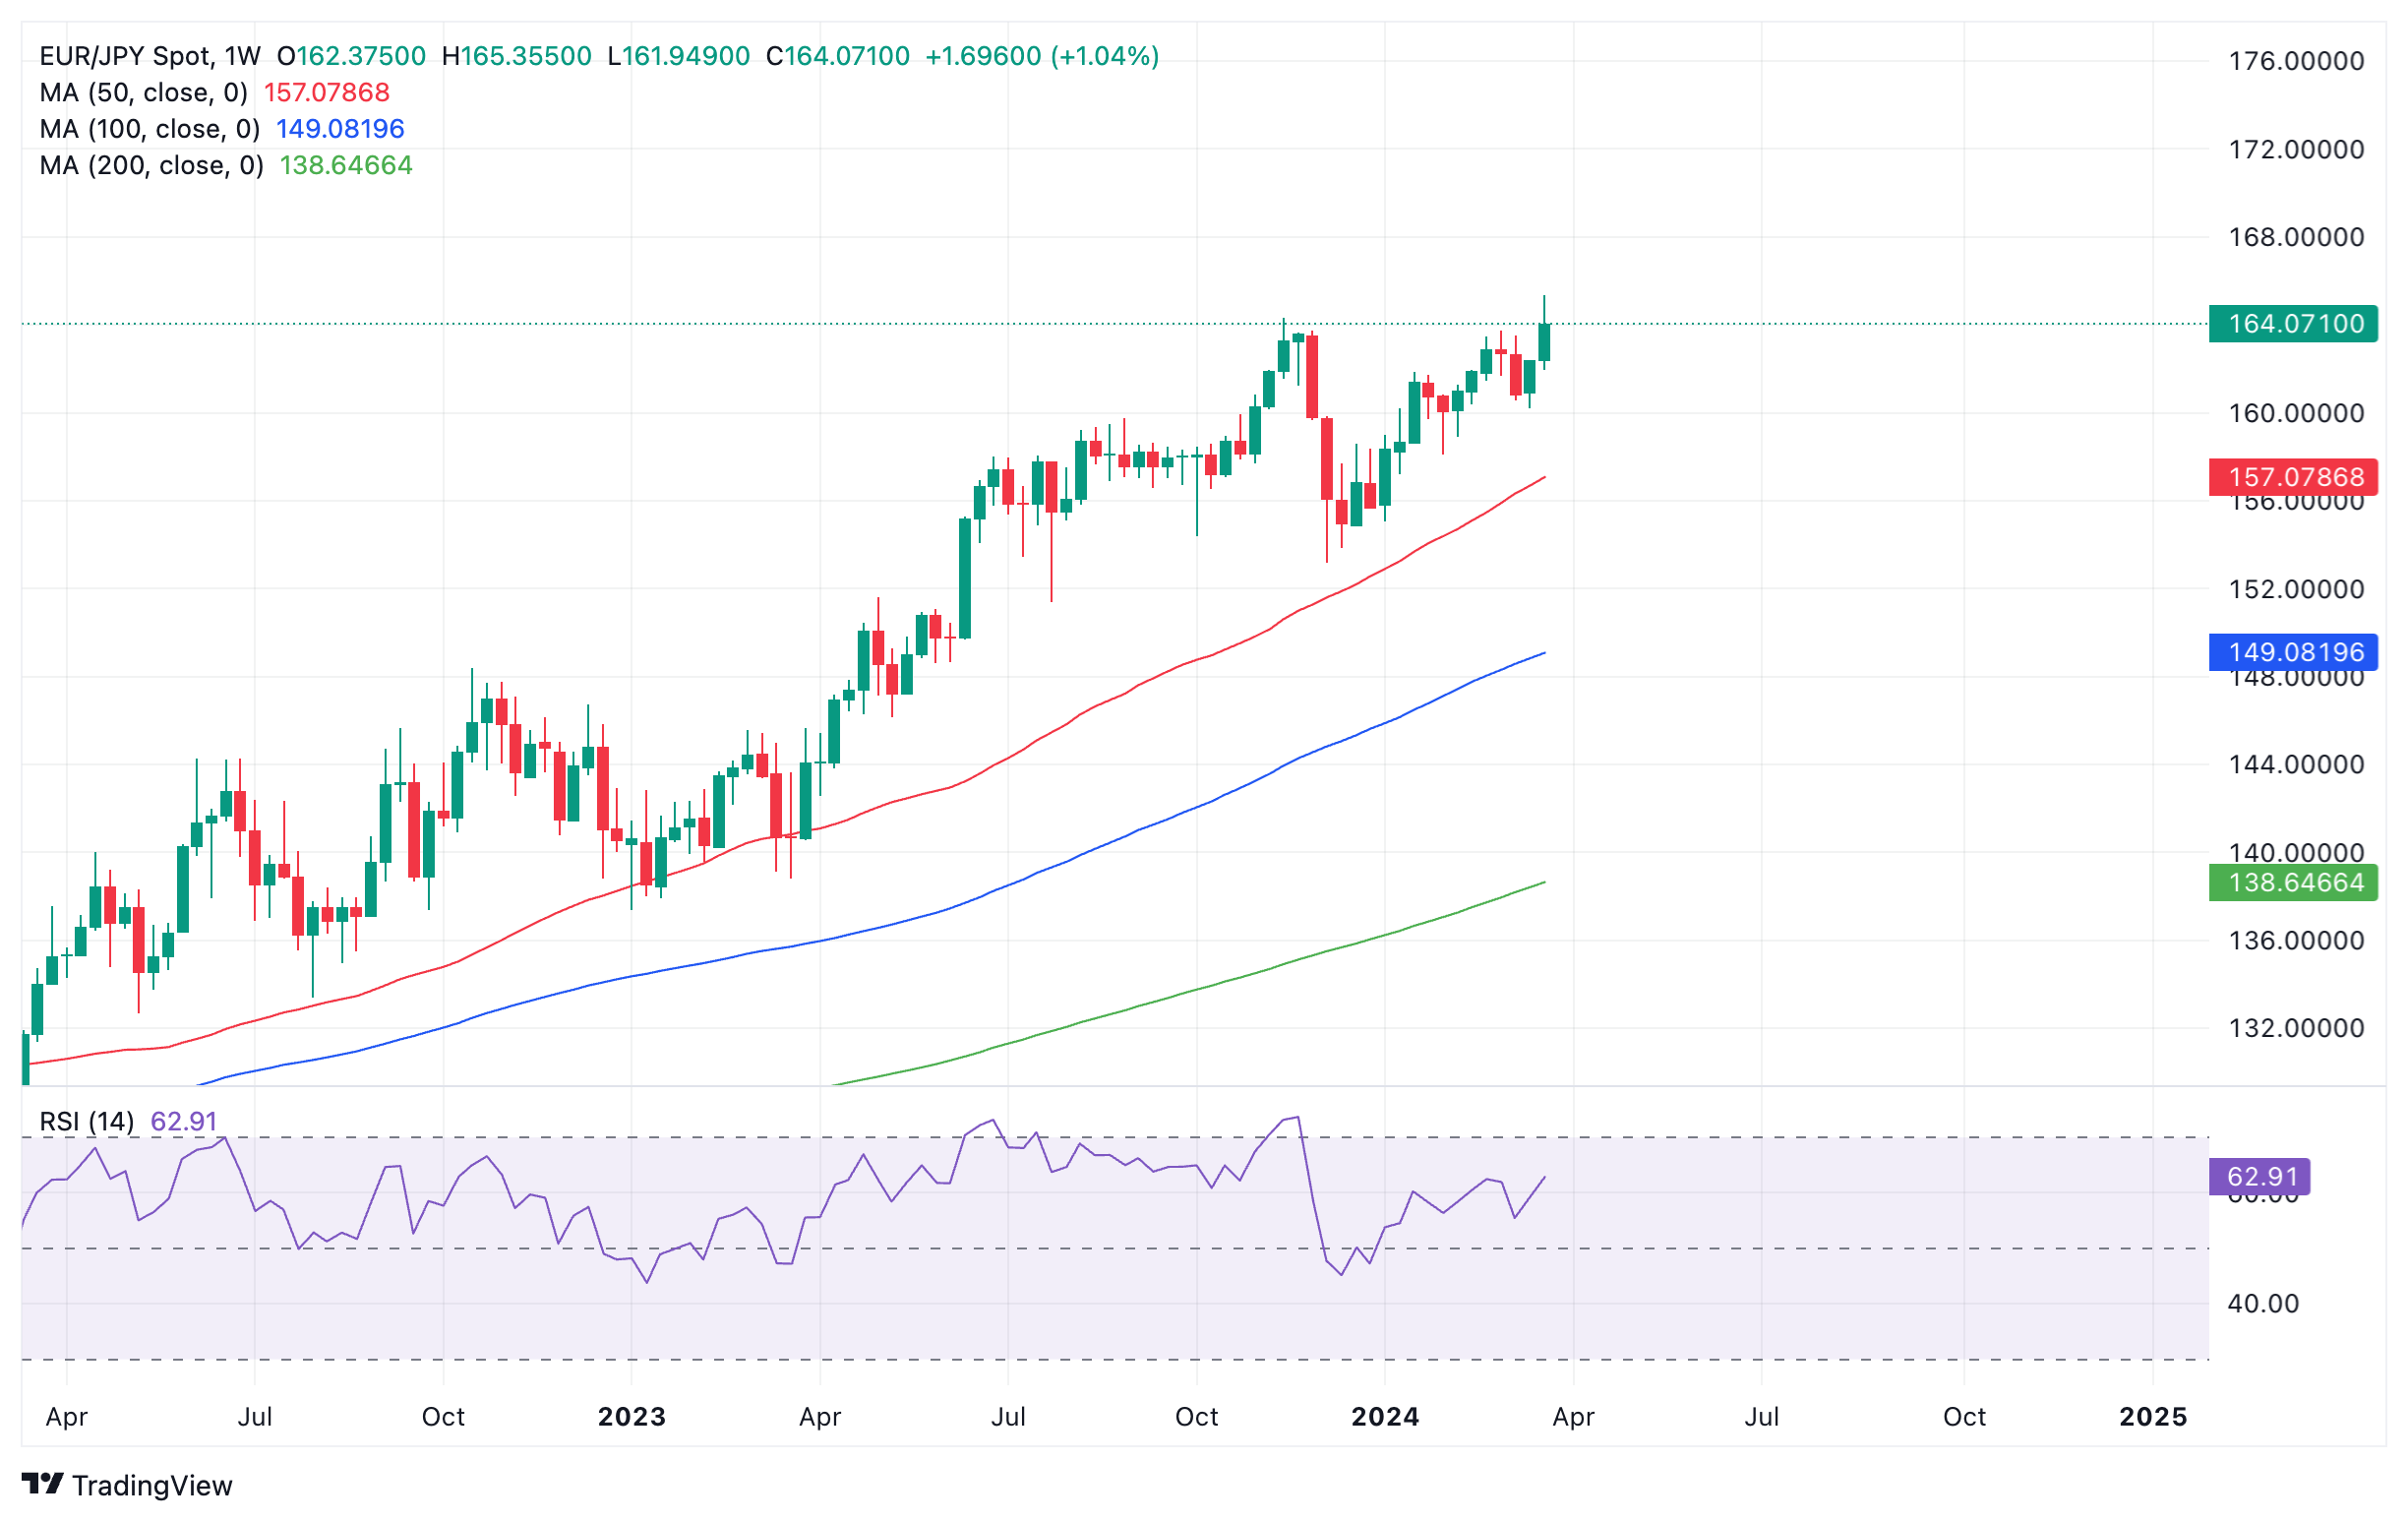
Euro versus Japanese Yen: Weekly chart
Divergence occurs when price reaches a higher high but the RSI fails to follow. It is a sign of underlying weakness in the asset price and a precursor to a possible correction. In the case of EUR/JPY the new multi-year high reached this week was not accompanied by a higher high in the RSI when compared with the high in November 2023.
The divergence is quite acute suggesting a stronger possibility it could indicate a subsequent bearish pullback in price.
A natural target for a pullback if it develops would be the red 50-week Simple Moving Average (SMA) at 157.080.
If the next week is bearish that would add credence to the view there will be a correction signaled by the divergence.
USD/CAD rebound has stalled after approaching the December high of 1.3620. Economists at Société Générale analyze the pair’s technical outlook.
1.3440 is important support
The USD/CAD pair has experienced a sideways consolidation since last month. The flattish slope of 200-DMA denotes a lack of clear direction.
Lower limit of the recent range near 1.3440 is important support.
Once a break above 1.3620 materializes, USD/CAD could head higher towards 1.3730, the 76.4% retracement from November and perhaps even toward the graphical hurdle of 1.3860/1.3900.
- Natural Gas prices were unable to break above $1.90 this week.
- Traders are throwing in the towel on bullish outlooks after European PMI data points to a subdued economic outlook.
- The US Dollar Index sprints higher with markets not buying into Fed’s soft-landing narrative.
Natural Gas (XNG/USD) trades roughly flat on Friday and it is set to close off the week with a small gain on the US side. However, on the other side of the Atlantic, the European Gas market is set to close this week in the red as elevated reserves and a lackluster economic outlook in Germany push demand for Gas further down.
Meanwhile, the DXY US Dollar Index, which gauges the US Dollar (USD) against a basket of six foreign currencies, is breaking above 104.00 on Friday. The mixture of China dropping the ball on its recovery, together with markets not buying into the three Fed rate cuts for 2024 is creating a cocktail in which the Greenback is winning twice. Investors do not see a reason for three rate cuts and a soft landing by the Fed because recent US economic numbers are still showing the economy is taking off, not landing, which questions the need for any rate cuts.
Natural Gas is trading at $1.85 per MMBtu at the time of writing.
Natural Gas news and market movers: European market leads the way
- The UN is holding a summit on Friday to discuss a forced ceasefire in Gaza. This could be a trigger for more downside risk in Natural Gas should a ceasefire take place.
- Russian Liquified Petroleum Gas prices are soaring as a result of the Ukraine drone strikes on several storage facilities.
- India has refused to take in Oil coming from Russia in order to comply with US sanctions, Bloomberg reported on Wednesday. A domino effect could be extended into Gas deliveries as well, which would mean a squeeze in prices in the region should Russian Gas be refused.
Natural Gas Technical Analysis: Consolidation phase
Natural Gas prices are still consolidating with a pennant formation on the Daily Chart, formed by lower highs and higher lows since mid-February. With both buyers and sellers being pushed toward each other, a breakout could be due at any time. Seeing the current lackluster energy demand out of Europe, with its storage units still above average, a turn to the downside looks more likely than an upside breakout.
On the upside, the key $2.00 level needs to be regained first. The next key mark is the historic pivotal point at $2.12, which falls broadly in line with the 55-day Simple Moving Average (SMA) at $2.05. Should Gas prices pop up in that region, a broad area opens up with the first cap at the red descending trendline near $2.27.
On the downside, multi-year lows are still nearby with $1.65 as the first line in the sand. This year’s low at $1.60 needs to be kept an eye on as well. Once a new low for the year is printed, traders should look at $1.53 as the next supportive area.
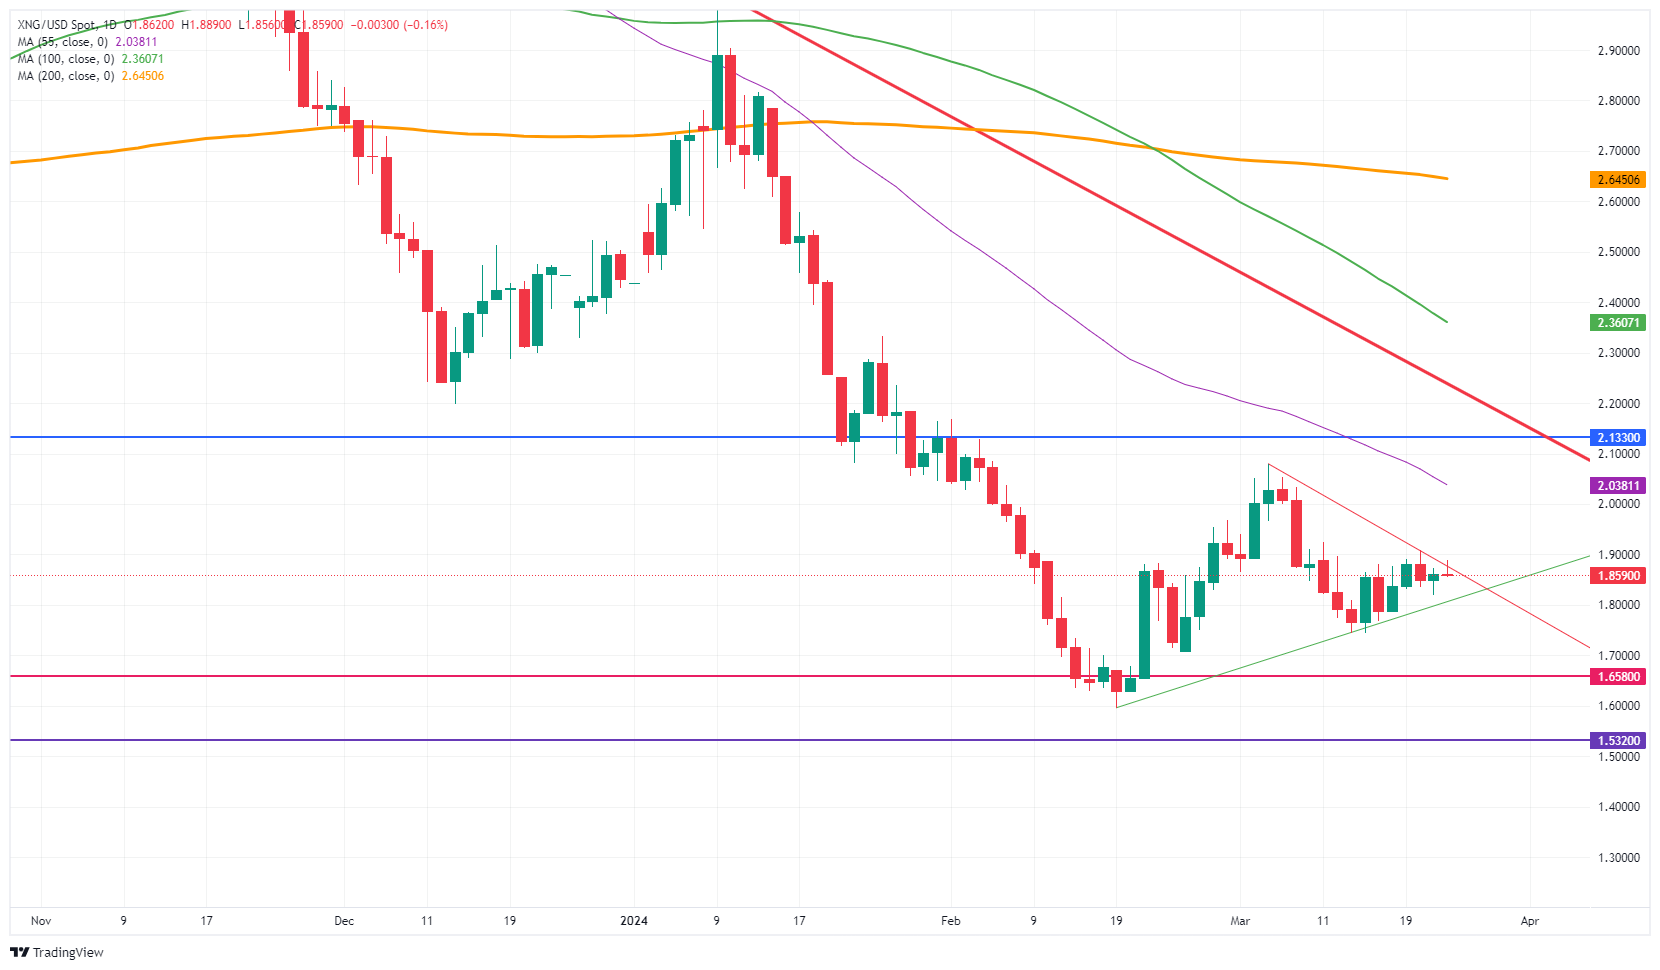
Natural Gas: Daily Chart
Natural Gas FAQs
Supply and demand dynamics are a key factor influencing Natural Gas prices, and are themselves influenced by global economic growth, industrial activity, population growth, production levels, and inventories. The weather impacts Natural Gas prices because more Gas is used during cold winters and hot summers for heating and cooling. Competition from other energy sources impacts prices as consumers may switch to cheaper sources. Geopolitical events are factors as exemplified by the war in Ukraine. Government policies relating to extraction, transportation, and environmental issues also impact prices.
The main economic release influencing Natural Gas prices is the weekly inventory bulletin from the Energy Information Administration (EIA), a US government agency that produces US gas market data. The EIA Gas bulletin usually comes out on Thursday at 14:30 GMT, a day after the EIA publishes its weekly Oil bulletin. Economic data from large consumers of Natural Gas can impact supply and demand, the largest of which include China, Germany and Japan. Natural Gas is primarily priced and traded in US Dollars, thus economic releases impacting the US Dollar are also factors.
The US Dollar is the world’s reserve currency and most commodities, including Natural Gas are priced and traded on international markets in US Dollars. As such, the value of the US Dollar is a factor in the price of Natural Gas, because if the Dollar strengthens it means less Dollars are required to buy the same volume of Gas (the price falls), and vice versa if USD strengthens.
The Swiss National Bank (SNB) delivered a 25 basis points rate cut to 1.50%, which triggered a sharp sell-off in CHF. Economists at Commerzbank analyze Franc’s outlook.
The SNB kicks off
The SNB surprised the majority of market participants by being the first of the G10 central banks to cut its key interest rate by 25 bps to 1.50%, which immediately sent the Franc plummeting.
In principle, the SNB has less leeway than other central banks to lower the key interest rate, as it has not raised it that sharply. In this respect, if it turns out that the ECB makes several interest rate cuts, but the SNB has possibly already done enough with this first step to guarantee price stability, the franc could even appreciate.
But let's wait and see; if inflation continues to fall, the SNB may well continue and cut rates further. For the time being, the SNB's action on Thursday suggests that the Franc should remain under downward pressure against the Euro.
The Pound Sterling (GBP) sold off on news that the two BoE hawks have now opted for unchanged rates. Economists at ING analyze GBP outlook.
A modest dovish shift by the BoE
The Bank of England opted for a more dovish than expected communication. Despite keeping its guidance unchanged (rates to be restrictive for an extended period of time), the two most hawkish members changed their vote from a hike to a hold, and there was a mention in the minutes that rates can still be restrictive even with rate cuts.
All this isn’t hugely surprising, after all the real policy rate has continued to inch higher with inflation declining. Still, markets are largely reading this as an acknowledgement that cuts aren’t too far away, and are now increasingly convinced the BoE will start easing in June (20 bps priced in), along with starting to speculate on a May move (7 bps priced in).
EUR/GBP may struggle to find much more support above 0.8600 as UK data still has to validate the recent repricing of the Sonia curve.
- Gold price fails to hold all-time highs around $2,220 as the US Dollar strengthens.
- The US Dollar capitalizes on the strong US economic outlook.
- The Fed’s rate-cut campaign could be less aggressive compared with other central banks in developed nations.
Gold price (XAU/USD) extends its downside to near $2,160 in Friday’s European session after failing to sustain close to its all-time highs above $2,220. The precious metal faces a sharp sell-off as the US Dollar strengthens on an upbeat United States economic outlook, reinforced by robust Existing Home Sales data released on Thursday. The US Dollar Index (DXY) refreshes a monthly high at 104.41.
Greenback-denominated Gold tends to face liquidity outflows when the US Dollar strengthens. The outlook for the US economy improved after the Federal Reserve upwardly revised growth forecasts for 2024. The Fed sees the US Gross Domestic Product (GDP) growing by 2.1%, up from the 1.4% it projected in December.
10-year US Treasury yields fall to 4.24% as the Fed reiterated on Wednesday that it expects three interest-rate cuts this year. Fed officials stuck to their outlook from December even though the consumer and producer price inflation remained sticky in February. US bond yields remain inside Thursday’s trading range, awaiting a fresh trigger for further guidance.
Daily digest market movers: Gold price drops as US Dollar strengthens
- Gold's price is pressured by the US Dollar’s strength. The appeal for the Greenback strengthened after the Swiss National Bank (SNB) emerged as leading the global rate-cut cycle. The SNB surprisingly reduced interest rates by 25 basis points (bps) to 1.50% on Thursday. This has increased optimism among market participants about other central banks following the same pattern, particularly in economies where inflation is decelerating and risks of a recession are high.
- The European Central Bank (ECB), the Bank of England, and the Bank of Canada (BoC) are also expected to start considering rate cuts soon. Due to their poor economic outlook, rate cuts could be aggressive in the longer term.
- Like other central banks, market participants anticipate that the Federal Reserve will also begin cutting interest rates this year. However, the Fed is not expected to rush for rate cuts as the US inflation is sticky and the US economic outlook is upbeat. The US economy exhibits a firm footing on the grounds of consumer spending and the labor market, providing time for the Fed to observe more data before moving to cuts.
- This week, the Gold price saw a strong rally after the Fed stuck to projections of three rate cuts for 2024. Fed Chair Jerome Powell said in his monetary policy statement that the story of easing price pressures is intact despite recent hot inflation readings.
- Though the Fed maintained its view of three rate cuts, it was clear from its side that rate cuts would be appropriate only if it gains greater confidence that inflation will sustainably come down to the 2% target. Assets that pay no interest, such as Gold, face downside pressure when the Fed keeps interest rates higher for a longer period.
Technical Analysis: Gold price falls sharply from $2,220 as oscillators turn overbought
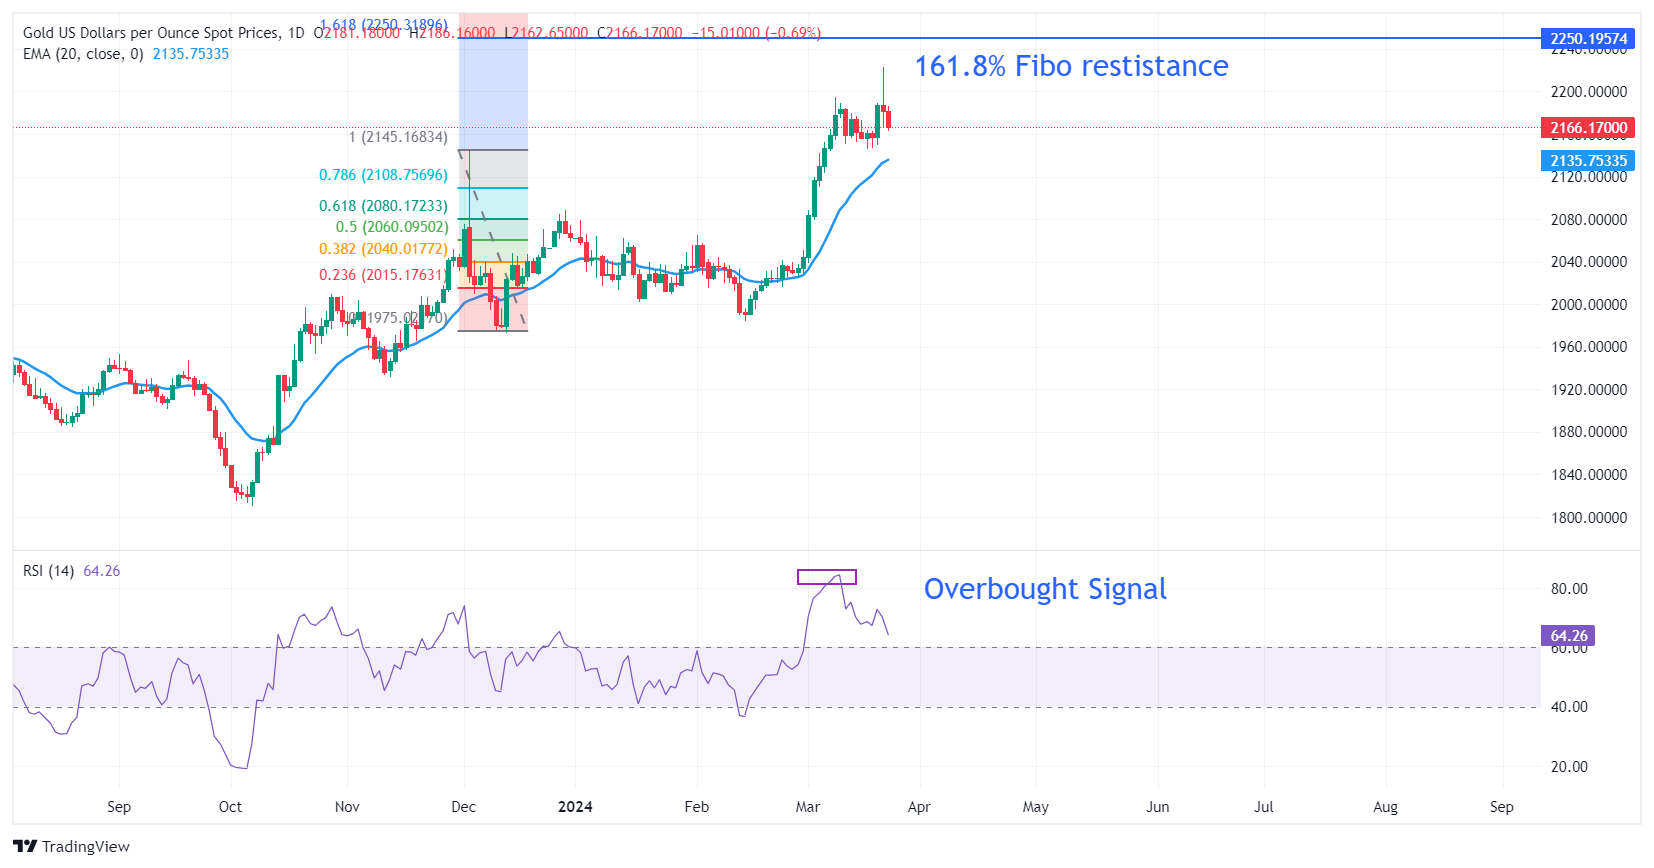
Gold price drops significantly to $2,162 from its all-time high of $2,222. Profit-booking dragged the Gold price as momentum oscillators turned extremely overbought on the daily time frame. This doesn’t exhibit a bearish reversal as the asset could rebound after oscillators cool down. The 14-period Relative Strength Index (RSI) drops after reaching a little above 84.00. The RSI (14) is considered extremely overbought when it climbs above 80.00.
The near-term demand for the Gold price remains strong as the 20-day Exponential Moving Average (EMA) at $2,137 is sloping higher.
On the upside, the Gold price could face resistance near the 161.8% Fibonacci extension at $2,250. The Fibonacci tool is plotted from December 4 high at $2,144.48 to December 13 low at $1,973.13. On the downside, December 4 high at $2,144.48 will support the Gold price bulls.
Gold FAQs
Gold has played a key role in human’s history as it has been widely used as a store of value and medium of exchange. Currently, apart from its shine and usage for jewelry, the precious metal is widely seen as a safe-haven asset, meaning that it is considered a good investment during turbulent times. Gold is also widely seen as a hedge against inflation and against depreciating currencies as it doesn’t rely on any specific issuer or government.
Central banks are the biggest Gold holders. In their aim to support their currencies in turbulent times, central banks tend to diversify their reserves and buy Gold to improve the perceived strength of the economy and the currency. High Gold reserves can be a source of trust for a country’s solvency. Central banks added 1,136 tonnes of Gold worth around $70 billion to their reserves in 2022, according to data from the World Gold Council. This is the highest yearly purchase since records began. Central banks from emerging economies such as China, India and Turkey are quickly increasing their Gold reserves.
Gold has an inverse correlation with the US Dollar and US Treasuries, which are both major reserve and safe-haven assets. When the Dollar depreciates, Gold tends to rise, enabling investors and central banks to diversify their assets in turbulent times. Gold is also inversely correlated with risk assets. A rally in the stock market tends to weaken Gold price, while sell-offs in riskier markets tend to favor the precious metal.
The price can move due to a wide range of factors. Geopolitical instability or fears of a deep recession can quickly make Gold price escalate due to its safe-haven status. As a yield-less asset, Gold tends to rise with lower interest rates, while higher cost of money usually weighs down on the yellow metal. Still, most moves depend on how the US Dollar (USD) behaves as the asset is priced in dollars (XAU/USD). A strong Dollar tends to keep the price of Gold controlled, whereas a weaker Dollar is likely to push Gold prices up.
Norges Bank kept its benchmark interest rate unchanged on Thursday. Economists at Commerzbank analyze Norwegian Krone’s (NOK) outlook after the decision.
Norges Bank remained unwavering in its restrictive stance
Norges Bank thus remains cautious about the timing of an initial rate cut. After all, inflation has to fall further first, and Norges Bank is obviously taking its time before it is sure that it can cut the key rate. And in the longer term, it now anticipates a slightly higher interest rate environment.
I think Norges has done a good job, as it already did back in January. The market seems to see it the same way, as the NOK traded higher immediately after the decision. Over the day, however, external factors, such as the weaker oil price, gained the upper hand again, causing the NOK to lose significant ground. It is a pity that Norges Bank's sensible monetary policy cannot be reflected in NOK prices at present.
The Swiss Franc (CHF) was dealt a blow on Thursday as the Swiss National Bank unexpectedly cut rates by 25 bps. Economists at ING analyze CHF outlook.
SNB cut paves the way for more CHF weakness
We think cuts in June and September now look likely. That would take the policy rate in Switzerland back to 1%, with another move potentially lowering it to 0.75%.
The EUR-CHF rate gap – a key driver of EUR/CHF – is set to prove supportive for the pair beyond the short term. We suspect markets are wrong in pricing in more than 75 bps of easing by the ECB this year, while the SNB rate expectations can face further dovish repricing.
Crucially, the SNB’s policy statement made two references to the strength of the Franc in real terms, meaning the FX intervention tool can now be used to weaken the currency.
Things may quiet down in EUR/CHF now, especially as markets may incline to price in more cuts by the ECB, but selling the rally in the pair remains risky, and a gradual climb towards parity is a more likely outlook.
Thursday's Bank of England meeting failed to provide the Pound Sterling (GBP) with another boost. Economists at Commerzbank analyze GBP outlook.
Disenchanting day for the Pound
Although the market focused on the vote, as we expected, the 8-1 vote was slightly more dovish than the 7-1-1 expected.
In a generally dovish mood on Thursday, triggered by the SNB's surprise rate cut, the Pound took a beating and ended the day as the second worst performing currency. However, it should also be noted that the GBP has enjoyed an extraordinary rally this year, largely based on a general correction in interest rate expectations towards fewer rate cuts (in addition to surprisingly good data). Therefore, if market sentiment turns, the Pound is one of the most vulnerable currencies.
Overall, however, we would suggest that not too much has changed as a result of Thursday's decision. Of course, the Bank of England has taken another step towards lowering interest rates. But whether this will happen sooner than before, simply because no policymaker voted for a hike, is still not entirely clear. Admittedly, the vote is a signal, but even before that, another rate hike was very unlikely.
European Central Bank (ECB) policymaker and Bundesbank Chief Joachim Nagel said on Friday that “the probability of a rate cut before the summer break is increasing.”
Additional comments
Do not see any automatism in rate cuts.
A June rate cut has a higher probability than one in April.
Market reaction
EUR/USD keeps its rebound intact above 1.0800 following Nagel’s comments. The pair is currently trading at 1.0818, still losing 0.38% so far.
ECB FAQs
The European Central Bank (ECB) in Frankfurt, Germany, is the reserve bank for the Eurozone. The ECB sets interest rates and manages monetary policy for the region. The ECB primary mandate is to maintain price stability, which means keeping inflation at around 2%. Its primary tool for achieving this is by raising or lowering interest rates. Relatively high interest rates will usually result in a stronger Euro and vice versa. The ECB Governing Council makes monetary policy decisions at meetings held eight times a year. Decisions are made by heads of the Eurozone national banks and six permanent members, including the President of the ECB, Christine Lagarde.
In extreme situations, the European Central Bank can enact a policy tool called Quantitative Easing. QE is the process by which the ECB prints Euros and uses them to buy assets – usually government or corporate bonds – from banks and other financial institutions. QE usually results in a weaker Euro. QE is a last resort when simply lowering interest rates is unlikely to achieve the objective of price stability. The ECB used it during the Great Financial Crisis in 2009-11, in 2015 when inflation remained stubbornly low, as well as during the covid pandemic.
Quantitative tightening (QT) is the reverse of QE. It is undertaken after QE when an economic recovery is underway and inflation starts rising. Whilst in QE the European Central Bank (ECB) purchases government and corporate bonds from financial institutions to provide them with liquidity, in QT the ECB stops buying more bonds, and stops reinvesting the principal maturing on the bonds it already holds. It is usually positive (or bullish) for the Euro.
- USD/MXN extend its winning streak for the third successive session on Friday.
- S&P Global Manufacturing PMI rose to 52.5 against the expected 51.7 and 52.2 prior.
- Banxico has lowered its interest rates by 25 bps to 11.0% in its March policy meeting.
USD/MXN rises on stronger US Dollar (USD) following mixed S&P preliminary Purchasing Managers Index (PMI) data and robust weekly Jobless Claims from the United States (US). The pair trades higher around 16.80 during the European session on Friday.
Additionally, the Bank of Mexico (Banxico) has reduced its interest rates by 25 basis points (bps) to 11.0% in a March policy meeting held on Thursday. This has contributed to the downward pressure on the Mexican Peso (MXN), consequently, underpinning the USD/MXN pair.
Additionally, the Bank of Mexico is set to release the 1st half-month Core Inflation for March, with expectations of a 0.26% increase, compared to the previous increase of 0.24%. The 1st half-month Inflation is anticipated to show a rise of 0.28%, a turnaround from the previous decline of 0.1%.
In March, the S&P Global Services PMI showed a slight decline, dropping to 51.7 from 52.3, slightly below the expected reading of 52.0. On the other hand, the Manufacturing PMI increased to 52.5, surpassing expectations of 51.7 and the previous figure of 52.2. Initial Jobless Claims for the week ending on March 15 came in at 210K, below the 215K expected and 212K prior.
The US Dollar Index (DXY) has continued to strengthen despite lower US Treasury yields. However, the US Dollar encountered challenges following the Federal Reserve's (Fed) reaffirmation of expectations for three interest rate cuts in 2024. The prevailing consensus indicates the commencement of an easing cycle in June, with the timing of subsequent cuts dependent on incoming data.
The US Dollar (USD) is enjoying good momentum after a week full of central bank decisions. Economists at ING analyze Greenback’s outlook.
End-of-week rally looks overdone
The jump in the Dollar appears overdone. The Federal Reserve sent a rather clear message earlier this week: some resilience in activity data won’t be a barrier to cutting as long as inflation shows downward momentum. We suspect the central bank’s dovish surprises in Switzerland (rate cut) and the UK (less hawkish narrative) have contributed to the strong Dollar momentum.
As things stand, we don’t see the Dollar rally having legs. As the dust settles after a very busy week for global central banks, we suspect markets may scale back long USD positions as the relatively dovish message by the Fed should still resonate.
Our view is that key March US data, released in the first half of April, can pave the way for a more sustainable Dollar decline.
- USD/CAD marches toward 1.3600 amid renewed US Dollar’s strength.
- The US economy exhibits a firm footing on the grounds of labor market and consumer spending.
- Expectations for BoC lowering interest rates sooner escalate due to easing price pressures.
The USD/CAD pair rises to 1.3570 in Friday’s European session on a buoyant US Dollar. The Loonie asset is expected to continue its upside move as the appeal for safe-haven assets remains upbeat.
The US Dollar Index (DXY) rose to a fresh two-week high at 104.20 on upbeat Existing Home Sales data for February, released on Thursday. Sales of pre-owned residences rose by 4.38 Million, the most in a year, against expectations of 3.94 Million and the prior reading of 4.00 Million. This demonstrates improving United States economic prospects despite interest rates remaining historically high in the range of 5.25%-5.50%.
Compared with other developed economies, the US economic outlook is stronger due to robust consumer spending and upbeat labor market conditions. The Federal Reserve (Fed) is not expected to rush for rate cuts as inflation remains higher than expected in February, strengthening the US Dollar.
Meanwhile, price pressures in the Canadian economy are decelerating at a faster pace, boosting expectations for the Bank of Canada (BoC) to reduce interest rates sooner.
USD/CAD approaches the horizontal resistance of the Ascending Triangle pattern formed on a daily timeframe, plotted from December 7 high at 1.3620. The upward-sloping border of the aforementioned pattern is placed from December 27 low at 1.3177. The chart pattern exhibits a sharp volatility contraction.
The near-term appeal is bullish as the 20-day Exponential Moving Average (EMA) near 1.3520 continues to provide support to the US Dollar bulls.
The 14-period Relative Strength Index (RSI) oscillates inside the 40.00-60.00 range, indicating indecisiveness among investors.
The Loonie asset would observe a fresh upside if it breaks above December 7 high at 1.3620. This will drive the asset towards May 26 high at 1.3655, followed by the round-level resistance of 1.3700.
On the flip side, a downside move below February 22 low at 1.3441 would expose the asset to February 9 low at 1.3413. A breakdown below the latter would extend downside towards January 15 low at 1.3382.
USD/CAD daily chart
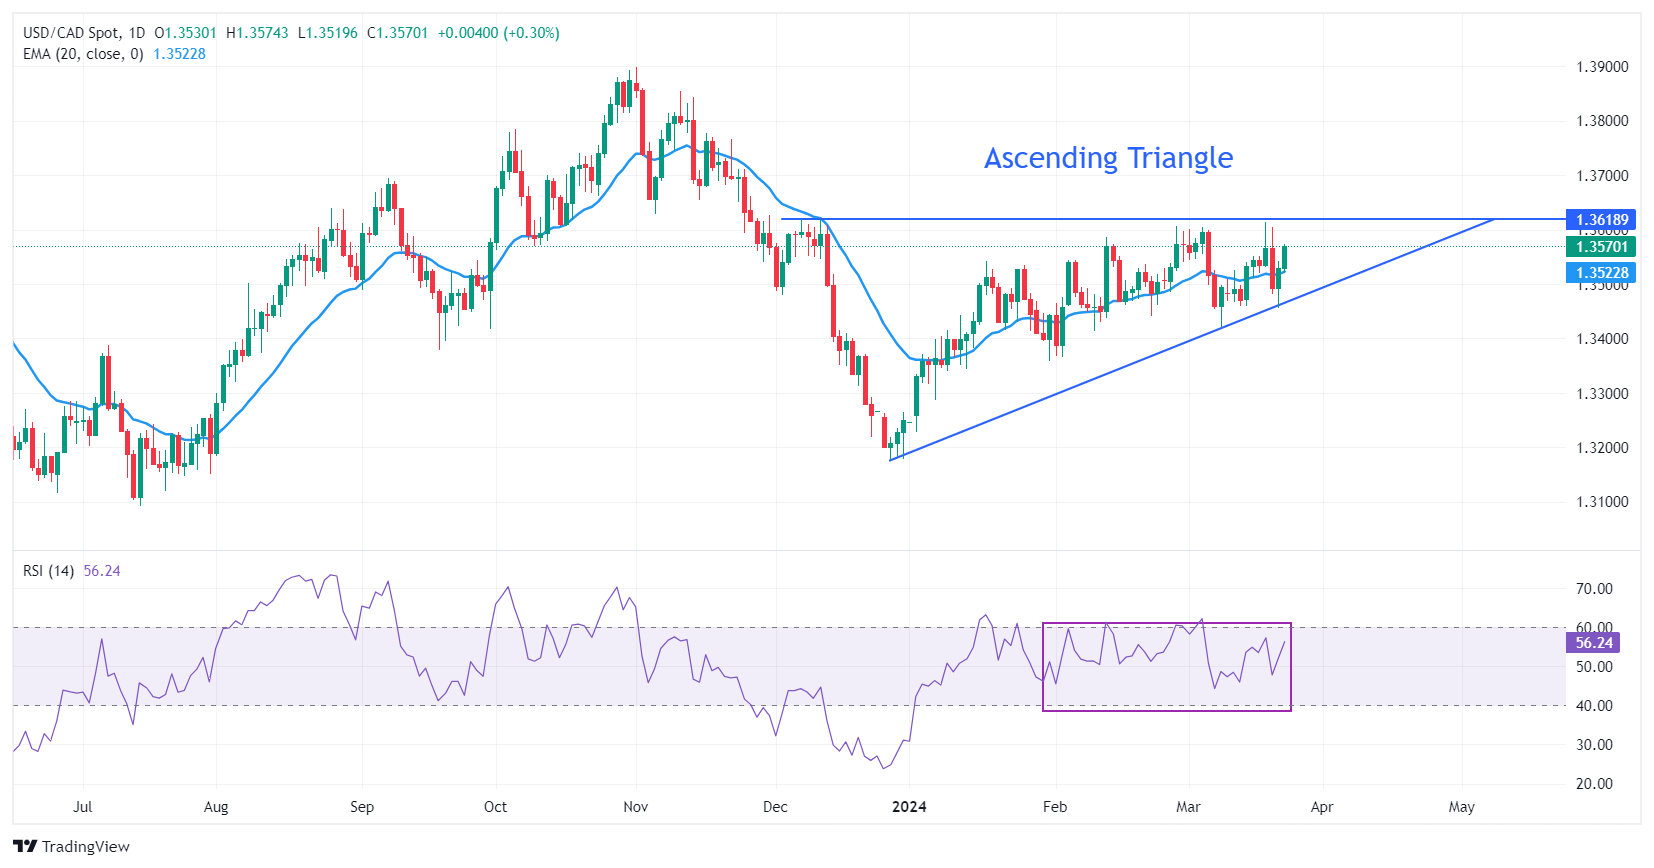
- German IFO Business Climate Index beat estimates with 87.8 in March.
- IFO Current Economic Assessment improved to 87.5 in the reported month.
The headline German IFO Business Climate Index arrived at 87.8 in March, higher than the February reading of 85.5, much above the market consensus of 86.0.
Meanwhile, the Current Economic Assessment Index rose from 86.9 in February to 88.1 in the reported month, beating expectations of 86.8.
The IFO Expectations Index – indicating firms’ projections for the next six months, edged higher to 87.5 in March vs. 84.1 recorded in the previous month while surpassing the expected 84.7 figure.
Market reaction to the German IFO Survey
EUR/USD defends the 1.0800 level on the upbeat German IFO survey. At the time of writing, the pair is trading 0.40% lower at 1.0815.
About German IFO
The headline IFO business climate index was rebased and recalibrated in April after the IFO Research Institute changed the series from the base year of 2000 to the base year of 2005 as of May 2011 and then changed series to include services as of April 2018. The survey now includes 9,000 monthly survey responses from firms in the manufacturing, service sector, trade and construction.
- Silver drifts lower for the second straight day and touches a one-and-half-week low.
- The mixed technical setup warrants caution before placing aggressive bearish bets.
- A convincing break below the 38.2% Fibo. level will set the stage for deeper losses.
Silver (XAG/USD) extends the previous day's sharp retracement slide from the $25.75-$25.80 region, or its highest level since early December and remains under some selling pressure for the second straight day on Friday. The white metal maintains its offered tone through the early part of the European session and is currently placed around mid-$24.00s, just above a one-and-half-week low touched earlier today.
From a technical perspective, the overnight breakdown through the $24.85-$24.80 horizontal support, coinciding with the 23.6% Fibonacci retracement level of the February-March rally was seen as a fresh trigger for bearish traders. The subsequent slide, however, stalls ahead of the 38.2% Fibo. level, which should now act as a key pivotal point. Meanwhile, oscillators on the daily chart – though have been losing traction – are still holding in the positive territory.
Hence, it will be prudent to wait for a sustained break below the said support near the $24.30 region before positioning for any further depreciating move for the XAG/USD. The corrective decline could then drag the white metal below the $24.00 round-figure mark, towards testing the 50% Fibo. level support near the $23.85 zone en route to the $23.40 confluence, comprising the 61.8% Fibo. and the very important 200-day Simple Moving Average (SMA).
On the flip side, the $24.80 horizontal support breakpoint could act as an immediate hurdle ahead of the $25.00 psychological mark. A sustained strength beyond the latter might trigger a bout of a short-covering rally towards the $25.50 region en route to the YTD peak, around the $25.75-$25.80 region. This is followed by the December 2023 swing high, just ahead of the $26.00 round figure, which if cleared decisively will set the stage for additional gains.
Silver daily chart
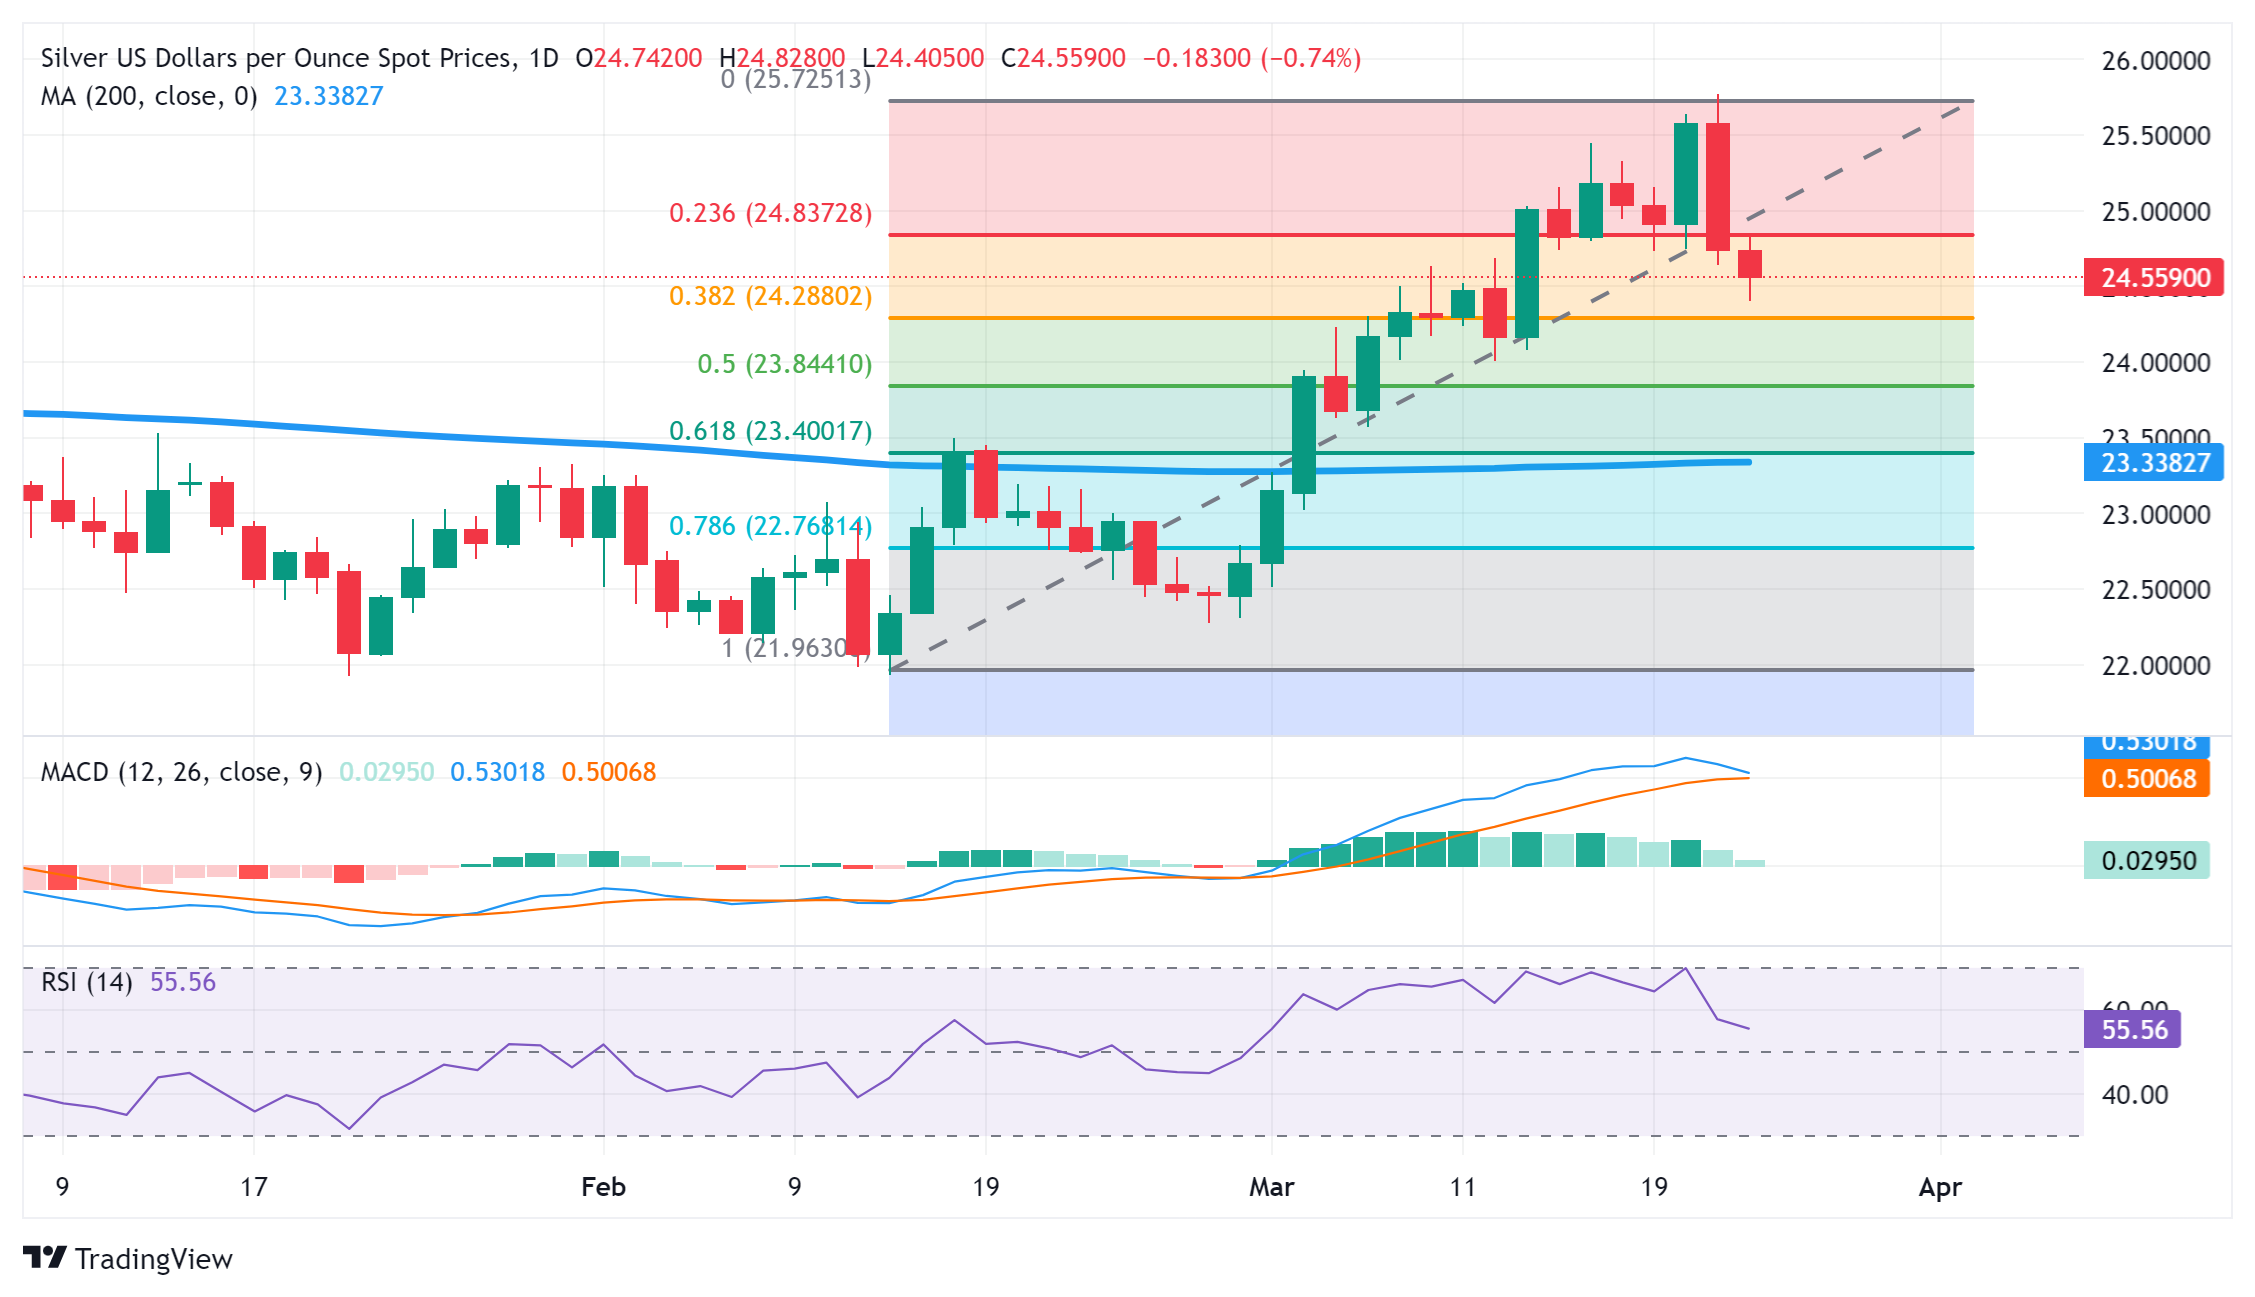
- EUR/USD is testing the key 200-day SMA on Friday after recapitulating over the prior sessions.
- The pair is poised to break below key support levels as key central bank figures line up to speak.
- Their commentary could impact expectations of when future interest rate cuts may take place.
EUR/USD is trading a quarter of a percent down on Friday, in the lower 1.0800s just below the 200-day Simple Moving Average (SMA). The pair has seen increased volatility since the Federal Reserve (Fed) policy meeting on Wednesday. The release of Eurozone and US flash PMI data for March on Thursday caused further volatility after the data showed the US economy in better shape than that of the euro area.
As traders wrap up for the weekend there is a heightened possibility of further moves as a roll call of central bank speakers take to the pulpit to share their views on Friday – from both the European Central Bank (ECB) and the Fed.
EUR/USD: A day of doves and hawks
EUR/USD exchanges hands in the 1.0830s as the European session on Friday gets underway. Key drivers for the pair at the end of the week will probably be commentary from central bankers. Several key figures are set to speak on monetary policy topics, including Bundesbank’s President Joachim Nagel, Fed’s Chairman Jerome Powell and ECB chief economist Philip Lane.
Their comments could impact the outlook for interest rates, which are set by central banks. Interest rates impact currencies because they dictate the level of foreign capital inflows from investors searching for returns. When interest rates are expected to go up it is positive for a currency; when down negative. Currently, the debate hinges around the timing of future rate cuts, with the consensus being that both the ECB and the Fed will make cuts in June. Anything that deviates from that view could cause volatility.
The first key central banker in the line up is the President of the Bundesbank, Joachim Nagel at 9:00 GMT who will be participating “in a webcast on monetary policy challenges and the economic outlook for the Eurozone and Germany,” according to the economic calendar.
His most recent comments suggested he is concerned about “Europe’s growth prospects more than his homeland” and back in February, he said the governing council should wait for Q2 wage data before deciding on whether to cut interest rates or not, suggesting he foresees June as a potential date for a rate-hike.
At 13:00 GMT, Federal Reserve Chairman Jerome Powell will participate in a “Fed Listens” panel about current economic conditions and how Covid impacted the economy. Vice-Chair Philip Jeffereson and Governor Michelle Bowman will also be at the event.
At 16:00 GMT, Federal Reserve Vice-Chair for Supervision Michael Barr will participate in a virtual discussion titled "International Economic and Monetary Design".
At 17:00 GMT , ECB Chief Economist and Board Member Philip Lane will deliver a policy lecture on inflation and monetary policy at the Aix-Marseille School of Economics (AMSE).
At 20:00 GMT, Federal Reserve Bank of Atlanta President Raphael Bostic will moderate a conversation about household finances at the 2024 Household Finance Conference – there is an outside chance he could mention interest rates.
Technical Analysis: EUR/USD tests trendline and 200-day SMA
EUR/USD is making volatile switches inside the 1.0800s and 1.0900s. It is currently trading back down in the 1.0800s just below the 200-day SMA at 1.0839, and a major trendline.
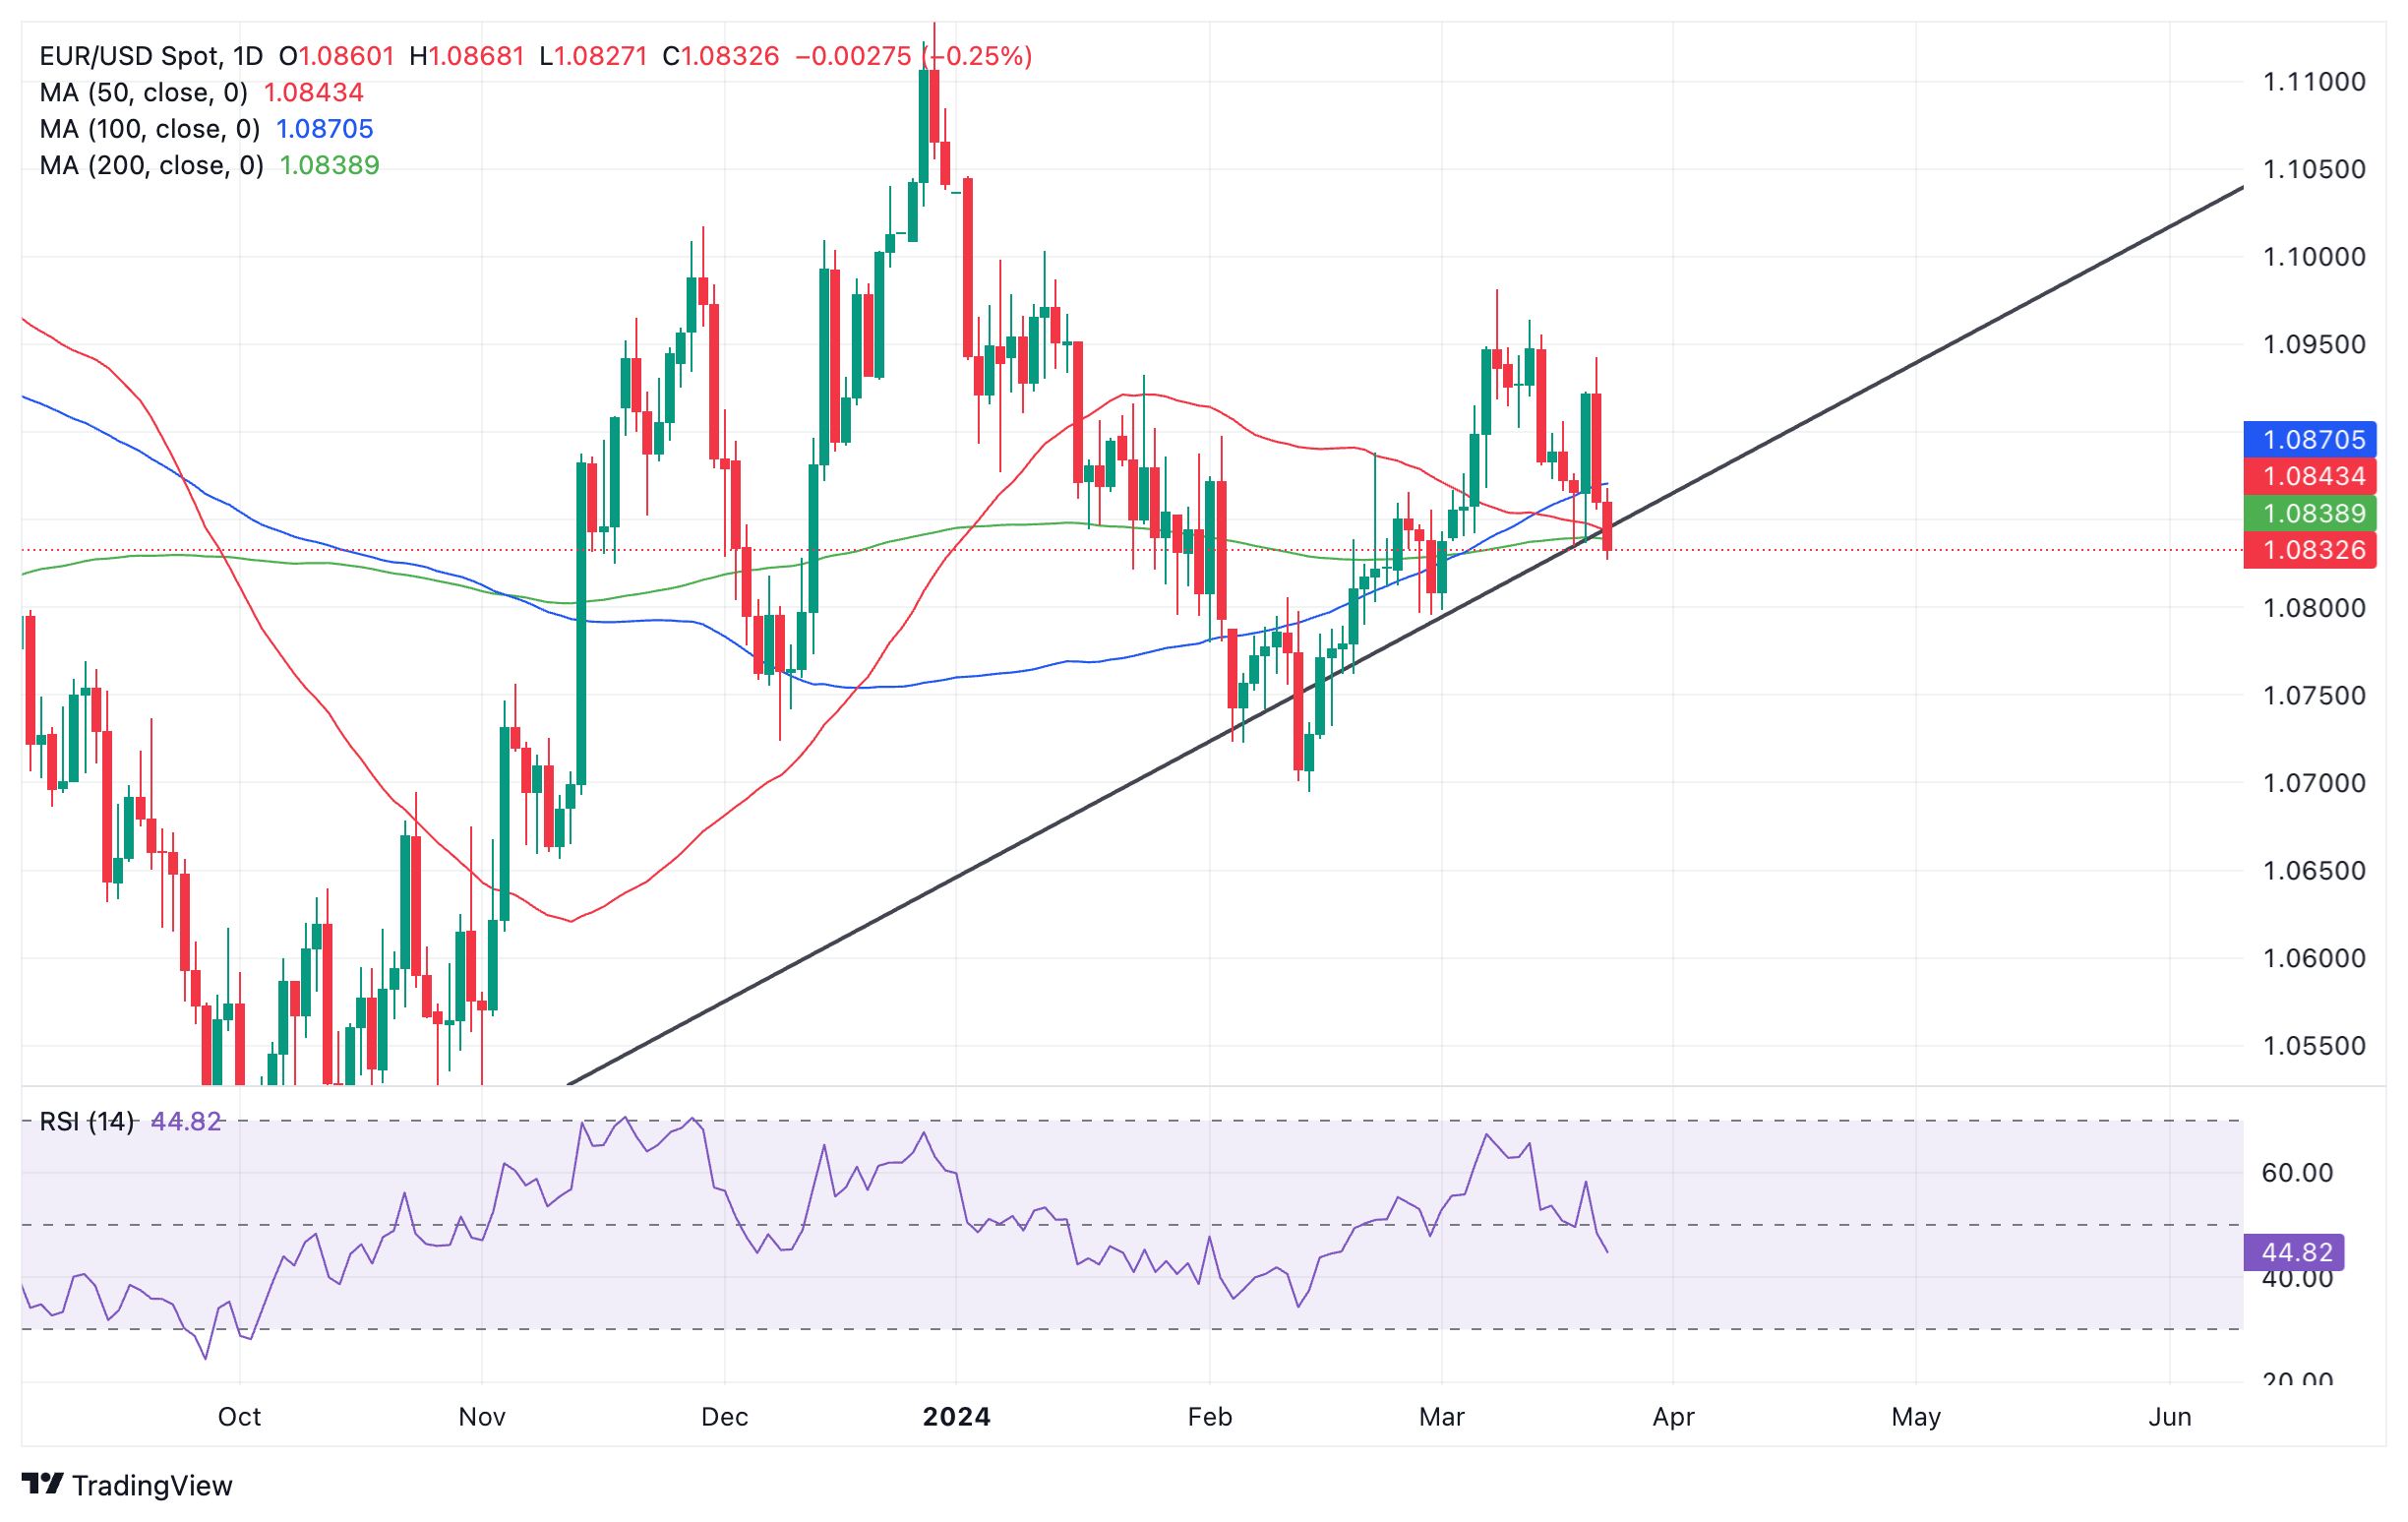
Euro versus US Dollar: Daily chart
The pair appears to be threatening to break below the trendline which could usher in a more bearish phase.
Such a move would be likely to tumble to at least 1.0775, the 0.618 Fibonacci extension of the move prior to the breakout lower, a common method of forecasting targets for trendline breaks.
The move down lacks momentum, however, as evidenced by the Relative Strength Index (RSI) on the 4-hour chart below, which shows RSI failing to reflect price’s current move down to a lower low – a suggestion bearish conviction is lacking.
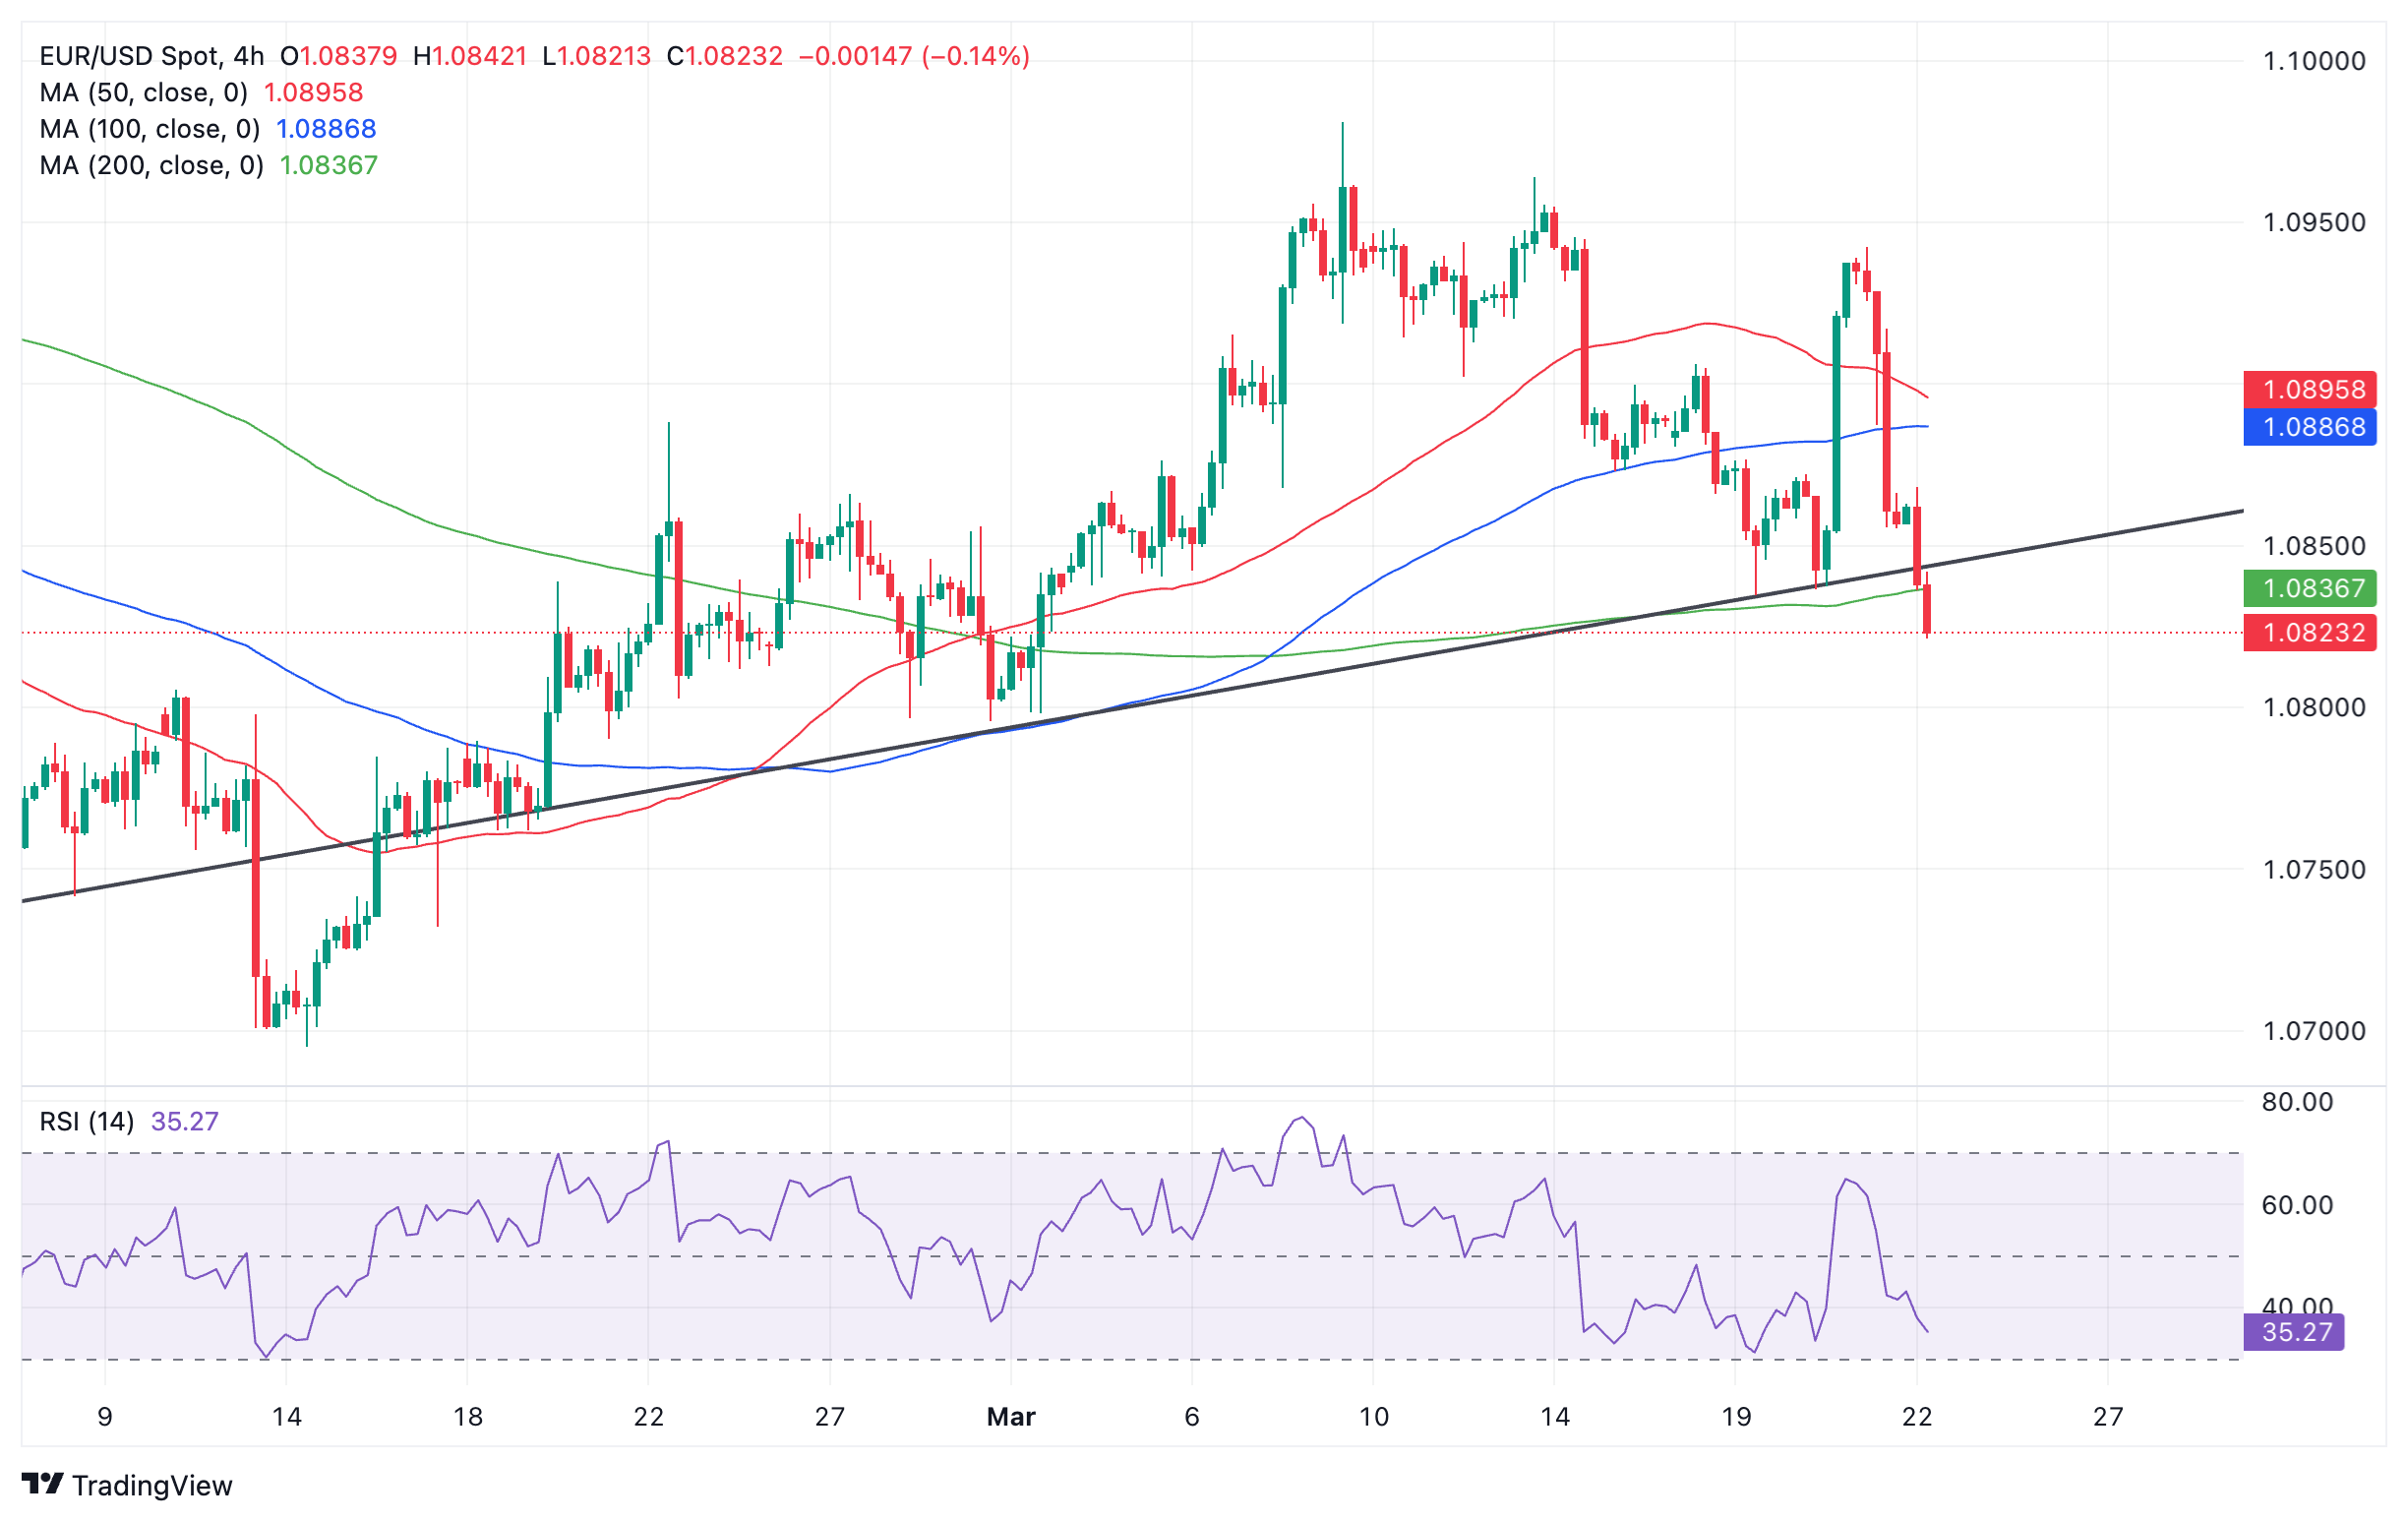
Euro versus US Dollar: 4-hour chart
Whilst the lack of momentum does not completely preclude the expectation price will fall further, it brings in a note of caution and suggests bears should be careful not to be caught in what could potentially be a false break.
Euro FAQs
The Euro is the currency for the 20 European Union countries that belong to the Eurozone. It is the second most heavily traded currency in the world behind the US Dollar. In 2022, it accounted for 31% of all foreign exchange transactions, with an average daily turnover of over $2.2 trillion a day. EUR/USD is the most heavily traded currency pair in the world, accounting for an estimated 30% off all transactions, followed by EUR/JPY (4%), EUR/GBP (3%) and EUR/AUD (2%).
The European Central Bank (ECB) in Frankfurt, Germany, is the reserve bank for the Eurozone. The ECB sets interest rates and manages monetary policy. The ECB’s primary mandate is to maintain price stability, which means either controlling inflation or stimulating growth. Its primary tool is the raising or lowering of interest rates. Relatively high interest rates – or the expectation of higher rates – will usually benefit the Euro and vice versa. The ECB Governing Council makes monetary policy decisions at meetings held eight times a year. Decisions are made by heads of the Eurozone national banks and six permanent members, including the President of the ECB, Christine Lagarde.
Eurozone inflation data, measured by the Harmonized Index of Consumer Prices (HICP), is an important econometric for the Euro. If inflation rises more than expected, especially if above the ECB’s 2% target, it obliges the ECB to raise interest rates to bring it back under control. Relatively high interest rates compared to its counterparts will usually benefit the Euro, as it makes the region more attractive as a place for global investors to park their money.
Data releases gauge the health of the economy and can impact on the Euro. Indicators such as GDP, Manufacturing and Services PMIs, employment, and consumer sentiment surveys can all influence the direction of the single currency. A strong economy is good for the Euro. Not only does it attract more foreign investment but it may encourage the ECB to put up interest rates, which will directly strengthen the Euro. Otherwise, if economic data is weak, the Euro is likely to fall. Economic data for the four largest economies in the euro area (Germany, France, Italy and Spain) are especially significant, as they account for 75% of the Eurozone’s economy.
Another significant data release for the Euro is the Trade Balance. This indicator measures the difference between what a country earns from its exports and what it spends on imports over a given period. If a country produces highly sought after exports then its currency will gain in value purely from the extra demand created from foreign buyers seeking to purchase these goods. Therefore, a positive net Trade Balance strengthens a currency and vice versa for a negative balance.
The Russian Central Bank (CBR) meets today. Economists at Commerzbank analyze Rouble’s (RUB) outlook ahead of the decision.
No rate cut from CBR
No (polled) analyst is expecting a change to the Russian Central Bank’s main rate from the current 16%.
Needless to say: this rate decision does not influence the ‘technical fix’ USD/RUB or EUR/RUB exchange rates that we observe – those are determined solely by demand-supply of energy (and some other commodity) trade.
On that basis, we forecast the Rouble to weaken steadily over the long term. Interest rates could have potentially affected the exchange rate only if capital flows could have occurred in response to interest rate differentials. But in Russia’s case, this cannot happen in US Dollars or Euros because of sanctions.
Here is what you need to know on Friday, March 22:
The US Dollar staged an impressive comeback following the selloff seen late Wednesday. The US Dollar (USD) Index gained more than 0.5% on Thursday and retraced the post-Fed decline. Early Friday, the USD Index continues to push higher and was last seen trading at its highest level in three weeks above 104.00. Later in the day, Federal Reserve Chairman Jerome Powell will deliver opening remarks at the Fed Listens event. Several other Fed policymakers are scheduled to deliver speeches ahead of the weekend as well.
The USD started to outperform its rivals in the American session on Thursday, boosted by the upbeat macroeconomic data releases. The PMI surveys showed that the economic activity in the private sector continued to expand at a healthy pace in early March, while input price pressures continued to strengthen. Additionally, the Initial Jobless Claims edged lower to 210K in the week ending March 16.
US Dollar price this week
The table below shows the percentage change of US Dollar (USD) against listed major currencies this week. US Dollar was the strongest against the Swiss Franc.
| USD | EUR | GBP | CAD | AUD | JPY | NZD | CHF | |
| USD | 0.53% | 1.00% | 0.15% | 0.64% | 1.62% | 1.28% | 1.75% | |
| EUR | -0.54% | 0.46% | -0.39% | 0.11% | 1.10% | 0.77% | 1.21% | |
| GBP | -1.01% | -0.47% | -0.86% | -0.36% | 0.62% | 0.29% | 0.75% | |
| CAD | -0.14% | 0.39% | 0.85% | 0.50% | 1.47% | 1.15% | 1.60% | |
| AUD | -0.62% | -0.09% | 0.35% | -0.51% | 1.00% | 0.67% | 1.13% | |
| JPY | -1.63% | -1.13% | -0.56% | -1.52% | -1.02% | -0.34% | 0.13% | |
| NZD | -1.31% | -0.77% | -0.30% | -1.16% | -0.66% | 0.33% | 0.45% | |
| CHF | -1.76% | -1.23% | -0.77% | -1.63% | -1.13% | -0.14% | -0.47% |
The heat map shows percentage changes of major currencies against each other. The base currency is picked from the left column, while the quote currency is picked from the top row. For example, if you pick the Euro from the left column and move along the horizontal line to the Japanese Yen, the percentage change displayed in the box will represent EUR (base)/JPY (quote).
The Bank of England (BoE) maintained the bank rate at 5.25% as expected following the March policy meeting. The BoE refrained from offering any hints at the timing of the policy pivot in the statement. Furthermore, none of the policymakers voted in favor of a rate hike, while one policymakers voted for a rate cut. BoE Governor Andrew Bailey said on Friday that markets can anticipate more than one interest rate cut this year and added that he is increasingly confident inflation is heading towards the target. GBP/USD stays under heavy bearish pressure and was last seen trading at its lowest level in a month near 1.2600.
The Swiss National Bank (SNB) announced on Thursday that it lowered the policy rate by 25 basis points to 1.5%. Markets were expecting the SNB to hold the interest rate unchanged. The initial reaction triggered a selloff in the Swiss Franc and USD/CHF gained more than 1% to reach its highest level since November above 0.9000.
EUR/USD extended its slide after breaking below 1.0900 on Thursday and declined nearly 0.6% on a daily basis. The pair continues to stretch lower early Friday and trades below 1.0850.
USD/JPY closed the eighth consecutive day in positive territory on Thursday before staging a technical correction toward the 151.50 area on Friday. Bank of Japan Governor Kazuo Ueda reiterated on Friday that the central bank’s Japanese government bond (JGB) holdings will remain at current levels for the time being.
Japanese Yen sticks to modest intraday gains against USD, upside potential seems limited.
Gold made a sharp U-turn after setting a new record high above $2,220 early Thursday and closed the day in negative territory. XAU/USD stays on the back foot in the European morning and was last seen losing more than 0.5% below $2,170.
Gold price extends its steady intraday descent amid broad-based USD strength.
Fed FAQs
Monetary policy in the US is shaped by the Federal Reserve (Fed). The Fed has two mandates: to achieve price stability and foster full employment. Its primary tool to achieve these goals is by adjusting interest rates. When prices are rising too quickly and inflation is above the Fed’s 2% target, it raises interest rates, increasing borrowing costs throughout the economy. This results in a stronger US Dollar (USD) as it makes the US a more attractive place for international investors to park their money. When inflation falls below 2% or the Unemployment Rate is too high, the Fed may lower interest rates to encourage borrowing, which weighs on the Greenback.
The Federal Reserve (Fed) holds eight policy meetings a year, where the Federal Open Market Committee (FOMC) assesses economic conditions and makes monetary policy decisions. The FOMC is attended by twelve Fed officials – the seven members of the Board of Governors, the president of the Federal Reserve Bank of New York, and four of the remaining eleven regional Reserve Bank presidents, who serve one-year terms on a rotating basis.
In extreme situations, the Federal Reserve may resort to a policy named Quantitative Easing (QE). QE is the process by which the Fed substantially increases the flow of credit in a stuck financial system. It is a non-standard policy measure used during crises or when inflation is extremely low. It was the Fed’s weapon of choice during the Great Financial Crisis in 2008. It involves the Fed printing more Dollars and using them to buy high grade bonds from financial institutions. QE usually weakens the US Dollar.
Quantitative tightening (QT) is the reverse process of QE, whereby the Federal Reserve stops buying bonds from financial institutions and does not reinvest the principal from the bonds it holds maturing, to purchase new bonds. It is usually positive for the value of the US Dollar.
USD/JPY is consolidating around 151.60 and struggling to break above its November 2023 high of 151.91. Economists at BBH analyze the pair’s outlook.
Threat of FX intervention is offering JPY support
The threat of FX intervention is offering JPY support. Japan’s Finance Minister Shunichi Suzuki warned again he’s ‘watching forex moves with a high sense of urgency’.
Japan’s February CPI print suggests the bar for an aggressive BoJ tightening cycle remains high. Bottom line: we think it’s only a matter of time before USD/JPY makes new cyclical highs.
- The Pound Sterling tumbles on increasing expectations that the BoE will opt for interest-rate cuts later this year.
- BoE Mann’s support for keeping interest rates unchanged in March boosted BoE rate cut prospects.
- UK Retail Sales data for February came in better than expected, although signaling little spending momentum among households.
The Pound Sterling (GBP) remains vulnerable against the US Dollar in Friday’s London session as the market sentiment is quite bearish. The GBP/USD pair fails to find support as increasing expectations that the Bank of England (BoE) will cut interest rates this year outweigh February Retail Sales data, which broadly beat market expectations.
The United Kingdom Office for National Statistics (ONS) reported that monthly Retail Sales were unchanged after increasing by a significant 3.6% in January, a figure that was upwardly revised from 3.4%. Investors had anticipated sales to decline by 0.3%. On an annual basis, sales contracted by 0.5% against expectations of a 0.7% decline.
The Retail Sales data is an indicator of the current status of consumer spending, which accounts for a major part of the economy. Sales at Retail stores were slightly better than expected, but are insufficient to offset the risk-aversion theme in the global market.
A slower decline in Retail Sales seems insufficient to outweigh the impact of higher expectations for the Bank of England (BoE) to reduce interest rates from August. However, higher wage growth will continue to worry BoE policymakers as they work to bring inflation down to the 2% target.
Meta Title: Pound Sterling slumps on risk aversion mood, BoE rate cut bets escalate
Daily digest market movers: Pound Sterling remains vulnerable as US Dollar advances
- The Pound Sterling refreshes two-week low at 1.2600 as the market sentiment remains downbeat and amid renewed US Dollar strength. The US Dollar Index (DXY), which measures US Dollar’s value against six major currencies, rises to a fresh two-week high around 104.20.
- The near-term demand for the US Dollar strengthens as inflation in the United States economy has remained sticky and the Federal Reserve (Fed) has upwardly revised its Gross Domestic Product (GDP) projections to 2.1% for 2024. On the contrary, inflation in other developed economies is decelerating at a faster pace, while the risk of a recession is also higher.
- On the domestic front, the Pound Sterling weakens after the BoE opted to keep interest rates on hold at 5.25% for the fifth time in a row on Thursday. Investors considered that the BoE is slowly turning dovish as two policymakers – Catherine Mann and Jonathan Haskel –, who supported hiking interest rates further in February’s meeting, voted to keep rates unchanged.
- Eight out of nine policymakers voted for keeping interest rates unchanged, except for policymaker Swati Dhingra who supported a rate cut. This was the first time since September 2021 that no MPC member voted for a rate hike.
- In the monetary policy statement, the BoE said that inflation is moving in the right direction but it is not at a point where interest rates can be lowered. The expectations for the BoE reducing interest rates from August boosted after Governor Andrew Bailey said: “I think it's reasonable that markets are 'taking the view' of two or three cuts this year, but I won't comment on timing.”
- Regarding the economic outlook, BoE Bailey said the economy is returning to the growth path after remaining in a technical recession in the second half of 2023.
Technical Analysis: Pound Sterling tests 1.2600 after steep fall
Pound Sterling prints a fresh two-week low near 1.2600 on downbeat market mood. The near-term demand for the GBP/USD pair weakens as it has dropped below the 100-day Exponential Moving Average (EMA), which trades around 1.2635. The asset is expected to find a cushion near the horizontal support plotted from December 13 low at 1.2500.
The 14-period Relative Strength Index (RSI) falls to 40.00. A bearish momentum would trigger if the RSI drops further.
FX option expiries for Mar 22 NY cut at 10:00 Eastern Time, via DTCC, can be found below
- EUR/USD: EUR amounts
- 1.0800 962m
- 1.0835 2.3b
- 1.0850 1.5b
- 1.0875 1.8b
- 1.0900 2.2b
- 1.0950 1.1b
GBP/USD: GBP amounts
- 1.2690 798m
- 1.2750 547m
- USD/JPY: USD amounts
- 148.80 1.9b
- 149.55 1.1b
- 150.00 1.1b
- 151.00 1.3b
- 151.75 647m
- AUD/USD: AUD amounts
- 0.6500 1.1b
- 0.6550 874m
- 0.6650 1.7b
- 0.6750 2.6b
- 0.6825 2.6b
- USD/CAD: USD amounts
- 1.3370 1.1b
- 1.3500 2.2b
- 1.3520 65m
- NZD/USD: NZD amounts
- 0.6050 1.2b
EUR/USD extends its downside. Economists at ING analyze the pair’s outlook.
Manufacturing concerns deepen
Eurozone PMIs continued to paint a grim picture for the region’s manufacturing outlook. That is not hugely relevant for the FX market, anyway. The soft economic outlook in the Eurozone has been priced in for a while, and with markets relatively confident about a June European Central Bank cut (23 bps priced in), it’s mostly Dollar rate expectations that are set to keep moving EUR/USD.
It remains unlikely that the pair can enjoy a sustained recovery without a decline in USD rates, but Turhusday’s positive Dollar reaction to US data appeared overdone considering the recent narrative by the Fed, and we don’t feel EUR/USD should fall much further before bottoming out.
- EUR/GBP moves in the positive direction after recovering intraday losses on Friday.
- UK Retail Sales MoM printed 0.0% for February, against the expected decline of 0.3%.
- German Import Price Index MoM reported a flat 0.0% for January, contrary to the expected decline of 0.3%.
EUR/GBP trims its intraday losses and rises to near 0.8590 during the early European session on Friday. The cross remains in negative territory despite positive Retail Sales data from the United Kingdom (UK).
UK Retail Sales (Month-on-Month) for February showed no growth, printing a reading of 0.0%, compared to the expected decline of 0.3% and the 3.4% growth recorded in January. However, Core Retail Sales, which exclude auto and motor fuel sales, increased by 0.2% month-on-month, surpassing expectations of a 0.1% decline and maintaining the 3.2% growth seen in January.
BOE Governor Andrew Bailey has reiterated that rate cuts this year are within reason, stressing that all meetings are subject to consideration, with decisions made anew each time. He emphasized the importance of having confidence in the direction of wage growth and stated that waiting for inflation to drop to 2% before contemplating rate cuts is unnecessary. Bailey also expressed optimism about recent economic developments, viewing them as positive news.
On the other hand, the Euro faced downward pressure on the latest Purchasing Managers Index (PMI) survey by HCOB on Thursday revealing that the Eurozone Manufacturing PMI for March was 45.7, lower than the previous reading of 46.5, and below the consensus forecast of 47.0. However, the Services PMI improved to 51.1 in March from 50.2 in February, surpassing the estimated 50.5. The Eurozone PMI Composite rose to 49.9 in March, compared to the expected 49.7 and the previous reading of 46.3.
On Friday, the German Import Price Index (Month-on-Month) for January was reported as flat at 0.0%, contrary to the expected decline of 0.3% and the previous decline of 1.0%. The year-over-year figure indicated a decline of 5.9%, which was better than the expected decline of 7.4% and the previous decline of 7.0%.
Gold surged to a record high as the prospect of rate cuts from the Fed rose. Economists at ANZ Bank analyze the yellow metal’s outlook.
The Fed maintained its outlook for three rate cuts this year
The Fed maintained its outlook for three rate cuts this year at Wednesday’s FOMC meeting, suggesting it hasn’t been concerned with the recent uptick in inflation. This was a green light for investors, with holdings of Gold-backed ETFs recording strong inflows.
These flows have been absent in this year’s Gold prices rally, with other factors including heightened geopolitical risks and buying from central banks underpinning the gains. However, increased demand from Gold-backed ETFs suggests the current rally could be the start of something more sustainable.
- The UK Retail Sales stood at 0% MoM in February, a positive surprise.
- Core Retail Sales for the UK rose 0.2% MoM in February.
- GBP/USD keeps losses above 1.2600 despite upbeat UK data.
The UK Retail Sales showed no growth over the month in February vs. -0.3% expected and 3.6% registered in January, according to the latest data published by the Office for National Statistics (ONS) on Friday.
The Core Retail Sales, stripping the auto motor fuel sales, rose 0.2% MoM vs. -0.1% expected and 3.4% in January.
The annual Retail Sales in the United Kingdom dropped 0.4% in February versus -0.7% expected and January’s 0.5% while the Core Retail Sales also decreased by 0.5% in the reported month versus -0.9% forecast and 0.5% previous.
Market reaction to UK Retail Sales report
GBP/USD is keeping its downbeat tone intact near 1.2625, despite the upbeat UK Retail Sales data. The spot is trading 0.24% lower on the day.
- USD/CHF holds positive ground around 0.8990 in Friday’s early European session.
- The Swiss National Bank (SNB) announced a surprise rate cut to its key interest rate to 1.5% on Thursday.
- US S&P Global Manufacturing PMI came in stronger than expected, climbing to 52.5 in March vs. 52.2 prior.
The USD/CHF pair gains traction below the 0.9000 psychological barrier during the early European session on Friday. The Swiss Franc (CHF) has faced some selling pressure after the Swiss National Bank (SNB) cut its main interest rate by 25 basis points (bps) to 1.50% in a surprise move on Thursday. At the press time, USD/CHF is trading at 0.8990, adding 0.15% on the day.
The Swiss central bank decided to cut interest rates from 1.75% to 1.50% on Thursday, marking the first central bank to declare victory over inflation. Following the monetary policy meeting, SNB Chairman Thomas Jordan said that the easing of monetary policy was possible because the fight against inflation has been effective. The move comes after Swiss inflation fell to 1.2% in February, which remained below the SNB's 0-2% target range. That being said, a surprise rate cut from the SNB drags the CHF lower and creates a tailwind for the USD/CHF pair.
On the other hand, the US Federal Reserve (Fed) left its benchmark interest rate unchanged on Wednesday but retained its outlook for three rate cuts this year. Fed Chairman Jerome Powell stated that the upside surprises on US inflation data in January and February haven't changed the overall story that inflation is returning to its 2% target gradually on a somewhat bumpy road.
Data released on Thursday showed that the US S&P Global Manufacturing PMI came in stronger than expected, rising to 52.5 in March from 52.2 in February. Meanwhile, the Services PMI eased to 51.7 in March from 52.3 in February, weaker than the estimation of 52.0. Finally, the Composite PMI came in at 52.2 in March versus 52.5 prior.
Investors await Federal Reserve (Fed) Chair Jerome Powell’s speech on Friday, which might offer some hints about the inflation and monetary policy outlook. Next week, the Swiss ZEW Survey for March and the SNB Quarterly Bulletin for the first quarter (Q1) of 2024 will be released, along with the US Gross Domestic Product Annualized (GDP) for Q4.
- EUR/USD struggles to sustain above 1.0840 as investors turn risk-averse.
- SNB’s surprise rate cut move has prompted the ECB’s rate cut expectations.
- The major currency pair is on the verge of delivering a Descending Triangle breakdown.
The EUR/USD pair extends its downside to three-day low around 1.0840 in the late Asian session on Friday. The major currency pair is expected to witness as appeal for safe-haven assets improve after the Swiss National Bank (SNB) surprisingly cut interest rates by 25 basis points (bps) to 1.50% on Thursday.
A surprise rate cut by the SNB has prompted hopes that inflation is getting under control and other central banks will follow its footprints. This has underscored the demand of the US Dollar as the Federal Reserve (Fed) has revised higher forecast for the annual core Personal Consumption Expenditure Price Index (PCE) to 2.6% from prior estimates of 2.4% for 2024 in its latest economic projections. The US Dollar Index (DXY) rises to a fresh two-week high around 104.20 and recovers its post-Fed policy losses.
Meanwhile, the Euro come under pressure as market expectations for the European Central Bank (ECB) lowering interest rates in the June meeting have boosted by SNB’s surprise rate cut. The pace at which the Eurozone’s inflation is decelerating is higher than the US economy, strengthening hopes for ECB reducing rates aggressively than the Federal Reserve (Fed).
EUR/USD is on the verge of delivering a breakdown of the Descending Triangle pattern formed on a four-hour timeframe. The asset hovers near the horizontal support of the aforementioned chart pattern plotted from March 5 low at 1.0840 while the downward-sloping border is placed from March 8 high at 1.0981.
The near-term demand is downbeat as it is trading below the 50-period Exponential Moving Average (EMA), which trades around 1.0886.
The 14-period Relative Strength Index (RSI) shifts into the bearish range of 20.00-40.00, which indicates a bearish momentum.
EUR/USD four-hour chart
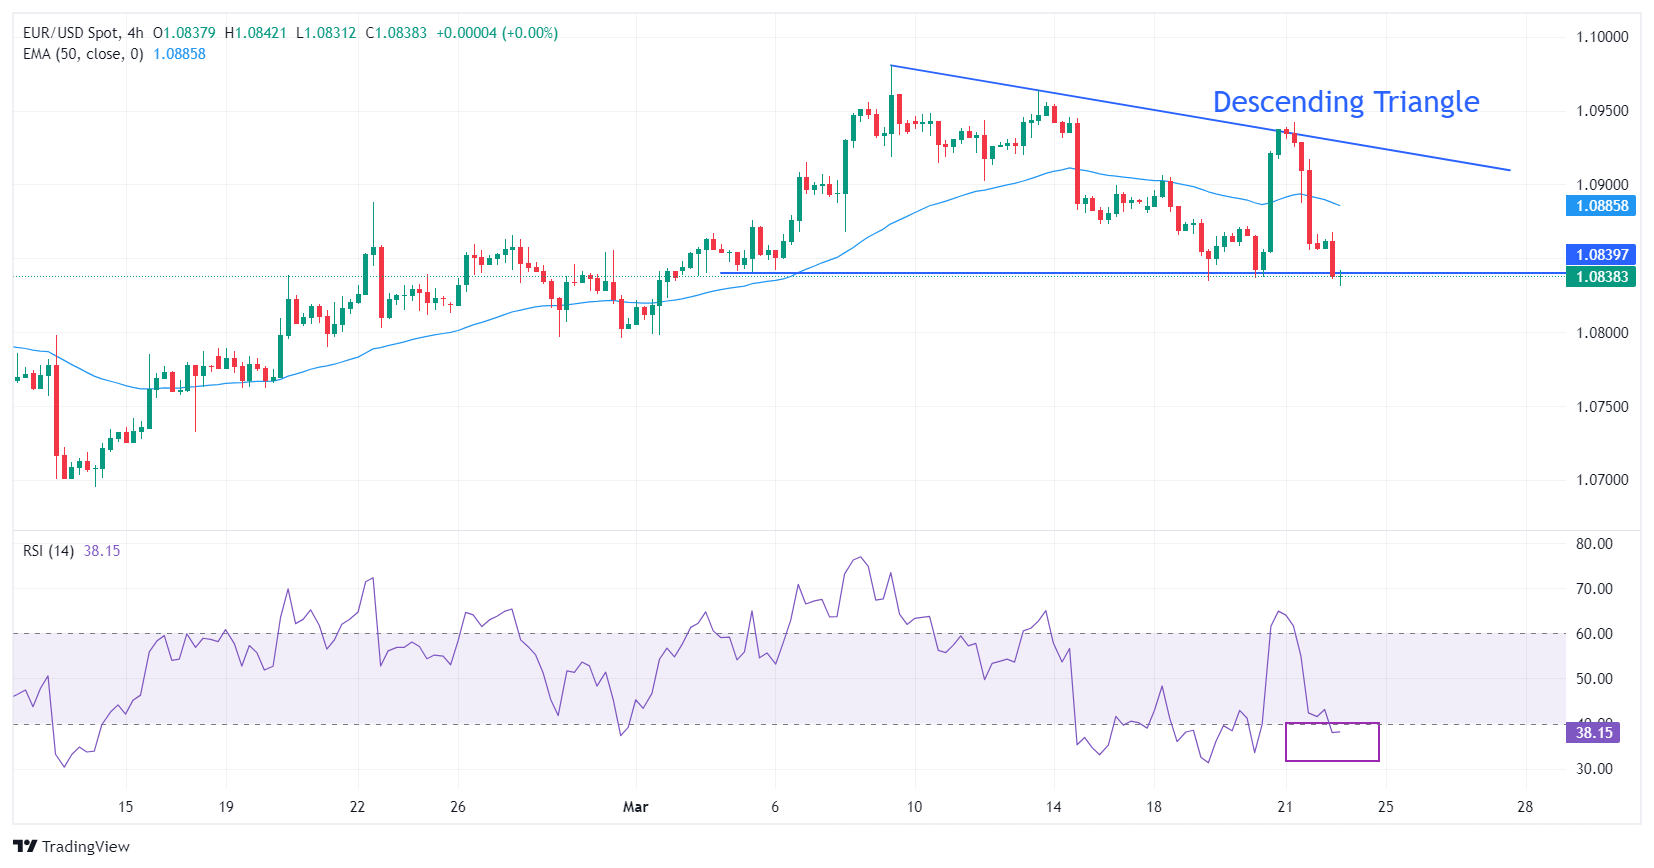
The Bank of England (BoE) governor Andrew Bailey indicated on Friday that markets can anticipate more than one interest rate cut this year, saying he is increasingly confident inflation is heading towards the target, per the Financial Times.
Key quotes
“All our meetings are in play, we take a fresh decision each time.”
“The global shocks are unwinding and we are not seeing a lot of sticky persistence coming through at the moment. That is the judgment we have to keep coming back to.”
“Need to have confidence that wages are heading in the right direction.”
“Don't need to wait for inflation to drop to 2% before cutting rates.”
“Recent economic developments are obviously good news.”
“The job on inflation is not done but what we are seeing is encouraging.”
Market reaction
At the time of writing, GBP/USD is trading at 1.2636, losing 0.19% on the day.
BoE FAQs
The Bank of England (BoE) decides monetary policy for the United Kingdom. Its primary goal is to achieve ‘price stability’, or a steady inflation rate of 2%. Its tool for achieving this is via the adjustment of base lending rates. The BoE sets the rate at which it lends to commercial banks and banks lend to each other, determining the level of interest rates in the economy overall. This also impacts the value of the Pound Sterling (GBP).
When inflation is above the Bank of England’s target it responds by raising interest rates, making it more expensive for people and businesses to access credit. This is positive for the Pound Sterling because higher interest rates make the UK a more attractive place for global investors to park their money. When inflation falls below target, it is a sign economic growth is slowing, and the BoE will consider lowering interest rates to cheapen credit in the hope businesses will borrow to invest in growth-generating projects – a negative for the Pound Sterling.
In extreme situations, the Bank of England can enact a policy called Quantitative Easing (QE). QE is the process by which the BoE substantially increases the flow of credit in a stuck financial system. QE is a last resort policy when lowering interest rates will not achieve the necessary result. The process of QE involves the BoE printing money to buy assets – usually government or AAA-rated corporate bonds – from banks and other financial institutions. QE usually results in a weaker Pound Sterling.
Quantitative tightening (QT) is the reverse of QE, enacted when the economy is strengthening and inflation starts rising. Whilst in QE the Bank of England (BoE) purchases government and corporate bonds from financial institutions to encourage them to lend; in QT, the BoE stops buying more bonds, and stops reinvesting the principal maturing on the bonds it already holds. It is usually positive for the Pound Sterling.
- AUD/JPY attracts some sellers to 98.90 in Friday’s early European session.
- Japan’s CPI inflation data rose to 2.8% YoY in February from 2.2% in January, which remains above the BoJ’s target.
- Australia added 116.5K new employees in February, up from 15.3K in January.
The AUD/JPY cross faces some selling pressure around the 99.00 mark during the early European session on Friday. The uptick in Japanese Consumer Price Index (CPI) inflation data provides some support to the Japanese Yen (JPY) and weighs on the AUD/JPY. Investors will take more cues from the Australian monthly CPI next week. AUD/JPY currently trades near 98.98, down 0.63%.
The recent data from the Japan Statistics Bureau on Friday revealed that the nation’s CPI inflation data for February climbed to 2.8% YoY from 2.2% in January. This figure remains well above the Bank of Japan’s (BoJ) 2% target, boosting the JPY against the Australian Dollar on Friday. Furthermore, the Core CPI, which excludes volatile fresh food prices, rose to 2.8% in February from 2.0% in the previous month, in line with market expectations.
On the Aussie front, the Australian Bureau of Statistics reported on Thursday that Australia added 116.5K new employees in February from 15.3K in the previous month. Meanwhile, the Unemployment Rate fell to 3.7% in February from 4.1% in January, stronger than the market expectation of 4.0%.
Next week, the market players will monitor the Australian monthly CPI and Retail Sales for February. On the Japanese docket, Tokyo CPI for March will be a closely watched event. Traders will take cues from these events and find trading opportunities around the AUD/JPY cross.
- NZD/USD pair loses ground after mixed PMI data from the United States.
- US Dollar strengthens despite lower US Treasury yields.
- New Zealand's Trade Balance improved to $-11.99 billion.
NZD/USD continues to lose ground on the second consecutive session on a stronger US Dollar (USD), which could be attributed to mixed data from the United States (US). The NZD/USD pair inches lower to near 0.6020 during the Asian trading hours on Friday.
The S&P Global Services PMI exhibited a slight decline in March, dropping to 51.7 from 52.3, slightly below the expected reading of 52.0. Conversely, the Manufacturing PMI increased to 52.5, surpassing expectations of 51.7 and the previous figure of 52.2. However, the Composite PMI showed a slight dip to 52.2 from the previous 52.5.
The US Dollar Index (DXY) is continuing to strengthen despite lower US Treasury yields. However, the US Dollar has encountered challenges due to the Federal Reserve's (Fed) reaffirmation of expectations for three interest rate cuts in 2024. The prevailing consensus indicates the initiation of an easing cycle in June, with the timing of subsequent cuts dependent on incoming data.
In February, New Zealand's Trade Balance improved to $-11.99 billion year-on-year, compared to the previous figure of $-12.62 billion. Both exports and imports witnessed an increase, rebounding from a minor decline observed in January. Exports surged to $5.89 billion from $4.81 billion, while imports rose to $6.11 billion from $5.9 billion.
Moreover, there are emerging hopes that the Reserve Bank of New Zealand (RBNZ) might consider cutting its official cash rate this year, rather than waiting until next year, in response to an unexpected recession in Q4 of 2023.
- WTI drifts lower for the third straight day amid hopes for a ceasefire in Gaza.
- Expectations for tightening global supply should help limit any further losses.
- The fundamental backdrop warrants caution for aggressive bearish traders.
West Texas Intermediate (WTI) US Crude Oil prices remain under some selling pressure for the third successive day on Friday and trades near the weekly low, around the $80.30 region during the Asian session.
US Secretary of State Antony Blinken said that gaps are narrowing in the ongoing talks aimed at reaching a ceasefire in Gaza and the release of hostages, easing concerns about supply disruptions in the Middle East. This, along with some follow-through US Dollar (USD) buying, bolstered by the optimistic US economic outlook, turn out to be key factors exerting downward pressure on USD-denominated commodities, including Crude Oil prices. The downside, however, seems cushioned in the wake of worries about tightening global supply.
Ukrainian drone strikes on Russian oil refineries could lead to lower fuel production by the latter. This comes on top of the OPEC+ members' decision to extend the production cuts of 2.2 million barrels per day through the second quarter and the International Energy Agency's upward revision of the 2024 oil demand growth. Furthermore, a stronger US economy and a potential recovery in China add to expectations of tighter supplies. This could act as a tailwind for Crude Oil prices and warrants some caution for bearish traders.
- Gold price edges lower on Friday amid some follow-through US Dollar buying interest.
- The Fed’s projected three rate cuts in 2024 will likely cap the USD and limit losses for the metal.
- Traders look forward to Fed Chair Jerome Powell’s speech for short-term opportunities.
Gold price (XAU/USD) struggles to capitalize on the overnight late bounce from the 100-hour Simple Moving Average (SMA) support near the $2,166-2,165 area and edges lower during the Asian session on Friday. As investors looked past the Federal Reserve's (Fed) policy update on Wednesday, the US Dollar (USD) made a solid comeback in the wake of the optimism around the US economic growth. This, along with elevated US Treasury bond yields and the prevalent risk-on environment, are key factors exerting some downward pressure on the safe-haven precious metal.
The downside for the Gold price, however, seems cushioned amid a less restrictive policy stance by the Fed, signalling that it remains on track to cut interest rates by 75 basis points this year. The outlook keeps a lid on any further rise in the US bond yields, which might hold back the USD bulls from placing fresh bets and act as a tailwind for the non-yielding yellow metal. This makes it prudent to wait for strong follow-through selling before confirming that the XAU/USD has topped out in the near term as traders now look to Fed Chair Jerome Powell's scheduled speech for a fresh impetus.
Daily Digest Market Movers: Gold price is pressured by modest USD strength; Fed rate cut bets to lend support
- The US Dollar looks to build on the previous day's strong recovery from a one-week low touched in the aftermath of the FOMC decision and is seen undermining the Gold price on Friday.
- The Federal Reserve upgraded its economic growth projection and now sees real GDP to hit 2.1% by the end of this year as compared to the previous estimate of 1.4% in December.
- Moreover, policymakers raised the forecast for core inflation to 2.6% from 2.4% and now see the unemployment rate at 4% for 2024, slightly lower than the 4.1% previously projected.
- The outlook remains supportive of elevated US Treasury bond yields and is seen acting as a tailwind for the USD, though the projected less restrictive policy might cap the upside.
- On the economic data front, the US Department of Labor (DOL) reported on Thursday that Initial Jobless Claims fell to 210K in the week ending March 16 from the 212K previous.
- US Secretary of State Antony Blinken said that gaps are narrowing in the ongoing talks aimed at reaching a ceasefire in Gaza and the release of hostages, boosting investors' confidence.
- Fed Chair Jerome Powell's speech later during the early North American session will be looked for more cues about future policy decisions and provide a fresh impetus to the XAU/USD.
Technical Analysis: Gold price is likely to find decent support near the weekly swing low, around the $2,146 area
From a technical perspective, some follow-through selling below the overnight swing low, around the $2,166 area, or the 100-hour SMA, might expose the $2,146 support or the weekly trough. A convincing break below the latter could drag the Gold price further towards the next relevant support near the $2,128-2,127 zone en route to the $2,100 round figure.
On the flip side, the $2,200 psychological mark now seems to act as an immediate hurdle, above which bulls might aim to challenge the record high, around the $2,223 zone touched on Thursday. Meanwhile, the Relative Strength Index (RSI) on the daily chart – though has eased from higher levels – is still flashing overbought conditions and warrants caution.
Gold FAQs
Gold has played a key role in human’s history as it has been widely used as a store of value and medium of exchange. Currently, apart from its shine and usage for jewelry, the precious metal is widely seen as a safe-haven asset, meaning that it is considered a good investment during turbulent times. Gold is also widely seen as a hedge against inflation and against depreciating currencies as it doesn’t rely on any specific issuer or government.
Central banks are the biggest Gold holders. In their aim to support their currencies in turbulent times, central banks tend to diversify their reserves and buy Gold to improve the perceived strength of the economy and the currency. High Gold reserves can be a source of trust for a country’s solvency. Central banks added 1,136 tonnes of Gold worth around $70 billion to their reserves in 2022, according to data from the World Gold Council. This is the highest yearly purchase since records began. Central banks from emerging economies such as China, India and Turkey are quickly increasing their Gold reserves.
Gold has an inverse correlation with the US Dollar and US Treasuries, which are both major reserve and safe-haven assets. When the Dollar depreciates, Gold tends to rise, enabling investors and central banks to diversify their assets in turbulent times. Gold is also inversely correlated with risk assets. A rally in the stock market tends to weaken Gold price, while sell-offs in riskier markets tend to favor the precious metal.
The price can move due to a wide range of factors. Geopolitical instability or fears of a deep recession can quickly make Gold price escalate due to its safe-haven status. As a yield-less asset, Gold tends to rise with lower interest rates, while higher cost of money usually weighs down on the yellow metal. Still, most moves depend on how the US Dollar (USD) behaves as the asset is priced in dollars (XAU/USD). A strong Dollar tends to keep the price of Gold controlled, whereas a weaker Dollar is likely to push Gold prices up.
- Indian Rupee loses traction on Friday on the softer USD, and lower US bond yields.
- The positive outlook in the Indian economy might boost the INR and cap the pair’s upside.
- Investors await Fed Chair Jerome Powell’s speech on Friday for fresh impetus.
Indian Rupee (INR) weakens on Friday amid the rise of the US dollar (USD) and higher US Treasury bond yields. According to the HSBC Flash India PMI, India's business activity ended the fiscal year on a good note, expanding at its fastest pace in eight months in March. This improvement in data suggests India is likely to continue its position as the fastest-growing major economy, which might boost the INR and cap the upside of the pair.
Investors will take more cues from Fed Chair Jerome Powell’s speech on Friday. Next week, attention will shift to the US Gross Domestic Product Annualized (GDP) for the fourth quarter (Q4), which is forecast to remain steady at 3.2%.
Daily Digest Market Movers: Indian Rupee remains vulnerable amid the uncertainties
- India's Flash HSBC Manufacturing Purchasing Managers' Index (PMI) came in at 59.2 versus 56.9 prior. The Services PMI arrived at 60.3 in March, versus 60.6 in the previous reading.
- The US S&P Global Manufacturing PMI rose to 52.5 in March from 52.2 in February, above the estimation of 51.7. The Services PMI eased to 51.7 in March from the previous reading of 52.3. The Composite PMI arrived at 52.2 in March versus 52.5 prior.
- The US weekly Initial Jobless Claims for the week ending March 15 dropped 2,000 to 210K from 212K in the previous week.
- The Fed held the rate steady at 5.25–5.50% at its March meeting on Wednesday, with the median dot plot for 2024 unchanged from the 75 basis points (bps) of cuts shown in the December projections.
- Fed chair Jerome Powell said on Wednesday that the upside surprises on US inflation data in January and February haven't changed the overall story that inflation is heading down gradually, on a somewhat bumpy road.
Technical Analysis: Indian Rupee will resume its bearish trend on a daily close above a longer-term range
Indian Rupee trades weaker on the day. USD/INR breaks above a multi-month-old descending trend channel around 82.60–83.15 since December 8, 2023. A daily close above the latter will confirm the positive outlook of the pair in the long term.
In the near term, USD/INR keeps the bullish vibe unchanged as the pair holds above the key 100-day Exponential Moving Average (EMA) on the daily timeframe. However, the overbought RSI condition indicates that further consolidation cannot be ruled out before positioning for any near-term USD/INR appreciation.
The immediate resistance level will emerge near a high of January 2 at 83.35. Further north, the pair might attract some buyers to an all-time high of 83.49, followed by the 84.00 psychological level. On the downside, the key contention level is located near the 100-day EMA and round figure of the 83.00 mark. The additional downside filter to watch is a low of March 14 at 82.80, en route to the lower limit of the descending trend channel at 82.60.
US Dollar price today
The table below shows the percentage change of US Dollar (USD) against listed major currencies today. US Dollar was the strongest against the Australian Dollar.
| USD | EUR | GBP | CAD | AUD | JPY | NZD | CHF | |
| USD | 0.22% | 0.19% | 0.24% | 0.58% | 0.00% | 0.50% | 0.19% | |
| EUR | -0.22% | -0.03% | 0.04% | 0.35% | -0.22% | 0.27% | -0.03% | |
| GBP | -0.19% | 0.03% | 0.07% | 0.39% | -0.19% | 0.32% | 0.00% | |
| CAD | -0.25% | -0.03% | -0.05% | 0.35% | -0.25% | 0.25% | -0.05% | |
| AUD | -0.58% | -0.37% | -0.41% | -0.34% | -0.58% | -0.08% | -0.40% | |
| JPY | 0.00% | 0.22% | 0.19% | 0.26% | 0.56% | 0.49% | 0.19% | |
| NZD | -0.51% | -0.28% | -0.33% | -0.25% | 0.08% | -0.50% | -0.32% | |
| CHF | -0.19% | 0.04% | 0.01% | 0.07% | 0.40% | -0.19% | 0.31% |
The heat map shows percentage changes of major currencies against each other. The base currency is picked from the left column, while the quote currency is picked from the top row. For example, if you pick the Euro from the left column and move along the horizontal line to the Japanese Yen, the percentage change displayed in the box will represent EUR (base)/JPY (quote).
Indian Rupee FAQs
The Indian Rupee (INR) is one of the most sensitive currencies to external factors. The price of Crude Oil (the country is highly dependent on imported Oil), the value of the US Dollar – most trade is conducted in USD – and the level of foreign investment, are all influential. Direct intervention by the Reserve Bank of India (RBI) in FX markets to keep the exchange rate stable, as well as the level of interest rates set by the RBI, are further major influencing factors on the Rupee.
The Reserve Bank of India (RBI) actively intervenes in forex markets to maintain a stable exchange rate, to help facilitate trade. In addition, the RBI tries to maintain the inflation rate at its 4% target by adjusting interest rates. Higher interest rates usually strengthen the Rupee. This is due to the role of the ‘carry trade’ in which investors borrow in countries with lower interest rates so as to place their money in countries’ offering relatively higher interest rates and profit from the difference.
Macroeconomic factors that influence the value of the Rupee include inflation, interest rates, the economic growth rate (GDP), the balance of trade, and inflows from foreign investment. A higher growth rate can lead to more overseas investment, pushing up demand for the Rupee. A less negative balance of trade will eventually lead to a stronger Rupee. Higher interest rates, especially real rates (interest rates less inflation) are also positive for the Rupee. A risk-on environment can lead to greater inflows of Foreign Direct and Indirect Investment (FDI and FII), which also benefit the Rupee.
Higher inflation, particularly, if it is comparatively higher than India’s peers, is generally negative for the currency as it reflects devaluation through oversupply. Inflation also increases the cost of exports, leading to more Rupees being sold to purchase foreign imports, which is Rupee-negative. At the same time, higher inflation usually leads to the Reserve Bank of India (RBI) raising interest rates and this can be positive for the Rupee, due to increased demand from international investors. The opposite effect is true of lower inflation.
- Australian Dollar extends losses amid an improved US Dollar on Friday.
- The decline in the ASX 200 could have undermined the Australian Dollar.
- S&P Global Manufacturing PMI rose to 52.5 against the expected 51.7 and 52.2 prior.
The Australian Dollar (AUD) depreciates for the second consecutive session on Friday, as the US Dollar (USD) strengthened following mixed S&P preliminary Purchasing Managers Index (PMI) data and robust weekly Jobless Claims from the United States (US).
Australian Dollar receives downward pressure from the decline in the ASX 200 Index. The Australian equity market experienced losses, particularly in energy and consumer stocks, despite the positive performance on Wall Street, where all three major benchmarks set record highs.
The US Dollar Index (DXY) continues to extend its gains despite lower US Treasury yields. However, the US Dollar faced challenges due to the Federal Reserve's (Fed) reaffirmation of expectations for three interest rate cuts in 2024. The prevailing consensus suggests the start of an easing cycle in June, with the timing of the next cut contingent upon incoming data.
Daily Digest Market Movers: Australian Dollar depreciates on weaker ASX 200 Index
- Australian Employment Change for February surged to 116.5K, surpassing expectations of 40.0K and the previous figure of 15.3K.
- Australia’s Unemployment Rate increased by 3.7%, lower than the anticipated 4.0% and the previous 4.1%.
- The preliminary Judo Bank Services PMI rose to 53.5, up from the previous figure of 53.1. Composite PMI showed a slight increase, reaching 52.4 compared to the previous 52.1.
- People’s Bank of China (PBoC) has kept its interest rate unchanged at 3.45%.
- Federal Open Market Committee (FOMC) maintained interest rates at 5.5% during Wednesday's policy meeting. The remarks made by US Federal Reserve (Fed) Chair Jerome Powell in the post-meeting press conference, signaling a dovish stance, exerted additional downward pressure on the Greenback.
- S&P Global Services PMI showed a slight decrease in March, dropping to 51.7 from 52.3. The expected reading was 52.0. Manufacturing PMI rose to 52.5 against the expected 51.7 and 52.2 prior. Composite PMI showed a slight dip to 52.2 from 52.5 prior.
- Initial Jobless Claims for the week ending on March 15 came in at 210K, below the 215K expected and 212K prior.
- US Building Permits (MoM) increased to 1.518 million in February, against the expected 1.495 million and 1.489 million prior.
- US Housing Starts (MoM) rose to 1.521M from the previous figure of 1.374M, exceeding the market expectation of 1.425M in February.
- The preliminary US Michigan Consumer Sentiment Index for March decreased to 76.5 from 76.9. This decline contrasts with expectations of it remaining unchanged.
Technical Analysis: Australian Dollar falls to near 0.6540 followed by 61.8% Fibonacci
The Australian Dollar trades near 0.6540 on Friday. The immediate support appears at the 61.8% Fibonacci retracement level of 0.6528. A break below this level could lead the AUD/USD pair to test the support area around the weekly low at 0.6503 and the psychological level of 0.6500. On the upside, an immediate resistance level stands at 0.6550. A breakthrough above the latter could exert upward support for the AUD/USD pair to explore the psychological region around 0.6600, followed by the weekly high at 0.6634 level.
AUD/USD: Daily Chart
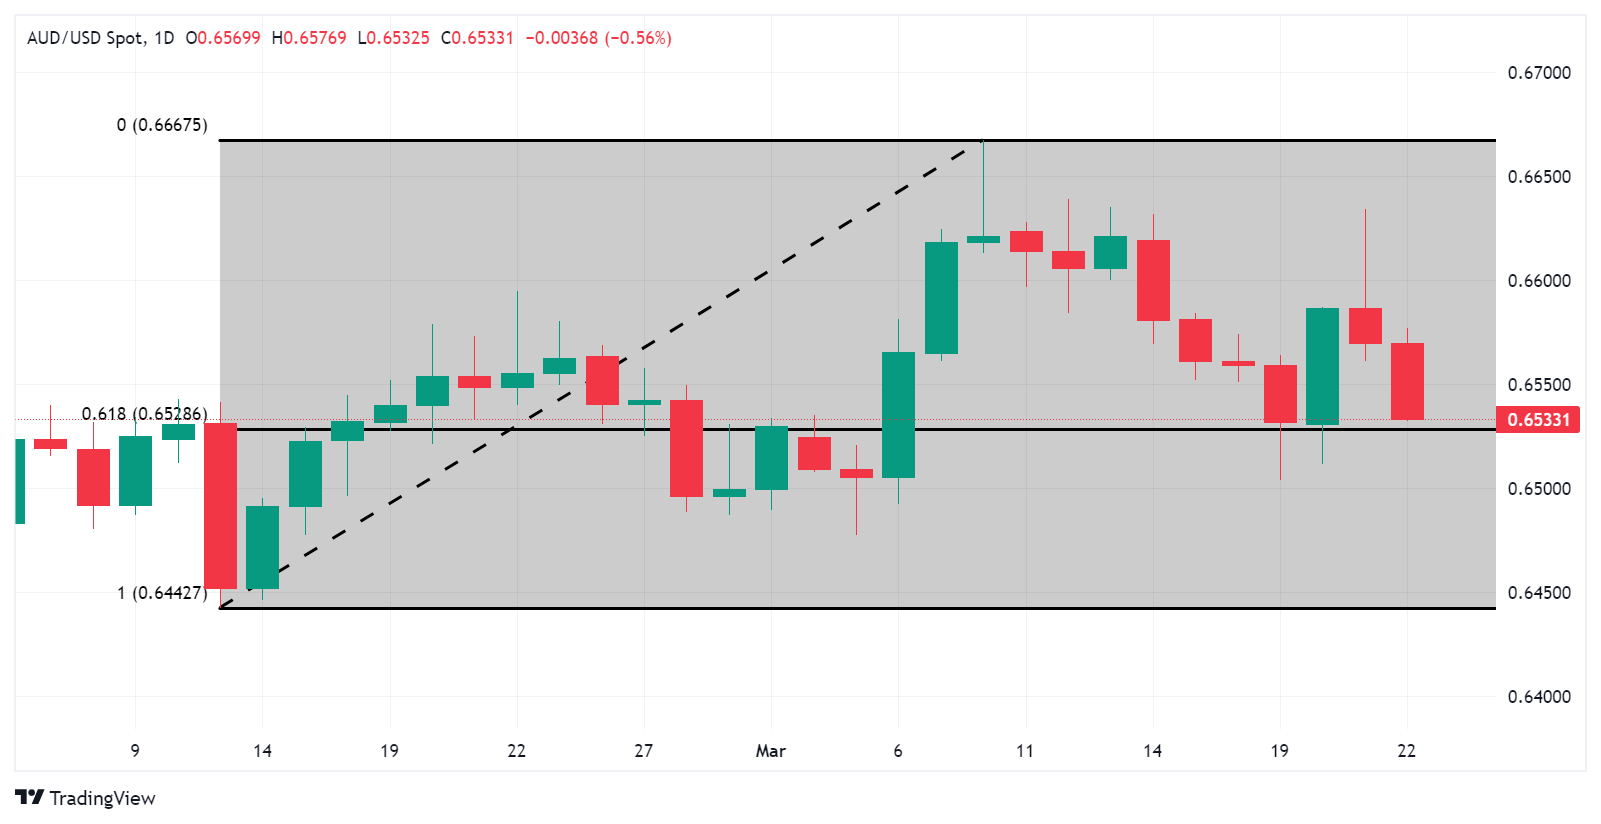
Australian Dollar price today
The table below shows the percentage change of Australian Dollar (AUD) against listed major currencies today. Australian Dollar was the weakest against the Japanese Yen.
| USD | EUR | GBP | CAD | AUD | JPY | NZD | CHF | |
| USD | 0.15% | 0.14% | 0.20% | 0.56% | -0.01% | 0.42% | 0.18% | |
| EUR | -0.15% | -0.01% | 0.07% | 0.43% | -0.16% | 0.30% | 0.03% | |
| GBP | -0.15% | 0.01% | 0.08% | 0.44% | -0.15% | 0.32% | 0.03% | |
| CAD | -0.22% | -0.07% | -0.06% | 0.36% | -0.23% | 0.20% | -0.03% | |
| AUD | -0.56% | -0.43% | -0.45% | -0.38% | -0.59% | -0.13% | -0.41% | |
| JPY | 0.01% | 0.16% | 0.15% | 0.23% | 0.57% | 0.43% | 0.18% | |
| NZD | -0.42% | -0.30% | -0.32% | -0.23% | 0.14% | -0.46% | -0.28% | |
| CHF | -0.18% | -0.02% | -0.03% | 0.05% | 0.41% | -0.19% | 0.28% |
The heat map shows percentage changes of major currencies against each other. The base currency is picked from the left column, while the quote currency is picked from the top row. For example, if you pick the Euro from the left column and move along the horizontal line to the Japanese Yen, the percentage change displayed in the box will represent EUR (base)/JPY (quote).
Australian Dollar FAQs
One of the most significant factors for the Australian Dollar (AUD) is the level of interest rates set by the Reserve Bank of Australia (RBA). Because Australia is a resource-rich country another key driver is the price of its biggest export, Iron Ore. The health of the Chinese economy, its largest trading partner, is a factor, as well as inflation in Australia, its growth rate and Trade Balance. Market sentiment – whether investors are taking on more risky assets (risk-on) or seeking safe havens (risk-off) – is also a factor, with risk-on positive for AUD.
The Reserve Bank of Australia (RBA) influences the Australian Dollar (AUD) by setting the level of interest rates that Australian banks can lend to each other. This influences the level of interest rates in the economy as a whole. The main goal of the RBA is to maintain a stable inflation rate of 2-3% by adjusting interest rates up or down. Relatively high-interest rates compared to other major central banks support the AUD, and the opposite for relatively low. The RBA can also use quantitative easing and tightening to influence credit conditions, with the former AUD-negative and the latter AUD-positive.
China is Australia’s largest trading partner so the health of the Chinese economy is a major influence on the value of the Australian Dollar (AUD). When the Chinese economy is doing well it purchases more raw materials, goods and services from Australia, lifting demand for the AUD, and pushing up its value. The opposite is the case when the Chinese economy is not growing as fast as expected. Positive or negative surprises in Chinese growth data, therefore, often have a direct impact on the Australian Dollar and its pairs.
Iron Ore is Australia’s largest export, accounting for $118 billion a year according to data from 2021, with China as its primary destination. The price of Iron Ore, therefore, can be a driver of the Australian Dollar. Generally, if the price of Iron Ore rises, AUD also goes up, as aggregate demand for the currency increases. The opposite is the case if the price of Iron Ore falls. Higher Iron Ore prices also tend to result in a greater likelihood of a positive Trade Balance for Australia, which is also positive of the AUD.
The Trade Balance, which is the difference between what a country earns from its exports versus what it pays for its imports, is another factor that can influence the value of the Australian Dollar. If Australia produces highly sought after exports, then its currency will gain in value purely from the surplus demand created from foreign buyers seeking to purchase its exports versus what it spends to purchase imports. Therefore, a positive net Trade Balance strengthens the AUD, with the opposite effect if the Trade Balance is negative.
| Raw materials | Closed | Change, % |
|---|---|---|
| Silver | 24.737 | -3.26 |
| Gold | 2181.026 | -0.26 |
| Palladium | 1009.57 | -1.2 |
Bank of Japan Governor Kazuo Ueda said on Friday that the central bank’s “Japanese government bond (JGB) holdings will remain at current levels for the time being.”
On Thursday, the BoJ Governor noted that he expects to maintain an accommodative monetary policy for the time being, fuelling a bout of intense selling in the Japanese Yen.
Market reaction
At the time of writing, USD/JPY is trading 0.07% higher on the day at 151.71, slightly off the year-to-date (YTD) highs.
Bank of Japan FAQs
The Bank of Japan (BoJ) is the Japanese central bank, which sets monetary policy in the country. Its mandate is to issue banknotes and carry out currency and monetary control to ensure price stability, which means an inflation target of around 2%.
The Bank of Japan has embarked in an ultra-loose monetary policy since 2013 in order to stimulate the economy and fuel inflation amid a low-inflationary environment. The bank’s policy is based on Quantitative and Qualitative Easing (QQE), or printing notes to buy assets such as government or corporate bonds to provide liquidity. In 2016, the bank doubled down on its strategy and further loosened policy by first introducing negative interest rates and then directly controlling the yield of its 10-year government bonds.
The Bank’s massive stimulus has caused the Yen to depreciate against its main currency peers. This process has exacerbated more recently due to an increasing policy divergence between the Bank of Japan and other main central banks, which have opted to increase interest rates sharply to fight decades-high levels of inflation. The BoJ’s policy of holding down rates has led to a widening differential with other currencies, dragging down the value of the Yen.
A weaker Yen and the spike in global energy prices have led to an increase in Japanese inflation, which has exceeded the BoJ’s 2% target. Still, the Bank judges that the sustainable and stable achievement of the 2% target has not yet come in sight, so any sudden change in the current policy looks unlikely.
- The Japanese Yen edges higher following the release of Japanese consumer inflation data.
- The uncertainty over the BoJ’s future policy steps keeps a lid on any further positive move.
- A modest US Dollar downtick exerts some pressure, though the downside remains limited.
The Japanese Yen (JPY) witnessed a dramatic intraday turnaround on Thursday and dived back closer to the YTD low touched the previous day, albeit it lacked follow-through amid the uncertainty over the Bank of Japan's (BoJ) future policy steps. In fact, the central bank indicated earlier this week that financial conditions would remain accommodative and fell short of offering any guidance about the pace of policy normalization. That said, a Bank of Japan source told the Nikkei newspaper that an early rate hike leaves room to consider rolling out another increase before the end of the year.
Moreover, data released this Friday showed that consumer inflation in Japan remains well above the BoJ's 2% annual target. Adding to this, the positive outcome of Japan’s spring wage negotiations indicated that most firms have agreed to the trade unions' wage rise demands, which is expected to push up inflation in the coming months and support prospects for further policy tightening by the BoJ. This, in turn, assists the JPY in attracting some dip-buying during the Asian session amid speculations that Japanese authorities will intervene in the markets to prop up the domestic currency.
The US Dollar (USD), on the other hand, ticks lower during the Asian session and erodes a part of the previous day's move up, which, in turn, is seen as another factor that exerts downward pressure on the USD/JPY pair. Meanwhile, investors seem to have digested the Federal Reserve's (Fed) less restrictive policy projection on Wednesday. This keeps the US Treasury bond yields elevated, which favours the USD bulls and warrants some caution before positioning for any meaningful depreciating move for the currency pair ahead of Fed Chair Jerome Powell's scheduled speech later this Friday.
Daily Digest Market Movers: Japanese Yen struggles to lure buyers despite a rise in domestic consumer inflation
- Japan Consumer Price Index rose from the 2.2% YoY rate to 2.8% in February and remains well above the Bank of Japan's 2% target, lending some support to the Japanese Yen on the last day of the week.
- The Core CPI, which excludes volatile fresh food prices, picked up sharply from the 2% annualized pace seen in January and rose to 2.8% during the reported month, broadly in line with market expectations.
- Meanwhile, the so-called “core core” index that strips away both fresh food and energy prices eased further from the 40-year high touched in 2023 and came in at 3.2% in February as compared to the 3.5% previous.
- This comes on top of a much-stronger-than-expected pay hike by major Japanese firms, which is expected to fuel demand-driven inflation and should allow the BoJ to tighten its monetary policy further.
- Japan's Finance Minister Shunichi Suzuki reiterated that the government is watching FX moves with a high sense of urgency and important for currency exchange rates to move stable reflecting fundamentals.
- Despite the Federal Reserve's projected three rate cuts this year, elevated US Treasury bond yields helped the US Dollar to regain positive traction on Thursday and should lend support to the USD/JPY pair.
- The US Department of Labor (DOL) reported that there were 210K Initial Jobless Claims during the week ending March 16 as compared to the previous week's print of 212K and better than the 215K expected.
- Market participants now look forward to Fed Chair Jerome Powell's scheduled speech later during the early North American session for some meaningful impetus and short-term trading opportunities.
Technical Analysis: USD/JPY remains close to multi-decade high set in November 2022; bullish potential intact
From a technical perspective, the overnight strong intraday rise stalled near the 151.75 zone, just ahead of the YTD peak set on Wednesday. This is followed by the multi-decade high, around the 152.00 mark touched in October 2022, which if cleared decisively will be seen as a fresh trigger for bullish traders. The USD/JPY pair might then build on its longer-term uptrend witnessed since January 2023.
On the flip side, any meaningful corrective decline now seems to find decent support near the 151.00 mark, below which spot prices could slide back to the 150.25 region. Some follow-through selling, leading to a subsequent break through the 150.00 psychological mark, might expose the next relevant support near the 149.35-149.30 region. The USD/JPY pair could eventually drop to the 149.00 round-figure mark.
Japanese Yen FAQs
The Japanese Yen (JPY) is one of the world’s most traded currencies. Its value is broadly determined by the performance of the Japanese economy, but more specifically by the Bank of Japan’s policy, the differential between Japanese and US bond yields, or risk sentiment among traders, among other factors.
One of the Bank of Japan’s mandates is currency control, so its moves are key for the Yen. The BoJ has directly intervened in currency markets sometimes, generally to lower the value of the Yen, although it refrains from doing it often due to political concerns of its main trading partners. The current BoJ ultra-loose monetary policy, based on massive stimulus to the economy, has caused the Yen to depreciate against its main currency peers. This process has exacerbated more recently due to an increasing policy divergence between the Bank of Japan and other main central banks, which have opted to increase interest rates sharply to fight decades-high levels of inflation.
The BoJ’s stance of sticking to ultra-loose monetary policy has led to a widening policy divergence with other central banks, particularly with the US Federal Reserve. This supports a widening of the differential between the 10-year US and Japanese bonds, which favors the US Dollar against the Japanese Yen.
The Japanese Yen is often seen as a safe-haven investment. This means that in times of market stress, investors are more likely to put their money in the Japanese currency due to its supposed reliability and stability. Turbulent times are likely to strengthen the Yen’s value against other currencies seen as more risky to invest in.
- ASX 200 Index snaps its winning streak, following losses in energy and consumer stocks.
- The shutdown of South32's GEMCO led to Jupiter Mines share rallying almost 20% in the last two sessions.
- Apple's stock declined by 4.1% following news of a lawsuit from the US Department of Justice for alleged monopolistic practices.
The ASX 200 Index edges lower to near 7,750, down by approximately 0.16% on Friday, snapping its winning streak that began on March 15. The index's downturn was primarily attributed to losses in energy and consumer stocks. The A-VIX has experienced a sharp decline, dropping by 0.92% to 12.92. Additionally, the All Ordinaries Index is down by 0.32%, currently standing at 8,019.
In the ASX 200 Index, Genesis Minerals experienced a significant decline, plunging to 1.792, marking a decrease of 7.45%. Telix Pharmaceuticals dropped to 12.620, down by 4.97%. On the positive side, Fisher & Paykel Healthcare showed strong performance, trading near 23.560, with an increase of 5.0%. Additionally, Light & Wonder rose to 165.02, up by 2.30%.
However, Wall Street experienced upward momentum overnight, with all three major benchmarks setting record highs. This surge followed positive sentiment stemming from the US Federal Reserve (Fed) reaffirming its outlook for three interest rate cuts this year in its latest policy decision.
The surge was somewhat tempered by a 4.1% decline in Apple stock, as the company faces a lawsuit from the US Department of Justice for alleged monopolistic practices. The Justice Department alleges that Apple makes it challenging for competitors to integrate with the iPhone's hardware and software features.
South32's Groote Eylandt Mining Company (GEMCO) has halted operations due to Cyclone Megan, resulting in the disruption of approximately 10% of the global manganese supply. For the fiscal year 2024, prior guidance indicated production of 1.7 million tonnes from GEMCO. The supply disruption could potentially lead to a tighter manganese market in the short term.
The shutdown of GEMCO has had a positive impact on Jupiter Mines, the largest ASX-listed manganese producer, with its share rallying almost 20% in the last two sessions. This surge has lifted the company's 12-month performance to break even. Jupiter Mines aims to increase production by 300% over the next five years.
Altech Batteries has disclosed favorable outcomes from a definitive feasibility study (DFS) for its Cerenergy sodium chloride solid-state battery project in Germany. The project, slated for construction on Altech's land at the Schwarze Pumpe Industrial Park in Saxony, is anticipated to establish a new benchmark in sustainable energy solutions. It is projected to have an annual capacity of 120 1MWh grid packs.
Australian Stock Market FAQs
Stock markets in Australia are managed by the Australian Securities Exchange (ASX), headquartered in Sydney. The main indices are the S&P/ASX 200 and the S&P/ASX 300, which track the performance of the 200 and 300 largest stocks by market capitalization listed on the exchange, respectively. The S&P/ASX 200 was launched in April 2000, and it is rebalanced every quarter.
Almost half of the index belongs to the financial sector, with major banks like the Commonwealth Bank of Australia, Westpac or National Australia Bank. The so-called materials sector is also relevant – comprising almost 20% of the weighting in the index – with mining giants such as BHP Group or Rio Tinto. Other important sectors are biotechnology, real estate, consumer staples and industrials.
Many different factors drive the ASX 200, but mainly it is the aggregate performance of the component companies revealed in their quarterly and annual earnings reports the main factor behind its performance. Commodity prices can also affect the index given its significant share of mining companies. Macroeconomic data such as Gross Domestic Product (GDP) growth, inflation, or unemployment data from Australia is also important as they are indicators of the health of the country’s economy and thus the profitability of its largest companies. Global economic conditions may also play a role, particularly from China, as the Asian country is Australia’s largest trading partner.
The level of interest rates in Australia, set by the Reserve Bank of Australia (RBA), also influences the ASX 200 and ASX 300 indexes as it affects the cost of credit, on which many firms are heavily reliant. Generally, when the RBA cuts interest rates (or signals it is going to do it), it is positive for the Australian stock market as it means a lower cost of credit for companies and higher economic growth ahead, likely boosting sales. On the contrary, if the RBA signals that it will increase interest rates, this tends to weigh on the index. As always, there is a caveat: banks. Financial institutions tend to benefit from higher interest rates because they earn more from lending to other businesses, thus boosting their overall income.
The People’s Bank of China (PBoC) set the USD/CNY central rate for the trading session ahead on Friday at 7.1004 as compared to the previous day's fix of 7.0942 and 7.2147 Reuters estimates.
- USD/CAD trades in negative territory around 1.3523 amid the softer USD.
- The US S&P Global Manufacturing PMI increased to 52.5 in March vs. 52.2 prior, stronger than expected.
- The Bank of Canada expects to begin cutting interest rates this year, although policymakers vary on the precise timing.
The USD/CAD pair trades on a weaker note above the 1.3500 mark during the early Asian trading hours on Friday. The decline of the US Dollar (USD) below the 104.00 mark weighs on the pair. At the press time, USD/CAD is trading at 1.3523, losing 0.05% on the day.
The Federal Reserve (Fed) held steady on interest rates at its March meeting on Wednesday and maintained its forecast for three interest rate cuts this year. During a press conference, Fed Chair Jerome Powell noted that a strong jobs market wouldn’t deter the central bank from cutting rates.
On Thursday, the US S&P Global Manufacturing PMI increased to 52.5 in March from 52.2 in February, above the estimation of 51.7. The Services PMI eased to 51.7 in March from the previous reading of 52.3, below the market, consensus of 52.0. Finally, the Composite PMI arrived at 52.2 in March versus 52.5 prior.
On the Loonie front, the Bank of Canada (BoC) Summary of Deliberations from its March meeting showed that the governing council agreed that if the economy continues to evolve “in line with the Bank’s projection, the conditions for rate cuts should materialize over the course of this year. However, the timing of rate cuts remains uncertain. The BoC Governor Tiff Macklem said the central bank did not want to move too quickly, only to have to reverse course later.
Moving on, the Canadian Retail Sales for January is due on Friday, which is estimated to decline by 0.4% MoM. The Fed Chair Jerome Powell and Michael Barr are set to speak on Friday.
Japanese Finance Minister Shunichi Suzuki offered some verbal intervention on Friday. Suzuki said that it’s important for forex rates to move in a stable direction reflecting fundamentals, and he will watch foreign exchange moves with a high sense of urgency.
Key quotes
“BoJ’s decision to change policy could squeeze policy expenditures.”
“Won't comment on forex levels.”
“Important for forex rates to move stable reflecting fundamentals.”
“Watching forex moves with a high sense of urgency.”
“FX rates are set by market.”
“Will take appropriate steps in fiscal management.”
“The possibility of FX intervention is the most difficult to comment.”
Market reaction
At the time of writing, USD/JPY is trading 0.11% lower on the day at 150.47.
Bank of Japan FAQs
The Bank of Japan (BoJ) is the Japanese central bank, which sets monetary policy in the country. Its mandate is to issue banknotes and carry out currency and monetary control to ensure price stability, which means an inflation target of around 2%.
The Bank of Japan has embarked in an ultra-loose monetary policy since 2013 in order to stimulate the economy and fuel inflation amid a low-inflationary environment. The bank’s policy is based on Quantitative and Qualitative Easing (QQE), or printing notes to buy assets such as government or corporate bonds to provide liquidity. In 2016, the bank doubled down on its strategy and further loosened policy by first introducing negative interest rates and then directly controlling the yield of its 10-year government bonds.
The Bank’s massive stimulus has caused the Yen to depreciate against its main currency peers. This process has exacerbated more recently due to an increasing policy divergence between the Bank of Japan and other main central banks, which have opted to increase interest rates sharply to fight decades-high levels of inflation. The BoJ’s policy of holding down rates has led to a widening differential with other currencies, dragging down the value of the Yen.
A weaker Yen and the spike in global energy prices have led to an increase in Japanese inflation, which has exceeded the BoJ’s 2% target. Still, the Bank judges that the sustainable and stable achievement of the 2% target has not yet come in sight, so any sudden change in the current policy looks unlikely.
| Index | Change, points | Closed | Change, % |
|---|---|---|---|
| NIKKEI 225 | 812.06 | 40815.66 | 2.03 |
| Hang Seng | 320.03 | 16863.1 | 1.93 |
| KOSPI | 64.72 | 2754.86 | 2.41 |
| ASX 200 | 86.2 | 7782 | 1.12 |
| DAX | 164.12 | 18179.25 | 0.91 |
| CAC 40 | 18.31 | 8179.72 | 0.22 |
| Dow Jones | 269.24 | 39781.37 | 0.68 |
| S&P 500 | 16.91 | 5241.53 | 0.32 |
| NASDAQ Composite | 32.43 | 16401.84 | 0.2 |
| Pare | Closed | Change, % |
|---|---|---|
| AUDUSD | 0.65694 | -0.21 |
| EURJPY | 164.634 | -0.31 |
| EURUSD | 1.08608 | -0.58 |
| GBPJPY | 191.89 | -0.73 |
| GBPUSD | 1.26569 | -1.01 |
| NZDUSD | 0.60437 | -0.44 |
| USDCAD | 1.35261 | 0.25 |
| USDCHF | 0.89749 | 1.26 |
| USDJPY | 151.608 | 0.29 |
- EUR/USD hovers around 1.0860 amid the firmer USD in Friday’s early Asian session.
- The US S&P Global Composite PMI came in at 52.2 in March vs. 52.5 prior.
- The Eurozone HCOB Manufacturing PMI arrived at 45.7 in March vs. 46.5 prior, a three-month low.
The EUR/USD pair retreats to the 1.0860 area during the early Asian trading hours on Friday. The downtick of the major pair is backed by the firmer US Dollar (USD) and higher US Treasury bond yields. Traders await the German IFO Business Climate on Friday ahead of the Fed's Chair Powell.
The US Fed decided to keep its benchmark overnight borrowing rate in a range between 5.25% and 5.5% on Wednesday. Fed Chairman Jerome Powell did not indicate the timing of rate cuts but he expected to lower the interest rate before the end of this year. According to the CME FedWatch Tool, futures markets have prices in 80% odds that the Fed will start cutting the rate in the June meeting.
About the data, the US S&P Global Composite PMI arrived at 52.2 in March versus 52.5 prior. Additionally, the Manufacturing PMI rose to 52.5 in March from 52.2 in February, above the market expectation of 51.7. The Services PMI dropped to 51.7 in March from the previous reading of 52.3, weaker than the estimation of 52.0.
On the other hand, the HCOB's latest Purchasing Managers Index survey on Thursday revealed that the Eurozone Manufacturing PMI arrived at 45.7 in March versus 46.5 prior, worse than the consensus forecast of 47.0. Meanwhile, the Services PMI figure improved to 51.1 in March from 50.2 in February, beating the estimate of 50.5. The Eurozone PMI Composite rose to 49.9 in March versus 49.7 expected and February’s 46.3 reading.
Moving on, traders will monitor the German IFO Business Climate, along with the Fed's Chair Powell and Barr speeches on Friday. Next week, German Retail Sales for February and the US Gross Domestic Product (GDP) for the fourth quarter (Q4) will be released. These events could give a clear direction to the EUR/USD pair.


© 2000-2026. All rights reserved.
This site is managed by Teletrade D.J. LLC 2351 LLC 2022 (Euro House, Richmond Hill Road, Kingstown, VC0100, St. Vincent and the Grenadines).
The information on this website is for informational purposes only and does not constitute any investment advice.
The company does not serve or provide services to customers who are residents of the US, Canada, Iran, The Democratic People's Republic of Korea, Yemen and FATF blacklisted countries.
Making transactions on financial markets with marginal financial instruments opens up wide possibilities and allows investors who are willing to take risks to earn high profits, carrying a potentially high risk of losses at the same time. Therefore you should responsibly approach the issue of choosing the appropriate investment strategy, taking the available resources into account, before starting trading.
Use of the information: full or partial use of materials from this website must always be referenced to TeleTrade as the source of information. Use of the materials on the Internet must be accompanied by a hyperlink to teletrade.org. Automatic import of materials and information from this website is prohibited.
Please contact our PR department if you have any questions or need assistance at pr@teletrade.global.
transfers