- Analytics
- News and Tools
- Market News
CFD Markets News and Forecasts — 25-03-2024
- NZD/USD hovers around 0.6000 in Tuesday’s early Asian session.
- The US February New Home Sales came in at -0.3% MoM vs. 1.7% gain in January, weaker than expected.
- Concerns over stunted economic growth and the slump in the GDP numbers weigh on the Kiwi.
The NZD/USD trades on a flat note around the 0.6000 mark during the early Asian session on Tuesday. The USD Index (DXY) retreats from the recent peaks and remains above the 104.00 mark. Investors await the US February Personal Consumption Expenditures Price Index (PCE) data, which might offer some hints about underlying momentum in inflation.
On Monday, the US February New Home Sales dropped 0.3% MoM from a 1.7% gain in January, below the market expectations for a 2.3% MoM rise. Meanwhile, the Dallas Fed Manufacturing Survey fell to -14.4 in March from the previous reading of -11.3. The US PCE report on Friday will be in the spotlight. The headline PCE is estimated to show an increase of 0.4% MoM, while the Core CPE is projected to rise by 0.3% MoM.
The US Federal Reserve (Fed) policymakers indicated that they will be in a position to cut interest rates when they have confidence that inflation is progressing towards the 2.0% target. Investors anticipate the incoming data to rule out a May rate cut, and the first rate cut is likely to happen in the June meeting. According to CME Group's FedWatch tool, Federal Funds Futures have priced in 74.5% odds that the Fed will cut rates in June.
On the other hand, New Zealand’s economy entered a technical recession in the final quarter of 2024, driven by weak consumer spending and wholesale trade. This, in turn, weighs on the New Zealand Dollar (NZD) and creates a headwind for the NZD/USD pair. Additionally, the weaker-than-expected GDP growth numbers might convince the Reserve Bank of New Zealand (RBNZ) to cut the official cash rate (OCR) sooner than expected.
Moving on, US Consumer Confidence by the Conference Board, Durable Goods Orders, and the FHFA’s House Price Index will be due. On Wednesday, the New Zealand ANZ Business Confidence will be published. On Friday, the US PCE report will be a closely watched event.
- AUD/USD stabilizes after gains, with traders eyeing the 200-DMA and upcoming Australian consumer sentiment indicators.
- Mixed messages from Fed officials on rate cuts contrast with potential optimism from RBA’s upcoming commentary.
- Geopolitical tensions and global economic indicators may sway risk appetite, influencing AUD/USD direction.
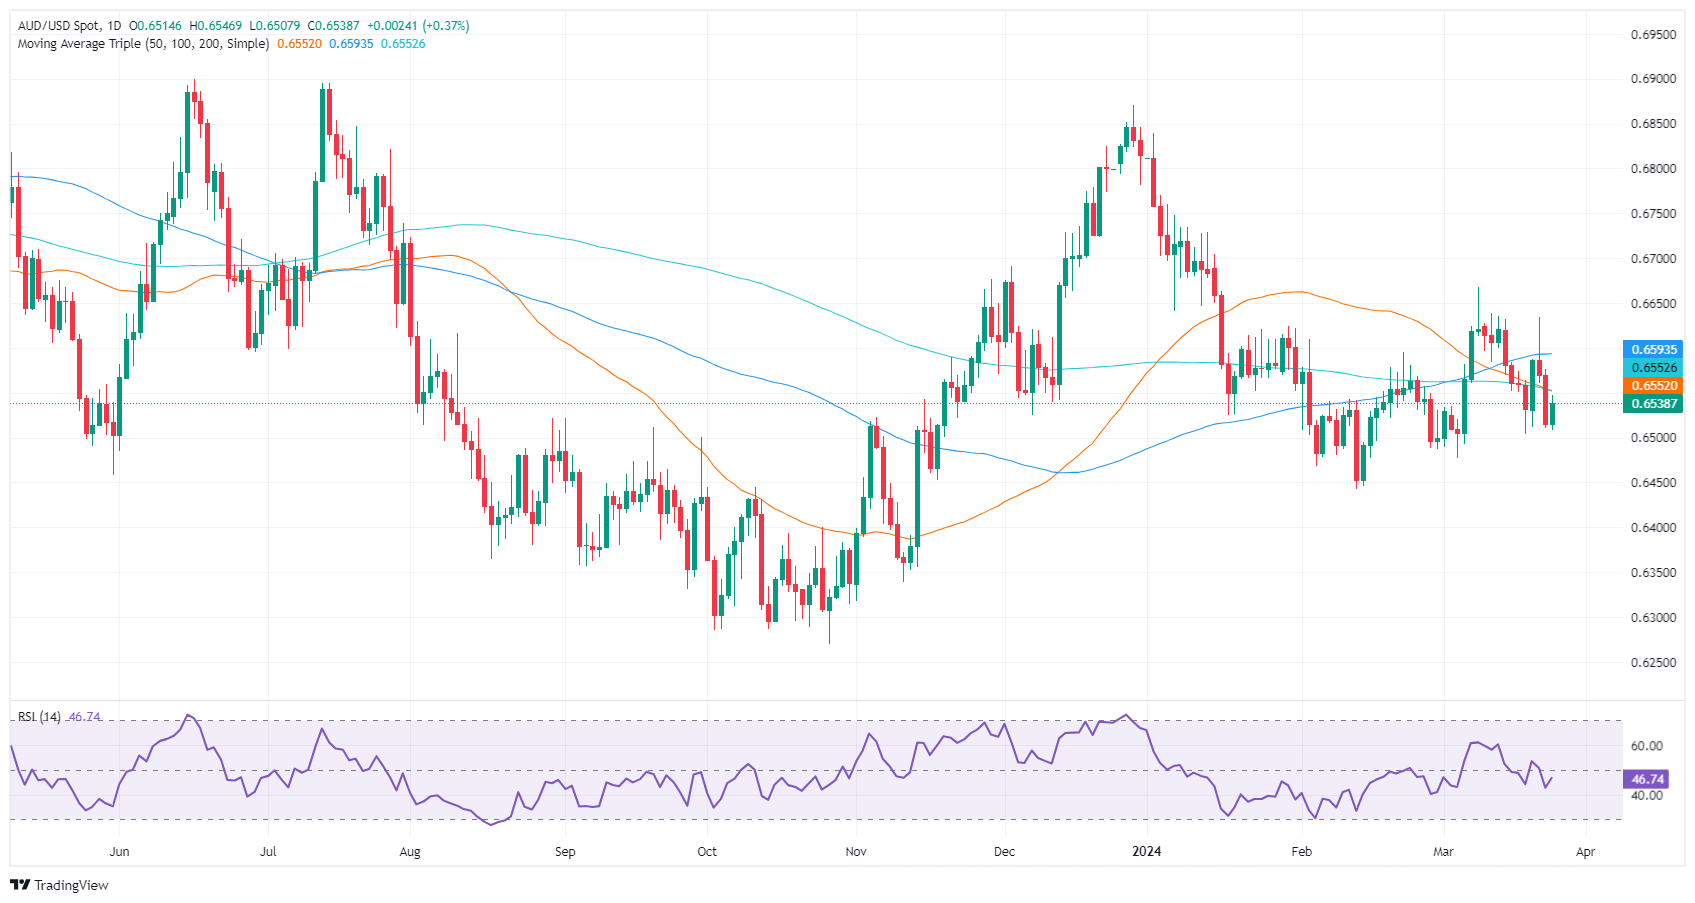
The Aussie Dollar (AUD) begins the Asian session virtually unchanged vs. the US Dollar after clocking solid gains of 0.41% on Monday. At the time of writing, the AUD/USD trades at 0.6539, beneath the 200-day moving average (DMA).
AUD/USD traders await Aussie’s Consumer Confidence
Wall Street ended Monday’s session with losses as traders braced for the release of a US inflation report. US New Home Sales in February contracted to pre-pandemic levels, decreasing -0.3% MoM from a 1.7% rise in January, from 0.664 million to 0.662 million. Other data showed that the Chicago Fed National Activity Index improved from -0.54 to 0.05.
Elsewhere, the Dallas Fed Manufacturing survey fell from -11.3 in February to -14.4 in March and below expectations for a minimal rise.
On the Aussie’s front, the schedule will feature the Consumer Confidence and the speech of Ellis Connolly, a Reserve Bank of Australia (RBA) member. In the US, traders are waiting for the release of the Fed’s preferred gauge for inflation, the Core Personal Consumption Expenditure (PCE), expected to dip from 0.4% to 0.3% MoM, which headline inflation is foreseen to tick up from 0.3% to 0.4% MoM.
Fed speakers remained split about rate cuts
Atlanta Fed President Raphael Bostic said he expects just one rate cut this year, adding that cutting rates too soon could be more disruptive. At the same time, his colleague, Chicago Fed President Austan Goolsbee, adheres to the majority of the board and expects three cuts, though he said he needs more evidence of inflation “coming down.”
Fed Governor Lisa Cook echoed Bostic's comments, saying that cutting too soon increases the risks of inflation becoming entrenched. She added that the Fed’s dual mandate goals are moving toward better balance.
Given the fundamental backdrop and a positive market mood, the AUD/USD can extend its gains and test key resistance levels. Nevertheless, the sudden escalation of the Russia-Ukraine conflict, alongside the Red Sea crisis, could dent investors' appetite for riskier assets, and seeking safety could underpin the Greenback.
AUD/USD Price Analysis: Technical outlook
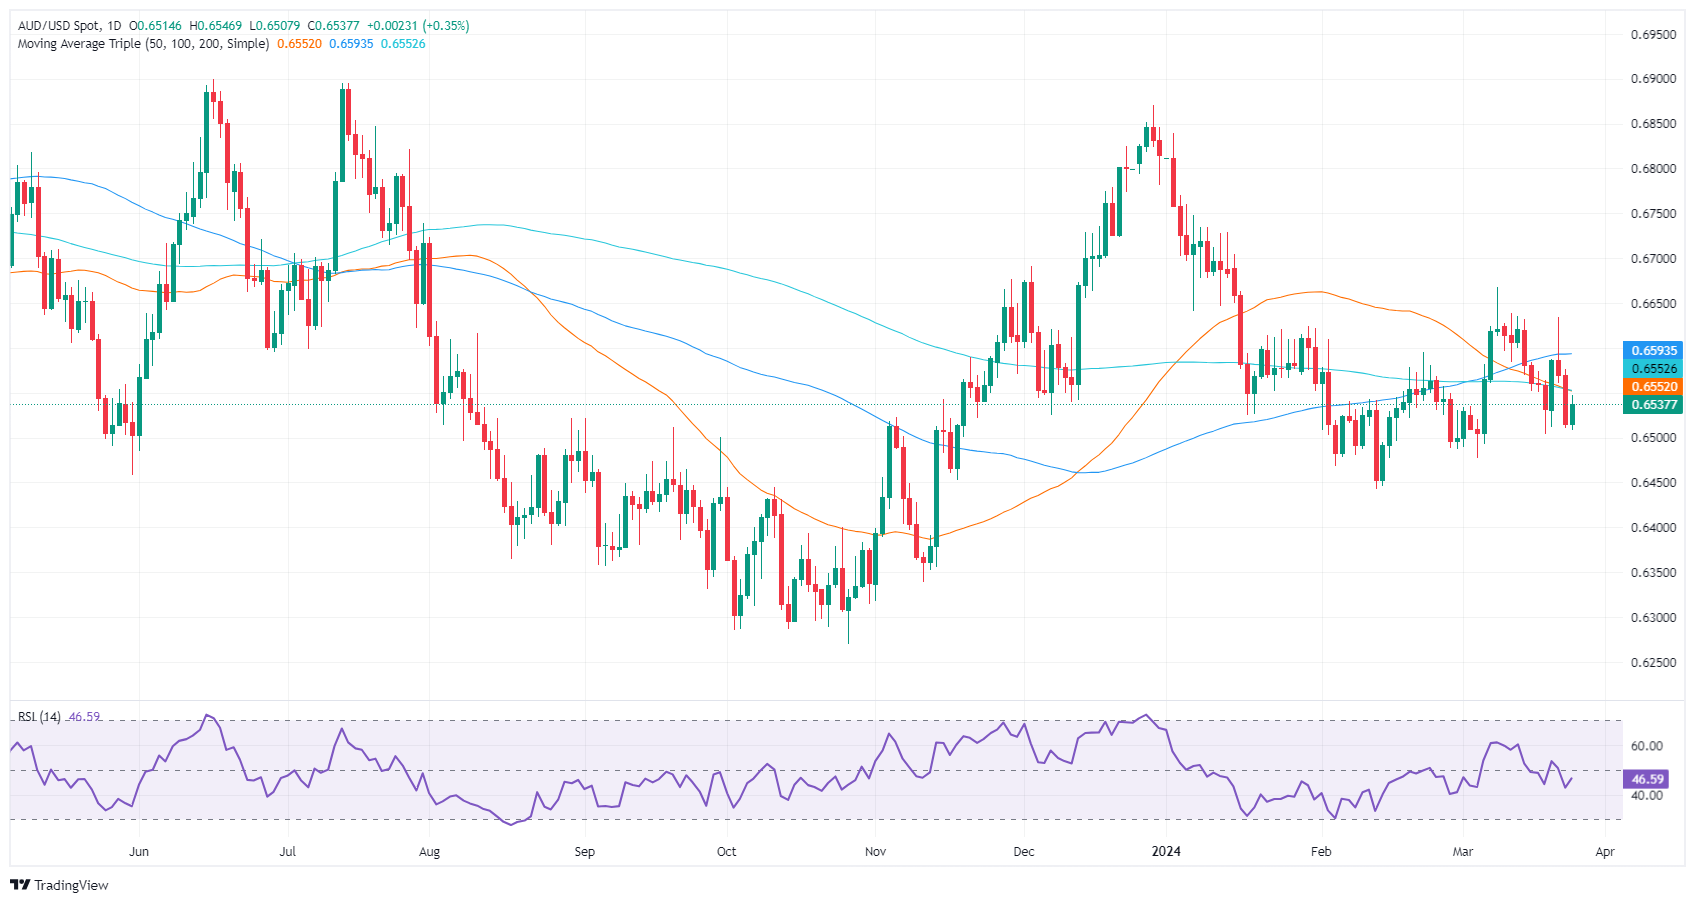
The AUD/USD pair bounced off last Friday’s lows and is climbing but faces a key resistance level at 0.6551, the confluence of the 50 and 200-day moving averages (DMA). Once breached, further upside is seen. The next supply zone would be the 100-DMA at 0.6589, ahead of 0.6600. On the other hand, sellers' failure at 0.6550 would sponsor a leg-down, and the pair could re-test the 0.6500 figure.
Australian Dollar FAQs
One of the most significant factors for the Australian Dollar (AUD) is the level of interest rates set by the Reserve Bank of Australia (RBA). Because Australia is a resource-rich country another key driver is the price of its biggest export, Iron Ore. The health of the Chinese economy, its largest trading partner, is a factor, as well as inflation in Australia, its growth rate and Trade Balance. Market sentiment – whether investors are taking on more risky assets (risk-on) or seeking safe-havens (risk-off) – is also a factor, with risk-on positive for AUD.
The Reserve Bank of Australia (RBA) influences the Australian Dollar (AUD) by setting the level of interest rates that Australian banks can lend to each other. This influences the level of interest rates in the economy as a whole. The main goal of the RBA is to maintain a stable inflation rate of 2-3% by adjusting interest rates up or down. Relatively high interest rates compared to other major central banks support the AUD, and the opposite for relatively low. The RBA can also use quantitative easing and tightening to influence credit conditions, with the former AUD-negative and the latter AUD-positive.
China is Australia’s largest trading partner so the health of the Chinese economy is a major influence on the value of the Australian Dollar (AUD). When the Chinese economy is doing well it purchases more raw materials, goods and services from Australia, lifting demand for the AUD, and pushing up its value. The opposite is the case when the Chinese economy is not growing as fast as expected. Positive or negative surprises in Chinese growth data, therefore, often have a direct impact on the Australian Dollar and its pairs.
Iron Ore is Australia’s largest export, accounting for $118 billion a year according to data from 2021, with China as its primary destination. The price of Iron Ore, therefore, can be a driver of the Australian Dollar. Generally, if the price of Iron Ore rises, AUD also goes up, as aggregate demand for the currency increases. The opposite is the case if the price of Iron Ore falls. Higher Iron Ore prices also tend to result in a greater likelihood of a positive Trade Balance for Australia, which is also positive of the AUD.
The Trade Balance, which is the difference between what a country earns from its exports versus what it pays for its imports, is another factor that can influence the value of the Australian Dollar. If Australia produces highly sought after exports, then its currency will gain in value purely from the surplus demand created from foreign buyers seeking to purchase its exports versus what it spends to purchase imports. Therefore, a positive net Trade Balance strengthens the AUD, with the opposite effect if the Trade Balance is negative.
- EUR/USD approaches the critical 200-day moving average, reflecting a cautious optimism in currency markets.
- Mixed Fed views and weaker US housing data contrast with ECB optimism on inflation and potential rate cuts.
- Upcoming US Durable Goods Orders and Consumer Confidence figures, to update economic outlook.
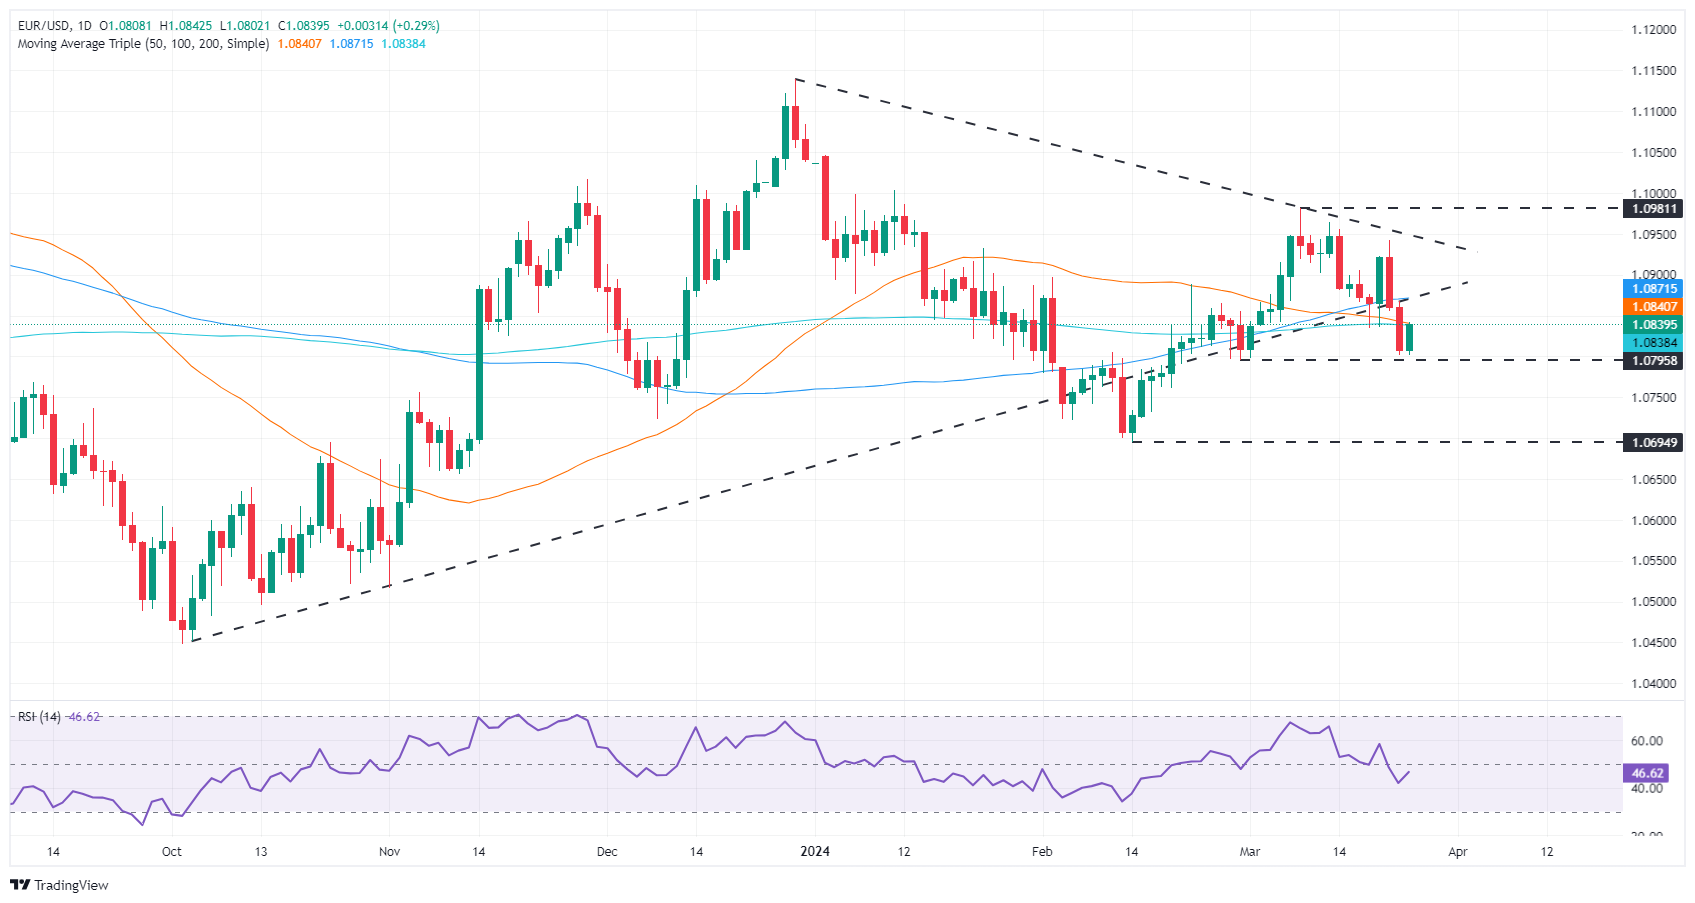
The Euro paired some of its Friday losses against the US Dollar, though it remains shy of reclaiming the 200-day moving average (DMA) at 1.0839. The Greenback has lost its momentum and remains offered late in the North American session, despite Federal Reserve (Fed) officials' commentaries. The EUR/USD trades at 1.0837, gains 028%.
EUR/USD inches up as Fed officials and ECB commentary diverge
Earlier, Atlanta’s Fed President Raphael Bostic projected one rate cut in 2024 if the US central bank embarks on slashing borrowing costs. Echoing some of his comments was Lisa Cook, with both adopting a cautious approach, emphasizing that easing policy prematurely could entrench inflation. On the dovish side, Chicago’s Fed Austan Goolsbee still sees three cuts in 2024, adding that they need to see evidence of inflationary declines.
US housing data was weaker than expected as New Home Sales slumped 0.3%, with sales coming at 0.662 million, below estimates of 0.675 million and January’s 0.664 million. Elsewhere, the Chicago Fed announced the National Activity Index saw improvement, moving from -0.54 to 0.05, with positive developments across all four index categories.
Across the pond, the Eurozone’s (EU) Consumer Confidence in Spain was almost unchanged, while European Central Bank (ECB) officials led by Mario Centeno said inflation has peaked. Fabio Panetta added that the EU’s inflation is quickly falling toward its 2% target, giving room to cut rates.
In addition, the EU’s docket will feature Consumer Confidence in Germany and the GDP release in Spain. On the US front, Durable Goods Orders, CB Consumer Confidence, and the S&P/Cas Shiller Home Price Index would shed some light on the economy's status.
EUR/USD Price Analysis: Technical outlook
The EUR/USD is forming a ‘bullish harami’ candle pattern that would need buyers to reclaim the March 22 high of 1.0868, so they could be poised to challenge 1.0900. Nevertheless, the Relative Strength Index (RSI) stills in bearish territory despite aiming slightly up, while the key 200-DMA caps the pair’s advance. If sellers moved in and dragged prices below last week’s 1.0806, that can expose 1.0800, followed by the February 14 low of 1.0694.
The resurgence of sentiment towards the risk-associated universe kept the price action around the US Dollar subdued at the beginning of a week that will be dominated by expectations around the release of US PCE.
Here is what you need to know on Tuesday, March 26:
The negative start of the week saw the USD Index (DXY) retreat from recent peaks, although maintaining the trade above the 104.00 hurdle. On March 26, the focus of attention will be on the release of US Consumer Confidence tracked by the Conference Board along with Durable Goods Orders and the FHFA’s House Price Index.
EUR/USD traded with decent gains and rebounded from the area of recent lows near the 1.0800 neighbourhood. Germany’s Consumer Confidence, measured by GfK, will take centre stage on March 26.
GBP/USD followed their risk-linked peers and left behind two daily pullbacks in a row on Monday, advancing past the 1.2600 barrier. Next of note in the UK docket will be the GDP figures on March 28.
USD/JPY started the week in a vacillating mood around the 151.50 zone, while market participants remained wary about potential FX intervention as the pair approaches the key 152.00 hurdle.
The improvement in appetite for the risk complex lent legs to AUD/USD and lifted it to the boundaries of the key 200-day SMA in the mid-0.6500s. Westpac’s Consumer Confidence Index and the speech by RBA’s Connolly are due on March 26.
Further supply concerns prompted WTI prices to regain some balance and reclaim the area beyond the $82.00 mark per barrel at the beginning of the week.
Renewed weakness in the greenback allowed Gold prices to edge higher after two consecutive sessions of losses. Silver, in the same tone, printed humble gains following the sharp sell-off seen in the latter part of last week.
- GBP/USD rises to 1.2639, lifted by speculation over Federal Reserve's potential rate cut in June.
- Fed officials offer varied views on policy direction, contributing to the Dollar's subdued performance.
- UK economic indicators and BoE Governor's rate cut hints set the stage for a cautious market outlook.
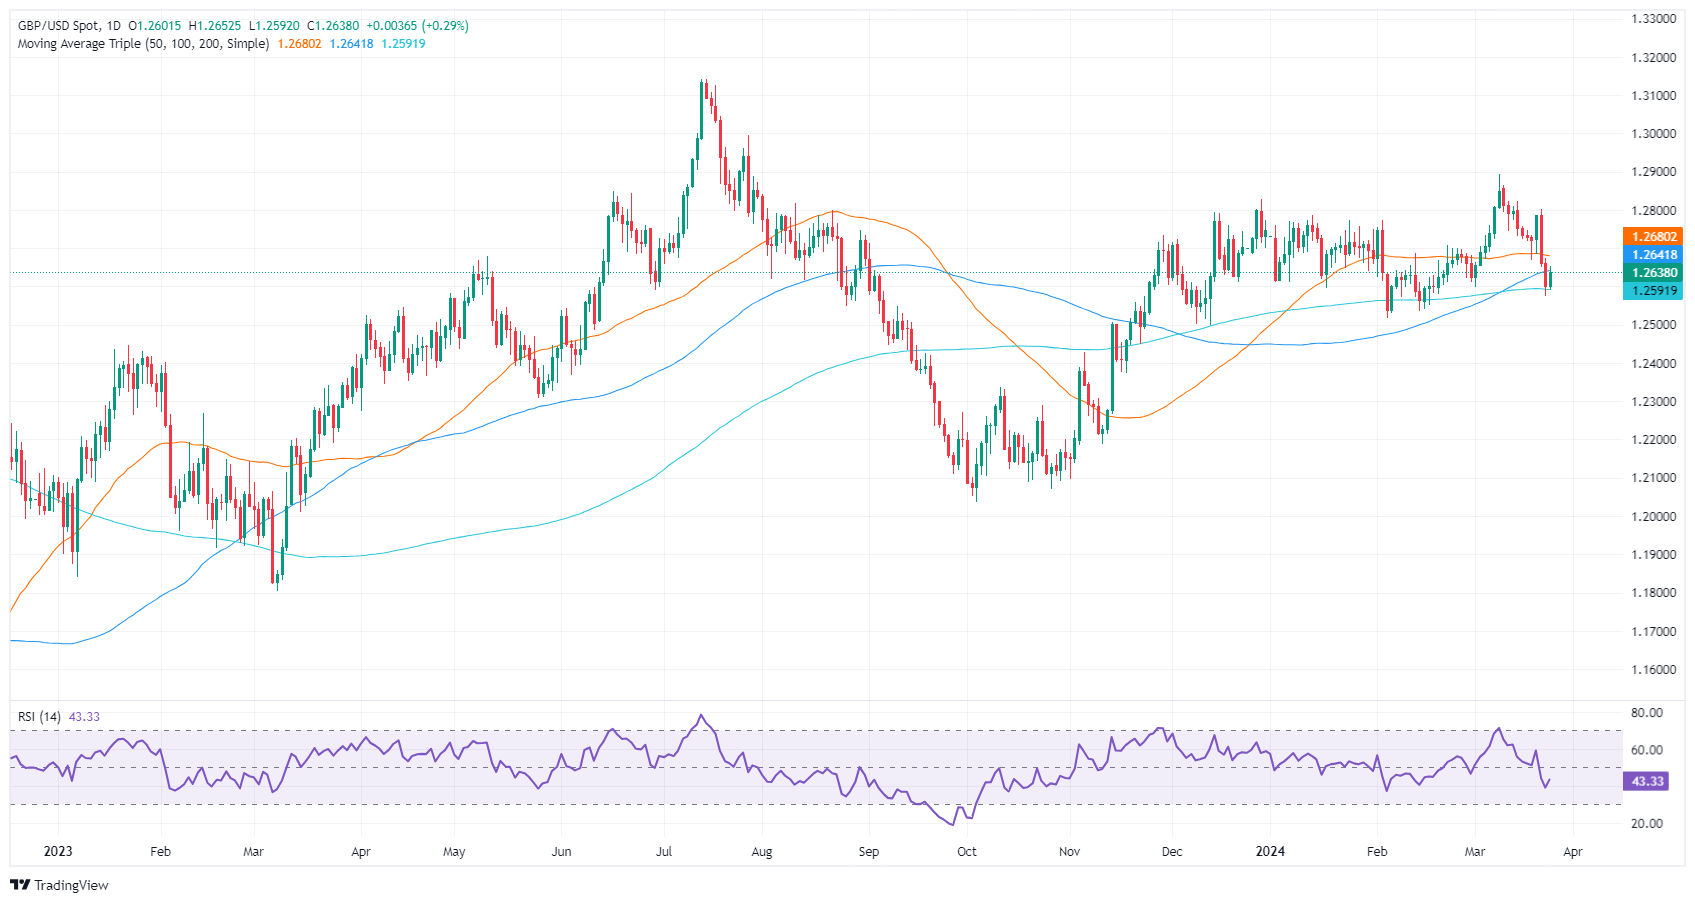
The Pound Sterling stages a mild recovery against the US Dollar in the mid-North American session, as the Greenback remains offered amid speculations the Federal Reserve would cut rates in June. At the time of writing, the GBP/USD trades at 1.2639. gains 0.32%.
GBP/USD edges higher as mixed Fed outlook and looming BoE rate cuts stir currency markets.
US economic docket failed to boost the US Dollar, which treads water against most G7 currencies. Three Federal Reserve officials crossed the wires, with Bostic and Cook advocating for a cautious approach, emphasizing the risks of easing policy prematurely, whereas Goolsbee, although also cautious, sees room for more aggressive action pending clear evidence of inflationary declines.
On the data front, the US housing market saw a slight decline in New Home Sales for February, dropping by 0.3% month-over-month from 0.664 million to 0.662 million units. Elsewhere, the Chicago Fed announced the National Activity Index saw improvement, moving from -0.54 to 0.05, with positive developments across all four index categories.
Across the pond, the UK CBI Distributive Trades Survey figures showed the monthly retail sales balance rose in March from a -7 reading a year ago, to 2. With this data out of the way, GBP/USD traders are eyeing the release of the Gross Domestic Product (GDP) for Q4 2023. Expectations sees the economy confirming a technical recession, as the preliminary GDP fell -0.3% QoQ following a fall of -0.1% in Q3.
That data, along with the dovish remarks of Bank of England (BoE) Governor Andrew Bailey, who said that rate cuts are “in play” in an interview with the Financial Times (FT), weighed on the GBP. Money market futures estimates see a 75% chance of a rate cut by the BoE in June, up from 35% at the beginning of last week.
GBP/USD Price Analysis: Technical outlook
Given the fundamental backdrop, the GBP/USD is forming a ‘bullish harami’ which suggests further ipside is seen. Nevertheless, a break above the 50-day moving average (DMA) of 1.2679 is needed, to confirm the reversal pattern. That would expose 1.2700, followed by the March 21 high at 1.2803. On the other hand, if the major slips below the 200-DMA at 1.2591, that would negate the chart pattern, as the pair could extend its losses.
- USD/JPY trades without conviction around 151.50.
- Fears of FX intervention remain well in place.
- Higher US yields limit the downside bias in the pair.
USD/JPY navigates in the upper end of the recent range north of the 151.00 mark amidst some renewed weakness in the Greenback and rising US yields.
USD/JPY: Upside appears capped by 152.00
The pair trades in an irresolute tone at the beginning of the week on the back of the resurgence of the downward bias in the US Dollar and in a context of prevailing appetite for the risk-linked galaxy.
In addition, US yields manage to regain some balance following many sessions of losses, while JGB 10-year yieds print humble gains near 0.75%.
In the meantime, as the pair gets closer to the 152.00 hurdle, fears of FX intervention by the BoJ and/or the government appear to limit the upsit potential in spot. On this, according to Vice Finance Minister for International Affairs, Kanda, the recent depreciation of the Japanese yen is not aligned with the underlying economic fundamentals and appears to be driven by speculative activities. Kanda issued a stern warning, stating, "We are prepared to intervene to address excessive fluctuations, with all options on the table."
On the domestic calendar, the BoJ published its Minutes of its March 19 gathering, noting that the central bank is gradually moving towards a phase of tightening, as board members recognize the potential for adjusting monetary policy and acknowledge the probability of maintaining accommodative financial conditions, even as measures like ending negative interest rate policy are implemented.
USD/JPY: Key levels to watch
So far, USD/JPY is up 0.06% at 151.40 and faces the next resistance at the 2024 peak of 151.86 (March 22) ahead of the 2023 high of 151.90 (November 13) and the 2022 top of 151.94 (October 21. In case bears regain the upper hand, the initial support level is set at March's low of 146.47 (March 8), which is reinforced by the proximity of the key 200-day SMA (146.68). If the pair clears the latter, it could extend the drop to the February low of 145.89 (February 1) seconded by the December 2023 low of 140.24 (December 28).
- Firmer crude oil prices provide support to the Canadian Dollar.
- The US Dollar sheds some ground after posting solid gains at the end of the previous week.
- USD/CAD is technically neutral according to the daily chart, needs to break through 1.3610/20 area.
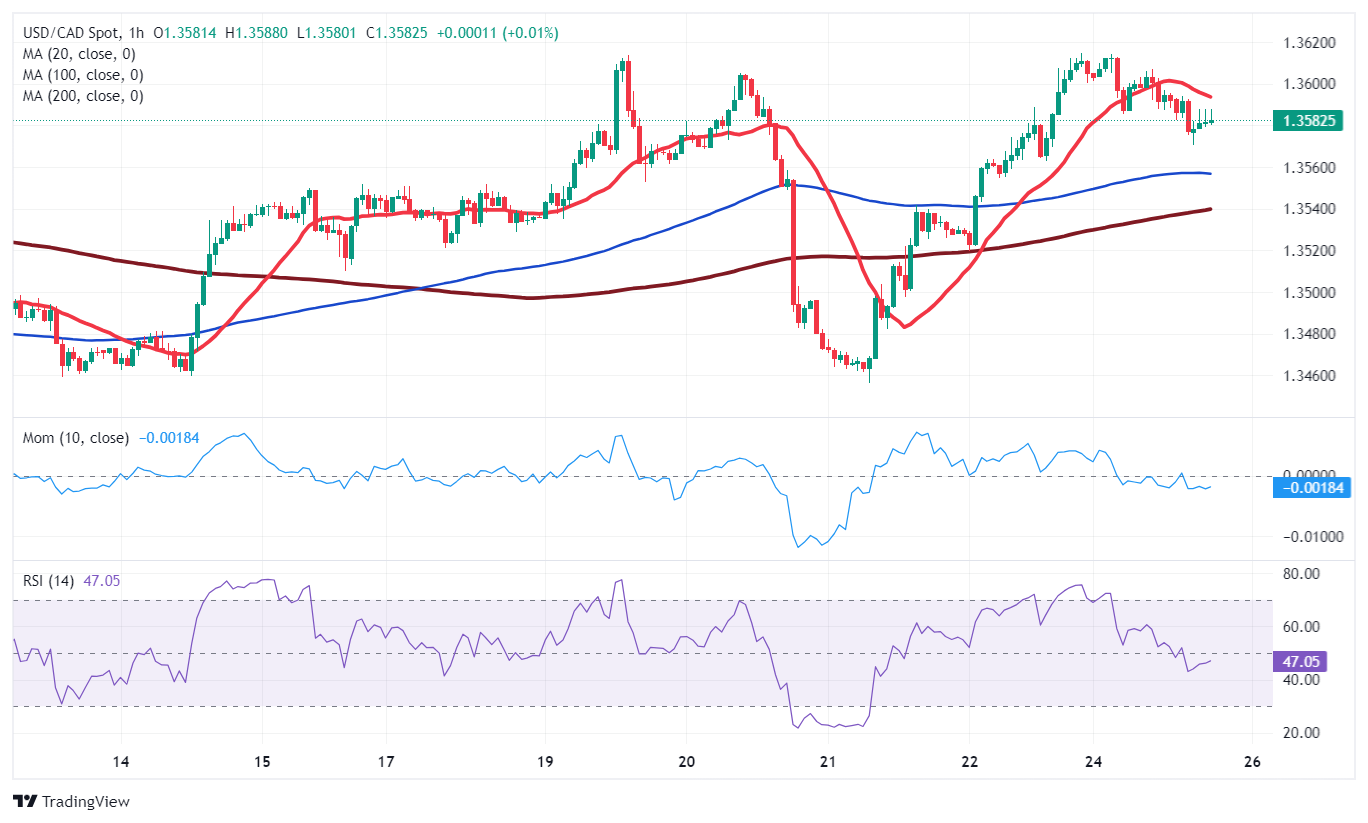
The FX board is all about the US Dollar (USD) giving up some of the gains achieved last week. The USD/CAD trades around 1.3585 in the American afternoon, bouncing modestly from an intraday low of 1.3570. Meanwhile, the Canadian Dollar (CAD) found near-term support in crude oil prices, as West Texas Intermediate (WTI) prices were up on Monday after the United States Energy Information Administration (EIA)increased its forecast prices for crude oil and petroleum products for the remainder of 2024 while reducing global production forecast in the second half of the year as a response to OPEC+ cuts. The black gold trades above $81.60 a barrel, up around $1 on the day.
Data-wise, Canada’s macroeconomic calendar has little to offer this week. The country will release the monthly Gross Domestic Product (GDP), which is expected to be confirmed at 0.4% MoM in January next Thursday. The report has a limited impact on CAD amid the delay between the period estimate and the actual release.
USD/CAD Technical Outlook
The daily chart for the USD/CAD pair shows a strong static resistance area between 1.3610 and 1.3620, as the area rejected advances multiple times since late February. The overall stance is neutral, as in the mentioned time frame, technical indicators head nowhere around or above their midlines. At the same time, the price currently develops above a bullish 20 DMA, which advances beyond the longer ones, all below the current level. A break through the mentioned resistance should favor an extension towards 1.3700, while the near-term risk will skew to the downside once below 1.3550, with the scope then to test the 1.3500 mark.
Canadian Dollar FAQs
The key factors driving the Canadian Dollar (CAD) are the level of interest rates set by the Bank of Canada (BoC), the price of Oil, Canada’s largest export, the health of its economy, inflation and the Trade Balance, which is the difference between the value of Canada’s exports versus its imports. Other factors include market sentiment – whether investors are taking on more risky assets (risk-on) or seeking safe-havens (risk-off) – with risk-on being CAD-positive. As its largest trading partner, the health of the US economy is also a key factor influencing the Canadian Dollar.
The Bank of Canada (BoC) has a significant influence on the Canadian Dollar by setting the level of interest rates that banks can lend to one another. This influences the level of interest rates for everyone. The main goal of the BoC is to maintain inflation at 1-3% by adjusting interest rates up or down. Relatively higher interest rates tend to be positive for the CAD. The Bank of Canada can also use quantitative easing and tightening to influence credit conditions, with the former CAD-negative and the latter CAD-positive.
The price of Oil is a key factor impacting the value of the Canadian Dollar. Petroleum is Canada’s biggest export, so Oil price tends to have an immediate impact on the CAD value. Generally, if Oil price rises CAD also goes up, as aggregate demand for the currency increases. The opposite is the case if the price of Oil falls. Higher Oil prices also tend to result in a greater likelihood of a positive Trade Balance, which is also supportive of the CAD.
While inflation had always traditionally been thought of as a negative factor for a currency since it lowers the value of money, the opposite has actually been the case in modern times with the relaxation of cross-border capital controls. Higher inflation tends to lead central banks to put up interest rates which attracts more capital inflows from global investors seeking a lucrative place to keep their money. This increases demand for the local currency, which in Canada’s case is the Canadian Dollar.
Macroeconomic data releases gauge the health of the economy and can have an impact on the Canadian Dollar. Indicators such as GDP, Manufacturing and Services PMIs, employment, and consumer sentiment surveys can all influence the direction of the CAD. A strong economy is good for the Canadian Dollar. Not only does it attract more foreign investment but it may encourage the Bank of Canada to put up interest rates, leading to a stronger currency. If economic data is weak, however, the CAD is likely to fall.
- Mexican Peso benefits from US Dollar weaknesses, shrugging off Banxico rate cut.
- Banxico Governor emphasized cautious approach to rate adjustments, stressing ongoing inflation battle.
- Mixed economic updates from both Mexico and the US leave traders weighing Fed's rate cut discourse against actual data.
The Mexican Peso capitalized on broad US Dollar weakness on Monday, climbing more than 0.1% in the mid-North American session. A risk-off impulse was no excuse for the Mexican currency’s bulls despite last week’s interest rate cut by the Bank of Mexico (Banxico). Additionally, traders ignored comments from Federal Reserve’s (Fed) members as the Greenback remains pressured. The USD/MXN trades at 16.69, down 0.28%.
Mexico’s economic docket is absent, though Banxico Governor Victoria Rodriguez Ceja crossed the wires. She said that the first rate cut does not mean the battle against inflation is over. She added that the central bank would be gradual, and adjustments to the main reference rates would be made taking into account upcoming data.
Last week, the National Statistics Agency (INEGI) revealed that the economy shrunk in January from December, while mid-month inflation increased on a monthly and annual basis.
Across the border, Federal Reserve officials had crossed the newswires. Atlanta Fed President Raphael Bostic said that he favors one rate cut this year, while Chicago Fed President Austan Goolsbee foresees three decreases to the fed funds rate (FFR). At the same time, Fed Governor Lisa Cook commented that a premature rate cut could increase the risk of inflation becoming entrenched.
The US schedule features housing market data, the Chicago Fed National Activity Index and the Dallas Fed Manufacturing Index.
Daily digest market movers: Mexican Peso capitalizes on US Dollar weakness on Monday
- Banxico Governor Victoria Rodriguez Ceja said, “When macroeconomic conditions and the inflationary outlook allow us to make additional adjustments to the reference rate to the one we already have, I consider that they would be gradual.”
- Mexico’s economy contracted for the fourth time in January. The Indicator of General Economic Activity plunged -0.6% MoM, below estimates of a 0.3% expansion, and slowed compared to December, missing estimates of 2.6% to print at 2%. Inflation in Mexico exceeded estimates of 4.45%, increasing by 4.48%, while core figures jumped above the consensus of 4.62% YoY to 4.69%.
- The outlook in Mexico suggests the economy is stagnating. A weak retail sales report, private spending falling sharply, and a contraction in economic activity justified Banxico’s rate cut. Nevertheless, they face stubbornly stickier inflation, keeping policymakers on their toes.
- The US economic calendar has featured Fed speakers led by Atlanta Fed President Raphael Bostic, who said he expects just one rate cut this year, adding that cutting rates too soon could be more disruptive. At the same time, his colleague, Chicago Fed President Austan Goolsbee, adheres to the majority of the board and expects three cuts, though he said he needs more evidence of inflation “coming down.”
- Recently, Fed Governor Lisa Cook echoed Bostic's comments, saying that cutting too soon increases the risk of inflation becoming entrenched. She added that the Fed’s dual mandate goals are moving toward better balance.
- New Home Sales for February decreased -0.3% MoM from 0.664 million to 0.662 million. The Chicago Fed National Activity Index improved from -0.54 to 0.05. According to the Chicago Fed, all four categories that compose the index improved on the month.
- Recently, the Dallas Fed Manufacturing Index plunged further from -11.3 in February to -14.4 in March. Wages and prices increased during the month, while expectations for future manufacturing activity generally improved.
Technical analysis: Mexican Peso gathers momentum as USD/MXN falls below 16.70
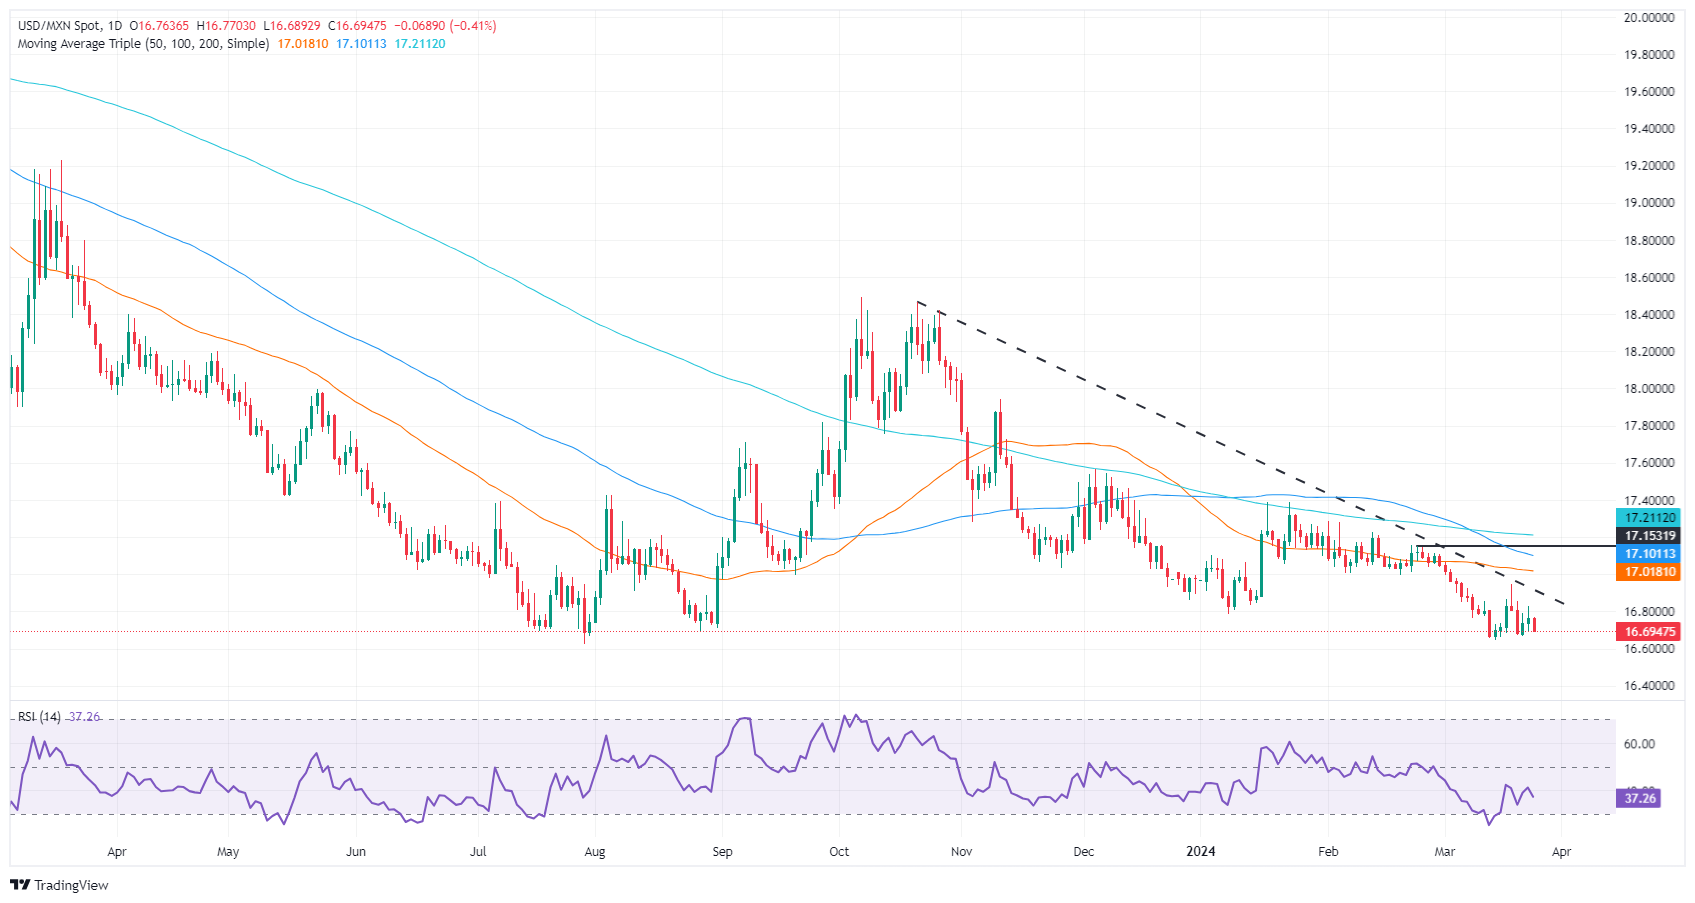
The USD/MXN remains downwardly biased after hitting 16.94, last week’s high. Since then, the exotic pair has tumbled 1.45% and is poised to register additional losses. If the pair drops below the current year's low of 16.64, that could clear the path to test last year’s cycle low of 16.62 and October 2015’s low of 16.32.
For a bullish scenario, traders must reclaim the current week’s high of 16.94, ahead of the 17.00 figure. Up next lie key dynamic resistance levels like the 50-day Simple Moving Average (SMA) at 17.01, the 100-day SMA at 17.11, and the 200-day SMA at 17.20.
USD/MXN Price Action – Daily Chart
Mexican Peso FAQs
The Mexican Peso (MXN) is the most traded currency among its Latin American peers. Its value is broadly determined by the performance of the Mexican economy, the country’s central bank’s policy, the amount of foreign investment in the country and even the levels of remittances sent by Mexicans who live abroad, particularly in the United States. Geopolitical trends can also move MXN: for example, the process of nearshoring – or the decision by some firms to relocate manufacturing capacity and supply chains closer to their home countries – is also seen as a catalyst for the Mexican currency as the country is considered a key manufacturing hub in the American continent. Another catalyst for MXN is Oil prices as Mexico is a key exporter of the commodity.
The main objective of Mexico’s central bank, also known as Banxico, is to maintain inflation at low and stable levels (at or close to its target of 3%, the midpoint in a tolerance band of between 2% and 4%). To this end, the bank sets an appropriate level of interest rates. When inflation is too high, Banxico will attempt to tame it by raising interest rates, making it more expensive for households and businesses to borrow money, thus cooling demand and the overall economy. Higher interest rates are generally positive for the Mexican Peso (MXN) as they lead to higher yields, making the country a more attractive place for investors. On the contrary, lower interest rates tend to weaken MXN.
Macroeconomic data releases are key to assess the state of the economy and can have an impact on the Mexican Peso (MXN) valuation. A strong Mexican economy, based on high economic growth, low unemployment and high confidence is good for MXN. Not only does it attract more foreign investment but it may encourage the Bank of Mexico (Banxico) to increase interest rates, particularly if this strength comes together with elevated inflation. However, if economic data is weak, MXN is likely to depreciate.
As an emerging-market currency, the Mexican Peso (MXN) tends to strive during risk-on periods, or when investors perceive that broader market risks are low and thus are eager to engage with investments that carry a higher risk. Conversely, MXN tends to weaken at times of market turbulence or economic uncertainty as investors tend to sell higher-risk assets and flee to the more-stable safe havens.
Economists at Société Générale analyze Gold (XAU/USD) technical outlook.
Pause likely short-lived
Gold recently gave breakout above multi-year rectangle denoting resumption in uptrend. It has staged an initial pullback after facing interim hurdle at $2,230 last week. Signals of large downside are not yet visible. Upper part of the pattern at $2,075/$2,065 should be a crucial support zone.
Weekly MACD is anchored within positive territory highlighting prevalence of upward momentum. The uptrend is likely to persist. Next potential objectives are located at $2,250 and projections of $2,360. Target for the rectangle is located near $2,460.
USD/ZAR is approaching hurdle of 19.25/19.38. Economists at Société Générale analyze the pair’s technical outlook.
Stuck in a triangle
USD/ZAR has evolved within a large symmetrical triangle since June last year and recently tested the lower limit near 18.50 which is also the trough of February. An initial rebound has happened, but the pattern denotes lack of clear direction.
Current bands of the formation near 18.50 and 19.25/19.38 are key levels. Move beyond one of these limits is essential for confirming a directional move.
- AUD/USD climbs after a dip, finding support from a broader USD retreat.
- Fed's mixed messages on interest rates, with Bostic cautious on cuts and Goolsbee open to three, sway market sentiment.
- US New Home Sales dropped, while the Dallas Fed Manufacturing Index dived.
The Aussie Dollar (AUD) recovers against the US Dollar (USD) after hitting a daily low of 0.6509, though broad USD weakness underpins the commodity-linked currency. At the time of writing, the AUD/USD trades at 0.6543, up 0.43%.
AUD/USD gains as Fed speakers offer divergent views on rate cuts
Market sentiment is downbeat, with Wall Street trading with losses. The US economic calendar has featured Fed speakers led by Atlanta’s Fed President Raphael Bostic, who said he expects just one rate cut this year, adding that cutting rates too soon could be more disruptive. At the same time, his colleague, Chicago Fed President Austan Goolsbee, adheres to the majority of the board and expects three cuts, though he said he needs more evidence of inflation “coming down.”
Recently, Fed Governor Lisa Cook echoed Bostic's comments, saying that cutting too soon increases the risks of inflation becoming entrenched. She added that the Fed’s dual mandate goals are moving toward better balance.
Data-wise, US housing market data was revealed, with New Home Sales for February decreasing -0.3% MoM from 0.664 million to 0.662 million. The Chicago Fed National Activity Index improved from -0.54 to 0.05. According to the Chicago Fed, all four categories that compose the index improved on the month.
Recently, the Dallas Fed Manufacturing Index plunged further from -11.3 in February to -14.4 in March. Wages and prices increased during the month, while expectations for future manufacturing activity, generally improved.
AUD/USD Price Analysis: Technical outlook
The AUD/USD pair bounced off last Friday’s lows and is climbing but faces a key resistance level at 0.6551, the confluence of the 50 and 200-day moving averages (DMA). Further upside is seen once breached. The next supply zone would be the 100-DMA at 0.6589, ahead of 0.6600. On the other hand, sellers' failure at 0.6550 would sponsor a leg-down and the pair could re-test the 0.6500 figure.
- GBP/USD recovers after steep sell-off takes it to 1.2600s.
- Brighter UK retail sales data helps improve the outlook for the Pound Sterling.
- BoE and Fed divergence on interest rate outlook, however, is a depresser for the pair.
GBP/USD saw a fillip on Monday, rising by almost four tenths of a percent to the mid 1.2600s on a mixture of better-than-expected UK retail sales data, profit taking after the recent steep sell-off and the US Dollar (USD) being broadly sold following intervention by authorities to prop up their currencies in Asia.
GBP/USD gets some support by UK retail sales
GBP/USD got some relief from the CBI Distributive Trades Survey figures showed the monthly retail sales balance climbed to plus two points in March from a reading of minus seven points a year ago, in March 2023.
The positive data published by the Confederation of British Industry (CBI), came after ten months of declines, suggesting the retail climate in the UK was improving.
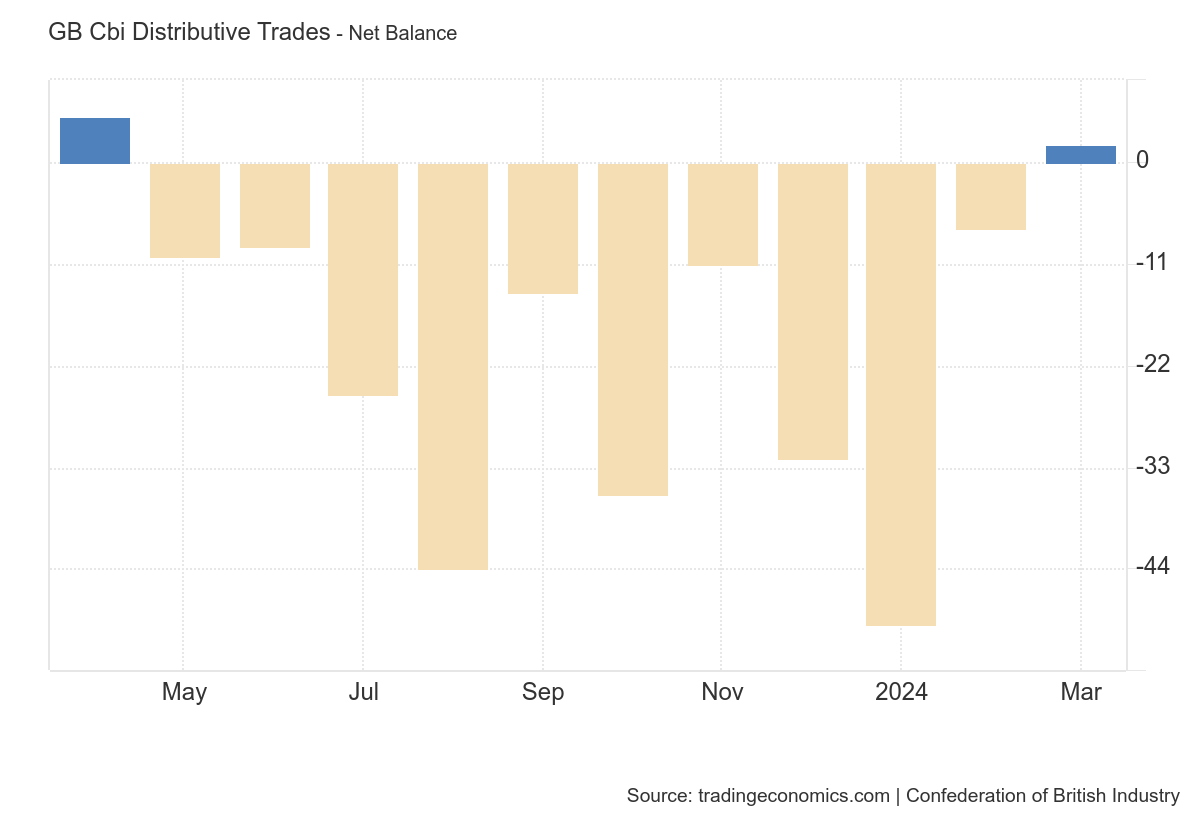
The data comes after official UK Retail Sales volumes data from the Office of National Statistics (ONS) beat expectations in February and were revised up in January.
The data indicates Q1 will probably be stronger for the UK economy than had previously been predicted which is likely to help underpin the Pound Sterling (GBP).
"Retail sales volumes are on track to rebound strongly in Q1, helping the economy leave last year’s recession behind, as falling inflation boosts consumer spending power," says Rob Wood, Chief UK Economist at Pantheon Macroeconomics, as quoted by Poundsterlinglive.com.
The data was all the more impressive given February was the wettest since 1836, added Wood.
Even if Retail Sales remain flat in March, they will still show a 1.7% gain quarter-on-quarter, according to the economist.
The data suggests the UK economy could be turning around after falling into a technical recession in Q4 and that the Bank of England (BoE) will not be in such a hurry to lower interest rates as may currently be expected. Maintaining higher interest rates would be positive for GBP as higher interest rates attract greater inflows of foreign capital.
GBP/USD suffers from diverging interest rate expectations
GBP/USD weakened substantially following the March BoE policy meeting on Thursday after it was revealed that the last remaining member of the board of governors holding out for interest rate hikes, Catherine Mann, had shifted allegiance. This left zero members voting for a rate hike, eight for leaving rates unchanged and one for cutting rates. It was viewed as indicative of a decisive shift in the BoE and a canary-in-the-coalmine warning of rate cuts on the horizon.
The US Dollar, meanwhile, has been supported by expectations shifting in the opposite direction – that of holding interest rates at their current elevated level, as US inflation data continues to surprise to the upside. Although the Federal Reserve (Fed) stuck to its earlier view that it would cut rates three times in 2024 at the March meeting, it revised up most of its economic metrics such as GDP, suggesting a risk it might not follow through with the cuts.
On Monday, Atlanta Federal Reserve President Raphael Bostic said he advocated a slow approach to lowering interest rates and only expected the Fed to make one rate cut in 2024.
Federal Reserve Governor Lisa Cook also urged caution, arguing that the Fed needed to take a “careful approach” to easing over time to “ensure inflation returns sustainably to 2.0%.”
The rate-setter who was previously in favor of rate hikes in the UK, Catherine Mann, but who chose to change her mind at the last BoE meeting, is currently speaking although she has not been reported as saying anything market moving at time of publication.
Kit Juckes, Chief Global FX Strategist at Société Générale, expects the Pound Sterling (GBP) and the Swiss Franc (CHF) to weaken over the coming months.
Setting the stage for GBP and CHF weakness
Dovish MPC comments and lower inflation have turned the tide and while a week ago, Sterling was 2024’s top G10 currency, it has slipped into second place and is likely to fall further as political uncertainty, pressure for tighter fiscal policy and lower inflation weigh.
The SNB seems to have switched from wanting Franc strength to being happy to see it weaken, and it’s likely to slug it out with Sterling at the bottom of the G10 FX rankings in the coming months.
"There are risks to easing policy too much or too soon as well as too late," Federal Reserve Governor Lisa Cook said on Monday, per Reuters.
Key takeaways
"Careful approach to easing policy over time can ensure inflation returns sustainably to 2% while striving to maintain strong labor market."
"Risks to achieving US central bank's employment and inflation goals moving into better balance."
"Inflation has fallen considerably; labor market has remained strong."
"Path of disinflation, as expected, has been bumpy and uneven."
"Current low rate of increase on new rental leases suggests housing services inflation will continue to fall."
"Strong productivity growth could mean faster pace of wage growth not inflationary."
"Could be that some services prices still adjusting to increase in pandemic-era input costs."
"Comprehensive measures of wage growth show gradual cooling."
"Wage growth differential between job switchers, those staying in jobs has narrowed."
"Artificial intelligence a potentially significant source of productivity growth; that will take time."
Market reaction
The US Dollar stays under modest bearish pressure following these comments. At the time of press, the US Dollar Index was down 0.23% on the day at 104.19.
Economists at Société Générale analyze USD/MXN technical outlook.
Risk of deeper decline if 200-DMA near 17.20 not overcome
USD/MXN has recently struggled to overcome the 200-DMA (now at 17.20) resulting in persistence of decline. It has retested last year low of 16.60 which is an interim support.
Daily MACD has started posting positive divergence denoting receding downward momentum but, move beyond the MA near 17.20 would be essential to confirm a meaningful up move.
In case the pair breaks 16.60, the phase of correction is likely to extend. Next potential objectives could be located at projections of 16.40 and 16.10.
The Japanese Yen (JPY) weakened further last week despite the BoJ’s decision to finally tighten monetary policy. Economists at MUFG Bank analyze USD/JPY outlook.
BoJ policy shift is important but global yields still key for JPY direction
From an FX perspective, it is difficult to argue that BoJ action alone both last week and going forward will be enough to change the JPY direction. But when global yields do start to move lower, the stance of the BoJ will certainly reinforce the scale of yen appreciation.
We still see scope for USD/JPY to drop to at least 140.00 by year-end with risks of a move to the mid-130.00’s. We also expect intervention quite quickly after any break of 152.00 with the government clearly opposed to Yen depreciation that would only serve to reinforce voter dissatisfaction with the Kishida government.
- Silver price will probably reverse its uptrend if it breaks below a key swing low.
- The precious metal formed a bearish candlestick pattern on the daily chart last week.
- It recently touched the top of a long-term range and is vulnerable to falling back down to the range floor.
Silver (XAG/USD) price is threatening to reverse its short-term uptrend and move lower within a range it has been yo-yoing within for almost a year – since April 2023.
The 4-hour chart, used by analysts to analyze the short-term trend, is showing warning signs of a potential trend reversal after the pair rolled over on Thursday.
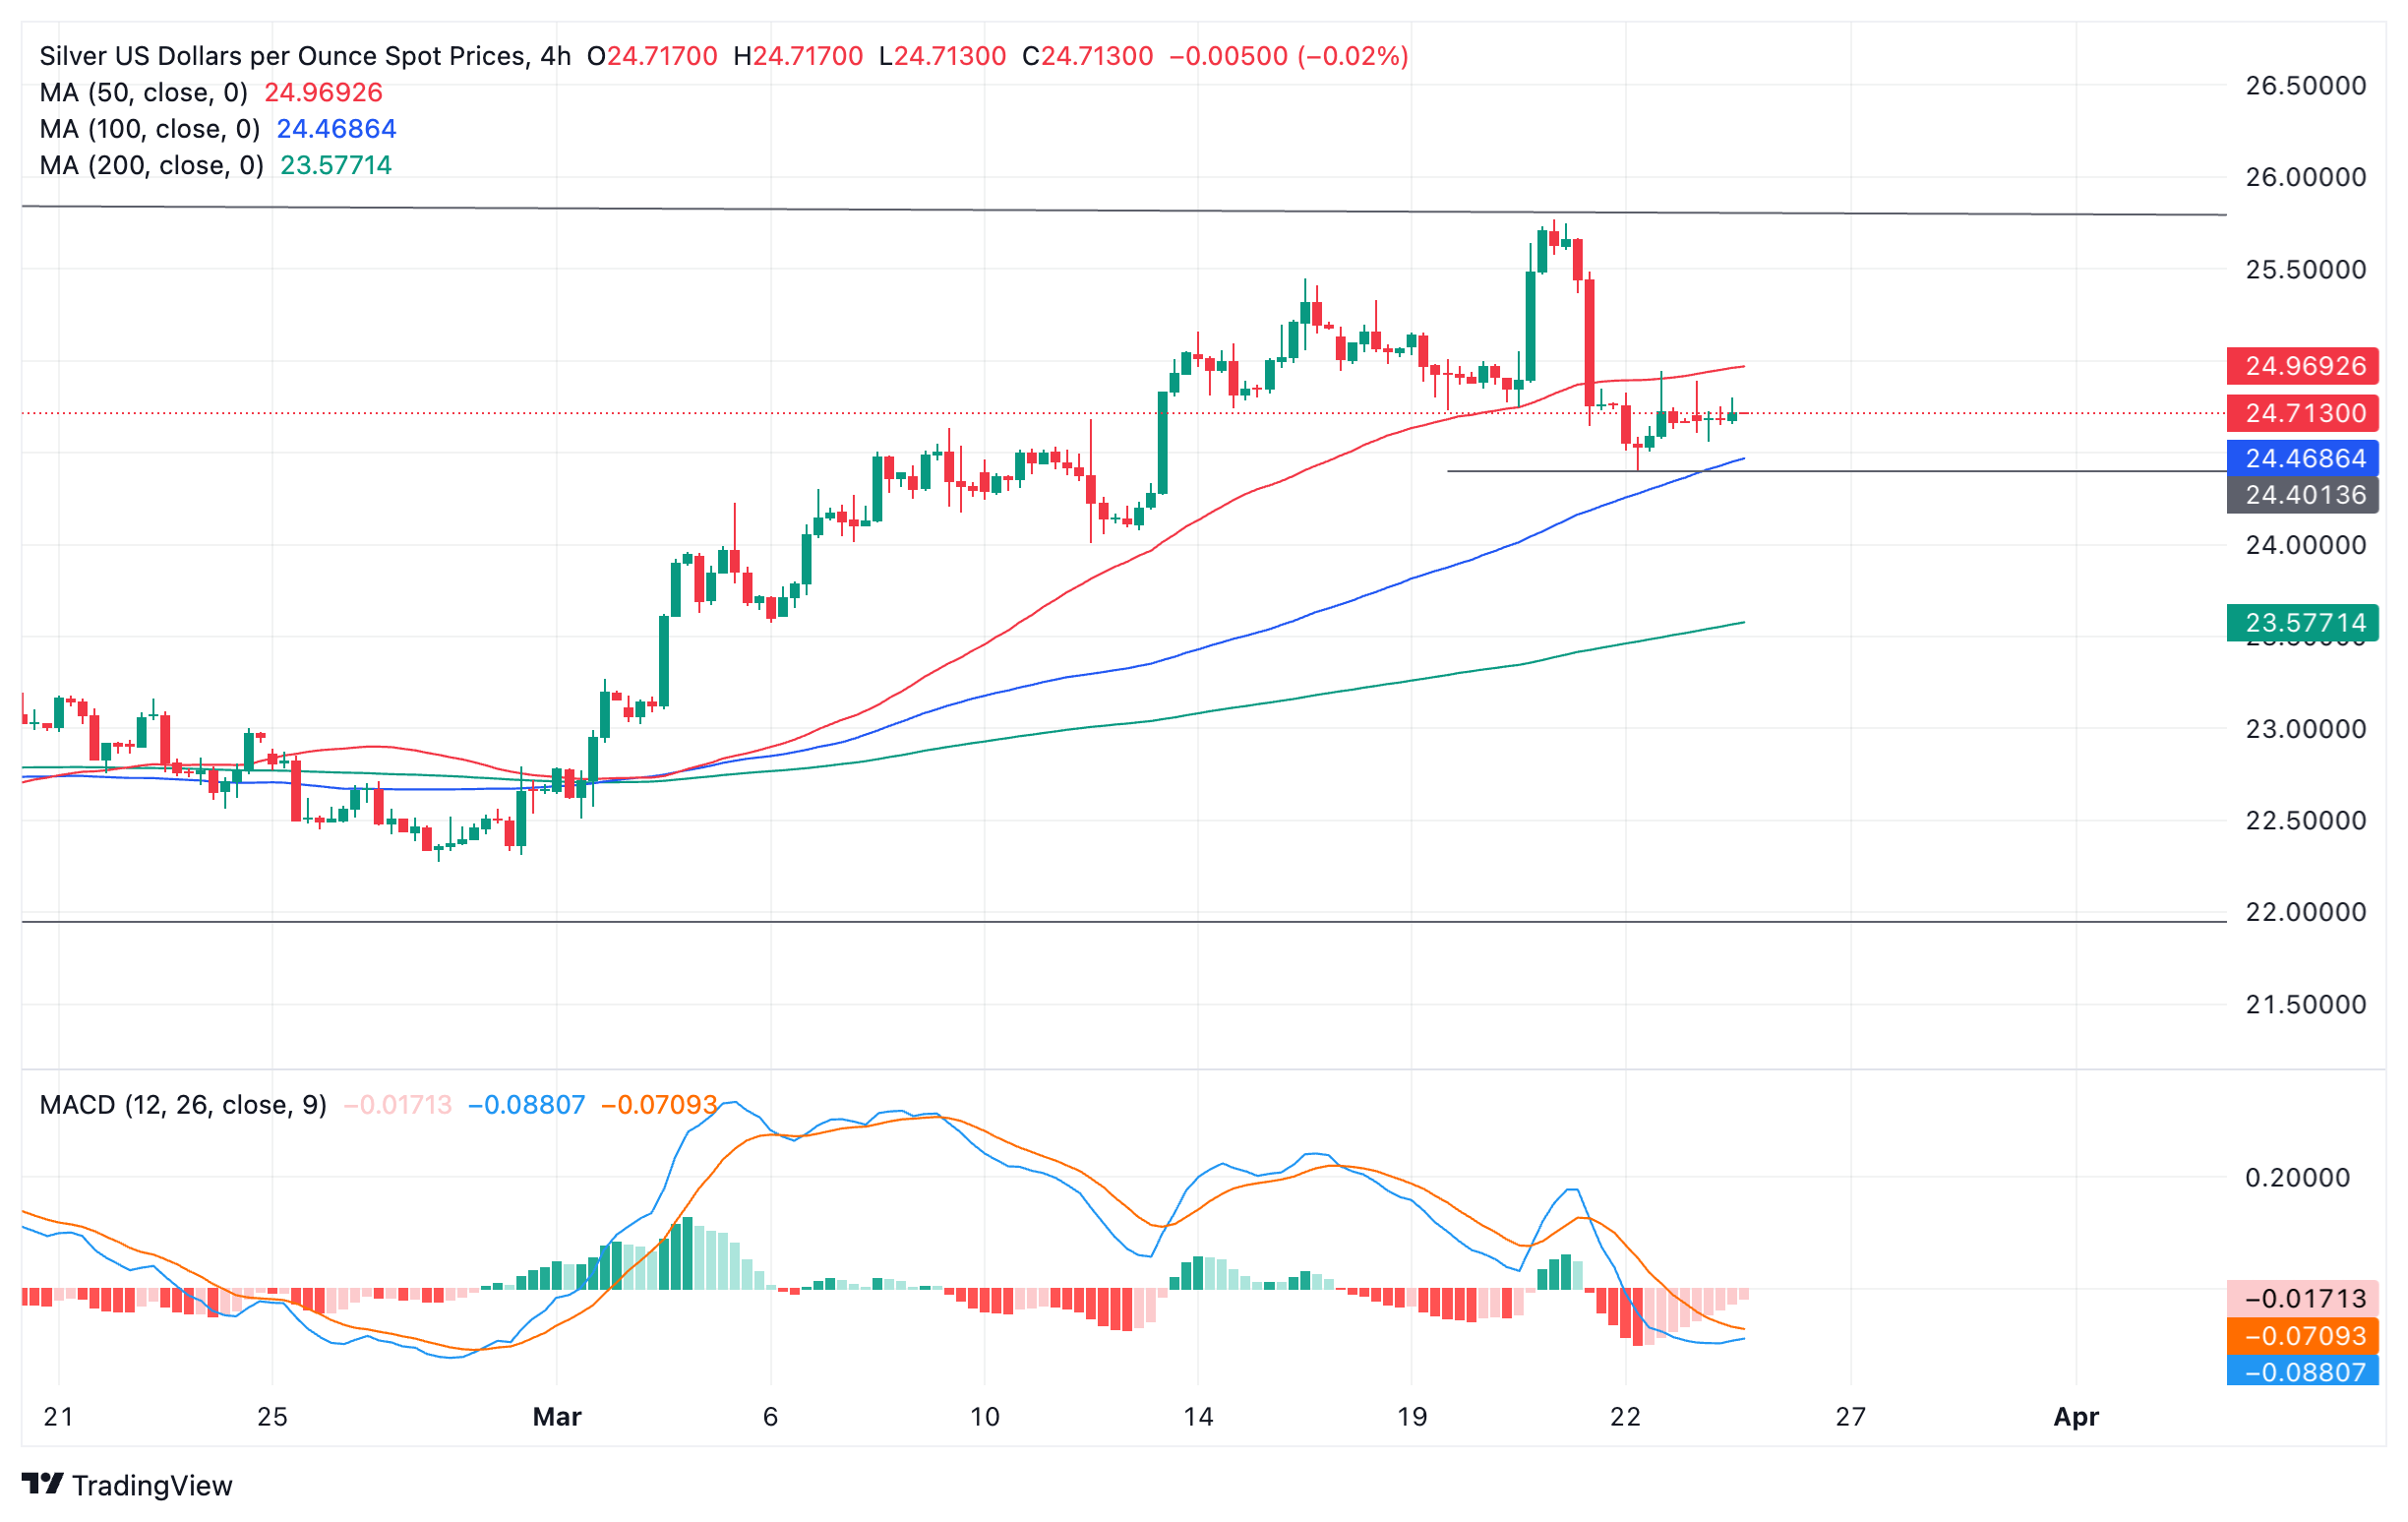
Silver versus the US Dollar: 4-hour chart
Silver price reversed direction at the long-term range highs on Thursday and began descending rapidly. The first sign the trend might be changing was the decisive break below the last swing low of the previous uptrend at roughly $24.710.
XAG/USD has completed one peak and trough lower since Thursday, if it completes another and manages to make a lower low, it would be a fairly reliable signal of a reversal of the uptrend. Such a reversal would probably usher in more weakness for the precious metal.
A break below the swing low at $24.400 would provide confirmation. XAG/USD is currently consolidating at key support-turned-resistance at around $24.700. This could be the point – known as a Bearish Breaker in technical analysis – where it meets supply and goes lower again.
A reversal of the short-term trend would indicate a probable move back down towards the lows of the range at around $22.000. An alternative, more conservative target might be the cluster of major moving averages, in the lower $23.000s, starting with the 100-day Simple Moving Average (SMA) at $23.490.
A bearish break lower would support the negative outlook on the daily chart which formed a Bearish Engulfing Japanese candlestick pattern on the daily chart on Thursday.
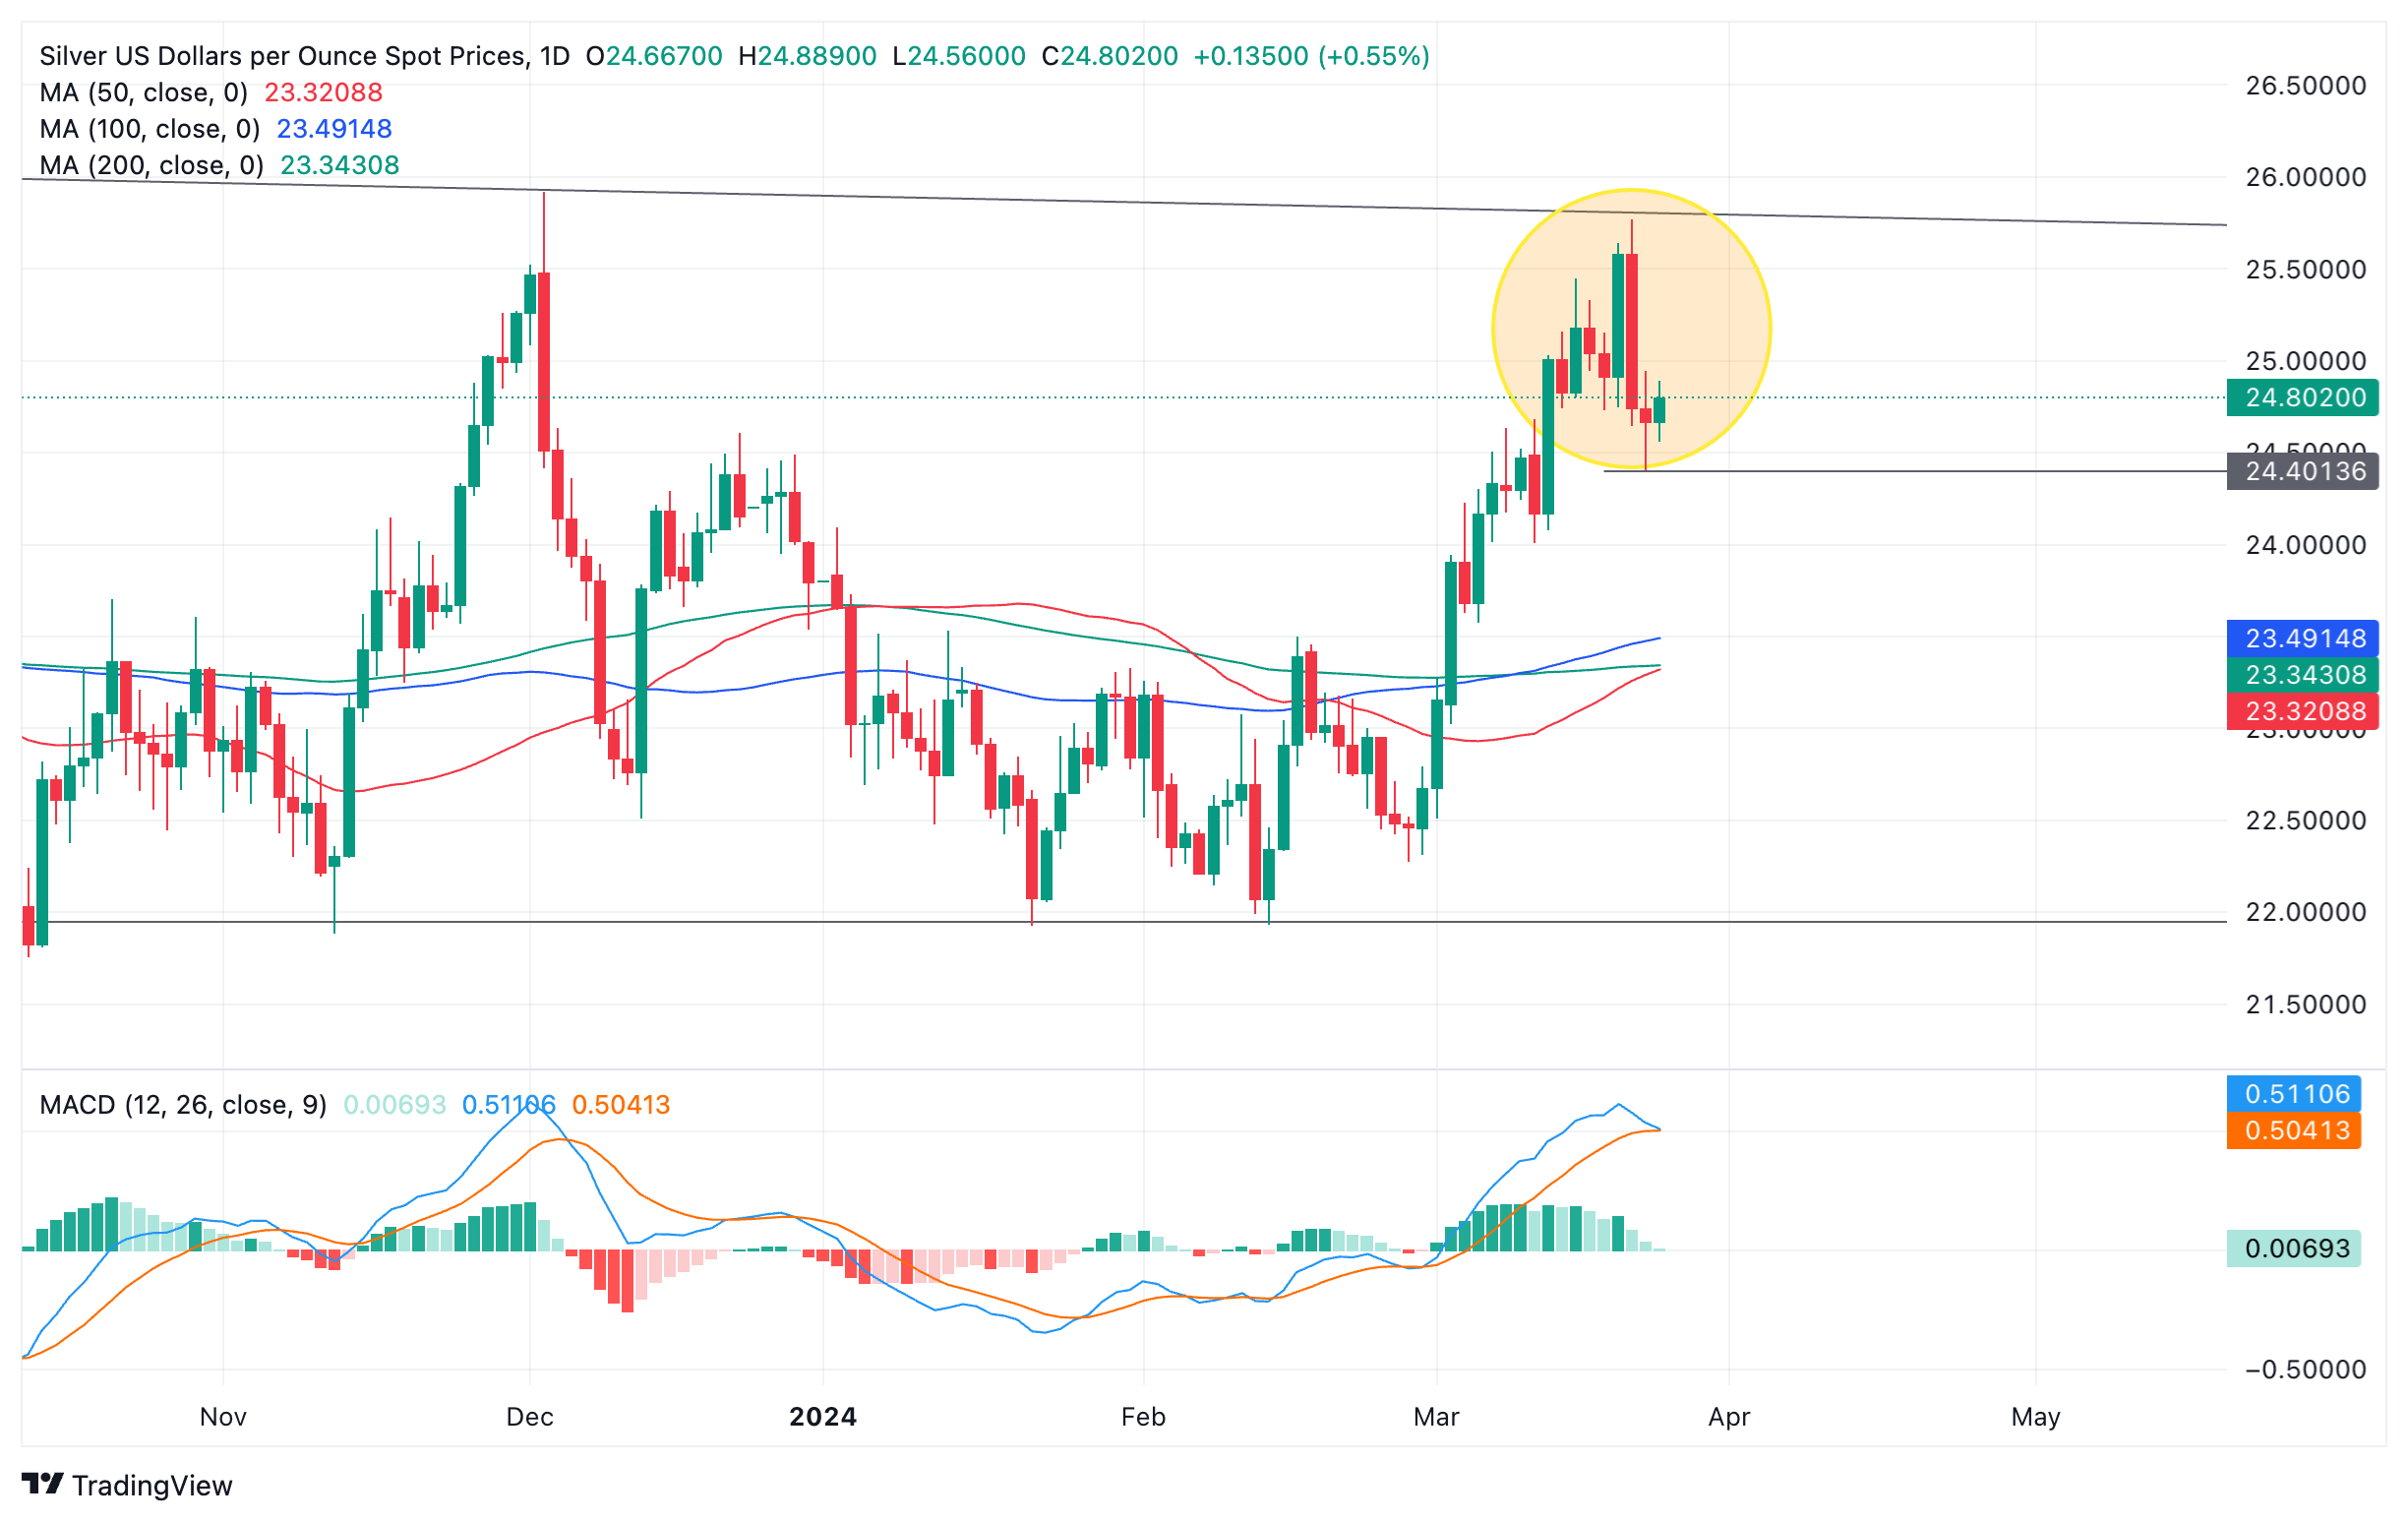
Silver versus US Dollar: Daily chart
The bearish candlestick was followed by a red down candlestick on Friday, providing added confirmation of a short-term reversal.
The Moving Average Convergence/ Divergence (MACD) momentum indicator is threatening to cross below its signal line, adding credence to the bearish reversal. The MACD is a particularly reliable indicator within range-bound markets and a cross would provide a good sell signal.
A break back above the $25.770 highs of Thursday, however, would indicate a probable extension of the uptrend.
A decisive break above the range highs would indicate even more bullish momentum higher. Such a move would be expected to then reach a conservative target at the 0.618 extrapolation of the height of the range from the breakout point higher, and a target at $28.524.
EUR/USD defends 1.0800. Economists at Société Générale analyze the pair’s technical outlook.
Crucial support at 1.0795/1.0760
EUR/USD rebound faced interim hurdle near 1.0980 resulting in a gradual pullback. It has dipped below the 200-DMA and is approaching recent pivot low near 1.0795/1.0760 which remains an important support. Defence of this zone could result in rebound but it would be interesting to see if the pair can re-establish beyond last week high of 1.0945. Failure could mean persistence in decline.
Break below 1.0795/1.0760 can lead to extension in down move towards February trough of 1.0695 and 1.0610.
Commenting on the inflation outlook, Federal Reserve Bank of Chicago President Austan Goolsbee said on Monday that they are "in a bit of a murky period."
Key quotes
"It doesn't feel like the story fundamentally changed."
"The Fed has to strike a balance with its dual mandate."
"We need to see progress in inflation coming down."
"The main puzzle with inflation is housing."
"Three cuts in 2024 was in line with my thinking."
Market reaction
The US Dollar Index stays under modest bearish pressure and was last seen losing 0.24% on the day at 104.18.
The US Dollar (USD) is tracking a little lower on the session. Economists at Scotiabank analyze Greenback’s outlook.
Easter week may be a little quiet for markets
USD losses are relatively limited within the core major currencies and while short-term price signals suggest the USD has peaked for now, scope for weakness may not be that significant in the near term.
Easter week may be a little quiet for markets. The calendar is pretty light today and for the week overall, there is not much top-tier US data to focus on – housing, regional Fed manufacturing surveys, Durable Goods, Personal Income, Spending and PCE.
The PCE data may be the data point the markets focus on this week. The street is looking for a 0.3% MoM gain in the core PCE reading while will leave the YoY rate steady at 2.8%. But these are February numbers and Chairman Powell commented last week that the early year numbers might be a ‘bump in the road’. March data are more important now.
Atlanta Federal Reserve Bank President Raphael Bostic said on Monday that he wants to avoid volatility from the balance sheet runoff.
Bostic added that he expects the US economy and inflation to slow gradually and repeated that he anticipates the US central bank to lower the policy rate once this year.
On Friday, he noted that inflation was falling more slowly than anticipated, with many items recording outsized price increases.
Market reaction
These comments failed to trigger a noticeable market reaction. At the time of press, the US Dollar Index was down 0.2% on the day at 104.22.
- WTI Oil finds support at $80.63 and jumps higher.
- Oil traders see demand possibly picking up and supply risks increasing due to geopolitical woes.
- The US Dollar Index trades above 104.00 though is a touch softer.
Oil prices are jumping higher on Monday after finding some technical support on the pivotal $80.63 level. Prices could be set to rise further due to both supply and demand factors. On the supply side, Russia faces issues from both sanctions and drone attacks from Ukraine on Russian refineries and storage facilities. On the demand side, the projection that the US Federal Reserve will cut three times this year, coupled with a decline in borrowing costs in Europe as well, could spur the global economy and thus demand for Oil.
The US Dollar, meanwhile, is retreating a touch from its last week’s rally. Although the Fed clearly communicated they will be cutting three times this year, markets appear not to be buying into the argumentation. This week, the Fed’s preferred inflation gauge – The Personal Consumption Expenditure (PCE) Price Index – is set to be released on Friday, and another pickup in inflation could mean mayhem in markets.
Crude Oil (WTI) trades at $81.04 per barrel, and Brent Oil trades at $85.29 per barrel at the time of writing.
Oil news and market movers: Russia getting crushed
- Markets are starting to gear up for possibly an extension of the 1 million barrel per day output cut from Saudi Arabia for the rest of the year to keep Oil afloat above $80.00.
- Bloomberg reports Iraq’s government and oil companies blamed each other for delays in resuming a key pipeline to Turkey, with discussion ongoing, that could keep the pipeline shut for longer.
- Goldman Sachs is bullish on commodities overall for this year as the US and Europe set to cut their interest rates.
- Indian refiners will no longer accept tankers owned by Russian state-run Sovcomflot PJSC because of the risk of sanctions.
Oil Technical Analysis: Up to OPEC to keep it above $80
Oil prices have found back their mojo, moving further away from the sub $70 levels seen earlier this year. Besides Russia being in the crosshairs, another big element is that markets are getting ready for another extension in production cuts from Saudi Arabia. With markets getting accustomed to the recent balance, a pickup in demand and another Saudi extension could be a perfect mix to push crude up to $90.
Oil bulls will see $86 appearing as the next cap. Further up, $86.90 follows suit before targeting $89.64 and $93.98 as top levels.
On the downside, both $80.00 and $80.60 should be acting as support now with the 200-day Simple Moving Average (SMA) as the level to catch any falling knives near $78.46. The 100-day and the 55-day SMA’s are near $75.54 and $76.79, respectively. Add the pivotal level near $75.27, and it looks like the downside is very limited and well-equipped to resist the selling pressure.
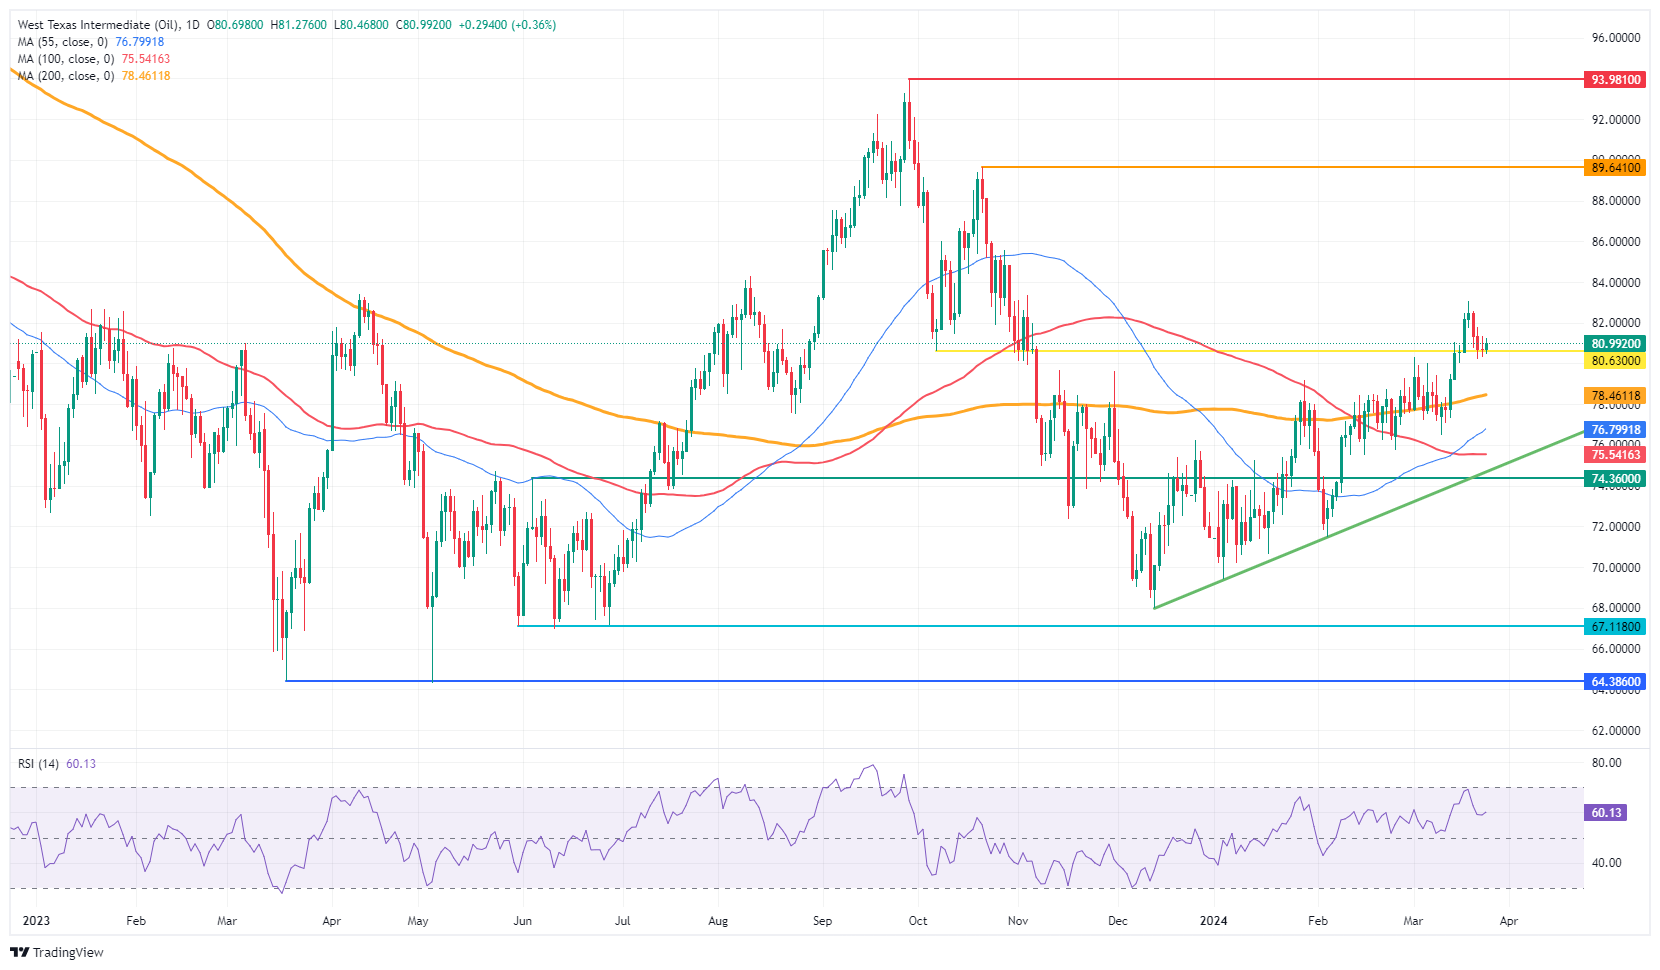
US WTI Crude Oil: Daily Chart
WTI Oil FAQs
WTI Oil is a type of Crude Oil sold on international markets. The WTI stands for West Texas Intermediate, one of three major types including Brent and Dubai Crude. WTI is also referred to as “light” and “sweet” because of its relatively low gravity and sulfur content respectively. It is considered a high quality Oil that is easily refined. It is sourced in the United States and distributed via the Cushing hub, which is considered “The Pipeline Crossroads of the World”. It is a benchmark for the Oil market and WTI price is frequently quoted in the media.
Like all assets, supply and demand are the key drivers of WTI Oil price. As such, global growth can be a driver of increased demand and vice versa for weak global growth. Political instability, wars, and sanctions can disrupt supply and impact prices. The decisions of OPEC, a group of major Oil-producing countries, is another key driver of price. The value of the US Dollar influences the price of WTI Crude Oil, since Oil is predominantly traded in US Dollars, thus a weaker US Dollar can make Oil more affordable and vice versa.
The weekly Oil inventory reports published by the American Petroleum Institute (API) and the Energy Information Agency (EIA) impact the price of WTI Oil. Changes in inventories reflect fluctuating supply and demand. If the data shows a drop in inventories it can indicate increased demand, pushing up Oil price. Higher inventories can reflect increased supply, pushing down prices. API’s report is published every Tuesday and EIA’s the day after. Their results are usually similar, falling within 1% of each other 75% of the time. The EIA data is considered more reliable, since it is a government agency.
OPEC (Organization of the Petroleum Exporting Countries) is a group of 13 Oil-producing nations who collectively decide production quotas for member countries at twice-yearly meetings. Their decisions often impact WTI Oil prices. When OPEC decides to lower quotas, it can tighten supply, pushing up Oil prices. When OPEC increases production, it has the opposite effect. OPEC+ refers to an expanded group that includes ten extra non-OPEC members, the most notable of which is Russia.
- Gold price is vulnerable to a temporary pullback as indicators flash "sell".
- A Shooting Star Japanese candlestick pattern at the all-time-highs adds bearishness.
- A five wave Elliott Wave impulse move may have completed, further suggesting a deeper pullback on the horizon.
Gold (XAG/USD) price is trading in the $2,174.000s after edging higher on the back of safe-haven flows at the start of the week.
Despite the heartbeat higher on Monday Gold continues to broadly consolidate after pulling back from a new record-high of $2,223.220 reached on Thursday.
The precious metal is in an uptrend on all major timeframes. Technical indicators, however, are showing XAG/USD is likely to continue consolidating for a while before going higher again.
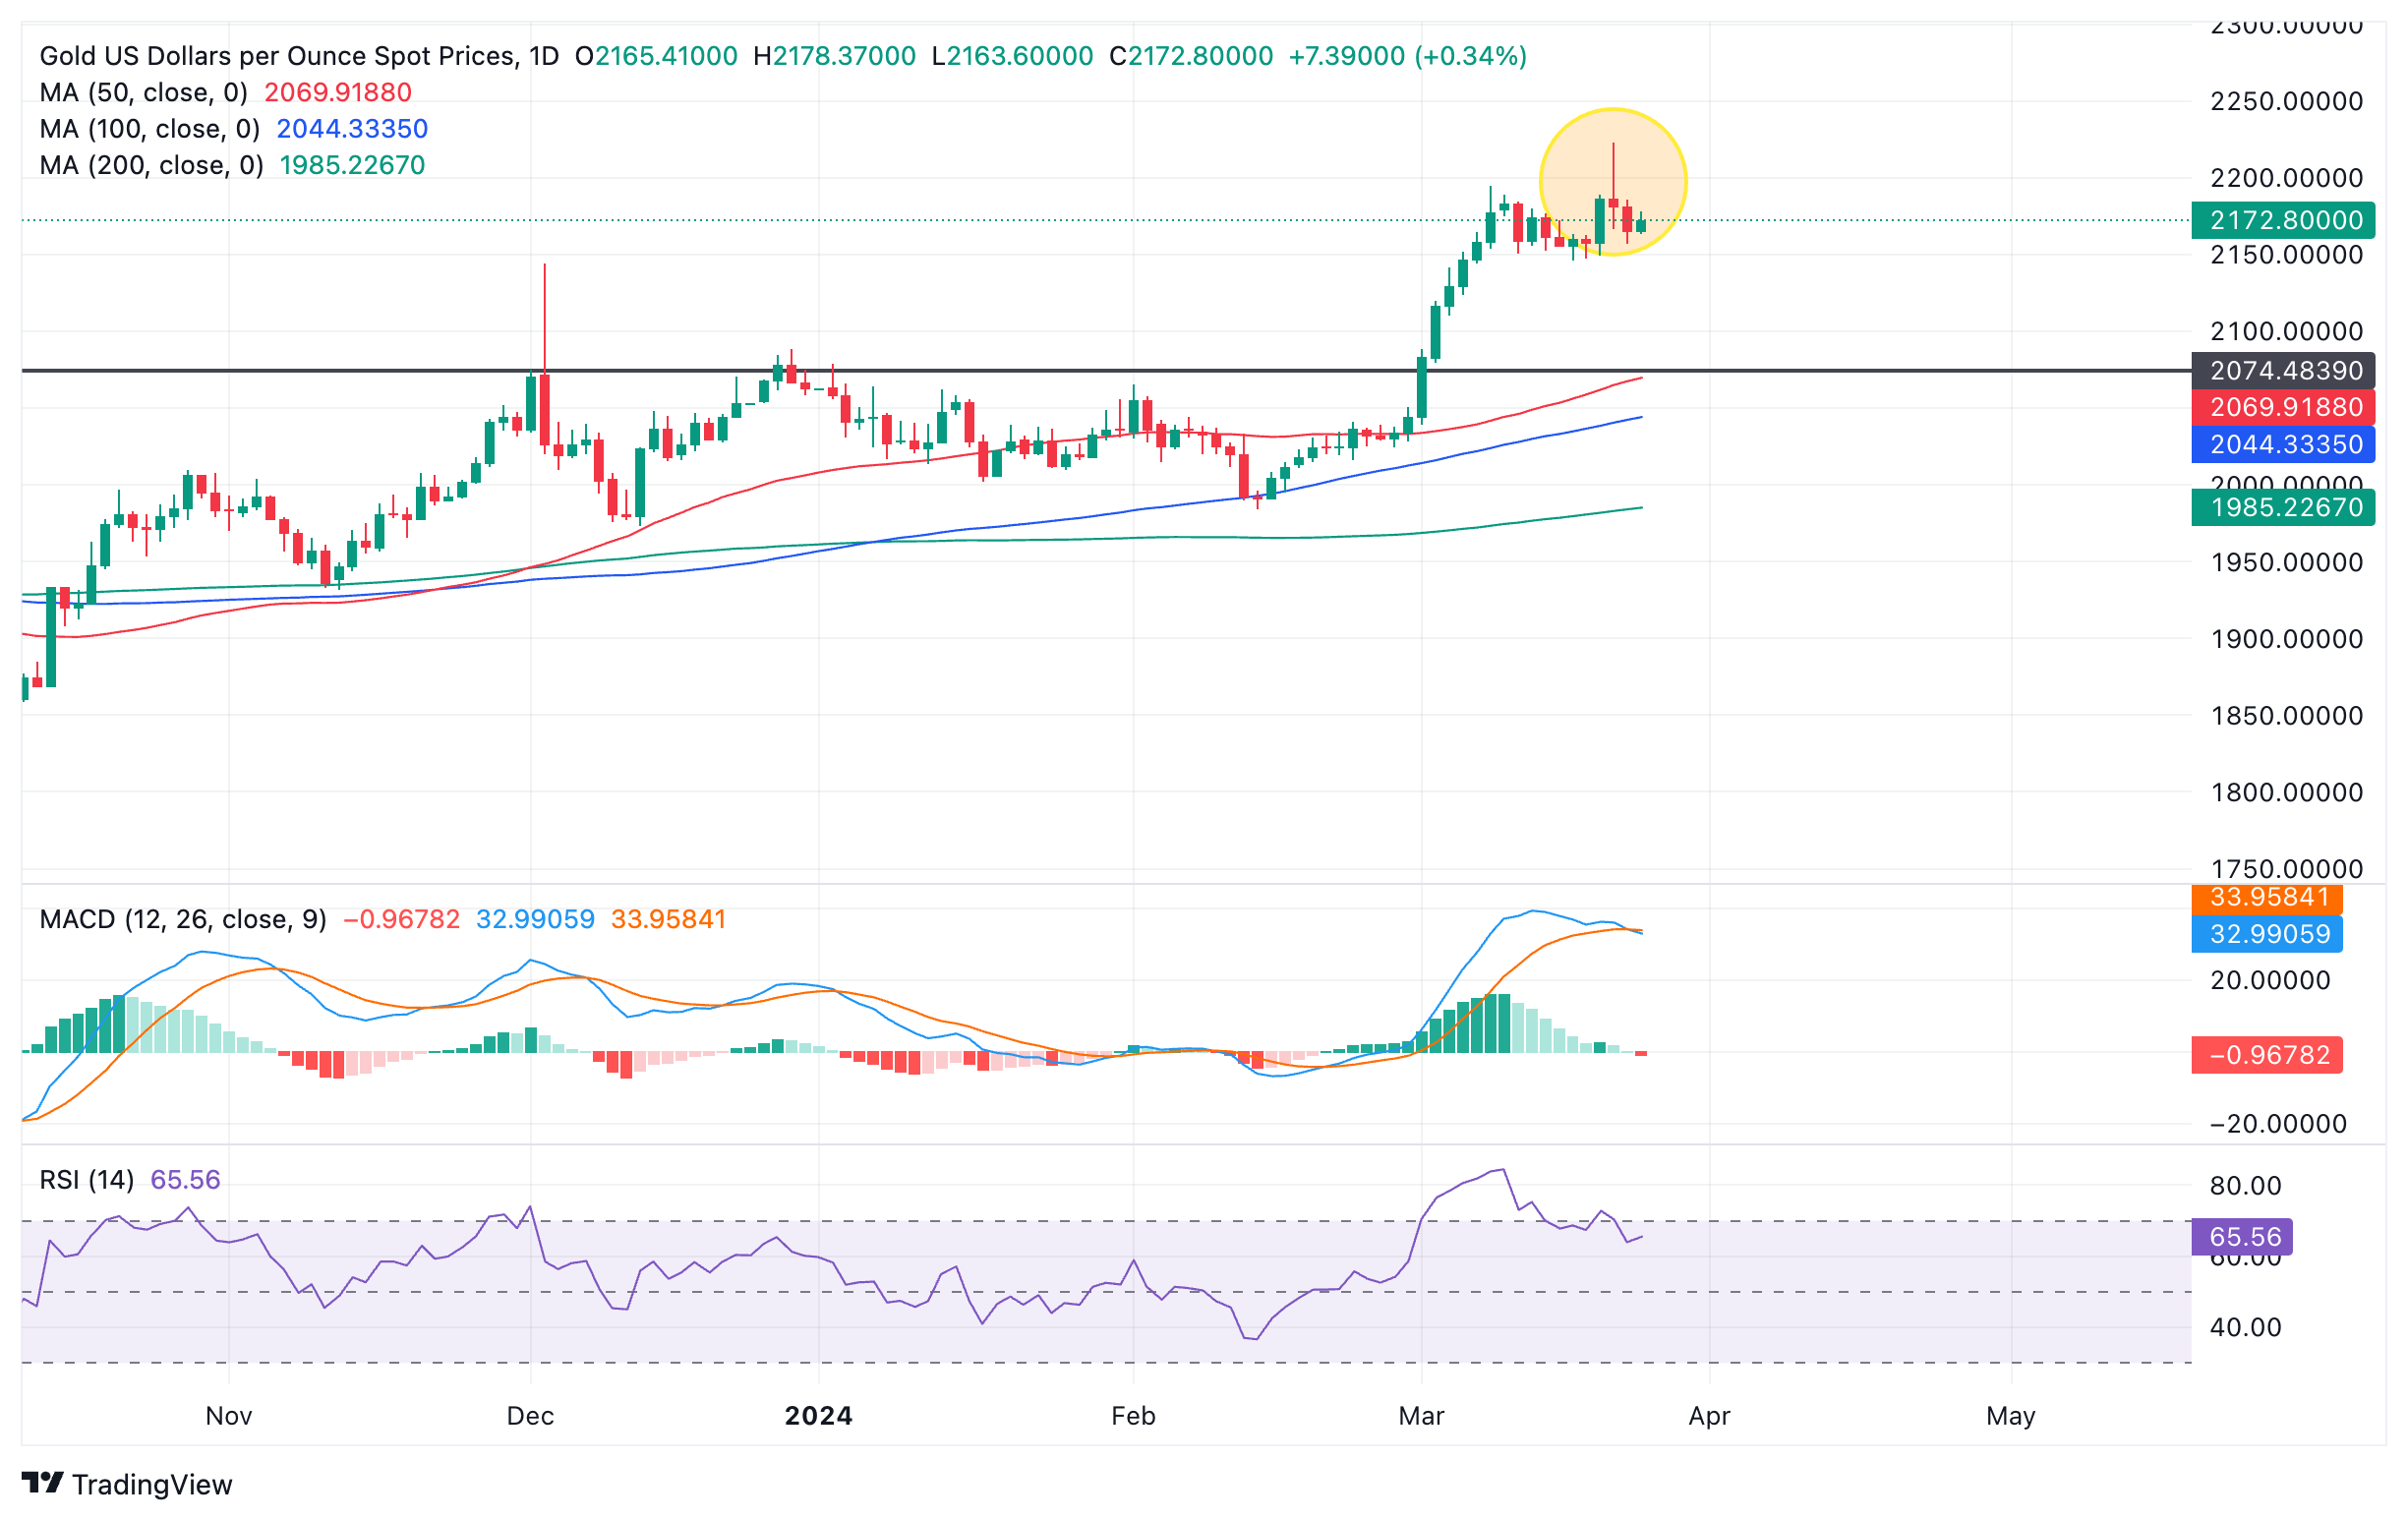
Gold versus US Dollars: Daily chart
Gold price has formed a textbook Shooting Star Japanese candlestick pattern at Thursday’s highs (circled above), suggesting the risk of a short-term reversal. This was followed by a bearish red candlestick on Friday which provided the Shooting Star with confirmation. This increased the chances of more downside.
The Moving Average Convergence/ Divergence (MACD) and Relative Strength Index (RSI) momentum indicators are both showing bearish divergence with Gold price and both giving sell signals.
The MACD has crossed below its signal line which is a signal to short sell the pair, and is lower than it was at the March 8 highs when it peaked. Since then it has declined, diverging with price, which carried on rising to a peak on March 21.
The RSI has just exited overbought which is a classic sell signal and is showing divergence with March 9 when it peaked in the overbought zone.
These are both indications of underlying weakness and a predisposition to weakness, although on their own they are not strong conclusive enough to signal a reversal of the bull trend, just a correction.
Gold versus US Dollars: Daily chart
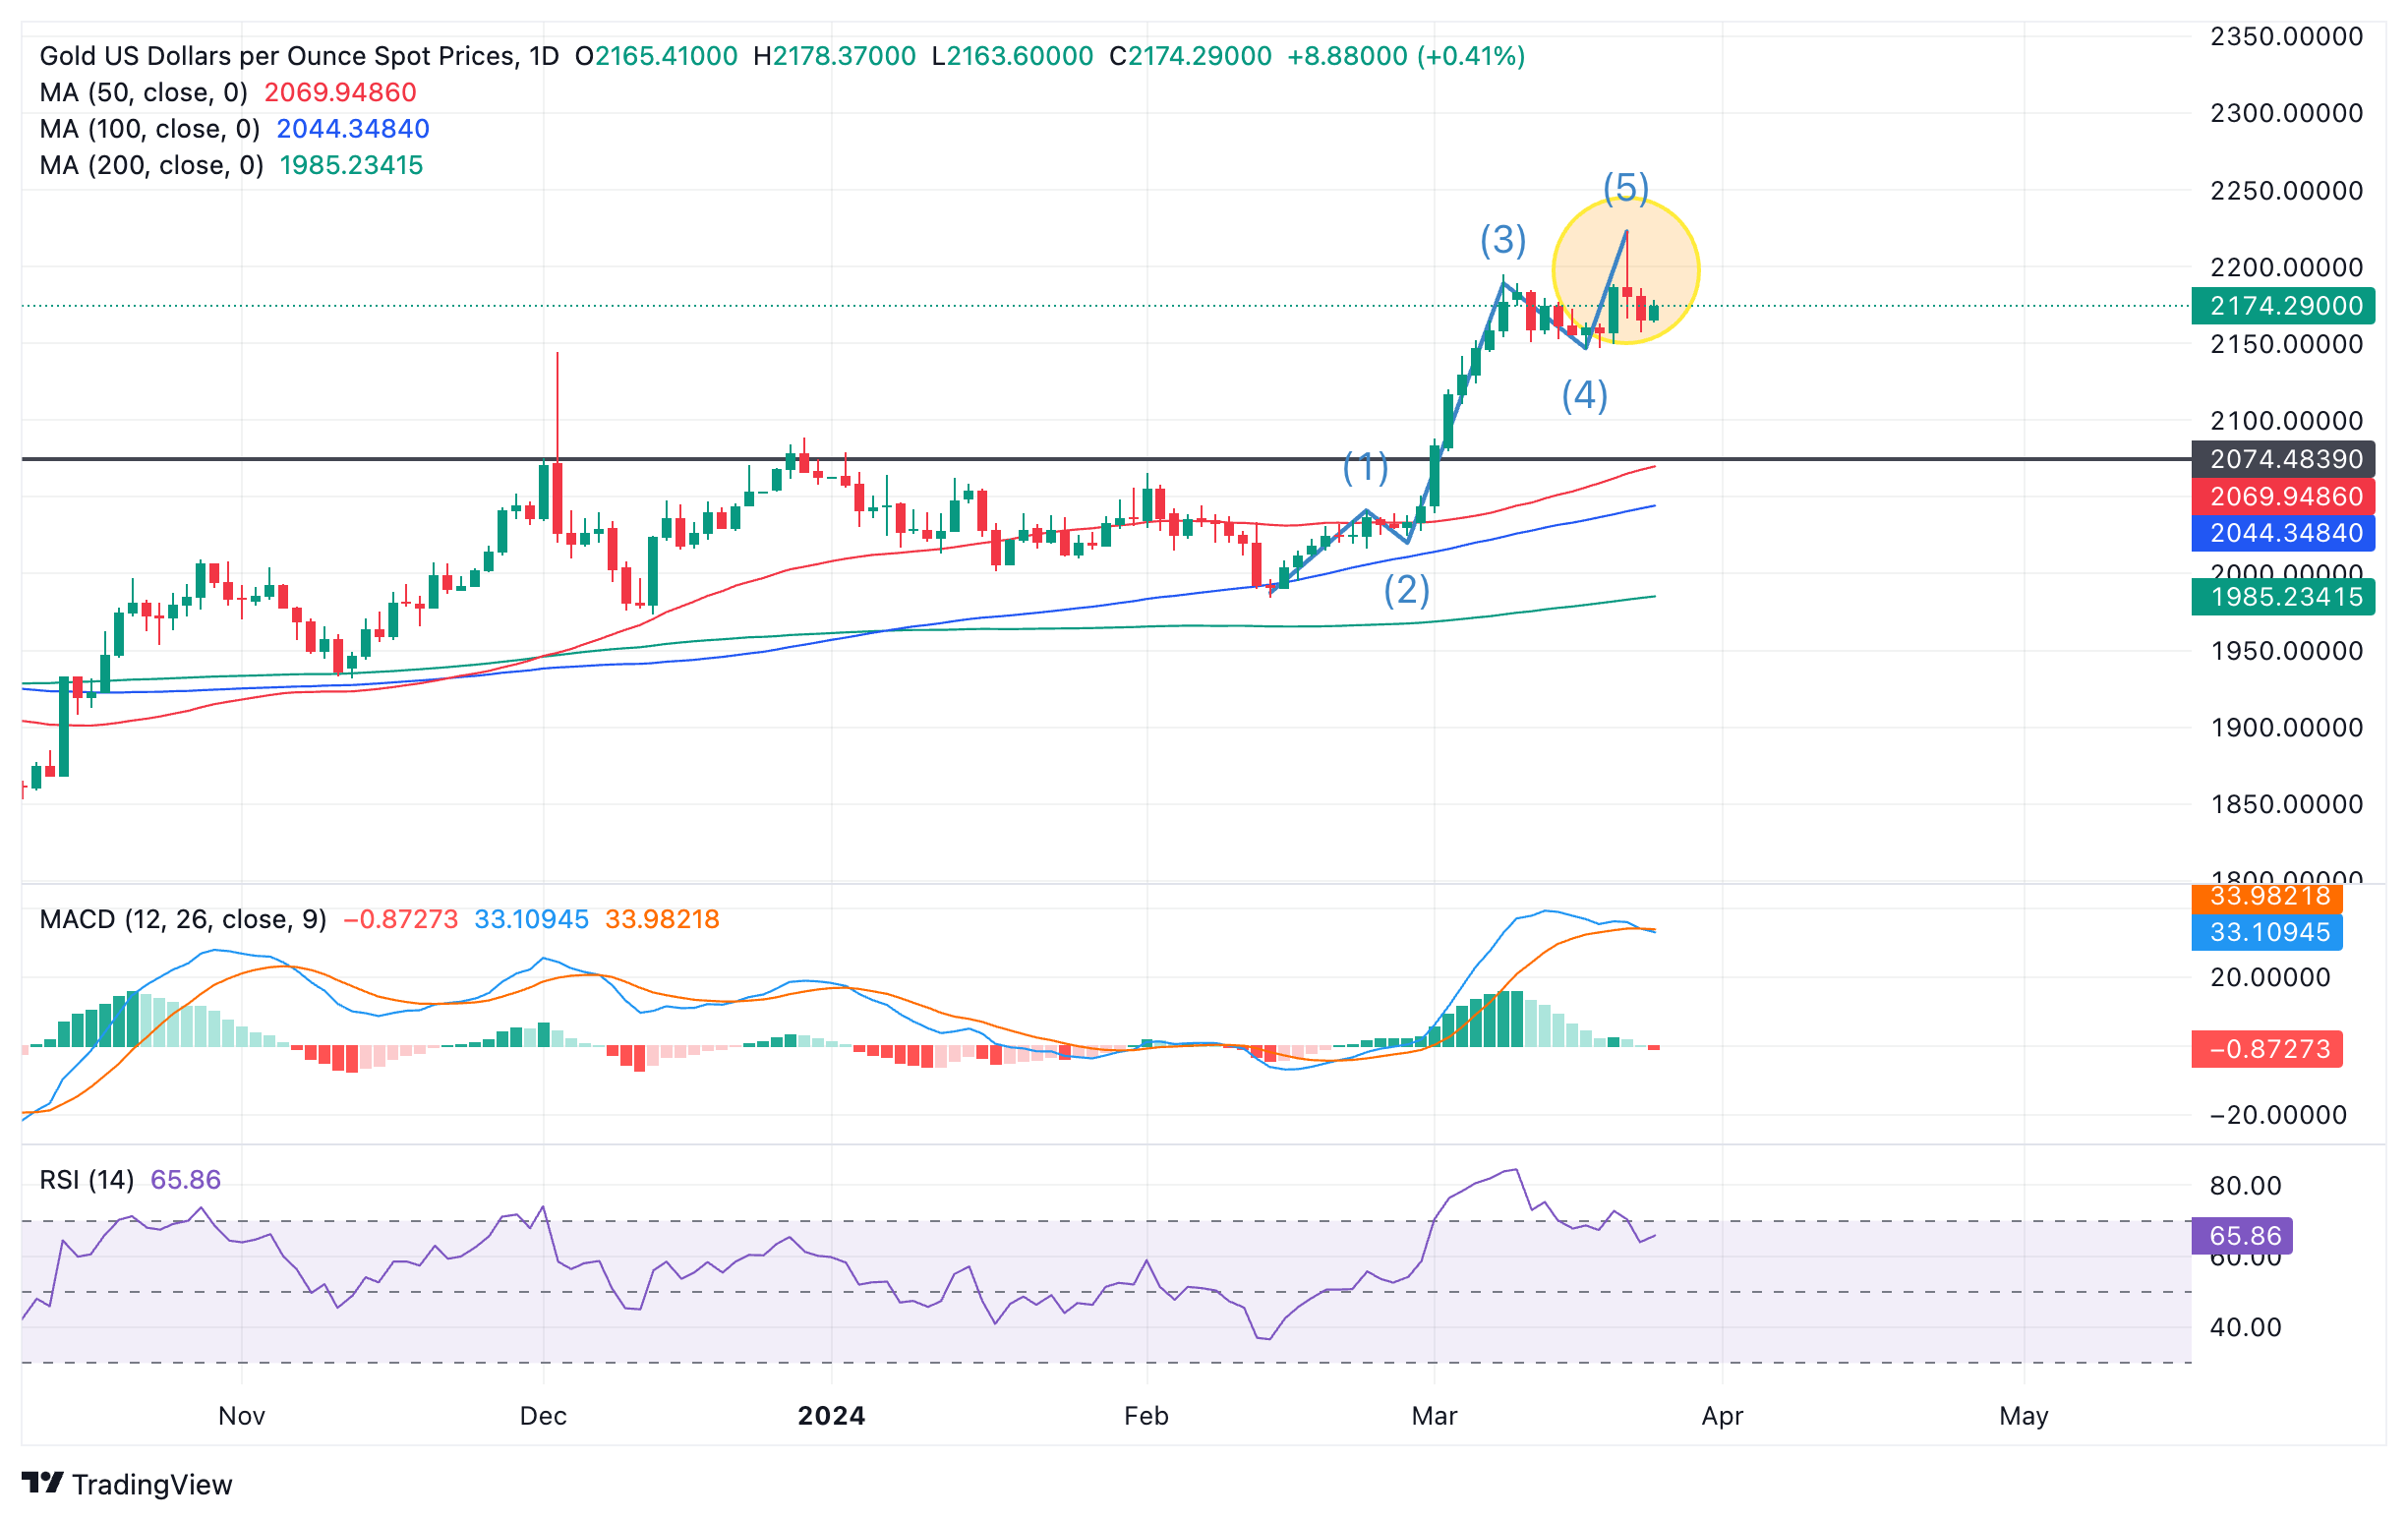
Gold price could also be vulnerable to a deeper correction if analyzed using Elliott Waves. The move up from the Valentine’s Day lows is a text book five-wave Elliott Wave impulse move. It suggests the possibility the up move is not temporarily complete and will likely soon be followed by an ABC correction, which could take it down to as low as the top of wave (1) at around $2,040.000.
Given the overarching uptrend, however, a more conservative target for the pullback would be the midpoint of the whole impulse move at roughly $2,107.000. Confirmation would come from a move below the low of wave (4) at $2,146.160.
After the pullback is complete, however, Gold price is likely to resume its rally in line with the dominant bull trend.
USD/CAD gains stall around 1.3600. Economists at Scotiabank analyze the pair’s outlook.
Price action is bearish
Short-term price action is leaning negative for the USD after spot peaked a little below 1.3615, close to where the USD has topped out a number of times since late February.
Price action is bearish (an ‘evening star’ candle pattern formed on the six-hour chart since late Friday) which should mean some corrective drift lower in in funds in the near term towards 1.3535/1.3555.
The low 1.3600 zone continues to look pretty solid resistance for the USD.
GBP/USD rebounds from near recent lows just under 1.2600. Economists at Scotiabank analyze the pair’s outlook.
Support on dips to the upper 1.2500s has been consistent recently
Sterling’s rebound from Friday’s low (a little below the 200-DMA at 1.2592) looks a bit more meaningful than many of its peers on the day so far.
Price signals are not obviously bullish on the intraday chart and trend momentum signals are aligned bearishly against the GBP on the intraday and daily oscillators. Still, support for the GBP on dips to the upper 1.2500s has been consistent recently and corrective gains in the Pound could extend a little more in the short run. Look for resistance around 1.2665/1.2675, however.
Support is 1.2590/1.2600.
- The US Dollar retreats a touch on Monday after failing to break Friday's high.
- Traders are looking forward to a very choppy trading week, with a bank holiday on Friday.
- The US Dollar Index steadies in the mid-104.00 range ahead of GDP and PCE data.
The US Dollar (USD) is facing a “pop quiz” moment before traders can enjoy a bank holiday this week, with many trading desks and markets across the globe closed on Good Friday. Traders will likely continue to speculate on whether the Fed’s thesis of three cuts for this year is still valid, with a few interesting leading economic indicators and US Gross Domestic Product (GDP) numbers at hand. As if that is not enough, on Good Friday (with thin liquidity and most markets closed), the US will release the Fed’s preferred inflation gauge: the Personal Consumption Expenditures (PCE) Price Index for February.
On the economic data front, Monday offers a soft opening for the trading week with only US New Home Sales as the data point to trade on. Three US Federal Reserve members are due to make an appearance: Lisa Cook, who is a member of the Board of Governors at the Fed, Chicago Fed President Austan Goolsbee and Atlanta Fed Raphael Bostic. In the bond market, the US Treasury will be very active with three bond auctions taking place this Monday.
Daily digest market movers: Asia has a hangover
- The People’s Bank of China (PBoC) fixed its Yuan substantially stronger against the US Dollar, triggering a lower USD/CNH, which, in a domino effect, puts the Greenback on the backfoot.
- The release of Minutes from the latest Bank of Japan meeting saw equities in Japan plunge as the documents signalled that the BoJ is considering to hike interest rates more than what markets were expecting.
- This Monday kicks off with New Home Sales data for February at 14:00 GMT. In January, sales rose by 1.5%.
- Three Fed speakers on the docket for this Monday:
- Atlanta Fed President Raphael Bostic will speak at 12:25 GMT.
- Chicago Fed President Austan Goolsbee will speak around 13:05 GMT.
- US Fed Board member Lisa Cook will speak around 14:30 GMT.
- The US Treasury is set to allocate three fresh bond issuances this Monday:
- A 3-month and a 6-month bill near 15:30 GMT.
- A 2-year note is expected to be placed at 17:00 GMT.
- Equities are falling sharply on Monday. Asia indices are down, led by Japan’s Nikkei, which closed off at more than 1% in the red ¡. Europe is following suit, with a negative opening for both the Stoxx 50 and the German Dax, while US Futures are roughly flat.
- According to the CME Group’s FedWatch Tool, expectations for the Fed’s May 1 meeting are at 89.2% for keeping the fed funds rate unchanged, while chances of a rate cut are at 10.8%.
- The benchmark 10-year US Treasury Note trades around 4.21%, the lower end of this week.
US Dollar Index Technical Analysis: Who is right and who is wrong?
The US Dollar Index (DXY) is trading broadly steady above 104.00. However, some easing could be in the cards this week as the Greenback looks for that equilibrium between the dovish Fed and the rather challenging markets on that possible outcome. The truth will probably be somewhere in the middle, which means the DXY could retreat a few points to challenge 104.00 and snap below this barrier by the end of the week.
The DXY is still eyeballing that pivotal level near 104.60, where last week’s rally peaked out. Further up, 104.96 remains the first level in sight. Once above there, the peak at 104.97 from February comes into play ahead of the 105.00 region, with 105.12 as the first resistance.
Support from the 200-day Simple Moving Average (SMA) at 103.72, the 100-day SMA at 103.50, and the 55-day SMA at 103.61 are getting a fresh chance to show their importance. The 103.00 big figure looks to remain unchallenged for now after the decline from the Fed meeting last week got turned around way before reaching it.
US Dollar FAQs
The US Dollar (USD) is the official currency of the United States of America, and the ‘de facto’ currency of a significant number of other countries where it is found in circulation alongside local notes. It is the most heavily traded currency in the world, accounting for over 88% of all global foreign exchange turnover, or an average of $6.6 trillion in transactions per day, according to data from 2022. Following the second world war, the USD took over from the British Pound as the world’s reserve currency. For most of its history, the US Dollar was backed by Gold, until the Bretton Woods Agreement in 1971 when the Gold Standard went away.
The most important single factor impacting on the value of the US Dollar is monetary policy, which is shaped by the Federal Reserve (Fed). The Fed has two mandates: to achieve price stability (control inflation) and foster full employment. Its primary tool to achieve these two goals is by adjusting interest rates. When prices are rising too quickly and inflation is above the Fed’s 2% target, the Fed will raise rates, which helps the USD value. When inflation falls below 2% or the Unemployment Rate is too high, the Fed may lower interest rates, which weighs on the Greenback.
In extreme situations, the Federal Reserve can also print more Dollars and enact quantitative easing (QE). QE is the process by which the Fed substantially increases the flow of credit in a stuck financial system. It is a non-standard policy measure used when credit has dried up because banks will not lend to each other (out of the fear of counterparty default). It is a last resort when simply lowering interest rates is unlikely to achieve the necessary result. It was the Fed’s weapon of choice to combat the credit crunch that occurred during the Great Financial Crisis in 2008. It involves the Fed printing more Dollars and using them to buy US government bonds predominantly from financial institutions. QE usually leads to a weaker US Dollar.
Quantitative tightening (QT) is the reverse process whereby the Federal Reserve stops buying bonds from financial institutions and does not reinvest the principal from the bonds it holds maturing in new purchases. It is usually positive for the US Dollar.
EUR/USD is finding a little bargain-hunting support in the low 1.0800s, economists at Scotiabank say.
Potential for additional EUR gains is not obvious
Price action has steadied and the EUR has found a minor bid against support in the 1.0800 area, where spot based at the end of February. But the lift seen in the EUR so far is limited and the potential for additional EUR gains is not obvious at this point.
EUR/USD gains through 1.0835/1.0840 should add to positive momentum in the near term and help lift spot to the mid/upper 1.0800s.
Support is 1.0800 and – firmer – 1.0775.
- The Swiss Franc has found its feet after investors turn risk averse on Monday morning.
- The launch of an EU probe into big tech giants' practices and renewed attacks on Kyiv are unsettling markets.
- USD/CHF reaches an upside target and pulls back.
The Swiss Franc (CHF) edges higher on Monday as increased risk aversion pushes investors into safe-havens, of which the Swiss Franc is one of the best known.
The flight to safety comes on the news that the European Union (EU) has launched an investigation into big tech giants such as Apple, Google and Meta on Monday, according to ABC News.
The news that Russia has launched hypersonic missiles at Ukraine’s capital Kyiv may have further unsettled markets.
Major European indices such as the DAX, CAC40 and FTSE 100 are down by roughly half a percent on Monday at the time of publication. US Futures are off by a quarter of a percent.
Swiss Franc benefits from safety trade
The Swiss Franc is gaining at the expense of competitors as risk aversion permeates markets at the start of the week. The news on Monday that the EU Commission has launched an investigation into big tech companies for suspected “non-compliance” of its Digital Markets Act (DMA) has been given as a key factor rattling investors.
The DMA seeks to broadly level the playing field in digital markets by preventing online big tech platforms from acting as “gatekeepers” and thereby monopolizing digital ecosystems.
The Commission “suspects that the measures put in place by these gatekeepers fall short of effective compliance of their obligations under the DMA,” according to the EU’s press release.
In Kyiv, meanwhile, a series of hypersonic missiles escalated the conflict in Ukraine, causing damage to buildings and wounding two civilians in the central Pechersk district, as well as damaging buildings in the Solomiansky, Holosiyvsky and Dnipro districts, according to the Independent.
Technical Analysis: Swiss Franc meets first target for breakout and pulls back
USD/CHF, the number of Swiss Francs purchasable with one US Dollar (USD), is trading in the upper 0.8900s after breaking out and rallying above a range it had been yo-yoing in since the middle of February.
The pair has met the conservative target for the breakout at 0.8984 and has pulled back. The target is calculated as the 0.618 Fibonacci extension of the height of the range extended from the breakout point higher.
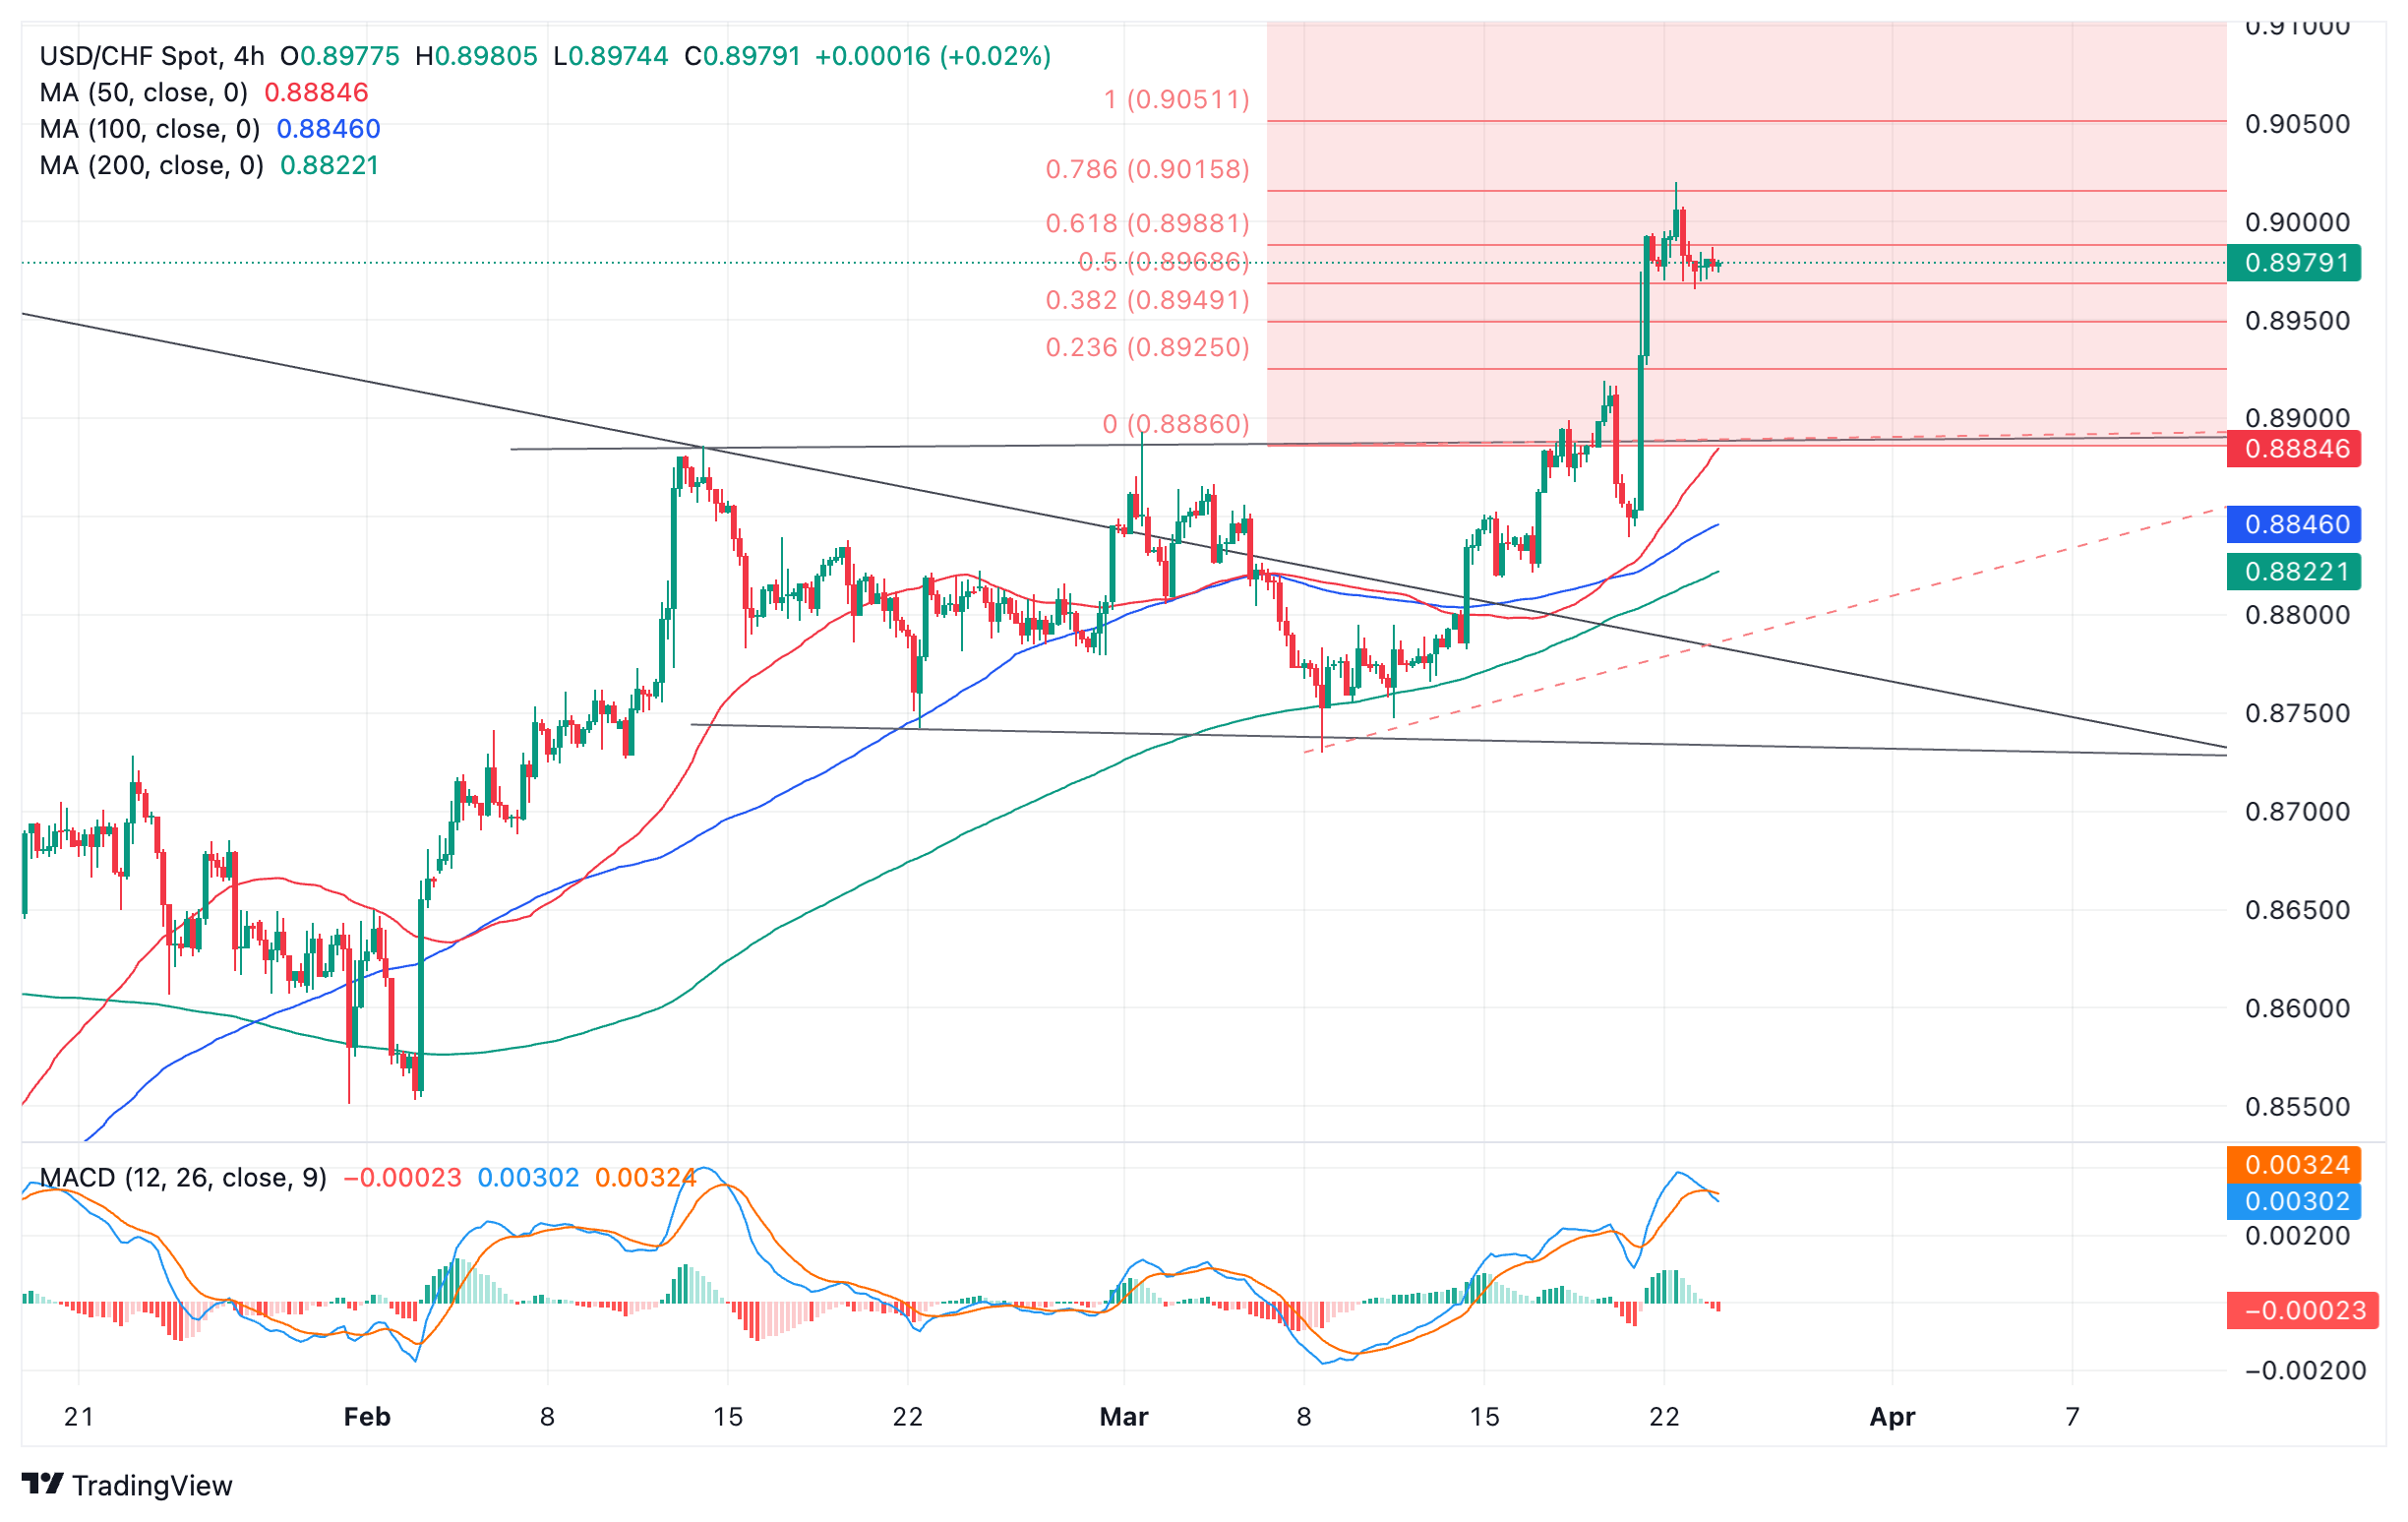
US Dollar versus Swiss Franc: 4-hour chart
The next target for the breakout is at 0.9052, the full height (1.000 ratio) of the range extrapolated higher.
There is a risk the pair could correct lower before attempting the next target. The Moving Average Convergence/ Divergence (MACD) indicator has just crossed below its signal line on the 4-hour chart, indicating the probability the pair will pull back.
If the correction continues it could target at the midpoint of the breakout rally, situated at roughly 0.8930.
Beyond that, the pair is overall seen continuing the short-term uptrend that formed prior to the range and its breakout higher.
It would take a break back below 0.8729 to suggest a short-term trend reversal and the start of a deeper slide.
The first target for such a move would be the 0.618 Fib. extrapolation of the height of the range at 0.8632, followed by the full extrapolation at 0.8577, which is also close to the 0.8551 January 31 lows, another key support level to the downside.
Swiss Franc FAQs
The Swiss Franc (CHF) is Switzerland’s official currency. It is among the top ten most traded currencies globally, reaching volumes that well exceed the size of the Swiss economy. Its value is determined by the broad market sentiment, the country’s economic health or action taken by the Swiss National Bank (SNB), among other factors. Between 2011 and 2015, the Swiss Franc was pegged to the Euro (EUR). The peg was abruptly removed, resulting in a more than 20% increase in the Franc’s value, causing a turmoil in markets. Even though the peg isn’t in force anymore, CHF fortunes tend to be highly correlated with the Euro ones due to the high dependency of the Swiss economy on the neighboring Eurozone.
The Swiss Franc (CHF) is considered a safe-haven asset, or a currency that investors tend to buy in times of market stress. This is due to the perceived status of Switzerland in the world: a stable economy, a strong export sector, big central bank reserves or a longstanding political stance towards neutrality in global conflicts make the country’s currency a good choice for investors fleeing from risks. Turbulent times are likely to strengthen CHF value against other currencies that are seen as more risky to invest in.
The Swiss National Bank (SNB) meets four times a year – once every quarter, less than other major central banks – to decide on monetary policy. The bank aims for an annual inflation rate of less than 2%. When inflation is above target or forecasted to be above target in the foreseeable future, the bank will attempt to tame price growth by raising its policy rate. Higher interest rates are generally positive for the Swiss Franc (CHF) as they lead to higher yields, making the country a more attractive place for investors. On the contrary, lower interest rates tend to weaken CHF.
Macroeconomic data releases in Switzerland are key to assessing the state of the economy and can impact the Swiss Franc’s (CHF) valuation. The Swiss economy is broadly stable, but any sudden change in economic growth, inflation, current account or the central bank’s currency reserves have the potential to trigger moves in CHF. Generally, high economic growth, low unemployment and high confidence are good for CHF. Conversely, if economic data points to weakening momentum, CHF is likely to depreciate.
As a small and open economy, Switzerland is heavily dependent on the health of the neighboring Eurozone economies. The broader European Union is Switzerland’s main economic partner and a key political ally, so macroeconomic and monetary policy stability in the Eurozone is essential for Switzerland and, thus, for the Swiss Franc (CHF). With such dependency, some models suggest that the correlation between the fortunes of the Euro (EUR) and the CHF is more than 90%, or close to perfect.
European Central Bank (ECB) chief economist Philip Lane noted on Monday that they need to make sure that wage inflation is normalizing after having above-normal wage increases for several years, per Reuters.
"I would say we’re confident that it's on track," Lane added and explained that they can consider reversing interest rate increases once the ECB becomes more confident that wage growth is slowing and inflation is heading back to the 2% target as projected.
Market reaction
EUR/USD clings to small daily gains at 1.0820 following these comments.
The initial FX market reaction to the news that the BoJ had exited its negative interest rate policy after eight years was one of disappointment. Economists at Rabobank analyze USD/JPY outlook for the coming months.
USD/JPY seen at 140.00 in 12 months
The BoJ has exited its negative interest rate policy after eight years. The JPY sold off on a ‘sell on the fact ‘reaction as investors digested the news that BoJ Governor Ueda was not in a position to signal that this week’s policy move was the start of a series of increases in interest rates.
Developments regarding the BoJ’s virtuous cycle are only part of a series of changes and reforms that will dictate how attractive Japanese assets become over the medium term.
We see scope for the JPY to recover moderately in the months ahead and maintain a 12-month target of USD/JPY at 140.00.
European Central Bank (ECB) executive board member Fabio Panetta said on Monday that the inflation in the Euro area was quickly declining toward the 2% target and added that the inflation trend was making a rate cut possible, per Reuters.
"The consensus emerging - especially in recent weeks - within the ECB governing council points in this direction," Panetta added.
Market reaction
These comments failed to trigger a noticeable market reaction. At the time of press, the EUR/USD was trading marginally higher on the day at 1.0820.
Taiwan’s central bank, the Central Bank of the Republic of China (CBC), hiked by 12.5 bps to 2% last Friday, the highest level since 2008. Economists at Commerzbank anlayze USD/TWD after the decision.
CBC’s action and watchfulness over inflation should provide some support for TWD near term
We don’t expect CBC to follow up with a series of rate hikes. They are likely to adopt a cautious wait-and-see approach.
CBC’s action and watchfulness over inflation should provide some support for TWD near term.
We look for USD/TWD to head lower, back below 31.00 by year-end, aided by the expected recovery in electronic exports.
The US Dollar (USD) pared back some of its recent solid gains. Economists at BBH analyze Greenback’s outlook.
The US economic growth outlook is encouraging
USD can edge higher because we don’t expect the Fed will deliver 75 bps of rate cuts this year.
The US economic growth outlook is encouraging, financial market conditions are very loose, and the February PCE deflator is expected to remain too sticky for the Fed to cut any time soon.
Interestingly, Atlanta Fed President Raphael Bostic (2024 voter) pointed out on Friday he now projects just one interest rate cut ‘later in the year’, instead of two, as he’s less confident on the trajectory of US inflation.
The Pound Sterling (GBP) is consolidating at slightly lower levels after the Bank of England's dovish bout of communications late last week. Economists at ING analyze GBP outlook.
BoE turns more dovish
Thursday's dovish statement and minutes were backed up by an interview from Governor Andrew Bailey in the Financial Times on Friday. Here, he implied that multiple rate cuts would be coming through this year. That dovish turn from the BoE helps cement the 0.8500 floor for EUR/GBP – which now can work its way slowly towards the 0.8700 area over the coming month.
Given our Dollar view, we are not too bearish on GBP/USD and would expect some decent demand to emerge under 1.2600.
- EUR/USD bounces on broad US Dollar selling after the Chinese PBoC decides to fix the Renminbi higher on Monday.
- Profit-taking after the deep declines at the end of last week could be another factor.
- Comments from key central bankers could move the pair on Monday.
EUR/USD is trading about a tenth of a percent higher at the start of the week, in the lower 1.0800s, possibly as a result of broad US Dollar (USD) selling after the People’s Bank of China (PBoC) fixed the Renminbi surprisingly higher on Monday morning, according to Bloomberg News.
Although it is up on the day, the pair appears to be in a new short-term downtrend and is now firmly below the 200-day Simple Moving Average (SMA) at 1.0838, the last key MA obstructing further downside.
EUR/USD bounces on profit-taking after sell-off
EUR/USD is bouncing on Monday due also perhaps to profit-taking. The pair suffered a substantial decline at the end of last week, following the release of Eurozone and US flash PMI data that highlighted US exceptionalism.
The data suggested the US economy is still doing pretty well and the Federal Reserve (Fed) may be being too hasty in expecting to make three interest-rate cuts this year. If the Fed changes its mind and cuts rates more slowly, it will be positive for the US Dollar since higher rates tend to attract greater inflows of foreign capital.
Despite Monday’s bounce, the Euro remains “fragile” to further weakness, according to analysts at ING, who think the surprise Swiss National Bank (SNB) decision to cut its interest rates on Thursday has stimulated “increased scrutiny of ECB communication,” for signs the European bank will follow suit. The ECB and SNB have a history of mimicking each other, although it is normally the SNB which follows the ECB, not the other way around.
“Following last week's surprise cut from the Swiss National Bank, there has been increased scrutiny on ECB communication. This remains mixed, with one hawk on Friday still talking up the chances of an April rate cut. Notably, money markets still ascribe a very low probability to such an outcome and we doubt that changes much this week given the absence of key data,” said ING in a recent note.
ING still sees a low probability of an early interest rate cut by the ECB, however, and volatility is likely to be minimalized by the lack of key data out for the Euro this week and the upcoming Easter holidays.
As far as calendar events go, European Central Bank President Christine Lagarde is scheduled to speak at 10:00 GMT on Monday.
The Federal Reserve Bank of Atlanta President Raphael Bostic is also scheduled to speak later in the day at 13:45 GMT, and is followed by the Federal Reserve member of the Board of Governors Lisa Cook at 14:30 GMT.
On the data front, US New Home Sales and the Chicago Fed National Activity Index will be released on Monday.
Technical Analysis: EUR/USD makes lower lows
EUR/USD seems now to be in a short-term downtrend after making lower lows on Friday, and since the “trend is your friend” this, on balance, favors bearish bets.
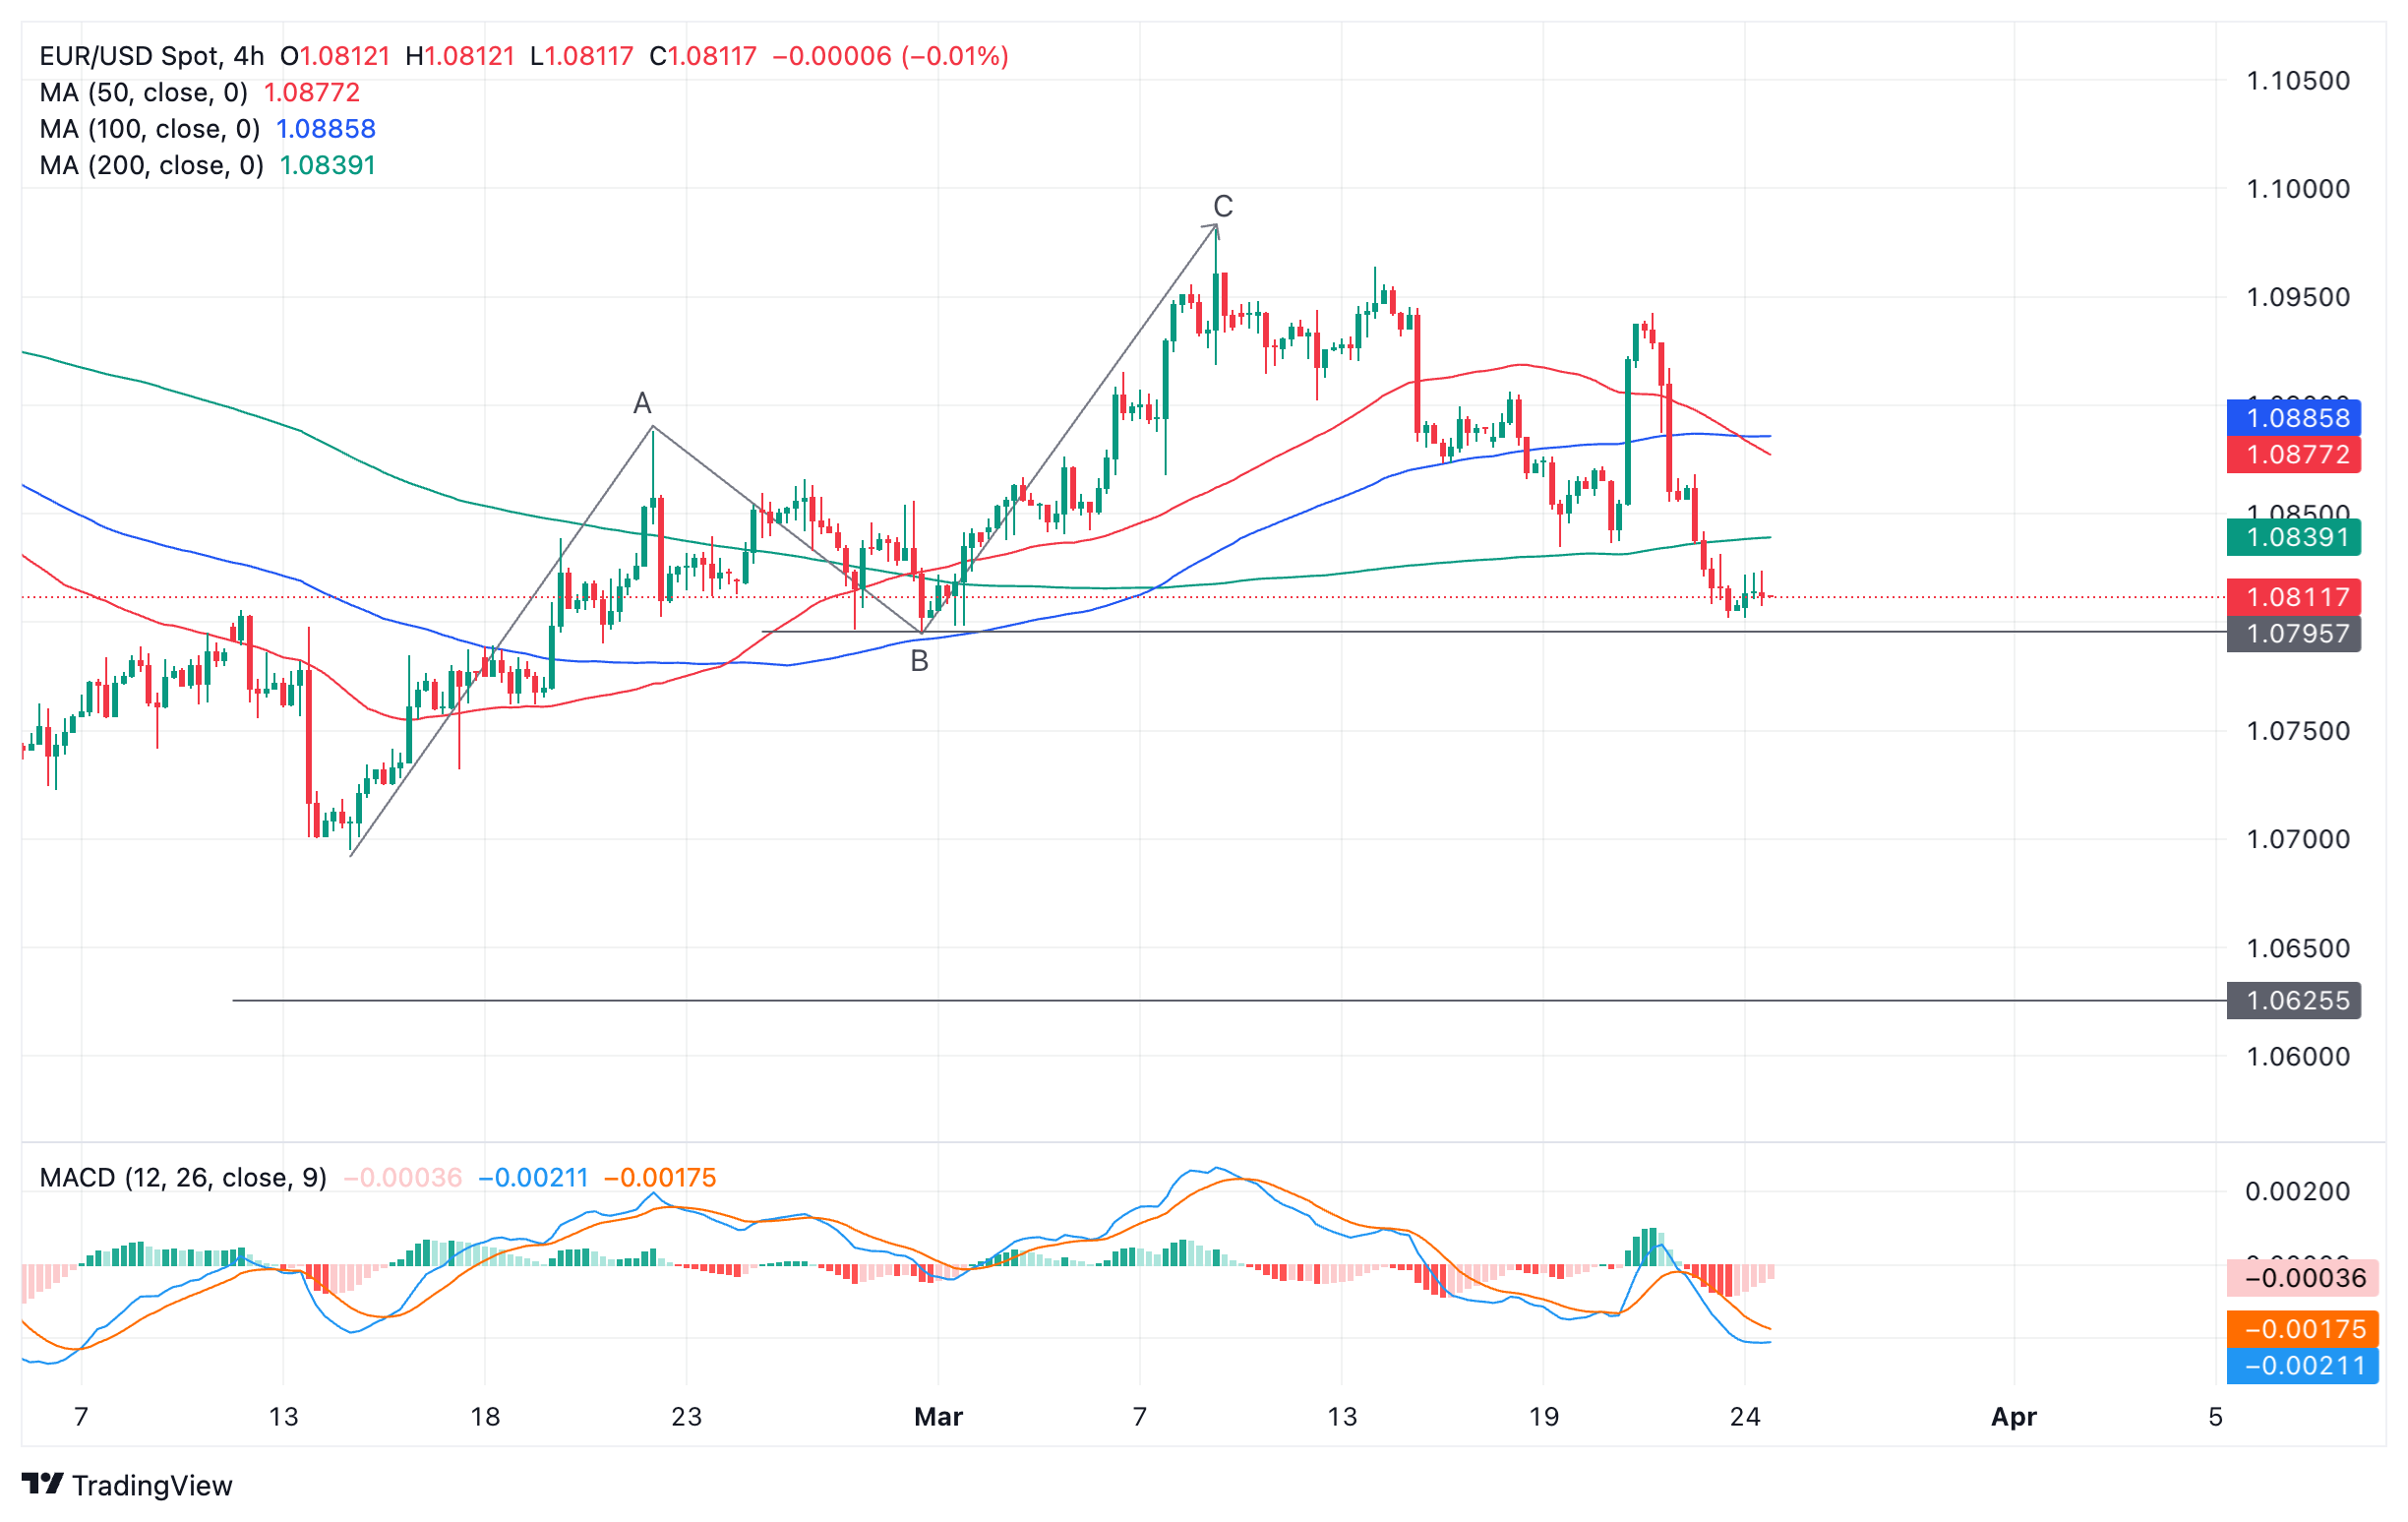
Euro versus US Dollar: 4-hour chart
EUR/USD has fallen to the low of wave B of the three-wave Measured Move pattern that unfolded higher during February and early March. This is likely to be a key support level and may see some stabilization of the exchange rate after the past week’s heightened volatility.
A decisive break below the B-wave lows at roughly 1.0795 would signal a continuation of the downtrend to the next target at 1.0750, possibly even the February lows at 1.0700.
A decisive break is one characterized by a long red bearish candle that breaks cleanly through the level and closes near its low, or three down candles in a row that breach the level.
Alternatively, a move above the 1.0950 level would bring into question the validity of the short-term downtrend.
Euro FAQs
The Euro is the currency for the 20 European Union countries that belong to the Eurozone. It is the second most heavily traded currency in the world behind the US Dollar. In 2022, it accounted for 31% of all foreign exchange transactions, with an average daily turnover of over $2.2 trillion a day. EUR/USD is the most heavily traded currency pair in the world, accounting for an estimated 30% off all transactions, followed by EUR/JPY (4%), EUR/GBP (3%) and EUR/AUD (2%).
The European Central Bank (ECB) in Frankfurt, Germany, is the reserve bank for the Eurozone. The ECB sets interest rates and manages monetary policy. The ECB’s primary mandate is to maintain price stability, which means either controlling inflation or stimulating growth. Its primary tool is the raising or lowering of interest rates. Relatively high interest rates – or the expectation of higher rates – will usually benefit the Euro and vice versa. The ECB Governing Council makes monetary policy decisions at meetings held eight times a year. Decisions are made by heads of the Eurozone national banks and six permanent members, including the President of the ECB, Christine Lagarde.
Eurozone inflation data, measured by the Harmonized Index of Consumer Prices (HICP), is an important econometric for the Euro. If inflation rises more than expected, especially if above the ECB’s 2% target, it obliges the ECB to raise interest rates to bring it back under control. Relatively high interest rates compared to its counterparts will usually benefit the Euro, as it makes the region more attractive as a place for global investors to park their money.
Data releases gauge the health of the economy and can impact on the Euro. Indicators such as GDP, Manufacturing and Services PMIs, employment, and consumer sentiment surveys can all influence the direction of the single currency. A strong economy is good for the Euro. Not only does it attract more foreign investment but it may encourage the ECB to put up interest rates, which will directly strengthen the Euro. Otherwise, if economic data is weak, the Euro is likely to fall. Economic data for the four largest economies in the euro area (Germany, France, Italy and Spain) are especially significant, as they account for 75% of the Eurozone’s economy.
Another significant data release for the Euro is the Trade Balance. This indicator measures the difference between what a country earns from its exports and what it spends on imports over a given period. If a country produces highly sought after exports then its currency will gain in value purely from the extra demand created from foreign buyers seeking to purchase these goods. Therefore, a positive net Trade Balance strengthens a currency and vice versa for a negative balance.
USD/JPY has moved back to within touching distance of the highs from the last couple of years at just below the 152.00 level. Economists at MUFG Bank analyze the pair’s outlook.
Renewed Yen weakness is drawing more concern from Japanese policymakers
Japanese officials find themselves under pressure to support the Yen again after market participants scaled Fed rate cut expectations at the start of this year in response to stronger US inflation data. Last week’s reassurance from the Fed that they still plan to deliver three rate cuts this year has not been sufficient on its own to prevent the US Dollar from strengthening further last week.
However, we do expect verbal intervention from Japanese officials to help dampen further upside for USD/JPY in the near term. Japan’s top currency official Masato Kanda warned that ‘the current weakening of the yen is not in line with fundamentals and is clearly driven by speculation. We will take appropriate action against excessive fluctuations, without ruling out any options’. He also added that ‘we are always prepared’ when asked about the prospect of direct intervention. He noted that the ‘large fluctuation of 4% in just two weeks in USD/JPY’ does not reflect fundamentals that he finds ‘unusual’.
- NZD/USD tests the psychological level of 0.6000 on Monday.
- The break above 0.6050 could lead the pair to navigate the area around the 14-day EMA and the 23.6% Fibonacci level.
- The major level of 0.5950 could act as support, following the psychological support at 0.5900 level.
NZD/USD continues its losing streak for the third successive session as the US Dollar (USD) falls on the dovish sentiment surrounding the Federal Reserve's stance on the trajectory of interest rates, with market sentiment leaning towards the Fed initiating interest rate cuts starting in June. The pair has trimmed its intraday gains and hovers around the psychological level of 0.6000 during the European session on Monday.
The NZD/USD pair could find a key barrier lies at the major level of 0.6050. A break above this level could lead the pair to navigate the area around the 14-day Exponential Moving Average (EMA) of 0.6076 and the 23.6% Fibonacci retracement level of 0.6086. A further movement could test the psychological level of 0.6100.
According to the Moving Average Convergence Divergence (MACD) analysis, a prevailing downward sentiment is indicated for the NZD/USD pair. This is evidenced by the MACD line positioned below the centerline and shows the divergence below the signal line, signaling a bearish trend. Furthermore, the 14-day Relative Strength Index (RSI) is below the 50 level, providing additional confirmation of the bearish sentiment.
On the downside, the NZD/USD pair could find the key support at the major level of 0.5950. A break below the latter could put pressure on the pair to navigate further support at a psychological level of 0.5900.
NZD/USD: Daily Chart
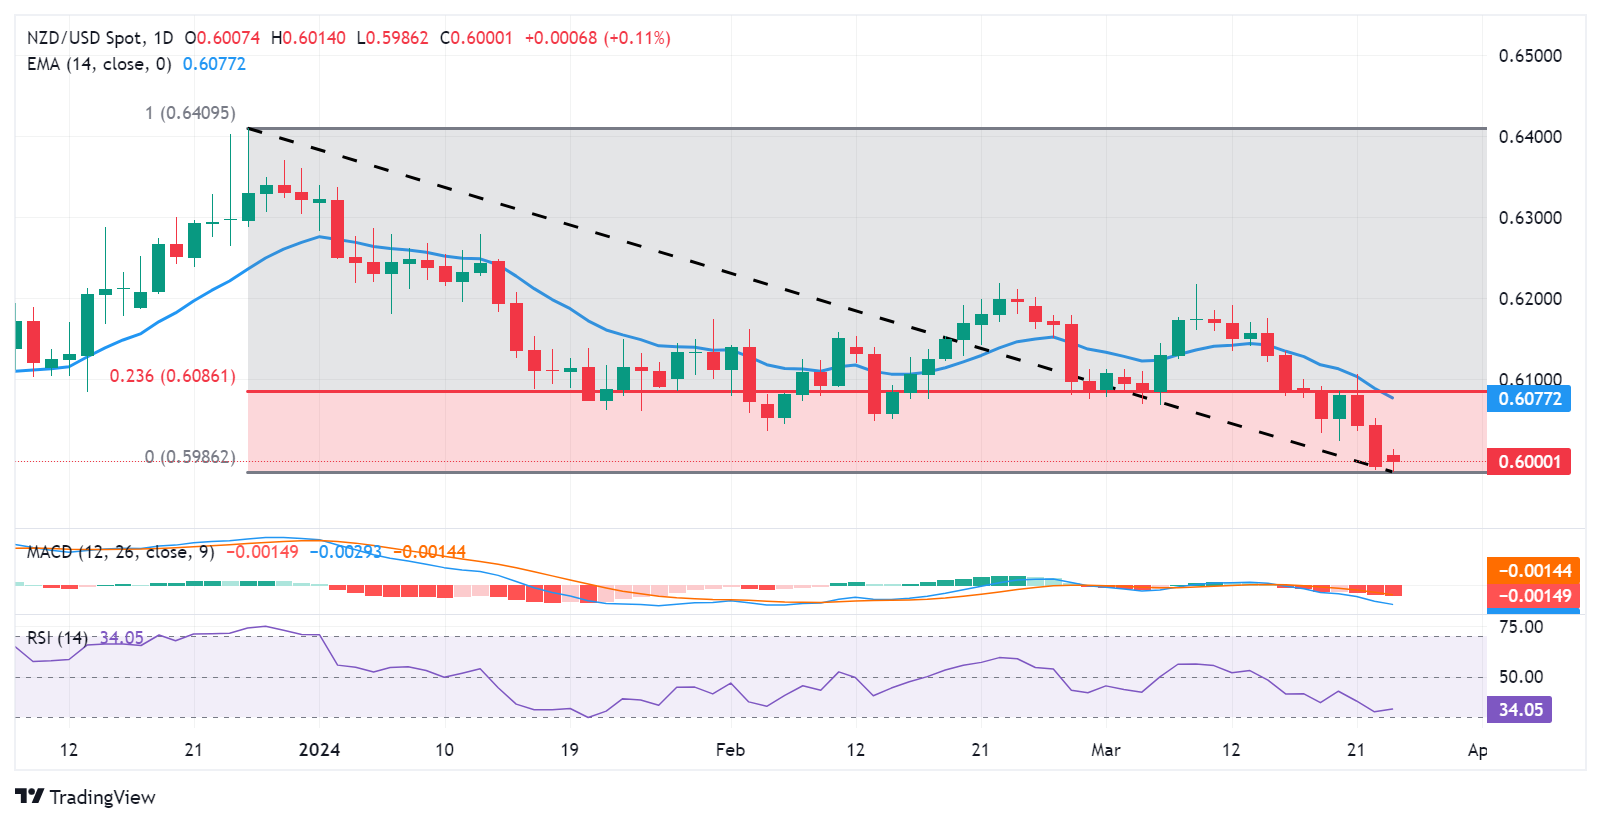
EUR/GBP nears the 0.8600 level. Economists at Société Générale analyze the pair’s technical outlook.
Last week low of 0.8530 is near-term support
EUR/GBP recently defended the low of last August near 0.8490 and evolved within a small base. It has crossed above the upper limit denoting potential upside. The move has so far remained contained near 200-DMA at 0.8610 which is also a multi month trend line.
Daily MACD has entered positive territory first time since January highlighting regain of upward momentum.
Once the pair establishes above 0.8610, the up move is likely to extend. In such a scenario, next objective could be located at 0.8665, the 61.8% retracement from November 2023.
Last week low of 0.8530 is near-term support.
Looking ahead in this holiday-shortened week, economists at ING expect a firm US inflation print on Friday. They analyze the US Dollar (USD) outlook.
DXY can push up to the 105.00 area
Friday is a public holiday in many parts of the world but still features the key release of the week, the US core PCE deflator for February. There is a strong consensus behind a 0.3% month-on-month reading, which will not be good enough for the Fed's disinflation narrative.
However, this week also sees quite a few Fed speakers. We would highlight the influential Christopher Waller speaking on Wednesday and Fed Chair Jerome Powell speaking on Friday We want to hear if the Fed has more to say about faulty seasonals making early-year inflation prints look too strong, a theme introduced by Chair Powell at last week's FOMC press conference.
A surging US stock market and the implications for US confidence and consumption make it hard to argue with the Dollar right now, warning that DXY can push up to the 105.00 area. But we continue to expect this strength to be temporary and would prefer to position for a second-quarter downtrend.
- GBP/USD gains ground as the Greenback weakens on speculations of a Fed rate cut in June.
- The higher US Treasury yields could have provided support for the US Dollar.
- Fitch Ratings revised the UK's sovereign credit outlook to stable from negative last Friday, affirming its sovereign credit rating at AA-.
GBP/USD snaps a two-day losing streak, retracing recent losses and trading near 1.2600 during the early European session on Monday. The decline in the US Dollar (USD) appears to be the catalyst underpinning the GBP/USD pair.
The dovish sentiment surrounding the Federal Reserve's stance on the trajectory of interest rates, with market sentiment leaning towards the Fed initiating interest rate cuts starting in June, is weakening the US Dollar.
The US Dollar Index (DXY) declines to near 104.30 as the 2-year and 10-year yields on US Treasury bonds hold at 4.60% and 4.21%, respectively, by the press time. The US Dollar (USD) fails to cheer the uptick in US Treasury yields.
Fitch Ratings revised the United Kingdom's sovereign credit outlook to stable from negative last Friday, affirming its sovereign credit rating at AA-. The revision came after the country's economy rebounded to growth in January from a shallow recession in the second half of 2023, boosted by a resurgence in retail sales and housing.
UK Retail Sales came in better than expectations, remaining flat in February. This figure was above the market consensus of a 0.3% decline and suggested a positive sign for the economy. Market participants will likely monitor the release of Gross Domestic Product (GDP) data for the fourth quarter of 2023 from the United Kingdom (UK) and the United States (US) on Thursday.
- USD/JPY drops slightly after intervention talk from Japan’s chief of FX, Masato Kanda.
- Recent weakness in the Yen should be attributed to speculation not fundamentals, Kanda said.
- The authorities may intervene to correct the situation, propping up the Yen.
USD/JPY is trading down almost a tenth of a percent in the 151.300s at the start of the new week. It has lost ground after intervention talk from Japan’s currency chief heightens speculation the Japanese authorities are about to use market operations to prop up their currency.
Vice-finance minister for international affairs Masato Kanda, was responding to the weakness experienced by the Yen, which remains at historic lows, after the Bank of Japan’s (BoJ) historic decision to raise interest rates for the first time since 2007 at their policy meeting last Tuesday. The move seemed highly unexpected since higher interest rates are usually a factor that strengthens not weakens currencies.
"The current weakening of the Yen is not in line with fundamentals and is clearly driven by speculation,” Kanda told reporters Monday. "We will take appropriate action against excessive fluctuations, without ruling out any options,” he said, according to a report in the Japan Times.
When questioned about the possibility of the authorities engaging in direct intervention, or Yen-buying in the open market Kanda said, “We are always prepared.”
USD/JPY has reached a level, above 150.000, where historically the BoJ has been known to intervene to prop it up, as was the case in 2022 when the currency hit 151.950 against the US Dollar.
Data from the currency futures market seems to support Kanda’s view that speculators drove the move higher following the BoJ decision. During the week of the BoJ’s March meeting, speculators, such as hedge funds, actually increased their bearish (short) bets on the Yen, according to data from the Commodity Futures Trading Commision (CFTC), despite widespread rumors the BoJ was going to hike rates.
From a technical perspective the USD/JPY has formed a bearish Hanging Man Japanese candlestick pattern (circled) on Thursday, suggesting a heightened risk of a short-term reversal and pullback.
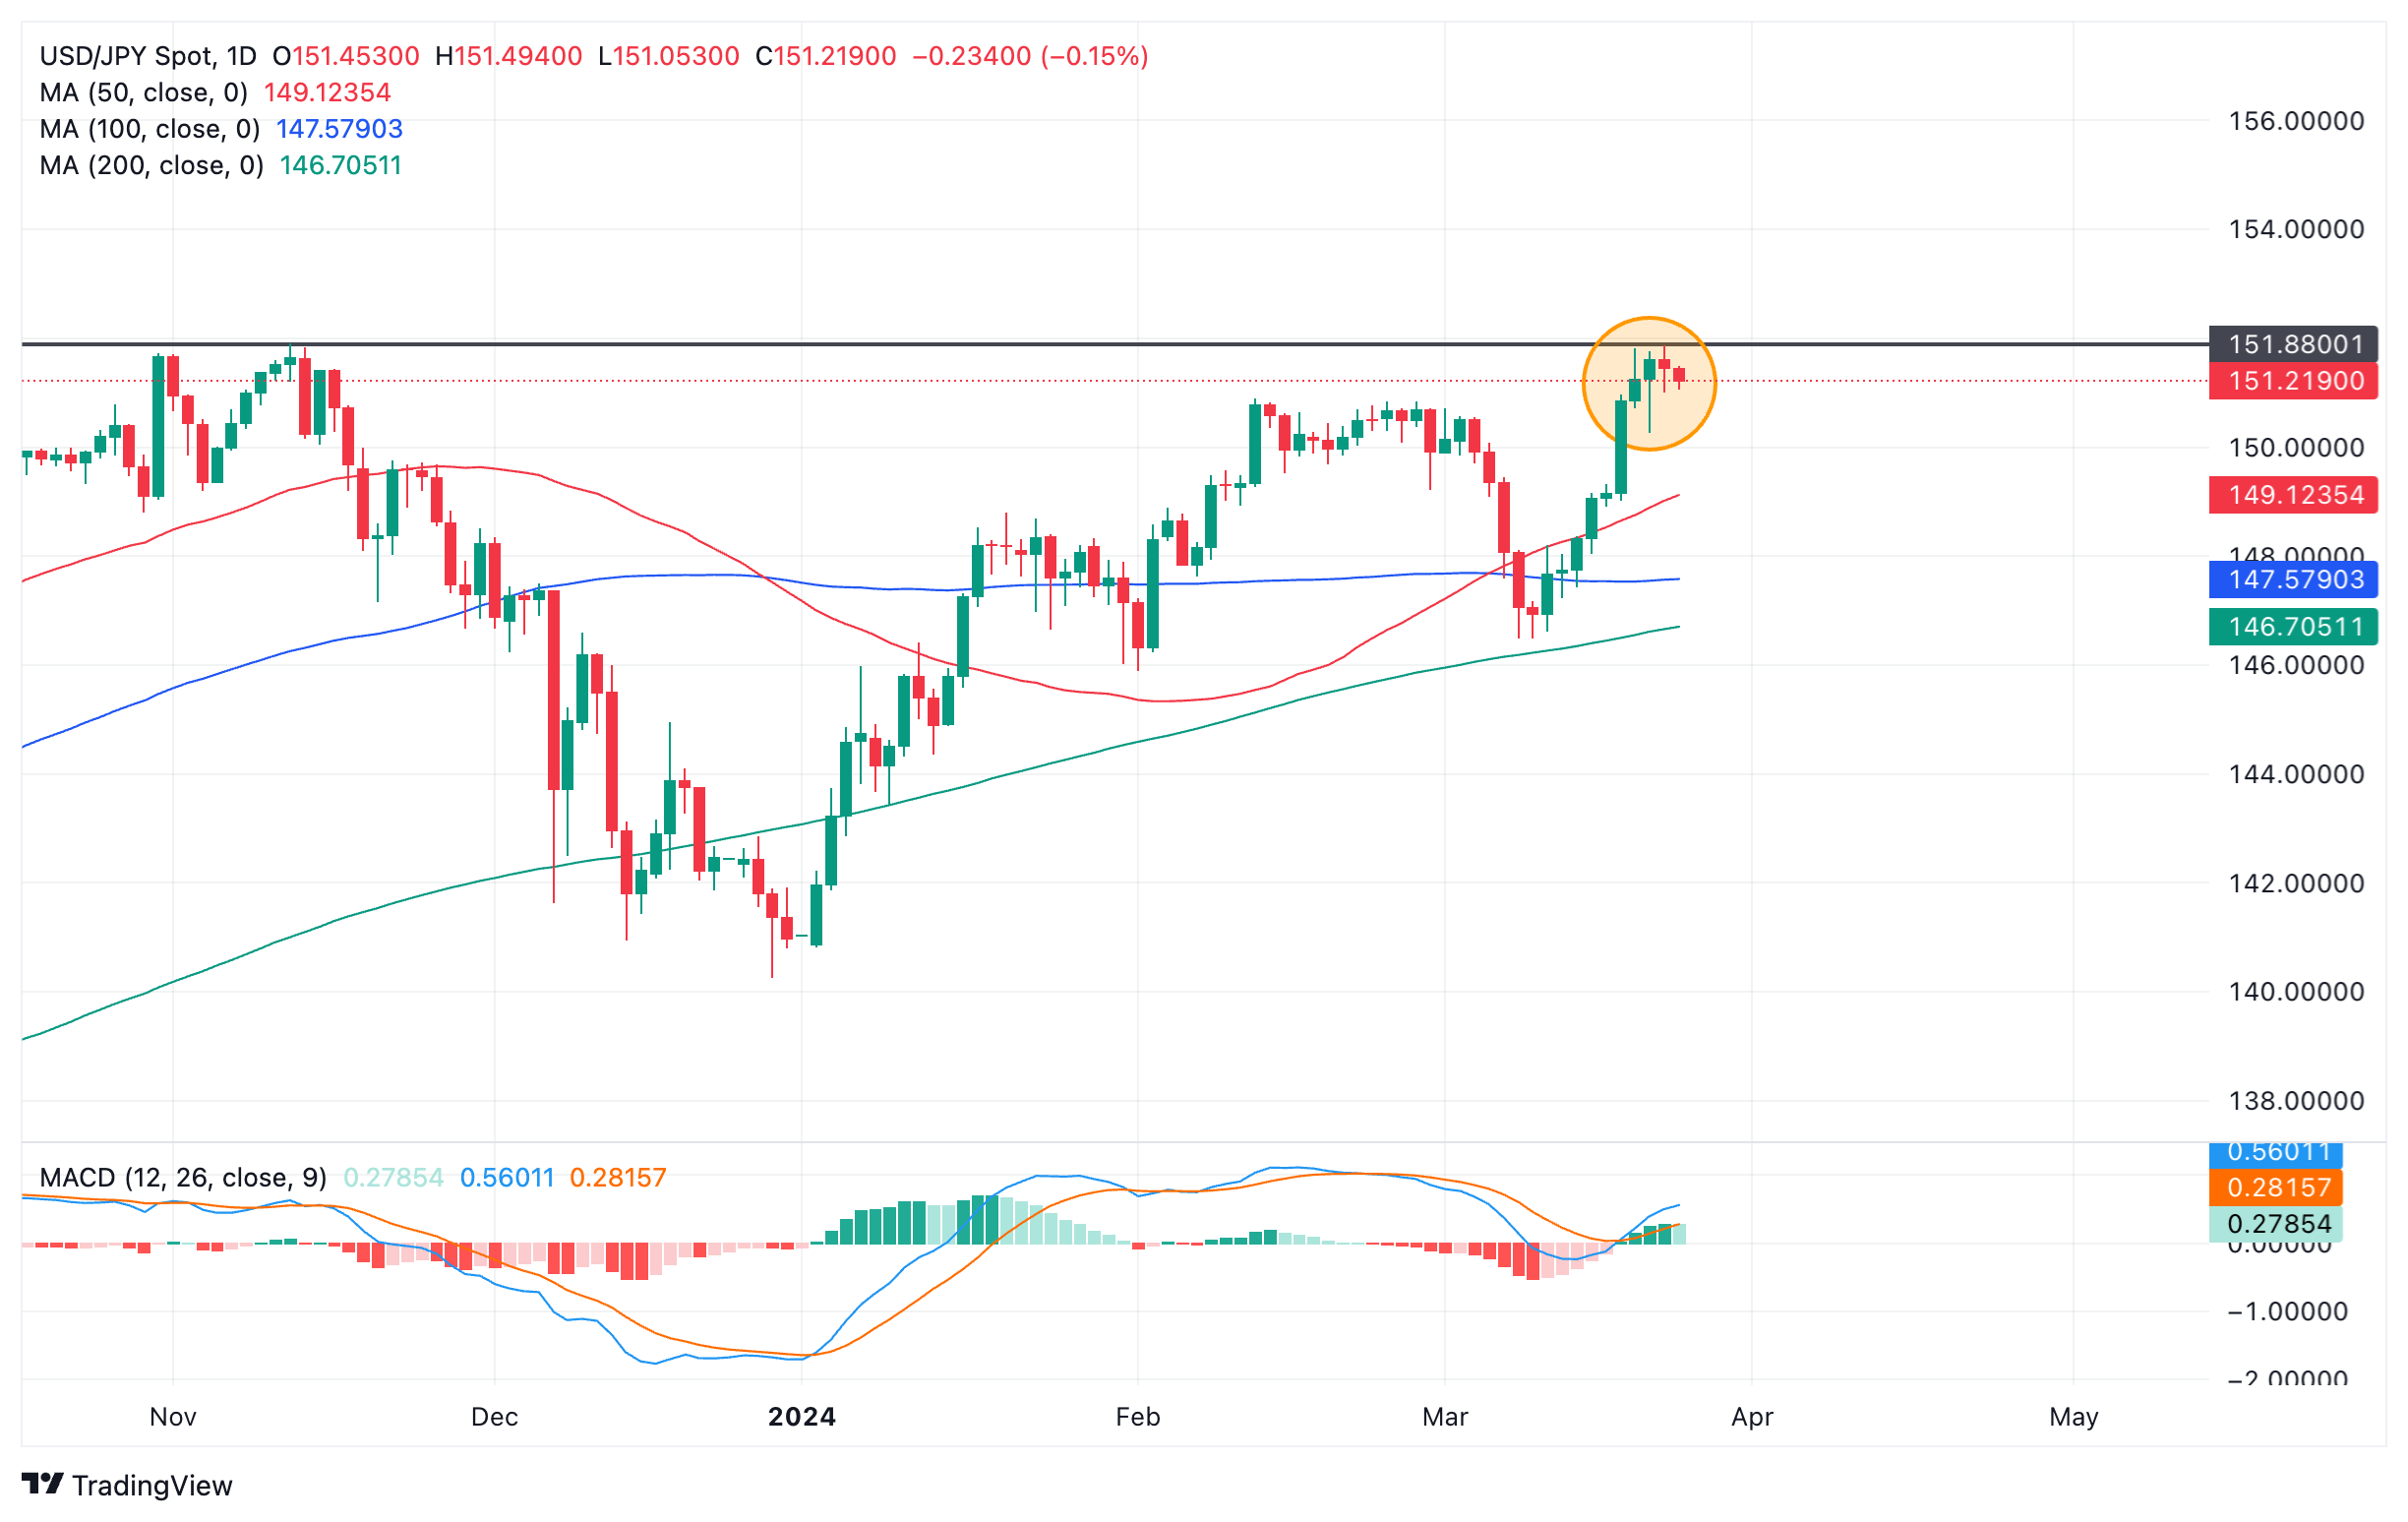
US Dollar versus Japanese Yen: Daily chart
The combination of the fact that the pair has tested the level of the 2023 and 2022 intervention highs, and at the same time formed the bearish pattern increases the possibility of a decline following on.
Friday’s red candlestick adds confirmation to the Hanging Man from Thursday, and further increases the odds of more downside.
Japanese candlesticks are only short-term reversal patterns, however, so the move lower may be short-lived.
A continuation of the pullback might be expected to go as low as support at the 50-day Simple Moving Average (SMA) situated at 149.123.
Alternatively, a recovery and clear break above 152.000 would suggest bulls continue to have the upper hand and the BoJ is reluctant or unable to intervene sufficiently to move the exchange rate.
Such a move, however, would be unlikely to rise much higher given the forces pitched against it, with a possible target at the next whole number of 153.000.
EUR/USD is back at 1.0800. Economists at ING analyze the pair’s outlook.
Steadier story for the Renminbi will discourage aggressive sales of EUR/USD through 1.0800
Following last week's surprise cut from the Swiss National Bank, there has been increased scrutiny on ECB communication. This remains mixed, with one hawk on Friday still talking up the chances of an April rate cut. Notably, money markets still ascribe a very low probability to such an outcome and we doubt that changes much this week given the absence of key data.
EUR/USD remains fragile, but at least the steadier story for the Renminbi will discourage aggressive sales of EUR/USD through 1.0800.
The Japanese Yen (JPY) weakened on the same day as the BoJ’s rate hike. Economists at Standard Chartered note that the BoJ may draw confidence from observing the JPY’s movements.
The JPY's current weakness is a double-edged sword
Achieving JPY appreciation vs. the USD would require a narrower interest rate gap between the US and Japan, which is partly dependent on Fed policy.
The JPY's current weakness is a double-edged sword. While it has significantly fueled Japan's export growth and equity market performance, its weakness is adding to imported price pressures. To that end, the weak JPY may be a key consideration for the BoJ to tighten policy in the foreseeable future as it seeks to stabilise import prices and safeguard consumers’ purchasing power.
Here is what you need to know on Monday, March 25:
The US Dollar (USD) holds steady to start the new week, with the USD Index moving sideways in a tight channel above 104.00 in the European morning on Monday. February New Home Sales and Federal Reserve Bank of Chicago's National Activity Index data will be featured in the US economic docket. Market participants will also pay close attention to comments from central bank officials.
US Dollar price in the last 7 days
The table below shows the percentage change of US Dollar (USD) against listed major currencies in the last 7 days. US Dollar was the strongest against the Japanese Yen.
| USD | EUR | GBP | CAD | AUD | JPY | NZD | CHF | |
| USD | 0.58% | 0.99% | 0.38% | 0.55% | 1.58% | 1.51% | 1.57% | |
| EUR | -0.59% | 0.40% | -0.20% | -0.04% | 1.00% | 0.93% | 0.98% | |
| GBP | -1.00% | -0.40% | -0.61% | -0.44% | 0.60% | 0.53% | 0.58% | |
| CAD | -0.38% | 0.21% | 0.61% | 0.17% | 1.21% | 1.14% | 1.19% | |
| AUD | -0.55% | 0.04% | 0.43% | -0.16% | 1.03% | 0.97% | 1.01% | |
| JPY | -1.61% | -1.02% | -0.55% | -1.22% | -1.05% | -0.09% | -0.02% | |
| NZD | -1.55% | -0.94% | -0.53% | -1.15% | -0.98% | 0.07% | 0.05% | |
| CHF | -1.59% | -0.99% | -0.59% | -1.20% | -1.03% | 0.01% | -0.05% |
The heat map shows percentage changes of major currencies against each other. The base currency is picked from the left column, while the quote currency is picked from the top row. For example, if you pick the Euro from the left column and move along the horizontal line to the Japanese Yen, the percentage change displayed in the box will represent EUR (base)/JPY (quote).
After falling sharply in the American session on Wednesday, the USD Index staged an impressive comeback and gained nearly 1% for the week. Although investors lean toward a Federal Reserve (Fed) rate cut in June, upbeat macroeconomic data releases from the US highlighted the US economy's resilience and helped the USD outperform its rivals.
USD/JPY edged slightly lower on Friday but closed the week decisively higher. The pair fluctuates above 151.00 to start the week. Earlier in the day, Japan's top currency diplomat Masato Kanda said that they will take appropriate steps to respond to the excessive Japanese Yen weakness, reiterating that they have been closely watching the action in foreign exchange markets with a high sense of urgency. The data from Japan showed that the Leading Economic Index declined to 109.5 in January from 109.9 and the Coincident Index improved to 112.1 from 110.2.
EUR/USD stabilized slightly above 1.0800 after posting losses for the second consecutive week. Eurostat will release business and consumer sentiment data for March on Wednesday.
GBP/USD dropped to its lowest level since mid-February below 1.2600 on Friday before erasing a small portion of its daily losses ahead of the weekend. The pair stays calm near 1.2600 in the European morning on Monday. Bank of England (BoE) policymaker Catherine Mann is scheduled to deliver a speech later in the day.
Gold registered large losses on Friday but ended up closing the week marginally higher. XAU/USD stays in a consolidation phase below $2,170 early Monday.
After losing nearly 1% on Friday, AUD/USD edged higher in the Asian session on Monday but struggled to gather recovery momentum. The pair moves up and down in a narrow band above 0.6500 in the European morning.
- EUR/USD gains momentum around 1.0817 in Monday’s early European session.
- The pair keeps the bearish vibe below the key EMA; RSI momentum indicator lies below the 50-midline.
- The initial support level is seen at 1.0800; the immediate resistance level will emerge at 1.0870.
The EUR/USD pair trades on a stronger note below the mid-1.0800s during the early European session on Monday. The softer US Dollar (USD) provides some support to the major pair. Investors await the German February Retail Sales and the US Gross Domestic Product (GDP) annualized growth numbers for the fourth quarter for fresh impetus. The US economy is expected to remain steady at 3.2% in Q4. At the press time, EUR/USD is trading at 1.0817, gaining 0.09% on the day.
According to the four-hour chart, the bearish outlook of EUR/USD remains unchanged as the major pair is below the key 100-period Exponential Moving Averages (EMA). Additionally, the downward momentum is further confirmed by the Relative Strength Index (RSI), which lies below the 50-midline, indicating that the path of least resistance is to the downside.
The initial support level for the major pair is seen near a low of March 22 and a round figure at 1.0800. Further south, the next contention level is located near the lower limit of the Bollinger Band at 1.0762. A breach of this level will see a drop to a low of February 16 at 1.0732, followed by the confluence of a low of February and a psychological level at 1.0700.
On the upside, the immediate resistance level will emerge at the 100-period EMA at 1.0870. The decisive break above the latter will expose a high of March 16 at 1.0906. The key upside barrier will emerge at the upper boundary of the Bollinger Band and a high of March 21 at the 1.0940–1.0945 region, en route to a high of March 8 at 1.0981.
EUR/USD four-hour chart
-638469467295758505.png)
FX option expiries for Mar 25 NY cut at 10:00 Eastern Time, via DTCC, can be found below
- EUR/USD: EUR amounts
- 1.0785 1b
- 1.0850 876m
- 1.0900 705m
- GBP/USD: GBP amounts
- 1.2625 845m
- USD/JPY: USD amounts
- 149.80-150.00 2b
- AUD/USD: AUD amounts
- 0.6550 727m
- USD/CAD: USD amounts
- 1.3500 2.5b
- 1.3700 658m
- Gold price edges higher on subdued Greenback on Monday.
- The US Dollar receives downward pressure on speculations of the Fed initiating rate cuts from June.
- Gold price could face challenge as US Treasury yields move lower on improved risk sentiment.
Gold price rises to near $2,170 per troy ounce, reclaiming losses from the previous two sessions. The uptick in Gold prices can be attributed to a weaker US Dollar (USD), which is influenced by the dovish sentiment surrounding the Federal Reserve's stance on interest rate trajectory. Market sentiment leans toward the Fed initiating interest rate cuts starting in June, and a softer Greenback has bolstered the appeal of bullion.
During a press conference, Federal Reserve Chair Jerome Powell noted that an unexpected rise in unemployment could lead the central bank to consider lowering interest rates. Powell also reassured markets that the Fed would not hastily respond to consecutive months of elevated inflation figures. Furthermore, Gold prices have been buoyed by recent indications from Fed policymakers that they still anticipate reducing interest rates by three-quarters of a percentage point by the end of 2024, despite recent high inflation readings.
Indeed, the decline in US yields indicates a shift in investor sentiment toward US Treasury bonds, potentially posing a challenge for non-yielding assets like Gold. With the 2-year and 10-year yields on US Treasury bonds holding steady at 4.60% and 4.21%, respectively. Investors may find the relative safety and stability of bonds more attractive compared to Gold.
The upcoming US inflation readings are expected to have a significant impact on the prices of the precious metal. Gold traders will closely monitor the release of Gross Domestic Product (GDP) data for the fourth quarter of 2023 and the Personal Consumption Expenditures (PCE) price index report from the United States (US) during the week, as these indicators can provide insights into inflationary pressures and influence Gold prices accordingly.
- NZD/USD gains ground around 0.5995 amid the softer USD.
- Fed’s Bostic said he expected just one rate cut this year due to persistent inflation and robust economic data.
- The IMF expects that New Zealand will likely lower its cash rate this year.
The NZD/USD pair posts modest gains below the 0.6000 barrier during the early European session on Monday. The modest uptick of the pair is backed by the weakening of the US Dollar Index (DXY) below the mid-104.00s. In the absence of top-tier economic data releases from New Zealand, the USD price dynamic will be the main driver for the NZD/USD pair. The pair currently trades near 0.5995, gaining 0.04% on the day.
The Federal Reserve (Fed) held the benchmark rate to the 5.25%-5.5% range at its March meeting last week. The Fed Chairman Jerome Powell emphasized after that meeting that policymakers are likely to cut interest rates later this year, but only once they have greater confidence that inflation is moving toward its 2% target. That being said, the dovish remarks from the Fed officials might weigh on the US Dollar (USD) and create a tailwind for the NZD/USD pair in the near term.
The US Fed maintained its outlook for the median dot plot for 2024 and hinted at three quarter-point rate cuts this year. However, Fed Bank of Atlanta President Raphael Bostic said on Friday that he expected just one interest rate cut this year instead of the two rate cuts he had forecast due to persistent inflation and stronger-than-anticipated economic data.
On the Kiwi front, the International Monetary Fund (IMF) stated in the report that the Reserve Bank of New Zealand will have scope to start cutting interest rates later this year as inflation returns to its target band. IMF added that inflation in New Zealand is projected to return to its central bank’s 1-3% target in the third quarter of this year.
The Chicago Fed National Activity Index, US New Home Sales for February, and Fed's Bostic speech are due on Monday. On Tuesday, the Durable Goods Orders will be released. The attention will shift to the release of US Gross Domestic Product Annualized on Thursday, which is expected to grow 3.2% in Q4. Traders will take cues from these events and find trading opportunities around the NZD/USD pair.
- USD/CAD attempts to continue its winning streak on Monday.
- Fed member Bostic forecasted only one interest rate cut instead of his earlier projection of two rate cuts in 2024.
- The higher WTI price might have provided support for the Canadian Dollar.
USD/CAD maintains its position in positive territory after paring back some gains on Monday. The pair trades higher around 1.3600 during the Asian trading session, following hawkish remarks from Federal Reserve Bank of Atlanta President Raphael Bostic on Friday. Bostic adjusted his earlier projection of two interest rate cuts this year, now forecasting only one, citing persistent inflation and stronger-than-expected economic indicators.
Moreover, the Canadian Dollar (CAD) faced downward pressure as the Bank of Canada (BoC) hinted at potential rate cuts in 2024 in its latest meeting minutes. Deputy Governor Toni Gravelle reaffirmed the central bank's intention for quantitative tightening to conclude by 2025, highlighting its sustainability amidst gradual interest rate reductions.
The CAD receives support from higher Crude oil prices, which in turn limits the losses of the USD/CAD pair. Additionally, better-than-anticipated Canadian Retail Sales data might have contributed to bolstering the Canadian Dollar.
The US Dollar Index (DXY) declines to near 104.40 as the 2-year and 10-year yields on US Treasury bonds hold at 4.60% and 4.21%, respectively, at the time of reporting. Despite the uptick in US Treasury yields, the US Dollar (USD) fails to find support.
Federal Reserve Chair Jerome Powell mentioned during a press conference, that an unexpected increase in unemployment could prompt the central bank to consider reducing interest rates. Powell also reassured markets that the Federal Reserve would not hastily react to consecutive months of heightened inflation figures.
Market participants will likely monitor the release of Gross Domestic Product (GDP) data for the fourth quarter of 2023 from the United States (US). Additionally, attention will be on Canadian GDP data for January, scheduled for release on Thursday.
- GBP/USD snaps the two-day losing streak near 1.2605 on the weaker USD.
- The UK Retail Sales remained flat in February, better than the estimation of a 0.3% decline.
- The rising speculation the Fed would start cutting rates in June might cap the upside of the Greenback.
The GBP/USD pair holds positive ground above the 1.2600 psychological support during the early European session on Monday. The major pair rebounds amid the softer US Dollar (USD) and lower US Treasury bond yields. Investors await the release of Gross Domestic Product (GDP) from the UK and US on Thursday for fresh catalysts. At the press time, GBP/USD is trading at 1.2605, adding 0.03% on the day.
Data released from the Office for National Statistics on Friday reported that UK Retail Sales came in better than expectations, remaining flat in February. This figure was above the market consensus of a 0.3% decline and suggested a good sign for the economy since the UK entered a technical recession after two consecutive quarters of economic contraction in the second half of last year. Market participants will take more cues from UK GDP growth numbers on Thursday, which is estimated to contract 0.3% QoQ and 0.2% YoY in the fourth quarter. The stronger-than-expected data might boost the Pound Sterling (GBP) and act as a tailwind for the GBP/USD pair.
On the other hand, the renewed bets that the Federal Reserve (Fed) would start cutting the interest rate in June might cap the upside of the Greenback. The Fed Chairman Jerome Powell reiterated last week that policymakers plan to cut rates before the end of this year, given that economic growth continues. According to CME Group's FedWatch tool, Federal Funds Futures have priced in 74.5% odds that the Fed will cut rates in the June meeting.
Market players will watch the Chicago Fed National Activity Index and US New Home Sales for February on Monday. Additionally, Fed’s Raphael Bostic and BoE’s Catherine Mann are set to speak later in the day. On Thursday, the UK and US Gross Domestic Product (GDP) growth numbers reports will be in the spotlight. These events could give a clear direction to the GBP/USD pair.
- USD/JPY extends losses on the likelihood of reaching the BoJ's inflation target.
- BoJ members discussed the potential implementation of measures if a positive cycle of wages and inflation is confirmed.
- The US Dollar could face challenges on expectations of the Fed’s initiating rate cuts from June.
USD/JPY continues its decline, nearing 151.20 during the Asian session on Monday. This movement follows the release of the Bank of Japan (BoJ) Minutes from the January policy meeting. BoJ Board members acknowledged an increasing likelihood of reaching the central bank's inflation target, albeit gradually.
Furthermore, members discussed the possibility of measures if a positive cycle of wages and inflation is confirmed. Some policymakers noted that the risk of inflation significantly exceeding expectations has diminished.
Moreover, the Japanese Yen (JPY) may receive support from potential forex intervention. Japan's top currency diplomat, Masato Kanda, issued a warning, stating his intention to take appropriate action to address excessive JPY weakness, without ruling out any measures.
The US Dollar Index (DXY) weakens despite higher US Treasury yields. However, the US Dollar (USD) saw a sharp rise following hawkish remarks from Federal Reserve Bank of Atlanta President Raphael Bostic on Friday. Bostic revised his earlier forecast of two interest rate cuts this year, now expecting only one, citing persistent inflation and stronger-than-expected economic data.
Nonetheless, the USD may encounter downward pressure on expectations for the initiation of a Federal Reserve easing cycle, anticipated to start in June. Despite higher inflation readings, the Federal Reserve has downplayed concerns, with Chairman Jerome Powell assuring markets that the central bank will not hastily react to two consecutive months of increased inflation figures.
- WTI gains ground near 81.00, adding 0.37% on the day.
- OPEC+ voluntary production cuts and the Middle East geopolitical tensions might lift WTI prices.
- Weaker economic growth in major countries might drag WTI prices lower.
Western Texas Intermediate (WTI), the US crude oil benchmark, is trading around $81.00 on Monday. WTI prices edge higher amid the softer US Dollar (USD) and the revised demand outlook from the International Energy Agency (IEA).
The IEA forecast significantly less global oil production for the remainder of 2024 following the announcement that OPEC+ will extend the existing voluntary production cuts through the second quarter of 2024. The draw on stockpiles throughout 2024 might boost WTI prices. Furthermore, the uncertainties surrounding geopolitical tensions in the Middle East might increase prices further as many ships are rerouting to avoid the Red Sea, which lengthens the trip and increases costs.
On the other hand, weaker economic growth in major countries might lead to less oil demand and drag WTI prices lower. Market players will keep an eye on the US Gross Domestic Product Annualized (GDP) for the fourth quarter (Q4), due on Thursday. The annual US GDP growth numbers are projected to remain steady at 3.2% in the fourth quarter.
The Federal Reserve (Fed) held rates steady at 5.25–5.50% for a fifth consecutive meeting last week. The Fed maintained its outlook for median dot for 2024 and signalled three quarter-point rate cuts this year. However, any hawkish comments and the higher-for-longer rate narrative from the central bank might cap the upside of the WTI prices as it translates to less demand for oil with higher costs.
- Australian Dollar rises on stronger Chinese Yuan and higher ASX 200 on Monday.
- Australia's government has committed to backing a minimum wage increase aligned with inflation in 2024.
- CNY experienced a significant upward movement due to FX intervention, with Chinese major state banks observed selling USD/CNY.
The Australian Dollar (AUD) starts the week by recovering its recent losses registered in the previous session. The AUD/USD pair trades higher on Monday despite a slight decrease in the US Dollar (USD) amid higher US Treasury yields. Investors are expected to closely monitor the Australian monthly Consumer Price Index (CPI) data for February and the US Gross Domestic Product (GDP) for the fourth quarter of 2023.
The Australian Dollar receives upward momentum as the ASX 200 Index extends its winning streak, led by gains in the mining and energy sectors. Additionally, the Aussie Dollar is bolstered by a stronger Chinese Yuan (CNY), with the People's Bank of China (PBoC) setting the mid-rate for the onshore yuan significantly higher than expected.
The US Dollar Index (DXY) undergoes a correction after hitting a five-week high at 104.49 in the previous session. The US Dollar (USD) might face downward pressure as ongoing United States (US) data shapes expectations for the start of the Federal Reserve (Fed) easing cycle, anticipated to commence in June. The Federal Reserve (Fed) has downplayed higher inflation readings, with Chairman Jerome Powell reassuring markets that the central bank will not hastily react to two consecutive months of increased inflation figures.
Daily Digest Market Movers: Australian Dollar appreciates on stronger CNY, ASX 200
- Australian Employment Change for February surged to 116.5K, surpassing expectations of 40.0K and the previous figure of 15.3K.
- Australia’s Unemployment Rate flashed by 3.7%, lower than the anticipated 4.0% and the previous 4.1%.
- Australia's government has pledged to support a minimum wage increase aligned with inflation this year, recognizing the ongoing challenges faced by low-income families amid the rising costs of living.
- China's Premier Li Qiang stated on Sunday that the nation's low inflation rate and low central government debt ratio provide significant leeway for macroeconomic policy adjustments.
- During the press conference, Fed Chair Jerome Powell stated that an unexpected rise in unemployment could lead the Federal Reserve to consider lowering interest rates.
- S&P Global Services PMI showed a slight decrease in March, dropping to 51.7 from 52.3. The expected reading was 52.0. Manufacturing PMI rose to 52.5 against the expected 51.7 and 52.2 prior. Composite PMI showed a slight dip to 52.2 from 52.5 prior.
- Initial Jobless Claims for the week ending on March 15 came in at 210K, below the 215K expected and 212K prior.
Technical Analysis: Australian Dollar hovers below 0.6540 followed by the 23.6% Fibonacci
The Australian Dollar trades near 0.6540 on Monday. The immediate resistance appears at the 23.6% Fibonacci retracement level of 0.6541, followed by the major barrier of 0.6550 level. A breakthrough above the latter could lead the AUD/USD pair to navigate the area around the 50-day Exponential Moving Average (EMA) at 0.6566 following the psychological barrier of 0.6600. On the downside, the key support appears at the psychological level of 0.6500. followed by March’s low at 0.6477.
AUD/USD: Daily Chart
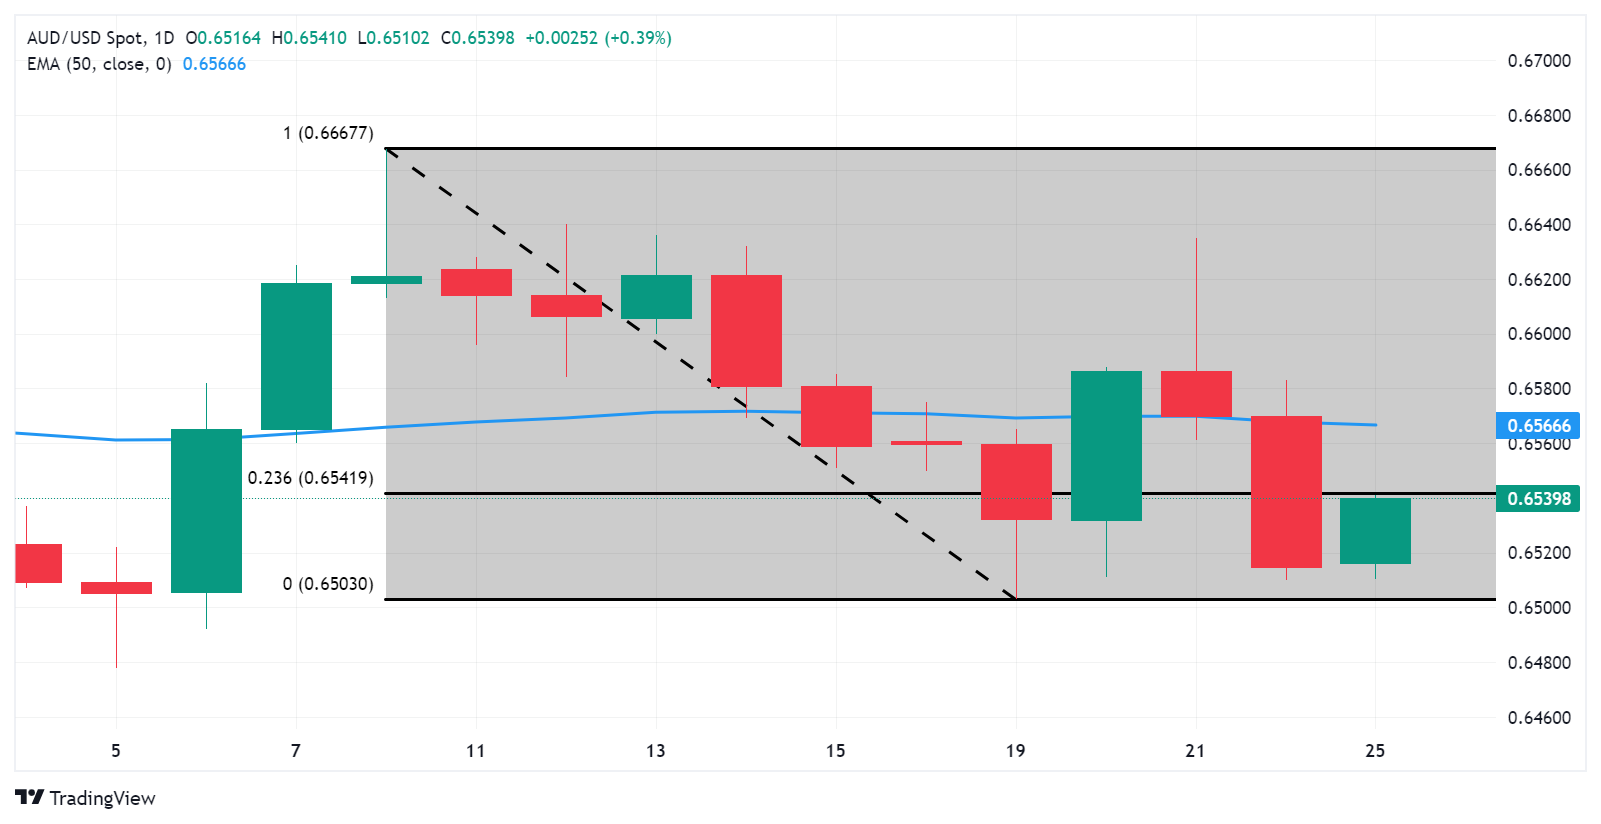
Australian Dollar price today
The table below shows the percentage change of Australian Dollar (AUD) against listed major currencies today. Australian Dollar was the strongest against the US Dollar.
| USD | EUR | GBP | CAD | AUD | JPY | NZD | CHF | |
| USD | -0.11% | -0.14% | -0.14% | -0.37% | -0.09% | -0.35% | -0.05% | |
| EUR | 0.13% | -0.02% | -0.02% | -0.24% | 0.02% | -0.18% | 0.07% | |
| GBP | 0.14% | 0.02% | 0.00% | -0.22% | 0.04% | -0.16% | 0.08% | |
| CAD | 0.13% | 0.02% | 0.00% | -0.22% | 0.04% | -0.17% | 0.08% | |
| AUD | 0.37% | 0.24% | 0.23% | 0.23% | 0.25% | 0.02% | 0.31% | |
| JPY | 0.08% | -0.02% | 0.04% | -0.02% | -0.26% | -0.24% | 0.06% | |
| NZD | 0.30% | 0.23% | 0.21% | 0.21% | -0.02% | 0.24% | 0.30% | |
| CHF | 0.06% | -0.07% | -0.09% | -0.08% | -0.31% | -0.03% | -0.25% |
The heat map shows percentage changes of major currencies against each other. The base currency is picked from the left column, while the quote currency is picked from the top row. For example, if you pick the Euro from the left column and move along the horizontal line to the Japanese Yen, the percentage change displayed in the box will represent EUR (base)/JPY (quote).
Australian Dollar FAQs
One of the most significant factors for the Australian Dollar (AUD) is the level of interest rates set by the Reserve Bank of Australia (RBA). Because Australia is a resource-rich country another key driver is the price of its biggest export, Iron Ore. The health of the Chinese economy, its largest trading partner, is a factor, as well as inflation in Australia, its growth rate, and Trade Balance. Market sentiment – whether investors are taking on more risky assets (risk-on) or seeking safe havens (risk-off) – is also a factor, with risk-on positive for AUD.
The Reserve Bank of Australia (RBA) influences the Australian Dollar (AUD) by setting the level of interest rates that Australian banks can lend to each other. This influences the level of interest rates in the economy as a whole. The main goal of the RBA is to maintain a stable inflation rate of 2-3% by adjusting interest rates up or down. Relatively high interest rates compared to other major central banks support the AUD, and the opposite for relatively low. The RBA can also use quantitative easing and tightening to influence credit conditions, with the former AUD-negative and the latter AUD-positive.
China is Australia’s largest trading partner so the health of the Chinese economy is a major influence on the value of the Australian Dollar (AUD). When the Chinese economy is doing well it purchases more raw materials, goods and services from Australia, lifting demand for the AUD, and pushing up its value. The opposite is the case when the Chinese economy is not growing as fast as expected. Positive or negative surprises in Chinese growth data, therefore, often have a direct impact on the Australian Dollar and its pairs.
Iron Ore is Australia’s largest export, accounting for $118 billion a year according to data from 2021, with China as its primary destination. The price of Iron Ore, therefore, can be a driver of the Australian Dollar. Generally, if the price of Iron Ore rises, AUD also goes up, as aggregate demand for the currency increases. The opposite is the case if the price of Iron Ore falls. Higher Iron Ore prices also tend to result in a greater likelihood of a positive Trade Balance for Australia, which is also positive of the AUD.
The Trade Balance, which is the difference between what a country earns from its exports versus what it pays for its imports, is another factor that can influence the value of the Australian Dollar. If Australia produces highly sought after exports, then its currency will gain in value purely from the surplus demand created from foreign buyers seeking to purchase its exports versus what it spends to purchase imports. Therefore, a positive net Trade Balance strengthens the AUD, with the opposite effect if the Trade Balance is negative.
| Raw materials | Closed | Change, % |
|---|---|---|
| Silver | 24.669 | -0.33 |
| Gold | 2165.516 | -0.76 |
| Palladium | 986.71 | -2.24 |
- EUR/USD gains ground around 1.0816 on the softer USD.
- FOMC’s Chair Powell said the recent elevated CPI inflation data hadn’t changed the overall view that inflation is trending lower.
- ECB’s Scicluna said the rate cut as soon as April could be warranted and shouldn’t be ruled out.
- Investors will focus on the Chicago Fed National Activity Index, US New Home Sales, and the Fed's Bostic speech on Monday.
The EUR/USD pair kicks off the new week on a positive note above the 1.0800 mark amid the softer US Dollar (USD). The highlights for this week will be the release of German February Retail Sales and US Gross Domestic Product (GDP) growth numbers for the fourth quarter (Q4). At the press time, EUR/USD is trading at 1.0816, adding 0.08% on the day.
The Federal Open Market Committee (FOMC) held rates steady at 5.25–5.50% for a fifth consecutive meeting last week. The FOMC’s Chair Powell said the recent elevated CPI inflation data hadn’t changed the view that inflation is trending lower while adding that the central bank would be prepared to cut rates if labour market conditions deteriorated unexpectedly. The FOMC maintained its outlook for median dot for 2024 at 4.625% and signaled three quarter-point rate cuts this year. Any dovish comments from Fed officials weigh on the US Dollar (USD) and cap the downside of the EUR/USD pair.
Across the pond, European Central Bank (ECB) Governing Council member Edward Scicluna stated that the interest-rate cut from the ECB as soon as April could be warranted and shouldn’t be ruled out. Meanwhile, Bundesbank President Joachim Nagel said on Friday that the ECB may be in a position to cut interest rates before the summer, possibly in June, as inflation is on the way back to the 2% target.
Financial markets anticipate 89 basis points (bps) of rate cuts or at least three but possibly four 25 bps moves, with the first coming in June or July. Additionally, the growing speculation that the ECB will be the second major central bank to cut rates after the Swiss National Bank (SNB) cut rates in a surprise move last week weighs on the Euro (EUR) against the Greenback
Moving on, the Chicago Fed National Activity Index and US New Home Sales for February will be due on Monday, along with the Fed's Bostic speech. On Thursday, the German Retail Sales and US GDP Annualized growth numbers for Q4 will be released. The US economy is forecast to expand 3.4%.
- ASX 200 Index continues its winning streak on gains in miners and energy stocks.
- Citi attributes a portion of the imbalances in iron ore prices to "non-traditional" sources of supply.
- Australian stock market is set to experience a dividend week, during which a staggering $18.8 billion will be distributed to shareholders.
The ASX 200 Index continues its winning streak that began on March 15, trading higher around 7,810, up by 0.45%, by the press time on Monday. This surge is driven by gains in miners and energy stocks. Concurrently, the A-VIX exhibits a notable rise today, climbing 2.35% to 11.14. The All Ords also sees an uptick, rising by 0.70% to 8,082.30.
ANZ predicts that iron ore prices are approaching the bottom, as they have experienced a significant decline since the beginning of the year. Citi, a major brokerage firm, attributes part of the market's imbalance to "non-traditional" sources of supply.
Investors are eagerly awaiting key domestic inflation and consumer spending figures later in the week, seeking insights into the Reserve Bank of Australia's (RBA) monetary policy trajectory. Additionally, the upcoming dividend week will play a crucial role in shaping the tone of the Australian stock market, with a remarkable $18.8 billion slated to be distributed to shareholders. Additionally, this week is abbreviated due to the impending Easter break.
Gains in the mining and energy sectors were driven by notable performances from Fortescue Metals, surging by 4.71%, West African Resources rising by 4.59%, BHP Group up by 1.05%, and Rio Tinto climbing by 1.32%. On the other side, major losers included ALS, down by 4.59%, Block Inc. falling by 3.90%, and Life360 Inc. decreasing by 3.58%, as of the latest update.
The RBA's latest Financial Stability Report highlights a concerning statistic that one in every 20 mortgage holders in Australia is spending more on repayments and other living expenses than their income. However, the RBA remains optimistic about the resilience of the Australian economy, asserting its ability to withstand risks originating from overseas.
In other news, Proteomics International Laboratories has entered into an agreement with the University of Oxford to acquire approximately 600 patient plasma samples for a study on endometriosis. These samples will facilitate further clinical validation of the company’s PromarkerEndo diagnostic models for detecting the disease.
Australian Stock Market FAQs
Stock markets in Australia are managed by the Australian Securities Exchange (ASX), headquartered in Sydney. The main indices are the S&P/ASX 200 and the S&P/ASX 300, which track the performance of the 200 and 300 largest stocks by market capitalization listed on the exchange, respectively. The S&P/ASX 200 was launched in April 2000, and it is rebalanced every quarter.
Almost half of the index belongs to the financial sector, with major banks like the Commonwealth Bank of Australia, Westpac or National Australia Bank. The so-called materials sector is also relevant – comprising almost 20% of the weighting in the index – with mining giants such as BHP Group or Rio Tinto. Other important sectors are biotechnology, real estate, consumer staples, and industrials.
Many different factors drive the ASX 200, but mainly it is the aggregate performance of the component companies revealed in their quarterly and annual earnings reports the main factor behind its performance. Commodity prices can also affect the index given its significant share of mining companies. Macroeconomic data such as Gross Domestic Product (GDP) growth, inflation, or unemployment data from Australia is also important as they are indicators of the health of the country’s economy and thus the profitability of its largest companies. Global economic conditions may also play a role, particularly from China, as the Asian country is Australia’s largest trading partner.
The level of interest rates in Australia, set by the Reserve Bank of Australia (RBA), also influences the ASX 200 and ASX 300 indexes as it affects the cost of credit, on which many firms are heavily reliant. Generally, when the RBA cuts interest rates (or signals it is going to do it), it is positive for the Australian stock market as it means a lower cost of credit for companies and higher economic growth ahead, likely boosting sales. On the contrary, if the RBA signals that it will increase interest rates, this tends to weigh on the index. As always, there is a caveat: banks. Financial institutions tend to benefit from higher interest rates because they earn more from lending to other businesses, thus boosting their overall income.
The People’s Bank of China (PBoC) set the USD/CNY central rate for the trading session ahead on Monday at 7.0996 as compared to the previous day's fix of 7.1004 and 7.2267 Reuters estimates.
Federal Reserve (Fed) Bank of Atlanta President Raphael Bostic said on Friday that he expected just one interest rate cut this year instead of the two rate cuts he had forecast, citing persistent inflation and stronger-than-anticipated economic data.
Key quotes
“Economy has proved more resilient than anticipated so much so that he's doubled his expected GFP growth estimate to 2%.”
“Sees little or no change in the current 3.9% unemployment rate.”
“Says 3.9% unemployment was considered an inflationary level not too long go.”
“Says inflation is falling but more slowly than anticipated, with many items recording outsized price increases.”
"If we have an economy that is growing above potential, and we have an economy where unemployment is at levels that were deemed to be unimaginable without pricing pressures, and if we have an economy where inflation is moderating. Those are good things."
Market reaction
The US Dollar Index (DXY) is trading 0.03% higher on the day at 104.46, as of writing.
Fed FAQs
Monetary policy in the US is shaped by the Federal Reserve (Fed). The Fed has two mandates: to achieve price stability and foster full employment. Its primary tool to achieve these goals is by adjusting interest rates. When prices are rising too quickly and inflation is above the Fed’s 2% target, it raises interest rates, increasing borrowing costs throughout the economy. This results in a stronger US Dollar (USD) as it makes the US a more attractive place for international investors to park their money. When inflation falls below 2% or the Unemployment Rate is too high, the Fed may lower interest rates to encourage borrowing, which weighs on the Greenback.
The Federal Reserve (Fed) holds eight policy meetings a year, where the Federal Open Market Committee (FOMC) assesses economic conditions and makes monetary policy decisions. The FOMC is attended by twelve Fed officials – the seven members of the Board of Governors, the president of the Federal Reserve Bank of New York, and four of the remaining eleven regional Reserve Bank presidents, who serve one-year terms on a rotating basis.
In extreme situations, the Federal Reserve may resort to a policy named Quantitative Easing (QE). QE is the process by which the Fed substantially increases the flow of credit in a stuck financial system. It is a non-standard policy measure used during crises or when inflation is extremely low. It was the Fed’s weapon of choice during the Great Financial Crisis in 2008. It involves the Fed printing more Dollars and using them to buy high grade bonds from financial institutions. QE usually weakens the US Dollar.
Quantitative tightening (QT) is the reverse process of QE, whereby the Federal Reserve stops buying bonds from financial institutions and does not reinvest the principal from the bonds it holds maturing, to purchase new bonds. It is usually positive for the value of the US Dollar.
- Gold price posts modest gains near $2,168 in Monday’s early Asian session.
- The FOMC maintained its outlook for three quarter-point rate cuts this year, which benefit the gold price.
- The rising geopolitical tension in Ukraine might boost safe-haven assets like gold prices.
Gold price (XAU/USD) holds above the mid-$2,100s during the early Asian trading hours on Monday. The recovery of the yellow metal is bolstered by the higher possibility that the US Federal Reserve (Fed) could start cutting rates later this year. Traders await the US Gross Domestic Product (GDP) numbers for the fourth quarter (Q4) for fresh impetus, which is estimated to remain steady at 3.2%. Gold price currently trades around $2,168, gaining 0.15% on the day.
Last week, the Fed left its benchmark interest rate unchanged for the fifth consecutive meeting at its 5.25% to 5.50% range after its March meeting. The Fed Chairman Jerome Powell hinted that the central bank was on course for three interest rate cuts in 2024, which fuel more investor demand for the precious metal and lift the gold price. Investors have priced in a 72% odds that the Fed will start cutting rates in the June meeting, up from 65% before the rate decision, according to the CME FedWatch Tool.
Furthermore, the escalating geopolitical tension in Ukraine might boost the safe-haven flows, benefiting the gold price. On Sunday, an underground gas storage facility in Ukraine was attacked in the latest round of Russian missile attacks on power facilities. Ukraine President Volodymyr Zelenskiy said attempts to restore power supply were underway in several locations, with the most challenging situation in Kharkiv, Ukraine's second-largest city, per Reuters.
Looking ahead, gold traders will closely watch the US GDP growth numbers Annualized for Q4. If the report shows stronger-than-expected data, this could provide some support to the Greenback and weigh on the US Dollar-denominated Gold. On Friday, the markets will be closed for Good Friday.
| Index | Change, points | Closed | Change, % |
|---|---|---|---|
| NIKKEI 225 | 72.77 | 40888.43 | 0.18 |
| Hang Seng | -363.63 | 16499.47 | -2.16 |
| KOSPI | -6.3 | 2748.56 | -0.23 |
| ASX 200 | -11.4 | 7770.6 | -0.15 |
| DAX | 26.69 | 18205.94 | 0.15 |
| CAC 40 | -27.8 | 8151.92 | -0.34 |
| Dow Jones | -305.47 | 39475.9 | -0.77 |
| S&P 500 | -7.35 | 5234.18 | -0.14 |
| NASDAQ Composite | 26.98 | 16428.82 | 0.16 |
| Pare | Closed | Change, % |
|---|---|---|
| AUDUSD | 0.6513 | -0.86 |
| EURJPY | 163.622 | -0.63 |
| EURUSD | 1.08087 | -0.48 |
| GBPJPY | 190.768 | -0.58 |
| GBPUSD | 1.25997 | -0.44 |
| NZDUSD | 0.5993 | -0.86 |
| USDCAD | 1.36061 | 0.57 |
| USDCHF | 0.89723 | -0.04 |
| USDJPY | 151.414 | -0.13 |
The Bank of Japan (BoJ) Board members shared their views on inflation and monetary policy outlook, per the BoJ Minutes of the January meeting.
Key quotes
“Members agreed on the rising likelihood of hitting the Bank's inflation target, the prospect of doing so was gradually rising.”
“Virtuous cycle of wages and inflation, if confirmed, means members would consider ending negative rates and other steps.”
“Upside risks of inflation greatly overshooting to the topside has become small, according to some members.”
Market reaction
Following the BoJ Minutes, USD/JPY was down 0.12% on the day at 151.28
Bank of Japan FAQs
The Bank of Japan (BoJ) is the Japanese central bank, which sets monetary policy in the country. Its mandate is to issue banknotes and carry out currency and monetary control to ensure price stability, which means an inflation target of around 2%.
The Bank of Japan has embarked in an ultra-loose monetary policy since 2013 in order to stimulate the economy and fuel inflation amid a low-inflationary environment. The bank’s policy is based on Quantitative and Qualitative Easing (QQE), or printing notes to buy assets such as government or corporate bonds to provide liquidity. In 2016, the bank doubled down on its strategy and further loosened policy by first introducing negative interest rates and then directly controlling the yield of its 10-year government bonds.
The Bank’s massive stimulus has caused the Yen to depreciate against its main currency peers. This process has exacerbated more recently due to an increasing policy divergence between the Bank of Japan and other main central banks, which have opted to increase interest rates sharply to fight decades-high levels of inflation. The BoJ’s policy of holding down rates has led to a widening differential with other currencies, dragging down the value of the Yen.
A weaker Yen and the spike in global energy prices have led to an increase in Japanese inflation, which has exceeded the BoJ’s 2% target. Still, the Bank judges that the sustainable and stable achievement of the 2% target has not yet come in sight, so any sudden change in the current policy looks unlikely.


© 2000-2026. All rights reserved.
This site is managed by Teletrade D.J. LLC 2351 LLC 2022 (Euro House, Richmond Hill Road, Kingstown, VC0100, St. Vincent and the Grenadines).
The information on this website is for informational purposes only and does not constitute any investment advice.
The company does not serve or provide services to customers who are residents of the US, Canada, Iran, The Democratic People's Republic of Korea, Yemen and FATF blacklisted countries.
Making transactions on financial markets with marginal financial instruments opens up wide possibilities and allows investors who are willing to take risks to earn high profits, carrying a potentially high risk of losses at the same time. Therefore you should responsibly approach the issue of choosing the appropriate investment strategy, taking the available resources into account, before starting trading.
Use of the information: full or partial use of materials from this website must always be referenced to TeleTrade as the source of information. Use of the materials on the Internet must be accompanied by a hyperlink to teletrade.org. Automatic import of materials and information from this website is prohibited.
Please contact our PR department if you have any questions or need assistance at pr@teletrade.global.
transfers