- Analytics
- News and Tools
- Market News
CFD Markets News and Forecasts — 21-03-2024
Japan’s National Consumer Price Index (CPI) for February climbed to 2.8% YoY from 2.2% in January, according to the latest data released by the Japan Statistics Bureau on Friday.
Further details unveil that the National CPI ex Fresh food arrived at 2.8% YoY in January versus 2.0% prior. The figure was in line with the market consensus.
Market reaction
Following the Japan inflation data, the USD/JPY pair is up 0.02% on the day at 151.65.
Inflation FAQs
Inflation measures the rise in the price of a representative basket of goods and services. Headline inflation is usually expressed as a percentage change on a month-on-month (MoM) and year-on-year (YoY) basis. Core inflation excludes more volatile elements such as food and fuel which can fluctuate because of geopolitical and seasonal factors. Core inflation is the figure economists focus on and is the level targeted by central banks, which are mandated to keep inflation at a manageable level, usually around 2%.
The Consumer Price Index (CPI) measures the change in prices of a basket of goods and services over a period of time. It is usually expressed as a percentage change on a month-on-month (MoM) and year-on-year (YoY) basis. Core CPI is the figure targeted by central banks as it excludes volatile food and fuel inputs. When Core CPI rises above 2% it usually results in higher interest rates and vice versa when it falls below 2%. Since higher interest rates are positive for a currency, higher inflation usually results in a stronger currency. The opposite is true when inflation falls.
Although it may seem counter-intuitive, high inflation in a country pushes up the value of its currency and vice versa for lower inflation. This is because the central bank will normally raise interest rates to combat the higher inflation, which attract more global capital inflows from investors looking for a lucrative place to park their money.
Formerly, Gold was the asset investors turned to in times of high inflation because it preserved its value, and whilst investors will often still buy Gold for its safe-haven properties in times of extreme market turmoil, this is not the case most of the time. This is because when inflation is high, central banks will put up interest rates to combat it. Higher interest rates are negative for Gold because they increase the opportunity-cost of holding Gold vis-a-vis an interest-bearing asset or placing the money in a cash deposit account. On the flipside, lower inflation tends to be positive for Gold as it brings interest rates down, making the bright metal a more viable investment alternative.
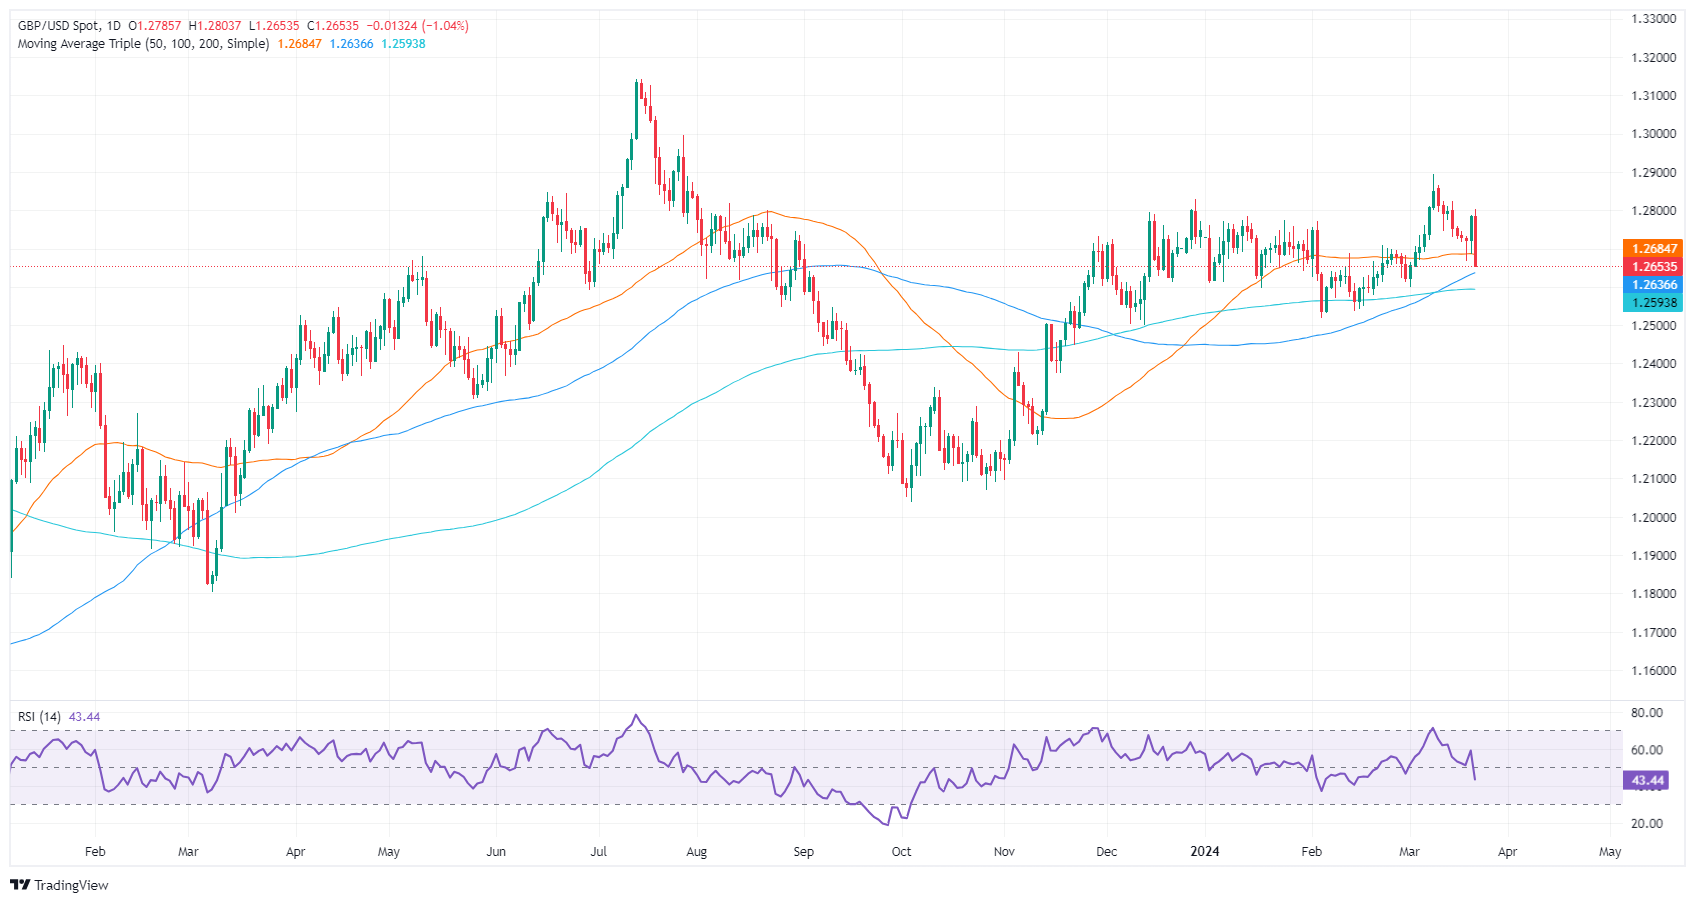
- GBP/USD edges lower to 1.2658 amid the weaker USD.
- The US S&P Global Composite PMI arrived at 52.2 in March vs. 52.5 in February.
- The BoE maintained its interest rates unchanged at 5.25% on Thursday.
- UK February Retail Sales will be due on Friday, which is forecast to fall 0.3% in February.
The GBP/USD pair faces rejection near the 1.2700 mark and holds above the mid-1.2700s during the early Asian session on Friday. The downtick of the major pair is backed by the stronger US Dollar (USD) and the dovish tilt of the Bank of England (BoE). Investors await the UK Retail Sales for fresh impetus, which is expected to fall 0.3% in February. GBP/USD currently trades near 1.2658, down 0.02% on the day.
The BoE kept the interest rate unchanged at 5.25% at its March meeting on Thursday, as widely anticipated. The BoE Governor Andrew Bailey said that the economy is not at a point where the Monetary Policy Committee (MPC) can lower interest rates, but the economy is moving along on the right track. Markets anticipate the UK central bank will need more evidence of moderating wage growth before beginning to cut rates. However, investors maintain bets on BoE rate cuts this year, and the dovish tilt by the BoE policymaker weighs on the Pound Sterling (GBP) and acts as a headwind for the GBP/USD pair.
On the other hand, the Fed held the rate steady at 5.25–5.50% at its March meeting on Wednesday, with the median FOMC projections retaining three cuts in 2024. The markets have priced in around 80% odds that the Fed will cut rates in June, according to the CME FedWatch Tool.
On Thursday, the US S&P Global Composite PMI came in at 52.2 in March from 52.5 in February. Meanwhile, the S&P Global Manufacturing PMI improved to 52.5 from 52.2 in the previous reading, above the market consensus of 51.7. The Services PMI eased to 51.7 in March from the previous reading of 52.3, weaker than the estimation of 52.0.
Moving on, market players will focus on the UK February Retail Sales. Also, Fed Chair Jerome Powell and Michael Barr are set to speak on Friday. Traders will take cues from the data and find trading opportunities around the GBP/USD pair.
- AUD/USD recovers to 0.6571 after dipping, despite central bank actions.
- BoJ hikes, SNB cuts rates, and other central banks are steady.
- Mixed US data: manufacturing up, services, and composite PMIs down.
- Market eyes June Fed cut, post-steady rate projections.
The Australian Dollar (AUD) tumbled against the US Dollar (USD) on Thursday despite refreshing weekly highs at 0.6634, printed losses of 0.25%. However, as Friday’s Asian session begins, the AUD/USD exchanges hands at 0.6571, virtually unchanged as traders brace for the weekend.
Australian Dollar holds near weekly lows amid mixed global monetary policy moves
A tranche of central banks adjusted their monetary policy throughout the weekend, led by the Bank of Japan, the Reserve Bank of Australia, the Federal Reserve, the Bank of England and the Swiss National Bank. Most of them kept rates unchanged, being the outliers of the BoJ and the SNB. The former raised rates for the first time in almost two decades, while the latter was the first major central bank to cut interest rates.
Data-wise, the US economic schedule featured March S&P Global PMIs, with the services and the composite index, missing estimates but standing at expansionary territory. On a positive note, manufacturing activity accelerated to its fastest pace in almost two years. Elsewhere, the US labor market continued to show signs of tightness despite the recent withholding according to February’s Nonfarm Payrolls figures. Initial Jobless Claims for the week ending March 16 fell to 210k versus 212k the week prior.
Aside from this, market participants seem convinced they overreacted post-Federal Reserve’s decision to withhold the federal funds rate (FFR) unchanged at the 5.25%-5.50% range. The Fed Dot-Plots failed to deliver a hawkish stance, keeping three cut rates on the table for 2024, spurring a jump in interest rate cut expectations for June, which sit at around 80%.
On the Aussie’s front, the docket is empty, though proxies like the data from New Zealand would feature the Balance of Trade and Japan’s Consumer Price Index (CPI) for February.
Australian Dollar FAQs
One of the most significant factors for the Australian Dollar (AUD) is the level of interest rates set by the Reserve Bank of Australia (RBA). Because Australia is a resource-rich country another key driver is the price of its biggest export, Iron Ore. The health of the Chinese economy, its largest trading partner, is a factor, as well as inflation in Australia, its growth rate and Trade Balance. Market sentiment – whether investors are taking on more risky assets (risk-on) or seeking safe-havens (risk-off) – is also a factor, with risk-on positive for AUD.
The Reserve Bank of Australia (RBA) influences the Australian Dollar (AUD) by setting the level of interest rates that Australian banks can lend to each other. This influences the level of interest rates in the economy as a whole. The main goal of the RBA is to maintain a stable inflation rate of 2-3% by adjusting interest rates up or down. Relatively high interest rates compared to other major central banks support the AUD, and the opposite for relatively low. The RBA can also use quantitative easing and tightening to influence credit conditions, with the former AUD-negative and the latter AUD-positive.
China is Australia’s largest trading partner so the health of the Chinese economy is a major influence on the value of the Australian Dollar (AUD). When the Chinese economy is doing well it purchases more raw materials, goods and services from Australia, lifting demand for the AUD, and pushing up its value. The opposite is the case when the Chinese economy is not growing as fast as expected. Positive or negative surprises in Chinese growth data, therefore, often have a direct impact on the Australian Dollar and its pairs.
Iron Ore is Australia’s largest export, accounting for $118 billion a year according to data from 2021, with China as its primary destination. The price of Iron Ore, therefore, can be a driver of the Australian Dollar. Generally, if the price of Iron Ore rises, AUD also goes up, as aggregate demand for the currency increases. The opposite is the case if the price of Iron Ore falls. Higher Iron Ore prices also tend to result in a greater likelihood of a positive Trade Balance for Australia, which is also positive of the AUD.
The Trade Balance, which is the difference between what a country earns from its exports versus what it pays for its imports, is another factor that can influence the value of the Australian Dollar. If Australia produces highly sought after exports, then its currency will gain in value purely from the surplus demand created from foreign buyers seeking to purchase its exports versus what it spends to purchase imports. Therefore, a positive net Trade Balance strengthens the AUD, with the opposite effect if the Trade Balance is negative.
New Zealand's seasonally-adjusted Trade Balance for the year ended in February rose to $-11.99 billion YoY compared to the previous period's $-12.62 billion, with both Exports and Imports rising in February from January's minor decline.
New Zealand's February Imports saw a meager rise to 6.11 billion, a slight but measurable recovery from January's dip to an 11-month low of 5.9 billion. The rebound in Imports was eclipsed by a firmer recovery in New Zealand's Exports in February, which rebounded to 5.89 billion from January's four-month low of 4.93 billion.
New Zealand's overall merchandise Trade Balance came within a hair of $-12 billion, and January's Trade Balance saw a slight downside revision to $-12.62 billion from the initial print of $-12.5 billion.
February's New Zealand Exports are 16% higher than the same time in 2023, rising $823 million YoY. Goods Imports are also 3.3% higher than at the same time last year, rising $194 million YoY.
Market reaction
The NZD/USD is trading thinly in Friday's early Asia market session, churning just beneath the 0.6050 level after the pair sagged from a failed bid to capture the 0.6100 handle amidst Thursday's broad-market US Dollar recovery.
NZD/USD 5-minute chart
About New Zealand's Trade Balance
Trade balance, released by Statistics New Zealand, is the difference between the value of country's exports and imports, over a period of year. A positive balance means that exports exceed imports, a negative ones means the opposite. Positive trade balance illustrates high competitiveness of country's economy.
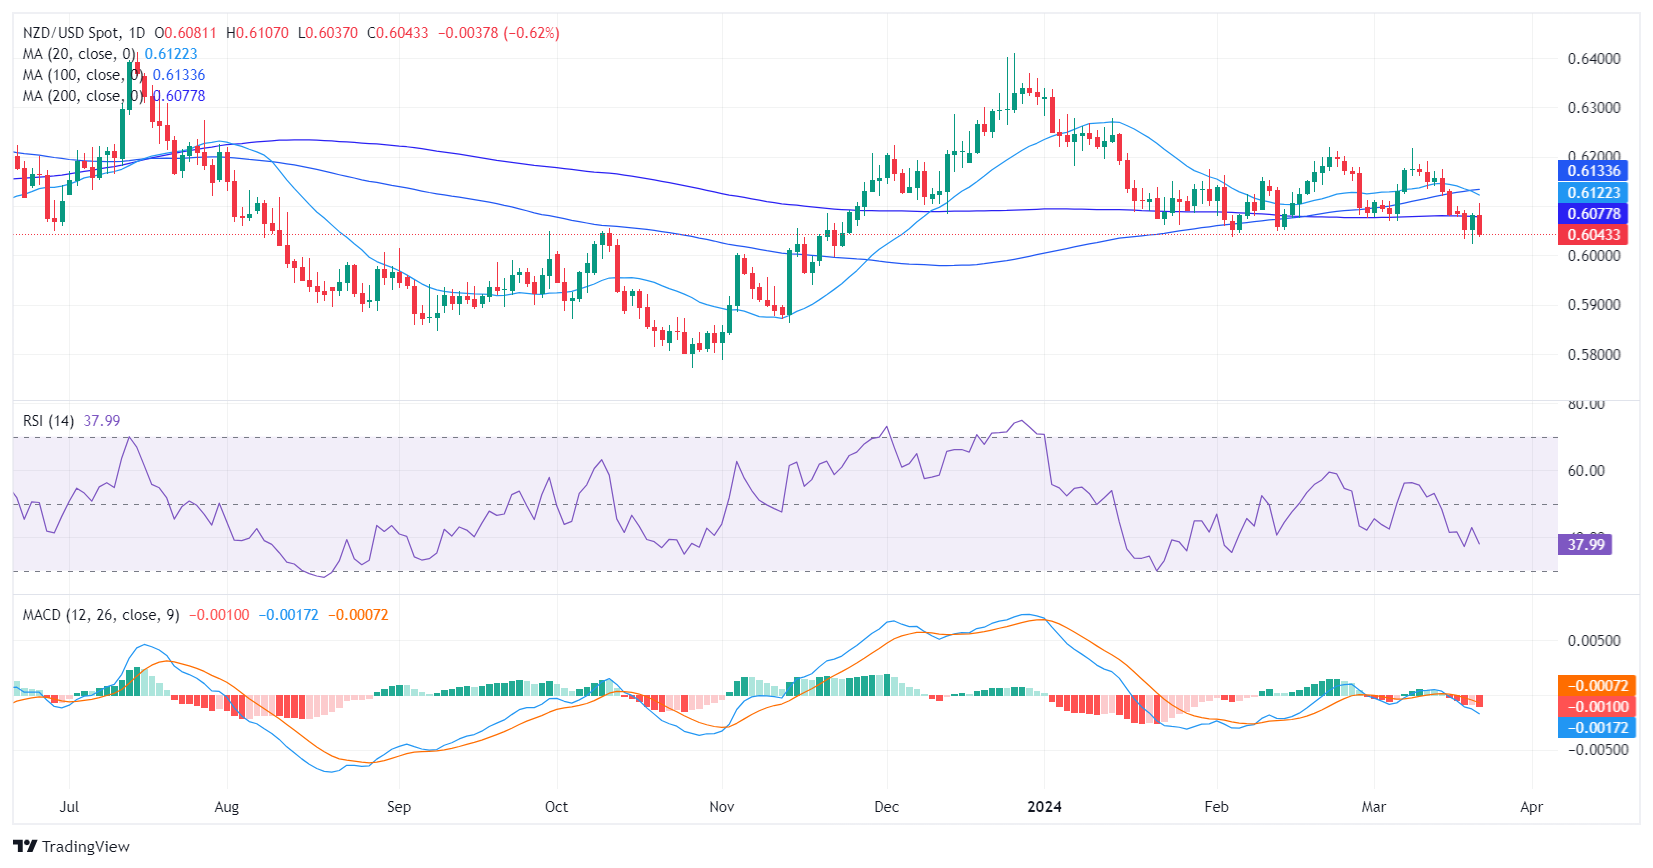
- The NZD/USD pair maintains its losing streak, depicting a bearish session on Thursday.
- The RSI for the daily chart points to a growing selling momentum, while MACD prints rising red bars.
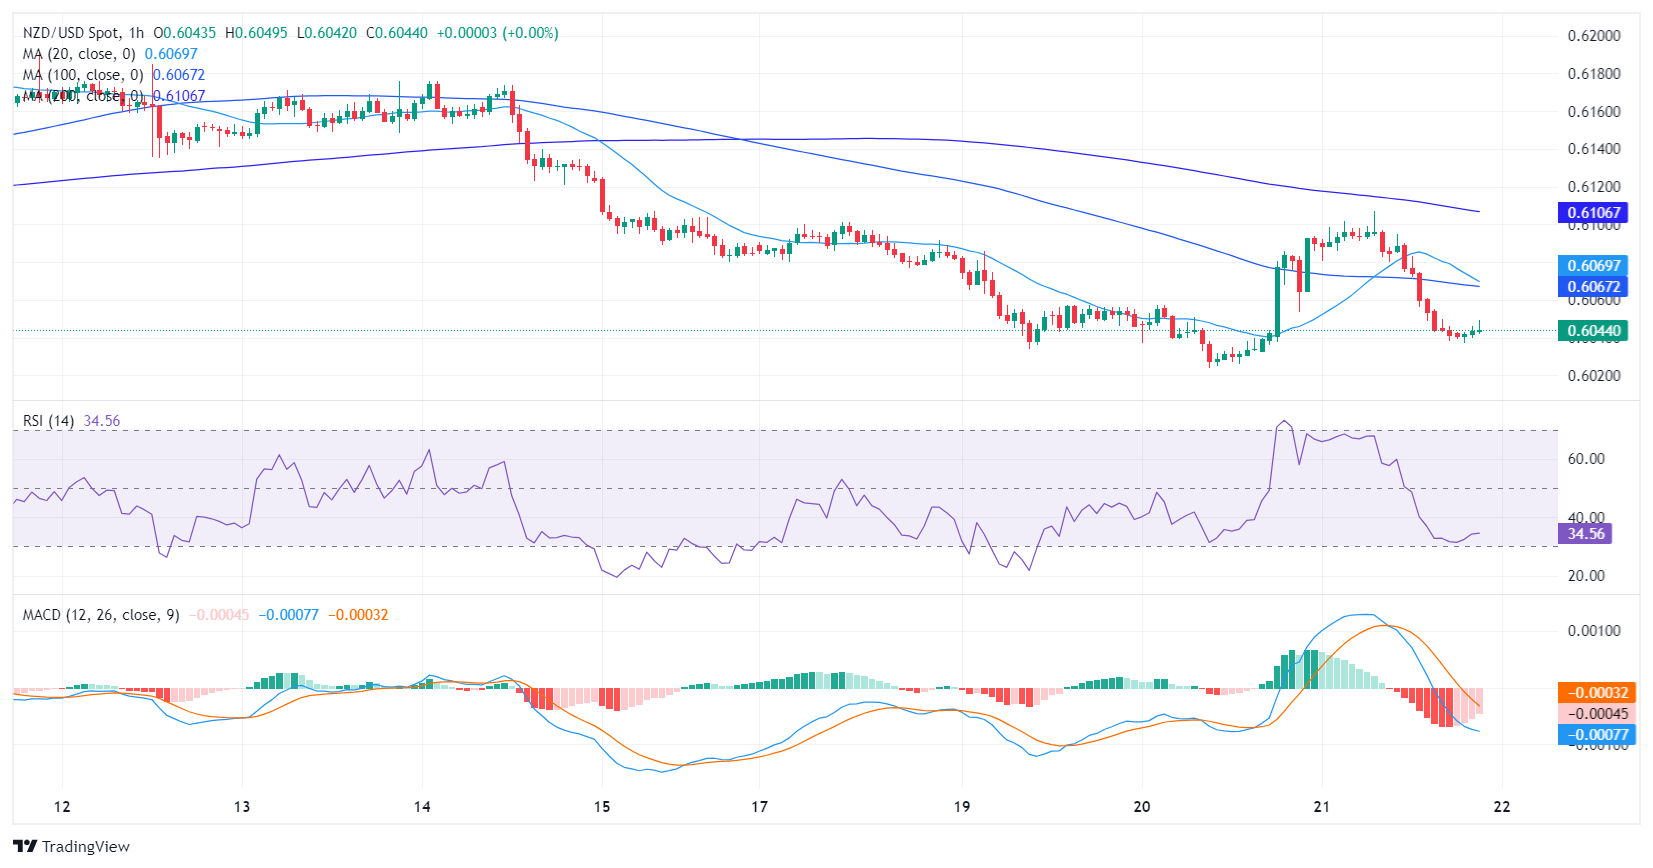
- Mimicking the daily chart, the hourly signals flash the ongoing strength of the sellers but with indicators somewhat flat.
The NZD/USD pair is trading lower at around 0.6045, undergoing a 0.33% decline. The currency pair's market sentiment seems to lean towards the bearish side, with sellers maintaining a strong grip. On the hourly chart, the selling pressure eased somewhat but the bears are still present.
On the daily chart, the Relative Strength Index (RSI) remains in negative territory, suggesting that sellers dominate the market. Furthermore, the rising red bars of the Moving Average Convergence Divergence (MACD) histogram indicate growing negative momentum, further supporting this bearish outlook.
NZD/USD daily chart
When reviewing the hourly chart, a similar pattern arises. The RSI still resides in the negative territory, indicating a bearish momentum prevailing in the market. The red bars of the MACD histogram continue to increase in this shorter timeframe, signaling the ongoing strength of the sellers. However, the latter flattened near the oversold indicating that the pair may consolidate the downwards movements ahead of the Asian session. Fundamental factors will be key as they could prompt another leg downwards.
NZD/USD hourly chart
A consistent negative trend is evident across both timeframes after comparing the daily and hourly charts. The RSI and MACD indicators suggest continuing domination by sellers in the NZD/USD pair. Surveying the larger context, the pair falls below the 20, 100, and 200-day Simple Moving Averages (SMAs), adding more evidence to the negative trend depicted in the daily and hourly charts.
- AUD/JPY nears 100.00 after strong Australian job data.
- Above Ichimoku Cloud, moving averages hint bullish trend.
- Resistance at 100.17, 101.00, with 102.84, 2014’s swing high as next target.
- Correction might pull to 99.05 and retreat deeper to 98.53, but bullish sentiment prevails.
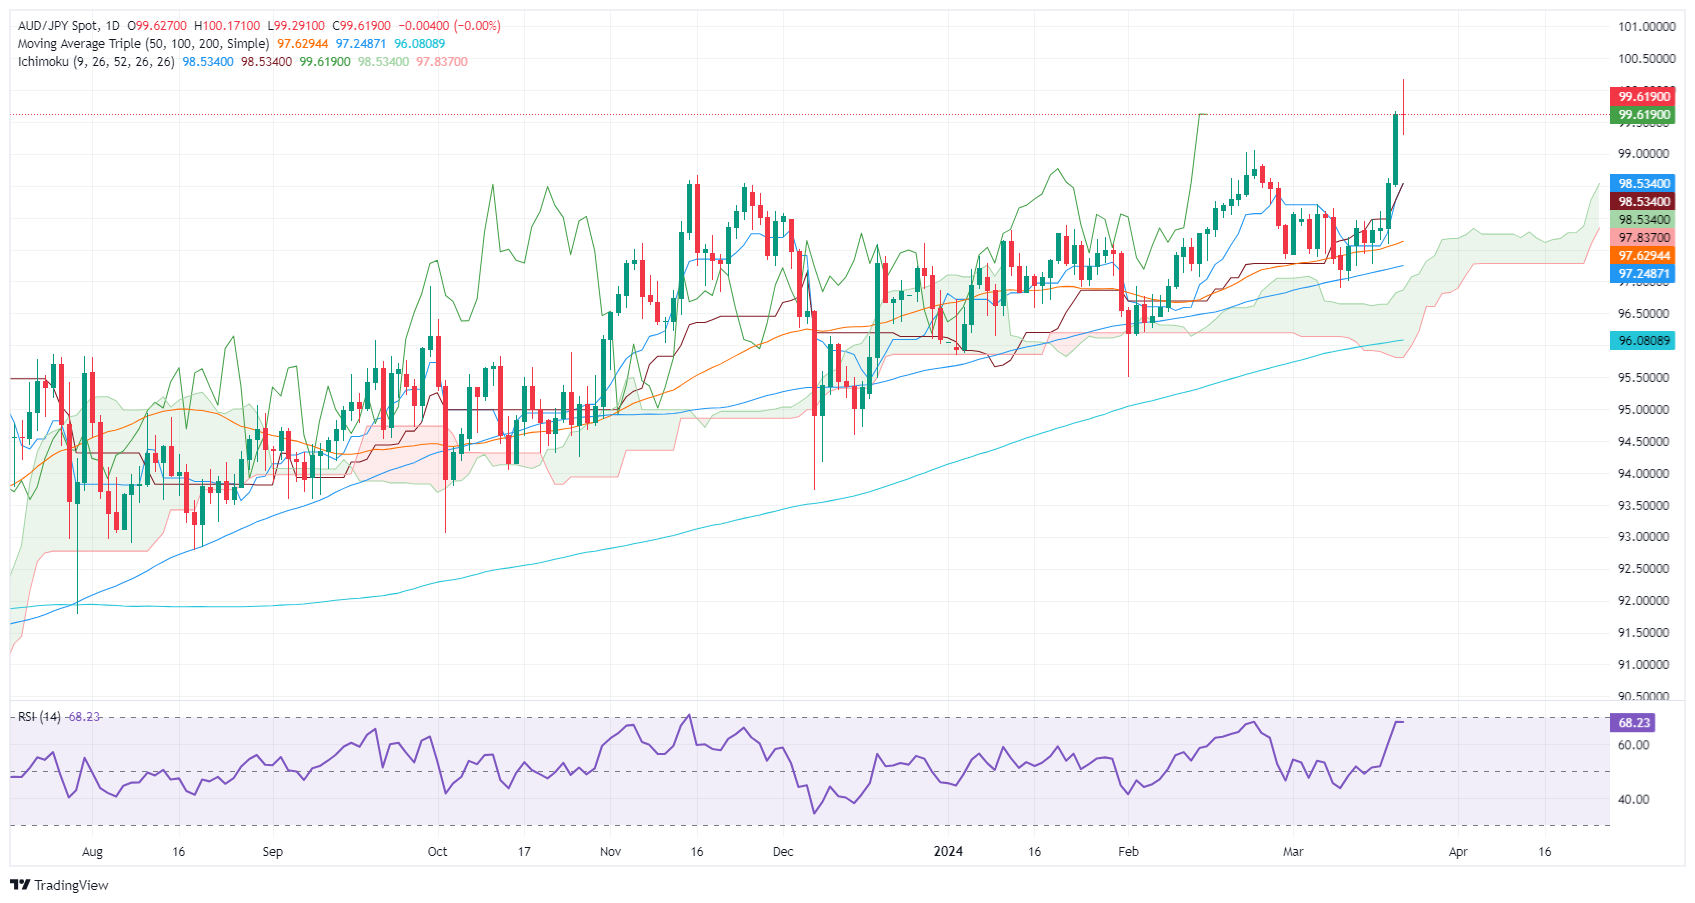
The AUD/JPY is virtually unchanged on Thursday in late trading during the North American session. At the time of writing, the pair is 99.62 shy of the 100.00 figure after hitting a ten-year high of 100.17 on positive Aussie jobs data.
AUD/JPY Price Analysis: Technical outlook.
The AUD/JPY daily chart suggests the cross is upward biased, though today’s price action indicates neither buyers nor sellers are gaining the battle. The pair surged past the Ichimoku Cloud (Kumo), signaling a strong uptrend, reinforced by the price exchanging hands above both the Tenkan and Kijun-Sen levels.
The slope of the Senkou Span A aims higher, indicating that further upside is seen. The 100.00 figure is the key resistance level. Once cleared, the next stop would be 100.17 and the 101.00 figure. Up next would be the 2014 high at 102.84.
Nevertheless, due to an overextended market move, the potential for a mean reversion move increases. Even though a pullback to the February 23 swing high at 99.05 isn’t out of cards, the pullback could be capitalized by bulls, as the rally is set to continue. However, a deeper pullback below that level could expose the Tenkan and Kijun-sen levels at 98.53.
AUD/JPY Price Action – Daily Chart
- The Euro’s Fed-fueled rise against the Greenback proved short-lived.
- Fed tips hat to future rate cuts, US Dollar selloff proves temporary.
- European Manufacturing PMI slips, US Services PMI contracts.
The EUR/USD drove headfirst back into familiar territory on Thursday, wit the pair falling three-quarters of a percent through the day to end near 1.0850. Wednesday’s Fed-fueled rally proved to be a whipsaw rather than a break of character for the markets, and the Fiber is pinned firmly back into familiar near-term consolidation territory.
The Euro (EUR) quickly backpedaled in early Thursday trading after European Purchasing Managers Index (PMI) figures for the European continent shook investors awake. As the economic powerhouse of the European Union, Germany’s mixed PMI prints splashed cold water on Euro bidders, with the German March Manufacturing PMI sliding to a five-month low of 41.6 as business activity confidence continues to wither. Germany’s Manufacturing component was expected to tick upwards to 43.1 from 42.5, and the downside print drowned out an uptick in Germany’s Services PMI component, which printed above expectations at 49.8, beating the forecast 49.8 and inches closer towards positive 50.0 territory after last month’s 48.3.
The pan-European HCOB Manufacturing PMI was expected to come in at an even 47.0 versus the previous 46.5, but missed expectations to print on the downside at 45.7.
US data also came in mixed, helping to bolster safe-haven bids into the Greenback. March’s US S&P Global Composite PMI declined slightly to 52.2 from the previous 52.5, with the backslide fueled by a miss for the US Services PMI component. US March Services PMI fell more than expected, printing at 51.7 versus the forecast 52.0 after coming in at 52.3 in February.
The trading week will wrap up on Friday with German IFO Expectations, which are expected to improve slightly to 84.7 from 84.1. On the US side, Friday brings a batch of Federal Reserve (Fed) board member speeches as the black-out period from the latest Fed rate call lifts. Fed Chairman Jerome Powell will be headlining the Fed appearance on Friday, slated to give a speech at 13:00 GMT at a Fed Listens event in Washington, DC.
EUR/USD technical outlook
The EUR/USD fell from the day’s early high of 1.09426, declining eight-tenths of a percent top-to-bottom to touch 1.08546. The pair hit the closing bell on Thursday’s trading window near 1.0857.
The pair is getting mired in the 200-period Exponential Moving Average (EMA) near 1.0864, and Thursday’s bearish turnaround leaves the EUR/USD at risk of chalking in a lower high on the 4-hour charts.
EUR/USD 15-minute chart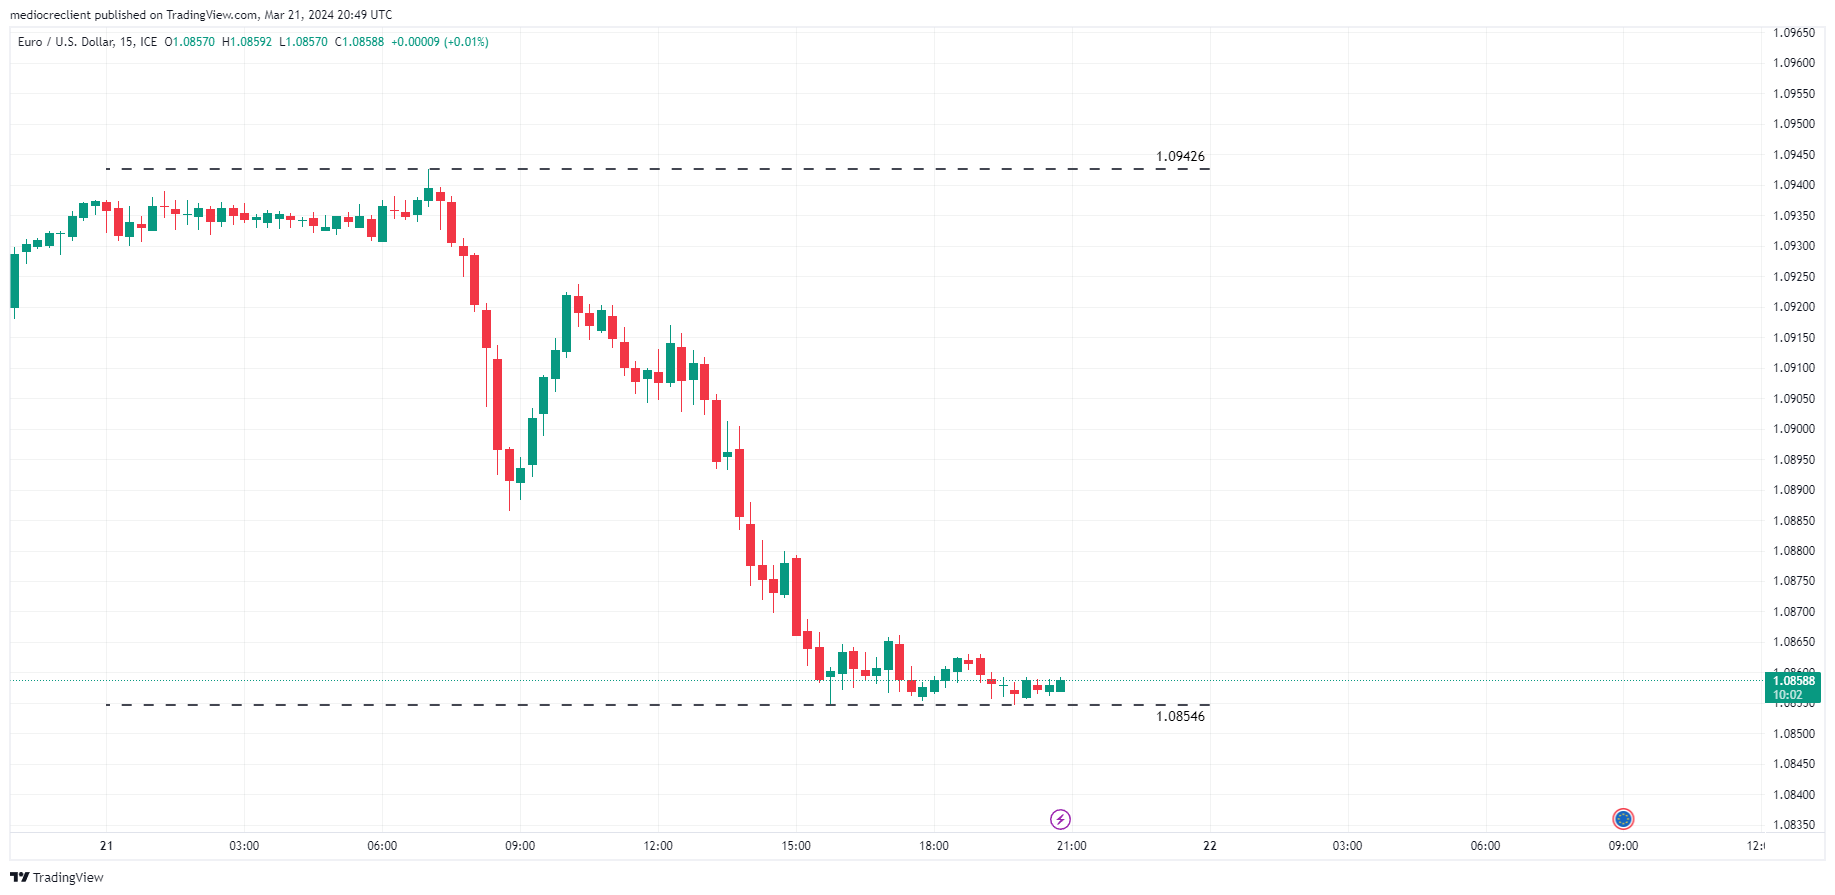
EUR/USD 4-hour chart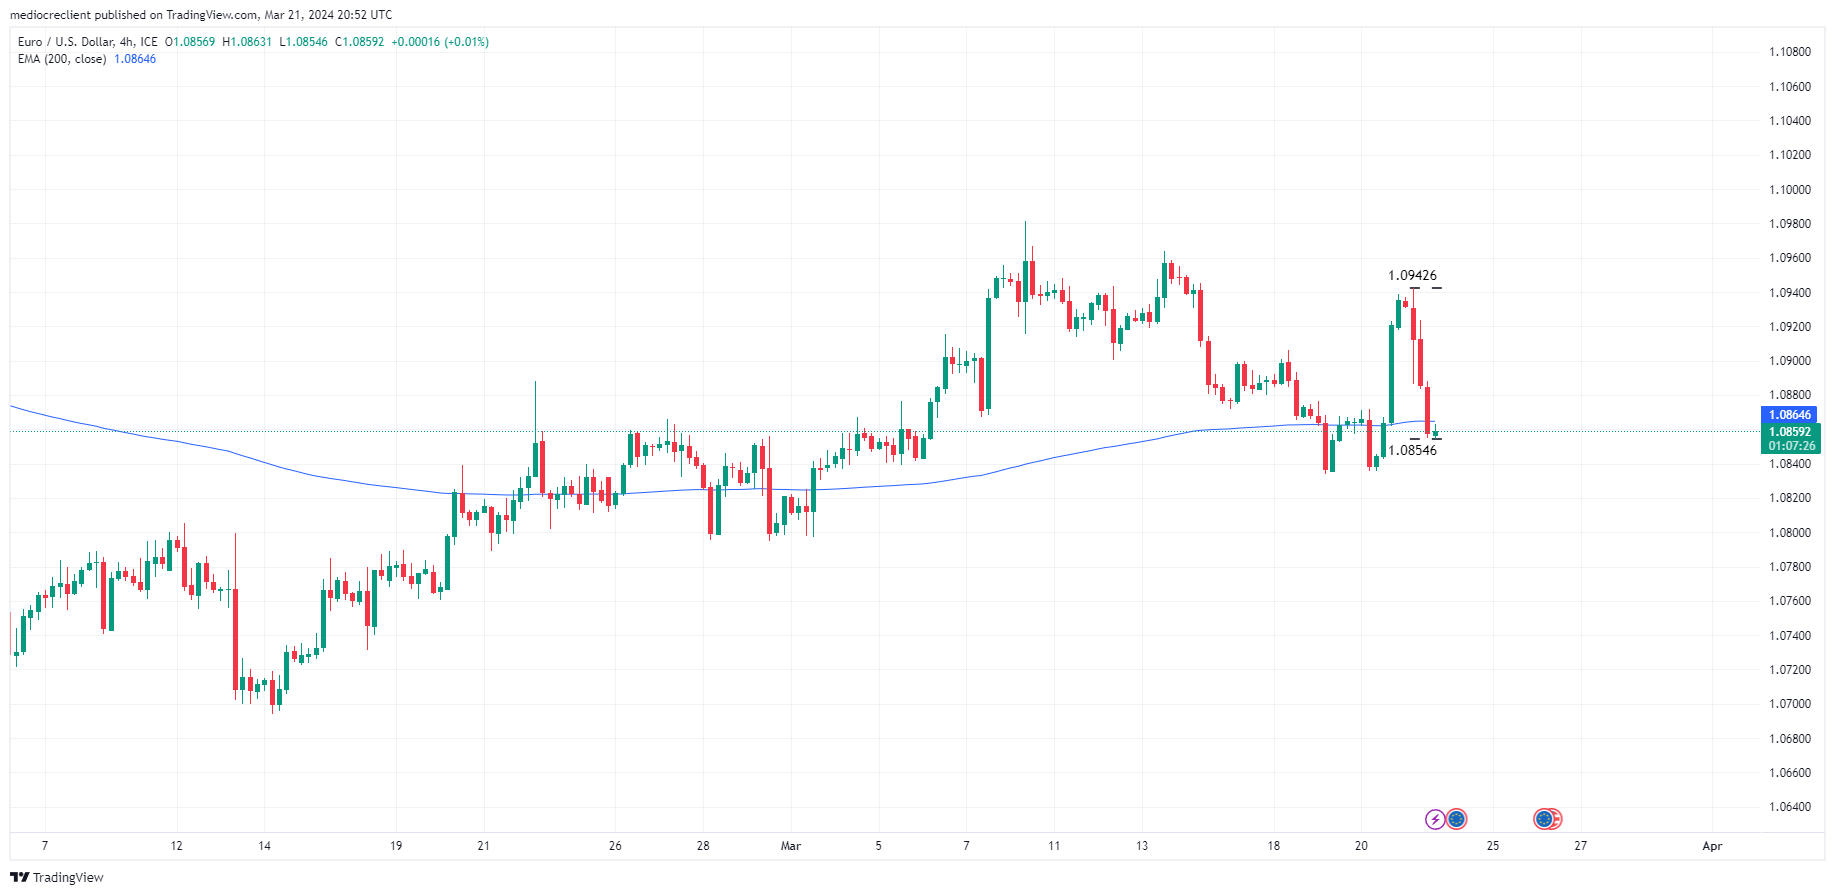
- Silver prices see a significant drop to $24.75, shedding over 3% in response to a strengthening US Dollar.
- Technical analysis reveals a bearish engulfing pattern, despite a recent 'golden cross', signaling mixed signals for traders.
- The RSI indicates diminishing buying pressure, hinting at a potential bearish swing.
Silver's price plunged on Thursday amidst a risk-off impulse, reinvigorating the US Dollar. Consequently, the grey metal dropped more than $0.70, or 3.15%, as the XAG/USD traded at $24.75 after hitting a daily high of $25.77.
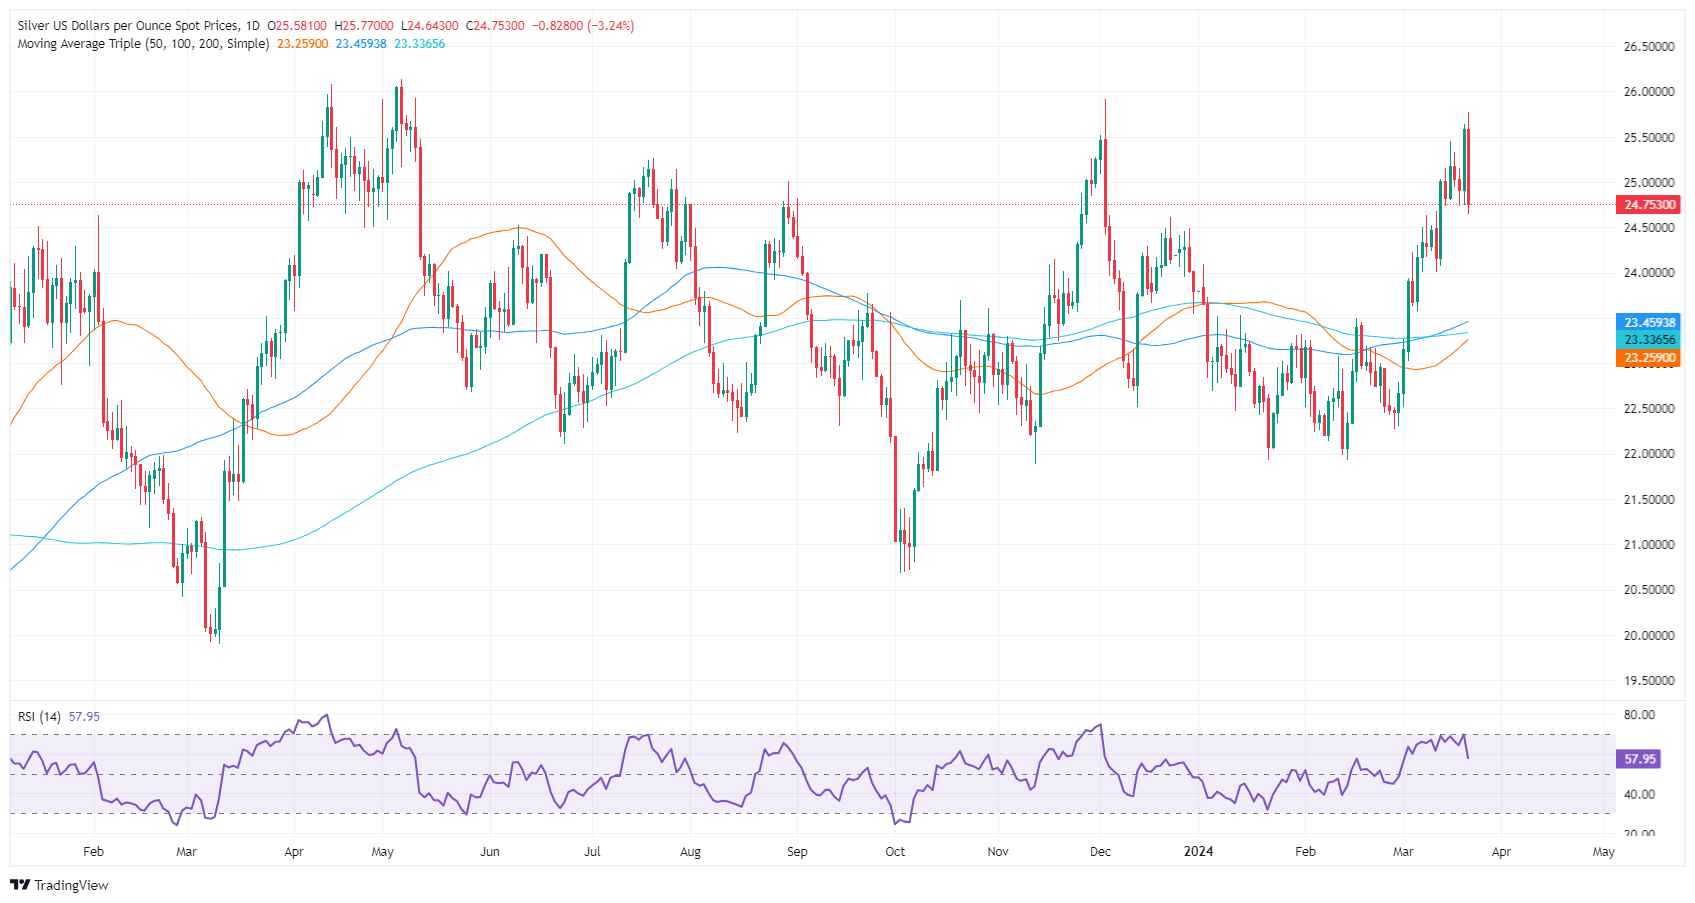
XAG/USD Price Analysis: Technical outlook
Silver is witnessing a downturn, as price action has formed a ‘bearish engulfing’ chart pattern in the last couple of days. Even though the 50-day moving average (DMA) has crossed above the 200-DMA, forming a classic ‘golden cross’ indicating that bulls are gathering steam, momentum suggests the opposite.
The Relative Strength Index (RSI) is hovering just below 60 after peaking around 70, indicating that moderate buying pressure remains. However, the RSI's descent from higher levels suggests that momentum might wane, and bears could gain ground.
The recent pullback has seen the price retreat from resistance near the $26.00 mark. Immediate support is found near December’s 22 high turned support at $24.60, followed by the $24.00 level. A breach of the latter could open a path towards the $23.00 area, marked by the previous cycle lows.
On the other hand, an XAG/USD daily close above $25.00 could pave the way for challenging yearly highs at $25.77, followed by last year’s high at $25.91.
XAG/USD Price Action – Daily Chart
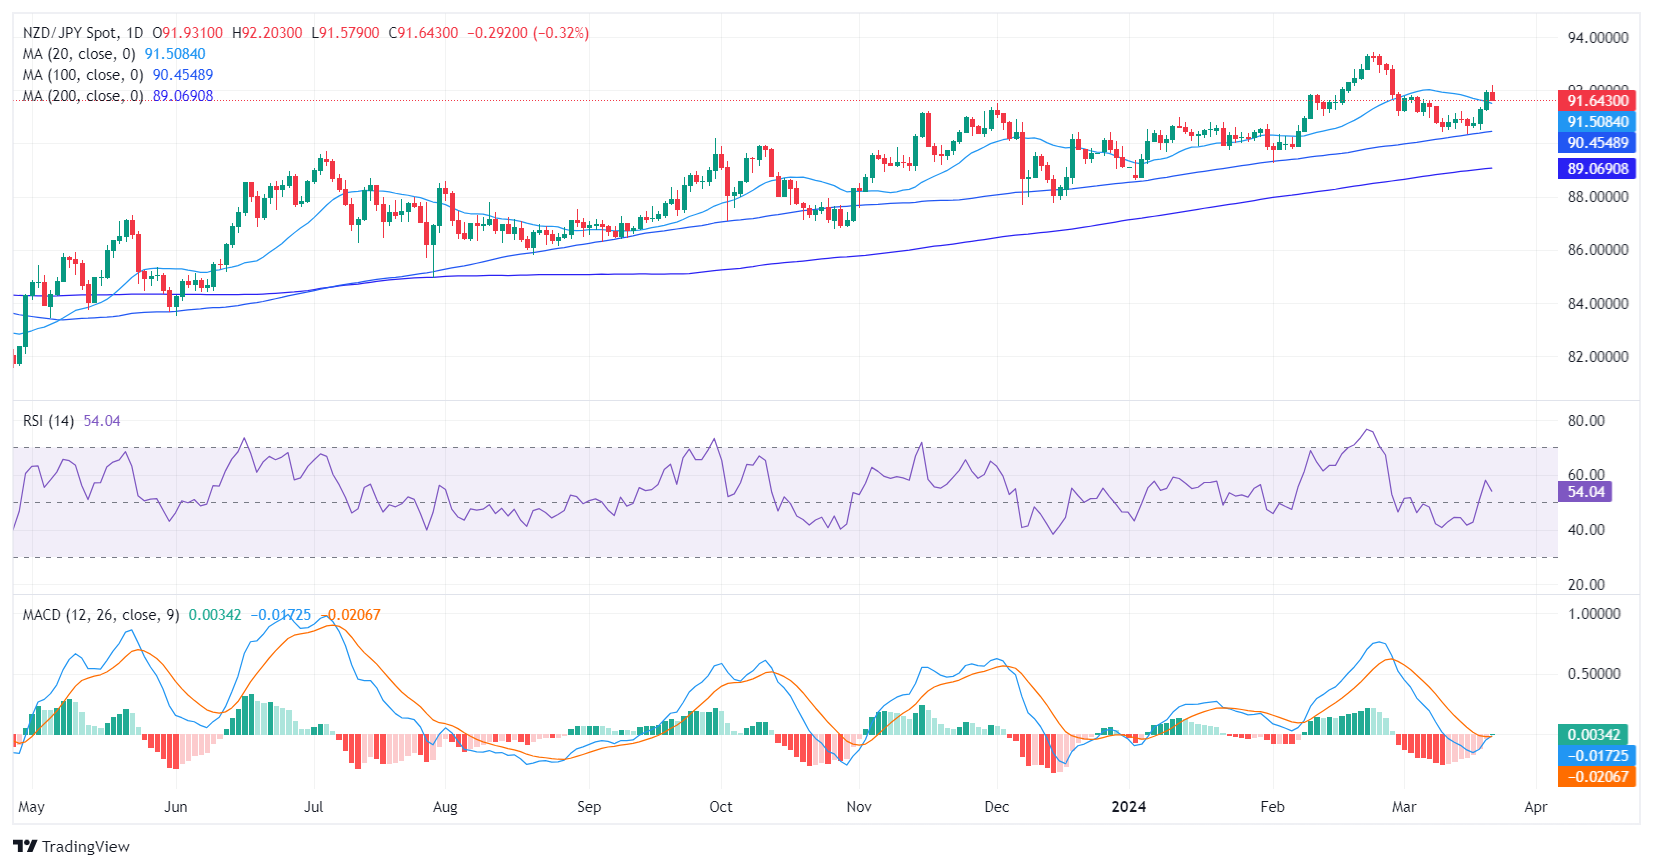
- On the daily chart, indicators are consolidating but the outlook is favoring the bulls.
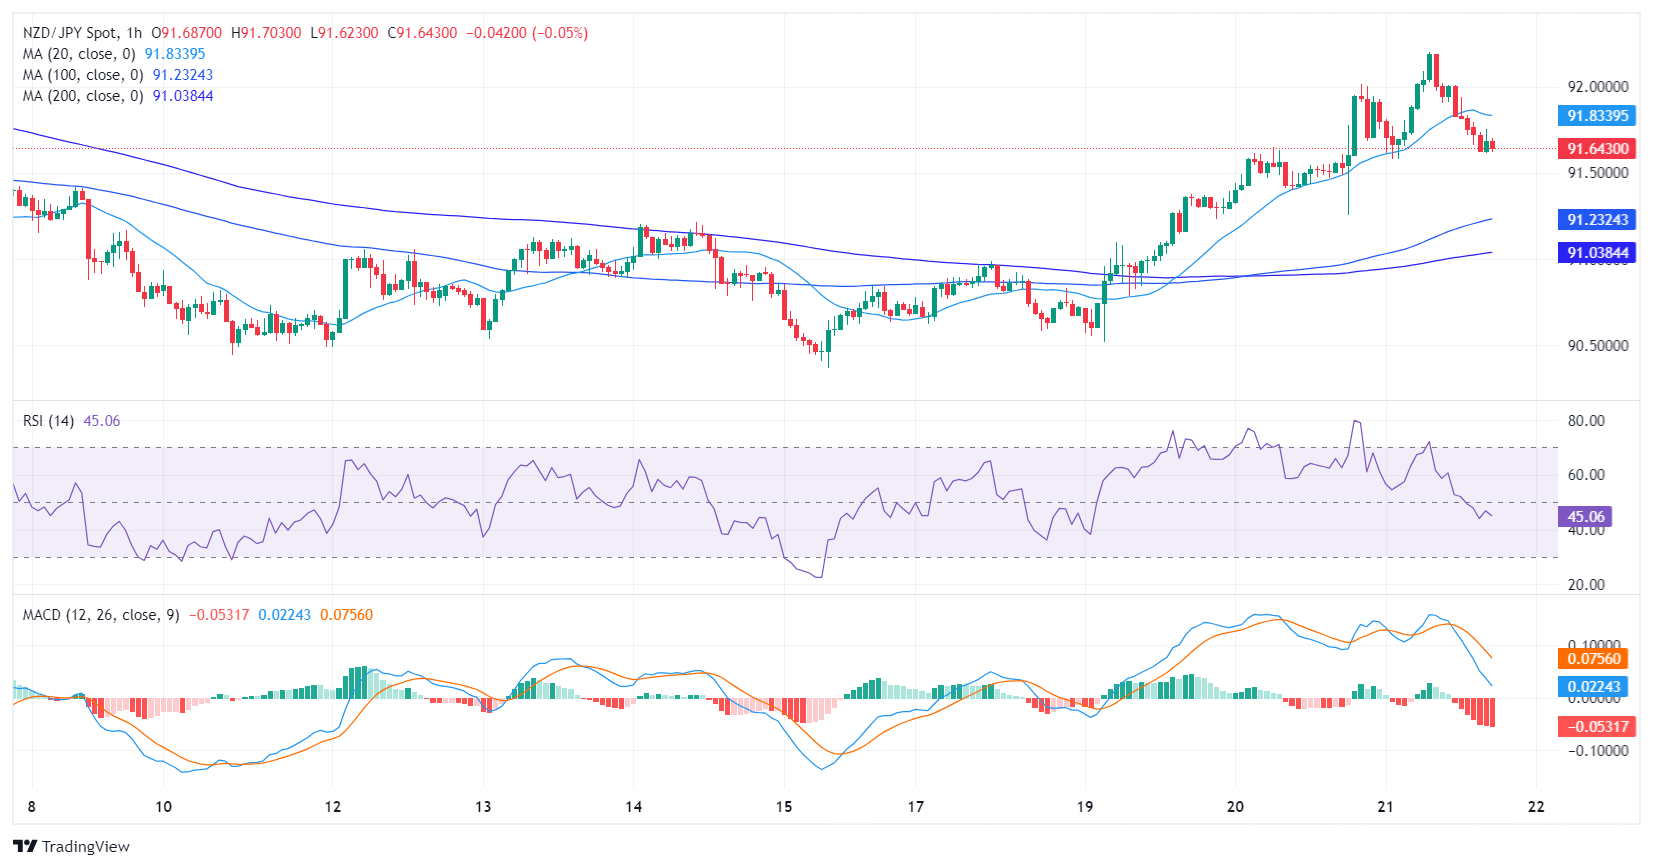
- The hourly chart gives hints of mounting selling traction with indicators deep in the red.
The NZD/JPY pair is currently trading at 91.60, slightly down in Thursday's session. Bulls hold a strong command over the market, even amidst transient selling pressure, which seems not to have weakened their movement with the pair holding above the 20,100 and 200-day Simple Moving Averages (SMAs).
On the daily chart, the NZD/JPY pair reveals an influx of buyers dominating the market, as indicated by the Relative Strength Index (RSI) progressing towards positive territory. The latest reading at 55, sits in the positive zone, but points down, as indicators consolidate. Meanwhile, the Moving Average Convergence Divergence (MACD) reveals a declining trend with red bars, indicating steady but weakening negative momentum.
NZD/JPY daily chart
The hourly landscape provides a more detailed perspective. The RSI has been fluctuating around the negative territory in the recent hours, dropping to 45 by the last hour. It suggests an increase in selling pressure in the short term compared to the daily setup. The continuous red bars of the MACD affirm this, reflecting the negative momentum represented in the RSI. This implies that the sellers step in as the buyers seem to be taking profits.
NZD/JPY hourly chart
Overall, while bulls are in command of the broad trend, the pair could see some additional selling pressure, as selling momentum is present and buyers might continue taking profits from the last two days' gains.
The risk-off trade returned to the markets on Thursday and lent extra oxygen to the Greenback, as investors continued to adjust to the latest FOMC event and the idea of three rate cuts by the Fed this year. Other than that, the BoE kept rates unchanged and signaled that rate cuts could be down the road.
Here is what you need to know on Friday, March 22:
The USD Index (DXY) traded with robust gains and resumed its uptrend following Wednesday’s post-FOMC decline. There will be no scheduled events on the US docket at the end of the week other than the speeches by FOMC M. Barr and R. Bostic.
EUR/USD succumbed to the Dollar’s advance and retreated to the 1.0850 area, rapidly fading the sharp advance recorded in the previous session. On March 22, Germany will release its IFO Business Climate.
GBP/USD could not sustain a move to levels just beyond 1.2800 the figure and collapsed to the mid-1.2600s following the stronger dollar and the dovish tilt by the BoE. On March 22, Retail Sales will take centre stage across the Channel along with the Gfk Consumer Confidence print.
USD/JPY extended its rally and flirted once again with the YTD tops near 151.80 as market participants continued to sell the yen following the BoJ meeting. On March 22, the domestic calendar includes the Inflation Rate and the weekly readings from Foreign Bond Investment.
A firm labour market report did not prevent AUD/USD from giving away its initial gains, eventually ending the session with modest losses. The RBA’s Consumer Inflation Expectations will be in the limelight on March 21.
Prices of WTI added to Wednesday’s retracement and approached the key $80.00 mark per barrel, losing around $3 since recent peaks north of the $83.00 yardstick.
Prices of gold rose to an all-time high past the $2,220 level per troy ounce, although they ended the session with humble losses amidst the recovery in the Greenback. Silver followed suit and dropped markedly after hitting fresh highs near $25.80 per ounce.
- GBP/USD falls to 1.2659 after BoE's dovish stance.
- BoE holds Bank Rate, hints at future cuts amid shifting views.
- UK inflation drop fuels June BoE rate cut bets.
- US Dollar bolstered by lower unemployment claims and economic strength.
The Pound Sterling tumbles sharply against the US Dollar and prints a new two-week low following major central banks' monetary policy decisions. On Thursday, it was the Bank of England’s (boE) turn to deliver a dovish hold, spurring a U-turn in price action. At the time of writing, the GBP/USD trades at 1.2659, down 0.97%.
Sterling erases Wednesday’s gains on BoE’s dovish pivot
The BoE kept the Bank Rate at 5.25%, with a split vote of 8-1, with no officials expecting a rate hike, and one dissenter that voted for a rate cut. At the previous meeting, policymakers voted 6-3, with two members expecting a rate hike. Given the stance adjustment amongst policymakers, there’s growing consensus on the BoE that the current level of rates is tempering inflationary pressures.
The latest inflation reports in the UK witnessed inflation dipping from 4% to 3.4%. Following the BoE’s decision, money markets are pricing a 75% chance of a rate cut in June, up from 65% earlier in the day.
The Greenback recovered some lost ground following Wednesday's Federal Open Market Committee (FOMC) policy decision. The FOMC kept rates unchanged and didn’t revise its rate cut expectations for 2024 despite printing back-to-back high inflation reports in the US. Regarding those reports, Federal Reserve (Fed) Chair Jerome Powell stated the road to lowering inflation to the Fed’s 2% goal would be bumpy.
The US economic docket revealed that unemployment claims for the last week dipped from 212K to 210K, lower than the 215K estimated. Other data witnessed S&P Global Flash PMI final readings for March mixed, though manufacturing activity improved. Elsewhere, Existing Home Sales jumped from 4 million to 4.38 million, an increase of 9.5%.
GBP/USD Price Analysis: Technical outlook
Given the fundamental outlook, the GBP/USD extended its losses and formed a large ‘bearish engulfing’ candle pattern, increasing the odds for further downside. The Relative Strength Index (RSI) dives further into bearish territory, while the 200-day moving average at 1.2592 is up for grabs. If sellers clear the psychological 1.2600 mark, followed by the 200-DMA, that could pave the way to test 1.2500. On the other hand, if buyers reclaim 1.2700, look for some consolidation.
- Dow Jones clips into its second all-time high in two days.
- US equities broadly higher in the back half of the trading week.
- DJIA climbs 0.8% on Thursday as traders extend Fed bid.
The Dow Jones Industrial Average (DJIA) tore into its second all-time high this week, climbing eight-tenths of a percent and tapping a fresh record peak of 39,889.05 as US equities broadly gain ground. Investor confidence is peaking after the Federal Reserve (Fed) held steady on interest rates at the March Federal Open Market Committee (FOMC) rate call on Wednesday. Still, Fed Chairman Jerome Powell nodded at the likelihood of rate cuts to come, sending broad-market risk appetite into the ceiling.
Of the 11 sectors that make up the US equities markets, all but one are in the green on Thursday, led by the Industrials and Financials Sectors, which are up around a percent. On the low side, Communications Services shed further weight, backsliding a third of a percent as investors pare back bets on telecoms.
Dow Jones news
The Dow Jones climbed around 300 points on Thursday as the index bears down on the 40,000.00 major price handle as the equity index trades above 39,800.00. Of the 30 securities listed on the DJIA, only six are in the red on the day, led by Apple Inc. (AAPL), which shed over 4% to trade into $171.00 per share after the US Department of Justice announced it was suing the company on the accusation that Apple’s iPhone ecosystem constitutes a monopoly. The Department of Justice accused Apple of anti-competitive practices in multiple areas of the megacompany’s mobile phone business. The AAPL ticker is down nearly 8% from recent all-time highs at $198.11 set last December.
Goldman Sachs Group Inc. (GS) is leading the charge up the Dow Jones market board on Thursday, climbing 4.25% on the day to trade above $413.00 per share. GS is followed by Home Depot Inc. (HD), which climbed over 2.5% to test $394.40. Caterpillar Inc. (CAT) is up a little over 2% ahead of the day’s market close, testing $364.00 per share.
Dow Jones Industrial Average technical outlook
The Dow Jones kicked off Thursday’s US trading session with a topside gap as investors scrambled to bid up US equities, rallying into a fresh all-time record peak at 39,889.05 before settling into sideways trading between 39,840.00 and 39,820.00. The day’s low was set early in the trading session at 39,589.23.
Sellers looking to close Thursday’s opening bullish gap will need to drag the index below 39,520.00, which would open the Dow Jones up for a further decline into the last swing low into the 38,600.00 region.
Dow Jones Industrial Average 5-minute chart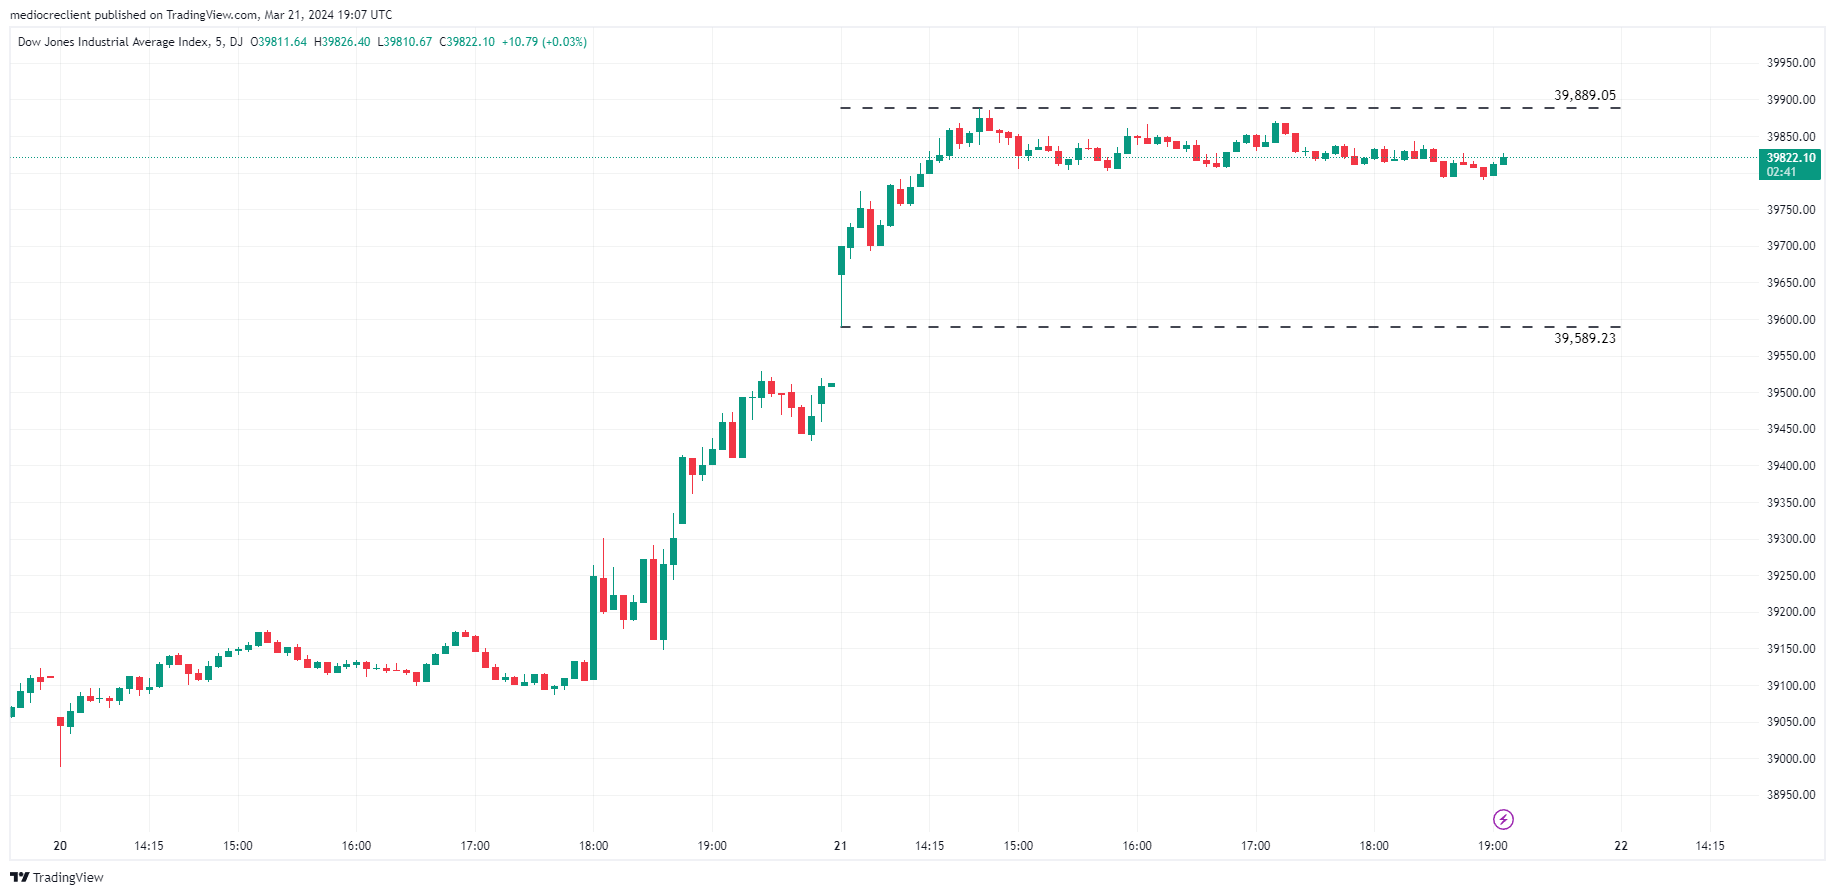
Dow Jones FAQs
The Dow Jones Industrial Average, one of the oldest stock market indices in the world, is compiled of the 30 most traded stocks in the US. The index is price-weighted rather than weighted by capitalization. It is calculated by summing the prices of the constituent stocks and dividing them by a factor, currently 0.152. The index was founded by Charles Dow, who also founded the Wall Street Journal. In later years it has been criticized for not being broadly representative enough because it only tracks 30 conglomerates, unlike broader indices such as the S&P 500.
Many different factors drive the Dow Jones Industrial Average (DJIA). The aggregate performance of the component companies revealed in quarterly company earnings reports is the main one. US and global macroeconomic data also contributes as it impacts on investor sentiment. The level of interest rates, set by the Federal Reserve (Fed), also influences the DJIA as it affects the cost of credit, on which many corporations are heavily reliant. Therefore, inflation can be a major driver as well as other metrics which impact the Fed decisions.
Dow Theory is a method for identifying the primary trend of the stock market developed by Charles Dow. A key step is to compare the direction of the Dow Jones Industrial Average (DJIA) and the Dow Jones Transportation Average (DJTA) and only follow trends where both are moving in the same direction. Volume is a confirmatory criteria. The theory uses elements of peak and trough analysis. Dow’s theory posits three trend phases: accumulation, when smart money starts buying or selling; public participation, when the wider public joins in; and distribution, when the smart money exits.
There are a number of ways to trade the DJIA. One is to use ETFs which allow investors to trade the DJIA as a single security, rather than having to buy shares in all 30 constituent companies. A leading example is the SPDR Dow Jones Industrial Average ETF (DIA). DJIA futures contracts enable traders to speculate on the future value of the index and Options provide the right, but not the obligation, to buy or sell the index at a predetermined price in the future. Mutual funds enable investors to buy a share of a diversified portfolio of DJIA stocks thus providing exposure to the overall index.
- Gold prices retrace, experience pullback from recent highs as US Dollar strengthens.
- Risk-off sentiment, lower Gold demand follows Fed announcement on monetary policy.
- Fed cautious on economy, eyes on inflation, labor market.
- US 10-year Treasury yields, Dollar Index rise, both headwinds for Gold prices.
Gold prices (XAU/USD) fell from all-time highs of $2,223 and broke below the $2,200 figure on Thursday, clocking losses of 0.29% as the Greenback stages a comeback while US Treasury yields paired yesterday’s losses. A risk-off impulse and the lack of demand for the yellow metal above the $2,200 mark sponsored XAU/USD’s leg down toward the $2,179 mark.
Financial markets continued to digest the Federal Reserve’s (Fed) dovish hold following its March 21 meeting. Fed Chairman Jerome Powell and his colleagues acknowledged that the economy is robust, the labor market is gradually cooling, and inflation remains high despite decreasing from higher levels last seen in the 1980s.
Fed officials reiterated that they expect three rate cuts in 2024, though policy would stay put unless data suggests the disinflation process is evolving. In the meantime, the US 10-year Treasury yield benchmark note has pared its losses, while the US Dollar Index (DXY) posted gains of 0.58% at 103.98.
Daily digest market movers: Gold price dips as US yields recover
- Jerome Powell emphasized the Fed had made progress on tempering inflation, and despite printing two straight months of higher prices, that hasn’t changed the Fed’s outlook in regard to price stability.
- Fed policymakers kept the Dot Plot unchanged for 2024. Still, the 2025 Dot Plot was revised up from 3.6% to 3.9%.
- For 2024, the Federal Open Market Committee (FOMC) forecasts that the economy will grow 2.1%, up from 1.4%, while the Unemployment Rate will remain at 4%.
- Inflation figures in the United States as measured by the Fed’s favorite gauge for inflation, the Personal Consumption Expenditures (PCE), weren’t changed. They were expected to be at 2.4%, while core PCE is projected to end at 2.6%, up from 2.4%.
- The US economic schedule revealed that Initial Jobless Claims for the week ending March 16 rose by 210K, below estimates of 215K and the prior week’s figures.
- S&P Global PMI figures for the United States were mixed with Services and Composite PMI readings cooling but remaining in expansionary territory. The S&P Global Manufacturing PMI was the outlier, exceeding estimates of 51.7 and the previous reading of 52.2 by jumping to 52.5.
- Existing Home Sales rose by 9.5% from 4 million to 4.38 million.
- According to the CME FedWatch Tool, expectations for a June rate cut stand at 74%, down from 59% at the beginning of the week.
Technical analysis: Gold traders' failure at $2,200 exposed the $2,180 mark
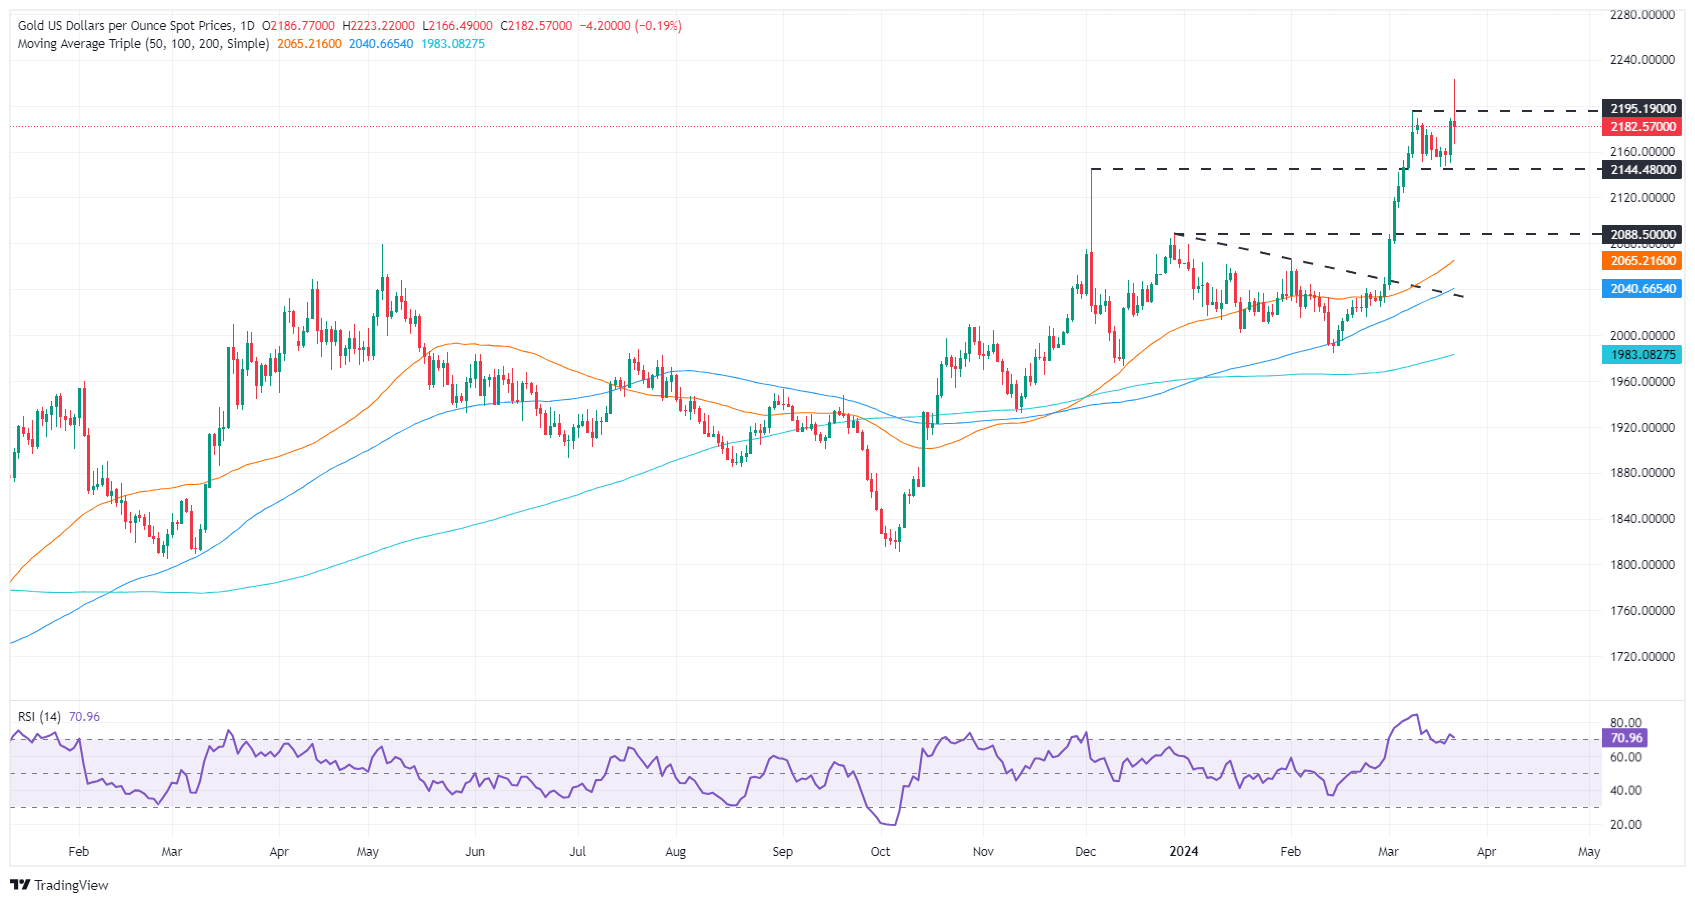
The XAU/USD price has fallen below the $2,200 mark and sits below the previous all-time high of $2,195 as sellers moved in. However, to further extend the yellow metal losses, they must drag prices toward the December 4 high, which turned support at $2,146, before challenging the $2,100 figure.
On the flip side, if buyers push prices toward $2,200, that will expose the current all-time high at $2,223 before aiming toward $2,250.
Gold FAQs
Gold has played a key role in human’s history as it has been widely used as a store of value and medium of exchange. Currently, apart from its shine and usage for jewelry, the precious metal is widely seen as a safe-haven asset, meaning that it is considered a good investment during turbulent times. Gold is also widely seen as a hedge against inflation and against depreciating currencies as it doesn’t rely on any specific issuer or government.
Central banks are the biggest Gold holders. In their aim to support their currencies in turbulent times, central banks tend to diversify their reserves and buy Gold to improve the perceived strength of the economy and the currency. High Gold reserves can be a source of trust for a country’s solvency. Central banks added 1,136 tonnes of Gold worth around $70 billion to their reserves in 2022, according to data from the World Gold Council. This is the highest yearly purchase since records began. Central banks from emerging economies such as China, India and Turkey are quickly increasing their Gold reserves.
Gold has an inverse correlation with the US Dollar and US Treasuries, which are both major reserve and safe-haven assets. When the Dollar depreciates, Gold tends to rise, enabling investors and central banks to diversify their assets in turbulent times. Gold is also inversely correlated with risk assets. A rally in the stock market tends to weaken Gold price, while sell-offs in riskier markets tend to favor the precious metal.
The price can move due to a wide range of factors. Geopolitical instability or fears of a deep recession can quickly make Gold price escalate due to its safe-haven status. As a yield-less asset, Gold tends to rise with lower interest rates, while higher cost of money usually weighs down on the yellow metal. Still, most moves depend on how the US Dollar (USD) behaves as the asset is priced in dollars (XAU/USD). A strong Dollar tends to keep the price of Gold controlled, whereas a weaker Dollar is likely to push Gold prices up.
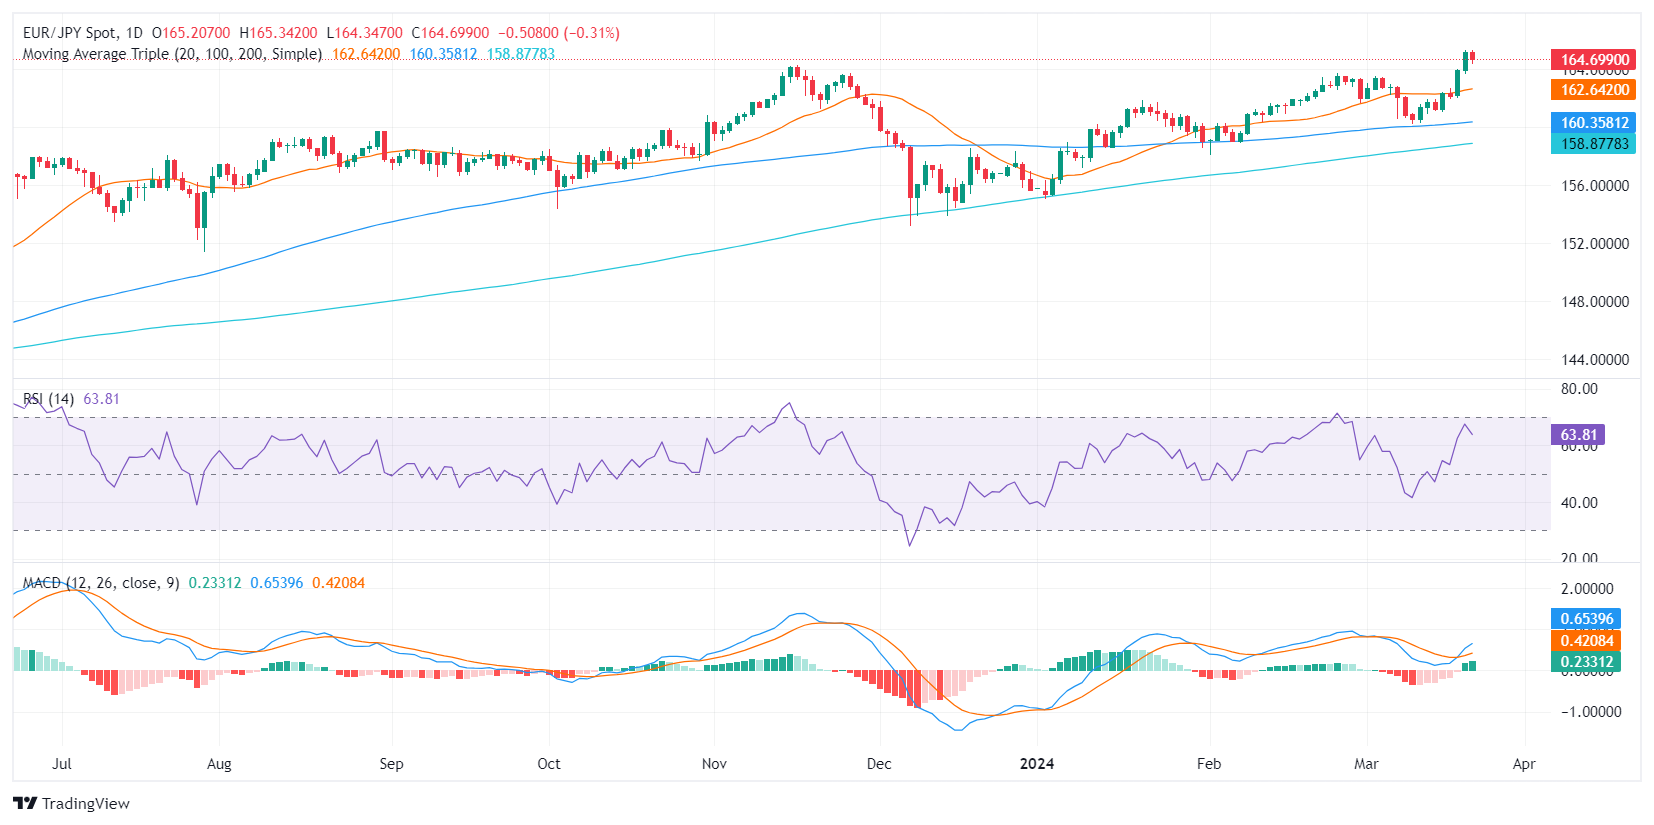
- The daily RSI was rejected near the overbought region.
- Hourly chart indicators show a shift in short-term dynamics, with sellers gaining ground.
- Despite the signs of potential short-term bearish correction, the pair still holds above key SMAs, denoting an overall bullish trend.
The EUR/JPY pair shows slight losses of 0.26% during Thursday's session. Despite sporadic fluctuations, there is a largely upward trend, indicating a strong position for buyers. Yet, recent subtle signs of selling pressure hint at a potential challenge to the continuity of the bullish trend for the next sessions.
On the daily chart, the Relative Strength Index (RSI) shows an overall positive trend. However, imminent overbought conditions suggest a possible downward retracement could soon emerge as buyers may continue taking profits. In addition, the Moving Average Convergence Divergence (MACD) continues to print green bars, suggesting a steady buying momentum
EUR/JPY daily chart
When examining the hourly chart, the RSI reveals some variability, with the latest reading at 47. This value is notably lower than the daily readings, suggesting that sellers might be gaining some ground in the short term. In addition, the MACD prints red bards which adds arguments to the growing selling pressure on the shorter timeframes.
EUR/JPY hourly chart
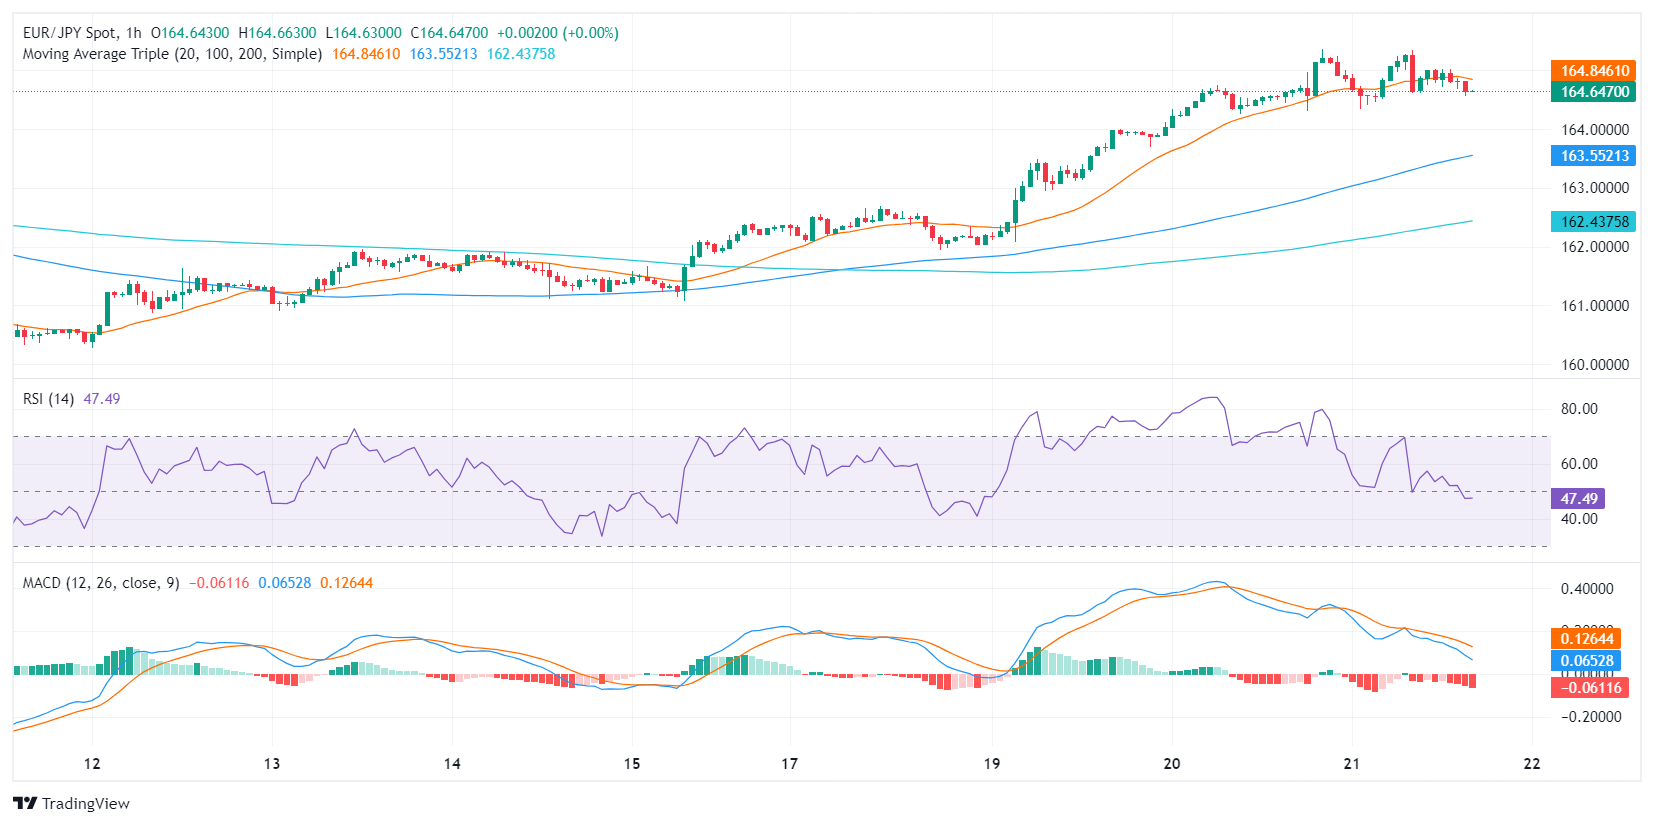
When analyzing with Simple Moving Averages (SMAs), the broader scale indicates that, despite a negative outlook in the short term, the pair maintains its position above the 20, 100, 200-day Simple Moving Averages, suggesting that, on a wider scope, the buyers are still firmly in control. However, if the technical correction extends below any of these levels the trend might slowly shift in favor of the seller.
- Canadian Dollar rises, but USD rises faster.
- Canada brings Retail Sales data to fore on Friday.
- US PMIs came in mixed on Thursday.
The Canadian Dollar (CAD) is broadly higher on Thursday, climbing against most of its major currency peers, but the US Dollar (USD) is getting bid higher, faster. Investors are paring back Greenback selling after a Fed-fueled midweek splurge, bolstering the US Dollar across the board.
Canada will return to the economic calendar with meaningful data on Friday. Retail Sales figures for January are expected to decline around half a percent after rising nearly a full percent in December.
Daily digest market movers: US Dollar dominates on US data flows
- US S&P Global Purchasing Managers Index (PMI) figures printed a split on Thursday.
- March’s US Manufacturing PMI rose to 52.5 from the previous 52.2, easily vaulting over the forecasted decline to 51.7.
- The Services PMI for March fell more than expected, declining to 51.7 from the previous month’s 52.3, falling more than the forecast 52.0.
- US Initial Jobless Claims slipped to 210K for the week ended March 15, missing the forecasted increase to 215K from the previous week’s 212K (revised upward from 209K).
- Analysts from Scotiabank have noted that the month of April tends to be the Canadian Dollar’s best-performing month against the Greenback.
- Scotiabank: April is the CAD’s best month of the calendar year against the USD.
Canadian Dollar price today
The table below shows the percentage change of Canadian Dollar (CAD) against listed major currencies today. Canadian Dollar was the weakest against the US Dollar.
| USD | EUR | GBP | CAD | AUD | JPY | NZD | CHF | |
| USD | 0.71% | 1.03% | 0.45% | 0.39% | 0.61% | 0.71% | 1.50% | |
| EUR | -0.72% | 0.32% | -0.26% | -0.33% | -0.12% | 0.01% | 0.79% | |
| GBP | -1.05% | -0.33% | -0.59% | -0.63% | -0.45% | -0.32% | 0.46% | |
| CAD | -0.47% | 0.26% | 0.59% | -0.05% | 0.13% | 0.26% | 1.04% | |
| AUD | -0.40% | 0.32% | 0.64% | 0.06% | 0.19% | 0.33% | 1.10% | |
| JPY | -0.58% | 0.13% | 0.45% | -0.16% | -0.19% | 0.14% | 0.91% | |
| NZD | -0.71% | 0.00% | 0.32% | -0.26% | -0.33% | -0.10% | 0.80% | |
| CHF | -1.51% | -0.79% | -0.47% | -1.06% | -1.12% | -0.90% | -0.80% |
The heat map shows percentage changes of major currencies against each other. The base currency is picked from the left column, while the quote currency is picked from the top row. For example, if you pick the Euro from the left column and move along the horizontal line to the Japanese Yen, the percentage change displayed in the box will represent EUR (base)/JPY (quote).
Technical analysis: US Dollar rebounds, bullish CAD gets outperformed
The Canadian Dollar (CAD) is broadly higher on Thursday, gaining ground against nearly all of its major currency peers despite falling around four-tenths of a percent against the US Dollar. The CAD is struggling to hold flat against the day’s other over-performing currency, the Australian Dollar (AUD).
The USD/CAD is on the rise in Thursday trading, cutting in approximately 0.6% in bullish momentum bottom-to-top. The pair caught a bounce from the 1.3460 region, reclaiming the familiar 1.3500 handle in intraday trading.
Thursday’s recovery etches in a technical rejection from the 200-day Simple Moving Average (SMA) at 1.3485. A rangebound USD/CAD pattern looks set to continue in the near term.
USD/CAD hourly chart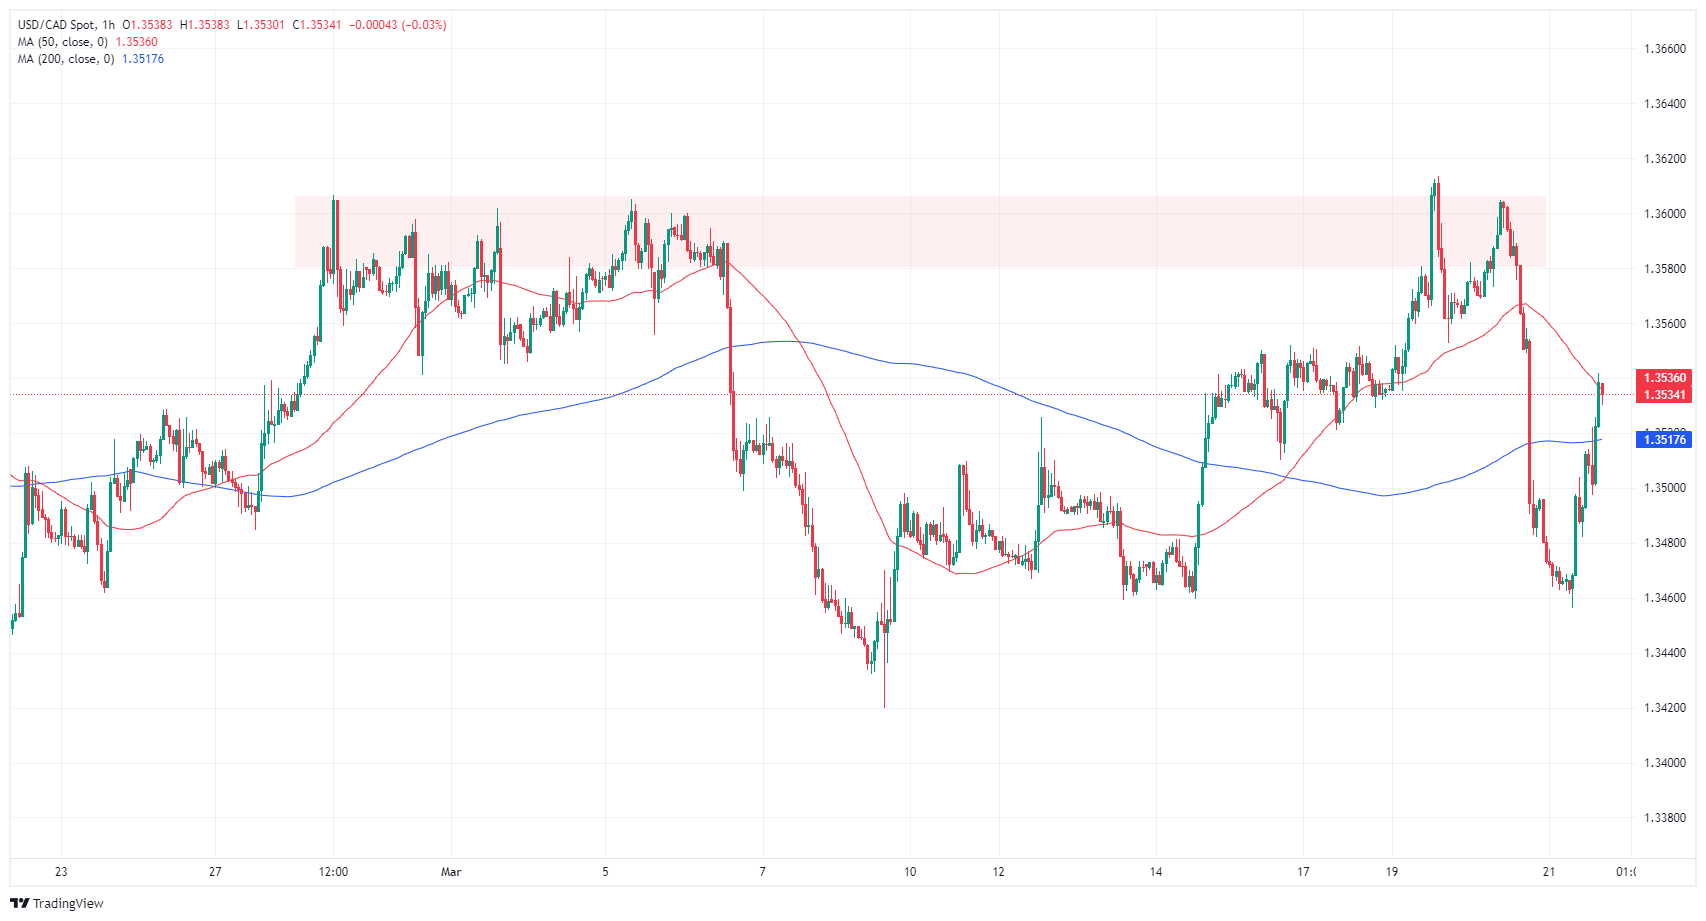
USD/CAD daily chart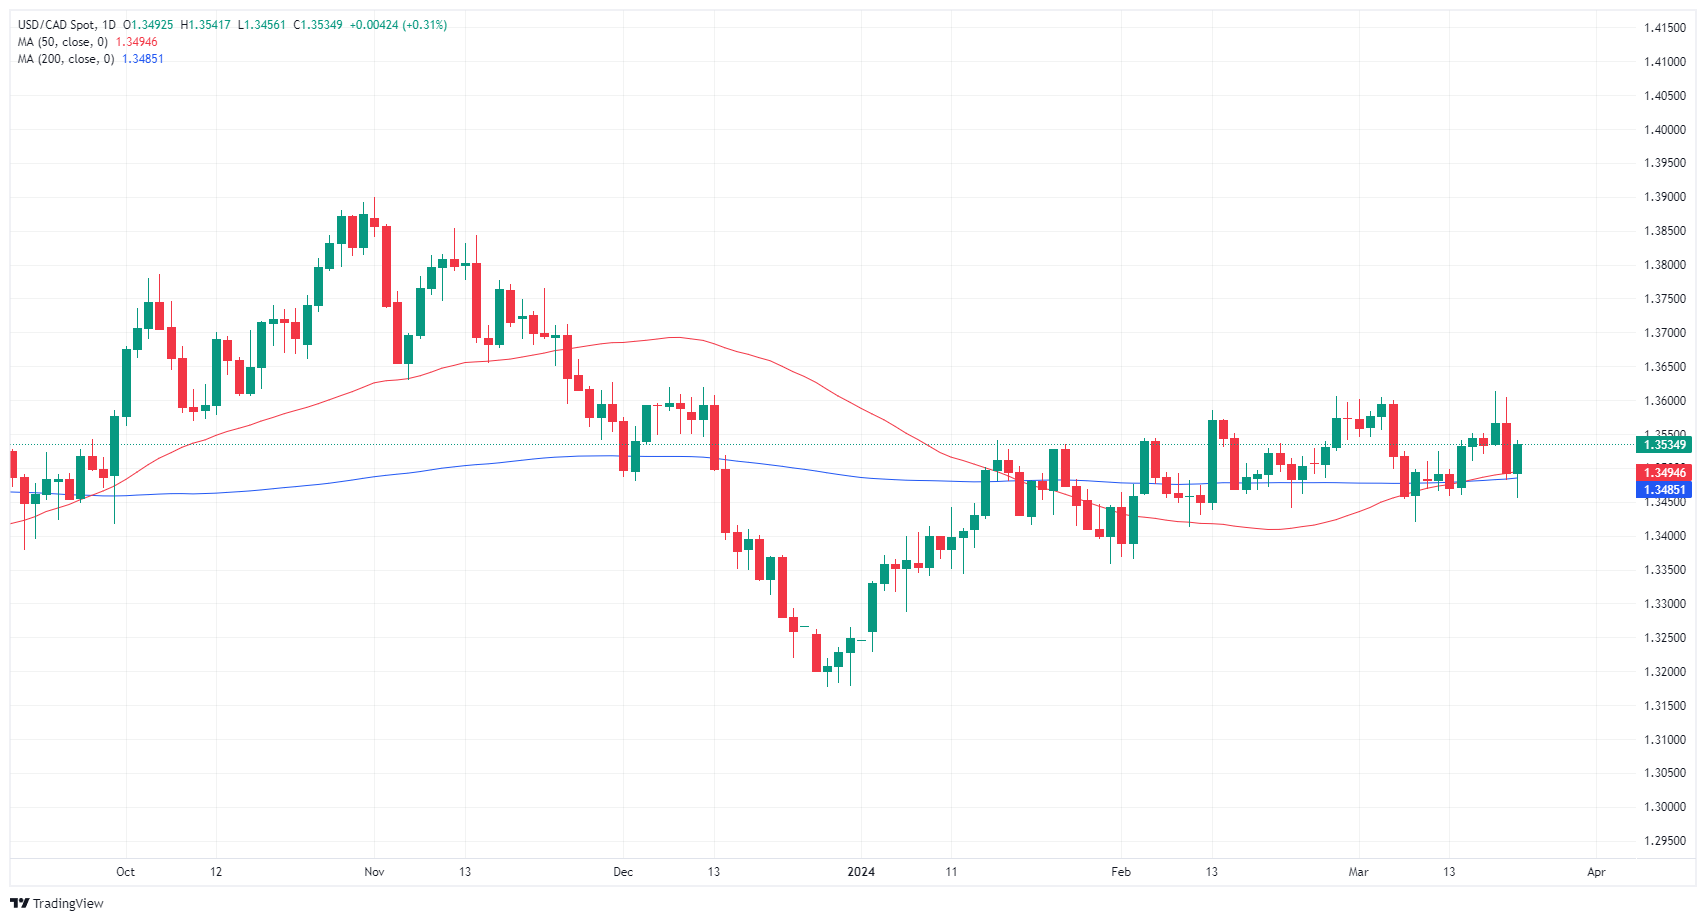
Canadian Dollar FAQs
The key factors driving the Canadian Dollar (CAD) are the level of interest rates set by the Bank of Canada (BoC), the price of Oil, Canada’s largest export, the health of its economy, inflation and the Trade Balance, which is the difference between the value of Canada’s exports versus its imports. Other factors include market sentiment – whether investors are taking on more risky assets (risk-on) or seeking safe-havens (risk-off) – with risk-on being CAD-positive. As its largest trading partner, the health of the US economy is also a key factor influencing the Canadian Dollar.
The Bank of Canada (BoC) has a significant influence on the Canadian Dollar by setting the level of interest rates that banks can lend to one another. This influences the level of interest rates for everyone. The main goal of the BoC is to maintain inflation at 1-3% by adjusting interest rates up or down. Relatively higher interest rates tend to be positive for the CAD. The Bank of Canada can also use quantitative easing and tightening to influence credit conditions, with the former CAD-negative and the latter CAD-positive.
The price of Oil is a key factor impacting the value of the Canadian Dollar. Petroleum is Canada’s biggest export, so Oil price tends to have an immediate impact on the CAD value. Generally, if Oil price rises CAD also goes up, as aggregate demand for the currency increases. The opposite is the case if the price of Oil falls. Higher Oil prices also tend to result in a greater likelihood of a positive Trade Balance, which is also supportive of the CAD.
While inflation had always traditionally been thought of as a negative factor for a currency since it lowers the value of money, the opposite has actually been the case in modern times with the relaxation of cross-border capital controls. Higher inflation tends to lead central banks to put up interest rates which attracts more capital inflows from global investors seeking a lucrative place to keep their money. This increases demand for the local currency, which in Canada’s case is the Canadian Dollar.
Macroeconomic data releases gauge the health of the economy and can have an impact on the Canadian Dollar. Indicators such as GDP, Manufacturing and Services PMIs, employment, and consumer sentiment surveys can all influence the direction of the CAD. A strong economy is good for the Canadian Dollar. Not only does it attract more foreign investment but it may encourage the Bank of Canada to put up interest rates, leading to a stronger currency. If economic data is weak, however, the CAD is likely to fall.
- Mexican Peso weakens as investors eye Banxico policy decision on Thursday.
- Mexico’s retail sales data indicate cautious consumer spending, setting stage for Banxico's potential 25 bps rate cut.
- Banxico rate cut may shrink US-Mexico rate gap, possibly nudging USD/MXN near 17.00.
- Decision might not be unanimous as Deputy Governors Espinosa and Heath expressed concerns over persistent inflation.
The Mexican Peso begins the session on the defensive against the US Dollar as investors prepare for the Bank of Mexico (Banxico) monetary policy decision. Most analysts expect a 25-basis-point rate cut, which would lower reference rates to 11.00%. The USD/MXN pair exchanges hands at a 16.74 for a gain of 0.4%.
Mexico’s economic docket featured retail sales for February, which improved on a monthly basis, yet suggests consumers are spending less. In the 12 months to January, sales missed estimates and plunged sharply. Later at 19:00 GMT, the Banxico Governing Council led by Governor Victoria Rodriguez Ceja will likely cut rates for the first time since mid-2021.
The decision is expected to be split, as two Deputy Governors, Irene Espinosa and Jonathan Heath, expressed their disagreement with easing policy, adding that inflation remains high and stubbornly stickier than expected. Although February’s inflation cooled from 4.88% to 4.40% and core figures decreased from 4.76% to 4.64%, external factors could trigger a second wave of inflation.
In the meantime, traders continued to digest the latest monetary policy decision by the Federal Reserve, which held rates unchanged and kept their projections for three 25 bps rate cuts toward year end. Although revising the federal funds rate (FFR) level upward to 3.9%, the Fed’s decision was perceived as dovish.
Given the backdrop, if Banxico lowers rates, that would decrease the interest rate spread between the US and Mexico, bolstering the USD/MXN, which could hit 17.00 following the decision.
Daily digest market movers: Mexican Peso weakens as reduction of rate differentials looms
- Mexico’s Retail Sales fell -0.6% MoM in January, missing estimates of 0.4% expansion but better than December’s data. Yearly figures plummeted from -0.2% to -0.8%, smashing projections for a 1.2% expansion.
- Mexico’s economic data released in the week:
- Aggregate Demand rose by 0.3% QoQ in Q4, up from 0%. On an annual basis, it decelerated from 2.7% to 2.6%.
- Private Spending on a quarterly basis slowed from 1.2% to 0.9%. On a yearly basis, it improved from 4.3% to 5.1%.
- The slowdown in Mexico’s economy is one of the main reasons that Banxico is eyeing the first cut. Mexico’s central bank expects the economy to grow 2.8% YoY in 2024, down from 3%, but maintains its 1.5% prior call for 2025.
- The US economic schedule revealed that Initial Jobless Claims for the week ending March 16 rose by 210K, below estimates of 215K and the prior week’s figures.
- S&P Global PMI figures for the United States were mixed, with Services and Composite PMI readings cooling but remaining in expansionary territory. The S&P Global Manufacturing PMI was the outlier, exceeding estimates of 51.7 and the previous reading of 52.2 by jumping to 52.5.
- Existing Home Sales rose by 9.5% from 4 million to 4.38 million.
- The latest inflation figures in the United States prompted investors to price in a less dovish stance. Money market futures have adjusted their rate cut expectations to be more in line with the Fed's as they foresee theFFR at 4.71% toward the end of the year. Analysts estimate the Fed will not change its FFR level until June or later.
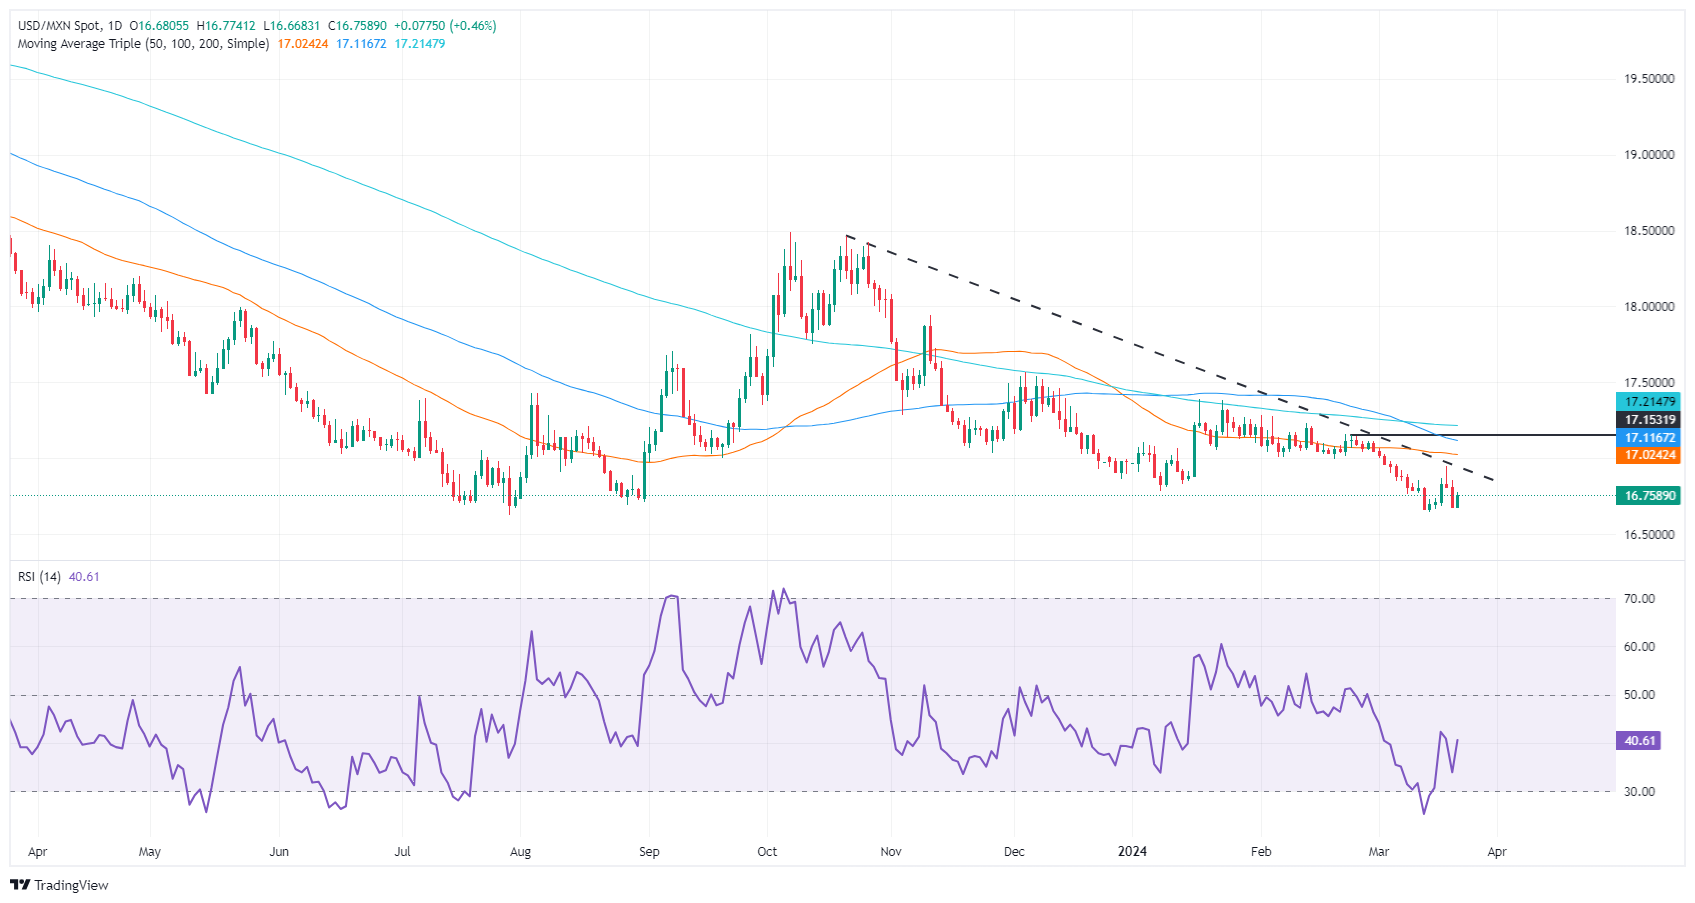
Technical analysis: Mexican Peso treads water as USD/MXN accelerates to 16.80
As mentioned on Wednesday, “the USD/MXN is neutral to downwardly biased after buyers lifted the exchange rate to a weekly high of 16.94 before retreating beneath 16.80.” However, with the Mexican Central Bank decision looming, a quarter percentage rate cut could lift the exotic pair and break key resistance levels.
The first resistance would be the March 19 cycle high at 16.94, followed by the psychological 17.00 figure. Up next would be a busy area of dynamic supply zones, led by the 50-day Simple Moving Average (SMA) at 17.01, the 100-day SMA at 17.12 and the 200-day SMA at 17.20.
On the other hand, sellers must drag the exchange rate below the current year-to-date low of 16.64 before challenging last year’s low of 16.62.
USD/MXN Price Action – Daily Chart
Mexican Peso FAQs
The Mexican Peso (MXN) is the most traded currency among its Latin American peers. Its value is broadly determined by the performance of the Mexican economy, the country’s central bank’s policy, the amount of foreign investment in the country and even the levels of remittances sent by Mexicans who live abroad, particularly in the United States. Geopolitical trends can also move MXN: for example, the process of nearshoring – or the decision by some firms to relocate manufacturing capacity and supply chains closer to their home countries – is also seen as a catalyst for the Mexican currency as the country is considered a key manufacturing hub in the American continent. Another catalyst for MXN is Oil prices as Mexico is a key exporter of the commodity.
The main objective of Mexico’s central bank, also known as Banxico, is to maintain inflation at low and stable levels (at or close to its target of 3%, the midpoint in a tolerance band of between 2% and 4%). To this end, the bank sets an appropriate level of interest rates. When inflation is too high, Banxico will attempt to tame it by raising interest rates, making it more expensive for households and businesses to borrow money, thus cooling demand and the overall economy. Higher interest rates are generally positive for the Mexican Peso (MXN) as they lead to higher yields, making the country a more attractive place for investors. On the contrary, lower interest rates tend to weaken MXN.
Macroeconomic data releases are key to assess the state of the economy and can have an impact on the Mexican Peso (MXN) valuation. A strong Mexican economy, based on high economic growth, low unemployment and high confidence is good for MXN. Not only does it attract more foreign investment but it may encourage the Bank of Mexico (Banxico) to increase interest rates, particularly if this strength comes together with elevated inflation. However, if economic data is weak, MXN is likely to depreciate.
As an emerging-market currency, the Mexican Peso (MXN) tends to strive during risk-on periods, or when investors perceive that broader market risks are low and thus are eager to engage with investments that carry a higher risk. Conversely, MXN tends to weaken at times of market turbulence or economic uncertainty as investors tend to sell higher-risk assets and flee to the more-stable safe havens.
- The DXY index bottomed at weekly lows and managed to trim Wednesday’s losses
- The Fed's stance seems slightly dovish, unmistakably resisting overreaction to two months of hot inflation.
- S&P PMIs came in mixed, Jobless Claims figures came in stronger than expected.
The US Dollar Index (DXY) is currently trading at 103.80, marking a 0.50% increase, almost trimming all of Wednesday’s losses. The Greenback gained ground after mixed S&P preliminary PMIs from March and strong weekly Jobless Claims.
The overriding consensus is a start to an easing cycle in June and the timing of the next cut will be dictated by incoming data. With recent hot inflation figures, the Fed revised its inflation projections higher. However, Jerome Powell confirmed there will be no overreaction from the bank. This consideration pushed the Fed's stance more dovish, implying a less aggressive approach toward rates. The Dot Plot showed that the median rate prediction by the end of this year remains at 4.6%.
Daily digest market movers: DXY is trending higher near 103.80, finding its footing after a post-FOMC sell-off
- S&P Global's initial Purchasing Managers Survey for March showed a slight decrease in the Services PMI, dropping from 52.3 to 51.7.
- Conversely, there was an increase in the Manufacturing PMI, rising from 52.2 to 52.5. The Composite PMI, which stood at 52.5 in February, showed a slight dip to 52.2.
- Initial Jobless Claims for the week ending March 15 came in at 210K, lower than the 215K expected.
- After the FOMC's decision, US Treasury bond yields are increasing with the 2-year yield trading at 4.59%, the 5-year at 4.25%, and the 10-year at 4.27%.
DXY technical analysis: DXY displays bullish momentum, trims Wednesday’s losses
The technical outlook for DXY reflects a recovering bullish momentum. This viewpoint is primarily driven by the rising slope and positive territory of the Relative Strength Index (RSI), which signals increasing buying pressure. In addition, the augmentation of green bars in the histogram of the Moving Average Convergence Divergence (MACD) signifies that buying momentum is mounting.
In addition, the index recovered above the convergence of the 20, 100, and 200-day Simple Moving Averages (SMAs), further reinforcing a resilient bullish traction. If the DXY manages to stay above the 103.50-70 area, the outlook will be bright for the DXY.
US Dollar FAQs
The US Dollar (USD) is the official currency of the United States of America, and the ‘de facto’ currency of a significant number of other countries where it is found in circulation alongside local notes. It is the most heavily traded currency in the world, accounting for over 88% of all global foreign exchange turnover, or an average of $6.6 trillion in transactions per day, according to data from 2022. Following the second world war, the USD took over from the British Pound as the world’s reserve currency. For most of its history, the US Dollar was backed by Gold, until the Bretton Woods Agreement in 1971 when the Gold Standard went away.
The most important single factor impacting on the value of the US Dollar is monetary policy, which is shaped by the Federal Reserve (Fed). The Fed has two mandates: to achieve price stability (control inflation) and foster full employment. Its primary tool to achieve these two goals is by adjusting interest rates. When prices are rising too quickly and inflation is above the Fed’s 2% target, the Fed will raise rates, which helps the USD value. When inflation falls below 2% or the Unemployment Rate is too high, the Fed may lower interest rates, which weighs on the Greenback.
In extreme situations, the Federal Reserve can also print more Dollars and enact quantitative easing (QE). QE is the process by which the Fed substantially increases the flow of credit in a stuck financial system. It is a non-standard policy measure used when credit has dried up because banks will not lend to each other (out of the fear of counterparty default). It is a last resort when simply lowering interest rates is unlikely to achieve the necessary result. It was the Fed’s weapon of choice to combat the credit crunch that occurred during the Great Financial Crisis in 2008. It involves the Fed printing more Dollars and using them to buy US government bonds predominantly from financial institutions. QE usually leads to a weaker US Dollar.
Quantitative tightening (QT) is the reverse process whereby the Federal Reserve stops buying bonds from financial institutions and does not reinvest the principal from the bonds it holds maturing in new purchases. It is usually positive for the US Dollar.
The US Federal Reserve is moving closer to cutting interest rates. A first move at the meeting in June is still likely if the next inflation data show progress, economists at Commerzbank say.
Fed wants to gain more certainty that inflation has really been beaten
While the Fed is moving towards lowering interest rates, it still needs more certainty that inflation will fall to 2% in the longer term. After the latest surprisingly high data, it is unlikely to have this confidence at its next meeting on May 1. The earliest date for a first rate cut is, therefore, the meeting in June, where we expect a move of 25 basis points as before. However, if the next inflation report is clearly disappointing again, the Fed could wait longer.
In any case, we only see relatively limited potential for rate cuts totalling 125 basis points which would bring the upper bound of the target range to 4.25% in spring 2025. The reason is that inflation is likely to remain above target in the longer term due to the tight labor market and structural factors that boost inflation such as the worsening demographics and increased protectionism.
Across the major currencies, the Canadian Dollar (CAD) appears to have one of the strongest seasonal reactions around this time of the year, economists at Scotiabank say.
USD typically strengthens in Q1 but loses ground through Q2 and Q3 before recovering
DXY patterns over the past 30-plus years suggest the USD typically strengthens in Q1 but loses ground through Q2 and Q3 before recovering, briefly and somewhat choppily, in Q4. That evolution is roughly reflected in the average rise and fall of US (10Y) bond yields over the course of the calendar year coincidentally.
April is the CAD’s best month of the calendar year against the USD and its firmer tone typically extends through May and June. The CAD averages a return of just over 1% in the April month against the USD and has strengthened 68% of the time since the 1990s.
CAD-supportive trends are reflected across asset classes. April is one of the strongest months of the year for the S&P 500, with an average return of just under 2%. April also typically heralds the start of a three-month jump in crude oil prices (with combined monthly gains through April-June over 10%).
Gains in stocks and commodities would provide the CAD with some support in the next few weeks and may help slow losses against a generally strong USD. But a significant improvement in the CAD undertone would likely require a USD-negative catalyst that is a bit harder to envisage right now.
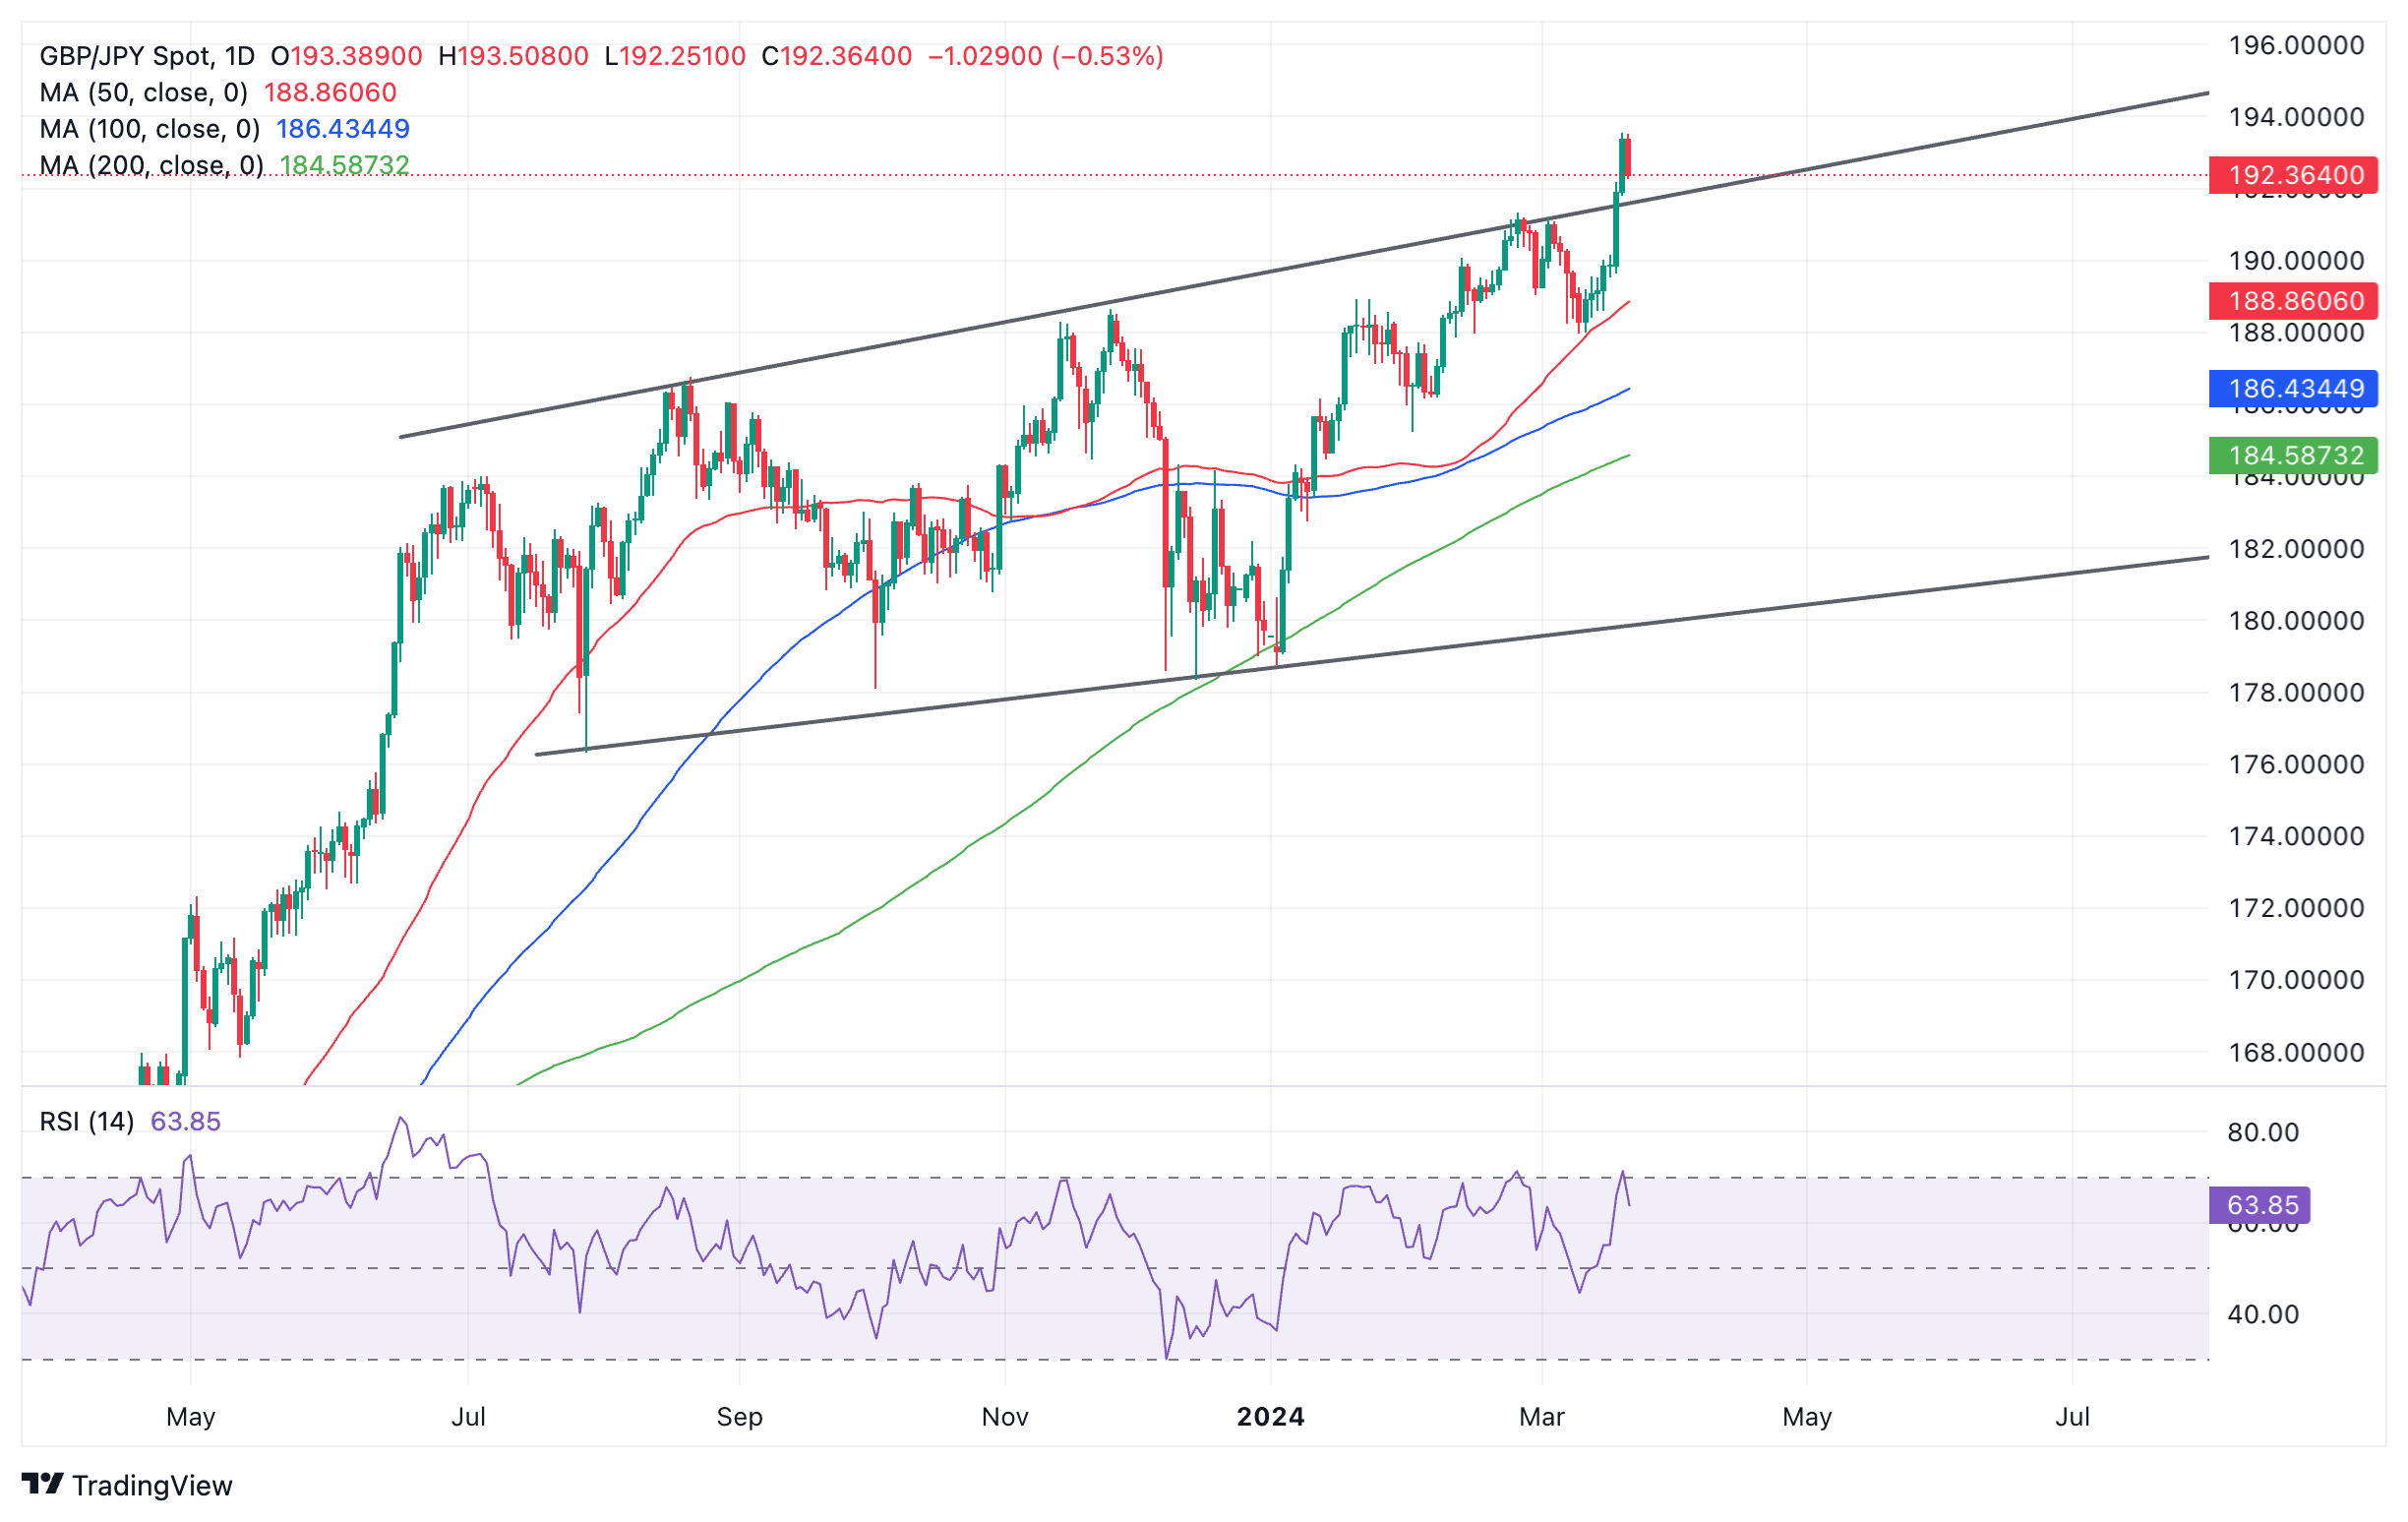
- GBP/JPY pulls back from extremes after the recent bout of Yen weakness.
- The Pound Sterling weakens after the BoE distribution of voting shows no-one voted for a hike.
- Japanese PMI data shows steady progress higher, UK data is mixed.
GBP/JPY is down over half a percent on Thursday, trading in the 192.000s, after a combination of the results of the Bank of England (BoE) policy meeting and weaker-than-expected UK PMI data, weighed on the Pound Sterling (GBP).
An improvement in Japanese data, meanwhile, may have helped staunch the recent hemorrhaging experienced by the Yen (JPY). The Jibun Bank Manufacturing Purchasing Manager Indices (PMI) showed upticks in both Manufacturing and Services sectors in March.
From a technical perspective, GBP/JPY looks overstretched after breaking out of the top of a Rising Wedge pattern on overbought momentum, according to the Relative Strength Index (RSI). A negative close on Thursday could signal an exit from overbought RSI, providing traders with a sell signal.
Pound Sterling to Japanese Yen: Daily chart
BoE voting distribution shows dovish shift
The Bank of England left interest rates unchanged at 5.25% at its meeting on Thursday, as was widely expected. The distribution of votes, however, changed from the previous meeting with zero officials voting for a hike instead of the one before. The majority of eight board members voted for no-change – one more than the seven of the previous meeting – and only one voted for a cut in interest rates, as before.
The Pound Sterling was hit by the lack of any BoE officials voting to raise interest rates, since higher interest rates are a positive factor for currencies because they attract greater inflows of foreign capital.
In Japan the opposite happened after the Bank of Japan (BoJ) raised interest rates, at its March meeting. Strangely the move failed to support the Yen. Reasons given were that it was widely telegraphed prior to the meeting, and that at between 0.0% and 0.1% interest rates in Japan are still very low compared to other major economies and unlikely to rise much in the future. This suggests the Yen will continue to be used as a funding currency – borrowed to purchase higher yielding peers.
Purchasing Manager Indices show mixed results
The UK S&P Global/CIPS Composite PMI in March came out lower-than-expected at 52.9 when 53.1 had been forecast, from 53.0 previously, on Thursday. The data weighed on GBP.
UK Services PMI undershot expectations of remaining at 53.8, dropping to 53.4.
Manufacturing was the bright spot, actually rising to 49.9 when 47.8 had been forecast from 47.5 previous.
In Japan the Jibun Bank Manufacturing PMI rose to 48.2 in March from 47.2 previously and Services PMI rose to 54.9 from 52.9.
Technical Analysis: Upside break seems unsustainable
GBP/JPY sees an upside break above the wedge pattern’s highs but the move looks unsustainable and price is already reversing. A bearish close on Thursday would form a Two Bar reversal pattern on the daily chart – a fairly reliable indicator of more weakness to come.
The RSI will probably exit overbought, another bearish sign. A break back inside the Wedge, confirmed by a decisive move below the upper trendline currently at 191.50, would probably signal further downside.

Pound Sterling to Japanese Yen: Daily chart
Often a reversal from an overshooting extreme, as is the case with GBP/JPY is a reliable signal to sell. When prices reach bullish extremes and overshoot their trendlines they often reverse sharply and move down quickly.
Economists at Commerzbank review Wednesday’s FOMC meeting and its implications for the US Dollar (USD).
The story may be the same, but the tone has changed
We can probably conclude that the story has remained the same, i.e. the Fed still wants to wait for inflation to return to its target on a sustained basis. The new projections are also consistent with this.
The only thing that has changed is Powell's tone: while he sounded very hawkish in January, this time he sounded much more neutral. This assessment of a more neutral Fed may change again as FOMC members speak in the coming days, but for now, the market is right to be wary of too much Dollar strength.
Gold has risen above $2,200 for the first time on a dovish Fed. Economists at MUFG Bank analyze the yellow metal’s outlook.
Short-term moves will remain tied to data potentially influencing Fed decision-making
Gold has leaped above $2,200 for the first time after the Fed maintained its outlook for three cuts this year, suggesting it is not alarmed by a recent uptick in inflation.
The FOMC left the target range for the federal funds rate unchanged at its March meeting. The median dot in the Summary of Economic Projections continued to show 75 bps of cuts in 2024. The median dots for 2025 and 2026 were each revised 25 bps higher, to 3.875% and 3.125%, respectively. The median dot for 2026 remained modestly above the median longer run dot, which edged up to 2.6%.
We continue to believe that the short-term moves will remain tied to data potentially influencing Fed decision-making while downside to the price will be limited by robust support from the other two channels (supportive central bank demand and bullion’s role as the geopolitical hedge of last resort).
- NZD/USD falls sharply to 0.6060 as the US Dollar sees a sharp recovery.
- The S&P Global reports that preliminary Manufacturing PMI surprisingly rose to 52.5 in March.
- The Q4 NZ GDP shows that the economy was in a technical recession in the second half of 2023.
The NZD/USD pair surrenders its intraday gains and turns negative in the early New York session on Thursday. The Kiwi asset falls back as the US Dollar rebounds sharply from its five-day low of 0.6060. The US Dollar Index (DXY) rises strongly to 103.76 as the Federal Reserve (Fed) has revised United States Gross Domestic Product (GDP) forecasts higher for 2024.
Fed’s latest economic projections indicate that the US economy will grow by 2.1% in 2024, upwardly revised from December’s projections of 1.4%. An upbeat economic outlook bodes well for the domestic currency.
Meanwhile, the S&P Global has reported mixed preliminary PMI data for March. The agency shows that the Manufacturing PMI surprisingly rose to 52.5 from the former reading of 52.2. Investors anticipated the factory PMI to decline to 51.7. The Services PMI that represents the service sector, which accounts for two-thirds of the economy, falls at a higher pace to 51.7 from expectations of 52.0 and the former reading of 52.3.
The appeal for risk-perceived assets has weakened despite firm market expectations for the Fed to reduce interest rates after the June policy meeting. The CME FedWatch tool shows that there is a little over 74% chance that a rate cut will be announced in June, which is significantly up from the 59% recorded before the Fed’s meeting.
On the Kiwi front, Statz NZ has reported that the economy was in a technical recession in the second half of 2023. The Q4 Gross Domestic Product (GDP) for 2023 surprisingly contracted by 0.1%, while investors projected the economy to have grown at a similar pace. In the third quarter of 2023, the NZ economy also contracted by 0.3%. A weak NZ economic outlook could force the Reserve Bank of New Zealand (RBNZ) to consider early rate cuts.
GBP/USD slid a bit on the BoE policy announcement, likely reflecting the shift in the voting bias. Economists at TD Securities analyze the Pound Sterling (GBP) outlook.
Cable set to move to 1.3000 in Q2
As universally expected, the MPC opted for a hold today, leaving Bank Rate at 5.25%. The vote was 8-1, with both Mann and Haskel switching to a hold vote. The language in the statement was broadly the same as in February, though we noted a slightly more dovish lean on inflation developments and a possible opening up for a May cut.
We think markets were generally looking for something like a copy and paste job from the last meeting. In turn, the voting shift from 2/6/1 to 8/1 has likely disrupted some short-term positioning. That said, we would fade the knee-jerk reaction, as the second order effects of central banks cuts are likely more important than the cuts themselves for FX. Easing financial conditions and improving growth prospects should continue to weigh on the USD in Q2/Q3.
For GBP/USD, we could see trend line support come in around 1.2700 in the near term. We would use dips as buying opportunities as we forecast a move to 1.3000 in Q2.
- AUD/USD declines back down to the 0.6580s.
- Aussie employment data and Fed meeting outcome had boosted the pair early on Thursday.
- Upbeat US data saw AUD/USD fall back down, however, during the US session.
AUD/USD trades back down at the lows of the day, during the US session on Thursday, after a batch of relatively strong American data helped the US Dollar (USD) claw back lost ground.
The pair had been rising after the Australian Dollar (AUD) got a boost from data showing an unexpected fall in Australian unemployment and a much higher-than-expected increase in the number of people in employment down under.
The release of US PMI data for March, Initial Jobless Claims and the Philadelphia Fed Manufacturing Index all supported the USD and saw the pair fall back close to the day’s lows in the 0.6580s.
US S&P Global Composite PMI came out at 52.2, holding above the 50 level that distinguishes expansion from contraction. US Manufacturing PMI came out at 52.5, beating estimates and previous figures. Services PMI, however, undershot expectations and previous results, coming out at 51.7 in March.
The Philadelphia Fed Manufacturing Survey came out higher than estimated at 3.2, and Initial Jobless Claims at 210K were lower than the 215K forecast.
AUD/USD rallied on Wednesday, triggered by US Dollar (USD) weakness after the Federal Reserve (Fed) March policy meeting.
At the meeting the Fed reaffirmed they would still be cutting interest rates by roughly three quarters of a percent in 2024 despite speculation they would reduce rate cuts because of recent warmer-than-expected inflation reading.
Early on Thursday the pair continued rising after it was revealed Australia added 116,500 new employees in February and saw its Unemployment Rate fall to 3.7% from 4.1%, according to data from the Australian Bureau of Statistics.
The figures beat economists expectations of a 40,000 increase in employees and unemployment at 4.0%.
The data supports the outlook for the Australian economy, is likely indicative of higher wage inflation going forward and suggests the Reserve Bank of Australia (RBA) will have to keep interest rates higher for longer. Higher interest rates are positive for currencies as they attract greater inflows of foreign capital.
The technical picture shows the AUD/USD pair oscillating in a range between roughly 0.6480 and 0.6650.
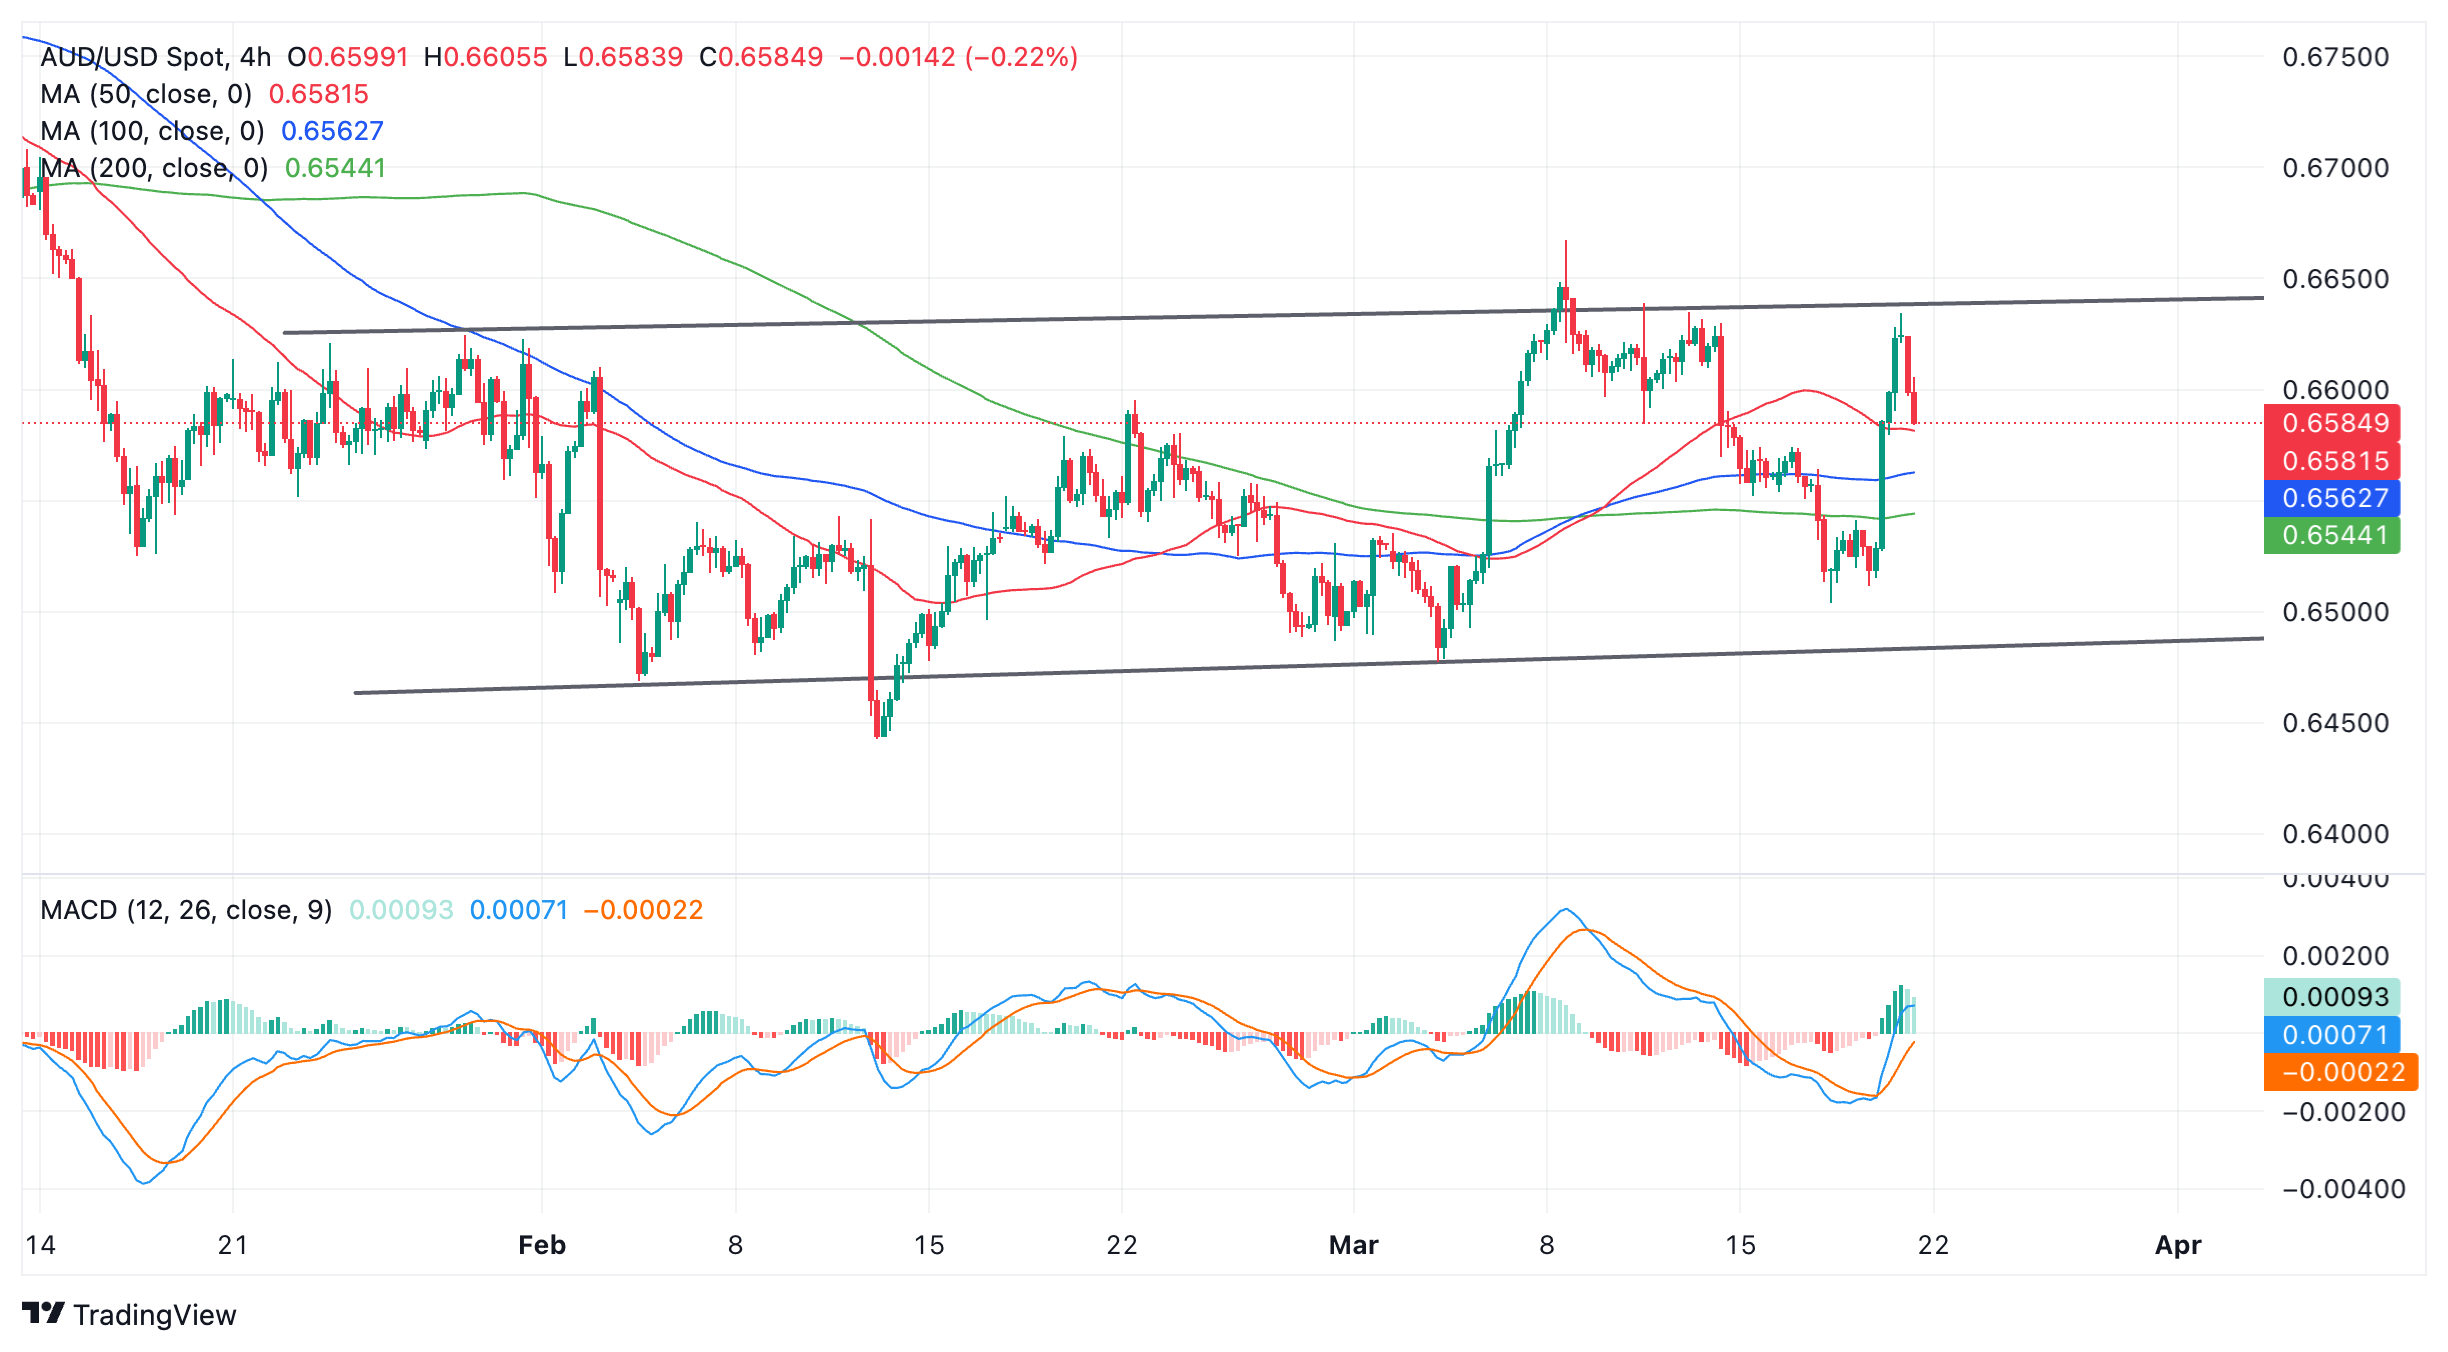
Australian Dollar versus US Dollar: 4-hour chart
The pair is currently turning around at the range highs and looking vulnerable to selling off.
A continued move lower could see it return to the base of the range. Alternatively a break above the 0.6668 highs would provide confirmation of a higher high and the formation of a bullish short-term trend.
- S&P Global Manufacturing and Services PMIs both arrived above 50 in early March.
- US Dollar Index stays in positive territory above 103.50.
Business activity in the US private sector continued to expand at a healthy pace in early March, with the S&P Global Composite PMI coming in at 52.2. This reading came in slightly below the February's 52.5.
S&P Global Manufacturing PMI improved to 52.5 from 52.2 in the same period, while S&P Global Services PMI edged lower to 51.7 from 52.3.
Commenting on the survey's findings, “further expansions of both manufacturing and service sector output in March helped close off the US economy’s strongest quarter since the second quarter of last year," said Chris Williamson, Chief Business Economist at S&P Global Market Intelligence.
"The survey data point to another quarter of robust GDP growth accompanied by sustained hiring as companies continue to report new order growth," Williamson added. “A steepening rise in costs, combined with strengthened pricing power amid the recent upturn in demand, meant inflationary pressures gathered pace again in March."
Market reaction
The US Dollar continued to gather strength after the PMI data. The US Dollar Index was last seen rising 0.35% on the day at 103.72.
The value of the Swiss Franc (CHF) has dropped 1.2% after the SNB’s ‘surprise’ rate cut. Economists at Rabobank analyze CHF outlook.
EUR/CHF six-month forecast of 0.9800 brought forward to a three-month view
The SNB’s decision to cut rates this month will likely further the probability that the CHF could be used as a funding currency particularly if the SNB signals that it is prepared to match ECB rate cuts this year.
While there are several fronts from which demand for safe-haven could re-appear over the medium term and we do expect that volatility will rise towards the end of the year with the US election. That said, for now the CHF is likely to remain soft.
We have brought forward our previous EUR/CHF six-month forecast of 0.9800 to a three-month view.
- EUR/GBP rebounds after the BoE meeting shows no board members voting for a rate hike.
- Previously one member had held out for an interest rate hike.
- UK PMI data also shows overall fall in Composite and Services, although Manufacturing recovers.
EUR/GBP is trading up by almost three tenths of a percent on Thursday in the 0.8560s after the outcome of the Bank of England (BoE) meeting and overall weaker-than-expected British PMI data, weighed on the Pound Sterling (GBP) side of the pair.
The Bank of England left interest rates unchanged at 5.25% at its meeting on Thursday but the distribution of votes changed to show none of the officials voting for an interest rate hike. This was a change from the one who voted for a hike at the last meeting. Instead the majority of eight board members voted for no-change – one more than the previous meeting – and only one voted for a cut in interest rates, as before.
The Pound Sterling was hit by the lack of any BoE officials voting to raise interest rates, since higher interest rates are a positive factor for currencies because they attract greater inflows of foreign capital.
Both Eurozone and UK PMI data for March showed overall cracks in the outlook. In the case of the UK, the S&P Global/CIPS Composite PMI came out lower-than-expected at 52.9 when 53.1 had been forecast from 53.0 previously.
UK Services PMI undershot expectations of remaining at 53.8, dropping to 53.4. Manufacturing actually beat expectations at 49.9 when 47.8 had been forecast from 47.5 previous.
In the Eurozone, the HCOB Composite PMI rose to 49.9 thereby beating estimates of 49.7 and the previous February reading of 49.2.
Eurozone HCOB Manufacturing PMI in March fell to 45.7, declining deeper into contractionary territory (below 50) than had been predicted. Economists had estimated a more buoyant rise to 47.0 from 46.5 previously.
Euro area HCOB Services PMI rose to 51.1 in March, beating estimates of 50.5 from 50.2 previous, according to data from S&P Global.
Europe's economic powerhouse Germany, meanwhile, revealed a similar trend, with German HCOB Manufacturing PMI declining to 41.6 which was below estimates of 43.1 and February's 42.5. It too showed unexpected gains, however, in both Services component and the Composite number.
Economists at BBH analyze US Dollar’s outlook after the perceived dovish Fed hold.
The Fed is unlikely to deliver 75 bps of rate cuts this year
For 2024, the Fed’s new funds rate projection continues to imply 75 bps of rate cuts despite higher GDP growth estimate (2.1% versus 1.4%) and higher core PCE inflation forecast (2.6% versus 2.4%). The combination of expected lower policy rates, stronger growth, and higher underlying inflation bodes well for risk assets and is weighing on USD.
In our view, the outcome of the Fed March policy meeting is not a dovish slam dunk. First, there was no indication from the Fed that it had gained greater confidence that inflation is moving sustainably towards 2%. Second, the median Fed funds rate projections for 2025 and 2026 were both lifted by 25bps to 3.875% and 3.125%, while the longer-term funds rate forecast is roughly 6bps higher at 2.6%. Third, the 2024 funds rate estimate was just one dove away from a hawkish shift.
Importantly, we doubt the Fed will deliver 75 bps of rate cuts this year in part because of the encouraging US economic growth outlook. As such, USD downside is limited.
USD mixed on the day. Economists at Scotiabank analyze Greenback’s outlook.
US Dollar prone to more softness after FOMC
With the risk of a more hawkish Fed removed the pathway to a somewhat softer USD seems to be a little clearer – if only to correct some of its recent gains that developed around concerns that hot CPI data recently could shift the Fed’s perspective on the rate outlook.
The DXY closed negatively Wednesday, losing ground broadly and signaling a technical reversal in its recent strength. The USD’s performance so far today has been mixed, however. But USD gains are not enough – at this point – to ward off more losses in response to the FOMC decision and lower US yields.
The DXY is at risk of easing a further 0.75%-1% in the near term, at least.
- Initial Jobless Claims in the US decreased by 2,000 in the week ending March 16.
- US Dollar Index clings to modest daily gains above 103.50.
There were 210,000 initial jobless claims in the week ending March 16, the weekly data published by the US Department of Labor (DOL) showed on Thursday. This print followed the previous week's print of 212,000 (revised from 209,000) and came in better than the market expectation of 215,000.
Further details of the publication revealed that the advance seasonally adjusted insured unemployment rate was 1.2% and the 4-week moving average stood at 211,250, an increase of 2,500 from the previous week's revised average.
"The advance number for seasonally adjusted insured unemployment during the week ending March 9 was 1,807,000, an increase of 4,000 from the previous week's revised level," the publication read.
Market reaction
The US Dollar Index clings to modest daily gains above 103.50 in the early American session.
USD/CAD is steady on Thursday. Economists at Scotiabank analyze the pair’s outlook.
Short-term spot trends are somewhat mixed
Lower US rates and narrower US/Canada spreads are supportive of a somewhat firmer CAD in the near term and the CAD-positive turn in seasonal trends into Q2 remains something to keep in mind.
On the one hand, the USD’s tumble from the low 1.3600 area on Wednesday marks another, clear rejection of 1.3600+ on the short-term chart which should really mean spot gravitates to retest the range low at 1.3420 at least. On the other, intraday patterns indicate a firm rebound in the USD from the intraday low which may mean the USD pushes back up to the low/ mid-1.3500 area before renewed selling pressure emerges.
The 1.3600/1.3610 looks very firm resistance now and a low close on the week for the USD should drive more losses and a deeper correction of the USD’s Q1 strength in the weeks ahead.
- The US Dollar recovers on Thursday after its brief moment of weakness on Wednesday.
- Traders were surprised by the dovish Fed, which continued to anticipate three rate cuts this year.
- The US Dollar Index fell to the lower end of 103.00 before staging a rebound.
The US Dollar (USD) is entering a patch of volatility after markets got caught by surprise on Wednesday when the release of the Fed monetary policy decision revealed that the Federal Open Market Committee (FOMC) is still committed to cut interest rates three times this year. Markets had already repriced their stance to just two cuts ahead of the Fed event. The repricing of the Fed statement resulted in ample US Dollar weakness, with equities rallying substantially higher.
On the economic data front, Thursday’s points could not come at a better time. With the preliminary Purchasing Manager Index (PMI) numbers to be released, markets can get confirmation if the Fed is right to stick to three cuts. A continuing strong economy could result in the Fed tuning down its rate cut expectations to only two or one cut in order to keep control of inflation as firm demand tends to fuel inflation.
Daily digest market movers: Fed view to be confirmed by data
- The Swiss National Bank (SNB) has cut its interest rate by 25 basis points from 1.75% to 1.50%. The Norwegian Norges Bank kept rates unchanged at 4.50%.The Bank of England is keeping its policy rate unchanged as well, seeing it too early to cut just yet.
- Thursday’s US economic data releases start at 12:30 GMT with a mixture of data:
- Current Account data for Q4 is seen heading from a $200.3 billion deficit to $209.0 billion.
- The Philadelphia Fed Manufacturing Survey for March is expected to head from 5.2 to a contraction at -2.3.
- Initial Jobless Claims for this week are expected to climb from 209,000 to 215,000.
- Continuing Jobless Claims were last week at 1.811 million.
- S&P Global will release its preliminary Purchasing Managers Survey for March at 13:45 GMT:
- The Services PMI is expected to head from 52.3 to 52.
- The Manufacturing PMI should be heading from 52.2 to 51.7.
- The Composite PMI was at 52.5 in February, with no forecast pencilled in.
- At 14:00 GMT, Existing Home Sales data will come in, with a small retreat from 4 million to 3.94 million expected.
- Federal Reserve's Vice Chair for Supervision Michael Barr will speak around 16:00 GMT.
- Equities are holding on to overnight gains and are advancing further. Japan and China saw all their major indices close off with more than 1.5% gains. European equities are steady just below 1% and US equity futures are seeing the Nasdaq leading the charge by soaring near 1% ahead of the US opening bell.
- According to the CME Group’s FedWatch Tool, expectations for the Fed’s May 1 meeting are 91.5% keeping the rate unchanged, while chances of a rate cut are at 7.5%.
- The benchmark 10-year US Treasury Note trades around 4.23%, the lower end of this week.
US Dollar Index Technical Analysis: Thank you Fed
The US Dollar Index (DXY) is turning into a snooze fest after the Fed meeting on Wednesday. The DXY is jumping this Thursday, partly erasing the losses from Wednesday after markets repriced again to three cuts. Traders should be very well aware that entering a trade in US Dollar means tighter entries and stop losses as volatility in the past three months (January 2024 to March 2024) was only around 6.5%, less than the 14% seen in the three months before (September 2023 to December 2023)
The DXY is on track to break back above the 200-day Simple Moving Average (SMA) at 103.70 before moving back above 104.00. On the upside, 104.96 remains the first level in sight. Once above there, the peak at 104.97 from February comes into play ahead of the 105.00 region with 105.12 as the first resistance.
Support from the 200-day Simple Moving Average (SMA) at 103.70, the 100-day SMA at 103.54, and the 55-day SMA at 103.53, fell short of providing enough cushion during the Fed meeting. The 103.00 big figure looks to be rather a level to focus on for future reference when the DXY tanks. In case 103.00 does not hold, 102.48-102.35 comes in with the low of March as a level to watch.
US Dollar FAQs
The US Dollar (USD) is the official currency of the United States of America, and the ‘de facto’ currency of a significant number of other countries where it is found in circulation alongside local notes. It is the most heavily traded currency in the world, accounting for over 88% of all global foreign exchange turnover, or an average of $6.6 trillion in transactions per day, according to data from 2022. Following the second world war, the USD took over from the British Pound as the world’s reserve currency. For most of its history, the US Dollar was backed by Gold, until the Bretton Woods Agreement in 1971 when the Gold Standard went away.
The most important single factor impacting on the value of the US Dollar is monetary policy, which is shaped by the Federal Reserve (Fed). The Fed has two mandates: to achieve price stability (control inflation) and foster full employment. Its primary tool to achieve these two goals is by adjusting interest rates. When prices are rising too quickly and inflation is above the Fed’s 2% target, the Fed will raise rates, which helps the USD value. When inflation falls below 2% or the Unemployment Rate is too high, the Fed may lower interest rates, which weighs on the Greenback.
In extreme situations, the Federal Reserve can also print more Dollars and enact quantitative easing (QE). QE is the process by which the Fed substantially increases the flow of credit in a stuck financial system. It is a non-standard policy measure used when credit has dried up because banks will not lend to each other (out of the fear of counterparty default). It is a last resort when simply lowering interest rates is unlikely to achieve the necessary result. It was the Fed’s weapon of choice to combat the credit crunch that occurred during the Great Financial Crisis in 2008. It involves the Fed printing more Dollars and using them to buy US government bonds predominantly from financial institutions. QE usually leads to a weaker US Dollar.
Quantitative tightening (QT) is the reverse process whereby the Federal Reserve stops buying bonds from financial institutions and does not reinvest the principal from the bonds it holds maturing in new purchases. It is usually positive for the US Dollar.
EUR/USD dips on soft PMI data. Economists at Scotiabank analyze the pair’s outlook.
Daily and weekly trend momentum signals are bullish
Preliminary March data from France was weaker than expected across the board while the German Manufacturing print (41.6) was also well below forecasts and February’s result. Preliminary Eurozone Services and Composite readings strengthened more than expected but the Manufacturing data slipped to 45.7 (below estimates and weaker than February).
EUR/USD losses from the daily peak have checked the short-term rebound in spot but the EUR’s technical undertone retains a bullish lilt after this week’s solid recovery from the low 1.0800 area (200-DMA test).
Daily and weekly trend momentum signals are bullish, suggesting the EUR should find steady support on minor dips.
Resistance is 1.0975/1.0980.
- The USD/CAD stabilizes at the base of a rising channel after post-Fed sell-off.
- The Fed struck a dovish tone in the meeting, weakening the US Dollar.
- The Canadian Dollar is supported by a mute BoC which was reluctant to reveal intentions in recent meeting minutes.
USD/CAD trades at the bottom of a multi-week range after breaking back above 1.3500 on Thursday. The pair is stabilizing after its steep sell-off following the Federal Reserve’s (Fed) March policy meeting, at which officials struck a more-dovish tone than had been expected, leading to a weaker US Dollar (USD).
According to its own projections, the Fed continues to expect to make three 0.25% interest rate cuts (of 0.25% each) in 2024, in response to cooling inflation. Some analysts had expected a reduction in the Fed’s forecasts to only two rate cuts due to warmer-than-expected inflation readings at the start of the year.
Lower interest rates are negative for a currency as they attract less inflows of foreign capital so the Fed’s persistence in expecting three rather than two cuts in 2024 led USD to sell-off, and USD/CAD to weaken.
The Fed’s stance contrasts with that of the Bank of Canada (BoC) which has been reluctant to reveal whether or how many rate cuts it expects to make in 2024. That said, the BoC suggests rate cuts may be on the cards, according to the last BoC meeting minutes, the Summary of Governing Council Deliberations (SGCD).
“Members agreed that if the economy evolves in line with the Bank’s projection, the conditions for rate cuts should materialize over the course of this year. However, there was some diversity of views among Governing Council members about when there would likely be enough evidence that these conditions were in place,” says the BoC.
One of the conditions BoC members agreed on was that they would want to see sustained easing in underlying inflation before cutting interest rates. One measure of underlying inflation is core inflation.
Since the March meeting, core inflation data has been released, showing an unexpected cooling in February. Canadian Core CPI fell to 2.1% in February compared to 2.4% in January. Whilst on a monthly basis, Core CPI increased 0.1%, the same as in January, according to Statistics Canada.
The data, “could lead to incrementally more dovish language from the BoC at its upcoming April 10 meeting,” said David Doyle, head of economics at Macquarie. However, Macquarie’s economists, “still see hopes for an imminent rate cut as premature.”
With cooling inflation in Canada contrasting with warming inflation in the US the expectation would be for USD/CAD to probably rise.
From a technical perspective, USD/CAD is making slow but steady progress higher within an ascending channel.
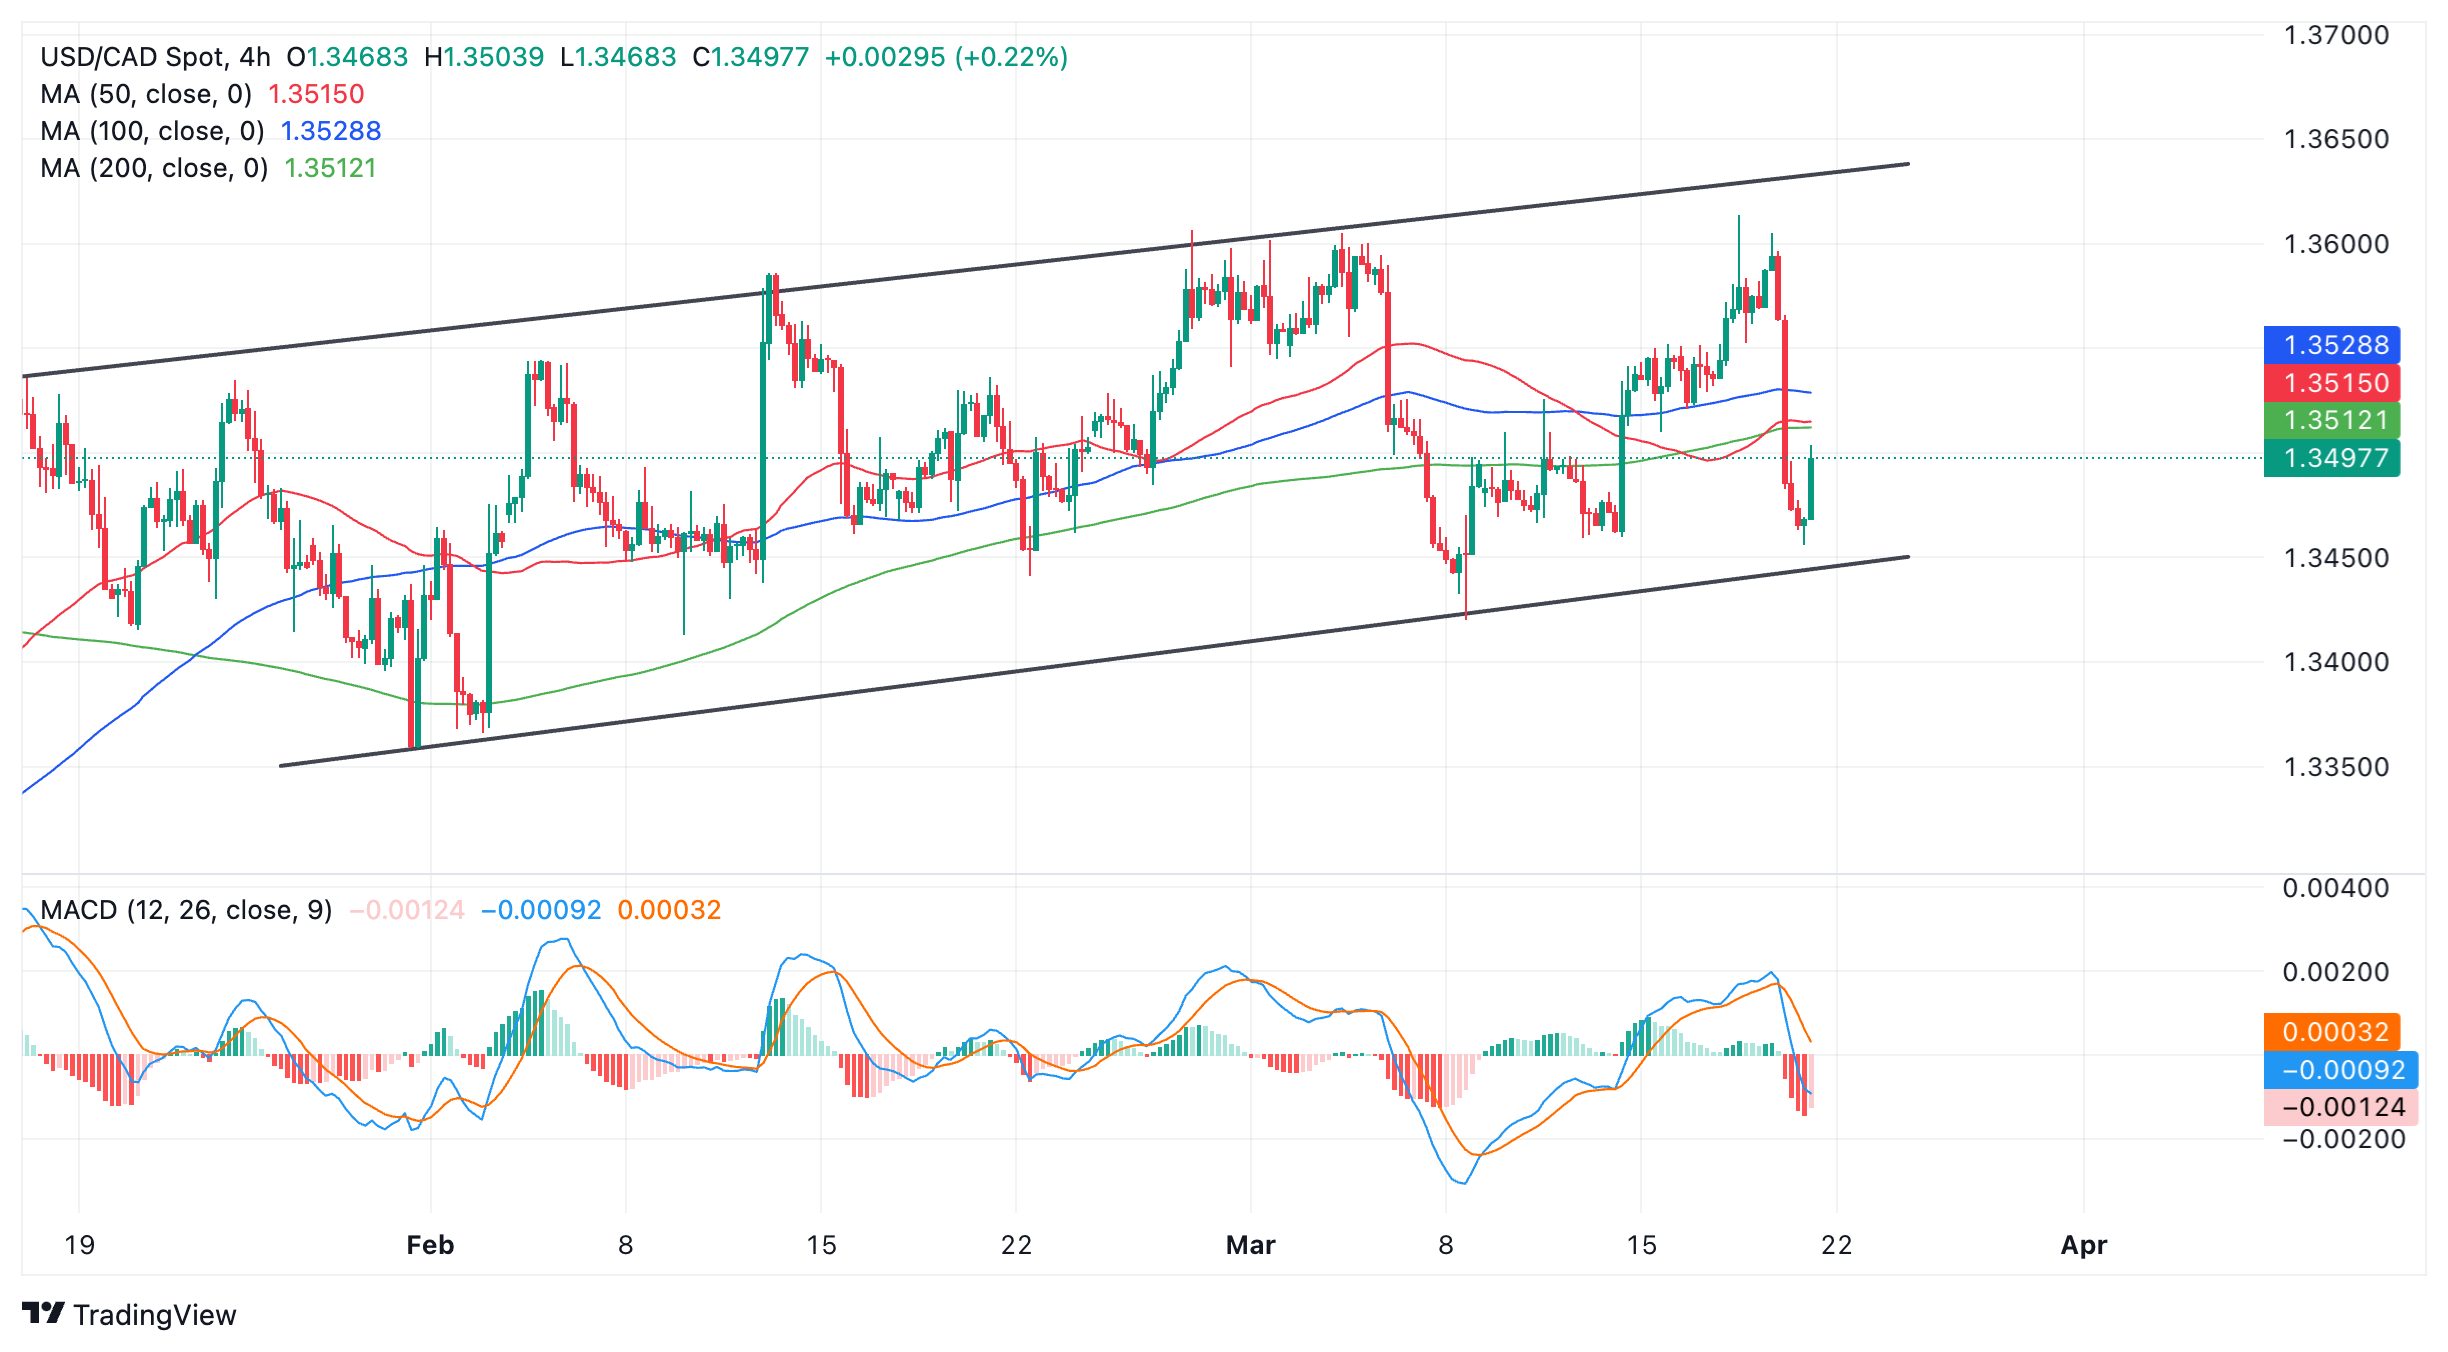
US Dollar versus Canadian Dollar: 4-hour chart
The pair appears to be rotating at the bottom of the range and in the process of swinging higher, though it is still too early to say whether it will rise all the way to the top of the channel again.
If it can push above the cluster of major Simple Moving Averages in the lower 1.3500s there is a good chance it will have the momentum to continue higher to the top of the range at roughly 1.3620. A break above 1.3550 would provide a degree of bullish confirmation.
Alternatively a decisive bear break below the lower borderline of the channel at roughly 1.3440 would signal more downside, first to 1.3420, and then 1.3370.
- USD/JPY rebounds to 151.00 as the US Dollar bounces back.
- Upwardly revised US economic outlook has supported the US Dollar.
- Rising expectations for Japan’s intervention fail to offset BoJ’s accommodative guidance.
The USD/JPY pair finds support after correcting to near 150.27 in the European session on Thursday. The asset rebounds as the US Dollar recovers after refreshing a five-day low. The US Dollar Index (DXY) bounces back from 103.17 as the Federal Reserve’s (Fed) latest economic projections showed that the United States growth rate for 2024 was revised higher to 2.1% from 1.4% forecasted in December’s policy meeting.
There is a region-specific demand in the global markets. Risk-sensitive assets in Europe are facing pressure as the Swiss Nation Bank (SNB) surprisingly reduced interest rates by 25 basis points (bps) to 1.25% while demand for antipodeans and Asian currencies is upbeat. S&P 500 futures have posted significant gains in the London session.
The market sentiment is broadly upbeat as the Fed’s dot plot for the March meeting, released on Wednesday, indicated that three rate cut projections for this year remain alive. In the monetary policy statement, Fed Chair Jerome Powell said that he is confident in the story of easing underlying price pressures despite recent hot inflation readings.
This has led to a sharp increase in speculation that the Fed will begin rate cuts from the June policy meeting. The CME FedWatch tool shows that there is a 74% chance that a rate cut will be announced in June.
Meanwhile, the Japanese Yen rose against the US Dollar after speculation of stealth intervention in the FX domain escalated. Japan's Finance Minister Shunichi Suzuki said, "Currencies must move in a stable manner and that he is closely watching foreign exchange moves with a high sense of urgency."
However, the Japanese Yen struggles to hold strength as the near-term guidance for the monetary policy by the Bank of Japan (BoJ) is still accommodative despite exiting the expansionary policy stance.
GBP/USD trades slightly lower. Economists at Scotiabank analyze the pair’s outlook.
The GBP rise appears to have stalled
Spot gains extended through the low 1.2700 area on Wednesday to lift the near-term technical tone for the GBP. But the GBP rise appears to have stalled – and may be reversing – from the test of 1.2800.
Intraday candle patterns suggest a minor top may have formed through European trade. GBP dips to the low/mid 1.2700 area should find firm support, however.
Resistance is 1.2810, ahead of a return to the 1.2900 zone.
- Natural Gas prices are falling back below $1.90.
- Traders are focusing on the robust Gas reserves in Europe ahead of the next heating season.
- The US Dollar Index fell to the lower 103.00 level after the Fed meeting.
Natural Gas prices (XNG/USD) trade subdued on Thursday after facing some profit-taking on Wednesday, with traders locking in some gains on long positions taken in the past few weeks. With the mixture of recent supply issues and delays in deliveries, European Gas reserves are not seeing the quick drain expected, urging traders to at least book some profit now. Meanwhile, LNG as an energy commodity is facing some pressure from European leaders, who are pushing for a renaissance in nuclear energy.
Meanwhile, the US Dollar (USD) fell back below 104.00 and nearly all the way back to 103.00. The US Federal Reserve (Fed) was the main driver of the move by confirming via its dot plot that it still sees three rate cuts happening this year. This meant markets had to reprice their US Dollar positions again after investors had already dialed down their optimism to only two rate cuts for this year.
Natural Gas is trading at $1.85 per MMBtu at the time of writing.
Natural Gas news and market movers: Europe remains key
- Lower emission levels and energy security is pushing European Leaders to revisit their commitment of shunning away from nuclear energy.
- The UK is facing supply issues, with no LNG arrivals since March 9, and the next delivery only scheduled for March 24, according to ship-tracking data from Bloomberg.
- Norwegian Gas outflows into Europe are picking up in volume again after some unforeseen disruptions and maintenance.
- Oil company Petrobras (state-controlled by Brazil) is turning to liquefied Natural Gas imports this month to secure supplies while it carries out maintenance work at a major offshore pipeline.
Natural Gas Technical Analysis: Pennant formation
Natural Gas prices are consolidating with a pennant formation on the Daily Chart, formed by lower highs and higher lows since mid-February. With both buyers and sellers being pushed toward each other, a breakout could be due at any time. Seeing the current lackluster energy demand out of Europe, with its storage units still above average, a turn to the downside looks more likely than an upside breakout.
On the upside, the key $2.00 level needs to be regained first. The next key mark is the historic pivotal point at $2.12, which falls broadly in line with the 55-day Simple Moving Average (SMA) at $2.05. Should Gas prices pop up in that region, a broad area opens up with the first cap at the red descending trendline near $2.27.
On the downside, multi-year lows are still nearby with $1.65 as the first line in the sand. This year’s low at $1.60 needs to be kept an eye on as well. Once a new low for the year is printed, traders should look at $1.53 as the next supportive area.
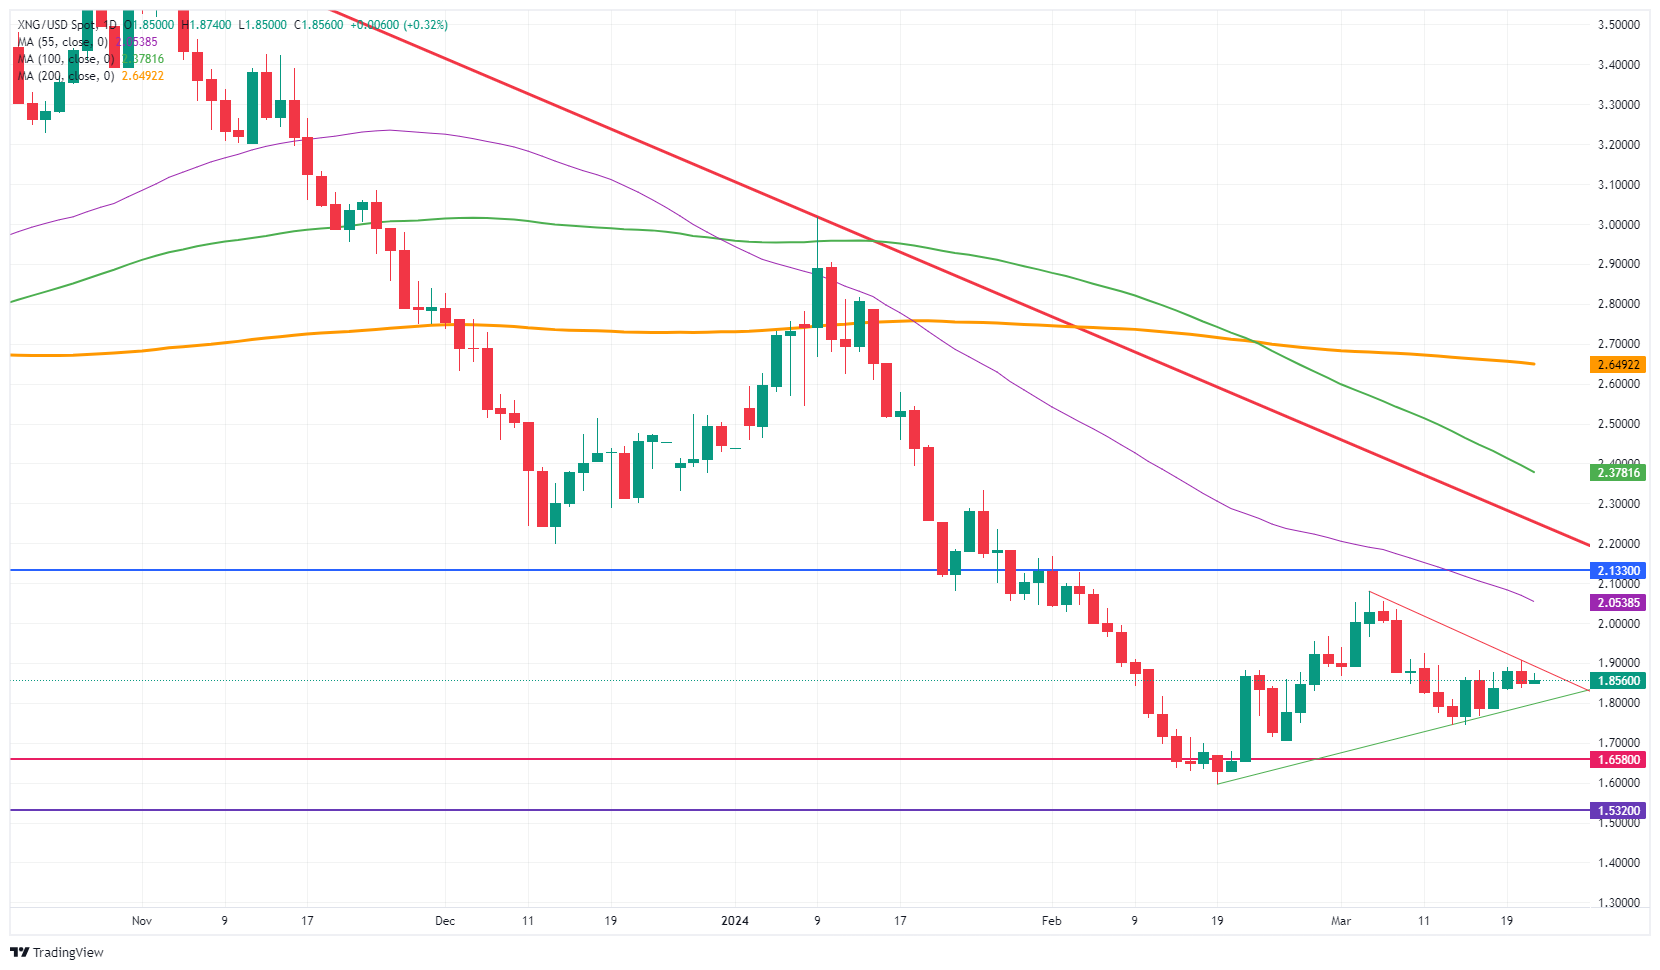
Natural Gas: Daily Chart
Natural Gas FAQs
Supply and demand dynamics are a key factor influencing Natural Gas prices, and are themselves influenced by global economic growth, industrial activity, population growth, production levels, and inventories. The weather impacts Natural Gas prices because more Gas is used during cold winters and hot summers for heating and cooling. Competition from other energy sources impacts prices as consumers may switch to cheaper sources. Geopolitical events are factors as exemplified by the war in Ukraine. Government policies relating to extraction, transportation, and environmental issues also impact prices.
The main economic release influencing Natural Gas prices is the weekly inventory bulletin from the Energy Information Administration (EIA), a US government agency that produces US gas market data. The EIA Gas bulletin usually comes out on Thursday at 14:30 GMT, a day after the EIA publishes its weekly Oil bulletin. Economic data from large consumers of Natural Gas can impact supply and demand, the largest of which include China, Germany and Japan. Natural Gas is primarily priced and traded in US Dollars, thus economic releases impacting the US Dollar are also factors.
The US Dollar is the world’s reserve currency and most commodities, including Natural Gas are priced and traded on international markets in US Dollars. As such, the value of the US Dollar is a factor in the price of Natural Gas, because if the Dollar strengthens it means less Dollars are required to buy the same volume of Gas (the price falls), and vice versa if USD strengthens.
USD/MXN is probing last year's low of 16.60. Economists at Société Générale analyze the pair’s technical outlook.
Move beyond 17.00/17.20 essential to confirm a meaningful up move
USD/MXN has recently struggled to overcome the 200-DMA (now at 17.20) resulting in persistence of decline. It is probing last year's low of 16.60.
Daily MACD has been posting positive divergence denoting receding downward momentum, but a move beyond the MA near 17.00/17.20 would be essential to confirm a meaningful up move.
Inability to defend 16.60 can lead to extension in the phase of correction. Next potential objectives could be located at projections of 16.40 and 16.10.
- Gold price rises as the Fed remains stuck with projections of three rate cuts this year.
- US yields fall sharply as market expectations for the Fed starting rate cuts from June rise.
- An improved US economic outlook could restrict the downside in the US Dollar.
Gold price (XAU/USD) clings to gains near fresh all-time highs around $2,220 in Thursday’s European session. Investors are gung-ho on Gold as markets increasingly expect the Federal Reserve (Fed) to lower interest rates in the June policy meeting.
The speculation over Fed rate cut hopes for June escalated after the quarterly updated dot plot of March’s policy meeting showed that three rate cut projections for this year remain on the table. Comments from Fed Chair Jerome Powell also helped to firm demand for Gold. Powell said policymakers are confident that underlying inflation is easing despite sticky February’s inflation numbers. Firm expectations for the Fed reducing interest rates diminish the opportunity cost of holding investment in non-yielding assets such as Gold. Meanwhile, yields on 10-year US Treasury bonds fall by 1% to 4.23%.
The US Dollar Index (DXY), which tracks the Greenback’s value against six major currencies, rebounds to 103.50 after the decline was seen post-release of the dot plot. However, upwardly revised forecasts for the Gross Domestic Product (GDP) and the annual Core Personal Consumption Expenditure Price Index (PCE) for 2024 could limit the US Dollar’s downside. An improving US economic outlook bodes well for the US Dollar.
Daily digest market movers: Gold price jumps higher as US yields hit hard
- Gold price falls slightly after refreshing all-time highs at around $2,223 as the US Dollar rebounds from a five-day low of 103.17.
- The demand for Gold is broadly bullish as the Federal Reserve indicated that inflation is moving in the right direction. The Fed is confident that underlying price pressures are easing despite inflation remaining stubborn in the first two months this year. Fed officials project the annual Core PCE Price Index at 2.6% in 2024, higher than the 2.4% anticipated in December’s policy meeting.
- The updated Fed’s dot plot indicated that December’s projections of three rate cuts in 2024 remain on track. Nine out of 19 policymakers support lowering interest rates three times this year, while one had projected more than three. The remaining policymakers anticipated to have two or less rate cuts in the same period.
- This has uplifted expectations for the Fed reducing interest rates from the June policy meeting. The CME FedWatch tool shows that there is a little over 74% chance that a rate cut will be announced in June, which is significantly up from 59% recorded before the Fed’s meeting.
- While the Fed’s projection for lowering interest rates three times this year remains intact, median rate projections for 2025 and 2026 have increased to 2.9% and 3.1%, respectively. The median projections for the longer-term rate have also increased to 2.6%.
- Regarding the United States economic outlook, the Fed sees the Unemployment Rate at 4.0% by 2024, down from 4.1% anticipated in December. Meanwhile, forecasts for the 2024 Gross Domestic Product (GDP) have been upwardly revised to 2.1% from the 1.4% projected in December.
Technical Analysis: Gold price refreshes all-time highs near $2,220
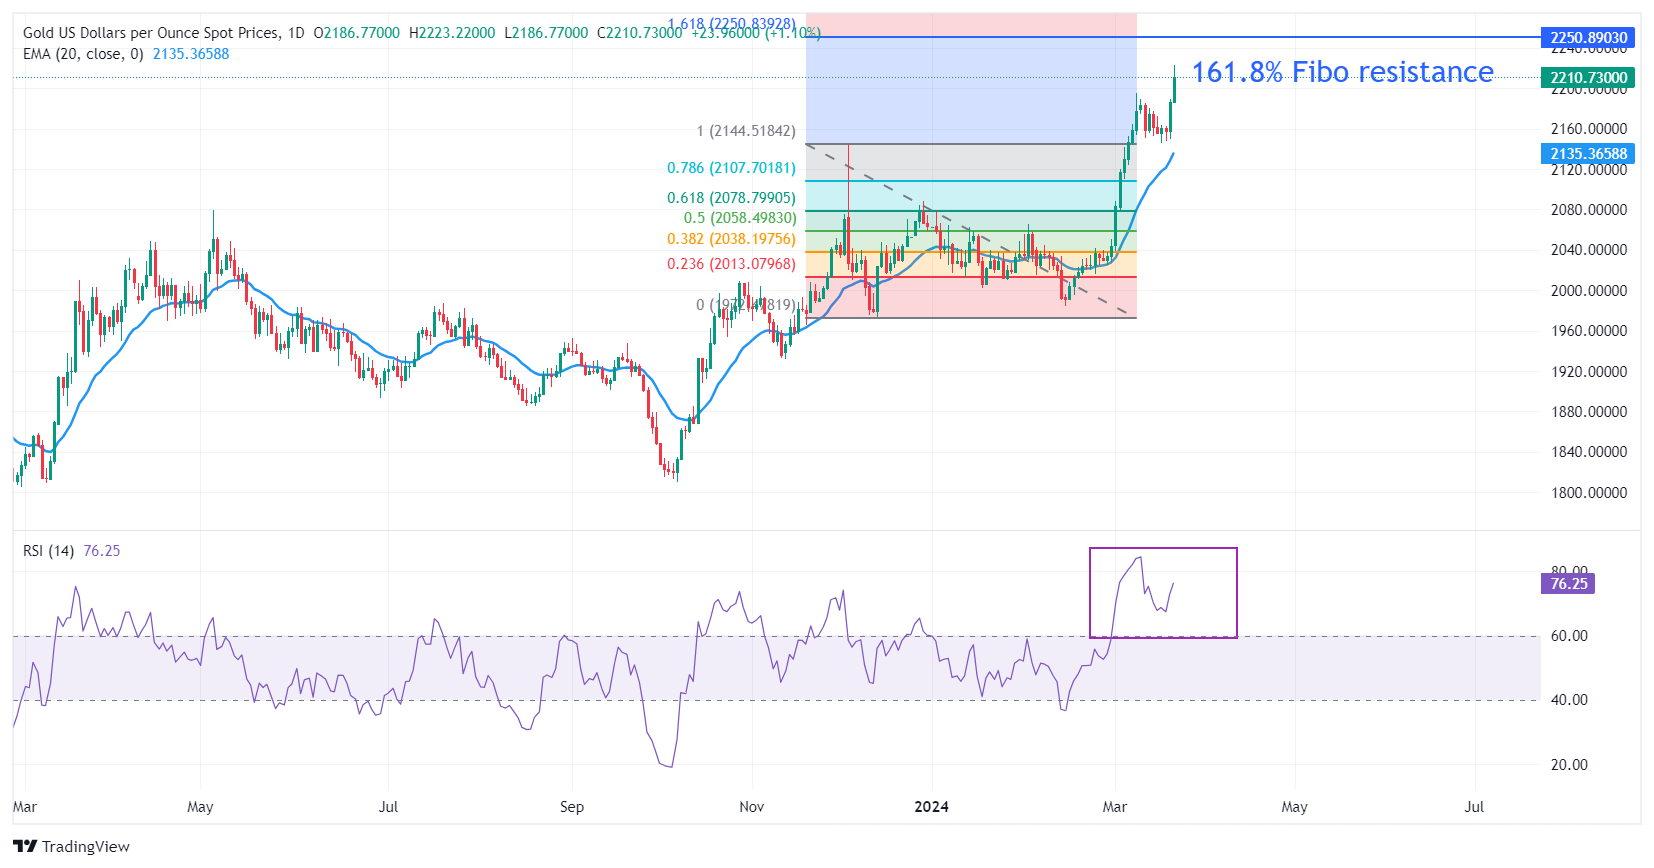
Gold price hovers near all-time highs around $2,220. The short-term demand for the Gold price is extremely bullish as the 20-day Exponential Moving Average (EMA) at $2,137 is sloping higher vertically.
The Gold price is trading in unchartered territory but could face resistance near the 161.8% Fibonacci extension level at $2,250. The Fibonacci tool is plotted from December 4 high at $2,144.48 to December 13 low at $1,973.13. On the downside, December 4 high at $2,144.48 will be a major support for the Gold price bulls.
The 14-period Relative Strength Index (RSI) oscillates in the bullish range of 60.00-80.00, indicating more upside ahead.
Gold FAQs
Gold has played a key role in human’s history as it has been widely used as a store of value and medium of exchange. Currently, apart from its shine and usage for jewelry, the precious metal is widely seen as a safe-haven asset, meaning that it is considered a good investment during turbulent times. Gold is also widely seen as a hedge against inflation and against depreciating currencies as it doesn’t rely on any specific issuer or government.
Central banks are the biggest Gold holders. In their aim to support their currencies in turbulent times, central banks tend to diversify their reserves and buy Gold to improve the perceived strength of the economy and the currency. High Gold reserves can be a source of trust for a country’s solvency. Central banks added 1,136 tonnes of Gold worth around $70 billion to their reserves in 2022, according to data from the World Gold Council. This is the highest yearly purchase since records began. Central banks from emerging economies such as China, India and Turkey are quickly increasing their Gold reserves.
Gold has an inverse correlation with the US Dollar and US Treasuries, which are both major reserve and safe-haven assets. When the Dollar depreciates, Gold tends to rise, enabling investors and central banks to diversify their assets in turbulent times. Gold is also inversely correlated with risk assets. A rally in the stock market tends to weaken Gold price, while sell-offs in riskier markets tend to favor the precious metal.
The price can move due to a wide range of factors. Geopolitical instability or fears of a deep recession can quickly make Gold price escalate due to its safe-haven status. As a yield-less asset, Gold tends to rise with lower interest rates, while higher cost of money usually weighs down on the yellow metal. Still, most moves depend on how the US Dollar (USD) behaves as the asset is priced in dollars (XAU/USD). A strong Dollar tends to keep the price of Gold controlled, whereas a weaker Dollar is likely to push Gold prices up.
EUR/CHF accelerates through 0.9750, USD/CHF clears 0.8950 after the SNB rate cut. Economists at Société Générale analyze the Swiss Franc (CHF) outlook.
SNB cuts 25 bps to 1.50%
The SNB stole a march on the ECB after cutting rates by 25 bps to 1.50%.
Market views were divided but the chance for a cut was not negligible after much softer inflation in 1Q. No cut would have meant inflation undershooting the target. Even after today’s reduction, the first since 2019, inflation in Switzerland is still forecast to average only 1.4% this year, 1.2% in 2025 and 1.1% in 2026. In other words, don’t rule out further cuts to get inflation back up to target. The next one could come in June.
Chair Jordan said the bank will adjust monetary policy again if necessary. That’s a recipe for steady Franc depreciation.
Economists at Commerzbank analyze how the Bank of England’s (BoE) policy decision could impact the Pound Sterling (GBP).
Expectations have shifted somewhat towards a dovish surprise
Presumably, the decision will not bring much news. After all, there will be no press conference and no new forecasts will be released. And a change in the key interest rate is also very unlikely.
It may be that after Wednesday's rather low inflation figures, expectations have shifted somewhat towards a dovish surprise. If this is the case, and the BoE delivers as we expect, the Pound could benefit somewhat again.
Economists at the Bank of America analyze the Pound Sterling (GBP) outlook ahead of the Bank of England's forthcoming policy decision.
BoE to maintain its interest rate stance
The BoE is expected to keep rates unchanged with a possible inclination towards caution, reflecting on services inflation and wage dynamics.
Limited direct market impact from the BoE's decision is expected due to minimal rate cut anticipations.
Supported by favorable carry trades and a benign risk environment, GBP is poised for strength in April, benefiting from seasonal trends.
- The Swiss Franc weakens after the Swiss National Bank decides to cut interest rates from 1.75% to 1.50%.
- The move was not widely expected by markets and the Swiss Franc has sold off heavily following the news.
- The SNB gives victory over inflation, a too-strong Swiss Franc and the need to stimulate economic activity as reasons for the cut.
The Swiss Franc (CHF) is trading weaker by about one percent in its most heavily traded pairs on Thursday after the Swiss National Bank (SNB) decided to cut interest rates at their March meeting.
The SNB cut its policy rate by 0.25% from 1.75% to 1.50% on Thursday, surprising traders who had been expecting a maintenance of the status quo. The move comes after a larger-than-expected fall in Swiss inflation in the first months of the year, and a slowdown in economic growth in 2023.
The Swiss Franc weakened on the news since lower interest rates tend to reduce foreign capital inflows.
SNB decides to ease monetary policy after victory against inflation
In its monetary policy assessment, the SNB said that it cut interest rates because it had won the battle against inflation.
“The easing of monetary policy has been made possible because the fight against inflation over the past two and a half years has been effective,” said the SNB.
Further, it added that, “For some months now, inflation has been back below 2% and thus in the range the SNB equates with price stability. According to the new forecast, inflation is also likely to remain in this range over the next few years.”
The appreciation of the Swiss Franc over the last year and the need to “support economic activity” were given as other reasons for reducing interest rates.
The Swiss economy saw its GDP growth sliced almost in half in 2023 when it recorded only a 1.3% expansion compared to 2.5% in 2022, according to its 2023 Annual Report. Lower interest rates will make it cheaper for businesses to borrow capital and a weaker Swiss Franc for them to export their wares abroad.
The decision somewhat surprised markets, who had only rated the chances of a cut at about one in three prior to the event, according to Reuters.
The bank also revised down its forecasts for future inflation and foresaw constraints to growth coming from a still-strong Swiss Franc and weaker demand from abroad.
Technical Analysis: Swiss Franc extends break out from range against US Dollar
The USD/CHF, which measures the buying power of a single US Dollar in Swiss Francs, is trading in the 0.8960s after penetrating the top of a range – between roughly 0.8900 and 0.8740 – it had been yo-yoing within since the middle of February.
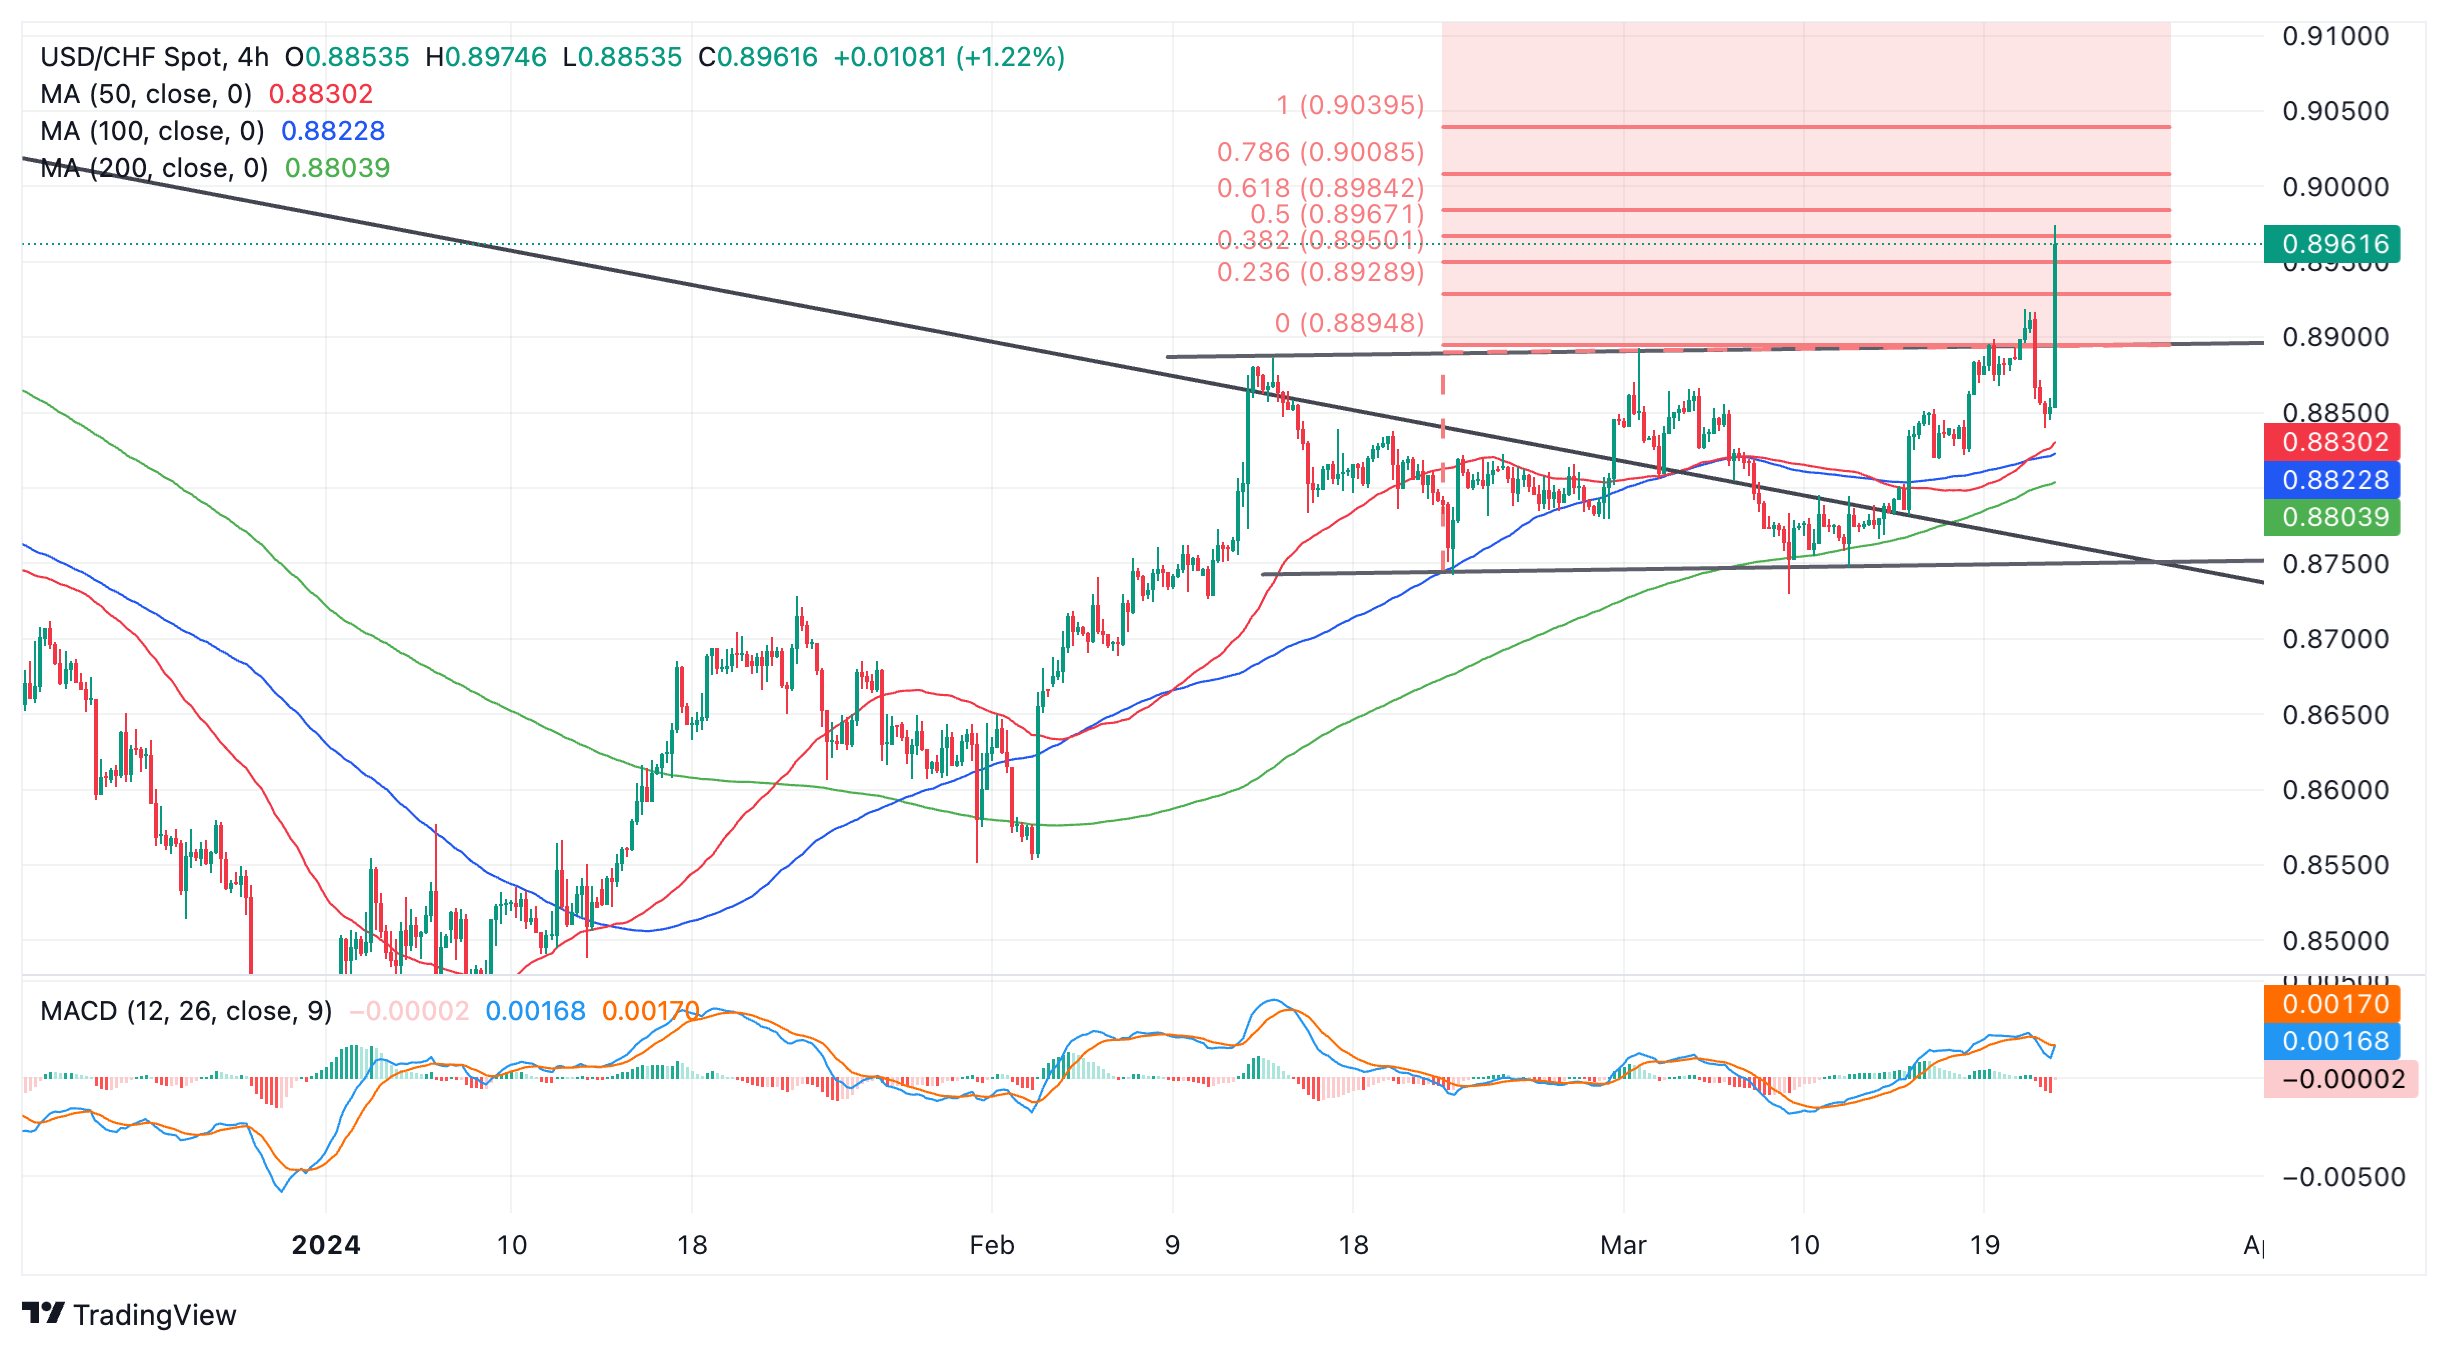
US Dollar versus Swiss Franc: 4-hour chart
The current move marks a decisive break above the range highs at 0.8900 and a continuation of the previous short-term uptrend.
The usual technical method for forecasting range breakouts is to take the height of the range and extrapolate higher from the breakout. This activates an initial target at 0.8992, the 0.618 Fibonacci (Fib) ratio of the height of the range extrapolated higher, followed by 0.9052, the full height extrapolated higher.
If the pair continues the strong performance into the end of the week and closes near or above the current level it will have confirmed a decisive break above the 50-week Simple Moving Average (SMA) – a formidable obstacle. It has also now convincingly broken above a long-term trendline, another bullish sign.
A break back below 0.8900 range high, however, would spoil the party and bring into doubt the validity of the breakout.
A move below the range low at 0.8729 could indicate a short-term trend reversal and the start of a deeper slide.
The first target for such a move would be the 0.618 Fib. extrapolation of the height of the range at 0.8632, followed by the full extrapolation at 0.8577, which is also close to the 0.8551 January 31 lows, another key support level to the downside.
SNB FAQs
The Swiss National Bank (SNB) is the country’s central bank. As an independent central bank, its mandate is to ensure price stability in the medium and long term. To ensure price stability, the SNB aims to maintain appropriate monetary conditions, which are determined by the interest rate level and exchange rates. For the SNB, price stability means a rise in the Swiss Consumer Price Index (CPI) of less than 2% per year.
The Swiss National Bank (SNB) Governing Board decides the appropriate level of its policy rate according to its price stability objective. When inflation is above target or forecasted to be above target in the foreseeable future, the bank will attempt to tame excessive price growth by raising its policy rate. Higher interest rates are generally positive for the Swiss Franc (CHF) as they lead to higher yields, making the country a more attractive place for investors. On the contrary, lower interest rates tend to weaken CHF.
Yes. The Swiss National Bank (SNB) has regularly intervened in the foreign exchange market in order to avoid the Swiss Franc (CHF) appreciating too much against other currencies. A strong CHF hurts the competitiveness of the country’s powerful export sector. Between 2011 and 2015, the SNB implemented a peg to the Euro to limit the CHF advance against it. The bank intervenes in the market using its hefty foreign exchange reserves, usually by buying foreign currencies such as the US Dollar or the Euro. During episodes of high inflation, particularly due to energy, the SNB refrains from intervening markets as a strong CHF makes energy imports cheaper, cushioning the price shock for Swiss households and businesses.
The SNB meets once a quarter – in March, June, September and December – to conduct its monetary policy assessment. Each of these assessments results in a monetary policy decision and the publication of a medium-term inflation forecast.
Economists at TD Securities discuss the Bank of England Interest Rate Decision and its implications for the GBP/USD pair.
Hawkish Hold (15%)
Most of the Policy Summary is unchanged from February. But echoing Pill's recent comments, it adds a line that the majority of the MPC still thinks that rate cuts remain ‘some way off’, effectively ruling out a May cut, and putting June into serious question. GBP/USD +0.50%.
Neutral Hold (65%)
The MPC leaves almost all key guidance unchanged from February's Policy Summary, especially ‘policy needs to be restrictive for an extended period of time until the risk of inflation becoming embedded above the 2% target dissipates’. There is a very slight marking to market to acknowledge softer underlying inflation data owing to recent downside surprises on inflation, wages, and growth. GBP/USD -0.15%.
Dovish Hold (20%)
The MPC downgrades the February Policy Summary element about underlying inflation to something along the lines of ‘key indicators of inflation persistence have improved in recent months’. Elsewhere, language around policy remaining "restrictive for an extended period of time’ is also adjusted to suggest that the MPC is starting to think more seriously about rate cuts. This scenario effectively is a signal from the MPC that May is a live meeting. Another scenario that drives a similar message would be to see a core Deputy Governor (e.g. Broadbent) vote for a cut. GBP/USD -0.80%.
- UK Manufacturing PMI rose to 49.9 in March, beating estimates of 47.8.
- Services PMI in the UK unexpectedly dropped to 53.4 in March.
- GBP/USD stays offered near 1.2770 after mixed UK business PMIs.
The seasonally adjusted S&P Global/CIPS UK Manufacturing Purchasing Managers’ Index (PMI) improved sharply from 47.5 in February to 49.9 in March, above the estimated 47.8 reading.
Meanwhile, the Preliminary UK Services Business Activity Index declined to 53.4 in March, missing the market forecast of 53.8. The previous figure was 53.8.
Commenting on the flash PMI data, Chris Williamson, Chief Business Economist at S&P Global Market Intelligence said: “Further signs of the UK economy having pulled out of last year's brief recession are provided by the provisional PMI data for March. A further robust expansion of business activity ended the economy’s best quarter since the second quarter of last year.”
“The survey data are indicative of first-quarter GDP rising 0.25% to thereby signal a reassuringly solid rebound from the technical recession seen in the second half of 2023,” Chris added.
FX implications
GBP/USD is consolidating the latest decline to near 1.2700 following the mixed UK PMI data. The pair is currently trading at 1.2776, down 0.05% so far.
Pound Sterling price today
The table below shows the percentage change of Pound Sterling (GBP) against listed major currencies today. Pound Sterling was the weakest against the Australian Dollar.
| USD | EUR | GBP | CAD | AUD | JPY | NZD | CHF | |
| USD | 0.30% | 0.17% | 0.13% | -0.14% | 0.25% | 0.06% | 0.89% | |
| EUR | -0.31% | -0.13% | -0.16% | -0.45% | -0.07% | -0.23% | 0.59% | |
| GBP | -0.17% | 0.13% | -0.04% | -0.31% | 0.06% | -0.10% | 0.72% | |
| CAD | -0.13% | 0.17% | 0.03% | -0.30% | 0.09% | -0.06% | 0.76% | |
| AUD | 0.16% | 0.44% | 0.31% | 0.28% | 0.37% | 0.21% | 1.03% | |
| JPY | -0.21% | 0.05% | -0.08% | -0.12% | -0.37% | -0.16% | 0.64% | |
| NZD | -0.06% | 0.24% | 0.11% | 0.07% | -0.20% | 0.17% | 0.84% | |
| CHF | -0.90% | -0.54% | -0.75% | -0.77% | -1.07% | -0.60% | -0.86% |
The heat map shows percentage changes of major currencies against each other. The base currency is picked from the left column, while the quote currency is picked from the top row. For example, if you pick the Euro from the left column and move along the horizontal line to the Japanese Yen, the percentage change displayed in the box will represent EUR (base)/JPY (quote).
- AUD/JPY extends its winning streak on positive employment figures from Australia.
- Australian Employment Change increased to 116.5K compared to the expected 40.0K in February.
- JPY weakens on the BoJ’s indication of accommodative financial conditions.
AUD/JPY continues to extend its gains that began on March 15, trading higher around 99.90 during the European session on Thursday. The Australian Dollar (AUD) maintained its upward trajectory supported by positive economic data from Australia, bolstering the AUD/JPY cross.
However, the Australian equity market moved back and forth but closed in positive territory, further reinforcing the AUD's gains. The ASX 200 Index experienced a surge, following a rally on Wall Street from the previous session.
In February, the seasonally adjusted Employment Change saw a significant surge to 116.5K, surpassing expectations of 40.0K and the previous figure of 15.3K. Moreover, the Unemployment Rate increased by 3.7%, below the anticipated 4.0% and the previous 4.1%.
Australia's private sector demonstrated resilience in March, extending its expansion for the second consecutive month. The preliminary Judo Bank Services PMI rose to 53.5 from the previous 53.1, indicating continued growth in the services sector. Additionally, the Composite PMI increased to 52.4 from 52.1, reflecting a broad-based expansion in services.
However, there was a decline in the Manufacturing PMI, dropping to 46.8 from the previous 47.8. This contraction suggests a slowdown in manufacturing activity during the same period, potentially influenced by various factors such as supply chain disruptions or weakening demand.
The Japanese Yen (JPY) faces losses amidst the prevailing risk-on sentiment. The Bank of Japan (BoJ) recently indicated that financial conditions would remain accommodative, refraining from guiding future policy steps or the pace of policy normalization.
Chief Cabinet Secretary Yoshimasa Hayashi of Japan stated on Thursday that he is closely monitoring foreign exchange (FX) movements with urgency. He emphasized the need to closely observe the impact on both the Japanese and global economies following the Federal Reserve's decision.
The US Dollar (USD) dropped after the FOMC meeting revealed a Fed committed to rate cuts. Economists at ING analyze Greenback’s outlook.
The start of an important new trend for the Dollar, should US price data soften
Financial markets have reacted positively to a soft landing scenario, where the Fed seems biased to cut rates even though the economy is doing quite well.
For the Dollar, we think this could be the start of something important. we have felt the second quarter would be the period when a meaningful USD bear trend would start to develop in advance of the first Fed cut.
Additionally, seasonal factors are less Dollar-supportive from April onwards. It is a big if, but if the March US price data does start to edge lower – validating the Fed's scepticism over high early-year inflation – then we can start to see a Dollar bear trend gain momentum over the coming months.
We doubt US data will be a big market mover today and see DXY staying gently offered.
Following the decision to lower the policy rate to 1.50%, Swiss National Bank (SNB) Chairman Thomas Jordan said that the “easing of monetary policy was possible because fight against inflation has been effective.”
Key quotes
Inflation is likely to remain in target range over the next few years.
See lower second round effects from inflation.
Uncertainty still elevated, will adjust policy again if necessary.
Price momentum has slowed more quickly than expected in December.
Swiss growth likely to remain modest in coming quarters.
Weak foreign demand and Franc appreciation has had dampening effect.
Remain willing to be active in forex market as necessary.
Interest rate cuts is 100% compatible with our framework.
We have much lower inflationary pressure than 3 months ago.
We give no forward guidance on future interest rates, will see where we are in 3 months time.
Rate cut is not a leaving gift, we always make the right decisions.
We always make our monetary decisions independently of what other central banks do.
Market reaction to SBN Jordan's comments
USD/CHF is off the multi-month highs but holding 1% higher on the day at around 0.8960.
Swiss Franc price today
The table below shows the percentage change of Swiss Franc (CHF) against listed major currencies today. Swiss Franc was the weakest against the Australian Dollar.
| USD | EUR | GBP | CAD | AUD | JPY | NZD | CHF | |
| USD | 0.42% | 0.27% | 0.22% | -0.08% | 0.26% | 0.13% | 1.17% | |
| EUR | -0.43% | -0.16% | -0.21% | -0.51% | -0.20% | -0.28% | 0.74% | |
| GBP | -0.27% | 0.15% | -0.05% | -0.34% | -0.03% | -0.12% | 0.91% | |
| CAD | -0.23% | 0.19% | 0.05% | -0.31% | 0.02% | -0.07% | 0.94% | |
| AUD | 0.07% | 0.49% | 0.35% | 0.29% | 0.31% | 0.23% | 1.24% | |
| JPY | -0.27% | 0.16% | 0.02% | -0.05% | -0.32% | -0.10% | 0.91% | |
| NZD | -0.14% | 0.28% | 0.15% | 0.08% | -0.23% | 0.12% | 1.05% | |
| CHF | -1.18% | -0.76% | -0.92% | -0.97% | -1.28% | -0.92% | -1.05% |
The heat map shows percentage changes of major currencies against each other. The base currency is picked from the left column, while the quote currency is picked from the top row. For example, if you pick the Euro from the left column and move along the horizontal line to the Japanese Yen, the percentage change displayed in the box will represent EUR (base)/JPY (quote).
- Eurozone Manufacturing PMI dropped to 45.7 in March, missing estimates of 47.0
- Bloc’s Services PMI climbed to 51.1 in March at vs. 50.5 anticipated.
- EUR/USD stays directed toward 1.08500 after German, Eurozone PMI data.
The Eurozone manufacturing sector activity downturn extended while the services sector continued to expand in March, according to the data from the HCOB's latest purchasing managers index survey released on Thursday.
The Eurozone Manufacturing Purchasing Managers Index (PMI) arrived at 45.7 in March, as against the consensus forecast of 47.0 and the 46.5 recorded in February. The index fell to a three-month low.
The bloc’s Services PMI rose to 51.1 in March from 50.2 in February, hitting a fresh nine-month high while beating the estimate of 50.5.
The HCOB Eurozone PMI Composite increased to 49.9 in March vs. 49.7 expected and February’s 46.3 print. The index also set a nine-month top.
EUR/USD reaction to the Eurozone PMIs data
EUR/USD is consolidating the latest leg down near 1.0890 after mixed Eurozone PMIs. The spot is down 0.25% on the day, at the press time.
Euro price today
The table below shows the percentage change of Euro (EUR) against listed major currencies today. Euro was the weakest against the Australian Dollar.
| USD | EUR | GBP | CAD | AUD | JPY | NZD | CHF | |
| USD | 0.42% | 0.26% | 0.20% | -0.09% | 0.28% | 0.12% | 1.17% | |
| EUR | -0.43% | -0.15% | -0.20% | -0.51% | -0.15% | -0.29% | 0.75% | |
| GBP | -0.26% | 0.15% | -0.06% | -0.35% | 0.00% | -0.13% | 0.90% | |
| CAD | -0.21% | 0.21% | 0.05% | -0.30% | 0.05% | -0.08% | 0.96% | |
| AUD | 0.10% | 0.51% | 0.35% | 0.31% | 0.35% | 0.22% | 1.25% | |
| JPY | -0.28% | 0.13% | -0.02% | -0.07% | -0.39% | -0.14% | 0.88% | |
| NZD | -0.12% | 0.30% | 0.14% | 0.08% | -0.21% | 0.17% | 1.05% | |
| CHF | -1.18% | -0.76% | -0.91% | -0.96% | -1.27% | -0.89% | -1.06% |
The heat map shows percentage changes of major currencies against each other. The base currency is picked from the left column, while the quote currency is picked from the top row. For example, if you pick the Euro from the left column and move along the horizontal line to the Japanese Yen, the percentage change displayed in the box will represent EUR (base)/JPY (quote).
- USD/CHF gains ground on SNB’s decision to reduce interest rates by 25 bps on Thursday.
- The Swiss National Bank (SNB) has opted to reduce interest rates in response to significant declines in both inflation and growth over the past year.
- Fed projects a higher long-term policy rate through December, increasing to 2.6% from the previous projection of 2.5%.
USD/CHF has rebounded from intraday losses and shifted into positive territory following the Swiss National Bank's (SNB) decision to cut interest rates by 25 basis points (bps) to 1.50% in its March meeting held on Thursday. As a result, the USD/CHF pair trades higher around 0.8960 during the European session.
SNB has reduced interest rates due to substantial declines in both inflation and growth over the last year. The Swiss National Bank (SNB) projects inflation to average 1.9% in 2024. Currently, the inflation rate is notably lower than this forecast, standing at 1.2%. However, there was a significant increase in the Consumer Price Index (CPI) in February, rising by 0.6% compared to the previous month's increase of 0.2%.
The Federal Reserve is now projecting a higher long-term policy rate through December, ticking up to 2.6% from 2.5%. However, despite the Fed's optimistic growth expectations, markets are seemingly shrugging off these projections, leading to a decline in the value of the US Dollar (USD).
The US Dollar Index (DXY) hovers around 103.30, mainly influenced by weaker US Treasury yields. Yields for the 2-year and 10-year bond coupons have fallen to 4.59% and 4.25%, respectively. This decline is attributed to the US Federal Reserve's (Fed) reaffirmation of expectations for three interest rate cuts this year.
Even though the Federal Open Market Committee (FOMC) projects stronger growth throughout 2024 and 2025 than initially anticipated, investor sentiment indicates expectations of additional easing measures in 2024.
Economists at ING analyze how the Bank of England (BoE) meeting could impact the Pound Sterling (GBP).
Unchanged forward guidance can help the Pound
We do not expect the BoE to change its forward guidance today. And assuming the MPC voting pattern remains the same as February, 2 (hike), 6 (unchanged), 1 (cut), GBP/USD should stay bid and perhaps push up to resistance in the 1.2850/1.2900 area. We doubt one of the votes for a hike shifting to an unchanged position has to hit the Pound.
The above scenario suggests that EUR/GBP could take another look at major support at 0.8500. However, we retain a view that this should be the medium-term base and that EUR/GBP will gently rise through the year once the BoE starts to elaborate on its easing plans over the coming months.
- Germany’s Manufacturing PMI dropped to 46.1 in March vs. 43.1 estimate.
- Services PMI for the German economy rose to 49.8 in March vs. 48.8 expected.
- EUR/USD falls below 1.0900 after mixed German PMIs.
Germany’s manufacturing sector experienced deeper contraction in March while the services sector performance improved, the preliminary business activity report published by the HCOB survey showed Thursday.
The HCOB Manufacturing PMI in the Eurozone’s economic powerhouse deteriorated to 41.6 this month, as against the 43.1 forecast and February’s 42.5. The index hit the lowest level in five months.
Meanwhile, Services PMI rose from 48.3 in February to 49.8 in March, missing the expected 48.8 figure in the reported period. The measure touched a fresh six-month high.
The HCOB Preliminary German Composite Output Index stood at 47.4 in March vs. 47.0 expected and 46.3 previous reading. The gauge rebounded to a three-month high.
FX implications
EUR/USD is losing ground below 1.0900 following mixed German data, currently trading 0.21% lower on the day at 1.0894.
Euro price today
The table below shows the percentage change of Euro (EUR) against listed major currencies today. Euro was the strongest against the Swiss Franc.
| USD | EUR | GBP | CAD | AUD | JPY | NZD | CHF | |
| USD | 0.39% | 0.28% | 0.17% | -0.15% | 0.45% | 0.10% | 1.18% | |
| EUR | -0.35% | -0.07% | -0.22% | -0.54% | 0.04% | -0.24% | 0.83% | |
| GBP | -0.24% | 0.11% | -0.11% | -0.43% | 0.15% | -0.17% | 0.94% | |
| CAD | -0.14% | 0.25% | 0.11% | -0.29% | 0.26% | -0.06% | 1.04% | |
| AUD | 0.19% | 0.58% | 0.44% | 0.32% | 0.57% | 0.26% | 1.37% | |
| JPY | -0.37% | -0.08% | -0.17% | -0.27% | -0.59% | -0.31% | 0.74% | |
| NZD | -0.05% | 0.34% | 0.15% | 0.07% | -0.25% | 0.35% | 1.13% | |
| CHF | -1.19% | -0.80% | -0.91% | -0.97% | -1.35% | -0.75% | -1.10% |
The heat map shows percentage changes of major currencies against each other. The base currency is picked from the left column, while the quote currency is picked from the top row. For example, if you pick the Euro from the left column and move along the horizontal line to the Japanese Yen, the percentage change displayed in the box will represent EUR (base)/JPY (quote).
Following its quarterly monetary policy assessment on Thursday, the Swiss National Bank (SNB) board members decided to cut the benchmark Sight Deposit Rate by 25 basis points (bps) from 1.75% to1.50%.
The rate decision came in as a surprise to the markets.
Summary of the SNB policy statement
Momentum on the mortgage and real estate markets has weakened noticeably in recent quarters. However, the vulnerabilities in these markets remain.
The weak demand from abroad and the appreciation of the Swissfranc in real terms over the past year are having a dampening effect.
In this environment, unemployment is likely to continue to rise gradually, and the utilization of production capacity is likely to decline somewhat further.
Banks’ sight deposits held at the SNB will be remunerated at the SNB policy rate up to a certain threshold, and at 1.0% above this threshold.
This scenario for the global economy is still subject to significant risks. Inflation could remain elevated for longer in some countries, necessitating a tighter monetary policy there than expected in the baseline scenario.
The SNB also remains willing to be active in the foreign exchange market as necessary.
The new conditional inflation forecast is significantly lower than that of December.
The easing of monetary policy has been made possible because the fight against inflation over the past two and a half years has been effective.
In theshort term, this is above all due to the fact that price momentum in the case of some categoriesof goods has slowed more quickly than had been expected in December .
According to the new forecast, inflation is also likely to remain in this range over the next few years.
Global economic growth is likely to remain moderate in the coming quarters.
The weak demand from abroad and the appreciation of the swiss franc in real terms over the past year are having a dampening effect.
Inflation is currently being drivenabove all by higher prices for domestic services.
Our forecast for switzerland, as for the global economy, is subject to significant uncertainty.
Market reaction to the SNB interest rate decision
In a knee-jerk reaction to the unexpected SNB rate cut decision, the USD/CHF pair nearly 100 pips to 0.8975 before easing slightly to 0.8965, where it now wavers. The pair is up 0.95% on the day.
SNB FAQs
The Swiss National Bank (SNB) is the country’s central bank. As an independent central bank, its mandate is to ensure price stability in the medium and long term. To ensure price stability, the SNB aims to maintain appropriate monetary conditions, which are determined by the interest rate level and exchange rates. For the SNB, price stability means a rise in the Swiss Consumer Price Index (CPI) of less than 2% per year.
The Swiss National Bank (SNB) Governing Board decides the appropriate level of its policy rate according to its price stability objective. When inflation is above target or forecasted to be above target in the foreseeable future, the bank will attempt to tame excessive price growth by raising its policy rate. Higher interest rates are generally positive for the Swiss Franc (CHF) as they lead to higher yields, making the country a more attractive place for investors. On the contrary, lower interest rates tend to weaken CHF.
Yes. The Swiss National Bank (SNB) has regularly intervened in the foreign exchange market in order to avoid the Swiss Franc (CHF) appreciating too much against other currencies. A strong CHF hurts the competitiveness of the country’s powerful export sector. Between 2011 and 2015, the SNB implemented a peg to the Euro to limit the CHF advance against it. The bank intervenes in the market using its hefty foreign exchange reserves, usually by buying foreign currencies such as the US Dollar or the Euro. During episodes of high inflation, particularly due to energy, the SNB refrains from intervening markets as a strong CHF makes energy imports cheaper, cushioning the price shock for Swiss households and businesses.
The SNB meets once a quarter – in March, June, September and December – to conduct its monetary policy assessment. Each of these assessments results in a monetary policy decision and the publication of a medium-term inflation forecast.
- EUR/USD rallies after a dovish hold by the Fed weakens the US Dollar.
- The Fed continues to expect to make three 0.25% interest rate cuts in 2024, same as December.
- Eurozone PMI data to give the latest assessment of the region’s economic well being.
EUR/USD is trading back up in the 1.0900s on Thursday, after surging higher following the Federal Reserve (Fed) meeting. The US central bank maintained the policy status quo and slightly wrong-footed markets, which had been expecting a more hawkish shift in light of recent warmer-than-expected inflation.
EUR/USD corrects course after Fed maintains status quo
The Fed left the Fed Funds Rate unchanged at 5.25%-5.50% as widely expected but in its accompanying forecast document, the Summary of Economic Projections (SEP), it continued to foresee rates falling to a median target of 4.6% in 2024, like it did in December.
This is equivalent to expecting around three 25 bps (0.25%) of rate cuts this year, even though some market participants had speculated it might reduce the number of cuts to two because of stickier-than-expected inflation.
It did, however, see less rate cuts in 2025, with the Fed Funds Rate falling to a median of only 3.9% rather than the 3.6% in the December SEP.
The Fed revised up its GDP forecast substantially, to 2.1% for 2024, from 1.4% in December – regarded by many as indicative of a “soft landing”.
The central bank’s preferred gauge of inflation, the Core Personal Consumption Expenditure (PCE) – Price Index, was revised up to 2.6% for 2024 from 2.4% in December.
In his press conference after the meeting, Federal Reserve Chairman Jerome Powell sought to play down the latest batch of hot inflation readings, saying only two months of data was not enough to dissuade the Fed from its path.
The overall interpretation was of a “dovish hold,” which resulted in the US Dollar selling off from overbought territory. The EUR/USD pair, which measures the buying power of a single Euro (EUR) in US Dollars (USD), rallied back up into familiar territory.
European PMI data ahead
The next key release for the EUR/USD pair is the Eurozone March Purchasing Manager Indices (PMI) from S&P Global and Hamburg Commercial Bank (HCOB), out at 10:00 GMT on Thursday.
The flash estimate will provide the latest snapshot of economic health in the region.
HCOB Composite PMI for the Eurozone is expected to show a rise to 49.7 in March from 49.2 in February, the Services PMI is forecast to come out at 50.5 from 50.2, and Manufacturing at 47.0 from 46.5 previously,
A higher-than-expected result would likely be bullish for EUR/USD and vice versa for a lower-than-expected result.
Technical Analysis: EUR/USD returns to the 1.0900s
EUR/USD reversed on a dime at around the level of the 200-day Simple Moving Average (SMA) in the 1.0830s and surged higher after the Fed meeting. It is now back up in the 1.0900s and seems to be trading in a range, with no real bias one way or another.
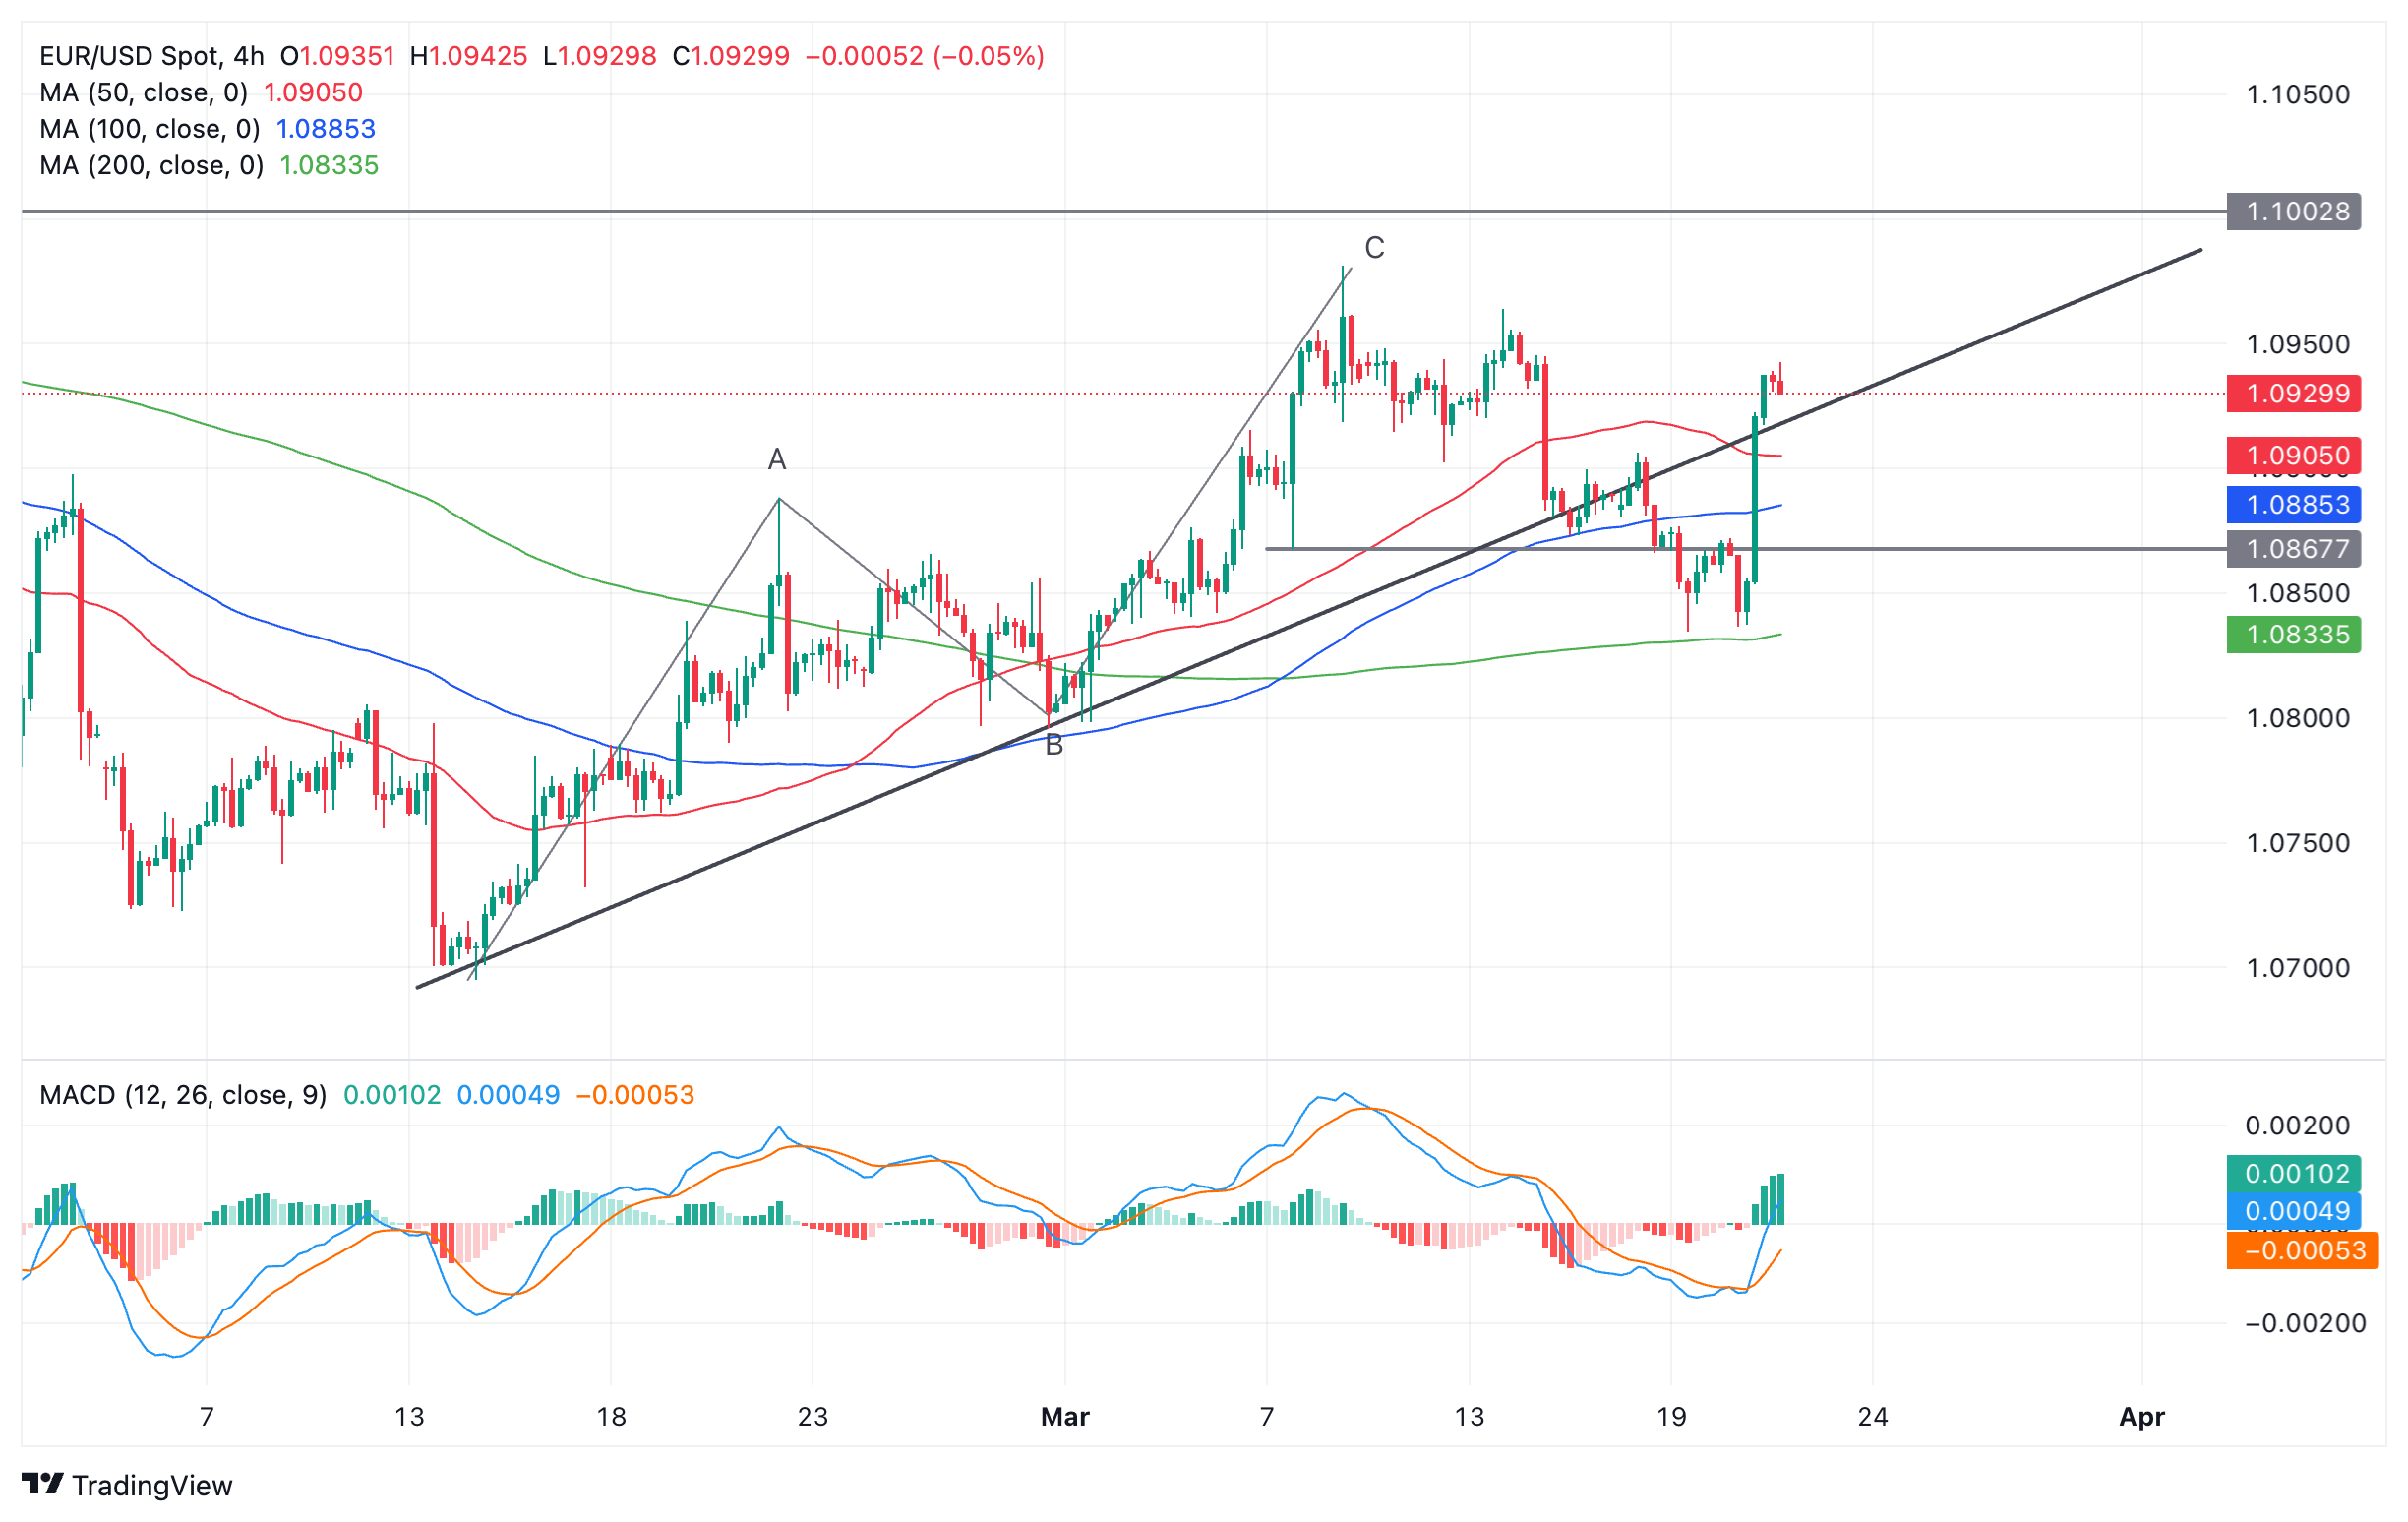
Euro versus US Dollar: 4-hour chart
The reversal at Wednesday’s lows continues to show momentum, however, and if price pushes higher it will probably meet resistance at the 1.0964 March 13 highs. If it breaks above them the March 8 highs for the month come into view at 1.0981. A break above them would turn the outlook bullish again.
Alternatively, the up move could petter out and price could also fall back down to target the 50-day SMA in the 1.0840s followed by the 200-day again in the 1.0830s.
Euro FAQs
The Euro is the currency for the 20 European Union countries that belong to the Eurozone. It is the second most heavily traded currency in the world behind the US Dollar. In 2022, it accounted for 31% of all foreign exchange transactions, with an average daily turnover of over $2.2 trillion a day. EUR/USD is the most heavily traded currency pair in the world, accounting for an estimated 30% off all transactions, followed by EUR/JPY (4%), EUR/GBP (3%) and EUR/AUD (2%).
The European Central Bank (ECB) in Frankfurt, Germany, is the reserve bank for the Eurozone. The ECB sets interest rates and manages monetary policy. The ECB’s primary mandate is to maintain price stability, which means either controlling inflation or stimulating growth. Its primary tool is the raising or lowering of interest rates. Relatively high interest rates – or the expectation of higher rates – will usually benefit the Euro and vice versa. The ECB Governing Council makes monetary policy decisions at meetings held eight times a year. Decisions are made by heads of the Eurozone national banks and six permanent members, including the President of the ECB, Christine Lagarde.
Eurozone inflation data, measured by the Harmonized Index of Consumer Prices (HICP), is an important econometric for the Euro. If inflation rises more than expected, especially if above the ECB’s 2% target, it obliges the ECB to raise interest rates to bring it back under control. Relatively high interest rates compared to its counterparts will usually benefit the Euro, as it makes the region more attractive as a place for global investors to park their money.
Data releases gauge the health of the economy and can impact on the Euro. Indicators such as GDP, Manufacturing and Services PMIs, employment, and consumer sentiment surveys can all influence the direction of the single currency. A strong economy is good for the Euro. Not only does it attract more foreign investment but it may encourage the ECB to put up interest rates, which will directly strengthen the Euro. Otherwise, if economic data is weak, the Euro is likely to fall. Economic data for the four largest economies in the euro area (Germany, France, Italy and Spain) are especially significant, as they account for 75% of the Eurozone’s economy.
Another significant data release for the Euro is the Trade Balance. This indicator measures the difference between what a country earns from its exports and what it spends on imports over a given period. If a country produces highly sought after exports then its currency will gain in value purely from the extra demand created from foreign buyers seeking to purchase these goods. Therefore, a positive net Trade Balance strengthens a currency and vice versa for a negative balance.
- Silver price advances toward 11-month high at $26.14 as the US Dollar weakens.
- Fed’s projections for three rate cuts this year remain unabated.
- The market sentiment turns bullish on higher expectations for the Fed reducing interest rates from June.
Silver price (XAG/USD) extends its upside to $25.70 in Thursday’s European session. The white metal is an inch away from reclaiming an 11-month high at $26.14. The appeal for precious metals has strengthened after the Federal Reserve’s (Fed) monetary policy announcement on Wednesday.
For the fifth time in a row, the Fed kept key borrowing rates unchanged in the range of 5.25%-5.50%, as expected. The appeal of the US Dollar weakened after the Fed stuck with three rate cut projections for this year. This led to a significant increase in market expectations for the Fed to lower interest rates from the June meeting.
According to the CME FedWatch tool, the chances for a rate cut have increased to almost 75% from 59%, which was recorded before the Fed’s policy announcement. Expectations for Fed rate cuts in June rose significantly despite the Fed's failure to provide any meaningful timeframe for rate cuts, as it lacks evidence that inflation will sustainably decline to the 2% target.
Meanwhile, the demand for risk-sensitive assets improves as investors seem confident that rate cuts will start in June. S&P 500 futures have posted significant gains in the London session. 10-year US Treasury yields have dropped slightly to 4.26%. The US Dollar Index (DXY) recovers intraday losses but broadly seems weak.
Silver technical analysis
Silver price approaches the 11-month high at $26.14. The near-term demand is bullish as the 20-day Exponential Moving Average (EMA) at $24.35 is sloping higher. The 14-period Relative Strength Index (RSI) oscillates in the bullish range of 60.00-80.00, indicating that momentum leans towards the upside. Bullish momentum remains unabated as the momentum oscillator is still far from turning overbought.
If the Silver price breaks above its 11-month high at $26.14, it will discover more upside. This would open upside towards the 8 March 2022 high at $26.95, followed by the 15 September 2020 high at $27.83.
In an alternate scenario, a breakdown below December 22 high at $24.61 would expose the asset to 12 March low at $24.00 and January 30 high at $23.30.
Silver daily chart
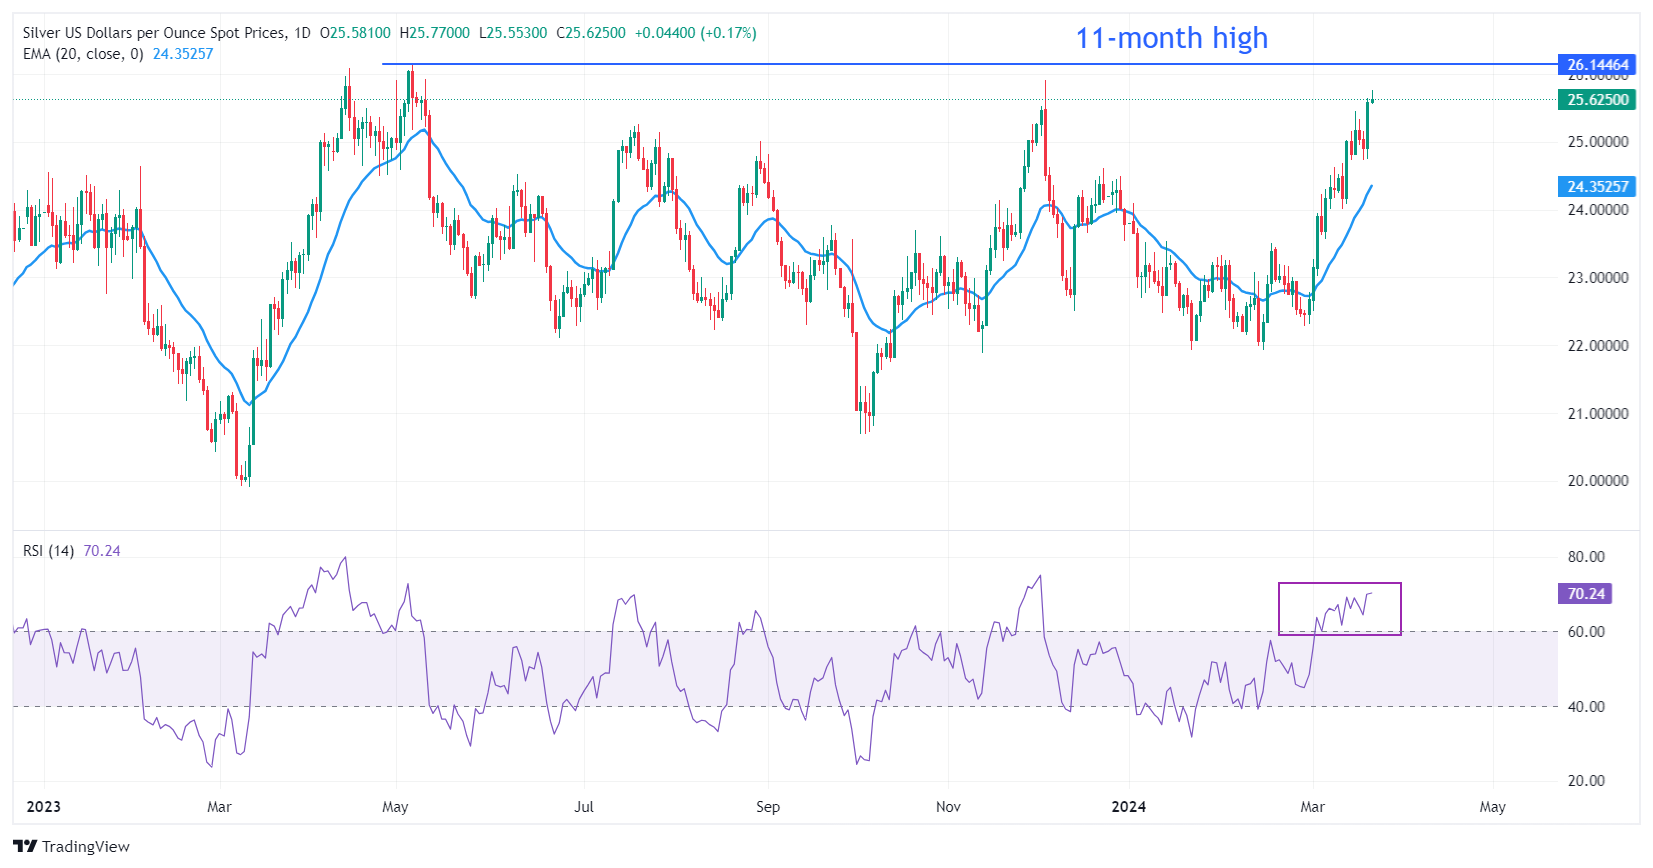
Economists at Commerzbank analyze how Norges Bank’s Interest Rate Decision could impact the Norwegian Krone (NOK).
NOK to remain unchanged if Norges Bank remains moderately restrictive
If Norges Bank remains moderately restrictive and does not surprise the market by bringing forward interest rate cuts, the effect on the Norwegian Krone should be neutral to slightly positive.
If, on the other hand, there is any indication of much earlier interest rate cuts (à la Riksbank), I would expect significant losses in the Norwegian Krone.
- The Pound Sterling rallies to 1.2800 ahead of BoE’s policy decision.
- February’s soft UK inflation report could allow the BoE to deliver a slightly dovish guidance.
- The US Dollar weakens as the Fed keeps forecasting three rate cuts this year.
The Pound Sterling (GBP) exhibits strength in Thursday’s London session ahead of the Bank of England’s interest rate decision, prompted by investors’ higher risk appetite. The GBP/USD pair saw a juggernaut rally as the Federal Reserve (Fed) stuck to the forecast of three rate cuts for this year, which weakened investors’ appeal for the US Dollar (USD).
The BoE is widely anticipated to keep interest rates unchanged at 5.25% as the United Kingdom’s core Consumer Price Index (CPI), which is the preferred inflation measure of policymakers, is growing by more than twice the required rate of 2%. Investors will look for cues about when the BoE will start lowering key borrowing rates. Currently, expectations are firm for a rate cut in the August policy meeting.
BoE’s guidance on interest rates could be slightly dovish as price pressures grew at a slower pace than market expectations in February. Annual headline and core inflation softened to 3.4% and 4.5%, respectively. The UK Office for National Statistics (ONS) reported that “Food and prices at eateries were the biggest downward drags, offset by motor fuels.”
It will be interesting to watch whether recent soft inflation figures have changed the views of Monetary Policy Committee (MPC) members Catherine Mann and Jonathan Haskel. Both of them have been voting for a further interest-rate hike in recent meetings even as the majority of the MPC decided to keep rates on hold at 5.25% in the past four policy meetings.
Daily digest market movers: Pound Sterling extends upside as US Dollar weakens
- The Pound Sterling advances to the round-level resistance of 1.2800 amid a cheerful market mood. The appeal for risk-sensitive assets strengthened after the Federal Reserve maintained its projections of three rate cuts for this year in its monetary policy meeting on Wednesday. Fed policymakers didn’t dial down their rate-cut projections despite inflation remaining hotter than expected in February.
- The Fed continued with its argument that rate cuts are appropriate only if it gains greater confidence that inflation will sustainably decline to the 2% target. However, it mentioned that the underlying story of price pressures moving in the right direction has not changed despite the recent acceleration in inflation.
- Going forward, the Pound Sterling is expected to face intense volatility as the Bank of England will announce the interest rate decision at 12:00 GMT. The BoE is expected to keep its interest rates unchanged at 5.25% for the fifth time in a row. Investors will closely pay attention to vote pattern from policymakers, particularly from Catherine Mann and Jonathan Haskel, who have been favoring more interest rate hikes.
- The BoE is expected to maintain the argument that rate cuts should be considered only after gaining confidence that inflation will sustainably return to 2%. However, February’s inflation readings, released on Wednesday, could have strengthened their confidence that inflation is moving in the right direction. This could allow them to discuss when to begin reducing interest rates.
- UK stubborn inflation has been driven by high service inflation, which is fed by strong wage growth. Investors will keenly focus on the wage growth outlook as earnings are increasing at a higher pace than what is required to bring down inflation sustainably to 2%.
Technical Analysis: Pound Sterling climbs to 1.2800
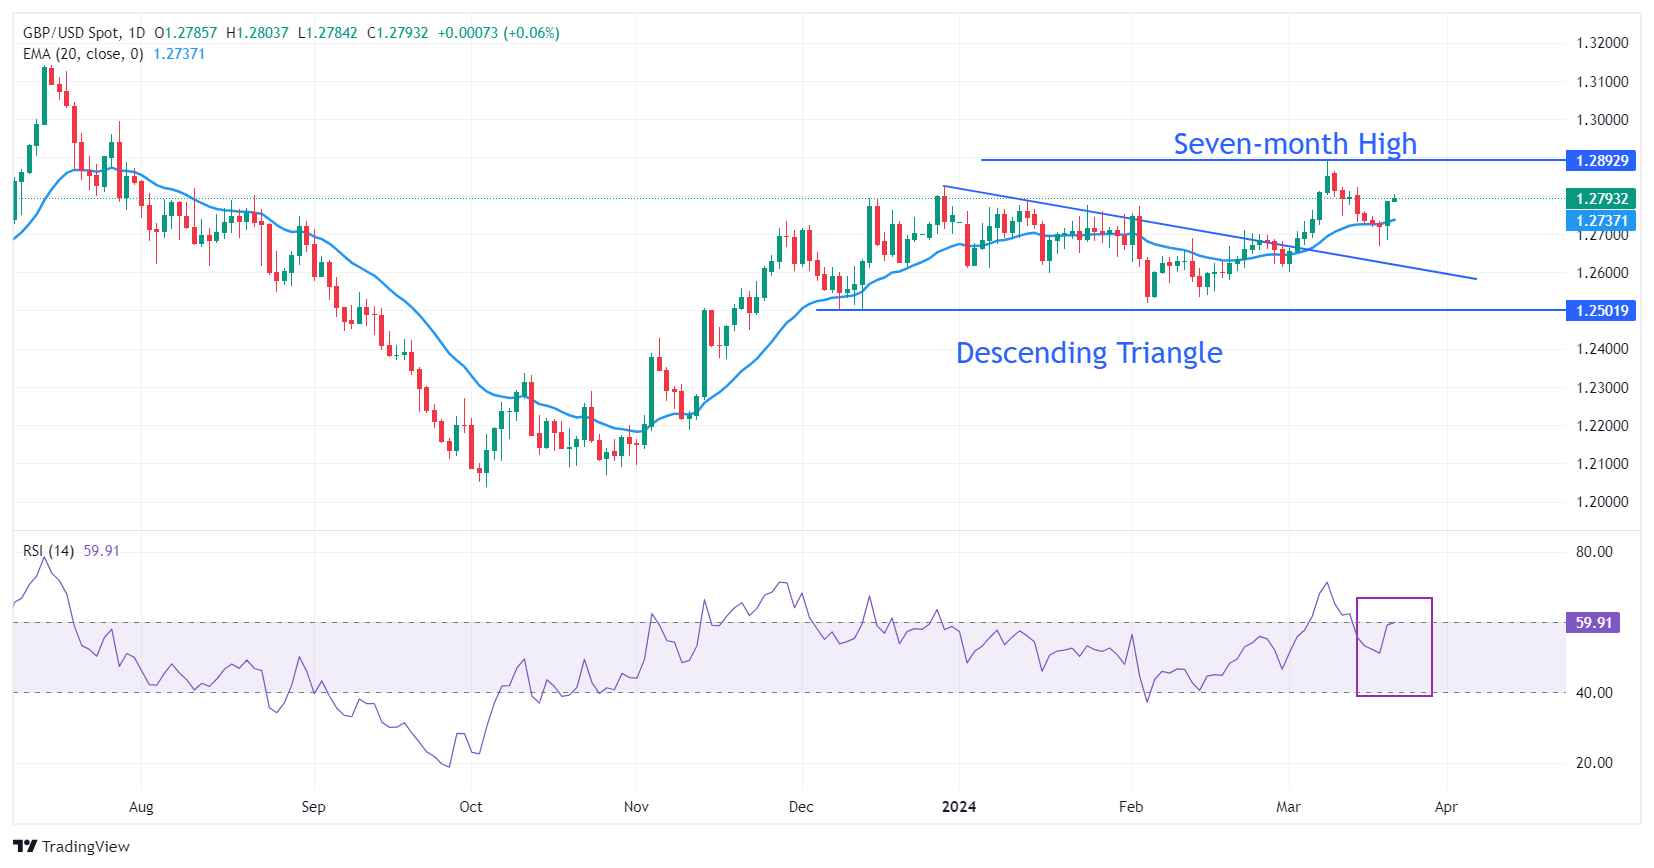
The Pound Sterling soars to the round-level resistance of 1.2800 amid risk-on sentiment. The GBP/USD pair delivered a strong recovery after discovering buying interest near the breakout region of the Descending Triangle formed around 1.2700. The near-term demand for the GBP/USD pair turns bullish as it rebounds above the 20-day Exponential Moving Average (EMA), which trades around 1.2740.
On the downside, the downward-sloping border of the Descending Triangle chart pattern will support the pair. On the upside, a seven-month high at around 1.2900 will be a major barricade for the Cable.
The 14-period Relative Strength Index (RSI) climbs above 60.00. If the RSI (14) manages to sustain above that level, bullish momentum will trigger.
Pound Sterling FAQs
The Pound Sterling (GBP) is the oldest currency in the world (886 AD) and the official currency of the United Kingdom. It is the fourth most traded unit for foreign exchange (FX) in the world, accounting for 12% of all transactions, averaging $630 billion a day, according to 2022 data. Its key trading pairs are GBP/USD, aka ‘Cable’, which accounts for 11% of FX, GBP/JPY, or the ‘Dragon’ as it is known by traders (3%), and EUR/GBP (2%). The Pound Sterling is issued by the Bank of England (BoE).
The single most important factor influencing the value of the Pound Sterling is monetary policy decided by the Bank of England. The BoE bases its decisions on whether it has achieved its primary goal of “price stability” – a steady inflation rate of around 2%. Its primary tool for achieving this is the adjustment of interest rates. When inflation is too high, the BoE will try to rein it in by raising interest rates, making it more expensive for people and businesses to access credit. This is generally positive for GBP, as higher interest rates make the UK a more attractive place for global investors to park their money. When inflation falls too low it is a sign economic growth is slowing. In this scenario, the BoE will consider lowering interest rates to cheapen credit so businesses will borrow more to invest in growth-generating projects.
Data releases gauge the health of the economy and can impact the value of the Pound Sterling. Indicators such as GDP, Manufacturing and Services PMIs, and employment can all influence the direction of the GBP. A strong economy is good for Sterling. Not only does it attract more foreign investment but it may encourage the BoE to put up interest rates, which will directly strengthen GBP. Otherwise, if economic data is weak, the Pound Sterling is likely to fall.
Another significant data release for the Pound Sterling is the Trade Balance. This indicator measures the difference between what a country earns from its exports and what it spends on imports over a given period. If a country produces highly sought-after exports, its currency will benefit purely from the extra demand created from foreign buyers seeking to purchase these goods. Therefore, a positive net Trade Balance strengthens a currency and vice versa for a negative balance.
EUR/USD has risen above 1.0900. Economists at ING analyze the pair’s outlook.
European equities enjoy prospects of a lower trajectory for global policy rates
EUR/USD has been lifted by the weaker Dollar, though looks unlikely to outperform. Typically the bullish steepening of the US curve sees EUR/AUD come lower. This has been the case – although helped by some exceptionally strong Australian employment data.
EUR/USD looks as though it can drift up to the 1.0980/1.1000 region as European equities also enjoy prospects of a lower trajectory for global policy rates.
- NZD/USD could test the psychological support of 0.6100 on Thursday.
- Technical analysis indicates a bearish momentum for the pair.
- The area around the 23.6% Fibonacci retracement level and the 21-day EMA could act as a resistance zone.
NZD/USD continues to gain ground for the second consecutive day, which could be attributed to the dovish remarks by the Federal Reserve. The pair trades above the psychological support of 0.6100 during the early European session on Thursday.
A decisive move below this level could exert downward pressure on the NZD/USD pair to navigate the area around the major support of 0.6050.
A break below the latter could lead the NZD/USD pair to revisit March’s low at 0.6024, followed by the psychological support at 0.6000. Traders will closely monitor these levels for potential shifts in market sentiment.
According to the Moving Average Convergence Divergence (MACD) analysis, a prevailing downward sentiment is indicated for the NZD/USD pair. This is evidenced by the MACD line positioned below both the centerline and the signal line, signaling a bearish trend. Furthermore, the 14-day Relative Strength Index (RSI) is below the 50 level, providing additional confirmation of the bearish sentiment.
On the upside, the NZD/USD pair could find a key barrier lies at the 23.6% Fibonacci retracement level at 0.6115, aligned with the 21-day Exponential Moving Average (EMA) at 0.6118. The pair could face further resistance barriers if it climbs higher, with key levels anticipated at 0.6150.
NZD/USD: Daily Chart
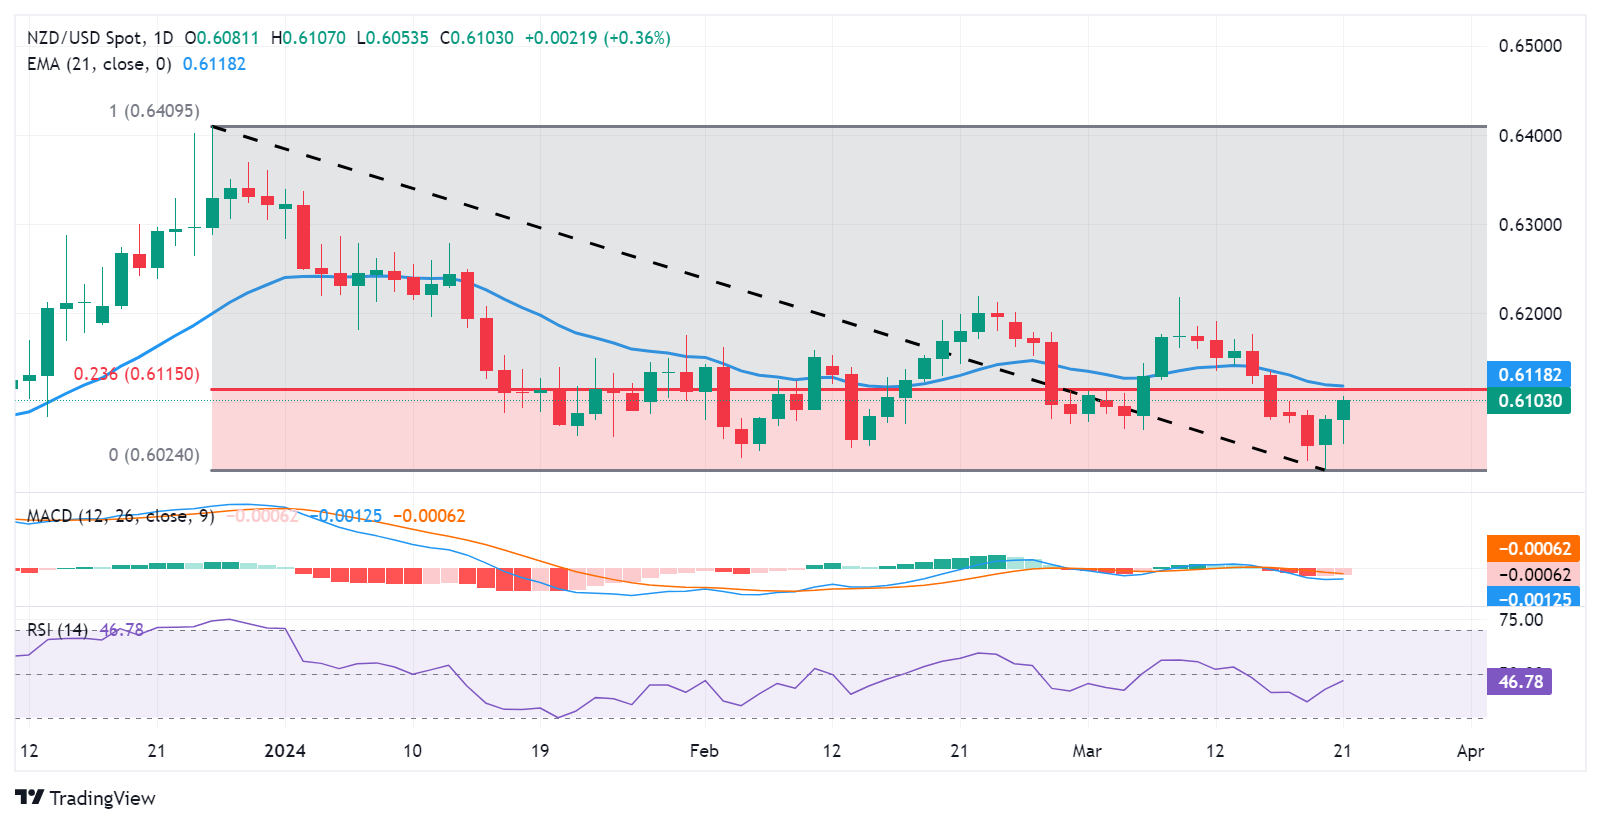
The Bank of England (BoE) will announce its Interest Rate Decision on Thursday, March 21 at 12:00 GMT and as we get closer to the release time, here are the expectations forecast by the economists and researchers of seven major banks.
The BoE is widely expected to leave interest rates unchanged at 5.25% for the fifth time in a row. Investors will look for cues about when the BoE will start reducing interest rates.
Rabobank
We anticipate that the BoE will hold the rate at 5.25%. We may see another three-way split in the vote. The current guidance already suggests the next move is likely to be a cut. We don’t think that the MPC will drop a strong hint on the timing of that cut at this meeting. Labour gradually shifts from a seller’s market to a buyer’s market. However, wage growth and services inflation currently remain inconsistent with a sustained 2% inflation. We think the BoE will trail behind the Fed and the ECB, with the first rate cut expected in September. This is still anticipated to occur well before core inflation is on track to reach 2%.
TDS
We expect the MPC to leave key guidance largely unchanged and hold Bank Rate at 5.25% at this meeting, with a wait-and-see message. There's scope to soften the language around underlying inflation, but little else should change.
Danske Bank
We expect the BoE to keep the Bank Rate unchanged at 5.25%. Overall, we expect the MPC to repeat its previous communication relying on a data dependent approach. We expect a muted reaction in EUR/GBP with risks tilted to the topside.
ING
We expect the BoE to reiterate its previous forward guidance that rates need to stay sufficiently restrictive for an extended period. Watering down that language would be seen as tantamount to opening the door to an imminent rate cut, something we doubt the committee wants to do. The more interesting question is whether the two hawks who voted for a rate hike in February finally throw in the towel, though we wouldn’t be surprised if at least one of them doesn’t. At the same time, we don’t expect lone dove Swati Dhingra to be joined by other members in voting for a rate cut this month. Our view is that the first rate cut will come in August, once the inflation data for the second quarter has come through.
Wells Fargo
Technical recession and progress on inflation likely mean BoE policymakers are considering rate cuts in the coming months, although we expect the BoE to remain on hold this week. UK disinflation has been gradual which likely means the BoE delivers rate cuts in Q2. As of now, we believe the BoE will deliver its first cut at the June meeting. We would note, however, that progress on disinflation and subdued activity at least raises the possibility that BoE easing could be delivered earlier than we expect. Not as early as March, but the March meeting could indicate as to when policymakers are thinking about the timing of a pivot to easing monetary policy.
Citi
We expect the MPC to hold rates steady this week, with the main move likely to be on the vote split – where hawkish dissent is likely to thin further.
SocGen
We expect the MPC to maintain its message that it needs further evidence that disinflation is on track before it starts easing. Recent statements from MPC members and the fact that key April wage data will be released after the May meeting have led us to push back our projection of a first rate cut to June.
Here is what you need to know on Thursday, March 21:
The US Dollar (USD) suffered large losses against its major rivals in the American session on Wednesday as investors reacted to the Federal Reserve's (Fed) policy decisions and Fed Chairman Jerome Powell's remarks on the policy outlook. The USD struggled to find demand early Thursday. Investors await the Bank of England's (BoE) policy announcements and S&P Global PMI data for Germany, the Euro area, the UK and the US. The US economic docket will also feature the weekly Initial Jobless Claims and Existing Home Sales data for February.
The Fed's revised Summary of Projections showed that policymakers still expect a total of 75 basis points reduction in the policy rate in 2024. In the post-meeting press conference, Chairman Powell downplayed inflation concerns and put additional weight on the USD's shoulders. Powell noted that inflation numbers were "quite high" in January and February but said that they have not changed the overall story on disinflation, arguing that they were higher due to seasonal effects. The benchmark 10-year US Treasury bond yield declined toward 4.25% and Wall Street's main indexes rallied following the Fed event. In turn, the USD Index lost nearly 0.5% and snapped a four-day winning streak. Early Thursday, US stock index futures trade in positive territory and the USD Index stays in the red below 103.50.
Jerome Powell speaks on policy outlook after leaving interest rate unchanged.
US Dollar price this week
The table below shows the percentage change of US Dollar (USD) against listed major currencies this week. US Dollar was the weakest against the Australian Dollar.
| USD | EUR | GBP | CAD | AUD | JPY | NZD | CHF | |
| USD | -0.49% | -0.48% | -0.61% | -1.05% | 1.40% | -0.12% | 0.23% | |
| EUR | 0.48% | 0.01% | -0.12% | -0.57% | 1.87% | 0.36% | 0.71% | |
| GBP | 0.48% | -0.01% | -0.12% | -0.56% | 1.87% | 0.36% | 0.70% | |
| CAD | 0.61% | 0.12% | 0.12% | -0.45% | 1.99% | 0.48% | 0.83% | |
| AUD | 1.04% | 0.56% | 0.55% | 0.44% | 2.41% | 0.92% | 1.26% | |
| JPY | -1.42% | -1.92% | -1.85% | -2.03% | -2.48% | -1.53% | -1.18% | |
| NZD | 0.11% | -0.37% | -0.34% | -0.46% | -0.93% | 1.54% | 0.33% | |
| CHF | -0.22% | -0.71% | -0.71% | -0.83% | -1.27% | 1.18% | -0.35% |
The heat map shows percentage changes of major currencies against each other. The base currency is picked from the left column, while the quote currency is picked from the top row. For example, if you pick the Euro from the left column and move along the horizontal line to the Japanese Yen, the percentage change displayed in the box will represent EUR (base)/JPY (quote).
During the Asian trading hours, the data from Australia showed that the Unemployment Rate declined to 3.7% in February from 4.1% in January. This reading came in better than the market expectation of 4%. Employment Change was up 116.5K in this period, surpassing analysts' estimate of 40K by a wide margin. AUD/USD extended its rally early Thursday after posting strong gains on Wednesday and it was last seen rising more than 0.5% on the day above 0.6620.
Australia’s Unemployment Rate drops to 3.7% in February vs. 4.0% expected.
Australian Dollar stretches higher amid a weaker US Dollar, awaits US PMI data.
USD/JPY gathered bullish momentum and came within a touching distance of 152.00 in the American session on Wednesday. The pair staged a deep correction in the early Asian session and declined below 150.50 before regaining its traction. At the time of press, the pair was trading marginally lower on the day near 151.00. Japanese Finance Minister Shunichi Suzuki said earlier in the day that they are closely watching the action in foreign exchange markets with a sense of urgency. In the meantime, Bank of Japan Governor Kazuo Ueda said that they expect to maintain the accommodative monetary policy for the time being.
Japanese Yen trims a part of strong intraday gains against USD, not out of the woods yet.
The Bank of England is widely expected to leave the policy rate unchanged at 5.25% after March policy meeting. The statement language following the soft UK inflation data and the vote split will be scrutinized by market participants for fresh clues on the timing of the policy pivot. GBP/USD rose 0.5% on Wednesday and was last seen trading near 1.2800.
USD/CHF closed modestly lower on Wednesday and edged lower toward 0.8850 early Thursday. The Swiss National Bank (SNB) will announce the interest rate decision at 08:30 GMT.
SNB Preview: A rate cut would further undermine the outlook for the CHF – Rabobank.
Gold gathered bullish momentum and climbed to a new all-time high of $2,222 in the Asian session on Thursday before retreating toward $2,200.
Gold price sticks to gains above $2,200 mark, bulls take a brief pause amid risk-on.
EUR/USD rallied above 1.0900 late Wednesday and continued to push higher early Thursday. The pair was last seen trading slightly below 1.0950.
Central banks FAQs
Central Banks have a key mandate which is making sure that there is price stability in a country or region. Economies are constantly facing inflation or deflation when prices for certain goods and services are fluctuating. Constant rising prices for the same goods means inflation, constant lowered prices for the same goods means deflation. It is the task of the central bank to keep the demand in line by tweaking its policy rate. For the biggest central banks like the US Federal Reserve (Fed), the European Central Bank (ECB) or the Bank of England (BoE), the mandate is to keep inflation close to 2%.
A central bank has one important tool at its disposal to get inflation higher or lower, and that is by tweaking its benchmark policy rate, commonly known as interest rate. On pre-communicated moments, the central bank will issue a statement with its policy rate and provide additional reasoning on why it is either remaining or changing (cutting or hiking) it. Local banks will adjust their savings and lending rates accordingly, which in turn will make it either harder or easier for people to earn on their savings or for companies to take out loans and make investments in their businesses. When the central bank hikes interest rates substantially, this is called monetary tightening. When it is cutting its benchmark rate, it is called monetary easing.
A central bank is often politically independent. Members of the central bank policy board are passing through a series of panels and hearings before being appointed to a policy board seat. Each member in that board often has a certain conviction on how the central bank should control inflation and the subsequent monetary policy. Members that want a very loose monetary policy, with low rates and cheap lending, to boost the economy substantially while being content to see inflation slightly above 2%, are called ‘doves’. Members that rather want to see higher rates to reward savings and want to keep a lit on inflation at all time are called ‘hawks’ and will not rest until inflation is at or just below 2%.
Normally, there is a chairman or president who leads each meeting, needs to create a consensus between the hawks or doves and has his or her final say when it would come down to a vote split to avoid a 50-50 tie on whether the current policy should be adjusted. The chairman will deliver speeches which often can be followed live, where the current monetary stance and outlook is being communicated. A central bank will try to push forward its monetary policy without triggering violent swings in rates, equities, or its currency. All members of the central bank will channel their stance toward the markets in advance of a policy meeting event. A few days before a policy meeting takes place until the new policy has been communicated, members are forbidden to talk publicly. This is called the blackout period.
- EUR/JPY trims gains near 165.15 amid renewed JPY demand.
- The potential of another hike from BoJ before the end of the year lifts the Japanese Yen.
- ECB's Lagarde said policymakers will consider cutting rates in June, as data available by June will confirm the path of inflation.
- The German and Eurozone HCOB PMI for March are due on Thursday.
The EUR/JPY cross trades on a softer note above the 165.00 mark during the early European trading hours on Thursday. The downtick of the cross is supported by the possibility of another rate hike by the Bank of Japan (BoJ) and the fear of FX intervention from the Japanese authorities. Traders await the preliminary German and Eurozone HCOB Purchasing Managers Index (PMI) data for March for fresh impetus. At the press time, EUR/JPY is trading at 165.15, losing 0.03% on the day.
The Bank of Japan (BoJ) hiked interest rates for the first time in 17 years on Tuesday, and investors are questioning if the BOJ will raise rates again this year and, if so, how much and how rapidly. Meanwhile, the Nikkei newspaper reported that an early rate hike allows for the potential of another hike before the end of the year. This, in turn, provides support for the Japanese Yen (JPY) against the Euro (EUR).
Furthermore, the verbal intervention from the Japanese authorities might boost the JPY and cap the upside of the EUR/JPY in the near term. Early Thursday, Japanese Finance Minister Shunichi Suzuki said that he will watch foreign exchange moves with a high sense of urgency while adding that it's important for currencies to move in a stable manner.
On the Euro front, European Central Bank (ECB) President Christine Lagarde stated on Wednesday that policymakers will consider cutting interest rates in the June meeting as data available by June will provide more insight into the inflation trajectory and the labor market condition. Money markets expect three rate cuts from the ECB by December, along with a potential fourth, according to Reuters.
The HCOB Purchasing Managers Index (PMI) from Germany and the Eurozone is due on Thursday, followed by the German Buba Monthly Report. On Friday, the Japanese National Consumer Price Index (CPI) for February will be released. The Core CPI inflation ex Fresh Food is expected to show an increase of 2.8% in February from 2.0% in January. Traders will take cues from these events and find trading opportunities around the EUR/JPY cross.
FX option expiries for Mar 21 NY cut at 10:00 Eastern Time, via DTCC, can be found below
- EUR/USD: EUR amounts
- 1.0900 2.7b
- 1.0990 1.9b
- USD/JPY: USD amounts
- 150.00 573m
- AUD/USD: AUD amounts
- 0.6500 1b
- The UK central bank is expected to keep its policy rate unchanged at 5.25%.
- The Bank of England is seen reducing its rates earlier than estimated after softer-than-expected inflation data.
- GBP/USD will closely follow the BoE’s decision as well as the Minutes.
The Bank of England (BoE) is set to hold its policy rate for a fifth meeting in a row on Thursday amidst some recent pick-up in speculation over interest rate cuts by the central bank.
Bank of England predicted keeping the “wait-and-see” mode
The Bank of England is expected to leave the benchmark interest rate unchanged at 5.25% following its policy meeting on Thursday at 12:00 GMT. The bank’s decision on the policy rate will come in tandem with the release of the Monetary Policy Minutes.
While market participants originally expected the BoE to lag both the Federal Reserve (Fed) and the European Central Bank (ECB) in kick-starting their easing cycles, the persistent disinflationary pressures not only accelerated in the UK in February, but also seem to have now underpinned the view of an earlier commencement of the interest rate reductions.
Speaking about inflation, the headline Consumer Price Index (CPI) in the UK rose by 3.4% in the year to February and 4.5% when it came to the Core CPI, that is, excluding food and energy costs.
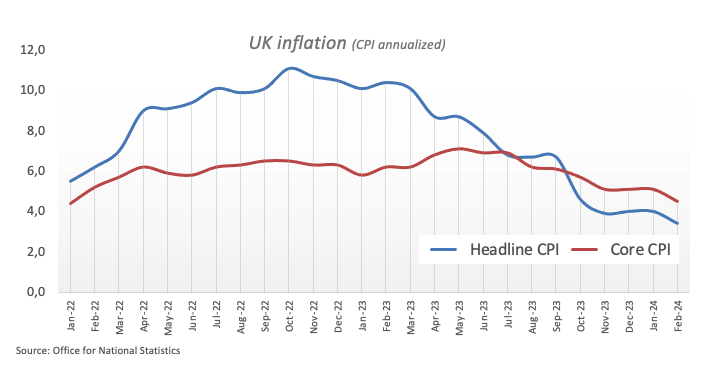
In fact, these latest UK inflation figures appear to put to the test the insofar “higher for longer” narrative by the BoE. Looking at the upcoming event, a decision to maintain rates unchanged is anticipated to be a done deal, while the central bank is also expected to extend its “wait-and-see” stance and probably drop some cautious tone regarding its inflation outlook.
Still around inflation, the latest BoE’s Decision Maker Panel survey (DMP) indicated that businesses anticipate a decrease in their output price inflation over the upcoming year. Furthermore, one-year ahead CPI inflation expectations declined to 3.3% in February, down from 3.4% in January, while the expected year-ahead wage growth remained steady at 5.2%. In addition, three-year ahead CPI inflation expectations dropped to 2.8% from 2.9%.
BoE’s Governor Andrew Bailey emphasized on March 12 that the pivotal issue revolves around the restrictiveness of policy, adding that the central question is the duration for which this restrictive stance needs to be maintained. He expressed satisfaction with the effectiveness of monetary policy, noting that inflation expectations seem firmly anchored. Additionally, Bailey noted that there has been minimal evidence indicating a rise in unemployment as a prerequisite for inflation reduction, while concerns regarding the entrenchment of second-round effects have diminished.
Ahead of the BoE gathering, analysts at TD Securities said, “We expect the MPC to hold its Bank Rate at 5.25% and leave key guidance largely unchanged, with a wait-and-see message. There's scope to soften the language around underlying inflation, but little else should change”.
How will the BoE interest rate decision impact the GBP/USD?
In light of the latest inflation figures, the probability of a hawkish hold by the central bank now looks markedly dwindled. That said, an outcome in line with market expectations should leave the Pound Sterling (GBP) trading within its familiar ranges, or even spark some fresh bouts of weakness in the very near future.
In that case, GBP/USD could decisively break below the key 200-day SMA at 1.2592, allowing for extra selling pressure to kick in. “Further losses could see Cable revisit the 2024 low of 1.2518 recorded on February 5," notes FXStreet Senior Analyst Pablo Piovano. Pablo adds that “a sustained breach of the latter is not contemplated for the time being, as it would involve a bigger deterioration of the currency’s outlook.”
On the upside, Pablo points at “the initial resistance at the YTD peak of 1.2893 (March 8). The surpassing of this level could prompt GBP/USD to embark on a move to, initially, the psychological 1.3000 yardstick.”
Economic Indicator
United Kingdom BoE Interest Rate Decision
The Bank of England (BoE) announces its interest rate decision at the end of its eight scheduled meetings per year. If the BoE is hawkish about the inflationary outlook of the economy and raises interest rates it is usually bullish for the Pound Sterling (GBP). Likewise, if the BoE adopts a dovish view on the UK economy and keeps interest rates unchanged, or cuts them, it is seen as bearish for GBP.
Read more.Pound Sterling price today
The table below shows the percentage change of Pound Sterling (GBP) against listed major currencies today. Pound Sterling was the weakest against the Australian Dollar.
| USD | EUR | GBP | CAD | AUD | JPY | NZD | CHF | |
| USD | 0.11% | 0.07% | -0.03% | -0.06% | 0.40% | 0.21% | 0.31% | |
| EUR | -0.11% | -0.03% | -0.13% | -0.14% | 0.30% | 0.11% | 0.21% | |
| GBP | -0.07% | 0.03% | -0.11% | -0.12% | 0.32% | 0.13% | 0.25% | |
| CAD | 0.03% | 0.14% | 0.14% | -0.02% | 0.43% | 0.25% | 0.35% | |
| AUD | 0.04% | 0.15% | 0.13% | 0.01% | 0.44% | 0.26% | 0.35% | |
| JPY | -0.40% | -0.29% | -0.33% | -0.44% | -0.42% | -0.19% | -0.09% | |
| NZD | -0.22% | -0.11% | -0.14% | -0.25% | -0.27% | 0.18% | 0.10% | |
| CHF | -0.33% | -0.20% | -0.24% | -0.36% | -0.38% | 0.07% | -0.08% |
The heat map shows percentage changes of major currencies against each other. The base currency is picked from the left column, while the quote currency is picked from the top row. For example, if you pick the Euro from the left column and move along the horizontal line to the Japanese Yen, the percentage change displayed in the box will represent EUR (base)/JPY (quote).
- GBP/USD trades on a stronger note near 1.2790 ahead of the BoE rate decision.
- The pair keeps the bullish vibe above the key EMA; RSI indicator lies above the 50 midlines.
- The immediate upside barrier is seen at the 1.2800 mark; the initial support level is located at 1.2735.
The GBP/USD pair holds positive ground below the 1.2800 psychological barrier during the early European session on Thursday. The weaker US Dollar (USD) following the Federal Reserve interest rate decision provides some support to the major pair. GBP/USD currently trades around 1.2790, up 0.04% on the day.
The US Fed held the rate steady at 5.25–5.50% at its March meeting on Wednesday, with the median dot plot for 2024 unchanged from the 75 basis points (bps) of cuts reported in the December projections. Investors will closely watch the Bank of England (BoE) monetary policy meeting on Thursday, with no change in rate expected.
According to the four-hour chart, GBP/USD resumes its upside as the major pair bounces above the key 100-period Exponential Moving Average (EMA). Additionally, the Relative Strength Index (RSI) lies above the 50 midlines, supporting the buyers for the time being.
The immediate upside barrier for the major pair is seen near the confluence of the upper boundary of the Bollinger Band and a psychological level of 1.2800. A decisive break above the latter will see a rally to a high of March 14 at 1.2823, en route to a high of March 11 at 1.2862, and finally the 1.2900 round mark.
On the other hand, the initial support level is located at the 100-period EMA at 1.2735. The additional downside filter to watch is a low of March 20 at 1.2684. Any follow-through selling will see a drop to the lower limit of the Bollinger Band at 1.2668.
GBP/USD four-hour chart
-638465937637686237.png)
- USD/CAD appreciates as the Fed reaffirms expectations for three interest rate cuts in 2024.
- Higher WTI price could have contributed to underpinning the Canadian Dollar.
- FOMC has projected stronger growth throughout 2024 and 2025 than initially anticipated.
USD/CAD moves downward to near 1.3470 during the Asian session on Thursday, extending its losses for the second successive day. The Canadian Dollar (CAD) likely found support from rising Crude oil prices.
West Texas Intermediate (WTI) crude oil prices edge higher, reaching close to $81.70 by the time of reporting. This increase may have bolstered the CAD, as the United States (US) Energy Information Administration (EIA) announced a second consecutive week of declines in Crude inventories, indicating strong demand in the world's largest oil consumer.
Meanwhile, the Bank of Canada's (BoC) Governing Council is considering potential rate cuts in 2024 should economic conditions align with forecasts. However, internal disagreements persist regarding the timing of such cuts and the risks associated with inflation. Governor Tiff Macklem remains cautious about immediate rate adjustments, citing concerns over underlying inflationary pressures.
At the time of writing, the US Dollar Index (DXY) has declined to approximately 103.20, primarily driven by weaker US Treasury yields. Yields for 2-year and 10-year bond coupons have fallen to 4.58% and 4.25%, respectively. This decrease can be attributed to the US Federal Reserve's (Fed) reaffirmation of expectations for three interest rate cuts this year.
The Federal Reserve maintained its interest rates at 5.5% during Wednesday's policy meeting. Investor sentiment continues to indicate expectations of additional easing measures in 2024, despite the Federal Open Market Committee (FOMC) projecting stronger growth throughout 2024 and 2025 than initially anticipated.
Notably, the FOMC's Dot Plot of interest rate expectations has shown an increase in the long tail end of the curve. Rates are now forecasted to reach approximately 3.1% by the end of 2026, compared to the previous projection of 2.9%.
- WTI regains some positive traction on Thursday and is supported by a combination of factors.
- The Fed’s projected three rate cuts in 2024 undermine the USD and benefit the black liquid.
- Worries about tightening global support prospects for a further near-term appreciating move.
West Texas Intermediate (WTI) US Crude Oil prices attract some dip-buying during the Asian session on Thursday and reverse a part of the previous day's losses. The commodity currently trades around the $81.70 region and remains well within the striking distance of over a four-month high touched earlier in the week.
The Federal Reserve (Fed) maintains its outlook for three interest rate cuts this year at the end of the March policy meeting on Wednesday. This is seen undermining the US Dollar (USD) and benefitting USD-denominated commodities, including Crude Oil prices. Moreover, Fed Chair Jerome Powell acknowledged strength in the US economy, which bodes well with a positive outlook for Oil demand and further lends support to the black liquid.
Adding to this, a larger-than-expected fall in the US crude inventories, along with potential supply shocks from geopolitical disruptions in Russia and the Middle East, suggests that the path of least resistance for Oil prices is to the upside. The official report published by the US Energy Information Administration (EIA) showed on Wednesday stockpiles declined unexpectedly by 2 million barrels to 445 million barrels during the week ended March 15.
Market participants now look to the release of the flash PMIs for cues about global economic health, which impacts fuel demand. This, along with the USD price dynamics, should produce short-term trading opportunities around Oil prices. The aforementioned fundamental backdrop, meanwhile, seems tilted firmly in favour of bullish traders, suggesting that any meaningful corrective decline could be seen as a buying opportunity and remain limited.
- Gold price gains strong positive traction for the second straight day and hits a fresh all-time high.
- The Fed’s projected three rate cuts this year weigh on the USD and benefit the yellow metal.
- The prevalent risk-on mood prompts some profit-taking amid slightly overbought conditions.
Gold price (XAU/USD) trims a part of its intraday gains to a fresh record high touched during the Asian session on Thursday, albeit holds in the positive territory for the second straight day and currently trades around the $2,200 mark. The Federal Reserve (Fed) indicated that it remains on track to cut interest rates by 75 basis points this year and eased market jitters that the central bank will lower its projection for the number of rate cuts to two amid stick inflation. This drags the US Dollar (USD) away from a two-week high touched on Wednesday and continues to benefit the non-yielding yellow metal.
That said, the prevalent risk-on environment – as depicted by an extension of the recent bullish run across the global equity markets – holds back traders from placing fresh bullish bets around the safe-haven Gold price. This, along with overbought conditions on the daily chart, further contributes to keeping a lid on the precious metal and prompts some profit-taking at higher levels. Nevertheless, the fundamental backdrop suggests that the path of least resistance for the XAU/USD remains to the upside, warranting some caution before positioning for any meaningful corrective fall in the near term.
Daily Digest Market Movers: Gold price remains well supported by the Fed’s rate-cut projection and a weaker US Dollar
- The Federal Reserve on Wednesday maintained its projection of three rate cuts for this year, which weighs on the US Dollar for the second straight day and lifts the Gold price to a fresh all-time peak.
- Policymakers now see the US economy to grow at 2.1% this year compared to 1.4% expected previously, and the jobless rate is seen at 4% by the end of this year, versus 4.1% anticipated in December.
- The Personal Consumption Expenditures Price Index, excluding food and energy, is projected to rise at a 2.6% rate by year-end, compared to the 2.4% increase in the previous quarterly economic projections.
- In the post-meeting press conference, Fed Chair Jerome Powell said that inflation is moving down gradually on a somewhat bumpy road; the recent high inflation readings kept officials on a cautious footing.
- According to the CME Group's FedWatch Tool, traders are now pricing in a greater chance, around 75%, that the Fed will begin cutting interest rates at the June policy meeting, up from 59% on Tuesday.
- This leads to a modest decline in the US Treasury bond yields, dragging the US Dollar to a one-week low during the Asian session on Thursday and lending some support to the precious metal.
- A slightly overbought condition on the daily chart prompts some profit-taking at higher levels amid a positive tone around the equity markets, which tends to undermine the safe-haven XAU/USD.
Technical Analysis: Gold price bulls need to wait for some consolidation or a pullback before placing fresh bets
From a technical perspective, the overnight strong positive move confirmed a breakout through a bullish flag chart pattern and validated the positive outlook for the Gold price. That said, the Relative Strength Index (RSI) has moved back above the 70 mark, making it prudent to wait for some near-term consolidation or a modest pullback before traders start positioning for any further appreciating move. Nevertheless, the broader setup supports prospects for an extension of the recent well-established strong uptrend witnessed over the past month or so.
Meanwhile, any meaningful corrective decline below the $2,200-2,190 region is likely to attract fresh buyers and remain limited near the $2,160-2,158 horizontal zone. This is followed by the weekly swing low, around the $2,146 area, which, if broken decisively, might prompt some technical selling and drag the Gold price further towards the next relevant support near the $2,128-2,127 zone. The XAU/USD could decline further, eventually dropping to the $2,100 round figure.
Gold FAQs
Gold has played a key role in human’s history as it has been widely used as a store of value and medium of exchange. Currently, apart from its shine and usage for jewelry, the precious metal is widely seen as a safe-haven asset, meaning that it is considered a good investment during turbulent times. Gold is also widely seen as a hedge against inflation and against depreciating currencies as it doesn’t rely on any specific issuer or government.
Central banks are the biggest Gold holders. In their aim to support their currencies in turbulent times, central banks tend to diversify their reserves and buy Gold to improve the perceived strength of the economy and the currency. High Gold reserves can be a source of trust for a country’s solvency. Central banks added 1,136 tonnes of Gold worth around $70 billion to their reserves in 2022, according to data from the World Gold Council. This is the highest yearly purchase since records began. Central banks from emerging economies such as China, India and Turkey are quickly increasing their Gold reserves.
Gold has an inverse correlation with the US Dollar and US Treasuries, which are both major reserve and safe-haven assets. When the Dollar depreciates, Gold tends to rise, enabling investors and central banks to diversify their assets in turbulent times. Gold is also inversely correlated with risk assets. A rally in the stock market tends to weaken Gold price, while sell-offs in riskier markets tend to favor the precious metal.
The price can move due to a wide range of factors. Geopolitical instability or fears of a deep recession can quickly make Gold price escalate due to its safe-haven status. As a yield-less asset, Gold tends to rise with lower interest rates, while higher cost of money usually weighs down on the yellow metal. Still, most moves depend on how the US Dollar (USD) behaves as the asset is priced in dollars (XAU/USD). A strong Dollar tends to keep the price of Gold controlled, whereas a weaker Dollar is likely to push Gold prices up.
- EUR/USD gains ground on dovish remarks from the Federal Reserve.
- Fed Chair Powell underscored the persistent nature of price growth remains a significant concern.
- ECB’s Lagarde underscored concerns regarding lower wage inflation.
EUR/USD extends its gains for the second consecutive session as the US Federal Reserve (Fed) maintained its benchmark rates at 5.5% during Wednesday's policy meeting. The pair rises to near 1.0930 during the Asian trading hours on Thursday.
In the post-meeting press conference, Federal Reserve (Fed) Chair Jerome Powell's remarks, indicating a dovish stance, further weighed down the Greenback. Powell underscored that while inflation is exhibiting signs of moderation, the persistent nature of price growth remains a significant concern that the Fed cannot overlook.
Investor sentiment reflects expectations of further easing measures in 2024, despite the Federal Open Market Committee (FOMC) projecting stronger growth throughout 2024 and 2025 than initially anticipated. Notably, the FOMC's Dot Plot of interest rate expectations also saw an uptick in the long tail end of the curve. The rate is forecasted to reach around 3.1% in end-2026, compared to the previous projection of 2.9%.
On the European front, President of the European Central Bank (ECB), Christine Lagarde, underscored concerns regarding lower wage inflation, a factor previously emphasized by the ECB as pivotal in determining future policy decisions.
Additionally, the Vice-President of the ECB, Luis de Guindos, cautioned against premature action, stating that a wait-and-see approach is warranted due to persistently high service inflation. Echoing this sentiment, ECB policymaker Pablo Hernandez de Cos hinted at the possibility of rate cuts in June, contingent upon incoming data.
- Indian Rupee recovers some lost ground on the softer US Dollar.
- The Fed remains on hold; dovish comments from Fed’s Powell during the press conference weighed on the Greenback.
- Market players await the Indian HSBC PMI and US S&P Global PMI data on Thursday.
Indian Rupee (INR) trades on a stronger note on Thursday amid the decline of the US Dollar (USD) after the Federal Reserve's (Fed) monetary policy meeting. The Fed held interest rates steady at its March meeting, as widely expected by the markets. Nonetheless, the dovish comments from Fed Chair Jerome Powell during the press conference have exerted some selling pressure on the Greenback and created a headwind for the USD/INR pair.
Moving on, traders will keep an eye on the Indian HSBC Manufacturing and Services Purchasing Managers Index (PMI), due on Thursday. The weaker-than-expected data might weigh on the INR and cap the pair's downside. On the US docket, the preliminary S&P Global PMI for March, the weekly Initial Jobless Claims, and Existing Home Sales will be released later.
Daily Digest Market Movers: Indian Rupee stays firm amid global influences
- Krishnamurthy Venkata Subramanian, India's executive director at the International Monetary Fund (IMF), stated on Wednesday that India needs to grow at 8% on a sustained basis to generate sufficient jobs to reduce poverty and inequality.
- The Reserve Bank of India (RBI) has projected GDP growth for the next financial year at 7%, based on improved household consumption and an upturn in the private capex cycle.
- The Fed held the rate steady at 5.25–5.50% at its March meeting on Wednesday, with the median dot plot for 2024 unchanged from the 75 basis points (bps) of cuts shown in the December projections.
- Fed Chair Jerome Powell noted during the press conference that strong labour market data wouldn’t deter the central bank from cutting rates. The Fed will wait for more evidence that inflation is sustainably moderating toward its 2% target.
- Investors have priced in a 75% odds that the Fed will start cutting the rate in the June meeting, according to the CME FedWatch Tool.
Technical Analysis: Indian Rupee remains capped within a long-term band
Indian Rupee trades strongly on the day. USD/INR faces rejection near the upper boundary of the descending trend channel and remains stuck within a multi-month-old descending trend channel around 82.60–83.15 since December 8, 2023.
In the near term, the bullish outlook of USD/INR remains intact as the pair holds above the key 100-day Exponential Moving Average (EMA) on the daily timeframe. The upward momentum is confirmed by the 14-day Relative Strength Index (RSI), which lies above the 50.0 midline, suggesting that further upside looks favorable.
The key upside barrier for the pair will emerge near the upper boundary of the descending trend channel at 83.15. A bullish breakout above this level could draw in USD/INR bulls and push the pair back to a high of January 2 at 83.35, followed by the 84.00 psychological level.
On the flip side, the first downside target is seen at the resistance-turned-support level at the 83.00 mark. Any follow-through selling below 83.00 could extend its downswing to a low of March 14 at 82.80. Further south, the next contention level is located at the lower limit of the descending trend channel at 82.60. A breach of this level might drag USD/INR to a low of August 23 at 82.45.
US Dollar price today
The table below shows the percentage change of US Dollar (USD) against listed major currencies today. US Dollar was the weakest against the Australian Dollar.
| USD | EUR | GBP | CAD | AUD | JPY | NZD | CHF | |
| USD | 0.00% | 0.01% | -0.04% | -0.36% | -0.21% | -0.11% | -0.10% | |
| EUR | -0.01% | 0.00% | -0.04% | -0.37% | -0.24% | -0.10% | -0.11% | |
| GBP | -0.01% | 0.00% | -0.05% | -0.36% | -0.24% | -0.09% | -0.11% | |
| CAD | 0.04% | 0.05% | 0.04% | -0.32% | -0.20% | -0.05% | -0.06% | |
| AUD | 0.36% | 0.34% | 0.36% | 0.32% | 0.12% | 0.27% | 0.25% | |
| JPY | 0.23% | 0.22% | 0.23% | 0.16% | -0.13% | 0.13% | 0.11% | |
| NZD | 0.11% | 0.11% | 0.11% | 0.07% | -0.26% | -0.11% | 0.01% | |
| CHF | 0.11% | 0.11% | 0.11% | 0.06% | -0.26% | -0.11% | -0.01% |
The heat map shows percentage changes of major currencies against each other. The base currency is picked from the left column, while the quote currency is picked from the top row. For example, if you pick the Euro from the left column and move along the horizontal line to the Japanese Yen, the percentage change displayed in the box will represent EUR (base)/JPY (quote).
Indian Rupee FAQs
The Indian Rupee (INR) is one of the most sensitive currencies to external factors. The price of Crude Oil (the country is highly dependent on imported Oil), the value of the US Dollar – most trade is conducted in USD – and the level of foreign investment, are all influential. Direct intervention by the Reserve Bank of India (RBI) in FX markets to keep the exchange rate stable, as well as the level of interest rates set by the RBI, are further major influencing factors on the Rupee.
The Reserve Bank of India (RBI) actively intervenes in forex markets to maintain a stable exchange rate, to help facilitate trade. In addition, the RBI tries to maintain the inflation rate at its 4% target by adjusting interest rates. Higher interest rates usually strengthen the Rupee. This is due to the role of the ‘carry trade’ in which investors borrow in countries with lower interest rates so as to place their money in countries’ offering relatively higher interest rates and profit from the difference.
Macroeconomic factors that influence the value of the Rupee include inflation, interest rates, the economic growth rate (GDP), the balance of trade, and inflows from foreign investment. A higher growth rate can lead to more overseas investment, pushing up demand for the Rupee. A less negative balance of trade will eventually lead to a stronger Rupee. Higher interest rates, especially real rates (interest rates less inflation) are also positive for the Rupee. A risk-on environment can lead to greater inflows of Foreign Direct and Indirect Investment (FDI and FII), which also benefit the Rupee.
Higher inflation, particularly, if it is comparatively higher than India’s peers, is generally negative for the currency as it reflects devaluation through oversupply. Inflation also increases the cost of exports, leading to more Rupees being sold to purchase foreign imports, which is Rupee-negative. At the same time, higher inflation usually leads to the Reserve Bank of India (RBI) raising interest rates and this can be positive for the Rupee, due to increased demand from international investors. The opposite effect is true of lower inflation.
People's Bank of China (PBOC) Deputy Governor said on Thursday that “there is still room for cutting the Reserve Requirement Ratio (RRR).
Further comments
Will promote effective investment, help resolve excess capacity.
China's monetary policy has ample room.
Will keep Yuan basically stable.
Expect China's nominal economic growth to be around 8% in 2024.
Will maintain appropriate growth in credit and total social financing.
Market reaction
At the time of writing, AUD/USD is holding higher ground near 0.6620, up 0.56% on the day.
Australian Dollar FAQs
One of the most significant factors for the Australian Dollar (AUD) is the level of interest rates set by the Reserve Bank of Australia (RBA). Because Australia is a resource-rich country another key driver is the price of its biggest export, Iron Ore. The health of the Chinese economy, its largest trading partner, is a factor, as well as inflation in Australia, its growth rate and Trade Balance. Market sentiment – whether investors are taking on more risky assets (risk-on) or seeking safe-havens (risk-off) – is also a factor, with risk-on positive for AUD.
The Reserve Bank of Australia (RBA) influences the Australian Dollar (AUD) by setting the level of interest rates that Australian banks can lend to each other. This influences the level of interest rates in the economy as a whole. The main goal of the RBA is to maintain a stable inflation rate of 2-3% by adjusting interest rates up or down. Relatively high interest rates compared to other major central banks support the AUD, and the opposite for relatively low. The RBA can also use quantitative easing and tightening to influence credit conditions, with the former AUD-negative and the latter AUD-positive.
China is Australia’s largest trading partner so the health of the Chinese economy is a major influence on the value of the Australian Dollar (AUD). When the Chinese economy is doing well it purchases more raw materials, goods and services from Australia, lifting demand for the AUD, and pushing up its value. The opposite is the case when the Chinese economy is not growing as fast as expected. Positive or negative surprises in Chinese growth data, therefore, often have a direct impact on the Australian Dollar and its pairs.
Iron Ore is Australia’s largest export, accounting for $118 billion a year according to data from 2021, with China as its primary destination. The price of Iron Ore, therefore, can be a driver of the Australian Dollar. Generally, if the price of Iron Ore rises, AUD also goes up, as aggregate demand for the currency increases. The opposite is the case if the price of Iron Ore falls. Higher Iron Ore prices also tend to result in a greater likelihood of a positive Trade Balance for Australia, which is also positive of the AUD.
The Trade Balance, which is the difference between what a country earns from its exports versus what it pays for its imports, is another factor that can influence the value of the Australian Dollar. If Australia produces highly sought after exports, then its currency will gain in value purely from the surplus demand created from foreign buyers seeking to purchase its exports versus what it spends to purchase imports. Therefore, a positive net Trade Balance strengthens the AUD, with the opposite effect if the Trade Balance is negative.
Japan’s Chief Cabinet Secretary Hayashi said on Thursday, he is “closely monitoring FX moves with urgency.”
Additional comments
Important for currencies to move in stable manner, movement reflecting fundamentals.
Closely watching the impact on Japanese and global economy after the Federal Reserve decision.
Related reads
- The Japanese Yen attracts strong buying and snaps a seven-day losing streak to the YTD low.
- The upbeat domestic macro data and BoJ rate hike speculations provide a boost to the JPY.
- The post-FOMC USD selling bias further contributes to the intraday fall in the USD/JPY pair.
The Japanese Yen (JPY) gains strong positive traction during the Asian session on Thursday and recovers further from its lowest level since November 2023 touched the previous day. The Bank of Japan (BoJ) reportedly is weighing the next rate increase in July, though the October hike is considered as one of the most likely scenarios. This, along with the upbeat economic data from Japan, provides a goodish lift to the JPY amid speculations that Japanese authorities might intervene to stem any further weakness in the domestic currency.
The US Dollar (USD), on the other hand, adds to the overnight losses led by the Federal Reserve's (Fed) dovish hold, which, in turn, is seen as another factor exerting downward pressure on the USD/JPY pair. Meanwhile, the BoJ indicated earlier this week that financial conditions would remain accommodative and fell short of offering any guidance about future policy steps, or the pace of policy normalization. This might hold back the JPY bulls from placing aggressive bets and help limit any further losses for the currency pair.
Daily Digest Market Movers: Japanese Yen draws support from upbeat domestic data and weaker USD
- A Bank of Japan source told the Nikkei newspaper that an early rate hike leaves room to consider rolling out another increase before the end of the year, which, in turn, boosts the Japanese Yen.
- The monthly Reuters Tankan survey showed that confidence at big Japanese companies rebounded to a three-month high in March and the service-sector mood rose to a seven-month high.
- The headline manufacturers' sentiment index jumped to 10 in March from -1 the previous month, while service-sector sentiment rose to 32 during the reported month from 26 in February.
- Other data released this Thursday showed that Japan's exports grew more than expected, by the 7.8% YoY rate in February, leading to a fall in the trade deficit to ¥379.4 billion from ¥1.7 trillion.
- The flash au Jibun Bank Japan Manufacturing PMI rose to 48.2 in March from 47.2 in February, suggesting that the pace of deterioration in the factory activity was the softest in four months.
- Adding to this, the au Jibun Bank flash services PMI rose to 54.9 in March, the highest since last May, from 52.9 in February, indicating that service providers maintained a brisk pace of expansion.
- Japan's Finance Minister Shunichi Suzuki said that it is important for currencies to move in a stable manner and that he is closely watching foreign exchange moves with a high sense of urgency.
- This comes a day after the BoJ's historic move to raise the short-term interest rates for the first time since 2007 and ditch years of unconventional easing in a shift towards normalising monetary policy.
- BoJ Governor Kazuo Ueda said that the central bank will support the economy and prices by maintaining accommodative monetary conditions and medium, long-term inflation expectations are heading toward 2%.
- The Federal Reserve signalled that it remains on track for three interest rate cuts this year, easing market jitters that the central bank will lower its projection for the number of interest rate cuts in 2024 to two.
- In the post-meeting press conference, Fed Chair Jerome Powell said that the recent high inflation readings had not changed the underlying story of easing price pressures, though kept officials on a cautious footing.
- The US Dollar extends the previous day's post-FOMC pullback from a two-week high and drifts lower for the second straight day, which is seen as another factor exerting downward pressure on the USD/JPY pair.
Technical Analysis: USD/JPY could extend the corrective decline further towards the 150.00 mark
From a technical perspective, the sharp intraday decline drags spot prices below the 150.80 strong resistance breakpoint turned support, and the 23.6% Fibonacci retracement level of the recent rally witnessed over the past week or so. This might have set the stage for a further intraday depreciating move towards the 150.00 psychological mark, representing the 100-hour Simple Moving Average (SMA). This is closely followed by the 38.2% Fibo. level, around the 149.75 region, which, if broken decisively, could accelerate the fall further towards the 149.25-149.15 region, or the 50% Fibo. level.
On the flip side, the 150.90-151.00 zone now seems to act as an immediate strong barrier, above which the USD/JPY pair could make a fresh attempt to challenge the multi-decade high, around the 152.00 mark touched in November 2023. Some follow-through buying will be seen as a fresh trigger for bullish traders and pave the way for an extension of the longer-term uptrend witnessed since January 2023.
Japanese Yen FAQs
The Japanese Yen (JPY) is one of the world’s most traded currencies. Its value is broadly determined by the performance of the Japanese economy, but more specifically by the Bank of Japan’s policy, the differential between Japanese and US bond yields, or risk sentiment among traders, among other factors.
One of the Bank of Japan’s mandates is currency control, so its moves are key for the Yen. The BoJ has directly intervened in currency markets sometimes, generally to lower the value of the Yen, although it refrains from doing it often due to political concerns of its main trading partners. The current BoJ ultra-loose monetary policy, based on massive stimulus to the economy, has caused the Yen to depreciate against its main currency peers. This process has exacerbated more recently due to an increasing policy divergence between the Bank of Japan and other main central banks, which have opted to increase interest rates sharply to fight decades-high levels of inflation.
The BoJ’s stance of sticking to ultra-loose monetary policy has led to a widening policy divergence with other central banks, particularly with the US Federal Reserve. This supports a widening of the differential between the 10-year US and Japanese bonds, which favors the US Dollar against the Japanese Yen.
The Japanese Yen is often seen as a safe-haven investment. This means that in times of market stress, investors are more likely to put their money in the Japanese currency due to its supposed reliability and stability. Turbulent times are likely to strengthen the Yen’s value against other currencies seen as more risky to invest in.
Bank of Japan Governor Kazuo Ueda is back on the wires on Thursday, via Reuters, commenting on the Bank’s policy.
Key quotes
Negative rate and bother tools under BoJ's massive stimulus had boosted demand by pushing down real interest rates, but had side-effects too such as on JGB market function.
Preliminary wage negotiation outcome tends to be revised down but even so, we thought final outcome would be fairly strong number.
Consumption was showing some weakness but we were able to confirm strength in capex, when asked why boj decided to end negative rates in March not April..
We know some small firms might struggle to hike wages, but overall, small, midsized firms' profits are improving.
As we end our massive stimulus, we will likely gradually shrink our balance sheet, and at some point reduce JGB purchases.
At present, we have no clear idea on timing of reducing JGB buying, scaling back size of balance sheet.
We will take plenty of time examining how to reduce BoJ's ETF holdings.
In event of reducing BoJ's ETF etf holdings, BOJ will come up with guidelines taking into account market developments at the time
In selling BoJ's ETF holdings, we will do so in a way that minimises losses on BOJ, disruptions in markets.
Market reaction
USD/JPY is holding its rebound to near 150.50 on the above comments, having hit session lows of 150.27 so far this Thursday. The pair is still down 0.50% on the day.
Japanese Yen FAQs
The Japanese Yen (JPY) is one of the world’s most traded currencies. Its value is broadly determined by the performance of the Japanese economy, but more specifically by the Bank of Japan’s policy, the differential between Japanese and US bond yields, or risk sentiment among traders, among other factors.
One of the Bank of Japan’s mandates is currency control, so its moves are key for the Yen. The BoJ has directly intervened in currency markets sometimes, generally to lower the value of the Yen, although it refrains from doing it often due to political concerns of its main trading partners. The current BoJ ultra-loose monetary policy, based on massive stimulus to the economy, has caused the Yen to depreciate against its main currency peers. This process has exacerbated more recently due to an increasing policy divergence between the Bank of Japan and other main central banks, which have opted to increase interest rates sharply to fight decades-high levels of inflation.
The BoJ’s stance of sticking to ultra-loose monetary policy has led to a widening policy divergence with other central banks, particularly with the US Federal Reserve. This supports a widening of the differential between the 10-year US and Japanese bonds, which favors the US Dollar against the Japanese Yen.
The Japanese Yen is often seen as a safe-haven investment. This means that in times of market stress, investors are more likely to put their money in the Japanese currency due to its supposed reliability and stability. Turbulent times are likely to strengthen the Yen’s value against other currencies seen as more risky to invest in.
| Raw materials | Closed | Change, % |
|---|---|---|
| Silver | 25.564 | 2.71 |
| Gold | 2185.616 | 1.29 |
| Palladium | 1021.52 | 3.19 |
- Australian Dollar extends gains on positive economic data from Australia.
- Australian Employment Change surged to 116.5K in February, exceeding expectations of 40.0K.
- US Dollar weakens following the Fed's reaffirmation of expectations for three interest rate cuts in 2024.
The Australian Dollar (AUD) continued its upward momentum for the second consecutive session on Thursday, likely buoyed by positive employment data from Australia. Concurrently, the US Dollar (USD) saw a significant decline following the Federal Open Market Committee's (FOMC) decision to maintain rates at 5.5% during Wednesday's policy meeting. This decision provided support for the AUD/USD pair. Furthermore, remarks made by US Federal Reserve (Fed) Chair Jerome Powell in the post-meeting press conference, signaling a dovish stance, exerted additional downward pressure on the Greenback.
Australian equity market surrendered its intraday gains and slipped into negative territory. This could potentially limit the AUD's advance. However, earlier in the trading day, the ASX 200 Index surged by nearly 1.0%, aligning with a rally on Wall Street from the previous session.
The US Dollar Index (DXY) exhibited a gap down on Thursday following its significant decline in the preceding session. Weaker US Treasury yields contributed to the losses in the US Dollar, which were likely influenced by the Fed's reaffirmation of expectations for three interest rate cuts in 2024.
Daily Digest Market Movers: Australian Dollar appreciates on positive market sentiment
- Australian Employment Change for February surged to 116.5K, surpassing expectations of 40.0K and the previous figure of 15.3K.
- Australia’s Unemployment Rate increased by 3.7%, lower than the anticipated 4.0% and the previous 4.1%.
- The preliminary Judo Bank Services PMI rose to 53.5, up from the previous figure of 53.1.
- Judo Bank Composite PMI showed a slight increase, reaching 52.4 compared to the previous 52.1.
- People’s Bank of China (PBoC) has kept its interest rate unchanged at 3.45%.
- Chinese Foreign Minister Wang Yi met Australia's Foreign Affairs Minister Penny Wong. The Chinese side emphasized their substantial potential. They stressed that China-Australia relations are progressing positively and urged against any hesitation, deviation, or reversal in this forward momentum.
- During the FOMC Press Conference, Fed Chair Jerome Powell emphasized that although inflation is showing signs of moderation, the persistence of price growth remains a significant concern that the Fed cannot ignore.
- US Building Permits (MoM) increased to 1.518 million in February, against the expected 1.495 million and 1.489 million prior.
- US Housing Starts (MoM) rose to 1.521M from the previous figure of 1.374M, exceeding the market expectation of 1.425M in February.
- The preliminary US Michigan Consumer Sentiment Index for March decreased to 76.5, from the previous reading of 76.9. This decline comes in contrast to expectations of it remaining unchanged.
Technical Analysis: Australian Dollar advances to near 0.6620 followed by a major barrier
The Australian Dollar trades near 0.6620 on Thursday. Notably, a key resistance level stands at 0.6650, a significant marker for potential upward movement. A successful breakthrough above this level could provide momentum for the AUD/USD pair to revisit March's high, recorded at 0.6667 on March 8. On the downside, immediate support is observed at the 23.6% Fibonacci retracement level of 0.6614, followed by the psychological barrier of 0.6600. Should the pair breach below the latter, it may face further downward pressure, potentially navigating toward the region surrounding the 38.2% Fibonacci retracement at 0.6581 and the 14-day Exponential Moving Average (EMA) positioned at 0.6575.
AUD/USD: Daily Chart
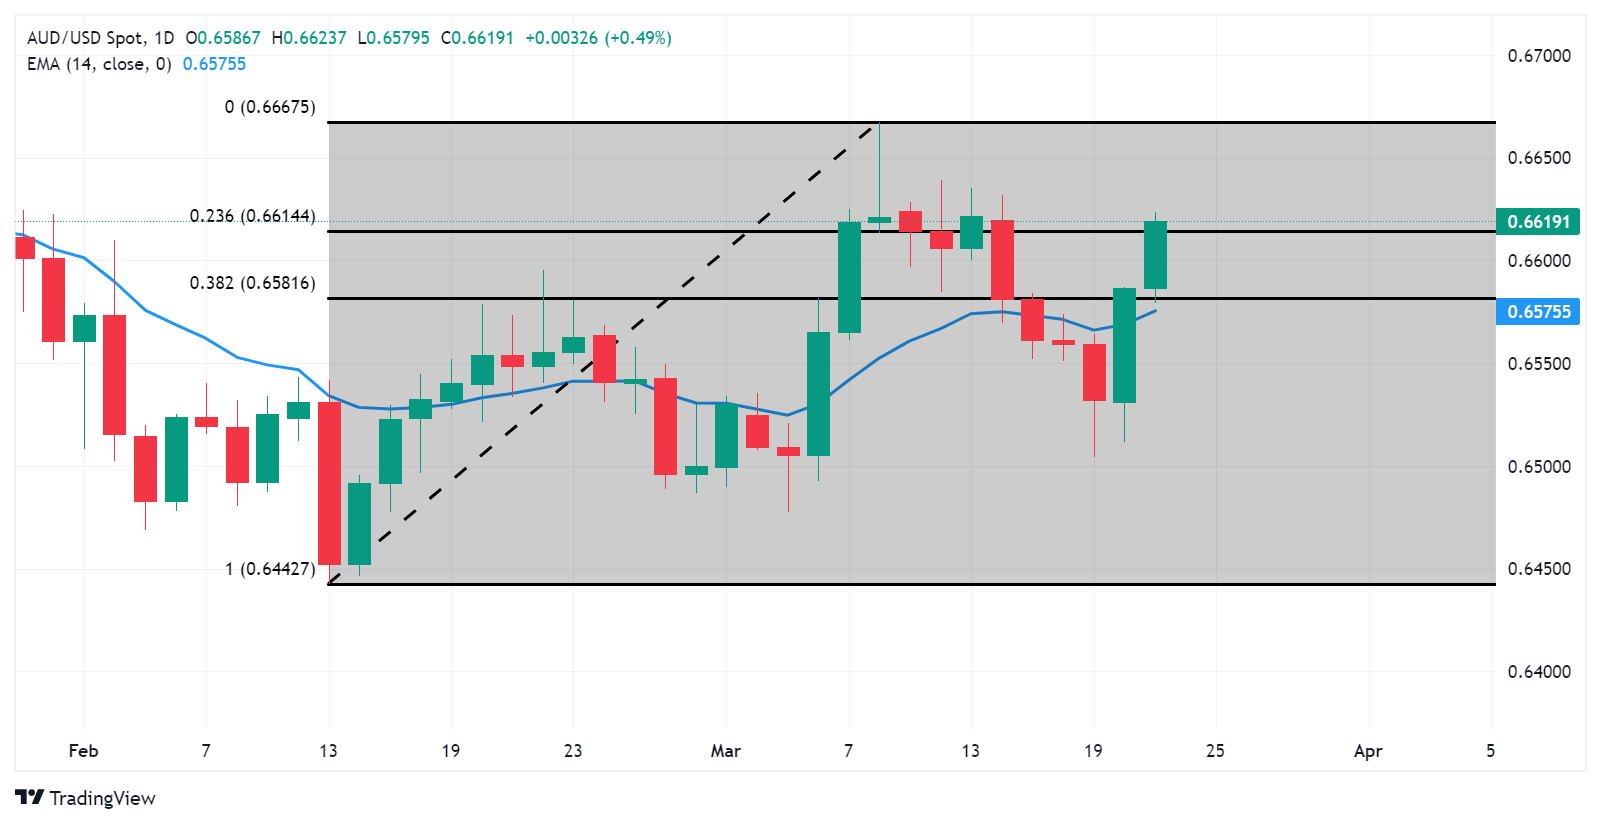
Australian Dollar price today
The table below shows the percentage change of Australian Dollar (AUD) against listed major currencies today. Australian Dollar was the strongest against the Euro.
| USD | EUR | GBP | CAD | AUD | JPY | NZD | CHF | |
| USD | 0.02% | 0.01% | -0.03% | -0.33% | -0.23% | -0.05% | -0.13% | |
| EUR | -0.02% | -0.01% | -0.05% | -0.35% | -0.26% | -0.07% | -0.15% | |
| GBP | -0.01% | 0.02% | -0.04% | -0.34% | -0.25% | -0.05% | -0.15% | |
| CAD | 0.03% | 0.04% | 0.04% | -0.30% | -0.23% | 0.00% | -0.11% | |
| AUD | 0.33% | 0.35% | 0.34% | 0.30% | 0.09% | 0.28% | 0.20% | |
| JPY | 0.26% | 0.25% | 0.25% | 0.20% | -0.08% | 0.19% | 0.09% | |
| NZD | 0.03% | 0.08% | 0.07% | 0.03% | -0.28% | -0.16% | -0.08% | |
| CHF | 0.13% | 0.15% | 0.13% | 0.10% | -0.20% | -0.10% | 0.08% |
The heat map shows percentage changes of major currencies against each other. The base currency is picked from the left column, while the quote currency is picked from the top row. For example, if you pick the Euro from the left column and move along the horizontal line to the Japanese Yen, the percentage change displayed in the box will represent EUR (base)/JPY (quote).
Australian Dollar FAQs
One of the most significant factors for the Australian Dollar (AUD) is the level of interest rates set by the Reserve Bank of Australia (RBA). Because Australia is a resource-rich country another key driver is the price of its biggest export, Iron Ore. The health of the Chinese economy, its largest trading partner, is a factor, as well as inflation in Australia, its growth rate and Trade Balance. Market sentiment – whether investors are taking on more risky assets (risk-on) or seeking safe havens (risk-off) – is also a factor, with risk-on positive for AUD.
The Reserve Bank of Australia (RBA) influences the Australian Dollar (AUD) by setting the level of interest rates that Australian banks can lend to each other. This influences the level of interest rates in the economy as a whole. The main goal of the RBA is to maintain a stable inflation rate of 2-3% by adjusting interest rates up or down. Relatively high interest rates compared to other major central banks support the AUD, and the opposite for relatively low. The RBA can also use quantitative easing and tightening to influence credit conditions, with the former AUD-negative and the latter AUD-positive.
China is Australia’s largest trading partner so the health of the Chinese economy is a major influence on the value of the Australian Dollar (AUD). When the Chinese economy is doing well it purchases more raw materials, goods, and services from Australia, lifting demand for the AUD, and pushing up its value. The opposite is the case when the Chinese economy is not growing as fast as expected. Positive or negative surprises in Chinese growth data, therefore, often have a direct impact on the Australian Dollar and its pairs.
Iron Ore is Australia’s largest export, accounting for $118 billion a year according to data from 2021, with China as its primary destination. The price of Iron Ore, therefore, can be a driver of the Australian Dollar. Generally, if the price of Iron Ore rises, AUD also goes up, as aggregate demand for the currency increases. The opposite is the case if the price of Iron Ore falls. Higher Iron Ore prices also tend to result in a greater likelihood of a positive Trade Balance for Australia, which is also positive of the AUD.
The Trade Balance, which is the difference between what a country earns from its exports versus what it pays for its imports, is another factor that can influence the value of the Australian Dollar. If Australia produces highly sought after exports, then its currency will gain in value purely from the surplus demand created from foreign buyers seeking to purchase its exports versus what it spends to purchase imports. Therefore, a positive net Trade Balance strengthens the AUD, with the opposite effect if the Trade Balance is negative.
The Bank of Japan (BoJ) Governor Kazuo Ueda said on Thursday that the Japanese central bank expected to maintain the accommodative monetary policy for the time being.
Key quotes
“BoJ expected to maintain accommodative monetary policy for the time being.”
“Accommodative monetary policy likely to underpin the economy.”
“Cost-push pressure on inflation dissipating but service prices continue to rise moderately.”
“Recent wage negotiation data, hearing on companies confirmed wage-inflation cycle strengthening.”
“Medium, long-term inflation expectations heading toward 2%.”
“BoJ will support the economy, and prices by maintaining accommodative monetary conditions for the time being.”
“We could have waited until inflation stays at 2% for a long time, before exiting massive stimulus but that could have led to a sharp increase in upside risk to price outlook.”
Market reaction
The USD/JPY pair is trading at 150.45, losing 0.53% on the day at the time of writing.
Bank of Japan FAQs
The Bank of Japan (BoJ) is the Japanese central bank, which sets monetary policy in the country. Its mandate is to issue banknotes and carry out currency and monetary control to ensure price stability, which means an inflation target of around 2%.
The Bank of Japan has embarked in an ultra-loose monetary policy since 2013 in order to stimulate the economy and fuel inflation amid a low-inflationary environment. The bank’s policy is based on Quantitative and Qualitative Easing (QQE), or printing notes to buy assets such as government or corporate bonds to provide liquidity. In 2016, the bank doubled down on its strategy and further loosened policy by first introducing negative interest rates and then directly controlling the yield of its 10-year government bonds.
The Bank’s massive stimulus has caused the Yen to depreciate against its main currency peers. This process has exacerbated more recently due to an increasing policy divergence between the Bank of Japan and other main central banks, which have opted to increase interest rates sharply to fight decades-high levels of inflation. The BoJ’s policy of holding down rates has led to a widening differential with other currencies, dragging down the value of the Yen.
A weaker Yen and the spike in global energy prices have led to an increase in Japanese inflation, which has exceeded the BoJ’s 2% target. Still, the Bank judges that the sustainable and stable achievement of the 2% target has not yet come in sight, so any sudden change in the current policy looks unlikely.
On Thursday, the People’s Bank of China (PBoC) set the USD/CNY central rate for the trading session ahead at 7.0942 as compared to the previous day's fix of 7.0968 and 7.1793 Reuters estimates.
- ASX 200 retraces its intraday gains amid positive Australian employment figures.
- Australia's private sector activity marked its second consecutive month of expansion in March.
- The S&P 500 reached 5,200 after the Fed maintained rates at 5.5%.
The ASX 200 Index relinquished its intraday gains and slipped into negative territory, trading near 7,740 on Thursday. This reversal could be attributed to the positive Employment data from Australia. The seasonally adjusted Employment Change for February surged to 116.5K, surpassing expectations of 40.0K and the previous figure of 15.3K. Additionally, the Unemployment Rate increased by 3.7%, lower than the anticipated 4.0% and the previous 4.1%. These positive figures contribute to the Reserve Bank of Australia’s (RBA) hawkish stance.
However, the index surged by nearly 1.0% to surpass 7,770 in the early hours, tracking a rally on Wall Street overnight. This surge followed the US Federal Reserve's reaffirmation of expectations for three interest rate cuts this year. The S&P 500 reached 5,200 after the Federal Reserve's decision to maintain rates at 5.5%. While Base metals, including copper and palladium, also experienced a rally overnight.
The Australian equity market mirrored a retreat in financial stocks, with notable declines observed across major players. Commonwealth Bank slid to 116.60, marking a decrease of 0.42%, while National Australia Bank dropped to 34.50, down by 0.54%, and Westpac Banking slipped to 26.40, down by 0.75%. Conversely, Telix Pharmaceuticals, Ramelius Resources, and Webjet emerged as top gainers, whereas Brickworks and Strike Energy were among the top losers.
Australia's private sector activity showed resilience in March, marking its second consecutive month of expansion. The preliminary Judo Bank Services PMI climbed to 53.5 from the previous 53.1, while the Composite PMI edged up to 52.4 from 52.1. However, Manufacturing PMI experienced a decline, dropping to 46.8 from the previous 47.8.
The US Justice Department is preparing to file a lawsuit against Apple, potentially as early as Thursday. The suit alleges that the tech giant violated antitrust laws by impeding rivals' access to hardware and software features of its iPhone. This legal action is part of the Biden administration's broader efforts to address antitrust concerns within the tech industry, further escalating its confrontations with major US technology corporations.
Employment FAQs
Labor market conditions are a key element to assess the health of an economy and thus a key driver for currency valuation. High employment, or low unemployment, has positive implications for consumer spending and thus economic growth, boosting the value of the local currency. Moreover, a very tight labor market – a situation in which there is a shortage of workers to fill open positions – can also have implications on inflation levels and thus monetary policy as low labor supply and high demand leads to higher wages.
The pace at which salaries are growing in an economy is key for policymakers. High wage growth means that households have more money to spend, usually leading to price increases in consumer goods. In contrast to more volatile sources of inflation such as energy prices, wage growth is seen as a key component of underlying and persisting inflation as salary increases are unlikely to be undone. Central banks around the world pay close attention to wage growth data when deciding on monetary policy.
The weight that each central bank assigns to labor market conditions depends on its objectives. Some central banks explicitly have mandates related to the labor market beyond controlling inflation levels. The US Federal Reserve (Fed), for example, has the dual mandate of promoting maximum employment and stable prices. Meanwhile, the European Central Bank’s (ECB) sole mandate is to keep inflation under control. Still, and despite whatever mandates they have, labor market conditions are an important factor for policymakers given its significance as a gauge of the health of the economy and their direct relationship to inflation.
Japanese Finance Minister Shunichi Suzuki offered some verbal intervention on Thursday. Suzuki said that he will watch foreign exchange moves with a high sense of urgency.
Key quotes
“Won't comment on forex levels.”
“Says it's important for currencies to move in a stable manner.”
“Is closely watching FX moves with a high sense of urgency.”
“Makes no comment when asked about currency intervention.”
Market reaction
At the time of writing, USD/JPY is trading 0.52% lower on the day at 150.46.
Japanese Yen FAQs
The Japanese Yen (JPY) is one of the world’s most traded currencies. Its value is broadly determined by the performance of the Japanese economy, but more specifically by the Bank of Japan’s policy, the differential between Japanese and US bond yields, or risk sentiment among traders, among other factors.
One of the Bank of Japan’s mandates is currency control, so its moves are key for the Yen. The BoJ has directly intervened in currency markets sometimes, generally to lower the value of the Yen, although it refrains from doing it often due to political concerns of its main trading partners. The current BoJ ultra-loose monetary policy, based on massive stimulus to the economy, has caused the Yen to depreciate against its main currency peers. This process has exacerbated more recently due to an increasing policy divergence between the Bank of Japan and other main central banks, which have opted to increase interest rates sharply to fight decades-high levels of inflation.
The BoJ’s stance of sticking to ultra-loose monetary policy has led to a widening policy divergence with other central banks, particularly with the US Federal Reserve. This supports a widening of the differential between the 10-year US and Japanese bonds, which favors the US Dollar against the Japanese Yen.
The Japanese Yen is often seen as a safe-haven investment. This means that in times of market stress, investors are more likely to put their money in the Japanese currency due to its supposed reliability and stability. Turbulent times are likely to strengthen the Yen’s value against other currencies seen as more risky to invest in.
| Index | Change, points | Closed | Change, % |
|---|---|---|---|
| Hang Seng | 13.59 | 16543.07 | 0.08 |
| KOSPI | 33.97 | 2690.14 | 1.28 |
| ASX 200 | -7.4 | 7695.8 | -0.1 |
| DAX | 27.64 | 18015.13 | 0.15 |
| CAC 40 | -39.64 | 8161.41 | -0.48 |
| Dow Jones | 401.37 | 39512.13 | 1.03 |
| S&P 500 | 46.11 | 5224.62 | 0.89 |
| NASDAQ Composite | 202.62 | 16369.41 | 1.25 |
| Pare | Closed | Change, % |
|---|---|---|
| AUDUSD | 0.65791 | 0.74 |
| EURJPY | 165.129 | 0.74 |
| EURUSD | 1.09227 | 0.53 |
| GBPJPY | 193.285 | 0.72 |
| GBPUSD | 1.27842 | 0.5 |
| NZDUSD | 0.60622 | 0.21 |
| USDCAD | 1.34916 | -0.55 |
| USDCHF | 0.88639 | -0.19 |
| USDJPY | 151.197 | 0.23 |
- GBP/USD trades strongly near 1.2797 amid the softer USD.
- The Fed held interest rates steady as expected on Wednesday and hinted at multiple rate cuts before the end of the year.
- The BoE is widely expected to keep rates on hold at 5.25% on Thursday.
- Traders await the BoE interest rate decision ahead of US S&P Global PMI data on Thursday.
The GBP/USD pair gains momentum during the early Asian trading hours on Thursday. The rebound of the pair is supported by the weaker US Dollar (USD) following Federal Reserve (Fed) Chair Powell's dovish press conference. Investors will closely watch the Bank of England (BoE) interest rate decision on Thursday, along with the preliminary US S&P Global PMI for March. At the press time, GBP/USD is trading at 1.2797, adding 0.09% on the day.
The US Fed decided to keep its benchmark overnight borrowing rate in a range between 5.25% and 5.5% on Wednesday. Fed Chairman Jerome Powell did not indicate the timing of rate cuts, but he expected to lower the interest rate before the end of this year. According to the CME FedWatch Tool, futures markets have prices in a 75% odds that the Fed will start cutting the rate in the June meeting.
The Fed's Powell noted that the recent high inflation reports had not changed the underlying story of slowly easing price pressures in the US, and Fed officials penciled in three quarter-percentage-point cuts by the end of 2024 as solid economic growth will continue. Additionally, the updated economic projections revealed the Personal Consumption Expenditures Price Index, excluding food and energy (Core PCE), will rise 2.6% by the end of the year, compared to 2.4% in the projections reported in December.
On the UK’s front, The BoE is anticipated to maintain its interest rates unchanged at 5.25% on Thursday. The CPI inflation data in February might keep the Bank of England (BoE) on course to begin cutting interest rates in the coming months. Data released on Wednesday showed that the Consumer Price Index (CPI) climbed by 3.4% YoY in February from a 4.0% rise in January, below the market consensus of 3.6%. This figure registered the weakest rate since September 2021. Meanwhile, the Core CPI, eased to 4.5% YoY in February from 5.1% in January, worse than the estimation of 4.6%.
Moving on, market players will closely watch the BoE interest rate decision, along with the preliminary UK S&P Global PMI for March. On the US docket, the US S&P Global PMI, the weekly Initial Jobless Claims, and Existing Home Sales will be due. These events could give a clear direction to the GBP/USD pair.


© 2000-2026. All rights reserved.
This site is managed by Teletrade D.J. LLC 2351 LLC 2022 (Euro House, Richmond Hill Road, Kingstown, VC0100, St. Vincent and the Grenadines).
The information on this website is for informational purposes only and does not constitute any investment advice.
The company does not serve or provide services to customers who are residents of the US, Canada, Iran, The Democratic People's Republic of Korea, Yemen and FATF blacklisted countries.
Making transactions on financial markets with marginal financial instruments opens up wide possibilities and allows investors who are willing to take risks to earn high profits, carrying a potentially high risk of losses at the same time. Therefore you should responsibly approach the issue of choosing the appropriate investment strategy, taking the available resources into account, before starting trading.
Use of the information: full or partial use of materials from this website must always be referenced to TeleTrade as the source of information. Use of the materials on the Internet must be accompanied by a hyperlink to teletrade.org. Automatic import of materials and information from this website is prohibited.
Please contact our PR department if you have any questions or need assistance at pr@teletrade.global.
transfers