- Analytics
- News and Tools
- Market News
CFD Markets News and Forecasts — 22-04-2020
| Time | Country | Event | Period | Previous value | Forecast |
|---|---|---|---|---|---|
| 00:30 | Japan | Manufacturing PMI | April | 44.2 | |
| 00:30 | Japan | Nikkei Services PMI | April | 33.8 | |
| 05:00 | Japan | Leading Economic Index | February | 90.5 | 92.1 |
| 05:00 | Japan | Coincident Index | February | 95.2 | 95.8 |
| 06:00 | Germany | Gfk Consumer Confidence Survey | May | 2.7 | -1.8 |
| 06:00 | United Kingdom | PSNB, bln | March | 0.39 | -2.3 |
| 07:15 | France | Services PMI | April | 27.4 | 25 |
| 07:15 | France | Manufacturing PMI | April | 43.2 | 37.5 |
| 07:30 | Germany | Services PMI | April | 31.7 | 28.5 |
| 07:30 | Germany | Manufacturing PMI | April | 45.4 | 39 |
| 08:00 | Switzerland | Credit Suisse ZEW Survey (Expectations) | April | -45.8 | |
| 08:00 | Eurozone | Manufacturing PMI | April | 44.5 | 39.2 |
| 08:00 | Eurozone | Services PMI | April | 26.4 | 23.8 |
| 08:30 | United Kingdom | Purchasing Manager Index Manufacturing | April | 47.8 | 42 |
| 08:30 | United Kingdom | Purchasing Manager Index Services | April | 34.5 | 29 |
| 10:00 | United Kingdom | CBI industrial order books balance | April | -29 | -53 |
| 12:30 | U.S. | Continuing Jobless Claims | April | 11976 | 16476 |
| 12:30 | U.S. | Initial Jobless Claims | April | 5245 | 4150 |
| 13:45 | U.S. | Manufacturing PMI | April | 48.5 | 37 |
| 13:45 | U.S. | Services PMI | April | 39.8 | 32.5 |
| 14:00 | U.S. | New Home Sales | March | 0.765 | 0.645 |
| 23:01 | United Kingdom | Gfk Consumer Confidence | April | -34 | -40 |
| 23:30 | Japan | National CPI Ex-Fresh Food, y/y | March | 0.6% | 0.4% |
| 23:30 | Japan | National Consumer Price Index, y/y | March | 0.4% |
FXStreet reports that analysts at TD Securities note that Canadian CPI inflation decelerated sharply in March, falling 1.3pp to 0.9% y/y for the first sub-1% reading since 2015.
“CPI inflation fell sharply in March; the year-ago measure dropped from 2.2% to 0.9%, while prices fell by 0.6% on a monthly basis.”
“Today's report shouldn't have much impact on monetary policy, as a sharp drop in near-term inflation should be incorporated in BoC forecasts.”
The U.S. Energy Information Administration (EIA) revealed on Wednesday that crude inventories jumped by 15.022 million barrels in the week ended April 17. Economists had forecast a surge of 16.133 million barrels.
At the same time, gasoline stocks rose by 1.017 million barrels, while analysts had expected a gain of 3.578 million barrels. Distillate stocks surged by 7.876 million barrels, while analysts had forecast an increase of 2.750 million barrels.
Meanwhile, oil production in the U.S. decreased by 100,000 barrels a day to 12.200 million barrels a day.
U.S. crude oil imports averaged 4.9 million barrels per day last week, decreased by 0.7 million barrels per day from the previous week.
FXStreet reports that analysts at the Bank of Montreal (BMO) note that Canadian inflation hit the brakes hard at the start of the shutdowns, sliding from above target to below 1% in a single month.
“Canadian consumer prices fell 0.6% in March in the first month of the North American shutdowns. Adjusted for seasonal factors, prices fell 0.9% m/m, the largest monthly drop in the series stretching back to its inception in 1992.”
“The big monthly drop in prices also carved heavily into the annual inflation rate, slicing it to just 0.9% from 2.2% in February.”
“This was a much bigger slowdown than reported in some other major economies, despite a drop in the Canadian dollar in the month. Look for inflation to fall even further in the coming months, with a trip into negative terrain likely for a spell.”
The European Commission (EC) said on Wednesday its flash estimate showed the consumer confidence indicator for the Eurozone decreased by 11.1 points to -22.7 in April from the previous month. Economists had expected the index to worsen to -19.6.
Considering the European Union (EU) as a whole, consumer sentiment dropped by 11.6 points to -22.0.
Given this month's sharp declines, both indicators are well below their long-term averages of -11.1 (Eurozone) and -10.4 (EU), and close to the record lows recorded during the Great Recession in 2009, the report said.

FXStreet notes that the Aussie has managed to bounce off the lows from yesterday. Analysts at TD Securities believe AUD/USD strength should fade.
“AUD managed to bounce off 0.6250 support from yesterday in what has been great reluctance to trade lower. We think that strength should be faded overall here as AUD/USD however, as rallies above 0.6350 have been met with some selling interest.”
“We see better prospects for AUD/NZD upside than vs. the USD however, where any rebound in Asia will be better observed in the AUD-leg.”
“The move in AUD has been more closely tied to gold than other markets, however. The link here is intuitive and with rampant monetary/fiscal stimulus and depressed real yields, that might be a more persistent link.”
- Says U.S. will provide $2.6 trillion in direct support for the economy, can leverage that to an additional $4 trillion through Federal Reserve
- Trump administration looking at different plans to support U.S. oil producers
- Expects oil price to reach $30 per barrel by August
FXStreet reports that FX Strategists at UOB Group keep the neutral stance on USD/CNH, which is seen extending the consolidative mood in the next weeks.
24-hour view: “We expected USD to ‘edge higher to 7.1050’ yesterday but it rose to 7.1087 before easing off. Despite the relatively rapid advance, upward momentum has not improved by much. For today, USD is likely to consolidate and trade between 7.0850 and 7.1100.”
Next 1-3 weeks: “USD traded in a relatively quiet manner last Friday and for now, we continue to hold the same view from last Thursday (16 Apr, spot at 7.0770) wherein USD ‘has likely moved into a consolidation phase” and “is likely to trade between 7.0450 and 7.1250 for a period.”
U.S. stock-index futures rose on Wednesday, as better-than-expected Q1 earnings reports lifted investor sentiment following a two-day selloff due to a massive decline in oil prices. Meanwhile, crude prices also attempted to stabilize in early trading.
Global Stocks:
| Index/commodity | Last | Today's Change, points | Today's Change, % |
| Nikkei | 19,137.95 | -142.83 | -0.74% |
| Hang Seng | 23,893.36 | +99.81 | +0.42% |
| Shanghai | 2,843.98 | +16.97 | +0.60% |
| S&P/ASX | 5,221.20 | -0.10 | 0.00% |
| FTSE | 5,773.38 | +132.35 | +2.35% |
| CAC | 4,408.97 | +51.51 | +1.18% |
| DAX | 10,393.90 | +144.05 | +1.41% |
| Crude oil | $13.49 | | +16.59% |
| Gold | $1,727.90 | | +2.38% |
- Adds that will be done in phases
- Certain areas of country meet guidelines to begins phased reopening
- Hot spots like New York City and Chicago might take longer to reopen
- Says community banks and smaller lenders will be included in SBA plan
- Small businesses should not be held liable for infections of COVID-19
- Expects "very significant demand" for relief loans
(company / ticker / price / change ($/%) / volume)
| 3M Co | MMM | 143.4 | 1.77(1.25%) | 3218 |
| ALCOA INC. | AA | 7.5 | 0.18(2.46%) | 29314 |
| ALTRIA GROUP INC. | MO | 38.31 | 0.55(1.46%) | 6430 |
| Amazon.com Inc., NASDAQ | AMZN | 2,369.51 | 41.39(1.78%) | 67382 |
| American Express Co | AXP | 83.56 | 2.04(2.50%) | 8100 |
| AMERICAN INTERNATIONAL GROUP | AIG | 22.5 | 0.25(1.12%) | 3300 |
| Apple Inc. | AAPL | 273.45 | 5.08(1.89%) | 351254 |
| AT&T Inc | T | 30.83 | 0.96(3.21%) | 531968 |
| Boeing Co | BA | 141.01 | 4.68(3.43%) | 235553 |
| Caterpillar Inc | CAT | 111.49 | 1.64(1.49%) | 5273 |
| Chevron Corp | CVX | 84.5 | 2.86(3.50%) | 232544 |
| Cisco Systems Inc | CSCO | 41.5 | 0.95(2.34%) | 38477 |
| Citigroup Inc., NYSE | C | 42.73 | 1.16(2.79%) | 135222 |
| E. I. du Pont de Nemours and Co | DD | 39.12 | 0.05(0.13%) | 1579 |
| Exxon Mobil Corp | XOM | 42.53 | 1.57(3.83%) | 167064 |
| Facebook, Inc. | FB | 177.9 | 7.10(4.16%) | 214016 |
| FedEx Corporation, NYSE | FDX | 123.75 | 3.27(2.71%) | 1060 |
| Ford Motor Co. | F | 4.88 | 0.11(2.31%) | 391198 |
| Freeport-McMoRan Copper & Gold Inc., NYSE | FCX | 7.65 | 0.24(3.24%) | 212320 |
| General Electric Co | GE | 6.65 | 0.17(2.63%) | 348048 |
| General Motors Company, NYSE | GM | 21.81 | 0.57(2.68%) | 10766 |
| Goldman Sachs | GS | 177.2 | 3.39(1.95%) | 66534 |
| Google Inc. | GOOG | 1,244.13 | 27.79(2.28%) | 15912 |
| Hewlett-Packard Co. | HPQ | 14.8 | 0.38(2.64%) | 2008 |
| Home Depot Inc | HD | 203.71 | 3.10(1.55%) | 20299 |
| HONEYWELL INTERNATIONAL INC. | HON | 133.38 | 1.38(1.04%) | 3128 |
| Intel Corp | INTC | 57.8 | 1.44(2.56%) | 76816 |
| International Business Machines Co... | IBM | 118.1 | 1.34(1.15%) | 17634 |
| Johnson & Johnson | JNJ | 152.78 | 3.10(2.07%) | 19713 |
| JPMorgan Chase and Co | JPM | 91.19 | 2.14(2.40%) | 152392 |
| McDonald's Corp | MCD | 180.91 | 3.33(1.88%) | 8521 |
| Merck & Co Inc | MRK | 79.54 | 0.98(1.25%) | 6227 |
| Microsoft Corp | MSFT | 171.2 | 3.38(2.01%) | 247315 |
| Nike | NKE | 86.6 | 1.40(1.64%) | 176597 |
| Pfizer Inc | PFE | 36.92 | 1.30(3.65%) | 240528 |
| Procter & Gamble Co | PG | 120.99 | 1.31(1.09%) | 5102 |
| Starbucks Corporation, NASDAQ | SBUX | 74.25 | 1.53(2.10%) | 12061 |
| Tesla Motors, Inc., NASDAQ | TSLA | 705 | 18.28(2.66%) | 408618 |
| The Coca-Cola Co | KO | 46 | 0.62(1.37%) | 35443 |
| Travelers Companies Inc | TRV | 102.75 | 0.97(0.95%) | 2758 |
| Twitter, Inc., NYSE | TWTR | 27 | 1.25(4.85%) | 212892 |
| UnitedHealth Group Inc | UNH | 278 | 3.81(1.39%) | 1765 |
| Verizon Communications Inc | VZ | 57.55 | 0.73(1.28%) | 34368 |
| Visa | V | 163.8 | 3.27(2.04%) | 50644 |
| Wal-Mart Stores Inc | WMT | 129.9 | 0.69(0.53%) | 6430 |
| Walt Disney Co | DIS | 102.42 | 1.88(1.87%) | 105071 |
| Yandex N.V., NASDAQ | YNDX | 35.45 | 1.43(4.20%) | 8663 |
Statistics Canada reported on Wednesday the country's consumer price index (CPI) fell 0.6 percent m-o-m in March, following a 0.4 percent m-o-m advance in the previous month.
On the y-o-y basis, Canada's inflation rate increased 0.9 percent last month, decelerating from 2.2 percent in February. That was the lowest inflation rate since May 2015.
Economists had predicted inflation would decrease 0.4 percent m-o-m but rise 1.2 percent y-o-y in March.
According to the report, prices rose in six of the eight major components on a y-o-y basis, with shelter prices (+1.9 percent y-o-y) contributing the most to the all-items advance. At the same time, consumers paid less for transportation (-1.2 percent y-o-y) and recreation, education and reading (-0.5 percent y-o-y) compared with March 2019.
Meanwhile, the closely watched the Bank of Canada's core index rose 1.7 percent y-o-y in March, after a 1.8 percent gain in February.
Home Depot (HD) downgraded to Hold from Accumulate at Gordon Haskett
Netflix (NFLX) downgraded to Hold from Buy at Stifel; target raised to $460
Netflix (NFLX) downgraded to Outperform from Strong Buy at Raymond James; target raised to $480
Tesla (TSLA) downgraded to Underperform from Neutral at BofA/Merrill; target lowered to $485
Johnson & Johnson (JNJ) upgraded to Buy from Neutral at BofA/Merrill; target raised to $175
Netflix (NFLX) upgraded to Equal Weight from Underweight at Wells Fargo; target $460
| Time | Country | Event | Period | Previous value | Forecast | Actual |
|---|---|---|---|---|---|---|
| 06:00 | United Kingdom | Retail Price Index, m/m | March | 0.5% | -0.2% | 0.2% |
| 06:00 | United Kingdom | Producer Price Index - Output (YoY) | March | 0.5% | -0.1% | 0.3% |
| 06:00 | United Kingdom | Producer Price Index - Input (MoM) | March | -1.2% | -3.9% | -3.6% |
| 06:00 | United Kingdom | Producer Price Index - Input (YoY) | March | -0.5% | -3.6% | -2.9% |
| 06:00 | United Kingdom | Producer Price Index - Output (MoM) | March | -0.2% | -0.4% | -0.2% |
| 06:00 | United Kingdom | Retail prices, Y/Y | March | 2.5% | 2.3% | 2.6% |
| 06:00 | United Kingdom | HICP ex EFAT, Y/Y | March | 1.7% | 1.6% | |
| 06:00 | United Kingdom | HICP, m/m | March | 0.4% | 0% | 0% |
| 06:00 | United Kingdom | HICP, Y/Y | March | 1.7% | 1.5% | 1.5% |
| 12:30 | Canada | New Housing Price Index, MoM | March | 0.4% | 0.3% | |
| 12:30 | Canada | New Housing Price Index, YoY | March | 0.6% | 0.9% | |
| 12:30 | Canada | Consumer Price Index m / m | March | 0.4% | -0.4% | -0.6% |
| 12:30 | Canada | Bank of Canada Consumer Price Index Core, y/y | March | 1.8% | 1.7% | |
| 12:30 | Canada | Consumer price index, y/y | March | 2.2% | 1.2% | 0.9% |
EUR rose against USD and JPY in the European session on Wednesday as more European countries are considering easing of COVID-19 restrictions as the number of new coronavirus cases decreases. At the same time, Europe's single currency eased against GBP, AUD, NZD and CAD, which benefited from improved risk sentiment.
Italy's Prime Minister Giuseppe Conte reportedly convened a taskforce comprised of leading economists and health experts to decide on which coronavirus measures can safely be lifted and when. "I would like to be able to say, let's open everything. Right away," he wrote on Facebook."But such a decision would be irresponsible." He pledged to spell out the details of the next stage of Italy's fight against pandemic as more data come.
Meanwhile, Spain's Prime Minister Pedro Sanchez stated on Wednesday his government plans to begin winding down the coronavirus lockdown in the second half of May. According to Sanchez, restrictions will be eased slowly and gradually to ensure safety.
Elsewhere, France's government announced plans to start unwinding coronavirus measures from May 11.
Market participants are also awaiting Thursday's virtual meeting of the European leaders, at which they are to discuss the funding of the economic recovery in the EU. Italian PM Conte stated on Tuesday that he would accept "no compromises" at Thursday's conference. He told an Italian parliament session that he would not sign up to a "bargain deal". "The EU and the eurozone cannot afford to repeat the same mistakes they made in the 2008 financial crisis, when it not possible to offer a joint response," he said. The media also report that Italy is expected to request EUR55 billion in stimulus from the European Parliament.
FXStreet reports that Alvin Liew, Senior Economist at UOB Group, assessed the latest Japanese trade balance figures.
“Japan’s exports continued to contract and by a more severe 11.7% y/y in March…as the coronavirus disease (COVID-19) pandemic spread across major and small economies, disrupting supply chains and constraining demand. This was the 16 th consecutive month of decline, the longest stretch of monthly contraction since 1987 and the worst decline since June 2016.”
“In spite of the weak exports, there was surprisingly a marginal trade surplus of JPY4.6bn for March even though the decline in imports was a more subdued -5.0% y/y .... That said, imports have been on the decline for 11 straight months since May 2019. On an adjusted basis, the trade balance showed a deficit of JPY190bn in March (from a JPY482.2bn in February).”
“Our cautious stance on Japan’s trade outlook has definitely worsened in light of the COVID-19 pandemic and we see Japan facing significant challenges due to the virus impact, on both the supply and demand sides of the economic equation.”
“We have further revised our forecast Japan’s export lower and will now contract by 7.2% in 2020 from previous forecast of -6.8% (+5.6% in 2019) while import is expected to contract by -8.7% from previous forecast of -9% (+5.0% in 2019).”
FXStreet reports that analysts at JP Morgan Asset Management note that falling demand, sticky supply and limited storage have forced oil producers into a precarious situation.
“Spot oil prices and near-term contracts have turned negative because oil holders are willing to pay investors to take the commodity off their hands to avoid those expenses.”
“The oil futures curve is currently in ‘super contango’ whereby the implied oil price of near-term contract may be very low but the market is implying a price for WTI of $35 a barrel one year from now.”
“It seems safe to say that the pressure of negative oil prices will not be in place forever.”
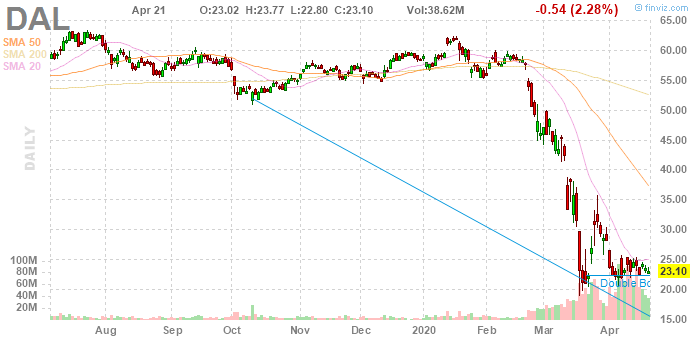
Delta Air Lines (DAL) reported Q1 FY 2020 loss of $0.51 per share (versus earnings of $0.96 per share in Q1 FY 2019), better than analysts' consensus estimate of a loss of $0.82 per share.
The company's quarterly revenues amounted to $8.592 bln (-18.00% y/y), missing analysts' consensus estimate of $9.333 bln.
DAL rose to $23.53 (+1.86%) in pre-market trading.
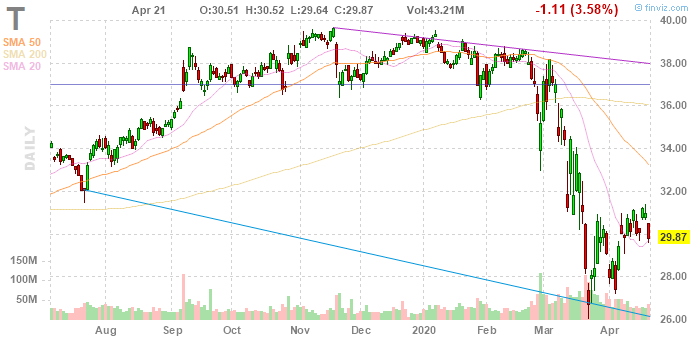
AT&T (T) reported Q1 FY 2020 earnings of $0.89 per share (versus $0.86 per share in Q1 FY 2019), beating analysts' consensus estimate of $0.87 per share.
The company's quarterly revenues amounted to $42.779 bln (-4.6% y/y), missing analysts' consensus estimate of $44.750 bln.
The company also withdrew its financial guidance due to the lack of visibility related to COVID-19 pandemic and recovery.
T rose to $30.19 (+1.07%) in pre-market trading.
The Mortgage Bankers Association (MBA) reported on Wednesday the mortgage application volume in the U.S. fell 0.3 percent in the week ended April 17, following a 7.3 percent surge in the previous week.
According to the report, refinance applications dropped 0.8 percent, while applications to purchase a home increased 2.1 percent.
Meanwhile, the average fixed 30-year mortgage rate remained unchanged at 3.45 percent, the lowest level in the MBA's survey, which began in 1990.
"The pandemic-related economic stoppage has caused some buyers and sellers to delay their decisions until there are signs of a turnaround," noted Joel Kan, an MBA economist. "This has resulted in reduced buyer traffic, less inventory, and March existing-homes sales falling to their slowest annual pace in nearly a year."
FXStreet reports that FX Strategists at UOB Group do not rule out further upside in USD/JPY, although any move should be considered as part of a broad trading range.
24-hour view: “We expected USD to ‘continue to consolidate within a 107.40/108.00 range’ yesterday. USD subsequently traded between 107.26 and 107.89, wider than our expected range. The consolidation phase over the past few days appears to be close to ending. From here, a break of 108.00 could lead to a rapid rise towards 108.40. Support is at 107.50 followed by 107.25.”
Next 1-3 weeks: “There is not much to add to our view from last Thursday (16 Apr, spot at 107.70). As highlighted, the current recovery in USD could extend higher but any advance is viewed as part of a 107.00/109.00 range. In other words, a sustained advance above 109.00 is unlikely.”
FXStreet notes that the Covid-19 pandemic has had a dramatic impact on economic activity. Economists at Nordea project the world economy to contract sharply by -2% in 2020.
“We expect global growth to be around -2% in 2020 followed by +6% in 2021 in the U-shaped baseline scenario.”
“The positive risk scenario looks much like the baseline U-shaped scenario, but the recovery is faster, like a V-shape. We expect global growth to end around 0% in 2020 and 5% in 2021.”
“Several risks have the potential to make any eventual recovery very gradual and seem more like an L-shape than a U-shape. We expect global growth to end around -6% in 2020 and +5 % in 2021.”
Snap (SNAP) reported Q1 FY 2020 loss of $0.08 per share (versus -$0.10 per share in Q1 FY 2019), in line with analysts' consensus estimate.
The company's quarterly revenues amounted to $0.463 bln (+44.4% y/y), beating analysts' consensus estimate of $0.420 bln.
The company's DAUs (daily active users) were 229 million in Q1 FY 2020, a gain of 39 million or 20% y/y.
SNAP rose to $14.90 (+19.77%) in pre-market trading.

- Says OPEC+ may want to consider further output cuts
- It may be advisable for OPEC+ to cut as soon as possible
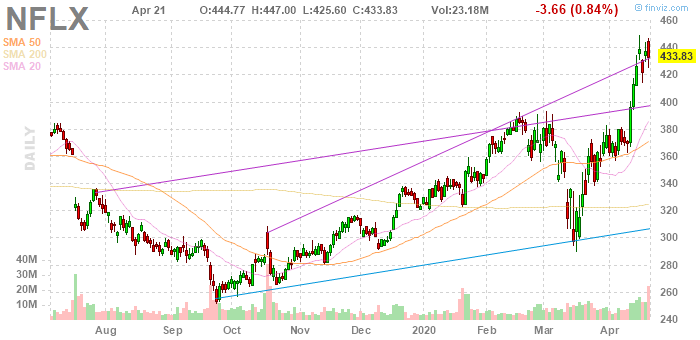
Netflix (NFLX) reported Q1 FY 2020 earnings of $1.57 per share (versus $0.63 per share in Q1 FY 2019), missing analysts' consensus estimate of $1.64 per share.
The company's quarterly revenues amounted to $5.768 bln (+27.6% y/y), generally in line with analysts' consensus estimate of $5.746 bln.
Netflix reported Q1 FY 2020 net adds of 15.77 mln versus its January guidance (pre-pandemic) of 7.00 mln.
The company also issued upside guidance for Q2 FY 2020, projecting EPS of $1.81 versus analysts' consensus estimate of $1.54 and revenues of $6.048 bln versus analysts' consensus estimate of $5.95 bln. In addition, it guided Q2 FY 2020 global streaming net adds of 7.5 mln.
NFLX fell to $431.97 (-0.43%) in pre-market trading.
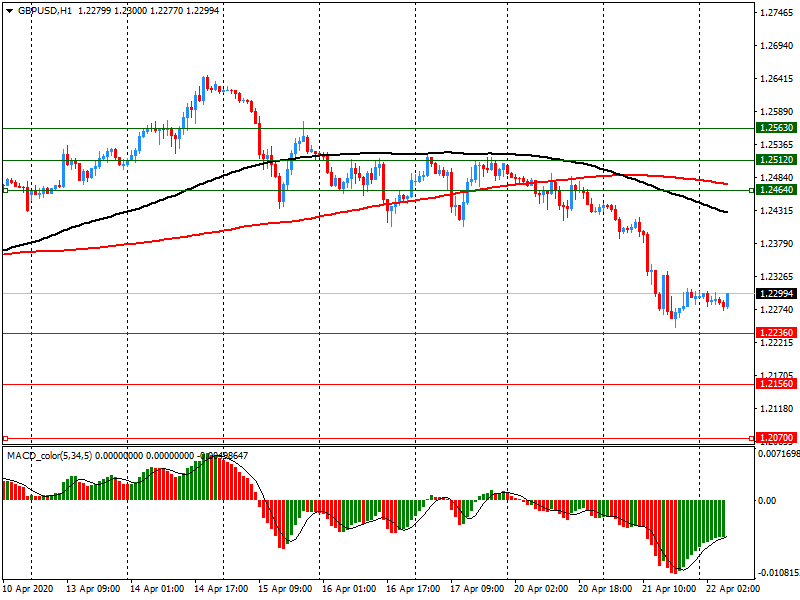
FXStreet reports that GBP/USD has extended its rejection of its 200-day average and remains below its falling 55-day average, which have also completed a bearish 'death cross', per Credit Suisse.
"With a bearish moving average 'death cross' in place we stay biased lower for a test of key support at 1.2176/66, the April low and 38.2% retracement of the entire rise from March."
"Below 1.2176 would mark a more important top as we highlighted yesterday to open up a move to the 50% retracement at 1.2030, then 1.1934/32, the 'neckline' to the March base."
"Resistance moves to 1.2389 initially, then 1.2407/08, with 1.2421 now ideally capping to keep the immediate risk lower. Above can raise the prospect of further sideways ranging and strength back to 1.2518/22."
According to the report from Eurostat, in 2019, the government deficit of both the euro area (EA19) and the EU27 increased in relative terms compared with 2018, while the government debt declined in both zones. In the euro area the government deficit to GDP ratio rose from 0.5% in 2018 to 0.6% in 2019, and in the EU27 from 0.4% to 0.6%. In the euro area the government debt to GDP ratio decreased from 85.8% at the end of 2018 to 84.1% at the end of 2019, and in the EU27 from 79.6% to 77.8%.
In 2019, Denmark (+3.7%), Luxembourg (+2.2%), Bulgaria (+2.1%), Cyprus and the Netherlands (both +1.7%), Greece (+1.5%), Germany (+1.4%), Austria (+0.7%), Malta, Slovenia and Sweden (all +0.5%), Ireland and Croatia (both +0.4%), Czechia and Lithuania (both +0.3%), and Portugal (+0.2%) registered a government surplus. Two Member States had deficits equal to or higher than 3% of GDP: France (-3.0%) and Romania (-4.3%).
At the end of 2019, the lowest ratios of government debt to GDP were recorded in Estonia (8.4%), Bulgaria (20.4%), Luxembourg (22.1%), Czechia (30.8%) and Denmark (33.2%). Eleven Member States had government debt ratios higher than 60% of GDP, with the highest registered in Greece (176.6%), Italy (134.8%), Portugal (117.7%), Belgium (98.6%), France (98.1%), Spain and Cyprus (both 95.5%).
In 2019, government expenditure in the euro area was equivalent to 47.1% of GDP and government revenue to 46.5%. The figures for the EU27 were 46.7% and 46.2% respectively.
FXStreet reports that the measures taken by the US Federal Reserve (Fed) since 15 March have already had a major impact on the balance sheets of commercial banks resident in the United States, Céline Choulet from BNP Paribas reports.
"Reserves held at the Central Bank have considerably increased following their role as intermediaries for the Fed's securities purchases, emergency loans and liquidity swaps."
"As in 2008-2014, the Fed's QE policy has also created a disconnect between growth in loans and growth in deposits on banks' balance sheets."
"As in 2008, a large proportion of dollar liquidity lent by the Fed to foreign central banks, then distributed to non-resident banks, has eventually been re-lent to resident banks, as shown by the increase in their net debts to affiliated entities located abroad."
-
Member states should enhance cooperation,take measures to support the economy
-
It is necessary to support the most severely hit European countries
-
The coronavirus pandemic is a common European problem
-
The difficulties caused are not due to any single country's reckless management
Reuters reports that there is a "big divide" between EU member states on whether any coronavirus recovery aid should be handed out to member states as subsidies or loans, an official with the bloc said on Wednesday.
National EU leaders are meeting via videoconference on Thursday to lock horns over how to kickstart growth after the coronavirus pandemic.
They are expected to give tentative agreement to use the bloc's next long-term budget to create a Recovery Fund but there is plenty of contentious detail still outstanding, meaning no final agreement is expected.
"For some member states it is important to have grants or subsidies, while for others it can only be loans. There is a big divide and we need to find the right balance," said the official under condition of anonymity.
The official said member states were still in disagreement on a proposal by the European Commission, which would see the Brussels-based EU executive raise debt against the bloc's joint budget to help restart growth on the continent.
FXStreet reports that the dramatic moves in the oil market reflect a very challenging economic outlook which sits alongside still-elevated levels of market volatility, per HSBC.
"Lower oil prices will help support consumers in many net-oil importing advanced and emerging economies by rising disposable incomes and reducing input costs into production. This will be especially important as containment measures are gradually lifted in the coming weeks."
"Many economies that are major oil producers will bear an economic hit from lower prices. Credit default rates within the US shale industry, in particular, are likely to pick up, weighing on the outlook for the US high-yield corporate bond sector."
"We think the case for a strategic, longer-term overweight in global equities in our multi-asset portfolios remains solid amid huge global policy support initiatives and highly attractive relative valuations."
FXStreet reports that according to FX Strategists at UOB Group, AUD/USD remains under pressure although a move to 0.6170 is not on the radar for the time being.
24-hour view: "We highlighted yesterday that 'a break of 0.6300 would not be surprising but 0.6260 is likely out of reach'. The subsequent weakness in AUD exceeded our expectation as AUD dropped to 0.6254 before recovering. Downward momentum is showing sign of waning but there is scope for AUD to dip to 0.6245 first before a recovery can be expected. For today, the next support at 0.6210 is unlikely to come into the picture. Resistance is at 0.6315 followed 0.6340."
Next 1-3 weeks: "We have held the same view since last Thursday (16 Apr, spot at 0.6300) wherein 'a short-term top is in place' and that 'the pullback in AUD could extend to 0.6170'. While AUD dropped to 0.6254 yesterday, downward momentum has not improved by all that much and 0.6170 may not come into the picture so soon. On the upside, only a breach of 0.6370 ('strong resistance' previously at 0.6400) would indicate the current downward pressure has eased."
Bloomberg reports that according to Bank of America Corp., U.S. stocks are likely to see new lows if VIX patterns from yesteryear hold sway.
The current bear-market rally most closely resembles what occurred in 2008, and suggests there's limited further upside before a turn that drags the S&P 500 to fresh lows, strategists led by Benjamin Bowler wrote in a note. They drew that conclusion by measuring from the peak of volatility in the three most recent major sell-offs and comparing those with the present one.
Volatility markets are "underpricing the risk of a secondary market shock," they wrote.
If the S&P 500, which is up about 15% since the March 16 peak in the VIX, continues to trade in line with the 2008-09 bear-market rally, it would top out around 2,960 as the economic impact of this crisis get priced in, according to the report.
In the three previous big sell-offs -- 1987, 2002 and 2008 -- it took between one and a half to four months after the VIX peaks for equity market to bottom, BofA noted. During that time, the S&P 500 rose anywhere from 15% to 25% before falling again, they said.
CNBC reports that billionaire hedge fund manager Ray Dalio has described the coronavirus outbreak as an exciting turning point in history - one that could pave the way for greater societal progress.
The Bridgewater Associates founder highlighted the devastating human toll of the virus, which has so far infected more than 2.5 million globally, and its wide-reaching economic repercussions.
However, he went on to strike an optimistic note, saying that the financial fallout should be viewed in wider historical context.
Comparing the pandemic with other periods of economic hardship, such as the Great Depression, Dalio said the current downturn - painful as it is - would be "relatively brief" and would allow for a wider global "restructuring."
That restructuring could last three to five years, he said.
"I know that's a long time, but it's not forever," Dalio told. "The human capacity to adapt and invent and come out of this is much greater."
Dalio went on to say that people should be "very excited" about the phase that will come after that, pointing to leaps forward in digitization, data and human thinking. The 70-year-old businessman's assessment reflects wider observations from economists and historians that we are currently in the midst of a technological revolution.
| Time | Country | Event | Period | Previous value | Forecast | Actual |
|---|---|---|---|---|---|---|
| 01:30 | Australia | Leading Index | March | -0.4% | -0.8% |
The US dollar fell against the euro and the yen, and the Australian national currency rose significantly on the news of a record increase in retail sales in March.
The US currency strengthened the day before, mainly due to risk aversion against the backdrop of a collapse in oil prices, which increased concerns about global demand.
Meanwhile, the US Senate on Tuesday passed a bill on a new $484 billion package of support for small businesses and hospitals. Most of the funds ($320 billion) are planned to be used for a loan program to pay employees during the pandemic. The house of representatives can vote on the bill as early as Thursday.
The Australian dollar rose after data showed that retail sales in the country in March jumped by 8.2% compared to February. The growth rate was a record, which is explained by the high demand for food and basic necessities in conditions of isolation. Reserve Bank of Australia Governor Philip Lowe on Tuesday said that the Australian economy in the first half of the year may fall at the highest rate since the great depression.
The ICE Dollar index, which shows the value of the dollar against six major world currencies, fell by 0.14% compared to the previous day.
FXStreet reports that the latest price action illustrates the extraordinary situation in which the oil market finds itself near-term but, in the opinion of strategists at Danske Bank, there are also stabilising forces longer term.
"Over time, physical arbitrage should reduce the elevated Brent-WTI spread, albeit subject to transportation options and costs."
"We expect stabilisation to come from fundamental market dynamics ahead. The current levels of oil prices will force producers to (continue to) cut back production but as demand recovers (at least partially) when lockdowns are eased, the inventory build should ease."
"We see Brent averaging USD35/bbl this year, rising to USD44/bbl on average in 2021."
FXStreet reports that FX Strategists at UOB Group suggested EUR/USD should remain side-lined in the next weeks.
24-hour view: "We expected EUR to 'trade sideways between 1.0830 and 1.0900' yesterday. EUR subsequently dipped to 1.0817 before snapping back up to 1.0880. While the current movement is still viewed as part of a consolidation phase, the underlying tone has firmed somewhat and the risk from here is tilted to the upside. That said, any advance is expected to face solid resistance at 1.0900 (next resistance is at 1.0925). Support is at 1.0840 but only a move below 1.0815 would indicate the current mild upward pressure has eased."
Next 1-3 weeks: "EUR traded in a relatively quiet manner over the past few days and the price actions offer no fresh clues. We continue to hold same view from last Thursday (16 Apr, spot at 1.0890) wherein 'the outlook is mixed' and EUR could 'continue to trade in an undecided manner within a broad 1.0750/1.1000 range for a period'."
According to the report from Office for National Statistics (ONS), the Consumer Prices Index (CPI) 12-month rate was 1.5% in March 2020, down from 1.7% in February. Economists also expected a 1.5% increase.
The Consumer Prices Index including owner occupiers' housing costs (CPIH) 12-month inflation rate was 1.5% in March 2020, down from 1.7% in February 2020.
The largest contribution to the CPIH 12-month inflation rate in March 2020 came from housing, water, electricity, gas and other fuels (0.51 percentage points). Falls in the price of motor fuels and clothing resulted in the largest downward contributions to the change in the CPIH 12-month inflation rate between February and March 2020. Rises in air fares produced the largest, partially offsetting, upward contribution to change.
A separate ONS report showed that the headline rate of output inflation for goods leaving the factory gate was 0.3% on the year to March 2020, down from 0.5% in February 2020.
The price for materials and fuels used in the manufacturing process displayed negative growth of 2.9% on the year to March 2020, down from negative growth of 0.2% in February 2020.
Petroleum products made the largest downward contribution to the change in the annual rate of output inflation.
Crude oil provided the largest downward contribution to the change in the annual rate of input inflation.
Crude oil prices have seen a record fall on the month, driven by factors including reduced global demand during the coronavirus (COVID-19) pandemic and OPEC+ failing to agree to cut supply.
-
CNBC reports that China's National Health Commission (NHC) said there were 30 new confirmed cases as of April 21, of which 23 were attributed to travelers coming from overseas. That brings the country's total to 82,788 cases, the NHC said.
-
Mexico reported a jump of more than 700 new cases, reaching a total of 9,501 cases.
-
Americans should prepare to see more deaths from the coronavirus pandemic, particularly in cities, as the outbreak in the United States moves past its peak and infection rates decline, White House coronavirus advisor Dr. Deborah Birx warned.
-
Global cases: At least 2,561,044.
-
Global deaths: At least 176,984.
-
Most cases reported: United States (823,786), Spain (204,178), Italy (183,957), France (159,297), and Germany (148,291).
EUR/USD
Resistance levels (open interest**, contracts)
$1.1031 (1400)
$1.0995 (770)
$1.0965 (657)
Price at time of writing this review: $1.0851
Support levels (open interest**, contracts):
$1.0785 (1857)
$1.0753 (1766)
$1.0716 (1373)
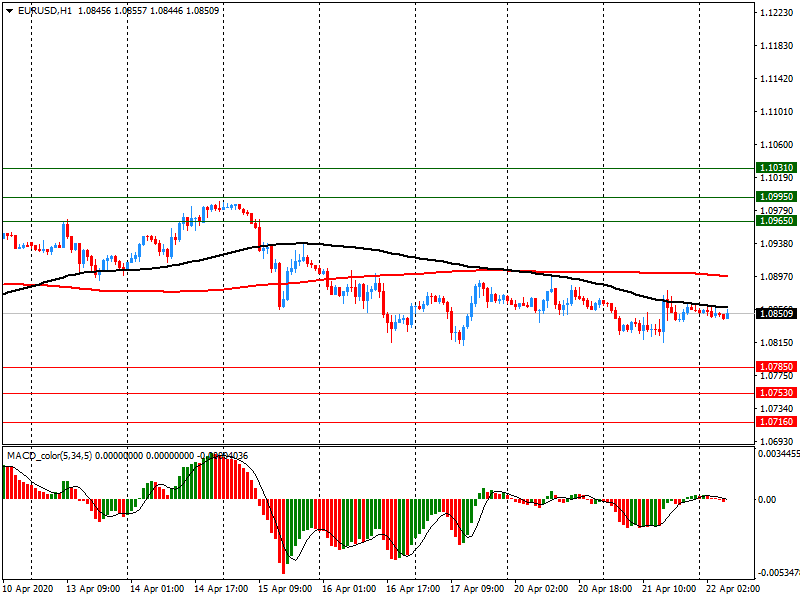
Comments:
- Overall open interest on the CALL options and PUT options with the expiration date May, 8 is 68457 contracts (according to data from April, 21) with the maximum number of contracts with strike price $1,1200 (3498);
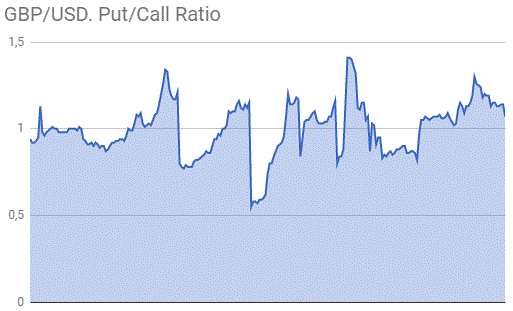
GBP/USD
Resistance levels (open interest**, contracts)
$1.2563 (545)
$1.2512 (292)
$1.2464 (203)
Price at time of writing this review: $1.2299
Support levels (open interest**, contracts):
$1.2236 (603)
$1.2156 (762)
$1.2070 (308)
Comments:
- Overall open interest on the CALL options with the expiration date May, 8 is 16428 contracts, with the maximum number of contracts with strike price $1,2700 (1713);
- Overall open interest on the PUT options with the expiration date May, 8 is 16854 contracts, with the maximum number of contracts with strike price $1,2850 (1073);
- The ratio of PUT/CALL was 1.03 versus 1.02 from the previous trading day according to data from April, 21
* - The Chicago Mercantile Exchange bulletin (CME) is used for the calculation.
** - Open interest takes into account the total number of option contracts that are open at the moment.
| Raw materials | Closed | Change, % |
|---|---|---|
| Brent | 18.95 | -25.77 |
| WTI | 2.39 | -83.2 |
| Silver | 14.85 | -2.88 |
| Gold | 1682.976 | -0.64 |
| Palladium | 1924.83 | -10.98 |
| Index | Change, points | Closed | Change, % |
|---|---|---|---|
| NIKKEI 225 | -388.34 | 19280.78 | -1.97 |
| Hang Seng | -536.47 | 23793.55 | -2.2 |
| KOSPI | -18.98 | 1879.38 | -1 |
| ASX 200 | -131.7 | 5221.3 | -2.46 |
| FTSE 100 | -171.8 | 5641.03 | -2.96 |
| DAX | -426.05 | 10249.85 | -3.99 |
| CAC 40 | -170.84 | 4357.46 | -3.77 |
| Dow Jones | -631.56 | 23018.88 | -2.67 |
| S&P 500 | -86.6 | 2736.56 | -3.07 |
| NASDAQ Composite | -297.5 | 8263.23 | -3.48 |
| Time | Country | Event | Period | Previous value | Forecast |
|---|---|---|---|---|---|
| 01:30 | Australia | Leading Index | March | -0.4% | |
| 06:00 | United Kingdom | Retail Price Index, m/m | March | 0.5% | -0.2% |
| 06:00 | United Kingdom | Producer Price Index - Output (YoY) | March | 0.4% | 0% |
| 06:00 | United Kingdom | Producer Price Index - Input (MoM) | March | 0.9% | -3.5% |
| 06:00 | United Kingdom | Producer Price Index - Input (YoY) | March | 2.1% | -3.6% |
| 06:00 | United Kingdom | Producer Price Index - Output (MoM) | March | -0.3% | -0.4% |
| 06:00 | United Kingdom | Retail prices, Y/Y | March | 2.5% | 2.3% |
| 06:00 | United Kingdom | HICP ex EFAT, Y/Y | March | 1.7% | |
| 06:00 | United Kingdom | HICP, m/m | March | 0.4% | 0% |
| 06:00 | United Kingdom | HICP, Y/Y | March | 1.7% | 1.5% |
| 12:30 | Canada | New Housing Price Index, MoM | March | 0.4% | |
| 12:30 | Canada | New Housing Price Index, YoY | March | 0.6% | |
| 12:30 | Canada | Consumer Price Index m / m | March | 0.4% | -0.4% |
| 12:30 | Canada | Bank of Canada Consumer Price Index Core, y/y | March | 1.8% | |
| 12:30 | Canada | Consumer price index, y/y | March | 2.2% | 1.3% |
| 13:00 | U.S. | Housing Price Index, m/m | February | 0.3% | |
| 14:00 | Eurozone | Consumer Confidence | April | -11.6 | -19.3 |
| 14:30 | U.S. | Crude Oil Inventories | April | 19.248 |
| Pare | Closed | Change, % |
|---|---|---|
| AUDUSD | 0.62846 | -0.73 |
| EURJPY | 116.999 | 0.04 |
| EURUSD | 1.08553 | -0.11 |
| GBPJPY | 132.454 | -1.05 |
| GBPUSD | 1.22946 | -1.14 |
| NZDUSD | 0.59619 | -1.13 |
| USDCAD | 1.41906 | 0.43 |
| USDCHF | 0.96884 | 0.18 |
| USDJPY | 107.741 | 0.12 |


© 2000-2026. All rights reserved.
This site is managed by Teletrade D.J. LLC 2351 LLC 2022 (Euro House, Richmond Hill Road, Kingstown, VC0100, St. Vincent and the Grenadines).
The information on this website is for informational purposes only and does not constitute any investment advice.
The company does not serve or provide services to customers who are residents of the US, Canada, Iran, The Democratic People's Republic of Korea, Yemen and FATF blacklisted countries.
Making transactions on financial markets with marginal financial instruments opens up wide possibilities and allows investors who are willing to take risks to earn high profits, carrying a potentially high risk of losses at the same time. Therefore you should responsibly approach the issue of choosing the appropriate investment strategy, taking the available resources into account, before starting trading.
Use of the information: full or partial use of materials from this website must always be referenced to TeleTrade as the source of information. Use of the materials on the Internet must be accompanied by a hyperlink to teletrade.org. Automatic import of materials and information from this website is prohibited.
Please contact our PR department if you have any questions or need assistance at pr@teletrade.global.
transfers