- Analytics
- News and Tools
- Market News
CFD Markets News and Forecasts — 23-01-2019
| Time | Country | Event | Period | Previous value | Forecast |
|---|---|---|---|---|---|
| 00:30 | Japan | Manufacturing PMI | January | 52.6 | |
| 00:30 | Australia | Unemployment rate | December | 5.1% | 5.1% |
| 00:30 | Australia | Changing the number of employed | December | 37 | 16.5 |
| 05:00 | Japan | Leading Economic Index | November | 99.6 | 99.3 |
| 05:00 | Japan | Coincident Index | November | 104.9 | 103 |
| 08:15 | France | Manufacturing PMI | January | 49.7 | 49.9 |
| 08:15 | France | Services PMI | January | 49 | 50.5 |
| 08:30 | Germany | Services PMI | January | 51.8 | 52.1 |
| 08:30 | Germany | Manufacturing PMI | January | 51.5 | 51.3 |
| 09:00 | Eurozone | Manufacturing PMI | January | 51.4 | 51.4 |
| 09:00 | Eurozone | Services PMI | January | 51.2 | 51.5 |
| 12:45 | Eurozone | ECB Interest Rate Decision | 0% | 0% | |
| 13:30 | U.S. | Continuing Jobless Claims | 1737 | 1735 | |
| 13:30 | U.S. | Initial Jobless Claims | 213 | 220 | |
| 13:30 | Eurozone | ECB Press Conference | |||
| 14:45 | U.S. | Services PMI | January | 54.4 | 54.1 |
| 14:45 | U.S. | Manufacturing PMI | January | 53.8 | 53.5 |
| 15:00 | U.S. | Leading Indicators | December | 0.2% | -0.1% |
| 16:00 | U.S. | Crude Oil Inventories | January | -2.683 | -0.435 |
| 21:45 | New Zealand | Visitor Arrivals | November | 4.8% | |
| 23:30 | Japan | Tokyo CPI ex Fresh Food, y/y | January | 0.9% | 0.9% |
| 23:30 | Japan | Tokyo Consumer Price Index, y/y | January | 0.3% |
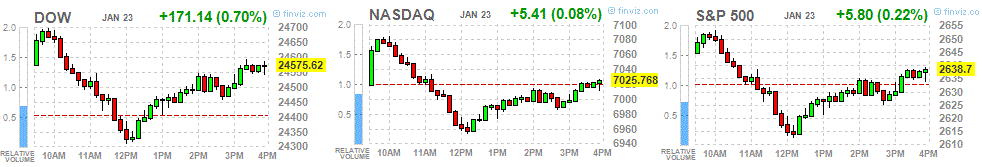
Major US stock indices rose slightly due to positive earnings reports from IBM, United Technologies and Procter & Gamble, as well as improved utility sector quotes.
In addition, as it became known, the production activity of the Fifth District has noticeably improved in January, and exceeded experts' forecasts, according to the latest Richmond Fed survey. The index of manufacturing activity from the Richmond Federal Reserve Bank rose to -2 points from -8 points in December. It was expected that the index will be -6 points. The increase in the index in January was due to an increase in the employment and supply components. The index of new orders fell to −11 points (the lowest since June 2016). Meanwhile, the index of outstanding orders fell to −21 points, which is the lowest since May 2009. However, manufacturers were optimistic that conditions will improve in the coming months.
Most of the components of DOW recorded an increase (18 out of 30). The growth leader was the shares of International Business Machines Corporation (IBM, + 8.66%). The outsider was Exxon Mobil Corporation (XOM, -0.79%).
Most sectors of the S & P ended in a plus. The largest growth was shown by the utility sector (+ 1.0%), the largest decrease was by the base materials sector (-0.5%)
At the time of closing:
Dow 24,575.62 +171.14 +0.70%
S & P 500 2,638.70 +5.80 +0.22%
Nasdaq 100 7,025.77 +5.41 +0.08%
| Time | Country | Event | Period | Previous value | Forecast |
|---|---|---|---|---|---|
| 00:30 | Japan | Manufacturing PMI | January | 52.6 | |
| 00:30 | Australia | Unemployment rate | December | 5.1% | 5.1% |
| 00:30 | Australia | Changing the number of employed | December | 37 | 16.5 |
| 05:00 | Japan | Leading Economic Index | November | 99.6 | 99.3 |
| 05:00 | Japan | Coincident Index | November | 104.9 | 103 |
| 08:15 | France | Manufacturing PMI | January | 49.7 | 49.9 |
| 08:15 | France | Services PMI | January | 49 | 50.5 |
| 08:30 | Germany | Services PMI | January | 51.8 | 52.1 |
| 08:30 | Germany | Manufacturing PMI | January | 51.5 | 51.3 |
| 09:00 | Eurozone | Manufacturing PMI | January | 51.4 | 51.4 |
| 09:00 | Eurozone | Services PMI | January | 51.2 | 51.5 |
| 12:45 | Eurozone | ECB Interest Rate Decision | 0% | 0% | |
| 13:30 | U.S. | Continuing Jobless Claims | 1737 | 1735 | |
| 13:30 | U.S. | Initial Jobless Claims | 213 | 220 | |
| 13:30 | Eurozone | ECB Press Conference | |||
| 14:45 | U.S. | Services PMI | January | 54.4 | 54.1 |
| 14:45 | U.S. | Manufacturing PMI | January | 53.8 | 53.5 |
| 15:00 | U.S. | Leading Indicators | December | 0.2% | -0.1% |
| 16:00 | U.S. | Crude Oil Inventories | January | -2.683 | -0.435 |
| 21:45 | New Zealand | Visitor Arrivals | November | 4.8% | |
| 23:30 | Japan | Tokyo CPI ex Fresh Food, y/y | January | 0.9% | 0.9% |
| 23:30 | Japan | Tokyo Consumer Price Index, y/y | January | 0.3% |
The composite index rose from −8 in December to −2 in January but continued to indicate weak growth. The rise from December came from increases in the component indexes of employment and shipments, although the shipments index remained negative. The third component, new orders, dropped to −11, its lowest reading since June 2016. Meanwhile, the index for backlog of orders fell to −21, its lowest reading since May 2009. However, manufacturers remained optimistic that conditions would improve in the coming months.
U.S. house prices rose in November, up 0.4 percent from the previous month, according to the Federal Housing Finance Agency (FHFA) seasonally adjusted monthly House Price Index (HPI). The previously reported 0.3 percent increase in October was revised to reflect a 0.4 percent increase.
The FHFA monthly HPI is calculated using home sales price information from mortgages sold to, or guaranteed by, Fannie Mae and Freddie Mac. From November 2017 to November 2018, house prices were up 5.8 percent.
For the nine census divisions, seasonally adjusted monthly price changes from October 2018 to November 2018 ranged from -0.8 percent in the Pacific division to +1.1 percent in the South Atlantic division. The 12-month changes were all positive, ranging from +4.5 percent in the West South Central division to +7.4 percent in the Mountain division.
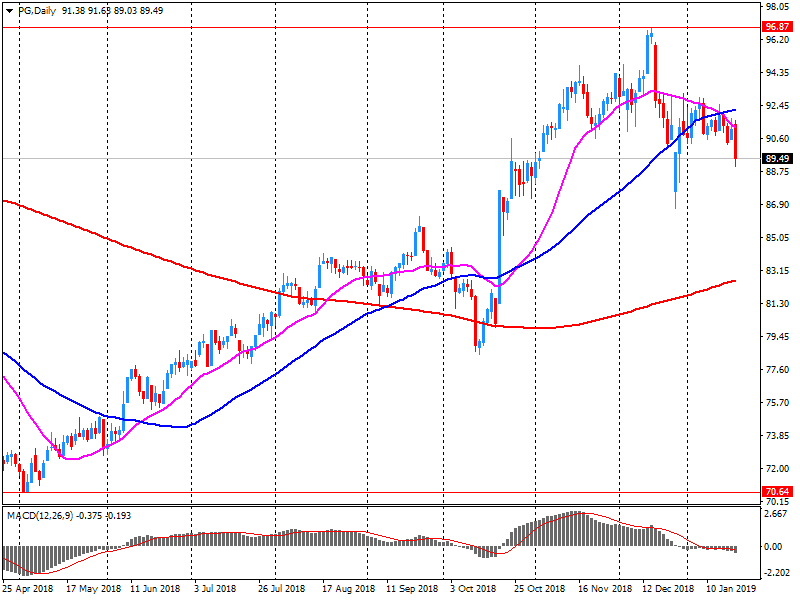
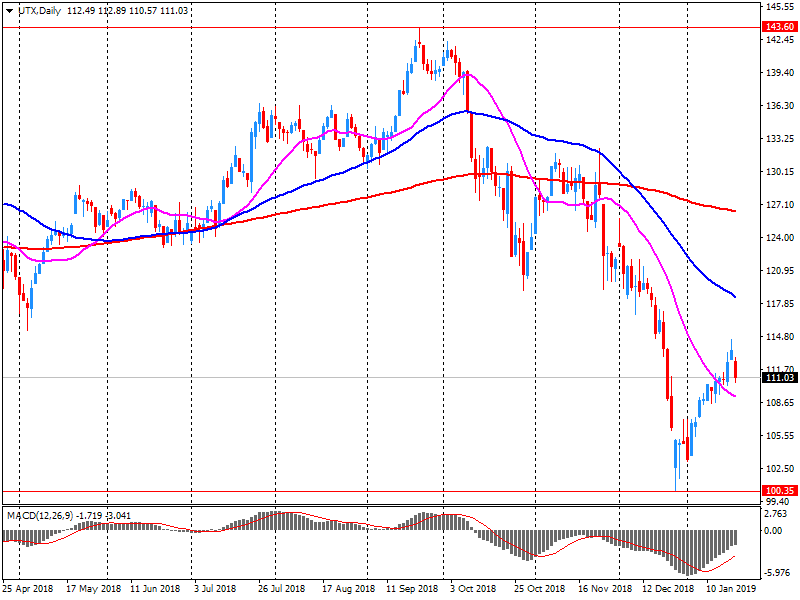
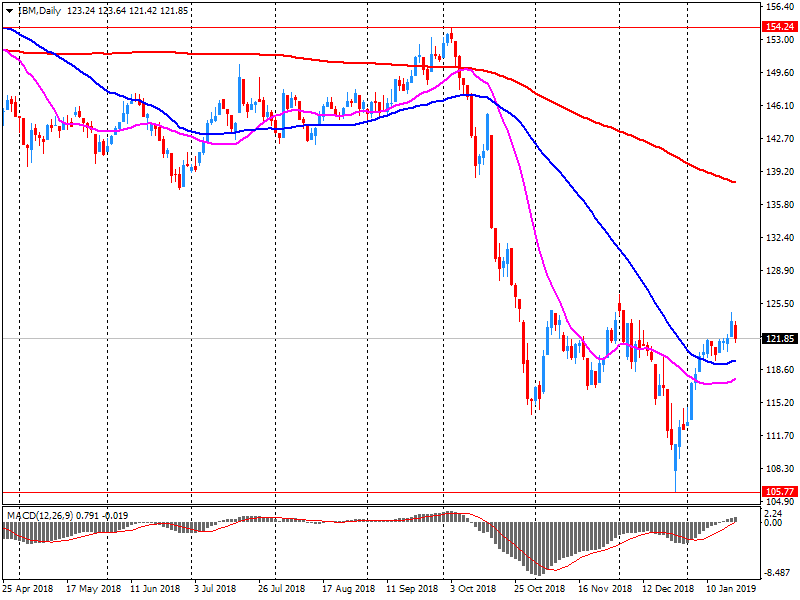
U.S. stock-index futures pointed to a higher open on Wednesday after the release of strong quarterly results from companies like IBM (IBM), United Technologies (UTX) and Procter & Gamble (PG).
Global Stocks:
Index/commodity | Last | Today's Change, points | Today's Change, % |
Nikkei | 20,593.72 | -29.19 | -0.14% |
Hang Seng | 27,008.20 | +2.75 | +0.01% |
Shanghai | 2,581.00 | +1.30 | +0.05% |
S&P/ASX | 5,843.70 | -15.10 | -0.26% |
FTSE | 6,880.47 | -20.92 | -0.30% |
CAC | 4,866.01 | +18.48 | +0.38% |
DAX | 11,116.50 | +26.39 | +0.24% |
Crude | $53.27 | +0.49% | |
Gold | $1,287.10 | -0.19% |
Excluding these two subsectors, retail sales increased 0.2%.
Sales were down in 6 of 11 subsectors, representing 75% of retail trade.
After removing the effects of price changes, retail sales in volume terms declined 0.4%.
Sales at gasoline stations declined for the third time in four months, decreasing 5.0% in November. The decline was largely attributable to lower prices at the pump. In volume terms, sales were down 1.5%.
Sales at motor vehicle and parts dealers (-1.8%) decreased for the first time in four months. Sales were down in three of the four store types within this subsector, with the largest decline at new car dealers (-1.9%).
Lower sales at food and beverage stores (-0.9%) were attributable to a 1.2% sales decrease at supermarkets and other grocery stores.
(company / ticker / price / change ($/%) / volume)
3M Co | MMM | 192.53 | 0.27(0.14%) | 1421 |
ALCOA INC. | AA | 28.03 | 0.22(0.79%) | 10710 |
ALTRIA GROUP INC. | MO | 45.15 | 0.18(0.40%) | 13222 |
Amazon.com Inc., NASDAQ | AMZN | 1,647.78 | 15.61(0.96%) | 73312 |
American Express Co | AXP | 100.09 | 0.26(0.26%) | 2208 |
Apple Inc. | AAPL | 153.9 | 0.60(0.39%) | 96200 |
AT&T Inc | T | 30.68 | 0.10(0.33%) | 17986 |
Boeing Co | BA | 360.61 | 2.71(0.76%) | 12969 |
Caterpillar Inc | CAT | 133.01 | 0.77(0.58%) | 18331 |
Chevron Corp | CVX | 113 | 0.66(0.59%) | 2349 |
Cisco Systems Inc | CSCO | 44.91 | 0.13(0.29%) | 11602 |
Citigroup Inc., NYSE | C | 62.06 | 0.21(0.34%) | 15978 |
Exxon Mobil Corp | XOM | 72.04 | 0.15(0.21%) | 1947 |
Facebook, Inc. | FB | 148.3 | 0.73(0.49%) | 51274 |
Ford Motor Co. | F | 8.54 | 0.04(0.47%) | 57576 |
Freeport-McMoRan Copper & Gold Inc., NYSE | FCX | 12.4 | 0.02(0.16%) | 9917 |
General Electric Co | GE | 8.73 | 0.07(0.81%) | 382694 |
General Motors Company, NYSE | GM | 38.45 | 0.30(0.79%) | 1259 |
Goldman Sachs | GS | 198.24 | 0.56(0.28%) | 4624 |
Google Inc. | GOOG | 1,077.77 | 7.25(0.68%) | 1754 |
Home Depot Inc | HD | 177.29 | 0.18(0.10%) | 1119 |
Intel Corp | INTC | 48.46 | 0.19(0.39%) | 44059 |
International Business Machines Co... | IBM | 131.4 | 8.88(7.25%) | 245332 |
International Paper Company | IP | 46.52 | 0.78(1.71%) | 840 |
Johnson & Johnson | JNJ | 128.9 | 0.10(0.08%) | 3815 |
JPMorgan Chase and Co | JPM | 103.23 | 0.29(0.28%) | 5852 |
McDonald's Corp | MCD | 184.61 | 0.04(0.02%) | 1811 |
Merck & Co Inc | MRK | 75.34 | -0.49(-0.65%) | 1757 |
Microsoft Corp | MSFT | 106.04 | 0.36(0.34%) | 78219 |
Nike | NKE | 80.9 | 0.15(0.19%) | 2279 |
Pfizer Inc | PFE | 41.96 | -0.31(-0.73%) | 18290 |
Procter & Gamble Co | PG | 94.23 | 3.79(4.19%) | 231733 |
Starbucks Corporation, NASDAQ | SBUX | 65.75 | 0.36(0.55%) | 17177 |
Tesla Motors, Inc., NASDAQ | TSLA | 292.55 | -6.37(-2.13%) | 222584 |
The Coca-Cola Co | KO | 47.82 | 0.10(0.21%) | 1635 |
Twitter, Inc., NYSE | TWTR | 32.45 | 0.20(0.62%) | 49618 |
United Technologies Corp | UTX | 115.8 | 4.74(4.27%) | 123355 |
UnitedHealth Group Inc | UNH | 266.65 | 0.96(0.36%) | 5192 |
Verizon Communications Inc | VZ | 57 | 0.01(0.02%) | 2446 |
Visa | V | 138.51 | 0.46(0.33%) | 4861 |
Wal-Mart Stores Inc | WMT | 98.7 | 1.21(1.24%) | 14535 |
Walt Disney Co | DIS | 110.99 | 0.39(0.35%) | 2890 |
Yandex N.V., NASDAQ | YNDX | 31.17 | 0.64(2.10%) | 7024 |
Tesla (TSLA) downgraded to Underperform from Sector Perform at RBC Capital Mkts
Merck (MRK) downgraded to Market Perform from Outperform at BMO Capital Markets
Pfizer (PFE) downgraded to Neutral from Buy at UBS
Wal-Mart (WMT) upgraded to Overweight from Equal-Weight at Morgan Stanley
Procter & Gamble (PG) reported Q4 FY 2018 earnings of $1.25 per share (versus $1.19 in Q4 FY 2017), beating analysts’ consensus estimate of $1.21.
The company’s quarterly revenues amounted to $17.438 bln (+0.2% y/y), beating analysts’ consensus estimate of $17.158 bln.
PG rose to $94.17 (+4.12%) in pre-market trading.
United Tech (UTX) reported Q4 FY 2018 earnings of $1.95 per share (versus $1.60 in Q4 FY 2017), beating analysts’ consensus estimate of $1.53.
The company’s quarterly revenues amounted to $18.044 bln (+15.1% y/y), beating analysts’ consensus estimate of $16.872 bln.
The company also issued guidance for FY 2019, projecting EPS of $7.70-8.00 (versus analysts’ consensus estimate of $7.80) and revenues of $75.5-77 bln (versus analysts’ consensus estimate of $77.18 bln).
UTX rose to $114.54 (+3.13%) in pre-market trading.
IBM (IBM) reported Q4 FY 2018 earnings of $4.87 per share (versus $5.18 in Q4 FY 2017), beating analysts’ consensus estimate of $4.82.
The company’s quarterly revenues amounted to $21.760 bln (-3.5% y/y), generally in line with analysts’ consensus estimate of $21.793 bln.
The company also issued upside guidance for FY 2019, projecting EPS of at least $13.90 versus analysts’ consensus estimate of $13.81.
IBM rose to $130.39 (+6.42%) in pre-market trading.
The survey of 326 manufacturing firms showed that output grew at a pace above the long-run average in the three months to January, a little slower than in the three months to December. Manufacturers expect volumes to continue growing at a similar pace over the next three months.
New domestic orders were unchanged over the past three months, stabilising from a fall in the previous quarter, which was the first decline in three years. While new export orders picked up following a fall in the three months to October, growth was weak and well below the highs seen in mid-2018. Overall order books remained strong, with export order books particularly robust.
According to the channel, Britain will lose access to some of the important information and a number of key EU computer data-bases, in the case of a no-deal.
As noted, this will lead to a “worsening situation” in the area of border security in Britain.
I do not think that the planned increase in sales tax will have a big impact on the economy
We closely monitor the scale of the spring wage increase
I do not expect a big downturn in the global economy
It is vital to first reach the inflation target, and then normalize the policy
I don’t think it’s worth raising interest rates now.
Japan's ratings balance the strengths of an advanced and wealthy economy, with high governance standards and strong public institutions, against weak medium-term growth prospects and high public debt. The country has strong external finances underpinned by a persistent current account surplus and large net external credit and international investment positions relative to peers. A high stock of domestic savings contributes to the economy's external resilience, as reflected in perceptions of Japan as a safe haven.
At the same time, Japan's gross general government debt (GGGD) of around 230% of GDP is the highest among Fitch-rated sovereigns. The economy's intrinsic financial strengths could be eroded over time in the absence of effective reforms to boost potential growth and address the public debt burden, says Fitch.
Median real GDP forecast for the 2020/21 fiscal year: + 1.0% versus 0.8% in October
Median real GDP forecast for fiscal year 2018/19: + 0.9% versus 1.4% in October
supports JGB's 10-year Target Yield Near Zero
leaves unchanged the obligation to buy JGBs in a flexible way, so its reserves increase at an annual rate of about Y80 trillion
leaves unchanged rate recommendations, says will keep current extremely low rates for a long period of time
the decision to control the yield curve is made by 7-2 votes, members of the board of directors. Harada, Kataoka disagree
Bank of Japan decides to extend the March term for a credit scheme aimed at encouraging financial institutions to increase lending
Extend the loan scheme for one year
Japan's economy is expected to continue to expand until 2020.
the economy’s momentum for achieving the inflation target is steady but lacks strength
risks to inflation forecast skewed down
risks to economic outlook skewed down
mid-term and long-term inflation expectations have remained more or less unchanged.
decides to extend the loan scheme to support the growth fundament for another year
expect consumer prices to rise gradually to 2 percent
we expect foreign economies to continue their steady growth, although they should pay attention to trade tensions between the USA and China and various recent steps
The average baseline consumer price forecast for the 2019/20 fiscal year is reduced to + 0.9% against + 1.4% in October
Median base consumer price forecast for the 2020/21 fiscal year at + 1.4% versus + 1.5% in October
The average basic consumer price forecast for the 2018/19 fiscal year will be + 0.8% against + 0.9% in October
EUR/USD
Resistance levels (open interest**, contracts)
$1.1502 (2381)
$1.1476 (450)
$1.1441 (547)
Price at time of writing this review: $1.1370
Support levels (open interest**, contracts):
$1.1339 (3787)
$1.1309 (5085)
$1.1274 (2577)
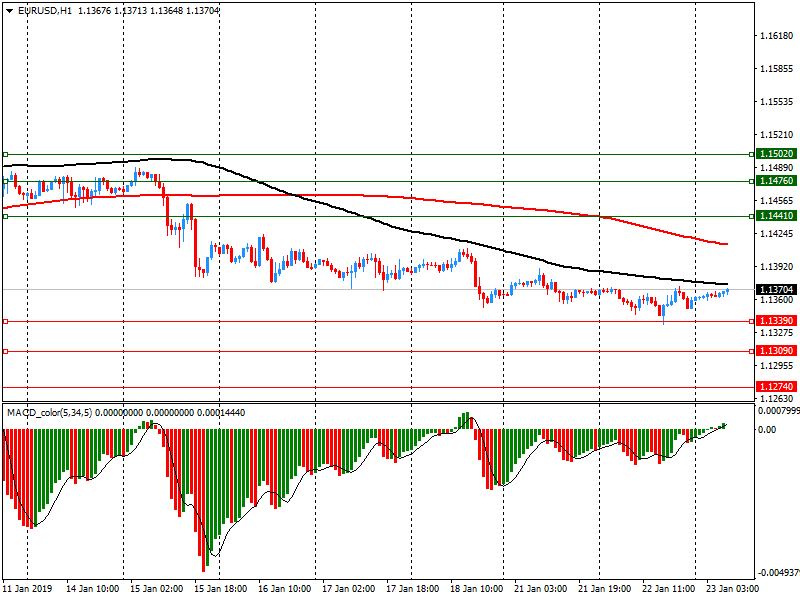
Comments:
- Overall open interest on the CALL options and PUT options with the expiration date February, 8 is 71614 contracts (according to data from January, 22) with the maximum number of contracts with strike price $1,1600 (5813);
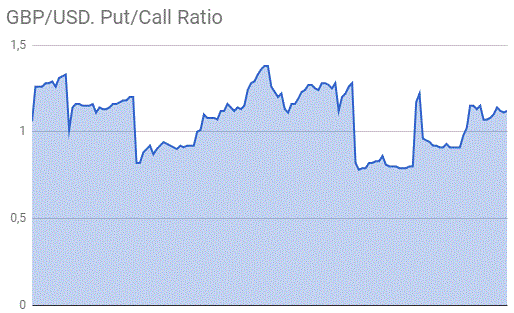
GBP/USD
Resistance levels (open interest**, contracts)
$1.3082 (639)
$1.3051 (1244)
$1.3029 (549)
Price at time of writing this review: $1.2953
Support levels (open interest**, contracts):
$1.2868 (579)
$1.2841 (223)
$1.2811 (492)

Comments:
- Overall open interest on the CALL options with the expiration date February, 8 is 23390 contracts, with the maximum number of contracts with strike price $1,3000 (1965);
- Overall open interest on the PUT options with the expiration date February, 8 is 26187 contracts, with the maximum number of contracts with strike price $1,2600 (1930);
- The ratio of PUT/CALL was 1.12 versus 1.12 from the previous trading day according to data from January, 22
* - The Chicago Mercantile Exchange bulletin (CME) is used for the calculation.
** - Open interest takes into account the total number of option contracts that are open at the moment.
| Raw materials | Closed | Change, % |
|---|---|---|
| Brent | 61.37 | -1.9 |
| WTI | 52.96 | -2.14 |
| Silver | 15.31 | 0.39 |
| Gold | 1284.915 | 0.38 |
| Palladium | 1346.12 | -0.87 |
| Index | Change, points | Closed | Change, % |
|---|---|---|---|
| NIKKEI 225 | -96.42 | 20622.91 | -0.47 |
| Hang Seng | -191.09 | 27005.45 | -0.7 |
| KOSPI | -6.84 | 2117.77 | -0.32 |
| ASX 200 | -31.6 | 5858.8 | -0.54 |
| FTSE 100 | -69.2 | 6901.39 | -0.99 |
| Dow Jones | -301.87 | 24404.48 | -1.22 |
| S&P 500 | -37.81 | 2632.9 | -1.42 |
| NASDAQ Composite | -136.87 | 7020.36 | -1.91 |
| Pare | Closed | Change, % |
|---|---|---|
| AUDUSD | 0.71201 | -0.52 |
| EURJPY | 124.225 | -0.31 |
| EURUSD | 1.13591 | -0.05 |
| GBPJPY | 141.687 | 0.24 |
| GBPUSD | 1.29561 | 0.51 |
| NZDUSD | 0.67473 | 0.27 |
| USDCAD | 1.33532 | 0.45 |
| USDCHF | 0.99719 | 0.03 |
| USDJPY | 109.359 | -0.26 |


© 2000-2026. All rights reserved.
This site is managed by Teletrade D.J. LLC 2351 LLC 2022 (Euro House, Richmond Hill Road, Kingstown, VC0100, St. Vincent and the Grenadines).
The information on this website is for informational purposes only and does not constitute any investment advice.
The company does not serve or provide services to customers who are residents of the US, Canada, Iran, The Democratic People's Republic of Korea, Yemen and FATF blacklisted countries.
Making transactions on financial markets with marginal financial instruments opens up wide possibilities and allows investors who are willing to take risks to earn high profits, carrying a potentially high risk of losses at the same time. Therefore you should responsibly approach the issue of choosing the appropriate investment strategy, taking the available resources into account, before starting trading.
Use of the information: full or partial use of materials from this website must always be referenced to TeleTrade as the source of information. Use of the materials on the Internet must be accompanied by a hyperlink to teletrade.org. Automatic import of materials and information from this website is prohibited.
Please contact our PR department if you have any questions or need assistance at pr@teletrade.global.
transfers