- Analytics
- News and Tools
- Market News
CFD Markets News and Forecasts — 27-03-2023
- NZD/USD rebounds from 0.6181 low as Silicon Valley Bank deal eases banking crisis concerns.
- Making inflation their top priority, Fed officials.
- Upcoming US Personal Consumption Expenditure (PCE) data release to influence US Dollar dynamics.
The NZD/USD currency pair experienced a slight rebound after reaching the 0.6181 mark, following a significant decline over several days due to jittery market sentiment amid the ongoing banking crisis.
The New Zealand dollar struggled last week as bank stress impacted risk appetites. However, on Monday, the risk-sensitive currency found some support following the Silicon Valley Bank (SVB) deal and the Federal Deposit Insurance Corporation's (FDIC) confirmation that First Citizens bank would assume all deposits and loans of Silicon Valley Bridge Bank from the FDIC.
Bloomberg reported that US regulators are considering expanding an emergency lending facility for banks, allowing First Republic Bank (FRC) more time to strengthen its balance sheet.
Over the weekend, Federal Reserve (Fed) voter Kashkari spoke with a dovish tone, emphasizing the uncertainty of the banking crisis's impact on the economy and the Fed's close monitoring of the situation. This contrasts with the hawkish views of non-voting colleagues Barkin and Bullard, who focused on addressing inflation over financial stability.
Fed Vice-Chair of Supervision Barr, in recent testimony, reassured that the banking system remains sound and resilient, with the Fed committed to ensuring deposit safety. He also discussed planned regulations to enhance the financial system's resiliency, including long-term debt requirements for large banks, improved stress testing, and exploration of liquidity rules and other reforms.
Market focus now shifts to the upcoming US Personal Consumption Expenditure (PCE) data release later this week, which will likely shape US Dollar dynamics.
Levels to watch
- AUD/NZD has shown a decent recovery from 1.0720 ahead of the release of the Aussie retail demand data.
- Australian inflation has remained extremely stubborn led by a shortage of labor and robust demand.
- RBA policymakers would maintain their intention of pausing the policy-tightening spell from its April meeting if inflation decelerates.
The AUD/NZD pair has sensed strength after a correction to near 1.0720 in the early Asian session. The cross is likely to show some action as the Australian Bureau of Statistics will report February’s monthly Retail Sales data. According to the estimates, the economic data is expected to expand by 0.4% lower than the former expansion of 1.9%.
Inflationary pressures in the Australian economy have remained extremely stubborn led by a shortage of labor and robust demand by households. The Reserve Bank of Australia (RBA) has already pushed its Official Cash Rate (OCR) to 3.60% to bring down persistent inflation, however, the Consumer Price Index (CPI) has not reacted in tandem with the velocity of hiking rates. Going forward, softening of retail demand would provide some relief to RBA Governor Philip Lowe and other policymakers.
This week, Australia’s monthly inflation data (Feb) will be keenly watched. Australia’s monthly inflation decelerated dramatically from 8.4% to 7.4% in January, which has cemented hopes of investors that the momentum would continue. The street is anticipating a decline in monthly CPI to 7.1% from the former release of 7.4%. An occurrence of the same would allow RBA policymakers to maintain their intention of pausing the policy-tightening spell from its April meeting.
On the New Zealand Dollar front, investors are worried about the economic outlook of the kiwi economy as flood situation has dented the sentiment of households. This week, investors will focus on New Zealand Building Permits (Feb) data. The economic data is expected to expand by 05% against a contraction of 1.5% witnessed earlier.
Retail Sales Overview
Early Tuesday, the market sees preliminary readings of Australia's seasonally adjusted Retail Sales for February month at 00:30 GMT. Market consensus suggests a softer seasonally adjusted monthly print of 0.4% versus 1.9% prior, suggesting a reduction in the pressure for the Reserve Bank of Australia (RBA) to act faster to tame inflation woes.
Given the recently softer Aussie inflation data and the mixed comments from the Reserve Bank of Australia's (RBA) officials, not to forget the challenges to sentiment ahead of the month-end consolidation, today’s Aussie Retail Sales data appears crucial for the AUD/USD traders.
It should be noted that comments from Assistant Governor (Economic) at the Reserve Bank of Australia, Luci Ellis, scheduled for 04:15 AM GMT, also increase the importance of the Asia-Pacific economic calendar on Tuesday.
Ahead of the data, Westpac said,
Our Westpac Card Tracker suggests the underlying trend in retail slowed further in Feb, dipping into negative on a rolling 3mth basis. That said, the volatile monthly profile since Nov, and the big decline in Dec in particular, mean the Feb month is still likely to see a gain vs Jan. A 0.5% rise will still leave retail sales down 1.4% on a 3mth basis (i.e. Dec-Jan-Feb vs Sep-Oct-Nov). With retail prices still rising, this suggests there has been a more pronounced weakening in sales volumes.
How could it affect AUD/USD?
AUD/USD extends the week-start rebound to refresh intraday high around 0.6660 heading into the key Aussie event. It’s worth noting that the firmer sentiment and broad US Dollar weakness underpins the risk-barometer pair’s latest run-up while the pre-data anxiety seems to test the bulls of late.
That said, the recent chatters surrounding the Aussie recession, amid fears of comparatively higher rates in Australia than the US, may also seek validation from today’s Aussie Retail Sales data. Hence, recovery in the key statistics may allow the AUD/USD buyers to extend the latest rebound to cross the immediate technical hurdle while a negative surprise, which is more likely, could recall the Aussie pair buyer by highlighting the hawkish Fed concerns.
It should be noted, however, that Wednesday’s Aussie Consumer Price Index (CPI) also increases the importance of today’s Retail Sales data as any disappointment from the figures could prod the firmer inflation-led run-up of the AUD/USD pair.
Technically, AUD/USD rebound remains elusive unless providing a sustained daily close beyond 0.6700 support-turned-resistance comprising lower line of the short-term rising wedge.
Key Notes
AUD/USD continues to juggle below 0.6660 ahead of Australian Retail Sales and CPI data
AUD/USD Forecast: More weakness below 0.6630
About Australian Retail Sales
The Retail Sales released by the Australian Bureau of Statistics is a survey of goods sold by retailers based on a sampling of retail stores of different types and sizes and it's considered an indicator of the pace of the Australian economy. It shows the performance of the retail sector over the short and mid-term. Positive economic growth anticipates bullish trends for the AUD, while a low reading is seen as negative or bearish.
North Korean leader Kim Jong Un called for scaling up weapons-grade nuclear materials to increase the country's nuclear arsenal, saying it should be fully ready to use the weapons at any time, state media KCNA said on Tuesday.
His remarks suggest he will continue provocative weapons tests in a pressure campaign to wrest concessions from the US and its allies. The parade on Monday night was to mark the 90th anniversary of North Korea’s army and was held as the country’s economy is battered by pandemic-related difficulties, punishing US-led sanctions and its own mismanagement.
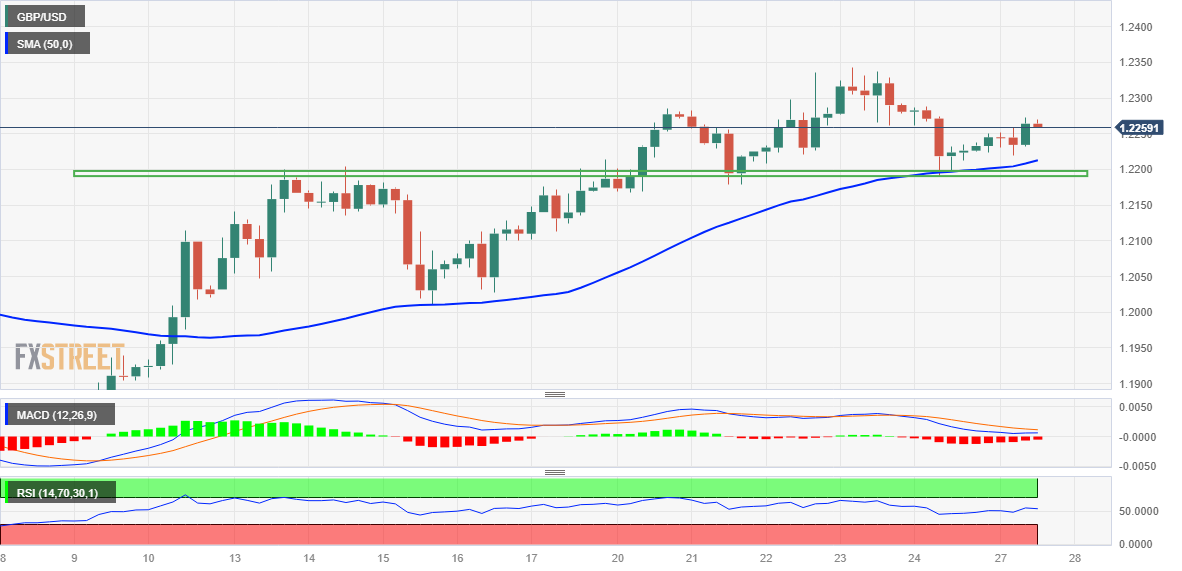
- GBP/USD picks up bids to extend week-start recovery moves from short-term key support.
- 50-SMA, 61.8% Fibonacci retracement level challenge bears amid looming bull cross on the MACD.
- Rising wedge confirmation keeps Cable sellers hopeful unless the quote stays below 1.2330 previous support.
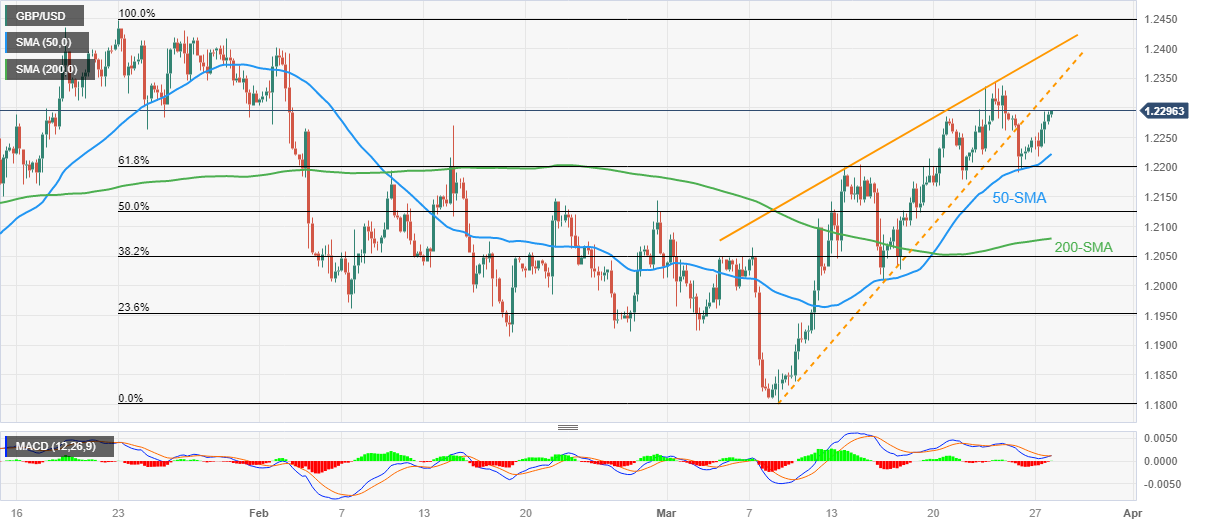
GBP/USD remains on the front foot as bulls attack the 1.2300 mark during Tuesday’s Asian session, following an upbeat start of the week.
In doing so, the Cable pair stretches the previous run-up from the 50-bar Simple Moving Average (SMA) and the 61.8% Fibonacci retracement level of the quote’s January-March downside. Adding strength to the upside bias could be the impending bulls cross on the MACD.
However, the previous week’s confirmation of the rising wedge bearish chart pattern keeps the Cable pair sellers hopeful unless the quote stays below the previous support line of the wedge, near 1.2330 by the press time.
Following that, the stated wedge’s top line near the 1.2400 round figure and multiple hurdles near the 1.2420-25 area can test the GBP/USD pair’s further upside ahead of directing it to the Year-To-Date (YTD) top surrounding 1.2450.
On the flip side, the 50-SMA and the aforementioned key Fibonacci ratio can challenge short-term GBP/USD bears around 1.2220 and 1.2200 respectively.
In a case where the Cable pair remains bearish past 1.2200, the 50% Fibonacci retracement and 200-SMA can test the downside moves around 1.2125 and 1.2080 in that order before directing bears towards the 1.2000 psychological magnet.
It should be noted that multiple supports near 1.1920 act as the last defense of the GBP/USD buyers.
GBP/USD: Four-hour chart
Trend: Further upside expected
- USD/CHF is expected to deliver a breakdown below 0.9150 on hopes that Fed won’t be heavy on interest rates.
- The street is anticipating that tight credit conditions by US banks are sufficient to bring down inflation further.
- Swiss ZEW Survey- Expectations (March) might decline heavily to -18.9 from the former release of -12.3.
The USD/CHF pair looks vulnerable above the immediate cushion of 0.9150 in the Asian session. The Swiss franc asset is expected to break down the aforementioned support as odds for an unchanged monetary policy by the Federal Reserve (Fed) are advancing.
S&P500 futures have extended their gains after a positive Monday on hopes that the United States banking system will get to the road of recovery sooner and the Fed won’t be heavy on interest rates from now, portraying positive market sentiment.
The demand for US government bonds remained extremely weak as investors channelize their funds into other assets. Safe-haven appeal for US government bonds eased dramatically as US authorities are making efforts to bail out the vulnerable banking system. Reuters reported that First Citizens BancShares said it would take on the deposits and loans of failed Silicon Valley Bank (SVB). On weekend, the US government planned to stretch its emergency lending facility for small banks as households rushed for their deposits while borrowings soared.
Meanwhile, the US Dollar Index (DXY) has gradually corrected to near 102.83 as investors’ domain is advocating an unchanged monetary policy by the Federal Reserve (Fed) ahead. The street is anticipating that tight credit conditions by US banks are sufficient to bring down inflation further. And further policy tightening could harm the economy.
On the Swiss front, expectations for a tight monetary policy by the Swiss National Bank (SNB) could keep the Swiss franc solid. SNB Chairman Thomas J. Jordan confirmed that the central bank won’t hesitate in hiking rates further if inflation continues to remain persistent.
Going forward, Swiss ZEW Survey-Expectations (March) data will remain in focus. As per the consensus, the economic data would decline heavily to -18.9 from the former release of -12.3. It seems that the demise of Credit Suisse has dented the sentiment of firms.
- West Texas Intermediate crude is sinking on Thursday.
- Investors fear a recession in the aftermath of the Fed.
West Texas Intermediate crude oil surged higher and was posting a 1-1/2 week high and gasoline posted a 2-week high. A weaker US Dollar on Monday was also bullish for energy prices. Easing banking sector concerns helped lift the mood after US authorities said they were considering expanding a lending facility to help regional banks shore up their balance sheets. West Texas Intermediate is currently flat near $72.80 after rallying from $69.18.
´´The extension of a lending facility for the sector comes as a buyer was found for the Silicon Valley Bank. This saw crude oil track broader markets amid the improved risk appetite,´´ analysts at ANZ Bank said. ´´The market was also encouraged by improving demand prospects. China’s top refiner, CNPC said that apparent oil demand in the country may expand by 5.1% to 756mt this year. This follows data showing that US exports of crude oil and refined products surged to a record 12mb/d. Disruption to supply is also raising concerns.´´ The analysts at ANZ also noted that Exxon Mobil said it would begin shutting down its refinery in Gravenchon France, representing 20% of the country’s refinery capacity, as protests across the country impact crude supply.
Additionally, last Wednesday, India's oil ministry reported that India Feb crude oil imports rose +8.5% YoY to 19.1 MMT, the most in seven months. Also, an EIA report showed that US crude oil inventories as of March 17 were +7.6% above the seasonal 5-year average, gasoline inventories were -4.0% below the seasonal 5-year average, and distillate inventories were -8.8% below the 5-year seasonal average.
Baker Hughes reported last Friday that active U.S. oil rigs in the week ended March 24 rose by +4 rigs to 593 rigs, moderately below the 2-1/2 year high of 627 rigs posted on December 2. US active oil rigs have more than tripled from the 17-year low of 172 rigs seen in Aug 2020, signaling an increase in US crude oil production capacity.
- AUD/JPY justifies its risk-on mood to grind higher after reversing from one-year low.
- Yields rally as banking fears ease, central bankers remain shy of backing further rate hikes.
- Upbeat Japan data failed to impress sellers amid risk-on mood.
- Australia Retail Sales for February and speeches from BoJ Governor Kuroda and RBA Policymaker Ellis eyed.
AUD/JPY seesaws near 87.50, following a clear rebound from the one-year low, as bulls await the key catalysts from Australia and Japan during early Tuesday. That said, the cross-currency pair cheered firmer sentiment to post the first daily gains in four the previous day.
With the European and the US authorities’ announcements of the extension of emergency lending to banks, the market players took a sigh of relief from the banking sector crisis. On the same line were comments from the central bank officials pushing back the banking crisis concerns and the Silicon Valley Bank (SVB) deal. It’s worth noting that the month-end consolidation could also be held responsible for the AUD/JPY pair’s run-up, especially when it eyes the second monthly fall with above 4.0% loss.
While portraying the mood, Wall Street closed mixed, losing some of the intraday gains in the late hours, whereas yields rebound after a four-week downtrend.
It should be noted that the AUD/JPY pair’s run-up ignored upbeat prints of Japan’s Coincident Index and Leading Economic Index for January, as well as growing chatters of the Bank of Japan (BoJ) exit from the ultra-easy monetary policy.
Looking ahead, Australia’s Retail Sales for February, expected 0.4% versus 1.9% prior, could offer immediate direction to the AUD/JPY pair ahead of a speech from BoJ’s exiting Governor Haruhiko Kuroda. Following that, comments from Assistant Governor (Economic) at the Reserve Bank of Australia, Luci Ellis will be important to watch for clear directions.
Among the key catalysts, talks about the banking crisis and central bank comments will be important for near-term directions.
Technical analysis
AUD/JPY recovery remains elusive unless the quote stays below a three-week-old resistance line, around the 88.00 round figure by the press time.
- USD/JPY rebounds from 129.64 low as banking sector receives relief from FDIC intervention.
- US regulators explore emergency lending expansion, bolstering USD against safe-haven Yen.
- Fed's cautious stance on interest rates amid inflation concerns and banking crisis impact USD/JPY outlook.
The USD/JPY currency pair has found some stability above the 131.50 mark, as US Treasury (UST) bond yields rise. The US Dollar has reached a five-day high against the Japanese Yen due to US authorities' efforts to alleviate concerns surrounding the global banking system, which has helped calm investors.
After dropping to the 129.64 mark, USD/JPY reversed course as market sentiment improved amid the ongoing banking crisis. Global banking stocks, which had been negatively impacted this month after the sudden collapse of Silicon Valley Bank (SVB) and Signature Bank, experienced relief on Monday. The Federal Deposit Insurance Corporation (FDIC) announced that First Citizens BancShares Inc would acquire all of Silicon Valley Bank's deposits and loans from the regulator.
According to Bloomberg, US regulators are considering expanding an emergency lending facility for banks in ways that would grant First Republic Bank (FRC) additional time to strengthen its balance sheet. This news has reduced concerns, leading the US Dollar to gain ground against the Japanese Yen as investors scaled back their demand for the safe-haven Yen.Even with positive developments in the banking sector and rising UST bond yields, the US Dollar has remained in a narrow range against most of its counterparts.
On Wednesday, the U.S. Federal Reserve (Fed) increased interest rates by 25 basis points (bps) as anticipated but maintained a cautious outlook due to the banking sector turmoil. However, Fed Chair Jerome Powell left the possibility of further rate hikes on the table if necessary.
Market expectations for the US Dollar may remain subdued, as investors are pricing in approximately a 55% chance that the Fed will keep interest rates unchanged at its next meeting in May. Additionally, they anticipate a potential rate cut as early as July. Earlier comments from Federal Reserve Board Governor Philip Jefferson highlighted that inflation has been more persistent and higher than desired. Recent Fed commentary has emphasized addressing inflation above the ongoing banking crisis.
The US calendar will feature the Goods Trade Balance for February on Tuesday. Later this week, the market focus will shift toward the release of the US Personal Consumption Expenditure (PCE) data, which could provide further direction for the USD/JPY currency pair.
Levels to watch
- EUR/JPY turns bullish as it forms a double bottom and a bullish engulfing candle pattern.
- Short term, the EUR/JPY is neutrally biased, trapped within the EMAs.
- EUR/JPY Price Analysis: Bullish above 142.00; otherwise would turn downwards.
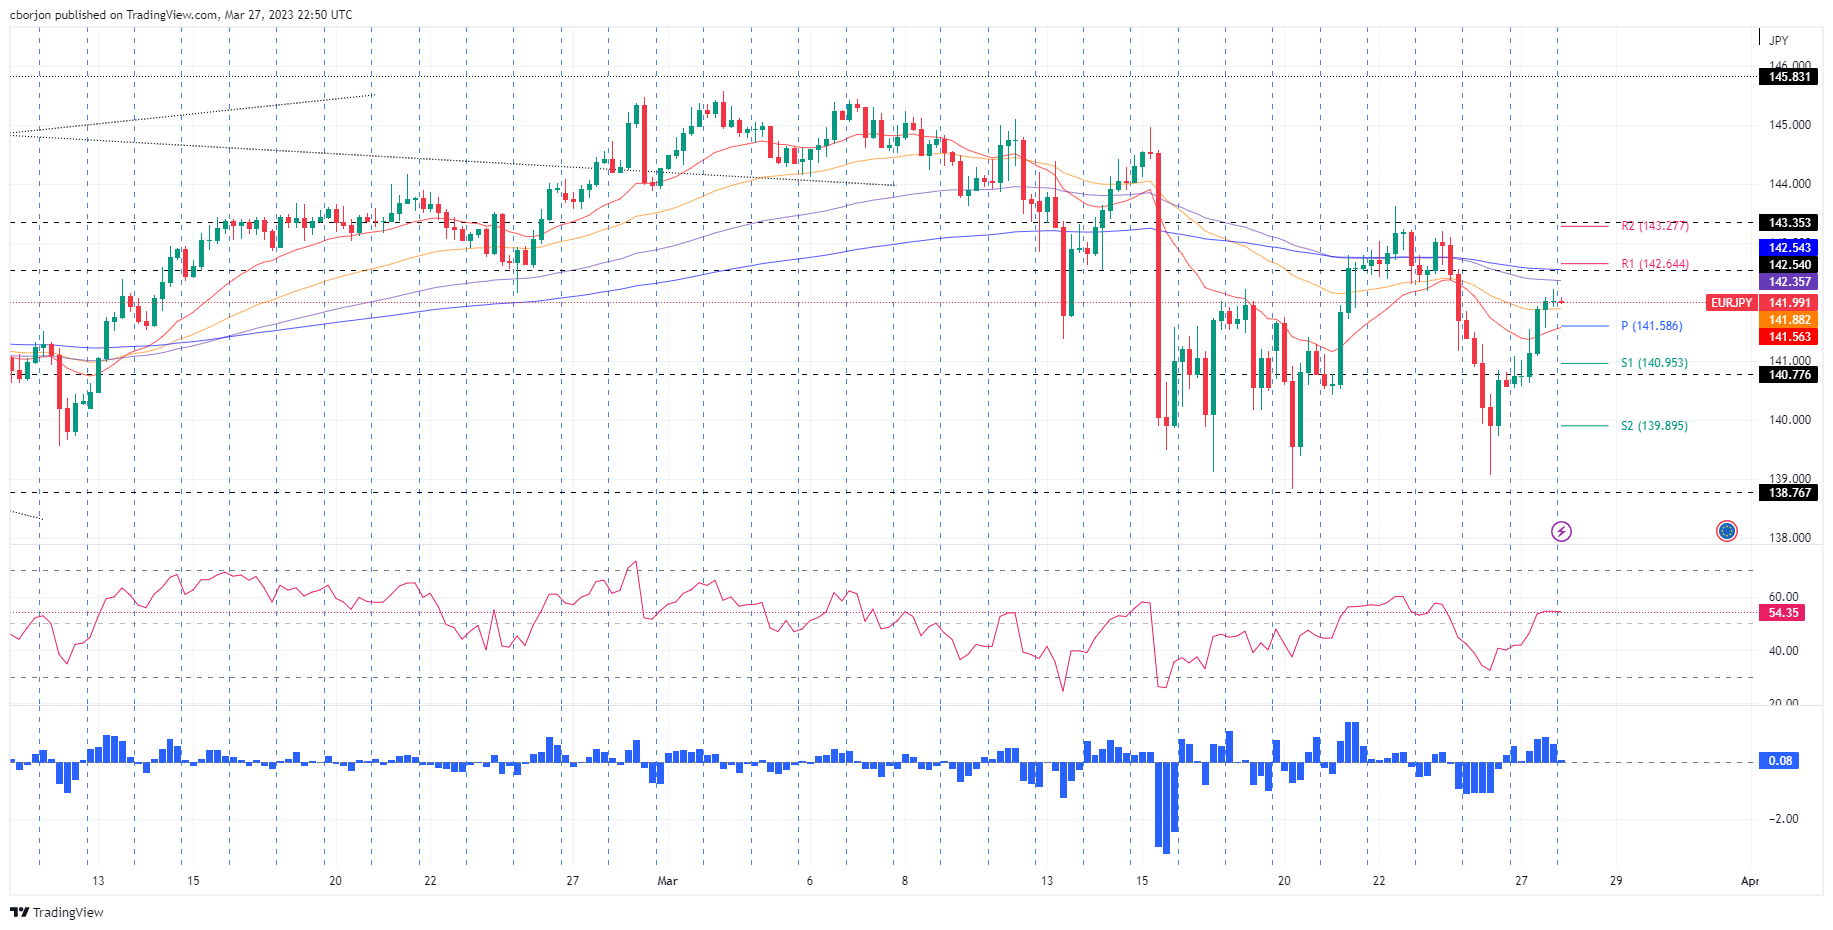
EUR/JPY rallied sharply on Monday and formed a bullish engulfing candle chart pattern. A double bottom takes shape as the EUR/JPY is poised to test solid resistance at around the 142.29-47 area. At the time of writing, the EUR/JPY is trading at 142.03.
EUR/JPY Price action
The EUR/JPY daily chart is neutral to upward biased. Nevertheless, the last few days’ price action has opened the door for further gains. Oscillators are mixed, with the Relative Strength Index (RSI) flat at bearish territory, while the Rate of Change (RoC) jumped on Monday’s trading session. Therefore, mixed signals could keep EUR/JPY traders at bay.
Short term, the EUR/JPY climb is pausing nearby the 142.00 mark. The EUR/JPY drew a doji, indicating that buyers/sellers are at equilibrium while oscillators remain bullish. The Relative Strength Index (RSI) at 54 turned flat, while the Rate of Change (RoC) was neutral. Therefore, the EUR/JPY might trade sideways before resuming upwards or downwards.
If the EUR/JPY cracks the 142.00 figure, the pair will test the 100-EMA at 142.35. A breach of the latter will expose the 142.54 as the pair sets to test the 143.00 mark.
On the flip side, the EUR/JPY first support would be the 50-EMA at 141.88. Once cleared, the pair would tumble to the confluence of the 20-EMA and the pivot point at 141.58 before testing 141.00.
EUR/JPY 4-hour chart
EUR/JPY Technical levels
- USD/CAD seesaws around intraday low after falling the most in two weeks the previous day.
- One-month-old ascending support line restricts immediate downside; 200-EMA is the key hurdle for Loonie pair bears.
- Downbeat oscillators add strength to the bearish bias.
- Recovery needs validation from 1.3815 to convince the bulls.
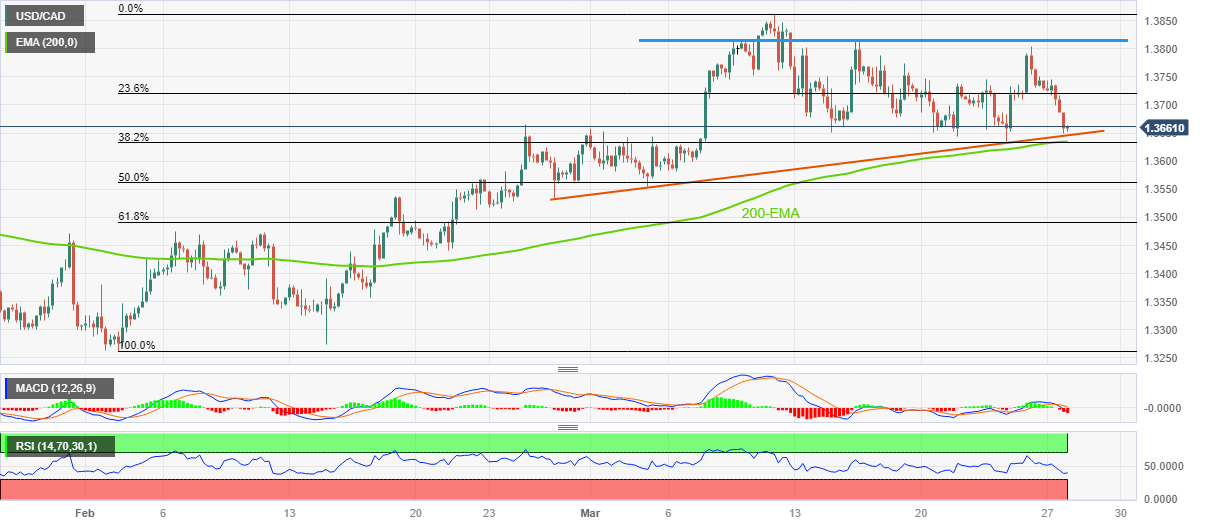
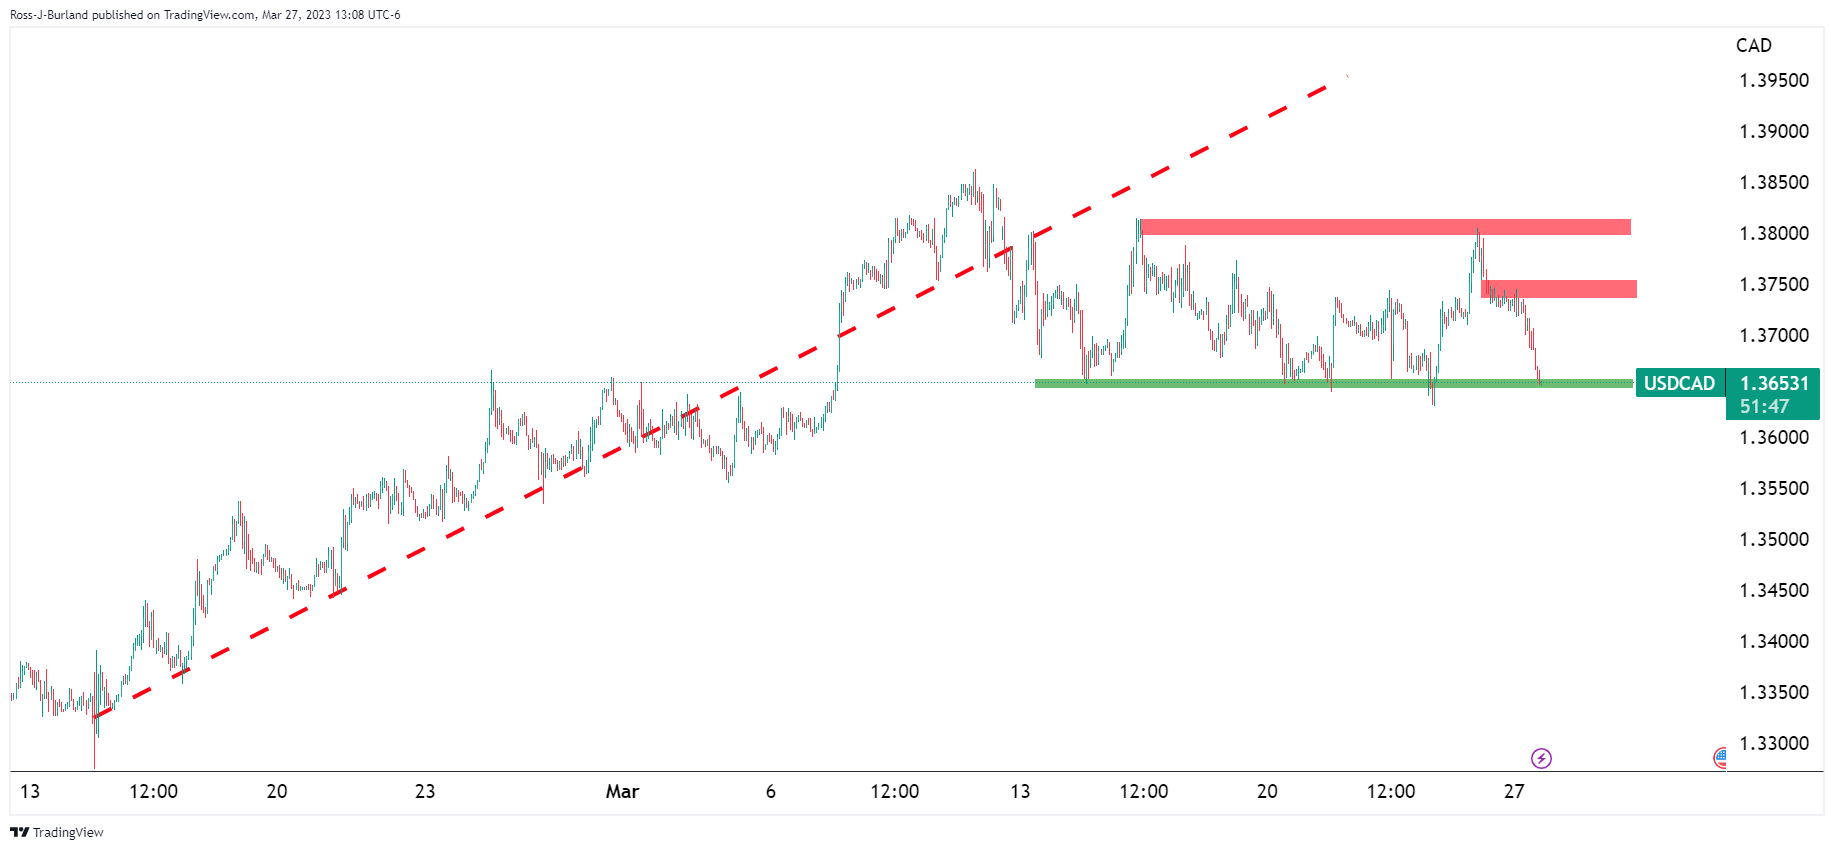
USD/CAD bears take a breather around 1.3660 during the early Asian session, following the biggest daily loss in a fortnight. In doing so, the Loonie pair seesaws around the key short-term support, as well as floats above the 1.3630 support confluence.
USD/CAD pair’s weakness gains support from the bearish MACD signals and downbeat RSI (14) line, not oversold. However, upward-sloping support from late February, around 1.3650 at the latest, restricts immediate declines of the quote.
Following that, a convergence of the 200-bar Exponential Moving Average (EMA) joins the 38.2% Fibonacci retracement level of the pair’s February-March upside, near 1.3630, appears a tough nut to crack for the USD/CAD bears to crack.
Should the quote remains bearish past 1.3630, the odds of witnessing a slump toward the 50% Fibonacci retracement surrounding 1.3560 can’t be ruled out.
Meanwhile, recovery moves may initially aim to regain the 1.3700 round figure before challenging the latest tops surrounding 1.3750 and 1.3800.
However, a three-week-long horizontal resistance around 1.3815-20 holds the key to the USD/CAD bull’s conviction.
Overall, USD/CAD is likely to decline further but the downside needs validation from 1.3630.
USD/CAD: Four-hour chart
Trend: Limited downside expected
- Gold price is sensing barricades around $1,960.00 as fears of US banking turmoil have eased.
- Appeal for Gold and US government bonds as safe-haven amid US banking jitters has trimmed dramatically.
- Risk appetite is improving further on hopes that US banking recovery will be faster.
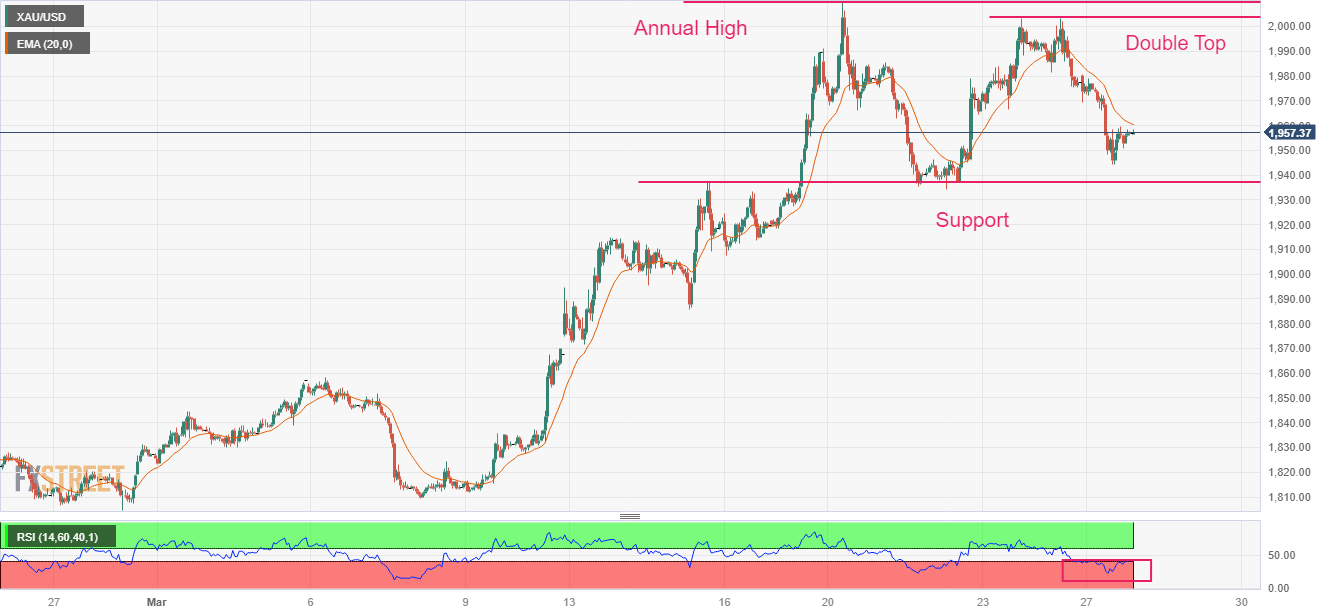
Gold price (XAU/USD) is juggling below $1,960.00 in the early Asian session. The upside for the Gold price seems restricted as fears of the United States banking debacle have eased. Therefore, investors have liquidated their positions in Gold and US government bonds, which were considered safe-haven amid banking jitters.
On Monday, First Citizens BancShares said it would take on the deposits and loans of failed Silicon Valley Bank (SVB). The news came after Bloomberg reported that US authorities are looking to expand the emergency lending facility for small banks amid turbulent times. Back-to-back supportive headlines for the US banking system infused confidence among the market participants.
Meanwhile, S&P500 futures are showing nominal gains after a bullish Monday on hopes that US banking recovery will be faster and chances of banking turmoil like the 2008 financial crisis are extremely lower. Easing US baking jitters impacted the demand for US government bonds heavily. This led to a perpendicular rise in 10-year US Treasury yields to 3.54%.
The US Dollar Index (DXY) has corrected to near 102.83 as hopes for a sooner conclusion of the rate-hiking spell by the Federal Reserve (Fed) are escalating.
Fed Governor Philip Jefferson cited on Monday, “Inflation ‘should fall back’ toward the Fed's 2% target as higher interest rates discourage spending in interest-rate sensitive sectors of the economy like housing,” as reported by Reuters. He further added, would like to say inflation will return to 2% soon, but have to avoid damaging the economy ‘any more than is necessary’.
Gold technical analysis
Gold price has shown a sheer fall after forming a Double Top chart pattern on an hourly scale plotted from March 23 high at $2,003.37. The precious metal re-tested critical resistance with less buying strength, which triggered aggressive selling from responsive sellers. Gold price is declining towards the horizontal support placed from March 15 high at $1,937.39. The yearly high is placed from March 20 high at $2,009.88.
The 20-period Exponential Moving Average (EMA) will continue to act as a barricade for the Gold bulls.
Meanwhile, the Relative Strength Index (RSI) (14) is making efforts in shifting its range to 40.00-60.00.
Gold hourly chart
- EUR/USD picks up bids to extend week-start rebound amid downbeat US Dollar, firmer sentiment.
- Receding fears of banking fallouts allow markets to take a breather from the previous risk aversion.
- Upbeat German data, hawkish ECB talks add strength to the Euro pair.
- ECB President Lagarde’s speech, US CB Consumer Confidence eyed for fresh impulse.
EUR/USD extends the week-start recovery to 1.0800 during early Asian session on Tuesday, picking up bids to refresh intraday high of late, as risk-on mood joins the hawkish comments from the European Central Bank (ECB) officials. Adding strength to the Euro pair’s run-up are the firmer data from Germany, Europe’s powerhouse, as well as the recent comments from the Federal Reserve (Fed) Governor.
Market sentiment improved as the European and the US authorities announced extension of emergency lending to banks. Adding strength to the optimism were comments from the central bank officials pushing back the banking crisis concerns and the Silicon Valley Bank (SVB) deal.
That said, the upbeat prints of Germany’s IFO data for March also favored the EUR/USD bulls. On Monday, Germany’s IFO Business Climate Index rose to 13-month high of 93.3 for March versus 90.9 market forecasts and 91.1 prior. Further, the IFO’s gauges of Current Assessment and Expectations also increased to 95.4 and 91.2 in that order during the said month compared to respective expected figures of 94.1 and 88.0, versus 93.9 and 88.4 previous readings.
Further, hawkish ECB talks were also part of the bullish ammunition for the pair. ECB policymaker, Pablo Hernandez de Cos, said on Monday, “Future monetary policy decisions will depend on three factors, such as new economic and financial data and core inflation.” The policymaker also said that tensions in financial markets have generated a further tightening of financial conditions, affecting the outlook for economic activity and inflation. On the same line, ECB Governing Council member Gediminas Šimkus said that the bank liquidity and capitalization is high in the euro area while also adding, “Financial stability is an important factor.”
Also positive was S&P Global’s announcement on Monday that it revised the 2023 Gross Domestic Product (GDP) growth forecast for Eurozone to 0.3% from 0% previously. However, the S&P Global also anticipates Eurozone GDP to grow by 1% in 2024, down from 1.4% expected in the previous forecast.
Looking ahead, EUR/USD pair traders should keep their eyes on ECB President Christine Lagarde’s speech and the US Conference Board’s (CB) Consumer Confidence for clear directions. That said, bulls will be more interested in seeking a further normalization of banking sector, as well as inflation run-up in the bloc, not to forget softer US data.
Technical analysis
A clear bounce off the 50-DMA, around 1.0735 by the press time, directs EUR/USD towards the 1.0930 horizontal resistance.
Federal Reserve Governor Philip Jefferson said on Monday, per Reuters, “Fed is ‘still learning’ how much impact its interest rate increases have had on the economy and inflation.”
“Inflation ‘has started to come down,’ with some of that due to tighter monetary policy and some due to other factors such as improving global supply chains,” Fed’s Jefferson said in remarks prepared for delivery at an event at Washington and Lee University.
Additional comments
Inflation ‘should fall back’ toward the Fed's 2% target as higher interest rates discourage spending in interest-rate sensitive sectors of the economy like housing.
Inflation ‘has started to come down’ with some of that due to tighter monetary policy and some due to other factors such as improving global supply chains.
Monetary policy affects the economy and inflation with long, variable, and highly uncertain lags, and we are still learning about the full effect of our tightening thus far.
No comments on recent bank stress.
No views about whether the Fed should continue raising interest rates at upcoming meetings.
Following the speech, the policymaker also participates in the Question and Answer (Q&A) session.
Following the speech, the policymaker also participates in the Question and Answer (Q&A) session.
Q&A response
Inflation has been longer lasting and current rate is too high.
Want to return to 2% sooner rather than later; don't want expectations to become embedded.
Some components of inflation have proved persistent, lowering them will take time.
Would like to say inflation will return to 2% soon, but have to avoid damaging the economy ‘any more than is necessary’.
Fed actions in recent weeks has aimed to show depositors there is ‘someone out there willing to lend’.
Fed wants banks that need liquidity to feel its okay to use the discount windown.
Recent rise in discount window lending is appropriate at the moment.
Here is a high degree of transparency at the Fed.
If small and regional banks contract in size could see lending standards change and could have a disproportionate impact on small business.
Fed will need to see how changes in credit standards play out, want community and regional banks to be strong.
Climate change important to the point that it influences safety and soundness of banks.
Important fed knows what is happening in the financial sector in terms of risk.
Market reaction
EUR/USD was last seen rising to 1.0800, extending the week-start rebound amid sluggish Asian session.
Also read: EUR/USD rebounds after two consecutive days of losses, boosted by risk-on impulse, weaker USD
- AUD/USD is continuously oscillating below 0.6660 as the focus has shifted to Australian Retail Sales and CPI data.
- Tuesday’s Retail Sales (Feb) data is expected to expand by 0.4% lower than the former expansion of 1.9%.
- The USD Index has corrected to near 102.83 as the Fed would terminate its rate-hiking spell sooner.
The AUD/USD pair is demonstrating a back-and-forth action below 0.6660 from Friday’s session. The sideways performance in the Aussie asset is expected to conclude and a power-pack action will be witnessed. Sheer volatility is expected in the Australian Dollar after the release of Tuesday’s Retail Sales and Wednesday’s Consumer Price Index (CPI) data.
Tuesday’s Retail Sales (Feb) data is expected to expand by 0.4% lower than the former expansion of 1.9%. The Reserve Bank of Australia (RBA) is extremely worried about persistent inflation in the Australian economy and a softening retail demand would provide some relief to policymakers.
However, the important catalyst is the monthly CPI data, which is likely to ease to 7.1% from the former release of 7.4%. RBA policymakers have already stated that there is evidence that indicates that Australian inflation has started easing. And, the RBA could terminate its policy-tightening process from April’s monetary meeting as the current monetary policy is restrictive enough to tame the stubborn inflation.
Meanwhile, S&P500 settled Monday’s trading session with decent gains on hopes that the United States banking system will be bailed out as US authorities are making significant efforts by expanding liquidity assistance, portraying a solid risk appetite theme.
The US Dollar Index (DXY) has corrected gradually to near 102.83 as the market participants are split about guidance on interest rates. As per the CME Fedwatch tool, more than 50% of investors are advocating for the maintenance of a status quo by the Federal Reserve (Fed) in its May monetary policy meeting as tight credit conditions approach by US banks would actively weigh on US inflation.
- Silver’s daily chart indicates a neutral to upward bias, although the 20-day EMA crossed above the 50-day EMA.
- The appearance of back-to-back hammers on Friday and Monday could signal a possible pullback.
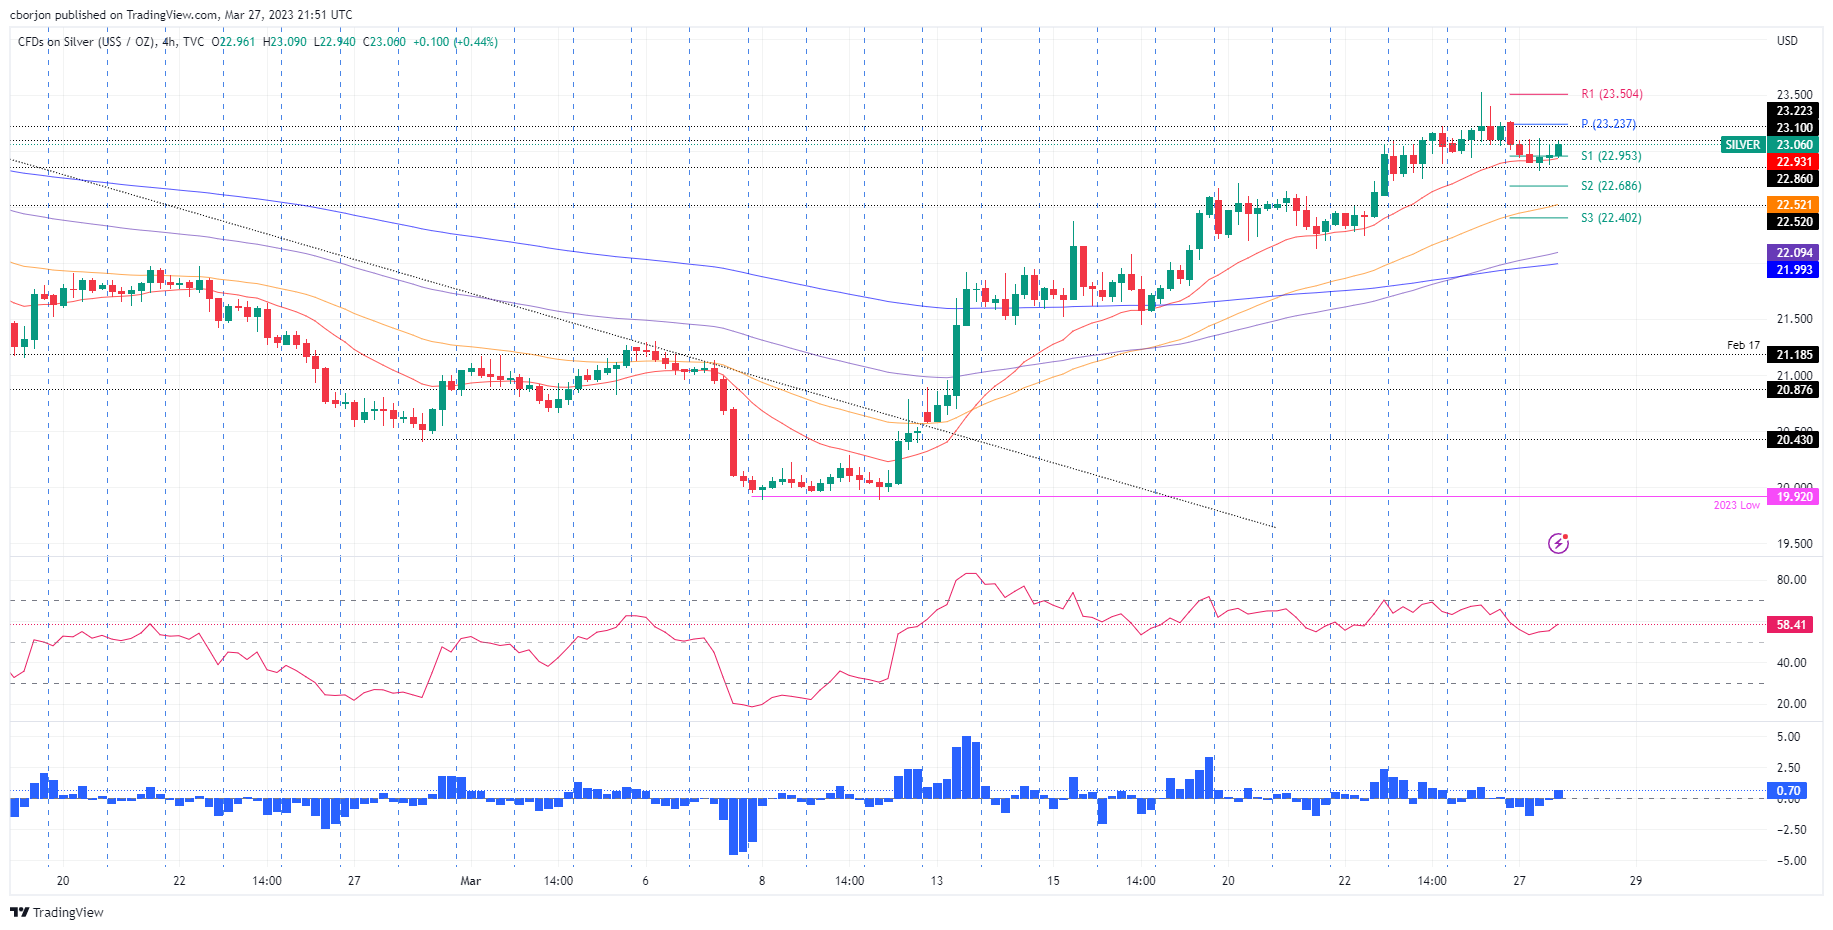
- XAG/USD Price Analysis: Bounces off 20-EMA, set to challenge resistance at $23.09
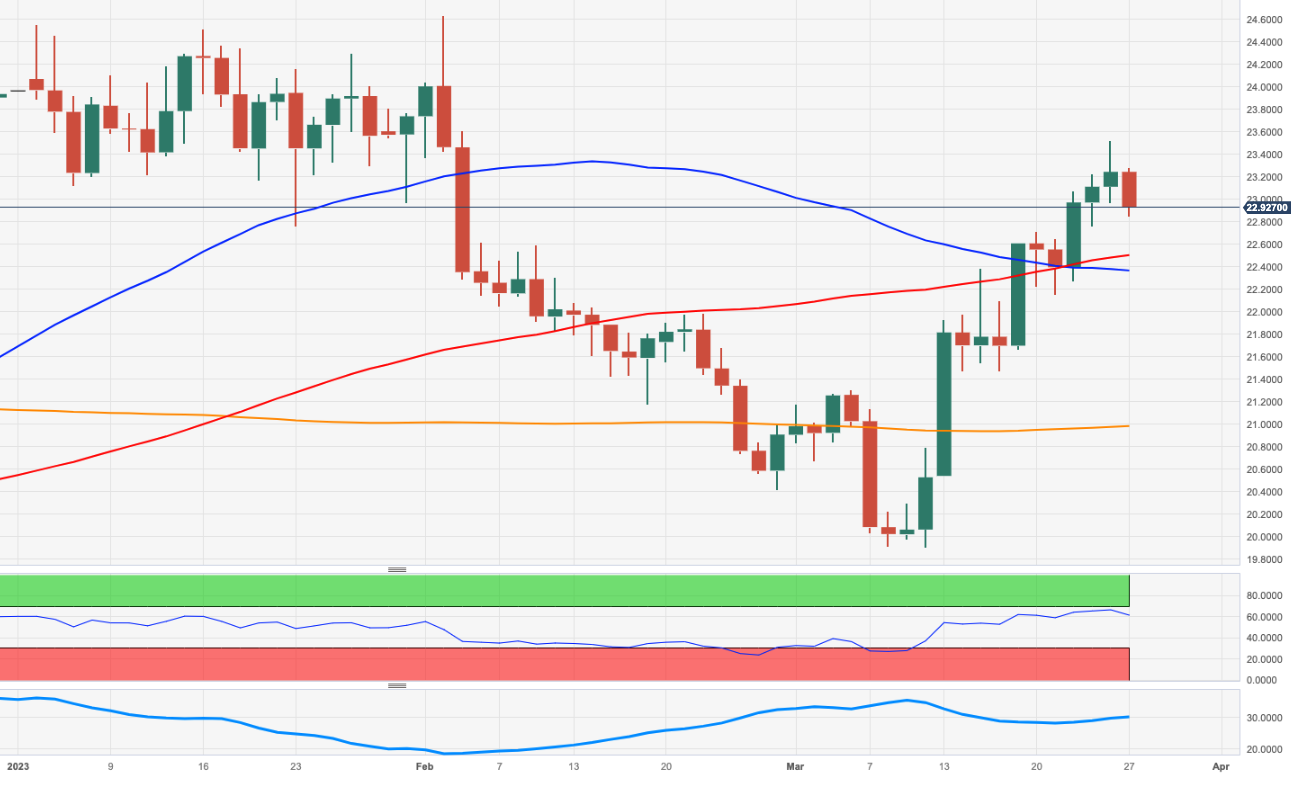
Silver price clashes with solid resistance and dwindles after hitting a daily high of $23.26. At the time of writing, the white metal is down 0.69%, trading at $23.06, a troy ounce.
XAG/USD Price action
Silver’s daily chart suggests the XAG/USD is neutral to upward biased, with the 20-day Exponential Moving Average (EMA) crossing above the 50-day EMA. Nevertheless, back-to-back hammers, last Friday’s inverted and Monday’s price action, could open the door for a pullback. In bullish territory, the Relative Strength Index (RSI) favors higher prices, but its slope turned south, while the Rate of Change (RoC) is neutral. That said, mixed signals warrant caution.
Short-term, the XAG/USD 4-hour chart indicates the pair is consolidating. The XAG/USD dipped toward the 20-EMA at $22.93, bouncing off and reclaiming the $23.00 figure. That, alongside the recent cross of the 100-EMA over the 200-EMA, could exacerbate a rally toward new YTD highs. Additionally, the Relative Strength Index (RSI) and the Rate of Change (RoC) shifted upwards.
Given the backdrop, the XAG/USD first resistance would be the March 27 high at $23.09. Once cleared, the white metal would be poised to test, the last week was high at $23.52 before challenging $24.00.
XAG/USD 4-hour chart
XAG/USD Technical levels
- GBP/USD stalls on the bid and moves into consolidation.
- Investors seek clarity on the fallout from the recent collapse of two US lenders and Credit Suisse recue.
GBP/USD climbed to 1.2293 from a low of 1.2218 while the US dollar was weighed within a narrow range against most major currencies while traders sought clarity on the fallout from the recent collapse of two US lenders and the rescue of Credit Suisse.
Data released earlier Monday showed that UK Retail Sales conditions from the Confederation of British Industry declined modestly in March and BoE Governor Andrew Bailey spoke and said that the central bank has to be very alert to any signs of persistent inflationary pressures.
Elsewhere, Minneapolis Federal Reserve’s president, Neel Kashkari, warned the US is on the brink of a recession. As for US data, the Dallas Fed Manufacturing Activity Index dropped to -15.7pts in March as perceptions of broader business conditions worsened. The company outlook subindex rose four points to -13.3.
Analysts at ANZ Bank noted that ´´the outlook uncertainty subindex came in at 22.0, down slightly from February but still high. Labour market measures remained positive, with 24% of firms net hiring, while 14% reported net layoffs. Price and wage pressures receded in March.´´
Here is what you need to know on Tuesday, March 28:
After a quiet beginning of the week, market participants will continue to evaluate the consequences for the economy of the banking crisis. Key economic reports due on Asian hours include Australian Retail Sales, ahead of Wednesday’s CPI and next week’s RBA meeting.
Markets showed some relief on Monday following the latest banking news, which led to a rebound in bank stocks. The Dow Jones gained 194 points or 0.60%, while the Nasdaq dropped by 0.46%. The VIX continued to trend lower, and Crude Oil jumped by more than 5%. Deutsche shares rebounded and First Citizens Bancshares agreed to buy parts of Silicon Valley Bank (SVB).
The DXY lost ground on Monday and dropped below 103.00 even as US yields rose (the curve remains inverted). The US 10-year Treasury bond yield rose toward 3.55% while the 2-year rate climbed back above 4.00%. The Japanese Yen was among the worst performers hit by the improvement in market sentiment and higher yields in Europe and the US. USD/JPY rose more than a hundred pips, climbing above 131.50.
EUR/USD is moving with a bullish bias, advancing at a slow pace toward 1.0800. Still, more consolidation seems likely ahead of key inflation data from the Eurozone on Thursday (Preliminary March Consumer Price Index) and from the US on Friday (February Core Personal Consumption Expenditure).
GBP/USD rose modestly on the back of a weaker US Dollar, approaching 1.2300. USD/CHF dropped from near 0.9200 to 0.9155.
AUD/USD is moving sideways in a small range near 0.6650. On Tuesday, Australia will report Retail Sales. NZD/USD oscillated under 0.6200, with the Kiwi underperforming.
The Loonie was the best among commodity currencies. USD/CAD lost more than 50 pips and posted the lowest daily close in three weeks, holding above the critical 1.3645/50 support area. The Federal Budget will be released on Tuesday.
Emerging market currencies were mixed. The Colombian Peso and the Chilean Peso outperformed on Monday. On the contrary, the South African Rand fell across the board, losing 0.85% versus the US Dollar.
Gold fell more than $20 and settled around $1,950/oz. Bitcoin dropped more than 3%.
Like this article? Help us with some feedback by answering this survey:
- NZD/USD is consolidating at the start of the week in mixed risk sentiment.
- Poor performance on crosses suggests the Kiwi is still out of favour.
NZD/USD is flat after falling by 1% last week due to fears of a repeat of the systemic banking crisis that swept through markets in 2008. On the day so far, NZD/USD has traveled between a low of 0.6180 and a high of 0.6211.
Sentiment, however, remains fragile due to concerns about a global credit crunch. ´´The roller-coaster ride continues, again leaving FX markets fairly untouched. Which begs the question; will NZ’s remoteness to all this deliver NZD strength if the RBNZ can get the OCR to 5¼%? It might, especially if things are wobbly enough to keep the Fed from tightening much more, but not wobbly enough to crash things,´´ analysts at ANZ Bank explained. ´´But poor performance on crosses suggests the Kiwi is still out of favour.´´
Elsewhere, a surprisingly large contraction in New Zealand's growth numbers in Q4 of 2022 came as the RBNZ is still in the process of cooling runaway inflation. The central bank has lifted its policy rate by a total of 450 basis points in ten straight meetings, pushing the cash rate to a 41-year record of 4.75%.
Meanwhile, the IMF chief Kristalina Georgieva said Sunday that 2023 would be another challenging year, with global growth slowing to below 3%, reflecting the impact of pandemic disruptions, the war in Ukraine, and monetary tightening. She added that even with a better outlook for 2024, global GDP will remain below its historic average of 3.8% and the overall outlook remained weak.
- GBP/JPY rises and trades above the 20 and 50-day EMAs, reflecting a gain of 1.18%.
- The pair formed a bullish engulfing candle pattern, with oscillators favoring the upside in the daily chart.
- GBP/JPY Price Analysis: In the short term might test 160.00 unless buyers reclaim 162.00.
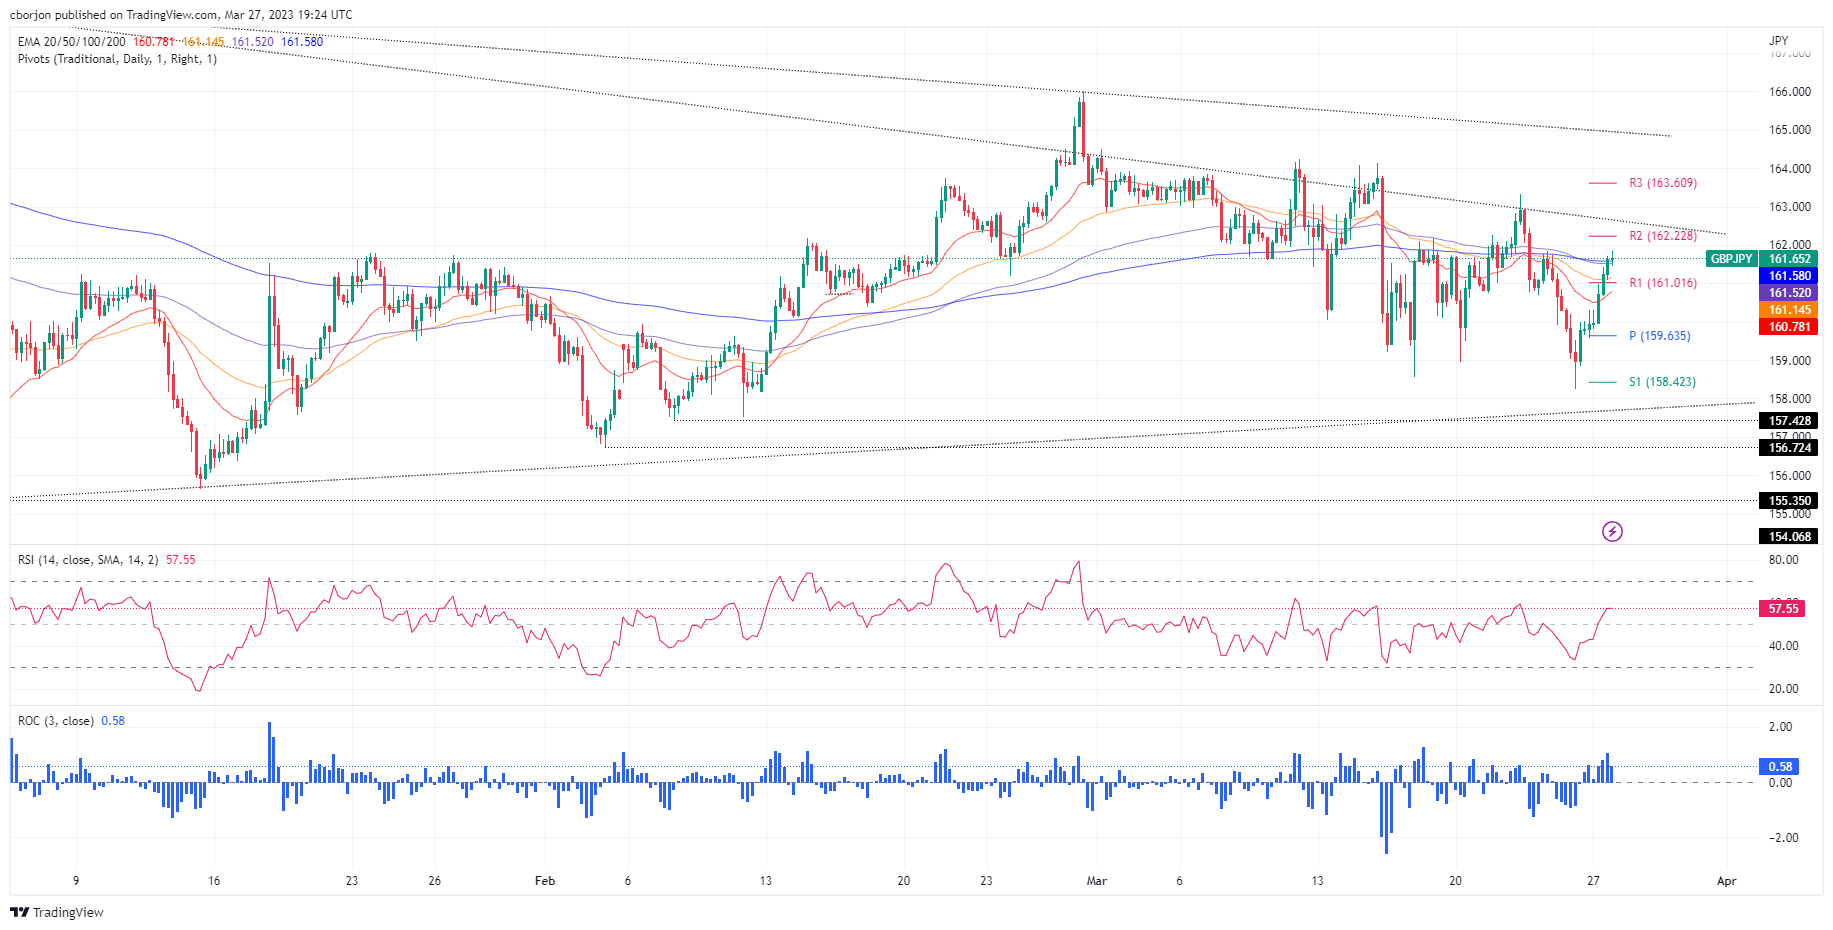
GBP/JPY pops after three days of losses, and trades above the 20 and 50-day Exponential Moving Averages (EMAs), sitting at 161.54 and 161.59, respectively. After hitting a daily low of 159.56, the GBP/JPY is trading at 161.68, gaining 1.18%.
GBP/JPY Price Analysis
Friday’s price action portrayed a hammer preceded by a downtrend, meaning that the GBP/JPY might print a leg-up. On Monday, the GBP/JPY resumed its uptrend, forming a bullish engulfing candle pattern, favoring the upside in the cross-currency pair. The Relative Strength Index (RSI) also shifted bullish, while the Rate of Change (RoC) jumped from neutral.
From an intraday perspective, the GBP/JPY 4-hour chart portrays the pair as neutral to downward biased facing the confluence of the 100 and 200-EMAs, around 161.52/58. A decisive break and the GBP/JPY could rally to 162.00, followed by the R2 daily pivot point at 162.22. Upside risks lie at a 5-month-old downslope trendline at around 162.50-60, followed by a March 23 daily high test at 163.33.
On the other hand, and the GBP/JPY path of least resistance in the near term, the first support would be the 50-EMA at 161.14, immediately followed by the R1 daily pivot at 161.01. Once hurdle, the pair might fall to the 20-EMA at 160.78, followed by a dip to the central pivot at 159.63.
GBP/JPY 4-Hour chart
GBP/JPY Technical levels
- USD/CAD bulls eye a move into prior support that meets a 61.8% ratio.
- Canada's budget is due on Tuesday is on the radar.
USD/CAD made its biggest drop in two weeks as the commodity complex picks up a bid in the face is easing stress in the banking sector and contributing to a surge in oil prices.
USD/CAD was down some 0.6% at the time of writing, losing space from a high of 1.3745 and reaching a low of 1.3649 on the day so far. The financial system was calmed after First Citizens BancShares said it would take on the deposits and loans of failed Silicon Valley Bank, supporting a risk-on mood. Additionally, the price of oil, a major Canadian export, settled 5.1% higher at $72.18 a barrel on hopes that banking sector issues would be contained, supporting the Loonie.
Looking at the calendar, Canada's budget is due on Tuesday. It will introduce a system to lock in future carbon credit prices, a move meant to boost investments by giving businesses certainty to develop low-carbon technologies, a senior government source with knowledge of the document told Reuters. Analysts at TD Securities said they look for January GDP to print above flash estimates at +0.4%. Growth should be broad-based, with unseasonably warm weather providing a tailwind. ´´A 0.4% print would leave Q1 GDP tracking well above BoC forecasts, though financial stability concerns take precedent for the moment. We look somewhat larger deficit projections in the budget compared to the Fall Economic Statement.´´
USD/CAD technical analysis
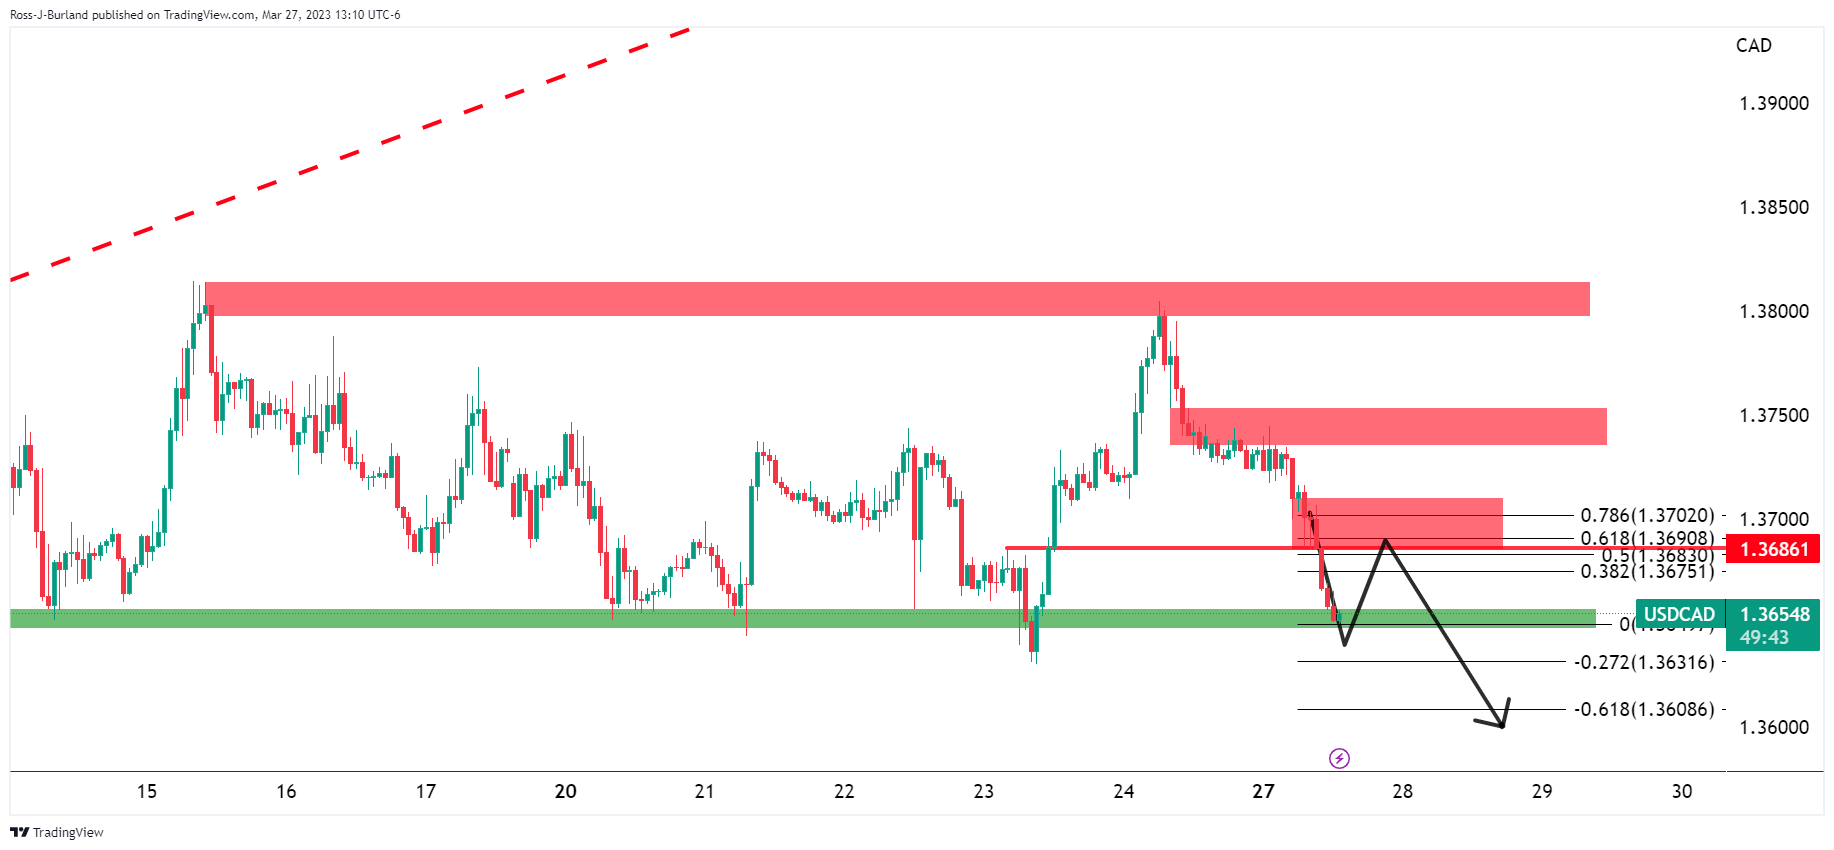
The price is meeting support and this leaves prospects of a move into prior support that meets a 61.8% ratio.
- Despite high US T-bond yields, EUR/USD rebounds after two consecutive days of losses.
- A risk-on impulse underpinned the Euro to the detriment of the US Dollar.
- EUR/USD Price Analysis: Triple bottom pattern remains in play as long as EUR/USD stays above 1.0759
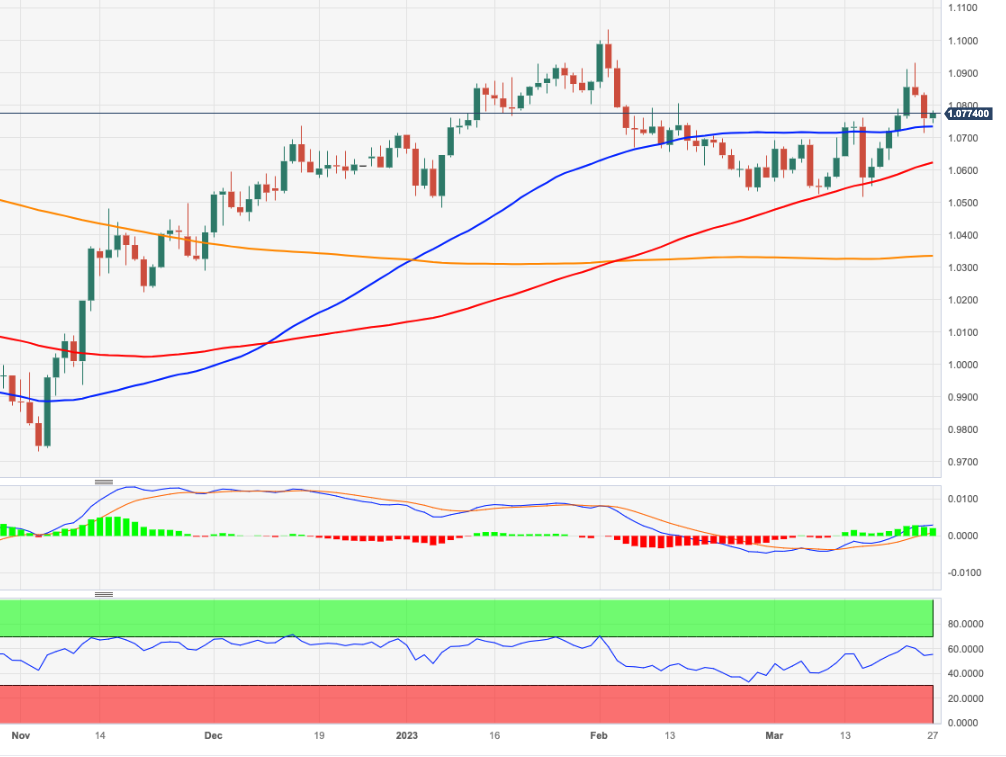
EUR/USD snaps two straight days of losses and climbs after hitting a daily low of 1.0744 amidst a subdued session. Despite high US Treasury bond yields, risk-appetite improvement and a softer US Dollar (USD) opened the door for further Euro (EUR) upside. At the time of writing, the EUR/USD is trading at 1.0789 above its opening price.
US equity markets are mixed, with the Dow Jones and the S&P 500 rising while the Nasdaq tumbles. Market participants cheered First Citizens BancShare’s takeover of the Silicon Valley Bank (SVB), while US authorities are considering expanding emergency lending facilities to First Republic Bank.
Data-wise, the March US Dallas Fed Manufacturing Index plunged -15.7, more than February’s -13.5 collapse and worse than the -10.9 estimate. Delving into the data, the Production Index and the Employment component rose. New Orders declined, and the Price Index fell from 15.5 to 7.0.
US Treasury bond yields recovered, with 2s meandering around 4%, while the 10-year benchmark note rate sits at 3.515%, gaining thirteen basis points. The greenback has failed to capitalize on the US bond yields rise, with the US Dollar Index (DXY) sliding 0.19% at 102.915.
On the Eurozone (EU) front, European Central Bank (ECB) speakers are crossing the wires. Nagel acknowledged the increasing importance of taking a meeting-by-meeting approach, though he emphasized that the path of monetary policy normalization would continue. He added that QT would accelerate soon. On the flip side, ECB’s de Cos took a cautious approach due to high levels of uncertainty in the financial markets.
Of late, ECB’s board member Isabel Schnabel commented that she wanted to signal that further rate hikes were possible, according to people who know the matter.
EUR/USD Technical analysis
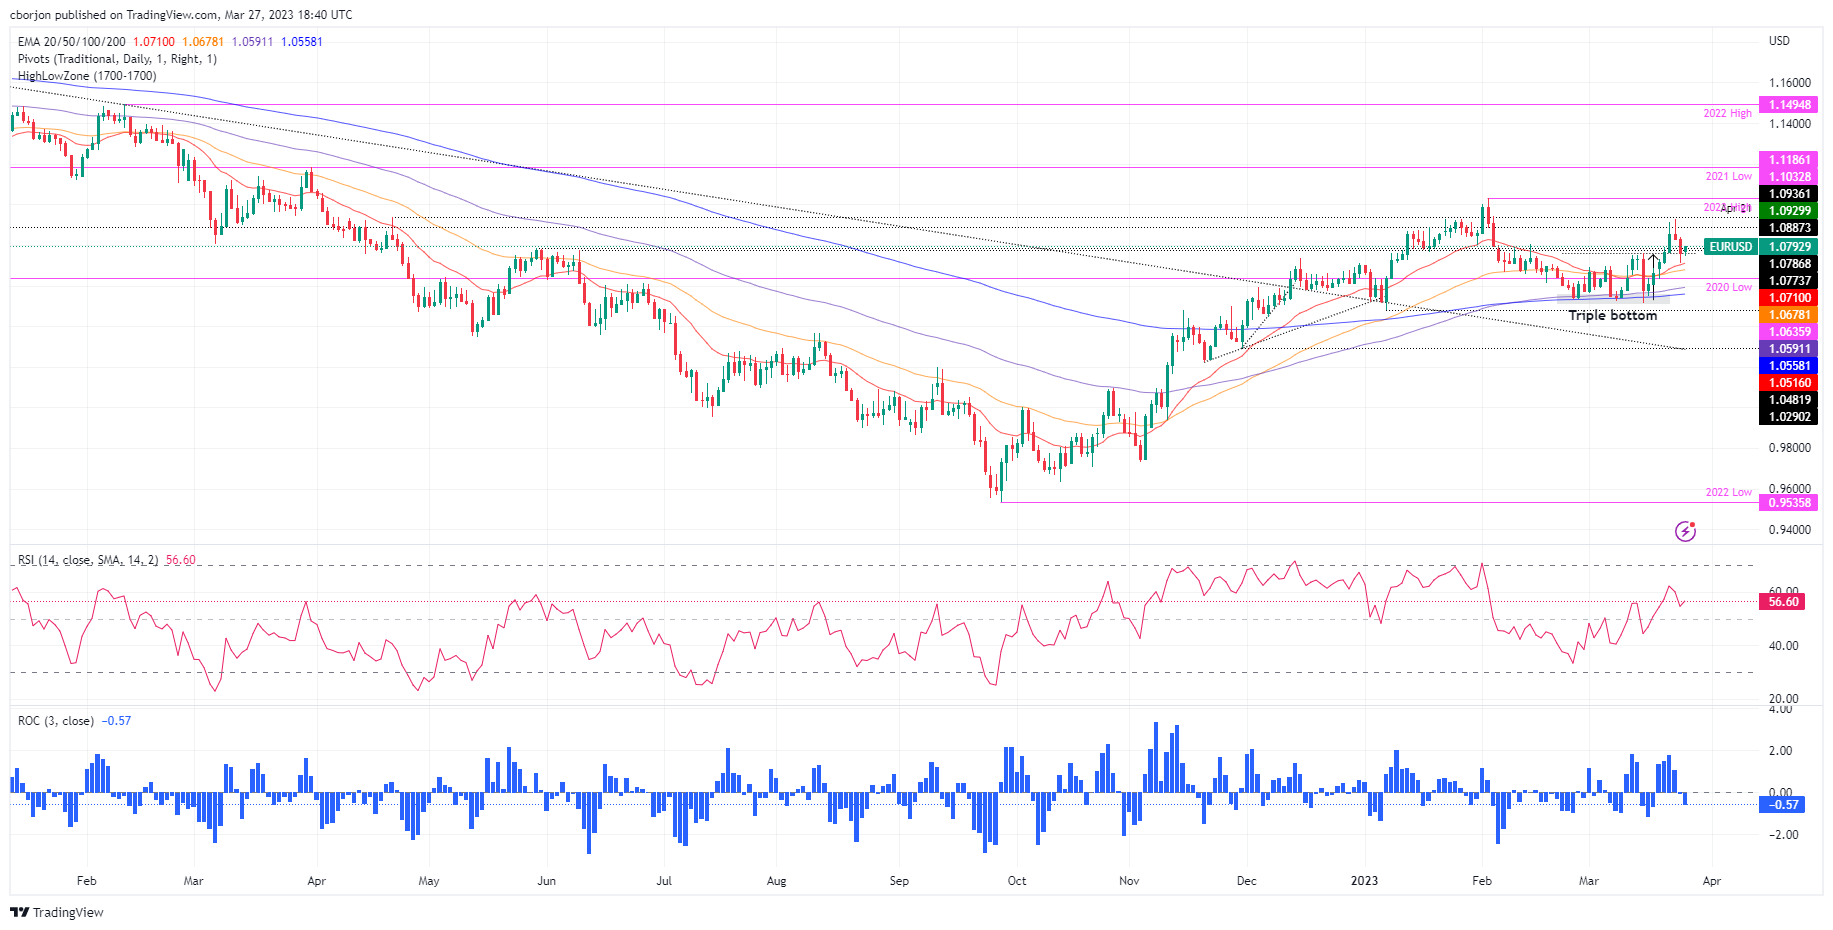
Technically speaking, the EUR/USD is neutral to upward biased, with a triple bottom staying in play as long as the EUR/USD remains above 1.0759. Oscillators are giving mixed signals. The Relative Strength Index (RSI) favors EUR/USD upside, while the Rate of Chance (RoC) suggests that buying pressure is waning. The path of least resistance is upwards; therefore, the EUR/USD first resistance would be 1.0800. Once broken, the EUR/USD’s next ceiling would be 1.0929, followed by the 1.1000 figure.
- USD/CHF bulls are tiring at a key resistance level.
- USD/CHF meets a 50% mean reversion level with 0.9050 now in focus.
USD/CHF is down 0.35% after the Swiss National Bank moved forward with a 50bps increase in borrowing costs as expected last week, citing a renewed rise in inflationary pressure and discarding the recent turmoil in the banking sector and the Credit Suisse takeover.
The SNB noted that measures announced by the federal government, FINMA, and the SNB had put a halt to the crisis and reiterated it was providing large amounts of liquidity assistance in Swiss francs and foreign currencies, backed by collateral and subject to interest.
Meanwhile, inflation in Switzerland unexpectedly climbed to 3.4% in February, overshooting market expectations of 3.1% and SNB forecasts of 3%.
Technically, the price is capped by a 50% mean reversion as the following illustrates:
USD/CHF daily chart
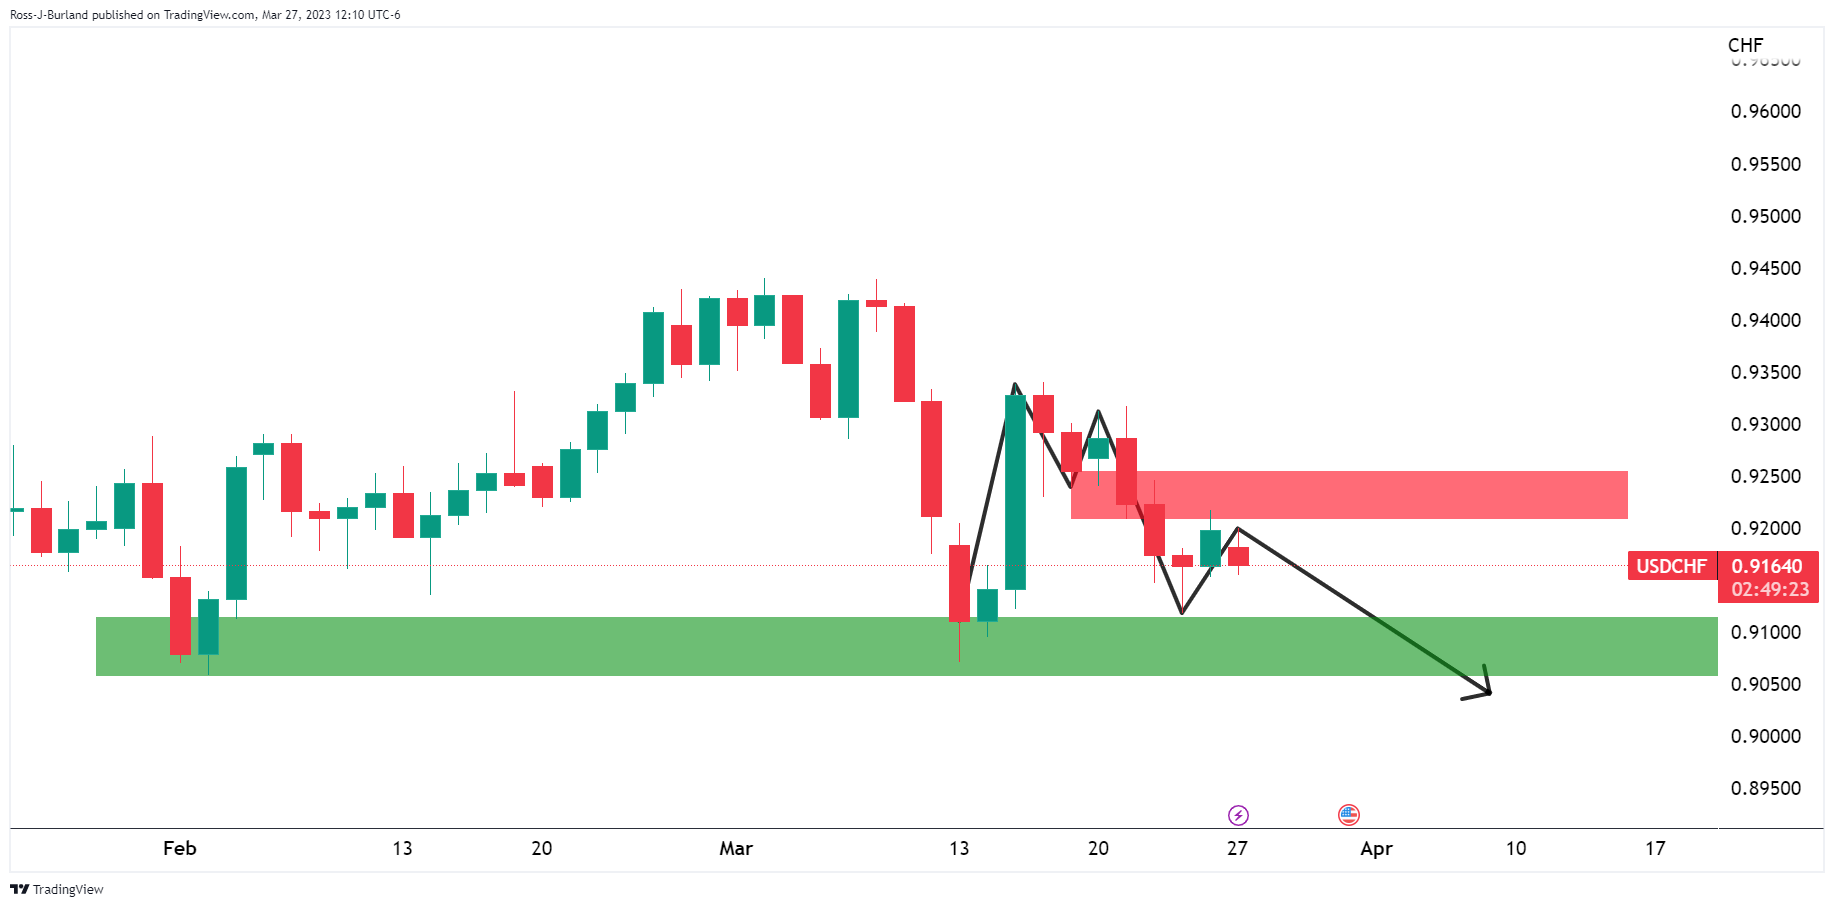
The M-formation is a reversion pattern and the neckline is currently holding.
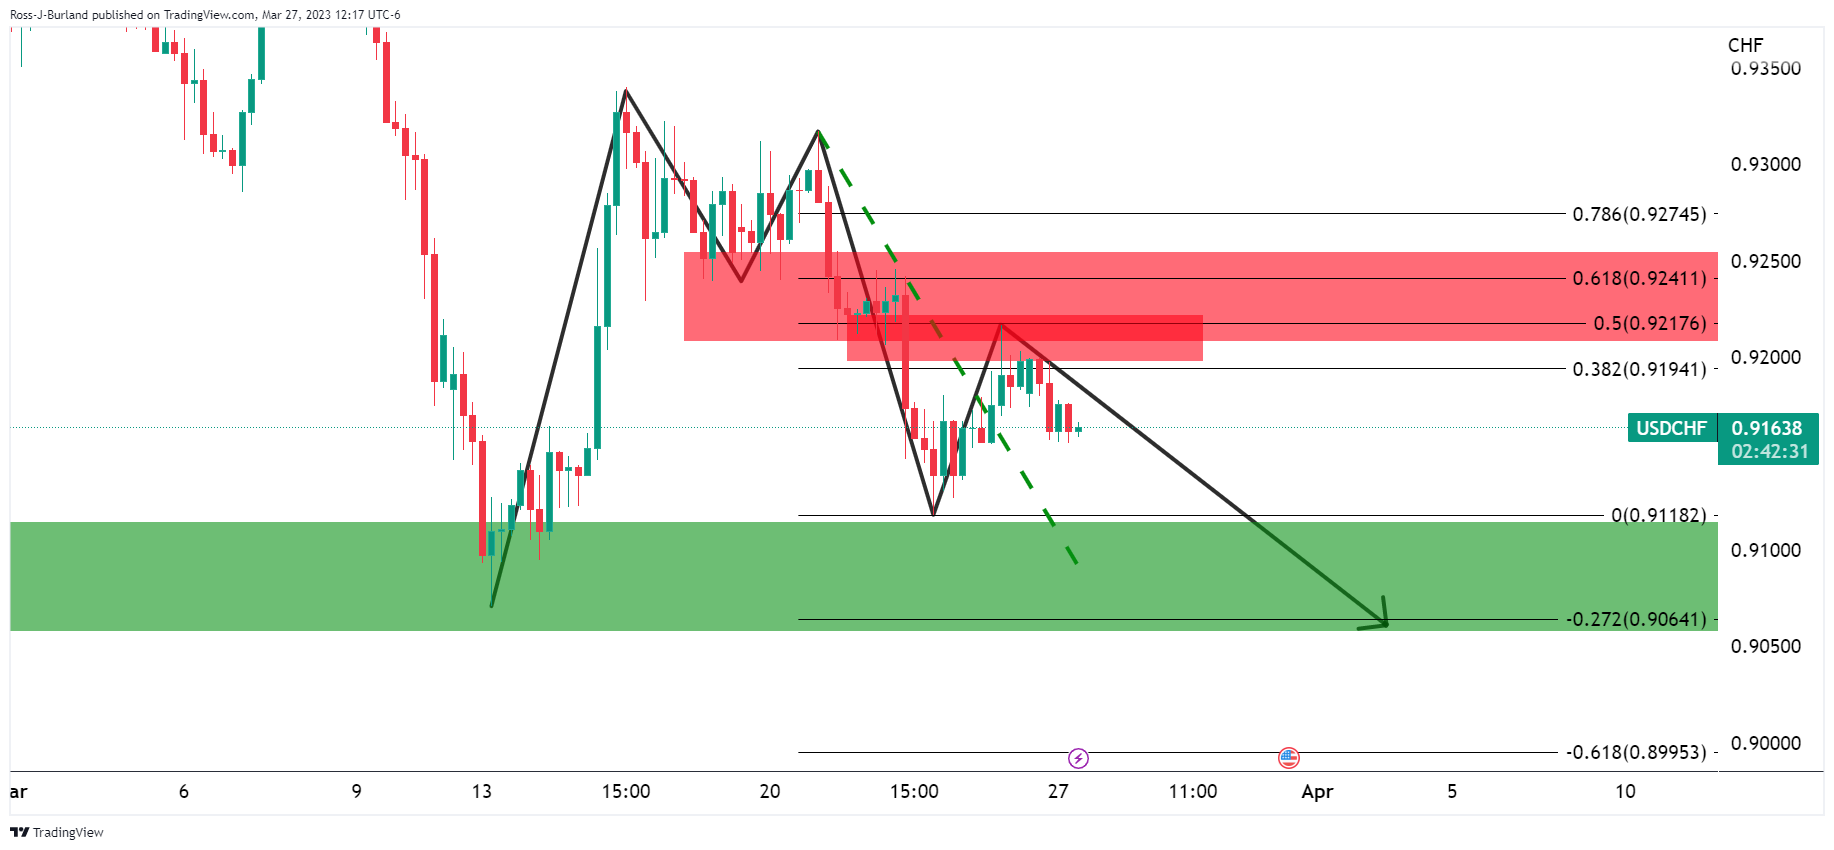
With resistance at a 50% mean reversion level, the bias is to the downside with 0.9050 in focus.
Bank of England's Andrew Bailey has crossed the wires and said that the central bank has to be very alert to any signs of persistent inflationary pressures.
Key notes
If they become evident, further monetary tightening would be required.
MPC´s response will be firmly anchored in the emerging evidence.
Evidence has pointed to more resilient activity in the economy.
We have seen some big strains in parts of the global banking system emerge.
Rise in inactivity driven by early retirement seems likely to have contributed to a rise in cyclical r-star rate
This is part of the reason why we have had to raise the bank rate by as much as we have.
- WTI advances on sentiment, Kurdistan oil exports halt.
- Investors shrugged off the US banking system woes after First Citizens BankShares acquired Silicon Valley Bank.
- WTI Price Analysis: Stuck in neutral to the downward trend but could rally to $80.00 once RSI turns bullish.
Western Texas Intermediate (WTI), the US crude oil benchmark, advances sharply on an upbeat sentiment. Another reason for oil’s jump was a halt to oil exports from Iraq Kurdistan and Putin’s nuclear threats. At the time of writing, WTI is trading at $71.13 per barrel.
A confidence vote in the banking system sparked a shift in market mood after First Citizens BankShares, Inc. takeover the Silicon Valley Bank (SVB). Reports emerging that US authorities are considering expanding emergency lending facilities gave another reason for hope, which was cheered by investors.
WTI’s reversed its course after a dragonfly doji emerged on its daily chart after Friday’s close. Hence, oil traders threaten to push prices to the 20-day EMA at $72.10.
In the middle east, an arbitrage case won by Baghdad halted 450K bpd exports from Kurdistan to Turkey due to Kurdistan’s need for Iraq’s consent to ship oil.
Russian President Vladimir Putin’s announcement to deploy tactical nuclear weapons in Belarus in an attempt to intimidate the West due to its support for Ukraine also contributed to the increase in oil prices. NATO described Putin’s comments as “dangerous and irresponsible:, and Ukraine called for a UN Security Council meeting.
At the same time, Russia’s Deputy Prime minister Alexander Novak commented that Moscow is close to achieving its 500K crude output, to about 9.5 million bpd.
WTI Technical analysis
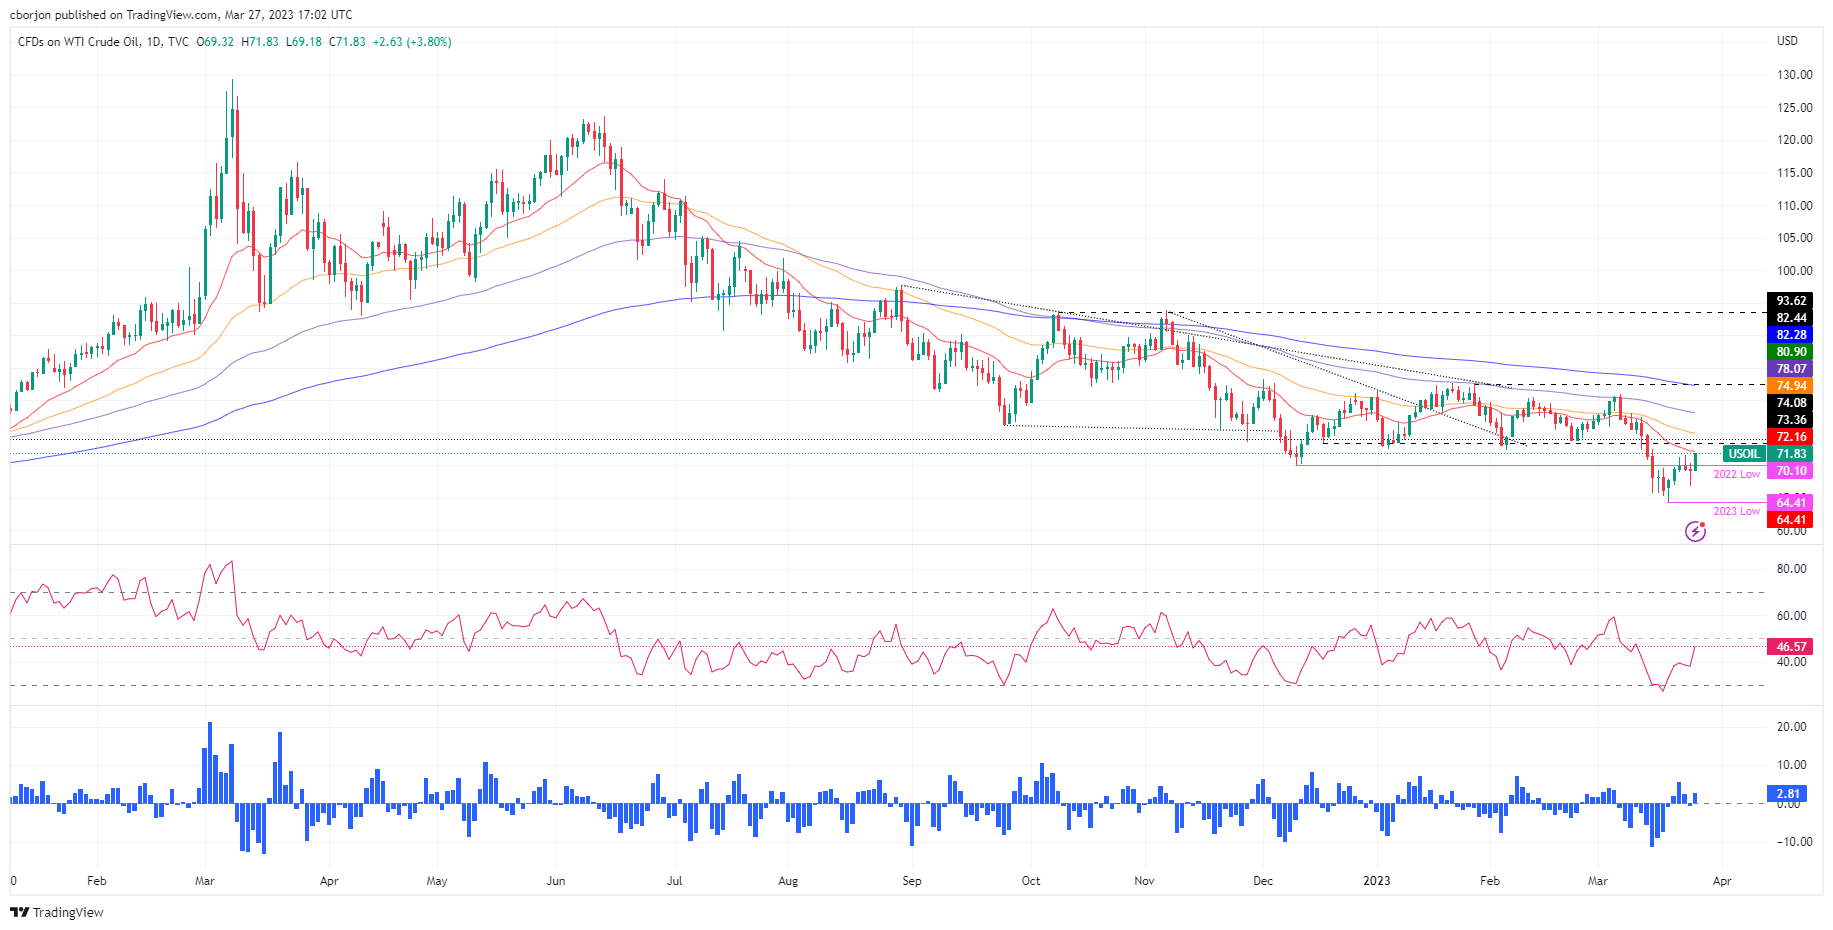
WTI is still neutral to downward biased, though approaching the 20-day EMA. Oscillators remain bearish, with the Relative Strength Index (RSI) below 50, but it’s aiming up. So, if RSI turns bullish, WTI’s could rally to $80.00. Hence, WTI’s first resistance would be the 20-day EMA at $72.10. A breach of the latter will expose the 50-day EMA at $74.93, followed by the 100-day EMA at $78.06, before testing $80.00.
European Central Bank (ECB) Governing Council member Isabel Schnabel said on Monday that they have no real concern about financial stability risks but added that the situation is still fragile, as reported by Reuters.
Key takeaways
"No sign of weakening in labour market."
"Balance sheet is expected to decline meaningfully over the coming years."
"Balance sheet will not return to the levels seen before the global financial crisis."
"Our balance sheet should only be as large as necessary to ensure sufficient liquidity provision and effectively steer short-term interest rates."
"If the corridor is sufficiently narrow, the implied rate volatility from fluctuations in aggregate excess reserves may not be a first-order concern."
"Banks might want to hold much higher liquidity buffers than in the past."
Market reaction
EUR/USD clings to modest daily gains slightly below 1.0800 following these comments.
"We are prepared to use all of our tools for any size institution as needed to keep the system safe," Federal Reserve Vice Chair for Supervision Michael Barr's prepared testimony to Congress reads, as reported by Reuters.
Additional takeaways
"Banking system is sound and resilient."
"Recent actions demonstrate we are committed to ensuring all deposits are safe."
"Committed to ensuring Federal Reserve fully accounts for any supervisory or regulatory failings around Silicon Valley Bank."
"It appeared contagion from SVB's failure could be far-reaching and damage the broader banking system."
"SVB had inadequate risk management, supervisors found deficiencies in its liquidity risk management near the end of 2021."
"Fed is examining whether applying more stringent standards would have prompted SVB to better manage risks."
"We plan to propose long-term debt requirement for large regional banks, need to enhance stress testing, explore changes to liquidity rules."
Market reaction
This headline doesn't seem to be having a significant impact on risk mood. As of writing, the Dow Jones Industrial Average was up 0.5% on the day.
- USD/MXN prints losses below $18.40 spurred on risk appetite despite high UST bond yields.
- US recession risks had risen, according to Minnesota’s Fed President Kashkari.
- USD/MXN Price Analysis: To continue its downtrend below 18.7968.
The USD/MXN tumbles to fresh two-week lows in the North American session at 18.3259, and sellers are taking a respite, exchanging hands slightly above the week’s lows. Investors shrugging off banking crisis woes shifted sentiment positively. Therefore, risk-perceived currencies in the FX space are printing gains. The USD/MXN trades at 18.3902.
USD/MXN touched fresh weekly lows, despite a deficit in Mexican Trade Balance
Wall Street is opening the week with gains. A light economic docket in the United States (US) keeps traders focused on the developments around global banks. News emerged that First Citizens BancShares, Inc. agreeing to buy SVB Financial Group spurred an uptick in sentiment, which sent the USD/MXN sliding to its new weekly lows. Nevertheless, US Treasury bond yields are recovering, capping the USD/MXN drop.
US Treasury bond yields are rising, with the 10-year benchmark note rate at 3.473%, gaining almost ten basis points. However, the greenback has failed to follow suit with UST bond yields, with the US Dollar Index registering losses of 0.14%, at 102.973.
Meanwhile, money market futures expect the US Federal Reserve (Fed) to hold rates unchanged at the May meeting, as shown by the CME FedWatch Tool. Odds are at 63.8%, vs. 38.2% chances of a 25 bps rate hike.
During the weekend, Minnesota’s Fed President Neil Kashkari said that the risks for a recession have improved after the banking system crisis.
On the Mexican front, the Balance of Trade for February missed estimates of a $0.9B surplus and printed a deficit of $1.84B. However, the figures showed some improvement after January’s $4.125B deficit. Exports were reduced by 2.80% YoY in February, blamed on crude oil exports dropping 19.2%, while Imports grew at a 4.1% YoY pace.
USD/MXN Technical analysis
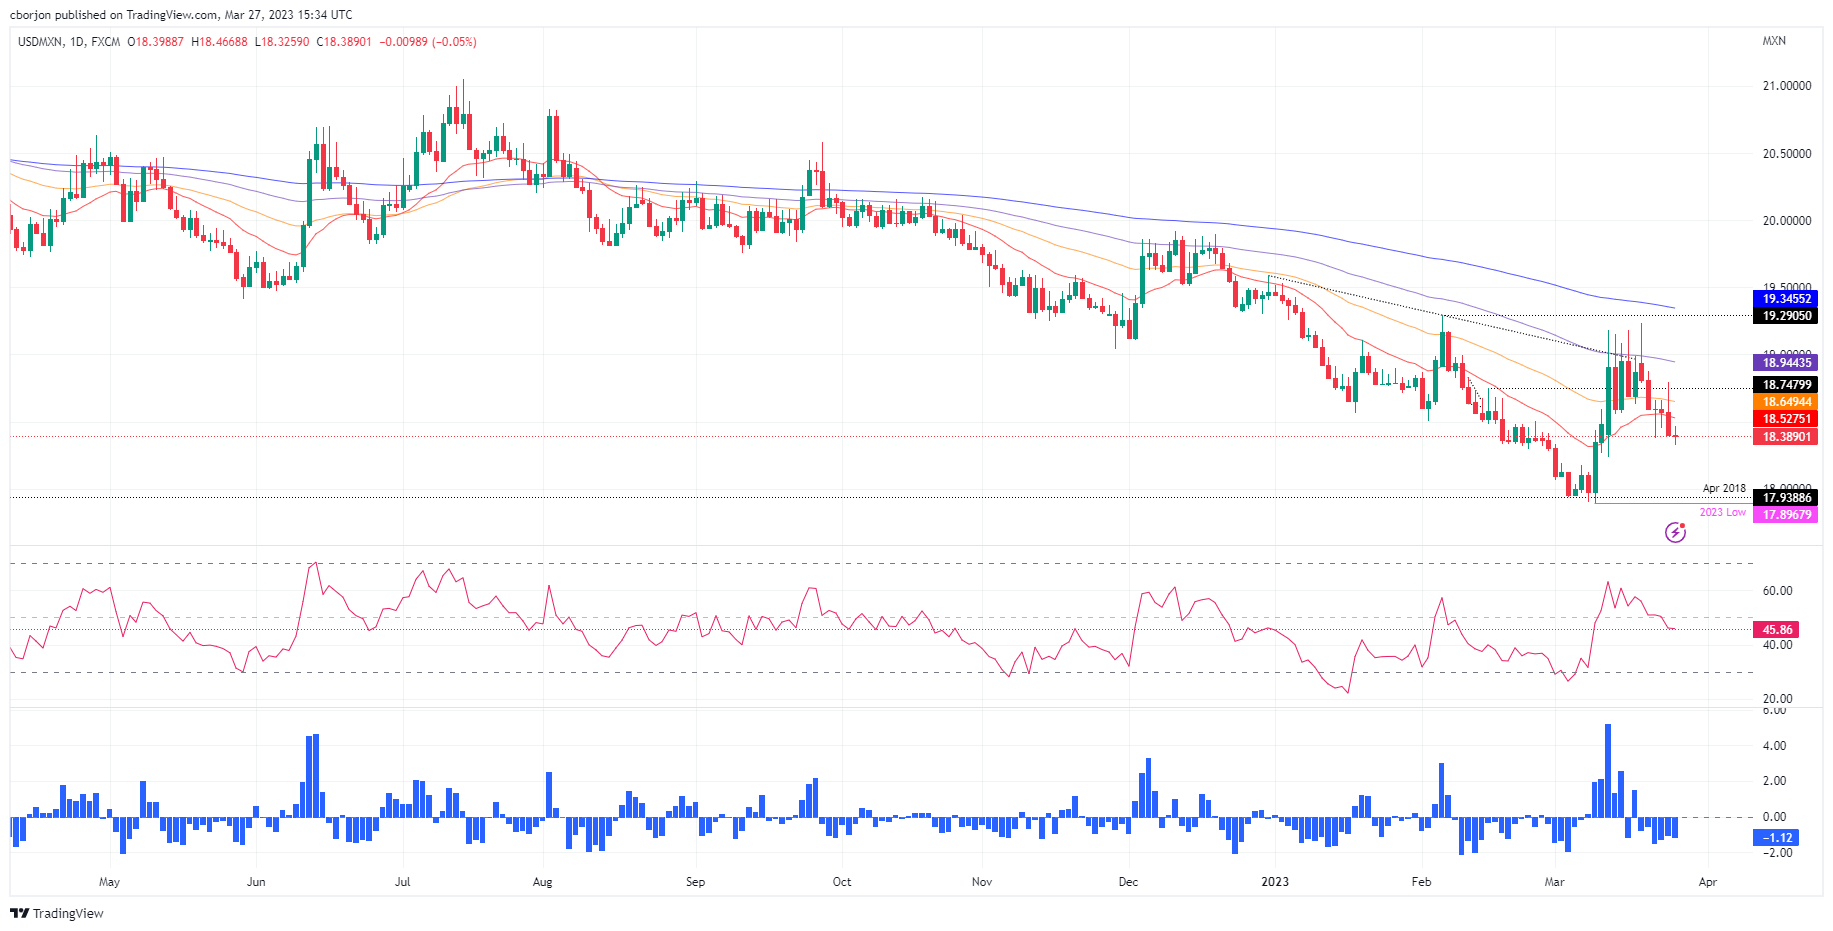
USD/MXN remains neutral to downward biased, capped by the 20-day Exponential Moving Average (EMA) at around 18.5290, slightly above the psychological $18.50 figure. Oscillators remained at bearish areas, with the Relative Strength Index (RSI) below 50, while the Rate of Change (RoC) stayed below the neutral line. Therefore, further downside is warranted, but the market mood could spur a reversal.
Hence the USD/MXN first support would be the weekly low at 18.3259. A breach of the latter will expose the March 13 low at 18.2369, followed by the YTD low at 17.8967. On the other hand, if the USD/MXN reclaims $18.50, that could open the door for further gains. But as long as the USD/MXN stays below 18.7968, the pair will remain tilted downwards.
- Dallas Fed Manufacturing Index for March missed market expectations.
- US Dollar Index drops 0.10% on a quiet day.
The headline General Business Activity Index of the Federal Reserve Bank of Dallas' Texas Manufacturing Survey declined to -15.7 in March from -13.5 in February. This reading came in weaker than the market expectation of -10.9
Further details of the survey revealed that the Production Index rose from -2.8 to 2.5, the Employment Index improved to 10.4 from -1.0, the New Orders declined from -13.2 to -14.3, the Prices received fell from 15.5 to 7.0 and the Price Paid for raw material dropped from 25.1 to 20.3.
Market reaction
The US Dollar Index is falling 0.10% on Monday, as it trades around 103.00, weakened amid a better tone in market’s mood.
Wild whipsaws in rates markets associated with banking stress newsflow have weighed on Gold prices to start the week. However, the trend for the yellow metal is unchanged, strategists at TD Securities report.
Gold has only seen lackluster interest associated with safe-haven buying
“Interestingly, the evidence suggests that Gold markets have only seen lackluster interest associated with safe-haven buying.”
“In Comex Gold markets, the crisis catalyzed some discretionary short covering, but much of the increase in long positioning has been associated with CTA buying activity. Even so, marginal liquidations from this cohort are unlikely to occur above the $1,955 mark, whereas additional buying activity could be catalyzed just north of the $2,000 range.”
“The wild gyrations observed in rates markets are unlikely to spark a change in trend for Gold.”
Nasdaq 100 is seen a short-term uptrend. The index could reach previous gap levels at 13075/13210 and perhaps even last August's peak of 13720, economists at Société Générale report.
Inching towards previous gap levels at 13075/13210
“Nasdaq 100 has witnessed a golden crossover i.e. the 50-DMA has crossed above the 200-DMA; this generally highlights further upside.”
“Daily MACD has been posting positive divergence and has now established itself above the equilibrium line denoting prevalence of upward momentum.”
“The index is expected to inch higher gradually towards previous gap levels at 13075/13210 and perhaps even towards last August peak of 13720.” “Defence of 200-DMA near 11900 would be crucial for persistence in up move.”
European Central Bank (ECB) policymaker Mario Centeno said on Monday that the wage increase in the Eurozone is still compatible with the monetary policy and added that they are not observing and second round effect on wage-setting, as reported by Reuters.
"We haven't seen a deanchoring inflation expectations," Centeno further reiterated and noted that the ECB has the tools for "whatever-it-takes" action for banks.
Market reaction
EUR/USD continues to edge higher in the second half of the day on Monday and was last seen rising 0.3% on the day at 1.0790.
The USD is narrowly mixed and may continue to range trade in the short run. But the greenback is set to weaken in the long run, Shaun Osborne, Chief FX Strategist at Scotiabank, reports.
Not at all clear that there is another 75 bps of tightening ahead
“It looks a bit of a toss-up about how equity hedge rebalancing flows might shake out at the end of the week and markets will likely remain subject to short-term bouts of uncertainty. Regardless of short-term haven demand or rebalancing flows, the longer-run outlook for the USD remains challenged by narrowing rate differentials.”
“Credit tightening will slow business investment and growth and I still think there is a risk that inflation starts to fall more obviously in the next month or two. The Fed might have one more hike in it but it’s not at all clear that there is another 75 bps of tightening ahead.”
EUR/USD came under pressure into late week. Economists at OCBC Bank expect the pair to recover if confidence among European bank bondholders is restored.
Near term corrective pullback
“Fragile sentiments may weigh on EUR in the interim but if concerns re EU banking sector prove short-lived (i.e. no material sell-off), then we should expect EUR to recover.”
“Daily momentum remains mild bullish, but RSI shows signs of fading. Corrective pullback not ruled out in the near term.”
“Support at 1.0730 (50-DMA), 1.0660/80 (21-DMA, 23.6% fibo retracement of Sep low to Feb high) before 1.0540 levels. Resistance at 1.0820, 1.0930 (recent high) and 1.1030 (2023 high).”
“Barring any extended risk sell-off, we look to buy dips on the pullback especially with ECB being one of the remaining hawks in town.”
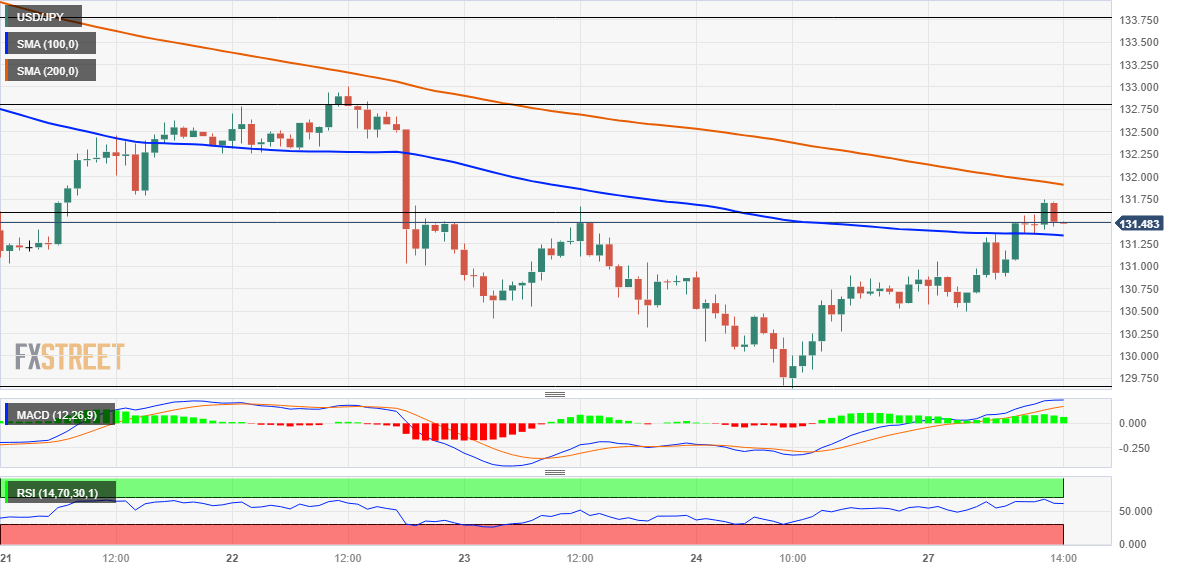
- USD/JPY gains strong positive traction on Monday and recovers further from a multi-week high.
- A combination of factors weighs heavily on the JPY and remains supportive of the momentum.
- The Fed’s less hawkish outlook keeps the USD bulls on the defensive and could cap the upside.
The USD/JPY pair builds on Friday's goodish rebound from the 129.65 region, or its lowest level since February 03 and kicks off the new week on a positive note. The steady intraday move-up remains uninterrupted through the early North American session and lifts spot prices to a fresh daily peak, around the 131.75 region in the last hour.
The risk-on impulse undermines the safe-haven Japanese Yen (JPY), which is further weighed down by the widening of the US-Japan rate differential amid a strong rally in the US Treasury bond yields. That said, the Federal Reserve's less hawkish outlook fails to assist the US Dollar (USD) to capitalize on its recent recovery from a multi-week low and might keep a lid on any further gains for the USD/JPY pair, at least for the time being.
The intraday move up, meanwhile, pushes spot prices beyond the 100-hour Simple Moving Average (SMA), though lacks follow-through beyond the 23.6% Fibonacci retracement level of the recent downfall from the monthly peak. Moreover, oscillators on the daily chart - though they have been recovering from lower levels - are still far from being in positive territory and warrant some caution before placing bullish bets around the USD/JPY pair.
Hence, any subsequent move up is more likely to confront stiff resistance around the 200-hour SMA, currently pegged just ahead of the 132.00 round figure. Some follow-through buying, however, might prompt a short-covering rally and push the USD/JPY pair towards the 132.80-132.85 region, representing the 38.2% Fibo. level. This is closely followed by the 133.00 mark, which if cleared will suggest that spot prices have formed a near-term bottom.
On the flip side, an intraday pullback now seems to find decent support near the 131.00 round-figure mark. The said handle should now act as a pivotal point, which if broken decisively could accelerate the fall towards the 130.55-130.50 intermediate support. The USD/JPY pair could decline further towards the 130.00 psychological mark before eventually dropping back to the multi-week low, around the 129.65 area touched on Friday.
USD/JPY 1-hour chart
Key levels to watch
- The grey metal trades on the defensive below $23.00.
- Recent tops near $23.50 caps the upside so far.
- There is an interim support at the 100-day SMA ($23.48).
Prices of the ounce of silver starts the new trading week on the defensive and retreat for the first time after three consecutive daily advances on Monday, probing at the same time the sub-$23.00 region.
In fact, silver comes under renewed selling pressure despite the so far bearish performance in the greenback and soon after hitting fresh multi-week peaks just beyond $23.50 on March 24.
In case the bullish mood returns to the market, the industrial metal is expected to meet the next up barrier at the March top at $23.52 (March 24). The surpass of this level should put silver en route to a potential visit to the 2023 peak at $24.62 (February 2) ahead of the April 2022 high at $26.21 (April 18). If losses accelerate, then there are provisional contention at the 100- and 55-day SMAs at $22.48 and $22.35, respectively, prior to the minor support level at $21.47 (low March 16). Further down comes the key 200-day SMA at $20.96, which precedes the 2023 low at $19.90 (March 10).
XAG/USD daily chart
GBP/USD has once again failed to overcome the key resistance at 1.2450. A break above here would open up 1.2610, then 1.2750, analysts at Société Générale report.
Defending 1.2010 critical for persistence in bounce
“Ongoing bounce is likely to persist towards recent high near 1.2450. If this is overcome, GBP/USD is expected to inch higher towards 1.2610 and 1.2750, the 61.8% retracement from 2021.”
“Defending recent higher low at 1.2010 is crucial for persistence in bounce.”
See – GBP/USD: Door open for the GBP to regain 1.23 in the short run – Scotiabank
- USD/CAD edges lower on Monday and is weighed down by a combination of factors.
- An uptick in Oil prices underpins the Loonie and exerts pressure amid a softer USD.
- Rallying US bond yields acts as a tailwind for the buck and should any further losses.
The USD/CAD pair comes under some selling pressure following a brief intraday consolidation on Monday and drops to a fresh daily low, around the 1.3700 mark heading into the North American session. The intraday downtick drags spot prices away from the 1.3800 round figure, or over a one-week high touched on Friday and is sponsored by a combination of factors.
Crude Oil prices edge higher on the first day of a new week amid expectations that a demand recovery in China and lower Russian production will tighten global supply. This, in turn, underpins the commodity-linked Loonie, which, along with subdued US Dollar (USD) demand, exerts some downward pressure on the USD/CAD pair. The risk-on impulse - as depicted by a positive tone around the equity markets - is seen as a key factor acting as a headwind for the safe-haven buck
Investors breathe a sigh of relief in reaction to the news that First Citizens Bank & Trust Company will buy all of Silicon Valley Bank's deposits and loans from the Federal Deposit Insurance Corporation (FDIC). Moreover, reports that US authorities were in the early stage of deliberation about expanding emergency lending facilities further boosted investors' confidence. Apart from this, the Federal Reserve's signal last week that it might soon pause the rate-hiking cycle weighed on the Greenback.
It is worth recalling that the US central bank raised interest rates by 25 bps on Wednesday, as was widely anticipated, though sounded cautious on outlook. That said, a strong follow-through rally in the US Treasury bond yields, bolstered by easing fears of a full-blown banking crisis, helps limit the downside for the USD and should lend some support to the USD/CAD pair. This, in turn, warrants some caution for aggressive bearish traders and before positioning for further intraday losses.
There isn't any major market-moving economic data due for release on Monday, either from the US or Canada. That said, the US bond yields and the broader risk sentiment might still influence the USD. Apart from this, traders will take cues from Oil price dynamics to grab short-term opportunities around the USD/CAD pair. The focus, meanwhile, remains on this week's important US macro data - the Conference Board's Consumer Confidence Index on Tuesday, followed by the final GDP print on Wednesday and the Fed's preferred inflation gauge - the US Core PCE Price Index on Friday.
Technical levels to watch
Lee Sue Ann, Economist at UOB group, reviews the latest BoE monetary policy meeting.
Key Takeaways
“As expected, the Bank of England (BoE)’s Monetary Policy Committee (MPC) voted by a majority of 7-2 to increase the Bank Rate by 25bps to 4.25%. The latest decision marked the 11th increase since the BoE started hiking in Dec 2021.”
“Clearly, the BoE is in a difficult position, and rightly so, has left the door open to options, indicating that if there were to be evidence of more persistent pressures, then further tightening in monetary policy would be required.”
“There is no monetary policy decision in Apr, and the next one on 11 May is still some time away. Whether the MPC will be comfortable with pausing by the time of the next meeting in May will depend very much on incoming data and developments. We are still expecting a 25bps hike in May (albeit with lower confidence), solely on the premise of the BoE’s focus on fighting inflation.”
The US Dollar Index (DXY) trades little changed as markets continue to adopt a cautious stance. Economists at OCBC Bank expect the greenback to come under renewed downside pressure if concerns around the banking system ease.
Next resistance at 103.40, support at 102.80
“On net, the mix of growth worries, lingering concerns of banking stresses could temporarily benefit safe haven proxies such as JPY, Gold and USD in the interim. But if concerns dissipate, we should expect USD to remain under pressure with risk proxies should recover.”
“Next resistance at 103.40 levels (50% fibo retracement of 2023 low to high, 50-DMA), 103.95 (38.2% fibo) and 104.20 (21-DMA).”
“Support at 102.80 (61.8% fibo), 102 levels.”
- EUR/USD trades within a narrow range around 1.0770.
- Occasional bearish moves could revisit the 1.0710 region.
EUR/USD looks cautious around 1.0760/70 amidst alternating risk appetite trends at the beginning of the week.
In case bears regain the upper hand, the pair could slip back to the provisional 55-day SMA near 1.0730 ahead of the minor support at 1.0712 (low March 24). A deeper retracement could extend to the 100-day SMA, today at 1.0621.
Looking at the longer run, the constructive view remains unchanged while above the 200-day SMA, today at 1.0333.
EUR/USD daily chart
US 10-Year Treasury Yields have pulled back after forming a lower peak near 4.09% earlier this month. The decline is set to continue towards 3.07%, economists at Société Générale report.
Correction towards 3.07%?
“An initial bounce is not ruled out, however, last week's high of 3.65%/3.70% should provide resistance.”
“Daily MACD has entered negative territory denoting possibility of potential downside.”
“Holding below 3.65%/3.70%, ongoing down move is expected to persist towards the lower limit of a multi-month channel at 3.17% and projections of 3.07%/3.02%.”
See – US 10-year Yield: Any break below 3% should prove short-lived – ING
- GBP/USD catches fresh bids on Monday and reverses a major part of Friday’s downfall.
- The risk-on mood undermines the safe-haven USD and remains supportive of the move.
- Rallying US bond yields acts as a tailwind for the buck and might cap any further gains.
The GBP/USD pair regains positive traction on the first day of a new week and builds on its steady intraday ascent through the mid-European session. Spot prices climb to a fresh daily high, around the 1.2270-1.2275 area in the last hour, and reverse a major part of Friday's losses amid the risk-on impulse.
Investors breathe a sigh of relief in reaction to the news that First Citizens Bank & Trust Company will buy all of Silicon Valley Bank's deposits and loans from the Federal Deposit Insurance Corporation (FDIC). This is evident from a generally positive tone around the equity markets, which fails to assist the safe-haven US Dollar (USD) to capitalize on last week's goodish rebound from its lowest level since February and lends support to the GBP/USD pair.
The Greenback is further undermined by the Federal Reserve's hints of a possible pause to its rate-hiking cycle in the wake of the recent turmoil in the banking sector. That said, a strong follow-through rally in the US Treasury bond yields acts as a tailwind for the buck, which, in turn, might keep a lid on any meaningful upside for the GBP/USD pair. Hence, any subsequent move is more likely to confront stiff resistance near the 1.2300 round-figure mark.
Technical indicators on the daily chart, meanwhile, are holding in the positive zone and are still far from being in the overbought territory. This, in turn, suggests that some follow-through buying should pave the way for additional gains and a move towards retesting the monthly peak, around the 1.2340-1.2345 region. The positive momentum could get extended further and allow the GBP/USD pair to aim back to reclaim the 1.2400 round-figure mark.
On the flip side, the 1.2230 level now seems to protect the immediate downside ahead of the 1.2200 round figure and the 1.2175 support zone. A convincing break below might prompt some technical selling and drag the GBP/USD pair towards the 1.2100 mark. The latter coincides with the 100-day Simple Moving Average (SMA), below which spot prices could slide to the next relevant support near the 1.2055-1.2050 region en route to the 1.2000 psychological mark.
GBP/USD 4-hour chart
Key levels to watch
In view of Markets Strategist at UOB Group Quek Ser Leang, a sustainable breakdown of 14,095 in USD/IDR seems unlikely for the time being.
Key Quotes
“We did not anticipate the sharp drop in USD/IDR to a low of 15,130 (we were expecting USD/IDR to consolidate).”
“The sharp and rapid drop has room to extend but in view of the deeply oversold conditions, a sustained drop below the major support at 14,095 is unlikely. Resistance is at 15,250, followed by 15,300.”
The US Dollar Index is drifting towards the February trough near 100.80. Failure to hold above here would trigger another leg lower, economists at Société Générale report.
Reclaiming 104 crucial to affirm bounce
“It would be interesting to see if the index can carve out a higher low and gradually establish itself above 104, the 50% retracement of recent pullback. Failure would mean continuation in decline.”
“In case the index breaks below 100.80, the downtrend is likely to persist. Next potential supports could be at 100.00 and projections of 98.90.”
EUR/USD steadies after finding support in the low 1.07s. The pair could see another leg higher on a break past 1.0785, economists at Scotiabank report.
EUR to remain firm on minor dips
“The short-term charts retain a bearish look after the EUR’s tumble from last week’s high. But spot has steadied around the 50% retracement of the EUR rally from 1.05 around the middle of the month and underlying trend dynamics remain EUR-bullish on the longer term oscillators. This should mean dips remain well-supported.”
“EUR gains back through 1.0785 will give spot a bit more lift.”
“Key resistance is 1.0930 – last week’s high.”
- AUD/USD struggles to gain any meaningful traction and oscillates in a range on Monday.
- A positive risk tone lends support to the risk-sensitive Aussie amid subdued USD demand.
- Rallying US bond yields acts as a tailwind for the buck and caps the upside for the major.
The AUD/USD pair lacks any firm intraday direction on Monday and oscillates in a narrow trading band around mid-0.6600s through the mid-European session. Spot prices, meanwhile, remain well within the striking distance of over a one-week low touched on Friday and seem vulnerable to prolonging last week's rejection slide from a technically significant 200-day Simple Moving Average (SMA).
A generally positive tone around the equity markets, bolstered by easing fears of a full-blown banking crisis, turns out to be a key factor offering some support to the risk-sensitive Aussie. News that First Citizens Bank & Trust Company will buy all of Silicon Valley Bank's deposits and loans from the Federal Deposit Insurance Corporation (FDIC) calm market nerves about the contagion risk. Furthermore, reports that US authorities were in the early stage of deliberation about expanding emergency lending facilities boost investors' confidence.
The risk-on flow, meanwhile, fails to assist the safe-haven US Dollar (USD) to capitalize on its recent strong recovery from a multi-week low touched last Thursday, which further contributes to limiting the downside for the AUD/USD pair. That said, a strong follow-through rally in the US Treasury bond yields acts as a tailwind for the Greenback. This, along with a dovish signal from the Reserve Bank of Australia (RBA) and the Fed, hinting at a pause in the rate-hiking cycle, warrants caution before placing aggressive directional bets around the major.
In the absence of any major market-moving economic releases from the US on Monday, the US bond yields might influence the USD price dynamics and provide some impetus to the AUD/USD pair. Apart from this, the broader risk sentiment could produce short-term trading opportunities, though the lack of any meaningful buying suggests that the path of least resistance for spot prices remains to the downside.
Technical levels to watch
GBP/USD inches higher from the 1.22 support zone. Economists at Scotiabank believe that the pair could surge above the 1.23 level.
Cable remains well-supported on dips back to the 1.22 zone
“Retests of 1.22 over the past few sessions have generated solid gains and while short-term trend dynamics are soft, they are leaning GBP-bullish. That leaves the door open for the GBP to regain 1.23+ in the short run. However, the intraday chart does reveal a potential weakness – a possible Head & Shoulders top whose neckline trigger falls right on the 1.22.”
“Near-term weakness below the 1.22 region would imply GBP losses back to the 1.2075 zone in the next 1-3 days.”
The Dollar regained some ground in the past two trading sessions. Economists at ING see more balanced risks for the US Dollar Index (DXY) this week.
Dollar support comes from Europe
“The resurgence in banking stress in Europe forces some softening of our bearish Dollar view for the moment, at least until we can get more clarity on the stability of the EU banking sector.”
“Still, we continue to see the Fed as mostly carrying downside risks for the greenback, as the lack of clear communication leaves the door open for dovish speculation as the US regional crisis remains unresolved and is keeping the monetary policy outlook in the US in stark contrast (for now) to that of most European central banks.”
“On balance, we see more balanced risks for DXY this week, but volatility may remain elevated, and if anything our preference remains for a higher EUR/USD.”
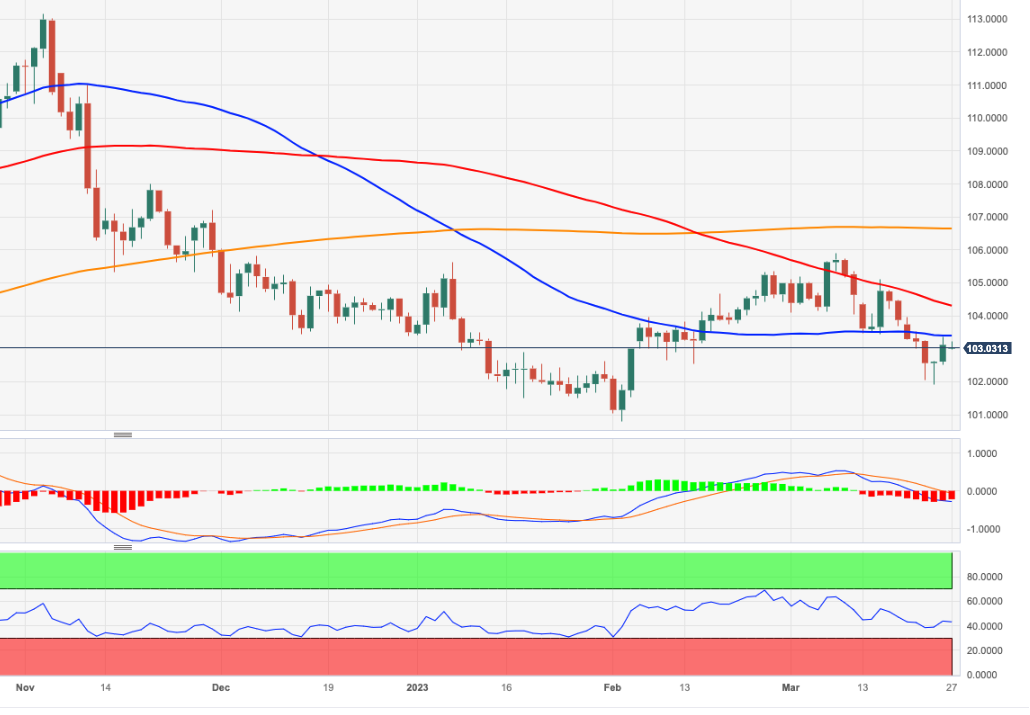
- DXY alternates gains with losses around the 103.00 region.
- The resumption of the selling bias could see the sub-102.00 area retested.
DXY trades within an inconclusive range in the 103.00 neighbourhood at the beginning of the week.
If bulls fail to regain control of the sentiment – ideally in the very near term - the index could lose the grip and challenge recent lows in the sub-102.00 zone (March 23). Extra losses from here could put a visit to the 2023 low around 100.80 (February 2) back on the investors’ radar
Looking at the broader picture, while below the 200-day SMA, today at 106.59, the outlook for the index is expected to remain negative.
DXY daily chart
S&P Global announced on Monday that it revised the 2023 Gross Domestic Product (GDP) growth forecast for Eurozone to 0.3% from 0% previously.
On a negative note, S&P Global now expects Eurozone GDP to expand by 1% in 2024, down from 1.4% in the previous forecast.
Market reaction
This headline doesn't seem to be having a noticeable impact on the Euro's performance against its major rivals. As of writing, EUR/USD was trading modestly higher on the day at 1.0770. Meanwhile, Euro Stoxx 50 is up more than 1% on a daily basis.
After probing graphical support at 4030, a bounce in Euro Stoxx 50 is underway. But if the index fails to surpass the 4240 mark, a deeper down move would be the most likely scenario, in the view of economists at Société Générale.
Break below the 4030 mark can extend the decline
“Failure to overcome 4240, the 76.4% retracement of recent pullback could mean risk of a deeper down move.”
“Break of 4030 can extend the decline towards 3910 and December low of 3800/3770.”
USD/MYR now seems to have moved into a 4.4100-4.4700 range, according to Markets Strategist at UOB Group Quek Ser Leang.
Key Quotes
“While we expected USD/MYR to weaken last week, we were of the view that ‘the next support at 4.4300 is unlikely to come under challenge’.”
“However, USD/MYR weakened more than expected as it plummeted to a low of 4.4080 and then rebounded to end the week at 4.4260. The rebound in oversold conditions suggests that USD/MYR is unlikely to weaken further. This week, USD/MYR is more likely to trade in a range, expected to be between 4.4100 and 4.4700.”
- EUR/JPY leaves behind three consecutive daily pullbacks on Monday.
- Extra range bound trade should remain on the cards for the time being.
EUR/JPY bounces off Friday’s weekly lows and retakes the 141.00 barrier and above at the beginning of the week.
The cross now flirts with the key 200-day SMA near 141.80, and a sustainable surpass of this region should open the door to further upside in the short-term horizon. Moving forward, the consolidation theme is expected to remain unchanged as long as the March peaks around 145.50 continue to cap the upside.
In the meantime, extra losses remain in store while the cross trades below the 200-day SMA.
EUR/JPY daily chart
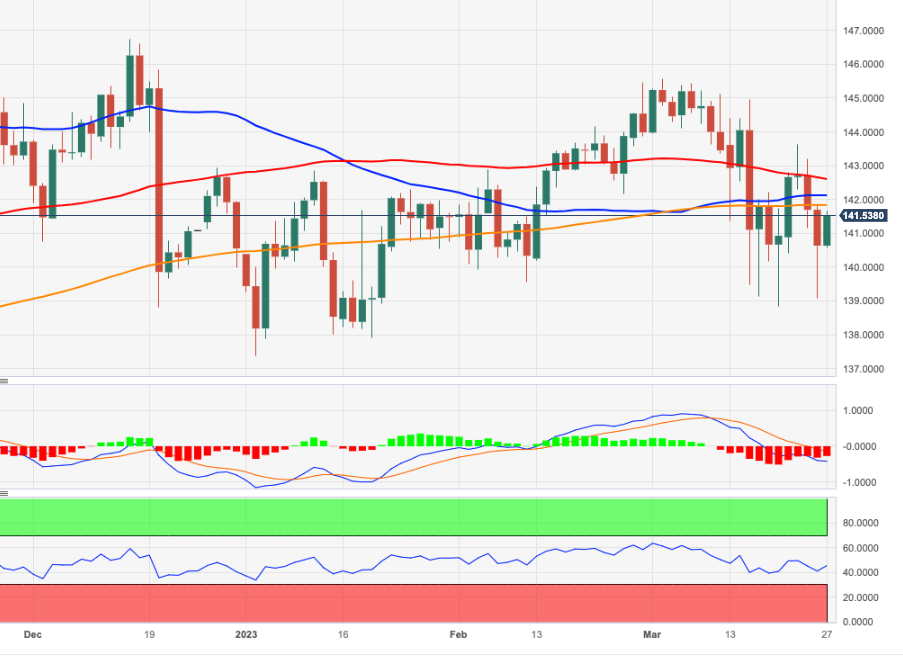
AUD/USD idles around 0.6650. If the pair fails to surpass 0.6780/0.6850, the decline is set to persist, analysts at Société Générale report.
Support 0.6550, resistance 0.6780
“AUD/USD has experienced a steady decline after forming a Head and Shoulders near peak of last August at 0.7130/0.7170. Neckline of the pattern at 0.6780/0.6850 is a short-term resistance zone. If the pair fails to overcome 0.6780/0.6850, the decline could extend.”
“Below 0.6550, next potential supports are at 0.6400, the 76.4% retracement from last October and 0.6310.”
Markets Strategist at UOB Group Quek Ser Leang favours further consolidation in USD/THB for the time being.
Key Quotes
“We highlighted last Monday (20 Mar, spot at 34.10) that USD/THB ‘is likely to break 34.00’ and we were of the view that ‘it is premature to expect USD/THB to weaken to 33.47’. While our view was not wrong as USD/THB dropped to 33.91, we did not quite expect the strong bounce from the low.”
“USD/THB appears to have moved into a consolidation phase and this week, USD/THB is likely to trade in a range, expected to be between 33.95 and 34.55.”
- USD/JPY gains strong positive traction on Monday and draws support from a combination of factors.
- The risk-on impulse, the widening of the US-Japan rate differential weighs on the JPY and lends support.
- The Fed’s less hawkish outlook keeps the USD bulls on the defensive and might cap any further gains.
The USD/JPY pair builds on Friday's goodish recovery from the 129.65 area, or its lowest level since February 03 and gains some follow-through traction on the first day of a new week. The positive momentum remains uninterrupted through the first half of the European session and lifts spot prices to a fresh daily high, around the mid-131.00s in the last hour.
A generally positive tone around the equity markets undermines the safe-haven Japanese Yen (JPY), which, in turn, is seen as a key factor acting as a tailwind for the USD/JPY pair. News that First Citizens Bank & Trust Company will buy all of Silicon Valley Bank's deposits and loans from the Federal Deposit Insurance Corporation (FDIC) calm market nerves about the contagion risk. Moreover, reports that US authorities were in the early stage of deliberation about expanding emergency lending facilities boost investors' appetite for perceived riskier assets.
The risk-on flow, along with easing fears of a full-blown banking crisis, lead to a further rally in the US Treasury bond yields. This results in the widening of the US-Japan rate differential, which is seen as another factor weighing on the JPY and providing an additional boost to the USD/JPY pair. That said, the Federal Reserve's signal that it might soon pause the rate-hiking cycle in the wake of the recent turmoil in the banking sector holds back the US Dollar (USD) bulls from placing fresh bets. This, in turn, might keep a lid on any meaningful appreciating move for the major.
It is worth recalling that the US central bank raised interest rates by 25 bps on Wednesday, as was widely anticipated, though sounded cautious on outlook. Apart from this, expectations that the Bank of Japan (BoJ) will tweak its bond yield control policy and whittle down its massive stimulus under new Governor Kazuo Ueda might contribute to capping gains for the USD/JPY pair. This makes it prudent to wait for some follow-through buying before confirming that the recent rejection slide from a technically significant 200-day Simple Moving Average (SMA) has run its course.
Technical levels to watch
Markets are once again forced to re-assess the risks of the banking crisis and that will drive much of the G10 FX swings this week. Still, monetary policy differentials seem to point more clearly to a higher EUR/USD, in the view of economists at ING.
Reassessing risks?
“While our general view favours a higher EUR/USD on the back of monetary policy divergence, last Friday brought a warning not to jump to the conclusion that this banking turmoil is turning into a US-only story – and therefore into a straight-line bullish EUR/USD. Still, a move to 1.10 in the coming weeks remains a very tangible possibility.”
“For this week, re-testing 1.0900 would already be a very welcome sign for EUR/USD bulls.”
Today and tomorrow, we will hear from Bank of England Governor Andrew Bailey. However, the Pound should rapidly default to being driven by external factors, economists at ING report.
GBP/USD is a USD story and EUR/GBP is a EUR story
“With virtually nothing to highlight on the data side, GBP may be moved by Bailey’s words but should rapidly default to being driven by external factors.”
“Essentially, GBP/USD is a USD story and EUR/GBP is a EUR story.”
“We still think Cable can reach 1.2500 this quarter, and that the EUR looks marginally more attractive than GBP, and EUR/GBP should move back to 0.8900.”
- NZD/USD oscillates in a narrow trading band and is influenced by a combination of factors.
- A positive risk tone lends some support to the risk-sensitive Kiwi amid subdued USD demand.
- The fundamental backdrop warrants caution before placing any bullish bets around the pair.
The NZD/USD pair struggles to gain any meaningful traction on the first day of a new week and seesaws between tepid gains/minor losses through the first half of the European session. The pair currently trades just below the 0.6200 mark and seems poised to extend the pullback from the vicinity of the 0.6300 round figure, or its highest level since February 16 touched last Thursday.
A combination of factors fails to assist the US Dollar (USD) to build on its recent recovery move from a multi-week low and lends some support to the NZD/USD pair. News that First Citizens Bank & Trust Company will buy all of Silicon Valley Bank's deposits and loans from the Federal Deposit Insurance Corporation (FDIC) calm market nerves about the contagion risk. Moreover, reports that US authorities were in the early stage of deliberation about expanding emergency lending facilities boost investors' confidence. This is evident from a fresh leg up in the US equity futures, which, along with the Federal Reserve's signal last week that it might soon pause the rate-hiking cycle, act as a headwind for the safe-haven buck.
Easing fears of a full-blown banking crisis, meanwhile, leads to a further strong follow-through recovery in the US Treasury bond yields. Apart from this, Russian President Vladimir Putin's decision to place tactical nuclear weapons in Belarus acts as a tailwind for the Greenback and keeps a lid on any meaningful upside for the risk-sensitive Kiwi, at least for the time being. This, in turn, warrants some caution for the NZD/USD bulls. Moreover, last week's failure near a technically significant 200-day Simple Moving Average (SMA) makes it prudent to wait for strong follow-through buying before placing fresh bullish bets around the major and positioning for any meaningful appreciating move in the near term.
There isn't any relevant market-moving economic data due for release from the US on Monday, leaving the USD at the mercy of the US bond yields. Apart from this, the broader risk sentiment might influence the safe-haven Greenback and provide some impetus to the NZD/USD pair. The market focus, however, will remain glued to the release of the Fed's preferred inflation gauge, the Core PCE Price Index, due on Friday.
Technical levels to watch
Gold traded briefly above the $2,000 level last week. Strategists at TD Securities analyze the conditions to see XAU/USD to see a sustained break above $2,000.
Investor appetite for Gold is likely to improve
“The brewing bank crisis which started with SVB, which has now migrated to European institutions, has prompted investors to aggressively increase Gold length.”
“With credit conditions tightening as the result of various bank sector difficulties, the Fed, and even more so money managers, have judged that the Fed funds will not need to increase as much as previously thought.”
“In order for the yellow metal to keep sustained new highs above $2,000, money managers will need to see the Fed show willingness to cut rates even if inflation remains far off the two percent target.”
In the view of Economist Lee Sue Ann and Markets Strategist Quek Ser Leang at UOB Group, USD/CNH could now face some consolidation, likely within 6.8100-6.9200.
Key Quotes
24-hour view: “We expected USD to trade in a range of 6.8150/6.8500 last Friday. However, it soared to a high of 6.8843 before closing on a strong note at 6.8717 (+0.62%). While the rapid rise is overbought, the risk for USD is still on the upside. That said, any advance is unlikely to break 6.9000. Support is at 6.8570, followed by 6.8400.”
Next 1-3 weeks: “We have expected a weaker USD for more than a week. In our most recent narrative from last Friday (24 Mar, spot at 6.8300), we indicated that while USD could weaken further, any decline is expected to face strong support at 6.8000. We added, ‘The downside risk is intact as long as it stays below 6.8710’. We did not anticipate the strong bounce in London trade that sent USD soaring to a high of 6.8843. The breach of our ‘strong resistance’ level at 6.8710 indicates that the weakness in USD has stabilized. The current movement is likely the early parts of a consolidation phase and USD is likely to trade between 6.8100 and 6.9200 for now.”
G10 commodity currencies underperform as banking fears intensify. Risks remain tilted to the downside the in near-term, economists at MUFG Bank report.
Evidence of stronger China demand needed for support
“We believe that risks remain titled to the downside for G10 commodity currencies in the near-term.”
“We do not expect banking fears to blow over quickly and they pose downside risks to global growth through tightening credit conditions. Nevertheless, it is premature to rule out a boost for commodity currencies later this year from a stronger than expected pick-up in demand from China.”
- EUR/USD advances modestly within a tight range.
- The European banking sector remains in the centre of the debate.
- Germany’s Business Climate improves further in March.
EUR/USD looks to leave behind the recent 2-day weakness and navigates within a narrow range and amidst tepid gains near 1.0770 on Monday.
EUR/USD remains cautious on banking jitters
EUR/USD starts the week in a positive fashion and so far prints humble gains near 1.0770 on the back of the generalized prudence among market participants regarding developments in the banking sector.
In the meantime, the absence of a clear direction in the broad risk appetite trends favour the pair’s ongoing erratic performance, although better-than-expected results from the German docket lends some support to the single currency on Monday.
On the latter, Business Climate in Germany tracked by the IFO Institute improved to 93.3 for the month of March (from 91.1). In addition, an IFO economist suggested that a winter recession in the country now looks more unlikely and noted a smaller proportion of businesses that want to raise prices.
From the ECB, Board member Simkus noted that bank liquidity and capitalization remain high in the euro area, while his colleague De Cos suggested tighter financial conditions have been impacting on the outlook for the economic activity and inflation. Later in the session, ECB’s Board members Elderson and Schnabel are also due to speak.
Across the pond, the speech by FOMC’s P.Jefferson will be in the limelight along with short-term bill auctions.
What to look for around EUR
EUR/USD manages to stage a small rebound following the strong pullback seen in the second half of the week.
In the meantime, price action around the European currency should continue to closely follow dollar dynamics, as well as the potential next moves from the ECB in a context still dominated by elevated inflation, although amidst dwindling recession risks for the time being.
Key events in the euro area this week: Germany IFO Business Climate (Monday) – France, Italy Business Confidence (Tuesday) – Germany GfK Consumer Confidence, France Consumer Confidence (Wednesday) – Germany Flash Inflation Rate, EMU Consumer Confidence, Economic Sentiment (Thursday) – Germany Retail Sales/Labor Market Report, EMU Flash Inflation Rate/Unemployment Rate, France Flash Inflation Rate, Italy Flash Inflation Rate (Friday).
Eminent issues on the back boiler: Continuation, or not, of the ECB hiking cycle. Impact of the Russia-Ukraine war on the growth prospects and inflation outlook in the region. Risks of inflation becoming entrenched.
EUR/USD levels to watch
So far, the pair is gaining 0.07% at 1.0767 and a break above 1.0929 (monthly high March 23) would target 1.1032 (2023 high February 2) en route to 1.1100 (round level). On the flip side, immediate support emerges at 1.0712 (low March 24) followed by 1.0621 (100-day SMA) and finally 1.0516 (monthly low March 15).
- USD/CAD is seen oscillating in a narrow trading band and is influenced by a combination of factors.
- Looming recession risks weigh on Oil prices, which undermines the Loonie and lends some support.
- The Fed’s less hawkish outlook acts as a headwind for the USD and acts as a headwind for the pair.
The USD/CAD pair struggles to gain any meaningful traction on the first day of a new week and oscillates in a narrow trading band through the early part of the European session. The pair is currently placed around the 1.3725 region, nearly unchanged for the day, and for now, seems to have stalled Friday's retracement slide from levels just above the 1.3800 mark, or a one-and-half-week high.
Despite Russian President Vladimir Putin's decision to place tactical nuclear weapons in Belarus, worries that a deeper global economic downturn will dent fuel demand and act as a headwind for Crude Oil prices. This, along with expectations that the Bank of Canada (BoC) will refrain from raising interest rates any further, undermines the commodity-linked Loonie and lends some support to the USD/CAD pair. The upside, however, remains capped amid subdued US Dollar (USD) demand, warranting some caution for aggressive bullish traders.
News that First Citizens Bank & Trust Company will buy all of Silicon Valley Bank's deposits and loans from the Federal Deposit Insurance Corporation (FDIC) calm market nerves about the contagion risk. Moreover, reports that US authorities were in the early stage of deliberation about expanding emergency lending facilities boost investors' confidence. This is evident from a fresh leg up in the US Treasury bond yields and fails to assist the safe-haven Greenback to capitalize on last week's solid rebound from its lowest level since February 03.
Apart from this, the Federal Reserve's signal that it might soon pause the rate-hiking cycle in the wake of the recent turmoil in the banking sector keeps a lid on any meaningful upside for the buck. That said, a further strong follow-through recovery in the US Treasury bond yields, bolstered by easing fears of a full-blown banking crisis, lends some support to the USD. The mixed fundamental backdrop holds back the USD bulls from placing fresh bets and should cap gains for the USD/CAD pair in the absence of any relevant economic data.
Technical levels to watch
We witnessed renewed nervousness above all in Europe – the Euro came under pressure. Nervousness is damaging for the EUR, Ulrich Leuchtmann, Head of FX and Commodity Research at Commerzbank, reports.
Renewed nervousness
“If the stress really were to reach levels which would make a continuation of the ECB’s interest rate policy impossible (let me repeat: that is not our house view!) the ECB above all would have to backpaddle very hard. As it would have been moving more forcefully in the wrong direction and for longer.”
“Even if nobody considers that to be a particularly likely scenario, it makes sense that the European single currency suffers if this risk is considered to be marginally higher.”
European Central Bank (ECB) Governing Council Gediminas Šimkus said on Monday, “financial stability is an important factor.”
“Bank liquidity and capitalization is high in the euro area,” Šimkus added.
Related reads
- Germany: IFO Business Business Climate Index improves to 93.3 in March vs. 90.9 expected
- ECB’s de Cos: Policy decisions will depend on new economic, financial data and core inflation
Further decline in USD/JPY now appears on the cards below the 129.60 level, comment Economist Lee Sue Ann and Markets Strategist Quek Ser Leang at UOB Group.
Key Quotes
24-hour view: “We highlighted last Friday that ‘there is potential for USD to break 130.15’ but we were of the view that ‘the next support at 129.80 is unlikely to come under threat’. The anticipated USD weakness exceeded our expectations as USD dropped to 129.67 and then rebounded strongly to end the day little changed at 130.69 (-0.09%). The strong bounce in oversold conditions suggests that the downside risk has faded. Today, USD is likely to consolidate, expected to be in a range of 130.20/131.40.”
Next 1-3 weeks: “Last Friday (24 Mar, spot at 130.65), we stated that ‘there is room for USD to weaken further though there are a couple of rather solid support levels at 130.15 and 129.80’. We did not expect the sharp but short-lived decline as USD dropped to 129.67 before rebounding strongly. Further USD weakness is not ruled out but USD has to break and stay below 129.60 before further decline is likely. The likelihood of USD breaking clearly below 129.60 will remain intact as long as it does not move above 132.00 (‘strong resistance’ level previously at 132.50).”
- GBP/USD regains positive traction on Monday and recovers a part of Friday’s modest losses.
- Rising US bond yields act as a tailwind for the USD and keep a lid on any meaningful upside.
- Traders now look to BoE Governor Bailey’s scheduled speech for short-term opportunities.
The GBP/USD pair builds on Friday's late intraday rebound from sub-1.2200 levels and gains some positive traction on the first day of a new week. The pair maintains its bid tone through the early part of the European session and is currently trading around mid-1.2200s, up nearly 0.15% for the day.
A further recovery in the US Treasury bond yields is seen lending some support to the US Dollar (USD) and turning out to be a key factor acting as a headwind for the GBP/USD pair. That said, the Federal Reserve's signal that it might soon pause the rate-hiking cycle in the wake of the recent turmoil in the banking sector should cap any meaningful upside for the US bond yields. Apart from this, a generally positive risk tone - as depicted by a fresh leg up in the US equity futures - keeps a lid on any the safe-haven Greenback and remains supportive of the bid tone surrounding the major.
News that First Citizens Bank & Trust Company will buy all of Silicon Valley Bank's deposits and loans from the Federal Deposit Insurance Corporation (FDIC) calmed market nerves about the contagion risk and boost investors' confidence. Traders, however, remain worried worries about a full-blown banking crisis. In fact, International Monetary Fund (IMF) Chief Kristalina Georgieva warned over the weekend that risks to financial stability have increased. This, along with Russia's decision to shift nuclear weapons near Belarus, continues to keep a lid on any optimism in the markets.
In the absence of any relevant economic data, either from the UK or the US, the aforementioned mixed fundamental backdrop warrants some caution for aggressive traders and before placing fresh directional bets around the GBP/USD pair. That said, the Bank of England (BoE) Governor Andrew Bailey's scheduled speech later during the US session might influence the British Pound and provide some meaningful impetus to the major. Meanwhile, the focus will remain glued to the release of the US Core PCE Price Index - the Fed's preferred inflation gauge - due on Friday.
Technical levels to watch
- Gold price extends retracement, bulls still in command.
- Quiet start to the week helps improving market mood.
- Federal Reserve speakers and Core PCE data headline the economic docket for the week.
Gold price is trading right above $1,970 at the time of the writing, as the bright metal extends the retracement triggered after topping at the $2,000 round resistance in the latter stages of last week. XAU/USD bulls still are in the driver’s seat, as Gold keeps making higher highs and higher lows.
Gold uptrend slows down as market mood improves
After a couple of turbulent and hectic weeks of trading, the start of the last week of March seems a bit quieter. Banking fears have receded somewhat, as the Federal Deposit Insurance Corp (FDIC) announced over the weekend that First Citizens BancShares Inc bought all the loans and deposits from the bankrupt Silicon Valley Bank. Monday trading has started with a positive market mood, and capital inflows to safe-haven assets like Gold have calmed down.
This week's highlights in the economic calendar await on Friday, with Chinese PMIs and US Personal Consumption Expenditures (PCE) Price Index data being the two heaviest hitters. Gold price traders should closely monitor both releases. China is the biggest Gold market in the world and any developments in their economy are huge for precious metals demand. On the United States front, inflation figures remain at the top of the Federal Reserve officials’ minds, and US PCE numbers are their preferred inflation indicators.
Eren Sengezer, Senior Analyst at FXStreet, explains that Federal Open Market Committee (FOMC) member speeches should also be tracked by Gold traders, as the blackout period ended after last week’s meeting and any insights from the future monetary policy intentions of the Fed is huge to shape the expectations of the market:
Investors will pay close attention to comments from Fed officials now that the blackout period is over. Furthermore, Friday’s panic mode in markets showed that investors remain on the lookout for signs of stress in the banking sector. Hence, Gold price could benefit from another slide in global yields.
Gold price develops bull flag pattern amidst bullish moving average cross
On the technical front, Gold price remains notably bullish despite the recent retracement. XAU/USD is nearing the 23.6% Fibonacci retracement level from the March 8-17 rally. According to Dhwani Mehta, Senior Analyst at FXStreet, Gold is developing a bull flag pattern and a bullish cross in its main moving averages, both clear signs of more upward trading action being developed:
Amidst the Bull Flag formation in play, Gold price continued to find support above the 23.6% Fibonacci Retracement (Fibo) level of the March advance, pegged at $1,963.
The 14-day Relative Strength Index (RSI) holds bullish while the 21-Daily Moving Average (DMA) pierced through the mildly firm 50 DMA for the upside on a daily closing basis, confirming a Bull Cross.
These favorable technical indicators continue to add credence to the bullish potential in the Gold price.
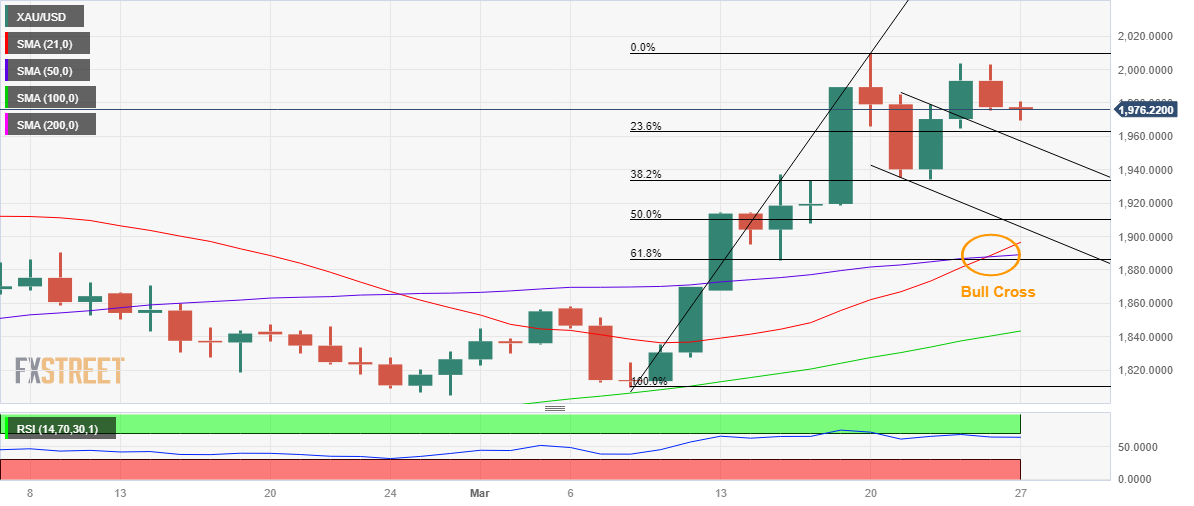
Gold price daily chart by Dhwani Mehta, Senior Analyst at FXStreet
European Central Bank (ECB) policymaker, Pablo Hernandez de Cos, said on Monday, “future monetary policy decisions will depend on three factors, such as new economic and financial data and core inflation.”
Additional comments
“Future monetary policy decisions will depend on how various sources of risks, including those recently experienced in financial markets crystallize.”
“Monetary policy decisions will also take into account intensity of monetary policy transmission.”
“Tensions in financial markets have generated a further tightening of financial conditions, affecting the outlook for economic activity and inflation.“
“All those factors have to be taken into account at our next meetings.”
“Over the medium term, the main risk for inflation comes from a persistent rise in price expectations above our inflation target.”
“On the contrary, the disinflation process could be accelerated further if the high tensions in financial markets were to be prolonged.”
“ECB, national authorities stand ready to act as and when necessary to maintain financial stability in euro area, as a necessary prerequisite to ensure price stability goal.”
The CAD has underperformed last week, losing ground on the generally softer USD. Economists at Scotiabank believe that the USD/CAD pair could enjoy further gains this week.
CAD’s struggles continue
“On the charts, the USD still looks somewhat overextended but overbought conditions have eased.”
“The CAD’s inability to take advantage of the soft USD last week, easily relinquishing gains below 1.3650, leave the charts looking more USD-bullish.”
“USD gains can extend through the 1.38 area to retest 1.3850/60 this week where trend resistance off the 2020 peak in funds sits. USD gains beyond that point remain questionable but are not entirely to be excluded, with little sign of the USD push higher relenting and the CAD looking friendless.”
Considering advanced prints from CME Group for natural gas futures markets, open interest shrank by around 6.1K contracts at the end of last week, offsetting the previous day small uptick. In the same line, volume retreated for the third straight session, this time by around 36.1K contracts.
Natural Gas: On its way to another test of the 2023 low
Friday’s uptick in prices of the natural gas came on the back of diminishing open interest and volume, which is indicative that a rebound seems not favoured in the very near term at least. Against that, the path of least resistance remains a gradual decline to the 2023 lows in the sub-$2.00 mark per MMBtu (February 22).
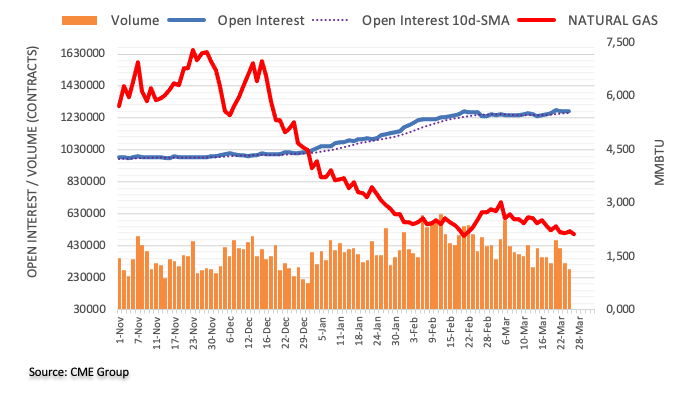
- German IFO Business Climate Index came in above market consensus in March.
- EUR/USD continues to fluctuate in daily range at around 1.0750.
The headline German IFO Business Climate Index rose to 93.3 in March versus the previous reading of 91.1 and the forecast of 90.9.
Meanwhile, the Current Economic Assessment Index edged higher to 95.4 from 93.9 and surpassed the market expectation of 94.1.
Finally, the IFO Expectations Index – indicating firms’ projections for the next six months, improved to 91.2 to in March from the previous month’s 88.4 and against the estimates of 88.0.
Market reaction
EUR/USD pair showed no immediate reaction to these figures and was last seen trading at 1.0760, where it was virtually unchanged on a daily basis.
AUD/USD is still seen trading between 0.6565 and 0.6760 for the time being, according to Economist Lee Sue Ann and Markets Strategist Quek Ser Leang at UOB Group.
Key Quotes
24-hour view: “Last Friday, we expected AUD to ‘trade in a range of 0.6655/0.6720’. However, AUD dropped to a low of 0.6625 before settling at 0.6643 (-0.61%). While downward momentum has not increased much, AUD is likely to trade with a downward bias towards 0.6610. The major support at 0.6565 is not expected to come under threat. Resistance is at 0.6670; a break of 0.6695 would indicate that the current downward pressure has eased.”
Next 1-3 weeks: “We have held a positive AUD view since the start of last week. As AUD struggled to extend its advance, we highlighted last Friday (24 Mar, spot at 0.6680) that AUD must break and hold above 0.6760 for the chances of it advancing further will rapidly diminish. AUD subsequently dropped below our ‘strong support’ level of 0.6640 (low of 0.6625). The price action suggests that AUD is not advancing further. For the time being, AUD is likely to trade between the two major levels of 0.6565 and 0.6760.”
US 10-year yield is around 3%. The 3% level is key for economists at ING.
The move down to 3% should be classed as an overshoot to the downside
“One of the simplest models for long-tenor rates is to look at the futures strip as far out as it goes (with reasonable liquidity) and add a moderate premium to this (maybe 20 bps). Employing that, we find that by mid-2024, the implied Fed funds rate is 3.5%. The fed funds strip can, of course, shift lower, and we think it will, ending up at 3%.”
“That 3% level is key for us, as it provides a target for the 10yr yield to aim for. Evidence of stress in the banking sector and tightening in credit conditions is likely to push us in that direction in the coming months or maybe even sooner. However, any break below 3% should prove short-lived, as even the move down to 3% should be classed as an overshoot to the downside.”
- Gold price continues steady pullback as First Citizens Bank is taking over SVB.
- Relief is tempered by comments from Fed’s Kashkari, suggesting banking crisis could still trigger recession.
- Gold remains in an uptrend, correction is still too minor to be called a reversal.
XAU/USD is trading in the lower $1,970s at the start of the week, after pulling back from highs just above $2,000 reached on Friday. Easing bank stress may have lessened Gold’s safe-haven appeal but persistent fears of wider contagion appear to be putting a floor under the precious metal’s price.
News of Silicon Valley Bank takeover soothes markets
The news that First Citizens Bancshares Inc, the holding company of North-Carolina based First Citizens Bank, has bought defunct lender Silicon Valley Bank (SVB) has brought some temporary relief to markets on Monday, March 27, lessening demand for safe-haven Gold.
First Citizens has taken over all of SVB’s $119B deposits and loans, and has bought $72B of its assets, at a $16.5B discount, a press release from the FDIC said.
The deal limits the damage from SVB’s failure but does not eradicate it: the bank’s collapse is still thought to have cost the FDIC $20B.
Policymakers voice concerns over banking crisis, recession
Despite the positive takeover news, Gold price may still be enjoying safe-haven flows as policymakers voice fears regarding more banking contagion triggering a possible recession.
Minneapolis Fed president Neel Kashkari said, “Recent stress in the banking sector and the possibility of a follow-on credit crunch brings the US closer to recession. It definitely brings us closer," in an interview on the CBS show Face the Nation.
"What's unclear for us is how much of these banking stresses are leading to a widespread credit crunch. That credit crunch... would then slow down the economy. This is something we are monitoring very, very closely," Kashkari added.
Gold price is in an intact uptrend
Gold price remains in an uptrend on a short to medium-term basis, as it makes higher highs and lows on the daily chart. This, according to the old adage “The trend is your friend until the bend at the end,” favors bullish bets.
-638154997722061789.png)
Gold price: Daily Chart
The next target for Gold price lies at the $2,070 March 2022 highs. A break and close above the $2,009 highs of March 20 when markets went into panic mode due to Credit Suisse’s failure, however, is a necessary prerequisite for confirming a move higher.
The Average Directional Index (ADX) indicator, which measures the strength of a trend is giving a 35 reading which suggests the uptrend is robust. 35 is also in a sweet spot – if it was much higher, say above 45, it might indicate a market top, or overbought state. Meanwhile, if ADX was below 20 it might indicate Gold is in a sideways market.
Here is what you need to know on Monday, March 27:
Following the previous week's highly volatile action, financial markets seem to have started the new week on an upbeat tone with US stock index futures trading in positive territory and Euro Stoxx 50 opening more than 1% higher. IFO will release business sentiment data for Germany and the US economic docket will feature Dallas Fed Manufacturing Business Index. Central bank speak will be watched closely by investors.
Following Friday's rebound, the US Dollar Index fluctuates in a tight channel slightly above 103.00 early Monday and the 10-year US Treasury bond yield clings to modest gains at around 3.4%. Several Fed policymakers spoke ahead of the weekend but their comments don't seem to be having a significant impact on rate expectations. According to the CME Group FedWatch Tool, markets are currently pricing in a nearly 70% chance that the FOMC will keep the policy rate unchanged after the next meeting in early May.
Over the weekend, the FDIC issued a statement announcing First Citizens BancShares Inc bought all the loans and deposits of SVB and gave the Federal Deposit Insurance Corp equity rights in its stock worth as much as $500 million in return, as reported by Reuters. This development seems to be helping the risk sentiment improve early Monday.
Despite having closed deep in negative territory on Friday, EUR/USD managed to register gains last week. The pair stays in a consolidation phase below 1.0800 in the European morning. IFO's Current Assessment Index for Germany is forecast to edge higher to 94.1 from 93.9 in February.
Following Friday's deep correction, GBP/USD managed to stabilize above 1.2200. At the time of press, the pair was trading modestly higher on the day at around 1.2250. Bank of England Governor Andrew Bailey is scheduled to deliver a speech at 1700 GMT.
USD/JPY benefited from improving market mood at the beginning of the week and climbed above 131.00. Earlier in the day, the data from Japan showed that the Coincident Index improved to 96.4 in January from 96.1 and the Leading Economic Index inched higher to 96.6 from 96.5.
Gold tested $2,000 early Friday but fell sharply after having failed to stabilize above that level. Early Monday, XAU/USD remains under pressure amid recovering US yields and was last seen losing 0.5% on the day slightly below $1,970.
Bitcoin stayed directionless over the weekend but ended up gaining more than 25% on a weekly basis. BTC/USD trades in a narrow range below $28,000 on Monday. Ethereum rose toward $1,800 on Sunday but lost its traction. As of writing, ETH/USD was down more than 1% on the day at $1,750.
- Silver extends Friday’s late pullback from its highest level since early February.
- The technical setup support prospects for the emergence of some dip-buying.
- A convincing break below the $22.00 mark would negate the positive outlook.
Silver comes under some selling pressure on the first day of a new week and retreats further from its highest level since February 03, around the mid-$23.00s touched on Friday. The white metal maintains its offered tone through the early European session and is currently flirting with the daily low, around the $23.00 round-figure mark.
From a technical perspective, last week's sustained breakthrough and acceptance above the 61.8% Fibonacci retracement level of the recent pullback from a multi-month peak favours bullish traders. Moreover, oscillators on the daily chart are holding comfortably in the positive territory and add credence to the constructive setup. Hence, any subsequent slide is more likely to find decent support near the said resistance breakpoint, around the $22.80 region.
That said, some follow-through selling, leading to a further slide below the $22.50 area, has the potential to drag the XAG/USD towards the 50% Fibo. level, around the $22.20 region. This is followed by the $22.00 round figure, which if broken decisively will expose the 38.2% Fibo. level support near the $21.75-$21.70 sone. Failure to defend the said support levels will negate the positive outlook and shift the near-term bias in favour of bearish traders.
On the flip side, the daily swing high, around the $23.25 area, now seems to act as an immediate hurdle ahead of the mid-$22.00s, or the multi-week top set on Friday. A sustained move beyond should pave the way for additional gains and allow the XAG/USD to aim to reclaim the $24.00 round figure. The momentum could get extended towards testing the multi-month peak, around the $24.65 region touched in February, en route to the $25.00 psychological mark.
Silver daily chart
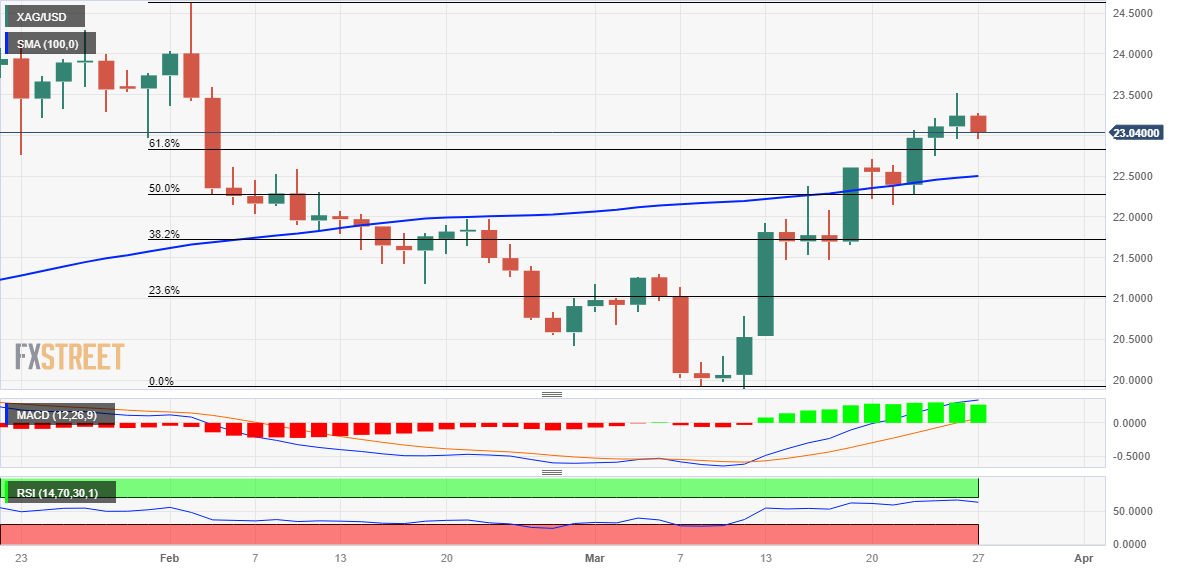
Key levels to watch
Economists at Crédit Agricole recommend not to sell the Dollar before the Federal Reserve is actually done hiking.
Fed hikes and intensifying recession risks tended to offer the USD a moderate boost on average
“Our recent historical analysis of FX price action during the past six Fed tightening cycles since 1980 has suggested that investors should not sell the USD before the Fed is actually done hiking.”
“It seems that the combination of ongoing Fed hikes and intensifying recession risks tended to offer the USD a moderate boost on average.”
CME Group’s flash data for crude oil futures markets noted traders increased their open interest positions for the fourth consecutive session on Friday, now by around 5.5K contracts. In the same direction, volume rose by nearly 41K contracts after four daily drops in a row.
WTI: Next target comes at $71.60
Friday’s comeback from the sub-$67.00 mark was accompanied by rising open interest and volume and favours the continuation of the recovery in prices of the WTI in the very near term. The convincing surpass of the key $70.00 mark per barrel should expose a potential move to the recent weekly peaks around $71.60 (March 23).
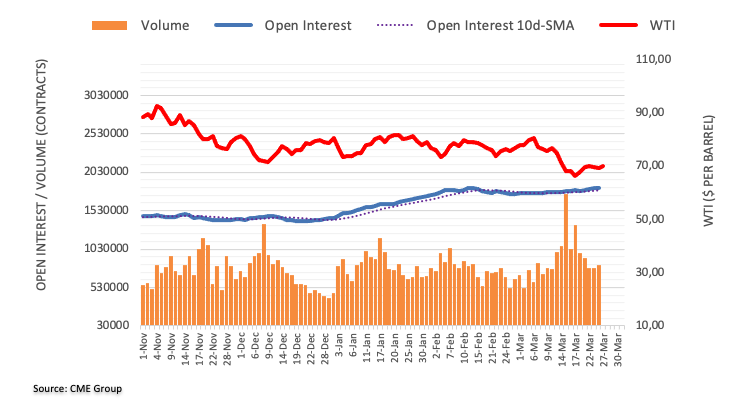
- USD/JPY struggles to upside momentum amid falling US Treasury yields.
- Banking turmoil fuels safe-haven demand for the Japanese Yen.
- USD/JPY's RSI suggests a possible pullback in the midst of downside bias.
The USD/JPY experienced a sharp rebound after finding support at the 130.00 mark. The significant drop after reaching the March high of 138.00 for the pair on a daily timeframe is a clear reflection of the falling US Treasury (UST) bond yields. Amid the ongoing banking adversity, the Federal Reserve (Fed) has signaled a pause, leading to a broad-based US Dollar weakness. In addition, the banking turmoil has ignited fresh safe-haven demand for the Japanese Yen.
With a downside bias intact, the USD/JPY's upward momentum is likely to remain limited. The first resistance for the pair is situated at Wednesday's high of 132.50, which also coincides with the 50-Day Moving Average (DMA). A convincing break above this level could lead the pair to confront the next resistance, a multi-tested broken resistance line coinciding with the 21-DMA.
A strong reversal in price or sudden surge in US Dollar demand could propel the USD/JPY to the March high of 138.00, a key psychological level.
On the other hand, the first support is seen at the 130.00 round figure, followed by the March low at the 129.75 mark. The final support zone is situated around the 128.00 mark.The fundamental picture for the USD/JPY portrays a downside bias, but the Relative Strength Index (RSI) signals a possible pullback due to slightly oversold conditions.
The pair could experience volatility based on any fresh developments in the banking sector, and later in the week, the market will carefully watch the US Personal Consumption Expenditure (PCE) data release. This key economic indicator could potentially impact the USD/JPY pair.
USD/JPY: Daily chart
-638154973496626723.png)
- EUR/JPY grinds higher around intraday top during the first positive day in three.
- Successful rebound from 61.8% Fibonacci retracement, ascending trend line from August 2022 lures buyers.
- Oscillators appear less lucrative as 100-DMA, short-term resistance line challenge immediate upside.
- Limited upside expected; bulls may remain cautious below 145.20.
EUR/JPY snaps two-day losing streak as it grinds higher past 141.00 during early Monday morning in Europe. In doing so, the cross-currency pair bounces off the 61.8% Fibonacci retracement of its August-October 2022 upside, also known as the golden Fibonacci retracement, as well as extending the rebound from nearly eight-month-old ascending support line.
The recovery moves, however, remain elusive unless crossing the 142.60-75 resistance confluence zone comprising the 100-DMA, descending trend line from March 15 and 38.2% Fibonacci retracement. It’s worth noting that the bearish MACD signals and downbeat RSI also keep sellers hopeful.
Even if the EUR/JPY price rises beyond 142.75, a downward-sloping resistance line from mid-December 2022, close to 145.25, could challenge the bulls.
Following that, the late 2022 peak surrounding 146.75 and the previous yearly peak of 148.40 will be in focus.
On the flip side, the multi-month-old ascending trend line, near 139.65 at the latest, restricts the short-term downside of the EUR/JPY pair before the 61.8% Fibonacci retracement level of 139.15.
It should be observed that the 140.00 round figure acts as an adjacent support while a downside break of 139.15 won’t hesitate to challenge the yearly low marked in January around 137.40
EUR/JPY: Daily chart
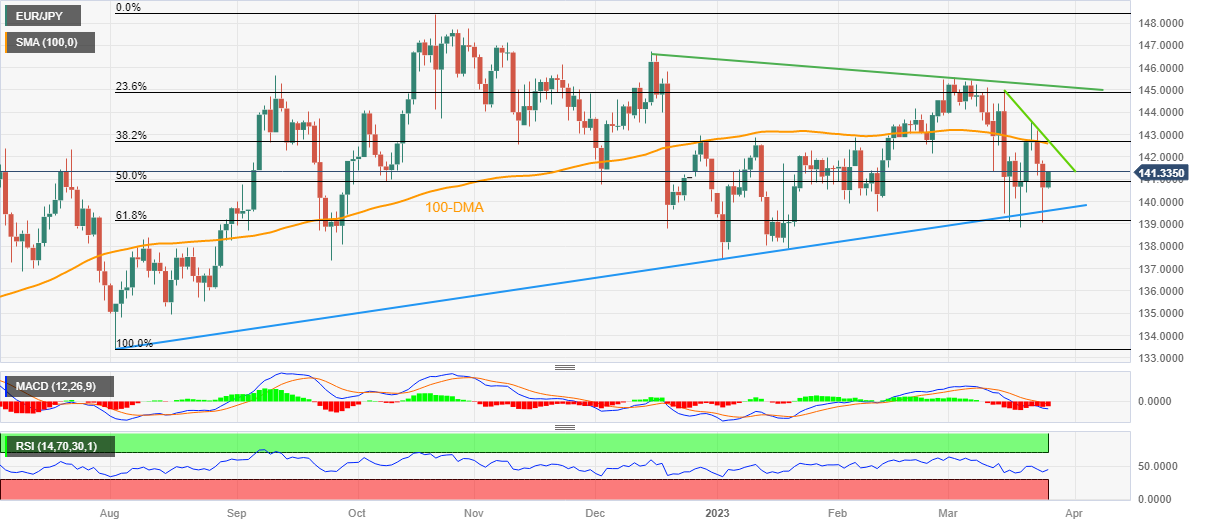
Trend: Limited recovery expected
Federal Reserve's (Fed) advisor and Chief Economist at KPMG, Diane Swonk, told MNI on Monday, the “Fed’s’decision Wednesday shows the central bank is strongly considering a halt to monetary tightening including an end to balance-sheet runoffs because of what could prove a substantial drag on the economy and inflation from the recent banking crisis.”
Additional takeaways
"It was the most dovish hike I could imagine.”
“If you get a cooling that's much more rapid without having the economy go into a deep freeze, the Fed could be easing by the end of the year and into next year."
“The Fed could be forced into such a policy reversal if a credit crunch delivers a bigger wallop to the economy than officials had foreseen.”
“Policymakers are trying to estimate the effects of suddenly tighter credit on growth, jobs and inflation - but it's too soon for a sound judgment.”
“FOMC members appear worried that rate hikes from zero to nearly 5% in just a year might be excessive in the face of financial turmoil.”
"They don't know how much that will do more than they need to cool inflation and chill the economy,"
"Their goal is to chill the economy not send it into a deep freeze."
Market reaction
The US Dollar Index ignores the dovish Fed view, as it is picking up fresh bids in early Europe. The US Dollar Index is rising 0.09% on the day at 103.19, as of writing.
In the opinion of Economist Lee Sue Ann and Markets Strategist Quek Ser Leang at UOB Group, GBP/USD should keep the side-line theme well in place for the time being.
Key Quotes
24-hour view: “Our view for GBP to trade in a range last Friday was incorrect as it dropped sharply to 1.2192 before rebounding. The rebound in oversold conditions suggest GBP is unlikely to weaken much further. Today, GBP is more likely to trade sideways, expected to be 1.2200 and 1.2300.”
Next 1-3 weeks: “We have expected GBP to advance since the start of last week. In our most recent update from last Friday (24 Mar, spot at 1.2275), we stated that ‘While GBP strength is still intact, short-term upward momentum is beginning to wane, and this combined with overbought conditions suggests 1.2400 may be out of reach this time around’. In London trade, GBP dropped sharply to a low of 1.2192. While our ‘strong support’ level at 1.2190 is not breached, upward momentum has more or less fizzled out. In other words, the week-long GBP strength has ended. The current movement is likely part of a consolidation phase. From here, GBP could trade within a range of 1.2140/1.2340.”
Open interest in gold futures markets increased for the second session in a row on Friday, this time by nearly 16K contracts according to preliminary readings from CME Group. Volume followed suit and went up by around 67.4K contracts, adding to the previous daily build.
Gold could slip back to $1930
Prices of the ounce troy of gold faded part of the recent advance on Friday. The downtick was on the back of increasing open interest and volume and leaves the door open to further weakness in the very near term. That said, the precious metal could revisit the area of recent lows near $1930.
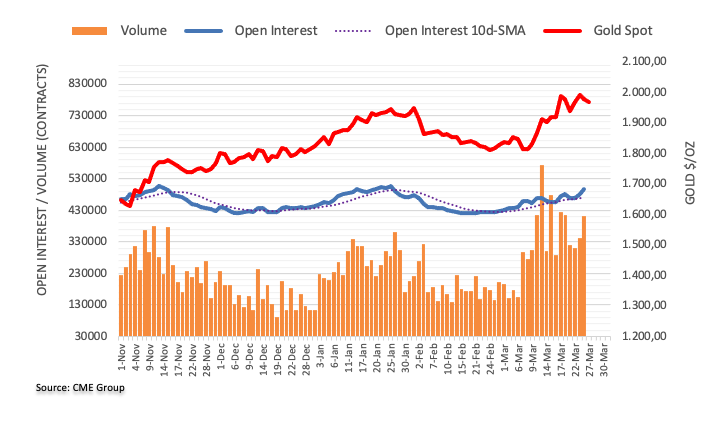
Economist Lee Sue Ann and Markets Strategist Quek Ser Leang at UOB Group suggest EUR/USD could navigate within the 1.0660-1.0870 range in the next few weeks.
Key Quotes
24-hour view: “We highlighted last Friday that EUR ‘has likely entered a consolidation phase’ and we expected it to ‘trade sideways in a range of 1.0800/1.0900’. Instead of trading sideways, EUR dropped sharply to 1.0712 before rebounding quickly to end the day at 1.0759 (-0.66%). The bounce from the low could extend but any advance is viewed as part of a trading range of 1.0740/1.0830. In other words, a clear break above 1.0830 is unlikely.”
Next 1-3 weeks: “Last Friday (24 Mar, spot at 1.0835), we highlighted that ‘As long as 1.0740 is not breached, there is potential for EUR to advance further, though the next resistance at 1.0980 could be out of reach this time around’. We did not quite expect the sharp pullback that broke below 1.0740 (low has been 1.0712). The breach of the ‘strong support’ at 1.0740 indicates that the upward pressure has eased. EUR appears to have entered a consolidation phase and it is likely to trade between 1.0660 and 1.0870 for the time being.”
- GBP/JPY picks up bids to refresh intraday high, prints the first daily gain in four.
- Clear break of immediate descending trend line, 50-HMA favor buyers.
- Upbeat oscillators add strength to bullish bias targeting 200-HMA.
GBP/JPY renews intraday high near 160.35 as bulls return to the table amid early Monday in London, after a three-day absence. In doing so, the quote pierces 50-Hour Moving Average (HMA) in an attempt to please the buyers.
That said, the cross-currency pair’s latest rebound could be linked to the quote’s successful break of a downward-sloping resistance line from the last Wednesday. Adding strength to the upside bias are the bullish MACD signals and ascending RSI (14) line, not overbought.
Although the GBP/JPY buyers are likely to keep the reins, at least for a while, the 200-HMA hurdle surrounding 161.10 holds the key for the pair’s further upside.
Following that, the previous weekly top and the monthly high, respectively around 163.35 and 164.25, could lure the bulls.
Meanwhile, the 160.00 psychological magnet limits the immediate downside of the GBP/JPY price ahead of the resistance-turned-support line of around 159.50.
Should the cross-currency pair slip beneath the 159.50 mark, the monthly low of 158.27, marked the previous day, may lure the GBP/JPY bears.
To sum up, GBP/JPY is likely to rise further but the pair’s upside past 200-HMA needs strong catalysts to convince bulls.
GBP/JPY: Hourly chart
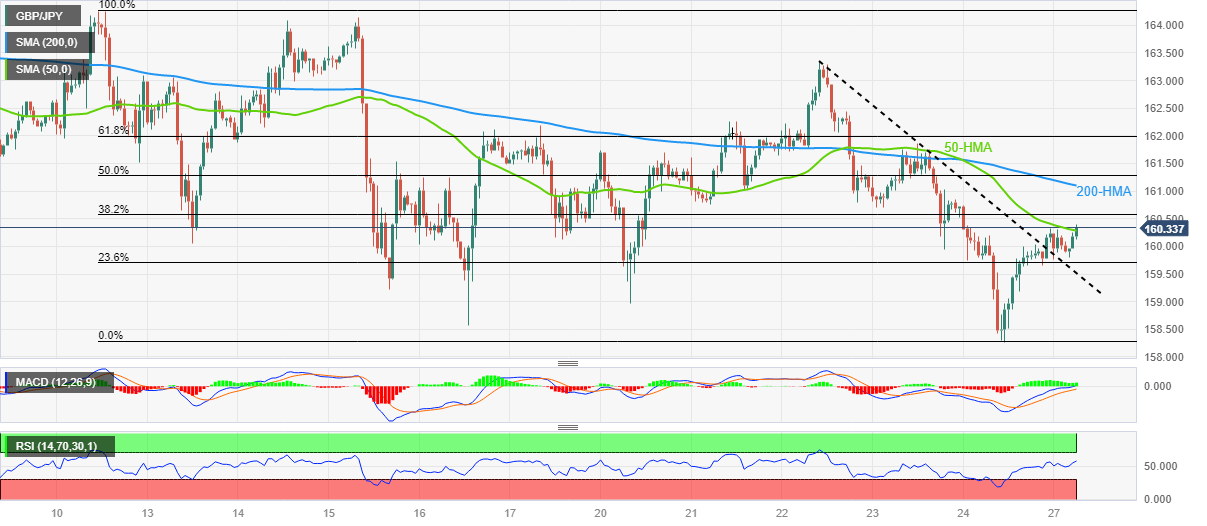
Trend: Further upside expected
FX option expiries for Mar 27 NY cut at 10:00 Eastern Time, via DTCC, can be found below.
- EUR/USD: EUR amounts
- 1.0785 700m
- 1.0800 1.0b
- GBP/USD: GBP amounts
- 1.2300 636m
- USD/JPY: USD amounts
- 130.00 606m
- 130.50 1.1b
- USD/CAD: USD amounts
- 1.3600 500m
- The index keeps the trade above the 103.00 mark.
- US yields attempt a tepid recover on Monday.
- Markets’ attention should shift to PCE inflation due on Friday.
The greenback, when measured by the USD Index (DXY), attempts to extend the rebound seen in the second half of last week just above the 103.00 mark.
USD Index: Gains look capped around 103.40
After bottoming out in the area just below the 102.00 yardstick on March 23, the index managed to regain some composure and reclaim the are beyond 103.00 the figure in past sessions, although the bull run appears to have met initial resistance near 103.40, an area coincident with the 55-day SMA.
Moving forward, investors are expected to closely follow messages from Fed’s rate setters in the wake of the recent dovish hike, while inflation figures tracked by the PCE should take centre stage towards the end of the week.
Later on Monday, short-term bill auctions and the speech by FOMC’s P.Jefferson (permanent voter, centrist) are due.
What to look for around USD
The index appears slightly bid in the area above the 103.00 mark at the beginning of the week, amidst unclear direction in US yields and alternating risk appetite trends.
So far, speculation of a potential Fed’s pivot in the short-term horizon should keep weighing on the dollar, although the still elevated inflation, the resilience of the US economy and the hawkish narrative from Fed speakers are all seen playing against that view for the time being.
Key events in the US this week: Advanced Goods Trade Balance, FHFA House Price Index, CB Consumer Confidence Advanced (Tuesday) – MBA Mortgage Applications, Pending Home Sales (Wednesday) – Final Q4 GDP Growth Rate, Initial Jobless Claims (Thursday) – PCE, Personal Income/Spending, Final Michigan Consumer Sentiment (Friday).
Eminent issues on the back boiler: Persistent debate over a soft/hard landing of the US economy. Terminal Interest rate near the peak vs. speculation of rate cuts in 2024. Fed’s pivot. Geopolitical effervescence vs. Russia and China. US-China trade conflict.
USD Index relevant levels
Now, the index is advancing 0.08% at 103.20 and faces the next hurdle at 103.39 (55-day SMA) followed by 104.30 (100-day SMA) and then 105.88 (2023 high March 8). On the other hand, the breach of 101.93 (monthly low March 23) would open the door to 100.82 (2023 low February 2) and finally 100.00 (psychological level).
The EUR is likely to appreciate somewhat against the USD with a view to the end of the year, once rate cuts draw nearer in the US, according to economists at Commerzbank.
Fed to start cutting rates again in early 2024
“As market concerns subside, the Dollar's ‘safe haven’ property is likely to be less and less in demand, which argues for rising EUR/USD.”
“Both the Fed and the ECB are likely to end their rate hike cycle in the summer. However, while ECB rates are then likely to remain at their levels, we expect the Fed to start cutting rates again in early 2024. This convergence of monetary policies is a significant advantage for the Euro.”
“Our target for EUR/USD is 1.12.”
- WTI oil prices surge as banking concerns ease and geopolitical tension rise.
- Russian crude inventories drive tactical production cuts amid escalating European tensions.
- Financial market sentiment and geopolitics are likely to shape oil market volatility.
The West Texas Intermediate (WTI) price is surging towards the $70 mark as investors ease some concern about ongoing banking adversity. Some rapid efforts from major central banks, including the Federal Reserve (Fed) and the US Treasury Department, have boosted confidence. As a result, risk appetite remains firm. On this positive development, oil prices have rebounded from the $67 mark.
Oil markets are closely watching the sentiment in the financial market, while oil fundamentals remain sidelined. The oil market has been reflecting the financial market volatility for the past several days.
The pullback from the $67 mark is likely driven by the US Dollar weakness, and for the oil price to break sustainably above the $70 mark, it will require a strong fundamental driver, such as the banking crisis dissipating fully.
Some confidence-boosting commentary from United States officials is keeping a lid on the US Dollar safe-haven demands.
Oil prices have also received some support from Russian President Vladimir Putin's comments that he will station tactical nuclear weapons in Belarus, escalating geopolitical tensions in Europe over Ukraine. It is quite obvious that further escalation on the Russia-Ukraine front implies higher oil prices. Although NATO and the United States both have condemned it and attributed such a move as "dangerous and irresponsible."
A tactical move from Russia to cut oil production can be attributed to the understanding that Russian crude inventories have been rising since September last year, and the country would likely want to avoid further stock builds. If Russia wants to draw down the inventories that it has built, output cuts may need to be extended beyond June.
Despite lots of activity on the fundamental forefront of oil, oil prices have been unable to reach the levels desired by the Organization of the Petroleum Exporting Countries (OPEC). For the time being, until the banking turmoil is resolved, oil prices will likely take cues from risk sentiment. As various factors continue to influence the global economy, investors and market participants will keep a close eye on developments in both financial and oil markets, as well as geopolitical tensions, to make informed decisions.
Levels to watch
- EUR/USD is oscillating around 1.0800 as investors are mixed about further action from Fed.
- The Euro is not shown any action despite renewed Russia-Ukraine concerns.
- The major currency pair is looking for a cushion near the demand zone placed in a range of 1.0733-1.0760.
The EUR/USD pair is displaying topsy-turvy moves in a narrow range below 1.0800 in the early European session. The major currency pair is struggling to find direction as investors are in a fix about further action in the FX domain due to a light economic calendar this week. The Euro is not shown any action despite renewed Russia-Ukraine concerns.
Russian President Vladimir Putin said on the weekend that Russia plans to station tactical nuclear weapons in neighboring Belarus. He further added, “We're not transferring our nuclear weapons to Belarus but will station them there as the United States does in Europe.”
Meanwhile, the US Dollar Index (DXY) is continuously auctioning sideways after a gradual correction to near 103.00. Investors are mixed about further action from the Federal Reserve (Fed) as upbeat preliminary S&P Global PMI indicates that the central bank could continue tightening policy further. While tight credit conditions from small US banks after the fiasco have solidified the risk of recession in the US.
EUR/USD is looking for a cushion near the demand zone placed in a range of 1.0733-1.0760 on a four-hour scale. The 50-period Exponential Moving Average (EMA) at 1.0750 is providing a cushion for the Euro bulls. The ultimate resistance is plotted from February 01 high at 1.1033.
The Relative Strength Index (RSI) (14) has taken support around 40.00, and a reversal move is highly anticipated.
For further upside, the shared currency pair needs to surpass February 14 low at 1.0805, which will drive the asset toward January 18 high at 1.0887 and the round-level resistance at 1.0900.
On the flip side, a downside break below March 17 low at 1.0612 would drag the shared currency pair toward March 16 low at 1.0551, followed by March 15 low at 1.0516.
EUR/USD four-hour chart
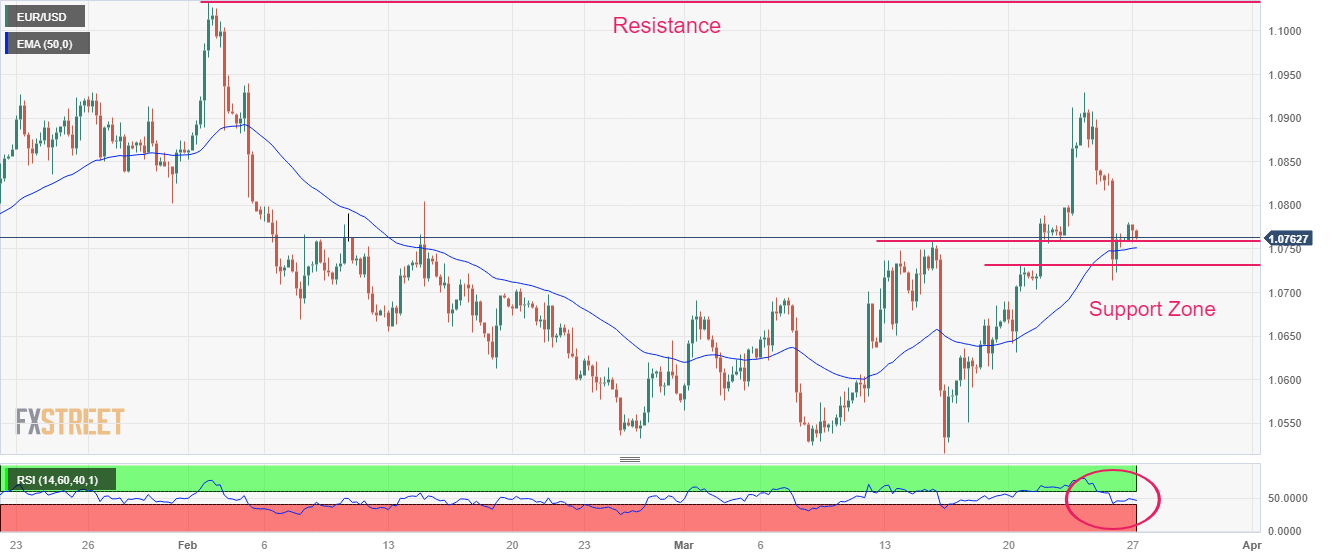
- Gold price drifts lower as US Treasury bond yields underpin US Dollar’s corrective bounce.
- Mixed concerns surrounding bank fallouts, growth allow XAU/USD traders to position themselves for Friday’s key US inflation clues.
- Central bankers’ comments, bond market moves should also be eyed for clear Gold price direction.
Gold price (XAU/USD) slides $1,970 during a two-day losing streak heading into Monday’s European session. In doing so, the bright metal justifies the latest rebound in the US Treasury bond yields, as well as the US Dollar, while extending the previous day’s U-turn from the key resistance zone.
Also behind the moves could be the receding banking fears as First Citizens bank agrees to buy a large chunk of Silicon Valley Bank (SVB). Additionally, talks that the pace of China’s growth, one of the world’s biggest Gold consumers, joined the previous day’s hawkish Fed talks and mostly US data to weigh on the XAU/USD of late.
Alternatively, International Monetary Fund (IMF) Chief Kristalina Georgieva warned that “risks to financial stability have increased,” which in turn probes the Gold sellers. On the same line were comments from Minneapolis Fed President Neel Kashkari who flagged fears of a US recession.
Amid these plays, US Dollar Index (DXY) prints a three-day uptrend near 103.12 as traders brace for Friday’s important inflation data, namely the US Core Personal Consumption Expenditure (PCE) Price Index for February.
That said, the US 10-year Treasury bond yields add two basis points to 3.40% while the two-year counterpart snapped a three-day losing streak near 3.85% by the press time.
Moving on, the Gold price remains on the bear’s radar amid the traders’ failure to cross the key resistance, as well as due to the month-end consolidation. However, the Fed’s preferred inflation gauge, up for Friday, becomes crucial for XAU/USD traders to watch for clear directions.
Gold price technical analysis
Gold price extends the previous day’s pullback from the key upside hurdles as XAU/USD bears keep their eyes on the $1,955 support confluence, comprising the 10-DMA and a 13-day-old ascending trend line.
Not only the failure to cross the broad resistance area between $2,010 and $1,998, the receding bullish bias of the MACD and a pullback in the RSI (14) from overbought territory also favors the Gold sellers.
It’s worth noting that the previous monthly high of around $1,960 acts as immediate support for the XAU/USD.
Should the quote drops below $1,955, the odds of witnessing a slump to the 61.8% Fibonacci retracement level of the metal’s fall from March 2022 to September, near $1,896, can’t be ruled out.
Meanwhile, multiple tops marked in the last year join an upward-sloping resistance line from August 2022 together highlighting the $1,998-2,010 region as the key hurdle for the Gold buyers to cross to retake control.
Following that, a run-up toward the previous yearly high of $2, 070 can’t be ruled out.
Gold price: Daily chart
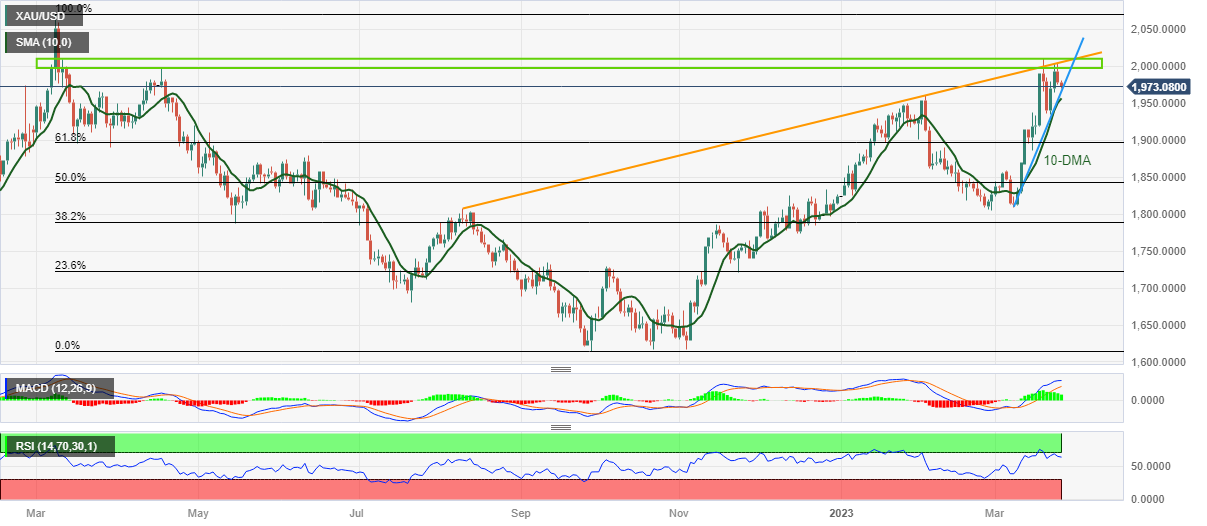
Trend: Further weakness expected
Gold price is holding onto the critical support in a cautious start to the new week. Will XAU/USD rebound from the key 23.6% Fibo level? FXStreet's Dhwani Mehta analyzes the pair's technical outlook.
23.6% Fibo level holds the key
“The 14-day Relative Strength Index (RSI) holds bullish while the 21-Daily Moving Average (DMA) pierced through the mildly firm 50 DMA for the upside on a daily closing basis, confirming a Bull Cross. These favorable technical indicators continue to add credence to the bullish potential in the Gold price.”
“Dovish Federal Reserve expectations combined with the renewed fears over the banking sector crisis could rekindle the upbeat momentum, prompting Gold price to resume its uptrend toward the yearly high of $2,010. However, reclaiming the March 21 high at $1,986 is critical to reversing the corrective downside.”
“Gold price correction could gather strength on a daily closing below the 23.6% Fibonacci Retracement (Fibo) level of the March advance, pegged at $1,963, below which the Bull Flag resistance-turned-support at $1,960 will be tested. Deeper declines will challenge the critical support at $1,935, which is the confluence of the 38.2% Fibo level, March 21 and 22 highs.”
- AUD/USD has observed selling pressure near 0.6660 as USD Index has defended the 103.00 support.
- The street is mixed about the commentary of fewer rate hikes ahead by Federal Reserve chair Jerome Powell.
- Reserve Bank of Australia is extremely worried about persistent inflation and a softening retail demand would provide some relief.
- AUD/USD is oscillating in an Inverted Flag pattern, which signals a bearish trend-following pattern after a downside move.
AUD/USD has faced immense pressure after a gradual recovery to near 0.6660 in the early European session. The Aussie asset has sensed meaningful offers amid a recovery move by the US Dollar Index (DXY). The Australian Dollar is likely to remain in action ahead of the release of the monthly Consumer Price Index (CPI), which is scheduled for Wednesday.
S&P500 futures have made stellar gains in the morning session on Monday on hopes of expansion in liquidity assistance to small United States banks. The 500-US stocks futures basket has continued its Friday’s bullish bias, portraying significant improvement in the risk appetite of the market participants.
The US Dollar Index (DXY) is defending the 103.00 support on expectations that upbeat preliminary S&P Global PMI could fade the expectations of a termination of the rate-hiking spell by the Federal Reserve (Fed). Manufacturing PMI jumped to 49.3 vs. the consensus of 47.0 and the former release of 47.3. While Services PMI accelerated to 53.8 against the estimates of 50.5 and the prior release of 50.6.
In addition to that, the demand for US government bonds has eased marginally, which has resulted in a minor recovery in 10-year US Treasury yields above 3.38%. Meanwhile, two-year US Treasury yields that track US equities firmly have stretched their recovery above 3.38%, indicating some pressure on risk-sensitive assets ahead.
Mixed views on US banking turmoil
The street is full of terror about the economic outlook of the United States economy after the banking sector turmoil. The collapse of three mid-size US banks was sufficient to dampen the confidence of investors. Fears of banking fiasco have extended to households, which have trimmed their deposits from small US banks dramatically.
Reuters reported on Friday that the data from Federal Reserve (Fed) shows that deposits at small U.S. banks dropped by a record amount following the collapse of Silicon Valley Bank (SVB). Therefore, US authorities have come forward to widen the blanket of support to US mid-size banks by expanding the emergency liquidity facility. This has provided a small time relief, however, the situation is likely to get vulnerable further.
Speaking at the China Development Forum over the weekend, International Monetary Fund (IMF) Chief Kristalina Georgieva warned that “risks to financial stability have increased.” She further added, 2023 would be another challenging year, with global growth slowing to 2.9% due to the pandemic, the war in Ukraine, and monetary tightening.
Precautionary moves from US banks in advancing loans to households and businesses have propelled the risk of a US recession. Minneapolis Fed president Neel Kashkari cited on Sunday, “Recent stress in the banking sector and the possibility of a follow-on credit crunch brings the US closer to recession. It definitely brings us closer." It would be a tough call from the Fed to bring more interest rates if recession fears are potential.
Australian Retail Sales and Consumer Price Index to remain in the limelight
A power-pack action is expected from the Australian Dollar as the release of the monthly Retail Sales and Consumer Price Index (CPI) data will remain key event this week. Tuesday’s Retail Sales (Feb) data is expected to expand by 0.4% lower than the former expansion of 1.9%. The Reserve Bank of Australia (RBA) is extremely worried about persistent inflation and a softening retail demand would provide some relief to policymakers.
It is worth noting that the Reserve Bank of Australia provided cues about the consideration of a pause in the rate-hiking spell from its April monetary meeting after a significant decline in monthly CPI data. Reserve Bank of Australia Governor Philip Lowe has already pushed rates to 3.60%,
On Wednesday, the monthly CPI will be the key highlight. For February, the monthly figure was recorded at 7.4%.
AUD/USD technical outlook
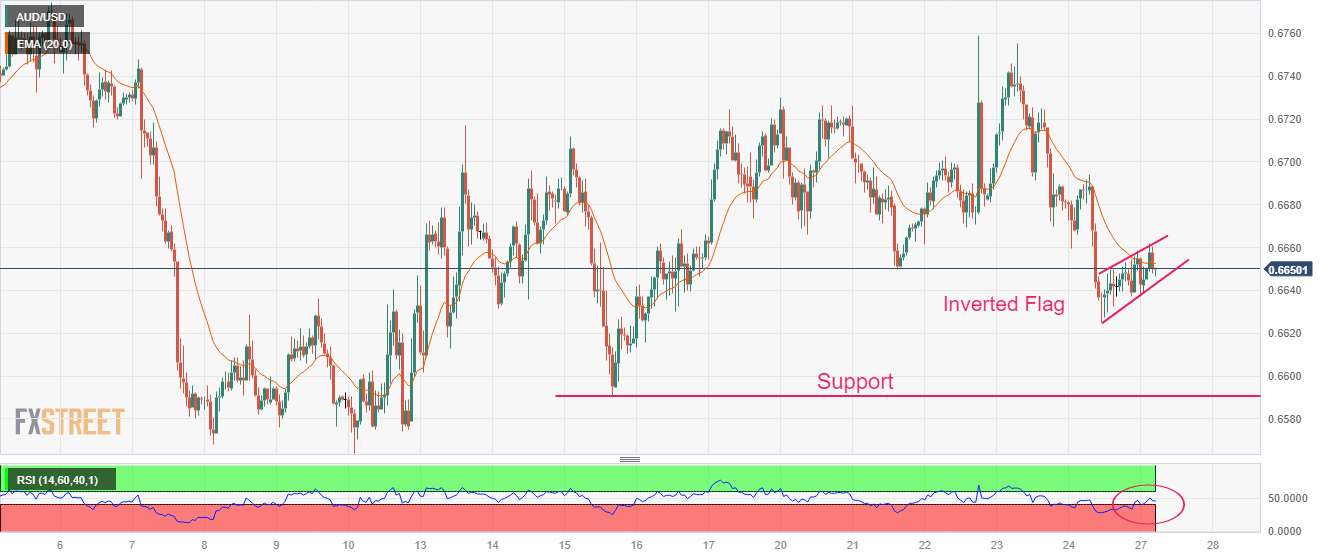
AUD/USD is auctioning in an Inverted Flag chart pattern on an hourly scale. An Inverted Flag is a trend-following pattern that displays a long consolidation that is followed by a breakdown. Usually, the consolidation phase of the chart pattern serves as an inventory adjustment in which those participants initiate shorts, which prefer to enter an auction after the establishment of a bearish bias.
The 20-period Exponential Moving Average (EMA) at 0.6600 is acting as a major barricade for the Australian Dollar.
Meanwhile, the Relative Strength Index (RSI) (14) has gradually shifted into 40.00-60.00 but looks less confident.
- Natural Gas price holds lower ground within four-day-old symmetrical triangle.
- Sustained trading below the key EMAs, downbeat oscillators keep XNG/USD sellers hopeful.
- Clear break of $2.30 becomes necessary to aim for multi-month low marked in February.
- Buyers need a successful break of $2.50 to retake control.
Natural Gas (XNG/USD) price remains on the back foot around $2.31 as bears take a breather after a three-week losing streak inside a short-term symmetrical triangle.
Despite the commodity’s latest inaction, the quote’s placement below the key Exponential Moving Averages (EMA) and a two-week-old horizontal resistance keep the bears hopeful.
Also favoring the sellers could be the bearish MACD signals and the steady RSI (14) suggesting the continuation of the downturn established in late 2022.
It’s worth noting, however, that the aforementioned triangle’s lower line, around $2.30 by the press time, restricts the immediate downside of the XNG/USD.
Following that, the previous weekly low of around $2.23 may act as an intermediate halt before directing the Natural Gas bears toward the 31-month low marked in February at around $2.13.
On the flip side, the 100-EMA restricts the immediate upside of the XNG/USD near $2.36, a break of which highlights the top line of the four-day-long symmetrical triangle, near $2.40.
Even if the Natural Gas price defies the triangle formation by crossing the $2.40 hurdle, the 200-EMA and a fortnight-old horizontal resistance, respectively near $2.43 and $2.50, could challenge the bulls.
Overall, Natural Gas remains on the bear’s radar even if the immediate triangle restricts the short-term downside of the commodity.
Natural Gas Price: Hourly chart
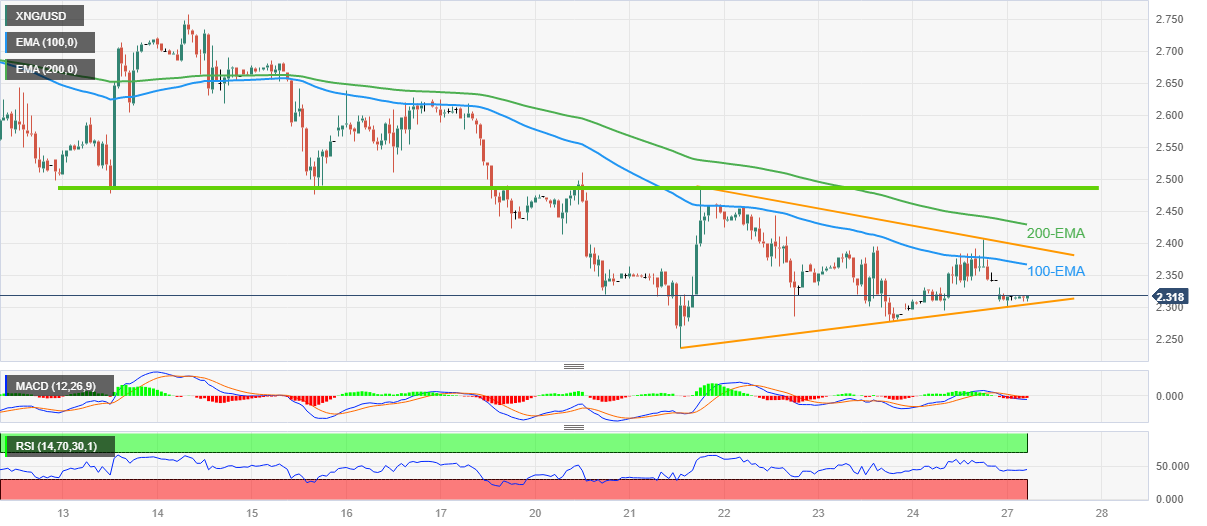
Trend: Bearish
USD/CHF pares intraday losses around 0.9185 but stays pressured amid downbeat options market signals and sluggish markets heading into Monday’s European session. In doing so, the Swiss currency pair (CHF) portrays the traders’ anxiety ahead of the key Swiss National Bank’s (SNB) quarterly Bulletin, as well as the Fed’s preferred inflation gauge, namely the Core Personal Consumption Expenditure (PCE) Price Index.
That said, a one-month risk reversal (RR) of the USD/CHF pair, a gauge of the spread between the call and put options, printed a three-day losing streak by the end of Friday’s North American session. It’s worth noting that the daily RR dropped to -0.010 at the latest.
Not only on the daily basis but the weekly RR also please the pair sellers as it dropped to -0.040 after printing 0.000 figures in the previous week.
Hence, the USD/CHF pair’s current weakness remains valid even as the markets stay dicey ahead of the top-tier data/events.
- US and European stock futures edge higher amid hope for banking system protection.
- Cautious investor sentiment following a decline in Deutsche Bank shares and the increase in default risk.
- US authorities reassure investors with strong fundamentals and tightened regulations for the banking system.
Asian stock futures softened on Monday, exhibiting mixed performance, while US and European stock futures inched higher amid hopes that authorities were taking action to protect the global banking system. This comes even as the cost of insuring against default approaches alarming levels.
Earlier reports indicated that First Citizens Bank was in advanced discussions to acquire Silicon Valley Bank (SVB) from the Federal Deposit Insurance Corp (FDIC).
Investor sentiment remained cautious following an 8.5% decline in Deutsche Bank shares on Friday and a significant increase in the cost of insuring its bonds against default risk. Credit default swaps (CDS) for numerous other banks also experienced sharp increases.
Forecasting the market mood based on Monday's early price action is not advisable, especially during a period of rapid change in the global banking landscape. The current CDS levels for European banks are only slightly lower than those seen during the peak of the European financial crisis in 2013. These elevated CDS levels could have widespread effects on the stock market.
Despite concerns about European banks, US Federal Reserve (Fed) officials and the US Treasury Department have reassured investors of the strong fundamentals within the US banking system. Following the Great Financial Crisis (GFC), US regulations tightened significantly, and regular stress tests have theoretically made the US financial system more robust.
In contrast, the European banking system faces a unique set of challenges due to the diverse economic circumstances of its member countries. The bloc is further divided into sub-blocks, each with varying levels of financial stability and regulatory frameworks. This heterogeneity adds complexity to the overall health and stability of the European banking system.
ChinaA50 and HK50 futures traded in the red, while the Nikkei225 remained in the green. The market is still waiting for more information regarding the condition of major American and European banks. As this information becomes available, market participants will gain a clearer understanding of the global banking landscape and its implications for stock markets.
it is essential for investors to stay informed and exercise caution. As authorities work to address the challenges faced by the global banking sector, market sentiment will likely remain jittery in the near term.
- USD/JPY fades late Friday’s rebound from seven-week low, takes offer to renew intraday bottom.
- Sluggish US Treasury bond yields, mixed concerns about banking crisis, recession woes underpin Yen’s safe-haven demand.
- Fed hawks need validation from Friday’s US Core PCE Price Index to retake control.
USD/JPY pleases bears for the fourth consecutive day even as markets remain inactive during early Monday.
The Yen pair’s latest weakness could be linked to the traders’ rush towards the Japanese Yen (JPY) in search of risk safety, as well as looming fears surrounding the banking industry in the US and Europe. It’s worth noting that the recent divergence between the market’s bias about the next moves of the Federal Reserve (Fed) and the Bank of Japan (BoJ) also seems to weigh on the quote of late.
Although Bloomberg came out with inspiring headlines suggesting that the US and European policymakers are up for taming the bank fallouts, International Monetary Fund (IMF) Chief Kristalina Georgieva warned that “risks to financial stability have increased.” Also raising the market’s fears was the news suggesting Russia’s shifting of nuclear weapons near Belarus.
However, Minneapolis Fed President Neel Kashkari flagged fears of US recession and tamed calls for more rate hikes from the US central bank, which in turn exerts downside pressure on the Yen pair.
It should be noted that Friday’s mixed details of the US Durable Goods Orders and Purchasing Managers’ Index for February and March respectively joined the hawkish Fed speak to trigger the USD/JPY pair’s corrective bounce off the multi-day low.
Above all, the escalating chatters of the BoJ’s exit from the ultra-lose monetary policy, in contrast to the Fed’s nearness to policy pivot, directs USD/JPY towards the south.
Amid these plays, stocks in the Asia-Pacific zone trade mixed while S&P 500 Futures rise half a percent to track Friday’s mildly positive Wall Street performance. That said, the benchmark US 10-year Treasury bond yields seesaw around 3.378% while the two-year counterpart picks up bids with mild intraday gains of around 3.797%.
Moving on, USD/JPY pair may seek more clues from risk catalysts amid a light calendar, which in turn suggests further grinding of the quote towards the south. However, Friday’s Tokyo Consumer Price Index (CPI), Japan's Unemployment Rate and Retail Trade will be important for the pair traders to watch for clear directions.
Following that, Fed’s preferred inflation gauge, namely the Core Personal Consumption Expenditure (PCE) Price Index, will be observed closely. Should the inflation numbers print strong outcomes, the greenback has scope for recovery and can allow the USD/JPY to pare recent losses.
Technical analysis
USD/JPY struggles between a 13-day-old resistance line and upward-sloping trend line support from January 16, respectively near 130.75 and 130.55 in that order.
- USD/CAD has slipped firmly to near 1.3720 amid subdued US Dollar and upbeat Canadian Retail Sales data.
- Higher Canadian Retail Sales have raised hopes for a resumption of a policy-tightening spell by the BOC.
- Oil price is eyeing more upside as Russia can attract more sanctions.
The USD/CAD pair has printed a fresh day low at 1.3725 in the Asian session. The downside move in the Loonie asset is backed by a subdued performance from the US Dollar Index (DXY) and rising hopes for a resumption of a policy-tightening spell by the Bank of Canada (BoC) after the release of robust Canadian Retail Sales data.
S&P500 futures have generated solid gains in the Asian session as the consideration of expanding the emergency lending program by US authorities has infused confidence among the market participants. The US Dollar Index (DXY) is struggling to find strength as the street is cheering the expectations of termination in the policy-tightening spell by the Federal Reserve (Fed). The USD Index is defending the 103.00 support, however, the downside looks favored.
Expectations for a halt in the rate-hiking spell by the Fed are deepening amid rising credit tightening conditions by US banks after turmoil. Banks are having more precautions while disbursing advances. It looks like financial institutions have heavily faced the consequences of a blood fight against stubborn inflation.
On the Canadian Dollar front, upbeat Retail Sales (Feb) data has bolstered the odds of a resumption of the policy-tightening spree by the Bank of Canada (BoC). The year started with the announcement of a halt in rate hikes by the BoC as it considered the current monetary policy restrictive enough to contain inflation.
Monthly Canadian Retail Sales (Feb) jumped to 1.4%, higher than the consensus of 0.7%, and a flat performance observed earlier. Robust demand by Canadian households might force firms to hike prices for goods and services offered, which could propel the need for further rate hikes by the BoC.
On the oil front, the oil price is juggling in a narrow range above $69.00. The black gold is gathering strength for extending the upside as Russia can attract more sanctions. Russian President Vladimir Putin has conveyed his intensions to planning stations for tactical nuclear weapons in Belarus.
Analysts at Morgan Stanley shift their view on the USD/JPY pair to neutral from their previous long recommendation.
Key quotes
"We turn neutral for JPY against USD on the back of the recent global financial stability concerns.”
“Repricing of overseas central banks' policy path led to broad JPY strength via the policy convergence channel.“
“While the BoJ continues to be patient to see wage-driven inflation, we see limited room for the market to reprice the Fed policy path higher in the near term.”
"With the risk of the market pricing in further policy convergence, we close our long USD/JPY position and turn neutral until things become much clearer."
- GBP/USD stretches recovery from 200-HMA, grinds near intraday high of late.
- 100-HMA, previous support line from early March challenge bulls.
- Upbeat oscillators, failure to break the key moving average keep buyers hopeful.
GBP/USD prints mild gains around mid-1.2200s as it defends the previous day’s rebound from the key moving average during early Monday’s sluggish trading.
In doing so, the Cable pair crosses a two-day-old descending resistance line, now immediate support around 1.2240.
It’s worth noting that the bullish MACD signals and gradually recovering RSI (14), not overbought also underpin the latest rebound in the Cable pair, which in turn suggests the quote’s further advances.
However, the 100-Hour Moving Average (HMA) restricts the immediate upside of the GBP/USD price to around the 1.2260 level.
Following that, the previous support line from March 08, close to 1.2320 at the latest, may act as the last defense of the GBP/USD pair sellers, a break of which opens the gate for the pair’s run-up towards the multiple tops marked during December 2022 and January 2023 near 1.2445-50.
On the contrary, pullback moves need to remain below the 1.2240 resistance-turned-support to lure intraday sellers.
Even so, the 200-HMA level of 1.2200 and the latest swing low of around 1.2190 can challenge the GBP/USD bears before giving them control.
Overall, GBP/USD is likely to grind higher but the upside momentum need validation from 1.2320.
GBP/USD: Hourly chart
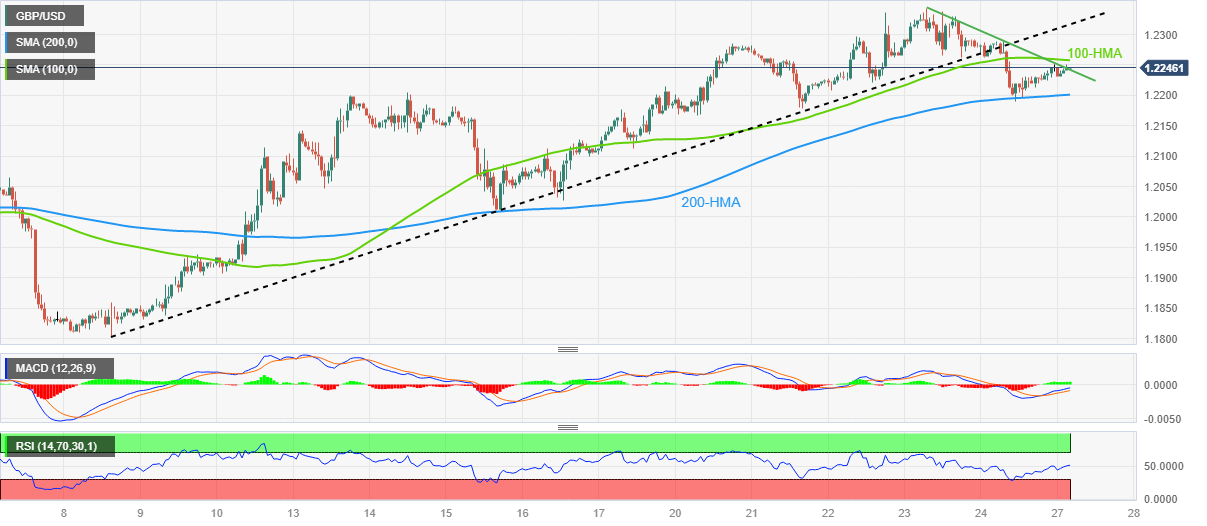
Trend: Further upside expcted
- USD/MXN has sensed pressure after a recovery move to near 18.45.
- The major looks vulnerable above 61.8% Fibo retracement at 18.40.
- A downward-sloping 50-EMA at 18.50 indicates more weakness ahead.
The USD/MXN pair has retreated after facing barricades around 18.45 in the Asian session. The downside bias for the asset is the outcome of a subdued performance by the US Dollar Index (DXY). The USD Index has refreshed its intraday low below 103.00 as investors are anticipating that the Federal Reserve (Fed) won’t go heavy on interest rates for now amid escalating United States recession fears.
US banks are expected to behave extremely precautionary while disbursing advances to households and businesses after the turmoil in order to justify fresh regulations. Therefore, extreme credit conditions by lenders would slow down overall economic activity and henceforth the overall demand.
Meanwhile, S&P500 futures have extended gains in the Asian session on hopes that expanded emergency lending facility to US banks will provide support to them, portraying a higher risk appetite of market participants.
USD/MXN is hovering near the 61.8% Fibonacci retracement (plotted from near March 09 low at 17.90 to March 20 high at 19.23) at 18.40. The retracement level also acted as a cushion for the pair last week. The major is consolidating below the 50-period Exponential Moving Average (EMA) at around 18.50, which indicates that the short-term bias is favoring the downside.
Meanwhile, the Relative Strength Index (RSI) (14) has slipped into the bearish range of 20.00-40.00, which indicates that the bearish momentum has been activated.
Going forward, a slippage below March 22 low at 18.43 would drag the asset toward March 13 low at 18.24 followed by March 09 low at 17.90.
Alternatively, a break above March 24 high at 18.00 will expose the asset to a 23.6% Fibo retracement at 18.92 and March 20 high at 19.23.
USD/MXN hourly chart
-638154867324940722.png)
- Fed's liquidity injection operations and confidence-boosting commentary diminish US dollar's safe-haven demand.
- Upside risks to RBI's inflation forecast and a potential rate hike in April as India assesses state-run lenders.
- All eyes are on upcoming US PCE data and global banking development.
The USD/INR is struggling to decline further, despite the broad-based US Dollar weakness stemming from recent positive banking developments and the Federal Reserve (Fed) signaling a pause. The pair is currently trading just below the 82.40 mark.
Recapping recent developments in the US banking sector, the consecutive failures of some US regional banks have prompted the Fed to adopt a slightly dovish stance in their last FOMC meeting. As a result, they signaled a pause after implementing a 25 basis point (bps) rate hike.
The Fed's ongoing liquidity injection operations and a strong willingness to support and tackle any surge in banking concerns have diminished the US Dollar's demand as a safe haven.
Last week, confidence-boosting commentary from the US Treasury Department and Fed members helped investors regain confidence in their risk appetite. Fed voter Kashkari emphasized that the US banking system is resilient and sound, but reducing stress would take time. Other Fed officials have adopted a similar tone, prioritizing inflation and boosting confidence in the underlying banking system.
Moving on to the Reserve Bank of India (RBI), there are upside risks to the RBI's January-March inflation forecast, and firm core prints are likely to result in a majority of the Monetary Policy Committee (MPC) members leaning towards a 25 bps hike in April. Afterward, a pause in rates could be expected to allow the lagged impact of hikes to filter through.
In response to recent developments in the global banking crisis, India's Finance Minister Nirmala Sitharaman has initiated a step to assess the underlying fundamentals of state-run lenders and public sector banks.
The US economic calendar will feature the final print of Gross Domestic Product (GDP) data and Unemployment Claims on Tuesday. Subsequently, the focus will shift to US Personal Consumption Expenditure (PCE) on Friday.
Levels to watch
- EUR/USD is oscillating in a narrow range below 1.0800 following the footprints of the USD Index.
- Russia-Ukraine tensions have renewed again as it is planning to station tactical nuclear weapons in neighboring Belarus.
- Investors have cheered the consideration of the expansion of the emergency lending facility to small US banks.
The EUR/USD pair is displaying a back-and-forth action below 1.0800 in the Tokyo session. The major currency pair has turned sideways following the footprints of the subdued US Dollar Index (DXY), which is struggling to extend upside despite upbeat preliminary S&P Global PMI and expansion of financial support for mid-size United States banks.
S&P500 futures have added significant gains in the Asian session. The 500-US stocks futures basket has carry-forwarded positive bias observed on Friday as investors have cheered the consideration of the expansion of the emergency lending facility to small US banks to maintain their liquidity obligations. The alpha generated on 10-year US Treasury bonds is still below 3.38% as the street believes that Federal Reserve (Fed) chair Jerome Powell won’t hike rates dramatically ahead.
Minneapolis Fed president Neel Kashkari cited on Sunday, “Recent stress in the banking sector and the possibility of a follow-on credit crunch brings the US closer to recession. It definitely brings us closer." It would be a tough call from the Fed to bring more interest rates if recession fears are potential.
On the global front, Russia-Ukraine tensions have renewed again as President Vladimir Putin said on the weekend that Russia plans to station tactical nuclear weapons in neighboring Belarus. He further added, “We're not transferring our nuclear weapons to Belarus but will station them there as the US does in Europe.”
In Eurozone, households are facing immense pressure due to galloping inflation. A massive strike in Germany was set to begin early Monday, crippling mass transport and airports in one of the biggest walkouts in decades as Europe's largest economy reels from soaring inflation, as reported by Reuters. The European Central Bank (ECB) is working hard to bring down red-hot inflation, however, the catalyst is extremely sticky led by a shortage of labor.
- Gold price remains pressured after snapping four-week uptrend.
- United States Treasury bond yields remain pressured amid mixed headlines.
- US Core PCE Price Index, banking news eyed for XAU/USD directions.
Gold price (XAU/USD) makes rounds to $1,975, staying inside a one-week-old symmetrical triangle, as the yellow metal struggles for clear directions during early Monday. In doing so, the precious metal extends the previous weekly losses, the first in four weeks, amid cautious optimism in the market, as well as due to the downbeat United States Treasury bond yields.
Gold price eyes further weakness as yields pause previous fall
Gold price remains pressured for the second consecutive day as the United States Treasury bond yields lick their wounds at the five-month lows marked in the last week. That said, the benchmark US 10-year Treasury bond yields seesaw around 3.378% while the two-year counterpart picks up bids with mild intraday gains of around 3.797%. It’s worth noting that the yields dropped to the lowest levels since September 2022 in the last week as market players rush to bonds and gold amid fears of banking fallouts.
Easing banking woes, Fedspeak probe XAU/USD traders
During the weekend, Bloomberg’s news surrounding the Silicon Valley Bank (SVB) seemed to have contributed towards pushing back the banking turmoil. “First Citizens BancShares Inc. is in advanced talks to acquire Silicon Valley Bank after its collapse earlier this month, according to people familiar with the matter,” said Bloomberg. On the same line were comments from Minneapolis Fed President Neel Kashkari who flagged fears of US recession and tamed calls for more rate hikes from the US central bank.
It’s worth noting, however, that the mixed US data and previously hawkish Federal Reserve (Fed) officials’ comments also weigh on the Gold price. That said, Durable Goods Orders for February dropped by 1.0% versus January's fall of 5% (revised from -4.5%) and the market expectation for an increase of 0.6%. Details suggested that the figure for Durable Goods Orders ex Defense and ex Transportation were also downbeat but Nondefense Capital Goods Orders ex Aircraft came in firmer-than-expected 0.0% to 0.2%, versus 0.3% prior. Moving on, the preliminary readings of the US S&P Global PMIs for March came in firmer as the Manufacturing gauge rose to 49.3 from 47.3 in February, versus 47.0 expected, while Services PMI rose to 53.8 from 50.6 prior and 50.5 expected. With this, the S&P Global's Composite PMI increased to 53.3 from 50.1 in February, versus 50.1 market forecasts.
Elsewhere, Atlanta Fed President Raphael Bostic told NPR that it was not an easy decision to raise the policy rate while also adding that he is not expecting the economy to fall into recession. Further, St. Louis Federal Reserve President James Bullard, a policy hawk, said on Friday that the response to the bank stress was swift and appropriate, allowing the monetary policy to focus on inflation, per Reuters. The policymaker also added that the projections suggest one more rate hike that could be at the next FOMC meeting or soon after.
Geopolitical fears, and anxiety before Fed’s preferred inflation gauge weigh on Gold price
Apart from the aforementioned catalysts, Russia’s shifting of nuclear weapons near Belarus joins the cautious mood ahead of the Fed’s favorite inflation data, namely the Core Personal Consumption Expenditure (PCE) Price Index for February, also weighs on the Gold price.
“The North Atlantic Treaty Organization (NATO) NATO on Sunday criticized Vladimir Putin for what it called his ‘dangerous and irresponsible’ nuclear rhetoric, a day after the Russian president said he planned to station tactical nuclear weapons in Belarus,” per Reuters. Additionally, the Financial Times (FT) quotes one of the world’s largest shipping group Maersk while raising fears of slower economic growth in China. Given the dragon nation’s status as one of the biggest Gold consumers, receding growth optimism weighs on XAU/USD price.
On the hand, US Core PCE Price Index is likely to ease in February and hence the latest pullback could be the preparations for an upswing after the likely softer US inflation clues.
Also read: Gold Price Forecast: Will XAU/USD rebound from the key 23.6% Fibo level?
Gold price technical analysis
Gold price seesaws inside a short-term triangle formation after snapping a three-week uptrend. It’s worth noting that the lower highs on the XAU/USD price are commensurate with the lower tops of the Relative Strength Index (RSI) line, placed at 14, which in turn suggests further downside of the quote. Adding strength to the downside bias is the recent bearish signal from the Moving Average Convergence and Divergence (MACD) indicator.
That said, a stated triangle’s lower line, close to $1,960 at the latest, restricts short-term Gold price downside. Also challenging the XAU/USD bears is the 50-bar Simple Moving Average (SMA) surrounding $1,955.
Should the Gold price breaks $1,955 support, the odds of witnessing a slump towards the 50% Fibonacci retracement of the XAU/USD upside from late February to March 20, near $1,906, can’t be ruled out.
Alternatively, an upside clearance of the aforementioned triangle’s resistance line, near $2,003 at the latest, could recall the Gold buyers. Even so, the high marked on March 10, 2022, around $2,010, may act as an extra check for the XAU/USD bulls before they aim for the previous yearly high surrounding $2,070.
Overall, the Gold price appears slipping off the bull’s radar but the bears need validation from $1,955 to retake control.
Gold price: Four-hour chart
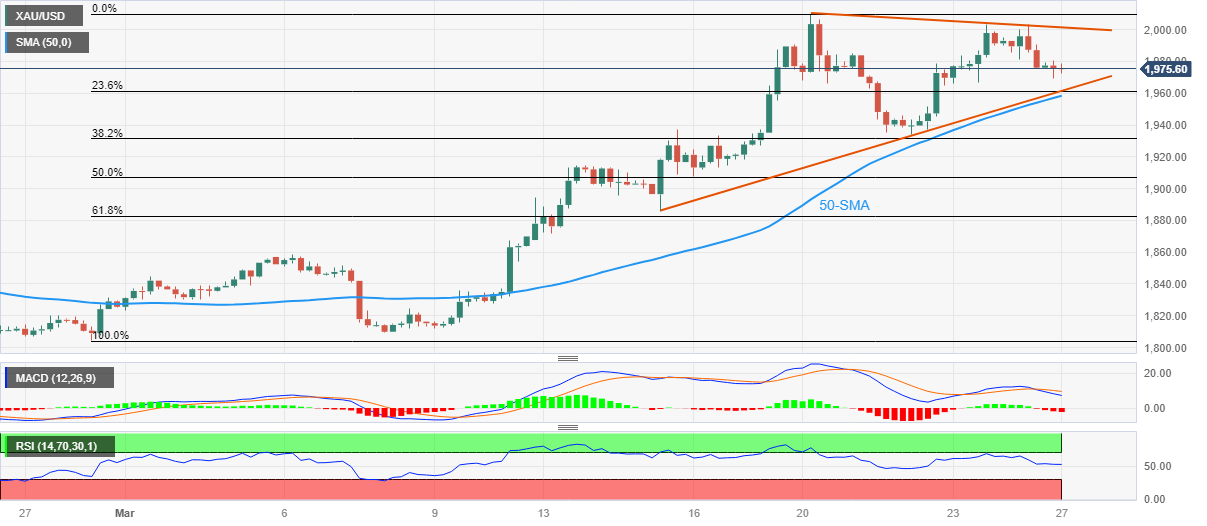
Trend: Pullback expected
Speaking at the China Development Forum over the weekend, International Monetary Fund (IMF) Chief Kristalina Georgieva warned that “risks to financial stability have increased.”
Additional quotes
Urge for continued vigilance.
The actions taken so far by advanced economies have calmed market stress.
2023 would be another challenging year, global growth slowing to 2.9% due to the pandemic, the war in Ukraine, and monetary tightening.
Will improve in 2024, but still below historic average of 3.8%.
Overall outlook remained weak.
China's strong economic rebound, projected GDP growth of 5.2% in 2023, offered some hope for the world economy.
China expected to account for around one third of global growth in 2023.
Market reaction
Cautious remarks from the IMF head have little to no impact on the market, at the moment. The US S&P 500 futures advance 0.44% on the day to challenge the 4,000 level.
- EUR/GBP prints three-day downtrend, stays pressed near intraday low.
- Sustained trading below 100-HMA teases confirmation of head and shoulders bearish chart formation.
- One-week-old ascending trend line can act as buffer on the way to 0.8670.
- Buyers remain off the table below 0.8865 hurdle.
EUR/GBP slides to 0.8795 during early Monday, printing a three-day downtrend amid a sluggish start to the week. In doing so, the cross-currency pair stays below the 100-Hour Moving Average (HMA) while justifying downbeat MACD and RSI.
It’s worth noting that the EUR/GBP pair portrays head and shoulders bearish chart formation on the hourly play amid the aforementioned signals, namely downbeat oscillators and sustained trading below the 100-HMA, favor sellers.
That said, the quote’s further downside hinges on a clear break of the stated bearish chart formation’s neckline, close to 0.8775 by the press time.
Following that, an ascending support line from March 15, close to 0.8745, may act as an intermediate halt during the theoretical fall targeting 0.8670. Also acting as the downside filter is the monthly low of around 0.8715.
Alternatively, recovery moves need successful trading beyond the 100-HMA level of 0.8810 to recall the EUR/GBP bulls.
Even so, the recent tops surrounding 0.8865 and the 0.8900 round figure could challenge the pair buyers afterward.
If at all the EUR/GBP stays firmer past 0.8900, the monthly high near 0.8925 may act as the last defense of the bears.
EUR/GBP: Hourly chart
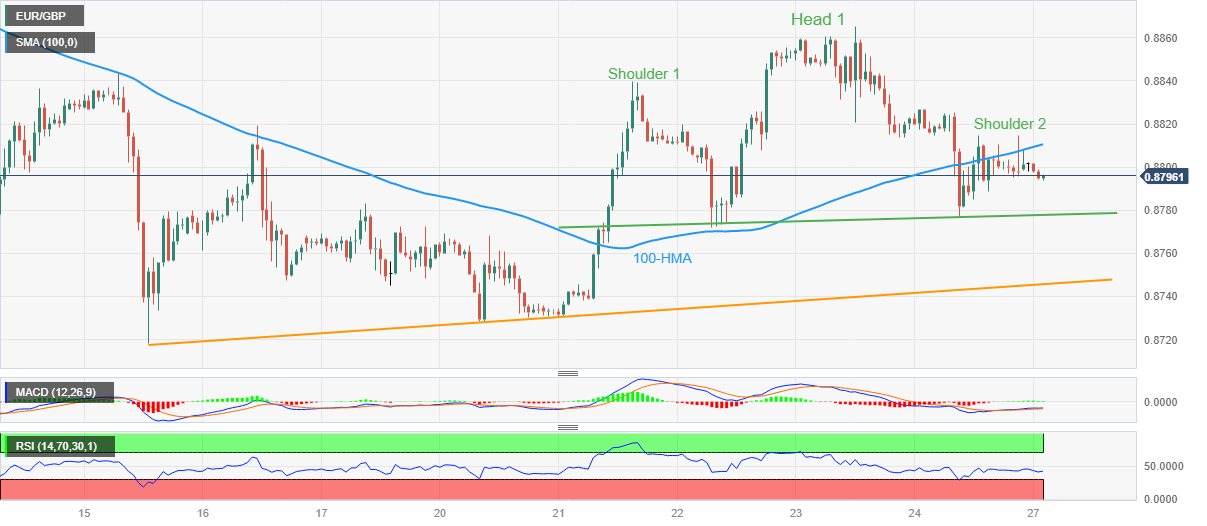
Trend: Further downside expected
- NZD/USD remains sidelined after reversing from one-month high in the last week.
- RBNZ’s Hawkesby cites fears of increasing floods but stated that the NZ banks are resilient.
- Markets remain sluggish mixed concerns about banks, geopolitics.
- China’s official PMIs, US Core PCE inflation eyed for clear directions.
NZD/USD portrays the market’s inaction by making rounds to 0.6200 during early Monday, following a downbeat weekly closing. In doing so, the Kiwi pair fails to justify the Reserve Bank of New Zealand’s (RBNZ) cautious optimism, as well as mildly positive sentiment, amid a light calendar, mixed news and anxiety ahead of the top-tier data from the US and China.
Earlier in the day, Reserve Bank of New Zealand (RBNZ) Deputy Governor Christian Hawkesby pushed back the fears of banking fallouts in New Zealand (NZ) even as the Pacific nation is likely to witness more floods. “The capital ratios of the country's banks will remain resilient during most severe weather events though more studies were needed to understand how they could potentially compound with other risks to the financial system,” said RBNZ’s Hawkesby.
On the other hand, a light calendar and a lack of major macros challenge the momentum traders of the NZD/USD pair.
Talking about positives, Bloomberg’s news surrounding the Silicon Valley Bank (SVB) seemed to have contributed to the risk-on mood. “First Citizens BancShares Inc. is in advanced talks to acquire Silicon Valley Bank after its collapse earlier this month, according to people familiar with the matter,” said Bloomberg. On the same line were comments from Minneapolis Fed President Neel Kashkari who flagged fears of US recession and tamed calls for more rate hikes from the US central bank.
Meanwhile, news about Russia’s shifting of nuclear weapons near Belarus joins the mostly upbeat US data and the previously hawkish Fed speak to weigh on the Kiwi pair. “The North Atlantic Treaty Organization (NATO) NATO on Sunday criticized Vladimir Putin for what it called his ‘dangerous and irresponsible’ nuclear rhetoric, a day after the Russian president said he planned to station tactical nuclear weapons in Belarus,” per Reuters.
On Friday, Durable Goods Orders for February dropped by 1.0% versus January's fall of 5% (revised from -4.5%) and the market expectation for an increase of 0.6%. Details suggested that the figure for Durable Goods Orders ex Defense and ex Transportation were also downbeat but Nondefense Capital Goods Orders ex Aircraft came in firmer-than-expected 0.0% to 0.2%, versus 0.3% prior. Moving on, the preliminary readings of the US S&P Global PMIs for March came in firmer as the Manufacturing gauge rose to 49.3 from 47.3 in February, versus 47.0 expected, while Services PMI rose to 53.8 from 50.6 prior and 50.5 expected. With this, the S&P Global's Composite PMI increased to 53.3 from 50.1 in February, versus 50.1 market forecasts.
Following the US data, Atlanta Fed President Raphael Bostic told NPR that it was not an easy decision to raise the policy rate while also adding that he is not expecting the economy to fall into recession. Further, St. Louis Federal Reserve President James Bullard, a policy hawk, said on Friday that the response to the bank stress was swift and appropriate, allowing the monetary policy to focus on inflation, per Reuters. The policymaker also added that the projections suggest one more rate hike that could be at the next FOMC meeting or soon after.
Moving on, the Fed’s preferred inflation gauge, namely the Core Personal Consumption Expenditure (PCE) Price Index, becomes necessary for the NZD/USD pair traders to watch ahead of China’s official activity data for March.
Technical analysis
Although a convergence of the 21-DMA and a two-week-old ascending support line challenges NZD/USD bears around 0.6200, the recovery moves remain elusive unless the quote stays below the 50-DMA level of around 0.6295.
| Raw materials | Closed | Change, % |
|---|---|---|
| Silver | 23.225 | 0.63 |
| Gold | 1977.52 | -0.76 |
| Palladium | 1411.8 | -0.79 |
- AUD/USD licks its wounds after posting weekly loss, as well as confirming bearish chart formation.
- Downbeat oscillators, key SMAs also challenge Aussie pair buyers.
- Monthly low can act as intermediate halt during theoretical target surrounding October 2022 peak.
AUD/USD buyers struggle to keep the reins around 0.6650 during Monday’s sluggish trading session, after a volatile week. In doing so, the Aussie pair licks its wounds after posting the weekly loss but lacks recovery momentum to extend the late Friday’s corrective bounce off a one-week low.
It should be noted that the AUD/USD pair’s confirmation of a two-week-old rising wedge bearish chart formations joins the bearish MACD signals and downbeat RSI (14), not oversold, to keep sellers hopeful.
That said, the latest trough surrounding 0.6625 lures intraday sellers of the Aussie pair before highlighting the monthly low of 0.6564.
Following that, the theoretical target of rising wedge confirmation, surrounding 0.6650, joins the October 2022 peak of near 0.6645, to offer strong support to the sellers.
On the flip side, the 100-bar Simple Moving Average (SMA), near 0.6670 at the latest, guards immediate recovery moves of the AUD/USD pair before the stated wedge’s lower line, around 0.6680.
Even if the Aussie pair crosses the 0.6680 support-turned-resistance, the wedge’s top line and the 200-SMA, respectively near 0.6750 and 0.6760, could challenge the bulls.
It’s worth observing that the monthly high of around 0.6785 acts as the last defense of the AUD/USD bears.
AUD/USD: Four-hour chart
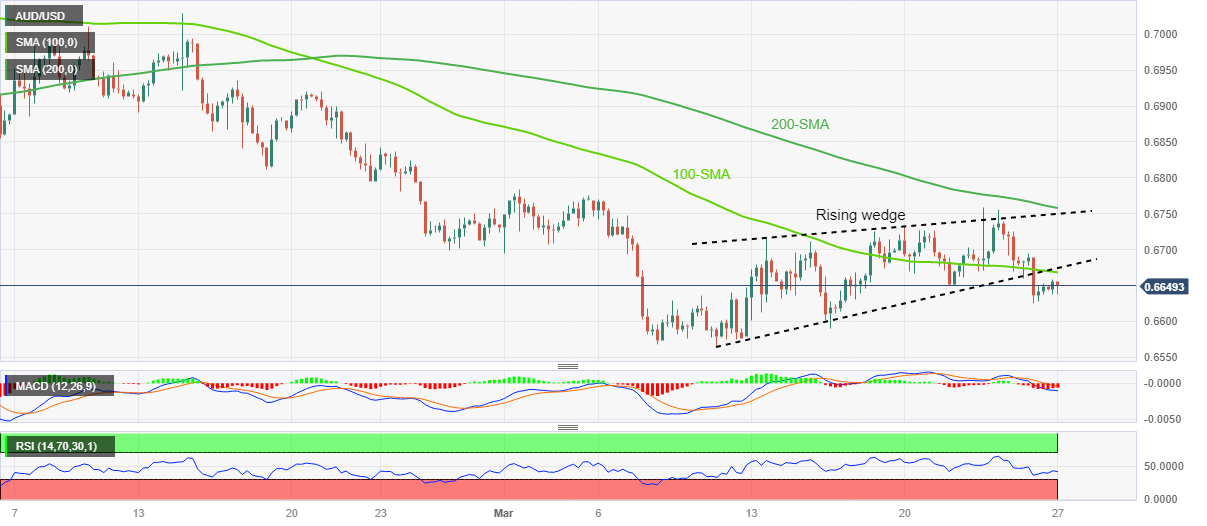
Trend: Further downside expected
Citing China's Finance Minister Liu Kun, the 21st Century Herald reported on Monday, the country “will intensify efforts to implement a strong fiscal policy and efficient taxation system this year to stabilize the economy.”
Liu said, “the global economic situation was not optimistic, and China's economy faces challenges.“
“Support for small and medium-sized enterprises, self-employed businesses, and disadvantaged industries will be a key focus this year,” he added.
Separately, China’s National Bureau of Statistics (NBS) reported that profits at industrial firms in China declined 22.9% in the first two months of 2023 from the year before.
Related reads
- S&P 500 Futures grind higher past 4,000, Treasury yields stay pressured on mixed bank, geopolitical news
- China’s Commerce Ministry: Do not actively pursue trade surplus with US
- Rollercoaster Ride: USD/CHF's volatility amidst global banking liquidity concerns.
- USD/CHF finds support at 0.9125 as US authorities intervened.
- Geopolitical tensions and US PCE data to influence USD/CHF movement.
USD/CHF managed to find support, and its downside fall was stalled at the 0.9125 level. This was due to some easing financial conditions in the US following the fallout from a regional bank and the contagion effect that spilled over to Europe. Concerns over Credit Suisse and a sudden spike in Deutsche Bank's credit default swap led to a rollercoaster ride for the market last week.
However, quick interventions and a strong willingness from US authorities to rescue the banking sector helped USD/CHF close on the green side last Friday.
Despite this, the downside bias for the pair remains intact, and any convincing break below the 0.9125 level will likely pave the way for the multi-test support line at 0.9068 on the daily time frame. The upside potential will likely remain capped by the 50-Day Moving Average (DMA), currently pegged around Wednesday's high at the 0.9250 level. A convincing break above this level will likely confront the pair with the 21-DMA, and breaking above both DMAs will lead USD/CHF towards the two-week high at 0.9333. The last line of support is seen at the 0.9446 mark, which is also a multi-month high.
The Relative Strength Index (RSI) signals lower lows, suggesting further downside room for the pair. All eyes will remain on Russia's deployment of nuclear weapons in Belarus, the upcoming US Personal Consumption Expenditure (PCE) for this week, and any further developments on the global banking liquidity front, as the US dollar will likely take its cue from them.
USD/CHF: Daily chart
-638154791780906720.png)
- GBP/USD is struggling to extend its recovery further as USD Index has shown signs of recovery.
- The promise of expansion of the emergency lending facility to small US banks has improved US Dollar’s appeal.
- Robust UK retail demand cements the continuation of the policy-tightening spell by the BoE.
The GBP/USD pair has surrendered its morning gains and has slipped to near 1.2230 in the Asian session. The Cable witnessed the heat after failing to climb above the immediate resistance of 1.2250 as the US Dollar Index (DXY) has shown some recovery after a gradual correction.
The USD Index has attempted a recovery move from 103.00 as the promise of providing more financial support to mid-size banks by the United States administration has infused confidence among market participants. Bloomberg reported that US authorities are considering an expansion of the emergency lending facility that would offer banks more support, and will provide the First Republic Bank more time to shore up its balance sheet.
S&P500 futures have loaded up some decent gains after a positive week on hopes that emergency lending support to mid-size banks will provide them room for more business. Also, more financial support to small US banks after declining deposits post-banking fiasco would help them to restore the confidence of households.
Meanwhile, contrary decisions from Federal Reserve (Fed) policymakers on the US recession are impacting the decision-making. Minneapolis Fed president Neel Kashkari cited on Sunday, “Recent stress in the banking sector and the possibility of a follow-on credit crunch brings the US closer to recession.
However, Atlanta Fed President Raphael Bostic told NPR on Friday that there are clear signs that the banking system is safe and resilient. And Fed Bostic is "Not expecting the economy to fall into recession."
On the United Kingdom front, Pound Sterling remained in action on Friday after robust Retail Sales data. Monthly Retail Sales (Feb) data accelerated firmly by 1.2%, higher than the consensus of 0.2% and the former release of 0.9%. UK’s annual Retail Sales data contracted by 3.5% while the street was anticipating a contraction of 4.7%. This indicates that the rate-hiking spell by the Bank of England (BoE) will stay for a longer period.
- Market sentiment stays cautiously optimistic amid sluggish week-start.
- S&P 500 Futures stay mildly bid after two-week uptrend, yields remain weak for the fourth consecutive week.
- Shift in Russia’s nuclear amenities to Belarus, talks of an SVB deal trouble traders amid light calendar.
- Dovish remarks from Fed’s Kashkari, mixed US data allow risk markets to grind higher, Fed’s favorite inflation gauge eyed.
Risk profile remains mildly positive after a volatile week as traders hope the policymakers’ efforts to tame banking turmoil would push back fears suggesting the return of the 2008 financial crisis. Adding strength to the cautious optimism are the recent comments from the central bankers who sounded less hawkish. Above all, a light calendar and a lack of major macros allowed traders to extend the previous weekly moves ahead of the key US inflation clues, namely the Core Personal Consumption Expenditure (PCE) Price Index, up for publishing on Friday.
While portraying the mood, US Treasury bond yields struggle to keep the three-week downtrend as benchmark bond coupons remain directionless around the latest multi-day lows marked in the last week. However, the S&P 500 Futures print mild gains around 4,010 at the latest and traces Wall Street’s gains to suggest a mildly positive risk appetite.
Among the major headlines, Bloomberg’s news surrounding the Silicon Valley Bank (SVB) seemed to have contributed to the risk-on mood. “First Citizens BancShares Inc. is in advanced talks to acquire Silicon Valley Bank after its collapse earlier this month, according to people familiar with the matter,” said Bloomberg.
On the same line were comments from Minneapolis Fed President Neel Kashkari who flagged fears of US recession and tamed calls of more rate hikes from the US central bank.
Alternatively, news about Russia’s shifting of nuclear weapons near Belarus join the mostly upbeat US data and the previously hawkish Fed speak to weigh on sentiment. “The North Atlantic Treaty Organization (NATO) NATO on Sunday criticized Vladimir Putin for what it called his ‘dangerous and irresponsible’ nuclear rhetoric, a day after the Russian president said he planned to station tactical nuclear weapons in Belarus,” per Reuters.
As per the latest US data, Durable Goods Orders for February dropped by 1.0% versus January's fall of 5% (revised from -4.5%) and the market expectation for an increase of 0.6%. Details suggested that the figure for Durable Goods Orders ex Defense and ex Transportation were also downbeat but Nondefense Capital Goods Orders ex Aircraft came in firmer-than-expected 0.0% to 0.2%, versus 0.3% prior. Moving on, the preliminary readings of the US S&P Global PMIs for March came in firmer as the Manufacturing gauge rose to 49.3 from 47.3 in February, versus 47.0 expected, while Services PMI rose to 53.8 from 50.6 prior and 50.5 expected. With this, the S&P Global's Composite PMI increased to 53.3 from 50.1 in February, versus 50.1 market forecasts.
It should be noted that the Atlanta Fed President Raphael Bostic told NPR that it was not an easy decision to raise the policy rate while also adding that he is not expecting the economy to fall into recession. Further, St. Louis Federal Reserve President James Bullard, a policy hawk, said on Friday that the response to the bank stress was swift and appropriate, allowing the monetary policy to focus on inflation, per Reuters. The policymaker also added that the projections suggest one more rate hike that could be at the next FOMC meeting or soon after.
Also read: Forex Today: Mixed week for the USD; is it time for some consolidation?
- USD/JPY is attempting to come up for air at the start of the week.
- There is a jittey mood in markets due to the banking crisis.
USD/JPY is up 0.1% on the day and has traveled between 130.49 and 131.05 so far while the mood remains jittery after shares in Deutsche Bank fell 8.5% on Friday. Investors are depending on the authorities to ring-fence the banking sector while depositors have already been fleeing smaller banks as seen in the flows to money market funds.
Banking stocks plunged in Europe with heavyweights Deutsche Bank and UBS Group pummelled by concerns that we are seeing the worst implications for financial markets since 2008 financial crisis. Consequently, the US Dollar, DXY, rose by over 0.5% to 103.35. Nevertheless, the safe-haven Japanese yen touched a seven-week low of 129.65 last week.
Elsewhere, Minneapolis Fed President Neel Kashkari on Sunday said officials were watching "very, very closely" to see if the banking stress led to a credit crunch that threatened to tip the economy into recession. Meanwhile, markets are well ahead of the central bank in pricing around an 80% chance rates have already peaked. In fact, a pivot is being priced in and the first rate cut is seen as early as July.
In this regard, the US PCE price inflation data will be key and it is expected to slow down from a robust 0.6% MoM in Jan to a still-strong 0.4% in February (also below core CPI's 0.5% MoM gain), as analysts at TD Securities said.
´´ The YoY rate likely rose a tenth to 4.8%, suggesting the path to normalization in price gains will be bumpy. Conversely, personal spending likely fell, but that would follow an eye-popping 1.8% surge in the prior month.´´
As for Fed speakers, we will have the Fed´s Governor Philip Jefferson later on Monday, while Fed Vice Chair for Supervision Michael Barr testifies on "Bank Oversight" before the Senate on Tuesday.
- WTI pares the first intraday gains in three amid downbeat RSI (14).
- Receding bearish bias of MACD probes Oil sellers around the key supports.
- Buyers need validation from 11-week-old horizontal resistance to retake control.
WTI crude oil trims intraday gains around $69.40 during Monday’s Asian session, despite snapping the two-day losing streak. In doing so, the black gold seems to trace the downbeat RSI (14) line amid a sluggish start to the week.
That said, the RSI (14) line struggles to extend the previous week’s rebound from the oversold territory, which in turn challenges the latest recovery moves. However, the easing bearish bias of the MACD signals and a looming bull cross on the stated indicator seems to keep the Oil buyers hopeful.
Adding strength to the bullish expectations could be the energy benchmark’s sustained trading beyond the 10-DMA and previous resistance line from March 07.
With this, the WTI bears remain off the table unless witnessing a clear downside break of the resistance-turned-support line, close to $68.20 by the press time. It should be noted that the 10-DMA restricts the commodity’s immediate downside, near the $69.00 round figure.
Above all, a downward-sloping support line from late September 2022, close to $64.00 by the press time, is the key challenge for the Oil bears to tackle.
Meanwhile, an area comprising multiple levels marked since early January, around $72.50-60, restricts short-term WTI rebound.
Following that, late February’s low of $73.85 can act as an extra check for the Oil buyers before directing them to the monthly high surrounding $81.00.
WTI: Daily chart
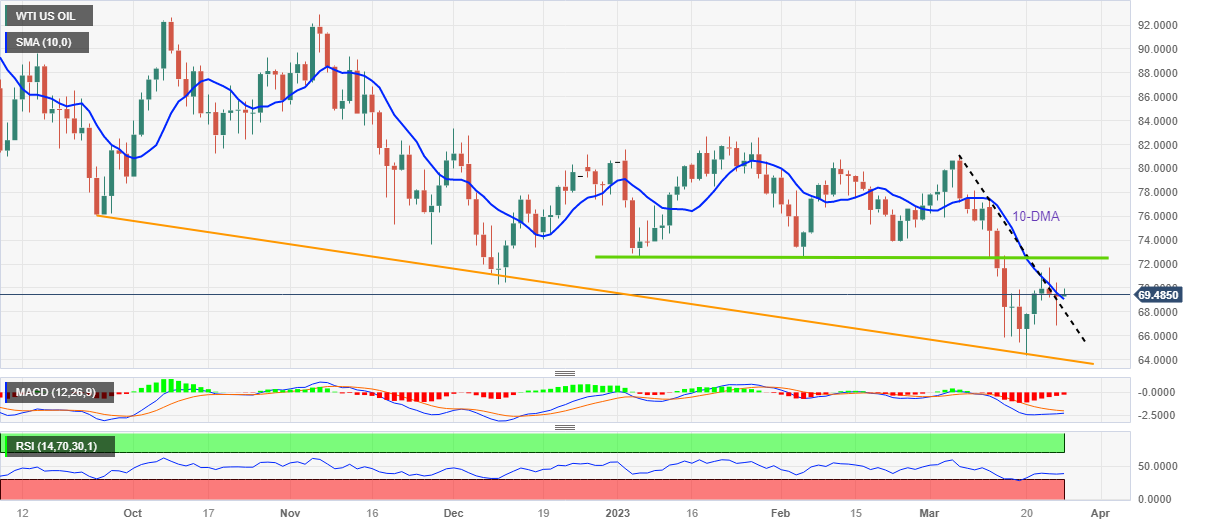
Trend: Recovery expected
In recent trade today, the People’s Bank of China (PBOC) set the yuan at 6.8714 vs. the last close of 6.8679 and the estimate at 6.8703.
About the fix
China maintains strict control of the yuan’s rate on the mainland.
The onshore yuan (CNY) differs from the offshore one (CNH) in trading restrictions, this last one is not as tightly controlled.
Each morning, the People’s Bank of China (PBOC) sets a so-called daily midpoint fix, based on the yuan’s previous day's closing level and quotations taken from the inter-bank dealer.
- Gold’s safe-haven demand diminishes as US authorities reassure investors.
- Federal Reserve’s focus on inflation and confidence in banking system stability.
- Geopolitical tensions and upcoming US PCE data are possible influencing factors for Gold.
The XAU/USD exchange rate experienced a dip from the $2,000 mark as US authorities reassured investors of their strong commitment to addressing any potential issues in the banking sector. This assurance, coupled with a slightly stronger US dollar and a recovery in equity markets, has contributed to the decline in Gold prices. However, the yellow metal is likely to continue receiving support from significant macroeconomic events, such as potential problems in the banking industry.
A recent surge in Deutsche Bank's credit default swaps has caused renewed concern among investors, prompting a shift towards risk aversion on Friday. Although there is no definitive evidence of any substantial issues for Deutsche Bank, concerns about the undercapitalization of US banks could cause Gold prices to rise.
At a policy meeting last week, Federal Reserve (Fed) officials noted that there were no signs of worsening financial stress, allowing them to maintain their focus on reducing inflation through further interest rate increases. As expected, the Fed raised rates by a quarter of a percentage point and hinted at an upcoming pause. Fed voter Kashkari and other officials have expressed confidence in the US banking system's stability and resilience while emphasizing that inflation remains a priority.
In geopolitical news, Russian President Putin announced the placement of tactical nuclear weapons in Belarus, along with the relocation of 10 aircraft capable of carrying such weapons. Putin stated that this move does not violate nuclear non-proliferation agreements and that Russia will station the weapons in Belarus similarly to how the US does in Europe. North Atlantic Treaty Organization (NATO) and the US have criticized this decision, calling it dangerous and irresponsible, but the US also believes Russia is not preparing to use a nuclear weapon. Further escalation in this situation could boost gold prices as demand for safe-haven.
Market participants are now looking forward to the release of US Personal Consumer Expenditure (PCE) data on Friday. Core PCE for February is expected to rise by 0.4% MoM, which is a slower pace compared to the 0.6% increase seen in January. The annual core PCE rate is anticipated to moderate to 4.3% YoY, down from 4.7%. This data release may influence gold prices and market sentiment, as investors closely monitor inflation trends and their potential impact on the economy and financial markets.
Levels to watch
- USD/CAD stays pressured around intraday low, extends late Friday’s pullback.
- Market’s cautious optimism, downbeat comments from Fed’s Kashkari weigh on US Dollar.
- Fears emanating from Russia, US Dollar retreat allow WTI crude oil to pare recent losses.
- Canada GDP, Fed’s preferred inflation eyed for clear directions.
USD/CAD prints mild losses as it extends the late Friday’s pullback from the highest levels in eight days to 1.3730 during Monday’s sluggish Asian session. In doing so, the Loonie pair cheers the US Dollar’s pullback, as well as firmer prices of Canada’s key export earner, namely WTI crude oil.
US Dollar Index (DXY) snaps two-day rebound as it retreats to 103.00 after Minneapolis Fed President Neel Kashkari flags fears of US recession. Also weighing on the greenback could be the US Treasury bond yields’ failure to regain upside momentum.
It’s worth noting that headlines from Bloomberg seemed to have contributed to the risk-on mood and weighed on the US Dollar, allowing USD/CAD to ease. “First Citizens BancShares Inc. is in advanced talks to acquire Silicon Valley Bank after its collapse earlier this month, according to people familiar with the matter,” said Bloomberg.
On the other hand, WTI crude oil rises half a percent intraday to near $69.70 while printing the first daily gains in three. The black gold’s latest gains could be linked to the cautious optimism in the market, as well as the headlines suggesting Russia’s shifting of nuclear weapons near Belarus. “The North Atlantic Treaty Organization (NATO) NATO on Sunday criticized Vladimir Putin for what it called his ‘dangerous and irresponsible’ nuclear rhetoric, a day after the Russian president said he planned to station tactical nuclear weapons in Belarus,” per Reuters.
It should be noted, however, that the mostly upbeat US data and an absence of dovish remarks by the Fed policymakers in the last week seemed to have favored the USD/CAD bulls.
That said, US Durable Goods Orders for February dropped by 1.0% versus January's fall of 5% (revised from -4.5%) and the market expectation for an increase of 0.6%. Details suggested that the figure for Durable Goods Orders ex Defense and ex Transportation were also downbeat but Nondefense Capital Goods Orders ex Aircraft came in firmer-than-expected 0.0% to 0.2%, versus 0.3% prior. Moving on, the preliminary readings of the US S&P Global PMIs for March came in firmer as the Manufacturing gauge rose to 49.3 from 47.3 in February, versus 47.0 expected, while Services PMI rose to 53.8 from 50.6 prior and 50.5 expected. With this, the S&P Global's Composite PMI increased to 53.3 from 50.1 in February, versus 50.1 market forecasts.
Following the data, Atlanta Fed President Raphael Bostic told NPR that it was not an easy decision to raise the policy rate while also adding that he is not expecting the economy to fall into recession. Further, St. Louis Federal Reserve President James Bullard, a policy hawk, said on Friday that the response to the bank stress was swift and appropriate, allowing the monetary policy to focus on inflation, per Reuters. The policymaker also added that the projections suggest one more rate hike that could be at the next FOMC meeting or soon after.
Against this backdrop, S&P 500 Futures trace Wall Street’s mild closing while the US Treasury bond yields remain pressured.
Looking ahead, Fed talks and second-tier US data may entertain DXY traders ahead of the Fed’s preferred inflation gauge, namely the Core Personals Consumption Expenditure (PCE) Price Index. Should the inflation numbers print strong outcomes, the greenback has scope for recovery.
Technical analysis
Unless dropping back below the two-week-old previous resistance line, around 1.3685 by the press time, USD/CAD remains on the bull’s radar.
- EUR/JPY is looking to scale above 141.00 as the ECB is preparing for more hikes.
- ECB Schnabel cited that headline inflation has begun to decline although said core inflation remains sticky.
- The speech from BoJ Ueda will provide guidance about the likely monetary policy action.
The EUR/JPY pair is facing barricades around 141.00 in the Tokyo session. The cross is struggling in extending its recovery above the aforementioned resistance, however, the upside seems favored as the European Central Bank (ECB) is preparing more rate hikes ahead.
Isabel Schnabel, Member of the ECB's Executive Board, has said headline inflation has begun to decline although said core inflation remains sticky. The ECB would be needed immense strength to bring higher inflation down to the desired levels, therefore, more rate hikes cannot be ruled out.
On the Japanese Yen front, the speech from Bank of Japan (BoJ) Governor Kazuo Ueda, scheduled for Tuesday, will be of significant importance. This will provide guidance about the likely monetary policy action.
EUR/JPY has rebounded firmly from the horizontal support of the Bearish Megaphone chart pattern formed on a two-hour scale. The horizontal support of the chart pattern is plotted from March 16 low at 139.13 while the upward-sloping trendline is placed at 141.58. Usually, a bearish megaphone pattern results in sheer weakness after the breakdown of critical support.
The 50-period Exponential Moving Average (EMA) at 141.00 is acting as resistance for the Eurozone bulls.
Meanwhile, the Relative Strength Index (RSI) (14) has shifted into the 40.00-60.00 range from the bearish range of 20.00-40.00, which indicates a reversal for the time being.
Should the asset breaks above March 21 high at 142.79, Euro bulls would drive the cross toward March 09 low around 144.00 followed by March 15 high at 145.00.
On the flip side, a downside break below March 16 low at 139.13 would drag the cross toward January 19 low at 138.00. A slippage below the same would expose the asset to a 26 September 2022 low of around 137.36.
EUR/JPY hourly chart
-638154752985637732.png)
- AUD/NZD bulls need to get over the 1.0750 mark.
- Bears eye prospects of a move below the triple bottom lows near 1.0670.
AUD/NZD is flat on the day after trading between a low of 1.0695 and a high of 1.0726 so far. It is a quiet start to the week while attention is on the banking crisis and Australia´s inflation data this week.
February´s Consumer Price Index print will grab attention after the Bank flagged it as a key data point for its April decision.
´´Our dovish forecast is due to the large seasonal decline from recreational services, partly offset by firm price increases rises for education and transport. We still retain a 25bps hike for the April meeting as inflation is still far above the RBA's inflation target,´´ analysts at TD Securities explained.
Meanwhile, analysts at ANZ Bank argued a bullish case for the Kiwi. ´´Although markets are skeptical about the idea that there is no trade-off between financial stability and price stability, NZ’s strong banks and remoteness make that more likely here; that may help NZD.´´
AUD/NZD technical analysis
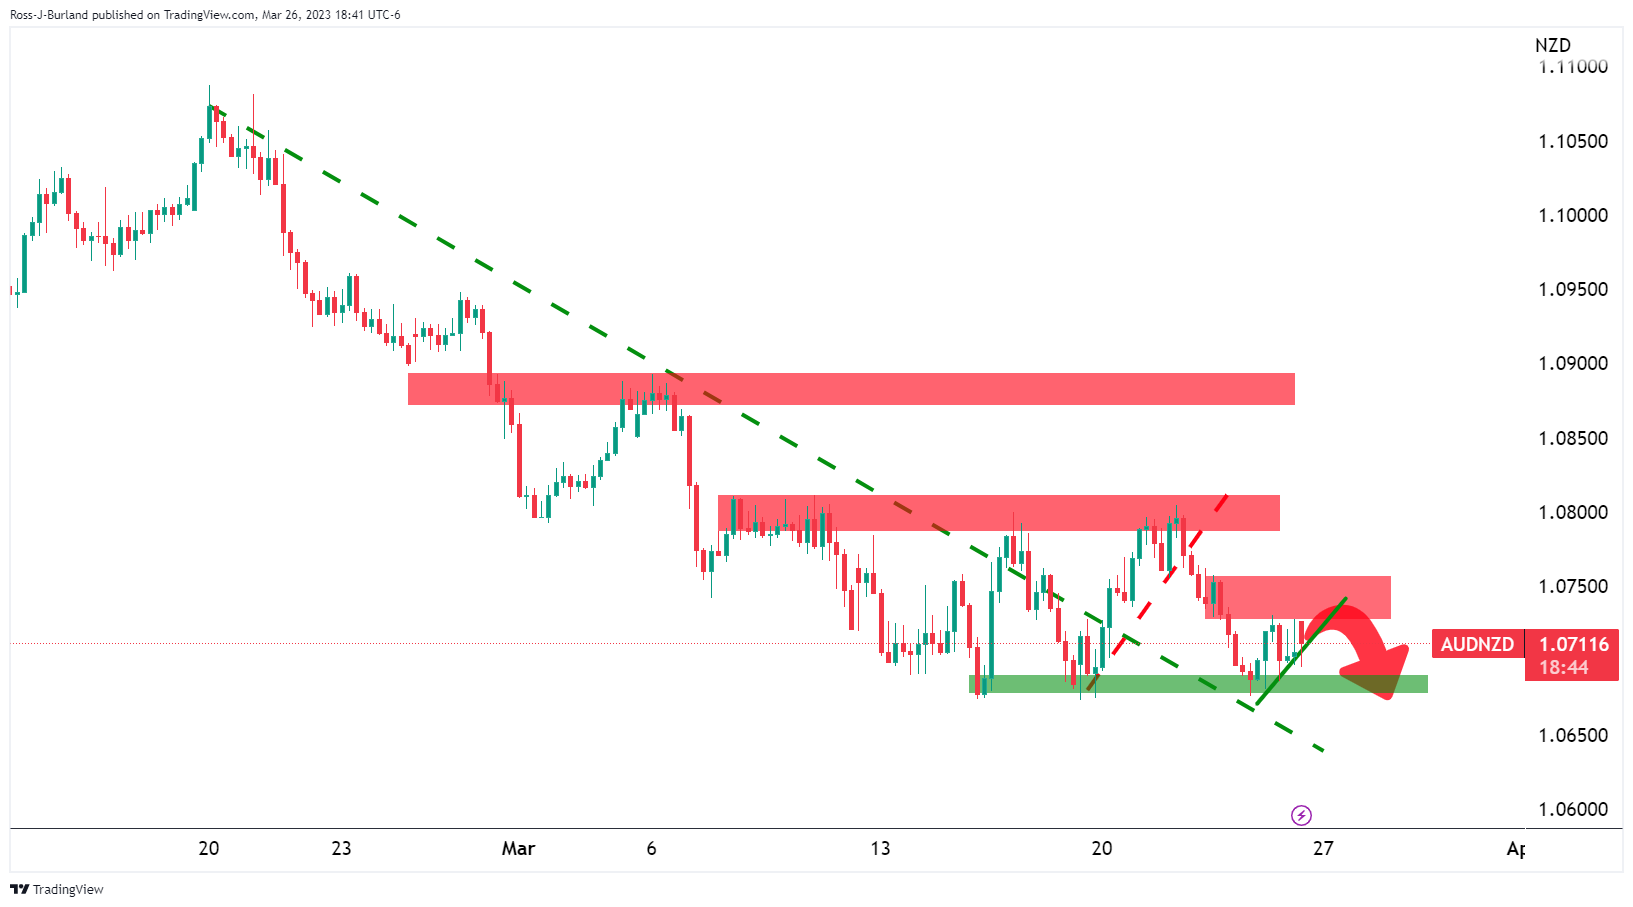
Although the price broke the trendline resistance, the bulls need to get over the 1.0750 mark or they face pressures and prospects of a move below the triple bottom lows near 1.0670.
- EUR/USD eases from intraday high, pares the first daily gain in three.
- Clear downside break of short-term ascending trend line, steady RSI keeps sellers hopeful.
- Convergence of 50-DMA, 10-DMA challenges Euro bears amid bullish MACD signals.
EUR/USD takes a U-turn from the intraday high while declining to 1.0770 during the mid-Asian session on Monday.
In doing so, the major currency pair consolidation the first daily gains in three while justifying the previous day’s downside break of a one-week-old ascending trend line amid steady RSI (14) line.
However, a convergence of the 50-DMA and the 10-DMA, around 1.0730, appears a tough nut to crack for the EUR/USD bears, especially amid bullish MACD signals.
Even if the quote drops below 1.0730, tops marked during early March around 1.690 could challenge the pair sellers before directing them to an upward-sloping support line from early January, around 1.0560 by the press time.
Meanwhile, the EUR/USD buyers remain off the table unless the quote remains below the previous support line, around 1.0820 by the press time.
Even so, multiple tops marked around 1.0930 becomes crucial for the bulls to tackle before eyeing the yearly high surrounding 1.1033.
Overall, EUR/USD is likely to grind lower but an area between the aforementioned DMA convergence and the support-turned-resistance line appears the key for the pair traders to watch.
EUR/USD: Daily chart
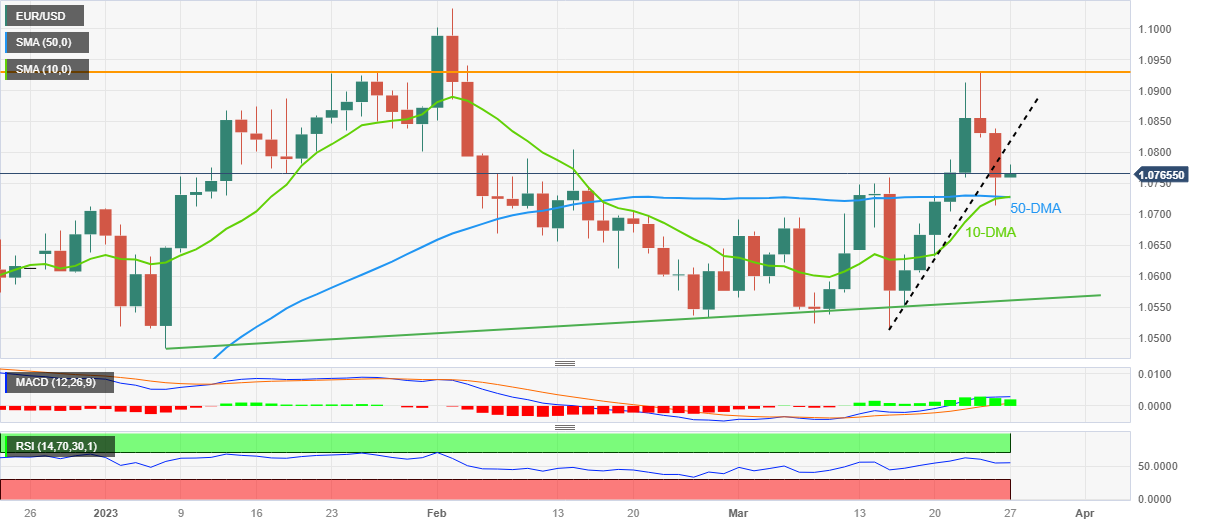
Trend: Limited downside expected
| Index | Change, points | Closed | Change, % |
|---|---|---|---|
| NIKKEI 225 | -34.36 | 27385.25 | -0.13 |
| Hang Seng | -133.96 | 19915.68 | -0.67 |
| KOSPI | -9.52 | 2414.96 | -0.39 |
| ASX 200 | -13.4 | 6955.2 | -0.19 |
| FTSE 100 | -94.1 | 7405.5 | -1.25 |
| DAX | -253.16 | 14957.23 | -1.66 |
| CAC 40 | -124.15 | 7015.1 | -1.74 |
| Dow Jones | 132.28 | 32237.53 | 0.41 |
| S&P 500 | 22.27 | 3970.99 | 0.56 |
| NASDAQ Composite | 36.56 | 11823.96 | 0.31 |
- GBP/JPY has climbed above 160.00 as UK’s retail demand remained robust.
- Upbeat UK retail demand could keep inflation above double-digit figure.
- Going forward, the speech from BoJ Ueda will be keenly watched.
The GBP/JPY pair has extended its recovery above 160.00 in the Asian session. The cross has get strength after the release of the better-than-anticipated United Kingdom Retail Sales data. Monthly Retail Sales (Fed) data accelerated firmly by 1.2%, higher than the consensus of 0.2% and the former release of 0.9%. UK’s annual Retail Sales data contracted by 3.5% while the street was anticipating a contraction of 4.7%.
Upbeat retail demand by UK households could propel fears of persistent inflation as firms would be motivated to come up with a higher Producer Price Index (PPI), which could increase the burden on households. Contrary to that, Bank of England (BoE) Governor Andrew Bailey is of the view that “There is evidence of encouraging progress on inflation, we have to be vigilant,” cited while interviewing with BBC on Friday.
Last week, the BoE hiked rates by 25 basis points (bps) to 4.25% despite global banking turmoil. Inflationary pressures in the UK zone are extremely elevated led by higher food price inflation and a shortage of labor. An inflation rate is still in the double-digit figure, therefore, the BoE had no other alternative than to elevate rates further.
On Friday, BoC member Catherine Mann said, that she voted at this week’s meeting for a 25bp rate hike instead of a bigger increase, motivated in part by the fact that inflation expectations began to moderate, reflecting that monetary policy is having an effect.
On the Tokyo front, the Japanese Yen will remain in action ahead of the speech from Bank of Japan (BoJ) novel Governor Kazuo Ueda. A dovish stance is expected from the BoJ as the central bank is working on keeping the inflation rate above 2%. The majority of the contribution to higher Japan’s inflation is coming from higher import prices. Therefore, more push for inflation would be required through monetary tools.
| Pare | Closed | Change, % |
|---|---|---|
| AUDUSD | 0.6644 | -0.61 |
| EURJPY | 140.663 | -0.74 |
| EURUSD | 1.07602 | -0.68 |
| GBPJPY | 159.871 | -0.55 |
| GBPUSD | 1.22297 | -0.48 |
| NZDUSD | 0.62025 | -0.73 |
| USDCAD | 1.37402 | 0.22 |
| USDCHF | 0.91965 | 0.34 |
| USDJPY | 130.725 | -0.06 |
- AUD/JPY shows resilience amid banking liquidity challenges.
- Upcoming Australian and Japanese CPI releases are likely to frame the path for AUD/JPY.
- Essential to monitor credit default swaps in the global banking sectors.
As the new week begins, the AUD/JPY pair is showing resilience, rising approximately 1% as of now and reflecting the risk-on mood triggered by US authorities' efforts to alleviate banking liquidity concerns.
The AUD/JPY has been under pressure since the Reserve Bank of Australia (RBA) hiked rates by 25 basis points (bps) in its last meeting. The market now expects no further hikes as the RBA minutes indicated a potential pause during the April policy meeting. This, along with the ongoing market turbulence due to the global banking liquidity crisis, has made it difficult for the pair to gain traction.
On Friday, the AUD/JPY experienced a setback as fresh developments surrounding Deutsche Bank's credit default swap reemergence led to a risk-off environment. Although no concrete information was available from the bank, panic began to spread.
Last week, heavy commentary from Federal Reserve (Fed) officials and the US Treasury Department demonstrated a willingness to intervene in the market if the liquidity crunch worsened. A rebound in US Treasury and peer debt yields, coupled with a partial easing of risk-off positioning, reduced the Yen's safe-haven premium, and Gold's allure also waned.
The Australian Consumer Price Index (CPI) for February is set to be released on Wednesday, with expectations of a slight decrease to 7.2% from January's 7.4%. The forecast range lies between 6.7% and 7.7%. Meanwhile, Core Tokyo CPI (Friday) is anticipated to ease to 3.1% from 3.3%, due to stabilizing energy prices and base effects. This release is considered a leading indicator of national metrics scheduled for release in the following weeks.
The AUD/JPY pair is likely to be influenced primarily by risk sentiment in the banking sector. As both the Australian and Japanese CPI releases draw near, market participants will closely monitor these indicators for potential impact on the currency pair. The ongoing efforts of global authorities, particularly the US, to address banking liquidity issues and stabilize financial markets will also play a crucial role in shaping the pair's performance.
Levels to watch


© 2000-2026. All rights reserved.
This site is managed by Teletrade D.J. LLC 2351 LLC 2022 (Euro House, Richmond Hill Road, Kingstown, VC0100, St. Vincent and the Grenadines).
The information on this website is for informational purposes only and does not constitute any investment advice.
The company does not serve or provide services to customers who are residents of the US, Canada, Iran, The Democratic People's Republic of Korea, Yemen and FATF blacklisted countries.
Making transactions on financial markets with marginal financial instruments opens up wide possibilities and allows investors who are willing to take risks to earn high profits, carrying a potentially high risk of losses at the same time. Therefore you should responsibly approach the issue of choosing the appropriate investment strategy, taking the available resources into account, before starting trading.
Use of the information: full or partial use of materials from this website must always be referenced to TeleTrade as the source of information. Use of the materials on the Internet must be accompanied by a hyperlink to teletrade.org. Automatic import of materials and information from this website is prohibited.
Please contact our PR department if you have any questions or need assistance at pr@teletrade.global.
transfers