- Analiza
- Novosti i instrumenti
- Vesti sa tržišta
Novosti i prognoe: devizno tržište od 22-07-2022
- The GBP/JPY finished the week with decent losses of 0.68%.
- July’s worldwide reported S&P Global PMIs resurfaced recession concerns in the financial markets, shifting sentiment sour.
- GBP/JPY Price Analysis: In the short-term downward biased unless buyers reclaim 164.00; otherwise, losses would extend towards 161.80.
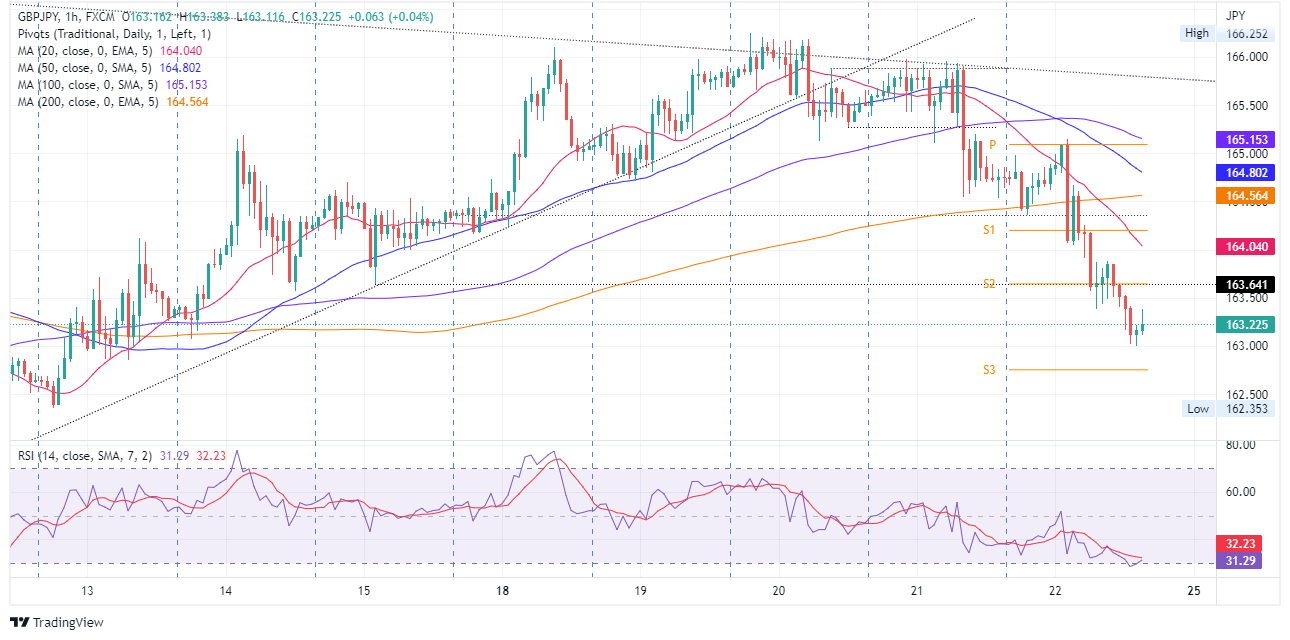
The GBP/JPY slides for the third straight day creep below the 50-day EMA at around 163.51, spurred by a dismal market mood, blamed on US companies missing earnings, alongside weak worldwide S&P Global PMIs reigniting recessions worries amongst investors. In the meantime, next week, traders brace for the July US Federal Reserve Open Market Committee (FOMC) monetary policy decision. At the time of writing, the GBP/JPY is trading at 163.22.
GBP/JPY Price Analysis: Technical outlook
The GBP/JPY daily chart depicts the pair as upward biased, despite the ongoing retracement from weekly highs near 166.00, towards the weekly lows at around 163.22. GBP/JPY traders should be aware that the 20 and 50-day EMAs, previous support levels, turned into resistance once the pair nosedived 150 pips. However, the uptrend is still in play unless the GBP/JPY breaks below the July 6 low at 160.38.
GBP/JPY 1-hour chart
The GBP/JPY hourly chart portrays the cross-currency pair as downward biased. Once the GBP/JPY plunged below the 200-hour EMA around 164.50, it exacerbated a fall towards its weekly lows near 163.00. Late in the session, the GBP/JPY bounced off some 20 pips to current exchange rate levels. Nevertheless, sellers are in charge unless GBP/JPY buyers reclaim 164.00.
Therefore, the GBP/JPY’s first support would be the July 22 low at 163.00. A breach of the latter will expose the S3 daily pivot point at 162.75. Once cleared, the cross next stop would be the confluence of the S4 daily pivot and the July 12 low around the 161.80-85 area.
GBP/JPY Key Technical Levels
- EUR/JPY finishes negative in the week, down by 0.48% as the yen shows signs of strength.
- Deteriorated market mood, augmented appetite for safe-haven peers.
- EUR/JPY Price Analysis: In the near term is downward biased, eyeing a fall below 137.00.
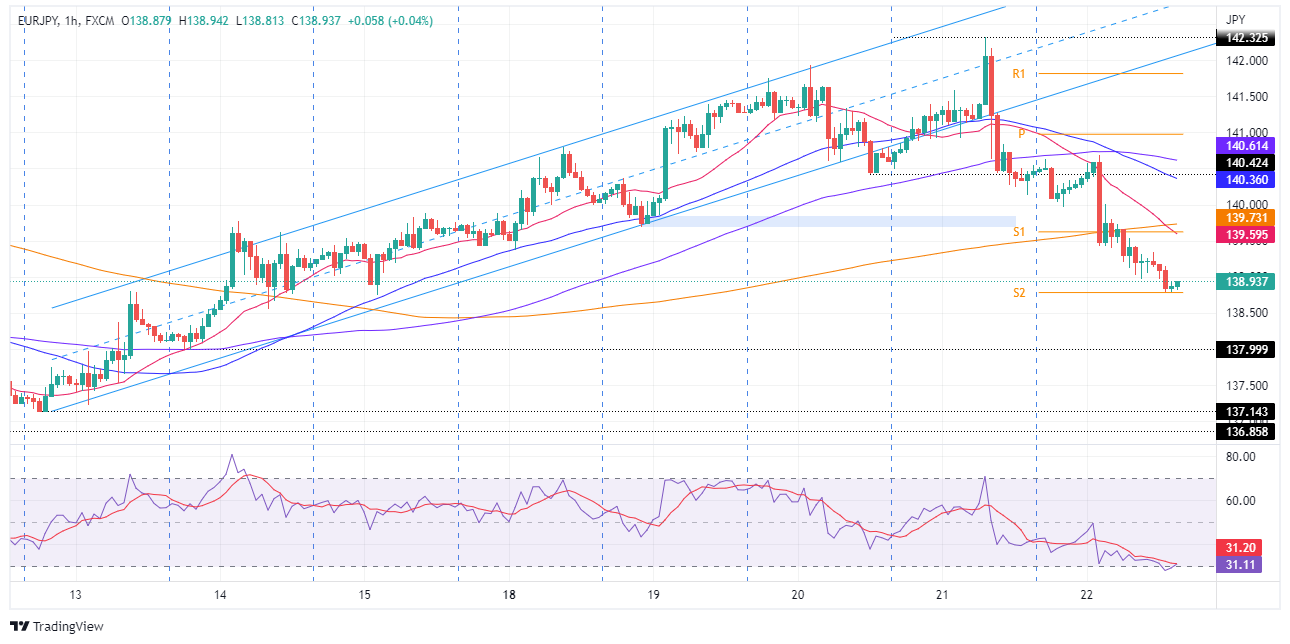
The EUR/JPY plummets from weekly highs hit on Thursday at 142.32, drops more than 160 pips on Friday, towards the 138.00 area, amidst a dampened market mood, which increased safety appetite, bolstering in the FX space, the Japanese yen. At the time of writing, the EUR/JPY is trading at 138.93.
US equities fell between 0.43% and 1.77% as Wall Street closed. Social media companies missing earnings estimations, alongside soft US economic data, added to recession fears. In the FX space, the greenback finished flat on Friday, as shown by the US Dollar Index, but slid 1.28%, snapping three consecutive weeks of gains.
Also read: EUR/JPY Price Analysis: Plunges 200 pips after hitting a two-week high
EUR/JPY Price Analysis: Technical outlook
The EUR/JPY Is still upward biased, despite the ongoing pullback from weekly highs at 142.32, towards its lows at 138.89. Traders should note that the cross-currency slumped below the 20 and 50-day EMA, exacerbating the break below 139.00. However, unless EUR/JPY sellers reclaim the 100-day EMA at 137.06, the uptrend is intact.
EUR/JPY 1-hour chart
The EUR/JPY hourly chart illustrates that once the pair dived below the ascending channel bottom trendline alongside the 140.42 July 20 low, the bias would shift neutral-to-downwards in the near term. However, sellers outweighing buyers by large sent the cross plunging from the 140.00 area to 138.90s, breaking beneath the 200-hour EMA on its way down.
Therefore, the EUR/JPY in the near term is downward biased. The EUR/JPY first support will be 138.50. Break below will expose the July 13 low at 137.99, followed by the July 12 swing low at 137.14.
EUR/JPY Key Technical Levels
- Gold Price is set to finish the week up by almost 1%, snapping five weeks of losses.
- Investors’ recession fears re-emerged on weak EU and US PMI data.
- The US 2s-10s yield curve inversion extended for 14 straight days.
Gold Price rises for the second consecutive day after tumbling to a fresh multi-month year low on Thursday, at around $1681, rebounding sharply and hitting a weekly high at $1720.24. Nevertheless, gold extended its gains on Friday and reached a fresh weekly high at $1739.27, but faltered to reclaim the crucial $1750 figure, opening the door for a fall to current price levels. At the time of writing, XAUUSD is trading at $1723.62
Investors’ mood shifted sour on companies’ earnings and recession worries
Sentiment turned negative just two hours after the NY ringing bell. US companies missing earnings and weaker than estimated US PMIs data reignited investors’ recession fears. The greenback rose, bonds jumped, and yields fell, led by the 10-year benchmark note yielding 2.792%, down eight basis points.
On Friday, S&P Global reported worldwide PMIs, with readings showing the global economy is slowing down. Particularly the Euro area and US readings were dismal, increasing the likelihood of a recession. The EU S&P Global Manufacturing and Composite PMIs for July dropped 49.6 and 49.4, respectively. In the case of the US, the Services and Composite Indices were the main drivers leading to the downside, falling to 47 and 47.6, respectively. That said, traders seeking safety sent gold prices towards their weekly high, around $1740.
Chris Williamson, Chief Business Economist at S&P Global Market Intelligence, said about US data, “The preliminary PMI data for July point to a worrying deterioration in the economy. Excluding pandemic lockdown months, output is falling at a rate not seen since 2009 amid the global financial crisis, with the survey data indicative of GDP falling at an annualised rate of approximately 1%.”
Consequently, the yield curve inversion in the US 2s-10s persists negative for 14 consecutive days and sits at -0.211%, while the US 3-month to 10-year spread flattened to 0.337%.
In the week ahead, the US Federal Reserve is expected to hike rates by 75 bps, lifting the Federal funds rate (FFR) to 2.50%. Gold traders should be aware that there will be no economic projections in the July meeting, which will be revealed in the September reunion.
Week ahead
Alongside the Federal Reserve Open Market Committee (FOMC) monetary policy decision, the US economic docket will feature US inflation data, the CB Consumer Confidence, and Q2 Gross Domestic Product on its advance reading.
Gold (XAUUSD) Key Technical Levels
- USD/CHF will finish the week with solid losses of 1.30%.
- The market sentiment remains negative, a headwind for the USD/CHF.
- USD/CHF Price Analysis: A break under 0.9600 would open the door towards 0.9510.
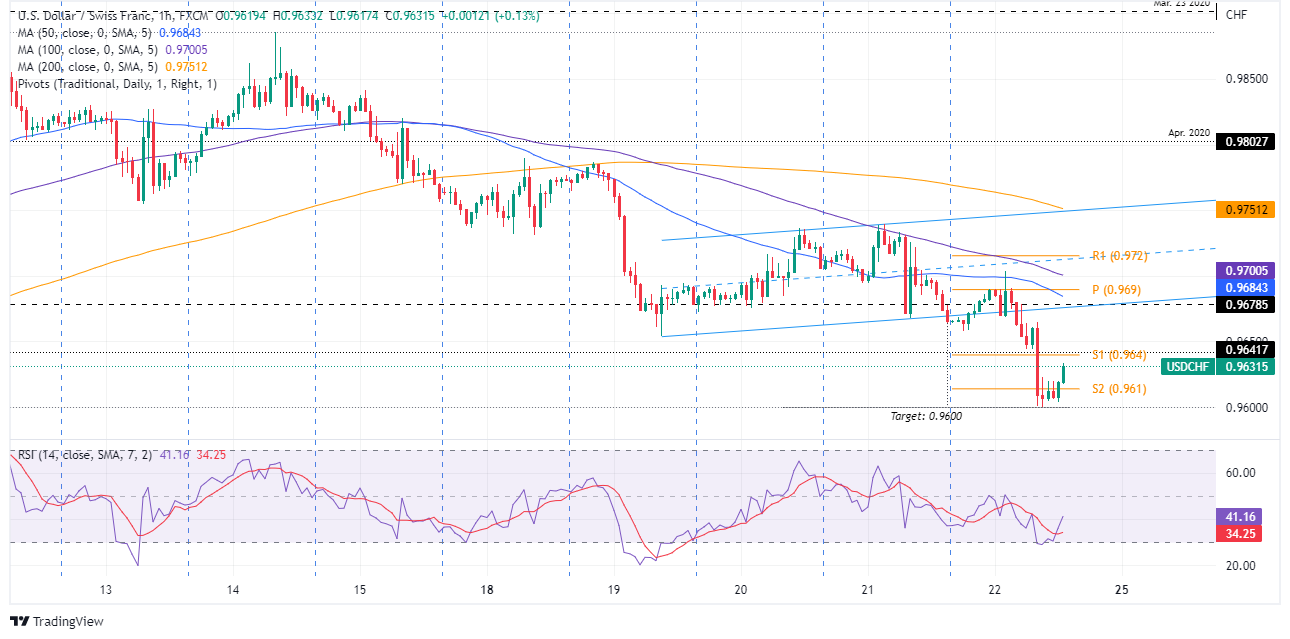
The USD/CHF tumbles on the back of dismal than expected US PMI data, further extending its weekly losses, as sentiment deteriorates due to the abovementioned and US tech firms’ soft earnings reports. Investors sought safety assets and peers, bolstering the Swiss franc. At the time of writing, the USD/CHF is trading at 0.9631, down by 0.34%.
US equities are tumbling across the board, while the greenback drops 0.11%, as shown by the US Dollar Index at 106.483. US bonds jump, spurring a drop in US Treasury yields, led by the 10-year yield down ten bps, at 2.776%-
USD/CHF Price Analysis: Technical outlook
The USD/CHF began trading around the 0.9660 region and rallied towards the daily high at 0.9700. however, buyers struggled to break resistance, and the USD/CHF fell to the daily low at 0.9599 before settling at the current exchange rate.
USD/CHF 1-hour chart
The USD/CHF hourly chart depicts the downtrend accelerated during the day, aligned with Thursday’s note that I wrote about the major. “A breach of the latter (0.9675) will immediately expose the bottom trendline of the aforementioned ascending channel, meaning that the USD/CHF next target would be 0.9600”. That happened on Friday, and the major entered range-bound as the Relative Strength Index (RSI), jumped from oversold readings, approaching the 50-midline.
Nevertheless, the USD/CHF bias remains downwards, but a leg-up is on the cards, and the USD/CHF might reach the S1 daily pivot at 0.9640 before resuming the downtrend. Therefore, the USD/CHF first support would be the S2 daily pivot at 0.9614. The break below exposes the 0.9600 figure, followed by the S3 pivot point at 0.9560 and the S4 daily pivot at 0.9514.
USD/CHF Key Technical Level
- AUD/USD is set to finish the week up by 2.23%.
- US Services and Composite PMIs plummeted below 50, suggesting a recession could be near.
- Hawkish RBA minutes revealed during the week cushioned the AUD/USD from falling further on weak Aussie PMIs.
The AUD/USD rises for the second consecutive day, registering solid gains amidst a fragile market mood, which shifted sour spurred by weaker than expected US PMIs, showing contraction lying ahead, while the greenback begins to pare some of its earlier losses.
The AUD/USD is trading at 0.6942, bouncing from daily lows at 0.6893 on soft Aussie data and hitting a daily high at 0.6977 before retracting to current price levels.
US Services and Composite PMis plunged to contractionary territory
During the New York session, S&P Global revealed July’s preliminary figures for the US, which showed that the manufacturing index ticked higher, but the services one dropped below 50. Therefore, the S&P Global Composite Index plunged to 47.6, further confirming the ongoing slowdown of the US economy. The AUD/USD jumped on the news, reaching its daily high.
Meanwhile, in the Asian session, the Australian PMIs slowed but remained in expansionary territory, triggering some downward pressure on the AUD/USD. Nevertheless, the RBA minutes released earlier in the week indicating the need for further rate hikes offered some cushion to the major, which later climbed towards its daily high.
In the meantime, the AUD/USD got bolstered by Chinese news. China revealed its intentions to consolidate its economic recovery and prioritize stable prices and employment, battered by Q2 Covid-19 lockdowns, which almost dragged the economy into recessionary territory.
What to watch
Next week, the Australian economic calendar will feature consumer inflation data, retail sales, and the Australian PPI. On the US front, the Federal Reserve Open Market Committee (FOMC) monetary policy decision, US inflation data, and Q2 Gross Domestic Product on its advance reading will give some guidance to AUD/USD traders.
AUD/USD Key Technical Levels
Analysts at MUFG Bank hold onto a short EUR/USD trade idea and see it moving below parity. They consider the euro will be affected by ongoing fears over disruption to the Eurozone economy and fragmentation risks.
Key Quotes:
“We expect the EUR to remain under downward pressure in the near-term driven by ongoing fears over disruption to the euro-zone economy from energy supply constraints and fragmentation risks.”
“The release of the euro-zone PMI surveys for July have further reinforced fears for a sharper slowdown/recession for the euro-zone economy in 2H of this year. We also expect Italian bond yields to continue experiencing upward pressure ahead off the snap elections to be held on 25th September.”
“We are not expecting the ECB to step in to support the Italian bond market in response to higher political uncertainty unless yields spike higher. We expect these negative factors to outweigh the ECB’s more front-loaded tightening.”
- SD/CAD bounces from weekly lows back to 1.2870.
- Data from Canada surpass expectations, while in US disappoints.
- Attentions turn to FOMC meeting next week.
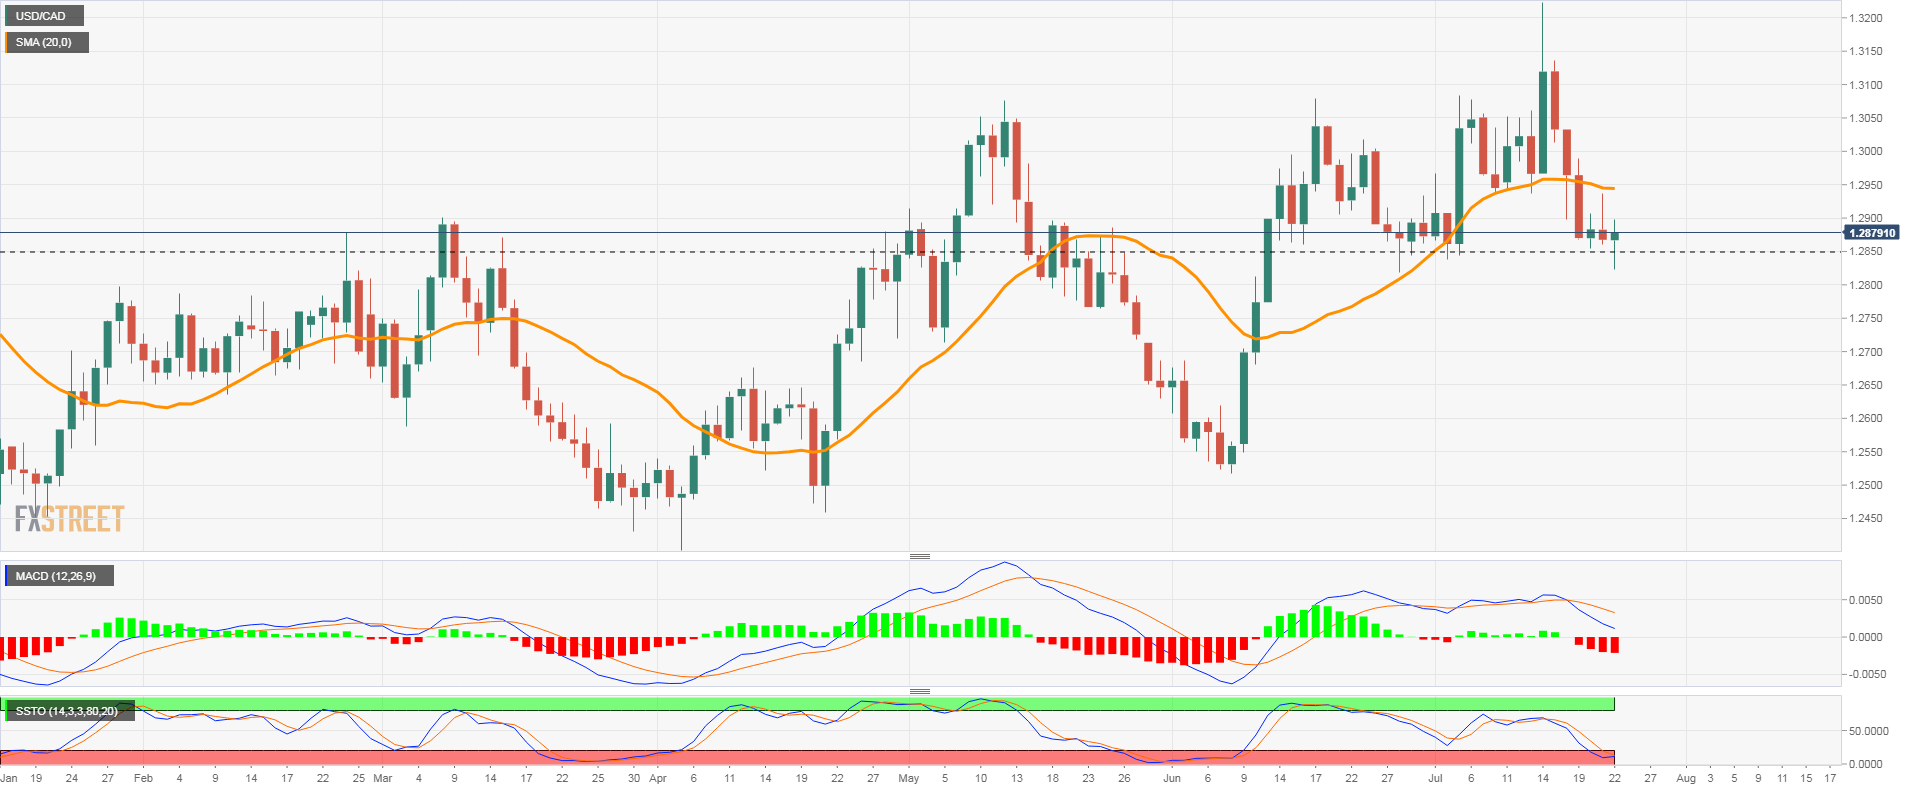
The USD/CAD is about to the week hovering around 1.2870 after rebounding from the 1.2820. Still the US dollar is about to end the week on a negative tone ahead of the FOMC meeting.
Economic data
The greenback tumbled after the release of the S&P Global PMI report that showed an unexpected contraction in the service sector in July according to preliminary data. The figures boosted further Treasuries and weighed on the US dollar. Attention now turns to next week’s FOMC meeting.
In Canada, data showed retail sales rose above market consensus in May with an increase of 2.2% and the preliminary estimate for June point to a gain of 0.3%. Although the numbers did not help the loonie that pulled back as stocks in Wall Street dropped further.
Key support holds
The USD/CAD rebounded after approaching the critical support area of 1.2820 and even recovered levels above the other relevant support of 1.2850, leaving the pair back into the previous range.
On a weekly basis, USD/CAD is about to end the week with losses after being unable to break the 1.3020 resistance. The wide range between 1.2850 and 1.3020 still prevails.
“The CAD has rebounded over the past week resulting in USD/CAD dropping back below the 1.2900 supported by the rebound in global equity markets. USD/CAD has had one of the strongest correlations with global equity market performance amongst G10 FX pairs. At the current juncture we view this equity market rebound as most likely a bear market rebound. As a result, the correction lower for USD/CAD should prove limited and short-lived”, consider analysts at MUFG Bank.
Technical levels
Data released in Canada on Friday showed retail sales rose 2.2% in May surpassing expectations of a 1.6% gain. Analysts at the National Bank of Canada point out sales were pushed up at gasoline stations and motor vehicle/parts dealers. They consider a strong labor market will compensate higher prices and rising interest rates.
Key Quotes:
“Consumer expenditures on goods came out better than expected although the prior month observed a small downward revision. The May print was pushed up by sales at gasoline stations and motor vehicle/parts dealers.”
“The remainder of the retail sales report was not too shabby as witnessed by core retail sales (ex. autos/gas) which increased 0.6% in May, a fifth consecutive monthly increase. The national diffusion of retail sales was also a bright spot of the report as all provinces reported gains in the month.”
“There was some optimism to be found by the increase in volume retail sales which rose 0.4% in the month. Including the rise in the previous month, real retail spending increased 2.1% annualized in the second quarter of the year assuming growth is flat in June. The Statistics Canada preliminary estimate for June suggests a 0.3% increase in nominal sales.”
“While gas receipts should support nominal retail sales with rising gasoline prices in June, there could be a reduction in spending in other sectors as consumers deal with higher prices and rising interest rates. Hopefully these headwinds are compensated by a strong labour market and a still high savings rate.”
The European Central Bank's policy normalization must continue, European Central Bank (ECB) Governing Council member and German central bank head Joachim Nagel said on Friday.
"I am confident that the ECB's Transmission Protection Instrument (TPI) would withstand legal challenges," Nagel added.
Market reaction
These comments don't seem to be having a noticeable impact on the shared currency's performance against its major rivals. As of writing, the EUR/USD pair was trading at 1.0223, where it was down 0.05% on a daily basis. Meanwhile, the pair remains on track to snap a three-week losing streak.
The FOMC will meet next week. Market consensus is for a 75 basis points rate hike. Analysts at Rabobank also expect such a hike and the balance sheet reduction schedule to rmain unchagned. They think that the Fed is still underestimating the persistence in inflation.
Key Quotes:
“We expect the FOMC to raise the target range for the federal funds rate by 75 bps to 2.25- 2.50%. Meanwhile, the balance sheet reduction schedule is expected to remain unchanged, with a $47.5 billion per month reduction through August, followed by $95 billion per month from September.”
“We think that the Fed is still underestimating the persistence in inflation, and has yet to acknowledge that a wage-price spiral has already started in the US. US CPI inflation rose to 9.1% in June and its core measure stands at 5.9%. With shelter already at 5.6% year-on-year and rising, core inflation is likely to remain persistent. Keep in mind that shelter accounts for 41% of the core CPI and tends to lag house prices. Shelter is likely to rise above 6.0% year-on-year later this year and remain elevated next year. At the same time, nominal wages have risen by 6.7% year-on-year in June according to the Atlanta Fed’s wage growth tracker. This does suggest that the wage-price spiral that the Fed still hopes to avert, is already here.”
“After a 75 bps hike on July 27, we expect 50 bps hikes at each meeting in the remainder of the year. This would raise the target range for the federal funds rate to 3.75-4.00% by the end of the year, which is more than indicated by the FOMC’s dot plot (3.4%) and futures markets (3.43%).
- GBP/USD snaps three straight weeks of losses, set to gain around 1.34%.
- US S&P Global PMIs flashes purchasing managers’ worries about current US economic conditions.
- The US 2s-10s yield curve remains inverted for 14 consecutive days.
GBP/USD recaptures the 1.2000 figure amidst a fragile market mood, as equities are seesawing of late, due to US S&P Global PMI data, flashing a contraction in the services sector and its Composite index, while traders seek safety towards US Treasuries, with US bond yields falling, undermining the greenback.
The GBP/USD is trading at 1.2028 after diving towards its daily low at around 1.1915. Nevertheless, the major bounced back and rallied towards a daily high at 1.2063 before stabilizing around current price levels.
US PMIs show signs of further deterioration
In the meantime, US S&P Global reported PMIs Indices for July. Manufacturing rose by 52.3, above expectations, but Services and Composite tumbled to 47 and 47.6, respectively, suggesting that the economy is deteriorating, according to the survey. When news crossed wires, the US Dollar Index, a basket of peers that measure the buck’s performance, slides 0.18%, sits at 106.407, while the US 10-year benchmark note coupon plunges ten bps to 2.789%.
Traders should be aware that the US 2s-10s yield curve remains inverted, at -0.174%, signaling an impending recession. Nonetheless, the US 3-month to 10-year yield curve bear flattened towards the 0.367% area, which, although positive, has erased since its peak in May at 2.350%, almost 200 bps.
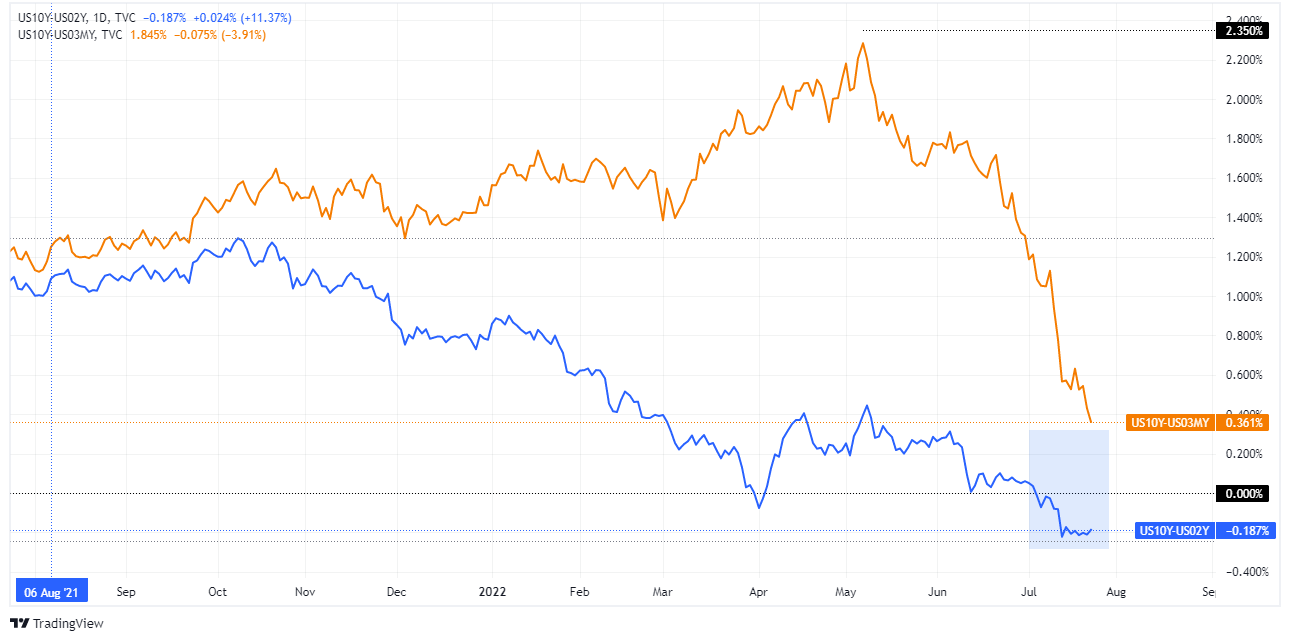
US 2s-10s in blue - US 3m-10y in orange
Meanwhile, on the UK side, UK Retail Sales contracted, showing the pressure of elevated prices in the UK. June sales dropped by -5.8% YoY, more than estimations, while the monthly reading shrank -0.1%, less than the -0.3% contraction estimated.
Later, UK S&P Global PMIs for July held above the expansionary territory, easing some pressures on the shoulders of the Bank of England (BoE) Governor Andrew Bailey. Nevertheless, the political issues surrounding the resignation of the current PM Boris Johnson keep Britons entertained with the battle between Rishi Sunak and Liz Truss. That, alongside Brexit jitters, might cap any upside reaction on the GBP/USD.
What to watch
Next week, an absent UK economic docket would keep GBP/USD traders leaning on US economic data. On the US calendar, the Federal Reserve Open Market Committee (FOMC) monetary policy decision, US inflation data, and Q2 Gross Domestic Product on its advance reading will keep GBP/USD traders glued to their screens.
GBP/USD Key Technical Levels
- US Treasury yields decline dramatically on Friday.
- US Economic data increases fears of a recession.
- USD/JPY is suffering the worst weekly performance since 2020.
The USD/JPY accelerated the decline following the release of US economic data and bottomed at 135.56, reaching the lowest level in two weeks. The pair hovers around 136.00, down 250 pips for the week, the worst performance since 2020.
The Japanese yen is up across the board even as stock prices rise in Wall Street and Europe. The rally in bonds gained speed after the release of US data, adding fuel to the yen.
The US S&P Global Services PMI tumbled unexpectedly in July to 47, down from 52.7 and against expectations of 52.6. It was the first reading under 50 since the pandemic. The S&P Manufacturing PMI fell less than expected to 52.3 against the market consensus of 52.
The activity numbers increased fears about a recession and softened Fed rate hike expectations. Next week the US central bank will likely raise the Fed Funds rate by 75 basis points. At the same time, stocks reacted to the upside.
From a technical perspective, the short-term bias now points to the downside in USD/JPY. The pair is about to post the first daily close under the 20-day Simple Moving Average since May. The immediate support is seen at 135.55, followed by the 134.50 zone. The US dollar needs to recover the 137.85 area to remove the negative tone.
Technical levels
- Gold price scaled higher for the second straight day and shot to over a one-week high on Friday.
- Recession fears, along with sliding US bond yields, offered some support to the safe-haven metal.
- The global monetary policy tightening trend could act as a headwind for the non-yielding XAUUSD.
Gold price gained some follow-through traction for the second successive day on Friday and built on the overnight goodish recovery from the $1,680 region, or its lowest level since March 2021. The momentum pushed the XAUUSD to over a one-week high, around the $1,737 region during the North American session. That said, any meaningful upside still seems elusive, warranting some caution for aggressive bullish traders.
Gold price underpinned by recession fears
Persistent worries about a possible global recession turned out to be a key factor that offered some support to the safe-haven gold. The concerns resurfaced on Friday following the disappointing release of the Eurozone PMI prints. In fact, the preliminary manufacturing activity report from S&P Global/BME research showed that the downturn in the German and French business activity gathered pace in July.

Growth concerns
Declining US bond yields offered additional support
A further decline in the US Treasury bond yields reflects mounting worries about the worsening economic outlook. Thursday's US macro data - Weekly Jobless Claims and the Philly Fed Manufacturing Index - also pointed to signs of a deteriorating trend in the economy. This, in turn, dragged the yield on the benchmark 10-year US government bond to its lowest level in over two weeks, which was seen as another factor that offered some support to the gold price.
Also read - Gold Price Forecast: Will XAUUSD sustain the recovery above $1,700?
Aggressive major central banks to cap gains
That said, the prospects for a more aggressive move by major central banks to curb soaring inflation might hold back traders from placing aggressive bullish bets around the non-yielding gold. The European Central Bank followed the global tightening trend and raised its official rates for the first time since 2011 on Thursday. The central bank delivered a jumbo 50 bps rate increase and indicated further tightening in future meetings.
Adding to this, the Bank of England Governor Andrew Bailey's hawkish remarks on Wednesday bolstered bets for a 50 bps rate hike in August, which would be the biggest since 1995. The Federal Reserve is also expected to raise rates by another 75 bps at its upcoming policy meeting on July 26-27. Moreover, the Reserve Bank of Australia had signalled earlier this week the need for higher interest rates to tame rising inflation.
Gold price technical outlook
Gold price has now found acceptance above the $1,710-$1,712 immediate resistance and seems poised to climb further. That said, any subsequent move up could attract some sellers near the $1,745-$1,746 supply zone. This, in turn, should cap gains for the XAUUSD near the $1,752 region, which should act as a pivotal point and help determine the next leg of a directional move.
On the flip side, the $1,712-$1,710 resistance breakpoint now seems to protect the immediate downside ahead of the $1,707 area and the $1,700 round-figure mark. A convincing break below the latter would suggest that the attempted recovery has run out of steam and rigger a fresh bout of selling. The gold price could then drop back to the YTD low, around the $1,680 region touched on Thursday before eventually dropping to the next relevant support near the $1,670 horizontal zone.
-637940942134264282.png)
Gold price: What does the race to raise rates mean for precious metal prices?
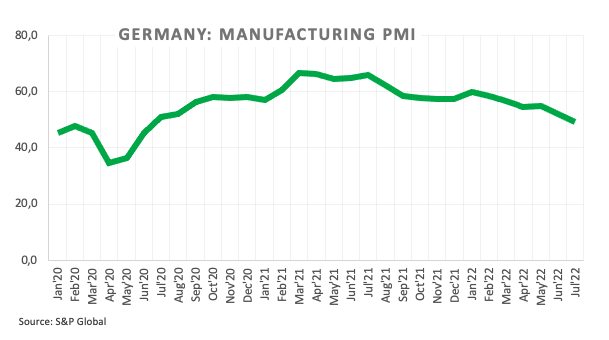
Business activity in the US service sector contracted in early July with S&P Global Services PMI dropping to 47 from 52.7 in June. This reading came in much weaker than the market expectation of 52.6.
Further details of the publication revealed that the Manufacturing PMI edged lower to 52.3 from 52.7 and the Composite PMI slumped to 47.5 from 52.3.
Commenting on the data, "the preliminary PMI data for July point to a worrying deterioration in the economy," said Chris Williamson, Chief Business Economist at S&P Global Market Intelligence.
"Excluding pandemic lockdown months, output is falling at a rate not seen since 2009 amid the global financial crisis, with the survey data indicative of GDP falling at an annualised rate of approximately 1%," Williamson further elaborated. "Manufacturing has stalled and the service sector’s rebound from the pandemic has gone into reverse, as the tailwind of pent-up demand has been overcome by the rising cost of living, higher interest rates and growing gloom about the economic outlook."
Market reaction
The dollar came under strong selling pressure after this report and the US Dollar Index was last seen losing 0.3% on the day at 106.30.
- EUR/USD fades the post-ECB bullish move to 1.0280.
- Further consolidation looks the most likely scenario near term.
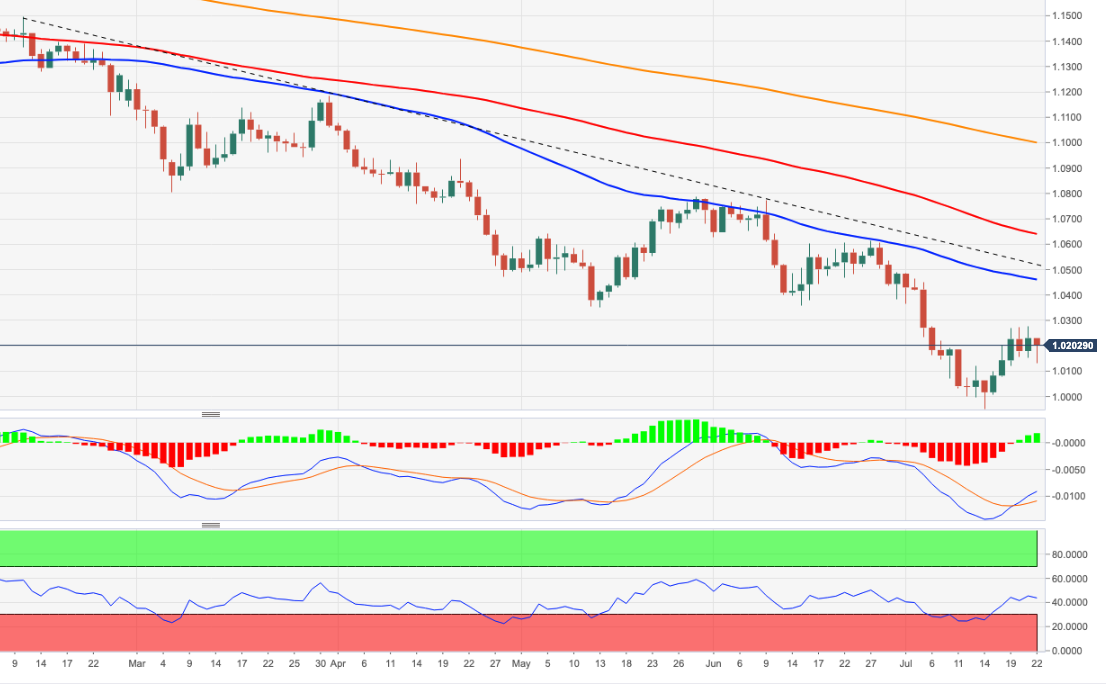
EUR/USD leaves behind Thursday’s decent advance to weekly highs in the 1.0280 region at the end of the week.
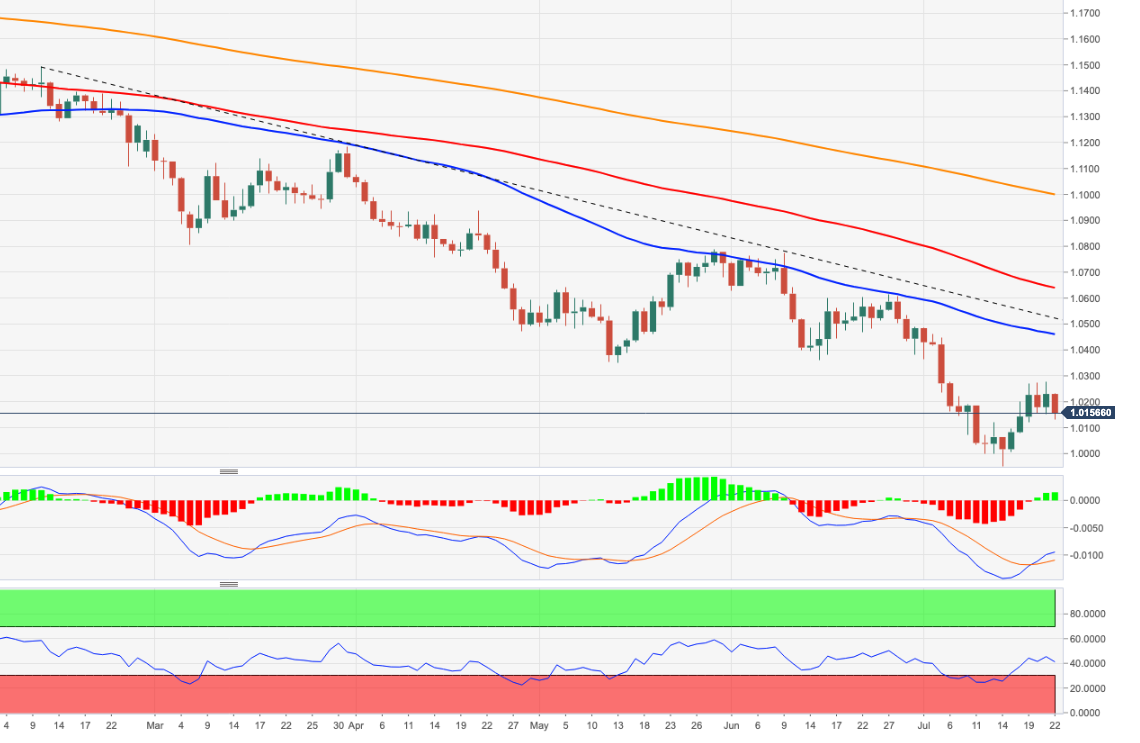
The current consolidative mood carries the potential to extend further, at least until next week’s FOMC meeting. The upside should remain limited by the weekly high around 1.0280, while the low-1.0100s are expected to hold the downside for the time being.
In the meantime, the pair is expected to remain under downside pressure while below the 5-month support line around 1.0500.
In the longer run, the pair’s bearish view is expected to prevail as long as it trades below the 200-day SMA at 1.0998.
EUR/USD daily chart
Senior Economist at UOB Group Alvin Liew comments on the latest BoJ monetary policy meeting.
Key Takeaways
“The Bank of Japan (BOJ), as widely expected, decided to keep its policy measures unchanged at its Jul Monetary Policy Meeting (MPM). The BOJ continued its stark divergence with its G7 peers who are on the cusp or already normalizing monetary policy, as the Japanese central bank kept persistently to its preference for easing, reiterating its pledge that it ‘will not hesitate to take additional easing measures if necessary, and also it expects short- and long-term policy interest rates to remain at their present or lower levels’.”
“In its latest outlook for economic activity and prices (The Bank’s View), it was also not surprising that the BOJ lifted inflation forecasts across FY 2022-24 and further trimmed near term GDP (FY2022). The BOJ now projects core CPI inflation (excluding fresh food) will rise to 2.3% in FY2022 and ease to 1.4% in FY2023 and to 1.3% in FY 2024. BOJ’s GDP growth outlook is materially downgraded for FY2022 to 2.4% (from +2.9% previously in Apr 2022 MPM), while upgrading the FY2023 growth to 2.0% (from 1.9% previously) as well as FY2024 growth to 1.3% (from 1.1% previously).”
“Even as Japan’s inflation is heading higher, it is still below 2% beyond the FY2022 spike and the driving factor is largely stemming from an uncertain supply shock while domestic demand remains weak and wage growth still lacklustre. And add the recent spike in COVID-19 inflections domestically, there is little incentive for the central bank to change course and we continue to expect the BOJ not considering policy normalisation (be it rate hikes or tweaking current monetary easing) anytime soon.”
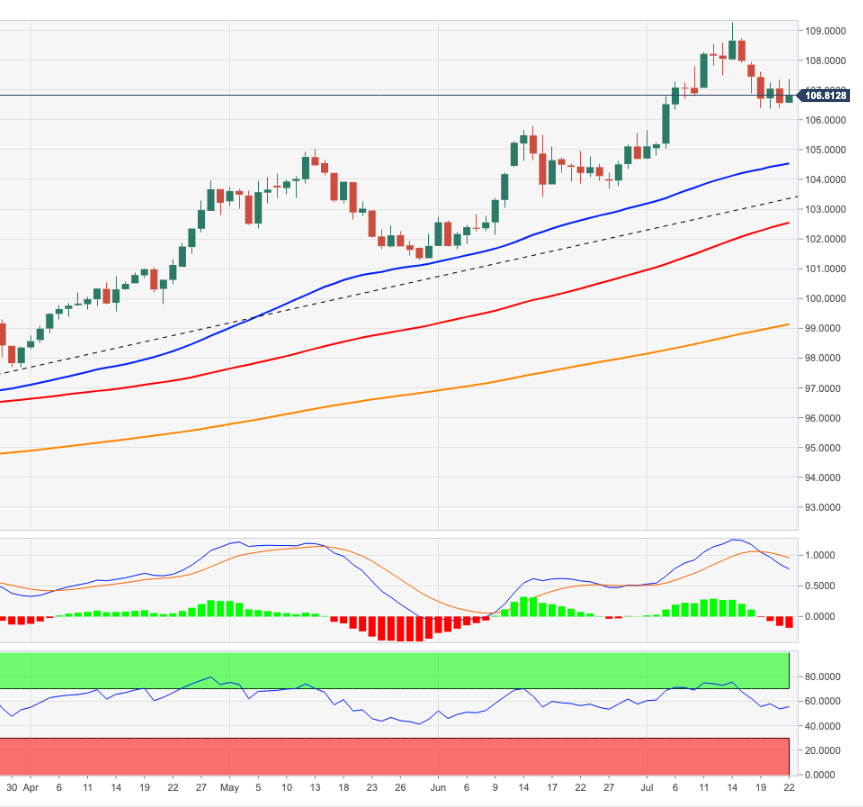
- DXY keeps the choppy performance so far on Friday.
- Next on the upside comes the 2022 high past 109.00.
DXY fades the earlier bull run to the 107.30/35 band, although it keeps the decent gains around 106.80 at the end of the week.
Considering the ongoing price action, the index remains poised for further consolidation, at least until the key FOMC event due on July 27, where the Federal Reserve is expected to tighten the interest rates by another 75 bps.
In the meantime, as long as the index trades above the 5-month line near 103.60, the near-term outlook for DXY should remain constructive.
In addition, the broader bullish view remains in place while above the 200-day SMA at 99.12.
DXY daily chart
- Retail Sales in Canada rose more than expected in May.
- USD/CAD trades with small daily losses near 1.2850.
Retail Sales in Canada rose by 2.2% on a monthly basis in May to CAD62.2 billion in May, Statistics Canada reported on Friday. This print followed April's increase of 0.7% and came in better than the market expectation of 1.6%.
"Sales were led by higher sales at gasoline stations and motor vehicle and parts dealers," Statistics Canada explained in its publication. "Core retail sales—which exclude gasoline stations and motor vehicle and parts dealers—increased 0.6%."
Market reaction
USD/CAD edged lower after this report and was last seen losing 0.1% on the day at 1.2854.
- GBP/USD witnessed some selling on Friday amid the emergence of fresh USD buying.
- Recession fears weighed on investors’ sentiment and benefitted the safe-haven USD.
- A 50 bps BoE rate hike bets offset mixed UK data and continued lending some support.
The GBP/USD pair struggled to capitalize on the overnight bounce from sub-1.1900 levels, or a multi-day low and attracted fresh selling on the last day of the week. The pair, however, managed to rebound a few pips from the daily low and was last seen trading with only modest losses, just above mid-1.1900s heading into the North American session.
The recent optimistic move in the equity markets seems to have run out of steam amid growing fears about a possible global recession. The worries were further fueled by the disappointing release of the flash Eurozone PMI prints, which continued weighing on investors' sentiment. The cautious mood assisted the safe-haven US dollar to regain positive traction, which, in turn, was seen as a key factor that exerted downward pressure on the GBP/USD pair.
The British pound was further undermined by rather unimpressive UK Retail Sales data, which edged down by 0.1% in June. The fall, however, was smaller than the 0.3% anticipated, which, along with slightly better-than-expected flash UK PMIs offered some support to sterling. Apart from this, the rising possibility of a 50 bps rate hike by the Bank of England in August assisted the GBP/USD pair to find some support near the 1.1915 region.
It is worth recalling that BoE Governor Andrew Bailey said earlier this week that the central bank has an absolute priority to bring inflation back down to its 2% target. Bailey clearly stated that a 50 bps increase will be among the choices on the table at the next meeting. This makes it prudent to wait for strong follow-through selling before confirming that the GBP/USD pair's recent bounce from the 1.1760 region has run its course.
Market participants now look forward to the US economic docket, featuring the release of the flash PMI prints for July. This, along with the broader market risk sentiment, would influence the USD price dynamics and provide some impetus to the GBP/USD pair. Nevertheless, spot prices remain on track to post modest weekly gains and snap a three-week losing streak, though the UK political and Brexit woes might continue to act as a headwind.
Technical levels to watch
Indonesia.
Key Takeaways
“Indonesia’s total investment rose by 35.5% y/y to a record-high of IDR 302.2tn ($20.2B) in 2Q22, aided by a surge in foreign investment.”
“Investments outside of Java Island accounted for 52% of the total investment in 2Q22, showing positive overall trends.”
“From January to June, the achievement of investment realization has contributed 48.7% to the 2022 target of IDR 1,200tn.”
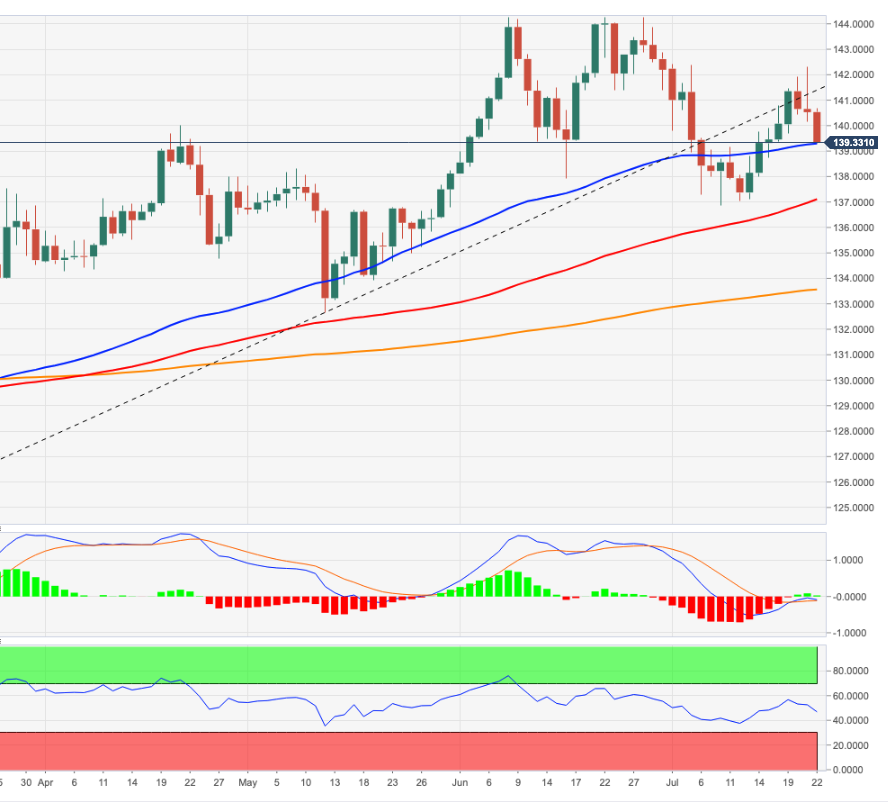
- EUR/JPY adds to the weekly leg lower and approaches 139.00.
- Below the 4-month resistance line extra decline looks likely.
EUR/JPY retreats for the third consecutive session and flirts with the 55-day SMA near 139.20 at the end of the week.
While the 4-month resistance line continues to cap the upside around 140.35, further losses should remain in the pipeline and another drop to the July low at 136.85 (July 8) should not be ruled out. This area of contention appears reinforced by the proximity of the 100-day SMA, today at 137.07.
In the longer run, the constructive stance in the cross remains well underpinned by the 200-day SMA at 133.53.
EUR/JPY daily chart
There are no signs of a wage-price spiral at the moment in the eurozone, European Central Bank Governing Council member Olli Rehn said on Friday.
Commenting on the policy outlook, Rehn reiterated that the rate September rate decision will be determined by the incoming data.
Market reaction
The shared currency struggles to find demand following these comments. As of writing, the EUR/USD pair was trading at 1.0160, where it was down 0.66% on a daily basis. Meanwhile, the US Dollar Index clings to strong daily gains above 107.00.
UOB Group’s Senior Economist Julia Goh and Economist Loke Siew Ting comment on the recently published trade balance figures in the Malaysian economy.
Key Takeaways
“Malaysia’s external trade outperformed last month with total trade, export, and import values breaching their all-time highs. Both export (Jun: +38.8% y/y, May: +30.4%) and import (Jun: +49.3%, May: +37.3%) growth beat our estimates (exports: +18.5%, imports: +34.0%) and Bloomberg consensus (exports: +21.2%, imports: +32.0%), leaving a larger trade surplus of MYR21.9bn in Jun (May: +MYR12.7bn).”
“Jun’s export growth was mainly driven by increased demand for electrical & electronics (E&E) and commodity related products (i.e. refined petroleum, liquefied natural gas (LNG), and palm oil) amid higher commodity prices. Overseas shipments to most trading partners also penciled in strong increases with exports to the ASEAN region, Japan, and New Zealand surging more than 50%. Highest monthly export value was also registered to ASEAN, the US and the EU.”
“We raise our 2022 full-year export growth forecast to 18.0% (from 8.0% previously, BNM est: +10.9%, 2021: +26.0%) after taking into account robust export growth of 26.1% in 1H22 and expectations of softer export growth momentum in 2H22 brought by rising cost pressures, shortages of raw materials and foreign labour, and currency volatility. In addition, there are signs of global tech cycle entering a soft patch. The near-term outlook for Malaysia’s palm oil exports is also clouded by the recent sharp fall in crude palm oil prices as well as Indonesia’s excess supplies and removal of export levy.”
The Bundesbank said in its monthly report that Germany is expected to face slower growth and a new spike in inflation, as reported by Reuters.
"The future development of the energy market is very uncertain, especially with regard to natural gas deliveries from Russia," the Bundesbank said. "The risks for the price outlook are clearly pointing upwards."
Market reaction
Germany's DAX Index showed no reaction to this report and was last seen posting small daily gains. Meanwhile, EUR/USD continues to trade deep in negative territory near 1.0150.
Canadian Retail Sales Overview
Statistics Canada is scheduled to publish the monthly Retail Sales figures for May later this Friday at 12:30 GMT. The headline sales are estimated to rise by 1.6% during the reported month as against the 0.9% growth recorded in April. Excluding autos, core retail sales probably climbed by 1.6% in May, up from the 1.3% increase in the previous month.
According to analysts at TD Securities: “Gasoline stations will provide a key driver for the headline print which reflects the ongoing surge in fuel prices. Meanwhile, motor vehicle sales should see little change from April, leaving the ex-autos measure up 1.4% (market: 1.8%).”
How Could it Affect USD/CAD?
Ahead of the key release, a fresh leg down in crude oil prices undermined the commodity-linked loonie and kept the USD/CAD pair afloat above the 50-day SMA support. Disappointing domestic data would be enough to exert additional pressure on the Canadian dollar, which, in turn, could prompt some short-covering and provide a goodish lift to spot prices.
Conversely, a stronger reading could offer some support to the CAD, though the immediate reaction is likely to be short-lived amid the prevalent bearish sentiment around crude oil prices. This, in turn, suggest that the path of least resistance for the USD/CAD pair is the upside. That said, repeated failures to capitalize on the attempted recovery move warrant some caution for bulls.
From current levels, any subsequent decline is likely to find decent support near the 1.2830-1.2820 area ahead of the 1.2800-1.2790 region. The latter should act as a key pivotal point, which if broken would be seen as a fresh trigger for bearish traders and make the USD/CAD pair vulnerable. The downward trajectory could then accelerate towards the 1.2700 mark en-route the 1.2675-1.2665 horizontal support.
On the flip side, momentum beyond the 1.2900 mark is likely to confront resistance near the overnight swing high, around the 1.2935 region. Some follow-through buying would suggest that the recent corrective pullback from the YTD peak has run its course and pave the way for additional gains. The USD/CAD pair might then aim to surpass the 1.3000 psychological mark and retest the 1.3075-1.3085 supply zone.
Key Notes
• USD/CAD Price Analysis: Bulls trying to defend 50-DMA/50% Fibo. confluence support
• Does the USD/CAD have more upside potential?
• Canada’s success in chasing inflation is upbeat news for the CAD
About Canadian Retail Sales
The Retail Sales released by the Statistics Canada is a monthly data that shows all goods sold by retailers based on a sampling of retail stores of different types and sizes. The retail sales index is often taken as an indicator of consumer confidence. It shows the performance of the retail sector in the short term. Generally speaking, the positive economic growth anticipates bullish movements for the CAD.
Economist at UOB Group Lee Sue Ann assesses the latest inflation figures in New Zealand.
Key Takeaways
“CPI climbed 1.7% q/q in 1Q22, a tad lower from the 1.8% q/q in 1Q22, but above expectations for a gain of 1.5% q/q. Compared to the same period a year ago, CPI advanced 7.3% y/y, an acceleration from 6.9% y/y in 1Q22. The outcome was also above expectations for a reading of 7.1% y/y.”
“Overall, the inflationary backdrop is very uncertain, with global inflationary pressures remaining intense. Although today’s readings could represent a peak, we now expect inflation to reach 5.9% for this year (compared to 5.5% previously), before easing towards 2.4% in 2023.”
“There are three more monetary policy meetings for this year – 17 Aug, 5 Oct and 23 Nov. We now see the Reserve Bank of New Zealand (RBNZ) raising rates by 50bps in Aug and again in Oct and Nov, bringing the OCR to 4.00% by year-end (3.75% previously).”
- EUR/USD reverses the post-ECB advance to the 1.0280 region.
- German, EMU, France Manufacturing PMIs drop below 50 in July.
- Investors started to pencil in a couple of 50 bps rate hikes.
Following Thursday’s advance to the proximity of the 1.0300 neighbourhood – or 2-week highs – EUR/USD gives away all of those gains at the end of the week on the back of the resumption of the buying interest surrounding the greenback and dwindling enthusiasm in the wake of the ECB event.
ECB: Further tightening remains well in place
EUR/USD comes under selling pressure on Friday, as market participants seem to have already digested the unexpected ECB 50 bps rate hike, while others appear to have sold the uptick ahead of the weekend and the upcoming FOMC gathering on July 27. However, another test of the parity zone does not look favoured now, as the central bank expects inflation to remain elevated and therefore the door remains open to further hikes at the next couple of meetings (September and October). On this, a 50 bps raise appears on the cards, while speculation of a 50 bps/75 bps hike in October already runs high.
PMIs slipped back to the contraction region
Friday’s offered stance in EUR/USD also gathers extra pace after advanced figures now see the Manufacturing PMIs in the core Euroland (Germany, France and the whole bloc) slipping back to the contraction territory (<50) for the month of July. Despite these readings could fan the flames around a potential recession in the euro area, the “obsession” of the ECB to bring down inflation to the bank’s 2% goal should leave prospects for further tightening well in place for the time being.
The dollar and Ukraine keep weighing on sentiment
Looking at the broader picture, the outlook for the greenback still looks constructive despite occasional bouts of weakness and remains well propped up by the Fed’s normalization plans. In addition, the war in Ukraine and the idea that the spectre of the energy crunch could extend further and hurt the economies in the old continent emerges as a tangible risk for the euro and a solid source of extra weakness in the near term.
Short-term Technical Outlook
The post-ECB high at 1.0280 now emerges as the initial barrier for EUR/USD in case of the resumption of the buying bias. North from here comes the temporary 55-day SMA at 1.0457, which precedes the 5-month resistance line in the 1.0500 neighbourhood. If the pair manages to clear the latter on a sustainable fashion, then it could open the door to extra rebound to, initially, the weekly top at 1.0615 (June 27). If bears push harder, then there are no contention levels of note until the parity zone ahead of the 2022 low at 0.9952 (July 14).
- AUD/USD attracted some dip-buying on Friday, though the uptick lacked any follow-through.
- Recession fears revived demand for the safe-haven USD and capped the risk-sensitive aussie.
- The mixed fundamental backdrop warrants some caution before placing fresh directional bets.
The AUD/USD pair reversed an intraday dip to sub-0.6900 levels and inched back closer to a nearly four-week high touched earlier this Friday. The pair was last seen trading around the 0.6920 region during the first half of the European session.
The minutes from the Reserve Bank of Australia policy meeting released on Tuesday indicated that further increases in interest rates will be needed to return inflation to the target over time. This, to a larger extent, helped offset the downbeat Australian PMI prints and assisted the AUD/USD pair to attract some dip-buying on the last day of the week.
That said, growing fears about a possible recession acted as a headwind for the risk-sensitive aussie. The markets worries were reaffirmed by the prevalent cautious mood around the equity markets, which revived demand for the safe-haven US dollar. This was seen as another factor that contributed to keeping a lid on any meaningful gains for the AUD/USD pair.
The global flight to safety, meanwhile, led to a further decline in the US Treasury bond yields. This, along with receding bets for a 100 bps rate hike by the Federal Reserve in July, could cap the USD and offer some support to the AUD/USD pair. The mixed fundamental backdrop, however, warrants some caution before placing aggressive directional bets.
Market participants now look forward to the US economic docket, featuring the release of the flash US PMI prints for July. Apart from this, the US bond yields, will influence the USD price dynamics and provide some impetus to the AUD/USD pair. Traders will further take cues from broader market risk sentiment to grab short-term opportunities.
Technical levels to watch
“The purchasing managers' indices for July show that the significant rise in energy prices and ongoing supply chain problems are leaving deep skid marks on the economy,” writes Christoph Weil, Senior Economist at Commerzbank.
Key Quotes:
“The massive rise in consumer prices has torn large holes in the pockets of private households and noticeably curbed their propensity to spend. The services sector is feeling the full force of this. Activity in this sector is increasing only slightly.”
“Demand for industrial products is also declining. As a result of weaker demand, pressure on supply chains appears to be easing. In addition, weaker demand is reducing the scope for companies to raise selling prices.”
“This will strengthen the position of the doves in the ECB Governing Council, who are more likely to seek a slower tightening of monetary policy, especially as there are signs that the inflation push may soon reach its peak.”
“Turkey's economic situation continues to offer a stark contrast, with resilient growth on one hand and soaring inflation, dwindling foreign exchange reserves and a depreciating lira on the other. In short, the reed bends but does not break,” economists at BNP Paribas note.
Additional quotes
“In a previous edition, at the beginning of the year, we mentioned the peculiar economic situation in Turkey. It is still the case. Growth still resists. It was plus 1.2% in the first quarter compared to the previous quarter.”
“At the same time, inflation has continued to accelerate, 5.1% per month on average between February and June, to reach a peak of 78.6% YoY.”
“Other estimates even mention a triple digit inflation rate. “
“In parallel, foreign reserves have decreased by approximately 28 billion dollars since late November due to the rising energy bills and portfolio investments outflows.
“The lira has depreciated by approximately 20% against a euro-dollar basket.”
Nick Kounis, Head of Financial Markets and Sustainability Research at ABN Amro, outlined the key features of the ECB's new Transmission Protection Instrument (TPI), designed to fight against excessive widening of spreads.
Key Quotes:
Subject to conditions the Eurosystem will be able to make secondary market purchases of securities issued in jurisdictions experiencing a deterioration in financing conditions not warranted by country-specific fundamentals.
The scale of TPI purchases would depend on the severity of the risks facing monetary policy transmission. Purchases are not restricted ex ante.
TPI purchases would be focused on public sector securities with a remaining maturity of between 1-10 years. Purchases of private sector securities could be considered, if appropriate. The Eurosystem will accept the same (pari passu) treatment as private or other creditors.
The eligibility criteria include compliance with the EU fiscal framework, absence of severe macroeconomic imbalances, public debt sustainability and sound and sustainable macroeconomic policies.
The ECB will avoid potential interference with the appropriate monetary policy stance by addressing the implications of the TPI purchases for the scale of the aggregate Eurosystem monetary policy debt security portfolio, and the amount of excess liquidity. This implies the programme will be sterilised.
PEPP reinvestment flexibility will continue to be the first line of defence to counter risks to the transmission mechanism.
European Central Bank (ECB) policymaker and Slovak central bank Governor Peter Kazimir said on Friday, “interest rate hike is first of a series of similar steps needed to tame inflation risks.”
Additional quotes
Economic development in eurozone and elsewhere will determine by how much we raise rates in September and beyond.
It is possible to expect 25 or 50 bps hike in September.
It will take a while to get inflation to desired levels.
I would wish we never have to use transmission protection instrument but we will see.
A lot will depend how governments tackle origins of imbalances and fragmentation.
Market reaction
EUR/USD is on a minor recovery mode while Kazimir speaks on the ECB’s policy decision. At the press time, the pair is trading at 1.0163, still down 0.62% on the day.
- USD/CAD bounced off the 1.2855-1.2850 confluence support, though lacked follow-through.
- Resurgent USD demand turned out to be a key factor that acted as a tailwind for the major.
- An uptick in oil prices offered some support to the loonie and capped any meaningful upside.
The USD/CAD pair once again managed to defend and attract some buying near the 1.2855-1.2850 confluence support on the last day of the week. The uptick, however, lacked any follow-through and ran out of steam ahead of the 1.2900 round-figure mark.
The US dollar was back in demand and shot to a multi-day high, which, in turn, was seen as a key factor that acted as a tailwind for the USD/CAD pair. That said, an uptick in crude oil prices underpinned the commodity-linked loonie and capped spot prices.
From a technical perspective, the aforementioned confluence support comprises the 50-day SMA and the 50% Fibonacci retracement level of the 1.2517-1.3223 rally. This is followed by the 1.2830-1.2820 area and the 1.2800-1.2790 region, or the 61.8% Fibo. level.
The latter should act as a key pivotal point, which if broken would be seen as a fresh trigger for bearish traders and make the USD/CAD pair vulnerable. The downward trajectory could then accelerate towards the 1.2700 mark en-route the 1.2675-1.2665 horizontal support.
On the flip side, momentum beyond the 1.2900 mark is likely to confront resistance near the overnight swing high, around the 1.2935 region, ahead of the 38.2% Fibo. level, around the 1.2960 area. Some follow-through buying would suggest that the recent corrective pullback from the YTD peak has run its course and pave the way for additional gains. The USD/CAD pair might then aim to surpass the 1.3000 psychological mark and retest the 1.3075-1.3085 supply zone, coinciding with the 23.6% Fibo. level.
USD/CAD daily chart
-637940776920644730.png)
Key levels to watch
FX option expiries for July 22 NY cut at 10:00 Eastern Time, via DTCC, can be found below.
- EUR/USD: EUR amounts
- 1.000 405m
- 1.0050 553m
- 1.0080-85 928m
- 1.0100 406m
- 1.0140-50 1.03b
- 1.0200 574m
- 1.0300 623m
- USD/JPY: USD amounts
- 137.55 230m
- 139.00 630m
- 140.00 990m
- 141.00 500m
- AUD/USD: AUD amounts
- 0.6800 1.24b
- 0.6830 290m
- 0.6900 1.21b
- USD/CAD: USD amounts
- 1.2900 925m
- 1.3000 602m
- 1.2955-60 596m
- 1.2975-80 391m
- 1.3000 602m
- 1.3100 525m
- EUR/GBP: EUR amounts
- 0.8750 780m
- EUR/JPY: EUR amounts
- 139.00 201m
- 141.00 485m
- 143.00 478m
Further upside momentum could lift USD/CNH to the 6.8000 area in the next weeks, noted FX Strategists at UOB Group Lee Sue Ann and Quek Ser Leang.
Key Quotes
24-hour view: “We expected USD to ‘strengthen further’ yesterday but we were of the view that ‘any advance is expected to face solid resistance at 6.7910’. USD subsequently rose to 6.7880 before dropping back down quickly. The price actions appear to be part of a consolidation and USD is likely to trade between 6.7630 and 6.7910 for today.”
Next 1-3 weeks: “There is not much to add to our update from yesterday (21 Jul, spot at 6.7740). As highlighted, after the strong advance on Wednesday, upward momentum has been boosted and we see room for USD to rise to 6.8000. Only a break of 6.7400 (no change in ‘strong support’ level from yesterday) would indicate that the current upward pressure that started more than a week ago has dissipated.”
- The index posts decent gains beyond the 107.00 mark.
- US yields extend the decline across the curve on Friday.
- Flash Manufacturing/Services PMIs next on tap in the docket.
The greenback, in terms of the US Dollar Index (DXY), leaves behind Thursday’s pullback and regains the area beyond 107.00 the figure at the end of the week.
US Dollar Index now looks to data, FOMC
The index extends the erratic performance so far this week and advances north of the 107.00 yardstick, as market participants seen to have already digested the start of the hiking cycle by the ECB on Thursday.
Contrasting with the upbeat tone in the buck, yields in the US cash markets continue their march south and already navigate in multi-session lows across the curve ahead of the key FOMC event due on July 27.
In the NA session, the advanced Manufacturing and Services PMIs for the month of July will be the only releases of note later in the NA session.
What to look for around USD
The index looks side-lined in the 107.00 neighbourhood amidst a broad-based range bound theme so far this week.
In the meantime, the dollar remains underpinned by the Fed’s divergence vs. most of its G10 peers (especially the ECB) in combination with bouts of geopolitical effervescence and the re-emergence of the risk aversion among investors. On the flip side, market chatter of a potential US recession could temporarily undermine the uptrend trajectory of the dollar somewhat.
Key events in the US this week: Flash PMIs (Friday).
Eminent issues on the back boiler: Hard/soft/softish? landing of the US economy. Escalating geopolitical effervescence vs. Russia and China. Fed’s more aggressive rate path this year and 2023. US-China trade conflict. Future of Biden’s Build Back Better plan.
US Dollar Index relevant levels
Now, the index is up 0.49% at 107.12 and faces next contention at 106.38 (weekly low July 20) followed by 103.67 (weekly low June 27) and finally 103.41 (weekly low June 16). On the other hand, a break above 109.29 (2022 high July 15) would expose 109.77 (monthly high September 2002) and then 110.00 (round level).
Responding to some questions about the European Central Bank’s (ECB) rate hike path, the central bank’s policymaker Pablo Hernandez de Cos said that “we will see about September, adding that “we are data dependent.”
Additional quotes
Political situation in Italy was not behind the creation of TPI.
The most significant part of TPI is its creation.
Maintaining homogeneous financial conditions in euro zone is prerequisite for financial stability.
We will see about future interest rates increases in September, we are data dependent.
ECB future decisions hinge on economic data.
Related reads
- EUR/GBP keeps the red post-Eurozone/UK PMIs, bears flirt with 0.8500 mark
- ECB SPF survey sees rise in short- and long-term inflation expectations
- EUR/GBP witnessed some selling on Friday and has now erased the overnight post-ECB gains.
- The risk of a sovereign debt crisis, recession fears exerted pressure on the shared currency.
- Bets for a 50 bps BoE rate hike in August underpinned sterling and added to the selling bias.
The EUR/GBP cross extended the overnight pullback from the post-ECB swing high to the 0.8585 region, or the highest level since July 6 and witnessed some follow-through selling on Friday. The retracement slide extended through the early European session, though spot prices showed some resilience below the 0.8500 psychological mark.
The shared currency's relative underperformance comes amid the lack of specific details, conditionality and what would justify the activation of the ECB's anti-fragmentation tool. Adding to this, the recent widening of the Italian-German government bond yield spread has raised the risk of a sovereign debt crisis. This, along with mounting recession fears, overshadowed the ECB's jumbo 50 bps rate hike on Thursday, which continued undermining the euro and exerted downward pressure on the EUR/GBP cross.
The intraday selling picked up pace following the disappointing release of the Eurozone PMI prints. The preliminary manufacturing activity report from S&P Global/BME research showed that the downturn in the German manufacturing and services sectors gathered pace in July. In fact, The Manufacturing PMI in Eurozone’s economic powerhouse slumped to 25-month lows and the Services PMI dropped to the lowest level in seven months. Furthermore, the Eurozone Manufacturing PMI also unexpectedly contracted in July.
On the other hand, the British pound drew support from better-than-expected flash UK PMI prints for July. Apart from this, the rising possibility of a 50 bps rate hike by the Bank of England in August was seen as another factor that underpinned sterling. This, in turn, supports prospects for a further near-term depreciating move, suggesting that any meaningful still seems elusive.
Technical levels to watch
- UK Manufacturing PMI eases to 52.2 in July, beats estimates.
- Services PMI in the UK comes in at 53.3 in July, better than forecasts.
- GBP/USD keeps the rebound intact at around 1.2050 on upbeat UK PMIs.
The seasonally adjusted S&P Global/CIPS UK Manufacturing Purchasing Managers’ Index (PMI) dropped to 52.2 in July versus 52.0 expected and 52.8 – June’s final reading.
Meanwhile, the Preliminary UK Services Business Activity Index for July arrived at 53.3 when compared to June’s final score of 54.3 and 53.0 expected.
Chris Williamson, Chief Business Economist at S&P Global, commented on the survey
“UK economic growth slowed to a crawl in July, registering the slowest expansion since the lockdowns of early-2021. Although not yet in decline, with pent-up demand for vehicles and consumer-oriented services such as travel and tourism helping to sustain growth in July, the PMI is now at a level consistent with just 0.2% GDP growth.“
“Forward-looking indicators suggest worse is to come. Manufacturing order books are now deteriorating for the first time in one and a half years as inflows of new work are insufficient to keep workforces busy, which is usually a precursor to output and jobs being cut in coming months."
FX implications
Better than forecast UK business PMIs enable the GBP/USD pair to maintain its rebound near 1.1950. The pair is losing 0.36% on the day.
USD/JPY is now expected to navigate within 136.60-139.00 range in the next weeks, noted FX Strategists at UOB Group Lee Sue Ann and Quek Ser Leang.
Key Quotes
24-hour view: “While we expected USD to strengthen yesterday, we were of the view that ‘a sustained rise above 138.60 is unlikely’. USD subsequently rose to a high of 138.87 before staging a surprisingly sharp sell-off (low of 137.28 during late NY session). The rapid drop could extend but in view of the oversold conditions, the major support at 136.60 is unlikely to come under threat (there is another support at 137.00). On the upside, a breach of 137.95 (minor resistance is at 137.60) would indicate that USD is unlikely to weaken further.”
Next 1-3 weeks: “We highlighted on Wednesday (20 Jul, spot at 138.15) that the recent upward pressure has eased and we expected USD to consolidate and trade between 136.60 and 139.40. USD rose to a high of 138.87 yesterday (21 Jul) before dropping sharply. The underlying tone has weakened somewhat but we continue to expect USD to consolidate for now, albeit likely within a narrower range of 136.60/139.00. Looking ahead, if USD breaks clearly below 136.60, it could trigger a deep pullback.”
In its quarterly Survey of Professional Forecasters (SPF), the European Central Bank (ECB) expects Eurozone short- and long-term inflation expectations higher.
Key takeaways
Sees 2022 inflation at 7.3% vs 6.0% seen 3 months ago; 2023 seen at 3.6% vs 2.4%.
Sees 2024 inflation at 2.1% vs 1.9% 3 months ago; longer-term seen at 2.2% vs 2.1%.
2022 GDP growth seen at 2.8% vs 2.9% forecast 3 months ago, 2023 seen at 1.5% vs 2.3%.
Longer-term core inflation expectations rise to 2.2% from 1.9%.
Intensifying energy price pressures, tightening of monetary policy, weakening of household purchasing power a drag on growth.
Separately, European Central Bank (ECB) Governing Council member Madis Muller said on Friday that the time of negative interest rates in the euro area is over.
Also read: Eurozone Preliminary Manufacturing PMI slumps to 49.6 in July vs. 51.0 expected
Market reaction
Amidst renewed concerns over an imminent recession in the bloc, EUR/USD is losing 0.82% on the day to trade at 1.0142, as of writing.
- Eurozone Manufacturing PMI arrives at 49.6 in July vs. 51.0 expected.
- Bloc’s Services PMI falls to 50.6 in July vs. 52.0 expected.
- EUR/USD keeps the red near 1.0140 on the downbeat Eurozone PMIs.
The Eurozone manufacturing sector activity unexpectedly contracted in July, the latest manufacturing activity survey from S&P Global research showed on Friday.
The Eurozone Manufacturing purchasing managers index (PMI) arrived at 49.6 in July vs. 51.0 expectations and 52.1 last. The index hit a 25-month low.
The bloc’s Services PMI dropped sharply to 50.6 in July vs. 52.0 expected and 53.0 prior. The indicator reached 15-month lows.
The S&P Global Eurozone PMI Composite slumped to 49.4 in July vs. 51.0 estimated and 52.0 previous. The gauge clocked its lowest level in 17 months.
Comments from Chris Williamson, Chief Business Economist at S&P Global
“The eurozone economy looks set to contract in the third quarter as business activity slipped into decline in July and forward-looking indicators hint at worse to come in the months ahead.”
“Excluding pandemic lockdown months, July’s contraction is the first signalled by the PMI since June 2013, indicative of the economy contracting at a 0.1% quarterly rate. Although only modest at present, a steep loss of new orders, falling backlogs of work and gloomier business expectations all point to the rate of decline gathering further momentum as the summer progresses.”
FX implications
EUR/USD remains heavily offered near 1.0140 on dismal euro area PMIs. The spot is down 0.90% on the day. Recession bells in the euro area now sound load and clear.
Spanish Economy Minister Nadia María Calviño expresses her take on the European Central Bank’s (ECB) July monetary policy decision.
Key quotes
ECB’s tools to keep government bonds' spreads down are adequate.
Forecasts show inflation remained high in July.
Market reaction
The above comments have little to no impact on the euro. At the time of writing, EURUSD price is trading at 1.0136, losing 0.89% on a daily basis.
- USD/JPY bounced off the 137.00 mark, or a one-and-half-week low touched earlier this Friday.
- The narrowing US-Japan bond yield differential, the caution mood benefitted the safe-haven JPY.
- The divergent Fed-BoJ policy stance supports prospects for a further near-term appreciating move.
The USD/JPY pair attracted some dip-buying near the 137.00 mark, or over a one-week low touched this Friday and reversed a major part of the overnight decline. The intraday uptick, however, faltered just ahead of the 138.00 mark during the early European session.
The overnight sharp decline in the US Treasury bond yields resulted in the narrowing of the US-Japan rate differential, which benefitted the Japanese yen and acted as a headwind for the USD/JPY pair. The US economic data released on Thursday pointed to signs of a weakened trend in the economy. Adding to this, a White House statement said that President Joe Biden tested positive for COVID-19. This, in turn, drove some haven flows and exerted heavy downward pressure on the US bond yields.
Furthermore, growing fears about a possible recession continued weighing on investors' sentiment, which was evident from the prevalent caution mood around the equity markets. Apart from this, an upward revision of Japan's core CPI, to 1% from the prior release of 0.8%, offered some support to the safe-haven JPY and capped the USD/JPY pair. That said, a big divergence in the monetary policy stance adopted by the Bank of Japan and the Federal Reserve should help limit the downside.
In fact, the BoJ defied the global tightening trend and stuck to its ultra-easy policy settings on Thursday. The central bank reiterated its commitment to continue buying the Japanese Government Bonds (JGB) at an annual pace of around ¥80 trillion. In contrast, the Fed is all but set to deliver another 75 bps rate hike at its upcoming policy meeting on July 26-27. Moreover, investors seem convinced that the US central bank would need to tighten its policy at a faster pace to curb soaring inflation.
The fundamental backdrop supports prospects for the resumption of the prior strong upward trajectory. The lack of strong buying interest, however, could be seen as the first sign of possible bullish exhaustion amid growing recession fears. This makes it prudent to wait for sustained strength beyond the 138.25-138.30 region before positioning for any further near-term appreciating move. Traders now look forward to the release of the US PMI prints for a fresh impetus on the last day of the week.
Technical levels to watch
European Central Bank (ECB) policymaker Francois Villeroy de Galhau speaks about the central bank’s new anti-fragmentation tool announced on Thursday.
Key quotes
“There are no limits to purchases with TPI mechanism.”
“ECB will be as determined in activating TPI if necessary.”
“TPI decision shows unity and unlimited commitment to the euro.”
“Frontloading rate hikes do not mean terminal rate will be higher.”
Market reaction
EUR/USD extends its sell-off after the French and German PMIs disappointed and revived recession fears. The pair is currently trading at 1.0130, down 0.94% on the day.
- German Manufacturing PMI arrives at 49.2 in July vs. 50.6 expected.
- Services PMI in Germany drops to 49.2 in July vs. 51.2 expected.
- EUR/USD drops towards 1.0150 on downbeat German PMIs.
The German manufacturing and services sectors entered into contraction in July as the downturn gathered pace, the preliminary manufacturing activity report from S&P Global/BME research showed this Friday.
The Manufacturing PMI in Eurozone’s economic powerhouse came in at 49.2 this month vs. 50.6 expected and 52.0 prior. The index slumped to 25-month lows.
Meanwhile, Services PMI dropped from 52.4 booked previously to 49.2 in July as against the 51.2 estimated. The PMI hit the lowest level in seven months.
The S&P Global/BME Preliminary Germany Composite Output Index arrived at 48.0 in July vs. 50.1 expected and June’s 51.3. The gauge reached 25-month troughs.
Key comments from Phil Smith, Economics Associate Director at S&P Global
“Having enjoyed a growth boost from the previous easing of virus-related restrictions, a collision of various headwinds in July served to push the German economy into contraction territory for the first time in 2022 so far.”
“Ongoing supply-delays and the uncertainty caused by the war in Ukraine continued to be reported as factors weighing on company performance, but based on a reading of anecdotal evidence, inflation and the pressures these are having on budgets was a noticeable feature behind the worst performance of private sector activity since the height of the first pandemic wave in the spring of 2020. With this in mind, whilst we are seeing a downward trend in our price indices, inflation rates remain stubbornly elevated according to the July survey.”
FX implications
EUR/USD is holding the lower ground near 1.0144, down 0.81% on the day. The spot lost 40-pips in a quick reaction to the downbeat German PMIs, which lift odds of an imminent recession.
- Silver struggled to gain any meaningful traction and remained below the $19.00 mark.
- Mixed oscillators on hourly/daily charts warrant some caution for aggressive traders.
- Strength beyond mid-$19.00s would suggest that the XAG/USD has formed a bottom.
Silver failed to capitalize on the overnight goodish rebound from the $18.25 area, or a multi-day low and remained below the $19.00 mark through the early European session on Friday.
Sustained strength beyond the aforementioned handle could trigger a fresh bout of a short-covering and lift the XAG/USD towards the $19.40-$19.50 strong horizontal resistance. Some follow-through buying would suggest that the white metal has formed a near-term base and pave the way for some meaningful recovery from a two-year low touched last week.
The XAG/USD could then aim back to reclaim the $20.00 psychological mark. The momentum could further get extended and push spot prices to the next relevant barrier near the $20.55-$20.60 region. The latter marks a strong horizontal support breakpoint and should act as a pivotal point, which if cleared decisively would set the stage for additional gains.
Positive technical indicators on hourly charts, meanwhile, support prospects for some intraday gains. That said, oscillators on the daily chart are still holding deep in the negative territory. This, in turn, warrants some caution for aggressive bullish traders and suggests that any meaningful move up could attract fresh selling at higher levels.
On the flip side, the $18.50 horizontal zone now seems to protect the immediate downside ahead of the overnight swing low, around the $18.25 region. This is closely followed by the YTD low, around the $18.15 area and the $18.00 mark. A convincing break below the latter would make the XAG/USD vulnerable to extending the recent downward trajectory.
The subsequent fall has the potential to drag spot prices towards the $17.45-$17.40 intermediate support en-route to the $17.00 round-figure mark. The bearish trend could further get extended and the XAG/USD could eventually drop to test the next relevant support near the $16.70-$16.60 region.
Silver 4-hour chart
-637940702076426203.png)
Key levels to watch
- WTI snaps two-day downtrend inside immediate triangle, grinds higher of late.
- 200-EMA, two-week-old descending trend line restricts immediate upside.
- Bullish MACD signals, sustained bounce off $94.12 favor buyers.
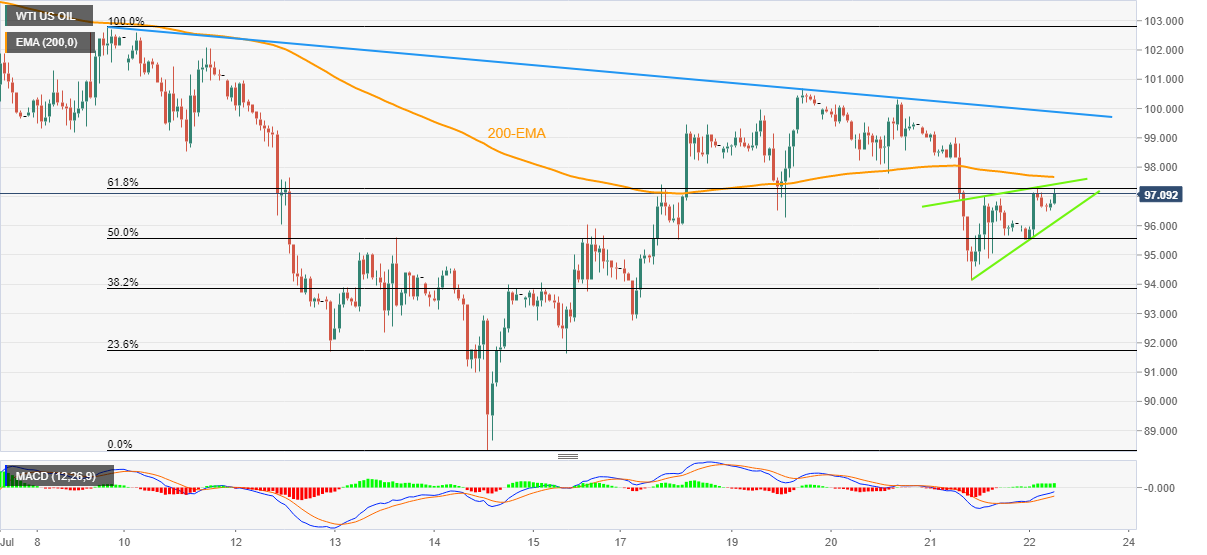
WTI grinds higher around the daily tops near $97.00 as it snaps a two-day downtrend during early Friday morning in Europe. In doing so, the black gold remains firmer inside an immediate ascending triangle formation.
Given the bullish MACD signals and the quote’s recent bounce off $94.10, buyers are likely to keep the reins.
However, a successful break of the two-week-old resistance line, near the $100.00 threshold, appears necessary for the WTI bull’s conviction.
That said, the aforementioned triangle’s resistance line and the 200-EMA, respectively around $97.45 and $97.70, guard the quote’s immediate upside.
In a case where the black gold rises past $100.00, the July 08 swing high near $102.80 and the monthly high of $109.53 could gain the market’s attention.
Alternatively, pullback moves need validation from the lower line of the stated triangle, at $96.10 by the press time.
Following that, a downward trajectory towards the $94.00 and 23.6% Fibonacci retracement of July 08-14 downside, near $91.75, can’t be ruled out.
It should be noted that the WTI’s weakness past $91.75, could make it vulnerable to refresh monthly low, close to $88.30 at the latest.
WTI: Hourly chart
Trend: Further recovery expected
Here is what you need to know on Friday, July 22:
Although the euro gathered strength following the European Central Bank's (ECB) decision to hike its key rates by 50 basis points, it lost its bullish momentum early Friday amid the negative shift witnessed in risk sentiment. The US Dollar Index edges higher toward 107.00 in the European session and US stock index futures are down between 0.3% and 0.8%. S&P Global will release the flash Manufacturing and Services PMI surveys for Germany, the euro area, the UK and the US on Friday. The Canadian economic docket will feature May Retail Sales data.
In addition to the double-dose rate increase, the ECB unveiled its new anti-fragmentation tool called the Transmission Protection Instrument (TPI). The bank also abandoned forward guidance by noting that every meeting will be live and that they will assess the data when making a decision. ECB President Christine Lagarde refrained from sharing key details regarding the TPI during the press conference. Meanwhile, Italian President Sergio Mattarella has dissolved the Italian parliament, triggering a snap election on September 25.
After having advanced toward 1.0300, EUR/USD erased a portion of its daily gains and closed in positive territory near 1.0250 on Thursday. The pair trades near 1.0200 early Friday.
GBP/USD closed virtually unchanged near 1.2000 on Thursday but started to push lower toward 1.1950 on Friday. The data published by the UK's Office for National Statistics showed earlier in the day that Retail Sales declined by 0.1% on a monthly basis in June. In 12 months to June, sales were down 5.8%, compared to the market expectation for a contraction of 5.3%.
Pressured by the sharp decline witnessed in US Treasury bond yields, USD/JPY fell to its lowest level in over a week near 137.00 but managed to reverse its course ahead of the weekend. With the benchmark 10-year US Treasury bond yield holding in positive territory following Thursday's 5% drop, the pair rises toward 138.00. The Japanese Finance Minister, Shunichi Suzuki, said on Friday that hiking rates could knock the economy's recovery, signalling support for the Bank of Japan's stance to keep monetary stimulus despite a global tightening trend amid rising inflation.
Gold finally capitalized on falling yields on Thursday and rose toward $1,720. XAUUSD stays relatively quiet near that level on Friday and clings to modest weekly gains.
Bitcoin continues to move sideways near $23,000 after having closed the previous two days virtually unchanged. Ethereum pushes higher toward $1,600 early Friday following Thursday's 3.5% gain.
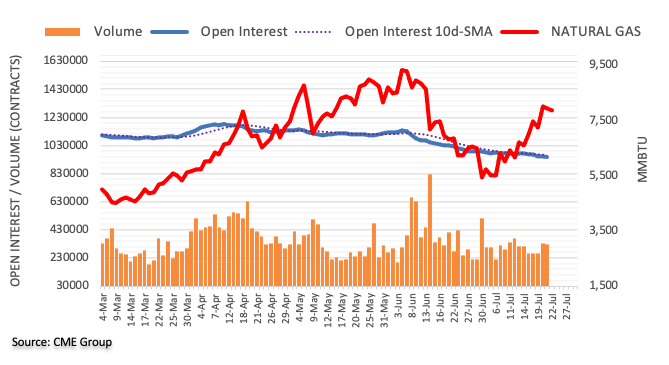
Open interest in natural gas futures markets shrank by around 3.2K contracts on Thursday, reversing the previous build considering advanced prints from CME Group. Volume followed suit and dropped by nearly 10K contracts after three consecutive daily builds.
Natural Gas could attempt some consolidation near term
Prices of natural gas briefly surpassed the $8.00 mark per MMBtu on Thursday, although the commodity ended the session with modest losses in the middle of the daily range. The drop was amidst shrinking open interest and volume and exposes some consolidation ahead of a potential corrective downside in the very near term.
- GBP/JPY struggles to defend the first daily gains in three.
- UK Retail Sales prints mixed details in June, ex-Fuel figures on MoM jumped.
- 100-HMA, two-day-old resistance line guards immediate upside.
- 50%, 61.8% Fibonacci retracement levels act as additional downside filters.
GBP/JPY buyers struggle to keep the first daily gains in three after the UK Retail Sales printed mixed figures for June. That said, the cross-currency pair grinds higher around 164.90 during the early Friday morning in Europe.
UK Retail Sales for June improved more than -0.3% expected and -0.8% prior to -0.1% MoM. A core version of the key British data, i.e. Retail Sales ex-Fuel, reverses the -0.4% market consensus and -0.1% previous readings to 0.4% positive figures.
Also read: UK Retail Sales fall 0.1% MoM in June vs. -0.3% expected
Technically, firmer MACD signals join the quote’s successful trading above the 200-HMA to keep buyers hopeful.
However, the 100-HMA and a downward sloping resistance line from Wednesday, respectively around 165.40 and 165.80, could prone the GBP/JPY upside before directing them to the weekly high of 166.25.
Alternatively, pullback moves remain elusive until staying beyond 200-HMA level of 164.50.
Even so, the 50% and 61.8% Fibonacci retracement of July 12-20 upside, near 164.00 and 163.00 in that order, could challenge the GBP/JPY bears before giving them controls.
GBP/JPY: Hourly chart
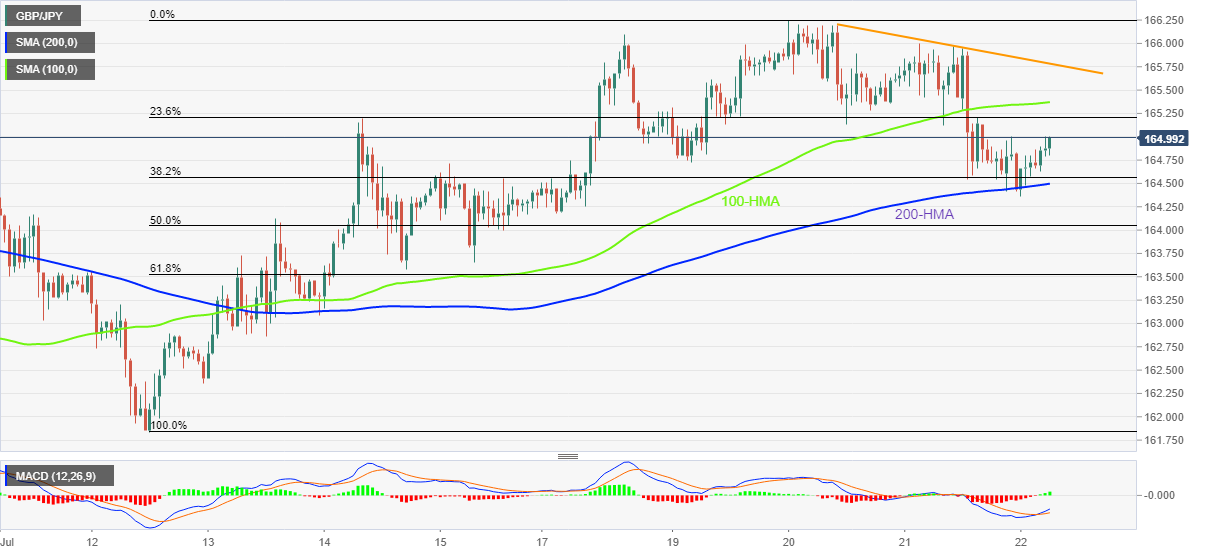
Trend: Further upside expected
There is still room for extra gains in AUD/USD, although a convincing break above 0.6975 appears unlikely, suggested FX Strategists at UOB Group Lee Sue Ann and Quek Ser Leang.
Key Quotes
24-hour view: “Yesterday, we expected AUD to ‘trade sideways within a range of 0.6850/0.6920’. However, after dipping to a low of 0.6860, AUD staged a sharp advance to 0.6940. Despite the rapid rise, upward momentum has not improved by much. That said, AUD could rise to 0.6950 first before a pullback is unlikely. The major resistance at 0.6975 is unlikely to come into the picture. Support is at 0.6905 followed by 0.6885.”
Next 1-3 weeks: “Our latest narrative was from Wednesday (20 Jul, spot at 0.6905) where the strong boost in momentum is likely to lead to further AUD strength to 0.6975. While AUD rose to a high of 0.6940 yesterday, upward momentum has not improved by much. However, as long as 0.6840 (‘strong support’ level was at 0.6820 yesterday) is not breached, AUD could still advance to 0.6975. At this stage, the chance for a sustained rise above this level is not high.”
CME Group’s flash data for crude oil futures markets noted traders added more than 11K contracts to their open interest positions on Thursday. On the other hand, volume retreated for the second session in a row, this time by around 27.9K contracts.
WTI could retest $96.50
Prices of the barrel of the WTI printed the second consecutive drop on Thursday on the back of rising open interest. Against that, the commodity could extend the downtrend with the immediate target at the 200-day SMA at $94.67 ahead of the July low at $96.46 (July 14).
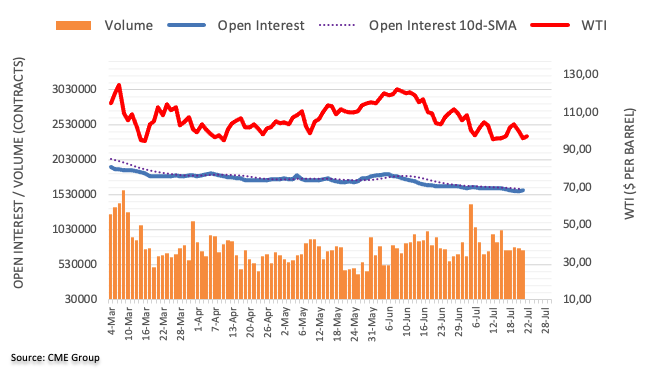
- GBP/USD takes offers to refresh intraday low on mixed UK Retail Sales data.
- UK Retail Sales for June improved on MoM but dropped on YoY for June.
- Risk-off mood, pre-Fed positioning helps US dollar to consolidate the first weekly loss in four.
- UK/US PMIs, UK politics will be important for fresh catalysts.
GBP/USD pays little heed to the UK’s Retail Sales figures for June as it holds lower ground near the intraday low following the data release. That said, the Cable pair refreshes daily lows around 1.1960 heading into Friday’s London open.
UK Retail Sales for June improved more than -0.3% expected and -0.8% prior to -0.1% MoM. That said, a core version of the key British data, i.e. Retail Sales ex-Fuel, reverses the -0.4% market consensus and -0.1% previous readings to 0.4% positive figures.
Also read: UK Retail Sales fall 0.1% MoM in June vs. -0.3% expected
The cable pair’s inaction despite mostly firmer UK data could be linked to the market’s cautious mood ahead of the preliminary US S&P Global PMIs for July, as well as the next week’s Federal Open Market Committee (FOMC). Furthermore, Hong Kong’s market intervention and fears of economic slowdown in China’s 2022 GDP growth, as signaled by the Asian Development Bank (ADB), also exert downside pressure on the GBP/USD prices, due to its trade links with Beijing.
It’s worth mentioning that political deadlock in the UK, due to the impending final announcement of the Tory leader, scheduled for September, also exerts downside pressure on the GBP/USD prices. Furthermore, the European Union’s (EU) dislike for Foreign Minister Liz Truss, due to her Brexit role, also raises challenges for the pair traders as ex-Chancellor Rishi Sunak has little support due to his resistance to tax cuts.
Moving on, GBP/USD traders should pay attention to the S&P Global PMIs for the UK for July. If the UK activity data came in softer, the pair may extend its latest weekly rebound. However, odds are high in favor of the hawkish Fed and the Cable pair’s a further weakness due to the US dollar’s safe-haven status.
Technical analysis
Unless crossing the 21-DMA hurdle surrounding 1.2020, GBP/USD remains vulnerable to testing the short-term horizontal support near 1.1930 before directing the bears towards the yearly low of 1.1760.
In the opinion of FX Strategists at UOB Group Lee Sue Ann and Quek Ser Leang, GBP/USD seems to have now moved into a consolidative phase, likely between 1.1890 and 1.2055.
Key Quotes
24-hour view: “Our expectations for GBP ‘edge higher’ was incorrect as it dropped sharply but briefly to 1.1891 before rebounding to end the day at 1.2004 (+0.20%). The rebound could extend to 1.2025, in view of the lackluster upward momentum, the major resistance at 1.2055 is unlikely to come into the picture. Support is at 1.1960 followed by 1.1920.”
Next 1-3 weeks: “Three days ago (19 Jul, spot at 1.1945), we held the view that the rebound in GBP could extend to 1.2055. GBP subsequently rose to 1.2044 but yesterday, it dropped below our ‘strong support’ level at 1.1915 (low of 1.1890). The breach of the ‘strong support’ indicates that upward momentum has eased. In other words, GBP is unlikely to rebound further. Instead, GBP appears to have moved into a consolidation phase and is likely to trade within a range of 1.1890/1.12055 for now. Looking ahead, GBP has to break clearly above 1.2055 before a sustained advance is likely.”
- Asian equities are mildly positive as a decent recovery in DXY has faded the risk-on mood.
- Japanese indices may face the heat of downward revision in the inflation-adjusted growth forecast.
- The Fed will highly likely announce a rate hike by 75 bps next week.
Markets in the Asian domain are trading mildly positive as the recovery in the US dollar index (DXY) has faded optimism derived from Wall Street gains recorded on Thursday. Better-than-expected earnings from Tesla and gains in tech stocks lifted the market sentiment. However, a sheer upside move in the DXY in the Asian session has faded optimism.
At the press time, Japan’s Nikkei225 gained 0.40%, Nifty50 added 0.21%, ChinaA50 remains subdued, while Hang Sang eased 0.22%.
The DXY has displayed a stellar recovery as investors have shifted their focus on monetary policy announcement by the Federal Reserve (Fed), which is due next week. No doubt, the investing community has ignored expectations of 100 basis points (bps) after a downward shift in long-run inflation expectations to 2.8% vs. 3.1% June print. However, the odds of a rate hike by 75 bps are still solid as price pressures have not shown any sign of exhaustion yet.
Meanwhile, the news wires from Nikkei Asia that the Japanese government is planning to scale down its inflation-adjusted economic growth forecast for fiscal 2022 to 2% from the former forecast of 3.2% may bring a steep fall in Japanese equities.
Also, Tokyo Governor Koike Yuriko has stated that the administration will record Coovid-19 cases again today. This has accelerated fears of the resurgence of Covid-19 in the Japanese economy.
Open interest in gold futures markets dropped by around 9.6K contracts on Thursday according to preliminary readings from CME Group. Volume, instead, went up for the second session in a row, this time by around 87.4K contracts.
Gold looks supported around $1,680
Thursday’s moderate rebound in prices of the ounce troy of gold was on the back of increasing open interest, leaving the prospects for further upside somewhat diminished. On the upside, there is a strong support around the $1,680 region, where also converges the 2021 low.
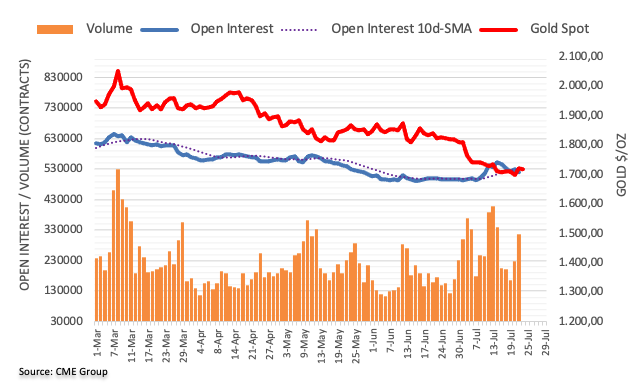
- The UK Retail Sales came in at -0.1% MoM in June, beat estimates
- Core Retail Sales for the UK rose by 0.4% MoM in June.
- The cable remains in the red below 1.2000 on the mixed UK data.
The UK retail sales arrived at -0.1% over the month in June vs. -0.3% expected and -0.8% previous. The core retail sales, stripping the auto motor fuel sales, stood at 0.4% MoM vs. -0.4% expected and -1.0% previous.
On an annualized basis, the UK retail sales plunged 5.8% in June versus -5.3% expected and -4.7% prior while the core retail sales fell by 5.9% in the reported month versus -6.3% expectations and -5.5% previous.
more to come ...
- AUD/USD refreshes intraday low, pares the biggest weekly gains in two months.
- Sluggish yields, hopes of Fed’s aggression favor DXY to consolidate the first weekly loss in four.
- Preliminary readings of the US PMIs for July will decorate calendar.
AUD/USD bears flirt with daily lows near 0.6900 amid a downbeat market mood heading into Friday’s European session. The Aussie pair’s weakness could also be linked to the downbeat PMI data at home and the US dollar’s consolidation of the first weekly loss in four.
The US Dollar Index (DXY) picks up bids to refresh its intraday high around 106.95, up 0.35% on a day, as sour sentiment joins sluggish yields to help the greenback pare latest losses. Even so, the DXY braces for the first weekly loss in four while extending the July 14 reversal from a nearly two-decade high. The greenback’s previous weakness could be linked to the US Treasury yields as the benchmark 10-year bond coupons marked the biggest daily slump since mid-June on Thursday, as well as eyes the second consecutive weekly loss.
The recent risk-aversion appears to take clues from cautious sentiment ahead of the preliminary US S&P Global PMIs for July, as well as the next week’s Federal Open Market Committee (FOMC). Furthermore, Hong Kong’s market intervention and fears of economic slowdown in China’s 2022 GDP growth, as signaled by the Asian Development Bank (ADB), also exert downside pressure on the AUD/USD prices, due to its trade links with Beijing.
Earlier in the day, Australia’s S&P Global Manufacturing PMI eased to 55.7 in July versus 56.2 prior and 56.4 expected. Further, the S&P Global Services PMI dropped to 50.4 during the stated month compared to 55.0 market consensus and 52.6 prior. Further, the S&P Global Composite PMI also declined to 50.6 versus 52.6 in previous readouts.
Amid these plays, Wall Street benchmarks closed firmer and the US Treasury 10-year Treasury yields marked the biggest daily slump in five weeks, down one basis point (bps) to 2.90% at the latest. That said, S&P 500 Futures drops 0.45% by the press time.
Looking forward, AUD/USD traders are likely to focus on the next week’s Fed meeting, especially after the European Central Bank’s (ECB) 0.50% rate hike. That said, today’s US PMI should print firmer numbers to recall the US dollar bulls.
Forecasts suggest that the US S&P Global Manufacturing PMI is expected to decline to 52.0 from 52.7 whereas its Services counterpart could ease to 52.6 from 52.7. With this, the Composite PMI may drop to 51.7 from 52.3 prior.
Technical analysis
AUD/USD sellers attack the weekly support line, at 0.6890 by the press time, a break of which could direct the quote towards May’s low near 0.6830. Alternatively, the 50-DMA hurdle surrounding 0.6975 appears an important resistance to watch for bulls during the Aussie pair’s further advances.
FX Strategists at UOB Group Lee Sue Ann and Quek Ser Leang still sees EUR/USD with chances of revisit the 1.0300 hurdle in the next few weeks.
Key Quotes
24-hour view: “Yesterday, we expected EUR to ‘trade sideways within a range of 1.0135/1.0235’. During London hours, EUR swung wildly between 1.0152 and 1.0278 before ending the day at 1.0228 (+0.50%). The volatile price actions have resulted in a mixed outlook. Further choppy movement is not ruled out, albeit likely within a narrower range of 1.0170/1.0275.”
Next 1-3 weeks: “We continue to hold the same view as from yesterday (21 Jul, spot at 1.0180). As highlighted, upward momentum has waned somewhat but there is still room for EUR to rise to 1.0300. At this stage, the chance for a sustained rise above this level is not high. On the downside, a breach of 1.0135 (‘strong support’ level was at 1.0115 yesterday) would indicate that the advance in EUR that started earlier this week has come to an end.”
- Gold price is in a corrective mode after a responsive buying action from near $1,680.00.
- The DXY is attempting to break the hurdle of 107.00.
- Monetary policy announcement by the Fed is in play now.
Gold price (XAUUSD) has shifted into a corrective phase in the Asian session after displaying a juggernaut vertical upside move on Thursday. The precious metal has faced barricades around $1,720.00 as the US dollar index (DXY) has remained upbeat on Friday. Earlier, the bright metal sensed a responsive buying action after printing a fresh 11-month low of $1,680.94. Usually, a responsive buying action indicates that investors have considered the asset a value bet and have channelized significant bids.
Meanwhile, the US dollar index (DXY) is advancing firmly higher in the Asian session. The DXY has displayed a bullish open-drive session in which the asset scales strongly higher right from the first tick of the trading session. The asset has reached near the critical hurdle of 107.00 and is likely to advance gains on it violation. Despite a firmer upside move, the asset is still inside the woods and is trading inside the wide range of 106.39-107.32 from Tuesday.
Also Read: Gold Price Forecast: Will XAUUSD sustain the recovery above $1,700?

Fed chair Jerome Powell to hike interest rates by 75 bps next week.
Fed seizes focus as more rate hikes look imminent
The Federal Reserve (Fed) is going to announce the interest rate decision next week. A light economic calendar, this week, kept the DXY’s dependency on other macro-economic events. The odds of a rate hike by 100 basis points (bps) have plunged after the release of the long-run inflation expectation on the lower side last week. However, runaway inflation still persists and chances of a consecutive rate of 75 bps are sky-rocketing. This could put the gold prices on tenterhooks.
Gold price fades hawkish ECB
Gold price has displayed a juggernaut recovery after printing a fresh 11-month low near $1,680.00. The precious metal has ignored the hawkish stance and guidance from the European Central Bank (ECB) revealed on Thursday.
The ECB elevated its interest rates by 50 bps. ECB President Christine Lagarde unexpectedly announced a rate hike by half a percent vs. expectations of 25 bps. Credit goes to the soaring price pressures which forced the ECB policymaker to feature a jumbo rate hike. Earlier, ECB Large in his testimony guided that the ECB is interested in elevating interest rates by 25 bps in July and later on by 50 bps in September.
Falling yields support gold bulls
The major factor behind the firmer recovery in gold prices is the falling US Treasury yields after the interest rate hike by the ECB for the first time in the past 11 years. Hawkish ECB dragged the 10-year US Treasury yields below 3% and are likely to drag further to near 2.70% as guidance from ECB President Christine Lagarde is extremely hawkish. Also, the introduction of the ‘Transmission Protection Instrument’ (TPI) to support southern European economies was the key highlight of ECB monetary policy.
S&P Global PMI to remain in focus
Due to a light economic calendar this week, investors’ focus will remain on the release of the S&P Global PMI data. As per the market consensus, the economic catalysts are expected to deliver a weak performance. The Global Composite data is seen at 51.7, lower than the prior release of 52.3. The Manufacturing PMI may slip to 52 vs. 52.7 recorded earlier. While the Services PMI is expected to display a mild correction to 52.6 against the former figure of 52.7. This will keep the DXY on the back foot and may support the gold prices.
-637940646462161955.png)
Gold technical analysis
Gold price has attacked the former balance area, which is placed in a wide range of $1,697.69-1,723.27 on the four-hour scale. A responsive buying action has pushed the gold prices above the 20-period Exponential Moving Average (EMA) at $1,708.65. Also, the precious metal has attacked the 50-EMA at $1,718.06, which indicates that the gold bulls are attempting a bullish reversal after a prolonged downside move.
Meanwhile, the Relative Strength Index (RSI) (14) has shifted into the 40.00-60.00 range from the bearish range of 20.00-40.00, which indicates that the gold bulls are not actively bearish.
For more upside, the gold bulls need to surpass Monday’s high at $1,723.97, which will drive the asset July 14 high at $1,733.68, followed by July 13 high at $1,745.49.
Alternatively, broader weakness in the asset could trigger again and the gold price will find itself near Thursday’s low to near $1,680.00 after surrendering the psychological support of $1,700.00. A breach of the former will force the asset to form a fresh yearly low of around $1,670.00.
Gold four-hour chart

Key trading levels: AUD/JPY, AUD/USD, EUR/JPY, EUR/USD, other currencies, Gold, and S&P 500
- USD/TRY dribbles around the highest levels since December 2021, flashed earlier in the day.
- CBRT maintained status-quo despite nearly 80% inflation, repeats expectations of disinflation.
- US dollar regains upside momentum as Fed hawks flex muscles, US S&P Global PMI for July eyed for intraday directions.
USD/TRY bulls keep reins around the yearly peak of 17.80, at 17.72 by the press time of early Friday morning in Europe. In doing so, the Turkish lira (TRY) pair justifies the market’s lack of confidence in the nation’s central bank’s latest moves ahead of the key US data and the next week’s Federal Open Market Committee (FOMC).
The Central Bank of the Republic of Türkiye (CBRT) left its benchmark interest rate, the one-week repo rate, unchanged at 14.00% while matching market expectations on Thursday. While conveying the news, Reuters mentioned that Turkey's central bank held its policy rate at 14% for a seventh straight month as expected on Thursday, despite inflation surging to near 80% and a global tightening cycle, and it repeated that disinflation was expected to begin.
Elsewhere, the US Dollar Index (DXY) picks up bids to refresh its intraday high around 107.00, up 0.40% on a day, as sour sentiment joins sluggish yields to help the greenback pare latest losses. Even so, the DXY braces for the first weekly loss in four while extending the July 14 reversal from a nearly two-decade high.
The greenback’s weekly losses could be linked to the US Treasury yields as the benchmark 10-year bond coupons marked the biggest daily slump since mid-June the previous day, as well as eyes the second consecutive weekly loss. It’s worth noting that the European Central Bank’s (ECB) 50 basis points (bps) rate hike and the Transmission Protection Instrument (TPI) also exerted downside pressure on the greenback.
On Friday, the reassessment of the post-ECB optimism and fears of an aggressive rate hike from the Fed, when it meets during the next week, helps the US dollar to remain firmer. Also underpinning the greenback’s safe-haven demand could be the market’s anxiety ahead of the preliminary figures of the US S&P Global PMIs for July.
Looking forward, USD/TRY traders should pay attention to the US catalysts, as well as any major criticism of the CBRT move, to determine further moves of the pair, expectedly on the north.
Technical analysis
USD/TRY is on the way to the late 2021 peak of 18.36 unless breaking the seven-month-old previous resistance line, around 17.30 by the press time.
- EUR/GBP consolidates weekly gains, extends pullback from fortnight top.
- RSI, MACD hint at the pair’s further weakness, 200-HMA adds to the downside filters.
- Buyers need validation from immediate resistance line before retaking control.
EUR/GBP bears return to the table, after a day full of bullish reign, as the quote drops to 0.8515 heading into Friday’s London open. In doing so, the cross-currently pair trims the weekly gains, the second consecutive one, ahead of the key data from the UK, Germany and the Eurozone.
That said, the quote stays above a one-week-old ascending support line, at 0.8510 by the press time.
Given the bearish MACD signals and the downward sloping RSI (14) line, not oversold, EUR/GBPU is likely to extend the previous day’s pullback from a two-week top.
However, a clear downside break of 0.8510 appears necessary for the pair to test the 200-HMA support of 0.8486.
In a case where EUR/GBP bears keep reins past 0.8486, the weekly low near 0.8457 will be in focus.
Alternatively, a downward sloping resistance line connecting the highs marked the previous day, around 0.8520 at the latest, guards the quote’s immediate upside.
Should EUR/GBP buyers manage to cross the 0.8520 hurdle, its run-up towards the latest peak of 0.8585 can’t be ruled out.
Even so, the 0.8600 threshold and the monthly high near 0.8680 could challenge the quote’s further upside.
EUR/GBP: Hourly chart
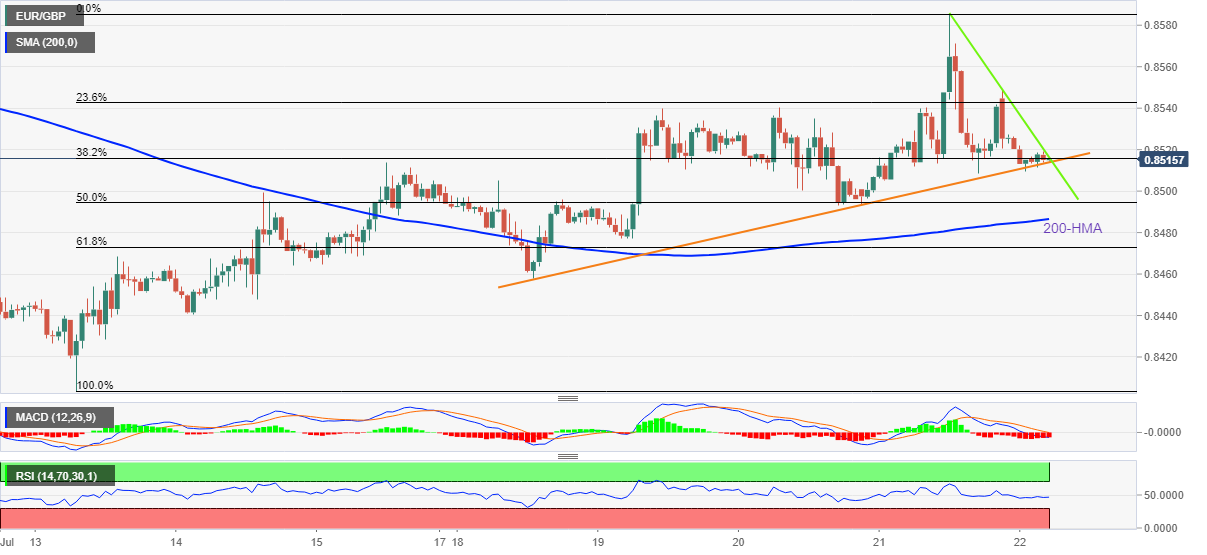
Trend: Further weakness expected
- USD/INR grinds higher around intraday top, stays inside 79.70-80.15 weekly trading range.
- FICCI cuts India’s FY 2023 GDP growth forecasts, Indian equities brace for the best week since mid-March.
- US PMIs, Fed’s moves will be important for fresh impulse.
USD/INR dribbles around the daily top surrounding 79.90 as the US dollar consolidates the previous day’s losses ahead of the key PMI data for July, as well as next the next week’s Federal Open Market Committee (FOMC). It’s worth noting that the recovery in oil prices and fears of India’s economic slowdown also propel the Indian rupee (INR) pair heading into Friday’s European session.
That said, the WTI crude oil prices pare the biggest daily slump in eight days around $96.50 by the press time.
On the other hand, India’s industry body, the Federation of Indian Chambers of Commerce and Industry (FICCI) downgrades the nation’s GDP forecasts in its quarterly survey. “The Indian economy is expected to expand 7% in fiscal 2022/23, slower than a previous estimate of 7.4% and the central bank's 7.2% projection, according to a survey by India's leading industry body,” reported by Reuters.
Elsewhere, the US Dollar Index (DXY) picks up bids to refresh its intraday high around 106.95, up 0.35% on a day, as sour sentiment joins sluggish yields to help the greenback pare latest losses. Even so, the DXY braces for the first weekly loss in four while extending the July 14 reversal from a nearly two-decade high. The greenback’s previous weakness could be linked to the US Treasury yields as the benchmark 10-year bond coupons marked the biggest daily slump since mid-June on Thursday, as well as eyes the second consecutive weekly loss.
Amid these plays, Wall Street benchmarks closed firmer and the US Treasury 10-year Treasury yields marked the biggest daily slump in five weeks, down one basis point (bps) to 2.90% at the latest. That said, S&P 500 Futures drops 0.45% by the press time.
Moving on, preliminary figures of the US S&P Global Manufacturing and Services PMI for July are crucial for USD/INR traders, especially after the ECB and before next week’s Fed meeting. The reason could also be linked to the recession fears and chatters surrounding the central bank’s aggression. That said, the US S&P Global Manufacturing PMI is expected to decline to 52.0 from 52.7 whereas its Services counterpart could ease to 52.6 from 52.7. With this, the Composite PMI may drop to 51.7 from 52.3 prior. Considering the downbeat forecasts for the US data, the US dollar may witness further headwinds and the same could tame the USD/INR prices if the actual figures match the market consensus.
Technical analysis
A one-week-old trading range between 79.70 and 80.15 restricts immediate USD/INR moves. However, the previous resistance line from early March, at 78.95 by the press time, appears a tough nut to crack for the pair sellers.
Analysts at Australia and New Zealand Banking Group (ANZ) offer a brief round-up of significant events that were reported from New Zealand this week.
Key quotes
“We learned this week that annual CPI inflation in New Zealand hit 7.3% in Q2 – higher than the RBNZ’s May MPS forecast of 7.0%, and our own forecast of 7.1%.”
“The real news in the CPI data was the surge in domestic and core inflation measures. Annual non-tradable inflation hit a new record high of 6.3%, and core inflation indicators range between 4.8% and 6.1%. It’s a stronger and more persistent domestic inflation pulse than expected and prompted us to revise up our OCR forecast. We’re now expecting the OCR to peak at 4% by year-end (versus 3.5% previously).”
“We have updated our inflation forecasts in the wake of Q2’s data. While it’s looking like headline inflation may have peaked in Q2, inflation is likely to remain very high for quite some time. We are forecasting inflation will only drop below 3% at the end of next year. There’s still work to do for the RBNZ.”
- GBP/USD takes offers to refresh intraday low, reverses the previous day’s corrective pullback.
- DXY pares the first weekly loss in four as traders await flash US PMIs for July, FOMC.
- Political, Brexit crisis in the UK keeps bears hopeful ahead of British Retail Sales for June, Flash PMIs for July.
GBP/USD pares the first weekly gains in four as it takes offers around 1.1960 to refresh intraday low heading into the London open on Friday. The Cable pair’s latest weakness could be linked to the US dollar’s broad recovery ahead of the next week’s Federal Open Market Committee (FOMC). Also weighing on the quote could be the cautious sentiment ahead of the key UK Retail Sales for June and preliminary readings of the UK and the US S&P Global PMIs for July. Additionally, political anxiety and Brexit fears are extra burdens for the pair.
That said, the US Dollar Index (DXY) picks up bids to refresh its intraday high around 106.95, up 0.35% on a day, as sour sentiment joins sluggish yields to help the greenback pare latest losses. Even so, the DXY braces for the first weekly loss in four while extending the July 14 reversal from a nearly two-decade high. The greenback’s recent weakness could be linked to the US Treasury yields as the benchmark 10-year bond coupons marked the biggest daily slump since mid-June the previous day, as well as eyes the second consecutive weekly loss.
At home, a tough battle for the Prime Minister’s status between ex-Chancellor Rishi Sunak and Foreign Minister Liz Truss appears to challenge GBP/USD bulls. Recent updates from the UK express hints at the market’s favoritism for Sunak due to his concrete policies. It’s worth noting that Liz Truss appears less welcomed by the European Union (EU) as they fear harsh Brexit policies.
Elsewhere, the UK’s House of Lords couldn’t pass the Northern Ireland Protocol (NIP) bill and hence increased the GBP/USD weakness.
Doubts over the European Central Bank’s (ECB) ability to tame regional crisis with rate hikes joins the Bank of England’s (BOE) limited capacity to act to weigh on Cable prices.
Hence, today’s UK data gains more attention if it manages to please bears. Alternatively, upbeat British data may not favor the Cable buyers much considering the hawkish expectations from the Fed and comparatively upbeat fundamentals of the US than the UK.
Technical analysis
The 21-DMA, around 1.2020 by the press time, exerts downside pressure on the GBP/USD, which in turn highlights the 1.1930 horizontal support before directing the bears towards the yearly low of 1.1760. That said, the 1.2045-55 area acts as an extra upside filter.
- The greenback bulls are flirting with the confluence of bear cross and triangle break.
- A range shift by the RSI (14) into the 40.00-60.00 zone indicates a loss of downside momentum.
- Violation of 138.88 will empower the asset to recapture all-time highs at 139.38.
The USD/JPY pair has displayed a vertical upside move in the Asian session as the US dollar index (DXY) has witnessed a bullish open-drive session. A responsive buying action from a low of 137.06 has driven the asset above the critical hurdle of 137.56 comfortably.
On an hourly scale, a downside break of the symmetrical triangle on Thursday resulted in a perpendicular downside move. The upward-sloping trendline of the above-mentioned chart pattern is placed from July 12 low at 136.47 while the downward-sloping trendline is plotted from July 14 high at 139.38. The expansion in volatility was followed by volumes and wide-range candlesticks by the market participants.
A bear cross has been represented by the 20- and 200-period Exponential Moving Averages (EMAs) at 137.78, which adds to the downside filters. The asset is auctioning near the confluence of a bear cross and the upward-sloping trendline of the symmetrical triangle.
Meanwhile, the Relative Strength Index (RSI) (14) has shifted into the 40.00-60.00 range from the bearish range of 20.00-40.00, which indicates that the greenback bulls are not actively bearish.
Should the asset drops below Tuesday’s low at 137.48, the yen bulls will drag the asset towards Thursday’s low at 137.00. A breach of the latter will unleash the yen bulls to drag the asset further towards July 12 low at 136.47.
Alternatively, the greenback bulls will extend their recovery if the asset oversteps the round-level resistance of 138.00. An occurrence of the same will strengthen the greenback and will drive the asset towards Thursday’s high at 138.88, followed by July 14 high at 139.38.
USD/JPY hourly chart
-637940598394843523.png)
US House Speaker Nancy Pelosi on Thursday hinted that the US military had expressed concerns that her plane "would get shot down" by Chinese forces as it neared Taiwan airspace, according to various Taiwanese media outlets.
Pelosi, however, refused to confirm or deny a reported trip to Taiwan.
Pelosi said, "I think what the president was saying is maybe the military was afraid our plane would get shot down, or something like that, by the Chinese." She added, "I don't know exactly. I didn't see it. I didn't hear it."
Earlier this week, The Financial Times (FT) cited six sources saying that Pelosi will head a delegation to Taiwan in August.
Market reaction
At the time of writing, the S&P 500 futures are down 0.36% on the day while the US dollar index steadies around 106.90.
- Gold price awaiting a fresh impetus for the next directional push.
- US dollar picks up fresh bids on the return of risk-off flows, recession fears.
- XAUUSD sees healthy barriers on both sides, as focus shifts to Fed decision.
Gold price is reversing its recovery from 16-month lows of $1,681, as the US dollar finds renewed safe-haven demand amid the return of risk-off flows. Recession fears are back in play, in the face of a more hawkish ECB rate hike and weak US jobless claims and Philly Fed Manufacturing Index. The ongoing weakness in the US Treasury yields could cushion the retreat in the yellow metal but the next path for XAUUSD remains at the mercy of the incoming euro area and US data. Investors also turn cautious heading into the weekly closing, with all eyes now turning towards next Wednesday’s 75 bps Fed rate hike announcement. Hawkish Fed expectations and looming recession risks could likely keep any upside in the commodity limited.
Also read: Gold Price Forecast: Will XAUUSD sustain the recovery above $1,700?
Gold Price: Key levels to watch
The Technical Confluence Detector shows that the Gold price is struggling to extend its recovery above the powerful hurdle around $1,718, which is the convergence of the Fibonacci 38.2% one-week, SMA10 one-hour and the previous high four-hour.
Acceptance above the latter will call for a retest of the previous day’s high of $1,720. A firm break above it will kick in a fresh advance towards the Fibonacci 61.8% one-week at $1,727.
The pivot point one-day R1 at $1,732 will be the level to beat for gold bulls.
Alternatively, strong support awaits at the Fibonacci 23.6% one-day at $1,711, below which the confluence of the Fibonacci 23.6% one-wee and SMA5 one-day at $1,709 will be put under threat.
The $1,706 support area will be next on sellers’ target, where the Fibonacci 38.2% one-day and SMA5 four-hour merge.
Further south, it's critical for bears to take out the pivot point one-month S3 at $1,704 to fight back complete control. The previous week’s low at $1,698 could be challenged on the additional declines.
Here is how it looks on the tool
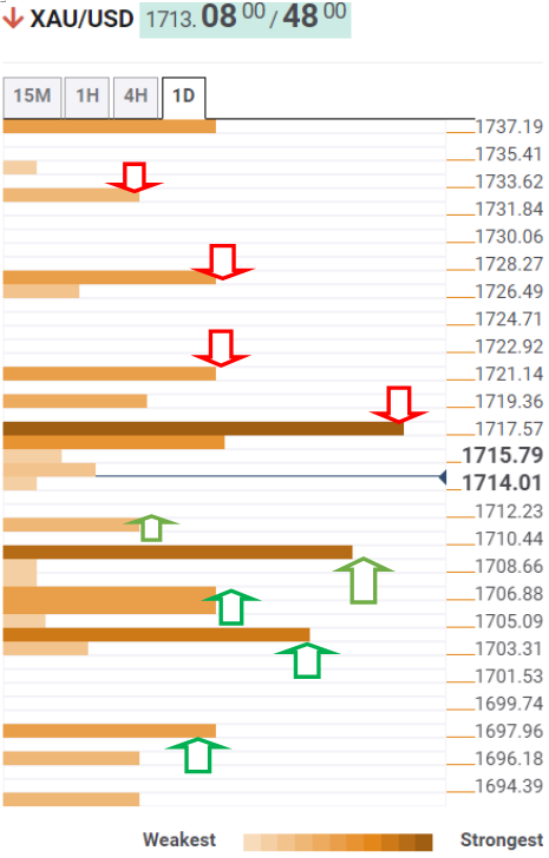
About Technical Confluences Detector
The TCD (Technical Confluences Detector) is a tool to locate and point out those price levels where there is a congestion of indicators, moving averages, Fibonacci levels, Pivot Points, etc. If you are a short-term trader, you will find entry points for counter-trend strategies and hunt a few points at a time. If you are a medium-to-long-term trader, this tool will allow you to know in advance the price levels where a medium-to-long-term trend may stop and rest, where to unwind positions, or where to increase your position size.
- EURUSD price holds lower ground near intraday bottom, stays on the way to first weekly gain in four.
- ECB drowned yields, US dollar with higher-than-forecast rate hike, TPI.
- Fears of economic slowdown, pre-Fed anxiety keep sellers hopeful with eyes on flash PMIs for July.
EURUSD price reverses the European Central Bank (ECB) inspired gains as it remains pressured around the intraday low of 1.0190 heading into Friday’s European session. In doing so, the major currency pair stays inside the immediate trading range while preparing to snap the three-week downtrend.
Although the ECB’s heavy rate hike and the Transmission Protection Instrument (TPI) weighed on the Treasury yields and the US dollar, the market’s reassessment of the risk catalysts calls back the EURUSD bears as they await key activity data from Eurozone and the US for July.
Also read: EUR/USD Forecast: Unconvinced buyers about to give up
EURUSD price ease on DXY rebound
US Dollar Index (DXY) picks up bids to refresh its intraday high around 106.95, up 0.35% on a day, as sour sentiment joins sluggish yields to help the greenback pare latest losses. Even so, the DXY braces for the first weekly loss in four while extending the July 14 reversal from a nearly two-decade high. The greenback’s recent weakness could be linked to the US Treasury yields as the benchmark 10-year bond coupons marked the biggest daily slump since mid-June the previous day, as well as eyes the second consecutive weekly loss.
Problems at home, doubts on TPI defy ECB’s hawkish move

European Union flags waver around ECB building
Economical/political problems in Germany and Italy raise questions about the ECB’s big rate hike. Among them, chatters surrounding the energy shortage and the odds of recession for the bloc’s powerhouse Germany gains major attention. On the same line is the political crisis in Italy after ex-ECB President Mario Draghi resigned from the post of Italian Prime Minister (PM) triggering the need for national elections in September. It’s worth noting that the nature of TPI also becomes a source of uncertainty as President Christine Lagarde made it compulsory for the TPI to follow the European Union (EU) Fiscal Framework.
Fed hawks flex muscles
Having witnessed an impressive reaction to the ECB, Fed hawks brace for the next week’s Federal Open Market Committee (FOMC) and underpin the US dollar’s safe-haven demand. Given the recently firmer US data and hawkish moves from the bloc’s central bank, the Fed policymakers are likely to match market expectations of announcing a 0.75% rate increase. The same could propel the US dollar and hence EURUSD price seems to prepare for the hawkish Fed.
PMIs can offer immediate directions
Given the talks of recession in Germany, today’s S&P Global/BME PMIs for July will be crucial for the EURUSD price. Also important will be the S&P Global PMI releases for the Eurozone and the US for the stated month. Forecasts suggest the overall weakness in activities during July. Given the pending action from the Fed, emphasis will be more on the US data and hence any stronger prints of the US data could extend the latest EURUSD weakness.
EURUSD price technical outlook
EURUSD remains pressured inside a three-day-old trading range, after reversing back from the 21-DMA the previous day.
RSI retreat battles bullish MACD signals to challenge EURUSD buyers and hence short-term sideways performance can’t be ruled out.
That said, a clear upside break of the 21-DMA hurdle surrounding 1.0260 could quickly propel the quote towards a horizontal resistance from May 13, close to 1.0385-90.
It’s worth noting, however, that a downside break of 1.0160 could quickly drag the EURUSD price towards 1.0100 and then to the parity level.
In a case where the quote stays weak below 1.0100, the 61.8% Fibonacci Expansion (FE) of March-May moves, near 0.9960, precedes the December 2002 low near 0.9860 to challenge the further weakness.
Overall, EURUSD remains sidelined but the bears have higher scope for an easy return than the bulls.
EURUSD price: Daily chart
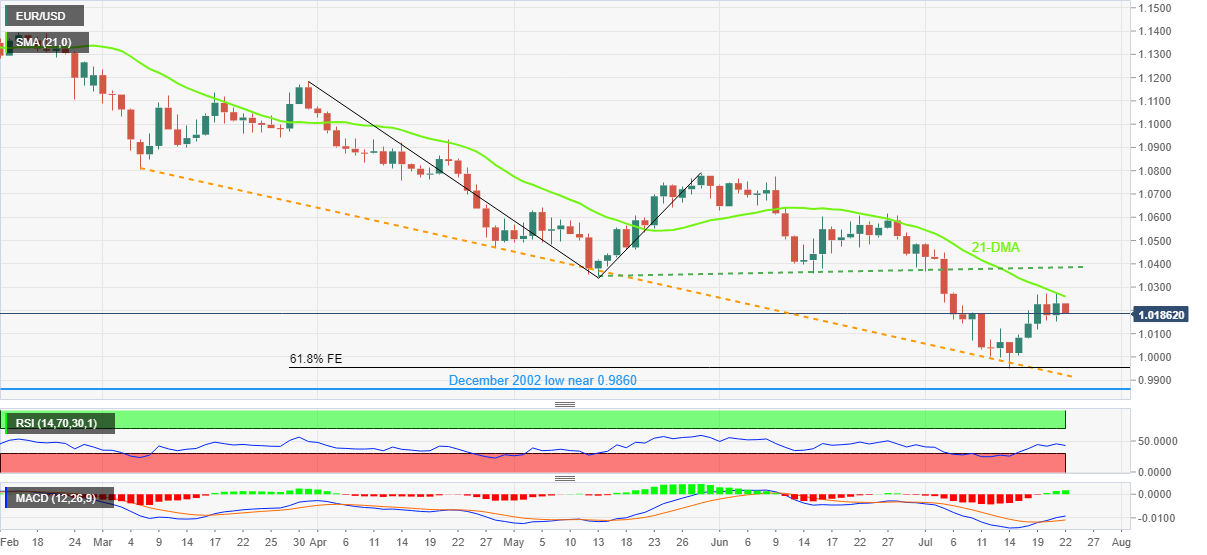
Key trading levels
- EUR/JPY is aiming for an establishment below 140.00 as Japan’s core CPI advance.
- The hangover of the hawkish ECB seems over and investors have started dumping eurozone.
- BOJ will continue to purchase JGBs at an annual pace of around 80 trillion yen.
The EUR/JPY pair has witnessed a less-confident rebound from the psychological support of 140.00 in the Asian session. However, the downside remains favored as investors dumped the shared currency on activation of the ‘Buy on Rumor and Sell on News’ indicator after the rate hike announcement by the European Central Bank (ECB). Apart from that, the upside release of Japan’s core Consumer Price Index (CPI) is going to strengthen the yen bulls.
The cross remained in the bullish trajectory from the past week on expectations of a rate hike by the ECB. On Thursday, expectations meet reality after ECB President Christine Lagarde announced a rate hike by 50 basis points (bps). No doubt, the announcement has triggered a divergence in ECB-Bank of Japan (BOJ) policy as both central banks remained stick to their grounded interest rates. The ECB elevated its rates for the first time in the past 11 years.
Apart from that, the BOJ also announced its interest rate decision on Thursday but kept a dovish stance as the central bank is committed to injecting more liquidity into the economy. The BOJ will continue to purchase Japan’s Government Bonds (JGBs) at an annual pace of around 80 trillion yen.
In the Asian session, the Statistics Bureau of Japan released the Inflation data. The National CPI was trimmed to 2.4% vs. 2.5% reported earlier. While the core CPI climbed to 1% from the prior release of 0.8%. The BOJ remained worried as oil and food prices were keeping the inflation rate above %. Now, a recovery in demand for durable goods is going to delight the BOJ policymakers. Also, it will strengthen the yen bulls.
- Steel prices eye some recovery as demand for automobiles to escalate.
- Demand for automobiles remained upbeat in June and a similar performance is expected in July.
- Construction activities to resume as monsoon may be concluded sooner.
Steel prices are eyeing a rebound after remaining in a bearish grip for the past few months. Pessimism about the steel prices is getting exhausted now and steel mill owners are returning to their production units. Earlier, steel producers halted production processes as margins were squeezed amid a significant slippage in steel prices.
To boost domestic steel production, China’s Commerce Ministry will extend anti-dumping duties on grain-oriented flat-rolled electrical steel imported from Japan, South Korea, and the EU for five years from July 23. This will boost China's steel mill owners to fire-up production capacities.
Now, steel prices are finding a cushion, and steel mill owners have chosen to resume production to cater to the likely growing needs. Automobile production is enlarging in China as China's Association of Automobile Manufacturers (CAAM) has reported a significant increase in sales data in June.
The demand for passenger cars has grown 36.9% on a monthly basis and 23.8% on an annual basis. Also, the demand for commercial vehicles has grown 17.4% on QoQ but fell 37.4% on yoy. Going forward, the demand is expected to escalate further as zero-Covid policy implementation by the Chinese government will force them to keep themselves isolated from others.
Apart from that infrastructure projects are gearing up again after the conclusion of monsoon in various provinces of China. Earlier, heavy rains in various parts of China forced postpone of construction activities. Now, infrastructure projects and real estate will start picking up pace and eventually, the demand for steel. Investors should be aware of the fact that global recession worries will remain stable as western central banks are ready for a fresh leg of interest rate elevation to barricade price pressures.
Commenting on the currency, China’s FX regulator, the State Administration of Foreign Exchange (SAFE) said on Friday, the “yuan exchange rate prominently stable despite the US dollar strength.”
Additional quotes
Companies' cross border financing in H1 remains stable.
Size of FX derivative trading continues rising, FX reserves largely stable.
International capital has been flowing out from emerging markets recently.
The influence and attractiveness of China’s bond market have risen significantly.
Volatility of China’s bond market far below other developed and emerging markets, shows relatively high stability.
Further opening up China’s bond market could improve resilience of FX market.
Confident overseas investors will continue to steadily increase investment in yuan denominated bonds.
Foreign firms' profit remittance is reasonable and in an orderly manner this year.
Impact from such profit remittance on cross border capital flow is under control.
Related reads
- USD/CNH Price Analysis: Pullback remains elusive beyond 6.7520
- US Dollar Index Price Analysis: Inverted Flag warrants a bearish impulsive wave, 105.00 eyed
- Market sentiment remains pressured, the US dollar gains upside momentum.
- Yields portray three-day downtrend, S&P 500 Futures differ from Wall Street.
- Flash readings of S&P Global PMIs for July will be important ahead of next week’s FOMC.
Market sentiment remains sluggish during early Friday, as traders take a breather after the European Central Bank (ECB)-impressed volatility. The market’s latest inaction could also be linked to the lack of major data/events, as well as the market’s wait for flash readings of S&P Global PMIs for July for the key economies like the US, the UK, Germany and the Eurozone.
Amid these plays, the US Dollar Index (DXY) picks up bids to refresh its intraday high around 106.80, up 0.22% on a day, as risk-aversion returns to the table. That said, Wall Street benchmarks closed firmer and the US Treasury 10-year Treasury yields marked the biggest daily slump in five weeks, down one basis point (bps) to 290% at the latest. That said, S&P 500 Futures drops 0.45% by the press time.
The latest weakness in the market’s sentiment emanates from the recheck of the optimism following the ECB’s verdict, as well as the pre-established fears of recession and covid. Also underpinning the US dollar’s safe-haven demand is the next week’s Federal Open Market Committee (FOMC).
A slump in the US Treasury yields, due to the European Central Bank’s (ECB) higher-than-expected 50 basis points (bps) rate hike, drowned the US dollar the previous day. On the same line was the announcement of a new tool called the Transmission Protection Instrument (TPI) to tame disorderly market dynamics in the bloc.
It’s worth observing that anticipated weakness in the US PMIs and likely weakness in the UK and the eurozone activity data for July are also likely to help market sentiment in the short-term, which in turn could exert downside pressure on the US dollar and favor equities, gold and Antipodeans.
Alternatively, recession fears remain on the table and the Fed policymakers are bracing for faster rate hikes, especially after the latest ECB, which in turn can keep the risk appetite weaker moving on.
- AUD/USD bulls are stepping in following a firm correction.
- There is a risk of an upside continuation but bears may commit to the neckline of the H4 W-formation's neckline.
As per the analysis at the start of the day, AUD/USD bears are eyeing a correction from lofty US session highs, we have seen a pullback in the pair and it now meets a crossroads as illustrated in the following update:
AUD/USD Prior analysis
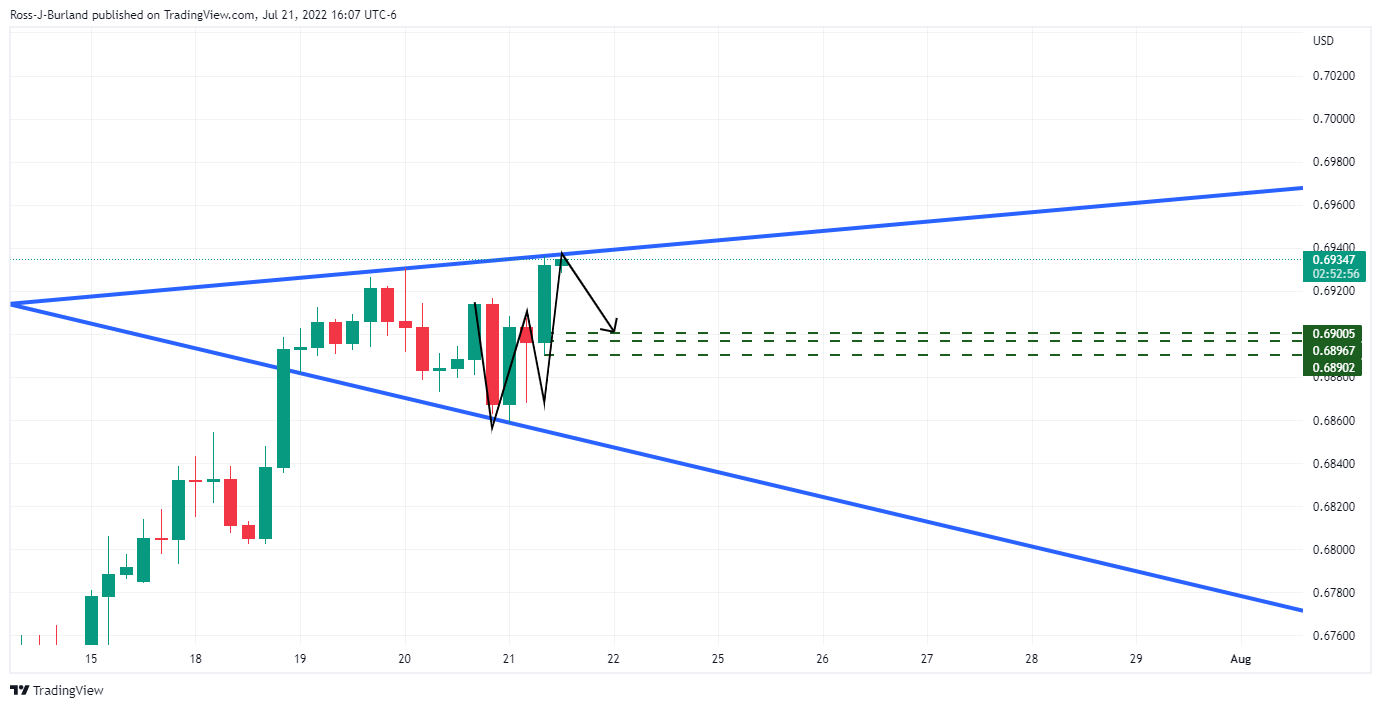
The price was meeting a broadening formation extreme and the W-formation on the 4-hour time frame was a compelling feature as well which could see the price revert to test the neckline and 15-min price bar lows if bears stay committed. 0.6890 was eyed in that regard.
In the Asian session, the pair has melted in a correction as follows:
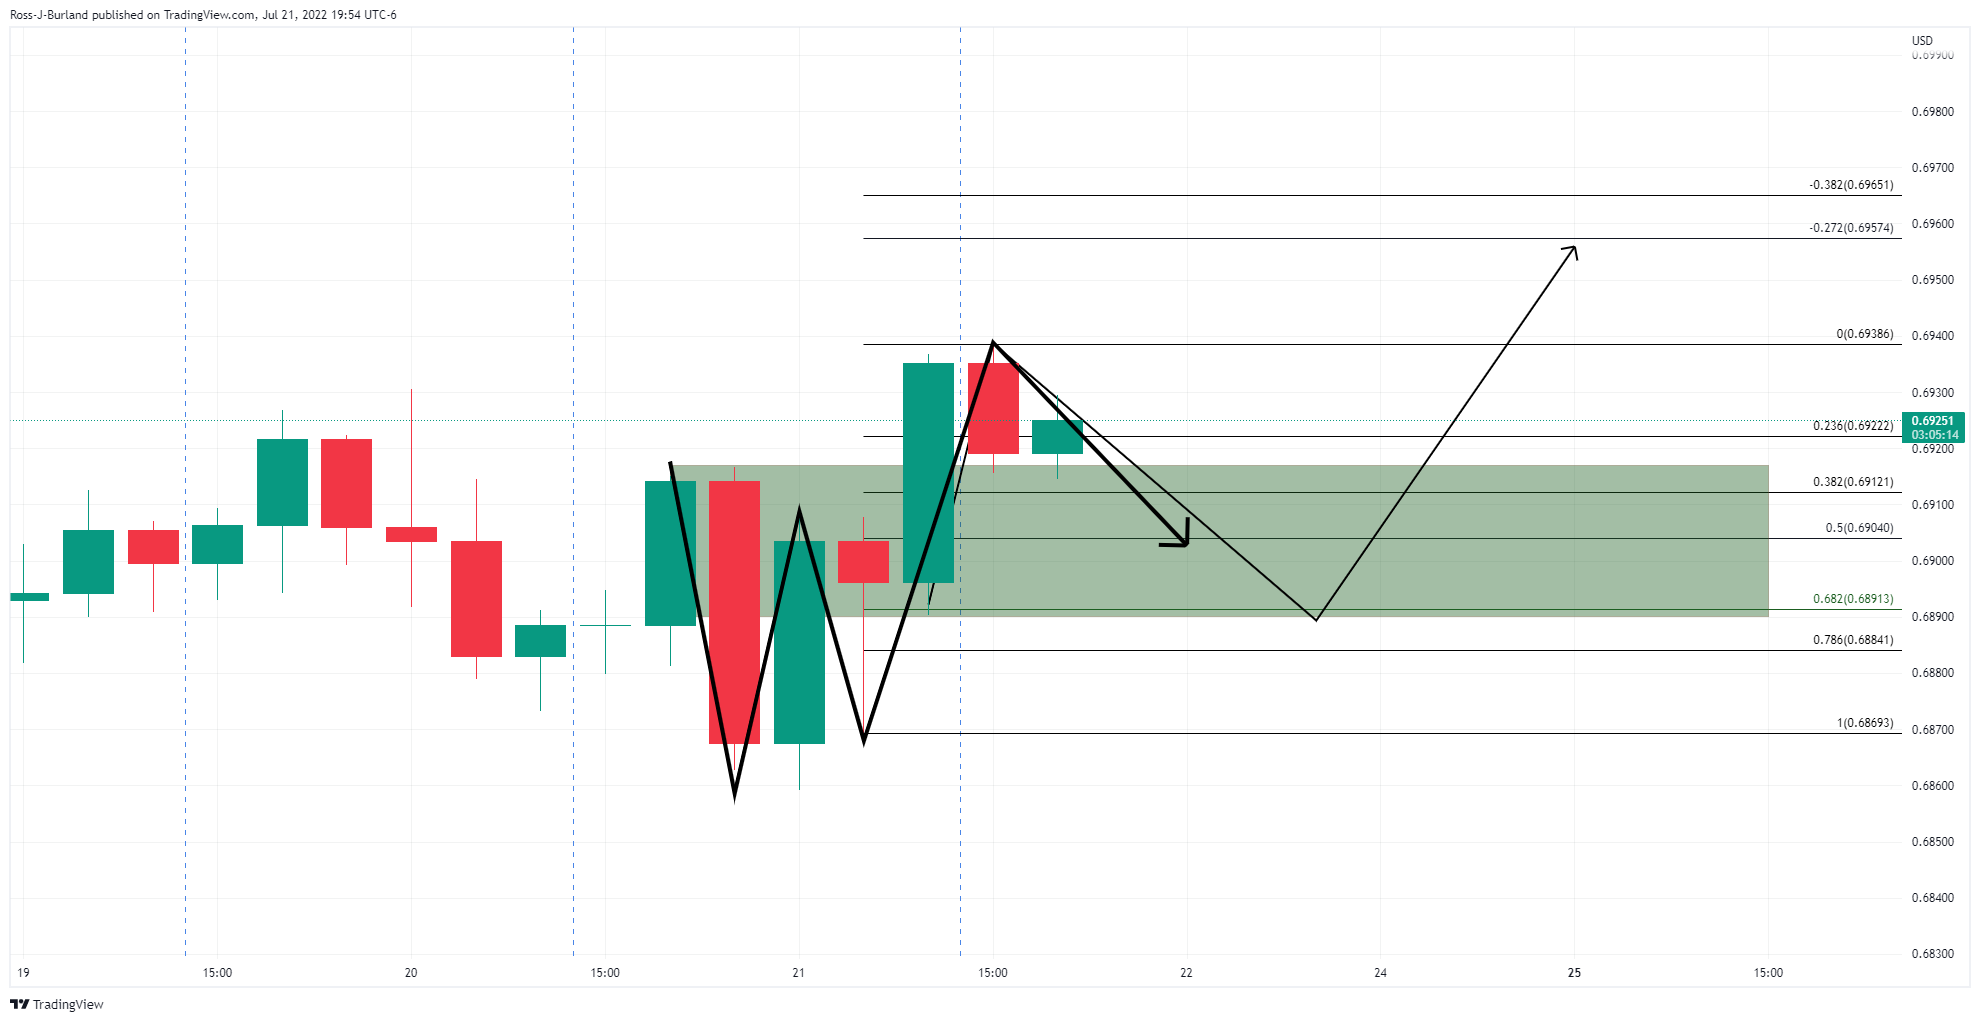
The W-formation's neckline is yet to be met but there are now risks of continuation highs, so bears will need to be cautious at this juncture, as per the following hourly chart:
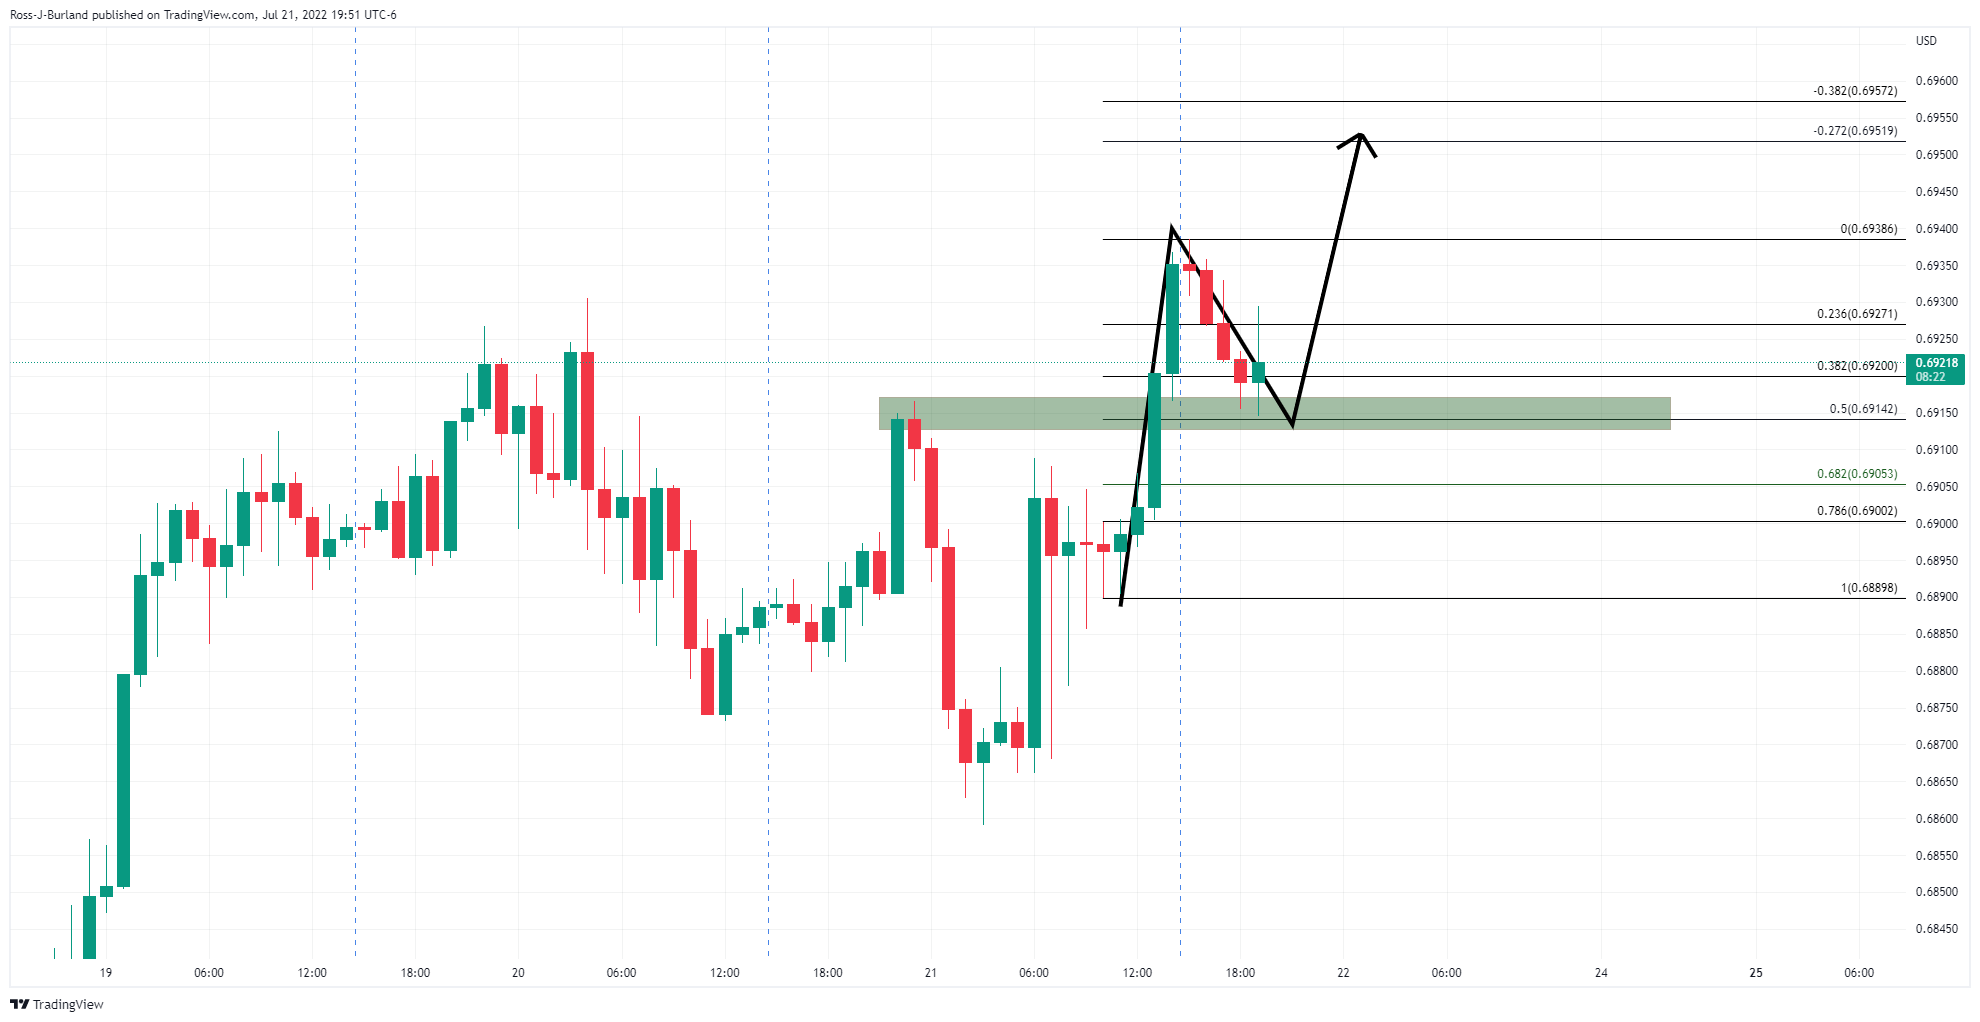
The price has already made a significant correction and the support is coming in at old structure highs that meet a 50% mean reversion level.
Citing Kremlin, Reuters reports on Friday that Russian President Vladimir Putin and Saudi Arabian Prince Mohammed bin Salman spoke by phone on Thursday and underlined the importance of further cooperation within the OPEC+ group of oil producers.
Key takeaways
“Saudi Arabia consulted closely with Russia before pushing for the production hikes.”
“Riyadh wants to keep Russia on board to increase leverage in the oil market, while Moscow gains from being part of OPEC+ at a time when the West is trying to strangle its economy with sanctions over the war.”
Market reaction
WTI is catching a fresh bid on the above headlines, recapturing the $97 mark, adding 1.02% on the day, at the time of writing.
- USD/CNH again retreats from a two-month-old horizontal resistance area.
- Impending bear cross on the MACD keeps sellers hopeful.
- 50-SMA, two-week-old ascending trend line restricts the short-term downside.
- Bull can aim for yearly high on crossing 6.7890 hurdle.
USD/CNH holds lower ground near 6.7700 during Friday’s Asian session, after reversing from a two-month-old horizontal resistance area.
Considering the looming bear cross on the MACD and the pair’s inability to cross the key hurdle, USD/CNH prices are likely to decline further.
However, a convergence of the 50-SMA and a fortnight-long support line, near 6.7520, appears crucial for the USD/CNH bears to watch.
Should the quote offshore Chinese yuan (CNH) pair drop below 6.7520, it can direct sellers toward an ascending trend line from early June, near 6.7000 by the press time.
Meanwhile, a clear upside break of the 6.7870-90 hurdle needs validation from the 6.7900 round figure and the monthly high of 6.7920.
Following that, the mid-May high near 6.8200 can act as an intermediate halt during the rally targeting the yearly peak of 6.8385.
Overall, USD/CNH is likely to witness further downside. However, 6.7520 and 6.7890 are important levels to watch for the pair traders.
USD/CNH: Four-hour chart

Trend: Further weakness expected
- USD/CAD takes the bids to refresh intraday high, pares the first weekly loss in four.
- Oil prices ignore US dollar’s rebound, Nord Stream 1 resumption.
- Mixed Canada economics, ECB-inspired weakness of USD favored bears earlier.
- US PMIs, Canada Retail Sales will be important to watch for clear directions.
USD/CAD picks up bids to refresh intraday high near 1.2895 during Friday’s Asian session. In doing so, the Loonie pair justifies a firmer US dollar, ignoring firmer prices of Canada’s key export item WTI crude oil, during a sluggish session.
The latest weakness in the market’s sentiment emanates from the recheck of the optimism following the ECB’s verdict, as well as the pre-established fears of recession and covid. Also underpinning the US dollar’s safe-haven demand is the next week’s Federal Open Market Committee (FOMC). It’s worth noting that the absence of major data/events and cautious mood ahead of flash readings of the US S&P Global PMIs for July and Canada’s Retail Sales for May also propel the USD/CAD prices.
While portraying the mood, the US Dollar Index (DXY) picks up bids to refresh its intraday high around 106.70, up 0.12% on a day, as risk-aversion returns to the table. That said, Wall Street benchmarks closed firmer and the US Treasury 10-year Treasury yields marked the biggest daily slump in five weeks. That said, S&P 500 Futures drops 0.45% by the press time.
It’s worth noting that a slump in the US Treasury yields due to the European Central Bank’s (ECB) higher-than-expected 50 basis points (bps) rate hike drowned the US dollar the previous day. On the same line was the announcement of a new tool called the Transmission Protection Instrument (TPI) to tame disorderly market dynamics in the bloc.
However, the oil prices failed to cheer the risk-on mood and the softer US dollar the previous day on the resumption of gas flows from Russia’s Nord Stream 1 pipeline. WTI crude oil currently trades near $96.20 as it consolidates the biggest daily slump in eight days.
Moving on, the US S&P Global Manufacturing PMI is expected to decline to 52.0 from 52.7 whereas its Services counterpart could ease to 52.6 from 52.7. With this, the Composite PMI may drop to 51.7 from 52.3 prior. Considering the downbeat forecasts for the US data, the US dollar may witness further headwinds and the same could help the USD/CAD bears if the Canada Retail Sales match 1.6% MoM forecasts for May, versus 0.9% prior.
Technical analysis
Unless breaking an upward sloping support line from June 28, at 1.2850 by the press time, USD/CAD can aim for the 200-SMA and the monthly horizontal resistance, respectively near 1.2915 and 1.2940.
The Japanese Finance Minister, Shunichi Suzuki, said on Friday that hiking rates could knock the economy's recovery, signalling support for the Bank of Japan's stance to keep monetary stimulus despite a global tightening trend amid rising inflation.
"Generally speaking, rate hikes could cause the economy to falter," Suzuki told reporters when asked about the BOJ's decision on Thursday to retain its ultra-easy policies as reported by Reuters.
Key notes
- Need to pay full attention to risk of rising inflation exerting downward pressure on economy.
- Will likely tap budget reserve to cover the cost of national funeral for ex-pm Abe.
- Monetary policy up to BoJ to decide.
- Export growth not keeping in pace with yen weakening.
- Generally speaking, rate hikes could hamper economic growth.
- Hard to single out one specific factor for the cause of trade deficit.
USD/JPY update
Meanwhile, USD/JPY is attempting to recover from the central bank-induced sell-off from overnight. The European Central Bank hiked rates by 50bps and this weighed on the greenback sending USD/JPY off a cliff to 137.02 from where it is stabilising at in Tokyo on Friday.
Read more: USD/JPY Price Analysis: Bulls make a move in Tokyo open and eye significant correction
- Silver consolidates the first weekly gains in eight inside nearly symmetrical triangle.
- Bullish MACD, sustained break of 50-SMA favor buyers.
- 100-SMA, yearly low act as additional trading filters.
Silver price (XAG/USD) struggles to extend the previous day’s run-up during the first positive in eight, picking up bids to $18.85 during Friday’s Asian session.
In doing so, the bright metal keeps the previous day’s breakout of the 50-SMA while staying inside a one-week-old symmetrical triangle.
That said, the metal’s sustained trading beyond 50-SMA and the bullish MACD signals direct buyers towards defying the triangle formation, with an upside break of the resistance line near $19.00.
However, the 100-SMA level of $19.20 acts as an extra filter to the north before directing XAG/USD bulls towards the 38.2% Fibonacci retracement of June 27 to mid-July downturn, near $19.45, as well as the $20.00.
Alternatively, pullback moves remain elusive until the quote stays above 50-SMA support of $18.78.
Following that, $18.50 and the stated triangle’s support line, at $18.25 by the press time, will challenge the silver sellers.
It should be observed that the yearly low surrounding $18.15 and the $18.00 round figure could act as extra supports to watch during the quote’s weakness past $18.25.
In a case where the metal drops below $18.00, it can slump to March 2020 swing high near $17.60.
Silver: Four-hour chart

Trend: Further recovery expected
In recent trade today, the People’s Bank of China (PBOC) set the yuan (CNY) at 6.7522 vs. the estimated 6.7485 and the previous 6.7620.
About the fix
China maintains strict control of the yuan’s rate on the mainland.
The onshore yuan (CNY) differs from the offshore one (CNH) in trading restrictions, this last one is not as tightly controlled.
Each morning, the People’s Bank of China (PBOC) sets a so-called daily midpoint fix, based on the yuan’s previous day's closing level and quotations taken from the inter-bank dealer.
- NZD/USD bears are regathering for a correction lower.
- The W-formation on the daily chart is a pull on the price and 0.6220 is key.
NZD/USD is poised for a bearish correction as per the W-formation on the daily chart illustrated above. The price rallied leaving a trail of stops below it along the way that are vulnerable to a significant series of supply for the days ahead.
NZD/USD daily chart
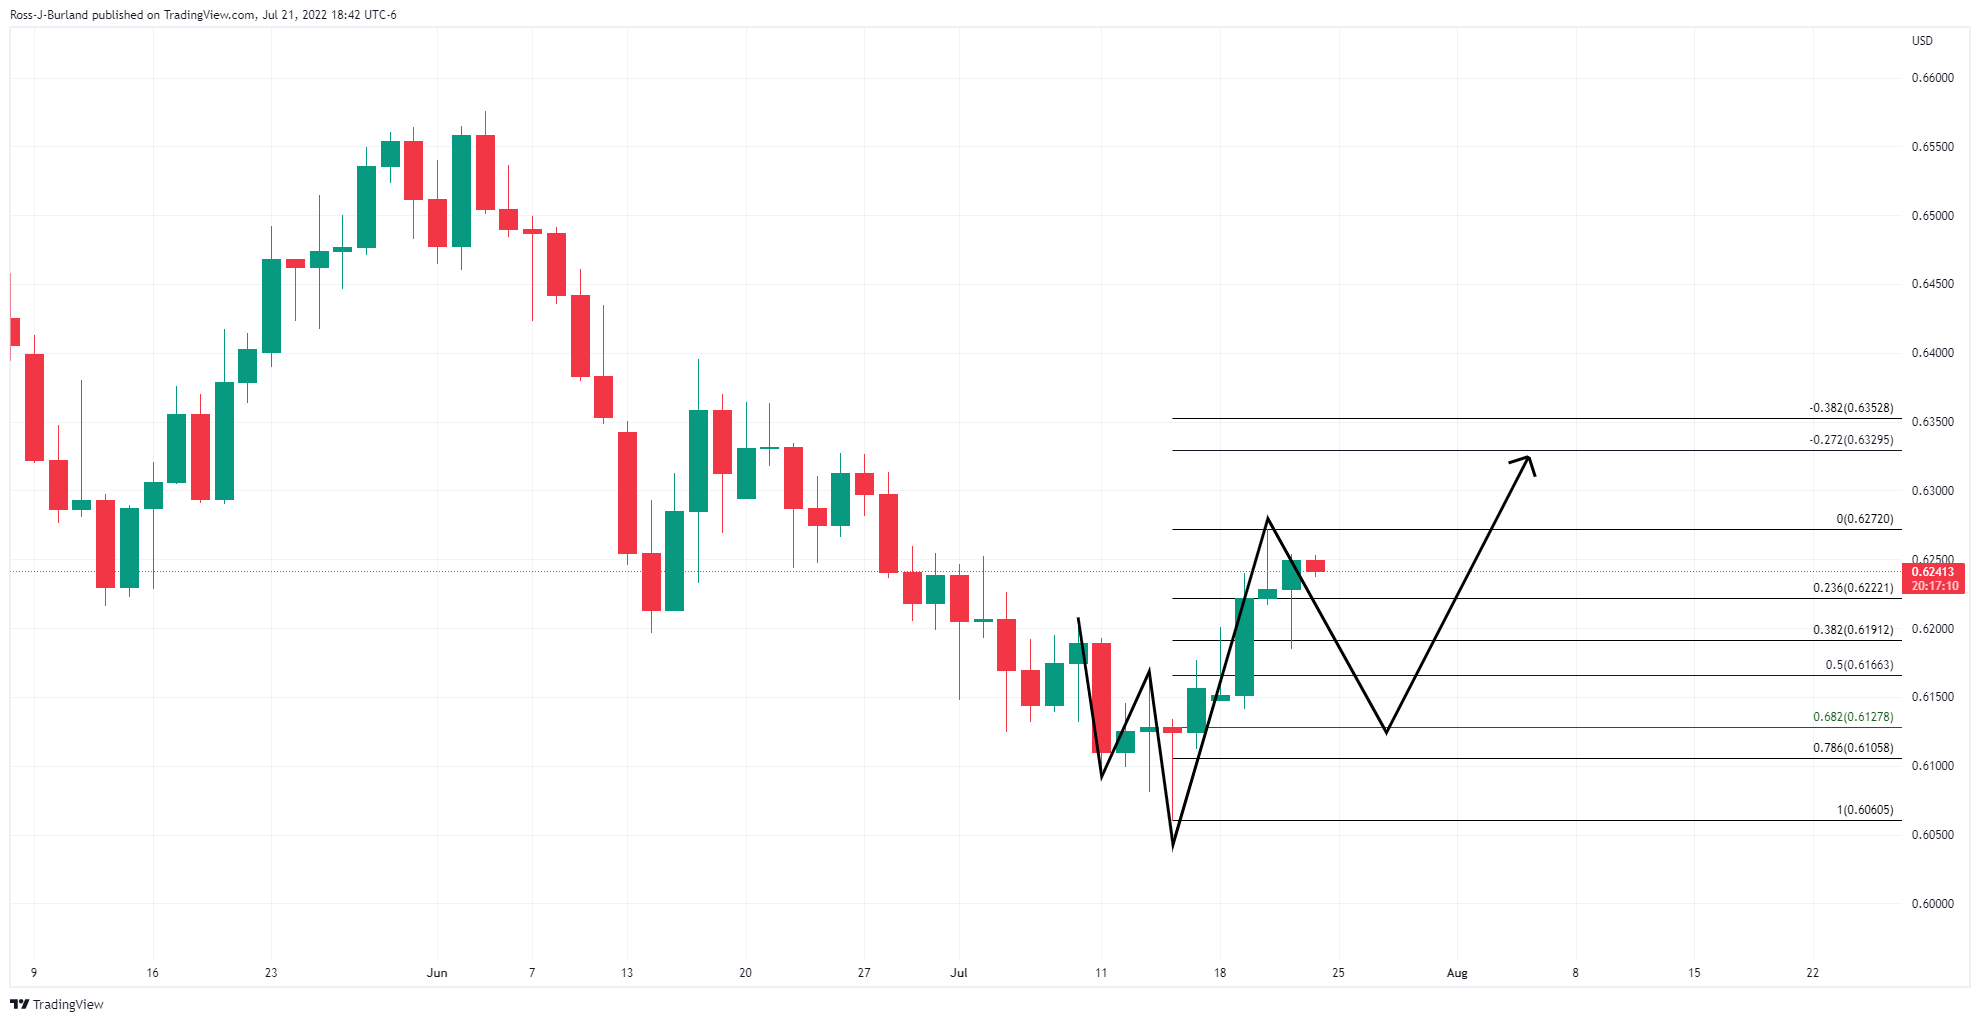
The pattern is a reversion formation where the price would be expected to revert to the neckline which in this case has a confluence with the 50% mean reversion and a 68.2% Fibonacci below there.
NZD/USD H1 chart
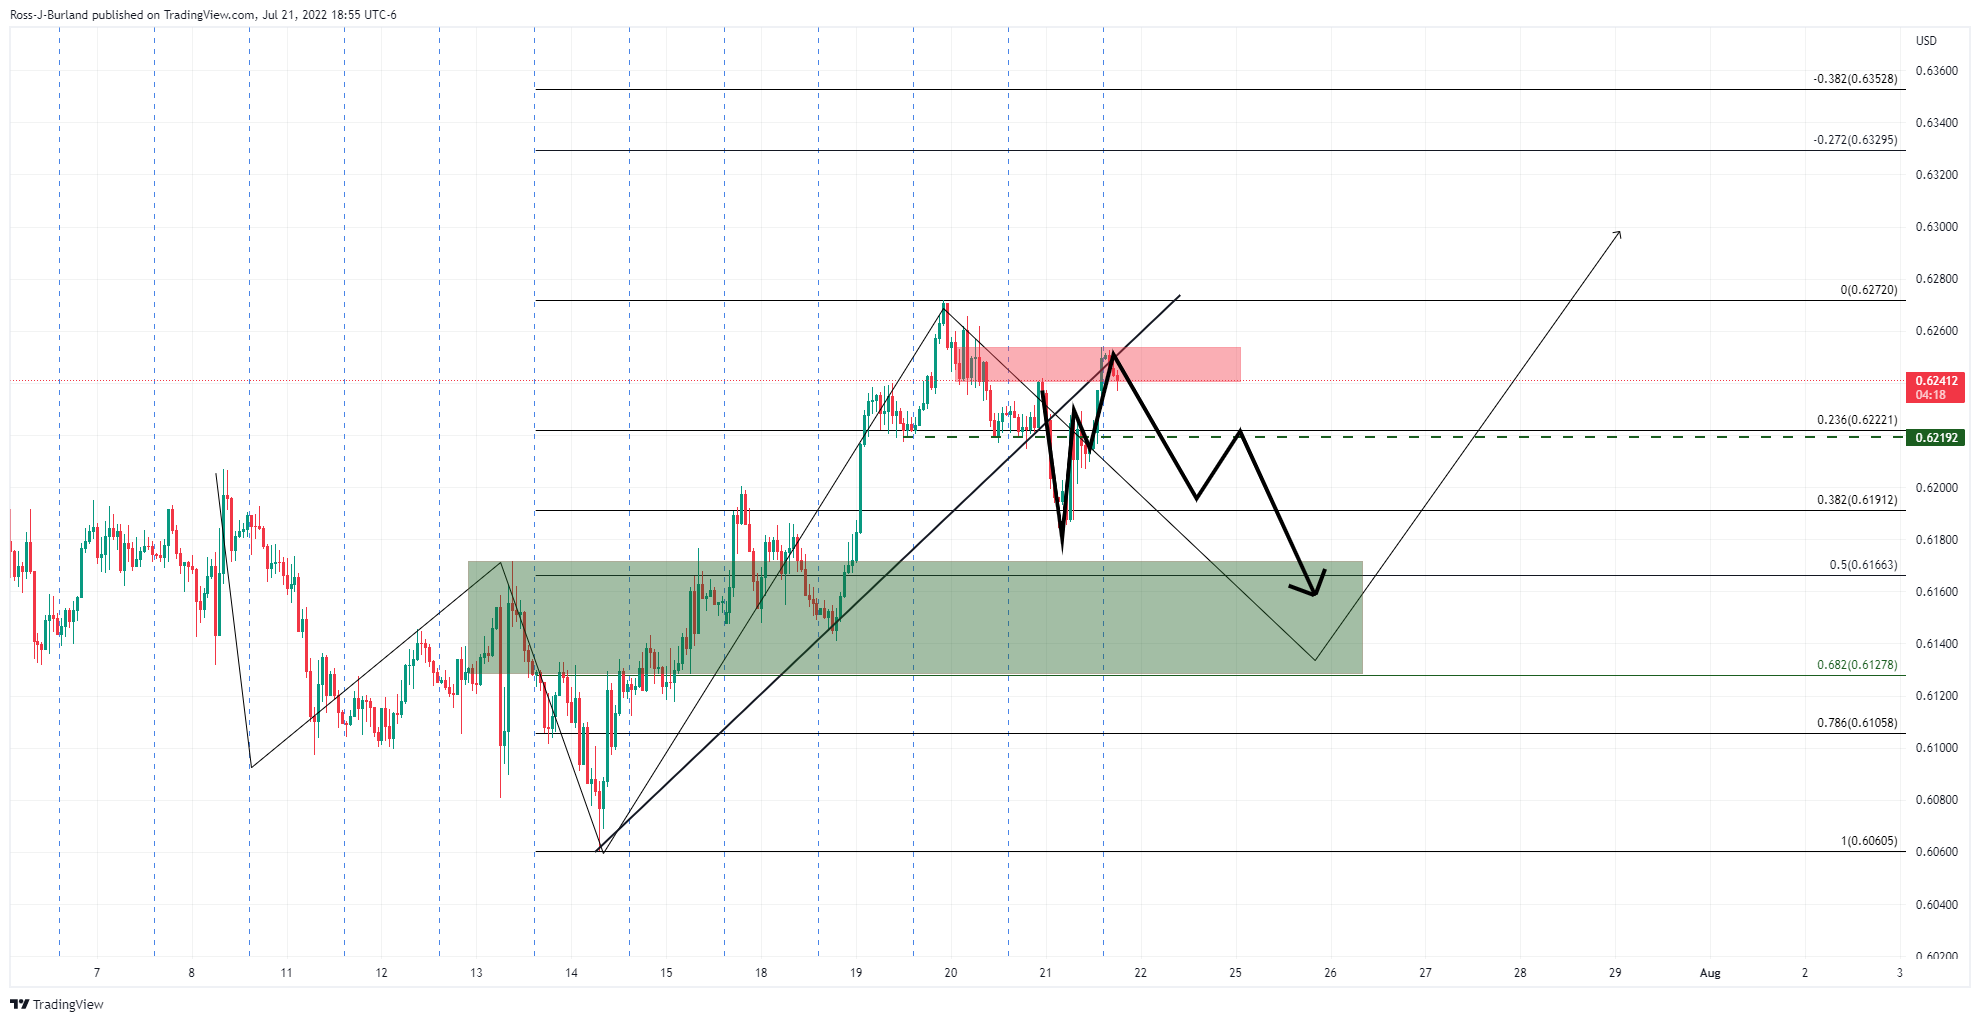
The hourly time frame has seen the price break the trend line support and rally back into a pool of liquidity where offers would now be expected to see the kiwi melt to the downside below 0.6220 in line with the daily chart's bearish bias.
- GBP/USD has shifted into a corrective phase as the DXY has performed stronger in morning trade.
- Pre-anxiety of an interest rate decision by the Fed is supporting the DXY.
- UK Retail Sales may tumble despite soaring price pressures.
The GBP/USD pair has witnessed selling pressure while attempting to surpass the psychological resistance of 1.2000 in the Asian session. Earlier, the cable displayed a vertical upside move after a responsive buying action from a low of 1.1890 on Thursday. The asset is expecting a corrective move but that doesn’t warrant a bearish reversal.
The US dollar index (DXY) has witnessed a decent buying action in its opening hour as investors are betting over a rate hike by the Federal Reserve (Fed) next week. No doubt, the odds of a rate hike by 100 basis points (bps) have trimmed significantly after a fall in long-run inflation expectations in the US. However, current price pressures are still devastating and need to get fixed sooner. Therefore, the Fed may maintain its status quo and may announce a rate hike by 75 bps.
In today’s session, investors' focus will remain on the US S&P PMI data. The Global Composite data is seen at 51.7, lower than the prior release of 52.3. The Manufacturing PMI may slip to 52 vs. 52.7 recorded earlier. While the Services PMI is expected to display a mild correction to 52.6 against the former figure of 52.7. This will keep the DXY on the back foot.
On the pound front, the focus will remain on the Retail Sales data. A preliminary estimate for the economic data is -5.3% more vulnerable than the prior release of -4.7%. It is worth noting that soaring energy bills are already pushing Retail Sales higher. Runaway inflation should have elevated the estimate for Retail Sales. However, lower consensus indicates that the overall demand is so much low that even the price pressures are unable to lift them above their prior release.
“The European Central Bank is unlikely to step directly into foreign-exchange markets even in the face of a more than 10% slump in the euro this year, although there is potential for Japan to engage in that kind of intervention if the yen continues to unravel, according to Goldman Sachs Group Inc,” as per Bloomberg. The piece quotes latest comments from Goldman’s Foreign Exchange strategist Karen Reichgott Fishman as follows.
Key quotes
President Christine Lagarde and her colleagues have more pressing issues to tackle before shifting their attention toward re-strengthening Europe’s common currency. High on that list are the ongoing surge in inflation, risks to energy supplies, and the deterioration of so-called peripheral bond markets, like Italy’s, whose issues are being exacerbated by ongoing political turmoil.
Concerns of fragmentation risks and elevated political uncertainty in Italy ultimately outweighed the initial upward pressure on the euro — highlighting the complicated set of challenges the single currency is facing at the moment.
While interventions by the world’s largest central banks have been rare in recent decades -- and when they do occur they’re typically coordinated among multiple monetary authorities -- the odds that Japan might do something will increase if the dollar-yen rate pushes even higher.
Also read: Forex Today: Europe in the eye of the storm
USD/CHF remains pressured around the weekly bottom, despite recently picking up bids to 0.9670, during Friday’s Asian session. In doing so, the Swiss currency (CHF) pair justifies bearish bias in the options market.
That said, the one-month risk reversal (RR) for the USD/CHF, a spread between the call options and the put options, printed the second daily negative of -0.030 the previous day. The same direct the weekly RR to snap the two-week uptrend.
In addition to the options market signals, the CHF’s status as a haven and the market’s risk-off mood, amid fears of recession and the central bank’s aggression, appears to exert downside pressure on the USD/CHF prices.
It’s worth noting, however, that flash readings of the US S&P Global PMIs for July will be crucial to watch for the USD/CHF traders for intraday directions. Additionally important will be the chatters surrounding the global economic slowdown.
Also read: USD/CHF Price Analysis: Trips down below 0.9700 as mood improves
- AUD/USD takes offers to refresh intraday low, extends pullback from three-week high.
- Australia’s preliminary S&P Global PMIs dropped below market forecasts and prior for July.
- US dollar pares weekly losses as markets reassess post-ECB optimism.
- US PMIs, risk catalysts are the key to fresh impulse.
AUD/USD consolidates the previous day’s losses, after refreshing the monthly peak, as it renews its intraday low at 0.6916 during Friday’s Asian session. The Aussie pair’s latest losses could be linked to the downbeat prints of Australia’s flash readings of S&P Global PMIs for July. The pair also bears the burden of the US dollar’s rebound amid sour sentiment.
That said, Australia’s S&P Global Manufacturing PMI eased to 55.7 in July versus 56.2 prior and 56.4 expected. Further, the S&P Global Services PMI dropped to 50.4 during the stated month compared to 55.0 market consensus and 52.6 prior. Further, the S&P Global Composite PMI also declined to 50.6 versus 52.6 in previous readouts.
On the other hand, the US Dollar Index (DXY) picks up bids to refresh its intraday high around 106.70, up 0.12% on a day, as risk-aversion returns to the table. It’s worth noting that the DXY slumped the previous day as it traced the US Treasury yields wherein the benchmark 10-year bond coupons marked the biggest daily slump since mid-June the previous day.
The fall in yields could be linked to the European Central Bank’s (ECB) higher-than-expected 50 basis points (bps) rate hike, as well as the announcement of a new tool called the Transmission Protection Instrument (TPI) to tame disorderly market dynamics in the bloc.
Elsewhere, the resumption of gas flow to Europe by Russia’s Nord Stream 1 pipeline also favored the market sentiment and helped AUD/USD buyers the previous day.
Against this backdrop, Wall Street benchmarks closed firmer and the US Treasury 10-year Treasury yields marked the biggest daily slump in five weeks. That said, S&P 500 Futures drops 0.50% by the press time.
The latest weakness in the market’s sentiment emanates from the recheck of the optimism following the ECB’s verdict, as well as the pre-established fears of recession and covid.
That said, the risk-off mood can weigh on the AUD/USD prices moving forward. However, downbeat forecasts of the US PMIs for July keep buyers hopeful.
Technical analysis
Despite the latest pullback, AUD/USD remains well beyond the weekly support line, at 0.6890 by the press time, which in turn keeps buyers hopeful of challenging the 50-DMA hurdle surrounding 0.6975.
- An Inverted Flag formation is advocating further downside in the DXY.
- Short-term EMAs have turned downside that signaling more weakness ahead.
- The RSI (14) is attempting to shift into the bearish range of 20.00-40.00.
The US dollar index (DXY) is struggling to defend the expectations of carry-forward pessimism. The asset remained extremely volatile on Thursday and ended the trading session on a weak note. The asset is oscillating around 106.60 but with a downside bias as per the broader context.
On an hourly scale, the DXY is forming an Inverted Flag chart pattern that results in a sheer downside move after a consolidation phase. Usually, a consolidation phase denotes the initiation of shorts by the market participants after a time pullback as it provides more conviction towards the downside.
The 20-and 50-period Exponential Moving Averages (EMAs) at 106.83 and 106.92 respectively have turned lower, which adds to the downside filters.
Also, the Relative Strength Index (RSI) (14) is attempting to shift into the bearish range of 20.00-40.00. An occurrence of the same will strengthen bears.
A decisive move below July 20 low at 106.37 will drag the asset towards July 1 high at 105.64, followed by the round-level support at 105.00.
On the flip side, bulls could regain strength if the asset oversteps Tuesday’s high at 107.62, which will send the DXY towards Monday’s high at 107.96. A breach of the latter will drive the asst to near July 13 high at 108.58.
DXY hourly chart
-637940460911681001.png)
| Pare | Closed | Change, % |
|---|---|---|
| AUDUSD | 0.6933 | 0.68 |
| EURJPY | 140.495 | -0.17 |
| EURUSD | 1.02271 | 0.46 |
| GBPJPY | 164.746 | -0.5 |
| GBPUSD | 1.19929 | 0.13 |
| NZDUSD | 0.62517 | 0.36 |
| USDCAD | 1.28669 | -0.14 |
| USDCHF | 0.96653 | -0.48 |
| USDJPY | 137.363 | -0.63 |
- USD/JPY bears rush the longs in the Tokyo open, but bulls eye significant correction.
- Bulls eye the daily M-formation neckline.
USD/JPY bears moved in despite the break of structure and the inverse head and shoulders, trapping breakout traders before the slamming reversal on the back of the European Central Bank event and volatility. The US dollar was heavily offered as the euro soared which has sent a bid into the yen with US yields back under par.
Nevertheless, the broadening formation on the hourly chart and support structure points to a bullish correction as the following chart illustrates:
USD/JPY H1 chart, bullish scenario
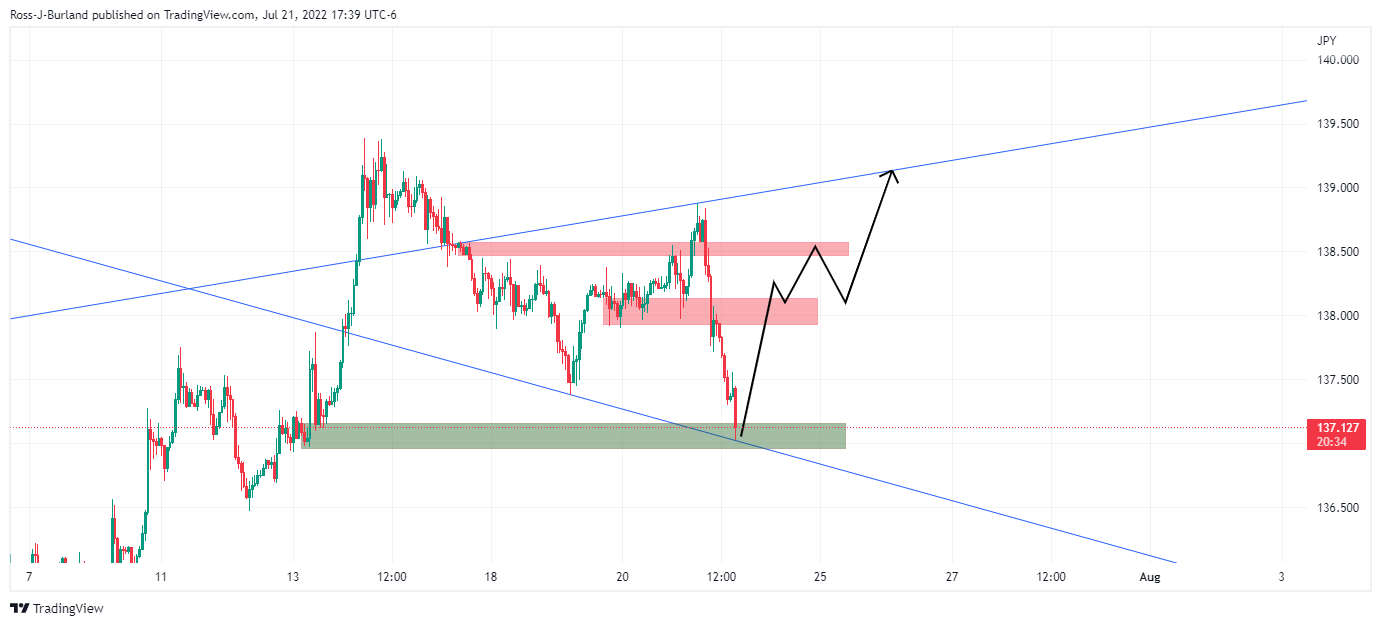
If the bulls commit to the broadening structure in Tokyo, then we could see the makings of a bullish correction and the prospects of an expansion in price to the upside for the days ahead.
USDJPY daily chart
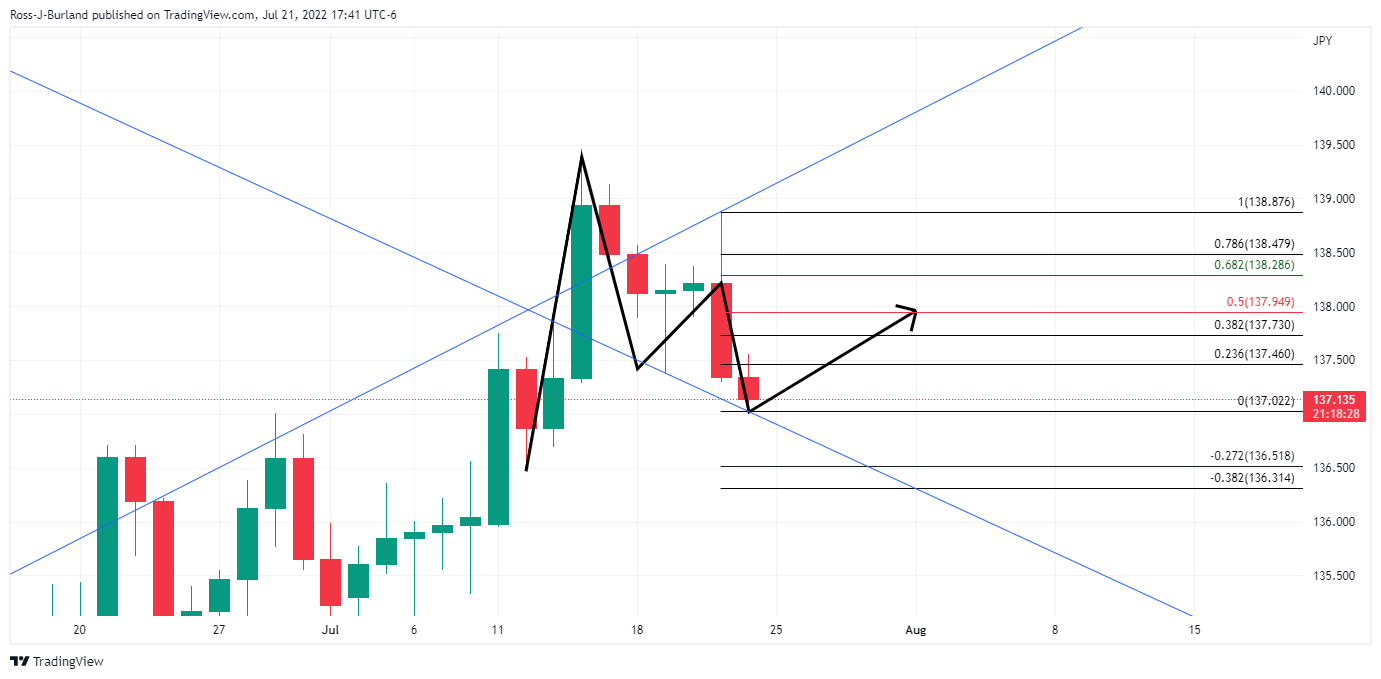
As per the daily chart, the M-formation is a bullish reversion pattern that could see the price revert to the neckline in a 50% mean reversion for the sessions ahead. Bulls will need to commit to the 137 figure or thereabouts.
- Gold price struggles to defend corrective pullback from yearly low.
- ECB, Russia’s Nord Stream 1 triggered risk-on mood.
- Yields drowned US dollar ahead of preliminary PMIs for July.
Gold price (XAUUSD) grinds higher around $1,717-20 on early Friday, after staging the biggest daily rebound in five weeks the previous day. The metal’s corrective pullback from the yearly low took clues from the US dollar’s weakness and upbeat sentiment but the latest cautious mood could well be linked to the lack of major catalysts and cautious mood ahead of the key US activity data for July.
US Dollar Index (DXY) braces for the first weekly loss in four while extending the July 14 reversal from a nearly two-decade high. The greenback’s latest losses could be linked to the US Treasury yields as the benchmark 10-year bond coupons marked the biggest daily slump since mid-June the previous day.
Also read: Gold Price Forecast: Bears keeping XAUUSD in check
Gold price cheered ECB’s 50 bps rate hike

ECB headquarters in Germany
European Central Bank (ECB) crossed market forecasts while announcing 50 basis points (bps) of a rate hike the previous day. In doing so, the region’s central bank returned to the 0.0% rate after more than a decade and resumed confidence among the traders, at least for the short term. Also, the ECB’s announcement of a new tool called the Transmission Protection Instrument (TPI) to tame disorderly market dynamics in the bloc might have favored the market’s optimism and propelled gold price. Above all, the slump in the Treasury yields following the ECB announcement was the widely discussed catalyst that weighed on the US dollar and helped the bullion to rebound from the yearly low.
Nord Stream 1 also favored XAUUSD buyers
In addition to the ECB, the resumption of gas flow to Europe by Russia’s Nord Stream 1 pipeline also favored the market sentiment and helped recall the gold buyers at the yearly low. “Flows through Russia's Nord Stream 1 natural gas pipeline, which runs under the Baltic Sea to Germany, partially resumed after being shut for maintenance on July 11. The pipeline had already run on reduced volumes following a dispute sparked by Russia's invasion of Ukraine,” said Reuters.
Growth fears of China test upside moves
On Thursday, the Asian Development Bank (ADB) raised concerns over China’s economic slowdown and probed gold buyers earlier in the day. The reason could be linked to the dragon nation’s status as one of the biggest gold consumers in the world. “China's economy will likely expand 4.0% this year, the ADB said, a drop of 1 percentage point from its April forecast, but will recover lost ground in 2023 with intact growth seen at 4.8%,” per Reuters.
Options market probe gold bulls
Options market signals continue to tease the gold sellers, after snapping the four-week-old bearish bias by the end of the previous Friday. That said, the daily risk reversal (RR), the spread between the calls and the puts, dropped the most since July by the end of Thursday’s North America trading session. As per the latest Reuters data for gold options, the RR prints -0.135 figures versus +0.015 and +0.105 readings in the last. With this, the weekly RR also turns negative to -0.015.
PMIs are the key
Preliminary figures of the US S&P Global Manufacturing and Services PMI for July are crucial for gold traders moving forward, especially after the ECB and before next week’s Fed meeting. The reason could also be linked to the recession fears and chatters surrounding the central bank’s aggression. That said, the US S&P Global Manufacturing PMI is expected to decline to 52.0 from 52.7 whereas its Services counterpart could ease to 52.6 from 52.7. With this, the Composite PMI may drop to 51.7 from 52.3 prior. Considering the downbeat forecasts for the US data, the US dollar may witness further headwinds and the same could help the gold price to extend the latest rebound if the actual figures match the market consensus.
Gold price technical outlook
Gold price holds onto its bounce off the previous restrict line from July 05, also staying beyond 50-SMA, to keep buyers hopeful amid bullish MACD signals.
However, a fortnight-old resistance line near $1,728 is likely to challenge the XAUUSD buyers ahead of the 100-SMA level surrounding $1,745.
Also acting as an upside hurdle is the July 08 swing high near $1,753, a break of which could welcome gold buyers.
Alternatively, the 50-SMA and the recent lows could restrict the immediate downside respectively around $1,714 and $1,680. However, the quote’s weakness past $1,680 will be challenged by the aforementioned resistance-turned-support near $1,674 by the press time.
Gold: Four-hour chart
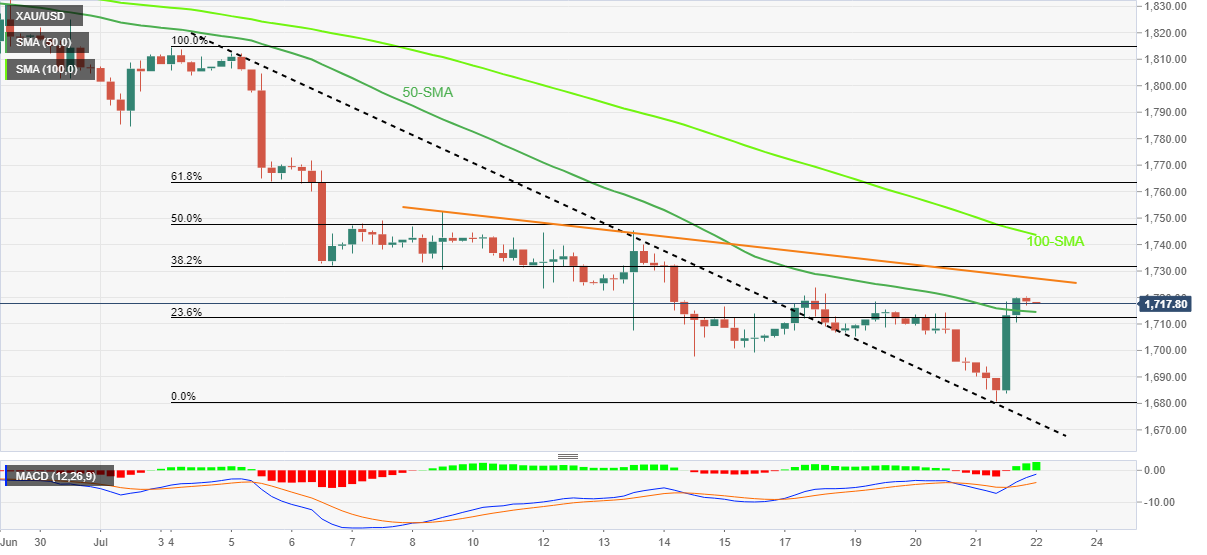
Gold halts decline, but bearish risks still intact


© 2000-2026. Sva prava zaštićena.
Sajt je vlasništvo kompanije Teletrade D.J. LLC 2351 LLC 2022 (Euro House, Richmond Hill Road, Kingstown, VC0100, St. Vincent and the Grenadines).
Svi podaci koji se nalaze na sajtu ne predstavljaju osnovu za donošenje investicionih odluka, već su informativnog karaktera.
The company does not serve or provide services to customers who are residents of the US, Canada, Iran, The Democratic People's Republic of Korea, Yemen and FATF blacklisted countries.
Izvršenje trgovinskih operacija sa finansijskim instrumentima upotrebom marginalne trgovine pruža velike mogućnosti i omogućava investitorima ostvarivanje visokih prihoda. Međutim, takav vid trgovine povezan je sa potencijalno visokim nivoom rizika od gubitka sredstava. Проведение торговых операций на финанcовых рынках c маржинальными финанcовыми инcтрументами открывает широкие возможноcти, и позволяет инвеcторам, готовым пойти на риcк, получать выcокую прибыль, но при этом неcет в cебе потенциально выcокий уровень риcка получения убытков. Iz tog razloga je pre započinjanja trgovine potrebno odlučiti o izboru odgovarajuće investicione strategije, uzimajući u obzir raspoložive resurse.
Upotreba informacija: U slučaju potpunog ili delimičnog preuzimanja i daljeg korišćenja materijala koji se nalazi na sajtu, potrebno je navesti link odgovarajuće stranice na sajtu kompanije TeleTrade-a kao izvora informacija. Upotreba materijala na internetu mora biti praćena hiper linkom do web stranice teletrade.org. Automatski uvoz materijala i informacija sa stranice je zabranjen.
Ako imate bilo kakvih pitanja, obratite nam se pr@teletrade.global.
транcфери