- Analiza
- Novosti i instrumenti
- Vesti sa tržišta
Forex-novosti i prognoze od 13-05-2022
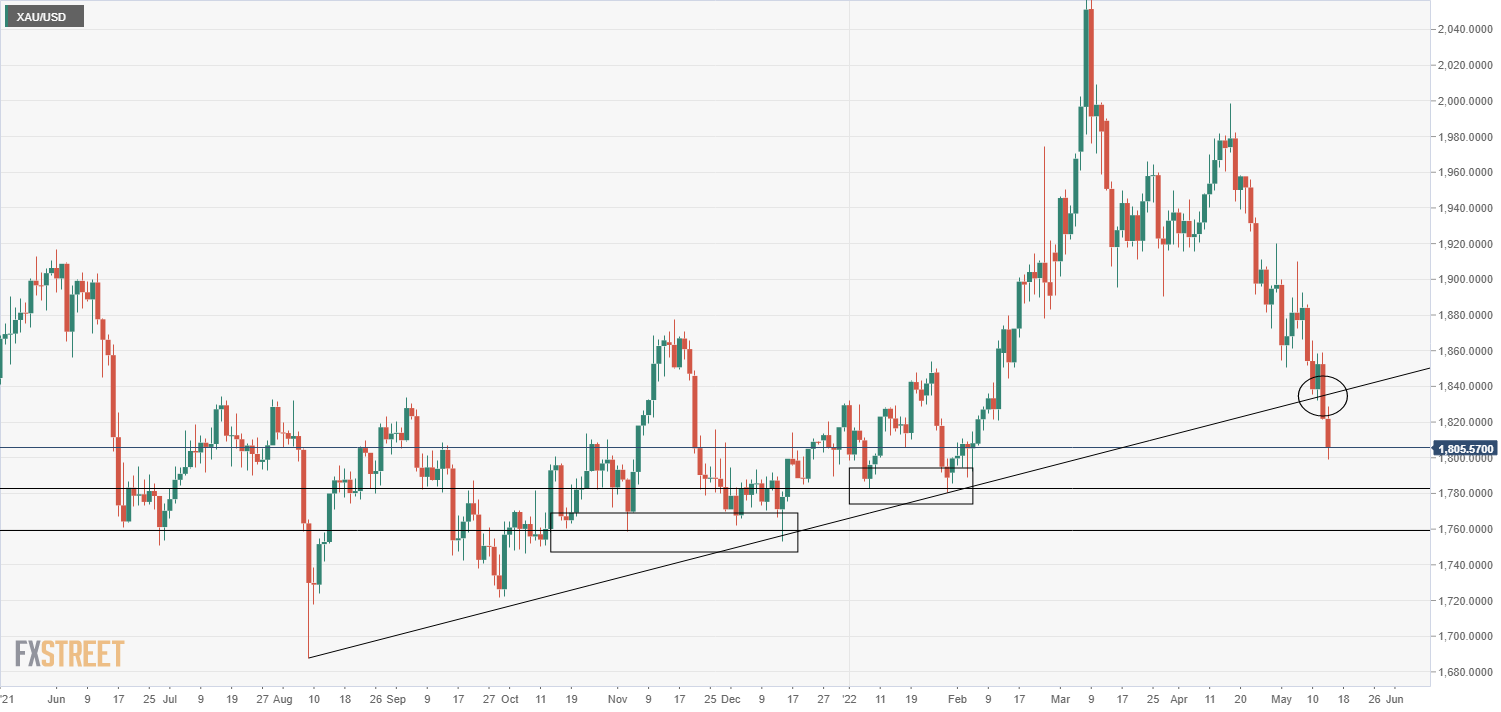
- Gold’s recovery capped by the $1,820 area, stays under pressure.
- Improvement in risk sentiment offers limited help to the yellow metal.
- On a weekly basis, XAU/USD is down almost 4%.
Gold bottomed at $1,799 on Friday, the lowest level since February. A recovery followed later that found resistance quickly at $1,820. The yellow metal remains under pressure.
Some risk returns, not for gold
Wall Street is rising sharply on Friday, on a recovery rally. Also, crude oil prices are printing important gains. US yields remain steady and the dollar is correcting lower. Usually, that environment should be positive for gold. It only helped the metal stay above $1,800.
On the contrary, Silver is staging a recovery back to the 21.00 area and is positive on Friday up 1.50%, while on a weekly basis it is down almost 6%, about to post the lowest close since July 2020.
Both metals remain under pressure in the current environment of higher interest rate, a weaker growth outlook and financial tensions. The technical perspective offers no improvement as the only positive is the extreme oversold readings in technical indicators. There is no sign of a rebound or a consolidation yet.
Gold is about to post a weekly decline of almost 4%, the second worst performance of the year and a close below the 20-week moving average, for the first time since January.
“A prolonged weakening of the dollar doesn’t look likely in the current market environment. The factors that have been driving the greenback’s valuation, namely the ongoing Russia-Ukraine conflict, heightened inflation fears amid lockdowns in China and the Fed’s tightening prospects, should remain intact next week. Hence, it would be reasonable to expect that gold’s recovery attempts are likely to remain limited in the short term”, explained Eren Sengezer, analyst at FXStreet.
Technical levels
The uspide potential of the US dollar versus the Japanse yen is becoming more limited, warned analysts at MUFG Bank. They noted the USD/JPY pair is reverting to a traditional risk-on/risk-off patterns amid financial instability.
Key Quotes:
“The fact that US yields have been more sensitive to asset price declines than to higher than expected inflation could have notable implications for momentum in USD/JPY. If market participants are shifting to the preservation of capital rather than the return on capital and we see leveraged positioning being cut further, USD/JPY is likely to fall further, possibly a lot further.”
“Yesterday, the 1-year USD/JPY risk-reversal had its largest one-day swing favouring JPY upside since 2010 if you exclude the COVID pandemic period. If financial conditions continue to tighten leveraged positioning is most prone to reversal. In that regard, we would point to the yen as being a highly leveraged long position in G10 FX.”
“Financial conditions continue to tighten and if this continues over the coming weeks it should help limit the upside for US rates which we would view as a scenario that leaves USD/JPY most vulnerable to a correction.”
- Higher equity prices weaken the dollar.
- DXY corrects to the downside after rising during a week.
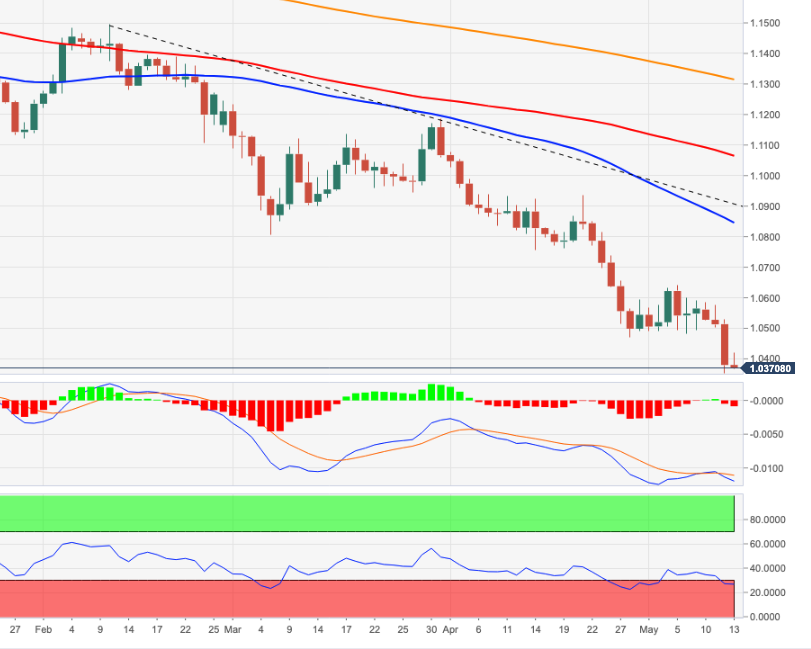
- EUR/USD up on Friday, still down for the week.
The EUR/USD rebounded from the lowest intraday level since 2017 and climbed back above 1.0400 late on Friday amid an improvement in risk sentiment and a correction of the US dollar. Still, the euro is headed toward the lowest weekly close since December 2002.
Stocks up, dollar drops
A recovery in equity prices weakened the greenback that turned negative across the board. The DXY is falling for the first time in seven trading days. US yields remain steady, not following the improvement in risk sentiment. As for writing, the Dow Jones gains 1.56% and the Nasdaq 3.64%. EUR/USD trades near daily high around 1.0410, after falling earlier at 1.0348.
Risk sentiment is the key driver on Friday. Economic data from the US showed a larger-than-expected decline in Consumer Confidence, to the lowest since 2011. Fed’s Kashkari mentioned that inflation is much too high and explained that a recovery in the supply chain could help the Fed.
Technical outlook
The EUR/USD is about to post the sixth weekly decline in a row. “Technical readings in the wider perspective reflect a strong bearish momentum that would likely favor additional declines in the upcoming weeks. Nevertheless, a corrective advance or at least another consolidative phase is on the cards and would help to enhance the dominant trend,” explained Valeria Bednarik, Chief Analyst at FXStreet.
According to Bednarik, the daily chart shows technical indicators “have begun giving signs of bearish exhaustion. The RSI indicator is now flat at around 26, while the Momentum indicator aims marginally higher from a multi-week low.” She places the main bearish target and the immediate support level at 1.0339, the low from January 2017. “Once below the latter should see the pair approaching the 1.0200 figure, and traders start jawboning about parity.”
Technical levels
Analysts at BBVA Research, point out their big data demand proxies and other high frequency indicators, shows a quarterly GDP growth rate close to 1-1.5% in the first quarter, which corresponds to a yearly growth rate of around 7.5%. They added the weaker performance in early April surprisingly turns out to be a recovery in the recent weeks, which increases the upside risks to their 2022 GDP growth forecast of 2.5% assuming no substantial negative shocks.
Key Quotes:
“Larger negative real interest rates, recent push in credits and loose fiscal policy remain supportive in the short term. Also, the recent performance in both exports and tourism show resilience, which surprise on the upside. However, current high financial volatility and uncertainty in global markets, and their potential impact on external demand are clear downside risks to the near term growth outlook.”
“As confirmed by our GDP nowcasts, economic activity has started to decelerate. Nonetheless, the expansionary bias of the government spending, other counter-cyclical policies and the pandemic-related reopening of the economy also help absorb downward pressures. 2Q22 GDP data will provide a clear test to understand the magnitude of the resilience of the economy.”
“If the current pace is sustained and no substantial negative shock occurs, risks are clearly tilted to the upside on our prudent 2022 GDP growth forecast of 2.5%, which at the same time generates significant downside risks for the next year.”
Data released on Friday showed University of Michigan's Consumer Sentiment Index fell to 59.1 in May from 65.2 in April, the lowest reading since 2011. According to analysts at Wells Fargo, there is no shortage of factors to blame for the decline in consumer sentiment, from inflation to rising interest rates and financial market instability.
Key Quotes:
“It is tough to find a silver lining for consumers so far in 2022. Inflation is as bad as it has been in decades. Rising mortgage rates make housing even less affordable. Gas prices are at an all-time high. Supply chain problems are still making everything from infant formula to household appliances hard to find. A selloff in financial markets and the associated dent in retirement accounts weighs on future prospects. Small wonder then that against this grim backdrop the University of Michigan's survey of consumer sentiment came in at its lowest level since 2011 when the economy was just emerging from the recession that followed the financial crisis.”
“The selloff in financial markets is not new, but it certainly worsened in recent weeks. Financial market instability is clearly taking a toll on sentiment.“
“We've made the point previously that consumer sentiment tends to be more impacted by inflation than by the labor market, but it is uncanny how that divergence is playing out. Inflation is so bad that it is able to swamp what is a unique period of labor market strength. Over the past 30 years, in prior periods when the unemployment rate was below 4%, the average level of consumer sentiment was almost 99, 40 points higher than it is today. This points to how bad other factors (particularly inflation) are at this particular moment.”
- USD/CAD breaks range and drops to test Wednesday’s low.
- Wall Street indices rise sharply, extending the rebound.
- Crude oil prices rise more than 3%, WTI approaches $110.00.
The USD/CAD broke under 1.2990 and quickly tumbled to 1.2923, a two-day low. It is hovering around 1.2945/50, still up for the week, but significantly off high, on its way to the highest weekly close since November 2021.
Market sentiment boosts loonie
The US dollar dropped after the beginning of the American session amid an improvement in market sentiment. The rebound in US stocks and in crude oil helped USD/CAD break the range to the downside.
The Jones is up by 1.41% while the Nasdaq gains 3.35%. Crude oil prices are up more than 3%. The WTI barrel trades at $109.38, more than $10 above Wednesday’s low.
The US Dollar Index is pulling back from multi-year highs. Earlier on Friday reached levels above 105.00 and as of writing, trades at 104.65 down 0.10%. The DXY is falling for the first time after rising for six consecutive days.
A strong barrier at 1.2920
Technical factors contribute to the decline in USD/CAD. The break of the range gave more momentum to the loonie. The slide found support at the 1.2920 area that also contained losses on Wednesday. The 200-hour Simple Moving Average is also seen around that area. A break under 1.2920 should open the doors for a test of 1.2900. Below the next support might be located at 1.2865/70.
The USD/CAD looks bearish in the very short term. A recovery above 1.3020 should change the outlook to neutral/bullish. Above awaits resistance at 1.3045.
Technical levels
- WTI has risen for a third straight day into the $109.00s and are eyeing recent highs in the $111.00s.
- Risk-on flows plus concerns about EU/Russia gas trade are supporting WTI for now, though it remains lower on the week.
- But global growth worries and the ongoing China lockdown remain a drag, making a break back above $110 harder.
Oil prices rose for a third straight session on Friday, with front-month WTI future last trading higher by close to $3.0 in the mid-$109.00s per barrel, more than $11 higher than mid-week lows in the $98.00s. The rally on Friday was partially spurred by a rebound in global equity markets at the end of what has, for them, been a difficult week marred by concerns about central bank tightening and weakening global growth.
However, WTI’s rally on Friday still leaves it lower by about $1.0 on the week, though the bullish momentum of the past few days suggests a test of recent highs in the $111.00s is certainly a possibility by the end of this week/early next. Recent bullish momentum in crude oil markets comes despite a few potentially bearish fundamental developments in recent days.
Firstly, Chinese lockdowns show no sign of widely easing yet even as cases in some key cities (like Shanghai) fall, with authorities in Beijing on Friday forced to deny rumors that the capital was headed into full lockdown. Separately, reports suggested the EU may abandon its plans for a Russian oil import embargo amid continued opposition from Hungary.
However, worries about a Russian gas export blockade as Gazprom halts flows to a number of its European sub-units after Russia imposed sanctions on them, and as flows in Ukraine face disruption are likely negating the above noted bearish developments for now. Analysts on Friday have been fretting about the longevity of the global risk asset rally and if sentiment takes a turn for the worse next week, it may be hard for WTI to hold in the upper $110s, especially if the EU’s Russian oil embargo plan collapses.
And oil traders shouldn’t forget that oil markets are also impacted by the very same global growth fears currently weighing on other asset classes. The International Energy Agency (IEA) and OPEC both downgraded their forecasts for oil demand growth in 2022 in their latest monthly reports released on Thursday citing the impact of falling demand in China and slowing growth elsewhere. That’s another reason why, in the absence of further geopolitical risk being built up (EU embargo on Russian oil)/an improvement in the lockdown situation in China, it may be difficult for WTI to break back above $110.
- UoM's headline Consumer Sentiment Index dropped more than expected to 59.1 from 65.2.
- FX markets did not react to the latest downbeat survey.
The preliminary estimate of the University of Michigan's (UoM) Consumer Sentiment Index for May fell to 59.1 versus an expected 64.0 fall from 65.2 in April, its lowest since August 2011, data released on Friday showed. UoM's Consumer Expectations Index fell to 56.3 from 63.0 in April, larger than the expected drop to 62.5, while the Current Conditions Index fell to 63.6 from 69.4, versus an expected small rise to 70.5, its lowest reading since March 2009.
UoM's index of consumer inflation expectations showed that both one and five-year expectations remained steady at 5.4% and 3.0% respectively.
Market Reaction
There was little to no reaction in the US dollar to the latest weaker-than-expected UoM survey, which likely reflects the worsening bite of US inflation on US consumer confidence.
- USD/TRY moves higher to new 2022 peaks around 15.50.
- Turkey Industrial Production expanded 9.6% YoY in March.
- Turkey Retail Sales grew 0.3% MoM also in March.
The Turkish lira continues to grind lower and lifts USD/TRY to new 2022 highs in the 15.50 region on Friday.
USD/TRY up on USD-strength, geopolitics
USD/TRY extends the monthly rebound for the seventh consecutive session on Friday, as the rally in the dollar remains unabated and geopolitical concerns keep the lira on the back foot so far.
On the latter, President Erdogan did not welcome news citing Sweden and Finland will apply for NATO membership amidst increasing tensions between the West and Russia over the war in Ukraine.
Data wise in Turkey for the month of March, Retail Sales expanded 0.3% MoM and 2.5% over the last twelve months. In addition, Industrial Production expanded at an annualized 9.6%, surpassing initial estimates.
What to look for around TRY
USD/TRY keeps the upside well and sound for yet another session and already left behind the 15.00 barrier. So far, price action in the Turkish currency is expected to gyrate around the performance of energy prices, the broad risk appetite trends, the Fed’s rate path and the developments from the war in Ukraine. Extra risks facing TRY also come from the domestic backyard, as inflation gives no signs of abating, real interest rates remain entrenched in negative figures and the political pressure to keep the CBRT biased towards low interest rates remain omnipresent.
Key events in Turkey this week: Unemployment Rate (Tuesday).
Eminent issues on the back boiler: FX intervention by the CBRT. Progress (or lack of it) of the government’s new scheme oriented to support the lira via protected time deposits. Constant government pressure on the CBRT vs. bank’s credibility/independence. Bouts of geopolitical concerns. Structural reforms. Upcoming Presidential/Parliamentary elections.
USD/TRY key levels
So far, the pair is gaining 0.63% at 15.4618 and faces the next hurdle at 15.4832 (2022 high May 13) seconded by 18.2582 (all-time high December 20) and then 19.00 (round level). On the other hand, a drop below 14.6836 (monthly low May 4) would expose 14.5458 (monthly low April 12) and finally 14.5136 (weekly low March 29).
- NZD/USD failed to preserve its modest recovery gains amid the emergence of some USD dip-buying.
- Rebounding US bond yields, aggressive Fed rate hike bets continued acting as a tailwind for the buck.
- Extremely oversold conditions held back bears from placing aggressive bets amid the risk-on impulse.
The NZD/USD pair surrendered its modest intraday gains and dropped to the lower end of its daily trading range, around the 0.6230-0.6225 region during the early North American session.
The pair struggled to capitalize on its attempted recovery move from its lowest level since June 2020 touched earlier this Friday and met with a fresh supply near the 0.6260 region. The risk-on impulse in the markets, along with the prospects for a more aggressive policy tightening by the Fed, allowed the US Treasury bond yields to make a solid comeback. This, in turn, pushed the US dollar to a fresh two-decade high and exerted some downward pressure on the NZD/USD pair.
The markets seem convinced that the Fed would need to take more drastic action to bring inflation under control and are still pricing in a jumbo 75 bps rate hike in June. The bets were reaffirmed by Fed Chair Jerome Powell's comments on Thursday, pledging that the US central bank was prepared to do more to combat stubbornly high inflation. Moreover, investors remain concerned that China's zero-covid policy and the war in Ukraine would continue to push consumer prices higher.
Despite the aforementioned factors, traders seemed reluctant to place aggressive bearish bets around the NZD/USD pair amid extremely oversold conditions on short-term charts. Nevertheless, the major remains on track to post heavy losses for the second successive week and record its lowest weekly close since May 2020. Next on tap will be the release of the prelim US Michigan Consumer Sentiment Index, which might provide some impetus and allow traders to grab short-term opportunities.
Technical levels to watch
- Gold momentarily dropped below $1800 per troy ounce in earlier trade for the first time since early February.
- Bears are eyeing a test of annual lows in the $1780 area following a key trendline break earlier this week.
Spot gold (XAU/USD) prices momentarily dipped below the $1800 per troy ounce level a few minutes ago for the first time since early February, weighed by a wave of US dollar strength heading into the US market open. At current levels just above $1800, XAU/USD is trading lower by about 1.0% on the day and about 4.2% on the week.
Buck strength as a result of a broadly risk-off market mood coupled with continued bets on an aggressive pace of Fed tightening has weighed heavily on the precious metal this week. Fed Chair Jerome Powell's remarks at the Senate (as his second term as Fed Chair was approved) suggest that, in wake of this week's hotter than forecast Consumer Price Inflation data, the Fed remains as committed as ever to getting inflation under wraps and to further rapid monetary tightening.
A clean break below $1800 would open the door to further losses towards the 2022 lows in the $1780 area. The next area of key support is in the $1760 area. Technical selling upon the break below a trend line that had been in play since last August earlier this week is likely exacerbating things for gold.
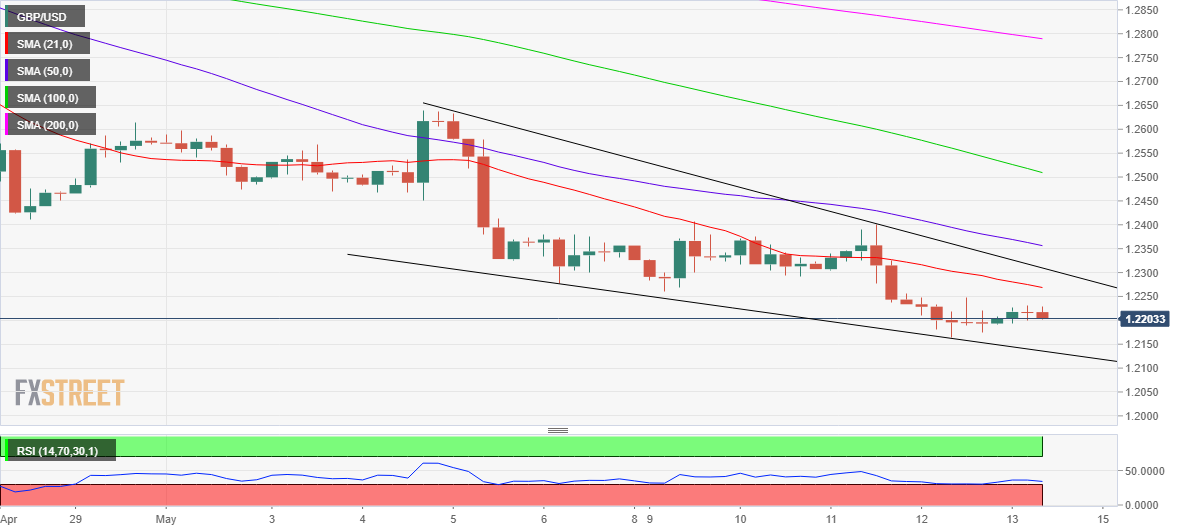
- GBP/USD hit fresh near two-year lows on Friday in the 1.2160s, extending weekly losses to about 1.4%.
- A strong buck, tailwinds from a weak euro, UK economic/BoE tightening outlook concerns and Brexit headlines have weighed this week.
- The pair has dropped around 7.0% in four weeks from above 1.3000 and is eyeing a break under 1.2000.
GBP/USD looks set to end the week at two-year lows in the 1.2160s, falling a further 0.3% on Friday to take weekly losses to around 1.4%. That takes cable’s losses in the past four weeks to a staggering approximately 7.0%. The US dollar has been picking up across the board in the lead-up to the start of the US trading session.
GBP/USD was weighed heavily this week not just by the strong safe-haven US dollar amid risk-off market conditions as markets continued to bet on aggressive Fed tightening, but also a combination of bearish factors emanating from the UK and Europe. Firstly, Brexit has been back in the headlines with the UK and EU still at loggerheads over the Irish/Northern Irish border.
The UK is threatening to scrap the post-Brexit arrangement (the Northern Ireland Protocol), but the EU is saying if they do that, they will scrap the entire post-Brexit trade deal they have with the UK. Traders have thus been upping political risk premia over the past few days and a resolution doesn’t appear likely any time soon.
Meanwhile, the euro came under severe pressure on Thursday amid a number of bearish geopolitical developments relating to relations and trade (particularly in energy with Russia). Long story short, Russia is angry that EU member nations Sweden and Finland want to joining NATO, has sanctions on various European gas companies (to which they are now no longer sending gas) and gas going through Ukraine is also facing disruption.
This weighed heavily on the typically quite closely correlated British pound, though the pound also still has domestic economic woes to contend with. Data out on Thursday revealed a surprise contraction in UK GDP in March and comes off the back of an even uglier Retail Sales report for the same month, both of which reflect the economic bite of the worst cost-of-living crisis in the UK in decades.
Worries about UK economic weakness (many economists are forecasting a slip into recession this year) stoke worries that the BoE won’t be able to tighten policy much more. While a few BoE hawks are still pushing for more tightening, they may increasingly find themselves in a minority on the Monetary Policy Committee (MPC). The UK’s relatively weaker economic outlook and relatively more dovish outlook for central bank tightening versus the US thus has been a key reason for the decline these last four weeks, and will probably send the pair lower yet.
The next key level of support to the downside is the May 2020 lows in the 1.2050 area and, beyond that, it’s a clear run all the way lower to the 2020 lows in the mid-1.1400s. Calling a test of this level might be a bit premature (maybe the US economy will underperform in H2 this year, and USD weaken..?), but GBP/USD moving under 1.2000 looks very much on the cards in the not too distant future.
The key market events that GBP/USD traders will be watching next week will be the appearance of multiple BoE MPC members at a parliamentary hearing on Monday, followed by UK jobs data, US Retail Sales data and a speech from Fed Chair Jerome Powell on Tuesday. On Wednesday, UK April Consumer Price Inflation data is out, followed by UK April Retail Sales figures on Friday. Fed speak and a few more BoE speakers are scattered throughout the week.
- EUR/USD fails to extend the move beyond 1.0400.
- The door is now open to a visit to the 2017 low at 1.0340.
EUR/USD’s daily bullish attempt ran out of steam near 1.0420 on Friday.
Extra retracements remain well on the cards for the time being. That said, bets are now on the rise for a test of the 2017 low at 1.0340 sooner rather than later. This area is reinforced by the 2003 low at 1.0334 (January 2).
Below the 3-month line around 1.0900, EUR/USD is expected to remain under pressure and vulnerable to extra losses.
EUR/USD daily chart
GBP/USD trades above Thursday’s new cycle low near 1.2165. Economists at BBH expect the pair to test the May 2020 low around 1.2075.
Bank of England tightening expectations have cooled
“We look for a test of the May 2020 low near 1.2075. After that, we have to start talking about the March 2020 low near 1.1410.”
“WIRP suggests another 25 bp hike is priced in for the next meeting June 16. Looking ahead, the swaps market is pricing in 125 bp of total tightening over the next 12 months that would see the policy rate peak near 2.25% vs. 2.5% at the start of this week.”
“April CPI data will be reported next Wednesday, with headline expected at a whopping 8.9% YoY vs. 7.0% in March. Therein lies the dilemma for the BoE, which at this point appears unwilling to confront the inflation problem head on as the Fed is trying to do. This is why we remain negative on sterling.”
EUR/USD could still visit 1.0340, the 2017 low. A break below here would clear the way for a return to parity, economists at TD Securities report.
EUR/USD to face a correlation drag from USD/CHF's push to parity
“The latest push below 1.05 in EUR/USD puts multi-year 1.0341 in the cross-hairs. A break of this level will open a return to parity, a condition that was last observed roughly 20 years ago.“
“EUR/USD could continue to face a correlation drag from USD/CHF's push to parity as well.”
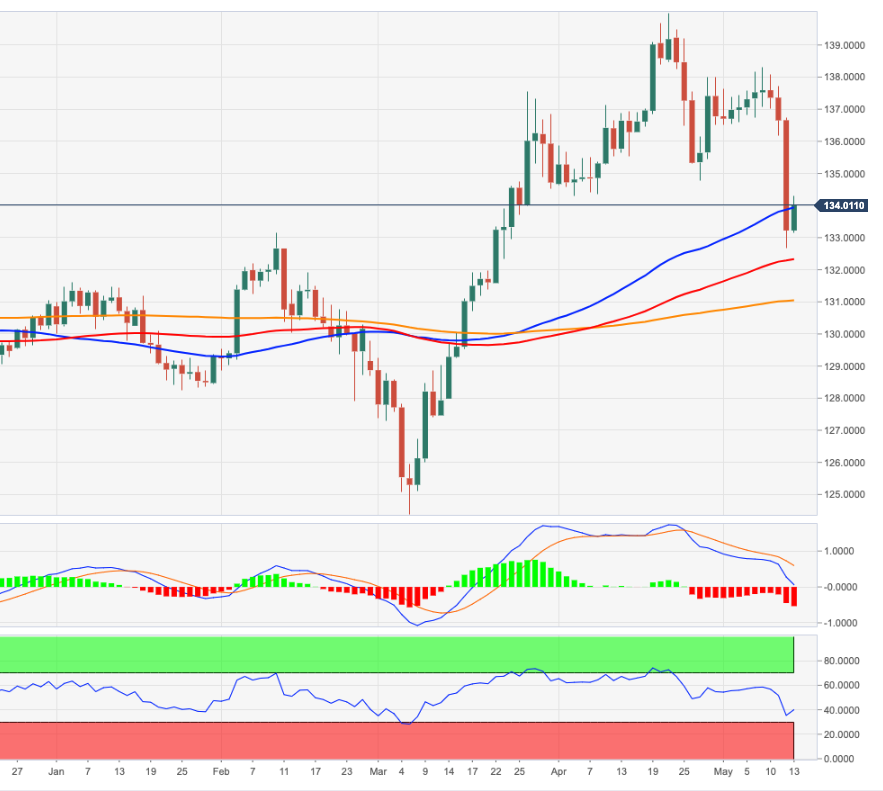
- A combination of supporting factors assisted USD/JPY to regain positive traction on Friday.
- Bulls, however, seem struggling to capitalize on the move beyond the 23.6% Fibo. level.
- Weakness back below the 128.00 mark would pave the way for a deeper corrective slide.
The USD/JPY pair built on the overnight late rebound from over a two-week low and gained some follow-through traction on the last day of the week. The pair maintained its bid tone through the early North American session and was last seen trading just below the 129.00 mark, up nearly 0.50% for the day.
The risk-on impulse - as depicted by a strong recovery in the equity markets - undermined the safe-haven Japanese yen and acted as a tailwind for spot prices. Bulls further took cues from a solid rebound in the US Treasury bond yields, though a softer tone surrounding the US dollar capped the USD/JPY pair.
From a technical perspective, the recent pullback from a two-decade high stalled on Thursday near the 38.2% Fibonacci retracement level of the 121.28-131.35 strong move up. The mentioned support, around mid-127.00s, should act as a pivotal point for traders and help determine the near-term trajectory.
The subsequent move up, however, lacked follow-through beyond the 23.6% Fibo. level. This warrants some caution for bullish traders and positioning for any further appreciating move. In the meantime, the 128.50 region now seems to protect the immediate downside ahead of the 128.00 round-figure mark.
A convincing break below the latter would be seen as a fresh trigger for bearish traders and make the USD/JPY pair vulnerable to retesting mid-127.00s (38.2% Fibo.). the corrective decline could further get extended towards the 127.00 mark en-route the 50% Fibo. level, around the 126.45 region.
On the flip side, any subsequent move up is likely to confront stiff resistance near the 129.75-129.80 region. This is closely followed by the 130.00 psychological mark, which if cleared will negate any near-term negative bias. The USD/JPY pair might then aim back to reclaim the 131.00 round figure.
USD/JPY 4-hour chart
-637880437375331994.png)
Key levels to watch
Aggressive rate hikes and a stronger US dollar are headwinds for gold in the short-term. However, economists at ANZ Bank expect the yellow metal to remain underpinned by soaring inflation and global growth concerns.
Reversal of the USD strength would be positive for gold
“Investors have flocked to the US dollar, as prospects of an economic slowdown in Europe rise and the US begins what could be an aggressive rate hike cycle. While the US dollar looks strong in the short term, any sign of peaking could stabilise gold prices.”
“Gold’s status as an inflation hedge is waning, as the risk of more aggressive monetary tightening rises. That said, the darkening economic backdrop and subsequent sell-off in equity markets should provide some support.”
- AUD/USD has rebounded into the upper 0.6800s, though remains on course for hefty on-the-week losses of over 2.5%.
- Risk asset weakness plus China lockdown/growth concerns that have weighed on industrial commodities hit the Aussie hard this week.
- Focus next week will be on Chinese data, the RBA minutes plus Australian Q1 WPI and labor market data.
The Aussie has staged a rebound on Friday in tandem with other recently hard-hit risk assets, though remains on course to post ugly on the week losses amid concerns about China lockdowns and amid associated recent downside in industrial commodity prices. AUD/USD is at present trading in the 0.6880s, higher by about 0.5% on the day after the pair hit its lowest levels since June 2020 on Thursday in the 0.6830 area.
However, the pair remains on course to end the week more than 2.5% lower, taking its losses in the last six weeks since it posted 2022 highs in the upper 0.7600s to more than 10%. Cities representing around 40% of China’s GDP, including Shanghai and Beijing, remain under some degree of Covid-19-related lockdown as of the end of this week, analysts said on Friday, warning in the same breath that upcoming Retail Sales and Industrial Production data this weekend will probably be ugly.
China also placed limits on unnecessary travel to and from the country this week. Against the backdrop of a weakening Chinese economy as it presses ahead with its zero-Covid-19 strategy and resultant harsh restrictions, it is probably too soon to bet on a rebound back into the 0.70s for AUD/USD.
A massive turnaround in the market’s appetite for risk might be enough to do it, but that also doesn’t seem likely, with the latest commentary from Fed Chair Jerome Powell on Thursday suggesting the Fed is as keen as ever to press ahead with monetary tightening in wake of this week’s hotter than forecast US inflation data. A rally back to the significant resistance area around 0.7000 (late 2021/early 2022 lows) likely remains a sell for many traders.
The minutes of the RBA’s last policy meeting where they surprised markets with a larger than expected 25 bps rate hike to 0.35% will be released on Monday, ahead of key Q1 Wage Price Index (WPI) data on Wednesday and April labour market figures on Thursday. While there will be plenty of focus on the outlook for RBA policy (more hikes expected) and the Australian economy (wage pressures likely building as the labour market tightens), this has not been a key driver of AUD/USD lately.
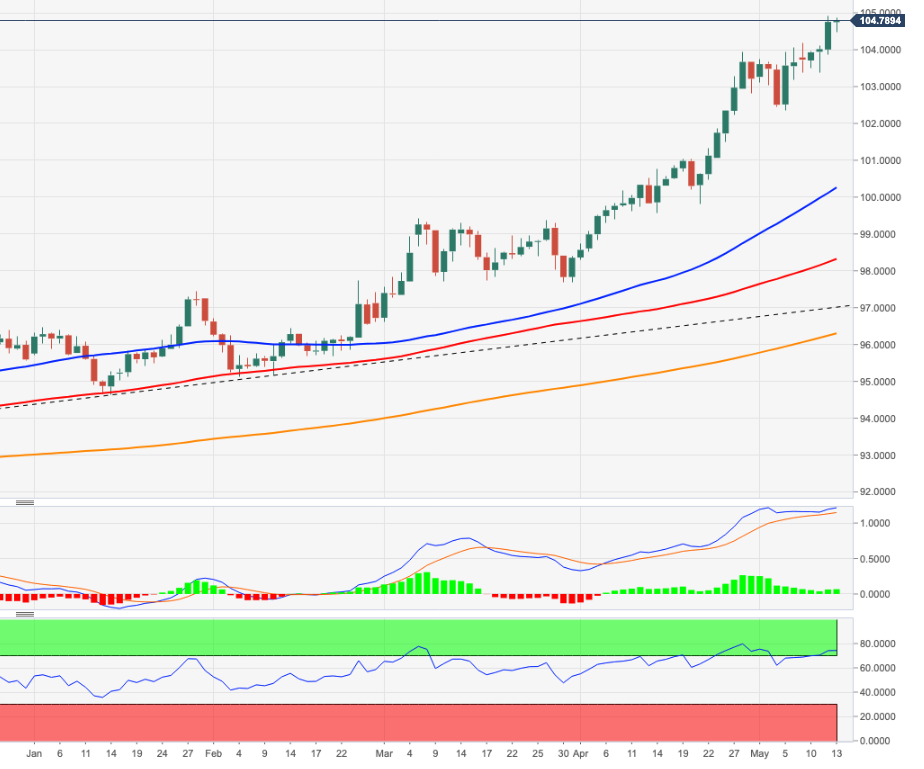
- DXY looks to challenge Thursday’s highs near 105.00.
- Further upside should target the 105.60/65 region.
DXY keeps the bullish bias well in place north of the 104.00 hurdle at the end of the week.
Considering the ongoing price action, further gains in the index remains well on the cards and with the immediate hurdle at the round level at 105.00 ahead of 105.63 (December 11 2002 high). Further up, the index is expected to challenge the December 2002 high at 107.31.
The current bullish stance in the index remains supported by the 8-month line around 97.00, while the longer-term outlook for the dollar is seen constructive while above the 200-day SMA at 96.28.
DXY daily chart
- A combination of factors prompted some selling around USD/CAD on the last day of the week.
- An uptick in oil prices underpinned the loonie and exerted pressure amid modest USD weakness.
- Rebounding US bond yields, Fed rate hike bets should limit losses for the USD and lend support.
The USD/CAD pair maintained its offered tone heading into the North American session and was last seen trading near the daily low, around the 1.3000 psychological mark.
The pair witnessed some selling on the last day of the week and extended the overnight modest pullback from the 1.3075 region, or its highest level since November 2020. Crude oil prices edged higher for the third successive day and underpinned the commodity-linked loonie. Apart from this, modest US dollar pullback from a two-decade high exerted downward pressure on the USD/CAD pair.
Concerns about tightening global supply amid the prospect of a European Union ban on Russian oil turned out to be a key factor that acted as a tailwind for the black liquid. That said, worries about faltering global demand on the back of strick COVID-19 lockdowns in China and slowing global growth might keep a lid on any meaningful gains for crude oil, at least for the time being.
On the other hand, a goodish recovery in the global risk sentiment - as depicted by a positive tone around the equity markets - dented demand for the traditional safe-haven buck. That said, a combination of factors helped limit any deeper USD corrective slide and supports prospects for the emergence of some dip-buying around the USD/CAD pair, warranting caution for bearish traders.
The risk-on impulse in the markets, along with the prospects for a more aggressive policy tightening by the Fed, triggered a solid rebound in the US Treasury bond yields. In fact, Fed Chair Jerome Powell pledged on Thursday that the US central bank was prepared to do more to curb soaring inflation and is ready to raise interest rates by 50 bps at each of the next two policy meetings.
Hence, it will be prudent to wait for strong follow-through selling before confirming that the USD/CAD pair has topped out in the near term. Market participants now look forward to the prelim US Michigan Consumer Sentiment Index for a fresh impetus. Apart from this, oil price dynamics should allow traders to grab some short-term opportunities on the last day of the week.
Technical levels to watch
- Gold prices continue to trade with a negative bias in the upper $1810s as the buck remains resilient.
- XAU/USD looks on course to post its fourth successive weekly decline and worst weekly performance since June 2021.
- With the 200DMA broken, technicians are eyeing support in the form of annual lows around $1780 as the next target.
Spot gold (XAU/USD) prices continue to trade with a negative bias on the final trading day of the week, having hit their lowest levels in more than three months just above $1810 earlier in the session. At current levels in the upper $1810s per troy ounce, gold is trading about 0.2% lower and looks on course to post a weekly loss of around 3.5%, which would mark a fourth successive week in the red and gold’s worst weekly performance since June 2021.
The main driver of gold weakness this week has been the strength of the US dollar, with the Dollar Index (DXY) looking on course to close out the week close to multi-decade highs in the upper 104.00s. A stronger US dollar makes USD-denominated commodities like XAU/USD more expensive for international buyers.
The buck’s resilience on Friday comes despite a rebound in risk appetite which has seen stocks and crypto rally, arguably burnishing gold’s safe-haven appeal. Price action in US bond markets has also been unfavourable for the precious metal this week. While nominal yields (though higher on Friday) look set to end the week substantially lower, real yields are little changed.
That means lower inflation expectations (to be exact, 10-year breakevens have fallen over 20 bps this week to under 2.70%, their lowest since early March), implying a reduced demand for inflation protection. This hurts gold, given the asset is often seen as a hedge against inflation.
Fed chair Jerome Powell’s remarks on Thursday didn’t seem to rock the boat much. He reiterated that he sees 50 bps rate hikes at upcoming meetings as appropriate. Looking ahead on Friday, gold traders will be watching the release of the US University of Michigan Consumer Sentiment survey for May at 1500BST for insights as to how US consumers are holding up in the face of still sky-high inflation.
Any fresh commentary from Fed speakers that might move the needle regarding tightening expectations would also be worth noting. With XAU/USD having broken below its 200-Day Moving Average on Thursday, many technicians predict further downside towards annual lows in the $1780 area.
- GBP/JPY regained positive traction on Friday and recovered a part of the overnight slump.
- The risk-on impulse undermined the safe-haven JPY and extended support to spot prices.
- A bleak outlook for the UK economy might act as a headwind and cap any further upside.
The GBP/JPY cross maintained its bid tone through the mid-European session and was last seen trading around the 157.35 region, up nearly 0.50% for the day.
A goodish recovery in the global risk sentiment - as depicted by a generally positive tone around the equity markets - undermined the safe-haven Japanese yen on Friday. This, in turn, was seen as a key factor that prompted some short-covering around the GBP/JPY cross and allowed spot prices to move further away from a near two-month low touched the previous day.
The attempted recovery, however, lacked bullish conviction amid looming recession fears, further fueled by Thursday's softer UK macro releases. The data suggested that the Bank of England's rate hike cycle could be nearing a pause. This might continue to act as a headwind for the British pound and hold back traders from placing aggressive bullish bets around the GBP/JPY cross.
From a technical perspective, spot prices stalled the recent bearish trend on Thursday ahead of the very important 200-day SMA. The subsequent move up supports prospects for additional gains. That said, the fundamental backdrop makes it prudent to wait for strong follow-through buying before confirming that the GBP/JPY cross has bottomed out in the near term.
Technical levels to watch
- EUR/JPY regains the smile following Thursday’s sharp drop.
- Extra gains are likely above the May high near 138.30.
Following Thursday’s deep sell-off, EUR/JPY seems to have met some decent contention near 132.60 for the time being.
If the recovery picks extra pace, then the cross could see the downside mitigated on a close above the May peak at 138.31 (May 9). The surpass of the latter should put a potential visit to the 2022 high at 140.00 (April 21) back on the radar.
In the meantime, while above the 200-day SMA at 131.02, the outlook for the cross is expected to remain constructive.
EUR/JPY daily chart
Senior Economist at UOB Group Alvin Liew comments on the publication of the US inflation figures for the month of April.
Key Takeaways
“Even as US CPI inflation came off its Mar highs, it was still at an elevated print of 0.3% m/m, 8.3% y/y in Apr (from 1.2% m/m, 8.5% y/y in Mar). Core CPI (which excludes food and energy) inflation was also off its highs, coming in at 6.2% y/y for Apr, from 6.5% y/y in Mar but of greater concern was that on a sequential basis, core inflation rose by a faster 0.6% m/m (up from 0.3% m/m in Mar), and above Bloomberg estimate of 0.4%.”
“The month of Apr continued to show broad based pressures just like in the last few months of 2021 and Jan 2022, but notably, while most of the main categories within the CPI basket saw m/m price increases, there was an increase to three main categories that registered m/m declines in Apr (transport, apparel, education and communications). The biggest contributions of the 0.3% m/m increase for headline CPI came from shelter, food, airline fares, and new vehicles, offsetting the declines in gasoline prices, used cars and trucks and apparel. As for the larger 0.6% m/m increase for the core CPI, in addition to the increases from shelter, airline fares, and new vehicles, indexes for medical care, recreation, and household furnishings and operations also added to the m/m increase.”
“Goods inflation dipped sequentially for the first time since Nov 2020, coming in at -0.3% m/m, 13% y/y in Apr but the bigger worry is services inflation – a far bigger and thus more important component of CPI at 60.2% weight – which continued to accelerate, increasing by 0.8% m/m, 5.4% y/y (from 0.7% m/m, 5.1% y/y in Mar). This is the fastest m/m increase since Jan 2001, while the y/y jump is the largest since May 1991 (5.44% y/y). The accelerating services inflation will be an increasing concern for the Federal Reserve (Fed) as it is a reflection of US wage pressures, amplifying the rising risks of a wage-price inflation spiral.”
“Our key worry from the latest Apr CPI report is the accelerating services inflation which is clearly flashing warnings about the wage-price spiral. We expect inflation to head higher in 2Q before some easing in 2H, and we will further raise our headline CPI inflation forecast to average 6.5% (from 6% previously) while the core CPI inflation to average 6% (from 5.5%) for 2022. Subsequently, we still expect both headline and core inflation to ease in 2023 to average 2.5%.”
UOB Group’s Senior Economist Julia Goh and Senior Economist Loke Siew Ting review the latest GDP figures in the Philippines.
Key Takeaways
“The Philippines’ economy got off to a strong start this year, with 1Q22 GDP growth accelerating to a three-quarter high of 8.3% y/y (from an upwardly revised 7.8% in 4Q21 vs 7.7% previously). The reading came in well above our estimate (+7.6%) and Bloomberg consensus (+6.8%). It was propelled by a persistent expansion across all sectors, the strongest household consumption growth on record, robust investment and continued stock replenishment activities regardless of the Omicron wave hit during the quarter.”
“Despite rising external challenges, we believe that the Philippines’ economic recovery prospects remain intact through 2022. Positive growth catalysts include the country's border reopening to foreign visitors since Feb, the ongoing targeted government policy support, the world’s transition to endemicity, and the likelihood of broader policy continuity after Monday's (9 May) presidential elections. We reiterate our 2022 full-year GDP growth forecast at 6.5% (official est: 7.0%-9.0%).”
- EUR/USD trims initial gains beyond the 1.0400 mark on Friday.
- German 10y Bund yields reverse part of the recent decline.
- EMU Industrial Production contracted less than expected in March.
The better sentiment in the risk-linked complex helped EUR/USD regain some poise and retake the 1.0400 hurdle and beyond earlier on Friday.
EUR/USD could still visit 1.0340
Despite the current bullish attempt, price action around EUR/USD keeps pointing to the likeliness of a deeper pullback in the short-term horizon and with the immediate target at the 2017 low at 1.0340 (January 3).
As usual, the negative stance in the pair follows the constructive perspective around the greenback, always against the backdrop of the tighter normalization of the Fed’s monetary conditions in the next months.
Friday’s improvement in the European currency also echoes in the German 10y Bund yields, which manage to return to the positive territory after four consecutive daily retracements.
In the domestic calendar, Industrial Production in the broader Euroland contracted at a monthly 1.8% in March and 0.8% over the last twelve months. Later in the NA session, the preliminary U-Mich Consumer Sentiment for the current month is due seconded by the speech by Fed’s Kashkari.
What to look for around EUR
EUR/USD battles to retake the 1.0400 mark on a convincing fashion amidst the recent worsening of the risk trends, while the outlook for the single currency remains entrenched into the negative view for the time being. As usual, price action in spot should reflect dollar dynamics, geopolitical concerns and the Fed-ECB divergence. Occasional pockets of strength in the single currency, in the meantime, should appear reinforced by firmer speculation the ECB could raise rates at some point in the summer, while higher German yields, elevated inflation and a decent pace of the economic recovery in the region are also supportive of an improvement in the mood around the euro.
Key events in the euro area this week: EMU Industrial Production (Friday).
Eminent issues on the back boiler: Asymmetric economic recovery post-pandemic in the euro area. Speculation of ECB tightening/tapering later in the year. Impact on the region’s economic growth prospects of the war in Ukraine.
EUR/USD levels to watch
So far, spot is up 0.06% at 1.0384 and faces the next hurdle at 1.0641 (weekly high May 5) followed by 1.0936 (weekly high April 21) and finally 1.1000 (round level). On the other hand, the breach of 1.0353 (2022 low May 12) would target 1.0340 (2017 low January 3 2017) en route to 1.0300 (round level).
- EUR/GBP attracted some dip-buying on Friday and reversed a part of the overnight sharp pullback.
- The euro drew support from comments by ECB policymakers, hinting at a July interest rate hike.
- Concerns about the economic fallout from the Ukraine crisis held back bulls from placing fresh bets.
The EUR/GBP cross maintained its bid tone through the first half of the European session and was last seen hovering near the daily high, around the 0.8525 region.
Following the overnight turnaround from the 0.8615-0.8620 area, or the highest since September 2021, the EUR/GBP cross attracted fresh buying in the vicinity of the 0.8500 psychological mark on Friday. The shared currency's relative outperformance comes amid hawkish comments by ECB policymakers, hinting toward a July interest rate hike.
On the other hand, the British pound was pressured by Thursday's softer UK macro data, which reaffirmed a bleak economic outlook and suggested that the Bank of England's rate hike cycle could be nearing a pause. This was seen as another factor that acted as a tailwind for the EUR/GBP cross, though the uptick lacked bullish conviction.
Concerns that the Eurozone economy would suffer the most from the Russia-Ukrain war held back bulls from placing aggressive bets around the EUR/GBP cross. In the latest developments, Ukraine announced that it would suspend Gazprom gas transit on its territory. Separately, Finland confirmed that it would apply to join NATO "without delay".
Sweden is also expected to follow suit amid security concerns after Russia invaded Ukraine. The Kremlin reacted by warning it will be forced to take retaliatory “military-technical” steps. Given its proximity, investors remain worried about the spillover effect might prevent the European Central Bank from lifting interest rates.
From a technical perspective, the emergence of some dip-buying near a descending trend-line resistance breakpoint, now turned support, favours bullish traders. The mixed fundamental backdrop, however, warrants some caution before positioning for any firm near-term direction amid absent relevant market moving economic releases.
Technical levels to watch
Despite the Bank of Japan’s (BOJ) policymakers insisting on maintaining the monetary policy ultra-easy, Takenobu Nakashima, Chief Rates Strategist at Nomura Securities, said that markets could be in for a surprise rate hike announcement from the BOJ.
Key quotes
“Wariness continues to linger in markets about the BOJ doing some sort of policy tweak -- not just widening the band to allow for 10-year yields to move.”
“Speculation for a policy shift is particularly strong among foreign investors.”
“Traders likely remember that BOJ Governor Haruhiko Kuroda suddenly introduced a negative rate policy in 2016, despite having denied such a move was a possibility at the time.”
Meanwhile, the two-year forward overnight index swaps climbed to a high of 0.19% -- a gap of about 20 basis points above the current rate -- a sign of increased speculation that a shift in policy lies ahead, per Bloomberg.
Extra gains could motivate USD/CNH to challenge the 6.8500 area in the next weeks, commented FX Strategists at UOB Group Lee Sue Ann and Quek Ser Leang.
Key Quotes
24-hour view: “Our expectations for USD ‘to trade between 6.7300 and 6.7800’ yesterday were incorrect as it lifted off and rocketed to a high of 6.8310 before pulling back. The outsized advance appears to be overdone and USD is unlikely to strengthen much further. For today, USD is more likely to consolidate and trade within a range of 6.7900/6.8350.”
Next 1-3 weeks: “We have held a strong USD view for about a month now. In our latest narrative from Wednesday (11 May, spot at 6.7500), we highlighted that upward momentum has waned somewhat but until there is a clear breach of 6.7100, we still see chance for one more push higher in USD to 6.8000. Yesterday (12 May), USD lifted and blew past 6.8000 to reach a high of 6.8310. The boost in momentum is likely to lead to further USD strength towards 6.8500. On the downside, a breach of 6.7650 (‘strong support’ level previously at 6.7100) would indicate that the current USD rally is ready to take a breather.”
The central bank’s 2%price target could be made more flexible, and perhaps reshaped as a medium-, or longer-term objective, Kenzo Yamamoto, a former Bank of Japan (BOJ) Executive Director told MNI in an interview on Friday.
Key quotes
“The BOJ should also drop its cap on yields of 10-year government bonds, currently enforced by unlimited daily fixed-rate bond-buying operations.”
"The average price gap between the U.S. and Japan for the 29 years from 1993, when core Japanese CPI fell below 2%, until 2021 is estimated to be about 1.8 percentage points.”
“Japanese inflation would only reach 2% when the rate of increases in U.S. prices was considerably higher.”
"Despite economic growth, the 2% price target hasn't been achieved, which shows that the 2% target is too high.”
Market reaction
The US dollar pullback and the verbal intervention by the Japanese authorities have dragged USD/JPY back below 129.00. The pair is trading at 128.78, adding 0.37% on the day.
- Gold staged modest recovery from over a three-month low touched earlier this Friday.
- The USD eased from a two-decade high and extended some support to the commodity.
- The risk-on impulse, rebounding US bond yields and Fed rate hike bets capped gains.
Gold reversed an intraday dip to the $1,810 region and staged modest recovery from over a three-month low touched earlier this Friday. The intraday uptick, however, lacked any follow-through and remained capped below the $1,830 level. The XAU/USD now seems to have stabilized in neutral territory and was seen trading around the $1,822-$1823 region during the early part of the European session.
The US dollar edged lower on the last day of the week as bulls opted to take some profits off the table following the recent run-up to a 20-year high. This, in turn, was seen as a key factor that extended some support to the dollar-denominated gold. That said, a combination of factors acted as a headwind for the precious metal and kept a lid on any meaningful recovery, at least for the time being.
A relief rally in the global equity markets dented demand for traditional safe-haven assets, which was reinforced by a solid rebound in the US Treasury bond yields. Apart from the risk-on impulse, the prospects for a more aggressive policy tightening by the Fed held back traders from placing bullish bets around the non-yielding gold. This warrants some caution before confirming a near-term bottom.
Fed chair Jerome Powell also reaffirmed on Thursday that the central bank is ready to raise interest rates by 50 bps at each of the next two policy meetings. Powell further pledged that the Fed was prepared to do more to curb soaring inflation. The fundamental backdrop favours the USD bulls and suggests that the recent downward trajectory for gold prices might still be far from being over.
Even from a technical perspective, the metal on Thursday confirmed a fresh bearish breakdown below the very important 200-day SMA. Hence, any subsequent move up might still be seen as a selling opportunity and runs the risk of fizzling out rather quickly. Traders now look forward to the prelim US Michigan Consumer Sentiment Index for a fresh impetus later during the early North American session.
Technical levels to watch
Eurozone’s Industrial Production fell less than expected in March, the official data published by Eurostat showed on Friday, suggesting a slowdown in manufacturing sector activity.
The industrial output in the bloc arrived at -1.8% MoM vs. a 2.0% drop expected and 0.5% last.
On an annualized basis, the industrial output dropped by 0.8% in March versus a -1.0% decline expected and February’s 1.7%.
FX implications
The shared currency fails to find any inspiration from the upbeat Eurozone industrial figures.
At the time of writing, EUR/USD gains 0.25% on the day to trade at 1.0405.
About Eurozone Industrial Production
Industrial Production is released by Eurostat. It shows the volume of production of Industries such as factories and manufacturing. Uptrend is regarded as inflationary which may anticipate interest rates to rise. Usually, if high industrial production growth comes out, this may generate a positive sentiment (or bullish) for the EUR, while low industrial production is seen as a negative sentiment (or bearish).
- DXY retreats from recent cycle peaks near 105.00.
- US yields edge higher as risk sentiment improves on Friday.
- Flash Consumer Sentiment, Fedspeak next in the docket.
The greenback, when measured by the US Dollar Index (DXY), gives away some gains and returns to the 104.60 region at the end of the week.
US Dollar Index retreats from 19-year tops
The index comes under some selling pressure on Friday against the backdrop of a mild improvement in the risk-associated universe.
Indeed, the dollar sheds some ground after hitting fresh peaks in levels last seen in December 2002 just below 105.00 the figure on Thursday. The recent sharp move higher was exclusively in response to the abrupt re-emergence of the risk aversion.
The risk-on mood is also seen in the US cash markets, as yields manage to regain some ground lost along the curve.
Later in the US calendar, May’s advanced Consumer Sentiment is due along with the speech by Minneapolis Fe N.Kashkari (2023 voter, dove).
What to look for around USD
The dollar corrects lower after climbing to the boundaries of the 105.00 mark on Thursday, or new 19-year highs. Supporting the buck appears investors’ expectations of a tighter rate path by the Federal Reserve and its correlation to yields, the current elevated inflation narrative and the solid health of the labour market. On the negatives for the greenback turn up the incipient speculation of a “hard landing” of the US economy as a result of the Fed’s more aggressive normalization.
Key events in the US this week: Flash Consumer Sentiment (Friday).
Eminent issues on the back boiler: Escalating geopolitical effervescence vs. Russia and China. Fed’s rate path this year. US-China trade conflict. Future of Biden’s Build Back Better plan.
US Dollar Index relevant levels
Now, the index is losing 0.15% at 104.58 and faces the next support at 102.35 (low May 5) seconded by 99.81 (weekly low April 21) and then 99.57 (weekly low April 14). On the other hand, a breakout of 104.92 (2022 high May 12) would open the door to 105.00 (round level) and finally 105.63 (high December 11 2002).
European Central Bank (ECB) Vice President Luis de Guindos said on Friday that he doesn't want to get sucked into the July rate hike debate.
Additional quotes
Doesn't see a recession in the euro area.
Inflation to decelerate in 2H 2022, but core inflation to remain high.
We will definitely stop bond buying in July.
"But if we raise rates, will it lower oil prices?"
more to come ...
GBP/USD has stabilized above 1.22. The pair, however, faces stiff resistance at 1.2250 and it might find it difficult to gather bullish momentum in case that level stays intact, FXStreet’s Eren Sengezer reports.
Cable needs to clear 1.2250 to stretch recovery
“The University of Michigan's preliminary Consumer Sentiment Index for May will be featured in the US economic docket. If the upbeat market mood remains intact after this data, the US Dollar Index could extend its downward correction and help GBP/USD edge higher.”
“GBP/USD stays below the descending trend line coming from May 5, which forms the first resistance at 1.2250. The 20-period SMA is reinforcing that level as well. In case the pair rises above that hurdle and starts using it as support, it could target 1.23 (psychological level, static level) and 1.2350 (static level, 50-period SMA).”
“A four-hour close below 1.22 (psychological level, static level) could attract sellers and open the door for another leg lower toward 1.2150 (static level from May 2020) and 1.21 (May 15, 2020, low, psychological level).”
- GBP/USD defends 1.2200 amid a broad US dollar pullback, positive mood.
- Cable’s rebound appears capped amid the UK-US macro divergence.
- GBP/USD jumps off falling wedge support on 4H but 21-SMA is the level to beat.
GBP/USD is moving back and forth in a 20-pips range in the European session, defending minor bids just above the 1.2200 level.
The recovery attempt in the pair could be attributed to a broad pullback in the US dollar vs. its main rivals from the highest level in two decades just shy of the 105.00 mark.
The positive shift in risk sentiment, in the wake of Shanghai reopening news, is boding ill for the safe-haven dollar. Although the further upside in cable remains elusive, thanks to the ongoing rally in the US Treasury yields across the curve.
The macroeconomic, as well as, the monetary policy divergence between the UK and the US economies will likely keep the pound undermined in the near term.
Attention now shifts towards the US Michigan Consumer Sentiment data and Fedspeak for fresh trading impetus. Next week, the focus will be on the US Retail Sales and the UK inflation data.
Looking at cable’s four-hour chart, the price staged a decent comeback after finding bids at 1.2165 on Thursday, which appeared to be the falling trendline (wedge) support.
Note that the major is traversing within a bullish wedge formation after the brief recovery on May 4 lost legs near the 1.2535 region.
The Relative Strength Index (RSI) has turned flat above the oversold region while below the midline, suggesting that the recovery momentum may be losing traction.
If the downside pressure accelerates, then a retest of the wedge support, now at 1.2136 will be challenged.
A breach of the latter will trigger a fresh drop towards the 1.2100.
GBP/USD: Four-hour chart
On the other side, any recovery attempts will need to recapture the immediate upside hurdle at 1.2250, above which the bearish 21-Simple Moving Average (SMA) at 1.2268 will be probed.
Further up, the falling trendline (wedge) resistance at 1.2309 will be the last line of defense for GBP sellers.
GBP/USD: Additional technical levels
- USD/CHF witnessed a corrective pullback from a two-year low amid modest USD weakness.
- The risk-on mood could undermine the safe-haven CHF and help limit any meaningful slide.
- Aggressive Fed rate hike bets, a goodish rebound in US bond yields also favour the USD bulls.
The USD/CHF pair dropped to a fresh daily low during the early European session and might now be looking to extend the corrective pullback further below the 1.0000 psychological mark.
The pair edged lower on the last day of the week and has now eroded a part of the overnight strong move up to the 1.050 area, or its highest level since May 2019. The downtick could be solely attributed to some profit-taking amid modest US dollar pullback from a two-decade high, though a combination of factors should help limit any meaningful downfall.
A relief rally in the global equity markets could undermine the safe-haven Swiss franc and act as a tailwind for the USD/CHF pair. The risk-on impulse was reinforced by a solid rebound in the US Treasury bond yields, which, along with the prospects for a more aggressive policy tightening by the Fed, should lend support to the buck and the USD/CHF pair.
Fed chair Jerome Powell also reaffirmed on Thursday that the central bank is ready to raise interest rates by 50 bps at each of the next two policy meetings. Powell further pledged that the Fed was prepared to do more to curb soaring inflation. Nevertheless, the fundamental backdrop still seems tilted firmly in favour of the USD bulls.
Hence, it will be prudent to wait for strong follow-through selling before confirming that the USD/CHF pair has topped out in the near term and positioning for a deeper corrective slide. Market participants now look forward to the release of the prelim Michigan Consumer Sentiment Index from the US for a fresh impetus later during the early North American session.
Technical levels to watch
EUR/USD has recovered modestly following Thursday's steep decline. The pair could extend its correction in case sellers give up on 1.04, FXStreet’s Eren Sengezer reports.
Euro to attract buyers if the 1.04 level is confirmed as support
“If Wall Street's main indexes open decisively higher and gather bullish momentum, EUR/USD could continue to erase its weekly losses.”
“The next recovery target is located at 1.0470 (static level, 20-period SMA) ahead of 1.05 (psychological level).”
“A four-hour close below 1.04 (psychological level) could be seen as a bearish development and open the door for additional losses toward 1.0370 (static level) and 1.0340 (January 3, 2017, low).”
- Silver gained positive traction on Friday and reversed a part of the previous day’s slide to the YTD low.
- Extremely oversold RSI (14) on the daily chart was seen as a key factor that prompted short-covering.
- The double-bottom support breakpoint, near the $21.40 area, should now cap any meaningful upside.
Silver witnessed a short-covering bounce on the last day of the week and recovered a part of the overnight slump to its lowest level since July 2020. The recovery momentum extended through the early European session and pushed spot prices back closer to the $21.00 round-figure mark.
Given that RSI (14) on the daily chart is flashing extremely oversold conditions, traders opted to lighten their bearish bets around the XAG/USD amid modest US dollar pullback from a two-decade high. Ay meaningful upside, however, still seems elusive amid the risk-on impulse in the markets.
The overnight sustained below the double-bottom support near the $21.40 region was seen as a fresh trigger for bearish trades. This comes on the back of the recent breakdown through an ascending trend-line and suggests the attempted recovery runs the risk of fizzling out rather quickly.
Hence, any subsequent move up is more likely to confront stiff resistance and remain capped near the aforementioned support breakpoint, around the $21.40 area. That said, sustained strength beyond has the potential to lift the XAG/USD and allow bulls to reclaim the $22.00 round figure.
On the flip side, the YTD low, around the $20.65-$20.60 region, now seems to protect the immediate downside. Some follow-through selling would reaffirm the near-term negative bias and make the XAG/USD vulnerable to slide further towards challenging the $20.00 psychological mark.
Silver daily chart
-637880253442209610.png)
Key levels to watch
- USD/JPY gained some positive traction on Friday and recovered further from a two-week low.
- The risk-on impulse undermined the JPY and extended support amid rebounding US bond yields.
- Modest USD pullback from a two-decade high kept a lid on any meaningful upside for the major.
The USD/JPY pair retreated nearly 75 pips from the daily high and was seen trading with only modest gains, near the 128.65-128.70 region during the early European session.
A combination of supporting factors assisted the USD/JPY pair to gain some positive traction on Friday and built on the overnight bounce from mid-127.00s, or over a two-week low. A goodish recovery in the equity markets undermined the safe-haven Japanese yen, which, along with rebounding US Treasury bond yields acted as a tailwind for spot prices.
That said, modest US dollar pullback from a two-decade high held back bulls from placing aggressive bets around the USD/JPY pair, rather attracted some selling near the 129.35 region. Given that at least 50 bps Fed rate hike move at the June meeting is fully priced in the markets, traders opted to take some profits off their USD bullish position.
Meanwhile, Fed chair Jerome Powell reaffirmed on Thursday that the central bank is ready to raise interest rates by 50 bps at each of the next two policy meetings. Powell further pledged that the Fed was prepared to do more to curb soaring inflation. This should help limit any meaningful downside for the buck and offer some support to the USD/JPY pair.
Market participants now look forward to the release of the prelim Michigan Consumer Sentiment Index from the US, due later during the early North American session. Apart from this, the US bond yields, might influence the USD and provide some impetus to the USD/JPY pair. Traders will further take cues from broader market risk sentiment to grab short-term opportunities.
Technical levels to watch
- Platinum consolidates biggest daily loss in two months, retreats from daily high of late.
- Bearish MACD signals hint at break of immediate support line but “double top” highlights $932 as the key support.
Platinum (XPT/USD) fails to recover from the biggest daily slump in two months despite posting 1.10% daily gains around $957 heading into Friday’s European session.
That said, the precious metal portrays a “double top” bearish chart pattern in the four-hour play. However, an upward sloping trend line from April 27 has recently probed bears.
Given the bearish MACD signals and the metal’s failure to rise past the 200-SMA, the XPT/USD prices are likely to drop back towards a fortnight-old support line, at $946 by the press time.
It should, however, be noted that the quote needs to conquer the $932 horizontal support, after breaking $946, to confirm the aforementioned bearish formation, which in turn could recall $860 on the chart.
Alternatively, a clear upside break of the 200-SMA, around 968, will challenge the “double tops” surrounding $1,000.
Also acting as the short-term key upside filter is the late April swing high close to $1,025.
Platinum: Four-hour chart
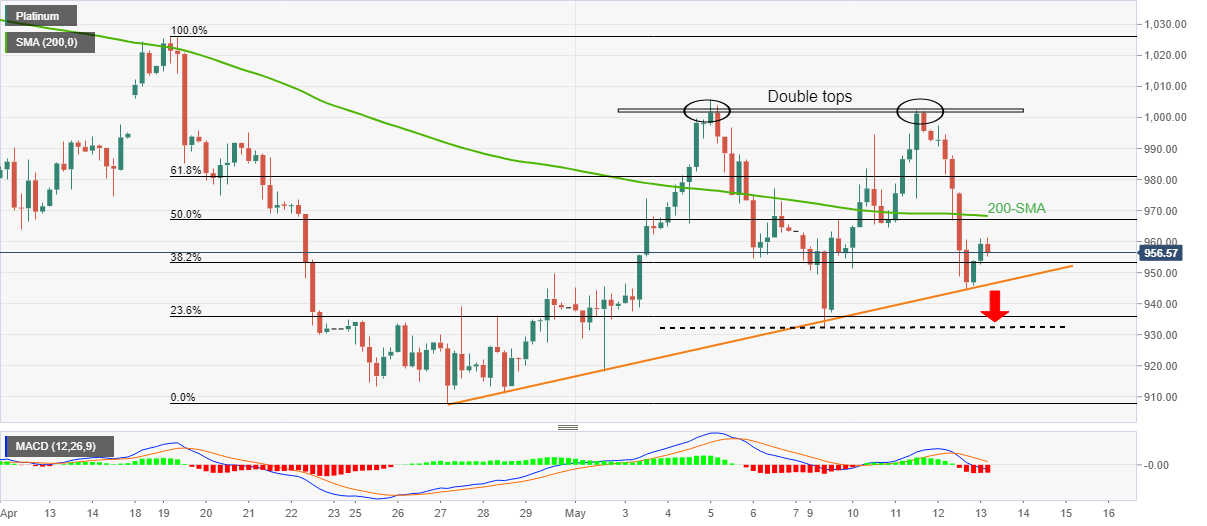
Trend: Further weakness expected
The pound is trying to find some support around the 1.22 level after what has been a near-freefall from the upper half of the 1.20-1.30 range. Economists at ING note that the cable is at risk of falling towards 1.20 next week.
EUR/GBP may remain close to the 0.85 mark
“The way ahead looks likely to remain very uneven for the pound considering that markets still have a good deal of monetary tightening to price out from the GBP swap curve (which continues to imply a policy rate at 2.00% by year-end).”
“Incidentally, with Brexit-related risks back to the fore as the UK appears close to unilaterally scrapping parts of the Northern Ireland agreement, the downside risks for GBP remain quite significant and a move to 1.2000 next week may be on the cards.”
“EUR/GBP may remain close to the 0.8500 mark (as the euro is facing weak momentum of its own), although we see greater potential for a return to 0.8600 rather than a drop to 0.8400 in the near term.”
Here is what you need to know on Friday, May 13:
After having registered its highest close in nearly two decades 104.75, the US Dollar Index is edging lower early Friday amid an improving market mood. Industrial Production data from the euro area will be looked upon for fresh impetus ahead of Export Price Index and Import Price Index figures from the US. The University of Michigan will release the preliminary Consumer Sentiment Index data for May as well. Investors will continue to pay close attention to comments from central bankers ahead of the weekend.
In a statement published early Friday, Deputy mayor Wu Qingat of China’s Shanghai city said that they are aiming to reach zero-Covid infections at the community level by mid-May. Shanghai will aim to open up, ease traffic restrictions and open shops in an orderly manner," the mayor added. The Shanghai Composite Index gained traction on this development and was last seen rising 0.8% on a daily basis. Reflecting the positive shift witnessed in risk sentiment, US stock index futures are up between 0.65% and 1.25% in the early European morning.
On Thursday, the data from the US revealed that the Core Producer Price Index (PPI) declined to 8.8% in April from 9.6% in March, compared to the market expectation of 8.9%. Meanwhile, in an interview with Marketplace radio, FOMC Chairman Jerome Powell reiterated that he expects the policy rate to rise by 50 basis points at each of the next two policy meetings. Nevertheless, the benchmark 10-year US Treasury bond yield fell for the fourth straight day on Thursday and remains on track to snap a five-week rising streak.
EUR/USD dropped to its lowest level since early 2017 at 1.0353 on Thursday. The pair fluctuates in a relatively tight range at around 1.0400 early Friday.
GBP/USD fell below 1.2200 for the first time in nearly two years on Thursday but seems to have gone into a consolidation phase above that level on Friday. On a weekly basis, the pair is down 200 pips.
The Japanese yen capitalized on safe-haven flows on Thursday and USD/JPY broke below its two-week-old trading channel. The pair stays relatively quiet in the European morning and trades below 129.00.
Gold failed to find demand despite falling US Treasury bond yields and encountered technical selling pressure after dropping below the key 200-day moving average. At the time of press, XAU/USD was trading at its lowest level since early February near $1,820.
Bitcoin is edging higher early Friday and was last seen rising more than 4% on the day at $30,250. The capital outflow from altcoins seems to be helping BTC hold its ground for the time being. Similarly, Ethereum is up 7% on a daily basis and trading slightly above $2,000 after having touched its lowest level in nearly a year at $1,700 on Thursday.
Terra’s planetary collapse is taking down crypto lending; Altcoins plummet.
The Czech National Bank (CNB) announced intervention in the FX market. As a result, EUR/CZK returned below 25.00. However, more action may be needed to support the koruna given dovish prospects, economists at ING report.
EUR/CZK below 25.00 is the CNB's goal
“CNB intervened in the FX market for the second time this year a day after the appointment of a new governor, who will take over on 1 July. As a result, EUR/CZK returned below 25.00, which we believe is the CNB's goal. For now, this is mainly a verbal intervention, just like after the outbreak of the Ukrainian conflict, with minimal central bank activity in the market.”
“Markets are bracing for the arrival of a dovish board, which is taking away support for the koruna in the form of record interest rate differentials. Thus, it can be expected that the central bank will have to stay in the market longer and at a greater cost than before. By 1 July, we expect nothing to change in the CNB's current approach and the koruna to remain below 25.0 EUR/CZK.”
“In the long run, if the new board is serious about its dovish direction, we can expect a much more frequent central bank presence in the market.”
- WTI is struggling to sustain above $106.00 amid the unavailability of any major event.
- Fed’s focus to absorb liquidity from the economy is backing lower demand forecasts.
- Rising oil production from the Middle East may ease supply concerns a bit.
West Texas Intermediate (WTI), futures on NYMEX, is trading lackluster in the early European session after a firmer rebound in the last two trading sessions. The oil prices are bent toward the bulls despite surging demand worries and the promise of higher oil production from the Middle East.
Investors have started worrying over the demand for oil in the US as the economy is highly focused on absorbing liquidity from the market. The resurging requirement to tame galloping inflation is focusing on tightening the quantitative measures dramatically. This will force the corporate to spend wisely on expansion plans due to the unavailability of the cheap dollar in circulation. Lesser expansion plans will dilute the demand for oil, which will keep the oil prices on tenterhooks.
Meanwhile, the prospects of rising oil production in the Middle East to mitigate the loss of oil supply due to heavy sanctions on Russia will stable the demand-supply mechanism. Now, the discussions of the European Union (EU) on the embargo of oil from Russia will remain in focus. After Germany’s backing for prohibiting Russian oil imports, an embargo on Russian oil looks a tad less difficult for the EU. It is worth noting that Germany was opposing the decision earlier due to its higher dependency on oil and energy from Russia.
EUR/USD broke under 1.05 on Thursday. The pair is close to the 1.0340 key support, below which would see the prospect of parity become quite material, economists at ING report.
Time to talk about parity
“The next major support to watch is the 1.0340 January 2017 low. A break below such a level would make the risk of EUR/USD hitting parity quite material. We wouldn’t be shocked to see the pair at 1.00 in the near term. Indeed, after losing the 1.05 ‘anchor’, EUR/USD volatility may well increase again.”
“A break below 1.0340 may not be a story for today though as the US session could endorse the rebound in risk assets and ease some of the dollar's momentum.”
The Japanese yen has so far suffered from the fact that interest rate expectations are being pushed up for other central banks. This process should now be completed. USD/JPY should therefore stabilize, economists at Commerzbank report.
Yen to recover moderately in 2023
“We expect the revision of Fed interest rate expectations to expire and USD/JPY to stabilize. Then (and only then!) can the Japanese Ministry of Finance's threat of intervention take effect.”
“We expect the yen to recover moderately in 2023, when economic momentum is expected to weaken significantly elsewhere (especially in the US).”
The Norges Bank was an early adopter of policy tightening, beginning back in September. Economists at CIBC Capital Markets believe that the Norges Bank is set to up its rate tightening profile, supporting the krone.
Upside inflation concerns risk coinciding with ongoing labour market tightness
“While headline inflation currently remains close to target, there are concerns over imported goods price inflation, in particular in food. In terms of the policy outlook, any such upside inflation concerns risk coinciding with ongoing labour market tightness, a scenario represented by a low unemployment rate and elevated wage growth.”
“As the labour market remains tighter than the Norges bank had previously anticipated, this raises the prospect of the Norges Bank considering upping the tightening profile come the June meeting, maintaining a supportive NOK bias.”
NZD/USD is down by more than 9% sine the beginning of April. With the pair looking increasingly oversold, economists at CIBC Capital Markets expect the kiwi to enjoy gains in the second half of the yaer.
NZD/USD to soon find a base
“Recognition of the RBNZ not being as hawkish as priced should limit over-tightening concerns.”
“With the NZD looking increasingly oversold we would look for the NZD to soon find something of a base as shorts are soon set to reach March extremes.”
- USD/RUB prints three-day downtrend as sellers reverse the corrective pullback from 27-month low.
- Russia warns Finland over joining NATO, Ukraine cheers Moscow’s failure to cross Siverskyi Donets river.
- Hopes of easing geopolitical tensions are thin but Fedspeak, US PPI favored USD pullback, firmer oil prices strengthen RUB.
- Russia CPI, US Michigan Consumer Sentiment Index eyed for fresh impulse.
USD/RUB remains pressured towards the lowest levels since February 2020, marked the previous day, as DXY pullback joins cautious optimism and firmer oil prices to favor the pair bears heading into Friday’s European session.
US Dollar Index (DXY) retreats from a 20-year high, flashed on Thursday, as market sentiment improves amid a light calendar and absence of major news during the sluggish Asian session.
That said, the greenback gauge drops 0.08% to 104.65 by the press time. It’s worth noting that the DXY weakness, or retreat to term it the best, could be linked to the US PPI’s matching of the 0.5% MoM market consensus for April, as well as Fed Chairman Jerome Powell’s reiteration of 50 bps rate hikes in the next two meetings. On the same line were comments from San Francisco Fed President Mary Daly who mentioned, “Is it 50, is it 25, is it 75? Those are things that I’ll deliberate with my colleagues, but my own starting point is we don’t want to go so quickly or so abruptly that we surprise Americans”.
On the other hand, WTI crude oil rises 1.0% to $107.80 during a three-day uptrend, eyeing the weekly top of late. The black gold’s latest run-up could be linked to the cautious optimism in the Asia-Pacific region, as well as fears of a European oil embargo over Russian energy imports.
It should be noted that Russia’s latest retreat from the Siverskyi Donets river in Donbas joins China’s hopes of overcoming covid in the short-term and seems to underpin the risk-on mood. On the contrary, Moscow’s warning to Finland, over its plan to join the North Atlantic Treaty Organization (NATO), coupled with Western sanctions, challenges optimists.
Amid these plays, the US 10-year Treasury yields portray a corrective pullback after refreshing a two-week low the previous day, around 2.89% by the press time, whereas the S&P 500 Futures print rises 1.0% while licking its wound near one-year low.
Looking forward, Russia’s Consumer Price Index (CPI) for April, prior 7.6% MoM, will precede the preliminary readings of US Michigan Consumer Sentiment data for May, expected 64 versus 65.2 prior, to direct short-term USD/RUB moves. Though, major attention will be given to headlines concerning coronavirus, geopolitics and Fedspeak.
Technical analysis
A seven-week-old descending trend line, around 67.60 by the press time, keeps directing USD/RUB prices towards early 2020 lows surrounding 61.00.
Britain's Minister for Brexit opportunities, Jacob Rees-Mogg, said Friday, the right response to inflation is tight monetary policy and constrained fiscal policy.
When asked if cuts to civil jobs were a return to austerity, he said, “I don't think it is, because what is being done is getting back to the efficiency levels we had in 2016. That's a perfectly reasonable and sensible ambition."
"The administration, the negotiations, most of the work in relation to Brexit has been completed,” Rees-Mogg added.
Market reaction
The pound remains unfazed by the above comments, as GBP/USD was last seen trading at 1.2211, up 0.12% on the day.
The slide in CAD in recent weeks reflects a broadly stronger greenback. Economists at CIBC Capital Markets think the loonie will follow broad USD sentiment and is likely to depreciate a touch in the near-term before retracing that ground over the balance of the year.
CAD a bit weaker again in 2023
“With inflation at higher levels stateside, and growth further above pre-pandemic levels, the Fed’s hawkishness could maintain USD strength in the coming months, especially as it leads in its tightening cycle relative to what’s being seen abroad.”
“We could see the CAD weaken a touch into mid-year, with USD/CAD at 1.31. However, over the second half of the year, we see scope for the loonie to regain lost ground, as the market dials down its hawkish view on the Fed and the USD softens by year-end.”
“The move stronger in the loonie in H2 will be limited by the market simultaneously paring BoC rate hike expectations when the Bank reverts to quarter point hikes later in the year, and USD/CAD is expected to end the year at 1.27.
“With the BoC not expected to take rates above the US in 2023, and overall softer commodity prices that year as global growth slows, we have the CAD a bit weaker again in 2023.”
Since the end of March, the stars have aligned in favour of a stronger USD. Economists at CIBC Capital Markets expect the greenback to remain on solid footing in the near-term as Federal Reserve leads peer central banks in tightening monetary policy.
Markets will reassess where the terminal interest rate for the Fed is being priced
“The USD will likely remain on solid ground in the coming months. That’s primarily because there doesn’t appear to be any let-up in the way long-end rates are moving, and the macro liquidity picture continues to point to a ‘risk off’ backdrop. The Fed is already quite hawkish, and the USD will find support against other currencies where policy settings are slower to adapt, or are outright divergent.”
“Beyond the next few months, there’s enough baked into the USD to preclude a sustained rally from here. Indeed, we still envisage that markets will reassess where the terminal interest rate for the Fed is being priced which should leave the USD on the defensive a bit as other majors play catch up.”
In the opinion of economists at CIBC Capital Markets, the pulling forward of rate hike expectations leaves the potential for rates to move back into positive territory prior to year-end, supporting the euro.
ECB remains mindful of repeating the policy mistake of 2011
“Any move back towards positive rates would not necessarily result in an immediate rush of capital. However, any marginal uptick in reserve manager EUR appetite would provide a more substantive underpinning of the currency, precluding fears over EUR/USD testing 2017 lows.”
“While real economy headwinds are growing, and we remain mindful of widening peripheral spreads, the window for policy adjustment may prove limited. Indeed, the ECB remains mindful of repeating the policy mistake of 2011. Nevertheless, a move early in H2, combined with the discussion of a potential return to positive rates, points towards EUR valuations proving to be supported in the near term, if not necessarily immediately boosted.”
FX option expiries for May 13 NY cut at 10:00 Eastern Time, via DTCC, can be found below.
- EUR/USD: EUR amounts
- 1.0450 500m
- 1.0650 297m
- GBP/USD: GBP amounts
- 1.2100 647m
- 1.2200 724m
- 1.2360 457m
- USD/JPY: USD amounts
- 130.00 520m
- USD/CAD: USD amounts
- 1.3000 1.1b
- 1.3040 425m
- 1.3050 980m
- 1.3060 240m
- EUR/CHF: EUR amounts
- 1.0200 510m
- 1.0400 847m
- EUR/JPY: EUR amounts
- 134.50 643m
- 137.50 630m
- NZD/USD is scaling modestly higher on weaker DXY.
- Fed Powell’s high probable dictation of two jumbo rate hikes has empowered inflationary fears.
- In today’s session, US Michigan CSI will remain in focus, which is seen at 64.
The NZD/USD pair displayed a bullish open-drive move on Friday. The pair is scaling higher swiftly right from the first opening tick at 0.6230. The kiwi bulls have witnessed an intense sell-off in the past few trading sessions and signs of exhaustion are hinting at a pullback, maybe a reversal. A consolidative move has been witnessed in a 0.6216-0.6266 range.
The odds of an extremely tight monetary policy by the Federal Reserve (Fed) are progressing each day. Fed chair Jerome Powell in his interview with Marketplace national radio program has stated that the Fed is expected to raise interest rates by half a percentage point at each of its next two policy meetings. Also, Powell added that the Fed is prepared to do more if data turns uglier.
Fed’s Powell emphasized price stability, which is necessary to keep the economy rock solid. Soaring inflationary pressures are denting the paychecks of households. Meanwhile, the US dollar index (DXY) has recorded some long liquidation after printing a fresh 19-year high of 104.92 on Thursday.
On the NZ front, investors have cheered a minor improvement in the REINZ House Price Index t -1.9% from -2.1% recorded earlier. Also, the economy reported the Business Purchase Managers Index (PMI) at 51.2, lower than the forecasts of 52.8.
Going forward, US Michigan Consumer Price Index (CSI) will be on the investors’ radar. The economic data is seen at 64 against the previous figure of 65.2.
USD/JPY risks a drop below 127.50 as long as it trades below the 130.10 level, noted FX Strategists at UOB Group Lee Sue Ann and Quek Ser Leang.
Key Quotes
24-hour view: “While we expected USD to weaken yesterday, we were of the view that ‘any weakness is expected to encounter strong support at 129.20’. The anticipated weakness exceeded our expectations by a wide margin as USD cracked 129.20 and nose-dived to 127.50 before snapping back up. The outsized decline appears to be overdone and USD is unlikely to weaken further. For today, we expect USD to trade between 128.00 and 129.50.”
Next 1-3 weeks: “On Tuesday (10 May, spot at 130.10), we highlighted that USD appears to have moved into consolidation phase and is likely to trade between 128.40 and 131.00. Yesterday (12 May), USD cracked 128.40 and plunged to 127.50 before rebounding strongly. While the price actions suggest USD could stage a deeper pullback, oversold shorter-term conditions could lead to USD trading above 127.50 for a couple of days first. Overall, only a breach of 130.10 would indicate that USD is not ready to move below 127.50. Looking ahead, support levels below 127.50 are at 127.00 and 126.00.”
- Gold prices extend rebound from three-month low towards refreshing daily high.
- Improvement in risk appetite adds strength to recovery moves inside bullish chart pattern.
- Fed’s Powell, headlines from China underpin latest cautious optimism ahead of US Michigan Consumer Sentiment Index for May.
- Gold Price Forecast: XAU/USD’s dead cat bounce could seek validation at $1,836
Gold (XAU/USD) prices recover during the sluggish Asian session on Friday, following a slump to the lowest levels since February the previous day. That said, the bullion quotes $1,827 as the latest price as traders await preliminary readings of the US Michigan Consumer Sentiment data for May.
The yellow metal’s latest rebound could be linked to the US PPI’s matching of the 0.5% MoM market consensus for April, as well as Fed Chairman Jerome Powell’s reiteration of 50 bps rate hikes in the next two meetings. On the same line were comments from San Francisco Fed President Mary Daly who mentioned, “Is it 50, is it 25, is it 75? Those are things that I’ll deliberate with my colleagues, but my own starting point is we don’t want to go so quickly or so abruptly that we surprise Americans”.
Also, China’s push for more employment generation to the college students and hopes of reaching covid-zero conditions in Shanghai after mid-May previously favored USD/CAD bears. On the same line was a three-day “at home” stay for residents for covid testing to tame and confirm the covid resurgence in Beijing.
While cheering the cautious optimism, the US US 10-year Treasury yields portray a corrective pullback after refreshing a two-week low the previous day, around 2.89% by the press time, whereas the S&P 500 Futures print rises 1.0% while licking its wound near one-year low.
Moving on, the US Michigan Consumer Sentiment Index, expected 64 versus 65.2 prior, will undoubtedly be important due to its preliminary nature and also because it comprises hints for inflation expectations. Also crucial for gold traders to follow are headlines concerning coronavirus, geopolitics and Fedspeak.
Technical analysis
Considering the metal’s moves since April 18, gold portrays a falling wedge bullish chart pattern on the four-hour play. That said, nearly oversold RSI (14) keeps gold buyers hopeful of further recovery moves.
However, a clear break of $1,857, comprising the resistance line of the wedge, won’t be enough for the gold buyers as the 50-SMA level, near $1,863, will act as an extra filter to the north before confirming the upside move.
That said, the monthly peak of $1,909 and late April’s swing high near $2,000 can act as crucial resistances during the metal’s run-up towards the theoretical target surrounding $2,050.
Alternatively, a downside break of the recent low, close to $1,810, will need validation from the $1,800 threshold before directing gold sellers towards the yearly bottom surrounding $1,780.
Gold: Four-hour chart
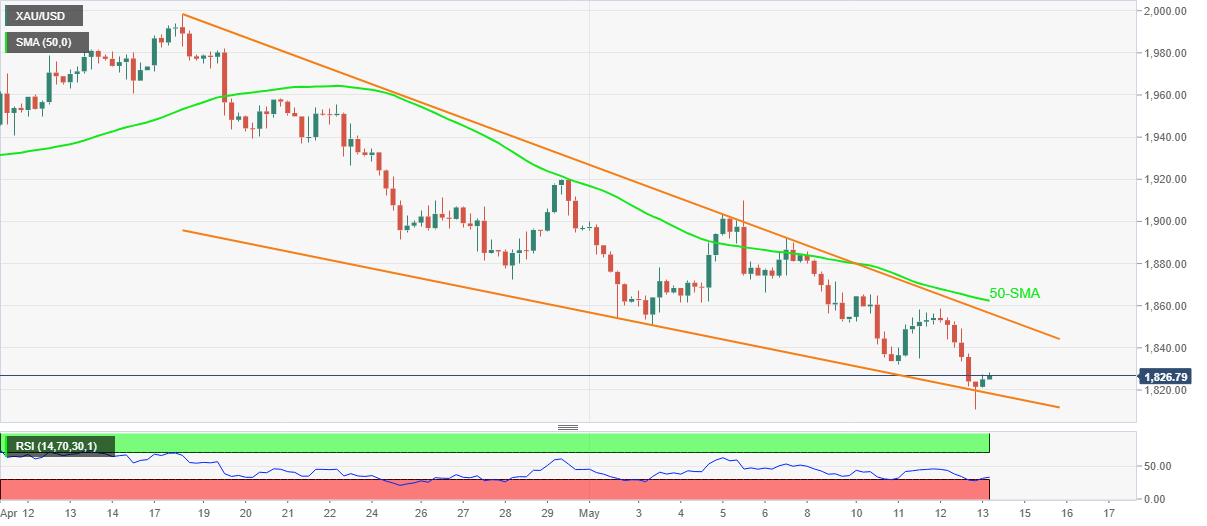
Trend: Further recovery expected
Advanced prints from CME Group for natural gas futures markets noted open interest increased for the first time after five consecutive daily builds, this time by around 13.8K contracts. On the other hand, volume dropped for the third session in a row, now by around 28.1K contracts.
Natural Gas: Next on the upside comes $8.00
Prices of natural gas rose for another session on Thursday against the backdrop of increasing open interest. That said, there seems to be room for the continuation of the leg higher in the very near term and with the next target at the $8.00 mark per MMBtu (high April 18).
While global central banks are moving to tighten policy, the Bank of Japan (BoJ) remains in almost splendid isolation. In the view of economists at CIBC Capital Markets, 10-year UST-JGB spreads risk testing 300bps – which should allow USD/JPY to test the 135.15 high prior to any JPY reversal.
Ultra-easy BoJ policy to weigh on JPY
“BoJ Governor Kuroda continues to suggest that a weak JPY is an overall positive for the economy. That suggests that in the absence of a material MoF pushback, which is only likely if markets risk becoming disorderly, we expect the path of UST-JGB spreads to remain the primary determinant of USD/JPY.”
“As 10-year UST-JGB spreads risk testing towards 300bps, this supports the notion of the 2002 USD/JPY high at 135.15 being tested prior to any JPY reversal.”
Analysts at Credit Agricole CIB Research think that the British pound is an attractive stagflation hedge but is looking quite oversold and undervalued.
UK could sink into a recession in the absence of meaningful fiscal support
“The GBP remains an attractive stagflation and risk aversion hedge and the most recent developments in the UK have seemingly added to the headwinds for the currency.”
“The government's legislative proposals for the upcoming parliamentary year left investors worrying that the economy could sink into a recession in the coming quarters in the absence of meaningful fiscal support. In addition, recent media reports have suggested that PM Boris Johnson would announce on Friday that his government would introduce new legislation that allows its ministers to override parts of the Northern Ireland protocol."
“With many negatives in the price, we think that the currency is looking quite oversold and undervalued at present as highlighted by our latest FX positioning and FAST FX model updates,”
In opinion of FX Strategists at UOB Group Lee Sue Ann and Quek Ser Leang, AUD/USD’s downside could visit the 0.6800 region in the next weeks.
Key Quotes
24-hour view: “Our expectations for AUD to ‘trade between 0.6900 and 0.6995’ yesterday were incorrect as it cracked 0.6900 and plunged to 0.6829 before rebounding. The rapid decline appears to be overdone but AUD could retest the 0.6830 level. The next support at 0.6800 is unlikely to come under threat. Resistance is at 0.6900 followed by 0.6925.”
Next 1-3 weeks: “Yesterday (12 May, spot at 0.6930), we highlighted that AUD has close below 0.6900 within these 1 to 2 days or the chance for a sustained decline would diminish quickly. AUD subsequently plummeted to 0.6829 before rebounding to close at 0.6858 (-1.20%). The boost in downward momentum suggests AUD could weaken to 0.6800. The downward pressure is intact as long as AUD does not move above 0.6960 (‘strong resistance’ level).”
According to preliminary readings from CME Group for crude oil futures markets, traders added around 18.3K contracts to their open interest positions on Thursday. Volume, instead, shrank for the second session in a row, this time by nearly 96K contracts.
WTI: Next on the upside comes $111.34
Prices of the barrel of WTI extended the weekly recovery on Thursday. The move was in tandem with rising open interest, which leaves the door open to extra gains in the very near term. Against that, the commodity continues to target the May high at $111.34 per barrel (May 5).
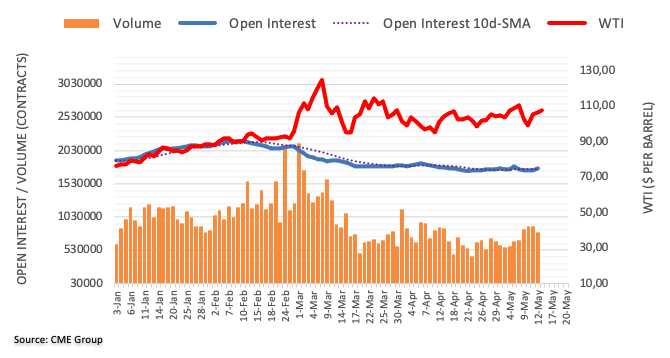
- An Inverted Flag formation is advocating a sheer downside move ahead.
- The pound bulls have posed a solid challenge to the 200-EMA.
- The RSI (14) has shifted into a bearish range of 20.00-40.00, which adds to the downside filters.
The EUR/GBP pair is oscillating in a minute range of 0.8498-0.8509 in the Asian session. It seems that the FX domain is enjoying the weekend vibes and has paused broadly despite the unavailability of any significant event on Friday. On Thursday, the cross witnessed a sheer downside move after failing to cross the crucial resistance of 0.8620.
The formation of an Inverted Flag chart pattern on an hourly scale is strengthening the pound bulls. Usually, an Inverted Flag chart formation denotes the placement of offers by the initiative sellers. The initiative selling perspective signals the continuation of inventory distribution after a downside move.
Meanwhile, pound bulls are challenging the 200-period Exponential Moving Average (EMA) at 0.8513. The trendline placed from April 14 low at 0.8250, adjoining April 20 low at 0.8283 and May 3 low at 0.8373 respectively will act as major support for the counter.
The Relative Strength Index (RSI) (14) is oscillating in a bearish range of 20.00-40.00, which signals more downside ahead.
Investors should gauge a pullback towards the 50-EMA at 0.8536, which will be a bargain sell for the market participants. An occurrence of the same will drag the asset towards Thursday’s low and May 4 high at 0.8493 and 0.8450 respectively.
On the contrary, euro bulls may regain strength if the asset oversteps Thursday’s high at 0.8616 decisively. This will drive the asset towards a 29 September 2021 high at 0.8658, followed by a 26 April 2021 high at 0.8720.
EUR/GBP hourly chart
-637880173910784010.png)
- USD/CAD renews intraday low as sellers attack 1.3000 threshold, extends pullback from 18-month high.
- WTI crude oil prints three-day uptrend amid softer oil, cautious optimism in Asia and geopolitical concerns over Russia.
- US dollar eases on firmer yields, stock futures ahead of US consumer sentiment data.
USD/CAD takes offers to renew intraday low around 1.2995, down 0.36% on a day, as markets cheer USD pullback, as well as firmer oil prices, during early Friday morning in Europe. The bulls, however, remain cautious while waiting for the US data for May.
WTI crude oil rises 1.0% to $107.80 during a three-day uptrend, eyeing the weekly top of late. The black gold’s latest run-up could be linked to the cautious optimism in the Asia-Pacific region, as well as fears of a European oil embargo over Russian energy imports.
That said, China’s push for more employment generation to the college students and hopes of reaching covid-zero conditions in Shanghai after mid-May previously favored USD/CAD bears. On the same line was a three-day “at home” stay for residents for covid testing to tame and confirm the covid resurgence in Beijing. However, chatters surrounding Taiwan and the latest warning from Aussie Defense Minister trim the optimism in Asia.
Amid these plays, the US 10-year Treasury yields portray a corrective pullback after refreshing a two-week low the previous day, around 2.89% by the press time, whereas the S&P 500 Futures print rises 1.0% while licking its wound near one-year low.
It’s worth noting that cautious comments from Fed Chairman Jerome Powell and San Francisco Fed President Mary Daly join the pre-data anxiety to keep the US dollar under pressure. Additionally, the US Producer Price Index (PPI’s) matching of 0.5% MoM market consensus also tests DXY bulls near a 20-year high.
While the intraday DXY moves will rely on the preliminary readings of US Michigan Consumer Sentiment data for May, expected 64 versus 65.2 prior, making it the key, headlines concerning coronavirus, geopolitics and Fedspeak will also be important for USD/CAD traders.
Technical analysis
Unless providing a daily closing beyond the monthly resistance line, around 1.3080 by the press time, USD/CAD pullback can’t be ruled out.
However, 10-DMA and a three-week-old rising trend line, respectively around 1.2930 and 1.2870, limit the short-term downside of the pair.
NZD/USD is at the day’s, the week’s, and the year’s lows this morning as global market turmoil continues. The break below key support at 0.6230 as the USD powers ahead amid the ongoing global market turmoil is a negative technical development, economists at ANZ Bank report.
Hard to see markets shying away from the USD’s safe-haven appeal
“One notable aspect of the turmoil has been lower bond yields, with the US 10yr having touched 3.20% on Monday. If the ramifications of volatility/tumbling asset prices become that significant, it’s hard to see markets shying away from the USD’s safe-haven appeal any time soon.”
“Kiwi’s break of 0.6230 (the 61.8% Fibo of the 2020/21 rally off COVID-19 lows) is a negative technical development.”
“Support 0.5940/0.6100/0.6200 Resistance 0.6465/0.6545”
Gold Price is licking its wounds on the final trading day of the week. As FXStreet’s Dhwani Mehta notes, XAU/USD’s dead cat bounce could seek validation at $1,836.
It remains to be seen if XAU/USD can sustain the rebound
“The sharp sell-off in Gold Price could well justify a minor corrective pullback towards the 200-Daily Moving Average (DMA) at $1,836 key support, now turned resistance. Acceptance above the latter will call for a retest of the $1,850 psychological barrier, beyond which the recent range highs near $1,860 will be put to test.”
“If the bearish momentum kicks in again, then sellers will target the multi-month lows of $1,810 once again. The next relevant downside cap is seen at the $1,800 round figure, below which the February 3 low of $1,789 will come into play.”
GBP/USD remains under pressure and further downside could retest 1.2140 ahead of 1.2100, suggested FX Strategists at UOB Group Lee Sue Ann and Quek Ser Leang.
Key Quotes
24-hour view: “We highlighted yesterday that ‘momentum is building quickly and a break of 1.2200 would not be surprising’. We added, ‘the next support at 1.2140 is likely out of reach for now’. Our view turned out to be correct as GBP dropped to 1.2165 before rebounding. While downward pressure appears to have eased, GBP could dip below 1.2165. However, 1.2140 still appears to be out of reach for now. Resistance is at 1.2240 followed by 1.2270.”
Next 1-3 weeks: “Yesterday (12 May, spot at 1.2240), we highlighted that improved downward momentum suggests that GBP could break 1.2200. We added, ‘the next support is at 1.2140’. GBP subsequently cracked 1.2200 and dropped to 1.2165. Further weakness appears likely even though oversold shorter-term conditions could slow the pace the any further decline. The next support below 1.2140 is at 1.2100. On the upside, a breach of 1.2300 (‘strong resistance’ level was at 1.2380 yesterday) would indicate that the weakness that started late last week has run its course.”
CME Group’s flash data for gold futures markets noted open interest rose for the third session in a row on Thursday, this time by around 6.2K contracts. In the same line, volume partially reversed the previous drop and went up by around 23.5K contracts.
Gold now looks to $1800
Thursday’s marked drop in gold prices was on the back of increasing open interest and volume, indicative that extra decline remains on the cards in the very near term. That said, the next support of note comes at the critical $1800 mark per ounce troy.
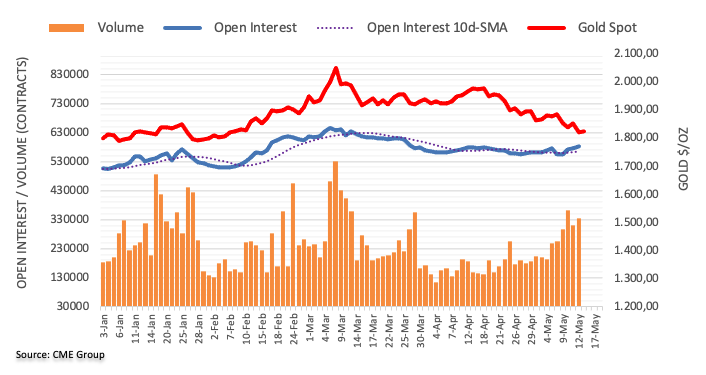
According to FX Strategists at UOB Group Lee Sue Ann and Quek Ser Leang, EUR/USD could extend the downtrend to 1.0300 and 1.0200 once it clears 1.0340.
Key Quotes
24-hour view: “While we expected EUR to weaken yesterday, we were of the view that ‘the chance for a break of the major support at 1.0470 is not high’. However, EUR cracked the major support and plunged to a low of 1.0352. The deeply oversold weakness has scope to drop below 1.0340 first before stabilization can be expected (next support is at 1.0300). Resistance is at 1.0430 followed by 1.0460.”
Next 1-3 weeks: “Last Friday (06 May, spot at 1.0540), we highlighted that EUR has to close below the solid support at 1.0470 before a sustained decline is likely. Yesterday (12 May, spot at 1.0515), we indicated that ‘there is no change in our view for now even though shorter-term downward momentum has weakened a tad and the chance for EUR to close below 1.0470 has increased slightly’. That said, we did expect the reaction upon the break of 1.0470 as EUR crashed to a low of 1.0352. From here, a break of the 2017 low near 1.0340 could trigger further sharp decline. The next support levels are at 1.0300 and 1.0200. Overall, only a break of 1.0490 (‘strong resistance’ level was at 1.0605 yesterday) would indicate that the current weakness in EUR has stabilized.”
- AUD/USD fades recovery moves from two-year low, retreats from daily high amid mixed clues.
- China pushes for more employment to college students, sees improvement in covid conditions looking forward.
- Aussie Defense Minister warns China over intelligence ship moving in Aussie waters.
- US yields, stock futures stay firmer but DXY bounces off daily lows ahead of Michigan Consumer Sentiment Index for May.
AUD/USD grinds higher around 0.6890 while struggling to keep the early Asian session rebound from a 23-month low as traders in Brussels await Friday’s bell. That said, the Aussie pair’s latest pullback could be linked to the US dollar’s bounce off intraday low, as well as headlines from Australia and China.
The US Dollar Index (DXY) seesaws around daily bottom near 104.60 amid a pause in the US Treasury yields and stock futures, following the initial run-up. The greenback’s latest moves could be linked to the market’s anxiety ahead of the preliminary readings of US Michigan Consumer Sentiment data for May, expected 64 versus 65.2 prior.
Read: Michigan Consumer Sentiment Index May Preview: Can Americans keep their spending habits?
It’s worth noting that China’s push for more employment generation to the college students and hopes of reaching covid-zero conditions in Shanghai after mid-May previously favored AUD/USD bulls. On the same line was a three-day “at home” stay for residents for covid testing to tame and confirm the covid resurgence in Beijing. However, chatters surrounding Taiwan and the latest warning from Aussie Defense Minister trim the optimism in Asia.
The DXY’s rebound could also be linked to the delay in the Ukraine aid package by the US, due to Senator Rand Paul’s objection. Furthermore, fresh fears that inflation will remain the key threat to the global economy add strength to the USD’s safe-haven demand.
However, cautious comments from Fed Chairman Jerome Powell and San Francisco Fed President Mary Daly join the pre-data anxiety to keep the US dollar under pressure, helping the AUD/USD buyers.
While portraying the mood, the US 10-year Treasury yields portray a corrective pullback after refreshing a two-week low the previous day, around 2.89% by the press time, whereas the S&P 500 Futures print rises 1.0% while licking its wound near one-year low.
Moving on, US data and risk catalysts, mainly relating to China and Russia, will be crucial for AUD/USD traders to watch.
Technical analysis
A downward sloping trend line from December 2021, around 0.6910 guards the immediate recovery of the AUD/USD prices. Failures to break the same won’t hesitate to direct bears towards 50% Fibonacci retracement (Fibo.) of March 2020 to February 2021upside, around 0.6760.
- EUR/USD is oscillating in a 7-pip range after a mild rebound.
- The greenback bulls are focusing on the release of the Michigan CSI.
- Fed Powell has unexpectedly added an alternative of two more jumbo rate hikes this year.
The EUR/USD is displaying a lusterless performance in the Asian session. The pair is oscillating in a tad lower range of 1.0391-1.0398 despite a bit healthy fall in the US dollar index (DXY). The euro bulls plunged significantly on Thursday after the US Bureau of Labor Statistics unveiled the Producer Price Index (PPI) numbers. The US PPI landed at 11% vs. 10.7% expectation on yearly basis. The legitimate indicator to display commodity inflation strengthened the greenback against the shared currency.
Federal Reserve (Fed) chair Jerome Powell’s interview with the Marketplace national radio program has unexpectedly added the option of two more jumbo rate hikes consecutively in the next policy meetings. Earlier, the street was expecting one more jumbo rate hike only above the 50 basis points (bps) elevation announced in the first week of May. Now, a getting longer spell of aggressive rate hikes is going the spurt the uncertainty in the FX domain.
Meanwhile, euro bulls are still discussing an embargo on Russian oil imports. Despite the withdrawal of the opposition by Germany to prohibit Russian oil on a sudden note, the European Union (EU) is facing headwinds of supply chain bottlenecks, restricted oil production, and unemployment fears to announce awaited embargo on oil from Moscow.
In today’s session, US Michigan Consumer Sentiment Index (CSI) holds significant importance. The catalyst is expected to land at 64 against the prior print of 65.2. An outperformance from the Michigan CSI data will add fuel to the greenback bulls.
- GBP/USD grinds higher around intraday top, keeps bounce off two-year low.
- One-week-old previous support tests recovery moves amid bullish MACD signals.
- Steady RSI, short-term descending trend line challenge the rebound.
- May 2020 lows to lure bears during further downside.
GBP/USD struggles to extend corrective pullback from multi-month low as a short-term resistance, previous support line, tests buyers around 1.2215 during early Friday morning in Europe.
Considering the recently bullish MACD signals, as well as the US dollar’s broad pullback, the cable pair’s latest rebound is likely to persist, unless any fundamental disappointments recall bears.
Even if the cable pair crosses the 1.2220 immediate hurdle, a downward sloping resistance line from May 04, near 1.2320, as well as the 200-HMA level of 1.2375, will challenge the GBP/USD buyers.
Alternatively, pullback moves may initially aim for the latest multi-month low near 1.2165 ahead of testing the 1.2100 round figure.
However, the GBP/USD pair’s weakness past 1.2100 will aim to the May 2020 bottom surrounding 1.2075 and the 2000 psychological magnet lure sellers.
GBP/USD: Hourly chart
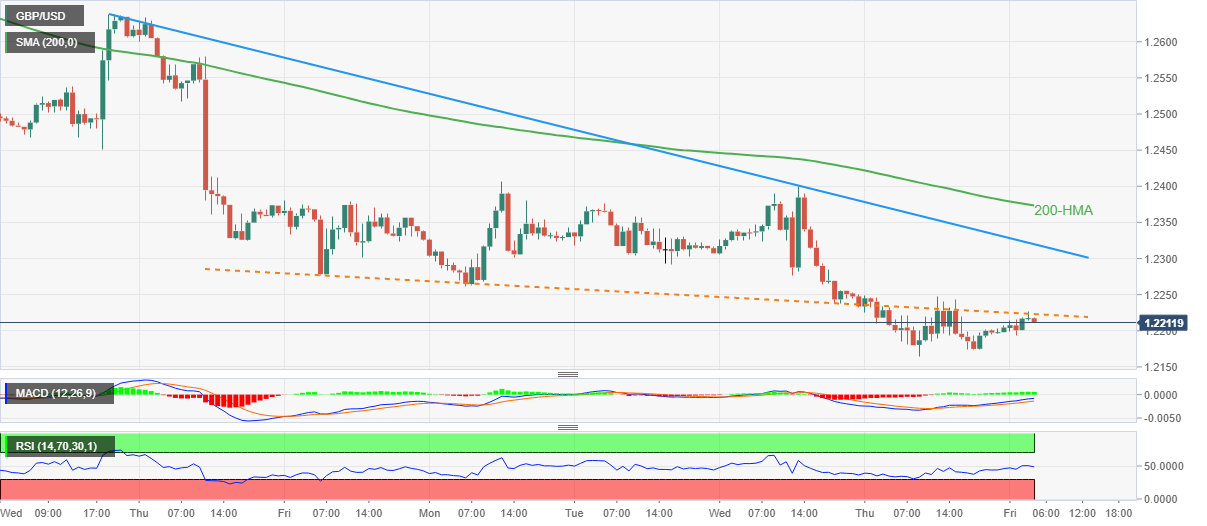
Trend: Bearish
- Asian stocks bounce firmly as DXY loses strength amid a time correction process.
- Chinese indices are gaining continuously on the withdrawal of tariffs on Chinese imports by the US.
- BOJ’s Kuroda promises more policy easing to spurt the growth rate.
Markets in the Asian domain are scaling sharply higher as risk-sensitive currencies have rebounded firmly amid a time correction in the US dollar index (DXY). The DXY is mildly offered in the Asian session after the asset printed a fresh 19-year high of 104.92 on Thursday. The asset got traction after the US economic agency reported the yearly Producer Price Index (PPI) at 11%, higher than the forecasts of 10.7%. Also, the core PPI that excludes food and energy climbed to 8.8% vs. estimates of 8.9%.
At the press time, Japan’s Nikkie225 surged 2.45%, China A50 jumps 0.74%, Hang Send added 1.86%, and India’s Nifty50 rises 0.8%.
Chinese markets are continuously gaining higher after the announcement of tariff withdrawal on Chinese imports by the US. US President Joe Biden on Tuesday announced that the administration could ease some of the tariffs imposed against Chinese imports to lower inflation. The announcement has infused an adrenaline rush into the Chinese indices.
Meanwhile, Japan’s Nikkie225 has outperformed the Asian indices on the announcement of the continuation of a prudent monetary policy by the Bank of Japan (BOJ). BOJ Governor Harihuko Kuroda doesn’t see any legitimate reason to halt stimulus to its economy. Growth rates have yet not reached their pre-pandemic levels and inflation is still lower than the targets despite soaring energy bills and food prices for the households.
- USD/INR takes offers to refresh intraday low, extends pullback from record high.
- RBI said to have infused $700 million to defend rupee as India inflation jumped to eight-year high.
- Mixed Fedspeak, absence of unexpectedly strong PPI triggered USD pullback amid a quiet session.
- China’s covid hopes add to the recovery strength, US Michigan Consumer Sentiment Index for May eyed.
USD/INR justifies the bearish Doji at the record top while taking offers to renew the intraday low near 77.32 during the initial Indian trading session on Friday. Not only the Doji candle but cautious optimism in Asia and the US dollar’s pullback from a 20-year high also weigh on the Indian rupee (INR) pair.
After multiple days of spreading covid woes and challenging the global supply chain, China finally released some news that sighed relief to investors. That said, Shanghai’s plan of zero-COVID at the community level by mid-May, backed by comments supporting 64% vaccinated people above age 60, seems to renew optimism in China. Also keeping the expectations firmer is a three-day “at home” stay for residents for covid testing to tame and confirm the covid resurgence in Beijing.
On the other hand, the USD correction takes clues from the US Treasury yields’ bounce off a two-week low, as well as mildly bid stock futures. The US PPI’s matching of 0.5% MoM market consensus joins Fed Chairman Jerome Powell’s reiteration of 50 bps rate hikes in the next two meetings to trigger the latest corrective moves. On the same line were comments from San Francisco Fed President Mary Daly who mentioned, “Is it 50, is it 25, is it 75? Those are things that I’ll deliberate with my colleagues, but my own starting point is we don’t want to go so quickly or so abruptly that we surprise Americans”.
Amid these plays, the US 10-year Treasury yields portray a corrective pullback after refreshing a two-week low the previous day, around 2.89% by the press time, whereas the S&P 500 Futures print rises 1.0% while licking its wound near one-year low.
It’s worth noting that the INR refreshed all-time before the Reserve Bank of India’s (RBI) intervention dragged it back from 77.66. That said, India’s Consumer Price Index (CPI) rallied to an eight-year high of 7.79% YoY versus 7.5% expected and 6.95% prior the previous day.
Looking forward, preliminary readings of US Michigan Consumer Sentiment data for May, expected 64 versus 65.2 prior, as well as headlines concerning coronavirus, geopolitics and Fedspeak will be important to gauge short-term USD/INR moves.
Technical analysis
Overbought RSI (14) line, Doji candlestick justifies the USD/INR pair’s latest pullback. However, highs marked during March and April, respectively around 77.17 and 77.07, may test the bears before directing them to the 77.00 threshold. Meanwhile, fresh buying may aim for the latest all-time high of 77.66 before challenging the 78.00 round figure.
- USD/JPY sees a balancing profile above 129.00 as BOJ may keep up the prudent monetary policy.
- Fed Powell has just signaled two more 50 bps rate hikes in CY2022.
- For further guidance, investors will focus on Michigan CSI, which is seen at 64.
The USD/JPY pair is advancing modestly from the early Asian session despite a weak performance from the US dollar index (DXY) has remained weak after printing a fresh 19-year high of 104.92 on Thursday. A bullish open-drive session is claiming an establishment above 129.00 on Friday.
A mild correction from the DXY in early Tokyo was highly expected after a strong run-up on Thursday. Higher-than-expected US Producer Price Index (PPI) numbers fueled the odds of an aggressive policy tightening by the Federal Reserve (Fed). The recent tradition of the DXY to renew 19-year high after a mild correction at regular intervals is expected to continue for a prolonged period as Fed chair Jerome Powell has warned of two more rate hikes by 50 basis points (bps) in Fed’s next two interest rate decision announcements. Also, Fed Powell emphasized the need for price stability as paychecks are losing their value amid soaring inflation.
Meanwhile, yen bulls are witnessing a broader weakness in the Asian session as the Bank of Japan (BOJ)’s Governor has promised a more conservative monetary policy going forward, in his statement on Friday. The Japanese economy has yet not achieved its pre-pandemic growth levels and inflation is still not at par with the targeted levels.
In today’s session, investors will keep an eye on the release of the Michigan Consumer Sentiment Index (CSI). The catalyst is expected to land at 64 against the former figure of 65.2.
"In times like now when uncertainty is high, central banks must conduct monetary policy by examining various data broadly without any preset idea," said Bank of Japan (BOJ) Governor Haruhiko Kuroda during early Friday in Asia.
Also read: BOJ’s Kuroda: The central bank must continue monetary easing to achieve its price target
Additional quotes
Japan's economy continues to pick up as a trend.
BOJ must continue to support economy's recovery from pandemic with powerful monetary easing.
Expected rise in inflation is driven mostly by energy costs, lacking sustainability.
We aren't seeing signs of sharp rise in medium-, long-term inflation expectations in Japan.
We will seek to achieve 2% inflation sustainably, stably by creaing cycle in which rising wages push up households' real income.
Covid pandemic continues to exert downward pressure on economy.
Recent rise in commodity prices is hurting economy by reducing real income.
Japan's inflation situation is completely different from that of US, Europe.
Uncertainty regarding economic outlook heightening sharply.
There is risk ukraine crisis could hurt global economy further, trigger sharp volatility in commodity prices.
There is risk markets, including forex, could destabilise as advanced economies accelerate withdrawal of stimulus.
Must be mindful that sharp fx volatility would hurt economy BOJ will carefully watch impact of market volatility on economy, prices.
Short-term inflation expectations among households, firms, market participants are clearly heightening.
We are carefully watching whether such rise in short-term inflation expectations would spread to higher medium-, long-term inflation expectations and wage growth.
We must see both prices and wages rise.
Japan must see a situation where price rises are accompanied by increases in real wages, income.
USD/JPY picks up bids
Following the news, USD/JPY regains upside momentum towards the daily high, at 129.15 by the press time.
Read: USD/JPY Price Analysis: Recovery remains elusive below 129.50
- USD/CNH takes offers to renew intraday low, snaps two-day uptrend around the highest level since September 2020.
- Rebound in yields, stock futures underpin consolidation of USD gains ahead of US Michigan Consumer Sentiment Index.
- Shanghai eyes easing virus-led restriction after mid-May, Beijing pushes for three-day “stay at home”.
USD/CNH pulls back from a 32-month high, pressured around intraday low near 6.8080, as consolidation of the US dollar gains joins hopes of covid recovery in China during Friday’s Asian session.
Shanghai’s plan of zero-COVID at the community level by mid-May, backed by comments supporting 64% vaccinated people above age 60, seems to renew optimism in China. Also keeping the expectations firmer is a three-day “at home” stay for residents for covid testing to tame and confirm the covid resurgence in Beijing.
Elsewhere, the latest pullback in the US dollar takes clues from the US Treasury yields’ bounce off a two-week low, as well as mildly bid stock futures. The US 10-year Treasury yields portray a corrective pullback after refreshing a two-week low the previous day, around 2.89% by the press time, whereas the S&P 500 Futures print rises 1.0% while licking its wound near one-year low.
It should be noted that the US Producer Price Index (PPI) matched 0.5% MoM forecasts and kept inflation fears on the table the previous day. However, Fed Chairman Jerome Powell reiterated the expectation that the Fed will raise interest rates by half a percentage point at each of its next two policy meetings. The same could have triggered the rebound in yields as markets anticipate 75 basis points (bps) of a rate hike. On the same line were comments from San Francisco Fed President Mary Daly who mentioned, “Is it 50, is it 25, is it 75? Those are things that I’ll deliberate with my colleagues, but my own starting point is we don’t want to go so quickly or so abruptly that we surprise Americans”.
Above all, the monetary policy divergence between the Fed and the People’s Bank of China (PBOC) keeps USD/CNH elevated. For the short-term directions, preliminary readings of US Michigan Consumer Sentiment data for May, expected 64 versus 65.2 prior, as well as headlines concerning coronavirus, geopolitics and Fedspeak will be the key to follow.
Technical analysis
Although overbought RSI conditions triggered the latest pullback from a fortnight-old resistance line, near 6.8320 by the press time, bears should remain cautious until the quote stays beyond the 6.6100 mark, comprising April 25 high and May’s low.
- Gold Price rebounds from three-month lows, as risk sentiment recovers.
- End of the week flows could add legs to the relief rally in XAU/USD.
- Recapturing the $1,836 level is critical for gold bulls after Thursday’s turmoil.
Gold Price is making a recovery attempt after the latest leg down to a new three-month low near $1,800. The market’s perception of risk sentiment and its impact on the US dollar valuations continue to play a key role, as global growth and inflation fears keep lurking. Hotter US inflation and expectations of aggressive Fed’s tightening renewed global economic slowdown concerns, as investors sought refuge in the ultimate safe-haven US dollar. Looking ahead, the end of the week flows and the dollar dynamics will continue to play a pivotal role in Gold Price action, as the turbulent week draws to an end.
Also read: Silver tests a make-or-break point
Gold Price: Key levels to watch
The Technical Confluences Detector shows that the Gold Price is eyeing a test of the Fibonacci 23.6% one-day at $1,830 on its road to recovery.
Recapturing that level will put minor resistance at $1,834 in XAU buyers’ sights.
Gold bulls need to find a strong foothold above the confluence of the Fibonacci 38.2% one-day and SMA200 one-day at $1,836 to affirm a meaningful recovery.
The next stop for bullish traders is seen at the Fibonacci 61.8% one-day at $1,843, above which the $1,847 hurdle will be challenged. At that point, the pivot point one-month S1 and pivot point one-day R1 meet.
On the downside, strong support is seen around $1,823, which is the convergence of the previous day’s low and the pivot point one-week S2.
A breach of the last will trigger a fresh downswing towards the intraday low of $1,810, below which the $1,808 cap will be the last line of defense for gold bulls. The latter is the pivot point one-day S1.
Here is how it looks on the tool
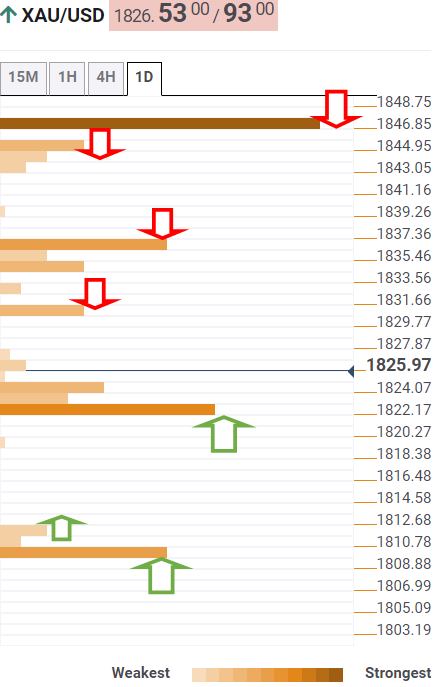
About Technical Confluences Detector
The TCD (Technical Confluences Detector) is a tool to locate and point out those price levels where there is a congestion of indicators, moving averages, Fibonacci levels, Pivot Points, etc. If you are a short-term trader, you will find entry points for counter-trend strategies and hunt a few points at a time. If you are a medium-to-long-term trader, this tool will allow you to know in advance the price levels where a medium-to-long-term trend may stop and rest, where to unwind positions, or where to increase your position size.
- Copper prices are expected to find significant offers sooner on lower demand forecasts.
- Fed Powell's statement on stepping up rates by more than two 50 bps rate hikes this year has dueled uncertainty.
- The minimal positives of the zero-Covid policy in China have added concerns over the copper demand.
A gradual upside move from the low of $4.0400 on COMEX may be holding the buyers' bet on the copper prices but follow up of a sheer downside move looks favored as demand worries fueled up by Federal Reserve (Fed) chair Jerome Powell’s statement.
Copper prices are on the tenterhooks as the market pundits are betting over a major slump in the aggregate demand going in the remaining year and hopefully for the next year. Fed’s Powell in his interview with Marketplace national radio program cited that interest rates could be elevated by 50 basis points (bps) each in its next two monetary policy meetings. And, investors should brace for more policy tightening if data turns ugly.
Read: Fed Powell says Fed will fix inflation, calls stable prices 'bedrock' of economy
Adding to that, Powell focused more on bringing price stability as higher inflationary price pressures are hurting the paycheck. No doubt, more policy tightening moves by the Fed will absorb helicopter money from the economy and corporate will spend their costly dollars on much-refined investments. This is going to dent the demand for the base metals significantly.
Meanwhile, the ongoing zero-Covid policy in China to curb the spread of the Covid-19 has raised concerns over the aggregate demand. The restrictions imposed by the administration on the movement of men, materials, and machines in Shanghai and Beijing have halted the production processes drastically. The renewed demand worries amid bulging restrictive measures in China are weighing on the copper prices.
Bank of Japan (BOJ) Governor Haruhiko Kuroda said Friday, the central bank must continue monetary easing to achieve its price target.
Additional quotes
Japan still hasn't achieved situation where inflation is stably, sustainably at 2%.
BOJ’s massive bond buying may be hurting market functions but we also need to maintain massive monetary easing.
Recent sharp, short-term forex moves are undesirable.
Premature to debate exit of ultra-easy policy.
Important for forex rates to move stably reflecting economic, financial fundamentals.
Japan's economy still in midst of recovering from pandemic's pain, so important to maintain powerful monetary easing.
BOJ’s median board forecast shows inflation won't stably reach BOJ’s target in fiscal 2023.
BOJ’s median board forecast for core-core consumer inflation shows inflation will steadily accelerate through 2024.
It will take some more time, but convinced Japan can achieve BOJ’s price target.
Market reaction
USD/JPY is back under 129.00, in reaction to BOJ Chief Kuroda’s comments. The pair is now trading at 128.88, still up 0.45% on the day.
- AUD/NZD stays mildly bid, up for the second consecutive day inside a bullish chart pattern.
- Sustained trading above the key moving averages, firmer RSI keep buyers hopeful.
- 200-SMA adds to the downside filters, bulls can test late 2017 peak on flag confirmation.
AUD/NZD extends the previous day’s bounce off short-term key SMA while printing mild gains around 1.1010 during Friday’s Asian session. In doing so, the cross-currency pair picks up bids inside a thee-week-old bull flag.
In addition to the bounce off the 100-SMA, the firmer RSI and successful trading above the 200-SMA also keep AUD/NZD buyers hopeful.
However, a clear upside break of 1.1050 becomes necessary to confirm the bullish chart pattern suggesting a rally towards the late 2017 peak near 1.1300.
It’s worth noting that the latest high around 1.1195 will act as an intermediate halt during the anticipated run-up.
Alternatively, 100-SMA and the stated flag’s lower line, respectively around 1.0675 and 1.0950, limit the short-term downside of the pair.
Following that, the 200-SMA level of 1.0930 will act as the last defense of the AUD/NZD buyers before challenging the late April’s low near 1.0820.
AUD/NZD: Daily chart
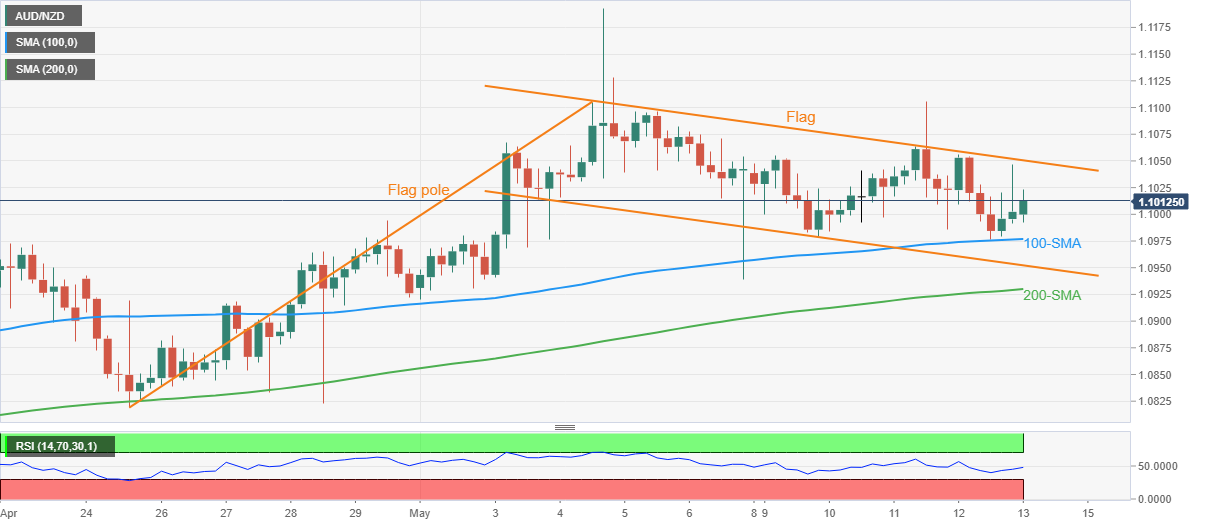
Trend: Further upside expected
Deputy mayor Wu Qingat of China’s Shanghai city said in a statement on Friday, the country's financial hub is aiming to reach zero-Covid at the community level by mid-May.
Additional quotes
Shanghai will aim to open up, ease traffic restrictions and open shops in orderly manner.
More than 9,000 large-scale enterprises in shanghai now operating at nearly 50% of capacity.
The fight against China's biggest-ever COVID-19 outbreak "still requires the joint exertions of every citizen.”
Shanghai's daily covid testing capacity now at more than 8 million, more than 5,700 testing stations already in operation.
Market reaction
The recovery in the risk sentiment, as reflective of the 0.72% rebound in the S&P 500 futures, is the underlying theme in Asia this Friday.
The above comments are likely to add to the risk recovery after a turbulent week so far.
| Raw materials | Closed | Change, % |
|---|---|---|
| Brent | 108.14 | 0.52 |
| Silver | 20.695 | -4.05 |
| Gold | 1821.86 | -1.6 |
| Palladium | 1899.27 | -6.21 |
- EUR/USD stabilizes around five-year low after positing the biggest daily loss since March 2020.
- US PPI, Fedspeak seems to have favored a rebound in Treasury Yields, stock futures but the bears stay hopeful.
- ECB policymakers renew July rate hike concerns but tussles with Russia, economic fears weigh on Euro.
- US consumer sentiment gauge for May, EU’s verdict on Russian oil embargo and ECBspek will be eyed for fresh impulse.
EUR/USD licks its wounds near 1.0380, after refreshing a five-year low the previous day, as global markets consolidate recent moves amid an absence of major catalysts during Friday’s Asian session.
The major currency pair’s latest daily fall, the biggest in 26 months, challenges the buyer’s return ahead of the short-term key US consumer sentiment gauge for May, as well as comments from European Central Bank (ECB) Vice President Luis De Guindos.
The reason for the latest anxiety among EUR/USD traders could be linked to the divergence in comments from the Fed and the ECB policymakers. That said, the ECBspeak has recently turned hawkish by highlighting the July rate hike concerns whereas Fed Chairman Powell and San Francisco Fed President Mary Daly seem trying to compress the odds favoring the 75 basis points (bps) of a rate hike.
It’s worth noting that an absence of major positives from the US Producer Price Index (PPI) for April, which matched 0.5% MoM forecasts, also could be linked to the latest rebound in the EUR/USD prices.
Amid these plays, the US 10-year Treasury yields portray a corrective pullback after refreshing a two-week low on Thursday, around 2.89% by the press time, whereas the S&P 500 Futures rise 0.75% intraday while licking its wound near one-year low.
Looking forward, comments from ECB Vice President Luis De Guindos will be the first to direct EUR/USD moves before the preliminary readings of US Michigan Consumer Sentiment data for May, expected 64 versus 65.2 prior. While ECB’s De Guindos will be eyed for more clarifications for a rate hike, US data should remain firmer to keep the EUR/USD bears hopeful.
Read: Michigan Consumer Sentiment Index May Preview: Can Americans keep their spending habits?
Additionally, the European Union (EU) is yet to officially approve the oil embargo on Russia's energy imports and the decision on the same was to be made this week. Any updates on the same, coupled with the chatters over Finland’s joining of NATO and Ukraine tension, will also be eyed for fresh impulse.
Technical analysis
A clear downside break of the 2017 bottom of 1.0340 becomes necessary for the EUR/USD bears to keep reins. Otherwise, oversold RSI may play the role of activating a corrective pullback targeting the last monthly low near 1.0470.
Japanese Finance Minister Shunichi Suzuki is on the wires again, via Reuters, continuing with its take on the yen price action.
Key quotes
Recent rise in Japan’s prices due mostly to global commodity inflation rather than forex moves
FX stability is important, recent rapid moves are undesirable.
Weak yen is boost to exports but lead to higher prices for importers.
Related reads
- Japan’s Suzuki: Will continue to watch FX, price moves carefully
- USD/JPY Price Analysis: Recovery remains elusive below 129.50
- AUD/USD bulls are stepping in within bearish territory.
- The Fibonacci scale has the 38.25 and 505 ratios lining up with stricture.
AUD/USD has been deteriorating for six straight trading days and has fallen into a void below 0.69 the figure and has been en route towards a weekly structure around 0.6780.
The following illustrates the market from a weekly and daily perspective and arrives at the potential for a meanwhile correction to the upside before mitigating the price imbalance to said level.
AUD/USD weekly chart
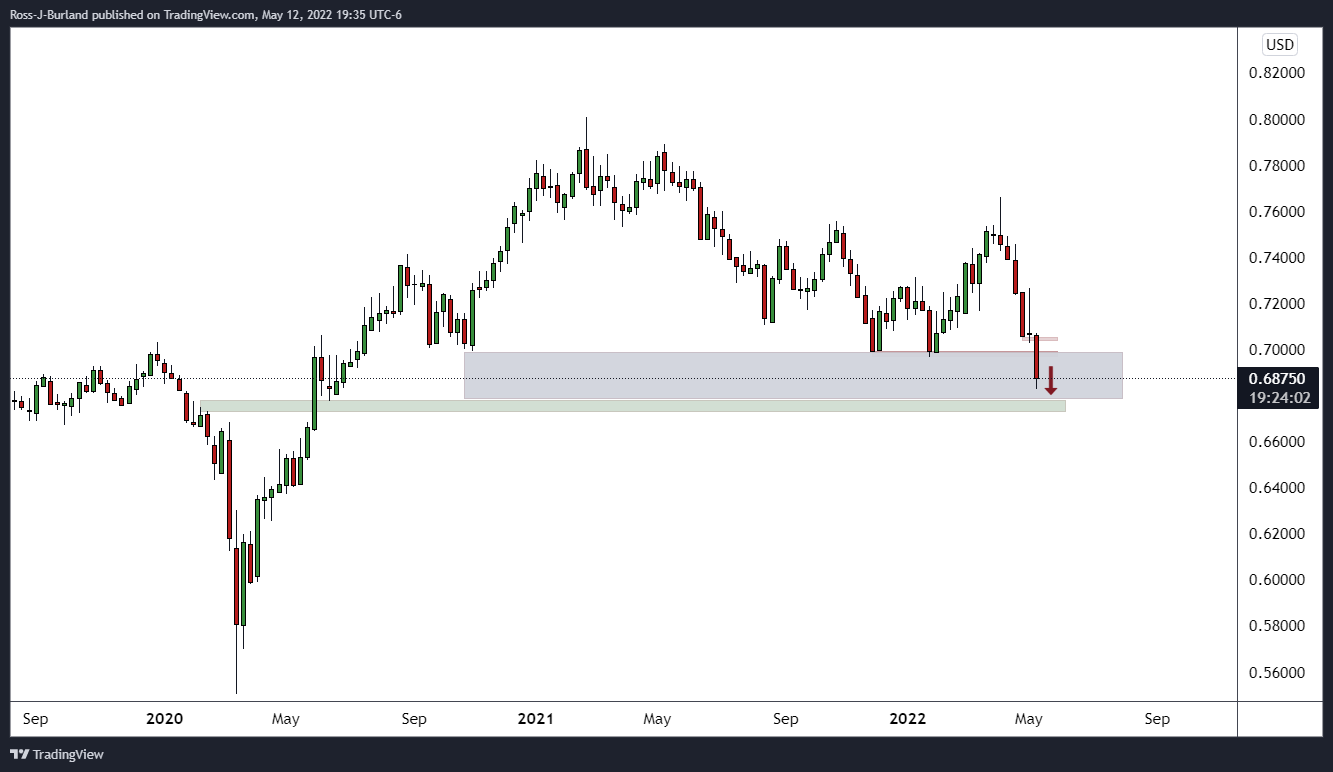
The weekly chart is highly bearish and the price is well on the way to the aforementioned weekly structure. However, from a daily perspective, there are prospects of bullish reaction:
AUD/USD daily chart
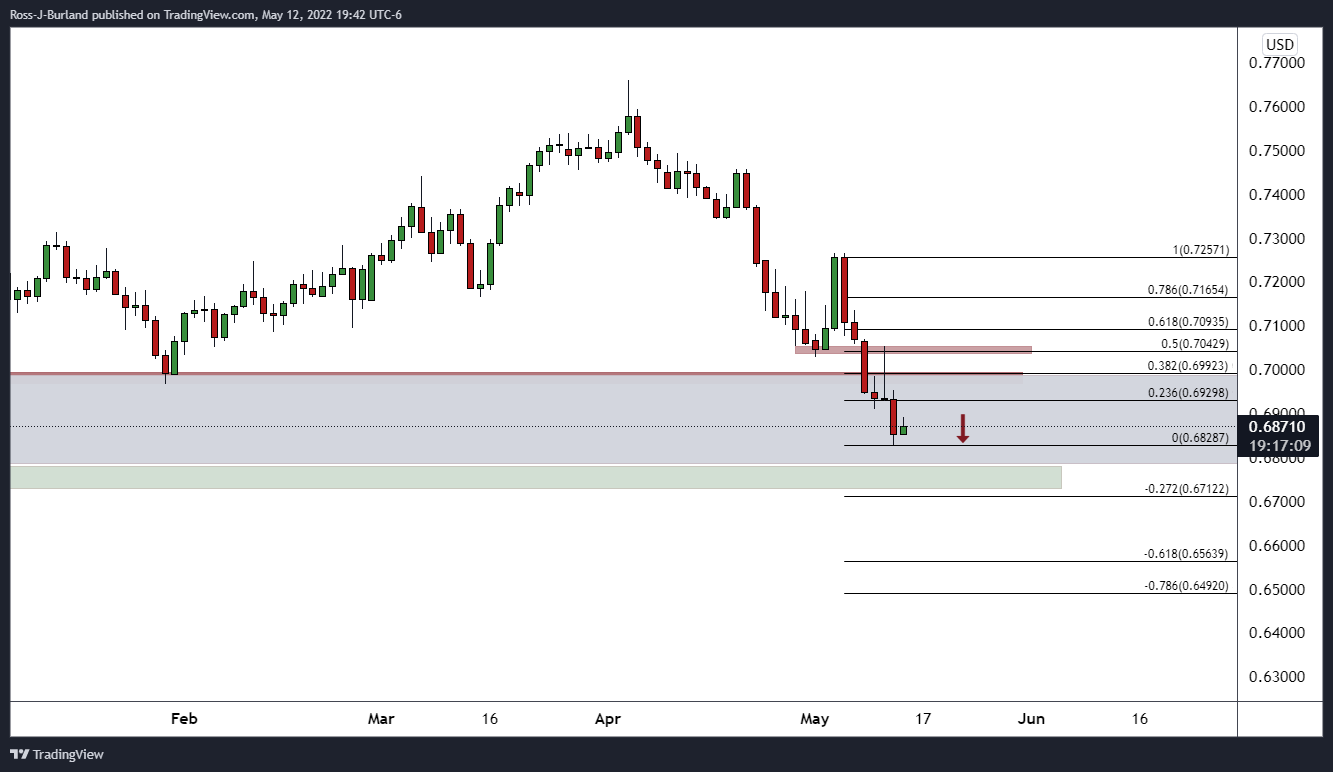
The price is already correcting and there are prospects of a move into the Fibonacci scale with 38.2% and the 50% ratios in areas of significance.
- GBP/JPY picks up bids to refresh intraday high, snaps two-day downtrend.
- Bearish MACD signals, downbeat RSI keep sellers hopeful to retest 200-DMA.
- One-month-old falling trend line adds to the downside filters.
GBP/JPY prints the highest daily gains in a fortnight as buyers flirt with 157.80 during Friday’s Asian session.
The cross-currency pair’s latest rebound from the lowest levels since March, marked the previous day, lacks support from the RSI, as well as the MACD.
As a result, the 100-DMA level, surrounding 158.00, probes the GBP/JPY buyers, making it difficult to reverse the monthly bearish trend.
Even if the quote rises past 158.00, a downward sloping trend line from April 20, near 160.80 by the press time, appears a tough nut to crack for the bulls, which in turn will trigger the run-up targeting the 164.00 level.
Meanwhile, pullback moves may retest the 157.00 threshold but will be challenged by the 200-DMA, around 155.20 at the latest.
Following that, the yearly lows surrounding 151.00 and the 150.00 psychological magnet will lure the GBP/JPY bears.
GBP/JPY: Daily chart
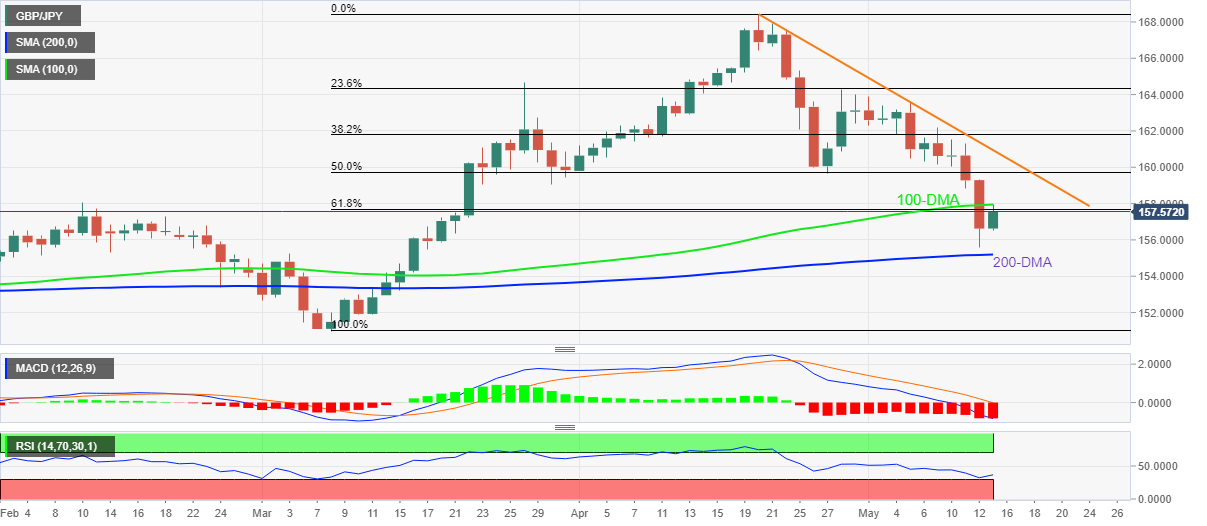
Trend: Bearish
When asked about the recent yen price movements, Japanese Finance Minister Shunichi Suzuki reiterated that they “will continue to watch FX and price moves carefully, with a sense of urgency.”
Additional quotes
Will continue to watch FX, price moves carefully, with a sense of urgency.
FX rates move on various factors not just Japan-US interest rate diffentials.
FX moves driven by markets.
G7 likely to discuss global economic challenges caused by Russia’s invasion of Ukraine.
BOJ holds jurisdiction over monetary policy, management of its operations.
BOJ is not government's subsidiary.
BOJ is buying govt bonds as part of its monetary policy effort to achieve price target.
BOJ holdings of govt bonds could fluctuate sharply depending on monetary policy decisions at the time.
Inappropriate to conduct fiscal policy on the assumption BOJ will continue to buy bonds indefinitely.
Market reaction
USD/JPY has staged a solid rebound amid a relief rally this Friday. The pair is trading at 129.14, up 0.66% on the day, having stalled its recovery at 129.35.
- Global markets take a sigh of relief after multiple days of drawdown.
- Comments from Fed’s Powell, neutral prints of US PPI seem to favored corrective pullback.
- Preliminary readings of US Michigan Consumer Sentiment for May eyed for fresh impulse.
Traders took a break from a stellar bear show during an inactive Asian session on Friday. Although a lack of major negatives could be mentioned as the key catalyst behind the relief rally, comments from Fed Chair Jerome Powell and the latest US Producer Price Index (PPI) could also be linked, indirectly, to the market’s recent behavior.
While portraying the mood, the US 10-year Treasury yields rebound from a two-week low, up nearly four basis points (bps) to around 2.89% by the press time. Also, the S&P 500 Futures rise half a percent to 3,950 while licking its wounds near a one-year low.
The US PPI’s matching of 0.5% MoM market consensus joins Fed Chairman Jerome Powell’s reiteration of 50 bps rate hikes in the next two meetings to trigger the latest corrective moves. On the same line were comments from San Francisco Fed President Mary Daly who mentioned, “Is it 50, is it 25, is it 75? Those are things that I’ll deliberate with my colleagues, but my own starting point is we don’t want to go so quickly or so abruptly that we surprise Americans”.
Elsewhere, China mandates three-day “at home” stay for residents for covid testing to tame and confirm the covid resurgence in Beijing. This challenges the market’s risk appetite amid a sluggish session. Also negative for the sentiment are the fears of an escalation in the West versus Russia tussles as Moscow recently warned Finland over its plans to join the North Atlantic Treaty Organization (NATO).
It should be noted, however, that a lack of major data/events in Asia and a pause in risk-aversion aren’t the strong catalysts for directions. Hence, the traders will wait for the preliminary readings of US Michigan Consumer Sentiment data for May, expected 64 versus 65.2 prior, for fresh impetus.
Read: Michigan Consumer Sentiment Index May Preview: Can Americans keep their spending habits?
In recent trade today, the People’s Bank of China (PBOC) set the yuan (CNY) at 6.7898 vs the last close of 6.7872.
About the fix
China maintains strict control of the yuan’s rate on the mainland.
The onshore yuan (CNY) differs from the offshore one (CNH) in trading restrictions, this last one is not as tightly controlled.
Each morning, the People’s Bank of China (PBOC) sets a so-called daily midpoint fix, based on the yuan’s previous day closing level and quotations taken from the inter-bank dealer.
- Gold remains in bearish territory but is attempting to recover from fresh cycle lows.
- The price has already corrected to a 38.2% Fibo so there are prospects for a move lower from here.
The price of gold is consolidating the overnight drop from a high of $1,858.87 to a fresh cycle low of $1,810.67. The US dollar has been strong into the end of the week and hit fresh two-decade highs on Thursday as investors move in droves into the safe-haven currency in the face of surging inflation and heightened risks surrounding the Russian invasion of Ukraine.
Finland said it would apply to join NATO "without delay." Sweden is expected to follow. Russia has said it will be forced to take "retaliatory steps" which has weighed on the euro, putting a bid in the US dollar and consequently weighing on the price of gold.
The dollar index (DXY), which measures the greenback's strength against a basket of six currencies, rose 0.4% to 104.92 and is holding in positive territory in Tokyo on Friday, near to the highs.
"Dollar is rallying as things potentially look negative in the US, which is hurting gold. Also, the market is realising the likelihood of seeing pretty aggressive interest rate increases," analysts at TD Securities argued.
''A liquidity vacuum is dragging all assets lower, leaving gold to circle the drain in defiance of its safe-haven status, despite the fierce rally in Treasuries,'' analysts at TD Securities said.
A drop in the benchmark 10-year Treasury yields hit the lowest level in two weeks. The ten-years were down over 3% overnight while the more Fed tentative 2-years were losing 3.7%, weighed by Producer Prices that fell short of expectations.
The US Producer Price Index increased by 0.5% in April compared with a 1.6% jump in March. Excluding food and energy, the core PPI climbed by 0.4%, lagging the 0.7% gain expected. Core PPI grew by 1.2% in March. On a year-over-year basis, producer price inflation surged 11% in April, and core PPI jumped 8.8%, the Bureau of Labor Statistics said Thursday.
''With CTA trend followers joining into the liquidation party, substantial selling flow continues to weigh on the yellow metal at a time when liquidity is scarce,'' the analysts at TD Securities said.
''Prices are now struggling to hold onto the bull-market-era defining uptrend in the yellow metal under the pressure of this selling flow. For the time being, the trendline has held despite the strong CPI report, as the turbulence in risk assets sparked a bid in Treasuries, but we continue to see a significant amount of complacent length in gold which could weigh on prices, while the breadth of traders short has just started to rise from near-record lows.''
Gold H4 chart
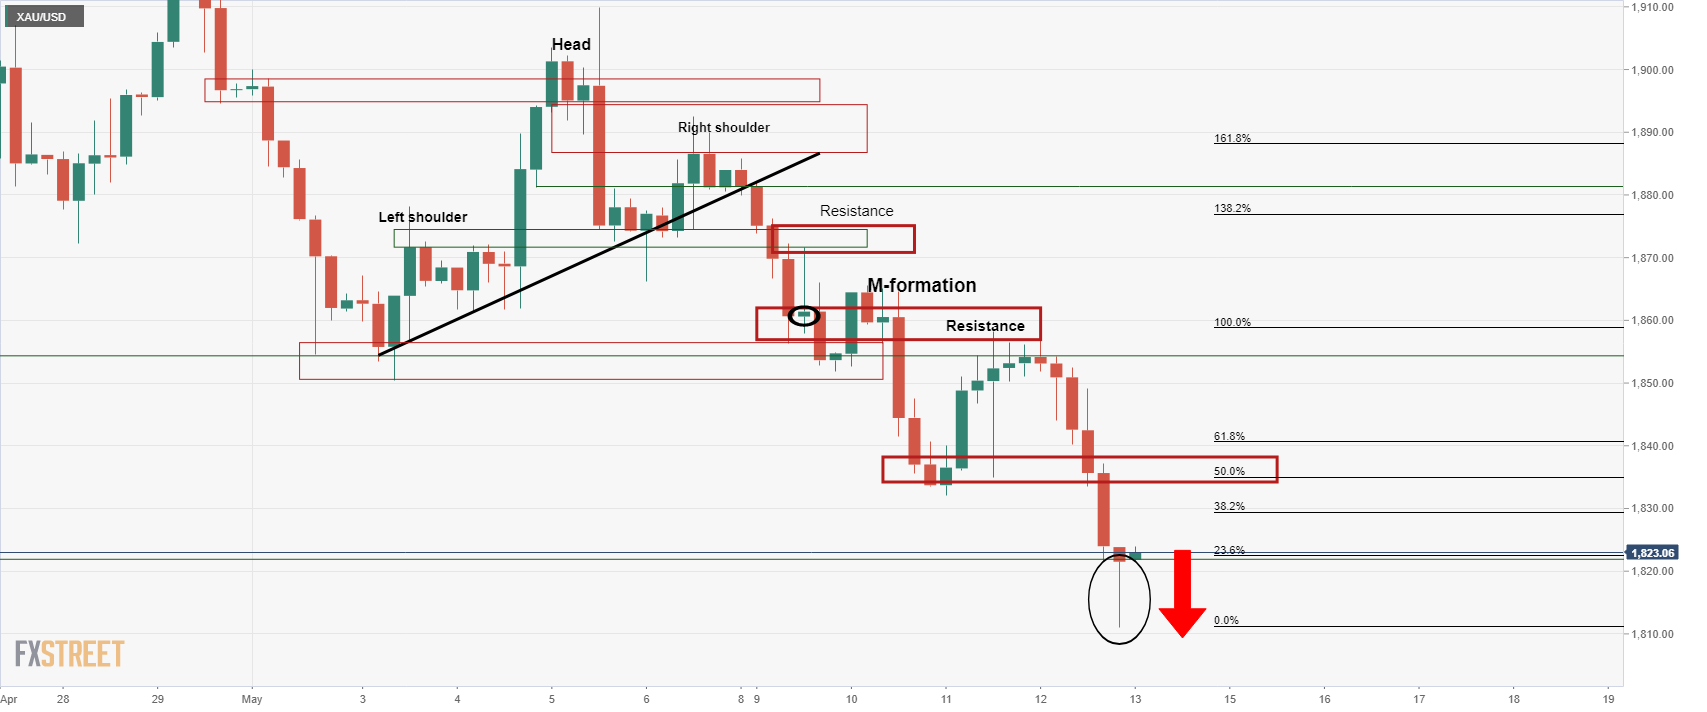
The price has been rejected but nevertheless, the 4-hour candle closed bearishly so there is every chance that the bears will step in again at a discount on the lower time frames as follows:
Gold H1 chart
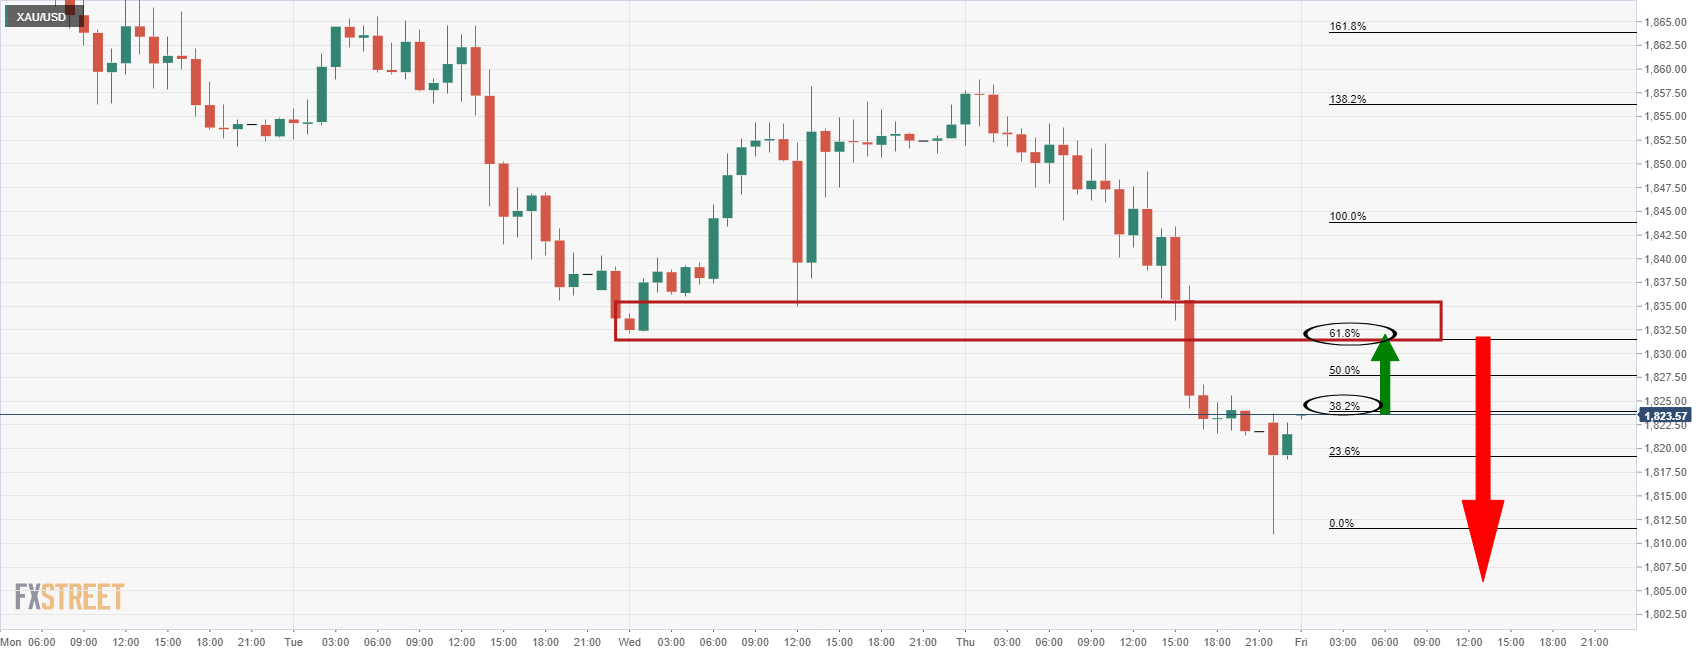
The price has already corrected to a 38.2% Fibo so there are prospects for a move lower from here as the correction decelerates. However, the price action is less than convincing. Some further mitigation of the price imbalance until the 61.8% Fibo towards the $1,830s.
On the way lower again, bears will be heading into new territories and a test below the psychological $1,800 round figure will be on the cards:
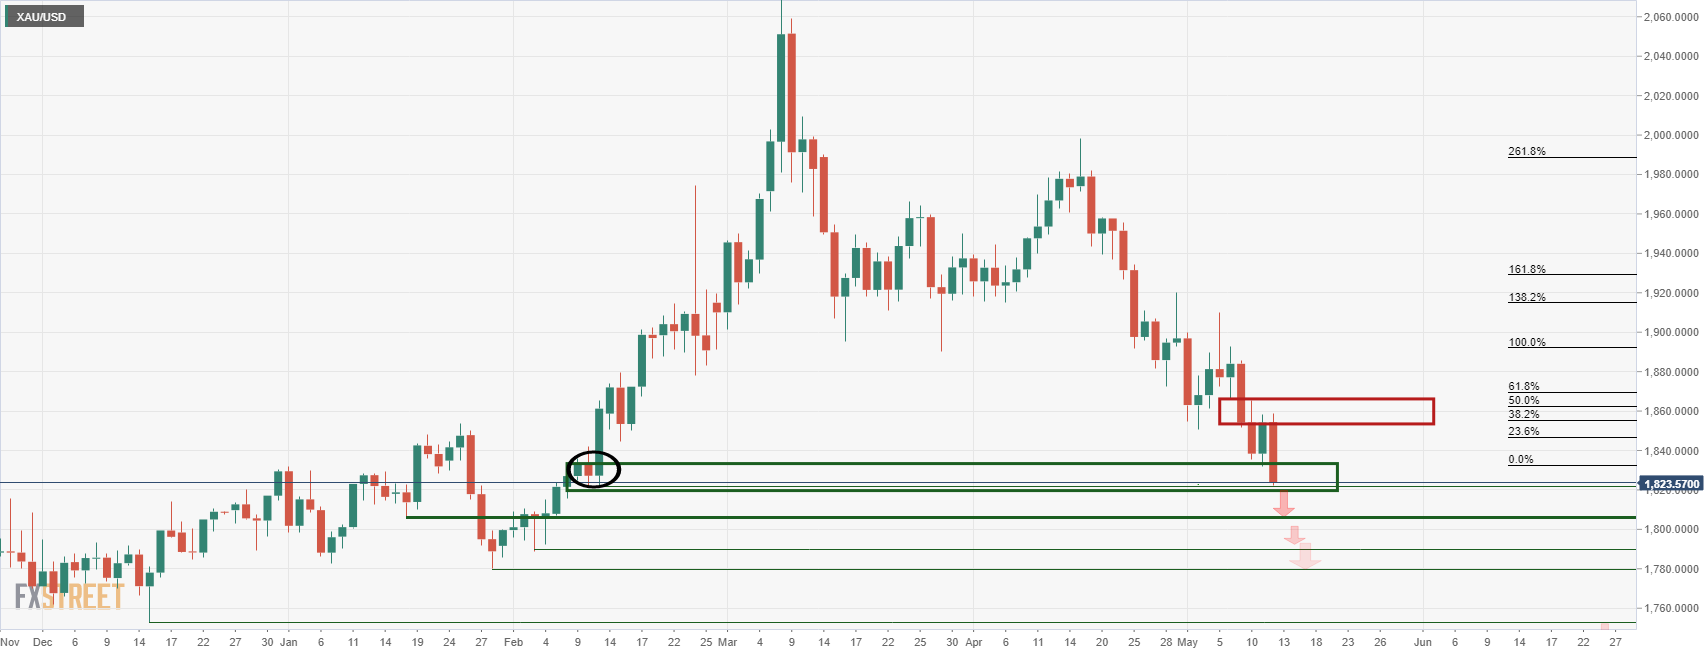
- USD/CHF is facing a time correction after a juggernaut upside move.
- Fed’s Powell has warned that a 50 bps interest rate hike could continue longer.
- The Swiss franc has remained vulnerable to failing to spurt the growth rates.
The USD/CHF pair is witnessing a time correction as momentum oscillators have turned extremely overbought on the lower timeframe. The pair is displaying back and forth moves in a narrow range of 1.0024-1.0035 in the Asian session. For the greenback bulls, sustainability above the psychological support of 1.0000 will be healthy going forward.
The pair have remained in the fist of the greenback bulls on the advancing US dollar index (DXY). The DXY is gaining sharply on upbeat economic data. The outperformance of the US Nonfarm Payrolls (NFP) and above-expectation release of the US Consumer Price Index (CPI) and Producer Price Index (PPI) have bolstered the odds of more jumbo rate hikes by the Federal Reserve (Fed) this year.
In the Asian session, the DXY is experiencing a mild correction after printing a fresh 19-year high at 104.93. Fed chair Jerome Powell in his interview with Marketplace national radio program stated that the Fed may elevate its interest rates by 50 basis points (bps) at each of its next two policy meetings. Adding to that, the Fed pledges that "we're prepared to do more." if data turn the wrong way.
Meanwhile, the Swiss franc is facing an extreme sell-off for a longer period as their ultra-loose monetary policy is failing to spurt the demand growth into their economy. Also, the flat Unemployment Rate and inflation numbers failed to provide and cushion to the asset.
- USD/CAD retreats from 18-month high on failure to cross immediate resistance line.
- Descending RSI line adds strength to the bearish bias.
- 100-HMA, one-week-old ascending trend line puts a floor under short-term downside.
- Bulls can aim for late 2020 swing high on crossing 1.3080 hurdle.
USD/CAD consolidates recent gains while easing from the highest level since November 2020, renewing an intraday low around 1.3010 by the press time of Friday’s Asia session.
In doing so, the Loonie pair portrays a pullback from a four-day-old resistance line, around 1.3080 by the press time.
Given the downward sloping RSI (14) line, not oversold, the latest weakness in prices may prevail for a bit more ahead of hitting any crucial support.
That said, a convergence of the 100-HMA and a one-week-old rising trend line appears, around 1.2995, a tough nut to crack for the USD/CAD bears.
In a case where the quote drops below 1.2995, multiple levels surrounding 1.2920-10, which includes early May’s high and the 200-HMA, will entertain the pair sellers.
On the flip side, a clear break of the aforementioned short-term resistance line of 1.3080 will need validation from the 1.3100 threshold before aiming for the late November 2020 peak of 1.3172.
To sum up, USD/CAD weakness isn’t a sign of trend reversal unless the quote breaks 1.2920.
USD/CAD: Hourly chart
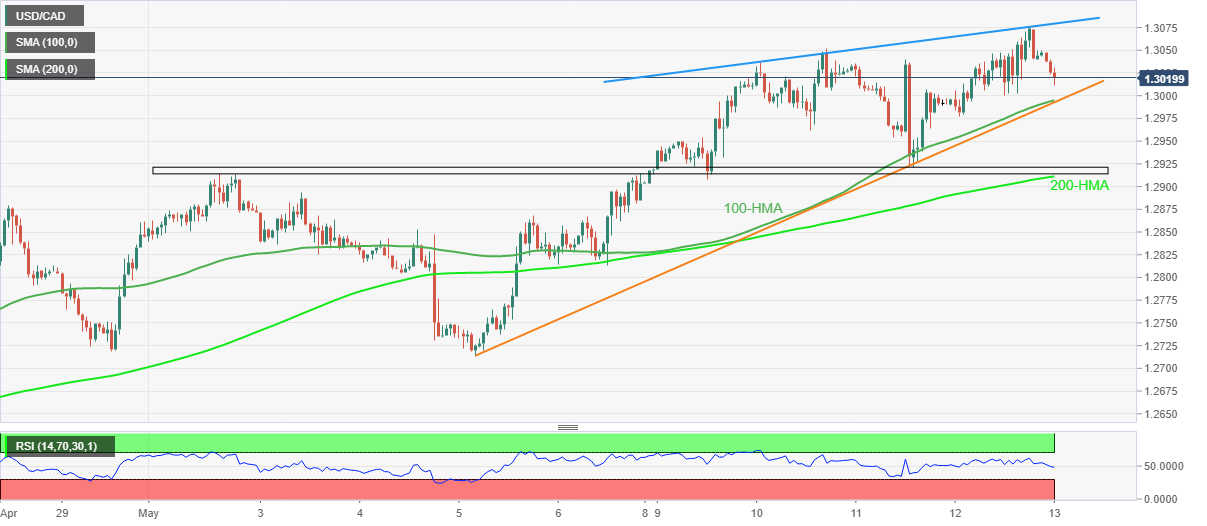
Trend: Bullish
- DXY retreats from multi-day high as traders pare the biggest daily gains in a week amid a quiet Asian session.
- Corrective pullback in US Treasury yields, stock futures could be linked to the greenback’s latest move.
- US PPI matches forecasts but Fed’s Powell reiterates 50 bps rate hike expectations.
- US Michigan Consumer Sentiment for May will be the last key data to watch this week.
US Dollar Index (DXY) bulls take a breather around a 20-year high, recently easing to 104.75 as sluggish markets trigger consolidation of recently sharp movements, mostly in favor of the greenback, during Friday’s Asian session.
The greenback gauge rose during the last three consecutive days to rise to refresh a multi-year high around 105.00. The underlying forces could be linked to the market’s fears of inflation and growth, coupled with the concerns surrounding the Fed’s faster/heavier rate hikes and covid/geopolitical fears.
That being said, the latest pullback in the DXY takes clues from the US Treasury yields’ bounce off a two-week low, as well as mildly bid stock futures. The US 10-year Treasury yields also portray a corrective pullback after refreshing a two-week low the previous day, around 2.86% by the press time, whereas the S&P 500 Futures print mild gains while licking its wound near one-year low.
It should be noted that the US Producer Price Index (PPI) matched 0.5% MoM forecasts and kept inflation fears on the table the previous day. However, Fed Chairman Jerome Powell reiterated the expectation that the Fed will raise interest rates by half a percentage point at each of its next two policy meetings. The same could have triggered the rebound in yields as markets anticipate 75 basis points (bps) of a rate hike. On the same line were comments from San Francisco Fed President Mary Daly who mentioned, “Is it 50, is it 25, is it 75? Those are things that I’ll deliberate with my colleagues, but my own starting point is we don’t want to go so quickly or so abruptly that we surprise Americans”.
Looking forward, DXY bulls will look for more clues to confirm the Fed’s 75 bps rate hike, which in turn highlights today’s preliminary readings of US Michigan Consumer Sentiment data for May, expected 64 versus 65.2 prior. Also important for the US Dollar Index are the risk catalysts like covid fears from China and geopolitical headlines concerning Russia and Ukraine.
Technical analysis
Despite the latest pullback, lows marked during November 2002 and the last month’s high, respectively near 104.10 and 103.95, put a floor under the DXY’s short-term downside. On the contrary, bulls are well-set to challenge the December 2002 high of 107.31.
| Index | Change, points | Closed | Change, % |
|---|---|---|---|
| NIKKEI 225 | -464.92 | 25748.72 | -1.77 |
| Hang Seng | -444.23 | 19380.34 | -2.24 |
| KOSPI | -42.19 | 2550.08 | -1.63 |
| ASX 200 | -123.7 | 6941 | -1.75 |
| FTSE 100 | -114.36 | 7233.34 | -1.56 |
| DAX | -89 | 13739.64 | -0.64 |
| CAC 40 | -63.47 | 6206.26 | -1.01 |
| Dow Jones | -103.81 | 31730.3 | -0.33 |
| S&P 500 | -5.1 | 3930.08 | -0.13 |
| NASDAQ Composite | 6.72 | 11370.96 | 0.06 |
- AUD/JPY has experienced a responsive buying action after the release of the Consumer Inflation Expectations.
- The improved safe-haven appeal underpinned yen against aussie over the past few trading sessions.
- Investors will focus on the release of the RBA meeting minutes next week.
The AUD/JPY pair has witnessed a rebound after hitting a low of 87.48 in the New York session. The risk barometer has remained in the grip of bears for the past few trading sessions amid improvement in the safe-haven appeal. Risk-sensitive assets were facing the headwinds of higher inflation and the Ukraine crisis, which led to a steep fall in the risk-perceived assets.
The asset has found a cushion after the Melbourne Institute reported the Consumer Inflation Expectations at 5%, mid of the market consensus and former print of 4.85 and 5.2% respectively. This has bolstered the odds of one more rate hike by the Reserve Bank of Australia (RBA) in its June policy.
The RBA stepped up its interest rates by 35 basis points (bps) in May’s first week to tame the galloping inflation. This was the first time when RBA raised its interest rates after the emergence of the Covid-19. Mounting price pressures were affecting the paycheck of the households, which forced the RBA to bank upon strict quantitative measures.
On the Japanese front, a safe-haven appeal has brought a broader strength in yen. Although the Bank of Japan (BOJ) will keep on pouring funds into its economy to spurt the growth rate so yen could lose strength further.
Going forward, investors will keep an eye on the release of the RBA’s meeting minutes on Tuesday. This will provide the strategic planning and buildup of the RBA policymakers behind elevating the interest rates.
| Pare | Closed | Change, % |
|---|---|---|
| AUDUSD | 0.68549 | -1.2 |
| EURJPY | 133.224 | -2.52 |
| EURUSD | 1.03809 | -1.27 |
| GBPJPY | 156.569 | -1.64 |
| GBPUSD | 1.21956 | -0.42 |
| NZDUSD | 0.62306 | -0.99 |
| USDCAD | 1.30466 | 0.43 |
| USDCHF | 1.00242 | 0.87 |
| USDJPY | 128.399 | -1.22 |
- USD/JPY picks up bids to portray a rebound from 12-day low, 38.2% Fibonacci retracement level.
- Bearish MACD signals, break of ascending trend line from March favor sellers.
- 100-SMA, the peak of April 20 constitute key short-term resistance.
- 200-SMA, late April’s swing low act as additional downside filters.
USD/JPY recovers from a fortnight low, snaps two-day downtrend, as it regains 128.50 during the initial hour of Tokyo open on Friday.
The yen pair’s latest run-up could be linked to the failure to break the 38.2% Fibonacci retracement (Fibo.) level of March 31 to May 09 upside. However, bearish MACD signals and sustained trading below the previous support line from late March, around 130.70 by the press time, keep sellers hopeful.
That said, the current upside momentum eyes 129.50 level, a confluence of the 100-SMA and April 20 high.
Following that, the 130.00 round figure and the support-turned-resistance line near 130.70 will be crucial to watch for further USD/JPY advances.
Should the quote rises past 130.70, the odds of it refreshing the latest multi-month high of 131.34 can’t be ruled out.
Alternatively, pullback moves may initially aim for the 38.2% Fibo level surrounding 127.50 before the 200-SMA challenge the USD/JPY sellers near 127.10. Also likely to test the pair’s further downside is the late April bottom close to 126.90.
Hence, USD/JPY moves aren’t likely to be entertaining until staying between 126.90 and 129.50.
USD/JPY: Four-hour chart
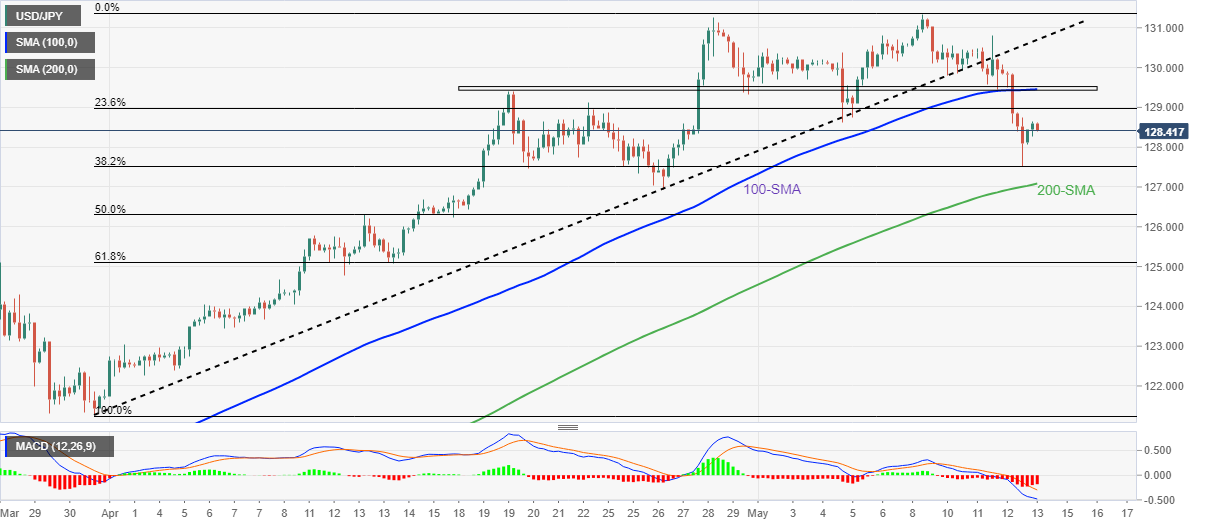
Trend: Pullback expected


© 2000-2026. Sva prava zaštićena.
Sajt je vlasništvo kompanije Teletrade D.J. LLC 2351 LLC 2022 (Euro House, Richmond Hill Road, Kingstown, VC0100, St. Vincent and the Grenadines).
Svi podaci koji se nalaze na sajtu ne predstavljaju osnovu za donošenje investicionih odluka, već su informativnog karaktera.
The company does not serve or provide services to customers who are residents of the US, Canada, Iran, The Democratic People's Republic of Korea, Yemen and FATF blacklisted countries.
Izvršenje trgovinskih operacija sa finansijskim instrumentima upotrebom marginalne trgovine pruža velike mogućnosti i omogućava investitorima ostvarivanje visokih prihoda. Međutim, takav vid trgovine povezan je sa potencijalno visokim nivoom rizika od gubitka sredstava. Проведение торговых операций на финанcовых рынках c маржинальными финанcовыми инcтрументами открывает широкие возможноcти, и позволяет инвеcторам, готовым пойти на риcк, получать выcокую прибыль, но при этом неcет в cебе потенциально выcокий уровень риcка получения убытков. Iz tog razloga je pre započinjanja trgovine potrebno odlučiti o izboru odgovarajuće investicione strategije, uzimajući u obzir raspoložive resurse.
Upotreba informacija: U slučaju potpunog ili delimičnog preuzimanja i daljeg korišćenja materijala koji se nalazi na sajtu, potrebno je navesti link odgovarajuće stranice na sajtu kompanije TeleTrade-a kao izvora informacija. Upotreba materijala na internetu mora biti praćena hiper linkom do web stranice teletrade.org. Automatski uvoz materijala i informacija sa stranice je zabranjen.
Ako imate bilo kakvih pitanja, obratite nam se pr@teletrade.global.
транcфери