- Analiza
- Novosti i instrumenti
- Vesti sa tržišta
Forex-novosti i prognoze od 23-08-2022
Federal Reserve's Neel Kashkari is crossing the wires with his comments dripping through throughout early Asia.
His pivot on his outlook for rates impacted recently when he said the ''Fed is far, far, far away from declaring victory on inflation'' following the recent surprise fall in inflation data. This is when prices rose 8.5% on an annualized basis in July, a slower pace than the 9.1% rise reported in June and below analysts' consensus expectations for an 8.7% rise.
Key comments
Half to two-thirds of US high inflation is driven by supply-side shocks.
There is some evidence supply chains are beginning to normalize.
We need to get some help on the supply side to get inflation down.
The more help we get from the supply side, the less fed has to do and better able to avoid a hard landing.
We need to make sure the underlying inflation trend gets back down to 2%.
We need to tighten monetary policy.
Right now there is no tradeoff between employment and inflation mandates.
If inflation was at 4%, I would be more willing to say let's take our time, and avoid the risk of overdoing it.
With inflation at 8% or higher, we don't want to allow inflation expectations to unanchor.
We can only relax on rate hikes when we see compelling evidence inflation is heading toward 2%.
Fear in the back of the mind is that inflation is more embedded at a higher level than appreciation.
A lot of balance sheet tightening has already happened due to forward guidance.
The biggest fear is that we are misreading underlying inflation dynamics.
Market implications
Old news has failed to move the needle and the greenback remains pressured albeit within a bullish correction on the lower timeframes:
The overall picture is that the Fed has hiked rates from near zero in March to their current range of 2.25% to 2.50%, with more expected in the months ahead.
Kashkari has flipped more hawkish as of late as the Fed tries to tame inflation, which is running near a 40-year high.
However, while WIRP suggests a 50 bp hike is fully priced in for the September 20-21 FOMC meeting, the odds of a 75 bp hike could start to dwindle and weigh on the greenback, reviving the bull's hopes elsewhere.
Nevertheless, analysts at TD Securities argued that with regards to the Jackson Hole that is coming up later this week, the Fed's Chair, Jerome Powell's speech ''will likely aim to reinforce the message that multiple, sizable hikes are still in the pipeline, and easing should not be expected to be on the horizon anytime soon.''
US treasury auction
Meanwhile, we were seeing a bid back into the greenback and US yields following today's bullish 2-year Treasury auction.
- High yield 3.307%.
- Tail 1.4 bps vs a 6-month average of -0.3 bps.
- Bid to cover 2.49X vs 6-month avg of 2.59X.
- Dealers 23% vs a 6-month average of 17.4%.
- Directs 17.3 vs a 6-month average of 22.2%.
- Indirects 59.7% vs a 6-month average of 60.4%.
The demand from domestic and international buyers is far below a 6-month average which has seen the 2 and 10-year yields rally, supporting the US dollar and weighing on gold prices in the recent hours since the auction:

- EUR/JPY is expected to display more weakness on a downside move below 136.00.
- An energy supply halt for three days could dampen the already vulnerable German energy market.
- Japan’s dismal PMI numbers despite prolonged dovish BOJ is a big reason to worry.
The EUR/JPY pair has displayed a short-lived pullback to near 136.40 after the shared currency bulls defended an establishment below 136.00. The asset defended further losses on mixed German Purchasing Managers Index (PMI) numbers, released on Tuesday.
The German Services PMI contracted to 48.2 against the forecast of 49 and the former release of 49.9. However, the Manufacturing PMI expanded to 49.8 from the expectations of 48.2 and the prior release of 49.3. It is worth noting that Germany is displaying a decline in the Manufacturing PMI consecutively for the past six months and the unavailability of downside exhaustion could have soared Germany’s recession fears.
Now, the entire focus of the market participants is on energy supply in Germany as Nord Stream 1 pipeline is going under unscheduled maintenance, and the winter season is coming in when demand for energy surges sharply.
Russia will halt natural gas supplies to Europe for the last three days of August to run the unscheduled maintenance under the Baltic Sea to Germany. The unexpected natural gas supply cut to Germany from Nord Stream 1 pipeline will accelerate the imbalance of the energy demand-supply mechanism. Investors should be aware of the fact that Germany is a core European Union (EU) member and an occurrence of an energy crisis in Germany could drag the shared currency.
On the yen front, investors have ignored the downbeat Japan PMI numbers despite the continuation of an ultra-loose monetary policy by the Bank of Japan (BOJ). Dismal PMI numbers by the Western leaders are the consequences of tight monetary policy by the Western central banks. However, the BOJ keeps on flushing liquidity in the economy and dismal PMI numbers at the same time are a big reason to worry.
- GBP/JPY marginally advances almost 0.05% on Wednesday’s Asian session.
- The GBP/JPY is seesawing in the 161.00-162.30 area, unable to break beyond the range.
The GBP/JPY is almost flat as the Asian session begins, still below the 20-day EMA for the third consecutive trading day, whilst price action continues to record successive series of lower highs and lows. At the time of writing, the GBP/JPY Is trading at 161.86.
Sentiment has improved, as shown by Asian equities set to open higher. GBP/JPY Tuesday’s price action illustrates the pair seesawing between 161.00-162-30, while all the hourly moving averages (HMAs) meandering around the exchange rate are almost flat.
GBP/JPY Price Analysis: Technical outlook
The GBP/JPY daily chart illustrates the pair as neutral biased. Helped by the GBP/USD recovery, the British pound edged higher, after recording a fresh five-daily low at 160.80, bounced off to close the session around 161.77. That said the GBP/JPY printed back-to-back doji’s, meaning indecision lurks in the pair.
In the near term, the GBP/JPY hourly chart illustrates the pair fulfilling the head-and-shoulders chart pattern target. Once the target was achieved, the GBP/JPY rallied sharply, testing a downslope trendline, drawn from the August 17 high around 163.56, which confluences with the 200-hour EMA at 161.96.
A breach of the latter will expose the 162.00 figure, followed by the August 22 high at 162.30, followed by the R1 pivot at 162.47. On the flip side, the GBP/JPY first support would be the daily pivot at 161.62. Break below will expose the figure at 161.00, immediately followed by the S1 pivot at 160.94.

GBP/JPY Key Technical Level
Reuters shared a research note from Goldman Sachs during early Wednesday in Asia. The report said, “Goldman economists said the message will be the same as laid out in his July news conference and in the minutes of the July Federal Open Market Committee meeting released last week.”
Key quotes
He is likely to balance that message by stressing that the FOMC remains committed to bringing inflation down and that upcoming policy decisions will depend on incoming data.
Policymakers saw the easing of financial conditions since July as unhelpful to keeping the economy on a below-potential growth trajectory.
Goldman expects the FOMC to hike rates by 50 basis points (bps) in September and by 25 bp in November and December, less aggressive than the 75 basis-point hikes at each of its last two meetings.
Also read: EUR/USD Forecast: A small respite for the shared currency
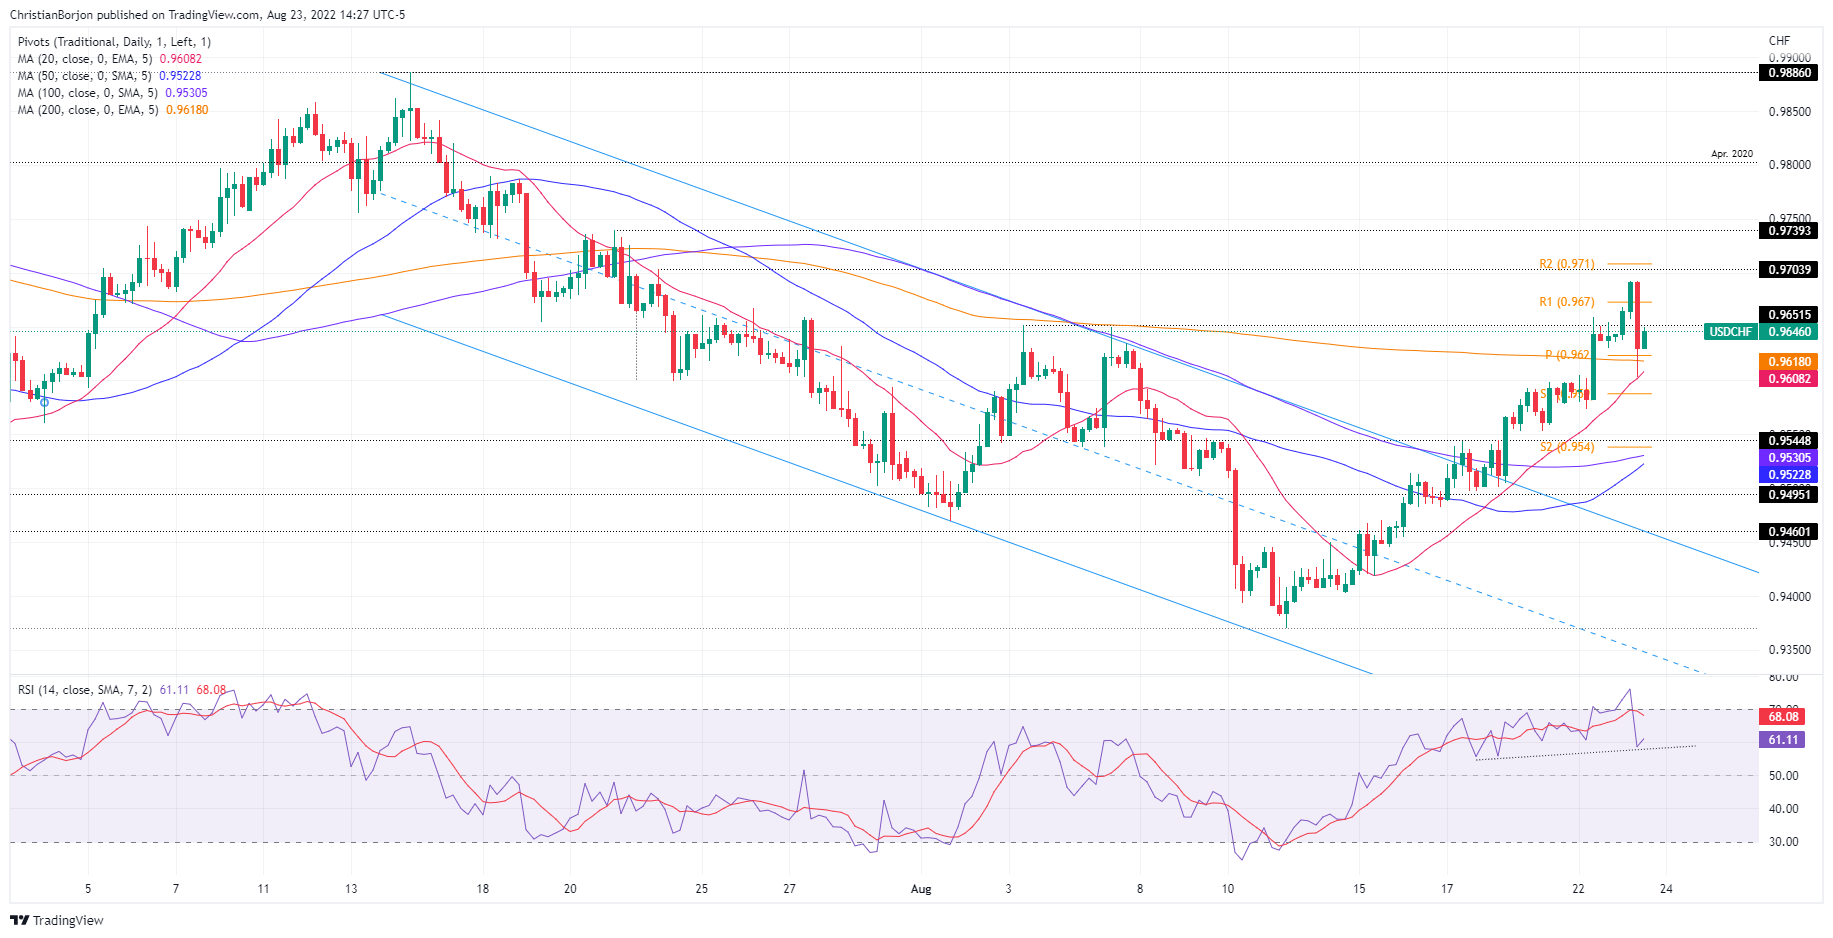
- USD/CHF retreats from monthly top as buyers struggle after six-day uptrend.
- 61.8% Fibonacci retracement triggered pullback amid overbought RSI, looming bear cross on MACD.
- 200-SMA, two-week-old ascending trend line restricts immediate downside.
USD/CHF keeps the previous day’s pullback from a one-month high as sellers flirt with the 50% Fibonacci retracement of the July-August downside during Wednesday’s Asian session. That said, the Swiss currency (CHF) pair remains pressured at around 0.9640 by the press time.
In doing so, the quote portrays a reversal from the 61.8% Fibonacci retracement, known as the golden ratio, amid the RSI retreat from the overbought territory and an impending bear cross of the MACD.
It’s worth noting, however, that the 200-SMA and an upward sloping support line from August 11, respectively around 0.9615 and 0.9590, challenge the USD/CHF bears.
Should the pair decline below 0.9590, the odds of witnessing a slump towards the 23.6% Fibonacci retracement level surrounding 0.9490 appear brighter. Following that, the monthly low of 0.9370 will be in focus.
Meanwhile, recovery moves remain elusive unless crossing the golden ratio, around 0.9690.
Even so, the July 13 swing low near 0.9750 precedes the previous monthly high surrounding 0.9885 could lure the USD/CHF bulls.
USD/CHF: Four-hour chart
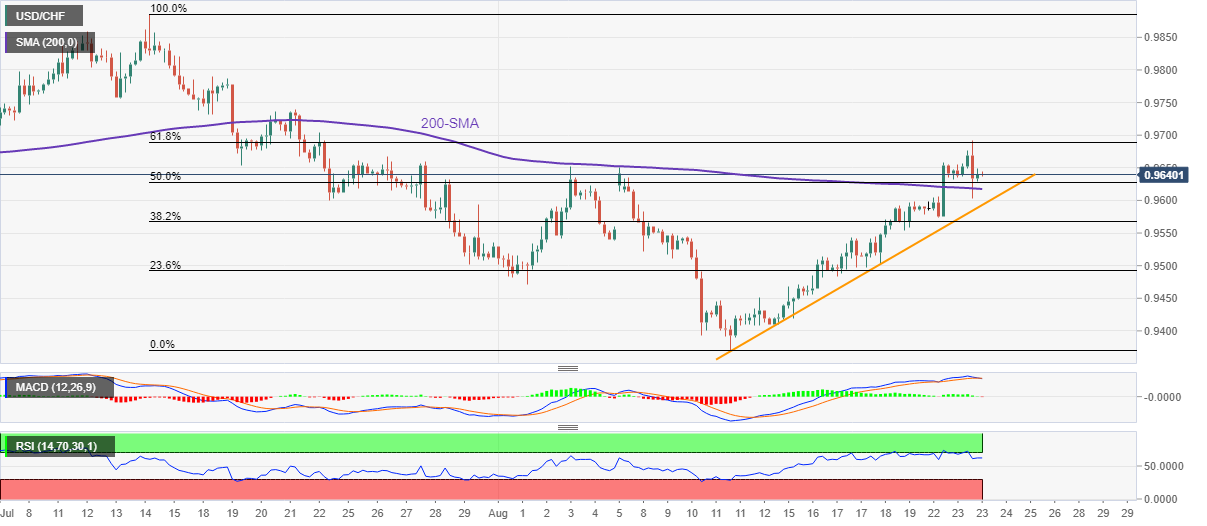
Trend: Further downside expected
- EUR/USD is juggling in a 13-pip range as investors await US Durable Goods Orders data.
- The US Durable Goods Orders data is likely to trim to 0.5% vs. 2%.
- A mixed German PMI helped EUR/USD in bottoming out after hitting a multi-year low of 0.9900.
The EUR/USD pair is displaying back and forth moves in a narrow range of 0.9959-0.9972 in the early Tokyo session. The asset has turned sideways after a mild correction from 1.0012 and is expected to continue its lackluster performance as investors are awaiting the release of the US Durable Goods Orders data.
On Tuesday, the asset printed a multi-year low near 0.9900 as the US dollar index (DXY) got strengthened. However, the release of mixed German Purchasing Managers Index (PMI) data helped the asset in bottoming out quickly. The German Manufacturing PMI improved to 49.8 from the expectations of 48.2 and the prior release of 49.3. However, the Services PMI contracted to 48.2 against the forecast of 49 and the former release of 49.9.
The shared currency bulls attempted to regain the territory above the magical figure of 1.0000 after the US dollar index (DXY) tumbled on poor US PMI data. The Services PMI contracted vigorously to 44.1 against the forecast of 49.2 and the prior release of 47.3. Also, the Manufacturing PMI landed lower to 51.3 vs. estimates of 52 and the prior release of 52.2.
The Eurozone bulls still have a chance to establish above the 1.0000 figure if US Durable Goods Orders also get contracted. As per the market consensus, the economic data is expected to slip to 0.6% against the former figure of 2%. In times, when the US economy has already displayed an unchanged US core Consumer Price Index (CPI), a decline in the economic data is not lucrative for the US dollar index (DXY).
- NZD/USD fades bounce off monthly low amid fears of economic slowdown, Fed’s aggression.
- Tepid US data triggered DXY pullback ahead of Friday’s key Jackson Hole Speech form Fed’s Powell.
- Light calendar allows risk catalysts to keep driver’s seat, US data eyed for fresh impulse.
NZD/USD retreats towards 0.6200 during the initial Asian session on Wednesday, after bouncing off the monthly low, as the market’s fears of economic slowdown and the Fed’s aggression remain intact ahead of this week’s key data/events. Also challenging the quote could be looming concerns over China and a light calendar that allows traders to consolidate recent moves.
US Dollar Index (DXY) poked the yearly high during the initial Tuesday trading amid fears of recession and increasing hawkish Fed bets, as well as growing pessimism in China. However, downbeat US economics triggered the greenback’s much-needed correction ahead of today’s Durable Goods Orders for July, not to forget Friday’s speech from Fed Chairman Jerome Powell at the Kansas City Fed’s symposium in Jackson Hole.
That said, preliminary readings of the US S&P Global Manufacturing PMI for August eased to 51.3 versus 52.0 expected and 52.2 prior while the Services gauge plunged to 44.1 from 47.3, compared to 49.2 market forecasts. According to S&P Global, the US economy is also in trouble as the Composite PMI shrank to 45, its lowest in 27 months.
Furthermore, the US New Home Sales for July dropped to the lowest levels in six years, to 0.511M from 0.585M prior and 0.575M market forecasts. Furthermore, the US Richmond Fed Manufacturing Index for August dropped to -8.0 compared to the 0.0 previous reading.
While the downbeat data allowed the USD bulls to take a breather, the yields remained firmer and Wall Street also failed to hold initial gains by closing with mild losses.
It’s worth noting that the market’s bets on the 75 basis points (bps) of Fed rate hike in September increase gradually despite the latest downbeat US data, which in turn also keeps the US dollar buyers hopeful ahead of crucial catalysts.
Talking about recession woes, the European energy crisis is getting worse amid Nord Stream 1 maintenance and fears of more geopolitical tension between Russia and Ukraine. On the same line could be the fears that China will have to go through a recession despite all efforts. Bloomberg recently came out with an analysis portraying the domestic currency yuan’s fall as another worry for the dragon nation. “The Chinese yuan’s slump to its weakest against the dollar in almost two years adds to what is already a precarious balancing act for Beijing, which is seeking ways to prop up its struggling economy without stoking financial instability,” said the piece.
To sum up, NZD/USD bears remain hopeful despite the latest corrective bounce. However, today’s US Durable Goods Orders for July, expected 0.6% versus 2.0% prior, will be important to watch for clear directions, not to forget the risk catalysts.
Technical analysis
NZD/USD rebound failed to provide a daily closing beyond the 50-DMA, around 0.6235 by the press time, which in turn joins bearish MACD signals and downbeat RSI to direct the quote towards 61.8% Fibonacci retracement of July-August upside, near 0.6190.
- AUD/JPY extended its gains to four consecutive days,
- Worldwide weaker than expected S&P Global PMIs reignited recession fears, but the AUD held to gains.
- If the AUD/JPY breaks above 95.00, it will pave the way towards the YTD high at 96.88; otherwise, a re-test of 93.00 is on the cards.
The AUD/JPY marginally advances as the Asian session begins up by 0.01%, carrying on the momentum gathered on Tuesday, when the cross-currency pair finished the session with solid gains of 0.24%. At the time of writing, the AUD/JPY is trading at 94.69.
On Tuesday, the AUD/JPY price action witnessed the pair opening around the 94.50 area, followed by a dip towards its daily low at 94.10. However, despite a dismal sentiment in the financial markets, courtesy of dismal S&P Global PMIs readings across the globe, the AUD/JPY rallied towards its daily high at 94.85 before retreating toward current price levels.
AUD/JPY Price Analysis: Technical outlook
The AUD/JPY advance now totals four consecutive days of gains. Worth noting that on its way north, AUD/JPY buyers reclaimed the 20, 50, and 100-day EMAs. However, they had failed to clear a three-month-old downslope trendline drawn from June highs near the 94.80-95-00 area. A breach of the latter will clear the way towards the YTD high at 96.88, but buyers will need to reclaim the 96.00 mark.
In the near term, namely the 4-hour chart, the AUD/JPY is facing solid resistance around the abovementioned trendline, putting a lid to AUD/JPY’s higher prices. Additionally, the pair is trading below an upslope trendline drawn from August 16 lows, which, acting as resistance, has kept the cross-currency pair seesawing within the 94.10-80 range.
All that said, the AUD/JPY is trading sideways. Therefore, a break above 94.80 would pave the way towards the 95.00 figure, followed by 96.00 and the YTD high at 96.88. On the flip side, the AUD/JPY first support will be the confluence of the 20-EMA and the daily pivot at around 94.57, followed by the S2 pivot at 94.28, and the confluence of the 100 and 200-EMA at 94.22.
AUD/JPY Key Technical Levels
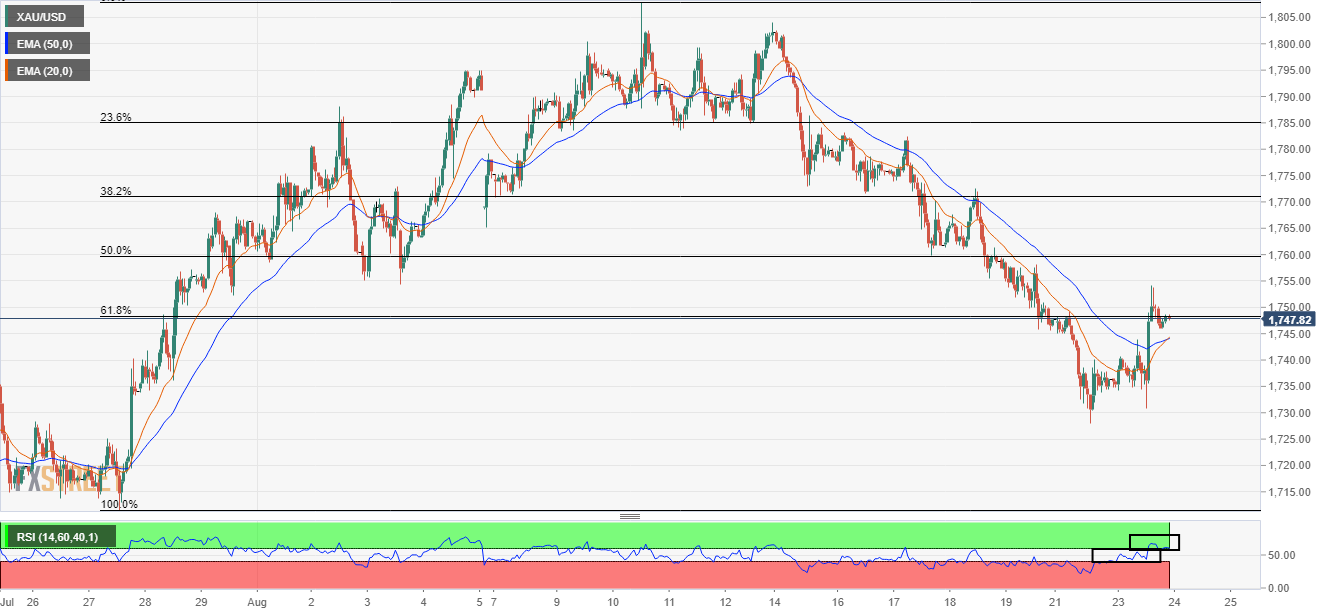
- Gold price is aiming to recapture the immediate hurdle of $1,750.00.
- Investors are focusing on the US Durable Goods Orders data for further cues.
- The downbeat US PMI is the consequence of hiking interest rates by the Fed vigorously.
Gold price (XAU/USD) has attempted a rebound after a mild correction to near $1,746.00. A rebound move is less-confident, at the press time, but is expected to gain momentum as investors are likely to discount poor consensus for the US Durable Goods Orders data.
Earlier, the gold prices displayed a sheer upside after a contraction in Purchasing Managers Index (PMI) numbers. The Manufacturing PMI contracted to 51.3 from the estimates of 52 and the prior release of 52.2. The Services PMI remained more vulnerable and contracted dramatically to 44.1 against the forecast of 49.2 and the prior release of 47.3.
This is a warning signal for the Federal Reserve (Fed) to slow down the pace of hiking interest rates as the unavailability of cheap money has restricted the private sector from exploiting entire production capacities.
Going forward, the US economy will see another consequence of price pressures in the form of a decline in the overall demand. Soaring price pressures have resulted in higher payouts for households. Due to the inevitable demand for necessity goods, households are surrendering demand for durable goods, which may weigh pressure on the US dollar index (DXY) further.
Gold technical analysis
On an hourly scale, gold prices are attempting to cross the 61.8% Fibonacci retracement (placed from July 27 low at $1,711.53 to August 10 high at $1,807.93) at $1,748.38 comfortably. The 20-and 50-period Exponential Moving Averages (EMAs) are on the verge of providing a bullish crossover at $1,744.38.
Meanwhile, the Relative Strength Index (RSI) (14) has shifted into the bullish range of 60.00-80.00, which indicates more upside ahead.
Gold hourly chart
- GBP/USD pares the week-start rebound from multi-month low.
- Bearish chart pattern, key SMAs challenge buyers even as RSI, MACD favor further recovery.
- The longer-term falling channel adds barriers to the trading filters.
GBP/USD rebound fails to gain acceptance inside a one-week-old descending trend channel. That said, the cable pair seesaws around the resistance line of the stated bearish chart pattern, close to 1.1835 during the initial Asian session on Wednesday.
In addition to the aforementioned channel’s top, near 1.1855, the 100-HMA and the 200-HMA could also challenge GBP/USD bulls around 1.1870 and 1.1990 in that order.
GBP/USD: Hourly chart
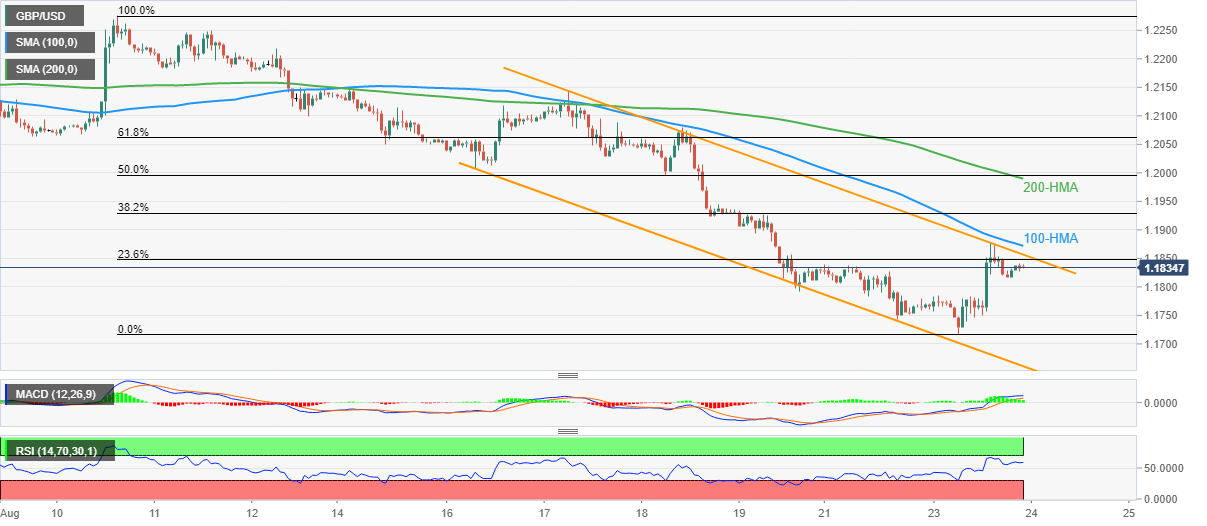
Trend: Further weakness expected
Following that, the 1.2000 psychological magnet and convergence of the 21-DMA and the 50-DMA on the daily chart will be crucial for the pair buyers to watch.
Above all, the upper line of the downward sloping trend channel from mid-May, close to 1.2200, appears the last defense of the GBP/USD sellers.
GBP/USD: Daily chart
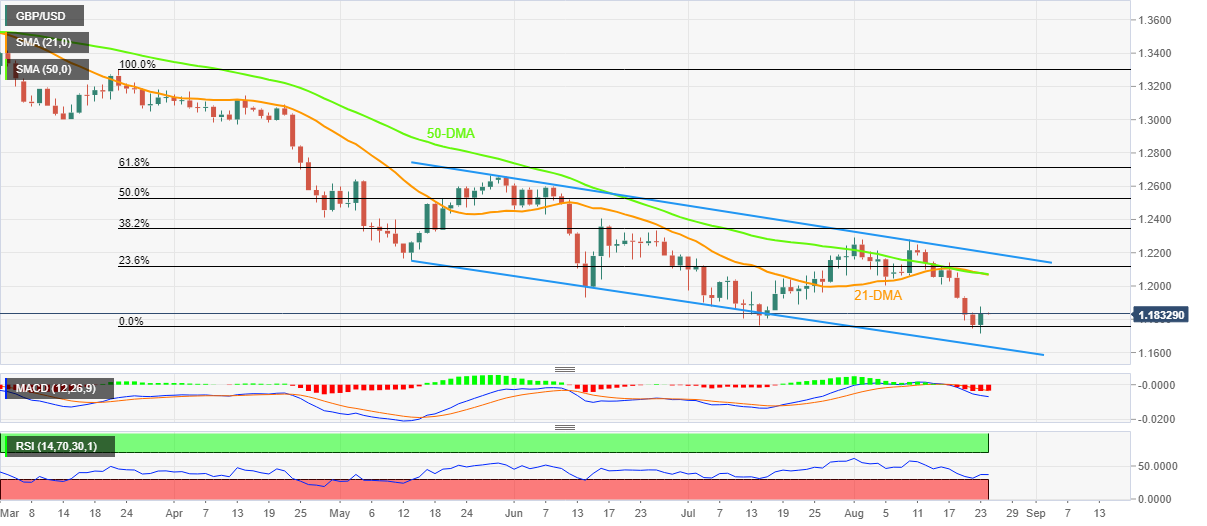
Trend: Bearish
It’s worth noting that the MACD and RSI are both suggesting short-term recovery on the hourly chart.
Alternatively, the 1.1790 level acts as the immediate support ahead of the latest lows near 1.1720-15.
Following that, the weekly channel’s support line and the lower line of the longer-term trend channel, respectively near 1.1660 and 1.1615, will be crucial supports to watch during the GBP/USD pair’s further weakness.
- AUD/USD is concluding its correction and will advance to reclaim its three-day high at 0.6960.
- Dismal performance on the PMI front resulted in a steep decline in the DXY.
- Investors have now shifted their focus on US Durable Goods Orders for further guidance.
The AUD/USD pair displayed a correction to near 0.6920 after a stellar rebound from a low of 0.6860. The asset has comfortably established above the critical hurdle of 0.6900 and is likely to recapture its three-day high at 0.6960. The major has strengthened after the release of the dismal Purchasing Managers Index (PMI) data by the US.
A sharp contraction in the US PMI is indicating the consequences of squeezing liquidity from the market. The US Services PMI has contracted dramatically to 44.1 against the forecast of an expansion to 49.2 and the prior release of 47.3. Also, the Manufacturing PMI has contracted to 51.3 from the estimates of 52 and the prior release of 52.2.
Stick to the path of achieving price stability in the economy, the Federal Reserve (Fed) is hiking the borrowing rates with severe momentum. The Fed has elevated its interest rates to 2.25-2.50% from 0-0.25% in its last four monetary policy meetings. And, one can assume the velocity of squeezing liquidity from the market. The unavailability of cheap money for the corporate sector resulted in the selection of ultra-filtered investment projects only and therefore a decline in the PMI data.
Now, investors are focusing on the US Durable Goods Orders data, which are expected to contract to 0.6% from the prior release of 2%. This also indicates a decline in the overall demand and may result in more pressure on the US dollar index (DXY).
On the aussie front, investors have ignored the downbeat Australian PMI numbers and have punished the DXY. The S&P Global Manufacturing PMI slipped sharply to 54.5 vs. expectations of 57.3 and the prior release of 55.7. While the Services PMI data landed lower to 49.6 against the forecasts of 54 and the former figure of 50.9.
- The silver price climbed 0.70% amidst a downbeat market sentiment, which weighed on the greenback.
- Higher US Treasury yields put a lid on XAG/USD prices.
- Market players’ focus turns to Wednesday’s Durable Good Orders, alongside Fed speaking on Friday, led by Chair Powell.
Silver price erases Monday’s losses and is higher as Wall Street’s ended the day with minimal losses, amidst a dismal sentiment propelled by US economic data dropping to contractionary readings. Also, traders are preparing for an expected hawkish speech by Federal Reserve Chairman Jerome Powell in Jackson Hole, which bolstered silver’s appeal, to the detriment of the US dollar At the time of writing, XAG/USD is trading at $19.11 up by 0.70%.
US equities finished the day in the red. Earlier in the New York session, S&P Global reported US PMIs, for August, with the Services and Composite indices plunging to contractionary territory, each with readings at 44.1 and 47, respectively. Contrarily, the Manufacturing Index downtick to 51.3 but remained in expansionary territory, despite missing estimates.
In the US data release, the US dollar weakened across the board, with the US Dollar Index sliding from around 109.000 to 108.200. On the contrary, US T-bond yields rose, led by the 10-year US Treasury yield, up by four bps, sitting at 3.057%, a headwind for silver prices.
Additionally, US housing data portrayed that New Home Sales dipped to their slowest pace since 2016, dropping for the sixth consecutive month, as the market continues to deteriorate as the Federal Reserve tightens monetary policy. New Home Sales dropped by 0.51M vs. estimations of 0.575M.
What to watch
The US economic docket will feature Durable Good Orders for July, alongside Housing Data, illustrating that the US economy is slowing down on Wednesday.
Silver Key Technical Levels
- EUR/USD bulls tiring and the bears are moving in in the near term.
- Longer-term, there are prospects of a bullish continuation in this daily correction for the days ahead.
EUR/USD has rallied on the day and is now consolidating in a correction of the bullish im[pulse. The following illustrates the potential flight trajectory based upon multi-time frame price action and structure between the daily, 4 and 1-hour charts, down to the 15-minute chart.
EUR/USD daily chart
The M-formation is a reversion pattern on the daily chart that has seen the price pull into the 38.2% Fibonacci. It would be unusual for the price to continue lower from here without at least another bar or two of corrective activity that could see the price move higher in the days ahead before the next sell-off.
H4 chart

Meanwhile, with the price forming a W-formation on the 4-hour chart, there would appear to be some prospect of a deeper correction of the current bullish impulse.
EUR/USD H1 chart
The hourly chart sees the price formation an M-formation and should the neckline hold as resistance, then the price will likely follow the 4-hour bearish bias for the session ahead.
EUR/USD M15 chart

With that being said, there would appear to be the possibility of a break higher in the very short term considering the inverse head and shoulders on the 15-min chart.
What you need to take care of on Wednesday, August 24:
The greenback turned south after extending its rally throughout the first half of the day, ending the day down against most major rivals. The catalyst was dismal US data, as the US Services S&P Global PMI contracted to 44.1. At the same time, the manufacturing index expanded at a slower-than-anticipated pace, with the index down to 51.3 from 52.2 in July.
However, S&P Global PMIs for most major economies indicated slowing economic progress and even contraction, indicating it is a global issue. The greenback recovered some ground ahead of Wall Street’s close as risk-off flows continue. The dollar’s decline seems corrective amid extreme overbought conditions. Tepid US data helped investors book some profits, but there are no signs of a trend change.
ECB Executive Board member Fabio Panetta painted a gloomy picture. He said that the central bank might need to adjust the monetary policy further as the probability of a recession increases. Meanwhile, speculative interest is slowly but steadily increasing bets of a US Federal Reserve 75 bps rate hike in September.
GBP/USD hovers around 1.1830, while AUD/USD stands in the 0.6920 region. The USD/CAD pair fell sharply and finished the day at 1.2950.
Safe-haven currencies posted gains vs the greenback, with USD/CHF hovering at around 0.9640 and USD/JPY trading at 136.77.
Gold is currently trading at $1,7477 a troy ounce, up for the day, while crude oil prices extended their latest advance amid market talks suggesting OPEC+ may cut back production. WTI is now at $93.60 a barrel.
The macroeconomic calendar will remain empty in Asia, with the focus on US Durable Goods Orders on Wednesday.
Like this article? Help us with some feedback by answering this survey:
- USD/CHF records minimal gains of just 0.09% on Tuesday.
- Softer US housing and PMI data weakened the US dollar.
- UJSD/CHF Price Analysis: RSI’s aiming higher, coincided with the major beginning to shift upwards.
The USD/CHF marginally advances on Tuesday after hitting a daily high nearby the 0.9700 figure, but weaker than estimated US data weighed on the greenback, boosting the Swiss franc. Nevertheless, the USD/CHF keeps trading above its opening price, at 0.9646, at the time of writing.
USD/CHF Price Analysis: Technical outlook
The USD/CHF from a daily chart perspective is neutral-biased. During the day, the USD/CHF tested the July 22 high at 0.9704, but sellers stepped in, sending the price dipping below the 100-day EMA. If buyers would like to remain in charge, they would need a break above the 0.9700 figure, which would pave the way for parity’s retest.
Zooming to a 4-hour time frame, the USD/CHF illustrates the pair as upward biased, as the major crossed above the 200-EMA around 0.9618. However, due to broad US dollar strength since the middle of the last week, the Relative Strength Index (RSI) entered overbought conditions, spurring a drop from around weekly highs towards the daily pivot point at 0.9623.
Once the RSI exited overbought conditions, it rebounded around the 60 reading. In the last 10 days, RSI touched the previously mentioned area five times, which equals the USD/CHF dips. That said, RSI begins to aim higher, meaning that the USD/CHF uptrend is about to resume.
Therefore, the USD/CHF first resistance would be the R1 pivot at 0.9672. Break above will expose the R2 daily pivot at 0.9709, followed by the July 21 high at 0.9739.
USD/CHF Key Technica Levels
- Oil prices rallied on Tuesday while Saudi Arabia warning that OPEC+ could cut production.
- Iran remains the wild card in the energy sector.
When oil futures trade at lower levels than spot prices and near-term futures, that’s known as backwardation and it's been a theme in 2022 that has seen Saudi Arabia warning that OPEC+ could cut production to narrow a gap between high prices in the physical oil market and weaker futures prices. The comments have sent the spot price higher on the day. At the time of writing, WTI is trading at $93.60, up 3.32% but of the highs of $94.19.
Saudi oil minister Prince Abdulaziz bin Salman told Bloomberg News that OPEC+ could cut production when the group next meets to raise prices. However, the wild card in the oil market stays with Iran. ''When it comes to the potential Iran deal, no news has been good news,'' analysts at TD Securities explained.
''While fears of an imminent deal had seen a sharp slump in our gauge of energy supply risk, raising the alarm on the bull market in oil, energy traders have grown increasingly skeptical of the legal and political risks associated with a potential resolution. After all, the clock is ticking for a resolution that has the potential to drive a continued and substantial erosion of supply risk premia, but a potential resolution appears plagued with legal and political risks which blur the outlook,'' the analysts at TD Securities explained.
The analysts warned that failure to reach a deal would suggest that oil is still on a runaway train, as even slowing demand growth would still continue to sap the world's spare capacity.
On the other side, of the coin, "how a lower production volume is supposed to restore the balance between the futures market and the physical market remains unclear, though. Possibly Saudi Arabia wants to prepare for a scenario in which the US agrees to a renewal of the nuclear agreement with Iran, thereby allowing the latter to return to the oil market. The fact that Saudi Arabia appears to regard an oil price of around $90 as too low could be seen by speculators as an invitation," Commerzbank said in a note.
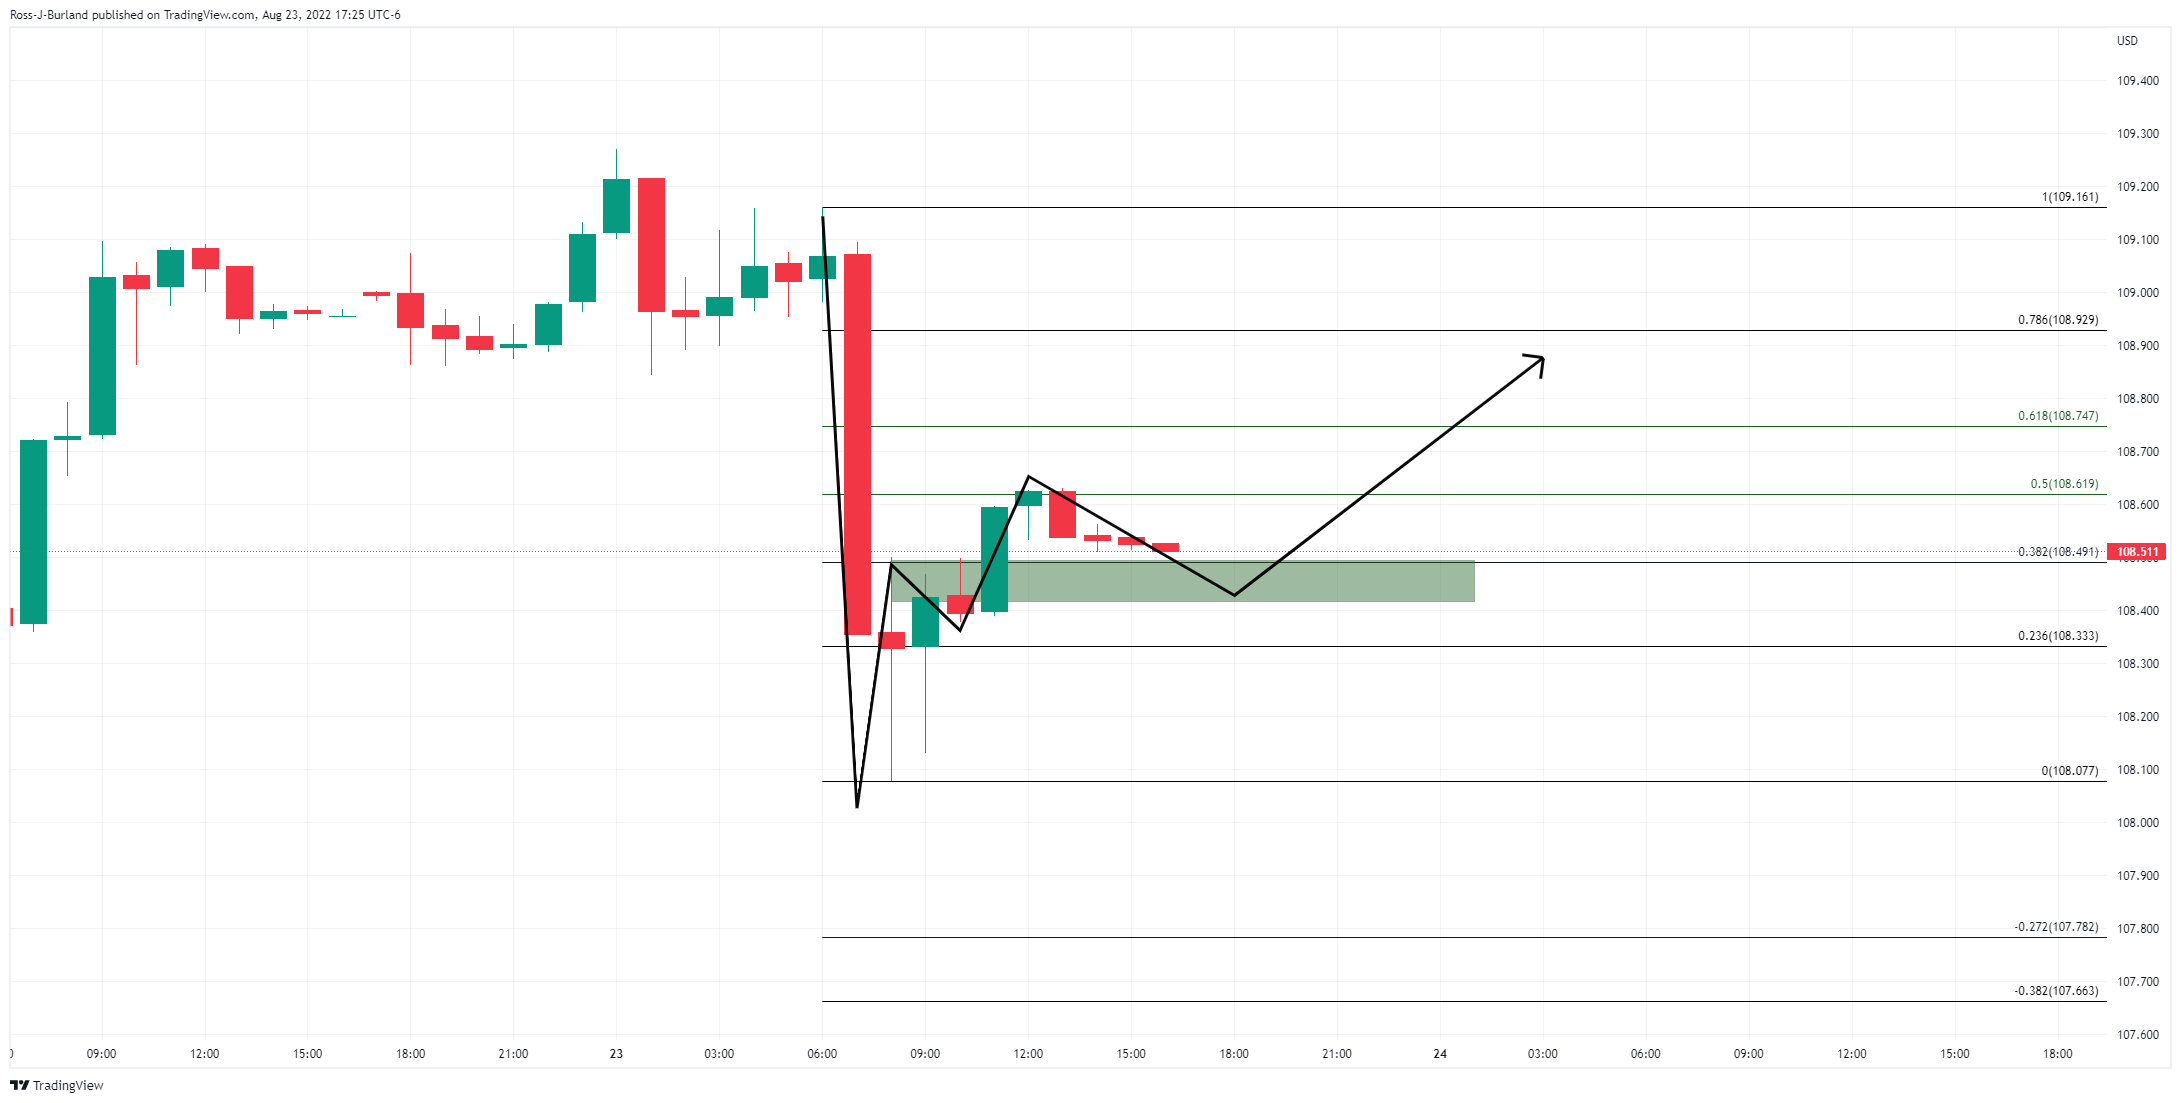
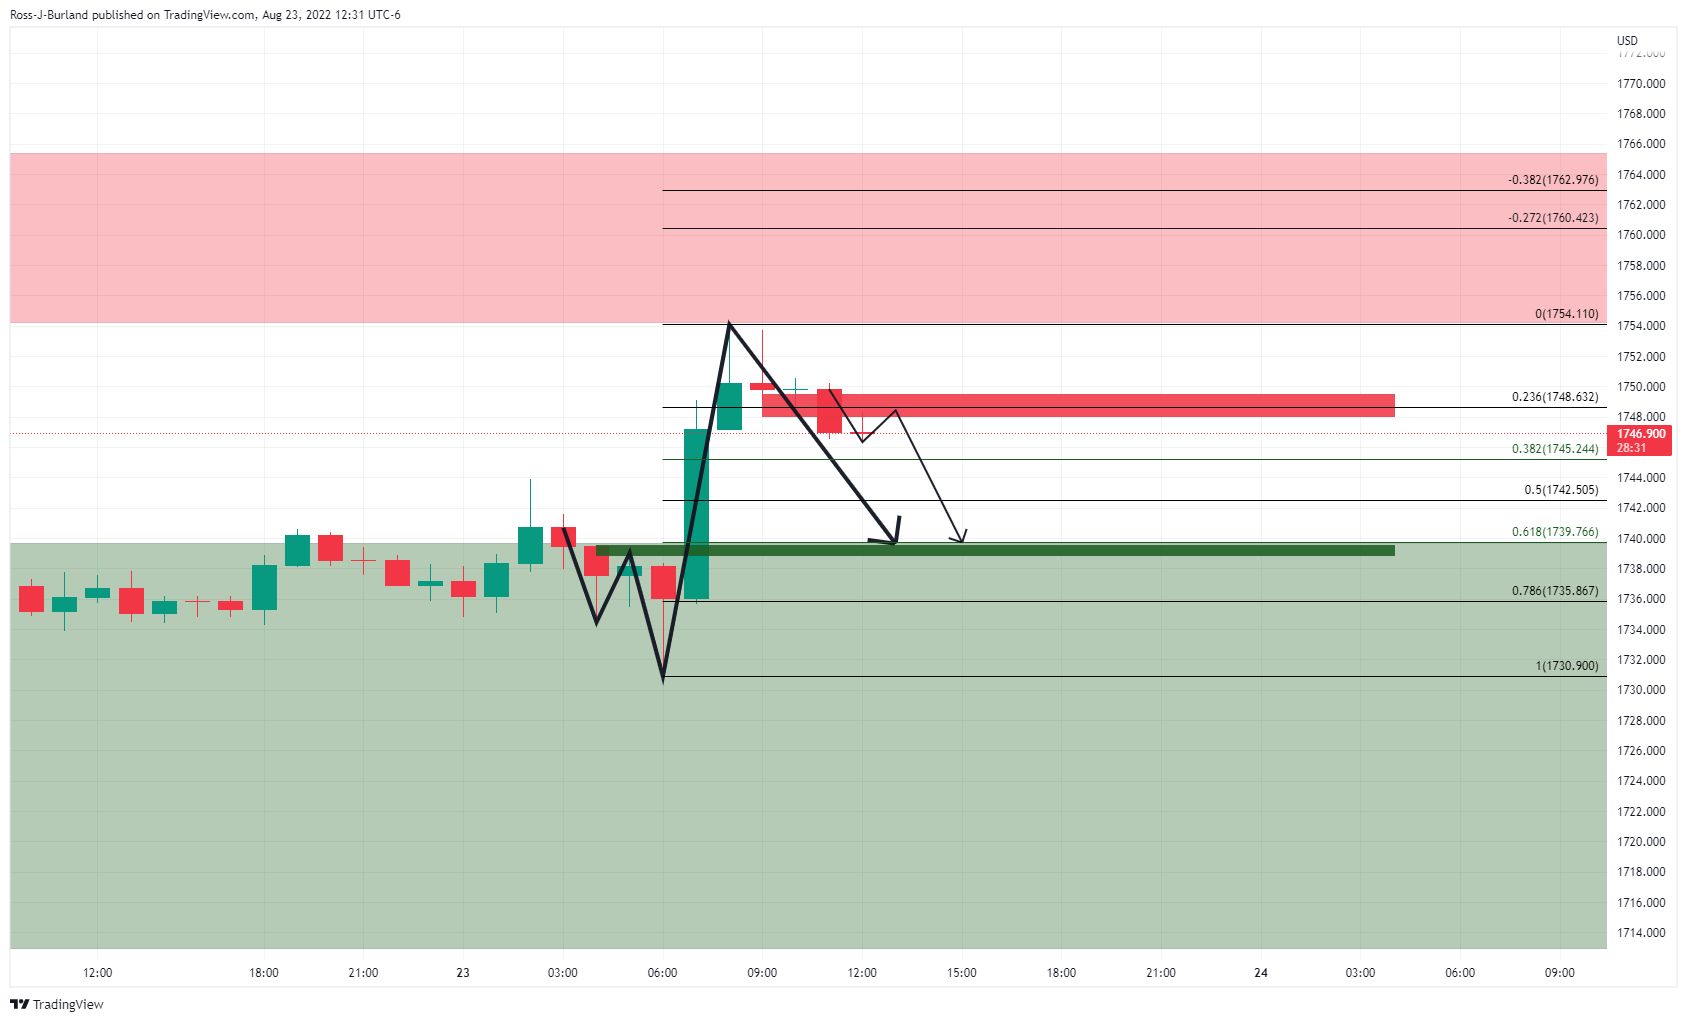
- Gold is on the verge of a downside correction following today's 2-year auction and recovery in yields.
- Gold bulls are eyeing a deeper correction on the daily chart.
- The Fed is the theme with US data taking the front seat in markets.
The gold price rallied on Tuesday following US data that proves the Federal Reserve's tactics could be going to plan in trying to rein in higher inflation in the US economy. At the time of writing, the yellow metal is trading at $1,747.50, 0.67% higher after rallying from a low of $1,730.90 to a high of $1,754.11.
The drop in the US dollar and yields helped the precious metal recover a lot of ground to the upside at the start of the New York day after a report showed US private sector activity contracted for a second-straight month in August. The data was the nail in the coffin for the greenback that had already started to flutter as investors started to trim long positions in anticipation of risk events that include the Jackson Hole as the showdown for the week.
Given a data-dependent Fed, markets will be cautious being too long of the greenback into such data as today's S&P Global flash composite purchasing managers index (PMI), tomorrow's Durable Goods Orders and Thursday's Gross Domestic Product, Initial Jobless Claims and Personal Consumption Expenditures. For instance, today's miss in the flash composite purchasing managers index (PMI) has raised the prospects the Federal Reserve will ease its rate hiking cycle. The data is showing exactly what the Fed is trying to achieve with its stiffest run of interest rate increases since the 1980s — a drop in demand which can help to tame the risks of rising inflation.
The S&P Global flash composite purchasing managers index (PMI) for August dropped to 45 this month, the lowest since February 2021, as demand for services and manufacturing weakened in the face of inflation and tighter financial conditions. A reading below 50 indicates a contraction in activity. If we see more of the same from the forthcoming data this week ahead of the Jackson Hole, then the US dollar may continue to struggle in the face of a cooling demand-side economy.
The Fed has hiked rates from near zero in March to their current range of 2.25% to 2.50%, with more expected in the months ahead, as it tries to tame inflation, which is running near a 40-year high. However, while WIRP suggests a 50 bp hike is fully priced in for the September 20-21 FOMC meeting, the odds of a 75 bp hike could start to dwindle and weigh on the greenback, reviving the bull's hopes for the higher gold prices.
Nevertheless, analysts at TD Securities argued that with regards to the Jackson Hole, the analysts suggest that the Fed's Chair, Jerome Powell's speech ''will likely aim to reinforce the message that multiple, sizable hikes are still in the pipeline, and easing should not be expected to be on the horizon anytime soon.''
''This fits with the recent easing in market expectations for rate cuts to immediately follow the rate hiking cycle, which we expect will be the focus of Fedspeak in the coming weeks. In this context, we are anticipating a capitulation event in gold driven by the unwind of a bloated position held by a few prop-shops and family offices.''
US treasury auction
Meanwhile, we are seeing a bid back into the greenback and US yields following today's bullish 2-year Treasury auction.
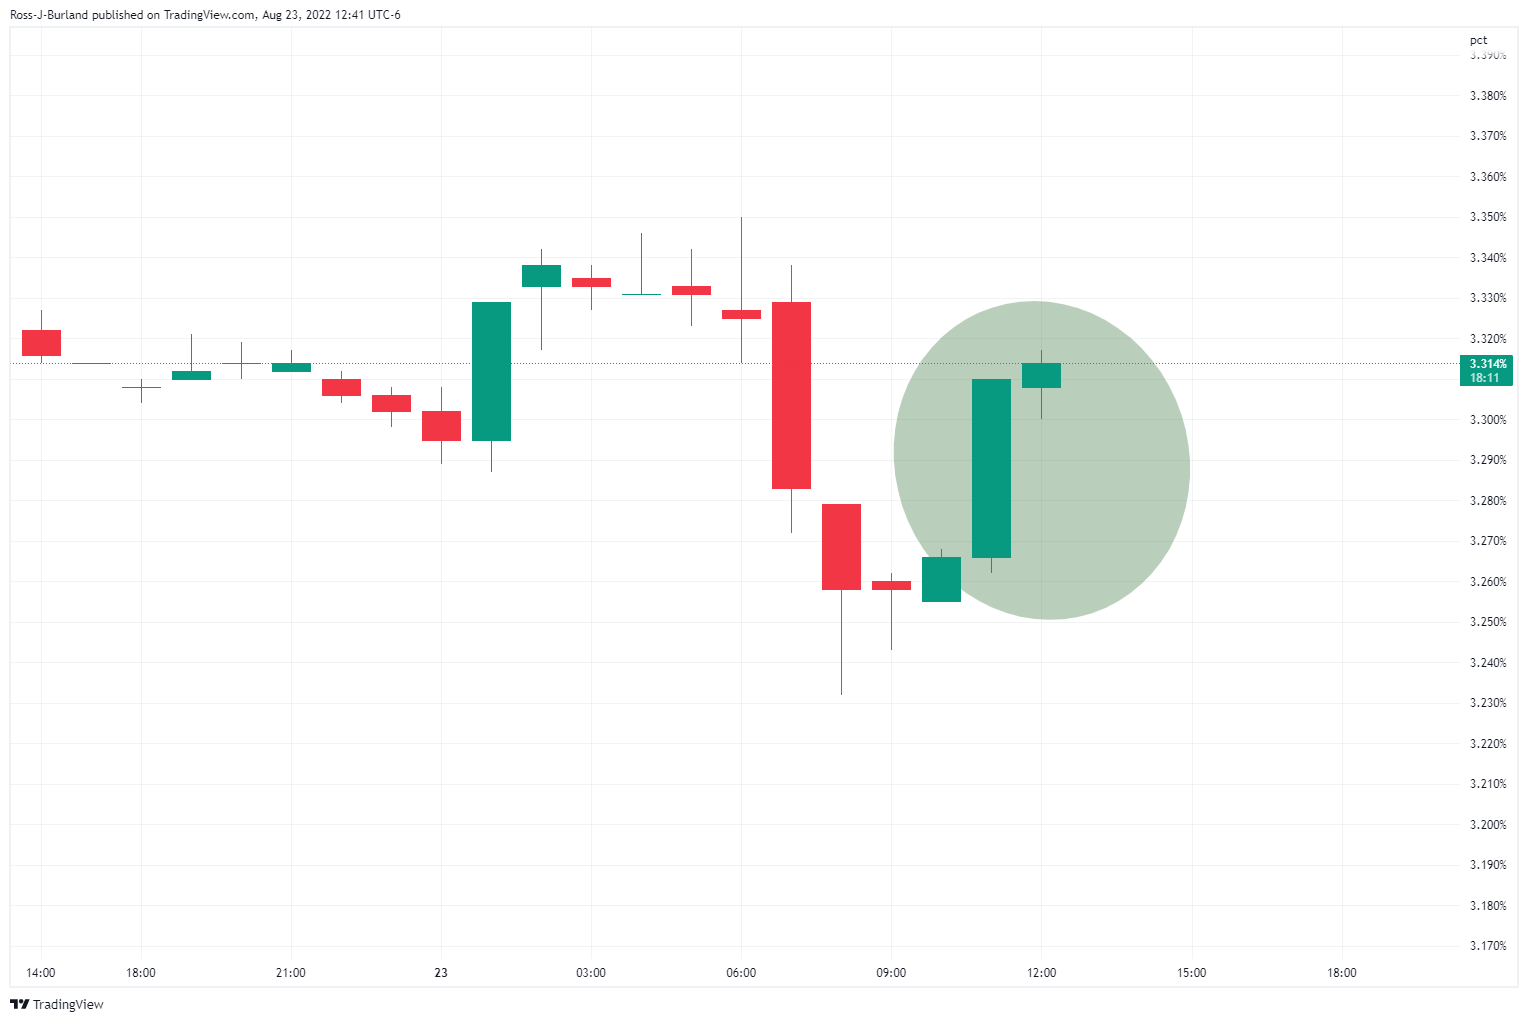
- High yield 3.307%.
- Tail 1.4 bps vs a 6-month average of -0.3 bps.
- Bid to cover 2.49X vs 6-month avg of 2.59X.
- Dealers 23% vs a 6-month average of 17.4%.
- Directs 17.3 vs a 6-month average of 22.2%.
- Indirects 59.7% vs a 6-month average of 60.4%.
The demand from domestic and international buyers is far below a 6-month average which has seen the 2 and 10-year yields rally, supporting the US dollar and weighing on gold prices in the recent hours since the auction.
The 2-year yield, as illustrated above, has recovered significantly following the auction, weighing on gold:
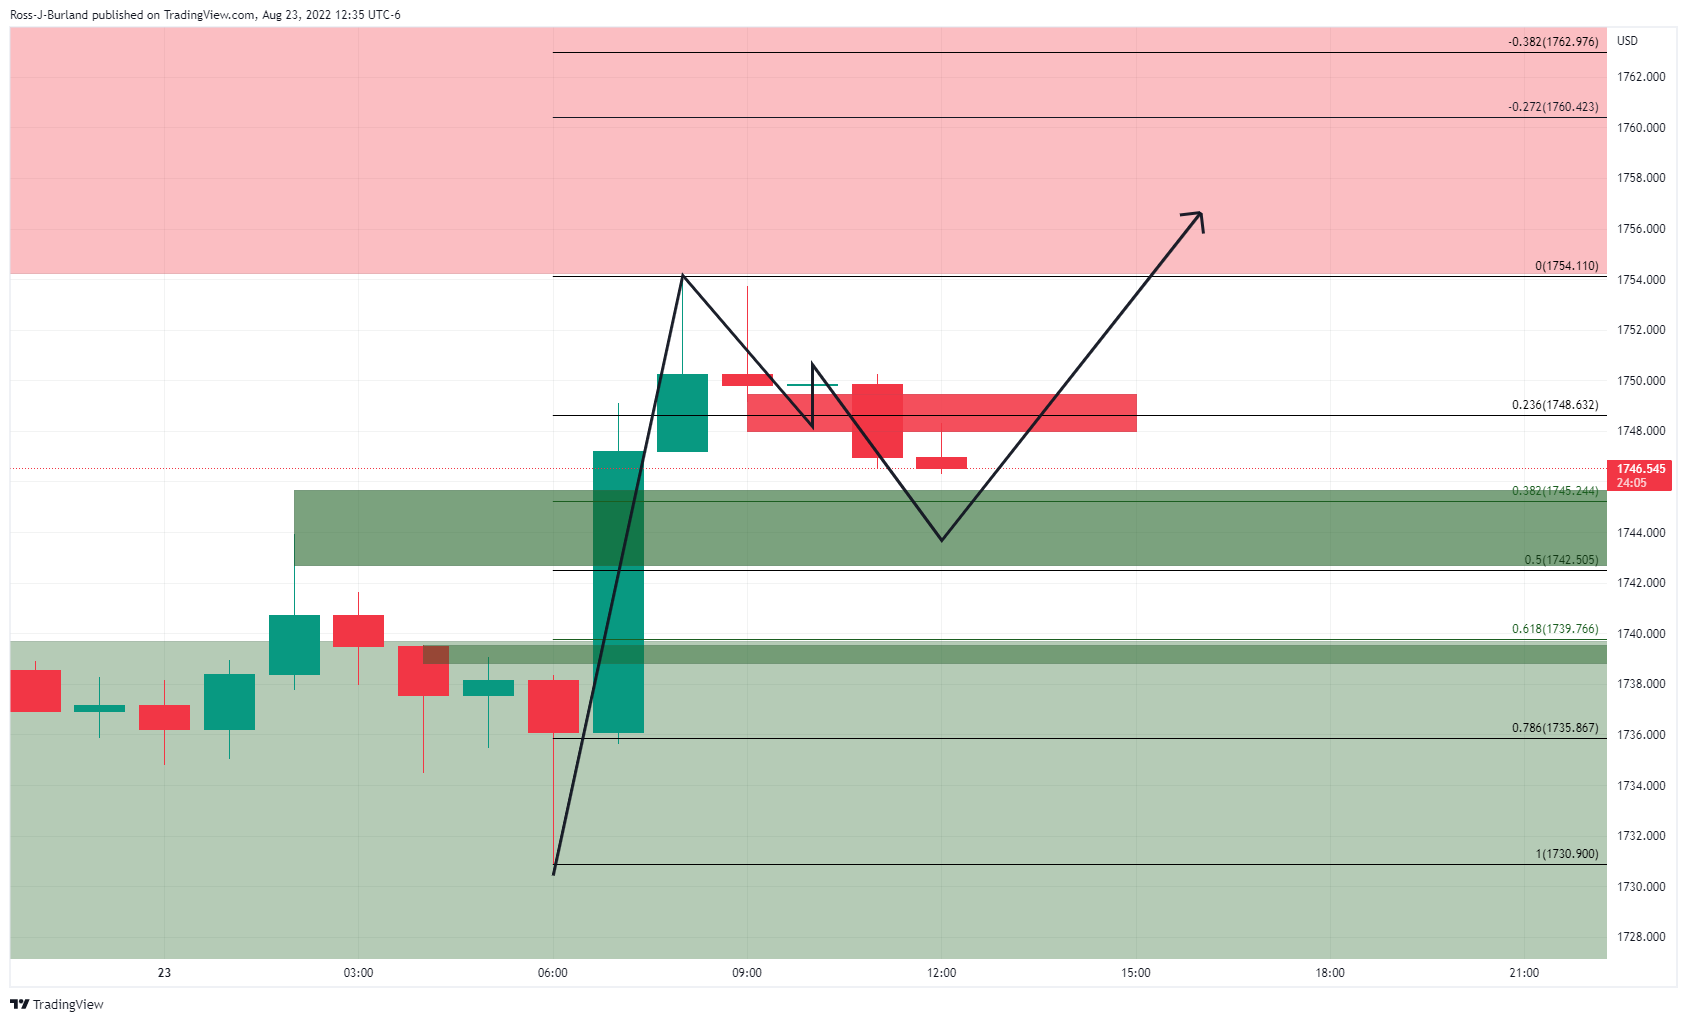
Gold technical analysis
As per the prior analysis, it was stated that the price of gold had left behind an M-formation on the daily chart, a reversion pattern that would be expected to see the price revert towards the neckline in due course. However, it also suggested that given the over-extension of the latest impulse, the correction will more probably only reach as far as the prior support near a 38.2% Fibonacci around $1,755.
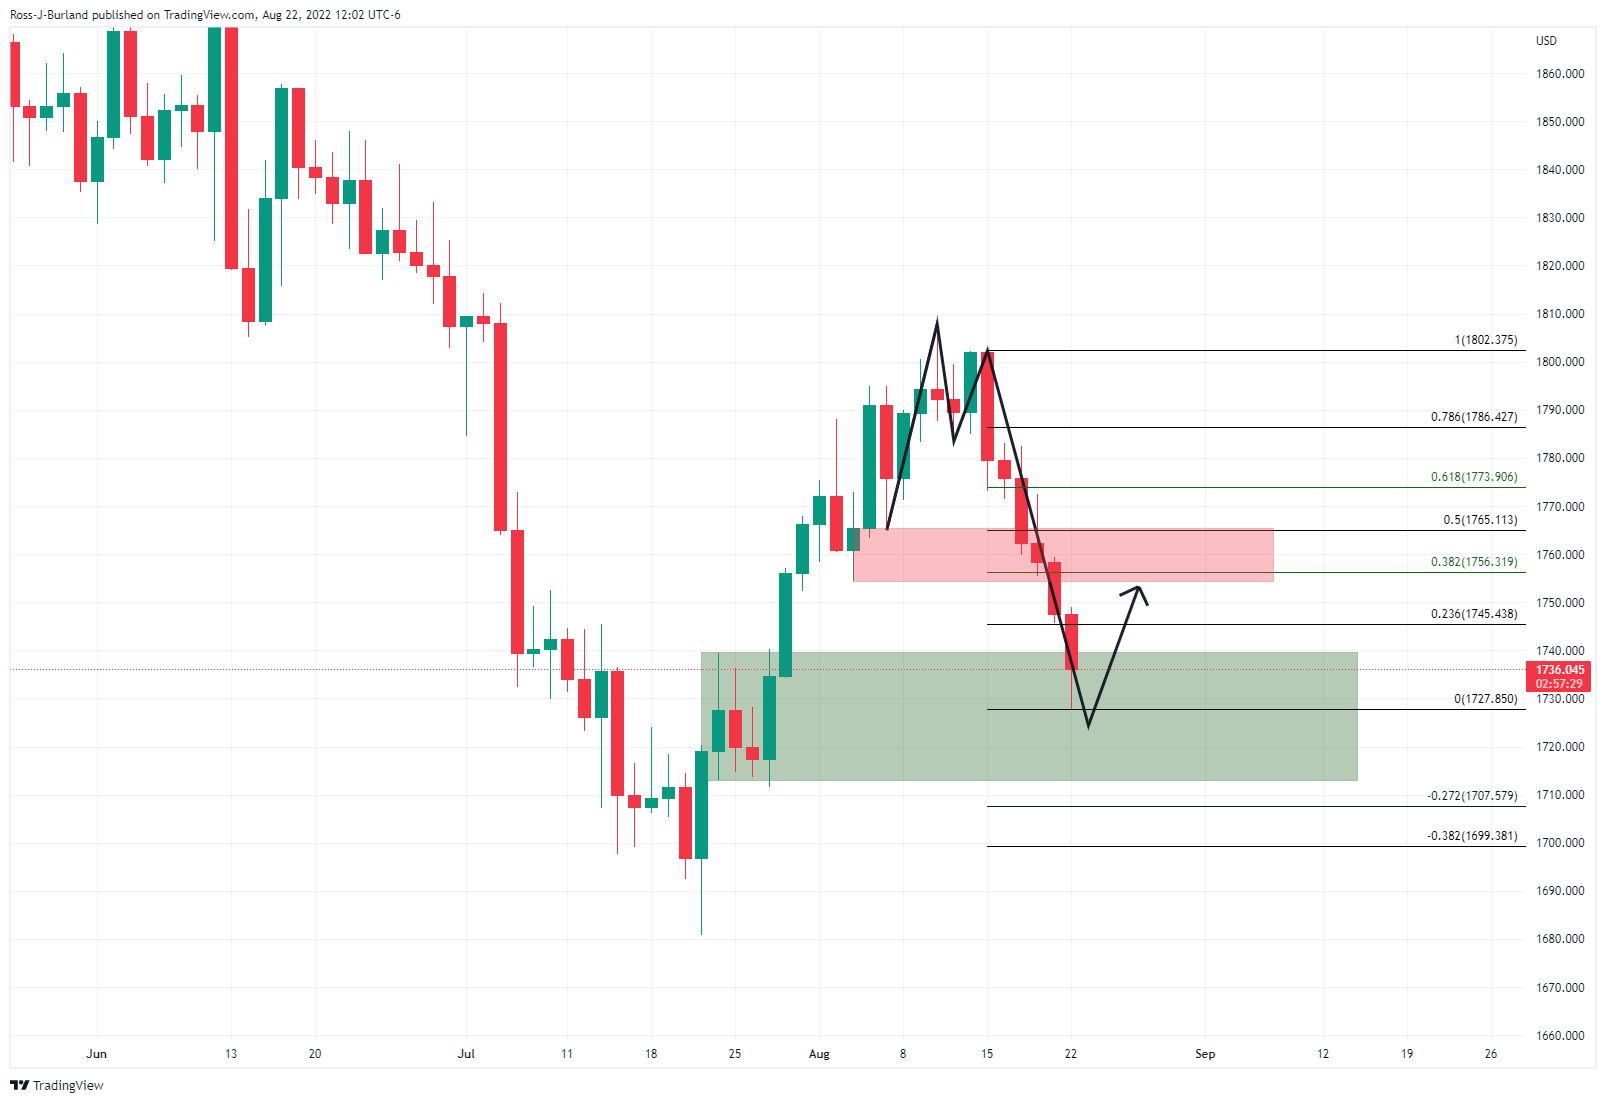
As illustrated, the prior analysis anticipated the correction, above, and the bulls committed to the moves today, below:
Meanwhile, the price could be on the verge of a significant bearish correction as per the hourly chart:
The W-formation is compelling with the neckline meeting the 61.8% Fibo should the 38.2% and 50% ratios give out. On the other hand, should the 38.2% and 50% hold, given the M-formaiton, the bulls could be encouraged to move in for a deeper correction on the daily chart:
- USD/CAD erases its Monday gains and slides more than 0.60%.
- Weaker US housing and PMI data weighed on the greenback.
- TDS Analysts expect the BoC will hike 75 bps in September; estimates the first cut in Q3 2023.
The USD/CAD stumbles from weekly highs around 1.3063 and plunged on weaker than expected US economic data, which reignited US recession fears amidst a week where traders are bracing for Fed Chair Jerome Powell’s speech.
The USD/CAD is trading at 1.2069, below its opening price, after hitting a daily high at 1.3063, followed by a dip towards its daily low at 1.2933, before settling at current exchange rates.
USD/CAD tumbled on weak US housing/PMI data
Earlier in the North American session, S&P Global reported that the US Services PMI for August plunged to contractionary territory, with a reading of 44.1, while the Composite Index followed suit at 47. Contrarily, the Manufacturing PMI, although it slowed, persisted in an expansionary territory at 51.3, less than estimated.
Furthermore, US housing data showed that New Home Sales dived to its slowest pace since 2016, falling for the sixth consecutive month, as the market continues to deteriorate as the Federal Reserve tightens monetary policy. New Home Sales dropped by 0.51M vs. estimations of 0.575M.
Aside from this, the USD/CAD slid from around 1.3010s to 1.2975 on the release of US data. An absent Canadian docket let traders lean on the dynamics of the US dollar and oil prices. That said, WTI futures contracts rose 3.65%, exchanging hands at $93.89 per barrel.
TDS Analysts foresee a 75 bps increase by the BoC and expect the first cut in 2023
Elsewhere, TDS analysts estimate that the Bank of Canada will hike 75 bps in September. They wrote in a note, “We continue to look for the Bank of Canada to deliver a 75bp hike before a final 25bp hike for a 3.50% terminal rate by October.”
“While we look for a 3.50% terminal rate for the BoC’s tightening cycle, we also expect slowing growth will force the Bank to cut rates in starting in Q3 2023, before reaching a long-term neutral rate of 2.25% by mid-2024.”
What to watch
The US economic docket will feature Durable Good Orders for July, alongside Housing Data, illustrating that the US economy is slowing down on Wednesday.
USD/CAD Key Technical Levels
- US dollar tumbles after weak economic data.
- US PMI S&P Global shows the lowest reading in more than a year.
- AUD/USD finds resistance around 0.6960 and losses momentum.
The AUD/USD broke above 0.6900 after the release of US economic data and peaked at 0.6962, the highest level since Thursday. The pair lost momentum and pulled back under 0.6950.
The August preliminary US S&P Global PMI report came in below expectations, particularly the Service sector index that plunged to 44.1 against expectations of a recovery to 49.2. The numbers increased concerns about the health of the US economy.
The demand for Treasuries rose after the numbers, pushing US yield sharply to the downside and at the same time weakening the greenback. The DXY dropped from above 109.00 to 108.10, it is hovering around 108.45, down by 0.48%.
During the last hour, the dollar stabilized and trimmed losses. Still, it remains negative for the day, about to post the first decline in days. The main trend is still bullish for the dollar. Attention now turns to the Jackson Hole symposium that will start on Thursday. Fed Chair Jerome Powell will deliver a speech on Friday.
Earlier on Tuesday, the Australian PMI came also below expectations. The S&P Global Composite dropped below 50 for the first time since January.
Key support at 0.6850/55
The outlook for the aussie versus the dollar improved following the rebound. On the upside, the level to break for AUD/USD now is 0.6960. On the flip side a slide back under 0.6895 would expose again the crucial support area around 0.6850/55. A break under 0.6850 should weaken the pair considerably targeting initially the 0.6800 zone.
Technical levels
- USD/JPY sinks 100 pips and is losing more than 0.70% due to mixed US economic data.
- A bearish-engulfing candle pattern in the daily chart could pave the way for further losses.
- The USD/JPY is trading below the 100-hour EMA, with sellers keeping the fort afloat.
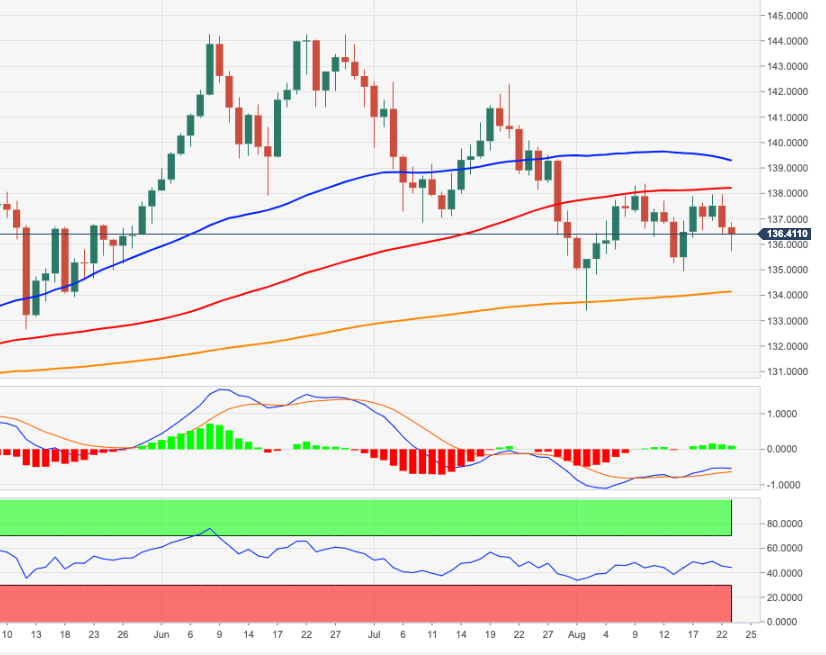
The USD/JPY plunges from weekly highs around 137.70 as US recession fears were fueled by mixed US economic data, dropping into contractionary territory, namely S&P Global Services and Composite PMIs, while the Manufacturing expanded. Nevertheless, traders took advantage of an overpriced US dollar and sent the major down. At the time of writing, the USD/JPY is trading at 136.39, below its opening price by 0.80%.
USD/JPY Price Analysis: Technical outlook
The daily chart shows that a bearish-engulfing candle pattern is emerging, which could pave the way for further losses. However, it’s worth noting that the pair tested the August 19 daily low at 135.71, but sellers could not hold buyers from reclaiming the 136.00 figure. Even though a bearish-engulfing candle pattern is bearish, sellers will face solid support at 135.71, followed by the 50-day EMA at 135.52.
The one-hour scale depicts that the USD/JPY broke below a confluence of the S1 daily pivot and a downslope trendline, exacerbating a fall towards the S3 pivot at 135.91, where USD buyers stepped in. Nevertheless, they’re facing resistance at the 100-hour EMA at 136,39, which, once cleared, could pave the way towards the 137.00 figure. Nonetheless, the most likely scenario is that the USD/JPY head downwards due to a confluence of the indicators tilting the pair as bearish,
Therefore, the USD/JPY first support will be the S3 pivot at 135-90. Break below will expose the August 7 high at 135.58, followed by the 200-hour EMA at 134.98.
USD/JPY Key Technical Levels
- GBP/USD jumps from YTD lows after US economic data reignited recession fears.
- US S&P Global PMIs were mixed, though reignited recession fears.
- The S&P Global Manufacturing PMI in the UK dropped to the contractionary territory.
- GBP/USD Price Analysis: If it clears 1.1900, a test of 1.1936 is on the cards.
The GBP/USD recovered some ground bouncing from weekly lows below the 1.1800 figure due to dismal US economic data, which increased fears of a US recession. Consequently, the greenback fell, alongside US T-bond yields, while most G8 currencies advanced. The GBP/USD is trading at 1.1860, after hitting a YTD low at 1..1716, so the major swang more than 100 pips as a reaction to the abovementioned data, while sentiment shifted positively, with US equities gaining.
The US and UK S&P Global PMIs came mixed; consequently, the greenback weakened
The US S&P Global PMI Composite for August showed that business activity in the US contracted for the second consecutive month. On the contrary, the Manufacturing PMI, although slowed, remained in expansionary territory, at 51.3, lower than expected.. The figures portray the Composite Index at 45, less than estimates of 47, while the Services PMI plunged to 44.1, below forecasts.
Meanwhile, during the European session, S&P Global revealed that August UK Manufacturing PMI plummeted into contractionary territory, falling to 46.0, shy of estimates of 51.1, driven by high energy prices across Europe, supply chain disruptions, and higher interest rates. Contrarily to the US, the UK’s Services PMI was unchanged at 52.5, while the Composite PMI downtick to 50.9.
What to watch
The US economic docket will feature Durable Good Orders for July, alongside Housing Data, illustrating that the US economy is slowing down on Wednesday. A light calendar will feature CBI Distributive Trades on the UK front on Thursday.
GBP/USD Price Analysis: Technical outlook
The GBP/USD is climbing as buyers eye a test of the August 19 daily high of 1.1935. Once the GBP/USD cleared the figure at 1.1800, followed by the August 22 daily high at 1.1836. The next resistance will be the 1.1900 figure on its way towards the August 19 daily high. Despite that the pound is staging a comeback, the Relative Strength Index (RSI), is still in negative territory, so caution is warranted.
- US dollar tumbles following the August preliminary US S&P Global PMI.
- Eurozone consumer confidence rises unexpectedly in August.
- EUR/USD is having the best day in two weeks.
A sharp decline of the US Dollar across the board boosted the EUR/USD pair following the release of US economic data. The pair climbed from under 0.9950 to 1.0018, printing a fresh daily high. It then pulled back, and as of writing, it is hovering around 1.0000.
US PMIs trigger alarms
The August preliminary S&P Global PMI showed numbers below expectations and activity at the lowest level in almost two years. The greenback tumbled across the board after the report. The DXY is falling by 0.70%, at 108.20, after testing multi-year highs.
US Treasuries rallied after the numbers. The US 10-year yield collapsed from 3.07% to 2.97% in a few minutes while the 30-year dropped from weekly highs at 3.28% to 3.20%. The moves in the bond market boosted the Japanese yen which become the best performer among majors.
Earlier on Tuesday, European PMI showed mixed numbers. More recently, during the American session, the European Commission announced that the Consumer Confidence Indicator for the Eurozone rose to -24.9 in August from July's record low of -27, against expectations of a decline to -28.
The euro is holding onto important daily gains versus the dollar, up for the first time after falling for three consecutive days. The main trend in EUR/USD is still bearish. The pair is up by almost 60 pips, the biggest daily gain in two weeks.
Technical levels
Citing nine OPEC sources familiar with the matter, Reuters reported on Tuesday that OPEC and its allies, the group known as OPEC+, may lean towards oil output cuts when and if Iranian production returns depending on the revival of the nuclear deal.
On Monday, Saudi Arabia's energy minister told Bloomberg that OPEC+ may be compelled to reduce oil production, as the physical and futures markets get increasingly strayed away from fundamentals.
Market reaction
Crude oil prices continued to push higher on this headline. As of writing, the barrel of West Texas Intermediate was trading at $93.75, where it was up 3.6% on a daily basis.
- Consumer confidence in the euro area improved modestly in early August.
- EUR/USD trades in positive territory near parity after the data.
The European Commission announced on Tuesday that the Consumer Confidence Indicator for the euro area rose to -24.9 (flash) in August from July's record low of -27. This reading came in better than the market expectation of -28.
For the EU, the Consumer Confidence Indicator rose to -26 from -27 in the same period.
Market reaction
The EUR/USD pair clings to daily recovery gains near parity after this data.
- USD/TRY extends the advance north of 18.00 on Tuesday.
- The rally in the US dollar sustains the upside in spot.
- Türkiye Consumer Confidence improved to 72.2 in August.
The persistent upside momentum in the greenback lifts USD/TRY to the area of 2022 highs past the 18.00 hurdle on Tuesday.
USD/TRY up on USD-buying, targets the all-time high
USD/TRY advances for yet another session on the back of the unabated uptrend in the greenback, which in turn appears bolstered by the Fed’s tightening expectations as well as another uptick in US yields.
The lira, in the meantime, continues to depreciate, as investors keep evaluating last week’s interest rate cut by the Turkish central bank (CBRT) despite inflation ran at nearly 80% in the year to July, the highest level since 1998.
Adding downside pressure to TRY, President Erdogan reiterated once again his opposition to raising interest rates earlier on Tuesday, increasing the rhetoric that the country needs “an increase in investment, employment, production, exports and current account surplus”… (nothing else).
Further news on Tuesday saw finmin N.Nebati suggesting (hoping) that inflation would start a sharp downside correction around December following base effects and that this strong downtrend could extend into 2023.
Again: with inflation around 80% YoY in July, the central bank’s CPI forecast at 70% by year end, no signs of an end to the Russia-Ukraine war for the time being and the energy crunch expected to get worse before it gets better, Nebati’s promises look no less than unachievable.
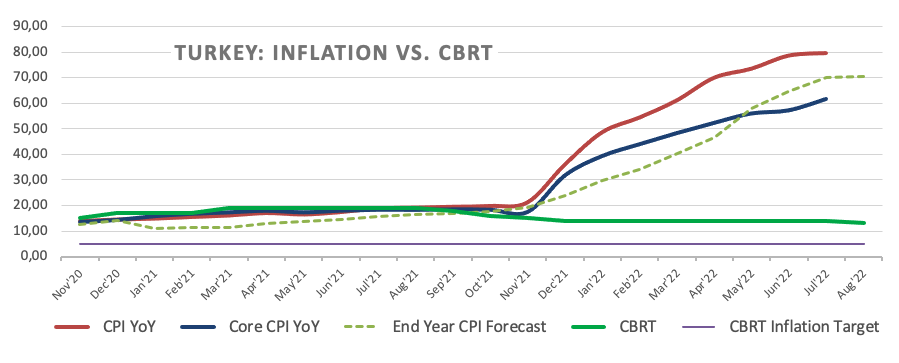
Back to reality, and in the domestic calendar, Consumer Confidence in Türkiye improved to 72.2 in August (from 68.0).
What to look for around TRY
The upside bias in USD/TRY remains unchanged and now targets the all-time high around 18.25 following the unexpected interest rate cut by the CBRT.
In the meantime, the lira’s price action is expected to keep gyrating around the performance of energy and commodity prices - which are directly correlated to developments from the war in Ukraine - the broad risk appetite trends and the Fed’s rate path in the next months.
Extra risks facing the Turkish currency also come from the domestic backyard, as inflation gives no signs of abating (despite rising less than forecast in July), real interest rates remain entrenched in negative figures and the political pressure to keep the CBRT biased towards low interest rates remains omnipresent. In addition, there seems to be no Plan B to attract foreign currency in a context where the country’s FX reserves dwindle by the day.
Key events in Türkiye this week: Consumer Confidence (Tuesday) – Capacity Utilization, Manufacturing Confidence (Thursday).
Eminent issues on the back boiler: FX intervention by the CBRT. Progress (or lack of it) of the government’s new scheme oriented to support the lira via protected time deposits. Constant government pressure on the CBRT vs. bank’s credibility/independence. Bouts of geopolitical concerns. Structural reforms. Presidential/Parliamentary elections in June 23.
USD/TRY key levels
So far, the pair is gaining 0.48% at 18.1164 and faces the immediate target at 18.1338 (2022 high August 23) seconded by 18.2582 (all-time high December 20) and then 19.00 (round level). On the other hand, a breach of 17.7586 (monthly low August 9) would pave the way for 17.4711 (55-day SMA) and finally 17.1903 (weekly low July 15).
- New Home Sales in the US fell sharply in July.
- The US Dollar Index continues to push lower toward 108.00.
Sales of new single‐family houses declined by 12.6% in July to a seasonally adjusted annual rate of 511,000, the data published jointly by the US Census Bureau and the Department of Housing and Urban Development showed on Tuesday.
"The median sales price of new houses sold in July 2022 was $439,400," the publication further revealed. "The average sales price was $546,800."
Market reaction
The dollar stays under heavy selling pressure after this data and the US Dollar Index was last seen losing nearly 0.7% on the day at 108.20.
- S&P Global Composite PMI for the US continued to decline in August.
- US Dollar Index continues to push lower on weak PMI figures.
The data published by S&P Global showed on Tuesday that the business activity in the US private sector contracted at a stronger pace in early August than it did in July with the Composite PMI falling to 45 from 47.7. The Manufacturing PMI declined to 51.3 from 52.2 and the Services PMI plunged to 44.1 from 47.3. Both of these readings fell short of market expectations.
Commenting on the data, "August flash PMI data signalled further disconcerting signs for the health of the US private sector. Demand conditions were dampened again, sparked by the impact of interest rate hikes and strong inflationary pressures on customer spending, which weighed on activity," noted Siân Jones, Senior Economist at S&P Global Market Intelligence.
"One area of reprieve for firms came in the form of a further softening in inflationary pressures," Jones further noted. "Input prices and output charges rose at the slowest rates for a year-and-a-half amid reports that some key component costs had fallen."
Market reaction
The dollar came under heavy bearish pressure after the disappointing PMI surveys and the US Dollar Index was last seen losing 0.45% on the day at 108.46.
- Gold catches some bids on Tuesday and recovers further from a multi-week low.
- A softer risk tone, along with a modest USD pullback, offers support to the metal.
- Hawkish Fed expectations, elevated US bond yields should cap any further gains.
Gold reverses an intraday dip to the $1,730 area and climbs to a fresh daily high during the early North American session. The XAU/USD, for now, seems to have snapped a six-day losing streak to a nearly four-week low and is currently placed around the $1,745 region, though any meaningful upside still seems elusive.
Macroeconomic headwinds stemming from China’s COVID-zero policy - imposing snap lockdowns after just a handful of cases - continue to fuel recession fears. This, in turn, tempers investors' appetite for riskier assets, which is evident from a generally weaker tone around the equity markets and benefits the safe-haven metal. Apart from this, a modest US dollar pullback from a two-decade peak further seems to underpin the dollar-denominated gold.
The USD lost additional ground following the release of weaker-than-expected flash US PMI prints for August. That said, expectations for a more hawkish message from Fed Chair Jerome Powell at the Jackson Hole symposium on Friday favour the USD bulls. This, in turn, suggests that the path of least resistance for gold is to the downside. Even from a technical perspective, the emergence of fresh selling at higher levels validates the negative outlook.
Furthermore, firming expectations that the Fed would continue to tighten its monetary policy leads to an extended sell-off in the US fixed income market. This, in turn, lifts the yield on the benchmark 10-year US government bond to a nearly one-month high and exerts some downward pressure on the non-yielding yellow metal. That said, a combination of factors offers some support to gold and helps limit the downside, at least for the time being.
Hence, any subsequent move up might still be seen as a selling opportunity and runs the risk of fizzling out rather quickly near the $1,754-$1,755 horizontal support breakpoint. Gold seems poised to prolong its recent retracement slide from the $1,808 area, or over a one-month high touched earlier this August. The downward trajectory could drag spot prices towards the $1,710 intermediate support en route to the $1,700 round-figure mark.
Technical levels to watch
EUR/USD has tested the 0.99 area. A break below here could trigger a substantial drop towards the 0.9575/70 support.
Weak demand for the euro
“Short-term price action does reflect some positives for the EUR – bullish reversals on the one and six-hour charts – but the lack of follow through off the intraday low at 0.99 suggests only weak demand for the EUR here, with the figure area still drawing attention.”
“We spot intraday resistance at 0.9950.”
“Support below the figure is really limited to 50s and 00s until 0.9570/75.”
USD/CAD dips modestly on crude rebound. The loonie could enjoy some strength if the pair breaks below 1.3010, economists at Scotiabank report.
WTI may head back towards the $95 area in the near term
“We still think the 1.3075 zone should provide some resistance to the USD’s advance but it may be hard for the CAD to resist a more generalized USD strength.”
“Key support is 1.3010; weakness below here should see the CAD regain a little more positive momentum.”
“WTI may head back towards the $95 area in the near term which may provide a little support for the CAD but the broader USD tone and risk appetite are likely to remain more influential drivers of the CAD in the absence of any major domestic developments.”
Gold’s recent selloff continued as precious metals traders are front-running Chair Powell's speech at the Jackson Hole symposium, economists at TD Securities report.
Easing in market expectations for rate cuts to immediately follow the rate hiking cycle
“In line with our view that the Fed may use Jackson Hole to push back against the notable easing in financial conditions sparked by the Chair's last remarks, precious metals prices have started to ease. Further, this fits with the recent easing in market expectations for rate cuts to immediately follow the rate hiking cycle, which we expect will be the focus of Fedspeak in the coming weeks.”
“We are anticipating a capitulation event in gold driven by the unwind of a bloated position held by a few prop-shops and family offices.”
- USD/JPY attracts some dip-buying on Tuesday and moves back closer to a one-month high.
- The USD stands tall near a two-decade high and offers support amid elevated US bond yields.
- The Fed-BoJ policy divergence favours bullish traders and supports prospects for further gains.
The USD/JPY pair reverses an intraday dip to the 137.00 mark and climbs back closer to over a one-month high touched earlier this Tuesday. The pair is seen trading just above mid-137.00s during the early North American session and looking to build on its recent upward trajectory witnessed over the past two weeks or so.
The US dollar hits a two-decade high amid hawkish Fed expectations, which turns out to be a key factor acting as a tailwind for the USD/JPY pair. Bullish traders further took cues from elevated US Treasury bond yields, resulting in the widening of the US-Japan rate differential and undermining the Japanese yen. This, along with the divergent Fed-Bank of Japan policy stance, supports prospects for a further near-term appreciating move.
Despite signs of easing US inflation, the recent hawkish remarks by several Fed officials suggested that the US central bank will continue to tighten its monetary policy to tame inflation. In contrast, the BoJ has repeatedly said that it will stick to its ultra-easy policy settings and
remains committed to keeping the 10-year Japanese government bond yield around 0%. This, in turn, reaffirms the near-term positive outlook for the USD/JPY pair.
Traders, however, might refrain from placing aggressive bullish bets and prefer to wait for a more hawkish message from Fed Chair Jerome Powell at the Jackson Hole symposium on Friday. Traders will further take cues from this week's important US macro releases. The combination of factors will play a key role in influencing the near-term USD price dynamics and help determine the next leg of a directional move for the USD/JPY pair.
In the meantime, Tuesday's US economic docket - featuring the flash PMI prints, New Home Sales data and Richmond Manufacturing Index - will drive the USD demand. This, along with the US bond yields and the broader market risk sentiment, should provide some impetus to the USD/JPY pair and allow traders to grab short-term opportunities.
Technical levels to watch
UOB Group’s Economist Ho Woei Chen, CFA, evaluates the latest move by the PBoC.
Key Takeaways
“The People’s Bank of China (PBoC)’s benchmark 1Y Loan Prime Rate (LPR) was fixed lower by a smaller-than-expected 5 bps to 3.65% (Bloomberg and UOB est: 3.60%) compared with the 10 bps cut to the 1Y medium-term lending facility (MLF) earlier this month. This is the first cut since Jan when the 1Y LPR was set lower by 10 bps.”
“Comparatively, Chinese banks have set the 5Y LPR lower by a larger 15bps to 4.30% (Bloomberg est: 4.35%). This follows 15 bps cut in May and 5 bps cut in Jan this year. The larger cut to the 5Y rate which mortgages are benchmarked against, suggests that authorities are increasingly concerned over the real estate downturn and continued to guide banks to set LPRs lower, in particular for the longer-tenor.”
“With the less optimistic outlook for the Chinese economy and measured pace of monetary policy easing so far, the 1Y LPR could continue to move lower to 3.55% by end-4Q22, instead of our earlier expectation that the monetary easing would cease by end-3Q22. After 35 bps cut YTD, the 5Y rate is still poised to fall further as PBoC extends support to the property market. However, there is less room for aggressive monetary policy easing by cutting interest rates and the PBoC will likely focus on using targeted tools including the relending programmes and guiding banks to increase credit.”
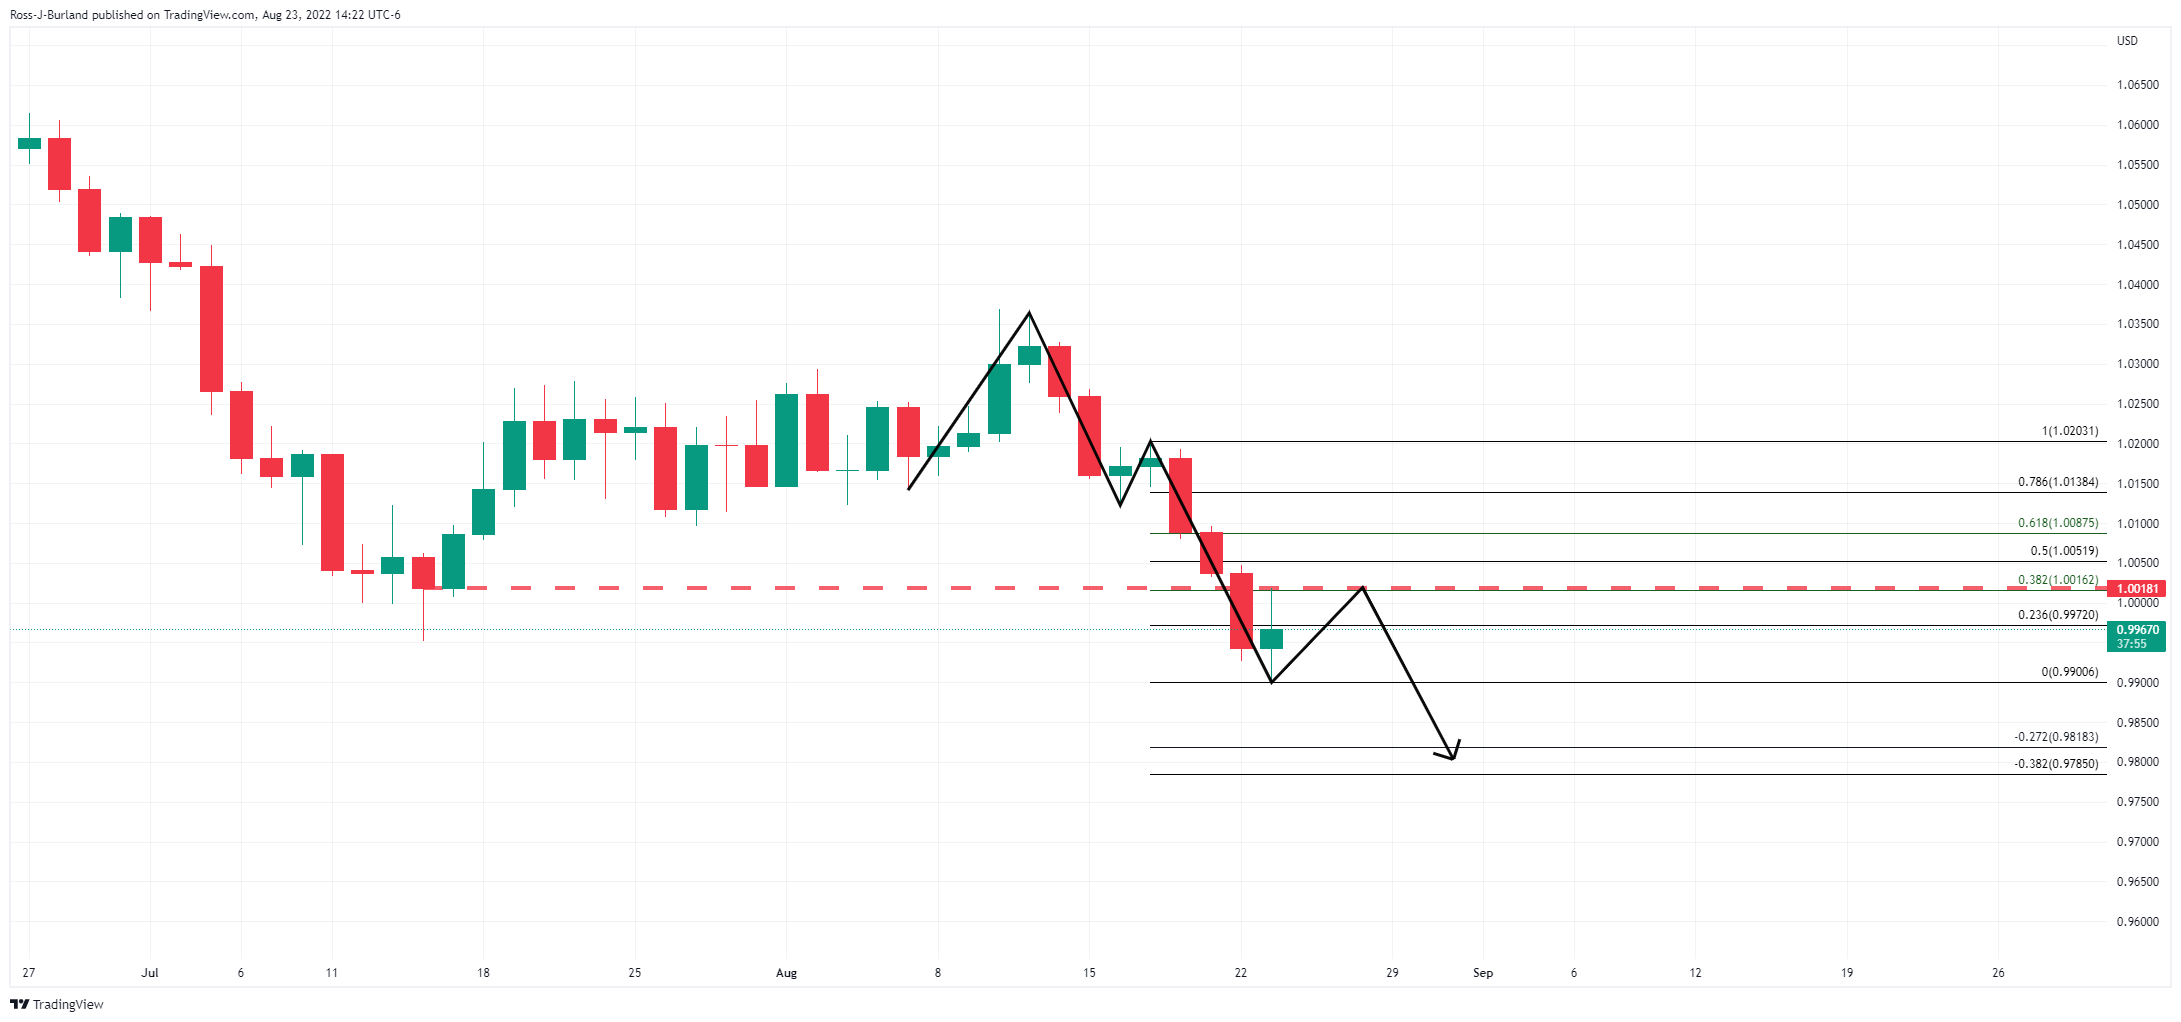
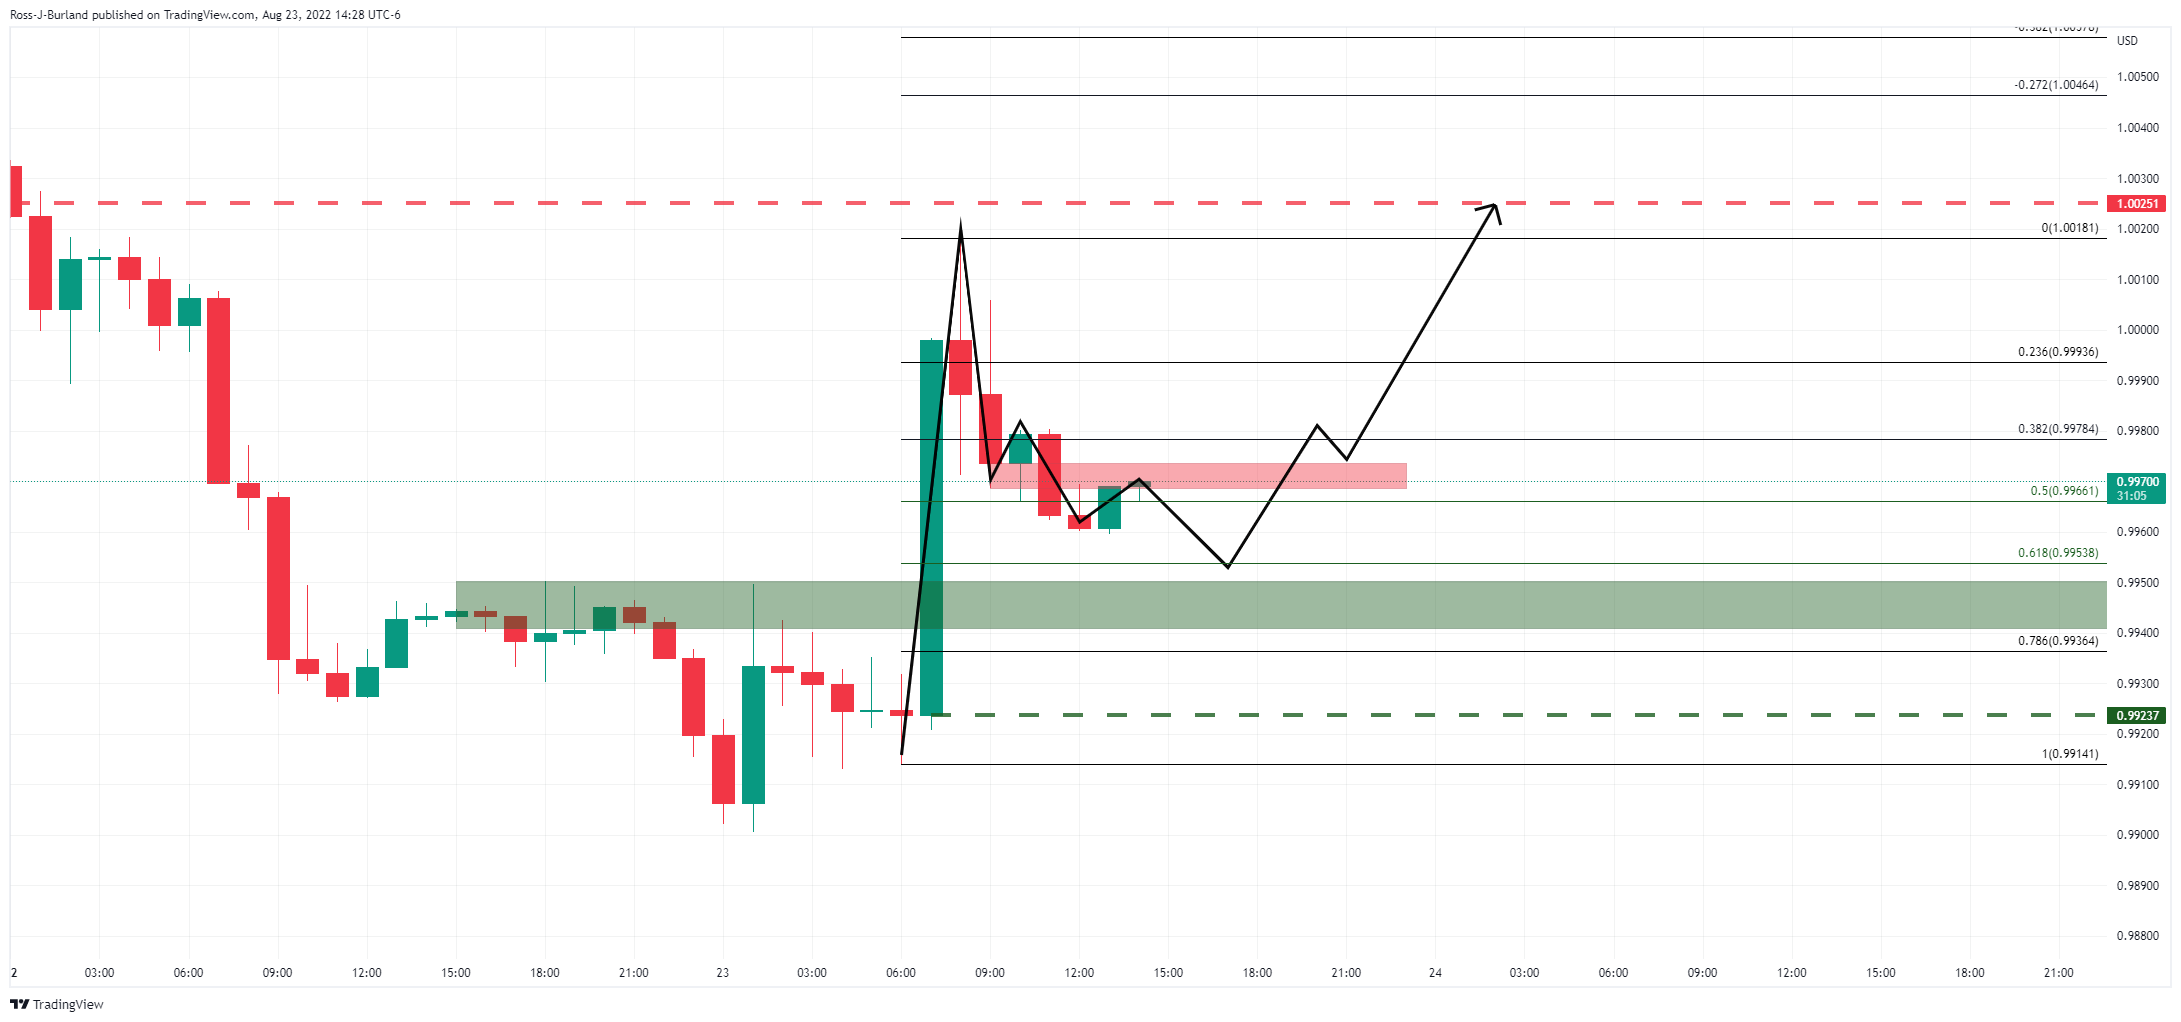
- EUR/USD clocks new cycle lows in the sub-0.9900 zone.
- Further losses could test the December 2002 low near 0.9860.
EUR/USD accelerates the daily losses and briefly breaks below the 0.9900 level, or new cycle lows.
Further weakness remains in the pipeline for the time being. Against that, the breakdown of the 2022 low at 0.9899 (August 23) should leave the door open to a probable deeper retracement to the December 2002 low at 0.9859.
In the longer run, the pair’s bearish view is expected to prevail as long as it trades below the 200-day SMA at 1.0845.
EUR/USD daily chart
Bank Indonesia (BI) unexpectedly raised its policy rate by 25 bps today. In the view of economists at ING, the Indonesian rupiah (IDR) could strengthen in the near-term after the surprising rate hike.
BI likely not done for the year
“BI finally hiked after staying on hold for the whole of 2022, confident that policy tightening would not derail the economy's recovery. We expect at least two more rate hikes by the central bank this year.”
“The IDR could gain support from the surprise rate hike in the near-term and could strengthen further should Indonesia's trade surplus remain sizable.”
Both the euro (EUR) and the British pound (GBP) have lost over 12% vs. the US dollar (USD) in the year to date. Economists at Rabobank expect the EUR/GBP pair to hover around the 0.84 area in the near-term but a move towards 0.86 is on the horizon.
EUR/GBP to hold around 0.84 on a one-to-three-month view
“We retain our forecast that EUR/GBP will hold around 0.84 on a one-to-three-month view.”
“For choice, we are forecasting a move to 0.86 on a six-month view, but how the eurozone copes this winter will be a strong determinant of whether the EUR can pull back some ground vs. GBP in the months ahead.”
- USD/CHF gains traction for the seventh straight day and jumps to a one-month high.
- A recovery in the risk sentiment undermines the safe-haven CHF and offers support.
- Hawkish Fed expectations act as a tailwind for the USD and favour bullish traders.
The USD/CHF pair prolongs its bullish move for the seventh successive day on Tuesday and climbs to over a one-month high during the mid-European session. The pair is currently placed comfortably above the 0.9650 horizontal resistance and seems poised to appreciate further.
A modest recovery in the global risk sentiment - as depicted by a positive turnaround in the equity markets - seems to undermine the safe-haven Swiss franc. This, along with the underlying bullish tone surrounding the US dollar, favours bullish traders and supports prospects for an extension of the recent recovery from the 0.9370 area, or the monthly low.
Despite signs of easing US inflation, investors seem convinced that the Fed will stick to its policy tightening path and have been pricing in at least a 50 bps rate hike in September. The bets were reaffirmed by the recent hawkish comments by several Fed officials and the FOMC minutes, indicating that the US central bank would continue hiking rates to tame inflation.
That said, a downtick in the US Treasury bond yields seems to hold back the USD bulls from placing fresh bets, especially after the recent run-up to a two-decade high. This could keep a lid on any further gains for the USD/CHF pair. That said, a sustained break through the previous monthly high, around the 0.9650 area, suggests that the path of least resistance is to the upside.
Market participants now look forward to the US economic docket - featuring the flash PMI prints, New Home Sales data and Richmond Manufacturing Index. This, along with the US bond yields, might influence the USD price dynamics and provide some impetus to the USD/CHF pair. Traders will further take cues from the broader risk sentiment to grab short-term opportunities.
Technical levels to watch
EUR/USD has tested 0.9900. Economists at BBH expect the pair to head lower towards the September 2002 low near 0.9615.
Preliminary eurozone August PMI readings continue to weaken
“The euro remains heavy and traded at new lows for this move near 0.9900. The next near-term target is the September 2002 low near 0.9615.”
“Headline manufacturing came in at 49.7 vs. 49.0 expected and 49.8 in July, services came in at 50.2 vs. 50.5 expected and 51.2 in July, and the composite came in at 49.2 vs. 49.0 expected and 49.9 in July.”
The US Dollar Index (DXY) is up for the fifth straight day and is coming off of its best week since March 2020. Economists at BBH note that the DXY could rally towards the 121 level on a break past the July 14 high near 109.294.
The dollar continues to strengthen
“DXY is trading at the highest since July 15 and it is on track to test the July 14 high near 109.294. After that, there really aren't any major chart points until the January 2002 high near 120.51 and the July 2001 high near 121.”
“Can the dollar rally another 10% from current levels? Fundamentally, that seems hard to justify but stranger things have happened.”
Economist at UOB Group Enrico Tanuwidjaja reviews the recently published Current Account results in the Indonesian economy.
Key Takeaways
“Indonesia’s current account posted a wider surplus amounting to USD 3.9bn (1.1% of GDP) in 2Q22, up significantly from a surplus of USD 0.4bn (0.1% of GDP) in 1Q22.”
“Indonesia also posted a balance of payment (BOP) surplus of USD 2.4bn in 2Q22, supported by a significantly larger current account surplus and a narrower capital and financial account deficit.”
“For 2022, we forecast that current account will return to a deficit of 0.2% of GDP as imports demand is likely to hasten up, while exports revenue is expected to moderate significantly.”
European Central Bank (ECB) executive board member Fabio Panetta said on Tuesday that they may have to adjust the monetary policy further, as reported by Reuters.
Panetta acknowledged that the probability of a recession in the eurozone was increasing and added that a recession would mitigate inflation pressures.
Market reaction
These comments don't seem to be having a noticeable impact on the shared currency's performance against its major rivals. As of writing, EUR/USD was trading at 0.9922, where it was down 0.2% on a daily basis.
Bank Indonesia (BI) hiked its policy rate by 25 bps today. Economists at TD Securities expect another 25 bps hike, potentially as early as next month. The USD/IDR has dropped following the hawkish pivot and is set to remain below the 15,000 level.
BI delivers a surprise hike
“In a surprise policy U-turn, BI hiked its 7-day reverse repo rate by 25 bps. BI justified the hike today as a preemptive move to address inflation pressures.”
“While BI took a hawkish stance on inflation, it appeared more dovish on other policy settings. BI is now signalling its own form of 'Operation Twist', joining other central banks like the RBI. We don't expect BI to stop with a one-off 25b ps hike today and expect another 25 bps, potentially as early next month.”
“We think IDR should be relatively more resilient compared to other EM-Asia currencies despite renewed USD strength.”
“We think BI will continue to defend the USD/IDR 15,000 level, which will act as a strong line in the sand.”
- DXY remains bid and flirts with the 2022 top near 109.30.
- Further north of comes the September 2002 high around 109.80.
DXY keeps the rally well and sound and trades at shouting distance from the YTD highs near 109.30 on Tuesday.
The continuation of the upside momentum looks increasingly likely in the very near term. That said, beyond the 2022 high at 109.29 (July 14) the index could challenge the September 2002 peak at 109.77 prior to the round level at 110.00.
In the meantime, while above the 6-month support line near 105.10, the index is expected to keep the short-term positive stance.
Looking at the long-term scenario, the bullish view in the dollar remains in place while above the 200-day SMA at 100.49.
DXY daily chart
Senior Economist Julia Goh and Economist Loke Siew Ting at UOB Group assess the release of the trade balance figures in Malaysia.
Key Takeaways
“Both export and import growth fell short of expectations in Jul, moderating to 38.0% y/y (UOB est: +41.5% vs Bloomberg est: +39.0%, Jun: +38.7%) and 41.9% y/y (UOB est: +49.0% vs Bloomberg est: +46.9%, Jun: +49.2%) respectively. Trade surplus narrowed to MYR15.5bn last month (from +MYR21.9bn in Jun) as a result of faster import growth over that of exports in the month.”
“Jul’s export growth was primarily supported by resilient demand for manufactured goods (particularly electrical & electronics, refined petroleum and chemicals & chemical products) and mining goods as overseas sales of agriculture goods were weighed by lower crude palm oil (CPO) prices and Indonesia’s palm oil exports policy. Higher shipments to the ASEAN region, US, EU, China including Hong Kong and Japan were key export growth drivers last month, with the ASEAN region logging an all-time high export value for two straight months.”
“Despite strong double-digit gains over the past one year, export growth is set to taper in the greater part of 2H22 as favourable base effects wane, major commodity prices retreating lately, and as heightened global headwinds keep businesses and consumers in a more cautious mode. Locally, the ongoing shortages of foreign labour continue to constrain manufacturers’ production capacity, in addition to the shortages of raw materials, higher cost pressures and currency volatility. We keep our 2022 full-year export growth forecast of 18.0% (BNM est: +10.9%, 2021: +26.0%).”
- EUR/JPY adds to Monday’s pullback above the 136.00 barrier.
- Bullish attempts remain capped by the August high at 138.40.
EUR/JPY extends the bearish start of the week, although it manages to bounce off earlier lows in the 135.70 region.
If the cross manages to break above the ongoing consolidation, the so far August high at 138.39 (August 10) is expected to come into focus once again. Above the latter, EUR/JPY could attempt a move to the 55-day SMA, today at 139.26.
While above the 200-day SMA at 134.12, the prospects for the pair should remain constructive.
EUR/JPY daily chart
- AUD/USD consolidates in a range near a one-month low touched earlier this Tuesday.
- A modest recovery in the equity markets offers support to the risk-sensitive aussie.
- Hawkish Fed expectations act as a tailwind for the USD and continue to cap the upside.
The AUD/USD pair struggles to gain any meaningful traction and seesaws between tepid gains/minor losses through the first half of the European session. The pair is currently placed in neutral territory, around the 0.6875 region, just a few pips above a one-month low touched earlier this Tuesday.
The US dollar pulls back from a two-decade high amid a softer tone surrounding the US Treasury bond yields. Adding to this, a goodish recovery in the global risk sentiment - as depicted by a positive turnaround in the equity markets - further underpins the safe-haven greenback. This turns out to be a key factor offering some support to the AUD/USD pair, through the attempted recovery move lacks bullish conviction.
Growing worries about a global economic downturn keep a lid on any optimistic move in the markets and act as a headwind for the risk-sensitive aussie. Furthermore, firming expectations that the Fed would continue to tighten its monetary policy to tame inflation should help limit any deeper USD corrective slide. The aforementioned factors should contribute to capping gains for the AUD/USD pair, warranting caution for bulls.
Investors might also be reluctant to place aggressive bets and prefer to move on the sidelines ahead of Fed Chair Jerome Powell's speech at the Jackson Hole symposium later this week. Investors will look for clues about the possibility of a 75 bps rate hike at the September FOMC meeting. This, along with important US macro data, will drive the USD demand and help determine the near-term trajectory for the AUD/USD pair.
In the meantime, Tuesday's US economic docket, featuring the flash PMI prints, New Home Sales data and Richmond Manufacturing Index might provide some impetus later during the early North American session. Apart from this, the broader risk sentiment could influence the USD price dynamics and allow traders to grab short-term opportunities around the AUD/USD pair.
Technical levels to watch
- UK CBI Manufacturing Order Book Balance fell below 0 for the first time in over a year.
- GBP/USD continues to fluctuate in a tight range above 1.1750.
Results from the latest survey released on Tuesday by the Confederation of British Industry (CBI) of trends in British manufacturing showed that the Manufacturing Order Book Balance dropped to -7 in August from +8 in July. This reading missed Reuters' estimate of +3 and it was the first negative reading since April 2021.
Further detail of the publication revealed that the Manufacturing Export Orders Balance remained unchanged at -12 and the Price Balance for the next three months climbed to +57 from +48.
Market reaction
This report doesn't seem to be having a significant impact on the British pound's performance against the dollar. As of writing, GBP/USD was unchanged on the day at 1.1765.
UOB Group’s Senior Economist Julia Goh and Economist Loke Siew Ting comment on the recent rate hike by the BSP.
Key Takeaways
“As expected, Bangko Sentral ng Pilipinas (BSP) continued to normalise its monetary policy rates today (18 Aug) with an additional 50bps hike. This brings the overnight reverse repurchase (RRP) rate to 3.75%, overnight deposit rate to 3.25%, and lending rate to 4.25%. Today’s interest rate hike marked the fourth back-to-back rate increases with a cumulative 175bps since May.”
“The Monetary Board (MB) judged that further monetary policy action is necessary to anchor inflation expectations and prevent a further breach in the inflation target over the policy horizon. The strong domestic economic growth in 1H22 also gave the central bank the flexibility to act against inflation pressures. It expects the national headline inflation to jump further to 5.4% this year (from its Jun’s estimate of 5.0%, UOB est: 5.0%) before decelerating to 4.0% in 2023 (from Jun’s estimate of 4.2%, UOB est: 4.0%) and 3.2% in 2024 (from Jun’s estimate of 3.3%).”
“Overall, the monetary policy statement and BSP Governor’s comments at the press briefing today indicated that the MB continues to the leave the door open for additional rate hikes. That said, BSP has almost fully unwound its collective 200bps rate cuts in the pandemic year of 2020. Ongoing uncertainties particularly global recession risks into 2023 and a tentative retreat in global oil prices could also lead the central bank to pause its rate hikes soon. Thus, we stick to our call for BSP to hike its policy rates by another 25bps in Sep and thereafter keep the RRP rate at 4.00% through 4Q22 and 2023, unless both global and domestic environments move in unexpected directions.”
- Gold edges higher on Tuesday and snaps a six-day losing streak to a multi-week low.
- Softer US bond yields prompt some USD profit-taking and offer support to the metal.
- Hawkish Fed expectations should continue to underpin the greenback and cap gains.
Gold gains some positive traction on Tuesday and moves away from a four-week low touched the previous day. The XAU/USD, for now, seems to have snapped a six-day losing streak and sticks to its modest recovery gains, around the $1,740 area through the first half of the European session, though lacks follow-through.
A slight US dollar pullback from a two-decade high turns out to be a key factor offering some support to the dollar-denominated gold. Following the recent strong run-up, the USD bulls to take some profits off the table amid a softer tone surrounding the US Treasury bond yields. In fact, the yield on the benchmark 10-year US government bond dips back below the 3.0% threshold, which further benefits the non-yielding yellow metal.
That said, a goodish recovery in the equity markets, along with hawkish Fed expectations, should hold back traders from placing aggressive bullish bets around gold. Despite signs of easing US inflation, investors seem convinced that the Fed will stick to its policy tightening path. The bets were reaffirmed by the recent hawkish comments by several Fed officials, which should act as a tailwind for the US bond yields and the greenback.
Investors also anticipate a more hawkish message from Fed Chair Jerome Powell's speech at the Jackson Hole symposium later this week. Apart from this, this week's important US macro releases will play a key role in influencing the near-term USD price dynamics and provide a fresh directional impetus to gold. This further warrants some caution before confirming that the XAU/USD has formed a bottom and positioning for any further appreciating move.
In the meantime, traders on Tuesday will take cues from the flash US PMI prints, due for release later during the early North American session. This, along with the US bond yields, will drive the USD demand. Apart from this, the broader risk sentiment would allow traders to grab short-term opportunities around gold.
Technical levels to watch
- GBP/USD whipsaws after UK services PMI improves but manufacturing PMI contracts.
- The US dollar maintains the pullback amid cautious optimism, weaker Treasury yields.
- Bear cross remains in play, as GBP bears eye a daily close below critical 1.1760 support line.
GBP/USD is struggling once again to extend the recovery while holding below the 1.1800 level, as bears remain unconvinced by the mixed UK Preliminary Business PMI surveys.
While activity in the services sector remained near July's 52.6, the manufacturing component tumbled to 46.0 in August from 52.1 in July, its lowest since May 2020.
Although a minor improvement in risk sentiment after an upside surprise delivered by the German Preliminary PMI eases fears over an imminent recession and lifts the European stocks. This helps the higher-yielding GBP to hold its ground against the US dollar.
The greenback pulls back from close to 19-year highs amid a sell-off in the US Treasury yields across the curve. Investors also book profit on their USD longs after the recent relentless rise and ahead of a fresh batch of relevant US economic data. The US S&P Global Preliminary manufacturing and services PMIs will be reported in the NA session, followed by the New Home Sales release.
Despite the renewed upside, cable remains vulnerable, as the state of the UK economy remains dire amid surging inflation, the European gas crisis and political concerns.
As observed on cable’s daily chart, the price is clinging to the critical support line at 1.1760. A daily closing below the latter is required to cement the ongoing downtrend towards the falling trendline support at 1.1565.
Ahead of that, 1.1600 – the round figure will challenge the bullish commitments. The 14-day Relative Strength Index (RSI) has stalled its descent but sits just above the oversold territory, suggesting that the downside remains more compelling.
Further, the 21-Daily Moving Average (DMA) has cut the 50 DMA from above, representing a bear cross and adding credence to the bearish potential.
GBP/USD: Daily chart

If buyers manage to take out the 1.1900 round figure, then a retest of Monday’s high at 1.1838 cannot be ruled.
Fresh buying opportunities will emerge above the latter, exposing the psychological barrier at 1.1850.
GBP/USD: Additional technical levels
- EUR/GBP defends the very important 200-day SMA, though struggles to gain any traction.
- The UK’s bleak economic outlook undermines sterling and offers some support to the cross.
- Concerns about the energy crisis in Europe weigh on the shared currency and cap the upside.
The EUR/GBP cross defends the very important 200-day SMA support and for now, seems to have stalled its recent pullback from a nearly one-month high touched last week. Spot prices, however, struggle to gain any meaningful traction and seesawed between tepid gains/minor losses, below mid-0.8400s through the early part of the European session.
The flash UK Manufacturing PMI unexpectedly falls in the contraction territory and comes in at 46.0 for August, which undermines the British pound and offers some support to the EUR/GBP cross. The data adds to concerns about a deeper economic downturn and overshadows the better-than-expected UK Services print of 52.5 for August. That said, rising bets for a 50 bps rate hike by the Bank of England in September, along with a modest US dollar pullback from a two-decade high, helps limit losses for sterling and caps the cross.
The shared currency, on the other hand, remains depressed amid worries about an energy crisis in the Eurozone, which could drag the region's economy faster and deeper into recession. In fact, European energy prices spiked to a record peak after Russia announced that it will halt supplies to Europe via the Nord Stream pipe for three days at the end of the month. Bulls seem rather unimpressed by mixed Eurozone Manufacturing PMI, which improves to 49.7 in August, though remains in the contraction territory.
The mixed fundamental backdrop warrants some caution for aggressive traders and positioning for a firm direction. Even from a technical perspective, the range-bound price action witnessed over the past two weeks or so further points to indecision among traders over the near-term trajectory for the EUR/GBP cross.
Technical levels to watch
EUR/USD has recovered modestly after having touched its weakest level in nearly two decades at 0.9900. Nevertheless, the pair is unlikely to enjoy additional recovery gains, FXStreet’s Eren Sengezer reports.
Near-term technicals suggest EUR/USD remains extremely oversold
“The short-term technical outlook suggests that the stays extremely oversold and the improving market mood suggests that the pair could extend its recovery. However, the underlying factors weighing on the pair remain in place, suggesting that recovery attempts are likely to remain as technical corrections.”
“EUR/USD seems to have met support at 0.9900 and as long as this level stays intact, additional recovery gains toward 1.0000 (psychological level) could be witnessed. In case sellers move to the sidelines and this level is confirmed as support, the next recovery targets could be set at 1.0025 (20-period SMA) and 1.0050 (static level).
“On the downside, a four-hour close below 0.9900 could open the door for an extended slide toward 0.9870 (former resistance area from October 2002) and 0.9800 (psychological level).”
Economist at UOB Group Lee Sue Ann reviews the latest release of the Australian labour market report.
Key Takeaways
“Australia’s seasonally adjusted employment decreased by 40,900 people (0.3%) in Jul, disappointing expectations for a gain of 25,000 even as the unemployment rate fell to 3.4% in Jul, the lowest since Aug 1974. Meanwhile, seasonally adjusted wage price index (WPI) rose for the third consecutive quarter, up 0.7% q/q in 2Q22. Annual wage growth came in at 2.6% y/y, the highest annual rate of wage growth since Sep 2014.
“Overall, the Australian labour market looks to tighten further in the next couple of months before slowing growth will likely push the jobless rate higher back towards the 3.8%-4.0% levels. Wage growth is also expected to pick up to over 3% by 2023.”
“Following the 50bps hike earlier this month, the Reserve Bank of Australia (RBA) is thus expected to continue pushing interest rates higher. We now believe the RBA can afford to raise the cash rate by a further 40bps to 2.25% at the 6 Sep meeting, given the extremely tight labour market and soaring inflation.”
- UK Manufacturing PMI contracts to 46.0 in August, a big miss.
- Services PMI in the UK eases to 52.5 in August, beats estimates.
- GBP/USD turns south towards 1.1750 on dismal UK PMIs.
The seasonally adjusted S&P Global/CIPS UK Manufacturing Purchasing Managers’ Index (PMI) unexpectedly contracts to 46.0 in August versus 51.1 expected and 52.1 – July’s final reading.
Meanwhile, the Preliminary UK Services Business Activity Index for August arrived at 52.5 when compared to July’s final score of 52.6 and 52.0 expected.
The first reading of the S&P Global/CIPS Composite PMI came in at 50.9 in August vs. 51.1 expected and 52.1 previous.
Annabel Fiddes, Economics Associate Director at S&P Global, commented on the survey
“The UK private sector moved closer to stagnation in August, as mild growth of activity across the service sector only just offset a deepening downturn at manufacturers. Waning customer demand amid the weaker economic outlook, and shortages of both staff and inputs, were reported to have hit goods producers hard, with firms registering the quickest drops in output and new work since May 2020.”
“Excluding the initial phase of the pandemic in early-2020, the reduction in manufacturing output was the quickest seen since the start of 2009. Meanwhile, the service sector registered the weakest increase in activity since the recovery began in early 2021.”
FX implications
A slump in the UK Manufacturing PMI checks the GBP/USD recovery. The spot is trading at 1.1763, almost unchnaged on the day.
- USD/CAD retreats from a multi-week high and is pressured by a combination of factors.
- Some follow-through rise in crude oil prices underpin the loonie and act as a headwind.
- A turnaround in the risk sentiment prompts some USD profit-taking and exerts pressure.
- Recession fears, hawkish Fed expectations might limit the USD pullback and lend support.
The USD/CAD pair comes under some selling pressure on Tuesday and snaps a four-day winning streak to a six-week high. The intraday downtick picks up pace during the early European session and drags spot prices to a fresh daily low, back closer to the 1.3000 psychological mark.
Crude oil prices gain traction for the second successive day and climb to a one-and-half-week high. This, in turn, is seen underpinning the commodity-linked loonie and exerting downward pressure on the USD/CAD pair. Concerns over tight global supply resurfaced after Saudi Arabia warned that the major oil producer could cut output to stall the recent fall in oil price, which continued boosting the black liquid.
The US dollar, on the other hand, eases a bit from a fresh two-decade high touched earlier this Tuesday and further contributes to the offered tone surrounding the USD/CAD pair. A sharp intraday recovery in the equity markets prompts some profit-taking around the safe-haven greenback. That said, recession fears might keep a lid on any optimism, which, along with hawkish Fed expectations should limit the USD pullback.
Despite signs of easing US inflation, the recent comments by several Fed officials suggested that the US central bank would stick to its policy tightening path. Adding to this, the FOMC meeting minutes released last week indicated that the Fed would continue hiking rates to tame inflation. Moreover, market participants expect a hawkish message from Fed Chair Jerome Powell's speech at the Jackson Hole symposium on Friday.
The hawkish Fed expectations support prospects for the emergence of dip-buying around the USD. Apart from this, worries that a global economic downturn would dent fuel demand should act as a headwind for crude oil prices and cap gains for the Canadian dollar. This, in turn, could further lend some support to the USD/CAD pair, warranting some caution for bearish traders and confirming that spot prices have topped out.
Market participants now look forward to the US economic docket, featuring the release of the flash PMI prints later during the early North American session. This, along with the broader risk sentiment, will influence the USD and provide some impetus to the USD/CAD pair. Traders will further take cues from oil price dynamics to grab short-term opportunities.
Technical levels to watch
- EUR/USD regains some poise and rebounds from 0.9900.
- German flash Manufacturing PMI improves a tad in August.
- EMU advanced Manufacturing PMI seen at 49.7 this month.
After bottoming out in fresh cycle lows around 0.9900, EUR/USD seems to have met some bargain hunters and trades with modest gains near 0.9950 on turnaround Tuesday.
EUR/USD depressed in nearly 20-year lows
EUR/USD remains under heavy downside pressure and trades in levels last visited in December 2002 in the vicinity of the 0.9900 neighbourhood on the back of the persevering upside in the greenback.
Indeed, speculation of further tightening by the Fed and expectations of a hawkish message from Chair Powell at the Jackson Hole Symposium continue to bolster the upside in the greenback, which has lifted the US Dollar Index (DXY) back above the 109.00 mark in detriment of the risk complex in past sessions.
In the euro calendar, flash Manufacturing PMI in Germany improved a tad to 49.8 in August, while the Services gauge appears deteriorate at 48.2. In the broader Euroland, the preliminary Manufacturing PMI is expected at 49.7 and 50.2 when it comes to the Services reading. Later, the European Commission will release its flash Consumer Confidence print for the current month.
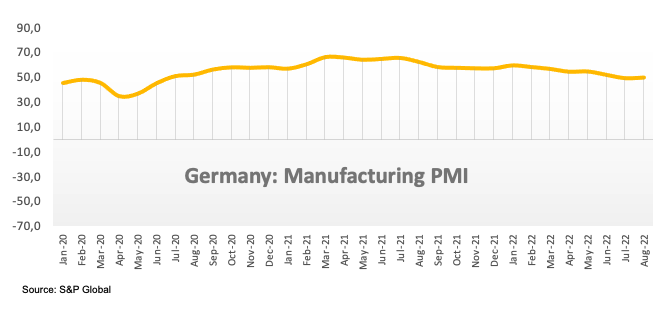
Across the pond, advanced Manufacturing and Services PMIs are also due ahead of July’s New Home Sales and the API report.
What to look for around EUR
EUR/USD prints new nearly 2-decade lows around 0.9900 amidst the relentless advance in the greenback.
Price action around the European currency, in the meantime, is expected to closely follow dollar dynamics, geopolitical concerns, fragmentation worries and the Fed-ECB divergence.
On the negatives for the single currency emerge the so far increasing speculation of a potential recession in the region, which looks propped up by dwindling sentiment gauges and the incipient slowdown in some fundamentals.
Key events in the euro area this week: Germany, EMU Flash PMIs, EMU Advanced Consumer Confidence (Tuesday) – Germany Final Q2 GDP Growth Rate, Germany IFO Business Climate, ECB Accounts (Thursday) – Germany GfK Consumer Confidence.
Eminent issues on the back boiler: Continuation of the ECB hiking cycle. Italian elections in late September. Fragmentation risks amidst the ECB’s normalization of its monetary conditions. Impact of the war in Ukraine on the region’s growth prospects and inflation.
EUR/USD levels to watch
So far, spot is losing 0.10% at 0.9932 and a break below 0.9900 (2022 low August 23) would target 0.9859 (December 2002 low) en route to 0.9685 (October 2022 low). On the other hand, the next up barrier comes at 1.0202 (high August 17) followed by 1.0280 (55-day SMA) and finally 1.0368 (monthly high August 10).
- Eurozone Manufacturing PMI arrives at 49.7 in August vs. 49.0 expected.
- Bloc’s Services PMI falls sharply to 50.2 in August vs. 50.5 expected.
- EUR/USD keeps the red near 0.9930 on the mixed Eurozone PMIs.
The Eurozone manufacturing sector activity eased its pace of contraction in August, the latest manufacturing activity survey from S&P Global research showed on Tuesday.
The Eurozone Manufacturing purchasing managers index (PMI) arrived at 49.7 in August vs. 49.0 expectations and 49.8 last. The index hit a 26-month low.
The bloc’s Services PMI dropped sharply to 50.2 in August vs. 50.5 expected and July’s 51.2. The indicator reached 17-month lows.
The S&P Global Eurozone PMI Composite fell to 49.2 in August vs. 49.0 estimated and 49.9 previous. The gauge clocked its lowest level in 18 months.
Comments from Chris Williamson, Chief Business Economist at S&P Global
“The latest PMI data for the eurozone point to an economy in contraction during the third quarter of the year.”
“Cost of living pressures mean that the recovery in the service sector following the lifting of pandemic restrictions has ebbed away, while manufacturing remained mired in contraction in August, seeing another record accumulation of stocks of finished goods as firms were unable to shift products in a falling demand environment.”
“This glut of inventories suggests little prospect of an improvement in manufacturing production any time soon.”
FX implications
EUR/USD keeps its recovery mode intact near 0.9930 on mixed euro area PMIs. The spot is down 0.13% on the day.
USD/CNH faces the next key up barrier at the 6.9000 level in the near term, note FX Strategists at UOB Group Quek Ser Leang and Peter Chia.
Key Quotes
24-hour view: “We expected USD to strengthen further yesterday. We highlighted that ‘resistance is at 6.8600’. We added, ‘as conditions are overbought, the next resistance at 6.8800 is not expected to come under threat’. Our view turned out to be correct as USD rose to 6.8751 before easing off. Conditions remain overbought but the improved upward momentum is likely to lead to a break of 6.8800. The next major resistance at 6.9000 is not expected to come into the picture for now. On the downside, a breach of 6.8440 (minor support is at 6.8550) would indicate that the current upward pressure has eased.”
Next 1-3 weeks: “Yesterday (22 Aug, spot at 6.8430), we highlighted that solid upward momentum is likely to lead to further USD strength. We indicated that resistance levels are at 6.8600 and 6.8800. USD subsequently took out 6.8600 and rose to 6.8751. Upward momentum is still solid and a break of 6.8800 would not be surprising. The next level to focus on is at 6.9000. Overall, only a break of 6.8330 (‘strong support’ level was at 6.8100 yesterday) would indicate that USD is unlikely to advance further.”
- Silver consolidates in a range below the 61.8% Fibo. level and the $19.00 round-figure mark.
- The set-up favours bearish traders and supports prospects for a further depreciating move.
- Attempted recovery moves could now be seen as a selling opportunity and remain capped.
Silver struggles to capitalize on the overnight bounce from a four-week low and seesaws between tepid gains/minor losses on Tuesday. The white metal remains on the defensive below the $19.00 mark through the early European session and seems vulnerable to slide further.
This week's convincing break and acceptance below the 61.8% Fibonacci retracement level of the July-August positive move was seen as a fresh trigger for bearish traders. Furthermore, technical indicators on the daily chart are holding deep in the negative territory and are still far from being in the oversold zone. This validates the bearish outlook and supports prospects for a further depreciating move for the XAG/USD.
Hence, a slide back towards the previous day's swing low, around the $18.70 region, en route to the next relevant support near the $18.45-$18.40 area, remains a distinct possibility. The downward trajectory could further get extended and the XAG/USD could eventually drop back to challenge the YTD low, around the $18.15 zone touched in July. This is followed by the $18.00 mark, which if broken should pave the way for additional losses.
On the flip side, the $19.10-$19.15 region (61.8% Fibo. level) now seems to act as immediate strong resistance. Any further recovery could be seen as a selling opportunity and remain capped near the $19.40-$19.50 area. The latter marks a static support breakpoint, which coincides with the 50% Fibo. level and should act as a pivotal point. Sustained strength beyond could allow the XAG/USD to reclaim the $20.00 psychological mark.
Silver daily chart
-637968365578497811.png)
Key levels to watch
- German Manufacturing PMI arrives at 49.8 in August vs. 48.2 expected.
- Services PMI in Germany contracts to 48.2 in August vs. 49.0 expected.
- EUR/USD rebounds towards 0.9950 on mixed German PMIs.
The German manufacturing and services sectors remained in contraction in August as the downturn deepened in the private sector economy, the preliminary manufacturing activity report from S&P Global/BME research showed this Tuesday.
The Manufacturing PMI in Eurozone’s economic powerhouse came in at 49.8 this month vs. 48.2 expected and 49.3 prior. The index jumped to two-month highs.
Meanwhile, Services PMI dropped from 49.7 booked previously to 48.2 in August as against the 49.0 estimated. The PMI hit the lowest level in 18 months.
The S&P Global/BME Preliminary Germany Composite Output Index arrived at 47.6 in August vs. 47.4 expected and July’s 48.1. The gauge reached 26-month troughs.
Key comments from Phil Smith, Economics Associate Director at S&P Global
“The PMI data paint a bleak picture of the German economy midway through the third quarter, showing a deepening decline in private sector business activity. Continued weakness in manufacturing is being compounded by a slowdown in the service sector, with surveyed businesses reporting a growing strain on demand from high inflation and increased interest rates.”
“The slowdown in the economy is increasingly taking a toll on firms’ hiring activity, with employment growth easing to its weakest for almost a year-and-a-half in August. A first fall in backlogs of work for more than two years points to capacity pressures across Germany’s private sector economy starting to ease and represents a downside risk to job creation going forward.”
FX implications
EUR/USD staged a decent comeback from 0.9900 towards 0.9935 on the German manufacturing upside surprise, as it eased fears of an imminent recession. The spot was last seen trading at 0.9925, still down 0.15% on the day.
NZD/USD has slumped below the 0.62 level. Economists at HSBC expect the kiwi to remain on the back foot in the next few weeks.
Shorter-term New Zealand-US yield differentials unlikely to offer much support to NZD
“We think the NZD will probably come under pressure in the next few weeks, amid broad risk sentiment and shorter-term yield differentials.”
“Markets may be concerned as policy rates move into restrictive territory, and a hawkish policy stance may cause ‘hard-landing’ risks to rise.”
“With the Fed having a much firmer footing from which to tighten further, shorter-term New Zealand-US yield differentials are unlikely to offer much support the NZD.”
- The rally in the index remains unabated above 109.00.
- US yields lose some upside traction on turnaround Tuesday.
- Flash PMIs, New Home Sales next on tap in the US docket.
The greenback, when gauged by the US Dollar Index (DXY), extends the advance past the 109.00 mark and trades at shouting distance from cycle highs near 109.30 on Tuesday.
US Dollar Index targets 109.30, looks to data
The index advances for the fifth consecutive session on Tuesday and approaches cycle tops in the 109.30 region, an area last visited back in September 2002.
Expectations of further tightening by the Federal Reserve in the next months, unabated inflation and the march higher in US yields across the curve have been all lending support to the buck in past sessions and ahead of the key PCE release and Chief Powell’s speech at the Jackson Hole Symposium due at the end of the week.
In the US data space, advanced Manufacturing and Services PMIs for the current month are due later in the NA session seconded by New Home Sales and the weekly report by the American Petroleum Institute (API) on US crude oil inventories.
What to look for around USD
Hawkish rhetoric from Fed’s rate-setters coupled with deteriorating sentiment in the risk complex propels the index back above the 100.00 barrier, exposing at the same time a probable move to YTD peaks.
Bolstering the dollar’s strength appears the firm conviction of the Federal Reserve to keep hiking rates until inflation looks well under control regardless of a likely slowdown in the economic activity and some loss of momentum in the labour market.
DXY, in the meantime, is poised to suffer some extra volatility amidst investors’ repricing of the next move by the Federal Reserve, namely a 50 bps or 75 bps hike in September.
Looking at the macro scenario, the greenback appears propped up by the Fed’s divergence vs. most of its G10 peers (especially the ECB) in combination with bouts of geopolitical effervescence and occasional re-emergence of risk aversion.
Key events in the US this week: Flash PMIs, New Home Sales (Tuesday) – MBA Mortgage Applications, Durable Goods Orders, Pending Home Sales (Wednesday) – Jackson Hole Symposium, Advanced Q2 GDP Growth Rate, Initial Claims (Thursday) - Jackson Hole Symposium, PCE, Personal Income, Personal Spending, Fed Powell, Final Consumer Sentiment (Friday) - Jackson Hole Symposium (Saturday).
Eminent issues on the back boiler: Hard/soft/softish? landing of the US economy. Escalating geopolitical effervescence vs. Russia and China. Fed’s more aggressive rate path this year and 2023. US-China trade conflict.
US Dollar Index relevant levels
Now, the index is gaining 0.13% at 109.09 and a breakout of 109.29 (2022 high July 15) would aim for 109.77 (monthly high September 2002) and then 110.00 (round level). On the other hand, immediate support comes at 106.02 (55-day SMA) followed by 104.63 (monthly low August 10) and then 104.28 (100-day SMA).
The US dollar has continued to strengthen at the start of this week resulting in the DXY rising up back above the 109.00 level. Economists at MUFG Bank believe that it is hard to argue against an even stronger US dollar in the coming months.
Fed policy and European energy woes boost relative appeal of US dollar
“The strength of the US dollar reflects expectations that the Fed will continue to deliver a relatively hawkish policy message at this week’s Jackson Hole symposium by reiterating that it still has work to do lifting rates to get inflation under control despite recent evidence that inflation pressures are starting to ease albeit from already elevated rates.”
“The strength of the US dollar was boosted further by the worsening negative energy price shock in Europe. The latest jump in gas prices follows the announcement at the end of last week from Gazprom that it is planning more maintenance work on the Nord Stream 1 pipeline from early next month which has stoked fears that it could be used as another excuse by Russia to further reduce supply from the already depleted rate of around 20% of the norm.”
“In the current difficult circumstances, it is hard to argue against an even stronger US dollar in the coming months with a dovish Fed pivot looking less likely in the near-term as well.”
AUD/USD has dived below the 0.69 mark. Economists at HSBC expect the aussie to face more headwinds ahead.
RBA should pivot soon to deliver a “soft-landing”
“Risk aversion amid slowing global demand and yield differentials would likely create near-term downside pressures for the AUD.”
“For the Reserve Bank of Australia (RBA’s) next meeting on 6 September, the market is priced for 39 bps of tightening (Bloomberg, 18 August 2022), while we think that the central bank should pivot soon to deliver a ‘soft-landing’. This will likely lead to AUD weakness.”
“Some recent softening activity data in China, contributing to a global downtrend, would probably weigh on the AUD, given Australia’s high exposure to trade.”
EUR/USD suffered another sharp drop yesterday, as a breach of parity led to a break below 20-year lows. Economists at ING expect the pair to stay below parity.
The euro will see another PMI drop
“A key question is whether the ECB will start discussing active support to the currency now that we have broken decisively below parity. We’ll hear from Fabio Panetta today in a scheduled speech, but keep an eye on any unscheduled remarks by hawkish members that may well become even more vocal on the weak euro.”
“On the data side, today’s PMIs will be the main highlight of the week, and we expect another drop after July’s grim readings, which may leave EUR/USD vulnerable to the 0.9800-0.9850 area.”
GBP/USD drops to the 1.17 region. Economists at HSBC expect cable to suffer further falls.
UK recession to leave the pound vulnerable
“The vagaries of risk appetite, two-year rate expectations and commodity prices point mostly to GBP downside.”
“Our forecasts (and the BoE’s) suggest a UK recession, probably leaving the GBP vulnerable.”
“Politics may get more traction in the FX market amid the 5 September result of the Conservative party leadership election. We expect meaningful loosening from the incoming UK Prime Minister. But such fiscal largesse may merely remind the GBP of the structural issues plaguing the economy in the form of its large twin deficits.”
- NZD/USD remains on the back foot inside a bearish chart pattern.
- Bears struggle after six-day downtrend amid sluggish RSI.
- 78.6% Fibonacci retracement can restrict immediate declines, buyers need validation from 200-SMA.
NZD/USD holds lower ground near 0.6170 during the initial hour of Tuesday’s European session as bears keep reins for the sixth consecutive day. In doing so, the Kiwi pair stays depressed inside a one-week-old descending trend channel.
However, sluggish MACD and RSI challenge the pair sellers as they approach the 78.6% Fibonacci retracement of July-August upside, near 0.6145.
Even if the quote declines below 0.6145, the lower line of the stated channel, at 0.6110, will precede the 0.6100 threshold and July’s bottom surrounding 0.6060 to challenge the NZD/USD bears.
In a case where the pair manage to remain on the seller’s radar past 0.6060, the 0.6000 psychological magnet will be in the focus of the market players.
On the flip side, recovery moves may initially aim for the 61.8% Fibonacci retracement level around 0.6215.
Following that, the aforementioned channel’s upper line, close to 0.6220, could test the NZD/USD buyers. Also acting as an upside hurdle is the 200-SMA level near 0.6250.
Overall, NZD/USD is in a bearish trend but the downside room is limited.
NZD/USD: Four-hour chart

Trend: Limited downside expected
- GBP/USD witnesses selling for the fifth straight day and drops to its lowest level since March 2020.
- Recession fears overshadow BoE rate hike bets and continue to weigh heavily on the British pound.
- Hawkish Fed expectations, the risk-off mood benefits the USD and contributes to the heavy selling.
The GBP/USD pair prolongs a nearly two-week-old downward trajectory and continues losing ground for the fifth successive day on Tuesday. This also marks the eighth day of a negative move in the previous nine and drags spot prices to the 1.1720-1.1715 area, or its lowest level since March 2020 during the early European session.
The recent surge in energy prices has raised concerns over the UK cost of living crisis and intensified fears of a deeper economic downturn. This, to a larger extent, overshadows rising bets for a 50 bps rate hike by the Bank of England in September and continues to undermine the British pound. Apart from this, the relentless US dollar buying exerts additional downward pressure on the GBP/USD pair.
In fact, the USD Index, which tracks the greenback against a basket of six currencies, jumps to a fresh two-decade high amid hawkish Fed expectations. The recent comments by several Fed officials suggested that the US central bank would stick to its policy tightening path. Furthermore, the FOMC meeting minutes released last week indicated that the Fed would continue hiking rates to tame inflation.
Adding to this, expectations of hawkish talk at the Jackson Hole symposium later this week, along with the prevalent risk-off environment, remain supportive of the ongoing USD rally. Recession fears temper investors' appetite for riskier assets, which is evident from a weaker tone around the equity markets. This, in turn, benefits the safe-haven buck and exerts additional pressure on the GBP/USD pair.
The aforementioned fundamental factors favour the USD bulls and support prospects for a further near-term depreciating move for the GBP/USD pair. That said, oversold conditions on short-term charts might hold back traders from placing aggressive bets. Investors might also prefer to wait on the sidelines ahead of this week's important macro releases and Fed Chair Jerome Powell's speech on Friday.
A rather busy week kicks off with the release of the flash UK PMI prints for August. Later during the early North American session, traders will take cues from the US PMIs. This, along with the broader market risk sentiment, might influence the USD price dynamics and provide some impetus to the GBP/USD pair.
Technical levels to watch
The dollar has remained well in demand at the start of this week. Economists at ING expect the US Dollar Index (DXY) to reach the 110 mark by the end of the week.
Global macro picture supporting the dollar seems unlikely to be changed
“Some price action in USD-crosses may end up being determined by any divergence in the surveys between the US and Europe, but the broad global macro picture that is currently supporting the dollar seems unlikely to be changed much from data at the moment.”
“Hawkish expectations heading into Fed Chair Jerome Powell’s speech on Friday at Jackson Hole should keep a fairly solid floor under the dollar for now, and probably pro-cyclical currencies (European FX in particular) on the back foot as the global risk environment remains choppy.”
“We may see 110 in DXY by the end of the week, and even at that level calling the dollar peak would prove risky.”
EUR/USD closed below parity for the first time since late 2002 on Monday. Economists at HSBC expect the world’s most popular currency pair to continue its move downward.
Eurozone-US rate differentials have been moving against the EUR since mid-June
“Much will hinge on the build-up and the result of the European Central Bank’s (ECB) 8 September meeting. The market is currently priced for 52 bps of tightening, in line with our expectations. Even if the ECB were to deliver an outsized 75 bps rate hike (not our central case), we are not convinced that it would be positive for the EUR beyond the knee-jerk reaction, as the FX market has been shifting its focus to the global growth outlook and away from the local pace of rate hikes.”
“It is worth noting that Eurozone-US rate differentials have been moving against the EUR since mid-June.”
GBP/USD continues to push lower toward 1.17. Economists at ING believe that a fall to the 1.15 area is on the cards.
Downside risks for sterling
“Rising energy prices should have put pressure on UK PMIs too, and this may keep the pound without any real solid floor against dollar appreciation.”
“Downside risks to GBP/USD remain quite elevated, and a move to the 1.1500 mark (last seen during the March 2020 flash crash) now looks like a tangible possibility.”
“EUR/GBP should instead keep trading in tighter ranges, as markets see the eurozone’s and the UK’s economic outlook following similar rocky paths. Oscillations within the 0.8400-0.8500 range may continue to rule in the near-term.”
The US Dollar Index (DXY) built on the previous week's gains and climbed above 109.00 on Monday. The combination of a hawkish Federal reserve and continuing concerns about global growth should ensure the USD to strengthen slightly in the next few weeks, economists at HSBC report.
Higher new median policy rate projections may be sufficient to push the USD higher
“Our expectation of a re-run by Fed Chair Powell of the existing narrative and a market justifiably finely balanced between 50 bps and 75 bps hike supports the case for the USD to track sideways. However, we think other considerations, like higher new median policy rate projections (in particular a higher terminal rate projection), may be sufficient to push the USD higher.”
“We expect the USD to be supported by both rates and risk aversion (to be elevated on global slowdown) in the next few weeks.”
EUR/USD and GBP/USD have once again moved into deeply undervalued territory. Therefore, economists at Crédit Agricole CIB Research see limited scope for further downside for both pairs in the near-term.
Short-term rate spreads seemed to be moving in the opposite direction
"The USD has been on a rampage with the beleaguered European currencies once again leading the losses. At the same time, however, traditional measures of the relative central bank policy outlook like short-term rate spreads seemed to be moving in the opposite direction, in part because of growing evidence of mounting inflation pressure in Europe as well as hawkish signals from both the ECB and the BoE.”
“Our measures of short-term fair value for both EUR/USD and GBP/USD that incorporate both short-term rate spreads and risk aversion metrics already seem to suggest that the recent sell-off of the two USD-crosses have once again moved into deeply undervalued territory. This much should limit the downside risks for EUR/USD and GBP/USD in the near-term.”
- USD/TRY seesaws around the yearly top marked the previous day.
- Turkish President Erdogan mentioned that the country did not need to hike interest rates.
- CBRT announced 100 bps rate cut the last week.
- US PMIs, Durable Goods Orders may entertain traders ahead of Friday’s Jackson Hole speech from Fed’s Powell.
USD/TRY picks up bids to refresh intraday high near 18.10 amid the initial hour of Tuesday’s European session. In doing so, the Turkish lira (TRY) justifies the broad US dollar strength, as well as Turkish President Recep Tayyip Erdogan’s resistance to the rate hike.
“Turkish President Tayyip Erdogan said on Monday the country did not need to hike interest rates, but instead work on raising investment, employment, production and exports and achieving a current account surplus,” reported Reuters.
It’s worth noting that the Central Bank of the Republic of Türkiye (CBRT) surprised markets by announcing 100 basis points (bps) of a rate cut during the last week even as Turkish inflation jumped to the all-time high in July, around 80%.
On the other hand, the US Dollar Index (DXY) rises for the fifth consecutive day as bulls attack the yearly top of 109.29 marked in July. The greenback’s gauge versus the six major currencies seems to cheer the market’s fears of recession, as well as the Fed’s aggression.
While the economic slowdown fears underpinned the yields in refreshing the monthly top the previous day, the US 10-year Treasury yields retreat to 3.0%, down three basis points (bps) at the latest. The pullback in US bond coupons could be linked to the traders’ anxiety ahead of the preliminary S&P Global PMIs from the UK, Eurozone and the US, for August month.
Also important to watch will be the US New Home Sales for July and Richmond Fed Manufacturing Index for August. However, major attention will be given to Fed Chair Jerome Powell’s speech at the Jackson Hole Symposium, up for publishing on Friday, for clear directions.
Technical analysis
USD/TRY bulls are well-directed towards refreshing the all-time high marked in late 2021, around 18.35 until the quote stays beyond a five-week-old ascending support line, close to the 18.00 threshold by the press time.
Here is what you need to know on Tuesday, August 23:
The US Dollar Index (DXY) built on the previous week's gains and climbed above 109.00 on Monday. The DXY was last seen closing in on multi-year highs it set at 109.29 in July with the dollar preserving its strength on safe-haven flows. US stock index futures were down between 0.3% and 0.5% in the early European morning. The S&P Global will release the preliminary August Manufacturing and Services PMI surveys for Germany, the euro area, the UK and the US later in the day. The European Commission will publish the Consumer Confidence Index data and the US economic docket will feature July New Home Sales and the Richmond Fed Manufacturing Index later in the day.
The dollar rally picked up steam on Monday during the American trading hours as Wall Street's main indexes opened deep in negative territory. Investors grow increasingly concerned over a global recession and they might be positioning themselves for hawkish comments at the Jackson Hole Symposium later this week following Fed policymakers' remarks last week.
Meanwhile, crude oil prices recovered sharply on Monday and the barrel of West Texas Intermediate closed modestly higher. Saudi Energy Minister told Bloomberg that they could consider cutting production due to the physical and futures markets getting increasingly strayed away from fundamentals.
EUR/USD closed below parity for the first time since late 2002 on Monday and extended its slide toward 0.9900 early Tuesday.
GBP/USD continues to push lower toward 1.1700 in the European morning on Tuesday and trades at its weakest level since March 2020.
USD/JPY gained more than 50 pips on Monday but struggled to gather further bullish momentum on Tuesday. The benchmark 10-year US Treasury bond yield retreated to the 3% area, not allowing the pair to gain traction.
Gold dropped to a fresh multi-week low of $1,727 on Monday but managed to stage a modest recovery before closing the day slightly below $1,740. Falling US T-bond yields help XAU/USD limit its losses for the time being.
Bitcoin stays on the backfoot early Tuesday and declines toward $21,000. Ethereum is already down more than 3% on the day and trades below $1,600.
Stocks have rallied since June. Will the bear market rebound last? Mike Wilson, Chief Investment Officer and Chief US Equity Strategist for Morgan Stanley, offers his perspective.
Earnings estimates likely to fall further
“While there are some strong indications that inflation has peaked from a rate of change standpoint, it's too soon for the Fed to declare victory in our view. In other words, the rising hope for the Fed to pivot away from rising rates or curtailing its balance sheet reduction remains optimistic.”
“Now, with the price earnings multiple exceeding 18x last week, valuations are inappropriate if one agrees with our view that earnings estimates are too high.”
- USD/JPY is likely to overstep the immediate hurdle of 137.40 amid upbeat DXY.
- Soaring expectations of the Fed’s continuation on a path of interest rate elevation are strengthening the DXY.
- Also, investors have underpinned the greenback against the yen on downbeat Japan PMI data.
The USD/JPY pair is struggling to overstep the immediate hurdle of 137.40 after a decent bounce from 137.20. The upside bias in the asset is still favored as the US dollar index (DXY) is expected to recapture the 19-year high of 109.30 sooner.
As investors are turning risk-averse ahead of the Jackson Hole Economic Symposium and on downbeat PMI performances by various nations, investors are shifting their funds into the US dollar index (DXY). The DXY is advancing sharply higher as a hawkish tone by the Federal Reserve (Fed) will stay for longer despite little evidence of exhaustion in the price pressures.
No doubt, the annual plain-vanilla US Consumer Price Index (CPI) slipped to 8.5% after hitting a figure above 9%. The Fed will continue its path of hiking interest rates as the current inflation rate is extremely far from the desired rate of 2%. Therefore, Fed chair Jerome Powell will continue its hawkish tone at Jackson Hole Economic Symposium this week.
On the economic data front, investors are awaiting the US Purchasing Managers Index (PMI) numbers, which are expected to display mixed performance. The Manufacturing PMI is expected to decline to 51.5 vs. the prior print of 52.2. However, the Services PMI will improve to 49.1 from the former figure of 47.3.
On the Tokyo front, downbeat Japan’s PMI data has weakened yen against the greenback. Japan’s Jibun Bank Manufacturing PMI has recorded lower at 51 than the expectations and the prior release of 51.8 and 52.1 respectively. Also, Services PMI remained downbeat at 49.2 from the consensus of 50.7 and the former figure of 50.3.
The US Treasury yield curve has inverted. Strategists examine what this means for Emerging Market (EM) currencies on historic sensitivities.
What US yield curve inversion means EM FX?
“Unsurprisingly the USD strengthens as the yield curve inverts. HUF, SGD, KRW, BRL and MXN are the most sensitive EM currencies vs. USD as this happens. If we are correct and the US curve inverts further, pressure on these currencies will likely intensify.”
“On the other end of the spectrum are INR, MYR and TRY, with INR the only EM currency that strengthens as the UST yield curve inverts.”
EUR/HUF has climbed as far as 410. Economists at Commerzbank expect the Hungarian forint to continue weakening.
Forint continues to struggle
“As inflation is not yet showing any signs of having peaked the MNB now has to stay its course. Any doubts on the part of the market that it might become less restrictive would put additional pressure on HUF and in the end probably force the MNB to hike its key rate anyway – at the expense of its credibility.”
“Politics might provide additional headwinds. The Hungarian government’s reply to the EU’s request for action on the rule of law, for which the deadline was yesterday, might cause the EU to withhold important funds in the end, which would hit Hungary hard. Regardless of the financial risks, disagreements with the EU tend to put pressure on the forint.”
Further upside could motivate USD/JPY to surpass the 137.85 level in the near term, comment FX Strategists at UOB Group Quek Ser Leang and Peter Chia.
Key Quotes
24-hour view: “Yesterday, we held the view that ‘the overbought advance in USD has momentum to extend further but the major resistance at 137.85 is likely out of reach’. Our view was not wrong as USD rose to a high of 137.64. Despite the advance, upward momentum has not improved by much. For today, we expect USD to consolidate and trade within a range of 136.80/137.85.”
Next 1-3 weeks: “We highlighted yesterday (22 Aug, spot at 137.10) that USD is likely to advance but it has to break 137.85 before further USD strength is likely. USD subsequently rose to 137.64 before closing on a firm note at 137.47 (+0.39%). While the price actions suggest USD could break 137.85, upward momentum has not improved by much. To look at it another way, it may take a while before USD could advance to the next resistance at 138.30. Overall, only a break of 136.40 (‘strong support’ level was at 135.90 yesterday) would indicate that USD is unlikely to advance further.”
AUD/USD is falling sharply after barricades around 0.6900. Economists at Commerzbank believe that the aussie is unlikely to enjoy gains ahead.
Reserve Bank of Australia might slow the speed of its rate hikes
“In early August the RBA had hiked its key rate by 50bp to now 1.85%. It signalled further rate hikes but will take its decisions one by one. In the meantime, the unemployment rate has fallen further, to now 3.4% in July. Moreover, wage costs rose by 2.6% in Q2. On the other hand, growth prospects for China and the global economy have deteriorated.”
“I assume that the RBA will remain on its restrictive course but might slow the speed of its rate hikes. That might make it more difficult for AUD to gain ground against the US dollar.”
Open interest in natural gas futures markets reversed the previous small build and dropped by more than 4K contracts on Monday according to advanced prints from CME Group. Volume, in the meantime, remained erratic and increased by around 72.5K contracts after Friday’s retracement.
Natural Gas keeps targeting $10.00
Prices of natural gas recorded new 2022 highs just shy of the key $10.00 mark per MMBtu on Monday. The daily advance was accompanied by shrinking open interest, which opens the door to some corrective move in the very near term. Supporting the latter, the commodity already flirts with the overbought territory, as per the daily RSI near 70.
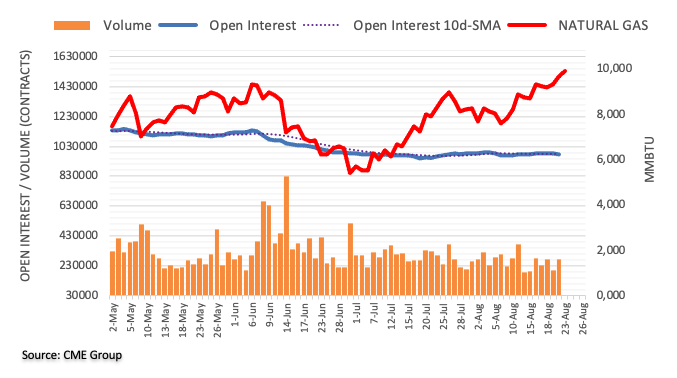
The Purchasing Managers' Indexes (PMIs) of several European countries and the eurozone as a whole will be published on Tuesday. If the figure comes below the expansion mark of 50, this would be another reason to settle the EUR/USD pair below parity, economists at Commerzbank report.
Things might begin to get tight for the euro now
“If the PMIs reinforce recession fears further by falling again, with the eurozone index for services even falling under the expansion mark of 50, it might begin to get tight for the euro. This would also cause market expectations to increase that the ECB might take a break in its rate hike cycle (too) soon despite continued high levels of inflation. It is already being seen as being (too) cautious in its fight against inflation.”
“In addition to the US dollar arguments, the PMIs and thus the euro side are another reason why EUR/USD should settle below parity for the time being.”
See – EUR/USD: Bad German PMI to cement the pair under parity – SocGen
- USD/CHF buyers attack 100-DMA in search of further gains around one-month high.
- Bullish MACD signals, clear break of 50-DMA keep buyers hopeful.
- Descending resistance line from mid-June challenges the advances.
USD/CHF prints a seven-day uptrend as it pokes the 100-DMA during the initial hour of Tuesday’s European session. In doing so, the Swiss currency (CHF) pair remains firmer around the monthly top surrounding 0.9660, marked the previous day.
The pair’s upside momentum takes clues from the bullish MACD signals and successful trading beyond the 50-DMA, at 0.9627 by the press time.
It should be noted, however, that the 100-DMA and a 10-week-old resistance line, respectively around 0.9655 and 0.9665, challenge the USD/CHF bulls.
Should the quote crosses the 0.9665 hurdle, an upward trajectory towards the 50% and 61.8% Fibonacci retracements of June-August downside, close to 0.9710 and 0.9790 in that order, appears imminent. Though, July’s peak of 0.9885 and the 0.9900 threshold could test the USD/CHF buyers afterward.
Alternatively, a convergence of the 50-DMA and the 38.2% Fibonacci retracement level, around 0.9630, restricts the short-term downside of the pair.
Following that, a one-week-old support line near 0.9585 will be crucial as a downside break of the same could quickly drag the quote towards the early-month swing low near 0.9470.
Overall, USD/CHF struggles to restore buyers’ confidence but needs validation from 0.9660.
USD/CHF: Daily chart

Trend: Further upside expected
NZD/USD dropped below 0.62 as the USD comeback intensified. Economists at ANZ Bank believe that the current environment ys challenging for the kiwi.
Bond yields rise and risk appetite fades
“Inflation remains at front of mind, and US markets seem to be warming to the idea that it could be harder to tame this time around given energy market woes, dents in supply chains and tight labour markets. This is, in turn, driving a shift in bond markets, which have of late been content to assume a slowdown might miraculously drive inflation lower; and that, in turn, is driving the USD up.”
“Support 0.6060/0.6290 Resistance 0.6575/0.6660.”
In the opinion of FX Strategists at UOB Group Quek Ser Leang and Peter Chia, NZD/USD could debilitate further in the short term, although a break below 0.6125 seems unlikely.
Key Quotes
24-hour view: “We highlighted yesterday that NZD ‘is likely weaken further’. We added, ‘in view of the oversold conditions, a clear break of 0.6150 appears unlikely’. Our view was not wrong as NZD dropped to 0.6157 before rebounding to close little changed at 0.6173 (-0.03%). We view the current price actions as part of a consolidation phase and expect NZD to trade between 0.6150 and 0.6210 for today.”
Next 1-3 weeks: “Our update from yesterday (22 Aug, spot at 0.6180) still stands. As highlighted, there is scope for further NZD weakness even though the chance for a break of 0.6125 is not high for now. Overall, only a breach of 0.6240 (‘strong resistance’ level was at 0.6260 yesterday) would indicate that the oversold weakness in NZD has stabilized.”
CME Group’s flash data for crude oil futures markets noted traders scaled back their open interest positions for yet another session on Monday, this time by around 16.8K contracts. On the other hand, volume reversed three daily drops in a row and went up by around 137.3K contracts.
WTI: Upside remains capped by $95.00
WTI prices started the week on a positive foot and managed to close the session above the key $90.00 mark per barrel. The move was amidst shrinking open interest and suggests the extra gains appear not favoured for the time being. In the meantime, bullish attempts in the commodity remain capped by the weekly high around $95.00 (August 11).
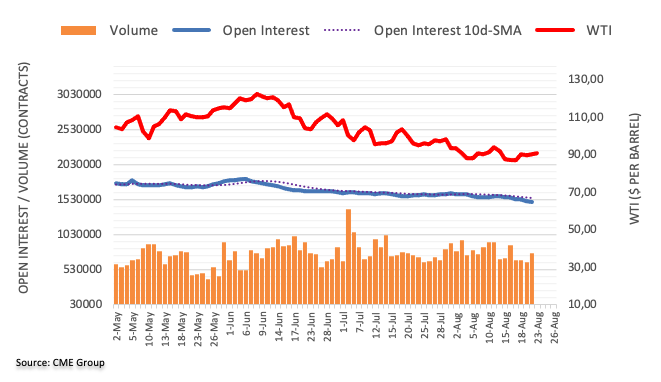
Gold price is in the green for the first time in seven days. Recession fears and 61.8% Fibo support could offer a brief reprieve to gold bulls, FXStreet’s Dhwani Mehta reports.
61.8% Fibo, recession fears could aid XAU/USD’s dead cat bounce
“A mix of recession fears combined with hawkish Fed expectations construes a perfect storm for markets, which could revive the bright metal’s appeal as the traditional safe haven.”
“For the recovery to gain legs, bulls need to crack $1,744, the 50% Fibonacci Retracement (Fibo) level of the recovery from yearly lows of $1,681 to the August 10 high of $1,808, on a daily closing basis, with eyes back on the $1,750 psychological level.”
“It is worth noting that the RSI still remains in the negative territory while the 50-Daily Moving Average (DMA) is approaching the 21 DMA from above, warranting caution for bulls. Therefore, the rebound appears short-lived and bears could remain in control in the near-term.”
“A sustained break below the 61.8% Fibo support at $1,729 will open up the downside towards $1,700, below which the yearly lows of $1,681 will be challenged.”
See – Gold Price Forecast: XAU/USD to struggle near-term, recovery to $1,900 expected next year – Commerzbank
- EUR/JPY has displayed a vertical fall to near 136.00 as investors have turned risk-averse ahead of German PMI.
- The unscheduled maintenance of the Nord Stream 1 pipeline may impact the German energy market.
- Investors have ignored the lower-than-expected Japan PMI data.
The EUR/JPY pair has witnessed a sheer downside move after facing barricades around 136.60. The asset has refreshed its day’s low at 136.12 and is expected to decline further on downbeat forecasts for Germany’s Purchasing Managers Index (PMI) data. Investors are turning risk-averse and are discounting the German PMI, which is expected to remain vulnerable due to a combination of factors such as soaring inflation, supply chain risks, and the energy crisis in the eurozone.
As per the market forecasts, the German S&P Global/BME Manufacturing PMI data will release at 48.3, lower than the prior release of 49.3. While the Services PMI will land lower at 49 than the former release of 49.7.
Also, the German Manufacturing PMI is on a declining spree since February. More downside in the German PMI could bolster the odds of a recession in Germany. Investors should be aware of the fact that Germany is a core member of the European Union (EU) and a situation of recession in Germany will have a significant impact on the shared currency.
Adding to that, the shared currency bulls are also facing the heat of the upcoming energy crisis in Germany. Nord Stream 1 pipeline will go through unscheduled maintenance in the last three days of August, which will accelerate the already vulnerable energy market in Germany.
Meanwhile, investors have ignored a decline in Japan’s PMI data. Japan’s Jibun Bank Manufacturing PMI has landed at 51, lower than the expectations and the prior release of 51.8 and 52.1 respectively. Also, Services PMI remained vulnerable at 49.2 from the consensus of 50.7 and the former figure of 50.3.
FX Strategists at UOB Group Quek Ser Leang and Peter Chia noted GBP/USD could slip back to the 1.1680 region in the next few weeks.
Key Quotes
24-hour view: “We highlighted yesterday that GBP ‘could drop further but a sustained decline below July’s low near 1.1760 appears unlikely for now’. GBP subsequently dropped to dropped to 1.1744 before closing at 1.1768 (-0.55%). Downward momentum has waned a tad and while GBP could dip below the major support at 1.1730, it is unlikely able to maintain a foothold below this level. The next support is at 1.1680. Resistance is at 1.1795 followed by 1.1825.”
Next 1-3 weeks: “Yesterday (22 Aug, spot at 1.1825), we highlighted that the pace of any further GBP decline is likely to be at a slower pace and 1.1730 is expected to offer solid support. We did not anticipate the subsequent sharp drop as GBP closed lower for the fourth straight day (1.1768, -0.55%). Despite the decline, downward momentum has not improved by much. That said, there is scope for GBP to edge lower towards 1.1680. Resistance is at 1.1825 but only a break of 1.1875 (‘strong resistance’ level was at 1.1935 yesterday) would indicate that the current GBP weakness has stabilized.
- Gold price retreats from daily top as DXY resumes uptrend after early-day pullback.
- Fears of recession, China-linked optimism and hawkish Fed bets keep XAU/USD buyers hopeful.
- US data, risk catalysts could offer intermediate halt ahead of Friday’s Jackson Hole Symposium.
Gold price (XAU/USD) dropped back towards $1,700, retreating from the intraday high near $1,740 heading into Tuesday’s European session, as the market’s risk-aversion returns to the table. That said, the yellow metal printed mild gains earlier in the day as the US Treasury yields retreated from the monthly peak.
It’s worth observing that the US Treasury yields refreshed monthly high before the early-day retreat, down two basis points (bps) near 3.0% by the press time.
The US Dollar Index (DXY), on the other hand, remains firmer during the five-day uptrend while ignoring the softer yields.
The reason could be linked to China’s pessimism despite the readiness for more stimulus, as signaled by China Securities News. Also challenging the yellow metal buyers are the fears that Russia could add strength to its invasion of Ukraine, per the anonymous US source of Reuters.
Additionally, fears of economic slowdown and the increasing bets on the 0.75% rate hike by the US Federal Reserve (Fed) in September, favor the XAU/USD bears.
Looking forward, the market’s fears could keep exerting downside pressure on the gold price. However, the preliminary S&P Global PMIs from the UK, Eurozone and the US, for August month, will be important for fresh impulse. Also in-line for publishing are the US New Home Sales for July and Richmond Fed Manufacturing Index for August. Above all, Fed Chair Jerome Powell’s speech at the Jackson Hole Symposium, up for publishing on Friday, will be crucial for the market as a whole.
Technical analysis
Gold fades bounce off the 61.8% Fibonacci retracement of July-August upside, around $1,730. In doing so, the XAU/USD remains inside a one-week-old bearish channel, between $1,721 and $1,745.
It’s worth noting, however, that the impending bull cross of the MACD and the RSI’s rebound from the oversold territory underpin the optimism of the XAU/USD buyers.
However, corrective pullback needs validation from the 200-SMA level surrounding $1,750 to tease buyers.
Meanwhile, a downside break of $1,721 could direct gold bears towards the late July swing low near $1,711 before highlighting the $1,700 threshold.
Gold: Four-hour chart
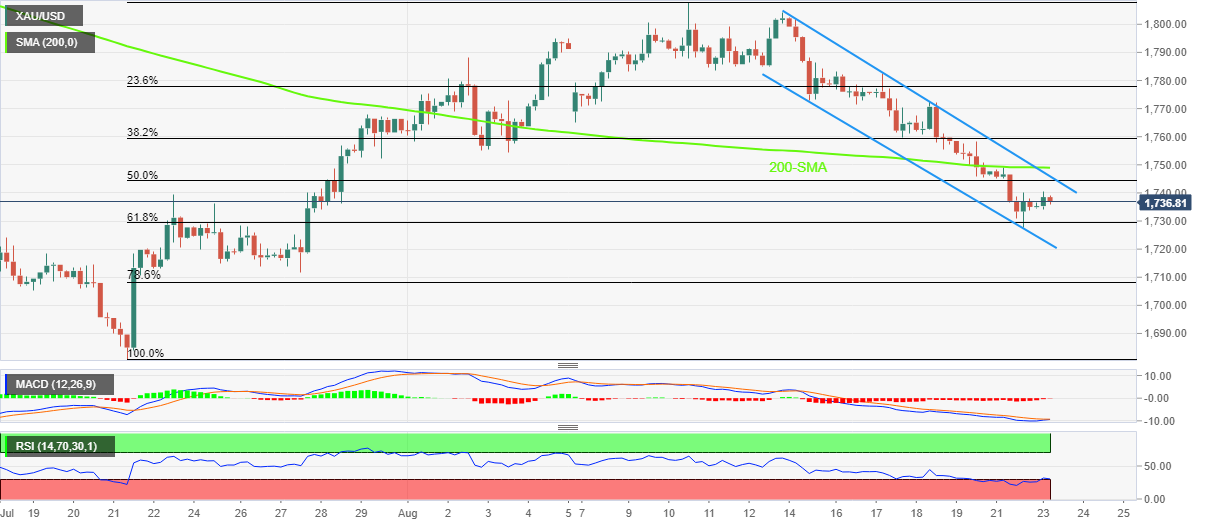
Trend: Further weakness expected
FX option expiries for August 23 NY cut at 10:00 Eastern Time, via DTCC, can be found below.
- EUR/USD: EUR amounts
- 1.0000 437m
- 1.0100 499m
- 1.0200 268m
- GBP/USD: GBP amounts
- 1.1730 248m
- 1.2025 284m
- 1.2200 210m
- USD/JPY: USD amounts
- 135.00 365m
- 135.85 230m
- 136.00 360m
- AUD/USD: AUD amounts
- 0.6850 273m
- 0.6900 360m
- USD/CAD: USD amounts
- 1.2950-60 560m
Considering preliminary readings from CME Group for gold futures markets, open interest shrank by just 483 contracts at the beginning of the week after three consecutive daily builds. Volume, instead, rose for the second straight session, now by around 5.8K contracts.
Gold appears to have met support near $1,730
Gold prices declined for the sixth session in a row on Monday. The daily pullback, however, was amidst shrinking open interest, which hints at the view that the retracement could take a breather in the very near term. So far, decent support seems to have turned up near $1,730 for the time being.
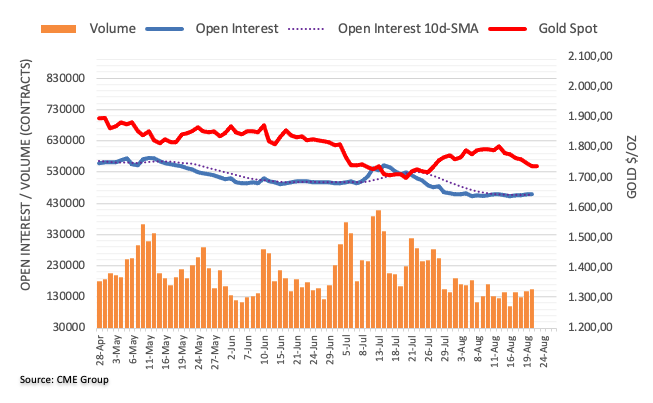
Further weakness could drag EUR/USD to the 0.9870 region and 0.9830, suggested FX Strategists at UOB Group Quek Ser Leang and Peter Chia.
Key Quotes
24-hour view: “While we expected EUR to ‘continue to weaken’ yesterday, we were of the view that ‘a sustained decline below 1.0000 is unlikely’. We did not anticipate the sharp sell-off as EUR plummeted to a low of 0.9924 before closing sharply lower by 0.93% (NY close of 0.9941). Despite being deeply oversold, the weakness in EUR has yet to stabilize and further decline appears likely. The next support is at 0.9880 (minor support is at 0.9900). On the upside, a breach of 0.9990 (minor resistance is at 0.9960) would indicate that the current weakness in EUR has stabilized.”
Next 1-3 weeks: “We indicated yesterday (22 Aug, spot at 1.0035) that a break of 1.0000 would not be surprising but it is left to be seen if the oversold decline in EUR could break the year-to-date low at 0.9950. The anticipated decline exceeded our expectations as EUR easily took out 0.9950 (low of 0.9924). While conditions remain oversold, solid downward momentum is likely to lead to further EUR weakness. The next levels to focus on are at 0.9870 and 0.9830. On the upside, a breach of 1.0035 (‘strong resistance’ level was at a much higher level of 1.0115 yesterday) would indicate that EUR is unlikely to weaken further.”
- AUD/USD has surrendered the majority of its gains and has slipped to near 0.6886.
- The downbeat Aussie PMI has weakened the aussie bulls.
- A mixed performance is expected by the US PMI.
The AUD/USD pair is falling sharply after failing to cross the immediate hurdle of 0.6900 in the Asian session. It seems that the pullback move by the aussie bulls from Monday’s low of 0.6862 is concluding sooner and a fresh downside impulsive wave will initiate. The asset has picked significant offers after the release of the downbeat Aussie Purchasing Managers Index (PMI) data.
The S&P Global Manufacturing PMI slipped sharply to 54.5 vs. expectations of 57.3 and the prior release of 55.7. While the Services PMI data landed lower to 49.6 against the forecasts of 54 and the former figure of 50.9. The downbeat PMI data has weakened the aussie bulls.
There is no denying the fact that the poor PMI data could be one of the consequences of the rising Official Cash Rate (OCR) by the Reserve Bank of Australia. To contain the galloping inflation, RBA Governor Philip Lowe has elevated its Official Cash Rate (OCR) to 1.85%. This has resulted in an extreme liquidity squeeze in the Australian economy, which has left only costly money in the palms of the corporate sector. And, they are forced to deploy the same in ultra-filtered investments only.
Meanwhile, the US dollar index (DXY) has resumed its upside journey after giving an upside break of the consolidation formed in a narrow range of 108.86-108.96 in the early European session. Going forward, investors are awaiting the release of the US PMI data. As per the market forecasts, the US Manufacturing PMI will land at 51.5 vs. the prior print of 52.2. Contrary to that, the Services PMI will elevate meaningfully to 49.1 from the former figure of 47.3.
- EUR/GBP remains pressured around intraday low after dropping the most in a month the previous day.
- Brexit optimism joins Eurozone energy crisis to weigh on the quote.
- Preliminary PMIs for August hint at downbeat figures but ECB versus BOE mode favor pair buyers.
- Eurozone Consumer Confidence, Russia-Ukraine headlines also become important for fresh impulse.
EUR/GBP holds lower ground near 0.8450 heading into Tuesday’s London open. In doing so, the cross-currency pair extends the previous day’s pullback from the monthly top as traders await flash readings of the August month PMIs for the UK, Germany and the Eurozone.
The quote’s weakness could also be linked to the expectations of positive developments on the Brexit front. “The UK government’s plan to tear up part of its Brexit deal with the EU and replace the Northern Ireland Protocol unilaterally will create a “myriad” of new problems, business leaders have warned,” said The Independent. The news also added that the Northern Ireland Business Brexit Working Group – which includes Logistics UK, CBI NI and Manufacturing NI – said soaring inflation mean there was an “urgent” need for compromise with Brussels.
Also keeping the EUR/GBP sellers hopeful is the energy crisis in the bloc. Russia’s unscheduled maintenance of the Nord Stream 1 pipeline unveiled a blow to the struggling Eurozone economy amid the energy crisis. The fears grew stronger as the firmer US data indicated the Fed’s aggression.
Germany’s monthly report from Bundesbank signaled that a recession in Germany is increasingly likely while also suggesting that inflation will continue to accelerate and could peak at more than 10%. Before that, Bundesbank President, as well as the European Central Bank (ECB) policymaker, Joachim Nagel mentioned that the ECB must keep raising interest rates even if a recession in Germany is increasingly likely, as inflation will stay uncomfortably high all through 2023. On the contrary, German Economy Minister Robert Habeck stated, “A good chance to get through winter without drastic energy measures.”
Moving on, the activity numbers may offer immediate directions but the odds of further downside are minimal considering the European Central Bank’s (ECB) comparatively hawkish stand than the Bank of England (BOE). Also, the first readings of the Eurozone Consumer Confidence for August will be out later in the day and can entertain the EUR/GBP traders.
Technical analysis
The previous resistance line from mid-June joins the support line of the three-week-old bullish channel to highlight 0.8410 as the key level required for the EUR/GBP bear’s entry. Until then, the quote may again attempt to cross the 50-DMA hurdle surrounding 0.8500.
- WTI holds onto the previous day’s recovery moves, grinds higher around daily top.
- Successful break of 100-SMA, bullish MACD divergence keep buyers hopeful.
- Two-month-old resistance line, 200-SMA restrict immediate upside.
- 12-day-old support line adds to the downside filters.
WTI crude oil buyers defend the $91.00 breakout heading into Tuesday’s European session. In doing so, the black gold justifies the previous day’s upside break of the 100-SMA, as well as the bullish MACD signals.
Additionally, the lower high on prices joins the higher high on the RSI (14) to portray the hidden bullish divergence of the commodity.
As a result, the quote aims for the downward sloping resistance line from late July, around $92.30.
However, the energy benchmark’s further upside hinges on how well the buyers can cross the 200-SMA hurdle surrounding $93.65.
Following that, a slow grind towards the monthly high of $95.90 and then to the $100.00 threshold can’t be ruled out.
On the flip side, pullback moves remain elusive until the quote remains above the descending resistance line from July 29, around $89.10. That said, the 100-SMA level near $90.45 restricts the immediate downside of the black gold.
It should be noted that the WTI crude oil’s weakness past $89.10 could make it vulnerable to refresh the six-month low, which in turn highlights the two-week-old support line, at $84.70 by the press time.
WTI: Four-hour chart
Trend: Limited upside expected
- Asian indices have declined on downbeat performance from the Asia-Pacific region on the PMI front.
- Advancing oil prices after OPEC signaled production cuts have dampened the market mood.
- Focus has shifted to US PMI data now which will provide more clarity to investors for further direction.
Markets in the Asian domain are displaying a cautious approach after the release of the downbeat Purchasing Managers Index (PMI) data in the Asia-Pacific region. PMI numbers for Japan and Australia are out and have remained downbeat and now investors are awaiting the release of the US PMI data.
At the press time, Japan’s Nikkei225 tumbled 1.19%, China A50 eased 0.37%, and Hong Kong surrendered 0.64%. Indian indices opened in the negative territory but have recovered firmly and have turned positive.
Japan’s Jibun Bank Manufacturing PMI has landed at 51, lower than the expectations and the prior release of 51.8 and 52.1 respectively. Also, Services PMI remained vulnerable at 49.2 from the consensus of 50.7 and the former figure of 50.3. In the Asia-Pacific region, Aussie’s Manufacturing PMI slipped sharply to 54.5 from the expectations of 57.3 and the prior release of 55.7. While the Services PMI data landed lower to 49.6 against the estimates of 54 and the former release of 50.9.
The downbeat performances by the weighing Asia-Pacific nations on the PMI front have dampened the sentiments of the market participants.
Apart from that, a firmer recovery in the oil prices has also dampened the market mood. Oil prices have rebounded sharply after OPEC signaled production cuts to offset the recent decline. It is worth noting that the oil prices fell around 33% from their yearly high of $127.00, recorded in March.
Going forward, investors will focus on the PMI numbers from the mighty US. The S&P Global Manufacturing PMI is expected to land at 51.5, lower than the prior print of 52.2. However, the Services PMI could improve meaningfully to 49.1 vs. the former figure of 47.3.
Li Daokui a former member of the People’s Bank of China’s (PBOC) monetary policy committee, said on Tuesday that China’s central bank has room to cut its benchmark interest rate by 50 basis points (bps) over the next year if the economy remains in doldrums, per Bloomberg.
Key quotes
“People’s Bank of China can lower rates through the middle of 2023 as needed to alleviate corporate debt.”
“Further cuts would be made possible because of the country’s strong trade surplus and capital controls that will support the yuan and ease capital outflow pressure.”
“I think there’s still room for 30-to-50 basis points of interest rate cuts in total by the end of the first half of next year.”
Related reads
- USD/CNH retreats as US dollar is faded in a significant move
- S&P 500 Futures lick its wounds, yields retreat as markets brace for Jackson Hole
- Copper price stays mildly bid at monthly high, reverses pullback from one-week high.
- Depleting inventories, heat wave in China restrict supplies of industrial metal.
- Expectations of more stimulus from China join a pullback in yields, DXY to underpin the mild gains.
Copper price seesaws around one-week high, reversing the previous day’s pullback, as softer US dollar joins hopes of more supply crunch. Adding strength to the recovery moves are the hopes that China could announce more stimulus to defend the world’s second-largest economy from recession.
That said, copper futures on COMEX print mild gains around $3.6570, up 0.10% intraday, whereas the three-month copper on the London Metal Exchange (LME) matches the move with the latest quote being around $8,040.
The energy crisis in Europe, China’s readiness for further stimulus and depleting inventories are some of the top-tier catalysts that have recently defended the copper price. It’s worth noting that the latest heat wave in China forces many metal producers to stop manufacturing plants and hence portray the supply crunch, as well as lead to a reduction in stockpiles.
Alternatively, hawkish Fed bets and chatters that China won’t be able to tame economic slowdown amid broad pessimism seem to challenge the metal buyers. On the same line could be the concerns surrounding the Russia-Ukraine tussles. Reuters quotes an anonymous US official to mention that Russia is preparing strikes on Ukraine's infrastructure in the coming days. Meanwhile, the New York Times (NYT) reported that the US is sending more weapons to Ukraine to aid counterattack.
Amid these plays, the market sentiment remains unclear and hence troubles the metal traders. As a result, today’s preliminary S&P Global PMIs from the UK, Eurozone and the US, for the August month, will be important for fresh impulse. Also in-line for publishing are the US New Home Sales for July and Richmond Fed Manufacturing Index for August. Above all, Fed Chair Jerome Powell’s speech at the Jackson Hole Symposium, up for publishing on Friday, will be crucial for the market as a whole.
Should the economic fears stop Fed’s Powell from favoring the 0.75% rate hike in September, the copper prices may witness further upside due to its inverse relationship with the US dollar.
- A subdued pullback in the EUR/USD pair may turn into a fresh bearish impulsive wave sooner.
- A downbeat release of Germany's PMI will strengthen the odds of a recession.
- Germany's Manufacturing PMI is declining consecutively since February this year.
The EUR/USD pair is attempting to build a base around 0.9940 after a vertical decline on Monday. The major has auctioned in a narrow range of 0.9933-0.9950 in the Asian session but is likely to deliver a downside break on lower expectations for Germany’s PMI data. On Monday, the asset recorded severe losses after losing the magical figure of 1.0000.
According to the preliminary estimates, the German S&P Global/BME Manufacturing PMI data will land at 48.3, lower than the prior release of 49.3. Also, the Services PMI is seen downbeat at 49 vs. the former print of 49.7. It is worth noting that Germany is a core member of the European Union (EU) and declining Germany PMI will have a significant impact on the shared currency.
Also, investors should be aware of the fact that the Manufacturing PMI is declining consecutively since February this year. And more downside in the economic data would bolster the odds of a recession in Germany. Apart from that, Russia will halt natural gas supplies to Europe for three days in August to run the unscheduled maintenance under the Baltic Sea to Germany. The unexpected natural gas supply cut to Germany from Nord Stream 1 pipeline will accelerate the imbalance of the energy demand-supply mechanism and may drag the shared currency.
On the dollar front, the US dollar index (DXY) is displaying a subdued performance in the Asian session. The asset is expected to remain sideways ahead of the US PMI data. As per the estimates, the S&P Global Manufacturing PMI will land at 51.5, lower than the prior print of 52.2. Contrary to that, the Services PMI will improve substantially to 49.1 vs. the former figure of 47.3.
- USD/INR holds lower ground after reversing from monthly high.
- Hopes that RBI wound intervene to defend the INR from refreshing record low favor pair sellers of late.
- Softer yields, sluggish session add strength to pullback moves.
- Preliminary US PMIs for August, housing numbers may entertain traders.
USD/INR holds onto the previous day’s retreat from the monthly peak, despite recent action surrounding 79.85, amid hopes that the Reserve Bank of India (RBI) would defend the Indian rupee (INR) from refreshing all-time low. Also keeping the pair sellers hopeful during early Tuesday in Europe is the sluggish session and a pullback in the US Treasury yields, as well as the US Dollar Index (DXY).
“The Indian rupee was set to open flat against the dollar on Tuesday amid a weak risk appetite and on expectations that the Reserve Bank of India would step in to prevent the local unit from touching a new record low,” said Reuters.
The news also mentioned that the RBI has been selling dollars to shield the rupee from the volatility fuelled by the US Federal Reserve's aggressive rate hikes. India's foreign exchange reserves have dropped to their lowest level since November 2020.
Alternatively, the US Dollar Index (DXY) retreats from the monthly high, down 0.08% intraday near 108.87 at the latest. The DXY’s latest pullback could be linked to the US Treasury yields as the benchmark 10-year bond coupons drop two basis points (bps) to 3.02% at the latest.
It’s worth mentioning that the hawkish Fed bets, fears of economic slowdown and the recently firmer Chicago Fed National Activity Index that improved to 0.27 in July, from a downwardly revised -0.25 prior, keeps the USD/INR buyers hopeful.
Moving on, the preliminary readings of the US PMIs for August will join the US New Home Sales for July and Richmond Fed Manufacturing Index for August to decorate today’s calendar. However, Fed Chair Jerome Powell’s speech at the Jackson Hole Symposium, up for publishing on Friday, will be crucial for clear directions.
Technical analysis
Despite the latest pullback, USD/INR remains above the 79.70 range support, which in turn keeps the pair buyers hopeful.
- GBP/USD portrays short-covering moves after declining to the lowest levels since March 2020.
- US dollar pares some gains as traders await fresh clues, yields retreat from monthly top.
- Hopes of UK-EU deal of Northern Ireland Protocol, amid rising cost of living crisis, also underpin corrective pullback.
- Cable may print kneejerk reaction in case of strong UK PMIs, bears have higher chances of ruling.
GBP/USD licks its wounds as it grinds higher around 1.1780, after refreshing the 29-month low the previous day. In doing so, the Cable pair cheers the recently increasing odds that the UK and the Eurozone might agree on the Northern Ireland Protocol (NIP) amid a pullback in the US Treasury yields. Also allowing the quote to rebound is the cautious optimism ahead of the preliminary readings of the UK and the US PMIs for August.
“The UK government’s plan to tear up part of its Brexit deal with the EU and replace the Northern Ireland Protocol unilaterally will create a “myriad” of new problems, business leaders have warned,” said The Independent. The news also added that the Northern Ireland Business Brexit Working Group – which includes Logistics UK, CBI NI and Manufacturing NI – said soaring inflation mean there was an “urgent” need for compromise with Brussels.
On the other hand, the US Dollar Index (DXY) retreats from the monthly high, down 0.08% intraday near 108.87 at the latest. With this, the greenback’s gauge versus the six major currencies tracks the US Treasury yields as the benchmark 10-year bond coupons drop two basis points (bps) to 3.02% at the latest.
It’s worth noting that the DXY rose to the six-week high the previous day, and also printed a four-day uptrend, amid fears of recession and increasing hawkish Fed bets. The US dollar excelled after Chicago Fed National Activity Index improved to 0.27 in July, from a downwardly revised -0.25 prior. “Fed funds futures on Monday have priced in a 54.5% chance of a 50 basis-point (bp) rate hike at the Fed's policy meeting next month. The fed funds rate is seen hitting roughly 3.6% by the end of the year, with a peak rate of nearly 3.8% in March 2023,” mentioned Reuters following the latest market data.
Elsewhere, Russia’s unscheduled maintenance of the Nord Stream 1 pipeline unveiled a blow to the struggling Eurozone economy amid the energy crisis, which in turn underpins the US dollar’s safe-haven demand.
Against this backdrop, the S&P 500 Futures print mild gains even as Wall Street closed in the red.
Looking forward, the first readings of the UK’s S&P Global PMIs for August hint at softer prints and hence a positive surprise can be welcomed to extend the GBP/USD pair’s latest rebound. However, the Bank of England’s (BOE) pessimism and the hawkish Fed concerns keep the pair bears hopeful.
Technical analysis
A downward sloping trend channel from May 13, currently between 1.1630 and 1.2220, keeps GBP/USD bears hopeful of further declines. The corrective pullback, however, may approach the convergence of the 21-DMA and 50-DMA, around 1.2080 if managed to cross June’s low of 1.1933.
- Gold price is aiming to overstep the immediate hurdle of $1,740.00.
- Lower estimates for the US Durable Goods Orders data are supporting the gold prices.
- Fed’s guidance on interest rates at Jackson Hole will be keenly watched.
Gold price (XAU/USD) is attempting a break above $1,740.00 on lower estimates for US Durable Goods Orders data. Earlier, the precious metal rebounded sharply after printing a fresh monthly low of $1,727.85 on Monday. The pullback move seems less lucrative due to the unavailability of momentum in the upside move, therefore the gold prices will remain on the tenterhooks.
The downbeat preliminary estimates for the US Durable Goods Orders have supported the yellow metal. As per the market consensus, the economic data is expected to scale down vigorously to 0.5% from the prior release of 2%. It is worth noting that core price pressures remained steady in the last reading at 5.9%. Therefore, the Durable Goods Orders data should remain the same or go through a minor change. However, a serious decline in the economic data indicates a plunge in the overall demand.
Apart from that, the commentary from Federal Reserve (Fed) chair Jerome Powell at Jackson Hole Economic Symposium will remain in limelight. Fed Powell will dictate the economic situation in the US and guidance on inflationary pressures and interest rates.
Gold technical analysis
On an hourly scale, gold prices are aiming to extend their recovery after rebounding from 61.8% Fibonacci retracement (placed from July 21 low at $1,680.91 to August 10 high at $1,807.93) at $1,729.44. The precious metal has challenged the 20-period Exponential Moving Average (EMA) at $1,738.00 and a break above the same could turn the short-term trend into a bullish trajectory.
Also, the Relative Strength Index (RSI) (14) has shifted into the 40.00-60.00 range from the bearish range of 20.00-40.00, which indicates that the gold prices are not bearish now.
Gold hourly chart
Analysts at Societe Generale predict that a poor Germany’s Preliminary S&P Global Manufacturing is likely to keep the EUR/USD pair pressured below the parity mark, as it would mean that the German economy is on the brink of a recession.
Key quotes
“In Europe, national surveys have been stronger than the PMI data, which may give some hope for a stronger figure, but in Germany, gas prices, the water level in the Rhine and inflation are having a devastating impact on business confidence.”
“A very bad German PMI might be enough to cement EUR/USD under parity, even if other countries fare better.”
- USD/CAD renews intraday low as bulls take a breather at five-week high.
- WTI crude oil rises for the second consecutive day as USD pares recent gains, OPEC flashes mixed signals.
- US PMIs will be important but Powell’s speech at Jackson Hole Symposium is the key.
- Bulls can keep reins amid recession woes, hawkish Fed bets.
USD/CAD takes offers to renew intraday low near 1.3030 during early Tuesday morning in Europe. In doing so, the Loonie pair retreats from a monthly high to snap a five-day uptrend.
US Dollar Index (DXY) traces sluggish yields amid an inactive market session to consolidate recent gains. The greenback’s positioning could also be linked to the lack of major data/events, as well as the cautious mood ahead of today’s preliminary readings of the US PMIs for August and Friday’s speech from Fed Chair Jerome Powell at the annual Jackson Hole Symposium.
It’s worth noting that an increase in prices of Canada’s main export item, namely WTI crude oil also favors the USD/CAD sellers. That said, the black gold prices print 0.40% intraday gains around $91.00 during the two-day uptrend. The commodity’s latest gains could be linked to the hopes of more demand from China, amid expectations of more stimulus, as well as mixed comments from the global producers.
Bloomberg quotes Saudi Arabian Energy Minister Prince Abdulaziz bin Salman as saying, “the OPEC and its allies (OPEC+) may be compelled to reduce oil production, as the physical and futures markets get increasingly strayed away from fundamentals.”
Elsewhere, the US 10-year Treasury yields retreat from the monthly high of 3.04%, down nearly two basis points (bps) to 3.02% by the press time. The pullback in the benchmark US bond coupons could be linked to the absence of major catalysts, as well as mixed chatters surrounding the People’s Bank of China (PBOC). Recently, China's Securities Times reported that the PBOC may reduce RRR this year to compensate for medium-term lending facility (MLF) maturity. The article states that reserve requirement ratio (RRR) cuts may lower lending prime rates. It is with noting that this is a state-run agency reporting such opinions.
Amid these plays, the S&P 500 Futures print mild gains even as Wall Street closed in the red.
It should be noted, however, that the fears of global recession, powered by Europe and China, join hawkish Fed bets to keep the USD/CAD buyers hopeful. “Fed funds futures on Monday have priced in a 54.5% chance of a 50 basis-point (bp) rate hike at the Fed's policy meeting next month. The fed funds rate is seen hitting roughly 3.6% by the end of the year, with a peak rate of nearly 3.8% in March 2023,” mentioned Reuters following the latest Chicago Fed National Activity Index that improved to 0.27 in July, from a downwardly revised -0.25 prior.
Technical analysis
A sustained daily closing below the 50-DMA support near 1.2915 could allow USD/CAD bears to aim for the monthly low surrounding 1.2725. Until then, the Loonie pair remains capable of approaching an eight-month-old resistance line, near 1.3120 by the press time.
| Raw materials | Closed | Change, % |
|---|---|---|
| Silver | 18.988 | -0.19 |
| Gold | 1735.71 | -0.56 |
| Palladium | 1994.88 | -5.77 |
Japanese Foreign Minister Yoshimasa Hayashi said on Tuesday that “we should continue stringent measures against Russia.”
Additional quotes
Discussed Ukraine's situation with other ministers.
Will continue strong support for Ukraine.
Japan PM Fumio Kishida said we must secure a steady supply of energy.
Japan PM Kishida said to continue diplomatic measures including sanctions against Russia in accordance with G7.
Separately, the country’s Finance Minister Shunichi Suzuki also said that “we will continue to work with the G7 on sanctions against Russia and support for Ukraine.”
“Japan's sanctions have dealt a blow to Russia; there has been no discussion of new sanctions against Russia,” he added.
Related reads
-
USD/JPY traces yields to retreat from monthly high towards 137.00, ignores Japan PMI
-
US believes Russia is planning strikes on Ukraine infrastructure soon-official
- USD/JPY holds lower ground near intraday low, snaps five-day uptrend at one-month high.
- Japan’s Jibun Bank PMIs for August came in softer than expected and prior.
- Yields ease as traders brace for US PMIs, Jackson Hole Symposium.
- Risk catalysts will be crucial to follow as bulls remain hopeful amid recession woes, and hawkish Fed bets.
USD/JPY takes offers to renew intraday low around 137.20, extending the pullback from a monthly high during Tuesday’s Asian session, as market sentiment dwindles amid mixed signals and a cautious mood ahead of the key data/events. In doing so, the yen pair prints the first daily loss in six even as Japan’s activity data for August appear downbeat.
The preliminary readings of Japan’s Jibun Bank Manufacturing PMI for August dropped to 51.0 versus 51.8 expected and 52.1 prior. On the same line, the Jibun Bank Services PMI also declined to 49.2 from 50.3 in previous readings and 50.7 market consensus.
Elsewhere, the US 10-year Treasury yields retreat from the monthly high of 3.04%, down nearly two basis points (bps) to 3.02% by the press time.
The pullback in the benchmark US bond coupons could be linked to the absence of major catalysts, as well as mixed chatters surrounding the People’s Bank of China (PBOC). Recently, China's Securities Times reported that the PBOC may reduce RRR this year to compensate for medium-term lending facility (MLF) maturity. The article states that reserve requirement ratio (RRR) cuts may lower lending prime rates. It is with noting that this is a state-run agency reporting such opinions.
It should be noted that Japan’s readiness for further printing of money and Japanese exporters’ profit booking move seems to have also favored the USD/JPY pair’s latest pullback. “Japan's Ministry of Finance is set to request 26.9 trillion yen ($195.5 billion) for debt servicing in the fiscal year beginning in April 2023, Yomiuri newspaper reported on Tuesday,” per Reuters.
Even so, expectations of higher Fed rates and firmer US data join the geopolitical fears surrounding Russia and Ukraine to keep the USD/JPY buyers hopeful.
That said, the preliminary readings of the US PMIs for August will join the US New Home Sales for July and Richmond Fed Manufacturing Index for August to decorate today’s calendar. However, Fed Chair Jerome Powell’s speech at the Jackson Hole Symposium, up for publishing on Friday, will be crucial for clear directions.
Technical analysis
The 137.50-55 area challenges USD/JPY bulls targeting the yearly low marked in July around 139.40. However, sellers remain cautious until the quote stays beyond the 50-DMA support level of 135.57, especially amid the bullish MACD signals and firmer RSI (14).
In response to written questions from Bloomberg News, Saudi Arabian Energy Minister Prince Abdulaziz bin Salman said that the OPEC and its allies (OPEC+) may be compelled to reduce oil production, as the physical and futures markets get increasingly strayed away from fundamentals.
Key quotes
“The paper and physical markets have become increasingly more disconnected.
“Futures prices don’t reflect the underlying fundamentals of supply and demand, which may require the group to tighten production when it meets next month to consider output targets.”
“Witnessing this recent harmful volatility disturb the basic functions of the market and undermine the stability of oil markets will only strengthen our resolve.”
Market reaction
WTI is cheering these above comments, currently trading at $91.02, adding 0.62% on the day.
- USD/CNH, a break below 6.8485 could be a significant turning point in the currency.
- Near term, 6.8600 needs to hold in a break of trendline support.
China's yuan slumped to its lowest level since July on Monday with Beijing stepping up its easing measures in the wake of an economic crisis and the resurgence of COVID-19 that has led to economic crippling lockdowns. However, in trade on Tuesday, the bears are taking on the bulls across US dollar pairs and CNH is making a comeback.
At the time of writing, USD/CNH is trading at 6.8650, flat compared to the prior session but heading lower from the highs nonetheless. The price has fallen from a high of 6.8743 to a low of 6.8625. Meanwhile, there are opinions circulating that more cuts are to come. After a monthly meeting, the PBOC lowered the one-year loan prime rate by 5 basis points to 3.65% from 3.7%, while the five-year rate was cut by 15 basis points to 4.3% from 4.45%, reducing the cost of payments on existing loans. However, the news that policymakers have trimmed lending rates was taken as only a minor positive due to the deepening troubles in the economy.
''We also do not expect either of these cuts to move the needle as far as the economy is concerned, with GDP growth still on track to fall below the official "around 5.5%" target. In particular, the housing market will need much more significant policy action to reverse current pressures,'' analysts at TD Securities argued.
In trade today, China's Securities Times reported that China may reduce RRR this year to compensate for MLF maturity. The article states that RRR cuts may lower lending prime rates. It is with noting that this is a state-run agency reporting such opinions. Meanwhile, widening policy divergence between the US and China, along with worries over weaker economic fundamentals, raised the risks of capital outflows which could be a continued weight on the yuan and supportive of the greenback in light of such opinions from the state media news company.
USD/CNH H1 chart

The price could be on the verge of a move beyond support levels should the US dollar blow off to the downside. That being said, the Jackson Hole could offer a hawkish surprise and traders could be reluctant to bet against such a scenario. Nevertheless, there is time for moves in the markets and a break below 6.8485 could be a significant turning point in the currency. Near term, 6.8600 needs to hold in a break of trendline support.
Analysts at JP Morgan provide their outlook on FOMC monetary policy meeting scheduled next in September.
Also read: Fed to slow to 50 bps hike in September as recession fears grow – Reuters poll
Key quotes
“We expect another outsized Fed hike in September, but post that we would look for the Fed not to surprise the markets on the hawkish side again.”
“Expect the trade-off between growth and monetary policy to improve from here, which will assist the overall market to keep recovering.”
- AUD/USD consolidates recent losses at monthly low, picks up bids to refresh daily top of late.
- RSI, MACD favor corrective pullback from the key Fibonacci retracement level.
- Weekly resistance line, 200-SMA restrict recovery moves before month-start peak.
AUD/USD renews intraday high around 0.6900 as bears take a breather during Tuesday’s Asian session.
The Aussie pair’s recovery takes clues from the RSI (14) rebound from the oversold territory, as well as the bullish MACD signals.
However, a week-long downward sloping resistance line precedes the 200-SMA to test the AUD/USD bulls respectively around 0.6910 and 0.6925.
Following that, the pair’s upward trajectory towards the early-month high of 0.7048 can’t be ruled out. Though, the 0.7000 threshold may act as an intermediate halt during the anticipated run-up.
Meanwhile, the 61.8% Fibonacci retracement level of July-August upside, near 0.6850, restricts short-term AUD/USD declines.
Also acting as short-term support is a descending trend line from August 10, close to 0.6815 by the press time.
In a case where the Aussie bears dominate past 0.6815, the 0.6800 round figure and the previous monthly low near 0.6680 could flash on their radar.
Overall, AUD/USD remains on the bear’s watch list unless the quote breaks the 0.6925 hurdle.
AUD/USD: Four-hour chart

Trend: Bearish
- Market sentiment remains divided even as stock futures, yields pare recent moves.
- Recession fears, hawkish Fed bets underpin risk-aversion wave.
- Headlines surrounding Russia exert fresh pressure on sentiment.
- Preliminary readings of August PMIs will decorate intraday calendar, Powell’s speech at Jackson Hole is the key.
The risk profile remains sour, despite the latest inaction, as recession woes join the increased expectations of the Fed’s aggressive rate hikes. It’s worth noting that the absence of major data/events, as well as the cautious mood ahead of the monthly PMIs, seem to have allowed the bears to take a breather during early Tuesday in Asia.
That said, the US 10-year Treasury yields retreat from the monthly high of 3.04% while the S&P 500 Futures dribble around a two-week low, down 0.16% intraday near 4,145 by the press time. With this, the US Dollar Index retreats from a six-week high flashed the previous day, down 0.08% around 108.88 by the press time, whereas prices of gold and WTI crude oil print mild gains.
The recently escalating geopolitical tension surrounding Russia and Ukraine joins increasing hawkish Fed bets to keep optimists off the table despite the latest pause in the risk-off mood. The corrective move is likely to have taken clues from China as the local media hints at more stimulus from the People’s Bank of China (PBOC). Also likely to favor the moves could be the consolidation ahead of today’s preliminary readings of the US PMIs for August, as well as a speech from Fed Chair Jerome Powell at the annual Jackson Hole Symposium.
Recession woes gained momentum after Russia’s unscheduled maintenance of the Nord Stream 1 pipeline unveiled a three-day blow to the struggling Eurozone economy amid the energy crisis.
While justifying the same, a monthly report from Bundesbank mentioned that a recession in Germany is increasingly likely. The report also suggested that inflation will continue to accelerate and could peak at more than 10%. Before that, Bundesbank President, as well as the European Central Bank (ECB) policymaker, Joachim Nagel mentioned that the ECB must keep raising interest rates even if a recession in Germany is increasingly likely, as inflation will stay uncomfortably high all through 2023.
On the other hand, strong US activity data helped Reuters to cite hawkish Fed bets. Chicago Fed National Activity Index improved to 0.27 in July, from a downwardly revised -0.25 prior. “Fed funds futures on Monday have priced in a 54.5% chance of a 50 basis-point (bp) rate hike at the Fed's policy meeting next month. The fed funds rate is seen hitting roughly 3.6% by the end of the year, with a peak rate of nearly 3.8% in March 2023,” mentioned Reuters following the latest market data.
It should be observed that the market’s latest move need validation and hence shouldn’t be relied upon as a trend change signal ahead of the key data/events.
In recent trade today, the People’s Bank of China (PBOC) set the yuan (CNY) at 6.8523 vs. the last close of 6.8477.
About the fix
China maintains strict control of the yuan’s rate on the mainland.
The onshore yuan (CNY) differs from the offshore one (CNH) in trading restrictions, this last one is not as tightly controlled.
Each morning, the People’s Bank of China (PBOC) sets a so-called daily midpoint fix, based on the yuan’s previous day's closing level and quotations taken from the inter-bank dealer.
- Oil prices have scaled to near $91.00 on growing supply worries after OPEC signaled production cuts.
- PBOC’s dovish stance on PLR will improve the oil demand in China ahead.
- Fed chair Jerome Powell may discuss a slowdown in the pace of hiking interest rates at Jackson Hole.
West Texas Intermediate (WTI), futures on NYMEX, has extended its gains to near $91.00 after overstepping the psychological resistance of $90.00. The oil prices are eyeing a break above their immediate hurdle of $91.62 for a fresh bullish impulsive wave.
Investors have gung-ho over black gold as OPEC has signaled a cut in its total production to offset the recent drop in oil prices. No doubt, the oil cartel has ways and means to tackle the oil-related challenges. Therefore, to push oil prices relatively higher, OPEC will scale down the production as required. It is worth noting that the oil prices fell around 33% from their yearly high of $127.00, recorded in March.
On the demand front, declining PMI numbers from Japan and Australia are indicating an economic slowdown in the Asia-Pacific region. The economic data has remained downbeat. This indicates that the oil demand has remained subdued earlier. Time ahead, the demand for oil in China is expected to rise as the People’s Bank of China (PBOC) has come forward with a dovish stance on the Prime Lending Rate (PLR). The central bank has trimmed the one-year and five-year PLR by 5 and 15 basis points (bps) respectively.
This week, the Jackson Hole Economic Symposium will be of utmost importance. Considering the evidence of exhaustion in the price pressures and accelerating consequences of hiking interest rates vigorously by the Federal Reserve (Fed), Fed chair Jerome Powell will discuss a slowdown in the pace of hiking interest rates looks likely.
- GBP/USD bears need a break of 1.1750 or face continued [presence from the bulls.#
- The bulls are attempting to correct through near-term hourly resistances.
GBP/USD bulls have sprung to life as the US dollar is faded across the board. The pair has been in a strong downtrend of late and the following illustrate the prospects of a bullish correction on the weekly chart, although leaves the door open for a move lower from an hourly basis also.
GBP/USD weekly chart

The M-formation on the weekly chart is a reversion pattern that would be expected to see the price drawn into the neckline, or thereabout, in due course. The tide is with the bear overall, however, so the 38.2% Fibonacci could well be the spot where bears could reemerge from.
GBP/USD H1 chart

The price is penetrating near-term resistance on the hourly chart, which tips the balance over to the bulls, for now. However, should the bulls fail to close above there, then this will open prospects of a move lower yet again, as illustrated. A break of 1.1750 will be key in such a scenario.
- EUR/USD picks up bids to refresh intraday high but stays near the lowest levels since December 2002.
- Oversold RSI hints at short-term rebound but weekly resistance line, 21-DMA guard recovery.
- Key FE levels, multi-day-old support line challenge bears below 0.9850.
EUR/USD renews intraday high near 0.9950 as it consolidates recent losses at the lowest levels in nearly 20 years during Tuesday’s Asian session. In doing so, the major currency pair justifies oversold RSI (14) as the bulls retreat.
It’s worth noting, however, that the weekly resistance line and the 21-DMA, respectively near 1.0100 and 1.0170, could challenge the EUR/USD buyers.
Even if the EUR/USD price manages to rise past 1.0170, the monthly high of 1.0370 will be crucial to watch for the pair buyers.
Alternatively, a daily closing beneath the yearly low surrounding 0.9950 becomes necessary for the EUR/USD bears to keep reins.
Following that, a southward trajectory towards the 61.8% Fibonacci Expansion (FE) of May-August moves, near 0.9850, could entertain sellers.
If at all the EUR/USD remains bearish past 0.9850, a convergence of the downward sloping support line from May 13 and the 78.6% FE, around the 0.99700 threshold, appears a tough nut to crack for the pair sellers.
EUR/USD: Daily chart
Trend: Further weakness expected
- The DXY is eyeing recapturing its 19-year high at 109.30 as investors turn risk-averse ahead of Jackson Hole.
- The Fed is expected to discuss the 50 bps rate hike this time.
- A downbeat US Durable Goods Orders data may halt the DXY’s rally.
The US dollar index (DXY) is on the verge of giving an upside break of the consolidation formed in a narrow range of 108.86-109.10. The DXY is aiming to recapture its fresh 19-year high at 109.29, which was earlier recorded last month. As anxiety over the commentary from Federal Reserve (Fed) chair Jerome Powell at Jackson Hole Economic Symposium is accelerating, investors are hiding behind the mighty DXY.
Guidance on policy rates at Jackson Hole
In the commentary from Fed chair Jerome Powell over the economic situation of the US, price pressures, and the consequences of liquidity shrinkage in the economy, investors will keenly focus on policy guidance. The investing community is aware of the evidence of exhaustion in the price pressures. Therefore, the Fed is expected to scale down its hawkish tone and will discuss a rate hike by half a percent in September.
Downside estimates for US Durable Goods Orders
As per the preliminary estimates, the US Durable Goods Orders data is expected to trim drastically to 0.5% from the prior release of 2%. The market participants are aware of the fact that the US core Consumer Price Index (CPI) remained steady at 5.9%. Despite that, a slump in the Durable Goods Orders indicates a decline in the overall demand. An occurrence of the same could bring significant offers for the DXY.
Key data this week: S&P Global Purchase Managers Index (PMI), New Home Sales, Durable Goods Orders, Pending Home Sales, Gross Domestic Product (GDP) (Preliminary), Initial Jobless Claims, and Core Personal Consumption Expenditure (PCE).
Major events this week: Jackson Hole Economic Symposium
| Index | Change, points | Closed | Change, % |
|---|---|---|---|
| NIKKEI 225 | -135.83 | 28794.5 | -0.47 |
| Hang Seng | -116.05 | 19656.98 | -0.59 |
| KOSPI | -30.19 | 2462.5 | -1.21 |
| ASX 200 | -67.6 | 7046.9 | -0.95 |
| FTSE 100 | -16.61 | 7533.79 | -0.22 |
| DAX | -313.95 | 13230.57 | -2.32 |
| CAC 40 | -117.09 | 6378.74 | -1.8 |
| Dow Jones | -643.13 | 33063.61 | -1.91 |
| S&P 500 | -90.49 | 4137.99 | -2.14 |
| NASDAQ Composite | -323.65 | 12381.57 | -2.55 |
- Gold price remains pressured at one-month low, down for the seventh consecutive day.
- Risk-aversion underpins the US dollar ahead of Fed Chair Powell’s Jackson Hole appearance on Friday.
- Market fears escalate on Russia’s Nord Stream 1 pipeline’s maintenance, US intelligence report.
- Monthly PMIs could entertain traders, bears are likely to keep the reins.
Gold price (XAU/USD) fades the late Monday’s corrective pullback from a monthly low as sellers tighten grinds during Tuesday’s Asian session. In doing so, the yellow metal bears the burden of the firmer US dollar amid the market’s rush for risk safety.
US Dollar Index (DXY) rose to the six-week high the previous day, and also printed a four-day uptrend, amid fears of recession and increasing hawkish Fed bets. Recently helping the XAU/USD bears are chatters surrounding Russia’s likely aggressive invasion of Ukraine’s infrastructure.
Reuters quotes an anonymous US official to mention that Russia is preparing strikes on Ukraine's infrastructure in the coming days. Meanwhile, the New York Times (NYT) reported that the US is sending more weapons to Ukraine to aid counterattack.
Elsewhere, Russia’s unscheduled maintenance of the Nord Stream 1 pipeline unveiled a blow to the struggling Eurozone economy amid the energy crisis. The fears grew stronger as the firmer US data indicated the Fed’s aggression.
Germany’s monthly report from Bundesbank signaled that a recession in Germany is increasingly likely while also suggesting that inflation will continue to accelerate and could peak at more than 10%. Before that, Bundesbank President, as well as the European Central Bank (ECB) policymaker, Joachim Nagel mentioned that the ECB must keep raising interest rates even if a recession in Germany is increasingly likely, as inflation will stay uncomfortably high all through 2023. On the contrary, German Economy Minister Robert Habeck stated, “A good chance to get through winter without drastic energy measures.”
Talking about the US data, Chicago Fed National Activity Index improved to 0.27 in July, from a downwardly revised -0.25 prior.
“Fed funds futures on Monday have priced in a 54.5% chance of a 50 basis-point (bp) rate hike at the Fed's policy meeting next month. The fed funds rate is seen hitting roughly 3.6% by the end of the year, with a peak rate of nearly 3.8% in March 2023,” mentioned Reuters following the latest market data.
Against this backdrop, S&P 500 Futures print mild gains as traders lick their wounds after Wall Street saw the red and the yields rose to a fresh monthly high.
To sum up, the gold price stays on the bear’s radar amid a firmer US dollar. However, the greenback’s further advances hinge on this week’s speech from Fed Chair Jerome Powell at the annual Jackson Hole Symposium, up for release on Friday. It should be noted that preliminary readings of the US PMIs for August may entertain intraday traders.
Technical analysis
Gold price extends the previous week’s downside break of the 21-DMA amid bearish MACD signals.
Given the safe distance of the RSI (14) from the oversold territory, the XAU/USD is likely to extend the latest south-run towards a five-week-old horizontal support area surrounding $1,715-13.
However, the yearly low and a downward sloping support line from mid-May, respectively around $1,680 and $1,630, could challenge the metal bears afterward.
On the flip side, a one-week-old resistance line, close to $1,745 at the latest, guards the short-term XAU/USD rebound ahead of the 21-DMA hurdle of $1,767.
Following that, a 10-week-long resistance line, near $1,790 at the latest, becomes crucial to watch for the gold buyers.
Gold: Daily chart

Trend: Further weakness expected
- AUD/NZD is likely to slip lower to 1.1120 amid poor Aussie PMI data.
- The Manufacturing PMI landed at 54.4 while the Services PMI was released at 49.6.
- Going forward, investors' focus will remain on the NZ Retail Sales data.
The AUD/NZD pair is facing barricades around 1.1140 in the Asian session. The asset is displaying exhaustion after printing a three-week high of 1.1151 last week. The cross is expected to display a sheer downside move after violating the immediate support of 1.1130 as the IHS Markit has reported a downbeat Aussie Purchase Managers Index (PMI) data.
The S&P Global Manufacturing PMI slipped sharply to 54.5 from the expectations of 57.3 and the prior release of 55.7. While the Services PMI data landed lower to 49.6 against the estimates of 54 and the former release of 50.9. The downbeat PMI data has weakened the aussie bulls. No doubt, the poor PMI data could be the consequence of the rising Official Cash Rate (OCR) by the Reserve Bank of Australia.
In order to tame the soaring price pressures, RBA Governor Philip Lowe has already raised the OCR to 1.85% by announcing three 50 basis points (bps) rate hikes consecutively. The sudden unavailability of cheap money in the aussie zone has trimmed the overall economic activities.
On the kiwi front, investors are awaiting the release of the NZ Retail Sales, which are due on Wednesday. The economic data was recorded at -0.5% for the first quarter of CY2022. Considering the soaring price pressures, the economic data should land higher as payouts for households have increased tremendously. In case of a decline in the economic data, investors will prefer to dump the kiwi dollar due to a slowdown in the overall demands.
| Pare | Closed | Change, % |
|---|---|---|
| AUDUSD | 0.68753 | 0.05 |
| EURJPY | 136.716 | -0.45 |
| EURUSD | 0.99433 | -0.91 |
| GBPJPY | 161.705 | -0.04 |
| GBPUSD | 1.17634 | -0.49 |
| NZDUSD | 0.61673 | -0.1 |
| USDCAD | 1.30521 | 0.43 |
| USDCHF | 0.96339 | 0.51 |
| USDJPY | 137.494 | 0.47 |
The US has intelligence that Russia is preparing strikes on Ukraine's infrastructure in the coming days, according to a US official.
.“We have information that Russia is stepping up efforts to launch strikes against Ukraine’s civilian infrastructure and government facilities in the coming days. Given Russia’s track record in Ukraine, we are concerned about the continued threat that Russian strikes pose to civilians and civilian infrastructure," the official said.
Meanwhile, the US is sending more weapons to Ukraine to aid counterattack according to the New York Times. The newly announced US shipment of weaponry includes armoured vehicles that can clear minefields ahead of major ground movements, an article stated.


© 2000-2026. Sva prava zaštićena.
Sajt je vlasništvo kompanije Teletrade D.J. LLC 2351 LLC 2022 (Euro House, Richmond Hill Road, Kingstown, VC0100, St. Vincent and the Grenadines).
Svi podaci koji se nalaze na sajtu ne predstavljaju osnovu za donošenje investicionih odluka, već su informativnog karaktera.
The company does not serve or provide services to customers who are residents of the US, Canada, Iran, The Democratic People's Republic of Korea, Yemen and FATF blacklisted countries.
Izvršenje trgovinskih operacija sa finansijskim instrumentima upotrebom marginalne trgovine pruža velike mogućnosti i omogućava investitorima ostvarivanje visokih prihoda. Međutim, takav vid trgovine povezan je sa potencijalno visokim nivoom rizika od gubitka sredstava. Проведение торговых операций на финанcовых рынках c маржинальными финанcовыми инcтрументами открывает широкие возможноcти, и позволяет инвеcторам, готовым пойти на риcк, получать выcокую прибыль, но при этом неcет в cебе потенциально выcокий уровень риcка получения убытков. Iz tog razloga je pre započinjanja trgovine potrebno odlučiti o izboru odgovarajuće investicione strategije, uzimajući u obzir raspoložive resurse.
Upotreba informacija: U slučaju potpunog ili delimičnog preuzimanja i daljeg korišćenja materijala koji se nalazi na sajtu, potrebno je navesti link odgovarajuće stranice na sajtu kompanije TeleTrade-a kao izvora informacija. Upotreba materijala na internetu mora biti praćena hiper linkom do web stranice teletrade.org. Automatski uvoz materijala i informacija sa stranice je zabranjen.
Ako imate bilo kakvih pitanja, obratite nam se pr@teletrade.global.
транcфери