- Analiza
- Novosti i instrumenti
- Vesti sa tržišta
Forex-novosti i prognoze od 27-05-2022
- The shared currency is about to finish the week with 1.66%.
- US Core PCE rose by 4.9% YoY, lower than March’s 5.1% reading; will the Fed diminish the speed of rate hikes?
- EUR/USD Price Forecast: Its long-term bias remains bearish, but a rally towards 1.0800 in the near term is on the cards.
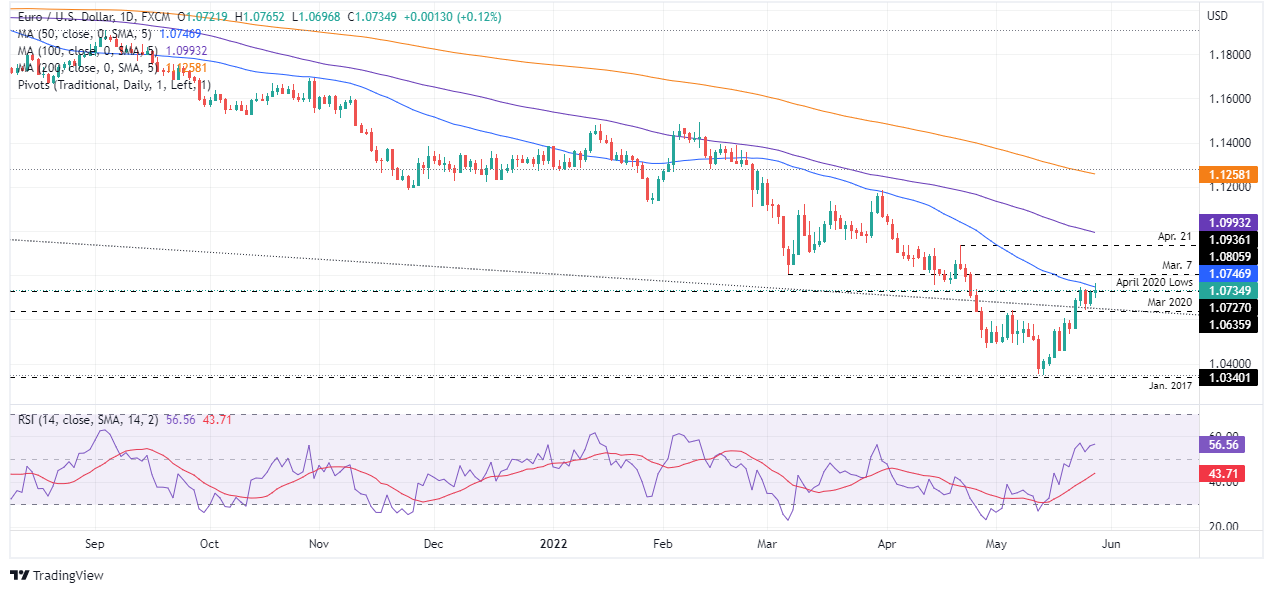
The EUR/USD reached a fresh four-week high, around 1.0765, but in the last hour, retreated some 30 pips, as the New York session wanes, on an upbeat trading session, courtesy of positive US data. At 1.0735, the EUR/USD is set to record weekly gains of 1.66% amidst a week full of ECB officials’ hawkish commentary and mixed US economic data.
US inflation eases some, and further ECB hawkish commentary lifts the EUR/USD
On Friday, the US Commerce Department unveiled inflation figures for the country. The Fed’s favorite gauge, the Core PCE for April, increased by 4.9% YoY, aligned with forecasts but lower than the March reading. That easied investors’ worries regarding an aggressive US central bank, with some of its members, like St. Louis Fed President James Bullard, expecting rates to finish in the 3.25-3.50% range.
In fact, during the week, Atlanta’s Fed President Raphael Bostic, usually a hawk, commented that once the Fed is done with 50 bps increases in the June and July meeting, it might pause as they assess the economy’s reaction.
In the meantime, the EUR/USD jumped on the release, towards 1.0750, though retraced the move, dipping towards 1.0700. However, in the middle of the North American session, the EUR/USD recovered some ground and settled above April’s 2020 lows of 1.0727.
Meanwhile, during the European session, the Bundesbank President and ECB member Joachim Nagel said that he believes the first-rate raise move should come in July, with more to follow in the second half of 2022. He added that inflation would not fall overnight, and it could take some time.
Next week, the Eurozone macroeconomic docket will feature Headline Inflation for Germany and the Euro area. Both headline figures are expected to rise to new highs, but core EU inflation is foreseen to fall to 3.4%. Another event triggering EUR/USD traders’ reaction would be the EU Council Meeting.
On the US front, the docket will reveal the May ISM Manufacturing and the Business related PMIs, Fed speakers, and employment data on the US front.
EUR/USD Price Forecast: Technical outlook
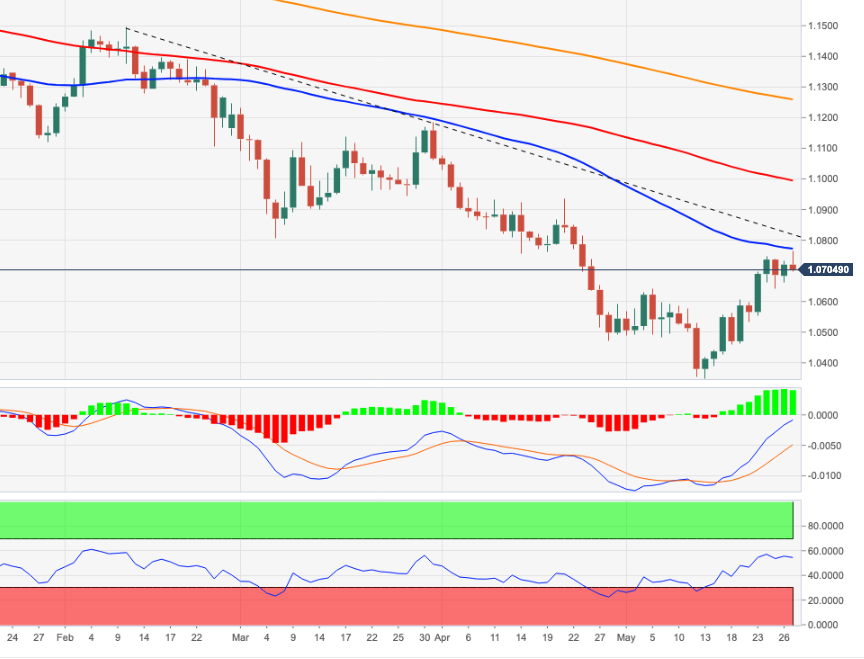
The EUR/USD advanced in the day and pierced the 50-day moving average (DMA) at 1.0746, pushing towards 1.0765 (new weekly highs). However, EUR/USD bulls’ failure to sustain the rally dragged spot prices below the abovementioned. However, they could remain hopeful as the Relative Strength Index (RSI) at 56 persists in bullish territory, aiming higher.
That said, the EUR/USD’s first resistance would be the 50-DMA. A break above would expose the March 7 low-turned-resistance at 1.0805, followed by April’s 21 high at 1.0936.
- The Australian dollar extends its weekly rally to two straight weeks, up 1.68%.
- The AUD/USD rises on positive Australian and US economic data as recession fears wane and expectations for a non-aggressive US Fed.
- Next week, the US economic docket will be busy and will feature releases of ISM PMIs, Fed speakers, and employment data to digest.
The Australian dollar reclaims the 0.7100 mark and records a fresh three-week high, up 0.83%. At 0.7159, the AUD/USD reflects the upbeat market sentiment amid the release of high US inflation, though ticking down from the March reading.
Investors cheered that US inflation is back below 5%, and US equities climb
Before Wall Street opened, the US Department of Commerce revealed that inflationary pressures in the US are still high but lower than in March. The Core Personal Consumption Expenditure (PCE), the Fed’s favorite inflation gauge, rose by 4.9% YoY, higher than the recorded in March of 5.1%. The market reacted positively to the news, turning towards riskier assets, as they discount that the Fed might pause or slow the pace of tightening conditions.
In the same release, consumer spending increased by 0.9% in April and beat the street’s forecast as consumers boosted purchases of goods and services, a sign that could underpin US economic growth in the Q2 amid increasing worries of a recession.
Elsewhere, during the Asian session, Australian Retail Sales for April rose by 0.9% as expected, marking a rise for four consecutive months, depicting the resilience of consumers, albeit a higher inflation reading, around 5.1% in the Q1.
The release of upbeat economic data for Australia and the US helped risk appetite. That triggered the so-awaited upside break on the AUD/USD, clearing the previous weekly high at 0.7126. As the North American session winds down, the AUD/USD settled in the mid-range of the 0.7100-0.7200 area.
In the week ahead, the Australian docket will feature the Real GDP for Q1. TD Securities analysts expect them to rise by 1.2%, higher than expected. They added that “Growth momentum probably slowed in Q1 as economic activity was interrupted by the Omicron wave and floods in Queensland and NSW. However, we think these shocks are temporary as domestic demand should be relatively resilient, as reflected in the strong Q1 retail sales outturn. We expect the RBA to make a bolder policy move in June as the economy is on a strong footing.”.
On the US front, the docket will reveal the May ISM Manufacturing and the Business related PMIs, Fed speakers, and employment data.
Key Technical Levels
- The Canadian dollar is recording goodish gains in the week of 0.85%.
- A positive market sentiment boosted the appetite for high-beta currencies, like the CAD.
- USD/CAD Price Forecast: To face solid support around 1.2694-1.2700.
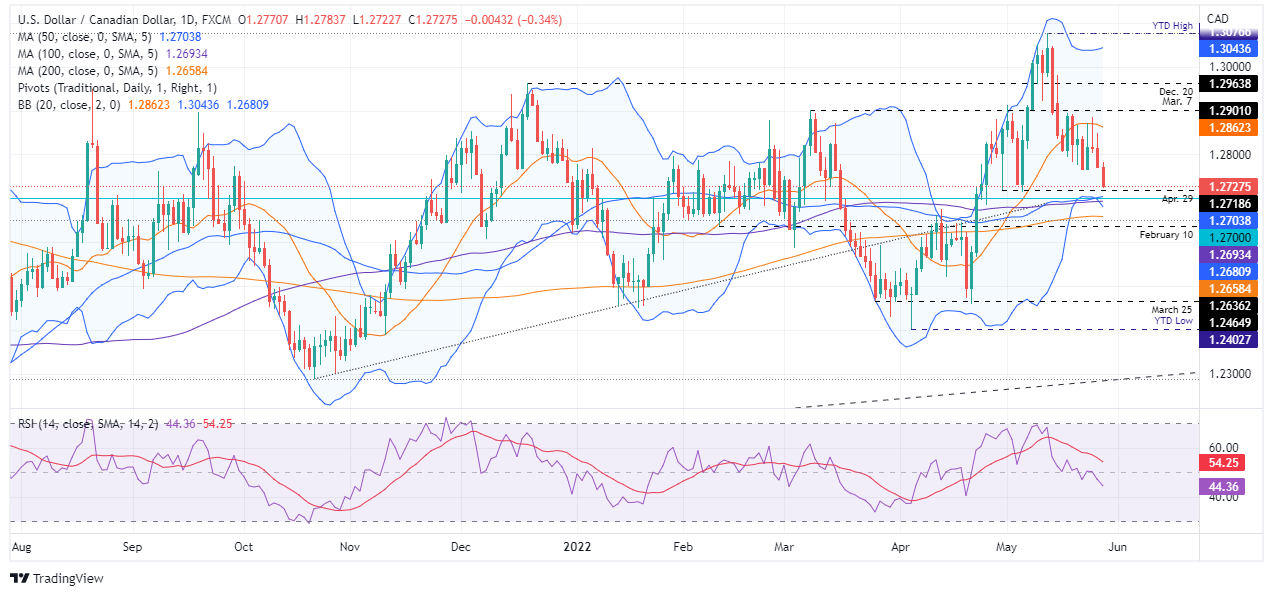
The USD/CAD edges lower in the North American session, extending its weekly losses for the third consecutive week as investors shrugged off an “aggressive” US Federal Reserve, as Core PCE rose to 4.9% but ticked down from 5.1% YoY. At the time of writing, the USD/CAD is trading at 1.2727.
US equities remain positive, reflecting a risk-on mood. The S&P 500 is about to erase its May losses, as the US Commerce Department informed that inflation increased at a slower pace than in March. Will the Fed slow the pace of hiking rates after reaching the 2% threshold?
Although inflation is heading lower, ING analysts noted that some factors lurk in the economic environment. First, the geopolitical backdrop keeps pushing energy prices higher. Second, China’s zero-covid policy slowed down the improvement in the supply chains, and thirdly, the tight labor market needs to mitigate a wage-price spiral.
Elsewhere, the USD/CAD on Friday began trading near the day’s highs at 1.2784 but slid towards three-week new lows around the 1.2720 area.
USD/CAD Price Forecast: Technical outlook
USD/CAD remains upward biased, though its two-week downtrend will face a solid support area in the 50 and the 100-day moving averages (DMAs), around the 1.2704-1.2693 area. Nevertheless, USD/CAD bulls need to be careful and not overconfident that the aforementioned level would hold. Why? The Relative Strength Index (RSI) at 44.29 is aiming lower, well within bearish territory, and with enough space before reaching oversold conditions.
If the USD/CAD two-week downtrend extends, the major’s first support would be the 1.2693-1.2704 area. Break below would expose the 200-DMA at 1.2658, followed by the April 22 low at 1.2566. On the flip side, the USD/CAD first resistance would be 1.2800. Once cleared, the following supply region would be the 20-DMA at 1-2862, followed by the March 8 high at.1.2901.
Key Technical Levels
- The USD/CHF is registering losses of 1.68% as the weekend looms.
- A risk-on market mood capped the USD/CHF fall as safe-haven appetite decreased.
- USD/CHF Price Forecast: If bulls are to regain control, a daily close above 0.9600 is needed.
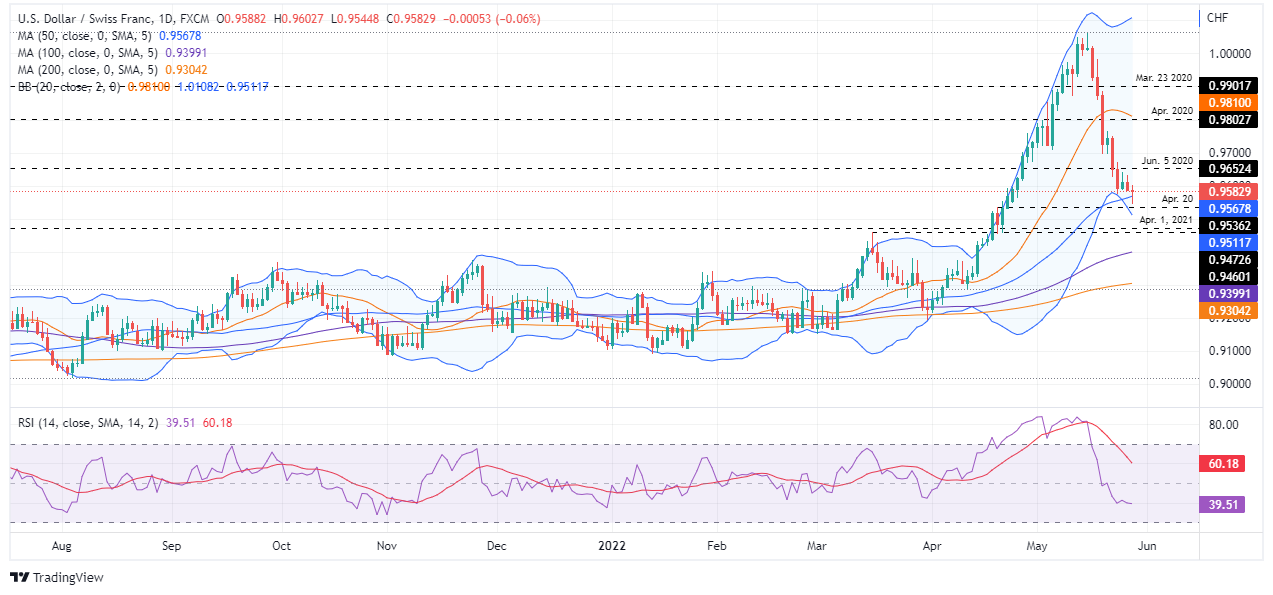
The Swiss franc is set to finish for the second consecutive week with hefty gains, as shown by the USD/CHF losing 1.68%. On Friday, in the North American session, the USD/CHF ticked down some 0.07%, trading at 0.9583 at the time of writing.
Sentiment remains upbeat, once the Fed’s favorite measure of inflation, although it came near 40-year highs, easied from the 5% threshold to 4.9% YoY. US equities are climbing during the day. Even the S&P 500 has almost pared its monthly gains in what seems to be a relief rally, as investors backpedaled from an “aggressive” Fed tightening cycle.
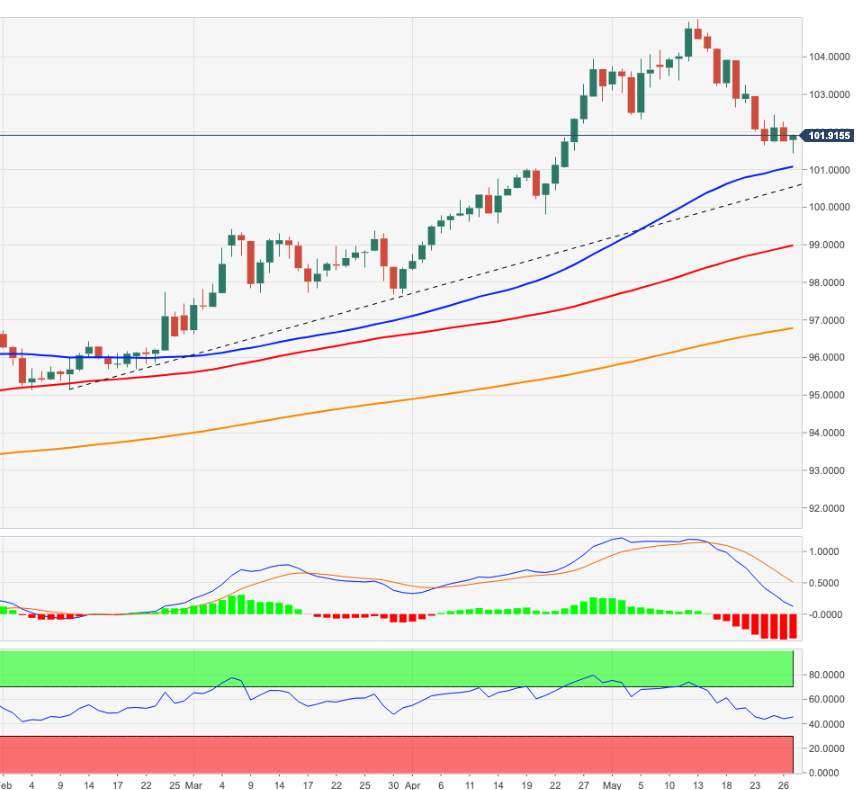
In the meantime, the US Dollar Index, a gauge of the greenback’s value, post-minimal gains of 0.05%, is sitting at 101.812. Contrarily US Treasury yields remain flat, led by the 10-year benchmark note, stationary at 2.749%.
USD/CHF Price Forecast: Technical outlook
Friday’s price action pushed the USD/CHF towards fresh five-week lows, near 0.9545 but bounced from under the 50-day moving average (DMA) around 0.9567, as USD/CHF bulls get ready to launch an assault towards 0.9600, so they can keep the uptrend intact. However, to their detriment, oscillators remain in bearish territory through directionless, opening the door for a consolidation.
Upwards, the USD/CHF first resistance would be 0.9600. Break above would open the door for additional supply zones. Firstly the May 26 daily high at 0.9632, followed by the June 5, 2020, high at0.9652. On the other hand, the USD/CHF first support would be the 50-DMA at 0.9567. Latter’s breach would expose the Bollinger’s band bottom band, at 0.9511, followed by a re-test of the 0.9500 figure.
Key Technical Levels
The USD/INR is about to end the week modestly lower, pulling back from record levels. The chart shows the primary trend is bullish and strong. According to analysts at Wells Fargo, the rupee will continue to decline versus the US dollar, at a gradual pace.
Key Quotes:
“The Indian rupee recently hit an all-time record low against the dollar, and going forward, we expect the currency to continue making new lows against the greenback. We believe the rupee will continue to weaken as the Reserve Bank of India (RBI) is likely behind the curve in tightening monetary policy.”
“While we forecast the RBI to lift interest rates again in June, we doubt RBI policymakers will be able to keep pace with the Federal Reserve.”
“As the Fed raises interest rates and shrinks its balance sheet, the U.S. dollar should rally against most emerging market currencies, including the rupee.”
“While we expect the rupee to consistently hit new lows, we believe the pace of depreciation will be gradual in nature. The RBI maintains a hefty stockpile of foreign exchange reserves and uses these asset buffers to limit rupee volatility. Recently, RBI FX intervention contained currency volatility, and going forward, we expect intervention efforts to continue to keep rupee depreciation orderly.”
- US dollar continues to pullback across the board.
- Yen loses momentum in the market amid risk appetite.
- USD/JPY fails to benefit from the rally in Wall Street.
The USD/JPY is about to end the week trading around 127.00. The pair bottomed on Tuesday at 126.35, the lowest level in five weeks and then rebounded finding resistance below 127.50. It is about to post the third weekly decline in a row.
The US dollar remains weak, and keeps correcting lower versus G10 currencies from multi-year highs. The improvement in risk sentiment boosted the retreat that was also driven by steady US yields.
The demand for Treasuries remained firm despite the rally in Wall Street. The S&P 500 is heading to a weekly gain of more than 5%. US yields edged lower during the week. The US 10-year yield stands at 2.74%, far from the 3.20% (May 9).
“In March, USD/JPY broke through 117 and moved sharply higher. IMM data shows Leveraged Funds’ short JPY position expanded over the following four weeks at the fastest pace in five years. Interestingly, despite the rally in risk this week USD/JPY has failed to rally and hit a new low on Tuesday. We continue to see downside risks over the coming weeks”, wrote analysts at MUFG Bank.
In the short-term, the bias in USD/JPY is tilted to the downside. A break under 126.50 should open the doors to more losses, targeting 126.20 and then 125.75. On the upside a recovery above 127.50 (horizontal resistance and downtrend line from recent top) should remove the negative bias.
Technical levels
- Gold aims to finish the week with decent gains of 0.37%.
- US Core PCE eases from 5.1% YoY, though remains at forty-year highs; will the Fed pause?
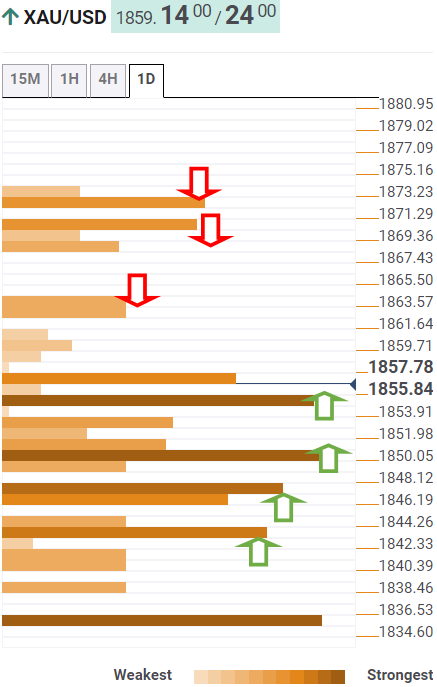
- Gold Price Analysis (XAU/USD): If Gold bulls reclaim $1870, a push towards $1900 is on the cards.
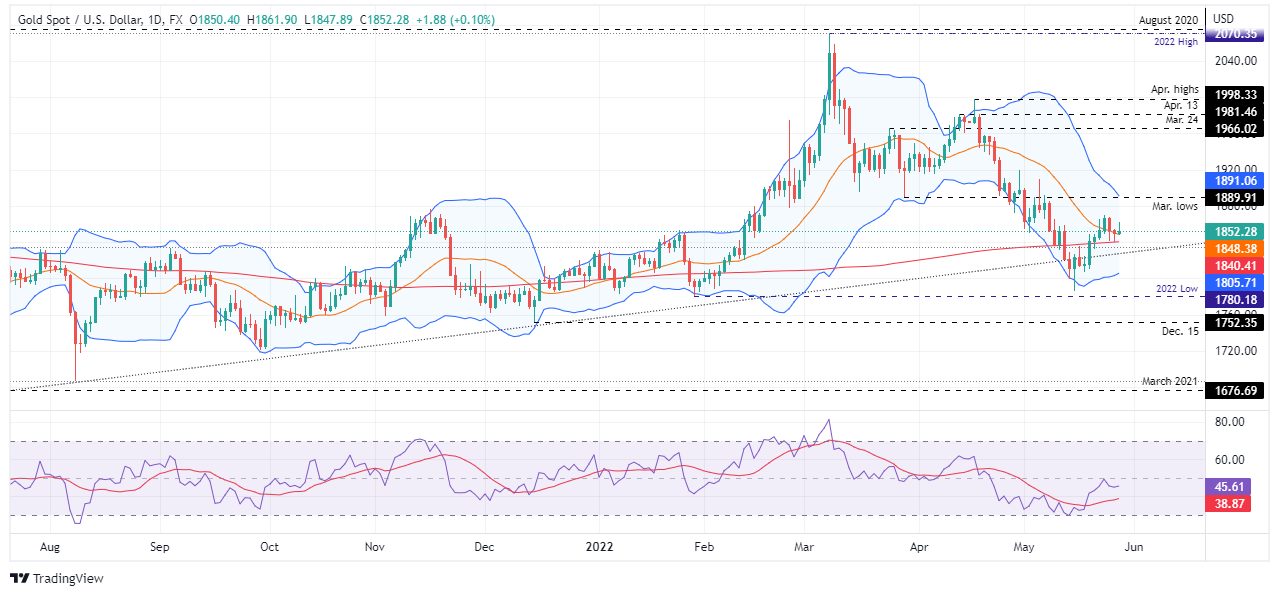
Gold spot (XAU/USD) climbs during the New York session but is still unable to challenge the weekly highs and remains glued to the 20-day moving average (DMA) near the $1848.48 area. At the time of writing, XAU/USD is trading at $1852.28 a troy ounce.
US Core PCE came aligned with expectations but lower than March’s reading
European and US equities continued rising amidst an upbeat market mood. The US Commerce Department released the Core Personal Consumption Expenditure (PCE), the Fed’s favorite inflation reading. Numbers came better than expected, showing that prices are still elevated but off the 5.1% highs, at 4.9% YoY.
Now that inflation appears to be easing from forty-years highs, will the Fed tighten conditions at a slower pace? Meanwhile, the Fed’s May minutes showed that all its members agreed to hike rates by 50 bps in each of the two-consecutive monetary policy meetings.
In the meantime, the US Dollar Index, a measure of the buck’s value vs. its peers, pares some early-day losses and is gaining some 0.07%, sitting at 101.827. Failure to reclaim above 102.500 would open the door for a re-test of the April 24 low at 99.818.
Contrarily to the USD gains, US Treasury yields showed that investors are scaling back from overpricing the US central bank rate hikes expectations. The US 10-year Treasury yield is almost flat in the day, posting minimal losses, down at 2.743%, a tailwind for the non-yielding metal, which benefits from lower yields.
Elsewhere, the US economic docket revealed additional data. Consumer spending rose 0.9% last month and beat estimations as consumers boosted purchases of goods and services, a sign that could underpin US economic growth in the Q2 amid increasing worries of a recession.
Gold Price Analysis (XAU/USD): Technical outlook
On Friday’s price action, Gold has reclaimed the 20-day moving average (DMA) at $1848.42, sitting above the $1850 mark. It’s worth noting that XAU/USD bears could not push prices below the 200-DMA, signaling that selling pressure might be easing, as shown by oscillators. The Relative Strenght Index (RSI) at 45.56 begins to aim higher. Even though it remains in bearish territory, an upslope keeps Gold bulls hopeful of lifting prices towards $1900.
That said, the XAU/USD first resistance would be $1869.61. Break above would send the spot towards the confluence of the Bollinger’s band top band and the March lows at around the $1889.91-1891.08 area. Once cleared, the next stop would be $1900.
Analysts at Wells Fargo forecast the AUD/USD pair at 0.7100 by the end of the second quarter, at 0.6900 by year-end and at 0.6800 by the first quarter of next year. They warn risks are tilted to the upside.
Key Quotes:
“After a steady rebound in growth in Q4-2021, labor market and activity trends during 2022 suggest solid economic fundamentals for Australia's economy amid building inflationary pressures.”
“The RBA raised its Cash Rate by 25 bps to 0.35% at its May monetary policy meeting, citing a resilient economy with inflation that has risen faster and higher than previously expected, as well as progress toward full employment and wage growth. The move surprised many market participants, given the consensus forecast for a hike of only 15 bps (…) The minutes indicated the RBA will review the size of its rate hikes again based on new information each month.”
“Our base case is for the Australian dollar to weaken moderately in the quarters ahead. However, we believe the risks are tilted to the upside, and it is possible that there will be a smaller decline in the currency than our base case forecast suggests.”
“More persistently elevated underlying inflation could prompt the Reserve Bank of Australia to raise rates faster than currently expected, which would be supportive of the currency.”
“In this more favorable scenario, the AUD/USD exchange rate might soften only moderately, perhaps not weakening much below the $0.6900 level.”
The EUR/USD is about to post end higher for the second weekly in a row, “notable gains” according to analysts at MUFG Bank. They point out that the bounce in the pair is very notable and is becoming more difficult to simply dismiss out of hand as just a temporary reversal.
Key Quotes:
“EUR/USD is heading for a second week of gains for the first time since April 2021. The percentage increase over the two-week period is close to 3%, which if we exclude the very volatile period during the period of covid, would be the largest two-week gain since February 2016 when the US dollar reversed course on the back of Fed communications suggesting a slower pace of monetary tightening in response to the financial crisis in China at that time.”
“Our current FX forecasts shows a low-point of 1.0400 in Q2 before a gradual increase through the second half of the year. The price action of late reinforces our view that the scope for notable further US dollar strength from here is becoming more limited.”
“There are risks that this current bounce in EUR/USD could fade and we could correct lower as financial conditions tighten again, risk aversion becomes more pronounced and there is a renewed flight to the dollar. We are mindful though that if those conditions do not materialise relatively soon, EUR/USD could rally further.”
“There are reasons for us to believe that US dollar strength could emerge again. While EUR/USD could drift lower again there are factors to suggest better support for EUR/USD is emerging. We remain sceptical of parity being hit.”
- Cable is about to post back-to-back weekly gains, up by 0.94%.
- The Fed’s favorite inflation gauge eases from above the 5% threshold, showing signs that elevated prices could be peaking soon.
- UK’s PM Boris Johnson said that the UK might avoid a recession.
- GBP/USD Price Forecast: If bulls fail to reclaim 1.2700, expect selling pressure to mount and send the pair towards a YTD low re-test.
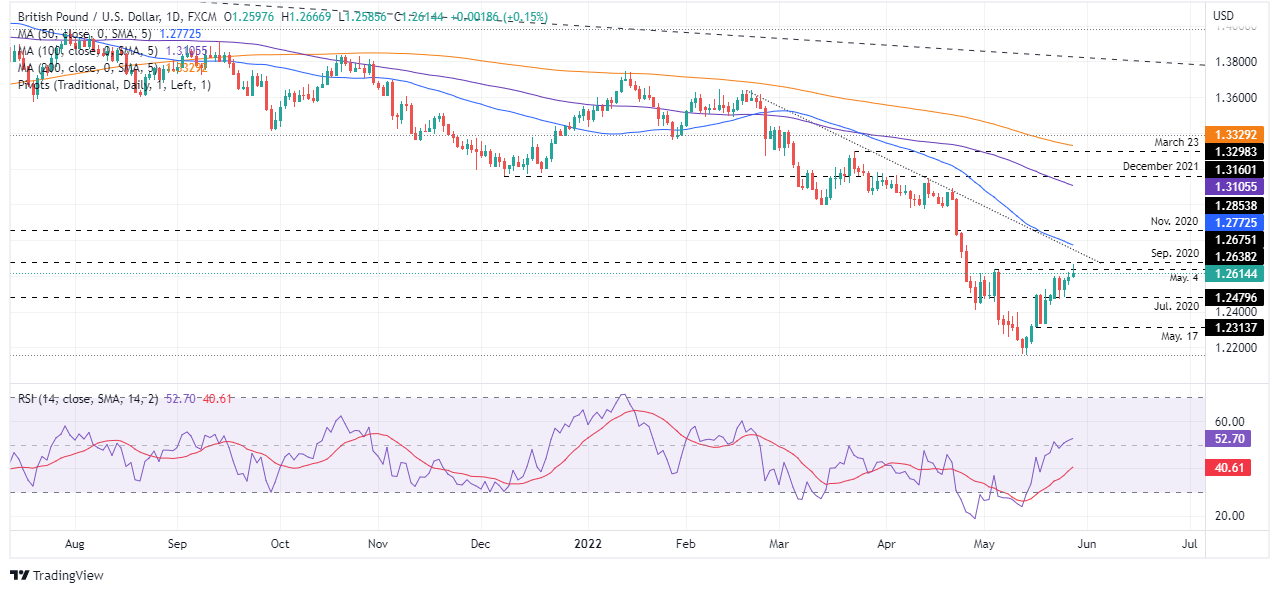
The British pound marches firmly during the last week’s trading day, gaining some 0.45% after the Commerce Department reported that the Fed’s preferred inflation gauge, the Core Personal Consumption Expenditure (PCE), rose by 4.9%, in line with estimations, but lower than 5.2% in March. At 1.2614, the GBP/USD keeps extending its gains during the North American session.
Global equities reflect a positive mood, climbing on Friday. Investors begin to shrug off worries that inflation will keep rising. Also, the pullback in core inflation could deter the Fed from hiking rates as aggressively as previously priced in by market players, which lifted the yield on the 10-year benchmark note to its YTD high at 3.20% earlier this month.
Before Wall Street opened, additional data was revealed. Consumer spending rose 0.9% last month and beat estimations as consumers boosted purchases of goods and services, a sign that could underpin US economic growth in the Q2 amid increasing worries of a recession.
Analyst of ING wrote in a note that the inflation reading is encouraging, though reiterated that bringing it back to its target will take a while. “We believe we need to see three conditions to get inflation to drop meaningfully quickly. Firstly, an improved geopolitical backdrop to get energy prices lower, which seems unlikely given Russia’s actions. Secondly, an improved supply chain environment, which also seems unlikely given China’s zero-Covid policy and the potential for strike action at US ports. Then thirdly, we would need to see a big increase in labor supply to mitigate surging labor costs, which again doesn’t seem on the cards just yet,” ING analysts added.
In the meantime, UK’s Prime Minister Boris Johnson commented that the UK could avoid a recession in the months ahead, despite UK’s last inflation report, popping up 9% at forty years high. Even the Bank of England is expecting a contraction in growth late in the year and a prolonged stagnation scenario.
Elsewhere, the US Dollar Index, a gauge of the greenback’s value vs. its peers, bounces off weekly lows and grinds higher by 0.10%, sitting at 101.850.
GBP/USD Price Forecast: Technical outlook
From a daily chart perspective, the GBP/USD remains downward biased. During the day, the major failed to break above the May 4 daily high at 1.2638 and pulled back towards 1.2610s, well below the daily moving averages (DMAs). However, the RSI shows some signs of turning bullish, but the GBP/USD bulls need to reclaim 1.2700 to shift the bias to neutral-upwards.
Failure to the above-mentioned would keep the pair vulnerable, sending the pair towards the May 20 daily low at 1.2436, followed by the May 17 lows at 1.2315, and the YTD low at 1.2155.
Key Technical Levels
Data released on Friday showed Persona Spending rose in April 0.9%, surpassing expectations. Analysts at Wells Fargo point out that for the first time since October 2021 income outpaced inflation. They forecast consumer spending will downshift over the next quarters.
Key Quotes:
“On the day after revised GDP numbers showed an even faster pace of consumer spending in the first quarter, fresh data today for April showed that momentum continued into the second quarter. Personal spending shot up 0.9% in the month and, after adjusting for inflation, real spending still added 0.7%; that comes on the heels of revisions that more than doubled March's real spending gain from 0.2% to 0.5%.
“Personal income rose 0.4% in April, with another solid gain in wages & salaries which are now over 15% above their pre-pandemic level. Once removing transfers and adjusting for inflation, real disposable personal income rose 0.02%. With this marking the first time in five months that income outpaced inflation, as expected the level of real disposable income looks to have bottomed in March.”
“We forecast consumer spending will downshift over the next several quarters, particularly as rate hikes begin to ratchet up the cost of credit. Even though we expect consumer spending to remain below trend throughout the forecast period, we do not look for sustained declines in outlays.”
- Mexican peso among top performers on Friday.
- USD/MXN trades at the lowest level since January 2021.
- Risk appetite, a weak dollar and a hawkish Banxico supports MXN's rally.
The USD/MXN is falling sharply on Friday, with the Mexican peso leading across the board. The pair tumbled to 19.56, reaching the lowest intraday level since January 2021.
The combination of technical factors, a weaker dollar, steady US yields, and risk appetite pushed USD/MXN further to the downside. It is headed toward the lowest weekly close since March 2020.
The break below the support area around 19.70 added weighed to the downside. The next critical support is seen at the 19.50 zone followed by 19.30. To alleviate the bearish pressure, the dollar needs to rise back above 19.90.
Equity markets are rising again on Friday. In Wall Street, the S&P 500 gains 1.64% and is up by more than 5% for the week. Main indices are about to post the first gain after falling for seven weeks in a row. The improvement in market sentiment boosted the demand for emerging market currencies.
The weaker dollar and steady yields also contribute to the slide in USD/MXN. The DXY is falling 0.15%, about to post the lowest daily close since April 25. At the same time, US yields remain steady, not reacting to risk appetite. The US 10-year stands at 2.72%, slightly above the weekly low.
Another positive factor for the Mexican peso was the “hawkish” minutes from Banxico’s latest meeting when it rose rates by 50 bp to 7%. “The minutes show that more policymakers were open to a larger move as another said it would reinforce the bank’s autonomy and have more impact on long-term inflation expectations,” explained analysts at Brown Brothers Harriman. The next board meeting is on June 23.
USD/MXN weekly chart
-637892607857292532.png)
- WTI has stabilised just below monthly highs near the $114 level, as bulls eye a push towards $120.
- Familiar themes of strong US demand, EU/Russia oil sanctions, OPEC+ output struggles and easing Chinese lockdowns are supporting prices.
- WTI looks set to end the week around $3.50 higher.
Oil prices have stabilised close to monthly highs on Friday, supported amid a strong end to the week for global risk assets and commodity markets, and with familiar supportive themes in focus. Front-month WTI futures were last trading ever so slightly in the red near the $114 per barrel mark, on course to post a weekly gain of just shy of $3.50. For now, earlier monthly highs in the $115s and late-March highs in the $116s are offering resistance.
Traders continue to cite expectations for strong US fuel demand as peak driving season there approaches and as US gasoline inventories continue to decline (weekly EIA data released on Wednesday showed another drop) as supportive to the price action. The EU’s plans to sanction Russian oil imports have also been in the headlines. The bloc is now reportedly working on a deal that would ban seaborne imports, but allow pipeline imports to continue in a bid to placate land-locked Hungary, the nation that has held things up until now.
EU officials reportedly think a deal on this could be reached by next week’s EU Council Summit meeting of EU 27 leaders. Commodity analysts expect fresh EU sanctions would be a major hit to Russian production, which has already dropped substantially since the start of its invasion of Ukraine back in February. Indeed, Russia accounted for around half of OPEC+’s 2.6M barrel per day (BPD) miss on its output target for April, a recent Reuters survey showed.
OPEC+ production woes are another factor being cited as supportive of crude oil prices by analysts at the moment. Aside from Russia, plenty of other smaller (mostly African) producers have struggled to keep up with output quota hikes in recent months. Only Saudi Arabia and the UAE really have any spare capacity to rapidly increase output and, despite Western pressures, they don’t seem to want to. Indeed, OPEC+ sources told Reuters earlier this week that the group would stick with its policy of lifting output quotas at a gradual, 432K BPD each month when they meet next week.
Elsewhere, the situation in China is less of a concern as of late. Though Beijing remains in lockdown, restrictions in Shanghai are soon set to be lifted and further improvement could provide further tailwinds for crude oil prices next week. Looking at WTI from a technical perspective, the commodity appears to have formed an ascending triangle below resistance in the $115-$116ish area.
Typically, these chart patterns precede a bullish breakout. Bullish fundamental developments in the form of an EU deal on Russian oil sanctions plus an improving demand outlook could combine with technical buying upon a break of resistance to send WTI towards $120 next week.
GBP/USD has tested key resistance at 1.2633/51. Analysts at Credit Suisse now look for a turn back lower from here.
Close above 1.2633/51 to trigger a deeper correction
“GBP/USD is still stalling around key resistance at the May high and 23.6% retracement of the entire fall from 2021 at 1.2633/51. Given both our bullish USD and bearish GBP view, we have a high level of conviction that the market will fail here and see an eventual resumption of the core downtrend.”
“Support is seen at 1.2482/39 initially, below which would confirm a small intraday top to turn the short-term risks back lower, with next support at 1.2338/29. Below here open up next support at 1.2218 and more importantly at 1.2167/57.”
“A close above 1.2633/59 would in contrast trigger an even deeper correction, with next resistance at the 38.2% retracement of the 2022 at 1.2766, then the crucial 55-day average at 1.2805, where we would have greater confidence in a ceiling if reached for a resumption of the broader downtrend.”
The University of Michigan's final estimate of US Consumer Sentiment fell to 58.4 in May from 65.2 in April, below the flash estimate released earlier this month of 59.1, data released on Friday revealed. Meanwhile, the Consumer Expectations index was revised lower to 55.2 from the flash estimate of 56.3, after coming in at 62.5 last month and the Current Conditions index was revised lower to 63.3 from 63.6, having printed 69.4 in April.
The 1-year measure of inflation expectations was also revised lower to 5.3% from the flash estimate and last month's reading of 5.4%.
Market Reaction
The data hasn't triggered a market reaction, but the revision lower to inflation expectations could weigh on the dollar a tad, as it further bolsters the "peak inflation" narrative that is in focus after Core PCE data showed an easing of US price pressures in April earlier in the day.
- USD/TRY comes under selling pressure, still above 16.00.
- Investors continue to digest the latest CBRT event.
- Focus now shifts to next weeks GDP and CPI figures.
USD/TRY now looks consolidative in the upper end of the recent range and trades close to recent yearly peaks near 16.50.
USD/TRY now looks to upcoming key data
The beleaguered Turkish currency manages to regain some buying interest and forces USD/TRY to recede to the negative territory for the first time after five consecutive daily advances on Friday. It is worth mentioning that the lira is down around 23% vs. the greenback so far this year.
Market participants, in the meantime, continue to assess Thursday’s reluctance to act on rates by the Turkish central bank despite inflation in the country is running at around 2-decades high (as per April figures).
Moving forward, investors are expected to shift their attention to next week’s release of Q1 GDP results (May 31) and inflation figures gauged by the CPI (June 3).
What to look for around TRY
USD/TRY keeps the upside bias well and sound and looks to consolidate the recent surpass of the 16.00 yardstick for the first time since late December 2021.
So far, price action in the Turkish currency is expected to gyrate around the performance of energy prices, the broad risk appetite trends, the Fed’s rate path and the developments from the war in Ukraine.
Extra risks facing TRY also come from the domestic backyard, as inflation gives no signs of abating, real interest rates remain entrenched in negative figures and the political pressure to keep the CBRT biased towards low interest rates remain omnipresent.
Eminent issues on the back boiler: FX intervention by the CBRT. Progress (or lack of it) of the government’s new scheme oriented to support the lira via protected time deposits. Constant government pressure on the CBRT vs. bank’s credibility/independence. Bouts of geopolitical concerns. Structural reforms. Upcoming Presidential/Parliamentary elections.
USD/TRY key levels
So far, the pair is losing 0.50% at 16.2508 and a breach of 14.6836 (monthly low May 4) would expose 14.5458 (monthly low April 12) and finally 14.5136 (weekly low March 29). On the upside, the initial hurdle lines up at 16.4554 (2022 high May 26) seconded by 18.2582 (all-time high December 20) and then 19.00 (round level).
S&P 500 pushed sharply higher yesterday. The 4091/4128 zone is key, as a break above here would similarly signal a deeper corrective recovery, economists at Credit Suisse report.
Risk of an eventual breakdown below 3855/15 stays elevated
“Key now going into the weekly close and month-end is the price high and gap at 4091/4128. Only a closing break above here would confirm a short-term base to signal a more profound recovery, which we would be inclined at this point to view as a ‘bear market rally’. If a base is confirmed, we would expect the market to extend the recovery to the 63-day average at 4277/4314.
“We would be inclined to view any recovery as corrective, as the medium-term technical picture is not particularly constructive. Therefore, the risk of an eventual breakdown below 3855/15 stays seen as elevated, with first near-term support seen at 3932/25, below which would remove the recent upward pressure.”
- NZD/USD is finishing a strong week positively and was last trading in the 0.6530s, up 0.9% on the day.
- The pair has rallied around 5.0% from monthly lows two weeks ago and is eyeing monthly highs in the 0.6560s.
- US inflation data on Friday supported the idea that US inflation is easing, weighing on the buck.
NZD/USD is on the front foot on Friday amid a strong end to what has, for the most part, been a strong week for risk assets and global commodity markets. The pair was last trading in the 0.6530s, up around 0.9% on the day, taking its gains on the week to around 2.0%, reflective of the fact that the kiwi has been one of this week’s best performing G10 currencies. The pair is eyeing a test of monthly highs in the 0.6560s.
Lifting the mood in recent trade and also somewhat weighing on the US dollar was US Core PCE inflation data for April that lent support to the idea that price pressures in the US have peaked, thus reducing the pressure on the Fed to tighten monetary policy quite so aggressively. But the kiwi has also derived support from domestic New Zealand factors this week, which go some way in explaining its outperformance versus most of the rest of its non-US dollar G10 peers.
The RBNZ raised interest rates by 50 bps to 2.0% as expected on Wednesday, but signaled a much more hawkish than expected path for interest rates in the quarters ahead, with the bank expecting to have lifted rates to nearly 4.0% in 2023. At this point, the RBNZ is comfortably the most hawkish central bank in the G10 and this has helped NZD/USD rebound around 5.0% in the last two weeks from earlier monthly lows in the low 0.6200s.
- A combination of supporting factors lifted AUD/USD to a fresh multi-week high on Friday.
- The technical set-up favours bullish traders and supports prospects for additional gains.
- Sustained break below the 0.7100 mark is needed to negate the constructive outlook.
The AUD/USD pair gained strong positive traction on the last day of the week and shot to over a three-week high, around mid-0.7100s during the early North American session.
Expectations that the US central could pause the current rate hike cycle later this year dragged the US Treasury bond yields to a multi-week low. This, along with a generally positive risk tone, undermined the safe-haven US dollar. This, in turn, benefitted the risk-sensitive aussie, which drew additional support from the Reserve Bank of Australia's hawkish signal earlier this week.
From a technical perspective, the recent recovery move from the YTD low along an upward sloping channel points to a well established short-term bullish trend. A subsequent move beyond the 38.2% Fibonacci retracement level of the 0.7662-0.6829 downfall, which coincided with the 200-period SMA on the 4-hour chart, favours bullish traders and supports prospects for additional gains.
The AUD/USD pair now seems all set to extend the momentum towards the 0.7200 round-figure mark en-route the 0.7235-0.7245 confluence hurdle. The latter comprises the 100-day SMA and the 50% Fibo. level. This is closely followed by the very important 200-day SMA, currently around the 0.7260 area, which if cleared decisively will set the stage for an extension of the appreciating move.
On the flip side, any meaningful pullback now seems to find decent support near the 0.7125 zone ahead of the 7100 round figure. A convincing break below might prompt aggressive technical selling and make the AUD/USD pair vulnerable. Spot prices could then test the 23.6% Fibo., around the 0.7030-0.7025 region before eventually dropping to the 0.7000 psychological mark.
Failure to defend the aforementioned support levels will shift the bias back in favour of bearish traders. The subsequent decline could drag the AUD/USD pair to the 0.6940 intermediate support en-route the 0.6900 mark and the YTD low, around the 0.6830-0.6825 region touched earlier this month.
AUD/USD 4-hour chart
-637892556315858985.png)
Key levels to watch
GBP/USD fluctuates in a relatively tight channel above 1.26 on Friday. Economists at Scotiatbank believe that cable is unlikely to see a push higher towards the 1.30 level.
The 1.26 figure zone is acting as solid support
“The 1.26 figure zone is acting as solid support ahead of yesterday’s low of ~1.2550.”
“Cable gains past the mid-1.26s face limited resistance until the next big figure with the 50-day MA of ~1.2775 following.”
“The UK macroeconomic backdrop and the global risk tone still mean a GBP return to 1.30 is unlikely.”
EUR sellers emerge in mid-1.07s. However, economists at Scotiabank expect the pair to inch higher towards the 1.08 figure.
Support aligns at 1.0700/10
“The EUR is still struggling somewhat to make a firm and sustained push above the mid-1.07s as it settles in a consolidation band of ~1.0650-1.0750 since Tuesday. But the higher highs, higher lows price action suggests gains extending towards 1.08 shortly once the mid-figure zone gives way”
“Around 1.08, the EUR faces key trendline resistance measured from mid-Feb.”
“Support is 1.0700/10 followed by 1.0660/65.”
“We spot resistance after the mid-1.07s at the daily high of 1.0765 and the 1.08 figure area.”
EURUSD is now very close to a series of retracement resistances around 1.0787/0822. Economists at Credit Suisse we look for a turn back lower from here, for a move to 1.0608/0599 initially, then 1.0350/41.
Resistance at 1.0839 expected to cap
“EUR/USD has now seen the anticipated recovery to the 38.2% retracement of the fall from February, the 55-day average and the mid-April lows at 1.0758/87. We expect a much tougher barrier here and for the medium-term downtrend to reassert itself from here and we therefore now turn tactically bearish again.”
“We note that there is further important resistance just above at 1.0822/39, which includes the back of the broken uptrend from 2017, where we look for a solid cap.”
“Support moves to 1.0642, then 1.0608/0599, below which would confirm that the risks have turned lower again for a retest of 1.0350/41.”
“Above 1.0822/39 is not our base case, however it would trigger a deeper-than-expected recovery, with the next level at 1.0923/37.”
- Gold is around 0.5% higher in the $1860 area in wake of US Core PCE data.
- The data lent support to the idea that inflation is easing, which may remove pressure on the Fed to tighten.
Spot gold (XAU/USD) prices saw a mixed, fairly subdued reaction to the latest US inflation data for April that supported the idea that price pressures might have peaked at the end of Q1. The US dollar and US yields weren't much changed after the Core PCE Price Index showed the rate of inflation falling to 4.9% YoY in April from 5.2% in March and the MoM rate of price gain remaining unchanged versus last month at 0.3% MoM. Thus, the precious metal didn’t get any cross-asset impulses to drive volatility.
At present, XAU/USD is trading around the $1860 level, up around 0.5% on the day, as the pair continues to derive support from the 21 and 200-Day Moving Averages at $1851 and $1839, as well as from US yields and the buck, both of which are close to/at monthly lows. Gold is currently on course to post a weekly gain of about 0.7%, and has rebounded by about 4.0% from last week’s multi-month lows under $1790.
The latest US inflation data will come as a relief to the Fed and takes away some of the pressure to raise interest rates back to neutral (around 2.5%) quite so rapidly. Though markets still expect 50 bps rate moves at the next two meetings (June and July), the argument for what would be a fourth successive 50 bps hike in September is somewhat diminished.
Meanwhile, if inflation continues to ease back from current levels in the months ahead, the Fed will feel more at ease in pausing rate hikes once it gets back to neutral and reassessing the need for further tightening. If the idea that the Fed won’t need to lift interest rates much beyond neutral starts gaining more traction, this is a downside risk for long-term US yields and also the US dollar, meaning an upside risk for gold.
These will be key themes in the weeks ahead. In the more immediate future, spot gold is likely to remain fairly well supported and may have another run at earlier weekly highs in the $1860s. The upcoming preliminary release of the May University of Michigan Consumer Sentiment survey at 1400GMT will be worth watching for a timely read on how well the US consumer is holding up.
- EUR/USD fades the earlier spike to the 1.0770 zone.
- US headline/Core PCE failed to surprise markets in April.
- US final Consumer Sentiment next of note in the calendar.
EUR/USD wobbles around the 1.0700 neighbourhood amidst mixed risk appetite trends at the end of the week.
EUR/USD looks well supported around 1.0700
EUR/USD came under some moderate selling pressure soon after printing fresh monthly highs near 1.0770 earlier in the session.
Indeed, the pair now exchanges gains with losses amidst the equally lack of a clear direction in the greenback, which managed to bounce off new monthly lows near 101.40 when tracked by the US Dollar Index (DXY).
No meaningful reaction in the pair to US inflation figures after the headline PCE rose 6.3% in the year to April and 4.9% YoY when it comes to the Core print. Further April data saw the trade deficit shrink to $105.94B, Personal Income expand 0.4% MoM and Personal Spending rise 0.9% inter-month. Later in the NA session, the final U-Mich Index will close the weekly calendar.
What to look for around EUR
The intense selling bias in the dollar puts EUR/USD on track to challenge the 1.0800 region in the short-term horizon.
Despite the pair’s upside impulse, the broader outlook for the single currency remains negative for the time being. As usual, price action in spot should reflect dollar dynamics, geopolitical concerns and the Fed-ECB divergence.
Occasional pockets of strength in the single currency, however, should appear reinforced by speculation the ECB could raise rates at some point in the summer, while higher German yields, elevated inflation and a decent pace of the economic recovery in the region are also supportive of an improvement in the mood around the euro.
Eminent issues on the back boiler: Speculation of the start of the hiking cycle by the ECB as soon as this summer. Asymmetric economic recovery post-pandemic in the euro area. Impact of the war in Ukraine on the region’s growth prospects.
EUR/USD levels to watch
So far, spot is losing 0.03% at 1.0718 and a breach of 1.0459 (low May 18) would target 1.0348 (2022 low May 13) en route to 1.0340 (2017 low January 3 2017). On the other hand, the immediate hurdle aligns at 1.0765 (monthly high May 24) followed by 1.0771 (55-day SMA) and finally 1.0936 (weekly high April 21).
- USD/CAD continued losing ground for the second straight day amid sustained USD selling.
- Softer-than-expected US PCE Price Index data for April did little to impress the USD bulls.
- Even modest pullback in oil prices also did little to undermine the loonie or lend support.
The USD/CAD pair maintained its offered tone below mid-1.2700s, or over a three-week low through the early North American session and moved little post-US macro data.
The headline US Personal Consumption Expenditure (PCE) Price Index decelerated to a 6.3% YoY rate in April as against consensus estimates pointing to a steady reading of 6.6%. The Core PCE Price Index - the Fed's primary inflation measure - fell from 5.2% in March to 4.9% during the reported month, though was in line with market expectations.
The data indicated that inflationary pressures in the US might be easing and reaffirmed the idea that the US central could pause the current rate hike cycle later this year. This was evident from the recent slump in the US Treasury bond yields to a multi-week low, which, along with the risk-on impulse, weighed on the safe-haven US dollar.
The prevalent selling bias surrounding the greenback turned out to be a key factor that dragged the USD/CAD pair lower for the second successive day, back closer to the monthly swing low. Bulls seemed rather unimpressed and largely shrugged off modest pullback in crude oil prices, which tend to undermine the commodity-linked loonie.
With the USD price dynamics turning out to be an exclusive driver of the USD/CAD pair's ongoing downward trajectory, traders now look forward to the revised Michigan US Consumer Sentiment Index. This, along with the US bond yields and the broader market risk sentiment, will influence the USD and provide some impetus to the USD/CAD pair.
Technical levels to watch
- Core PCE inflation rose at a pace of 4.9% YoY in April, in line with expectations.
- MoM, prices were up 0.3%, also in line with forecasts.
- Markets didn't react to the data, which was broadly in line with expectations.
The annual pace of inflation in the US according to the Core PCE Price Index fell to 4.9% in April, in line with the median economist forecast for an inflation rate of 4.9%, according to newswire polling. That comes after the Core PCE Price Index had prices rising at a pace of 5.2% YoY in March. The MoM pace of inflation according to the index came in at 0.3% in April, also in line with the median economist forecast for an inflation rate of 0.3%, according to newswire polling.
According to the PCE Price Index, the YoY rate of price gain in April was 6.3%, down from 6.6% in March, while the MoM pace of price gain was 0.2%, down from 0.9% in March. Elsewhere, Personal Incomes rose at a pace of 0.4% MoM in April, a little below the expected gain of 0.5% and down from last month's 0.5% growth rate. Personal Spending, meanwhile, grew at a pace of 0.9% MoM, above the expected drop to 0.7% from a 1.4% growth rate in March.
Market Reaction
The broadly in line with expectations inflation data has not triggered much of a market reaction just yet.
US President Joe Biden's administration is reportedly planning to cancel $10,000 in student debt per borrower, reported the Washington Post citing sources on Friday. Biden had reportedly hoped to make the announcement as soon as this weekend, though this has been delayed in light of the recent massacre in Texas.
Reducing student debt by $10,000 of per borrower could cost as much as $230 billion, a nonpartisan think tank called the Committee for a Responsible Federal Budget has said. The timing of the relief isn't clear, but would mark a massive fiscal injection that critics might argue could make the Fed's inflation-fighting job harder.
- Silver is on the front foot pre-US Core PCE data as the buck and US yields hover at monthly lows.
- Upcoming inflation data at 1230GMT will be viewed in the context of how it impacts Fed tightening expectations.
- A downside surprise could lift silver towards $23.00 while an upside surprise could send it back under $22.00.
Spot silver (XAG/USD) prices have rallied to nearly three-week highs in the mid-$22.00s per troy ounce on Friday ahead of the release of key US Core PCE inflation figures for April, boosted as the US dollar and US bond yields probe monthly lows. A weaker buck helps USD-denominated commodities attract demand from foreign investors, while a fall in bond yields represents a lower “opportunity cost” of holding non-yielding assets (such as precious metals).
At current levels in the $22.30s, XAG/USD is trading higher by more than 1.5% on Friday, thus extending its weekly gains to about 2.8%, and its gains from earlier monthly lows to closer to 9.0%. For reference, since spot-silver posted multi-month lows in the mid-$20.00s on 13 May, the DXY has dropped about 3% and the US 10-year by about 17bps.
Upcoming US Core PCE inflation data at 1230GMT will, as usual, be closely scrutinised and could trigger a choppy market reaction. Analysts increasingly believe that inflation in the US might have now peaked, and might well ease back over the remainder of the year, thus allowing the Fed to pause its rate hikes once it gets back to neutral (around 2.5%). The upcoming data will thus be viewed in the context of whether it supports or pushes back against this narrative.
The MoM price gain according to the Core PCE Price Index will be the most closely watched number. If prints in line with consensus forecasts and last month’s number at 0.3%, or if it comes in lower, recent USD weakness/US yield downside might well extend. In this scenario, XAG/USD might be in with a shot of reclaiming a $23 handle. If it surprises to the upside, a quick drop back into the $21.00s might be on the cards.
- USD/CHF dropped to a one-month low on Friday amid the prevalent USD selling bias.
- Signs that the Fed could pause the rate hike cycle later this year weighed on the USD.
- The risk-on impulse undermined the safe-haven CHF and helped limit deeper losses.
The USD/CHF pair remained on the defensive heading into the North American session and was seen trading around the 0.9570 region, or a fresh one-month low.
Minutes from the May 3-4 FOMC meeting released on Wednesday suggested that the Fed could pause the rate hike cycle after two 50 bps hikes each in June and July amid the worsening economic outlook. The speculations were reinforced by the recent slump in the US Treasury bond yields to a multi-week low, which, in turn, weighed on the US dollar and exerted downward pressure on the USD/CHF pair.
That said, the risk-on impulse - as depicted by a generally positive tone around the equity markets - undermine the safe-haven Swiss franc and held back traders from placing aggressive bearish bets around the USD/CHF pair. Apart from this, a modest USD rebound from a fresh monthly low helped limit any further losses, at least for the time being, though any meaningful recovery still seems elusive.
Market participants now look forward to the release of the US April Core PCE Price Index - the Fed's preferred inflation gauge. This, along with the US bond yields, will influence the USD price dynamics and provide some impetus to the USD/CHF pair. Traders will further take cues from the broader market risk sentiment to grab short-term opportunities on the last day of the week.
Technical levels to watch
European Union nations are reportedly working on a Russia oil sanction deal that could be signed at next week's EU Council Summit that would exclude oil delivered into the EU via pipelines, two EU officials told Reuters. Bloomberg had reported something similar earlier in the day.
The exclusion of oil delivered by pipelines is designed to win over the approval of landlocked nations such as Hungary, who have thus far pushed back against plans for a broad EU ban on Russian oil imports. Leaders of EU 27 nations will be meeting on 30-31 May and any EU sanction plan must get unanimous approval from all nations.
- GBP/USD has pared back from earlier highs but remains in the green and supported above 1.2600 pre-US Core PCE data.
- The pair was nonetheless able to hit monthly highs earlier in the day, with some citing UK fiscal stimulus optimism.
Though the pair has now handed back most of the gains it made during the Asia Pacific session, GBP/USD continues to trade slightly in the green and supported to the north of the 1.2600 level on Friday. FX market conditions have been fairly subdued in recent hours ahead of the release of key US Core PCE inflation data for April that, if it shows an easing of price pressures, could contribute to a continuation of recent USD weakening if it contributes to the “inflation has peaked” narrative and thus triggers a further paring back on Fed tightening bets.
Indeed, USD weakness (the DXY is on course for a second successive weekly loss, the worst losing streak since December 2021) has been the key driver behind cable’s more than 3.5% rally from earlier monthly lows in the mid-1.2100s to fresh monthly highs this Friday. But analysts have also attributed a few domestic UK factors as lending support to the rebound. Firstly, last week’s UK labour market data was strong, while the April inflation figures showed price pressures at their worst in four decades, giving a marginal boost to BoE tightening bets at the time.
Meanwhile, the UK government surprised markets on Thursday with a new, larger than expected fiscal aid package of £15 billion, aimed at helping low-income households cope with the current cost-of-living squeeze. Some analysts said that this larger than expected injection of fiscal stimulus (which will be spread over the summer and autumn) might encourage the BoE to revise higher its very pessimistic UK growth forecasts for this year and next.
A less pessimistic growth outlook means that the BoE might feel more confident that it can get away with slightly more monetary tightening in order to ensure inflation expectations don’t de-anchor. Still, FX strategists continue to warn that the UK growth outlook remains far weaker than in the US, meaning the outlook for BoE policy is far less hawkish than the outlook at the Fed. That mean, in the medium-longer term, a sustained rebound for GBP/USD doesn’t look likely. If Brexit tensions surrounding the Northern Ireland Protocol further worsen, that only could the pair’s outlook.
US PCE Price Index Overview
Friday's US economic docket highlights the release of the April Personal Consumption Expenditure (PCE) Price Index, scheduled later during the early North American session at 12:30 GMT. The headline gauge is expected to hold steady at a 6.6% YoY rate during the reported month. The core reading, however, is anticipated to have eased to 4.9% YoY in April from 5.2% previous and rose 0.3% on a monthly basis.
How Could it Affect EUR/USD?
According to Yohay Elam, Analyst FXStreet: “The dollar has been whipsawed in recent days, but when it comes to data, the greenback seems to have been in a win-win situation. A better figure means more rate hikes and a stronger dollar, while a weak figure implies the global economy is weakening – sending investors to the safety of the world's reserve currency.”
This, along with the EUR/USD pair's inability to make it through the 50-day SMA, suggest that the path of least resistance for spot prices is to the downside. Meanwhile, Eren Sengezer, Editor at FXStreet, offered a brief technical outlook for the major: “The near-term technical outlook shows that the bullish bias remains intact for the time being. EUR/USD holds above the ascending trend line coming from mid-May and the Relative Strength Index (RSI) indicator on the four-hour chart holds comfortably above 50.”
Eren also outlined important technical levels to trade the EUR/USD pair: “On the upside, static resistance seems to have formed at 1.0760. 1.0800 (psychological level) aligns as the next hurdle. Initial support is located at 1.0700 (psychological level, 20-period SMA) before 1.0660 (ascending trend line, static level) and 1.0630 (200-period SMA). As long as the pair manages to end the week above 1.0700, sellers are likely to remain on the sidelines.”
Key Notes
• US Core PCE Preview: Why there is room for a dollar-lifting upside surprise
• EUR/USD Forecast: A weekly close above 1.0700 could be a bullish sign
• EUR/USD invades 1.0760 ahead of US PCE, DXY renews monthly lows
About the US PCE Price Index
The Personal Spending released by the Bureau of Economic Analysis, Department of Commerce is an indicator that measures the total expenditure by individuals. The level of spending can be used as an indicator of consumer optimism. It is also considered as a measure of economic growth: While Personal spending stimulates inflationary pressures, it could lead to raise interest rates. A high reading is positive (or Bullish) for the USD.
- EUR/USD advances to fresh monthly peaks near 1.0770.
- Extra gains now target the resistance line near 1.0820.
EUR/USD comes under pressure soon after clinching new highs in the vicinity of 1.0770 on Friday.
Considering the pair’s current price action, the continuation of the rebound looks likely in the very near term at least. That said, the next up barrier now appears at the 55-day SMA, today at 1.0770 prior to the 3-month resistance line near 1.0820.
The breakout of this area should mitigate the selling pressure and allow for a probable move to the weekly high at 1.0936 (April 21).
EUR/USD daily chart
Bundesbank President and European Central Bank (ECB) Governing Council member Joachim Nagel said in an interview with Der Spiegel on Friday that the ECB should raise interest rates in July, followed by more rate hikes in the second half of the year, Reuters reported.
"In our June meeting we must send a clear signal where we're going," Nagel told the German paper, adding that "from my current perspective, we must then make the first rates move in July and have others follow in the second half of the year". Nagel warned that it may take some time for inflation to fall in the Eurozone.
Earlier this week, ECB President Christine Lagarde outlined new interest rate guidance in a blog post, where she indicated taking Eurozone interest rates back into positive territory by the end of the third quarter. Thus Nagel's views seem to be well aligned with Lagarde's.
- DXY made a U-turn soon after hitting new lows near 101.40.
- The support line near 100.60 underpins the constructive view.
The index reverses course after bottoming out in the 101.40 region earlier on Friday.
The breakdown of the May low at 101.43 (May 27) should expose another pullback to the interim 55-day SMA at 101.47 ahead of the support line around 100.60, which is expected to offer decent contention. While above this area, further gains in the very near term in the dollar should remain well on the table.
The longer-term positive outlook for the index is seen constructive while above the 200-day SMA at 96.76.
DXY daily chart
- EUR/JPY falters once again around the 136.70 region.
- Extra gains look likely while above the 134.50 zone.
EUR/JPY corrects lower after failing once again to extend the recovery further north of the 136.70 area on Friday.
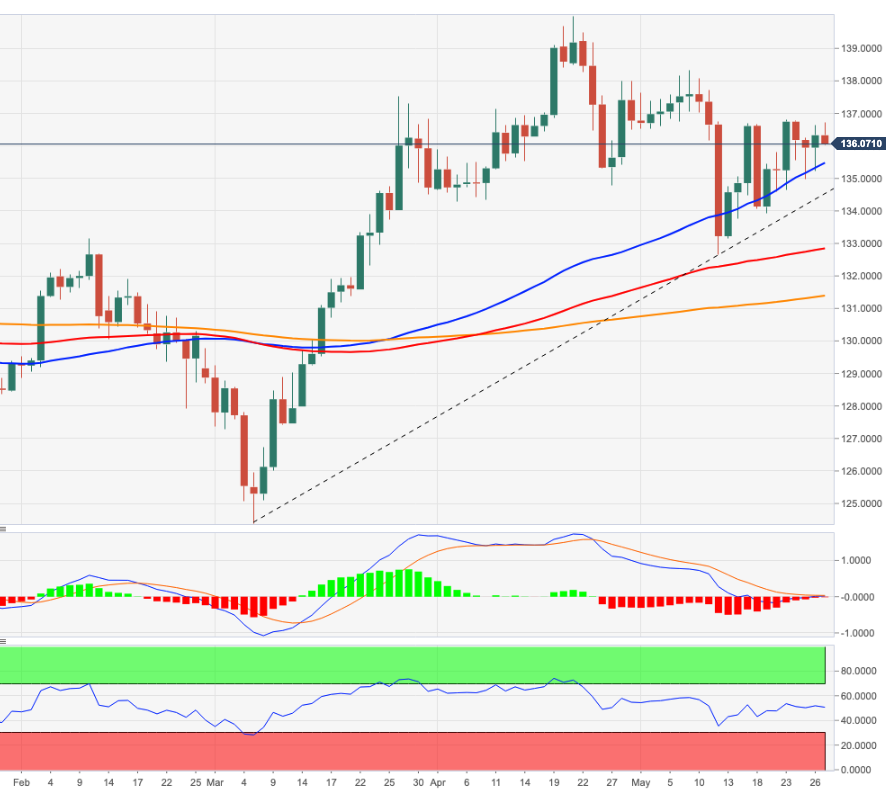
The succession of higher lows since mid-May leaves the prospects for further upside well on the table for the time being. That said, while above the 2-month support line near 134.50, further upside appears likely with the next target at recent peaks in the 136.80 region ahead of the May high at 138.31 (May 9).
In the meantime, while above the 200-day SMA at 131.36, the outlook for the cross is expected to remain constructive.
EUR/JPY daily chart
- Gold Price is heading back towards $1900 amid mixed markets.
- US dollar recovers ground but the correction doesn’t seem to be over yet.
- XAUUSD’s path of least resistance appears to the upside, for now.
Gold Price is staging a solid comeback after finding strong support near the $1,840 region over the past two trading days. The bright metal is looking to retest the two-week highs on the road to recovery, as the US dollar is struggling to recover further ground amid mixed market sentiment and subdued Treasury yields. Dismal US GDP, Markit Manufacturing PMI and Pending Home Sales point to signs of US economic slowdown, cooling off the aggressive Fed tightening expectations and keeping the dollar broadly undermined. This week’s turnaround in global stocks is also weighing on the greenback’s safe-haven appeal, benefiting the USD-priced gold.
Also read: Gold Price Forecast: Key $1,838 support could be at risk ahead of US GDP
Gold Price: Key levels to watch
The Technical Confluences Detector shows that the Gold Price is fast approaching strong resistance at $1,863, as the renewed upside gathers steam.
That level is the convergence of the Fibonacci 161.8% one-day and the pivot point one-day R2.
The next significant upside barrier awaits at the confluence of the pivot point one-day R3, pivot point one-week R1 and the two-week highs at $1,870.
The previous month’s low of $1,872 will be a tough nut to crack for gold bulls.
Alternatively, the immediate downside will be capped by $1,855, which is the meeting point of the SMA5 one-day and the previous day’s high.
Failure to defend the latter will threaten the $1,850 demand area, where the previous week’s high and the Fibonacci 61.8% one-day merge.
Gold sellers will then target the intersection of the SMA100 four-hour, pivot point one-month S1 and the Fibonacci 38.2% one-day at $1,847.
The last relevant support is pegged at the pivot point one-day S1 at $1,844.
Here is how it looks on the tool
About Technical Confluences Detector
The TCD (Technical Confluences Detector) is a tool to locate and point out those price levels where there is a congestion of indicators, moving averages, Fibonacci levels, Pivot Points, etc. If you are a short-term trader, you will find entry points for counter-trend strategies and hunt a few points at a time. If you are a medium-to-long-term trader, this tool will allow you to know in advance the price levels where a medium-to-long-term trend may stop and rest, where to unwind positions, or where to increase your position size.
UK Prime Minister Boris Johnson voices his concern over the country’s economic outlook, in an interview with Bloomberg TV on Friday.
Key quotes
“See a difficult period ahead for the economy.”
“The UK can avoid a recession.”
“Do not want to see a return to 1970's 'wage-price' spiral.”
Market reaction
GBP/USD is trading around 1.2600, having hit a daily low of 1.2587 in the last hour. The spot is still up 0.07% on the day.
- NZD/USD gained strong positive traction on Friday and climbed to a three-week high.
- The technical set-up favours bullish traders and supports prospects for further gains.
- Sustained break below the 0.6400 mark is needed to negate the constructive outlook.
The NZD/USD pair caught aggressive bids on the last day of the week and rallied to over a three-week top during the first half of the European session. Bulls are now looking to build on the momentum beyond the 0.6525-0.6530 confluence, comprising 200-period SMA on the 4-hour chart and the 38.2% Fibonacci retracement level of the 0.7035-0.6217 fall.
Signs that the Fed could pause the rate hike cycle after two 50 bps hikes each in June and July amid the worsening economic outlook, along with the risk-on impulse continued weighing on the safe-haven US dollar. Apart from this, the Reserve Bank of New Zealand's hit at even higher rates going forward further benefitted the risk-sensitive kiwi.
Looking at the broader technical picture, the recent recovery from the YTD low has been along an upward sloping channel. This points to a well-established short-term bullish trend and supports prospects for additional gains. Some follow-through buying beyond the aforementioned 0.6525-30 confluence hurdle will reaffirm the near-term positive outlook for the NZD/USD pair.
Bullish traders might then lift the NZD/USD pair beyond the 0.6600 round-figure mark, towards the 50% Fibo. level resistance near the 0.6625 region. The momentum could further get extended towards the next relevant hurdle near the 0.6655 area, or the 50-day SMA, spot prices could aim to challenge the very important 200-day SMA, currently around the 0.6700 mark.
On the flip side, any meaningful pullback below the 0.6500 psychological mark now seems to find decent support near the lower end of the ascending channel, around the 0.6470-0.6465 region. This is followed by the 23.6% Fibo. level, just ahead of the 0.6400 mark, which if broken will negate the positive bias and prompt aggressive selling around the NZD/USD pair.
NZD/USD 4-hour chart
-637892415867968569.png)
Key levels to watch
EUR/USD remains on track to close the second straight week in positive territory. A weekly close above 1.07 could be a bullish sign, FXStreet’s Eren Sengezer reports.
Static resistance seems to have formed at 1.0760
“On the upside, static resistance seems to have formed at 1.0760. 1.08 (psychological level) aligns as the next hurdle.”
“Initial support is located at 1.07 (psychological level, 20-period SMA) before 1.0660 (ascending trend line, static level) and 1.0630 (200-period SMA).”
“As long as the pair manages to end the week above 1.07, sellers are likely to remain on the sidelines.”
- A combination of factors dragged USD/CAD to a fresh multi-week low on Friday.
- Bullish oil prices underpinned the loonie and exerted pressure amid a weaker USD.
- Signs that the Fed might pause later this year continued weighing on the greenback.
The USD/CAD pair weakened further below mid-1.2700s through the first half of the European session and dropped to a fresh three-month low in the last hour.
A combination of factors dragged the USD/CAD pair lower for the second successive day on Friday, taking along some trading stops near the previous weekly low support near the 1.2765-1.2760 region. Crude oil prices held steady near a two-month high and continued underpinning the commodity-linked loonie. Apart from this, the prevalent bearish sentiment surrounding the US dollar exerted downward pressure on the major.
Despite worries about softening global economic growth, expectations of demand recovery in China and the impending European Union embargo on Russian oil imports extended support to the black liquid. Furthermore, OPEC+ is expected to stick to last year's oil production deal at its June 2 meeting and raise July output targets by 432K barrels per day. This added to supply concerns and acted as a tailwind for oil.
On the other hand, the USD was pressured by speculations that the Fed could pause the rate hike cycle later this year amid the worsening economic outlook. Doubt over the Fed's ability to bring inflation under control without sinking the economy into recession dragged the yield on the benchmark 10-year US government bond fell to a six-week low. This, along with the risk-on impulse, weighed on the safe-haven greenback.
The fundamental backdrop seems tilted in favour of bearish traders and a break below the weekly low supports prospects for a further near-term depreciating move for the USD/CAD pair. Hence, some follow-through decline, towards testing the 100-day SMA, currently around the 1.2700-1.2695 region, remains a distinct possibility.
Technical levels to watch
UOB Group’s Barnabas Gan comments on the GDP figures in Singapore.
Key Takeaways
“Singapore has revised its 1Q22 GDP growth higher to 3.7% y/y, from the preliminary estimate of 3.4% y/y released in Apr. From a quarter-on-quarter perspective, 1Q22 GDP rose 0.7% as compared to the advance estimates for an expansion of 0.4%. The upward revision is in line with our call for GDP to grow at 3.6% y/y (+0.6% q/q sa).”
“The official estimate for Singapore’s full-year growth has been maintained at 3 – 5% in 2022. However, authorities are now expecting GDP growth ‘likely to come in at the lower half of the forecast range.’ This is also in line with our expectations for full-year GDP to average 3.5% this year.”
“Singapore’s overall economic prognosis remains optimistic on the back of trade and manufacturing momentum. However, exogenous factors including rising inflation, China’s slowdown and the monetary policy tightening in advanced economies could weaken Singapore’s economic outlook in the year ahead.”
- USD/JPY reverses losses in tandem with the US dollar.
- The market mood remains upbeat, Treasury yields recover losses.
- The pair defends 50-DMA once again but not for long.
USD/JPY is trading on the defensive around the 127.00 level, licking its wound after the drop to 126.68 lows in Asian trading.
The spot is off the lows, tracking the recovery in the US dollar across its main peers. The downside in the major also appears capped amid a minor bounce in the US Treasury yields and positive European equities.
Markets also assess the latest comment from the Japanese PM Fumio Kishida and BOJ Governor Haruhiko Kuroda, as both leaders expressed their take on the country’s growth and inflation outlook.
All eyes now remain on the US PCE Price Index data for fresh dollar valuations, eventually affecting the pair. Note that the latest slew of US macro data has not been very encouraging and has collaborated with the downside in the buck.
Technically, USD/JPY’s daily chart shows that the price is moving lower while within a falling wedge formation after peaking out at 131.34 earlier this month.
Bears are now testing the lower range of the wedge, although the bullish 50-Daily Moving Average (DMA) at 126.55 has been guarding the downside over the past four trading days.
If the latter gives way on a sustained basis, then a test of the wedge lower boundary at 125.90 will be inevitable.
The 14-day Relative Strength Index (RSI) is inching lower below the midline, suggesting that there is scope for additional weakness going forward.
USD/JPY: Daily chart
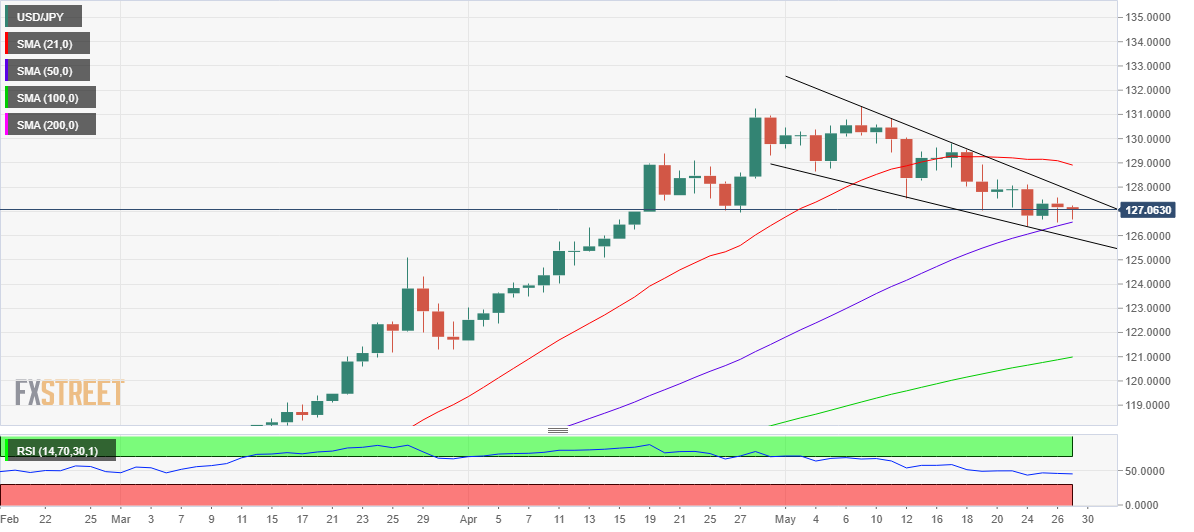
However, the major could find fresh bids near the wedge support, which may prompt a rebound towards the wedge’s upper boundary, now pegged at 127.83.
Daily closing above that hurdle will confirm a falling wedge breakout, recalling buyers for a fresh run towards the downward-pointing 21-DMA at 128.90.
Ahead of that upside target, the 128.50 psychological barrier could test the bearish commitments.
USD/JPY: Additional levels to consider
- AUD/USD gained strong positive traction on Friday and climbed to a fresh multi-week high.
- The RBA’s hawkish signal acted as a tailwind for the aussie amid sustained USD selling bias.
- Signs that the Fed could pause the rate hike cycle, the risk-on mood weighed on the buck.
The AUD/USD pair maintained its bid tone through the first half of the European session and was last seen trading near a three-week high, just below mid-0.7100s.
A combination of supporting factors assisted the AUD/USD pair to gain strong positive traction on Friday and breakout through a multi-day-old trading range. The Australian dollar continued drawing support from the Reserve Bank of Australia's hawkish signal that a bigger interest rate hike is still possible in June amid the upside risks to inflation. Apart from this, the prevalent US dollar selling bias provided an additional boost to the major and contributed to the ongoing bullish move.
The FOMC meeting minutes released on Wednesday suggested that the Fed could pause the rate hike cycle after two 50 bps hikes each in June and July amid the worsening economic outlook. The speculations were fueled by Thursday's release of the Prelim US GDP report, which showed that the economy contracted by a 1.5% annualized pace in Q1. This, in turn, dragged the yield on the benchmark 10-year US government bond fell to a six-week low, which, along with the risk-on impulse, weighed heavily on the buck.
Meanwhile, the intraday move up pushed spot prices beyond the 0.7125 supply zone and might have already set the stage for additional gains. Hence, a subsequent strength, towards reclaiming the 0.7200 round-figure mark, now looks like a distinct possibility. The momentum could further get extended to the 100-day SMA, around the 0.7230-0.7235 region. Traders now look to the US Core PCE Price Index - the Fed's preferred inflation gauge - for a fresh impetus later during the early North American session.
Technical levels to watch
Gold is trending sideways. Economists at Commerzbank note that the yellow metal is not attracting the attention of investors with risk flows dominating the financial markets.
Somewhat weaker US dollar is lending virtually no support
“In the current market environment, which is characterised once again by higher risk appetite among market participants, gold is not in much demand.”
“The somewhat weaker US dollar is lending virtually no support this morning.”
“The past two days saw outflows from the gold ETFs again, meaning that gold is lacking any impetus from financial investors.”
- GBP/USD climbed to a fresh monthly low and was supported by the prevalent USD selling bias.
- Speculations that the Fed could pause the rate hike cycle, the risk-on mood weighed on the buck.
- Doubts over any further BoE rate hikes, Brexit woes held back bulls from placing aggressive bets.
The GBP/USD pair trimmed a part of its intraday gains to a one-month low and was seen trading near the 1.2625-1.2620 area, up 0.25% during the early European session.
The pair gained positive traction for the third successive day on Friday - also marking the sixth day of a positive move in the previous seven - and confirmed a bullish breakout through the 1.2600 mark. The momentum pushed spot prices to the highest level since April 26 and was sponsored by the prevalent US dollar selling bias.
The FOMC meeting minutes released on Wednesday suggested that the Fed could pause the rate hike cycle after two 50 bps hikes each in June and July amid the worsening economic outlook. The speculations were fueled by Thursday's release of the Prelim US GDP report, which showed that the economy contracted by a 1.5% annualized pace in Q1.
Doubt over the Fed's ability to bring inflation under control without sinking the economy into recession led to an extension of the recent decline in the US Treasury bond yields. In fact, the yield on the benchmark 10-year US government bond fell to a six-week low, which, along with the risk-on impulse, dragged the USD to a fresh one month low.
That said, diminishing odds for any further interest rate hikes by the Bank of England and the UK-EU impasse over Northern Ireland acted as a headwind for the British pound. This was seen as the only factor that held back bulls from placing aggressive bets and behind the GBP/USD pair's intraday pullback of around 40 pips from the daily high.
In the absence of any major market-moving economic releases from the UK, the USD price dynamics will continue to play a key role in influencing the GBP/USD pair. Later during the early North American session, the release of the US Core PCE Price Index - the Fed's preferred inflation gauge - could allow traders to grab short-term opportunities.
Technical levels to watch
Here is what you need to know on Friday, May 27:
With risk flows dominating the financial markets on Thursday, Wall Street's main indexes registered impressive gains and the dollar continued to lose interest. Although the market mood seems to have turned cautious early Friday, the US Dollar Index trades at its lowest level in a month near the mid-101.00s. The US Personal Consumption Expenditures (PCE) Price Index data, the Fed's preferred gauge of inflation, will be published later in the day. The US Bureau of Economic Analysis will also release the Personal Income and Personal Spending data for April alongside the University of Michigan's Consumer Sentiment Index for May.
US Core PCE Preview: Why there is room for a dollar-lifting upside surprise.
Crude oil prices rose sharply on Thursday amid renewed supply concerns and the barrel of West Texas Intermediate (WTI) climbed to its highest level in ten days near $115. Earlier in the day, Russian Deputy Prime Minister Alexander Novak said they were expecting Russia's oil production to decline to 480-500 million tonnes this year from 524 million tonnes in 2021.
Bloomberg reported on Friday that Chinese Premier Li Keqiang warned of dire consequences if they fail to prevent the economy from sliding further and noted that a contraction in the second quarter must be avoided. Meanwhile, the US and Taiwan are reportedly planning to announce economic talks to deepen their ties, which could be seen as a factor that could cause US-China geopolitical tensions to escalate.
EUR/USD took advantage of the selling pressure surrounding the dollar and advanced to its highest level in a month at 1.0765 before going into a consolidation phase. The pair remains on track to close the second straight week in positive territory.
GBP/USD registered small gains on Thursday and fluctuates in a relatively tight channel above 1.2600 on Friday. British Finance Minister announced on Thursday that they will be sending one-off £650 payments to around 8 million of the country's lowest-income households.
Following a three-day consolidation, AUD/USD gained traction during the Asian trading hours and climbed above 0.7100. The data from Australia showed that Retail Sales rose by 0.9% on a monthly basis in April, matching the market expectation.
USD/JPY stays on the back foot and trades near 127.00 early Friday. Bank of Japan Governor Haruhiko Kuroda noted on Friday that they are not expecting prices to rise sustainably unless accompanied by wage hikes.
Gold struggled to gather bullish momentum on Thursday as the benchmark 10-year US Treasury bond yield continued to move up and down near 2.75%. XAU/USD stays calm on Friday and moves sideways slightly above $1,850.
Bitcoin dropped to a two-week low of $28,000 on Thursday. Although BTC/USD managed to erase a small portion of its losses ahead of the weekend, it continues to trade below the key $30,000 level. Ethereum suffered heavy losses in the second half of the week and lost nearly 8% on Thursday. At the time of press, ETH/USD was down 1% on the day at $1,770.
- Sustained USD selling bias assisted gold to gain some positive traction on Friday.
- Speculations that the Fed would pause the rate hike cycle and undermined the buck.
- The risk-on impulse could cap gains for the metal ahead of the US PCE Price Index.
Gold built on the overnight bounce from the very important 200-day SMA support and edged higher on the last day of the week. The XAUUSD held on to its modest intraday gains through the early European session and was last seen trading near the top end of the daily range, just above the $1,850 level.
The US dollar prolonged its recent bearish trend and dropped to a fresh one-month low on Friday, which, in turn, benefitted the dollar-denominated gold. The FOMC meeting minutes released on Wednesday suggested that the Fed could pause the rate hike cycle after two 50 bps hikes each in June and July amid the worsening economic outlook. The speculations were further fueled by Thursday's release of the Prelim US GDP report, which showed that the world's largest economy contracted by a 1.5% annualized pace in the first quarter. This was seen as a key factor that exerted downward pressure on the buck.
Meanwhile, doubt over the Fed's ability to bring inflation under control without sinking the economy into recession continued dragging the US Treasury bond yields lower. In fact, the yield on the benchmark 10-year US government bond fell to a six-week low, which further undermined the greenback and offered additional support to the non-yielding gold. That said, a positive turnaround in the global risk sentiment - as depicted by a generally positive tone around the equity markets - could act as a headwind for the safe-haven precious metal. This might hold back bulls from placing aggressive bets.
Market participants now look forward to the release of the US Core PCE Price Index - the Fed's preferred inflation gauge - for some impetus later during the early North American session. This, along with the US bond yields will influence the USD price dynamics and provide some impetus to gold. Apart from this, traders will take cues from the broader market risk sentiment to grab short-term opportunities on the last day of the week.
Technical levels to watch
- EUR/USD adds to Thursday’s advance near 1.0770.
- The risk-on sentiment keeps weighing on the dollar.
- US PCE will be the salient event later in the NA session.
The optimism around the European currency remains well in place in the second half of the week and lifts EUR/USD to fresh monthly tops around 1.0770 on Friday.
EUR/USD boosted by ECB, risk appetite
EUR/USD remains well en route to close the second consecutive week with gains, gaining around 4 cents since the 2022 lows around 1.0350 recorded a couple of weeks ago.
Increased hawkishness from most ECB’s rate-setters coupled with persistent weakness around the greenback and the firmer appetite for the riskier assets have all been underpinning the sharp recovery in the pair as of late, against the backdrop of muted price action in the money markets on both sides of the ocean.
Nothing in the euro calendar on Friday should leave all the attention to the US data space, where the PCE and Core PCE will be in the centre of the debate seconded by Trade Balance, Personal Income/Spending and the final reading of the Consumer Sentiment.
What to look for around EUR
The intense selling bias in the dollar puts EUR/USD on track to challenge the 1.0800 region in the short-term horizon.
Despite the pair’s upside impulse, the broader outlook for the single currency remains negative for the time being. As usual, price action in spot should reflect dollar dynamics, geopolitical concerns and the Fed-ECB divergence.
Occasional pockets of strength in the single currency, however, should appear reinforced by speculation the ECB could raise rates at some point in the summer, while higher German yields, elevated inflation and a decent pace of the economic recovery in the region are also supportive of an improvement in the mood around the euro.
Eminent issues on the back boiler: Speculation of the start of the hiking cycle by the ECB as soon as this summer. Asymmetric economic recovery post-pandemic in the euro area. Impact of the war in Ukraine on the region’s growth prospects.
EUR/USD levels to watch
So far, spot is gaining 0.16% at 1.0738 and faces the immediate hurdle at 1.0765 (monthly high May 24) followed by 1.0771 (55-day SMA) and finally 1.0936 (weekly high April 21). On the other hand, a breach of 1.0459 (low May 18) would target 1.0348 (2022 low May 13) en route to 1.0340 (2017 low January 3 2017).
- Market sentiment dwindles as fears of inflation, recession battle hopes of stimulus from China, pre-data caution.
- S&P 500 Futures, US 10-year Treasury yields print mild losses, Euro Stoxx 50 Futures remain indecisive.
- Light calendar ahead of US PCE Inflation weighs on market mood.
- ECB’s de Coz hints at the July rate hike, Japan’s Kishida rejects rate hike concerns.
Risk appetite remains sluggish during early Friday in Europe as market players struggle for fresh impulses. Also challenging the sentiment could be the anxiety ahead of the Fed’s preferred inflation gauge, namely the US Core Personal Consumption Expenditure (PCE) Price Index.
While portraying the mood, the S&P 500 Futures drops 0.20% intraday and the US 10-year Treasury yields decline 1.7 basis points (bps) to 2.741%. However, the Euro Stoxx 50 Futures register an advance of 0.15% intraday by the press time.
It’s worth noting that the recent comments from the European Central Bank (ECB) Governing Council member and Spanish central bank chief Pablo Hernandez de Cos seem to have favored European equity futures. The policymaker said, “Inflation will gradually slow down towards the 2% goal,” while also mentioning, “The process of increasing rates should be gradual.”
Elsewhere, softer US data weighed on the US dollar as market participants welcomed the lack of uncertainty over the Fed’s next move with zeal, showing confidence in the 50 bps rate hikes during the next two meetings. That said, the US preliminary Q1 2022 Annualized GDP eased to -1.5%, below -1.4% prior and -1.3% forecasts, whereas the Pending Home Sales slumped in April, to -3.9% versus -2.0% forecast.
It’s worth noting that the Japanese policymakers’ defense of the easy money policies seemed to have helped equities as well.
Alternatively, the latest news from Bloomberg saying, “The US plans economic talks with Taiwan in latest challenge to China,” seems to challenge the sentiment. On the same line are the fears of global economic slowdown, mainly due to covid-led lockdown in China and the Russia-Ukraine crisis.
It’s worth noting that the market players keep their eyes on the US PCE inflation data, expected at 4.9% YoY versus 5.2% prior, for clear directions. Also important will be the Fedspeak and the geopolitical headlines concerning China and Russia.
The dollar is set to face a second consecutive week of losses against all G10 currencies. However, economists at ING think that the combination of a material improvement in the global risk environment and further USD-adverse widening of short-term rate differentials is unlikely, and therefore expect the dollar to find a floor soon.
Dollar’s downside risks are shrinking
“It's hard to see a much calmer risk environment amid global monetary tightening and multiple downside risks (China, Russia/Ukraine), and a further shrinking of the USD’s short-term rate advantage over other G10 currencies, given that the FOMC rhetoric is still very hawkish.”
“We see a higher chance of recovery in US rate expectations, which should put a floor under the greenback.”
“When adding a more balanced positioning picture following the latest moves, we think that the dollar’s downside risk is now looking less pronounced, and we favour instead a recovery to the 103.00 level in DXY.”
Hungarian forint has hit the weakest levels since the beginning of March. For now, the EUR/HUF has settled in the 390-395 range. Economists at ING note that the pair could reach its highest level in history if the central bank does not hike rates next week.
Hidden potential for the forint in the second half of the year
“With FX weakening, markets are raising bets on an emergency rate hike next week. However, this is far from certain. Thus, market disappointment may lead to further forint weakening to the 400 level, which would be the weakest in history.”
“It is necessary to keep in mind that the market has already priced in a lot of negative news. Thus, we are negative on the forint in the short-term, but we continue to monitor headlines that should unlock the hidden potential of the forint in the second half of the year.”
The new GBP15 billion ($19 billion) cost-of-living support package is seen as having less than a 1 percentage point impact on inflation, UK Finance Minister Rishi Sunak seen in an interview with Sky News on Friday.
Key quotes
"My view is that it will have a minimal impact on inflation,"
Asked if it would be a one percentage point impact, he said: "Much, much less than that."
Asked about a possible windfall tax on electricity generators, "What we want to do and we are going to do urgently is understand the scale of those profits, and then decide on the appropriate next steps."
Market reaction
GBP/USD is paring back gains above 1.2600, as risk-on flows cool off a bit and the US dollar recovers. The pair is currently trading at 1.2614, up 0.17% on the day.
In the view of economists at ING, the bar to trigger further hawkish repricing in the Bank of England (BoE) rate expectation curve is quite elevated, Subsequently, the British pound is set to face some pressure from the short-term rate differential side.
A consolidation around 0.8450-0.85 in EUR/GBP seems plausible
“In the longer run, as we expect the BoE to underdeliver compared to rate expectations, the pound is still looking likely to face some pressure from the short-term rate differential side.”
“For now, swings in risk sentiment should continue to drive most day-to-day moves. A consolidation around 0.8450-0.8500 in EUR/GBP seems plausible.”
FX option expiries for May 27 NY cut at 10:00 Eastern Time, via DTCC, can be found below.
- EUR/USD: EUR amounts
- 1.0565-75 1.49b
- 1.0585 397m
- 1.0625-35 2.45b
- 1.0650-60 3.58b
- 1.0670-80 974m
- 1.0690-1.0700 1.69b
- 1.0750-55 742m
- 1.0760-65 1.17b
- 1.0775-80 827m
- 1.0800 450m
- GBP/USD: GBP amounts
- 1.2685 202m
- USD/JPY: USD amounts
- 125.50 430m
- 125.70-75 560m
- 126.00 451m
- 126.50 431m
- 126.98-05 1.46b
- 127.05-10 (506m
- 127.70-75 1.44bln
- AUD/USD: AUD amounts
- 0.6950-60 543m
- 0.7075 369m
- 0.7125-30 508m
- 0.7145-55 632m
- 0.7165-70 1.05b
- 0.7200 513m
- USD/CAD: USD amounts
- 1.2700-10 658m
- 1.2750-60 1.17b
- 1.2770 250m
- 1.2835-40 520m
- EUR/GBP: EUR amounts
- 0.8450-60, 710m
- 0.8500-05 280m
EUR/USD is making a fresh attempt at breaking significantly above 1.0750 (the 50-day moving average) this morning. However, economists at ING expect the pair to move back lower towards the 1.07 level.
Upside potential more limited now
“We see a higher chance of some recovery in the dollar from the current levels rather than an extension of the drop, and with a lot of ECB tightening now in the price, the room for the euro to benefit further from the monetary-policy factor appears limited.”
“We expect a return below 1.07 in the coming days.”
- Palladium prices stay on the front foot towards weekly high.
- Clear break of three-week-old descending trend line, 100-SMA favor buyers.
- Fortnight-old symmetrical triangle limits short-term moves amid firmer RSI.
Palladium (XPD/USD) takes the bids to refresh intraday high around $2,020 heading into Friday’s European session.
In doing so, the precious metal justifies the previous day’s upside break of a downward sloping trend line from May 05, as well as the 100-SMA. However, a two-week-long symmetrical triangle restricts the immediate moves of the quote.
That said, firmer RSI conditions join the aforementioned breakout to direct the current upside towards the stated triangle’s resistance line, near $2,050 by the press time.
Should the quote manage to cross the $2,045 hurdle, the $2,100 hurdle may act as an intermediate halt during the rise towards the 200-SMA level near $2,150.
Meanwhile, pullback moves may initially rest around the 100-SMA level near the $2,000 threshold before challenging the $1,980 key support comprising the aforementioned triangle’s support line and the previous resistance line.
Overall, XPD/USD is up for further advances but needs validation from the $2,045 hurdle.
Palladium: Four-hour chart
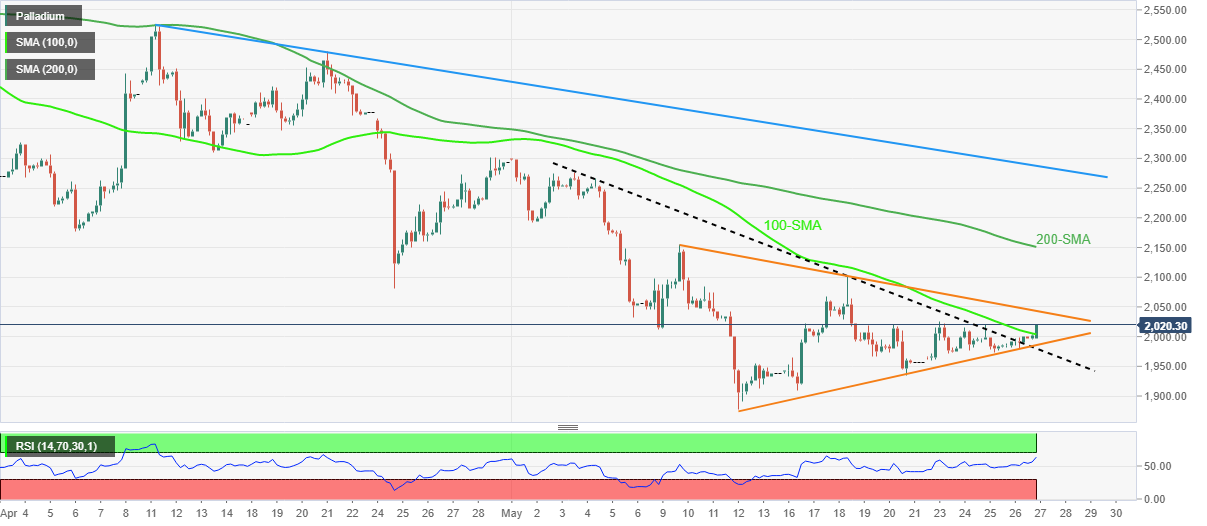
Trend: Further upside expected
Will US Treasury yields move higher? Matthew Hornbach, Global Head of Macro Strategy for Morgan Stanley, forecasts an inverted yield curve at year-end with two-year Treasury yields reaching 3.25% and ten-year yields near 3%.
Outlook for government bonds depends on more than just central bank policy
“We now expect the Fed to deliver two more 50 basis point rate hikes this year, then downshift to a series of 25 basis point moves. At the end of the year, they see the Fed funds target range at 2.5% to 2.75%, and the Fed's balance sheet on its way to $6.5 trillion.”
“We expect front end yields to trace market-implied forward yields, largely consistent with two-year Treasury yields reaching 3.25% by the end of the year.”
“Demand from investors looking to hedge risks to a weaker outcome for global growth will likely show up in the longer end of the Treasury curve. We think the ten-year yield will end the year near 3%, which is a level we were at not that long ago.”
“We're forecasting an inverted yield curve at year-end. With inflation remaining high and growth slowing, discussions of stagflation or outright recession should continue to lead investor debate this year. And ultimately, that should limit the degree to which Treasury yields rise into year-end.”
- DXY loses further ground and revisits the 101.50 area.
- Activity around US yields remain anaemic on Friday.
- Inflation tracked by the PCE, U-Mich Index next of note in the docket.
The greenback, in terms of the US Dollar Index (DXY), loses further the grip and extends the downtrend well south of the 102.00 mark.
US Dollar Index weaker on risk-on trade
The index accelerates losses and breaks below the 102.00 support quite convincingly amidst further improvement in the appetite for the risk complex.
The poor performance of US yields in the cash markets do not help the buck either in a context where investors appear to have already fully priced in the well-telegraphed 50 bps rate hile at both the Fed’s June and July events.
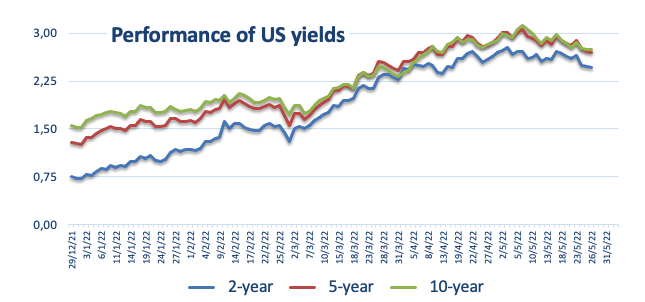
On the latter, the probability of such scenario at the June 15 meeting is at 93% and nearly 90% when it comes to the July 27 gathering, according to CME Group’s FewdWatch Tool.
In the US docket, the inflation gauged by the PCE will take centre stage seconded by the final print of the Consumer Sentiment. In addition, Trade Balance figures will be published along with Personal Income and Personal Spending.
What to look for around USD
The dollar extends the weekly leg lower and threatens to put the 101.00 zone to the test in the not-so-distant future.
In the meantime, a tighter rate path by the Federal Reserve looks more and more priced in, while the elevated inflation narrative and the tight labour market seem to still support further upside in the dollar in the longer run.
On the negatives for the greenback, the incipient speculation of a “hard landing” of the US economy as a result of the Fed’s more aggressive normalization carries the potential to undermine the bullish prospects for the buck.
Key events in the US this week: Core PCE, Personal Income/Spending, Final Consumer Sentiment (Friday).
Eminent issues on the back boiler: Speculation of a “hard landing” of the US economy. Escalating geopolitical effervescence vs. Russia and China. Fed’s more aggressive rate path this year and 2023. US-China trade conflict. Future of Biden’s Build Back Better plan.
US Dollar Index relevant levels
Now, the index is retreating 0.18% at 101.57 and faces initial support at 101.43 (monthly low May 27) followed by 101.06 (55-day SMA) and then 99.81 (weekly low April 21). On the flip side, the breakout of 105.00 (2022 high May 13) would open the door to 105.63 (high December 11 2002) and finally 106.00 (round level).
Economists at the Bank of America Global Research maintain a bullish USD bias through the summer. They note that risk sentiment is the latest driver for the greenback.
The correlation of the USD with risk sentiment has returned
"So far this month, risk sentiment has taken over as the main USD driver, with risk-off leading to both lower yields and a stronger USD, with the exception against JPY and CHF, the other safe-haven G10 currencies.”
“As the market starts pricing a stagflation scenario, the outlook for risk assets remains challenging, which is likely to keep supporting the USD."
Considering advanced prints from CME Group for natural gas futures markets, open interest dropped for the second straight session on Thursday, now by around 86.3K contracts. Volume, instead, rose for the second session in a row, this time by around 168.7K contracts.
Natural Gas remains focused on $10.00
Prices of the MMBtu of natural gas clinched fresh cycle peaks near $9.50 on Thursday before reversing that move and close with modest losses. That daily performance was amidst shrinking open interest, leaving the door open to the continuation of the uptrend in the very near term. The next big magnet for bulls still emerges at the key $10.00 mark in the short-term horizon.
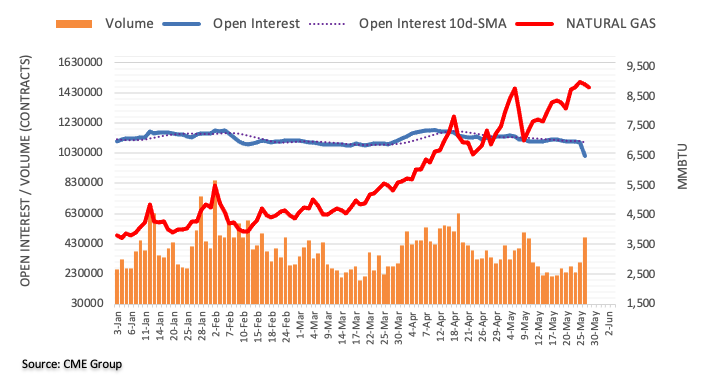
EUR/AUD was around 1.56 on the eve of Russia’s invasion of Ukraine. Its slide extended to near 1.43 by April. Economists at Westpac believe that the pair could race higher towards 1.52/53 in the short-term before turning back lower to the 1.45 area by the third quarter.
EUR/AUD could push up to 1.52/53 near-term
“Markets price the RBA cash rate above 2.50% by end-2022 versus 0.45% for the ECB key rate.”
“Given the currently fragile global risk mood including concerns over China, EUR/AUD could push up to 1.52/1.53 near-term. But we expect the aussie’s fundamentals to help the pair return to 1.45 during Q3.”
USD/CHF picks up bids from the monthly low, marked earlier in the day, as bears track downbeat options market signals, coupled with the broad US dollar weakness, amid a sluggish session.
That said, the Swiss currency (CHF) pair consolidates intraday losses around 0.9580 heading into Friday’s European session.
It’s worth noting that the one-month risk reversal (RR), the spread of call versus puts, of USD/CHF print the third weekly fall with the latest figures being -0.1000.
On a monthly basis, however, the USD/CHF options trader seems the most bearish since October 2020, with the latest figures for May being -0.750.
Also read: USD/CHF establishes below 0.9600 as DXY weakens ahead of US PCE
NZD/USD bounced immediately following the Reserve Bank of New Zealand (RBNZ) meeting, but it has struggled to hold on to gains. The focus is on the dollar side of the equation, therefore, the kiwi could enjoy gains as the greenback may have peaked, economists at ANZ Bank report.
Rate differentials are supportive of the kiwi
“Rate differentials are supportive of the kiwi. However, at the moment they are being overshadowed by growing fears in FX markets of a domestic hard landing and we view that as a potential headwind for the NZD.”
“There are signs that the USD has topped out, which is consistent with the historic tendency for the USD to peak early in the Fed tightening cycle.”
“Bringing it all together speaks to a more neutral outlook, but if the USD has peaked, that is likely to trump domestic considerations, and deliver mild further strength over coming quarters.”
- GBP/JPY has faced selling pressure around 160.50 as profit-booking kicks in.
- The BOE is expected to announce a bumper rate hike in its June monetary policy.
- The price rise should be accompanied by a wage hike to stable inflation.
The GBP/JPY pair has witnessed some offers after failing to sustain above the critical resistance of 160.50. The odds of upside seem lucrative amid a firmer rebound in the positive market sentiment. The risk-on impulse is underpinning the risk-sensitive assets and the pound bulls are enjoying liquidity at the cost of the yen bulls.
Rising Inflation in the UK area is the major catalyst, which is worrying the pound bulls. The Bank of England (BOE) is deploying the majority of its quantitative measures to control the soaring inflation. However, fixing a whopping figure of 9% inflation is not a cakewalk and it will take sufficient time to get cornered.
It is worth noting that the BOE raised its interest rate by 25 basis points (bps) in the first week of May. Officially, the benchmark rate in the UK stands at 1%. As per the market consensus, the BOE could feature a jumbo rate hike in its June monetary policy. Considering the galloping inflationary pressures, a rate hike announcement by 50 bps seems highly required.
Meanwhile, the Japanese yen is worried over grounded inflation in its region. The Statistics Bureau of Japan has reported the Tokyo Consumer Price Index (CPI) at 2.4%, lower than the estimates of 2.7% and the prior print of 2.5%. Japan’s Prime Minister Fumio Kishida stated on Wednesday that the Bank of Japan (BOJ) should make some efforts to achieve the targeted inflation rate of 2%. And BOJ Governor Harihuko Kuroda believes that the dual combo of price rise and wage hike could stable the inflation at desired levels.
CME Group’s flash data for crude oil futures markets saw investors add more than 33K contracts to their open interest positions on Thursday, reaching the second consecutive daily build. Volume followed suit and rose markedly by around 160.6K contracts, reversing the previous day’s pullback.
WTI keeps targeting $115.50 ahead of $116.60
Prices of the barrel of WTI advanced strongly on Thursday and closed above the $114.00 mark amidst increasing open interest and volume. Against that, there is now room for the continuation of the rebound with the immediate target at the weekly highs at $115.53 (May 17) ahead of $116.61 (March 24).
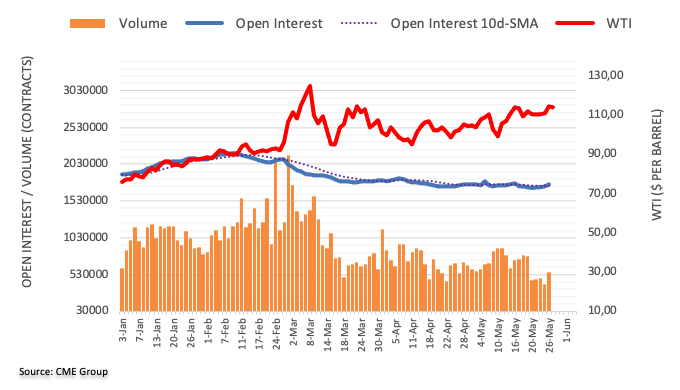
Gold Price is building on the previous rebound on the final trading day of this week. XAUUSD is supported at the 100-Simple Moving Average (SMA) at $1,846, therefore, risks are skewed to the upside in the near term, FXStreet’s Dhwani Mehta reports.
XAUUSD bulls stay hopeful whilst above $1,846
“Investors look forward to the US PCE inflation gauge for the next trading impetus in the metal, as the data will help provide further insights on the Fed’s rate hike outlook this year. The Fed’s preferred core inflation gauge is expected to have risen by 0.3% in April. Meanwhile, the prevalent risk sentiment and the end-of-the-week flows could also influence the gold price action.”
“The bright metal managed to defend the 100-SMA at $1,846. The renewed upside in gold price will gain acceptance on a four-hourly candlestick closing above the horizontal 21-DMA resistance at $1,856. The next critical target is the falling trendline resistance at $1,861. Further up, the two-week highs of $1,870 will be put to test, opening doors for a fresh upswing towards the $1,900 mark.”
“If bears yield a sustained break below the 100-SMA, it will automatically invade the triangle support as well, confirming a downside break. Although the bullish 50-SMA at $1,842 could come to the immediate rescue of gold buyers.”
Japanese Prime Minister Fumio Kishida again crossed the wires on Friday, via Reuters, by saying, "Aiming to achieve inflation target with BOJ's monetary easing, government's structural reforms, fiscal policy."
More to come
"Inflation will remain high in the coming months," European Central Bank (ECB) Governing Council member and Spanish central bank chief Pablo Hernandez de Cos said on Friday, per Reuters.
Additional comments
Inflation will gradually slow down towards the 2% goal.
The APP will end at the start of Q3, hike to follow shortly after.
The process of increasing rates should be gradual.
We don't have predetermined normalization guideline.
EUR/USD bulls take a breather
EUR/USD fails to cheer the hawkish comments from ECB policymaker as the major currency pair retreats from intrady high of 1.0765 towards 1.0750 at the latetst.
Read: EUR/USD invades 1.0760 ahead of US PCE, DXY renews monthly lows
Open interest in gold futures markets shrank for yet another session on Thursday, this time by around 2.5K contracts according to preliminary readings from CME Group. In the same line, volume dropped by around 66.2K contracts after three consecutive daily pullbacks.
Gold remains supported around $1,840
Prices of the ounce troy of bullion shed ground for the second straight session on Thursday. The move was accompanied by shrinking open interest and volume, which is indicative that a deeper pullback appears out of favour for the time being. So far, gold prices appear contained by the 200-day SMA around $1,840.
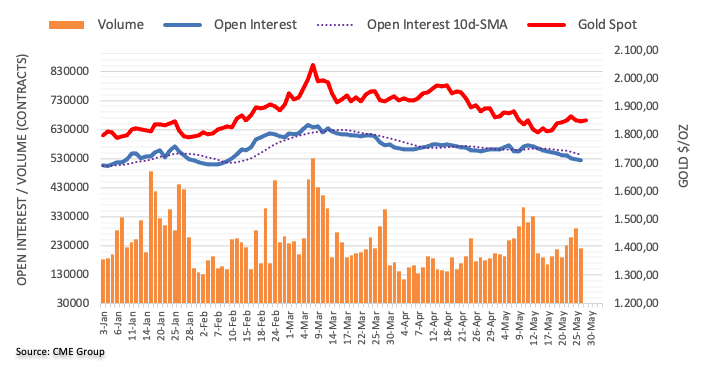
- EUR/GBP is juggling in a six-pip range amid a light economic calendar this week.
- The ECB is expected to announce its first rate hike after the pandemic period sooner.
- Fixing the CPI print of 9% will be a laborious task for the BOE.
The EUR/GBP pair is consolidating in a narrow range of 0.8498-0.8504 in the Asian session as investors are confused over the selection of currency for parking their liquidity. A firmer risk-on impulse in the market has strengthened the pound and the shared currency against the greenback, which has dwindled the market participants in choosing the optimal one. On a broader note, the shared currency bulls look more confident as the asset has remained positive over the last week.
The discussions over the decision of an embargo on oil from Russia have resumed and now Hungary is opposing the Russian oil prohibition amid its higher dependency on fossil fuels and energy from Russia. The European Union has urged Hungary to support the ‘Isolating Russia’ movement after it invaded Ukraine. Well, discussions are still on and its possibility seems sooner now.
Apart from that, investors expect a rate hike announcement by the European Central Bank (ECB). Inflation is scaling higher in the eurozone and the ECB is still far from its first rate hike after the pandemic. Dutch Central Bank head and ECB Governing Council member Klass Knot stated on Wednesday, that inflation expectations will remain well-anchored at its upper limit and a rate hike by 50 basis points (bps) is not off the table.
On the pound front, mounting fears of a recession could affect the sterling going forward. The annual inflation figure has reached 9% in the UK. The Bank of England (BOE) has got a laborious task of fixing the inflation mess, which will compel the BOE to remain extremely hawkish on monetary policy for a longer horizon.
- USD/TRY remains pressured around yearly high, probes five-day uptrend.
- Overbought RSI, bearish candlestick formation favor pullback moves.
- Three-week-old bullish channel keeps buyers hopeful, 10-DMA adds strength to the key support.
USD/TRY struggles to keep bulls on the table after the previous day’s rejection from the yearly peak. That said, the Turkish lira (TRY) pair stays pressured around 16.35 by the press time of early Friday morning in Europe.
The Turkish lira pair’s pullback from 2022’s top the previous day portrays the quote’s U-turn from the resistance line of a three-week-old rising channel.
In doing so, the USD/TRY also closed without major moves, which in turn portrayed the bearish Doji candlestick on the multi-day high. Adding to the bearish bias is the overbought RSI condition.
Hence, the USD/TRY prices are likely to witness a pullback towards the 16.00 threshold. Though, a convergence of the 10-DMA and support line of the aforementioned channel restricts the pairs’ further downside.
Should the quote break the 16.00 support, the odds of its slump towards refreshing the weekly low near 15.68 can’t be ruled out.
Alternatively, the pair’s further upside needs to cross the latest high surrounding 16.50 to reject the bearish candlestick formation.
Even so, the stated channel’s upper line near 16.55 will act as an extra filter to the north for the pair.
USD/TRY: Daily chart
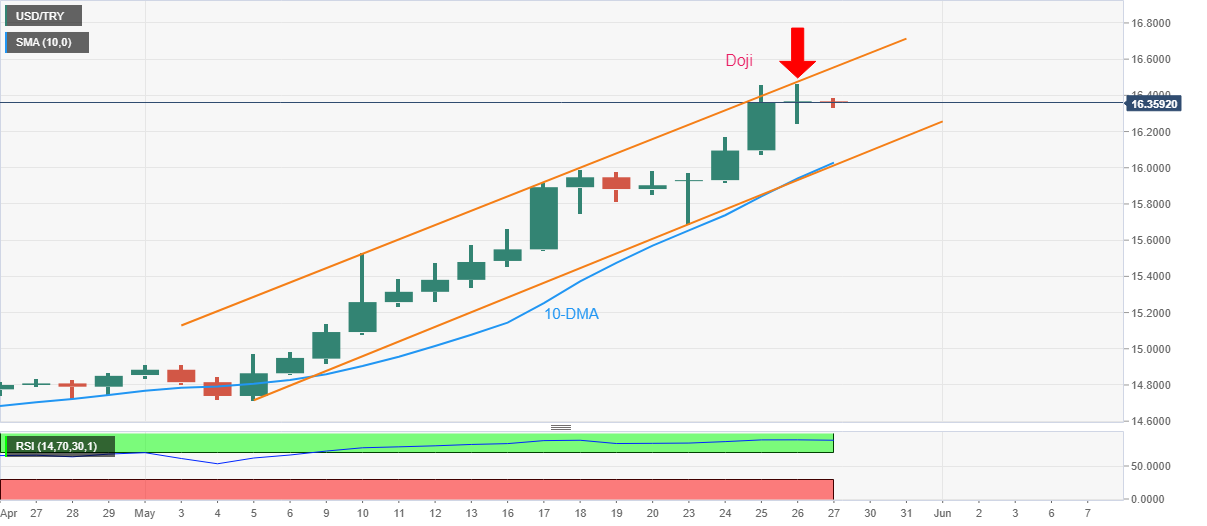
Trend: Pullback expected
- USD/JPY is expected to witness a pullback selling action amid broader weakness in the DXY.
- Investors have started ignoring the uncertainty over the rate hike decision by the Fed.
- The Tokyo inflation has tumbled to 2.4% vs. 2.7% estimates and 2.5% earlier.
The USD/JPY has witnessed an unreliable rebound after hitting an intraday low of 126.67 in the Asian session. The asset has been trading in a defined range since Tuesday and is expected to continue its volatility contraction amid the unavailability of any significant economic event in today’s session. Considering the ongoing weakness in the greenback on a broader note, the asset may find offers soon and will resume its downside journey. The asset is oscillating around critical support of 127.00.
Fading Federal Reserve (Fed)’s rate hike fears in the global markets have brought an extreme sell-off in the US dollar index (DXY). The DXY has printed a fresh monthly low at 101.43 and the market participants are betting over more weakness in the counter on dismal Gross Domestic Product (GDP) numbers. The US Bureau of Economic Analysis reported the annualized GDP numbers at -1.5%, lower than the estimates of -1.3% and the prior print of -1.4%.
On the Japanese yen front, the Statistics Bureau of Japan has released the Tokyo Consumer Price Index (CPI) at 2.4%, lower than the estimates of 2.7% and the prior print of 2.5%. The Japanese administration is worrying over the anchored price pressures. In response to that, Bank of Japan (BOJ) Governor Haruhiko Kuroda has commented that the price rise should be accompanied by wage hikes in order to sustain inflation at desired levels.
- Copper rebounds from weekly low, picks up bids of late.
- Mixed sentiment, downbeat US data directs US dollar towards refreshing monthly low.
- China data, fears of economic slowdown poke metal buyers.
Copper futures on COMEX recall buyers after three days of rejections as the US dollar weakness underpins commodity buying. That said, the quote rises to $4.29 by the press time of early Friday morning in Europe.
Prices of the three-month copper on the London Metal Exchange (LME) and the most-traded July copper contract in Shanghai also portray notable gains of late, respectively around 1.1% and 1.3% as the prices rise to near $9,550 and $10,700 in that order.
The US Dollar Index (DXY) refreshes the monthly low at the 101.43 level as market participants cheer the lack of uncertainty over the Fed’s next move with zeal. Also weighing on the greenback could be the recently downbeat US data. It should be noted that the latest FOMC Minutes and Fedspeak have both confirmed two 50 bps rate hikes, which the market seems to have already priced and hence allows traders to trigger the month-end profit booking moves of the USD.
That said, the US preliminary Q1 2022 Annualized GDP eased to -1.5%, below -1.4% prior and -1.3% forecasts, whereas the Pending Home Sales slumped in April, to -3.9% versus -2.0% forecast.
It’s worth noting, however, that downbeat data from China and fears of global recession, as well as cautious mood ahead of the US Federal Reserve’s (Fed) preferred inflation gauge, namely the US Core Personal Consumption Expenditure (PCE) Price Index, tests buyers.
China’s Industrial Profits for the January-April period dropped to 3.5% versus 8.5% prior whereas the figures for April slumped to -8.5% versus 12.2% previous gains.
Hence, copper’s recent gains remain doubtful amid macro pessimism. Though, softer US data may help the red metal to extend the month-end consolidation.
Technical analysis
A weekly high around $4.35 holds the key to COMEX Copper’s further upside.
- USD/CAD remains on the back foot around the lowest levels in three weeks.
- Break of monthly support, descending RSI keeps sellers hopeful.
- Bulls need to cross 21-DMA to retake control, 100/50-DMAs lure bears.
USD/CAD takes offers to refresh intraday low, also the lowest level in three weeks, as bears cheer a clear downside break of the monthly support. That said, the Loonie pair stays depressed at around 1.2750 by the press time of early Friday morning in Europe.
An absence of oversold RSI joins the aforementioned trend line breakdown to favor sellers targeting a convergence of the 100-DMA and the 50-DMA, near 1.2700-2690.
However, the USD/CAD weakness past 1.2690 appears difficult, which if taken place could direct the quote towards an upward sloping support line from April 05, close to 1.2585.
Meanwhile, the support-turned-resistance line from late April, near 1.2785, restricts the USD/CAD pair’s recovery moves.
Following that, a two-week-old resistance line and the 21-DMA, respectively around 1.2840 and 1.2865, will challenge the buyers.
Overall, USD/CAD bears are all set to refresh the monthly low but the key moving averages may restrict further declines.
USD/CAD: Daily chart
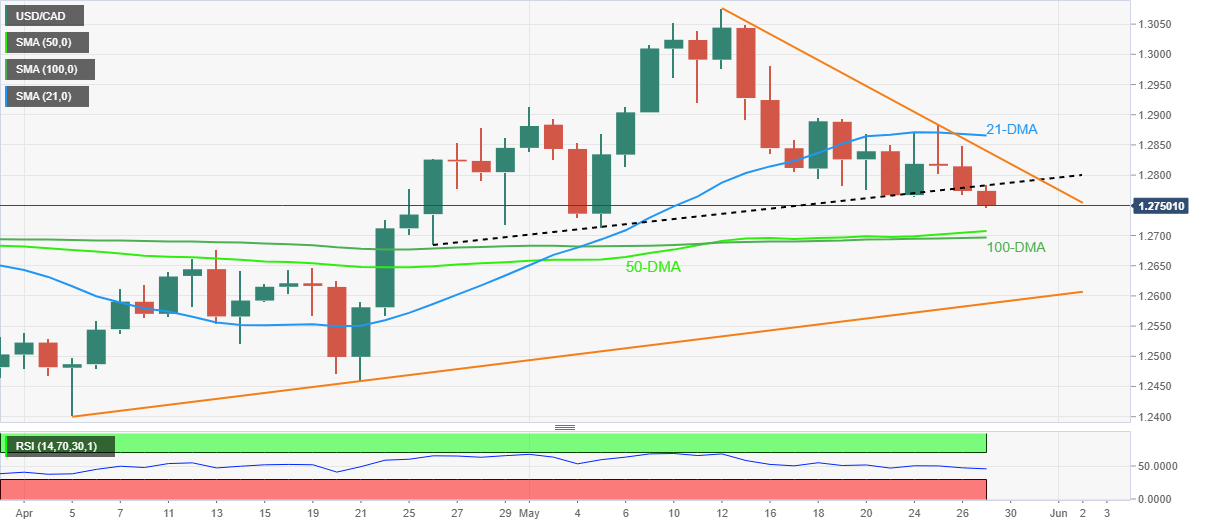
Trend: Further downside expected
- A broad-based optimism has been witnessed in the markets as Fed rate hike fears faded.
- The DXY has refreshed its monthly lows at 101.43, more downside looks possible.
- Oil prices are boiling on renewed supply concerns.
Markets in the Asian domain have rebounded strongly after following positive cues from the Western indices. The risk-on impulse has rebounded firmly and investors are pouring funds into the global equities. Therefore, bulls are enjoying liquidity on a cheerful Friday.
At the press time, Japan’s Nikkei 225 added 0.64%, China A50 jumped more than 1%, Hang Sang surged almost 3% while India’s Nifty50 gained 0.80%.
The US dollar index (DXY) has plunged in the Asian session as fears of jumbo rate hikes by the Federal Reserve (Fed) have started fading now. Investors are realizing the fact that the honeymoon period in which the central banks injected helicopter money is over now and it’s high time to return back to the neutral rates. Rising demand for risk-sensitive currencies has diminished the safe-haven’s appeal. The DXY has refreshed its monthly lows at 101.43. More downside looks possible considering the soaring market mood.
On the oil front, a rebound in fossil fuel prices has been witnessed as the expectations of an embargo on oil from Moscow bolstered. The EU urged Hungary to withdraw its opposition to the prohibition of Russian oil imports. Earlier, Hungary declined the proposal of a sudden ban on Russian oil amid its higher dependency on its energy requirements from the Kremlin. The black gold has jumped to near $115.00 and is expected to extend its gains further.
- Gold prices snap two-day downtrend as 200-DMA limits short-term fall.
- Downbeat US data, mixed sentiment underpin US dollar weakness ahead of Fed’s preferred inflation gauge.
- Monthly resistance lures buyers but geopolitical, covid headlines test upside momentum.
- Gold dropped as expected & rebound in progress
Gold Price (XAU/USD) marks another bounce off the 200-DMA as bulls flirt with the $1,855 during Friday’s Asian session. In doing so, the bullion prices print the first daily gains in three while bracing for the key upside hurdle.
The yellow metal cheers the broad US dollar weakness amid the market’s indecision. However, the metal’s gains seem to be challenged by the cautious mood ahead of the US Federal Reserve (Fed) preferred inflation gauge, namely the US Core Personal Consumption Expenditure (PCE) Price Index.
The US Dollar Index (DXY) refreshes the monthly low at the 101.43 level as market participants welcomed the lack of uncertainty over the Fed’s next move with zeal. Also weighing on the greenback could be the recently downbeat US data. It should be noted that the latest FOMC Minutes and Fedspeak have both confirmed two 50 bps rate hikes, which the market seems to have already priced and hence allows traders to trigger the month-end profit booking moves of the USD.
That said, the US preliminary Q1 2022 Annualized GDP eased to -1.5%, below -1.4% prior and -1.3% forecasts, whereas the Pending Home Sales slumped in April, to -3.9% versus -2.0% forecast.
While the DXY weakness underpins gold’s upside momentum, downbeat data from China and fears of global recession, as well as cautious mood ahead of the key US data test buyers.
China’s Industrial Profits for the January-April period dropped to 3.5% versus 8.5% prior whereas the figures for April slumped to -8.5% versus 12.2% previous gains.
Among the risk-negative negative catalysts are headlines suggesting the US-Taiwan ties, which China dislikes. On the same line are the fears of a global recession. Additionally, Russia’s refrain from stepping back and Ukraine’s readiness to fight more also keeps weighing on the sentiment.
Amid these plays, the US 10-year Treasury yields remained indecisive around 2.75% while the S&P 500 Futures print mild losses around 4,050, down 0.10% intraday at the latest.
Looking forward, the US Dollar Index weakness and mixed catalysts may keep XAU/USD buyers hopeful ahead of the US Core Personal Consumption Expenditure (PCE) Price Index for April, expected at 4.9% YoY versus 5.2% prior. Should the Fed’s preferred inflation gauge rise more than expected, the US dollar may consolidate recent losses and probe the gold buyers.
Technical analysis
Gold portrays the second bounce off the 200-DMA with its latest run-up, suggesting the buyer’s hesitance in leaving the desk. The upside momentum could also gain support from the bullish MACD signals and steady RSI (14).
Hence, the metal prices are likely to extend the latest rebound towards a one-month-old descending resistance line, around $1,868 by the press time.
It’s worth noting that gold’s run-up beyond $1,868 needs validation from the weekly top near $1,870 before directing buyers towards the month’s high close to $1,910.
Alternatively, pullback moves remain elusive beyond the 200-DMA level of $1,839, a break of which will direct the gold sellers towards the $1,808-07 support zone.
In a case where gold bears keep reins past $1,807, the monthly low of around $1,785 will be in focus.
Gold: Daily chart
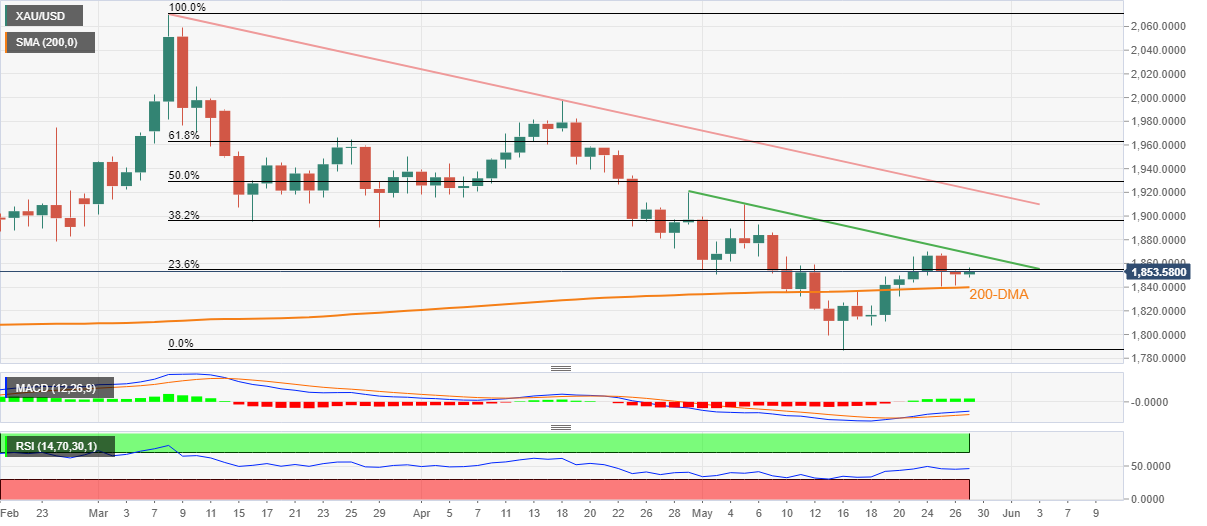
Trend: Further upside expected
- A bullish reversal has been triggered as the asset has overstepped 38.2% Fibo retracement.
- The asset is comfortably balancing above the 200-EMA.
- The RSI (14) has shifted into a 60.00-80.00 range, which adds to the upside filters.
The GBP/USD pair is sensing a mild selling pressure near 1.2660 after a vertical upside move in the Asian session. The cable has remained in the grip of bulls after hitting the monthly lows at 1.2155. A two-day winning streak has been continued by the pound bulls on Friday after overstepping Thursday’s high at 1.2621.
On a four-hour scale, the cable has overstepped 38.2% Fibonacci retracement (which is placed from March 23 high at 1.3300 to May 13 low at 1.2155) at 1.2590. Usually, overstepping of 38.2% Fibo retracement is considered as a bullish reversal in the counter.
The asset has comfortably established above the 200-period Exponential Moving Average (EMA) at 1.2613, which adds to the upside filters. Also, the asset holds above the 50-EMA near 1.2500.
Meanwhile, the Relative Strength Index (RSI) (14) has shifted into a bullish range of 60.00-80.00, which signals the strength of the sterling bulls.
A minor pullback move towards the 200-EMA at 1.2613 will be an optimal buying opportunity for investors, which will drive the major towards Friday’s high at 1.2667, followed by the round-level resistance at 1.2700.
On the flip side, the greenback bulls could regain control if the asset drops below weekly lows at 1.2471. An occurrence of the same will drag the asset towards 23.6% Fibo retracement at 1.2415, followed by May 9 low at 1.2260.
GBP/USD hourly chart
-637892207132710257.png)
- AUD/USD takes the bids to refresh the highest levels in three weeks.
- Absence of overbought RSI suggests further advances past 200-SMA.
- 100-SMA, previous resistance line from April limit immediate downside.
AUD/USD prints the biggest daily gains in four as bulls attack the 200-SMA surrounding 0.7140 amid Friday’s Asian session.
The Aussie pair’s upside momentum could be linked to the recent break of the weekly hurdle, near 0.7105.
Despite the latest jump, the RSI (14) line has some room to the north, which in turn favors buyers.
However, the 200-SMA level surrounding 0.7140 appears immediate hurdle for the AUD/USD bulls to cross before heading towards the 50% Fibonacci retracement of April-May downside, near 0.7250.
In a case where the quote rises past 0.7250, the monthly peak of 0.7267 will gain the market’s attention.
On the contrary, pullback moves remain elusive until staying beyond the previous resistance confluence around 0.7020, including the 100-SMA and descending trend line from April 05.
Following that, the 0.7000 threshold and 0.6950 may entertain AUD/USD sellers before directing them to the monthly low of 0.6828.
AUD/USD: Four-hour chart

Trend: Further upside expected
- USD/INR eyes the first weekly loss in four despite the latest inaction.
- Moody’s cut India’s calendar year 2022 GDP forecasts to 8.8%.
- US dollar’s slump to monthly low challenges buyers ahead of the Fed’s preferred inflation gauge.
USD/INR pares daily losses around 77.60, following an uptick towards the weekly top, as India’s GDP cut battles broad US dollar weakness during early Friday.
Moody’s Investors Service cut India’s Calendar Year (CY) 2022 GDP forecasts to 8.8% from 9.1% anticipated in March. The global rating institute mentioned that the rising inflation and interest rates will temper the economic growth momentum.
“Even after the latest downward revision, the GDP forecast by Moodys remains among the most optimistic. While the RBI has projected that the economy will grow 7.2% in financial year 2022-23 (FY23), Fitch expects the economy to grow 8.5%. To be sure, Moodys has not yet revised its FY23 GDP forecast for India, which remains at 9.1%,” mentioned the Business Standard news shared by Reuters.
It’s worth noting that the inflation and growth fears also weigh on the US dollar and restrict the USD/INR upside despite INR-negative news. That said, the US Dollar Index (DXY) refreshes the monthly low at the 101.43 level as market participants welcomed the lack of uncertainty over the Fed’s next move with zeal. Also weighing on the greenback could be the recently downbeat US data.
The US preliminary Q1 2022 Annualized GDP eased to -1.5%, below -1.4% prior and -1.3% forecasts, whereas the Pending Home Sales slumped in April, to -3.9% versus -2.0% forecast.
Not only in India and the US, China’s softer Industrial Profits for the January-April period, 3.5% versus 8.5% prior, also restrict the USD/INR downside, due to China’s status as the world’s biggest industrial player and the Asian leader.
Against this backdrop, the US 10-year Treasury yields remain indecisive around 2.75% while the S&P 500 Futures print mild losses around 4,050, down 0.15% intraday at the latest.
Looking forward, the US Dollar Index weakness and mixed catalysts may keep USD/INR sellers hopeful ahead of the US Core Personal Consumption Expenditure (PCE) Price Index for April, expected at 4.9% YoY versus 5.2% prior. However, pessimism surrounding the Indian economy could restrict the USD/INR downside.
Technical analysis
Despite the latest run-up, USD/INR remains inside the 50-pip trading range between 77.85 and 77.35. It’s worth noting, however, that the oscillators portray a gradual loss of upside momentum, which in turn keeps the pair sellers hopeful.
- EUR/USD has renewed its monthly highs at 1.0765 on the soaring market mood.
- Rising odds of a rate hike by the ECB have supported the euro bulls.
- The DXY has extended its losses after slipping to the weekly low at 101.65.
The EUR/USD pair is advancing sharply higher on broader weakness in the greenback. The pair has attacked 1.0760 and is expected to extend its gains further on a bullish open-drive set up in the Asian session. The shared currency bulls are driving the asset strongly higher right from the first auction. The asset has renewed its monthly highs at 1.0765 and bullish momentum is still intact.
The euro bulls are enjoying bids from the market participants on advancing expectations of the first rate hike announcement by the European Central Bank (ECB) in June. Price pressures are soaring over the last few months and the ECB has yet not stepped up its interest rates like the other Western leaders, which are not taking the bullet anymore. Dutch Central Bank head and ECB Governing Council member Klass Knot stated on Wednesday that inflation expectations will remain well-anchored at its upper limit and a rate hike by 50 basis points (bps) is not off the table.
Meanwhile, the US dollar index (DXY) has renewed its monthly lows at 101.43. The asset is falling like a house of cards on underpinned risk-on impulse in the market. The negative market sentiment has lost its traction and risk-perceived assets are scaling sharply higher. The asset has extended its losses in the Asian session after slipping below the weekly low at 101.65.
For further guidance, investors are awaiting the release of the US Personal Consumption Expenditure (PCE) Price Index, which is due in the New York session. The annualized figure is seen as stable at 6.65 while the monthly figure could slip to 0.8%.
Japanese Prime Minister Fumio Kishida was back on the wires on Friday, via Reuters, noting that the “recent yen moves are driven by various factors,” adding that the government’s priority is to help ease the pain on households, and businesses via various policy measures.”
Additional comments
“Steps to avoid the outflow of funds from Japan, such as promoting renewable energy and inbound tourism, will contribute to stabilizing FX moves.”
“Expect BOJ to continue efforts to achieve inflation target based on a government-BOJ joint statement.”
Related reads
- BOJ’s Kuroda: Inflation won't rise sustainably, stably unless accompanied by wage hikes
- USD/JPY slides below 127.00 on mixed Tokyo CPI, focus on US PCE Inflation
- AUD/JPY is struggling around 90.40 but upside remains favored on satisfactory aussie Retail Sales.
- The Retail Sales have landed at 0.9% as expected by the market participants.
- BOJ’s Kuroda seeks wage hikes to keep inflation at desired levels.
The AUD/JPY pair has touched a high of 90.54 in the Asian session after the Australian Bureau of Statistics reported the Retail Sales. The economic data has come in line with the forecasts of 0.9% but lower than the prior print of 1.6%. An aligned Retail Sales data with the preliminary estimates have underpinned aussie against the Japanese yen. Despite soaring inflation and tightening monetary policy, the economy has managed to report decent Retail Sales.
The antipodean is also performing better against Tokyo on active risk-on impulse. Positive market sentiment has strengthened the risk-perceived currencies.
Investors are betting on more rate hikes by the Reserve Bank of Australia (RBA) as mounting inflationary pressures are complicating the situation for the households. Firing oil and commodity prices are affecting the real income of the households and eventually posing challenging tasks for RBA policymakers.
On the Japanese yen front, Japanese Prime Minister Fumio Kishida urged the Bank of Japan (BOJ) on Thursday that the BOJ should make some efforts to achieve the targeted inflation rate of 2%. In response to that, BOJ’s Governor Haruhiko Kuroda has commented that the price rise should be accompanied by wage hikes in to sustain inflation at desired levels. The Japanese yen performed well this week on upbeat Purchase Managers Index (PMI) data. The Manufacturing PMI landed at 53.2, against the forecasts of 52 while the Services PMI was recorded at 51.7, higher in comparison with the estimates of 50.6.
More comments flowing in from Bank of Japan Governor Haruhiko Kuroda, as he now sheds some light on the central bank’s inflation outlook.
Unless energy prices drop sharply, Japan's core CPI is likely to remain around 2% for about 12 months.
BOJ will continue to work closely with government, strive to achieve 2% inflation target.
Prices won't rise sustainably, stably unless accompanied by wage hikes.
Market reaction
USD/JPY is testing daily lows near 126.70, down 0.34% on the day. The move lower in the pair is mainly driven by the broad-based US dollar sell-off in Asia, as the Japanese authorities continue with their verbal intervention.
- DXY extends the previous day’s losses towards testing the lowest levels in five weeks.
- Bearish MACD signals, absence of oversold RSI favor sellers.
- 50-DMA, 50% Fibonacci retracement level challenge further downside.
- Bulls remain hopeful unless the quote crosses 103.30 hurdle.
US Dollar Index (DXY) stands a slippery ground as it refreshes its monthly low around 101.45 during Friday’s Asian session.
In doing so, the greenback gauge extends the previous day’s pullback amid bearish MACD signals. Also adding strength to the bearish bias is the descending RSI (14) line, not oversold.
However, a convergence of the 50-DMA and 50% Fibonacci retracement of late March to early May upside, around 101.30, appears a tough nut to crack for the bears.
Following that, the 101.00 threshold, also comprising mid-April tops, may entertain DXY bears ahead of directing them to the late March high near 99.35.
Meanwhile, recovery moves remain elusive below a downward sloping trend line from May 16, close to 102.40 by the press time.
Also challenging the US Dollar Index upside is the previous support line from late March, around 103.30, a break of which can recall the 104.00 round figure in the chart.
DXY: Daily chart
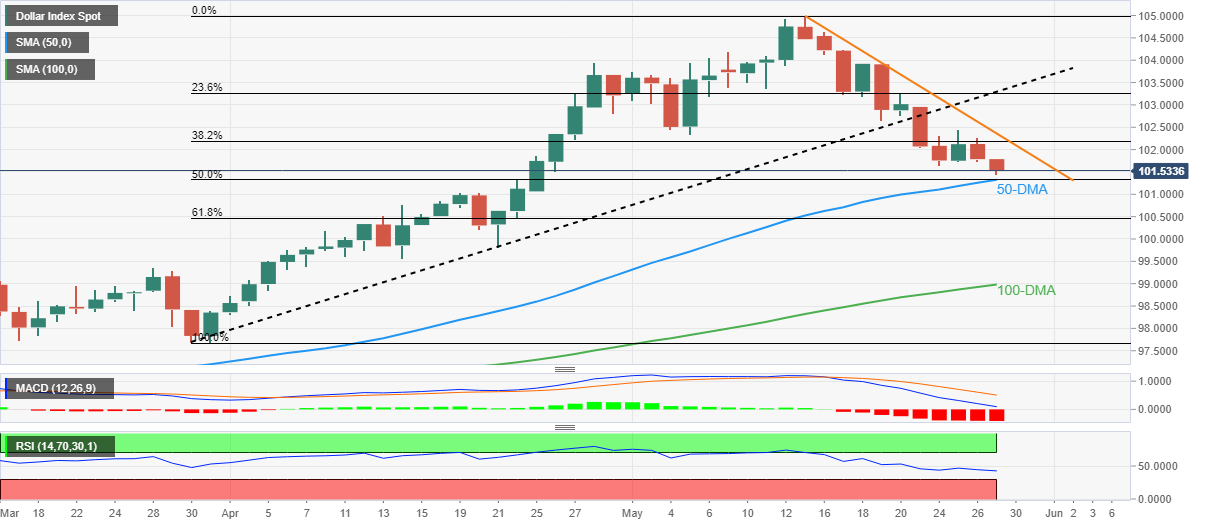
Trend: Limited downside expected
| Raw materials | Closed | Change, % |
|---|---|---|
| Brent | 117.46 | 2.66 |
| Silver | 22.022 | 0.16 |
| Gold | 1850.74 | -0.1 |
| Palladium | 2014.77 | 0.49 |
- NZD/USD stays bid around monthly top marked earlier in the week.
- US dollar fails to rebound as traders fear US economic slowdown, Fed’s fixed path of 50 bps rate hikes.
- Market sentiment dwindles on headlines from China, Russia.
NZD/USD prints the biggest daily gains in four days as bulls poke the monthly high surrounding 0.6500 during Friday’s Asian session. In doing so, the Kiwi pair cheers broad US dollar weakness while paying a little heed to softer China data, as well as geopolitical concerns relating to Russia and Taiwan.
That said, the US Dollar Index (DXY) refreshes the monthly low at the 101.43 level as market participants welcomed the lack of uncertainty over the Fed’s next move with zeal. Also weighing on the greenback could be the recently downbeat US data.
The US preliminary Q1 2022 Annualized GDP eased to -1.5%, below -1.4% prior and -1.3% forecasts, whereas the Pending Home Sales slumped in April, to -3.9% versus -2.0% forecast.
Elsewhere, China’s Industrial Profits for the January-April period dropped to 3.5% versus 8.5% prior whereas the figures for April slumped to -8.5% versus 12.2% previous gains.
It should be noted that risk appetite remains mixed and should have weighed the NZD/USD prices but does not. Among the risk-negative negative catalysts are headlines suggesting the US-Taiwan ties, which China dislikes. On the same line are the fears of a global recession. Additionally, Russia’s refrain from stepping back and Ukraine’s readiness to fight more also keeps weighing on the sentiment.
Amid these plays, the US 10-year Treasury yields remained indecisive around 2.75% while the S&P 500 Futures print mild losses around 4,050, down 0.10% intraday at the latest.
Looking forward, the US Dollar Index weakness and mixed catalysts may keep NZD/USD sellers hopeful ahead of the US Core Personal Consumption Expenditure (PCE) Price Index for April, expected at 4.9% YoY versus 5.2% prior.
Read: US Core PCE Preview: Why there is room for a dollar-lifting upside surprise
Technical analysis
Sustained trading beyond the two-week-old rising trend line, around 0.6410, directs NZD/USD buyers towards the 0.6565-70 resistance area comprising the monthly high and the 50-day EMA.
Russian Deputy Prime Minister Alexander Novak said late Thursday, the country’s “oil production is expected to decline to 480-500 million tonnes this year from 524 million tonnes in 2021.”
Additional quotes
“The forecast is subject to change.”
“I think there will be a recovery in the future.”
Market reaction
WTI was last seen trading at $113.00, down 0.21% on the day.
-
WTI Price Analysis: Steadies above $113.00, six-week-old resistance line in focus
- Gold bulls are moving in again as the US dollar continues to bleed out.
- The bears are lurking on the longer-term time frames.
The gold price pared some early losses overnight as investors continued to move out of the US dollar making it cheaper to buy the safe-haven precious metal. At $1,853, XAU/USD is a touch higher in Asis, chalking up 0.18% of gains at the time of writing as it moves in for a fresh high on the day at $1,854.27 so far.
''The prospects of an economic slowdown driven by lockdowns in China and the Russia-Ukraine war have boosted safe-haven buying,'' analysts at ANZ Bank explained. ''However, this is being offset by concerns of an aggressive rate hike cycle by the US Federal Reserve. Ultimately what inflation does over the next couple of months will have a big part to play in gold’s performance.''
Minutes of the Fed's May 3-4 policy meeting highlighted that most participants favour additional 50 basis point rate hikes at the June and July meetings. This is arguably a thorn in the side for the gold bugs because higher short-term US interest rates and bond yields raise the opportunity cost of holding bullion, which yields nothing. ''Without the conviction that the Fed could blink, there are few participants remaining to buy gold, which still leaves a liquidation vacuum as the playbook in gold,'' analysts at TD Securities argued.
However, US Treasury yields were subdued after the benchmark 10-year note hit a fresh six-week low. Traders and investors will weigh the inflation risks but the concerns are continuing to dissipate as economic data and corporate announcements point to slower growth. Additionally, the dollar index (DXY) is set for a second straight weekly decline, making bullion less expensive for buyers. At the time of writing, DXY is down some 0.32% at 101.437.
From a more bearish perspective, analysts at TD Securities argued that ''trend followers have completed their buying program, and still remain long, which argues for additional downside on the horizon as momentum persists to the downside, with the macro narrative sapping investment demand for gold''.
Gold technical analysis
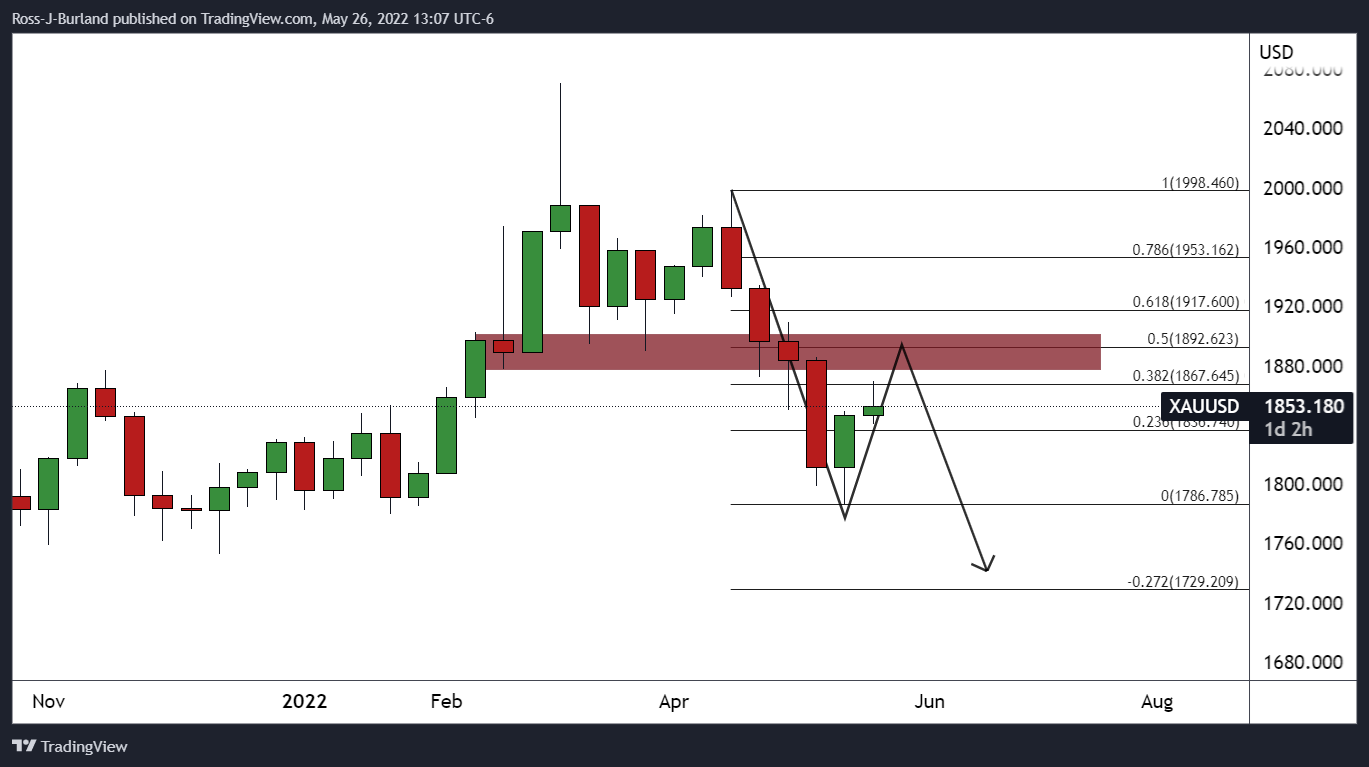
This week's candle is bullish and the bulls have corrected to a 38.2% ratio milestone with prospects of a 50% mean reversion in due course.
- USD/CNH takes offers to renew intraday low, snaps two-day uptrend at weekly top.
- China’s Industrial Profits rose 3.5% during January-April versus 8.5% prior.
- Overbought RSI, key hurdles triggered the latest retreat suggesting further weakness towards 100-SMA.
- Previous resistance from early acts as an extra filter to the south, bulls need to break 6.7900 to retake control.
USD/CNH remains on the back foot around the intraday low of 6.7515 as sellers cheer the broad US dollar weakness, by also ignoring the downbeat China data during Friday’s Asian session.
That said, China’s Industrial Profits for the January-April period dropped to 3.5% versus 8.5% prior whereas the figures for April slumped to -8.5% versus 12.2% previous gains.
Technically, multiple levels marked since May 12, near 6.7860-7900, joined overbought RSI conditions to trigger the latest AUD/USD weakness.
Also keeping the sellers hopeful is the pair’s inability to cross the previous support line from late April, around 6.7750 by the press time.
The quote’s latest weakness eyes the 100-SMA level of 6.7390. However, the previous resistance line from early May, close to 6.7100, could test the bears afterward.
Should USD/CNH prices drop below 6.7100, the 61.8% Fibonacci retracement of late April to early May upside, near 6.6575, will be in focus.
USD/CNH: Four-hour chart
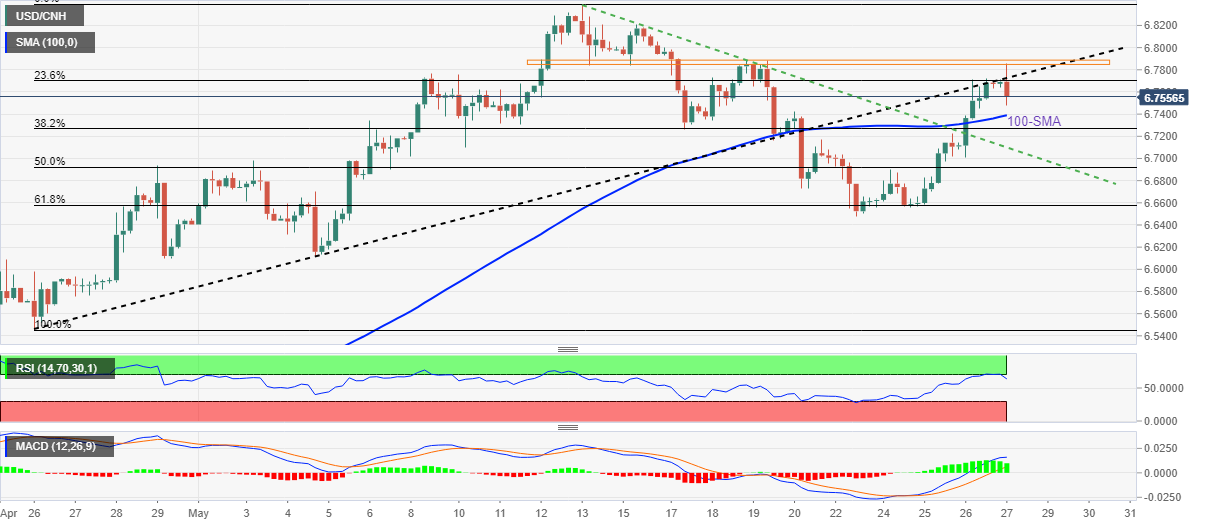
Trend: Further weakness expected
The US and Taiwan are planning to announce economic talks to deepen their ties, Bloomberg reported on Friday, citing unnamed 'people familiar with the matter.'
Key takeaways
“Bilateral economic talks to be announced in the coming weeks.”
“Talks would focus on enhancing economic cooperation and supply-chain resiliency, falling short of a traditional free-trade agreement. “
“The deal is likely to include areas of trade facilitation, supply-chain work and trade in agricultural products.”
Market reaction
The confirmation of the proposed talks between the US and Taiwan is unlikely to go down well with China, although markets seem to have ignored that for now.
AUD/USD, the Chinese proxy, is jumping 0.51% on the day to trade around 0.7135, as of writing.
Meanwhile, the S&P 500 futures are losing 0.12% so far.
- AUD/USD takes the bids to refresh intraday high despite no surprises from Aussie data.
- Australia’s seasonally adjusted Retail Sales for April march 0.9% MoM Forecasts.
- Market sentiment sours amid fears emanating from China, US dollar stays pressured around monthly low.
- US PCE Price Index, risk catalysts eyed for fresh impulse.
AUD/USD takes the bids to approach the weekly top surrounding 0.7130 during Friday’s Asian session. In doing so, the Aussie pair fails to justify the Retail Sales data that matched market forecasts. The reason could be linked to the fresh monthly low o the US Dollar Index (DXY).
Australia’s preliminary readings of seasonally adjusted Retail Sales for April match the 0.9% market consensus, versus 1.6% prior.
Read: Aussie Retail Sales arrives at 0.9% as expected, AUD/USD perky around 0.7105
It’s worth noting, however, that the sour sentiment challenges AUD/USD buyers due to the pair’s risk-barometer status.
Among the negatives are the latest news from Bloomberg saying, “US plans economic talks with Taiwan in latest challenge to China.” On the same line are the fears of global economic slowdown, mainly due to covid-led lockdown in China and the Russia-Ukraine crisis.
Alternatively, softer US data weighed on the US dollar as market participants welcomed the lack of uncertainty over the Fed’s next move with zeal, showing confidence in the 50 bps rate hikes during the next two meetings. That said, the US preliminary Q1 2022 Annualized GDP eased to -1.5%, below -1.4% prior and -1.3% forecasts, whereas the Pending Home Sales slumped in April, to -3.9% versus -2.0% forecast.
Amid these plays, the US 10-year Treasury yields remained indecisive around 2.75% while the S&P 500 Futures print mild losses around 4,050, down 0.10% intraday at the latest.
Moving on, the US Dollar Index weakness and mixed catalysts may test AUD/USD moves ahead of the US Core Personal Consumption Expenditure (PCE) Price Index for April, expected at 4.9% YoY versus 5.2% prior.
Read: US Core PCE Preview: Why there is room for a dollar-lifting upside surprise
Technical analysis
Unless breaking convergence of the 21-DMA and previous resistance line from early April, around 0.7030, AUD/USD appears capable of refreshing its weekly high, currently around 0.7130.
Australia's April Retail Sales have been released as follows:
Aussie Retail Sales
Australia April Retail Sales +0.9 pct m/m s/adj (Reuters poll +0.9 pct).
Prior to the data, analysts at Westpac argued that card spending indicators suggested retail sales should sustain strong momentum (March +1.6%), but explained weakening consumer sentiment and elevated prices add downside risk.
AUD/USD update
The data had failed to move the needle on the Aussie initially but a bid has come in four minutes following the release and it has moved higher to 0.7120 the high so far from 0.7105 on the data.
About Retail Sales
The primary gauge of Australia’s consumer spending, the Retail Sales, is released by the Australian Bureau of Statistics (ABS) about 35 days after the month ends. It accounts for approximately 80% of total retail turnover in the country and, therefore, has a significant bearing on inflation and GDP. This leading indicator has a direct correlation with inflation and the growth prospects, impacting the Reserve Bank of Australia’s (RBA) interest rates decision and AUD valuation. The stats bureau uses the forward factor method, ensuring that the seasonal factors are not distorted by COVID-19 impacts.
In recent trade today, the People’s Bank of China (PBOC) set the yuan (CNY) at 6.7387 vs. the estimate of 6.7314 and the previous 6.6766.
About the fix
China maintains strict control of the yuan’s rate on the mainland.
The onshore yuan (CNY) differs from the offshore one (CNH) in trading restrictions, this last one is not as tightly controlled.
Each morning, the People’s Bank of China (PBOC) sets a so-called daily midpoint fix, based on the yuan’s previous day's closing level and quotations taken from the inter-bank dealer.
- AUD/NZD bounces off intraday low but struggles to reject key support break.
- Bearish MACD signals, sustained trading below 20-DMA keep sellers hopeful.
- Bulls need validation from three-week-old resistance line, 1.0830 appears a tough nut to crack for sellers.
AUD/NZD picks up bids to consolidate intraday losses around 1.0955 during Friday’s Asian session.
In doing so, the cross-currency pair marks another bounce off the 50-DMA. However, the clear downbeat break of the previous support line from mid-March, around 1.0975 by the press time, keeps the bears hopeful.
Also favoring the bearish bias is the MACD conditions and successful trading below the 20-DMA.
That said, the quote’s further weakness needs validation from the 50-DMA level of 1.0920 before declining towards the 1.0830 key support, including the 61.8% Fibonacci retracement (Fibo.) of March-May upside.
On the contrary, an upside break of the support-turned-resistance line, near 1.0975, will direct the AUD/NZD prices towards the 20-DMA level of 1.1015.
However, the pair buyers remain unconvinced until the quote stays below a downward sloping resistance line from early May, close to 1.1065.
AUD/NZD: Daily chart
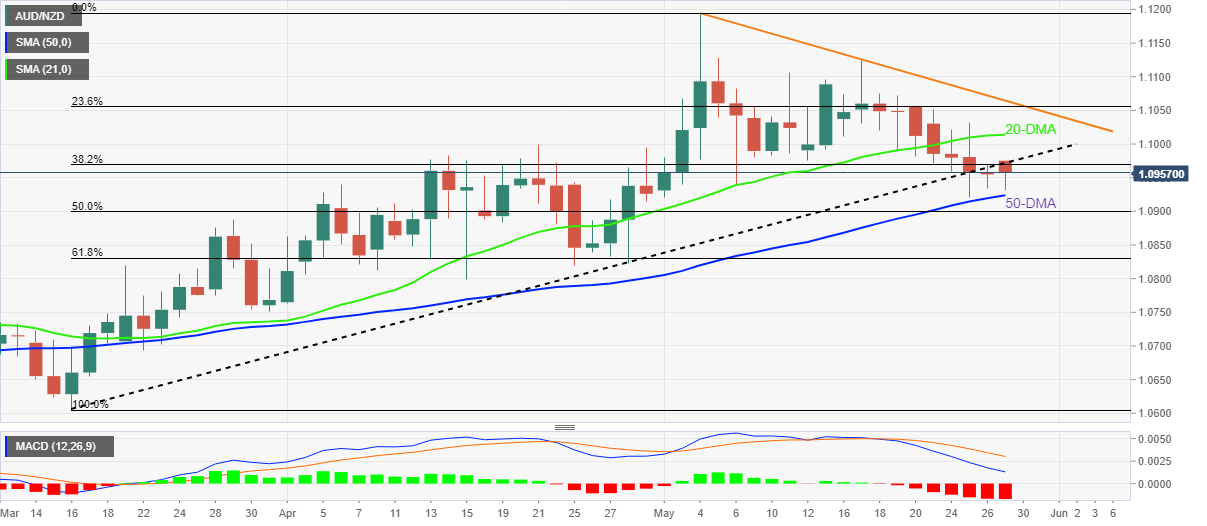
Trend: Further weakness expected
- USD/CAD is oscillating below 1.2800 as DXY has lost its strength amid the soaring market mood.
- Investors have underpinned loonie against the greenback despite weak Canada Retail Sales.
- Higher oil prices have empowered the Canadian dollar.
The USD/CAD pair is displaying back and forth moves in a narrow range of 1.2768-1.2784 and is eyeing to decline towards the monthly lows at 1.2714. The asset has remained in the grip of the bears after failing to sustain above the psychological resistance of 1.3000 last week.
A breakdown in the asset is expected after a decisive slippage below weekly lows at 1.2766 amid weakness in the greenback bulls. A recorded underperformance in the Gross Domestic Product (GDP) numbers on Thursday has diminished the demand for the greenback. The annualized GDP slipped further to -1.5% vs. the estimate of -1.3%.
Vulnerability in the US dollar index (DXY) has also impacted the loonie pair. The US dollar index (DXY) has tumbled below 102.00 as investors have underpinned the positive market sentiment. This has diminished the safe haven’s appeal and fresh monthly lows are expected from the asset.
On the loonie front, investors have ignored the slippage in the Retail Sales, as reported on Thursday. The Retail Sales landed at 0% against the prior print of 0.2% and the forecasts of 1.4%. Meanwhile, the oil prices settled above $110.00 firmly on Thursday after the European Union (EU) forces Hungary to withdraw its opposition to banning Russian oil imports. Higher oil prices will fetch more fund inflows into the loonie region.
Following the inflation data on Friday, the Bank of Japan's governor Kuroda has explained that unless energy prices drop sharply, Japan's core Consumer Price Index will likely remain around 2% for about 12 months.
Just ahead of the Tokyo open, Japan reported its CPI data as follows:
- Headline Tokyo CPI 2.4% YoY, expected 2.5%, prior was 2.5%.
- Tokyo CPI excluding Fresh Food 1.9% y/y, expected 2.0%, prior was 1.9%.
- Tokyo CPI excluding Food, Energy 0.9% y/y, expected 0.9%.
In recent trade, the Japanese PM Kishida also commented and said the recent rise in Japanese prices is driven mostly by the global rise in fuel, and raw material costs. He added that the government will proceed with efforts to help raise wages with responsibility.
- USD/JPY takes offers to renew intraday low, eyes consecutive third weekly loss.
- Tokyo CPI came in softer but core readings surprised with upbeat prints.
- Market sentiment dwindles amid anxiety ahead of the Fed’s preferred inflation gauge.
USD/JPY extends the three-week-old retreat from a multi-year high as bears flirt with 126.90 amid mixed concerns during Friday’s Asian session. The metal’s latest weakness could also be linked to the firmer prints of the Tokyo core cpi data, as well as the market’s wait for the Fed’s preferred inflation gauge.
Tokyo Consumer Price Index (CPI) for May eased to 2.4% YoY versus 2.7% expected and 2.5% prior. However, the Tokyo CPI ex Food, Energy rose past 0.4% market consensus and 0.8% previous readouts to 0.9% YoY. Further, Tokyo CPI ex Fresh Food reprints 1.9% figures versus 2.0% expected.
Following that Japan inflation data release, Bank of Japan (BOJ) Governor Haruhiko Kuroda mentioned, per Reuters, “Unless energy prices fall considerably, japan's core cpi is likely to remain around 2% for the next 12 months.”
His comments raise doubts about the BOJ’s easy money policies and strengthen the yen prices of late.
On the other hand, the US preliminary Q1 2022 Annualized GDP eased to -1.5%, below -1.4% prior and -1.3% forecasts, whereas the Pending Home Sales slumped in April, to -3.9% versus -2.0% forecast.
Softer US data weighed on the US dollar as market participants welcomed the lack of uncertainty over the Fed’s next move with zeal, showing confidence in the 50 bps rate hikes during the next two meetings. Also weighing on the US dollar were the firmer prints of the US equities and downbeat US Treasury yields.
It’s worth mentioning that the fears of global recession, mainly due to China’s covid-led lockdowns and the Russia-Ukraine crisis, not to forget the Sino-American tussles, also exert downside pressure on the risk appetite and the USD/JPY prices.
That said, Wall Street benchmarks portrayed the second day of gains whereas the US 10-year Treasury yields remained indecisive around 2.75%. Further, S&P 500 Futures begins Friday with mild losses around 4,045, down 0.25% intraday at the latest.
Moving on, Fedspeak and the geopolitical headlines concerning China and Russia will be crucial for short-term USD/JPY moves. Above all, the US Core Personal Consumption Expenditure (PCE) Price Index for April, expected at 4.9% YoY versus 5.2% prior, will be crucial amid the latest run of softer US data weighing on the greenback.
Read: US Core PCE Preview: Why there is room for a dollar-lifting upside surprise
Technical analysis
Although a three-week-old descending resistance line restricts immediate USD/JPY moves around 127.85, the 50-DMA level surrounding 126.55 appears a tough nut to crack for the short-term sellers.
- GBP/USD bulls are moving up a gear from the critical support structure.
- The bulls have their eyes on a fresh daily high.
As per the prior analysis, GBP/USD Price Analysis: Bulls seeking a discount from daily support structure, the price has respected the support structure and has subsequently moved higher as the bulls piled in.
The following illustrates the bullish bias from the daily chart's perspective and the price action on the lower 1-hour time frame.
GBP/USD daily and hourly charts, prior analysis
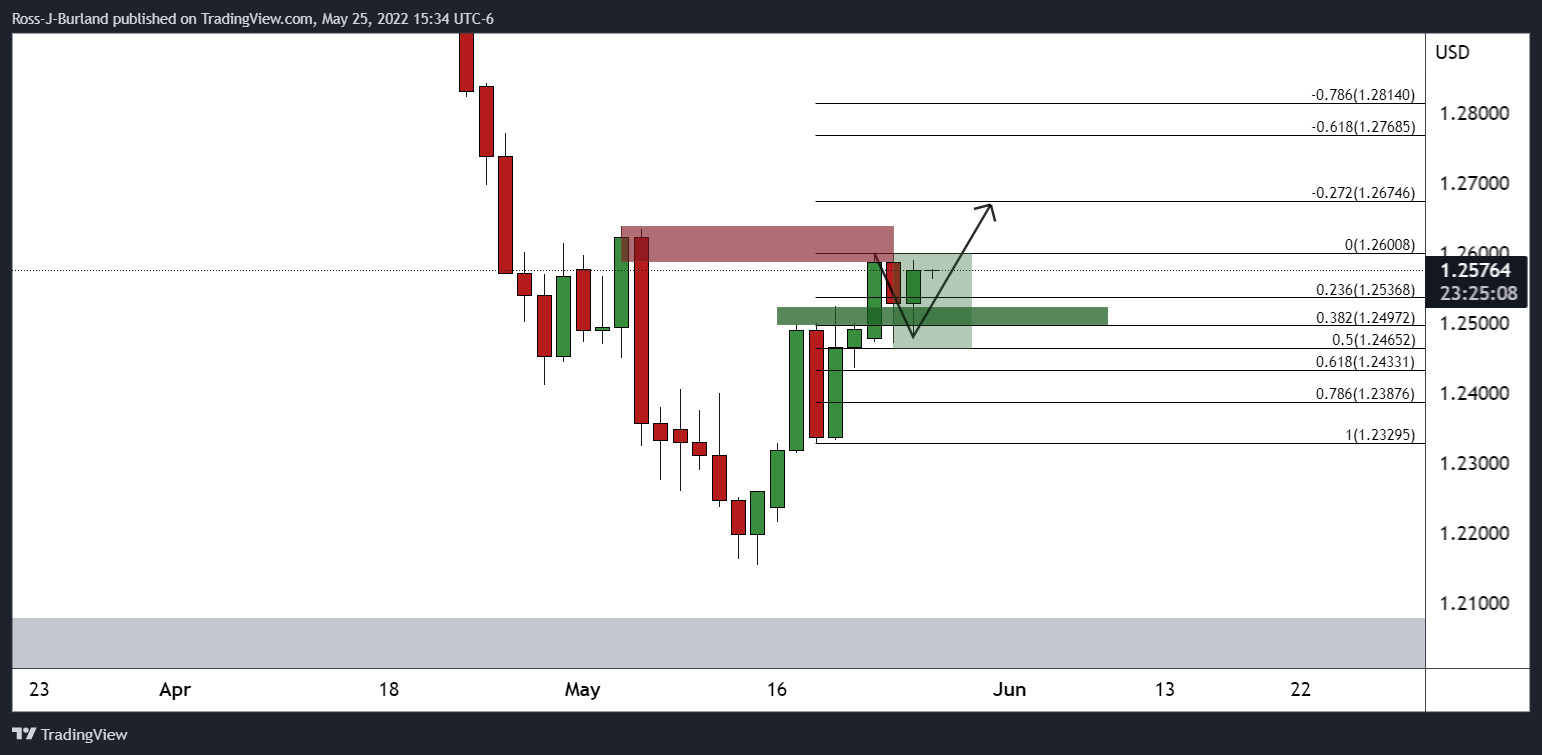
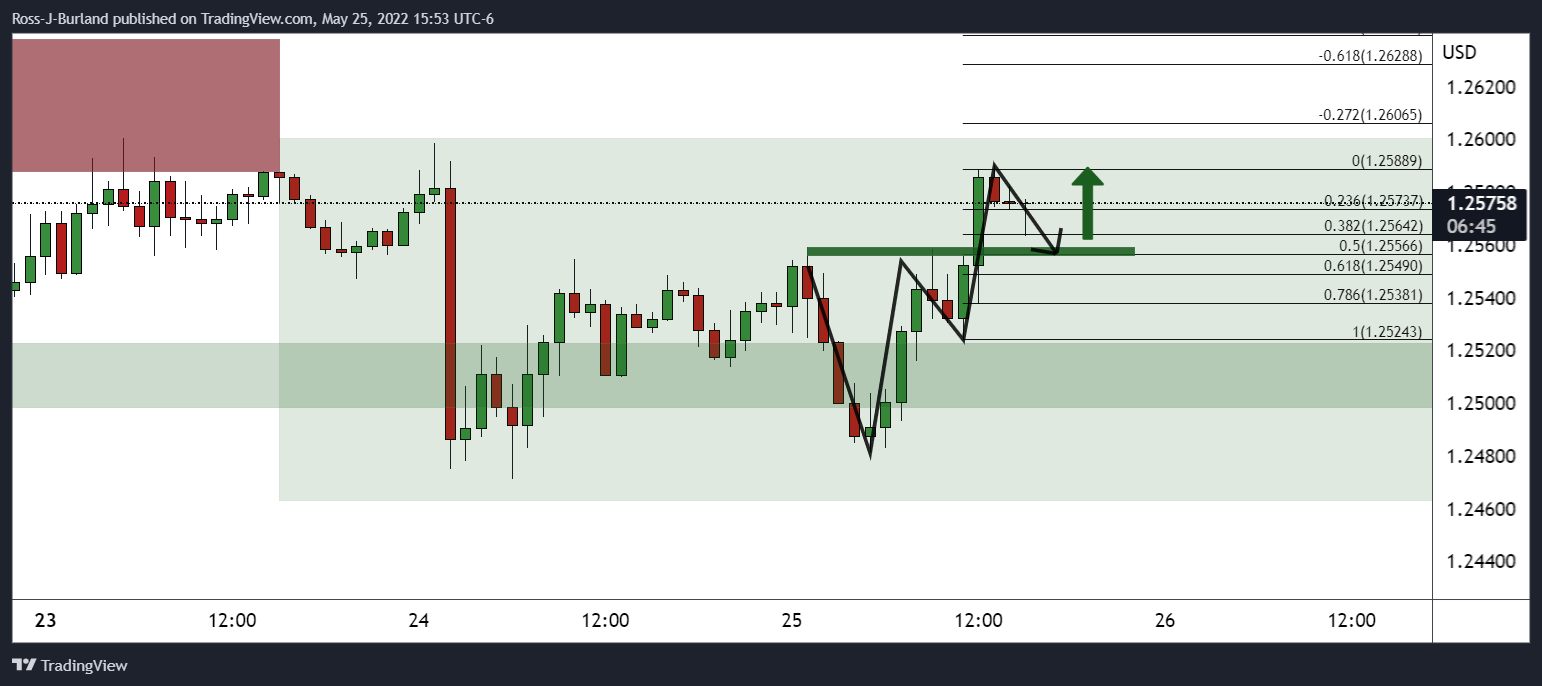
It was explained that the price was on the verge of a significant correction of bullish impulses. However, cheaper prices may only encourage more bulls to the table and ultimately result in a continuation to the upside in confluence with the bullish outlook on the higher time frames.
GBP/USD live market
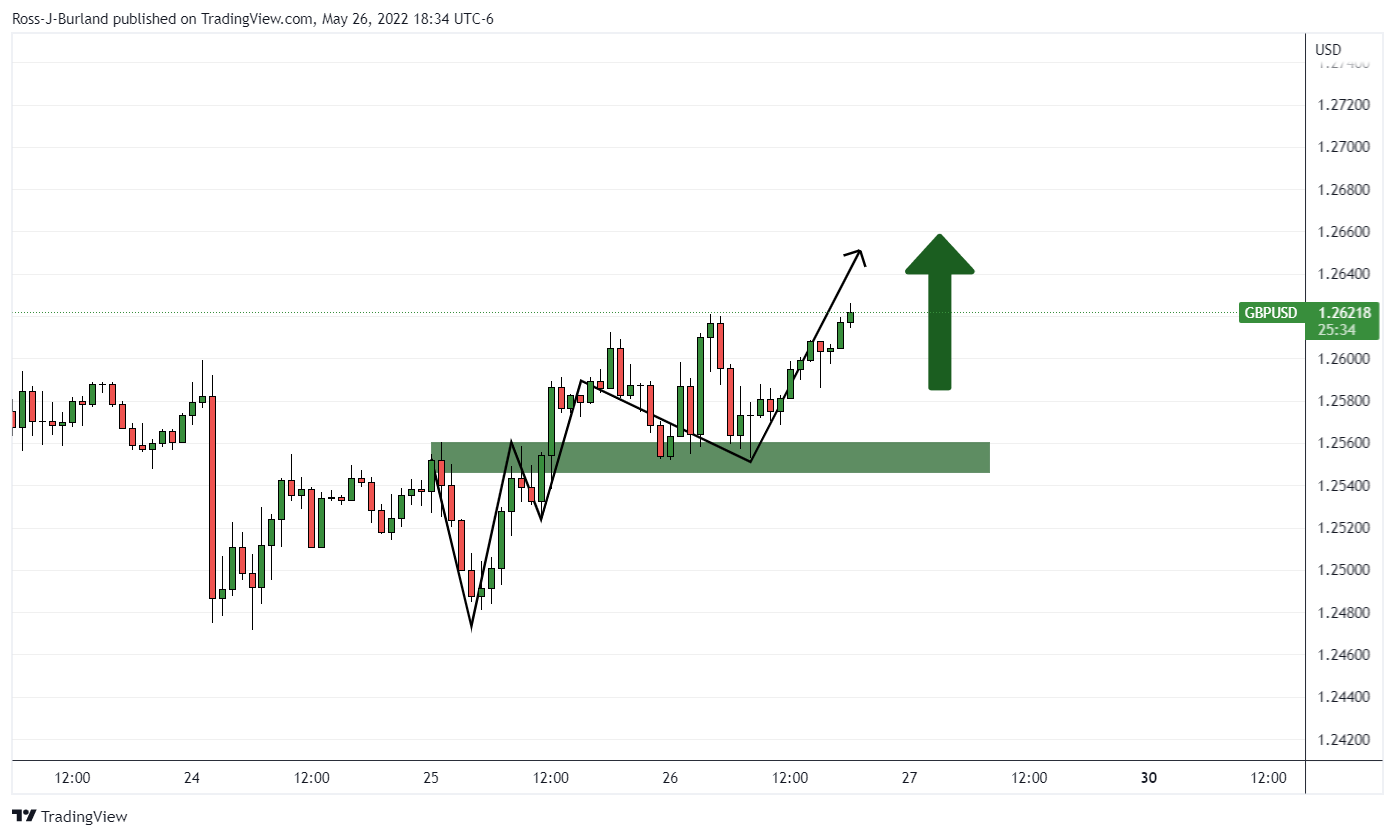

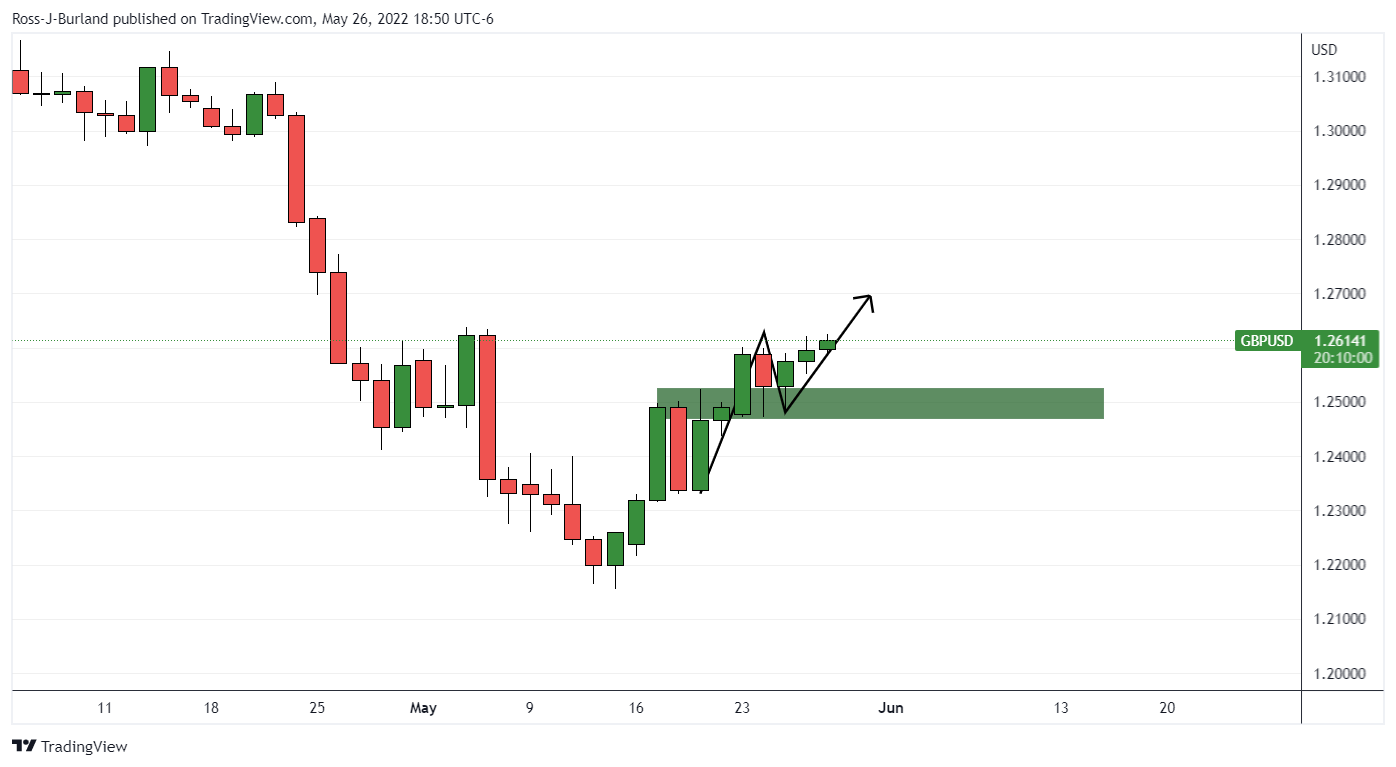
The above hourly, 4-hour and daily charts illustrate the bullish bias and validity of the prior analysis.
- USD/CHF is oscillating below 0.9600 as the US PCE Price Index is expected to fall to 4.9%.
- The Fed is set to hike interest rates by 50 bps more than two times this year.
- Next week, the Swiss economy will release GDP and inflation numbers.
The USD/CHF pair is oscillating near Thursday’s low at 0.9583 and a balance auction near the previous day’s low strengthens the bears as it dictates that the sentiment has not changed overnight and more downside could be displayed by the major. The asset has remained vulnerable for the last two trading weeks and a sheer downside move has been displayed after failing to sustain above the psychological resistance of 1.0000.
Despite the rising odds of a 50 basis point (bps) interest rate hike by the Federal Reserve (Fed), the US dollar index (DXY) has failed to sustain its glory. The DXY has been hammered sharply by the market participants as investors have discounted the fact that the monetary policy is going to remain tight this year and hopefully next year. The Fed has already provided clues that investors should brace for two more consecutive jumbo rate hikes to anchor the price pressures.
In today’s session, the focus will remain on the US Personal Consumption Expenditure (PCE) Price Index, which may tumble to 4.9% against the prior print of 5.2%.
On the Swiss franc front, next week is going to be a busy week for the market participants. The Swiss Federal Statistical Office will report the Consumer Price Index (CPI), which is seen at 2.8% against the prior print of 2.5% on yearly basis. Apart from that, the Swiss State Secretariat for Economic Affairs will release the Gross Domestic Product (GDP) numbers. The quarterly and yearly figures may improve to 0.7% and 4.9% respectively.
- Silver prices remain lackluster above 20-DMA, keeping downside break of fortnight-old support line.
- 50-DMA eyes to cross the 200-DMA from above, suggesting further downside amid steady RSI.
- Bullish MACD probes sellers, $21.70 restricts immediate downside.
Silver (XAG/USD) grinds higher past 20-DMA, keeping the early week break of short-term key support line, during Friday’s Asian session. That said, the bright metal takes rounds to $22.00 as bulls and bears jostle amid mixed signals.
As the 50-DMA eyes to pierce the 200-DMA from above, known as the bear cross, backed by the metal’s recent failures to stay beyond the 20-DMA, not to forget Wednesday’s downside break of the two-week-old support line, silver sellers remain hopeful.
However, a fresh weekly low, currently around $21.65, becomes necessary for the bright metal to confirm the bearish signals.
Following that, a downward trajectory toward the monthly low near $20.45, with the $21.00 acting as an intermediate halt, can’t be ruled out.
Meanwhile, XAG/USD upside remains unconvincing below the previous support line, near $22.50.
Should the commodity prices rally beyond $22.50, the odds of the metal’s run-up towards the convergence of the 50-DMA and 200-DMA, close to $23.55, can’t be ruled out.
Silver: Daily chart
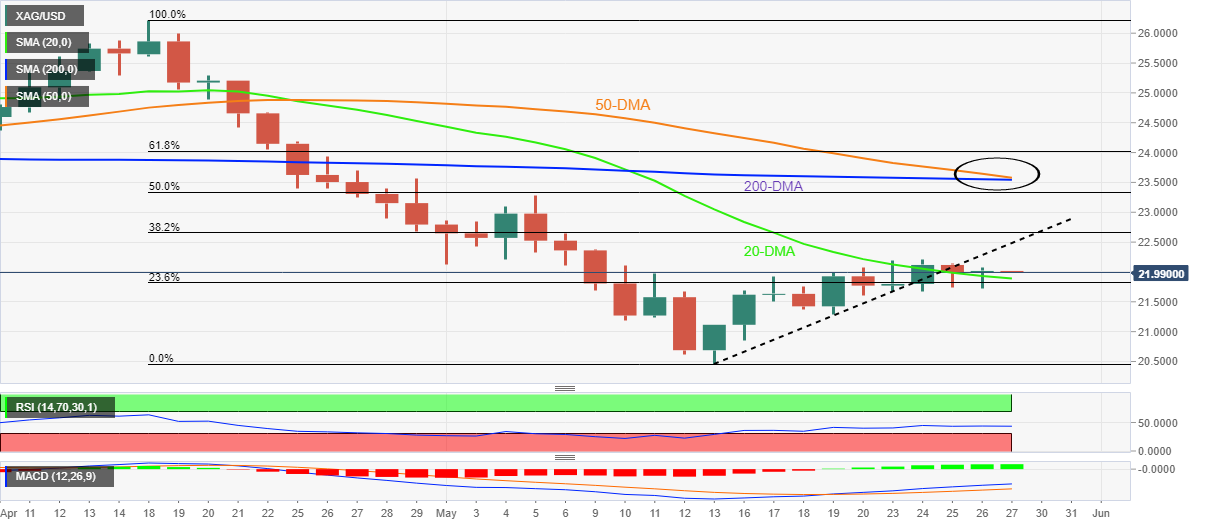
Trend: Further downside expected
| Index | Change, points | Closed | Change, % |
|---|---|---|---|
| NIKKEI 225 | -72.96 | 26604.84 | -0.27 |
| Hang Seng | -55.07 | 20116.2 | -0.27 |
| KOSPI | -4.77 | 2612.45 | -0.18 |
| ASX 200 | -49.3 | 7105.9 | -0.69 |
| FTSE 100 | 42.12 | 7564.92 | 0.56 |
| DAX | 223.36 | 14231.29 | 1.59 |
| CAC 40 | 111.94 | 6410.58 | 1.78 |
| Dow Jones | 516.91 | 32637.19 | 1.61 |
| S&P 500 | 79.11 | 4057.84 | 1.99 |
| NASDAQ Composite | 305.91 | 11740.65 | 2.68 |
Retail Sales overview
Early Friday, the market sees preliminary readings of Australia's seasonally adjusted Retail Sales for April month at 01:30 GMT. Market consensus suggests a downbeat MoM print of 0.9% versus 1.6% prior readings, suggesting the lack of sustained improvement in economic activity after positing the softer outcome in March.
Given the recently mixed Aussie data challenging the Reserve Bank of Australia’s (RBA) hawkish bias, not to forget covid-led lockdowns in China, today’s Aussie Retail Sales appear the key for the AUD/USD traders.
Ahead of the data, TD Securities said,
We expect retail sales in Australia to rise by 1.4% m/m in April, extending the 1.6% m/m gain in March. The April holidays should give a boost to consumer spending while we expect a further rebound in sales from Queensland and New South Wales which experienced severe flooding and extreme rainfall in February & March. A strong retail beat should give the RBA confidence that taming inflation is its top priority as economic fundamentals are strong. We stick with our call for a 40bps hike by the Bank in June.
On the other hand, Westpac said,
Card spending indicators suggest retail sales should sustain strong momentum (March +1.6%) but weakening consumer sentiment and elevated prices add downside risk. Westpac forecasts: 1.3%mth, consensus is 1.0%.
How could it affect AUD/USD?
AUD/USD remains sidelined around 0.7100, marking the third lackluster day ahead of the key Aussie data. The pair’s latest moves fail to cheer a softer US dollar amid market anxiety, as well as fears of global recession due to China’s covid-led lockdowns and the Russia-Ukraine crisis.
That said, Australia’s seasonally adjusted Retail Sales for April is expected to ease to 0.9%, versus 1.6% prior, amid hopes of a recovery in consumer demand due to the restoration of normal life after severe flooding. However, softer consumer sentiment and inflation fears seem to test the outcome.
It’s worth noting that softer-than-expected Aussie Retail Sales figures will weigh on the AUD/USD prices, especially after the pair’s recent difficulties in picking up bids. Alternatively, strong data might back the RBA’s hawkish bias and underpin further upside towards refreshing the weekly top above 0.7100.
Technically, AUD/USD buyers seem running out of fuel after rising to 0.7127 on Monday. Even so, a convergence of the 21-DMA and previous resistance line from early April, around 0.7030, becomes necessary for the bear’s entry.
Key Notes
AUD/USD bulls flirt with 0.7100 with eyes on Aussie Retail Sales, US PCE Inflation
AUD/USD Forecast: Ignoring stocks’ rally may hint at an upcoming slump
About Australian Retail Sales
The Retail Sales released by the Australian Bureau of Statistics is a survey of goods sold by retailers is based on a sampling of retail stores of different types and sizes and it''s considered as an indicator of the pace of the Australian economy. It shows the performance of the retail sector over the short and mid-term. Positive economic growth anticipates bullish trends for the AUD, while a low reading is seen as negative or bearish.
| Pare | Closed | Change, % |
|---|---|---|
| AUDUSD | 0.70952 | 0.16 |
| EURJPY | 136.342 | 0.29 |
| EURUSD | 1.07299 | 0.42 |
| GBPJPY | 160.143 | 0.02 |
| GBPUSD | 1.26001 | 0.13 |
| NZDUSD | 0.64789 | 0.02 |
| USDCAD | 1.27708 | -0.32 |
| USDCHF | 0.95857 | -0.32 |
| USDJPY | 127.114 | -0.1 |
- The DXY is declining to re-test its monthly lows at 101.65 on positive market sentiment.
- Underperformance in the DXY is backed by weak GDP and stable PCE.
- US NFP will remain the major economic event next week.
The US dollar index (DXY) is moving gradually lower to re-test its monthly lows at 101.65 as the risk appetite of the market participants has improved firmly and safe-haven assets are losing their appeal. The DXY attempted to surpass its crucial resistance at 102.40 but found strong barricades that dragged the asset below 102.00. The sheet volatility increment in the DXY is compelling for more downside, which could drag the asset lower. A decisive slippage below Tuesday’s low at 101.65 will expose the asset to fresh monthly lows.
Flat US PCE and underperformance from GDP
A responsive selling action in the DXY on Thursday is backed by more weakness in the Gross Domestic Product (GDP) numbers and Personal Consumption Expenditure (PCE) figures. The annualized GDP has been recorded at -1.5%, lower than the expectations and the prior print of -1.3% and -1.4% respectively. Lower GDP numbers have raised concerns about the economy’s growth prospects. Apart from that, the PCE remained stable at 7%, which is indicating that the inflationary pressures are finding an anchor now. This signals that a peak in price pressure is not so far, which has dampened the demand of the DXY.
Key events next week: Consumer Confidence, ISM Manufacturing PMI, ADP Employment Change, Initial Jobless Claims, Nonfarm Productivity, Nonfarm Payrolls (NFP), Unemployment Rate, and ISM Services PMI.
Major events next week: European Union (EU) Leaders Summit, Bank of Canada (BOC) interest rate decision.


© 2000-2026. Sva prava zaštićena.
Sajt je vlasništvo kompanije Teletrade D.J. LLC 2351 LLC 2022 (Euro House, Richmond Hill Road, Kingstown, VC0100, St. Vincent and the Grenadines).
Svi podaci koji se nalaze na sajtu ne predstavljaju osnovu za donošenje investicionih odluka, već su informativnog karaktera.
The company does not serve or provide services to customers who are residents of the US, Canada, Iran, The Democratic People's Republic of Korea, Yemen and FATF blacklisted countries.
Izvršenje trgovinskih operacija sa finansijskim instrumentima upotrebom marginalne trgovine pruža velike mogućnosti i omogućava investitorima ostvarivanje visokih prihoda. Međutim, takav vid trgovine povezan je sa potencijalno visokim nivoom rizika od gubitka sredstava. Проведение торговых операций на финанcовых рынках c маржинальными финанcовыми инcтрументами открывает широкие возможноcти, и позволяет инвеcторам, готовым пойти на риcк, получать выcокую прибыль, но при этом неcет в cебе потенциально выcокий уровень риcка получения убытков. Iz tog razloga je pre započinjanja trgovine potrebno odlučiti o izboru odgovarajuće investicione strategije, uzimajući u obzir raspoložive resurse.
Upotreba informacija: U slučaju potpunog ili delimičnog preuzimanja i daljeg korišćenja materijala koji se nalazi na sajtu, potrebno je navesti link odgovarajuće stranice na sajtu kompanije TeleTrade-a kao izvora informacija. Upotreba materijala na internetu mora biti praćena hiper linkom do web stranice teletrade.org. Automatski uvoz materijala i informacija sa stranice je zabranjen.
Ako imate bilo kakvih pitanja, obratite nam se pr@teletrade.global.
транcфери