- Analytics
- News and Tools
- Market News
CFD Markets News and Forecasts — 08-12-2022
- WTI crude oil licks its wounds near the yearly low.
- Bearish MACD signals, key resistances challenge the black gold buyers.
- Three-week-old descending support line challenges further downside.
WTI crude oil picks up bids to pare weekly losses around the lowest levels in 2022 as bulls poke the $72.00 level during Friday’s Asian session. In doing so, the black gold prints the first daily gains in six while justifying a bullish divergence between the oil prices and the Relative Strength Index (RSI) line, placed at 14.
That said, the lower low of WTI contrasts with the higher low of the RSI line and teases the commodity buyers around the multi-day low.
However, the recovery moves need validation from the late November swing lows, around $73.70, to convince oil buyers.
Even so, a three-week-old horizontal region could challenge the quote’s further upside between $75.25 and $75.75.
Additionally, acting as an upside filter is the 200-HMA level surrounding $77.90 and the $78.00 threshold.
In a case where the energy benchmark rises past $78.00, the $80.00 could act as the last defense of bears.
Alternatively, a downward-sloping support line from late November, close to $70.80, acts as the immediate challenge for the WTI bears.
Following that, the $70.00 round figure and late December 2021 low near $66.00 could lure the commodity sellers.
WTI: Hourly chart
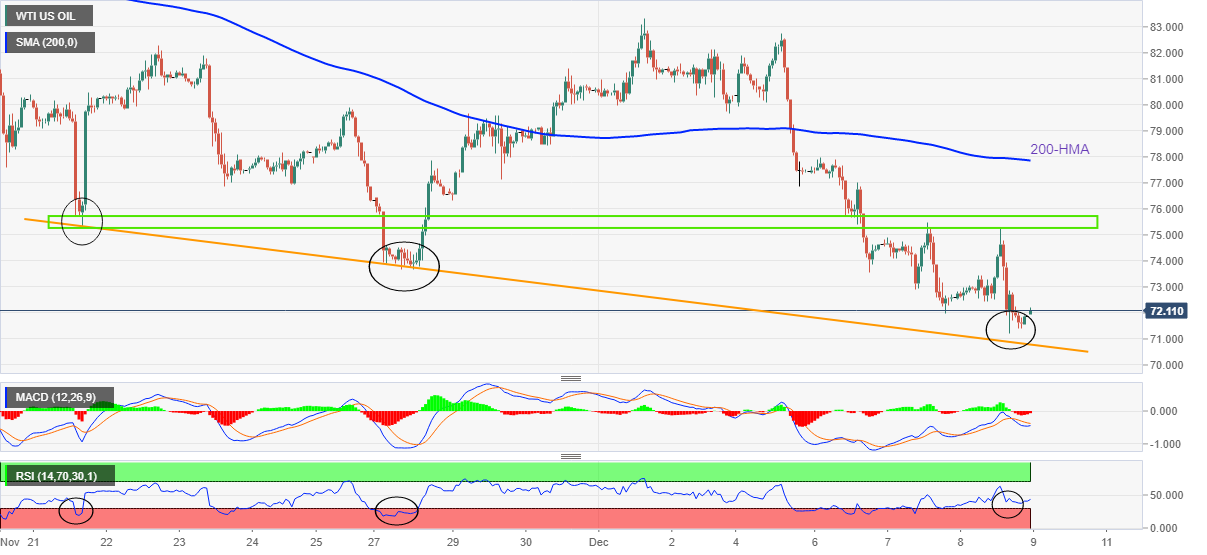
Trend: Limited recovery expected
- USD/CHF is likely to display weakness to near 0.9350 as a risk-on impulse has hogged the limelight.
- Volatility in the currency market is accelerating as the Fed is set to announce the last monetary policy of CY2022.
- Investors have ignored uncertainty over Fed’s interest rate peak.
The USD/CHF pair has failed to extend its recovery above 0.9380 in early Asia and is declining towards the 0.9350 cushion ahead. A significant drop in safe-haven appeal led by the mounting risk appetite theme has weighed on the US Dollar Index (DXY). Volatility in the currency market is accelerating as the Federal Reserve (Fed) is set to announce the last monetary policy of CY2022 next week.
The USD Index is looking to shift its auction profile below the critical resistance of 105.00 as investors are cheering expectations of a slowdown in the pace of the interest rate hike by the Fed. Meanwhile, S&P500 is focusing more on optimism derived from expectations over a deceleration in interest rate hike pace rather and has ignored recession fears.
Fed policymakers have been favoring a return to lower rate hike culture to avoid financing risks and to give some time to the economy to heal stubborn inflation itself. Analysts at Danske Bank see a further hike in interest rates by 50 basis points (bps) and a hawkish message from Fed chair Jerome Powell for CY2023. Also, the neutral rate is expected at 5.00-5.25%.
But before that, the release of the United States inflation data will be of utmost importance. The headline inflation is seen unchanged at 7.7% while the core inflation figure could move marginally higher to 6.4% from the former release of 6.3%.
On the Swiss Franc front, investors are shifting their focus toward the interest rate decision by the Swiss National Bank (SNB), which is scheduled for next week. SNB Chairman Thomas J. Jordan is expected to return to policy easing as the inflationary pressures are marginally above the desired rate.
- NZD/USD struggles to extend three-day uptrend, eyes to snap seven-week uptrend.
- New Zealand Manufacturing Sales improved in Q3, Electronic Card Retail Sales came in mixed for November.
- Anxiety ahead of the key data/events keeps traders on dicey floor, light macro also contributes to market’s inaction.
- China inflation, US Michigan Consumer Sentiment Index will entertain traders ahead of the busy next week.
NZD/USD makes rounds to 0.6380 during Friday’s Asian session, after rising in the last three consecutive days, as mixed data from New Zealand (NZ) probes the Kiwi pair traders. Also likely to have challenged the bulls is the cautious mood ahead of the key statistics from the US and China, as well as the pair’s first weekly loss in eight.
New Zealand’s Electronic Card Retail Sales rose more than 0.2% to 0.3% MoM in November, versus 1.0% prior, whereas the YoY figures eased to 7.1% from 12.9% market consensus and 16.6% previous readings. Further, the nation’s Manufacturing Sales for the third quarter (Q3) surprised markets with 3.1% growth compared to -2.4% forecasts and -4.1% prior.
Elsewhere, the US Dollar weakness joined the likely improvement in Sino-American relations and China’s gradual easing of the Zero-Covid policy to favor the bulls. However, the fears emanating from Russia and hopes that the US economic recovery could allow the Federal Reserve (Fed) to remain hawkish in the next week seem to probe the NZD/USD bulls.
US Dollar Index (DXY) dropped for the second consecutive day on Thursday, paring the first weekly gain in three, even as the benchmark United States 10-year Treasury bond yields recovered from the lowest levels since mid-September. That said, the greenback’s gauge versus the six major currencies remains pressured around 104.80 by the press time.
The DXY losses could be linked to the recently downbeat statistics from the world’s biggest economy. On Thursday, US Initial Jobless Claims matched 230K market consensus for the week ended on December 02, versus the upwardly revised 226K prior. Further, the four-week average also printed 230K figure compared to 229K previous readings. Earlier in the week, the US Goods and Services Trade Balance deteriorated to $-78.2 billion versus $-79.1 billion expected and $-73.28 billion prior. Further, the final readings of the Unit Labour for Q3 eased to 2.4% QoQ versus 3.5% first estimations.
Elsewhere, Shanghai City Authorities mentioned that they will stop requiring Covid test checks for restaurants or entertainment venues from this Friday. On the same line, the South China Morning Post (SCMP) states that Hong Kong is ‘to ease isolation rules’ for infected travelers, with a release on the fifth day.
Also, China Premier Li Keqiang said, “Growth will continue amid the implementation of optimized pandemic policies.” The policymaker also stated, “Will keep yuan exchange rate basically stable.”
Recently, US Treasury Secretary Janet Yellen said on Thursday that "Recession is not inevitable," while also declining to say whether the dollar had peaked against other currencies.
Amid these plays, S&P 500 Futures print mild gains while Wall Street closed positive on Thursday.
Moving on, the scheduled top-tier readings from China and the United States could entertain NZD/USD traders. That said, China Consumer Price Index (CPI) is expected to repeat 0.1% MoM figure in November but is likely to ease to 1.0% YoY versus 2.0% previous readings. Further, the Producer Price Index (PPI) could decline to -1.5% compared to -1.3% prior during the stated month. Additionally, the preliminary readings of the Michigan Consumer Sentiment Index for December, expected 53.3 versus 56.8 prior, will entertain Gold traders afterward. Also important to watch will be the University of Michigan’s (UoM) 5-year Consumer Inflation Expectations for the said month, 3.0% previous readings.
Technical analysis
NZD/USD pair’s rebound from 0.6300 enables it to again aim for the 0.6470-75 key hurdle, comprising tops marked in August and December.
“The Bank of England will add another 50 basis points to Bank Rate next week and take borrowing costs to 3.50%, despite the economy falling into recession, as it battles inflation running at more than five times its target,” stated the latest survey from Reuters.
Key findings
One of the first major central banks to start unwinding the ultra loose policy adopted globally during the pandemic, the BoE went for a 75 bp lift last month but was expected to add a more modest 50 on Dec. 15 according to all but two of the 54 economists surveyed Dec. 5-7.
Only two economists expected a 75 bp increase next week compared to 13 of 56 in the Nov. 23 poll.
The U.S. Federal Reserve is also expected to shift down to a 50 bp move this month after four consecutive 75 bp increases, a separate Reuters poll found.
After next week's move, the BoE will add another 50 bps in the first quarter and 25 bps in the second, with medians showing Bank Rate peaking at 4.25% then. Forecasts for the terminal rate ranged from 3.50% to 4.75%.
In last month's survey, Bank Rate was expected to peak at 4.25% next quarter and there was a big divide between economists in the latest survey as to when and where it would level out.
Quarterly forecasts suggest the economy shrank 0.2% last quarter and will do so by 0.4% in this one, meeting the technical definition of recession. It will then contract 0.4%, 0.4% and 0.2% in the first three quarters of next year.
A majority of respondents to another question said the recession would be long and shallow.
Those forecasts were little changed from last month but when asked about the risks to their GDP forecasts, 12 of 18 said it was to the downside. Across this year the economy was predicted to expand 4.4% but then contract 0.9% next year before returning to 0.9% growth in 2024.
Inflation was seen peaking at 10.9% this quarter, higher than the 10.7% estimate given last month before drifting down. However, it won't reach the Bank's 2.0% goal until the third quarter of 2024.
Also read: GBP/USD eyes more gains above 1.2250 amid upbeat market mood, UK GDP eyed
- GBP/USD is aiming to overstep the 1.2250 hurdle on expectations of slowdown in Fed’s rate hike pace.
- The BOE is set to hike rates further by 50 bps despite the economy falling into recession.
- S&P500 snapped a three-day losing streak as investors shrugged off recession fears.
The GBP/USD pair is gathering momentum to surpass the immediate hurdle of 1.2250 in the early Tokyo session. The Cable is displaying a sideways auction profile after sustaining above the round-kevel resistance of 1.2200. Positive market sentiment has tilted bias for more upside in the Cable ahead. The US Dollar Index (DXY) is expected to remain on the tenterhooks as investors are shifting their focus to the monetary policy meeting by the Federal Reserve (Fed), which is due next week.
S&P500 snapped a three-day losing streak and recovered firmly after investors shrugged off recession fears. The 10-year US Treasury yields followed optimism in US equities and escalated to 3.49%.
The Pound Sterling is likely to remain in action as investors are awaiting the release of the monthly Gross Domestic Product (GDP) data, which will release on Monday. As per the estimates, the United Kingdom GDP data will improve to 0.1% contraction vs. the prior 0.5% contraction. Apart from that, Industrial and Manufacturing Production figures will be of utmost importance.
Key trigger that will bring power-pack action in the Pound Sterling is the interest rate decision by the Bank of England (BOE). A poll on interest rate hike expectations by the BOE taken by Reuters speaks that the Bank of England will add another 50 basis points (bps) next week and take borrowing costs to 3.50%, despite the economy falling into recession.
On the United States front, rising expectations of a slowdown in an interest rate hike by the Federal Reserve (Fed) are weighing on the US Dollar. Fed chair Jerome Powell is expected to decelerate the current pace of interest rate hike and will announce a 50 bps addition in borrowing costs.
- USD/CAD licks its wounds after the biggest daily loss in over a week.
- 50-DMA restricts immediate downside but bearish Doji candlestick, seven-week-old resistance line probe bulls.
- Ascending trend line from mid-November puts a strong floor under the prices.
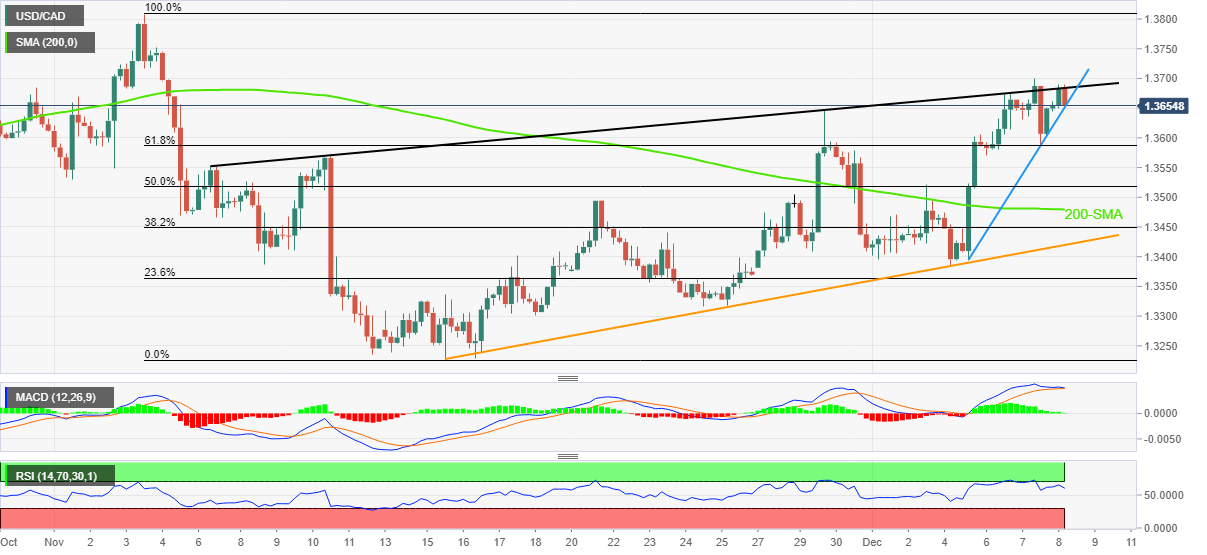
USD/CAD seesaws around 1.3600 as bearish take a breather during early Friday morning in Asia, after the heaviest slump in eight days.
The Loonie pair’s previous fall could be linked to the bearish Doji candlestick, as well as the U-turn from the seven-week-old downward-sloping resistance line.
However, the bullish MACD signals and the 50-DMA level surrounding 1.3560 challenge the quote’s immediate downside.
In a case where the USD/CAD bears manage to conquer the 50-DMA support, the 38.2% Fibonacci retracement level of the pair’s August-October upside, near 1.3500 threshold, will be on their radars.
Even so, the pair buyers remain hopeful unless witnessing a clear downside break of an ascending support line from the mid-November, at 1.3430 by the press time.
Meanwhile, recovery moves not only need to cross the aforementioned nearby resistance line figures of 1.3665 but also cross the stated Doji’s top of 1.3700 to convince USD/CAD buyers.
Following that, a quick run-up towards the previous monthly peak surrounding 1.3810 can’t be ruled out.
Though, multiple levels surrounding 1.3850 and 1.3900 can test the USD/CAD bulls afterward, before directing them to the yearly high marked in October near 1.3980.
USD/CAD: Daily chart
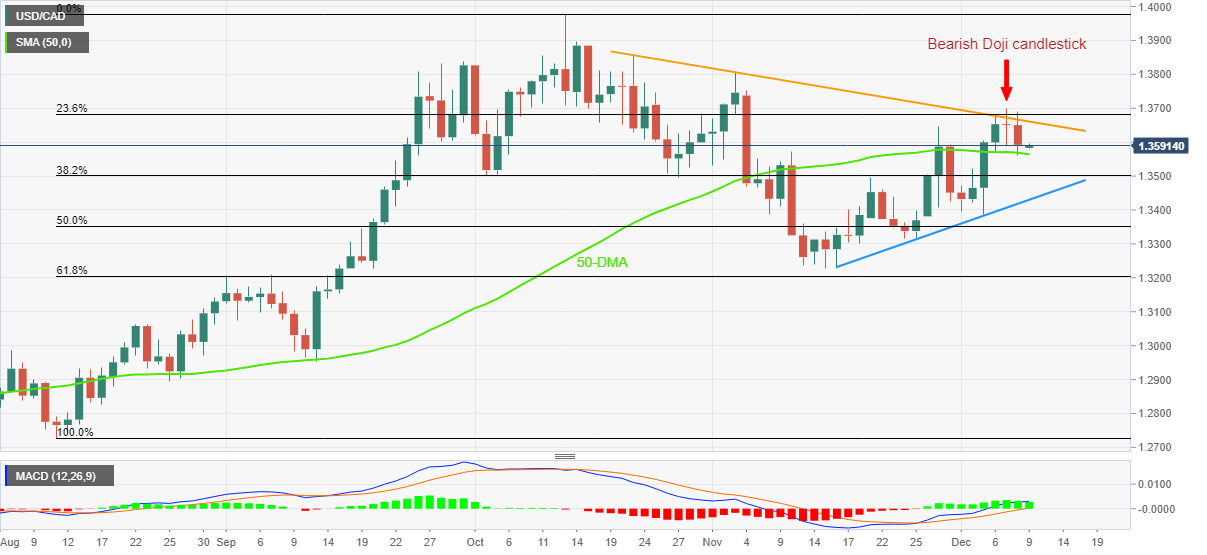
Trend: Limited downside expected
- AUD/USD is oscillating below 0.6800, more upside seems favored amid the risk appetite theme.
- The commentary from Janet Yellen that the US could avoid recession has supported bond yields.
- Lower inflation print could force PBOC to call for more policy easing ahead.
The AUD/USD pair is displaying back-and-forth moves below the critical hurdle of 0.6800 in the early Asian session. The Aussie asset has turned sideways as investors are awaiting the release of China’s Consumer Price Index (CPI) data. The Australian Dollar stretched its recovery firmly on Thursday after surpassing the critical resistance of 0.6740 as the risk-on impulse regained its glory.
Meanwhile, the US Dollar Index (DXY) is oscillating below the 105.00 support as investors shrugged off United States recession-inspired uncertainty that led to a decline in safe-haven’s appeal. A decent recovery in S&P500 on Thursday after a three-day weakness spell showed investors have discounted further interest rate hike by the Federal Reserve (Fed).
The 10-year US bond yields have accelerated to near 3.49% after a sell-off as commentary from US Treasury Secretary Janet Yellen trimmed recession risks. Yellen said the US can avoid recession, given that there is no wage-price spiral and supply chain bottlenecks are starting to ease, as reported by Reuters.
Going forward, investors are shifting their focus toward the United States CPI data, which will release on Tuesday. As per the consensus, the headline CPI is expected to remain steady at 7.7% while the core CPI that excludes food and oil prices could inch higher to 6.4% from the prior release of 6.3%. Recent jump in labor additions and upbeat demand in the service sector justify higher consensus for core inflation figure.
On the Australian front, the release of the China CPI will be keenly watched. As per the projections from economists at TD Securities, the annual inflation data could decline to 1.5% from the former release of 2.1%. This may force the People’s Bank of China (PBOC) to adopt an extreme dovish stance on interest rates. It is worth noting that Australia is a leading trading partner of China and the injection of liquidity into the Chinese economy will also support the Australian Dollar.
- Gold price extends three-day uptrend to reverse Monday’s heavy losses.
- Firmer sentiment, downbeat United States statistics weighed on the US Dollar.
- Optimism surrounding China Covid conditions adds strength to Gold price.
- China inflation numbers, US Michigan Consumer Sentiment Index and 5-year Consumer Inflation Expectations in focus.
Gold price (XAU/USD) grinds higher towards $1,800 as broad US Dollar weakness and optimism surrounding China favors the metal buyers ahead of the key data from Beijing and the United States. Even so, the bullion remains on the way to printing the first weekly loss in three as it seesaws around $1,790 during the early hours of Friday’s Asian session.
US Dollar fails to trace United States Treasury bond yields and favor Gold buyers
US Dollar Index (DXY) dropped for the second consecutive day on Thursday, paring the first weekly gain in three, even as the benchmark United States 10-year Treasury bond yields recovered from the lowest levels since mid-September. That said, the greenback’s gauge versus the six major currencies remains pressured around 104.80 by the press time.
The DXY losses could be linked to the recently downbeat statistics from the world’s biggest economy. On Thursday, US Initial Jobless Claims matched 230K market consensus for the week ended on December 02, versus upwardly revised 226K prior. Further, the four-week average also printed 230K figure compared to 229K previous readings. Earlier in the week, the US Goods and Services Trade Balance deteriorated to $-78.2 billion versus $-79.1 billion expected and $-73.28 billion prior. Further, the final readings of the Unit Labour for Q3 eased to 2.4% QoQ versus 3.5% first estimations.
Even so, US Treasury Secretary Janet Yellen said on Thursday that "Recession is not inevitable," while also declining to say whether the dollar had peaked against other currencies.
Optimism surrounding China also propels XAU/USD
China runs down on its Zero-Covid policy and propels the Gold price due to its status as one of the world’s key Gold consumers. On Thursday, Shanghai City Authorities mentioned that they will stop requiring Covid test checks for restaurants or entertainment venues from this Friday. On the same line, the South China Morning Post (SCMP) states that Hong Kong is ‘to ease isolation rules’ for infected travelers, with a release on the fifth day.
Following the announcements, China Premier Li Keqiang said, “Growth will continue amid implementation of optimized pandemic policies.” The policymaker also stated, “Will keep yuan exchange rate basically stable.”
An active day before the key week
After witnessing a few days of inaction and mixed clues, mainly due to a light calendar, Friday could entertain Gold traders with the scheduled top-tier readings from China and the United States.
Firstly, China Consumer Price Index (CPI) is expected to repeat 0.1% MoM figure in November but is likely to ease to 1.0% YoY versus 2.0% previous readings. Further, the Producer Price Index (PPI) could decline to -1.5% compared to -1.3% prior during the stated month.
That said, the preliminary readings of the Michigan Consumer Sentiment Index for December, expected 53.3 versus 56.8 prior, will entertain Gold traders afterward. Also important to watch will be the University of Michigan’s (UoM) 5-year Consumer Inflation Expectations for the said month, 3.0% previous readings.
It should be noted that the geopolitical fears emanating from Russia and the latest passage of the bill to help Taiwan with weapons by the US Congress seem to challenge the XAU/USD traders ahead of the key week comprising multiple central bank meetings.
Gold price technical analysis
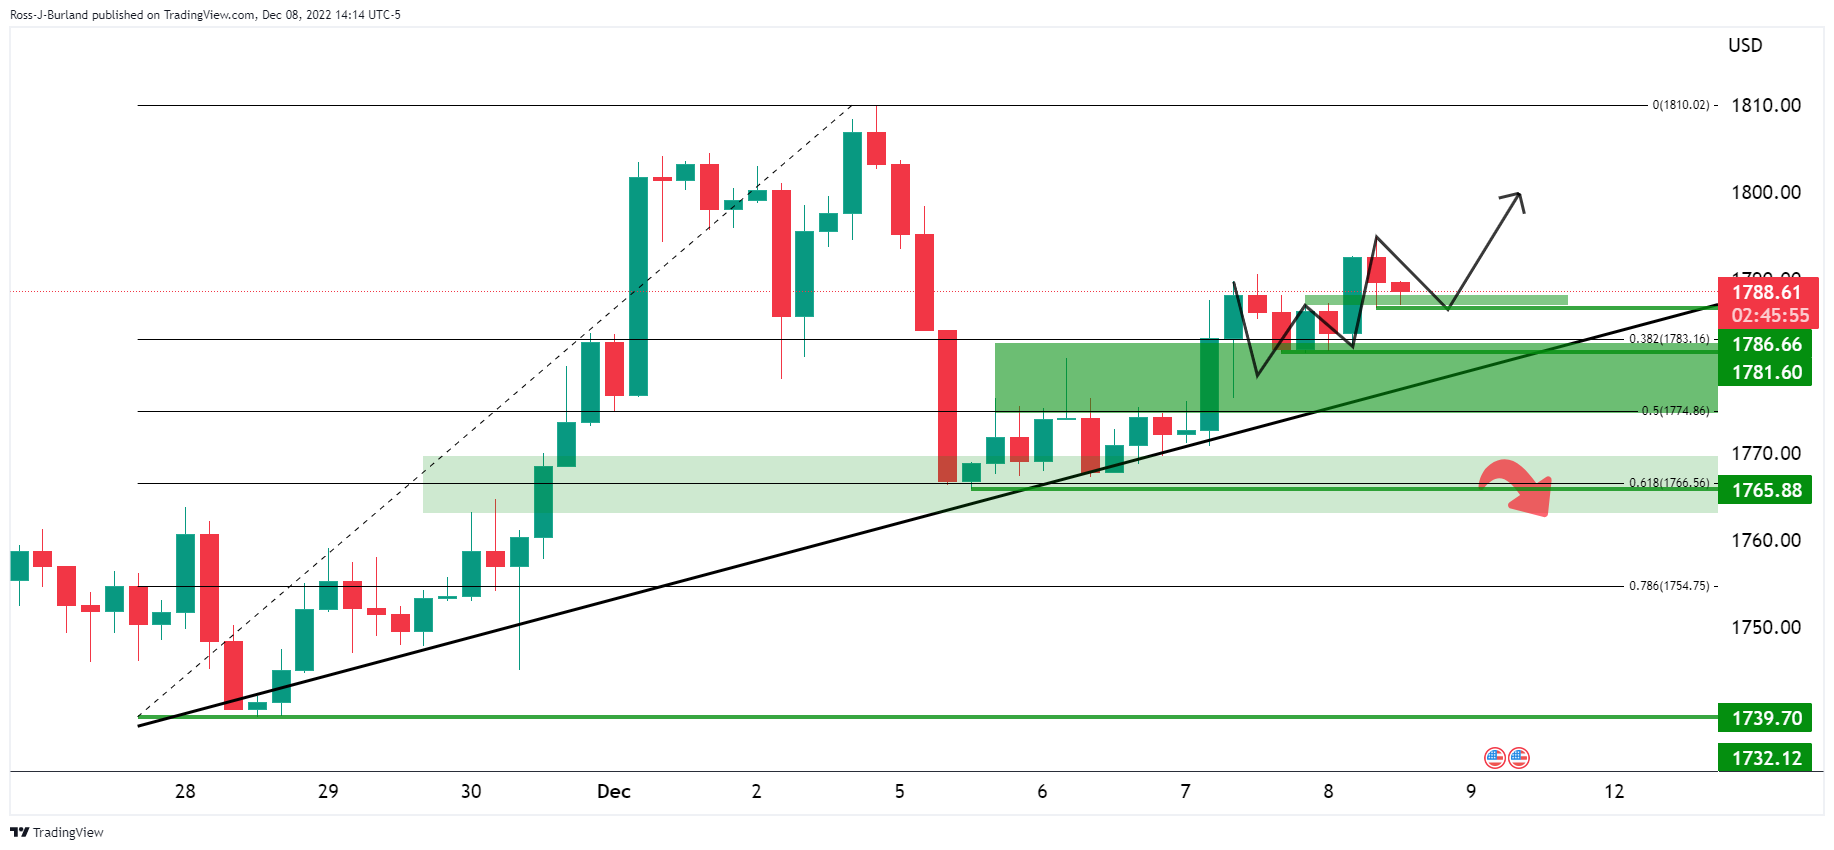
Gold price portrays a rising wedge bearish chart formation on the four-hour play. However, the firmer Relative Strength Index (RSI) line, placed at 14, as well as bullish signals from the Moving Average Convergence and Divergence (MACD) indicator, keeps the XAU/USD buyers hopeful.
That said, the $1,800 threshold and the weekly high, as well as the monthly peak, surrounding $1,810 appear as the immediate levels that lure the Gold buyers. Though, the upper line of the stated wedge, close to $1,816 at the latest, could question the metal’s further advances.
In a case where the quote rises past $1,816, the odds of witnessing a run-up toward the mid-June high near $1,858 can’t be ruled out.
On the flip side, a convergence of the 50-Exponential Moving Average (EMA) and lower line of the wedge, around $1,777, appears the key support to watch during the fresh declines of the Gold price.
Also acting as an important support is the horizontal area comprising October’s high and late November swing low, close to $1,730-32.
Overall, Gold price grinds higher inside a bearish chart pattern.
Gold price: Four-hour chart
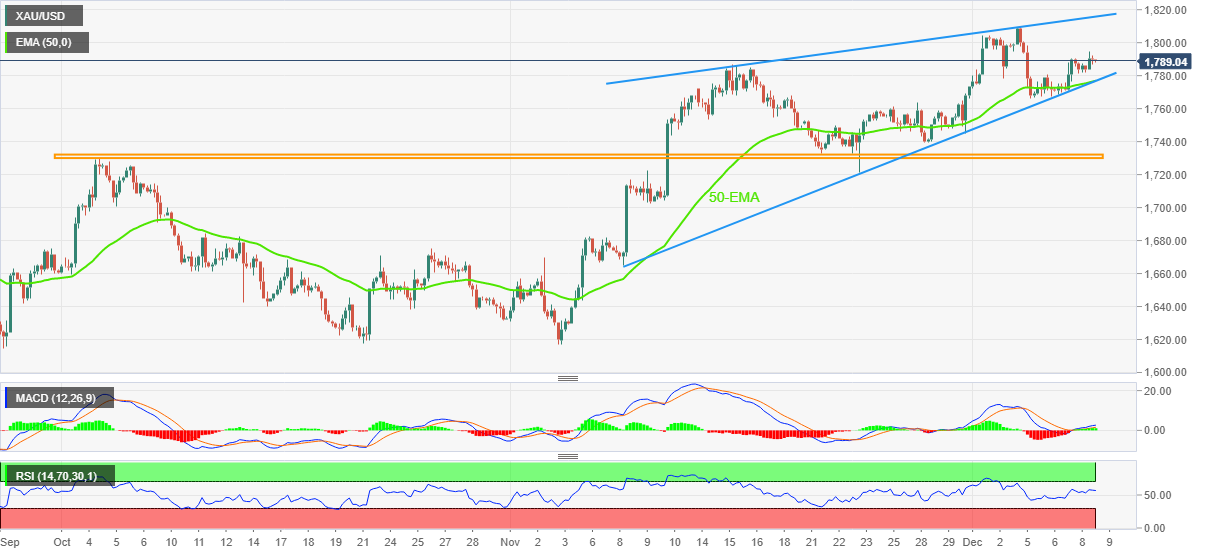
Trend: Limited upside expected
- EUR/USD is eying more upside towards a weekly high at 1.0600 amid a cheerful market mood.
- The US Treasury yields have extended their gains to near 3.49% as the Fed is set to hike the interest rate further.
- The ECB is looking to hike interest rates by 50 bps next week.
The EUR/USD pair climbed above the psychological hurdle of 1.0500 in the New York session and is aiming to sustain above the same ahead. The major currency pair is expected to kiss a weekly high around 1.0600 amid a significant improvement in the risk appetite of the market participants.
Meanwhile, the US Dollar Index (DXY) has slipped below the round-level cushion of 105.00 as investors have shrugged off uncertainty about a recession situation in the United States economy. S&P500 recovered sharply on Thursday after three consecutive bearish trading sessions, portraying a recovery in the risk-on profile. The 10-year US Treasury yields have extended their gains to near 3.49% as the Federal Reserve (Fed) is set to hike the interest rate next week.
As the inflation rate is extremely far from the desired rate of 2% and the Fed has yet not reached the neutral rate, continuation of policy tightening is highly expected. Analysts at Danske Bank see a further hike in interest rates by 50 basis points (bps) and a hawkish message from Fed chair Jerome Powell for CY2023. Also, the neutral rate is expected at 5.00-5.25%.
On Friday, investors will focus on the release of the five-year Consumer Inflation Expectation data. A de-anchored inflation data could accelerate recession fears in the US economy as it will force Fed policymakers to look more at a higher interest rate peak than current projections.
Meanwhile, Eurozone investors are shifting their focus toward the interest rate decision by the European Central Bank (ECB), which will be announced next week. Analysts at Rabobank think that the ECB is likely to raise the policy rate by 50 basis points in December but note that they are not fully discounting the possibility of a 75 bps hike. They have forecasted a terminal rate at 3%.
Reuters reports that the US Treasury Secretary Janet Yellen on Thursday said the Biden administration was listening to concerns raised by European allies over the US Inflation Reduction Act, a $430 billion green energy subsidy package.
Many European Union countries fear their companies will be unfairly disadvantaged by the subsidies contained in the new law.
"We will look at what is legal and what is feasible," Yellen told reporters.
Yellen said the US can avoid recession, given that there is no wage-price spiral and supply chain bottlenecks are starting to ease.
"Recession is not inevitable," Yellen told reporters. She declined to say whether the dollar had peaked against other currencies.
- NZD/USD bulls stay in charge on the softness in the US Dollar.
- USD data will be key in the build-up to the Fed next week.
NZD/USD is up on the day as the US Dollar bulls fold ahead of key data in the build-up to the Federal Reserve (Fed) meeting next week. The Kiwi has rallied from a low of 0.6326 and reached a high of 0.6388 with the US Dollar touching its lowest level since Monday as per the DXY index.
The index eased to a low of 104.724 while investors positioned themselves ahead of key US inflation data on Friday and next week. The slide in the greenback comes at the same time a rise in weekly jobless claims suggested that the labour market is slowing down. Weekly jobless claims rose to 230K, as expected. Continuing claims rose to 1.671M, topping the forecast of 1.6M and the data comes ahead of next week's Federal Reserve meeting.
The data falls ahead of Friday's Producer Price Index (PPI) and the University of Michigan's consumer sentiment survey and then next week's November Consumer Price Index will be due. Investors w look for any signs that the Federal Reserve is getting ready to pause its hikes.
Domestically, local data today will give a final steer on how third quarter Gross Domestic Product GDP (due next week) is shaping up, but analysts at ANZ Bank said it is unlikely to perturb FX markets much. As with most of the year, the focus is offshore, they said.
''In that regard, tonight’s US PPI data will be interesting, as it’ll highlight any upstream pressures in CPI, due out next week – which, recall, was the main catalyst for the turn in the USD last month. We thus continue to brace for volatility, especially with US 10yr bond yields now 1% below where we expect the fed funds rate to be after next week’s decision as markets all but ignore hawkish elements of Fed rhetoric. Buckle up!''
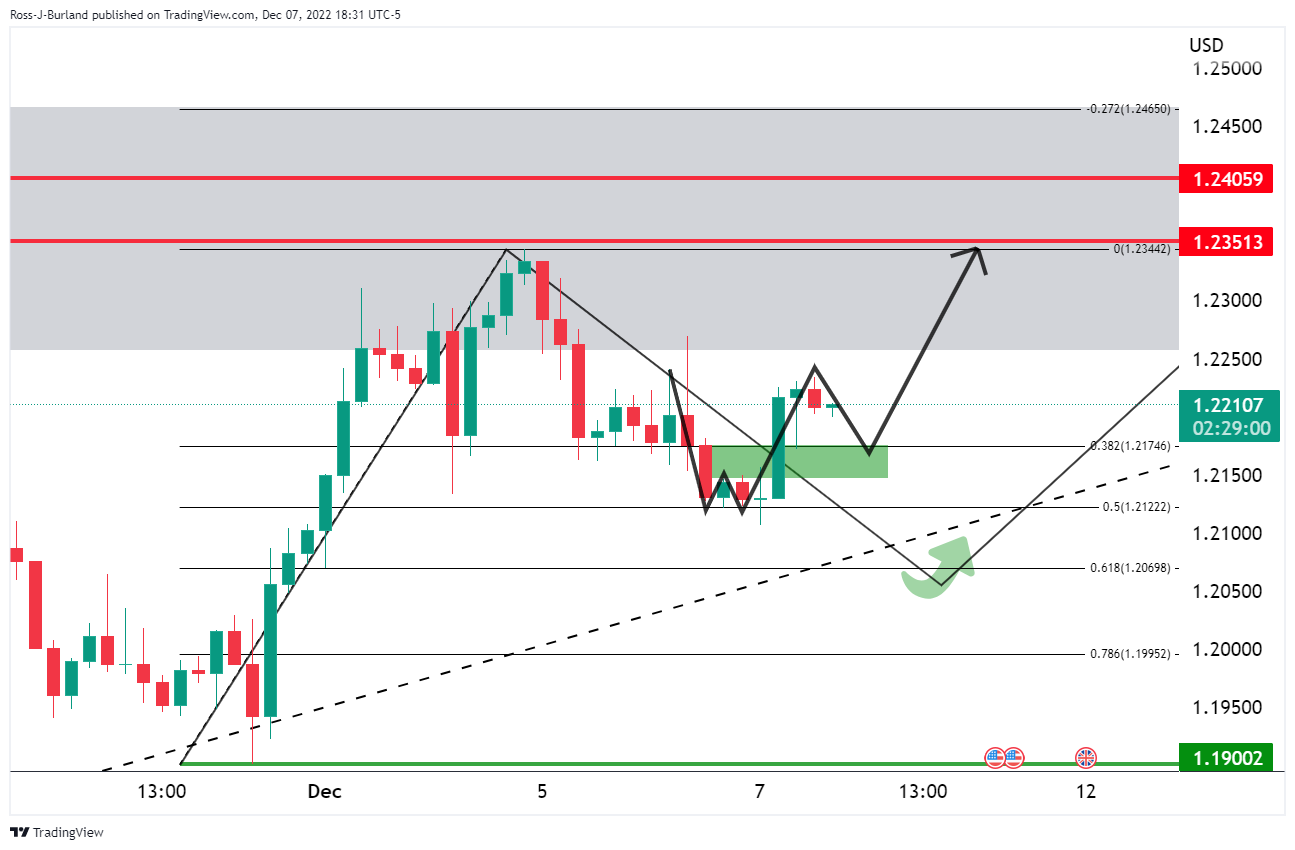
- GBP/USD's combination of harmonic patterns is a bearish feature.
- A trip into the Fibonacci scale could be on the cards for the remainder of the week with 1.22 eyed.
In the prior analysis, GBP/USD Price Analysis: Bulls in control and eye 1.2350, it was explained that the bulls took out a key resistance and so long as 1.2150 holds, there would be prospects of a rally towards 1.2350 and then 1.2450 for the days ahead:
GBP/USD prior analysis
GBP/USD update
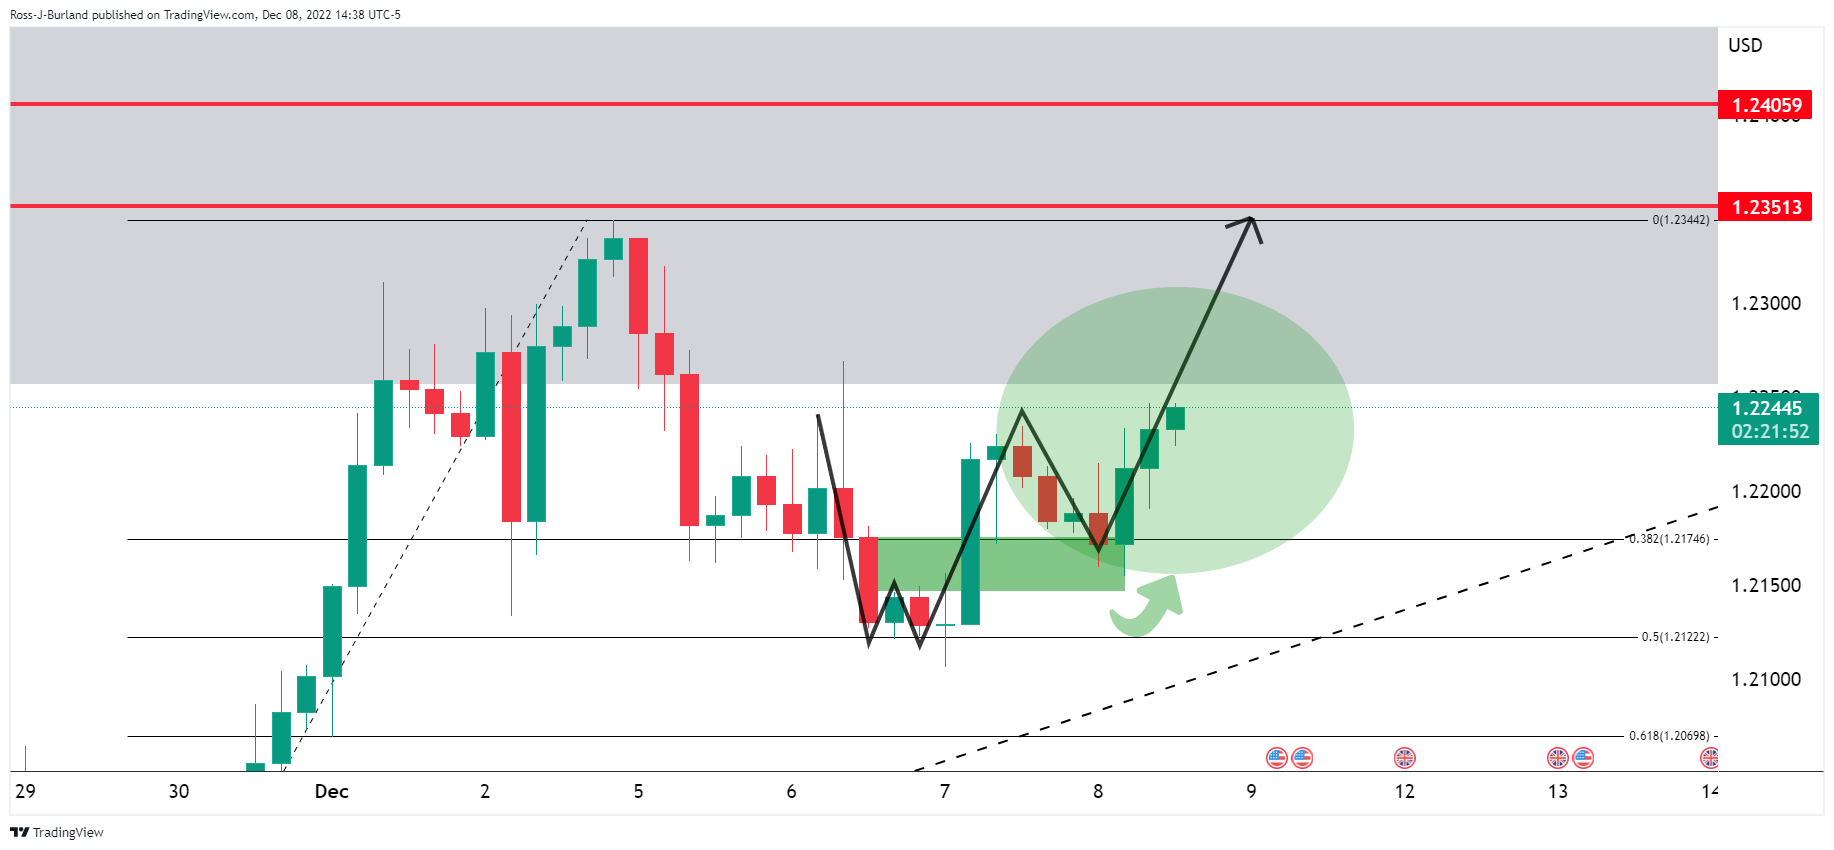
The price respected the support area and subsequently moved higher. However, another W-formation has formed which could see the Gold price move into the neckline prior to the next bullish impulse:
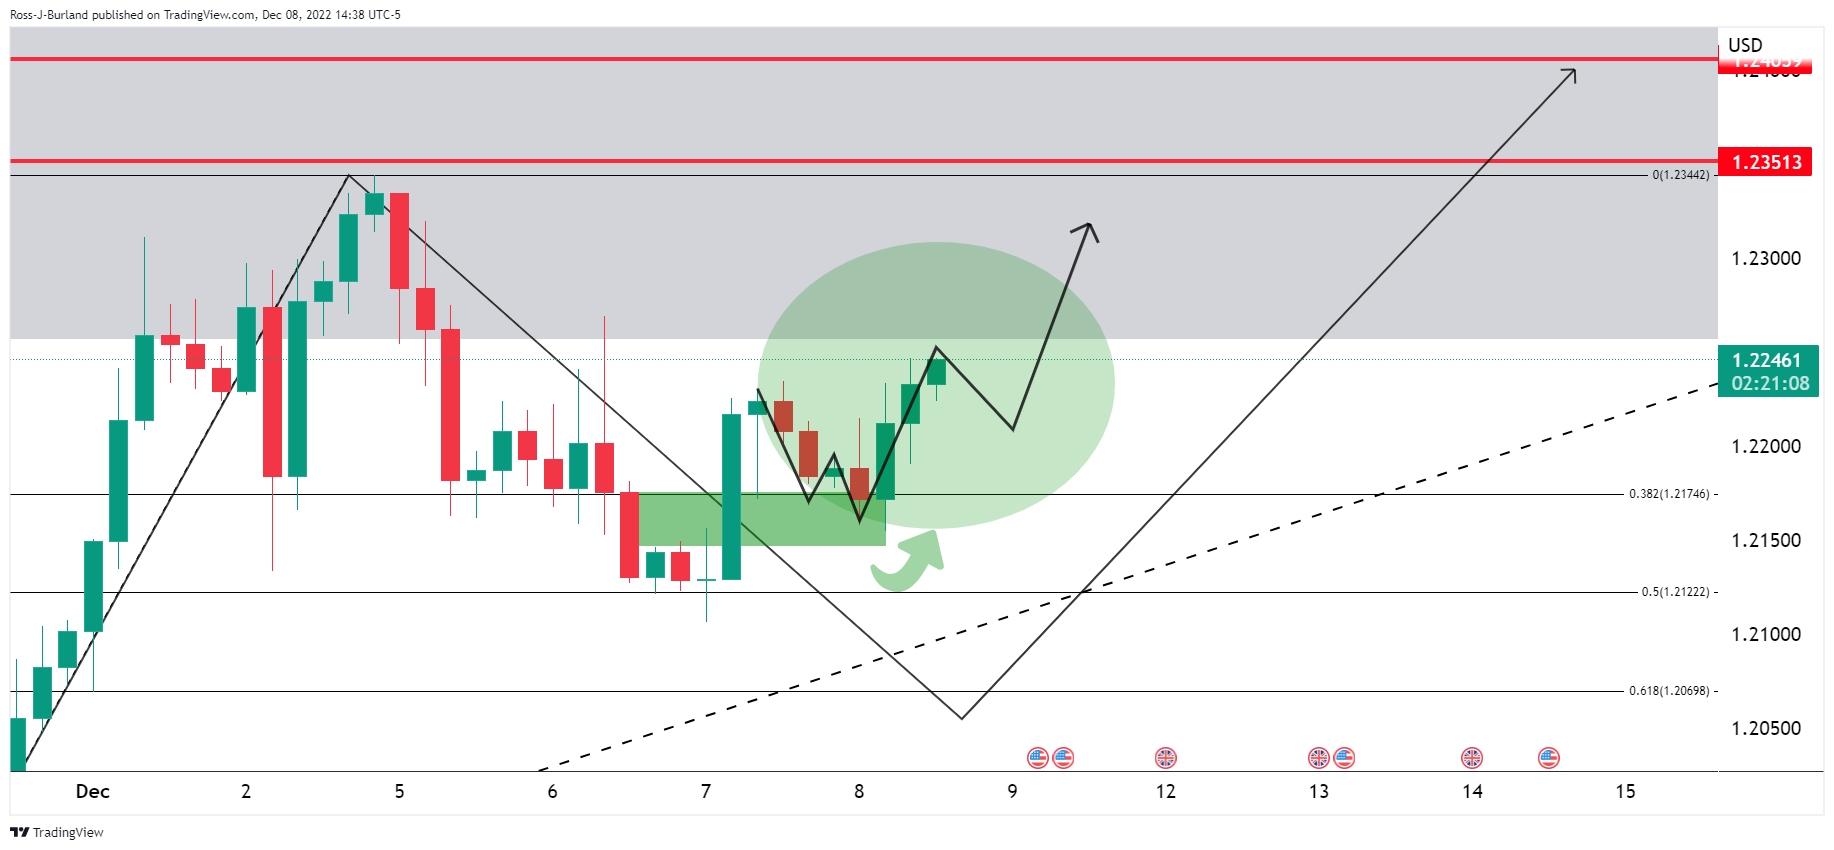
GBP/USD M10 chart
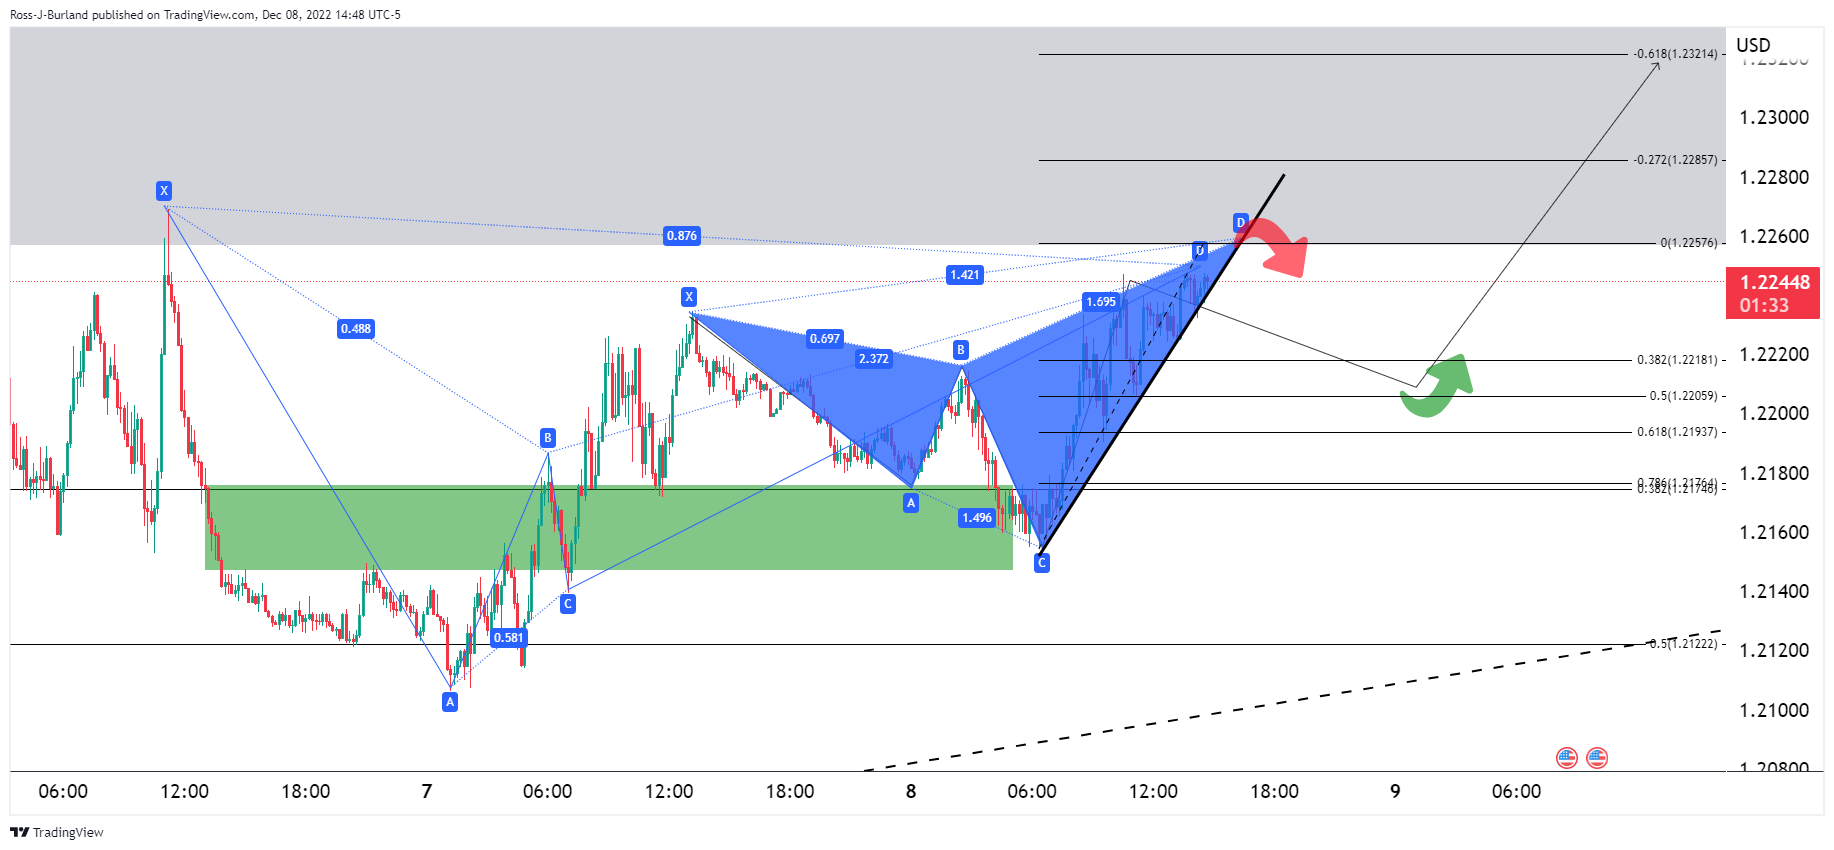
The combination of the harmonic patterns is a bearish feature for the near term and a trip into the Fibonacci scale could be on the cards for the remainder of the week with 1.22 eyed.
What you need to take care of on Friday, December 9:
The better tone of US stocks weighed on the American Dollar. The USD finished the day with losses against most of its major rivals, shedding most ground early in the US session, and spending the rest of it in consolidation mode.
Volatility decreased amid the absence of first-tier figures and ahead of central banks’ decisions next week, as speculative interest lacks certainties about their next moves on monetary policy. The US Federal Reserve, the European Central Bank, the Switzerland National Bank and the Bank of England will provide monetary policy updates next week.
The EUR/USD pair trades at around 1.0540, while GBP/USD is up to 1.2235. AUD/USD advanced for a second consecutive day and hovers around 06760.
Bank of Canada Deputy Governor Sharon Kozicki said the bank will study the latest economic data to gauge whether or not to raise interest rates, adding it would move forcefully if necessary. The Canadian Dollar strengthened, with USD/CAD down to 1.3580.
The USD/JPY saw little action and finished the day little changed at around 136.70. The USD/CHF is down to 0.9360.
Gold posted a modest intraday advance and trades around $1,787 a troy ounce. Crude oil prices, on the other hand, kept falling with WTI trading at $71.60 a barrel.
Friday will start with China publishing the November Consumer Price Index and the Producer Price Index. Later in the day, it will be the turn of the US to unveil wholesale inflation. The US PPI is expected to have risen by 7.4% YoY in November, down from 8% in the previous month.
Like this article? Help us with some feedback by answering this survey:
- Gold bulls eye a run towards $1,800 from W-formation neckline support.
- All eyes will be on the Federal Reserve next week and key data before then.
Gold price is up on the day by some 0.22% after rising from a low of $1,781 to a high of $1,794.88 so far on Thursday. Markets have been relatively quiet on the day with little data released and the Federal Reserve in a blackout. Nevertheless, The US dollar eased, while investors positioned themselves ahead of key US inflation data and the Federal Reserve's policy meeting due next week.
The US Dollar index, as measured by the DXY index, fell 0.4% from a high of 105.433 to a low of 104.724, making gold less expensive for other currency holders. The dip came at the same time a rise in weekly jobless claims suggested that the labour market is slowing down. Weekly jobless claims rose to 230K, as expected. Continuing claims rose to 1.671M, topping the forecast of 1.6M and the data comes ahead of next week's Federal Reserve meeting.
There will be more key data events coming up before the Federal Reserve December 14 meeting. The Producer Price Index and the University of Michigan's consumer sentiment survey on Friday as well as November's Consumer Price Index are due. Investors will be on the watch for any signs that the Federal Reserve is getting ready to pause its hikes.
Fed expectations
Meanwhile, money markets show there is a 91% chance that the policy-setting Federal Open Market Committee (FOMC) will raise rates by half a point next week, and just a 9% chance there will be another 75 basis point increase with the rates peaking in May 2023 at 4.92%. The US Federal Reserve has already raised its policy rate by 375 basis points this year in the fastest hikes since the 1980s.
Meanwhile, supportive of the Gold price, safe haven assets were in strong demand amid growing recessionary fears this week as seen in the thirty-year Treasuries that dropped more than 10bp to a three-month low while yields on the 10-year were also lower. The yield curve between the 2-year and 10-year Treasury notes US 10-year has also widened in recent days.
Gold technical analysis
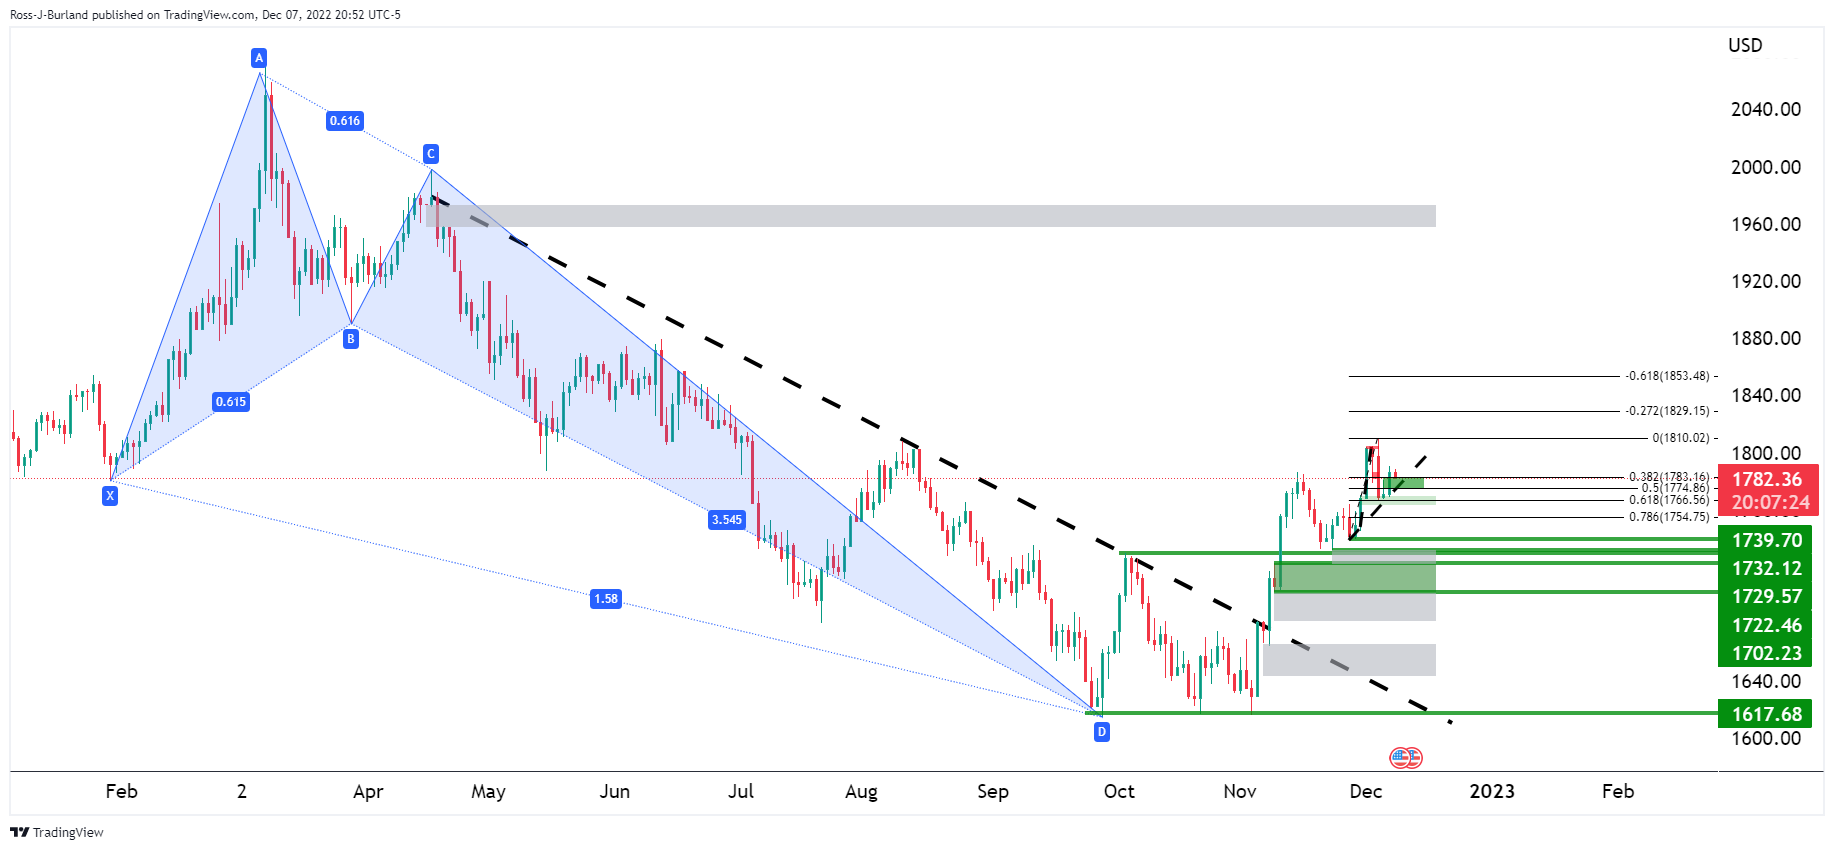
The daily charts above show the Gold price correcting in the harmonic formation although it has started to decelerate below the key $1,800s. On the 4-hour chart below, the Gold price is attempting to move higher and so long as the W-formation's neckline holds, there will be prospects of an upside continuation:
Deputy Governor Sharon Kozicki said in a speech in Montreal that the Bank of Canada will in study the latest economic data to gauge whether or not to raise interest rates, adding it would move forcefully if necessary.
Key Quotes
"We expect our decisions will be more data-dependent," Deputy Governor Sharon Kozicki said in a speech in Montreal, adding the bank is still prepared to be "forceful" with rates.
"We are moving from how much to raise interest rates to whether to raise interest rates."
"With the labor market still tight and businesses still finding it easy to raise their prices, Governing Council agreed that the economy still needs a more sustained moderation of demand," Kozicki said.
USD/CAD update
At the time of writing. USD/CAD is trading at 1.3581 and down by over 0.5%. The Canadian Dollar has been tracking oil higher this week and has been boosted by the central bank lifting rates at a record pace of 400 basis points in nine months to 4.25% - a level that was last seen in January 2008. However, the BoC also signalled this week that its unprecedented tightening campaign was near an end, dropping language that said they would have to rise further.
- EUR/USD bulls rally on Federal Reserve and European Central Bank prospects.
- United States economic data weighed on the US Dollar with more to come before the Federal Reserve,
- EUR/USD bulls are firming from near 1.0480 support and are taking on resistance around 1.0570.
EUR/USD is firmly higher on Thursday due to diminishing expectations for the Federal Reserve (Fed) to keep raising interest rates at the same aggressive pace. A rise in weekly jobless claims suggests that the labour market is slowing down. EUR/USD is currently 0.38% higher having rallied from a low of 1.0489 to a high of 1.0564 on the day so far.
Federal Reserve expectations
Weekly jobless claims rose to 230K, as expected. Continuing claims rose to 1.671M, topping the forecast of 1.6M and the data comes ahead of next week's Federal Reserve meeting. Money markets show there is a 91% chance that the policy-setting Federal Open Market Committee (FOMC) will raise rates by half a point next week, and just a 9% chance there will be another 75 basis point increase.
There will be more key data events coming up before the Federal Reserve December 14 meeting. The Producer Price Index and the University of Michigan's consumer sentiment survey on Friday as well as November's Consumer Price Index are due. Investors will be on the watch for any signs that the Fed is getting ready to pause its hikes.
Noting the shift in market sentiment following last Friday's Nonfarm Payrolls (NFP) and this week's ISM Services data, analysts at Danske Bank said ''we acknowledge that our earlier call of a 75bp hike next week appears unlikely, but do not think the need to tighten monetary policy further has disappeared. We adjust our Federal Reserve call, and now expect a 50 basis points (bp) hike next week, followed by 50bp in February and 25bp in March. Thus, we maintain our call for a terminal rate of 5.00-5.25% unchanged.''
European Central Bank in focus
The European Central Bank (ECB) and the Bank of England (BoE) are also set to announce interest rate decisions next week and are expected to act in order to thwart stubbornly high inflation.
''At next week's meeting, we expect the European Central Bank to deliver a 50bp rate hike with a hawkish twist,'' analysts at Danske Bank said. ''Specifically, we expect the European Central Bank to present key principles of the end to reinvestments under the Asset Purchase Programme (APP) process (in which reinvestments will almost come to a full stop) and an open-ended wording for more rate hikes to come. This will be a compromise, which we believe will be palatable to both hawks and doves.''
''We currently expect European Central Bank rate hikes into Q1 next year, with the deposit rate peaking at 2.75%, but with risks skewed for more hikes,'' the analysts added.
EUR/USD technical analysis
While on the front side of the daily trendline, EUR/USD bulls are firming from near 1.0480 support and are taking on resistance around 1.0570. A break there opens the risk of a move in EUR/USD beyond 1.0600:
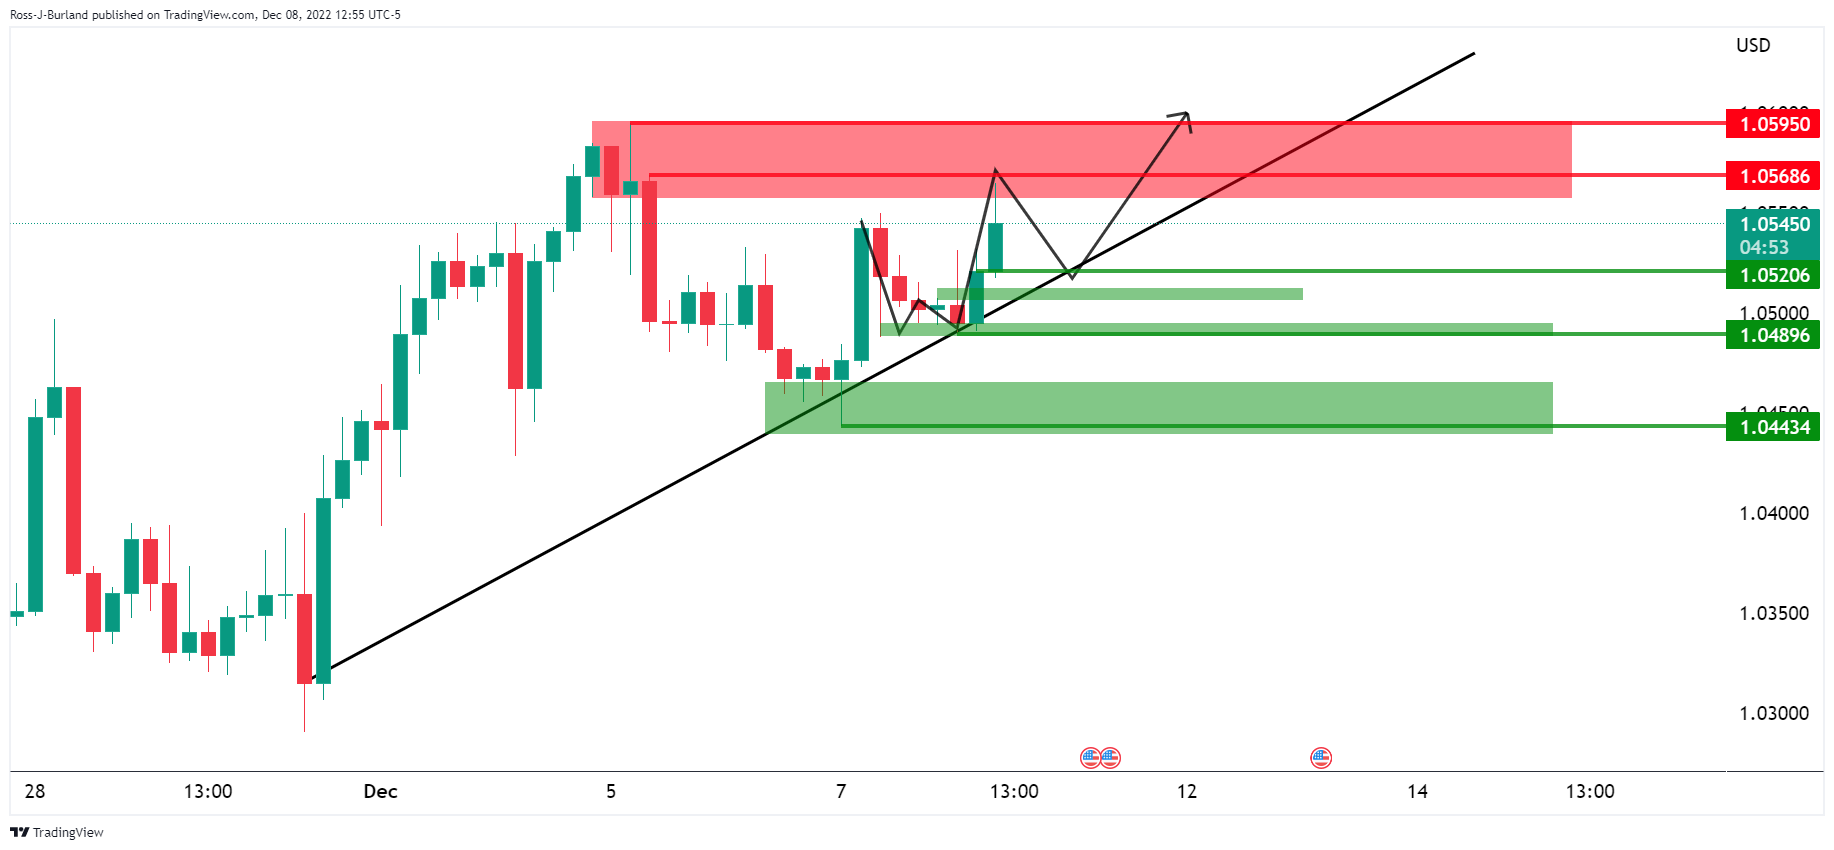
A move in EUR/USD below the trendline, however, will expose supports near 1.0490 and 1.0440 and open prospects of a deeper correction towards 1.0400.
Commenting on Brexit negotiations, German Foreign Minister Annalena Baerbock said on Thursday that they are "100% in line" with the European Commission and Ireland on the Northern Ireland Protocol, as reported by Reuters.
"We should use and seize the window of opportunity on Northern Ireland Protocol talks," Baerbock added.
Market reaction
These comments don't seem to be having a significant impact on Pound Sterling's performance against its rivals. As of writing, GBP/USD was trading at 1.2230, where it was up 0.28% on a daily basis.
Next week, the European Central Bank will have its monetary policy meeting. Analysts at Danske Bank see the central bank raising rates by 50 basis points and to continue rising rates into the first quarter of next year. They see the deposit rate peaking at 2.75%, but with risks skewed for more hikes.
Key Quotes:
“At next week’s meeting, we expect the ECB to deliver a 50bp rate hike with a hawkish twist. Specifically, we expect the ECB to present key principles of the end to reinvestments under the APP process (in which reinvestments will almost come to a full stop) and an open-ended wording for more rate hikes to come. This will be a compromise, which we believe will be palatable to both hawks and doves.”
“For EUR/USD, the ECB meeting will conclude a busy week that also includes US CPI and the FOMC meeting. Overall, we do not expect a ‘hawkish 50bp hike’ will leave a big impact on EUR/USD, but it depends on the momentum heading into the meeting. The market may feed off a hawkish ECB, if US CPI inflation drops again and the Fed comes across as dovish and sends EUR/USD to new highs. Vice versa, higher US CPI inflation may turn around momentum in EUR/USD, send it back down and leave the ECB meeting less relevant.”
According to analysts at Wells Fargo, the US Dollar will remain strong early next year, followed by a depreciation during the second half of 2023. As market participants begin to anticipate eventual policy easing in the US, they believe the greenback will start to trend lower beginning in mid-2023.
Key Quotes:
“The over-arching theme for most of 2022 was that of U.S. dollar strength. In fact, the Federal Reserve's trade-weighted dollar index is up nearly 6% on balance since the beginning of 2022. We expect this theme of U.S. dollar strength to persist in early 2023 as U.S. economic trends remain resilient relative to other major developed economies, and as the Federal Reserve pursues a more aggressive pace of monetary tightening compared to other major central banks. With the Fed set to deliver rate hikes through March 2023, and most other central banks seen finishing their tightening cycles at a similar time, we believe the U.S. dollar index could gain a further 4%-5% by the end of Q1-2023.”
“But as the Fed ends its tightening cycle and U.S. economic trends worsen, we believe the greenback will enter a period of cyclical depreciation and weaken against most foreign currencies for the remainder of next year. We anticipate that dollar weakness will be broad enough such that most G10, as well as emerging market currencies, can strengthen vis-à-vis the greenback over the course of 2023.”
“In that sense, we believe 2023 could be ripe for emerging market currencies to not only recover against the U.S. dollar, but also outperform relative to G10 currencies.”
Next week, the FOMC will have its two-day meeting. Market participants expect a 50 basis points rate hike. Analysts at Danske Bank continue to expect a hawkish message regarding the policy stance in 2023. They think the recent easing in financial conditions is premature, and further hikes will be needed.
Key Quotes:
“US economy remains on a path of modest growth in Q4, and Fed needs to force a moderate recession next year to avoid prolonging inflation from here. Getting demand lower requires broad financial conditions to retighten again, which likely includes a combination of more rate hikes in Q1, still elevated longer real yields and stronger USD.”
“We acknowledge that our earlier call of a 75bp hike next week appears unlikely, but do not think the need to tighten monetary policy further has disappeared. We adjust our Fed call, and now expect 50bp hike next week, followed by 50bp in February and 25bp in March. Thus, we maintain our call for a terminal rate of 5.00-5.25% unchanged.”
- Wall Street adds to gains while US Treasury yields remain steady.
- Japanese up versus US Dollar, steady versus other rivals.
- USD/JPY down for the second day in a row, still above 136.00.
The USD/JPY is falling on Thursday but still holds above the 136.00/30 support area. The pair peaked on Asian hours at 137.25 and then turned to the downside. It is hovering around 136.45, down for the second day in a row.
The US Dollar Index (DXY) is down by 0.28% despite modestly higher US Treasury yields and on the back of risk appetite. The biggest gainers on Thursday are commodity prices as gold and silver rise sharply.
The Japanese yen is up versus the US Dollar despite yields and higher equity prices. The Dow Jones is up by 0.74% and the Nasdaq gains more than 1%. Economic data released in the US came in below expectations with Initial Jobless Claims rising to 230K in the week ended December 3 while Continuing Claims increased by 62K in the week of November 26 to 1.671 million, the highest level since early February.
Key data to be released on Friday includes the Chinese Consumer Price Index, US Producer Price Index and the University of Michigan’s Consumer Sentiment.
USD/JPY weak but above 136.00/30
The intraday bias in USD/JPY point to the downside but losses seems limited while above 136.00/30. A break below would open the doors an extension of the decline.
On the upside, immediate resistance is seen at 136.70, followed by 137.00 and then 137.40. A firm break of 137.70 could change the short-term outlook from negative to neutral.
Technical levels
Analysts at Rabobank said they expect AUD/NZD to rise to the 1.08 area on a six-month view.
Scope for NZD/USD to drop back in coming months
"The RBNZ is forecasting a temporary contraction of 1% in GDP in 2023. The view is that this is necessary to bring demand back in line with supply and to stamp inflation out of the system. This GDP forecast contrasts with that from the RBA which projects no recession."
"The optimism assessment is that a short downturn this will put the NZ domestic economy on a better path to sustainable growth over the medium-term with this year’s input from tourism already providing a solid base for export growth. That said, the outlook fares poorly in relation to Australia where the economy is likely to continue to draw protection from energy production (though its terms of trade fell back sharply in Q3, driving by weak iron ore prices)."
"We expect AUD/NZD to creep higher to 1.08 on a 6 month view. We see scope for NZD/USD to drop back in the coming months as global growth slows and demand for safe haven increases but look for NZD/USD to move higher again on a 6 to 9 month view."
- US Dollar falls while commodity currencies outperform.
- Equity prices rise in Wall Street, head for a slide in Europe.
- GBP/USD with positive momentum, tests relevant resistance.
The GBP/USD is up on Thursday for the second day in a row but the upside remains limited by the 1.2230 area. Risk appetite and a weaker dollar are supporting the pair.
In Wall Street, the Dow Jones is up by 0.72% while the Nasdaq gains by 1.10%. European indexes are in negative, with the FTSE 100 down by 0.07%. The US Dollar Index is falling by 0.25%. The best performers in FX are commodity currencies as Gold, Silver and oil rise sharply.
Economic data released on Thursday showed US Initial Jobless Claims rose as expected to 230K in the week ended December 3 while Continuing Claims increased by 62K in the week of November 26 to 1.671 million, above the 1.575 million of market consensus, hitting the highest level since early February.
On Friday, China will report the Consumer Price Index for November that is expected to show an increase of 1% (annual). The Bank of England will release the Consumer Inflation Expectations report. In the US are due the Producer Price Index and the University of Michigan Consumer Sentiment report.
GBP/USD short-term outlook
The GBP/USD pair is trading at daily highs, challenging the 1.2230 zone. If it consolidates above, the positive momentum will favor more gains, targeting 1.2260. Above, attention would turn to 1.2290/1.2300.
A failure to break 1.2230 would keep the pair sideways between that area and 1.2150. A slide below would expose the weekly low at 1.2104.
Technical levels
- US Dollar falls across the board on Thursday, amid risk appetite.
- AUD/USD strengthens after breaking 0.6750, trims weekly losses.
- US Initial Jobless Claims rise to 230K and Continuing Claims hit fresh monthly highs.
A slide of the US Dollar across the board boosted the AUD/USD pair that broke above 0.6745. It hit three-day highs at 0.6769 following US economic data and then pulled back to 0.6755/60.
The US Dollar is falling modestly while commodity currencies are rising strongly. Gold, silver and crude oil are all up. The DXY is down just 0.05% at 105.10. US Treasury yields hold steady, marginally higher.
Regarding economic data, US Initial Jobless Claims rose as expected to 230K in the week ended December 3 while Continuing Claims increased by 62K to 1.671 million in the week ended November 26, above the 1.575 million of market consensus, hitting the highest level since early February. On Friday, China will report the Consumer Price Index for November which is expected to show an increase of 1.5% (annual).
Positive short-term outlook for AUD above 0.6750
The AUD/USD gained momentum after breaking the 0.6740/50 area that capped the upside during the previous two trading days. While above this level, the outlook is bullish of the Aussie in the very short-term. The next resistance is seen at 0.6780 followed by 0.6795.
A slide back under 0.6740 would weaken the pair, exposing the next support area at 0.6710. Below, the next one stands at 0.6680.
Technical levels
- SUD/CAD comes under heavy selling pressure and is weighed down by a combination of factors.
- A solid recovery in oil prices underpins the Loonie and exerts pressure amid a softer greenback.
- Rebounding US bond yields, recession fears should limit the USD losses and lend some support.
The USD/CAD pair continues with its struggle to make it through the 1.3700 mark and attracts aggressive selling on Thursday. The sharp intraday decline drags spot prices below the 1.3600 round figure during the early North American session and is sponsored by a combination of factors.
As investors look past a dovish 50 bps rate hike by the Bank of Canada (BoC), a solid recovery in crude oil prices underpins the commodity-linked Loonie. Hopes that the easing of COVID-19 curbs in China will revive fuel demand assist the black liquid to snap a four-day losing streak to a fresh YTD low. Apart from this, a modest US Dollar weakness exerts downward pressure on the USD/CAD pair and contributes to the sharp intraday fall of around 100 pips.
As investors seek clarity on the Fed's rate-hike path, a mildly positive tone around the equity markets is seen weighing on the safe-haven greenback. That said, rebounding US Treasury bond yields, along with growing recession fears, should help limit losses for the USD. Traders might also refrain from placing aggressive bets and prefer to wait for next week's release of the US consumer inflation figures and the highly-anticipated FOMC monetary policy meeting.
The crucial US CPI report, along with the Fed decision will play a key role in influencing the near-term USD price dynamics and provide a fresh directional impetus to the USD/CAD pair. This makes it prudent to wait for strong follow-through selling before confirming that the recent positive move witnessed over the past week or so has run out of steam. That said, bulls need to wait for a sustained move beyond the 1.3700 mark before positioning for additional gains.
Technical levels to watch
- Initial Jobless Claims in the US increased by 4,000 in the week ending December 3.
- US Dollar Index stays in negative territory near 105.00.
There were 230,000 initial jobless claims in the week ending December 3, the weekly data published by the US Department of Labor (DOL) showed on Thursday. This print followed the previous week's print of 226,000 (revised from 225,000) and came in line with the market expectation.
Further details of the publication revealed that the advance seasonally adjusted insured unemployment rate was 1.2% and the 4-week moving average was 230,000, an increase of 1,000 from the previous week's revised average.
"The advance number for seasonally adjusted insured unemployment during the week ending November 26 was 1,671,000, an increase of 62,000 from the previous week's revised level," the DOL noted in its publication.
Market reaction
The US Dollar Index edged slightly lower after this report and was last seen losing 0.18% on the day at 104.98.
- Gold price struggles to capitalize on its gains recorded over the past two trading sessions.
- Rebounding US Treasury bond yields revives US Dollar demand and acts as a headwind.
- Traders also seem reluctant amid uncertainty over the Federal Reserve’s rate hike path.
Gold price reverses an intraday dip to the $1,780 area and climbs to the top end of its daily trading range heading into the North American session. The XAU/USD is currently placed just above the $1,785 level, though lacks bullish conviction and remains below a technically significant 200-day Simple Moving Average (SMA).
Traders wait for clarity about the Federal Reserve’s rate hike path
The sideways consolidative move comes amid the uncertainty over the Federal Reserve's rate-hike path, which tends to drive the non-yielding Gold price. The current market pricing indicates over a 90% chance of a relatively smaller 50 bps rate hike move by the US central bank in December. That said, the recent positive macro data from the United States backed the case for further policy tightening and fueled speculations that the Fed may lift interest rates more than projected.
Focus remains on next week’s key data/event risk from the United States
Hence, the focus will remain glued on the upcoming Federal Open Market Committee (FOMC) monetary policy meeting on December 13-14. Heading into the key central bank event risk, investors will take cues from the release of the latest consumer inflation figures from the United States. The crucial CPI report plays a key role in influencing the Federal Reserve's policy outlook. This, in turn, should determine the near-term trajectory for Gold price, which is also seen as a hedge against inflation.
Rebounding US Treasury bond yields seems to cap Gold price
In the meantime, a goodish rebound in the US Treasury bond yields is seen acting as a tailwind for the US Dollar and keeping a lid on the Dollar-denominated Gold price. Apart from this, a generally positive risk tone, bolstered by the optimism over the easing of COVID-19 curbs in China, contributes to capping the upside for the safe-haven XAU/USD. The aforementioned factors might hold back traders from placing aggressive bets and supports prospects for an extension of the range-bound price action.
Gold price technical outlook
From a technical perspective, the 200-day SMA, currently around the $1,792-$1,793 area, is likely to act as an immediate hurdle ahead of the $1,800 psychological mark. The next relevant hurdle is pegged near the $1,810 area, or the multi-month top touched on Monday, above which Gold price could appreciate further towards the $1,830 hurdle. The momentum could eventually lift the XAU/USD to the $1,843-$1,845 supply zone.
On the flip side, the $1,775-$1,774 region could protect the immediate downside ahead of the weekly low, around the $1,765-$1,764 area. Some follow-through selling, leading to a subsequent break below the $1,761-$1,760 horizontal resistance breakpoint, will negate any near-term positive outlook and shift the bias in favour of bearish traders. Gold price might then turn vulnerable to accelerate the fall towards the $1,738-$1,737 area en route to the $1,725 level.
Key levels to watch
Analysts at Rabobank think that the European Central Bank (ECB) is likely to raise the policy rate by 50 basis points in December but note that they are not fully discounting the possibility of a 75 bps hike.
We maintain our forecast of a 3% terminal rate
"Despite a first easing of headline inflation, core inflation is still high and will slow the convergence of inflation back to target. The new staff projections will include a 2025 forecast, but given recent forecast errors the ECB should err on the side of caution as long as upside inflation risks remain."
"A slower rate path does not mean a lower terminal rate. Conveying this message will be a key challenge for President Lagarde. Details on quantitative tightening may steal the limelight.
"We maintain our forecast of a 3% terminal rate. As such, we have extended our policy expectations with a final 25bp hike in April. We could see quantitative tightening run at a monthly pace of €25-30bn, and we have pencilled in a Q2 start date."
- EUR/USD struggles to gain any meaningful traction and oscillates in a narrow trading band.
- Rebounding US bond yields, recession fears revive the USD demand and act as a headwind.
- The uncertainty about the Fed’s rate-hike path caps the greenback and offers some support.
The EUR/USD pair struggles to capitalize on the overnight bounce from the 1.0440 area, or the lower end of its weekly range and oscillates in a narrow trading band on Thursday. The pair is currently placed around the 1.0500 psychological mark, nearly unchanged for the day.
Following the previous day's pullback, the US Dollar regains some positive traction and turns out to be a key factor acting as a headwind for the EUR/USD pair. The recent positive US economic data fueled speculations that the Fed might lift rates more than recently projected. This, in turn, pushes the US Treasury bond yields, which, along with growing recession fears, revive demand for the safe-haven buck.
The shared currency, on the other hand, is undermined by diminishing odds for more aggressive rate hikes by the European Central Bank (ECB). Apart from this, worries about economic headwinds stemming from the protracted Russia-Ukraine conflict further contribute to capping the upside for the EUR/USD pair. The downside, however, remains cushioned amid rising bets for a 50 bps Fed rate hike in December.
Firming expectations that the US central bank will slow the pace of its policy tightening is holding back the USD bulls from placing fresh bets and lending some support to the EUR/USD pair. Hence, the focus remains glued to the highly-anticipated FOMC policy meeting on December 13-14. The ECB is also scheduled to announce its decision on Thursday, which should provide a fresh directional impetus to the major.
In the meantime, traders on Thursday will take cues from the release of the Weekly Initial Jobless Claims data from the US, due later during the early North American session. This, along with the US bond yields and the broader risk sentiment, might influence the USD price dynamics and allow traders to grab short-term opportunities around the EUR/USD pair.
Technical levels to watch
Economists at Nordea expect the European Central Bank (ECB) to raise key rates by 75 basis points for the third time in a row in December in a nod to the more hawkish voices in the Governing Council.
ECB to set broad guidelines for QT
"We think the ECB will postpone the decision on the starting date for reducing the huge bond holdings, or set the date for late Q2 or early Q3 2023, in a nod to the more dovish voices in the Governing Council."
"We think the ECB will set the broad guidelines for the reduction in bond holdings, or quantitative tightening (QT), including setting cap values for the amount of bonds allowed to mature each month, with the monthly cap initially set at EUR 10 to 20bn per month."
"We think the ECB will signal that while the central bank remains in a data-dependent mode, further hikes look likely and their magnitude is likely to moderate going forward."
Economists at TD Securities said they expect the Consumer Price Index in China to decline to 1.5% on a yearly basis in November from 2.1%.
November PPI to remain in deflationary territory
"Pork prices fell in November after several months of gains, contributing to a likely overall drop in food prices, while a higher base is also likely to result in a lower year-on-year CPI reading. Fuel prices have also added upward pressure on inflation over past months, but we expect this to have moderated in November too."
"Taken together, with weak demand side pressures, it all points to a subdued CPI outcome. Separately, we expect November PPI to remain in deflationary territory, with a print of -1.2% y/y likely (cons. -1.4%, last -1.3%)."
"While industrial metals and bulks recovered some ground over the month this was mitigated by a fall in oil prices. Additionally, despite rising Covid cases, there appears to be little sign of any build-up of supply constraints and any feed through into producer prices at present, with PMI input prices falling further."
Analysts at TD Securities noted that the Bank of Canada's (BoC) decision to hike the policy rate by 50 basis points to 4.25% was a mild hawkish surprise relative to market pricing and the analyst community.
Statement was more balanced than previous months
"The larger surprise was the Bank's signal that it may be finished with rate hikes as it softened its forward guidance, implying that 4.25% will be the Bank's terminal rate."
"The statement itself was more balanced than previous months, with the Bank citing evidence that interest rates are working to slow demand and that inflation momentum is softening. The Bank's new guidance suggests a more data-dependent approach going forward, and we look for the Bank to keep rates unchanged in January."
- Silver reverses an intraday dip to the $22.55 area and climbs back closer to the overnight swing high.
- The technical setup favours bullish traders and supports prospects for a further appreciating move.
- Any meaningful pullback might attract some di-buyers and remains limited near the $22.00 mark.
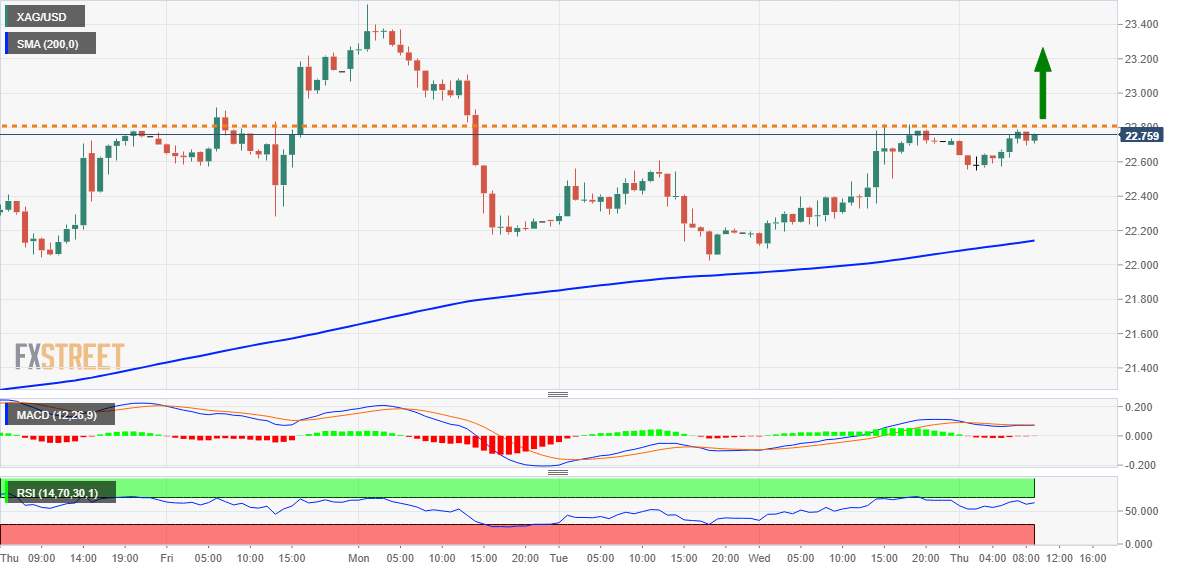
Silver attracts fresh buyers near the $22.55 region on Thursday and steadily climbs back closer to the overnight swing high during the first half of the European session. The white metal is currently placed around the $22.70-$22.75 area and seems poised to build on its intraday ascent.
This week's repeated failures to break through the $22.00 mark and the overnight goodish rebound from the vicinity of the 200-hour SMA favours bullish traders. Moreover, positive technical indicators on daily/hourly charts are still away from being in the overbought zone and add credence to the constructive outlook for the XAG/USD.
This, in turn, supports prospects for a move back towards reclaiming the $23.00 round-figure mark. The momentum could further get extended and allow the XAG/USD to challenge the multi-month peak, around the $23.50-$23.55 zone touched earlier this week. Some follow-through buying should pave the way for an extension of the upward trajectory.
On the flip side, the daily swing low, around the $22.55 region, should protect the immediate downside. Any subsequent fall might continue to find decent support near the 200-hour SMA, currently around the $22.15-$22.10 zone. This is followed by the $22.00 mark, which if broken will negate the positive outlook for the XAG/USD.
The next relevant support is pegged near the $21.40 region ahead of the technical significant 200-day SMA, around the $21.25 area, and the $21.00 mark. The latter should act as a strong base for spot prices. A convincing break below will shift the bias in favour of bearish traders and prompt aggressive technical selling around the XAG/USD.
Silver 1-hour chart
Key levels to watch
- AUD/USD remains confined in a range and is influenced by a combination of diverging forces.
- The subdued USD demand offers some support, though recession fears seem to cap the Aussie.
- Traders also prefer to wait on the sidelines ahead of the key FOMC policy meeting next week.
The AUD/USD pair struggles to capitalize on the overnight bounce from the 0.6670-0.6665 area, or a one-week low and seesaws between tepid gains/minor losses on Thursday. The pair holds steady above the 0.6700 mark through the early part of the European session, awaiting a fresh catalyst before the next leg of a directional move.
The downside for the AUD/USD pair, meanwhile, remains cushioned amid subdued US Dollar demand and optimism over the easing of COVID-19 restrictions in China. That said, growing worries about a deeper global economic downturn act as a headwind for the risk-sentiment Aussie. Traders also seem reluctant to place aggressive directional bets amid the uncertainty over the Fed's rate hike path.
It is worth mentioning that the markets have been pricing in a greater chance of a relatively smaller 50 bps Fed rate hike move in December. The incoming positive US macro data, however, suggested that the economy remained resilient and fueled speculations that the Fed might lift rates more than projected. This leads to a goodish rebound in the US Treasury bonds yields and offers support to the USD.
Hence, the focus will remain glued to the highly-anticipated FOMC monetary policy meeting on December 13-14. In the meantime, the mixed fundamental backdrop warrants some caution before positioning for a firm near-term direction. This, in turn, supports prospects for an extension of the range-bound price action around the AUD/USD pair as traders look to the US Initial Jobless Claims for some impetus.
Technical levels to watch
FX option expiries for Dec 8 NY cut at 10:00 Eastern Time, via DTCC, can be found below.
- EUR/USD: EUR amounts
- 1.0400-05 306m
- 1.0420-30 567m
- 1.0450 810m
- USD/JPY: USD amounts
- 136.35-45 420m
- 137.00 741m
- AUD/USD: AUD amounts
- 0.6665 201m
- 0.6700 526m
- 0.6800-10 1.02b
- USD/CAD: USD amounts
- 1.3490-00 881m
- 1.3550 500m
- 1.3650 785m
- USD/JPY oscillates in a narrow trading band amid subdued trading action on Thursday.
- A combination of factors undermines the JPY and extends some support to the major.
- Bets for less aggressive Fed rate hikes keep the USD bulls on the defensive and cap gains.
The USD/JPY pair lacks any firm directional bias and seesaws between tepid gains/minor losses through the early European session on Thursday. The pair, however, manages to hold its neck above the daily low and is currently placed around the 136.65-136.70 area, nearly unchanged for the day.
The Japanese Yen is weighed down by the weaker domestic data, showing an unexpected current account deficit and an economic contraction during the third quarter. Apart from this, a goodish rebound in the US Treasury bond yields widens the US-Japan rate differential and further contributes to driving flows away from the JPY. This, in turn, assists the USD/JPY pair to attract some buying near the 136.25 region.
The intraday uptick, however, lacks bullish conviction and runs out of steam near the 137.25 zone amid subdued US Dollar demand. Expectations that the Fed will slow the pace of its policy tightening cycle keeps the USD bulls on the defensive and caps the upside for the USD/JPY pair. That said, the incoming positive US macro data has been fueling speculations that the Fed might lift rates more than recently projected.
This, in turn, holds back traders from placing aggressive bets around the USD/JPY pair and leads to a range-bound price action. Hence, the focus will remain glued to the upcoming FOMC policy meeting on December 13-14. Heading into the key central bank event risk, investors will confront the release of the latest US consumer inflation figures, which should influence the Fed's policy outlook and drive the USD demand.
This, in turn, will help determine the next leg of a directional move for the USD/JPY pair. In the meantime, traders on Thursday will take cues from the release of the usual Weekly Initial Jobless Claims data from the US, due later during the early North American session. This, along with the US bond yields and the broader market risk sentiment, will be looked upon for short-term trading opportunities around the USD/JPY pair.
Technical levels to watch
Here is what you need to know on Thursday, December 8:
Financial markets remain choppy in the second half of the week amid a lack of fundamental drivers and high-tier data releases. Participants stay on the sidelines ahead of next week's key central bank announcements and major currency pairs struggle to make a decisive move in either direction. Following Wednesday's pullback on falling US Treasury bond yields, the US Dollar Index stays calm near 105.00. The US economic docket will feature the weekly Initial Jobless Claims on Thursday and investors will keep a close eye on mews surrounding China's zero-Covid policy.
Shanghai city authorities announced earlier in the day that they will not be requiring Covid test checks for restaurants and entertainment venues from Friday. Meanwhile, Hong Kong said that they will ease isolation rules for infected travellers. Hong Kong's Hang Seng Index looks to close more than 3% higher but Shanghai Composite Index trades flat following these developments.
Meanwhile, the data from the US revealed on Wednesday that Unit Labor Costs rose by 2.4% in the third quarter. With this print missing the market expectation of 3.2% by a wide margin, the benchmark 10-year US Treasury bond yield turned south and dropped below 3.5%, weighing on the US Dollar.
Following the December policy meeting, the Bank of Canada decided to raise its policy rate by 50 basis points to 4.25% as expected. Regarding future policy action, the BoC noted in its policy statement that it will be considering whether the interest rate needs to rise further. "Inflation is still too high and short-term inflation expectations remain elevated," the BOC further noted. After having closed flat at 1.3650 on Wednesday, USD/CAD continues to fluctuate near that level early Thursday.
EUR/USD snapped a two-day losing streak and closed slightly above 1.0500 on Wednesday. The pair trades in a narrow channel in the European morning. European Central Bank (ECB) President Christine Lagarde is scheduled to deliver a speech at 1200 GMT.
GBP/USD managed to register modest daily gains on Thursday and went into a consolidation phase at around 1.2200 on Thursday.
Earlier in the day, the data from Japan revealed that the Gross Domestic Product shrank at an annual rate of 0.8% in the third quarter. This reading came in slightly better than the market expectation for a contraction of 1.1%. USD/JPY showed no immediate reaction to this data and was last seen fluctuating below 137.00.
Gold Price benefited from falling US T-bond yields and posted strong daily gains on Wednesday. XAU/USD was last seen consolidating its gains above $1,780.
Bitcoin continues to move up and down in a narrow channel at around $17,000 on Thursday. Following Wednesday's 3% decline, Ethereum stays quiet slightly above $1,200.
- GBP/USD lacks any firm direction and oscillates in a narrow trading range on Thursday.
- Subdued USD demand lends some support, though recession fears seem to cap the pair.
- Traders also seem reluctant ahead of the crucial FOMC/BoE policy meetings next week.
The GBP/USD pair struggles to capitalize on the overnight recovery from the 1.2100 neighbourhood, or the weekly low and oscillates in a range through the early European session on Thursday. The pair is currently trading around the 1.2200 round-figure mark, nearly unchanged for the day.
The latest optimism over the easing of COVID-19 curbs in China is seen undermining the safe-haven US Dollar, which, in turn, offers some support to the GBP/USD pair. That said, rebounding US Treasury bond yields, along with growing recession fears, should act as a tailwind for the greenback. Traders might also refrain from placing aggressive bets amid the uncertainty over the Fed's rate-hike path.
Market participants seem convinced that the US central bank will slow the pace of its policy tightening and have been pricing in a greater chance of a smaller 50 bps rate hike in December. That said, the incoming positive US macro data suggested that the economy remained resilient despite rising borrowing costs and fueled speculations that the Fed might lift rates more than recently projected.
Hence, the focus will remain glued to the FOMC monetary policy meeting on December 13-14, which will be followed by the Bank of England (BoE) meeting on Thursday. The UK central bank is expected to hike rates by 50 bps, though some analysts anticipate a larger 75 bps move. Nevertheless, the crucial central bank decisions should provide a fresh directional impetus to the GBP/USD pair.
In the meantime, a bleak outlook for the UK economy might hold back bulls from placing aggressive bets around the British pound amid absent relevant domestic macro data. The US economic docket, meanwhile, features the release of the usual Weekly Initial Jobless Claims. This, along with the US bond yields and the broader risk sentiment, will drive the USD and influence the GBP/USD pair.
Technical levels to watch
- USD/CAD pulls back from intraday high to pare daily gains.
- Weekly support line holds the key for bear’s entry.
- Buyers need validation from November’s peak to keep the reins.
USD/CAD registers another failure to cross the one-month-old resistance line as it drops to 1.3655 amid the initial hour of Thursday’s European trading session.
The Loonie pair’s latest declines also take clues from the impending bear cross on the MACD, as well as RSI (14) pullback from the overbought territory.
Although the intraday bears are having an upper hand by the press time, an upward-sloping support line from Monday, close to 1.3650, restricts the USD/CAD pair’s immediate downside.
Following that, a southward trajectory towards the 200-Simple Moving Average (SMA) level surrounding 1.3480 can’t be ruled out.
However, a three-week-old ascending trend line near 1.3420 appears crucial for the USD/CAD seller’s further dominance as a break of which won’t hesitate to poke the previous monthly low of 1.3226.
Alternatively, an upside clearance of the monthly resistance line near 1.3685 will need validation from the 1.3700 threshold and November’s peak of 1.3808 to convince the USD/CAD bulls.
In that case, the 1.3855-60 and the 1.3900 level could also probe the Loonie pair’s further upside before highlighting the 1.4000 psychological magnet.
USD/CAD: Four-hour chart
Trend: Limited downside expected
- Gold price picks up bids to pare the first daily loss in three.
- Risk-positive headlines from China, Hong Kong appear to favor the latest XAU/USD rebound.
- Gold bears remain hopeful as firmer US Dollar, Treasury bond yields keep recession fears on the table.
- Headlines surrounding Russia also probe bullion buyers ahead of next week’s key Fed meeting.
Gold price (XAU/USD) bounces off intraday low to $1,785 during the initial hour of Thursday’s Asian session as the market players lick their wounds after a negative start.
The latest easing in the risk-off mood, which initially helped the US Dollar to brace for weekly gains, could be linked to the headlines from China. Recently, Shanghai City Authorities mentioned that they will stop requiring Covid test checks for restaurants or entertainment venues from this Friday. On the same line, the South China Morning Post (SCMP) states that Hong Kong is ‘to ease isolation rules’ for infected travelers, with a release on the fifth day.
Even so, the looming fears of economic slowdown, as well as Russia’s usage of nuclear weapons in its war with Ukraine, seemed to weigh on the XAU/USD price. Furthermore, Bloomberg came out with the news suggesting more tension between the US and China due to the latest bills the US Congress is up for passing, which in turn challenges the Gold buyers. “The US is set to pass legislation revamping US policy toward Taiwan and restricting government use of Chinese semiconductors, moves that appear certain to antagonize Beijing even as President Joe Biden seeks to ease tensions,” said Bloomberg.
Amid these plays, the S&P 500 Futures reverse the initial losses while recovering from the three-week low to around 3,935 by the press time. Further, the US 10-year Treasury yields stay inactive near 3.45% while paring the previous day’s losses near the lowest levels since early September.
Looking forward, the Gold price may witness lackluster days ahead of the next week’s Federal Open Market Committee (FOMC) meeting. However, today’s weekly US Initial Jobless Claims, as well as Friday’s preliminary prints of the Michigan Consumer Sentiment Index and 5-year Consumer Inflation Expectations may entertain traders.
Gold price technical analysis
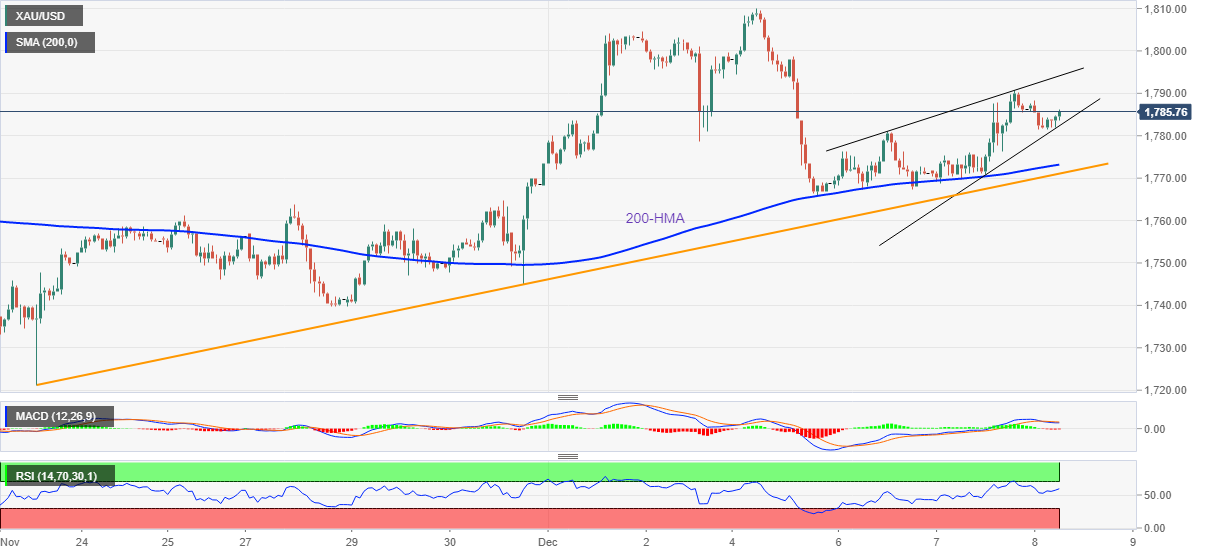
Gold price stays defensive above the 200-Hour Moving Average (HMA) level surrounding $1,773. In doing so, the yellow metal remains inside an immediate rising wedge bearish chart pattern, currently between $1,782 and $1,795.
It’s worth noting that a two-week-old ascending trend line holds the key to XAU/USD bear’s entry, around $1,771 at the latest.
That said, bearish MACD signals and recently firmer RSI keeps sellers hopeful as the metal portrays the rising wedge chart pattern on the hourly play. However, a clear upside break of the $1,782 hurdle won’t hesitate to refresh the monthly peak surrounding $1,810.
Gold price: Hourly chart
Trend: Limited recovery expected
- NZD/USD retreats towards 50-HMA, snaps two-day winning streak.
- Bearish MACD signals, weekly resistance line keep sellers hopeful
- Convergence of 200-HMA, ascending trend line from late November challenge further downside.
- Bulls need validation from 0.6470-75 to refresh yearly top.
NZD/USD remains mildly offered around 0.6350 heading into Thursday’s European session.
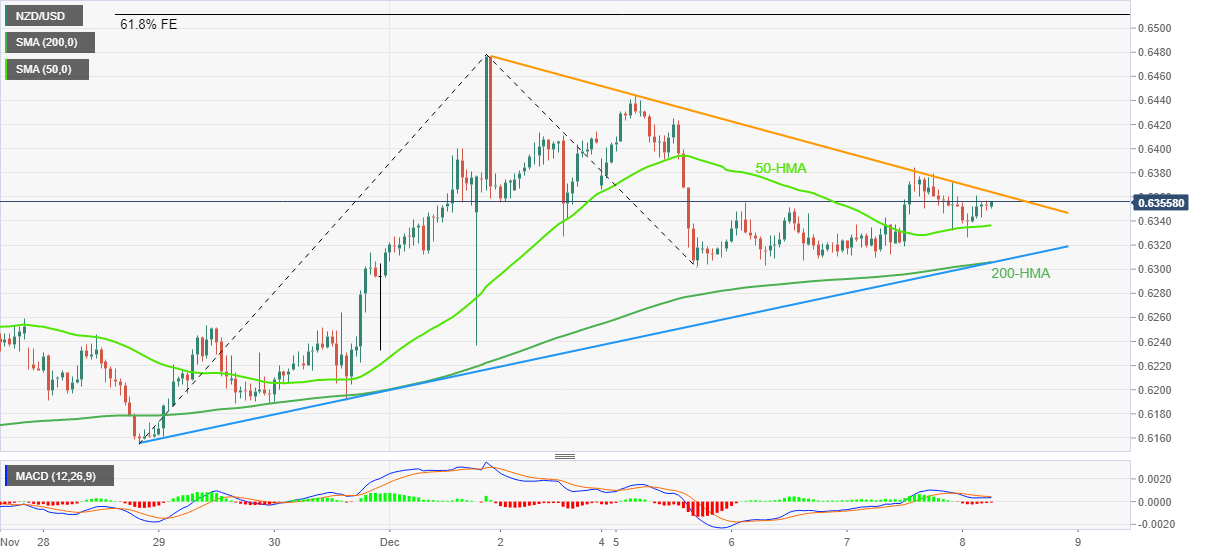
In doing so, the Kiwi pair struggles to extend the day-start bounce off the 50-Hour Moving Average (HMA) while defending the one-week-old bearish trend, as shown by the descending trend line. Also supporting the downside bias are the bearish MACD signals.
That said, a clear downside break of the 50-HMA, around 0.6335 by the press time, holds the key to the NZD/USD pair’s short-term downside.
Even so, the 200-HMA and an upward-sloping trend line from November 28, close to 0.6300, appears a tough nut to crack for the Kiwi pair sellers.
Following that, a slump towards the late November swing low near 0.6155 can’t be ruled out.
Meanwhile, recovery moves need not only cross the weekly resistance line, around 0.6365 at the latest, but should also cross the monthly high surrounding 0.6475 to lure the NZD/USD bulls.
It’s worth noting that the August month’s peak near 0.6470 adds strength to the 0.6470-75 resistance area.
During the quote's sustained trading beyond 0.6475, the 61.8% Fibonacci Expansion (FE) of the pair's moves from November 28 to December 05, close to 0.6510, will be on the NZD/USD buyer's radar.
Overall, NZD/USD is likely to remain weak for the short term and the sellers can regain control on a successful break of 0.6300.
NZD/USD: Hourly chart
Trend: Limited downside expected
- Silver price is juggling around $22.60 amid a quiet market mood.
- The US Dollar Index (DXY) is struggling to cross the critical hurdle of 105.40.
- The 200-EM is aiming higher which indicates that the upside trend is intact.
Silver price (XAG/USD) is displaying a sideways auction profile around the immediate hurdle of $22.60 in the early European session. The white metal has turned balance after correcting from the critical resistance of $22.80. The market mood is extremely quiet as investors are awaiting a potential trigger for fresh impetus.
Meanwhile, the US Dollar Index (DXY) is struggling to cross the critical hurdle of 105.40. S&P500 futures are displaying a subdued performance following Wednesday’s choppy movement.
On an hourly scale, Silver price recovered firmly after testing the horizontal support placed from November 15 high at $22.25. The precious metal is testing the 20-period Exponential Moving Average (EMA) around $22.60 after a sheer recovery. Meanwhile, the 200-EMA at $22.20 is aiming higher, which indicates that the long-term trend is bullish.
The Relative Strength Index (RSI) (14) is aiming to reclaim the bullish range of 60.00-80.00 for a decisive rally.
Should the Silver price break above Friday’s high at $22.82, bulls will drive the asset toward the round-level resistance at $23.00, followed by Monday’s high at $23.52.
On the flip side, Silver price will witness a steep fall if its surrenders the 200-EMA at $22.20. An occurrence of the same will drag the asset toward November 24 high at $21.67. A breakdown of $21.67 support will expose the asset for more downside toward November 28 low of around $21.00.
Silver hourly chart
-638060762462721399.png)
AUD/USD defends bears around 0.6715 heading into Thursday’s European session. In doing so, the Aussie pair braces for the weekly loss while parting ways from the previous fortnight’s optimism.
While the risk-aversion and fears of downbeat economics from Australia, as well as China, keeps the AUD/USD bears hopeful, the options market disagrees with the bearish bias.
That said, the one-month risk reversal (RR) for the AUD/USD pair, the ratio between call and put premiums, prints the biggest daily gains in three by flashing 0.120 numbers at the latest, per options data from Reuters. In doing so, the weekly RR also remains firmer and prints the winning streak for the third consecutive time, 0.160 by the press time.
It’s worth noting that the market’s latest moves could also be linked to the preparations ahead of the next week’s Federal Open Market Committee (FOMC) meeting.
Also read: AUD/USD remains depressed below 0.6750 after Australia Trade Balance, RBA Bulletin
- EUR/USD is oscillating around 1.0500 as investors await a speech from European Central Bank’s Lagarde.
- Uncertainty over the Federal Reserve policy outlook has muddled investors’ sentiment.
- The speech from Christine Lagarde will trim obscurity over interest rate policy.
- EUR/USD is expected to continue its sideways auction profile amid a quiet market mood.
EUR/USD is failing to sustain above the psychological support of 1.0500 in the Tokyo session. The major currency pair is struggling to hold its reins amid a cautious market mood. Rising fears of a recession in the United States economy are compelling investors to safeguard themselves behind the US Dollar.
Meanwhile, the shared currency bulls are getting anxious ahead of the speech from European Central Bank (ECB) President Christine Lagarde, which is scheduled for Thursday. At the time of writing, the US Dollar Index (DXY) extended its recovery to near the bewildering resistance at 105.40. S&P500 futures continue to remain sideways as the upside has been restricted by soaring recession fears.
The return on US Treasury bonds has recovered sharply as the Federal Reserve (Fed) is preparing to hike interest rates further next week. The 10-year US Treasury yields have climbed above 3.47% after diving near 3.40%.
Uncertainty over the Federal Reserve policy outlook muddles market mood
Market mood is displaying mixed responses as investors are confused whether to cheer strength in the United States economy supported by a tight labor market and firmer demand in the service sector or to turn cautious on expectations of a higher interest rate peak to contain fresh evidence of a reversal in inflation.
The upbeat demand for manpower is indicating that the inflationary pressures are here to stay as strong demand for labor meets with higher salaries. This will left more money in the palms of households, which will result in higher retail demand and therefore will trigger inflation ahead.
Therefore, Federal Reserve policymakers are pressuring for a higher interest rate peak rather than a continuation of the current rate hike pace to unbundle the inflation mess. Expectations for a higher neutral rate have triggered recession fears. Bank of America (BoA) CEO Brian Moynihan told investors at a Goldman Sachs financial conference that the United States economy will show "negative growth" in the first part of 2023, but the contraction will be "mild."
A prolonged decline is expected in the US Dollar
Expansion in recession fears in the United States economy has set a bullish ground for the US Dollar in the short-term. A report from ING states that as long as the Federal Reserve will remain hawkish, US Dollar will remain strong. Current recessionary fears have built a positive environment for the Dollar and a negative one for commodity and pro-cyclical currencies.
Also, economists at the National Bank of Canada believe that the greenback could recover some ground in the near term. On a longer horizon, they have a different opinion that a policy change from the Federal Open Market Committee (FOMC) in the first quarter of 2023 would set the stage for a more prolonged decline in the Greenback.
Speech from European Central Bank President will trim obscurity over interest rate policy
Going forward, investors will keep an eye on the speech from European Central Bank President Christine Lagarde for fresh impetus. The speech from Christine Lagarde will provide cues about the likely monetary policy action for December monetary policy meeting.
Eurozone headline inflation has displayed a plunge in its preliminary November report. However, a one-time slowdown in the inflationary pressures is not sufficient to call for policy change but requires deceleration in the inflation report continuously for a few months. A survey conducted by the European Central Bank dictates that 12-month inflation expectations have accelerated to 5.4% from the prior consensus of 5.1%. While, for a three-year period, forward inflation is unchanged at 3.0%. To offset the increment in one-year inflation expectations, a hawkish commentary is expected from ECB’s Lagarde.
EUR/USD technical outlook
-638060743480449360.png)
EUR/USD is holding itself above the upward-sloping trendline placed from November 3 low at 0.9730 on a four-hour scale. The 50-period Exponential Moving Average (EMA) at 1.0465 is acting as a major cushion for the major currency pair.
Meanwhile, the Relative Strength Index (RSI) (14) has shifted into the 40.00-60.00 range, which indicates a consolidation ahead.
- USD/CHF prints mild gains while defending the bounce off weekly support line.
- 200-HMA probes the run-up targeting 13-day-old resistance line.
- MACD, RSI suggests extension of recent moves towards the north.
USD/CHF picks up bids to 0.9420 during the first weekly positive, so far, in three heading into Thursday’s European session. In doing so, the Swiss Franc (CHF) pair also snaps the two-day downtrend as it grinds near the intraday high.
The quote’s latest upside could be linked to the repeated bounce off the one-week-old ascending trend line.
Also keeping the buyers hopeful are the bullish MACD signals and the firmer RSI (14) line, not overbought.
However, the 200-HMA level surrounding 0.9435 guards the USD/CHF pair’s immediate upside.
Also acting as the short-term key resistance line is a downward-sloping trend line from November 21, near 0.9500 by the press time.
In a case where the USD/CHF bulls manage to keep the reins past 0.9500, tops marked during November 30 and 21, close to 0.9550 and 0.9600 in that order, will be in focus.
On the contrary, pullback moves remain elusive beyond the aforementioned short-term support line, near 0.9370 as we write. That said, the 0.9400 round figure limits the USD/CHF pair’s immediate downside.
In a case where the quote stays weak past 0.9370, it becomes vulnerable to testing the lows marked during late March, around 0.9200.
USD/CHF: Hourly chart
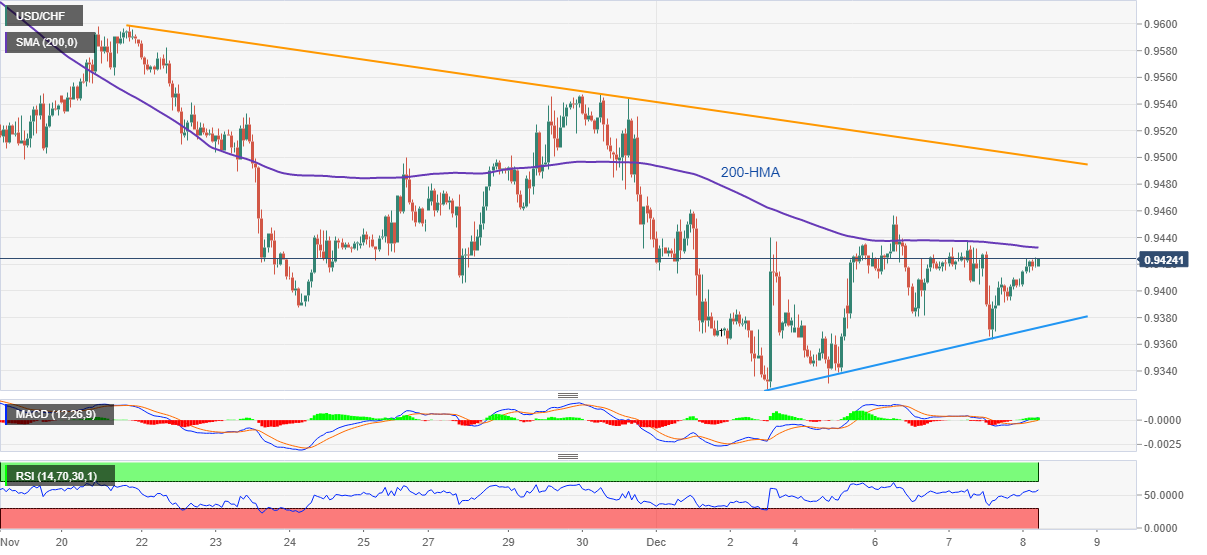
Trend: Limited upside expected
- WTI prints mild gains at the lowest levels in 2022, snaps four-day downtrend.
- Russian President Vladimir Putin’s comments, China’s easing of zero-Covid policy favor bulls.
- Fears of economic recession, price cap on oil exports from Moscow probe oil buyers.
- US inventory build, rebound in Treasury yields also challenge energy bulls amid mixed clues.
WTI crude oil picks up bids to print half a per cent intraday gains near the $73.80 level heading into Thursday’s European session. In doing so, the black gold consolidates the weekly loss around the lowest levels in 2022.
That said, the commodity’s rebound could be linked to the geopolitical fears surrounding Russia and hopes of more energy demand from China.
Russian President Vladimir Putin’s threat of using nuclear weapons contrasts with the latest comments from German Chancellor Olaf Scholz, suggesting easing the risks of Moscow using atomic weapons. Furthermore, China’s gradual easing of the Zero-Covid policy appears as a passive reopening and struggles to impress the bulls.
However, Bloomberg came out with the news suggesting more tension between the US and China due to the latest bills the US Congress is up for passing, which tests the oil buyers. “The US is set to pass legislation revamping US policy toward Taiwan and restricting government use of Chinese semiconductors, moves that appear certain to antagonize Beijing even as President Joe Biden seeks to ease tensions,” said Bloomberg.
On the same line could be the recent improvement in the weekly stockpile data from the US Energy Information Administration (EIA). That said, the official inventory improved while flashing a -5.187M figure for the week ended on December 02 versus -12.58M prior.
Above all, growing fears of an economic slowdown could be witnessed in the market’s rush towards risk-safety, as appeared from the US Treasury bond prices rally. The same drowns the oil prices, the Eurozone’s readiness to cap Russian oil exports and Moscow’s rejection to supply at that price. Furthermore, OPEC+ inaction and the US push for more oil supplies also weigh on the black gold.
Moving on, a light calendar can keep the commodity directionless, but the risk-off mood may weigh on the quote ahead of the following week’s critical Federal Open Market Committee (FOMC) meeting.
Technical analysis
An apparent U-turn from the 50-DMA, around $83.85 by the press time, directs WTI crude oil bears towards a downward-sloping support line from April 2022, close to $68.70 at the latest.
- GBP/USD takes offers to refresh intraday low inside one-month-old rising wedge.
- Sustained trading below weekly resistance line, bearish MACD signals keep sellers hopeful.
- 200-SMA, late November swing low act as additional downside filters.
GBP/USD renews its intraday low near 1.2180 as it braces for the first weekly loss in five during early Thursday. In doing so, the Cable pair defends the bears by trading below a one-week-old descending resistance line, as well as inside a one-month-old rising wedge bearish chart formation.
That said, the downbeat signals from the MACD indicator also add strength to the bearish bias.
However, a clear downside break of the stated wedge’s support line, near 1.2100 by the press time, becomes necessary for the GBP/UDS sellers to take control. Following that, the theoretical target of 1.1100 will be in focus.
Though, the 200-SMA and November 09 swing low, respectively near 1.1790 and 1.1335, could challenge the downside moves.
Alternatively, an upside clearance of the weekly resistance line, close to 1.2210 at the latest, is a pre-requisite for the GBP/USD buyer’s entry.
Even so, the monthly high near 1.2340 and the stated wedge’s upper line, close to 1.2425, could challenge the pair’s upside momentum.
Overall, GBP/USD bulls seem running out of steam and hence a pullback can’t be ruled out.
GBP/USD: Four-hour chart

Trend: Limited downside expected
- USD/CAD braces for the biggest weekly gains in 10 as it grinds near one-month high.
- Fears of recession, US-China tussles join chatters surrounding Russia to weigh on sentiment.
- Rebound in US Treasury yields favors US Dollar bulls despite pre-Fed inaction.
- Second-tier data/events could offer intermediate moves ahead of important Friday.
USD/CAD picks up bids to 1.3685 as it pares the Bank of Canada (BOC)-led losses during early Thursday. In doing so, the Loonie pair takes clues from the US Dollar’s rebound while paying little attention to the recently firmer oil prices, Canada’s main export item.
US Dollar Index (DXY) reverses the previous day’s pullback from a one-week high around 105.35 while bracing for the first weekly gain in three. The greenback’s latest gains could be linked to the corrective bounce in the US Treasury bond yields, as well as the market’s consolidation ahead of the next week’s Federal Open Market Committee (FOMC) meeting.
It’s worth noting that the US 10-year Treasury bond yields dropped to the lowest levels since early September by losing 3.30% on Wednesday. On the same line, the two-year counterpart dropped 2.54% amid the rush for risk safety. As a result, the US Treasury bond yield curve, the difference between the long-dated and the short-term bond yields, inverted the most in over forty years and highlighted the recession woes. That said, the US 10-year Treasury yields add five basis points (bps) to 3.45% while the two-year coupons are at 4.295% at the latest.
Other than the rebound in yields, challenges to market sentiment also favor USD/CAD bulls. Russian President Vladimir Putin’s threat of using nuclear weapons contrasts with the latest comments from German Chancellor Olaf Scholz suggesting easing the risks of Moscow using nuclear weapons. Furthermore, China’s gradual easing of the Zero-Covid policy appears as a passive reopening and struggles to impress the bulls. Further, Bloomberg came out with the news suggesting more tension between the US and China due to the latest bills the US Congress is up for passing. “The US is set to pass legislation revamping US policy toward Taiwan and restricting government use of Chinese semiconductors, moves that appear certain to antagonize Beijing even as President Joe Biden seeks to ease tensions,” said Bloomberg.
Elsewhere, WTI crude oil bounces off the yearly low, up half a percent near $73.00, as demand fears ebb due to China’s easing Zero-Covid policy. However, economic slowdown woes and the firmer US Dollar challenge the black gold prices.
On Wednesday, the Bank of Canada (BOC) announced a 0.50% rate hike and weighed on the USD/CAD prices. However, the tone of the Rate Statement appeared dovish and challenged the Canadian Dollar (CAD) buyers.
Looking forward, USD/CAD bulls can keep the reins ahead of today’s weekly US Initial Jobless Claims, as well as Friday’s preliminary prints of the Michigan Consumer Sentiment Index and 5-year Consumer Inflation Expectations. However, major attention will be given to the next week’s Fed meeting as policy doves are flexing muscles of late.
Technical analysis
Wednesday’s Doji candlestick joins descending trend line from late October, around 1.3685 by the press time, to challenge USD/CAD buyers targeting October’s peak near 1.3810.
- Gold price is seeking a cushion near $1,780.00 as US Dollar dwindled on the Fed policy outlook.
- The cautious market mood amid uncertainty over Fed’s policy outlook is impacting risky assets.
- A policy change from the FOMC in CY2023 would set the stage for a prolonged decline in the Greenback.
Gold price (XAU/USD) is looking to build a cushion around the immediate support of $1,782.00 in the Asian session. The precious metal was corrected after failing to surpass the critical hurdle of $1,790.00. Gold price is displaying mixed responses as uncertainty over the policy outlook by the Federal Reserve (Fed) has turned the market mood cautious.
The US Dollar index (DXY) is hovering around 105.30 in the Tokyo session. The street is having mixed views on Fed’s policy outlook. Upbeat Nonfarm Payrolls (NFP) and robust demand in the service sector have shown strength in the United States economy while expectations for higher interest rate guidance are triggering recession fears.
Meanwhile, S&P500 futures have carry-forwarded their subdued performance, portraying a precautionary mood until any potential trigger could provide decisive guidance. The Gold price could deliver a rally in the first quarter of CY2023 as economists at the National Bank of Canada are of the view that a policy change from the FOMC would set the stage for a more prolonged decline in the Greenback.
Gold technical analysis
Gold price is seeking a cushion around the horizontal support placed from December 2 low at $1,778.5 on an hourly scale. The 20-period Exponential Moving Average (EMA) is acting as a major cushion for the asset.
Meanwhile, the Relative Strength Index (RSI) (14) has slipped into the 40.00-60.00 range. It would be early calling it a reversal, however, the Gold price has surrendered upside momentum.
Gold hourly chart
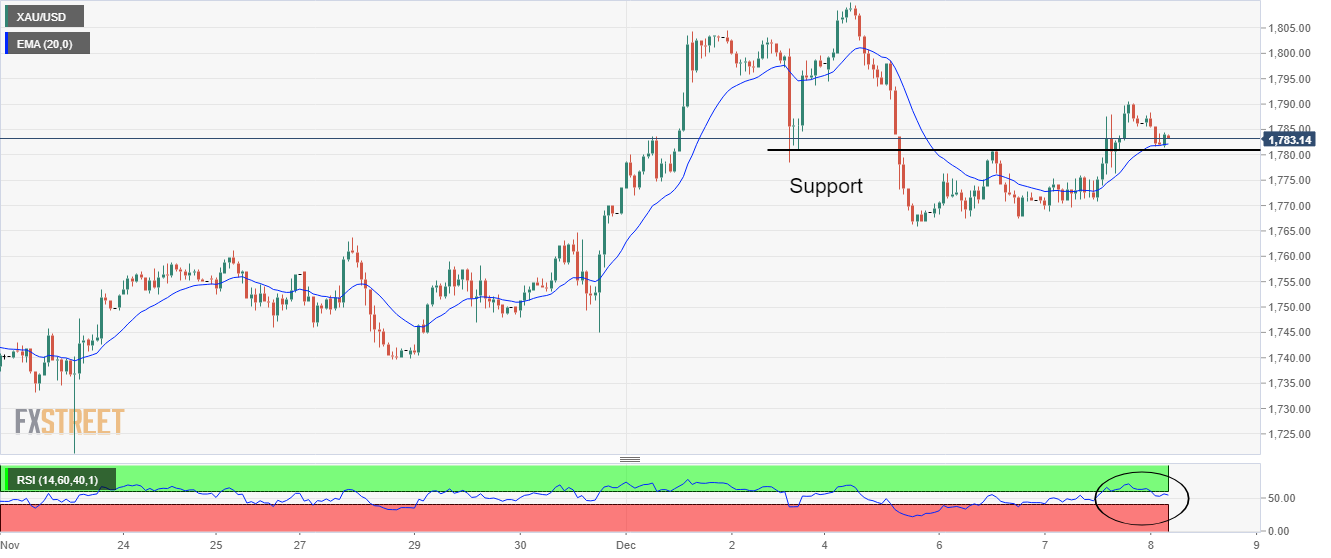
- USD/INR picks up bids to reverse the previous day’s pullback from monthly high.
- Seven-week-old descending trend line, bearish MACD signals tease sellers.
- Sustained trading beyond 200-SMA keeps buyers hopeful of witnessing fresh record top.
USD/INR remains firmer around a one-month high as it jostles with a short-term key resistance line near 82.65 during early Thursday.
The Indian Rupee (INR) pair rose to the highest levels in a month the previous day before reversing from 82.77. In doing so, the USD/INR pair retreated from a downward-sloping resistance line from October 19 following the Reserve Bank of India’s (RBI) interest rate hike.
It’s worth noting that the failure to cross the aforementioned resistance line joins the recently bearish MACD signals to tease USD/INR sellers.
However, successful trading beyond the 200-SMA level, around 81.80 by the press time, keeps the pair buyers hopeful.
As a result, the quote is likely to remain firmer but the further upside needs validation from the previously mentioned resistance line near 82.65.
Following that, a run-up towards the all-time high marked in October around 83.45 can’t be ruled out.
Meanwhile, a downside break of the 200-SMA could welcome the USD/INR bears. That said, the late November swing high around the 82.00 round figure also restricts short-term declines of the pair.
In a case where USD/INR remains bearish past 82.00, the odds of witnessing a slump towards the monthly low are around 81.00 and then towards the late November swing low of 80.37.
USD/INR: Four-hour chart

Trend: Further upside expected
- Indices display bearish moves as US recession fears have spooked investors’ sentiment.
- A decline in China’s inflation could compel the PBOC to ease policy ahead.
- The oil price has displayed a pullback move after registering a fresh annual low at $72.00
Markets in the Asian domain have carry-forwarded weakness on Thursday as United States recession fears have soared. As the US sneezed, Asian indices have caught the cough. S&P500 remained choppy on Wednesday after two consecutive bearish sessions. The risk aversion theme is still solid as the Federal Reserve (Fed) is set to hike interest rates further next week. Also, higher interest rate guidance is expected from Fed chair Jerome Powell in December monetary policy meeting.
At the press time, Japan’s Nikkei225 dropped 0.69%, ChinaA50 slipped 0.30%, however, Hang Seng jumped 2.71%.
Chinese equities are facing pressure as investors are shifting their focus toward the Consumer Price Index (CPI) data, which will release on Friday. As per the projections, a decline is expected in the annual CPI figure to 1%. An occurrence of the same will force the People’s Bank of China (PBOC) to look for policy easing to spur growth in the economy.
Meanwhile, Japanese indices are facing immense pressure despite better-than-anticipated Gross Domestic Product (GDP) data. The annualized data has contracted by 0.8% vs. expected contraction by 1.1% and the prior release of -1.2%. While the quarterly data has contracted by 0.2% against the consensus and the prior release of 0.3% contraction.
Figures are upbeat than expectations but the growth rate is still contracting, which calls for more economic stimulus from the Bank of Japan (BOJ). This has triggered fears of a decline in inflation ahead.
On the oil front, West Texas Intermediate (WTI) has shown a pullback move from a fresh annual low at $72.00. The oil prices have been impacted by US recession fears. Bank of America (BoA) CEO Brian Moynihan told investors at a Goldman Sachs financial conference that the United States economy will show "negative growth" in the first part of 2023, but the contraction will be "mild."
- The 200-EMA around 0.6730 is acting as a major barricade for the Australian Dollar.
- A failure in sustaining above the upward-sloping trendline from 0.6585 has strengthened the US Dollar.
- A recovery in risk-off mood is weighing pressure on the Aussie asset.
The AUD/USD pair is aiming to hold its rebound move above the round-level support of 0.6700 in the Asian session. The Aussie strength is sensing supply as the US Dollar Index (DXY) has extended its recovery to near 105.32.
Meanwhile, S&P500 futures are facing selling pressure again, portraying a rebound in the risk aversion theme. The 10-year US Treasury yields have resurfaced to near 3.45% as the risk-off is regaining traction.
On an hourly scale, the Aussie asset is failing to sustain above the upward-sloping trendline placed from November 21 low at 0.6585. Also, the 200-period Exponential Moving Average (EMA) at 0.6732 has acted as major resistance for the Australian Dollar.
The Relative Strength Index (RSI) (14) has failed to enter the bullish range of 60.00-80.00, which indicates that investors are capitalizing on less-confident rallies for parking smart money into the downside trend.
For further downside, a decisive move below Wednesday’s low at 0.6668 will drag the Aussie asset towards November 29 low at 0.6640 and November 21 low at 0.6585.
Alternatively, a break above Tuesday's high at 0.6744 will drive the major towards the round-level resistance at 0.6800, followed by Monday’s high around 0.6850.
AUD/USD hourly chart
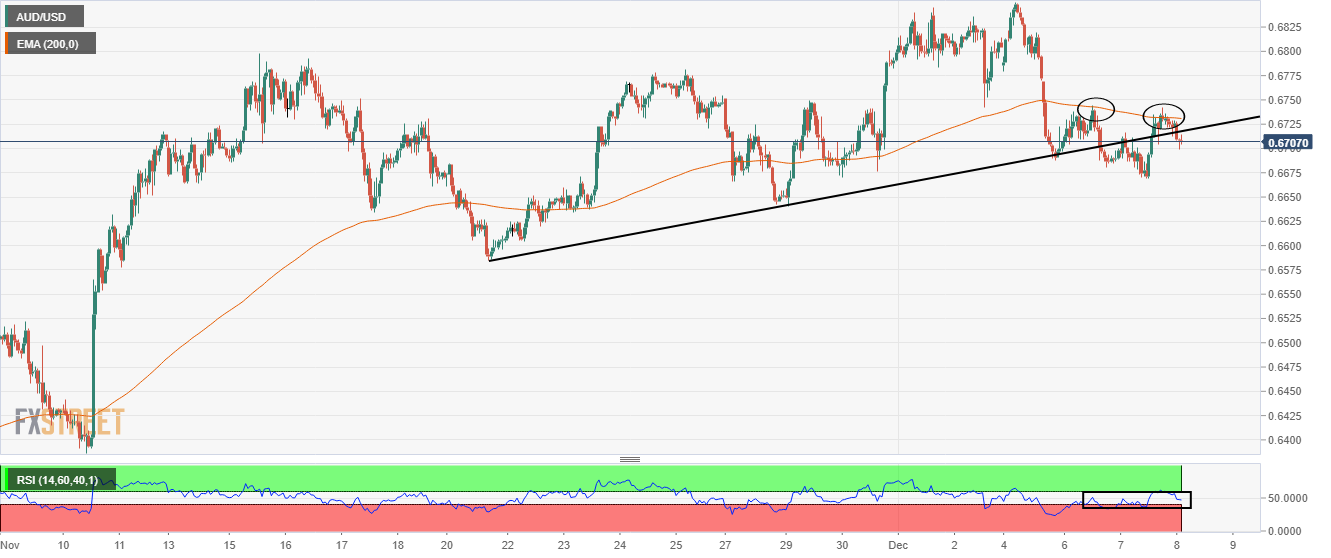
- NZD/USD fades bounce off intraday low, braces for the first weekly loss in eight.
- Downbeat milk price forecast by Fonterra, mild risk aversion adds strength to the Kiwi pair’s losses.
- Hawkish RBNZ keeps buyers hopeful despite short-term pullback.
NZD/USD retreats to 0.6342 while printing the first daily loss in three during early Thursday. In doing so, the Kiwi pair is on the way to defying the seven-week uptrend while bracing for the weekly loss.
The quote’s latest weakness could be linked to the downward revision of dairy price forecasts by the world’s biggest dairy exporter Fonterra. “New Zealand's Fonterra Co-operative Group Ltd. on Thursday lowered its farmgate milk price forecast range for the second time for the 2022/23 season on higher costs and softening demand for whole milk powder,” said Reuters. The news also mentioned that Fonterra now expects to pay farmers between NZ$8.50 and NZ$9.50 per kilogram of milk solid (kgMS), compared with NZ$8.50 to NZ$10.00 per kgMS it forecast in August.
Elsewhere, the US Dollar cheers the cautious sentiment, as well as a rebound in the US Treasury bond yields amid a sluggish session and mixed signals from China and Russia.
That said, the benchmark 10-year Treasury bond yields dropped to the lowest levels since early September by losing 3.30% on Wednesday. On the same line, the two-year counterpart dropped 2.54% amid the rush for risk safety. With this, the US Treasury bond yield curve, the difference between the long-dated and the short-term bond yields, inverted the most in over forty years and highlighted the recession woes.
On the other hand, Russian President Vladimir Putin’s threat of using nuclear weapons contrasts with the latest comments from German Chancellor Olaf Scholz suggesting easing the risks of Moscow using nuclear weapons. Furthermore, China’s gradual easing of the Zero-Covid policy appears as a passive reopening and struggles to impress the bulls. Further, Bloomberg came out with the news suggesting more tension between the US and China due to the latest bills the US Congress is up for passing. “The US is set to pass legislation revamping US policy toward Taiwan and restricting government use of Chinese semiconductors, moves that appear certain to antagonize Beijing even as President Joe Biden seeks to ease tensions,” said Bloomberg.
Amid these plays, S&P 500 Futures portray a six-day downtrend near 3,930, down 0.25% intraday at the latest.
Given the mixed concerns and the US Dollar’s rebound, as well as an absence of Fed talks ahead of next week’s Federal Open Market Committee (FOMC), NZD/USD may witness further inaction. Even so, the hawkish view of the Reserve Bank of New Zealand (RBNZ) versus the Fed’s recently dovish remarks keep the pair buyers hopeful.
Technical analysis
Although double tops surrounding 0.6470-80 challenge the NZD/USD buyers, the pair sellers remain off the table unless witnessing a clear downside break of the five-week-long support line, at 0.6315 by the press time.
- USD/JPY fades bounce off one-week-old ascending support line.
- Looming bull cross on MACD teases buyers but 13-day-old downward-sloping trend line appears the key hurdle.
- Weekly horizontal region acts as an extra filter towards the south.
USD/JPY grinds near the intraday high surrounding 137.00, retreating of late, as buyers jostle with the 200-HMA during early Thursday.
In doing so, the Yen pair struggles to extend the early-day rebound from a weekly support line, around 136.30 by the press time.
However, the impending bull cross on the MACD indicator suggests the USD/JPY pair’s upside past the immediate hurdle comprising the 200-HMA near 137.00.
Even so, the pair buyers remain confused unless the quote trades below a descending resistance line from November 21, close to 137.55 at the latest.
The weekly high of 137.85 also acts as an additional upside filter, a break of which could quickly propel the USD/JPY prices towards the November-end swing high near 139.90.
On the flip side, USD/JPY sellers may remain confused unless providing a clear break of an immediate support line, close to 136.30, as well as a one-week-old horizontal support region near 135.95-85.
Following that, a south-run towards the monthly low near 133.60 can’t be ruled out.
Overall, USD/JPY is likely to witness a corrective bounce but the upside room appears to be limited.
USD/JPY: Hourly chart
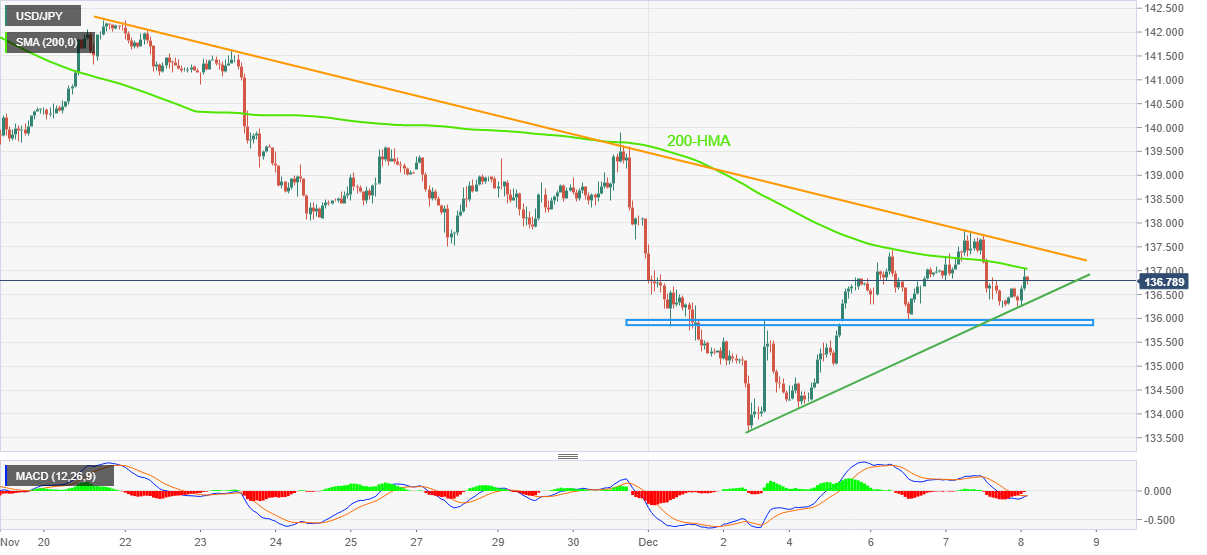
Trend: Limited upside expected
| Raw materials | Closed | Change, % |
|---|---|---|
| Silver | 22.728 | 2.5 |
| Gold | 1786.36 | 0.88 |
| Palladium | 1845.3 | -0.39 |
- GBP/USD takes offers to reverse the previous day’s corrective bounce.
- Slump in UK’s house prices, easing momentum in labor market keeps bears hopeful.
- US Dollar remains sluggish pre-Fed blackout of policymakers, downbeat Treasury yields.
- Second-tier data, risk catalysts are the key to fresh impulse.
GBP/USD renews its intraday low around 1.2180 as it braces for the first weekly loss in five during early Thursday. The Cable pair’s latest downside could be linked to the corrective bounce in the US Dollar. However, fears surrounding the British economy appear to be a major challenge for the pair traders.
Reuters came out with the news conveying a slump in the UK’s house prices to portray pessimism for the GBP/USD. “Britain saw the most widespread house price falls since early in the COVID-19 pandemic last month, as demand from buyers and sales activity slowed in the face of higher borrowing costs, a survey showed on Thursday,” said the news.
On the same line, the monthly index of demand for staff from the Recruitment and Employment Confederation (REC) also weighed on the GBP as it fell in November to 54.1 from 56.7 in October by testing the lowest levels since February 2021.
Additionally, looming labor strikes in England and Wales push the UK government to witness more hardships even if Prime Minister Rishi Sunak pledged to take more action "to protect the lives and livelihoods" of Britons during months of planned strikes by rail, health and postal workers, per Reuters.
It should be noted that the slump in the US Treasury yields and a light calendar drowned the US Dollar the previous day. That said, the benchmark 10-year Treasury bond yields dropped to the lowest levels since early September by losing 3.30% on Wednesday. On the same line, the two-year counterpart dropped 2.54% amid the rush for risk safety. With this, the US Treasury bond yield curve, the difference between the long-dated and the short-term bond yields, inverted the most in over forty years and highlighted the recession woes.
However, the recently sour sentiment in the market, as portrayed by the six-day downtrend of the S&P 500 Futures, seems to underpin the US Dollar’s safe-haven demand. Mixed headlines surrounding China and Russia could be linked to the latest risk-off mood.
Russian President Vladimir Putin’s threat of using nuclear weapons contrasts the latest comments from German Chancellor Olaf Scholz suggesting easing the risks of Moscow using nuclear weapons. Furthermore, China’s gradual easing of the Zero-Covid policy appears as a passive reopening and struggles to impress the bulls.
Moving on, a light calendar in the UK and the US, except for the US Initial Jobless Claims for the week ended on December 02, emphasizes risk catalysts as the key to fresh impulse.
Technical analysis
A one-month-old rising wedge bearish chart pattern, currently between 1.2130 and 1.2420, keeps GBP/USD sellers hopeful.
- The Federal Reserve interest rate decision is looming and will be key for the Gold price.
- Gold price is correcting in a daily harmonic formation although it has started to decelerate.
- On the 4-hour chart, the Gold price is hugging the dynamic support but is showing signs of an imminent test of the same.
Gold price has found a base at a technical level of support as traders look ahead to next week's Federal Reserve interest rate decision. In this regard, the US Dollar weakened against major currencies midweek amid worries that rising interest rates could push the United States economy into recession.
Gold price weighed by US Dollar bull correction
Traders are buying up the safe havens amid growing recessionary fears which has helped to boost sentiment in the Gold market. The ''thirty-year United States Treasuries dropped more than 10bp to a three-month low while yields on the 10-year United States Treasuries were also lower. The US Dollar, as measured by the DXY index, which measures the greenback against a basket of currencies, fell to a low of 104.87 on Wednesday where it has since stabilised, moving into the 105's on Thursday, weighing on Gold price.
Overall, Gold price investors are searching for direction as we await November Producer Price Index (PPI) data Friday as the next critical data that followed Monday’s upside surprise to ISM Services PMI. The US Dollar has been unable to build on any strength in the anticipation of the data and the absence of Federal Reserve speakers has left the Gold market void of a robust catalyst. Even news of further China reopening measures has failed to impact the Gold price, US Dollar or equities in any significant way.
Federal Reserve expectations have solidified
World Interest Rate Probabilities, (WIRP), are suggests that a Federal Reserve 50 bp interest rate hike at the Federal Open Market Committee (FOMC) meeting on December 14 is fully priced in. There are less than a 10% odds of a larger 75 bp move which has been a weight on the US Dollar while swaps markets are pricing in a peak policy rate of 5.0%.
Analysts at Brown Brothers note that the WIRP suggests around 60% odds of a 50 bp move on February 1 and then around 50% odds of a final 25 bp Federal Reserve interest rate hike in the second quarter, (Q2). With both Average Hourly Earnings and core Personal Consumption Expenditures flat-lining near 5% for most of this year, the analysts said they ''don’t think this tightening path will get inflation back to target, not when the labour market remains so firm and consumption is holding up. This is where we believe the mispricing lies. If and when markets reprice, that should be dollar-positive.''
Meanwhile, analysts at TD Securities argue that the pain trade in Gold price may finally be abating, ''but a notable consolidation in prices is still needed before CTA trend followers spark renewed outflows in Gold. We look for a break below the $1,745/oz range for the first of several selling programs likely to weigh on gold prices in this scenario.''
Gold technical analysis

The daily charts above show the Gold price correcting in the harmonic formation although it has started to decelerate around the key $1,800s.
On the 4-hour chart below, the Gold price is hugging the dynamic support but is showing signs of an imminent test of the same. A break of the trendline will expose the downside in the Gold price with $1,739.79 eyed as the prior lows from where the last bullish surge originated.

- EUR/USD reverses the previous day’s rebound during the first weekly loss in three.
- Downbeat oscillators direct intraday sellers towards one-week-old ascending trend line.
- Rising wedge keeps bears hopeful, 100-SMA adds to the downside filter.
EUR/USD takes offers to reverse the previous day’s recovery around 1.0500, snapping a two-week uptrend during early Thursday.
The major currency pair’s latest losses could be linked to the failure to cross the downward-sloping resistance line from Monday. Also favoring the bearish bias are the downbeat MACD signals and mostly steady RSI (14).
Above all, a one-month-old rising wedge bearish formation at the highest levels in six months keeps the AUD/USD sellers hopeful.
That said, the EUR/USD pair’s latest declines aim for the one-week-old support line, near 1.0470.
However, the aforementioned rising wedge’s support line and the 100-SMA, respectively around 1.0425 and 1.0400, could challenge the quote’s additional south run.
It’s worth noting that the 200-SMA near 1.0210 and the November 10 swing low around 0.9935 act as the last defenses of the EUR/USD buyers, a break of which won’t hesitate to direct bears towards the theoretical target of rising wedge confirmation, near 0.9740.
Meanwhile, recovery moves will initially aim for the aforementioned resistance line stretched from Monday, near 1.0540.
Following that, the latest multi-day high near 1.0600 and the stated wedge’s upper line, close to 1.0615 by the press time, may challenge the EUR/USD bulls.
EUR/USD: Four-hour chart
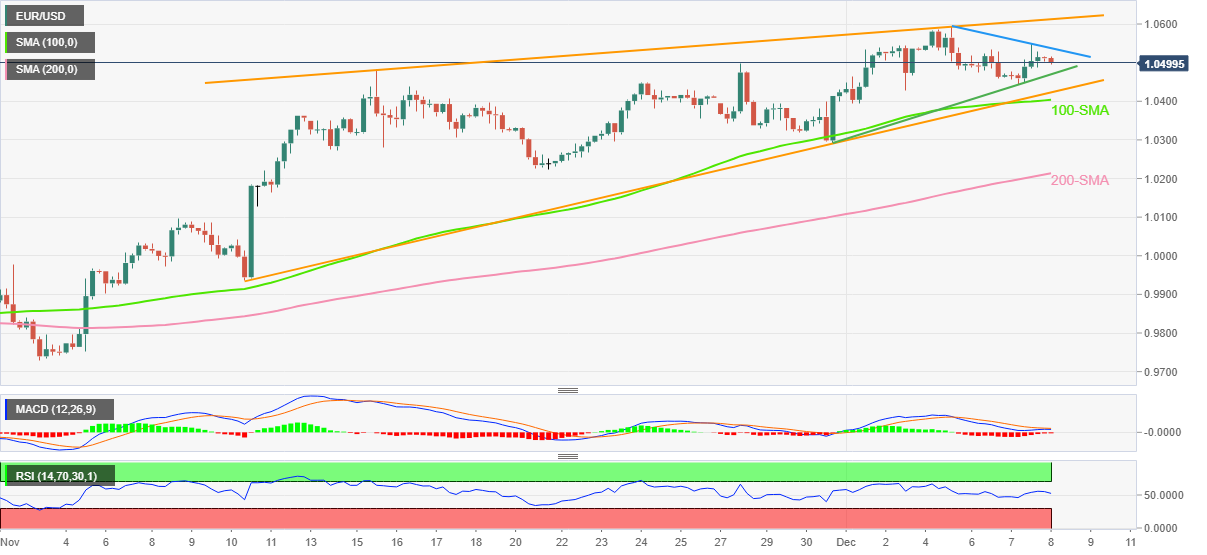
Trend: Further downside expected
- EUR/GBP has extended its recovery to near 0.8615 ahead of ECB Lagarde's speech.
- Eurozone 12-month inflation expectations have climbed to 5.4% vs. the former release of 5.1%.
- The rising food supply crisis is fueling already strengthened food inflation in the UK economy.
The EUR/GBP pair has stretched its recovery to near 0.8615 in the Asian session. The cross rebounded firmly after testing Wednesday’s low around 0.8600 as investors are shifting their focus towards the speech from European Central Bank (ECB) President Christine Lagarde.
The speech from ECB President will provide fresh impetus about the likely monetary policy actions in December monetary policy meeting. Although ECB policymakers believe that the central bank has done a lot in pushing interest rates and a neutral rate is not so far now but a rate hike in December is higher expected as inflationary pressures are still solid in Eurozone.
A survey from the ECB on consumer inflation expectations for the next 12 months conducted revealed that median expectations for inflation have increased to 5.4% from former projections of 5.1%. While three-year inflation expectations are unchanged at 3.0%. Therefore, investors should brace for a hawkish commentary on interest rate guidance by ECB President.
This week, monthly Retail Sales data contracted by 1.8% while expectations were aiming for a 1.7% contraction this week. And, annual Retail Sales contracted by 2.7% against the consensus of a 2.6% contraction. Ceteris Paribus, a decline in consumer spending is hinting that inflation may display a slowdown ahead.
On the United Kingdom front, inflation expectations have soared as escalating food supply crisis is fueling already firm food inflation. Rising input costs and shortage of labor are resulting in a shortage of food supply, which is expected to paddle up food inflation from the current pace of 12.4%. This could extend the extent of recession in the UK economy and could impact Pound Sterling.
- Market sentiment remains dicey amid pre-Fed blackout, absence of major data/events.
- Mixed updates surrounding China, Russia adds filters to the trading moves.
- US Treasury bond yields marked widest inversion in forty years amid recession fears.
- Second-tier data, risk catalysts may entertain intraday traders.
Global traders remain cross-minded during early Thursday as a pause in the US Treasury bond rally joined mixed headlines surrounding China and Russia. Also likely to have probed the market moves could be the unimpressive prints of data from Australia and Japan.
While portraying the mood, the S&P 500 Futures drops 0.40% intraday to 3,921, poking a three-week low during a six-day downtrend. Further, the US 10-year Treasury yields print the first daily gains in three at the lowest levels since mid-September, up four basis points (bps) near 3.45% by the press time.
It’s worth noting that the benchmark 10-year Treasury bond yields dropped to the lowest levels since early September by losing 3.30% on Wednesday. On the same line, the two-year counterpart dropped 2.54% amid the rush for risk safety. With this, the US Treasury bond yield curve, the difference between the long-dated and the short-term bond yields, inverted the most in over forty years and highlighted the recession woes.
Elsewhere, Russian President Vladimir Putin’s threat of using nuclear weapons contrasts the latest comments from German Chancellor Olaf Scholz suggesting easing the risks of Moscow using nuclear weapons. Furthermore, China’s gradual easing of the Zero-Covid policy appears as a passive reopening and struggles to impress the bulls.
Talking about the data, Japan’s final readings of the third quarter (Q3) Gross Domestic Product (GDP) came in better than initial forecasts as the QoQ figures improved to -0.2% versus -0.3% while the GDP Annualized came in -0.8% versus -1.1% expected and -1.2% prior.
On the other hand, Australian Trade Balance for October improved to 12,217M versus 1,155M expected and 12,444 prior. Further details suggest that the Imports and Exports both dropped 1.0% versus expectations of rising by 2.0% and 1.0% in that order. Additionally, the quarterly Bulletin from the Reserve Bank of Australia (RBA) failed to provide any clear directions as it highlights the importance of education while praising the economic transition due to the easing of Covid-linked restrictions.
It should be noted that the policy-driven blackout of the Fed officials ahead of next week’s Federal Open Market Committee (FOMC) restricts the market’s overall momentum even if the bears are in control. The same, however, fails to please the US Dollar buyers and rather helps the traditional safe-haven assets like the Yen and Gold. That said, crude oil prices also witness downside pressure despite challenges to the supplies.
Looking forward, US Initial Jobless Claims, expected to rise by 230K versus 225K prior during the week ended on December 02, may entertain the traders amid a light calendar.
Also read: Forex Today: US Dollar weakness set to continue
In recent trade today, the People’s Bank of China (PBOC) set the yuan (CNY) at 6.9606 vs. the last close of 6.9693.
About the fix
China maintains strict control of the yuan’s rate on the mainland.
The onshore yuan (CNY) differs from the offshore one (CNH) in trading restrictions, this last one is not as tightly controlled.
Each morning, the People’s Bank of China (PBOC) sets a so-called daily midpoint fix, based on the yuan’s previous day's closing level and quotations taken from the inter-bank dealer.
- AUD/JPY snaps three-day uptrend, remains pressured around intraday low.
- Australia Trade Balance improved but Exports, Imports dropped in October.
- Failures to cross 100-EMA keep sellers hopeful, bulls need validation from 92.00.
AUD/JPY holds lower ground near the intraday low of 91.63 during early Thursday. In doing so, the cross-currency pair justifies the mixed plays of Japanese and Australian data.
That said, Japan’s final readings of the third quarter (Q3) Gross Domestic Product (GDP) came in better than initial forecasts as the QoQ figures improved to -0.2% versus -0.3% while the GDP Annualized came in -0.8% versus -1.1% expected and -1.2% prior.
On the other hand, Australian Trade Balance for October improved to 12,217M versus 1,155M expected and 12,444 prior. Further details suggest that the Imports and Exports both dropped 1.0% versus expectations of rising by 2.0% and 1.0% in that order.
Additionally, the quarterly Bulletin from the Reserve Bank of Australia (RBA) failed to provide any clear directions to the AUD/USD pair traders as it highlights the importance of education while praising the economic transition due to the easing of Covid-linked restrictions.
With this, the AUD/JPY bears are well-set to break the weekly support line surrounding 91.60, which in turn could recall the monthly low of 91.13 to the chart. Following that, the 91.00 and the 90.00 thresholds could lure the sellers.
On the flip side, a convergence of the 100-hour Exponential Moving Average (EMA) and a descending trend line from Tuesday, near 92.00, restricts the short-term upside of the AUD/JPY pair.
In a case where the AUD/JPY buyers manage to cross the 92.00 hurdle, the weekly high near 92.30 and the late November swing top around 93.85 will be in focus.
AUD/JPY: Hourly chart
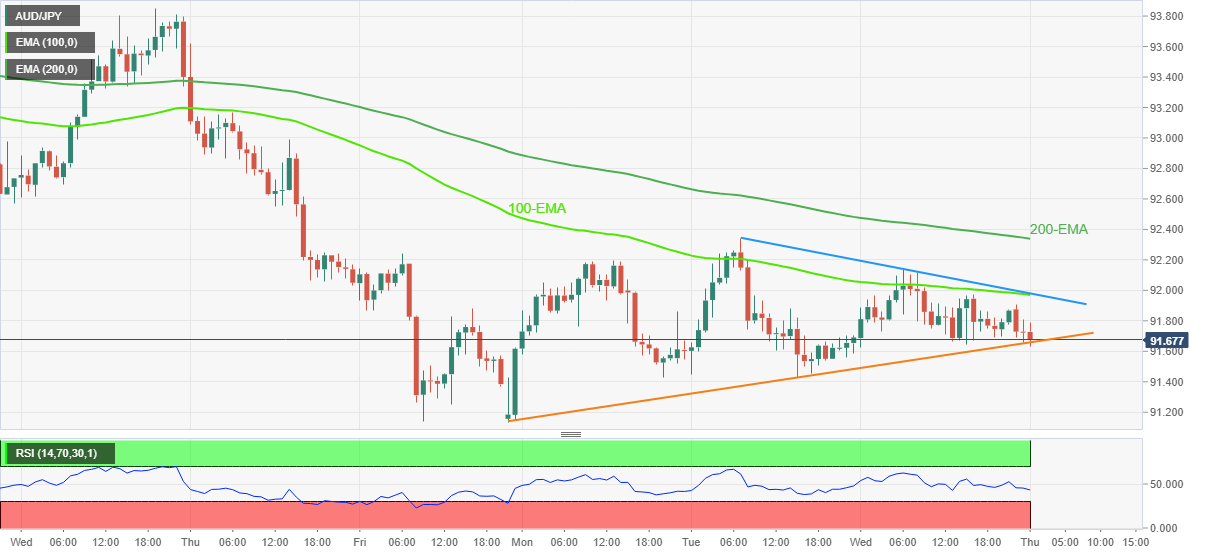
Trend: Further downside expected
- USD/CHF is hovering around 0.9400 as investors await fresh impetus for further guidance.
- The risk-on impulse is expected to restrict the US Dollar from gaining strength.
- The US economy may show a mild contraction in the first half of CY2023.
The USD/CHF pair is displaying back-and-forth moves near the round-level hurdle of 0.9400 in the Tokyo session as investors are awaiting the release of the five-year consumer inflation expectations in the United States for further guidance. The Swiss franc asset is attempting to cross the immediate hurdle of 0.9410, however, the risk-on impulse is restricting the US Dollar from gaining strength.
The US Dollar Index (DXY) is facing barricades around the critical resistance of 105.20 amid the risk appetite theme. Meanwhile, the 10-year US Treasury yields have attempted a rebound after dropping to near 3.40% on Wednesday. The return on long-term US Treasury bonds has resurfaced to near 3.45%.
Escalating uncertainty over Federal Reserve (Fed)’s policy outlook has triggered anxiety among market participants. With upbeat United States economic data, investors are anticipating more interest rate hikes by the Fed to offset fresh inflation triggers. Also, it will force a recession as firms will trim or tick to the current extent of economic activities due to higher interest obligations.
Bank of America (BoA) CEO Brian Moynihan told investors at a Goldman Sachs financial conference that the United States economy will show "negative growth" in the first part of 2023, but the contraction will be "mild."
Going forward, investors will keep an eye on US five-year Consumer Inflation Expectations, which will release on Friday.
On the Swiss franc front, investors are shifting their focus toward the interest rate decision by the Swiss National Bank (SNB), which is scheduled for next week. SNB Chairman Thomas J. Jordan is expected to continue with policy easing as the inflationary pressures are marginally above the desired rate. This week, the Swiss Unemployment Rate dropped to 2.1% lower than expectations and the prior release of 2.0%.
- AUD/USD holds lower ground near intraday low, fades the previous day’s bounce off weekly low.
- Australia Trade Balance improved in October, RBA Bulletin remains elusive.
- Mixed signals from China, Russia and the US test traders amid a light calendar elsewhere and the pre-Fed blackout.
AUD/USD stays pressured around the intraday low near 0.6720, paying little heed to Aussie data during early Thursday. Not only the unimpressive trade data from Australia but mixed comments from the Reserve Bank of Australia’s (RBA) quarterly Bulletin and risk catalysts also restrict the Aussie pair’s immediate moves.
That said, Australian Trade Balance for October improved to 12,217M versus 1,155M expected and 12,444 prior. Further details suggest that the Imports and Exports both dropped 1.0% versus expectations of rising by 2.0% and 1.0% in that order.
Additionally, the quarterly Bulletin from the Reserve Bank of Australia (RBA) failed to provide any clear directions to the AUD/USD pair traders as it highlights the importance of education while praising the economic transition due to the easing of Covid-linked restrictions.
Other than the data, the mixed clues from the geopolitical front appear to restrict the AUD/USD pair’s immediate moves. The reason could be linked to Russian President Vladimir Putin’s threat of using nuclear weapons and comments from German Chancellor Olaf Scholz suggesting easing the risks of Moscow using nuclear weapons.
On the other hand, China’s gradual easing of the Zero-Covid policy appears as a passive reopening and struggles to impress the bulls.
Amid these plays, US Treasury yields lick their wounds and the stock futures print mild losses by the press time.
Moving on, a light calendar and mixed signals from the qualitative catalysts might restrict short-term AUD/USD moves. Also likely to challenge the pair’s immediate momentum could be a policy-driven blackout of the Fed officials ahead of next week’s Federal Open Market Committee (FOMC). Even so, US Initial Jobless Claims, expected to rise by 230K versus 225K prior during the week ended on December 02, may entertain the traders.
Technical analysis
Unless breaking the 100-DMA, around 0.6680 by the press time, the AUD/USD bears are off the table. It’s worth noting, however, that the upside room also appears limited as a convergence of the two-week-old ascending trend line and the 61.8% Fibonacci retracement level of the June-October downside, near 0.6860, challenge the bulls.
- USD/CAD bears are lurking with prospects of a deeper correction.
- Bulls remain in play while above the triangle.
test As per the prior analysis, USD/CAD Price Analysis: Bulls and bears battle it out at key structure, the bears did indeed move into prior highs near 1.3580, an area that has started to offer support. A break of 1.3700 opens the prospects of a run on liquidity towards 1.3800/25 stops in a continuation of the short squeeze.
USD/CAD prior analysis
It was stated that USD/CAD is in an uptrend with eyes on a break of 1.4000. However, the following charts illustrated a number of key structures to take into consideration:
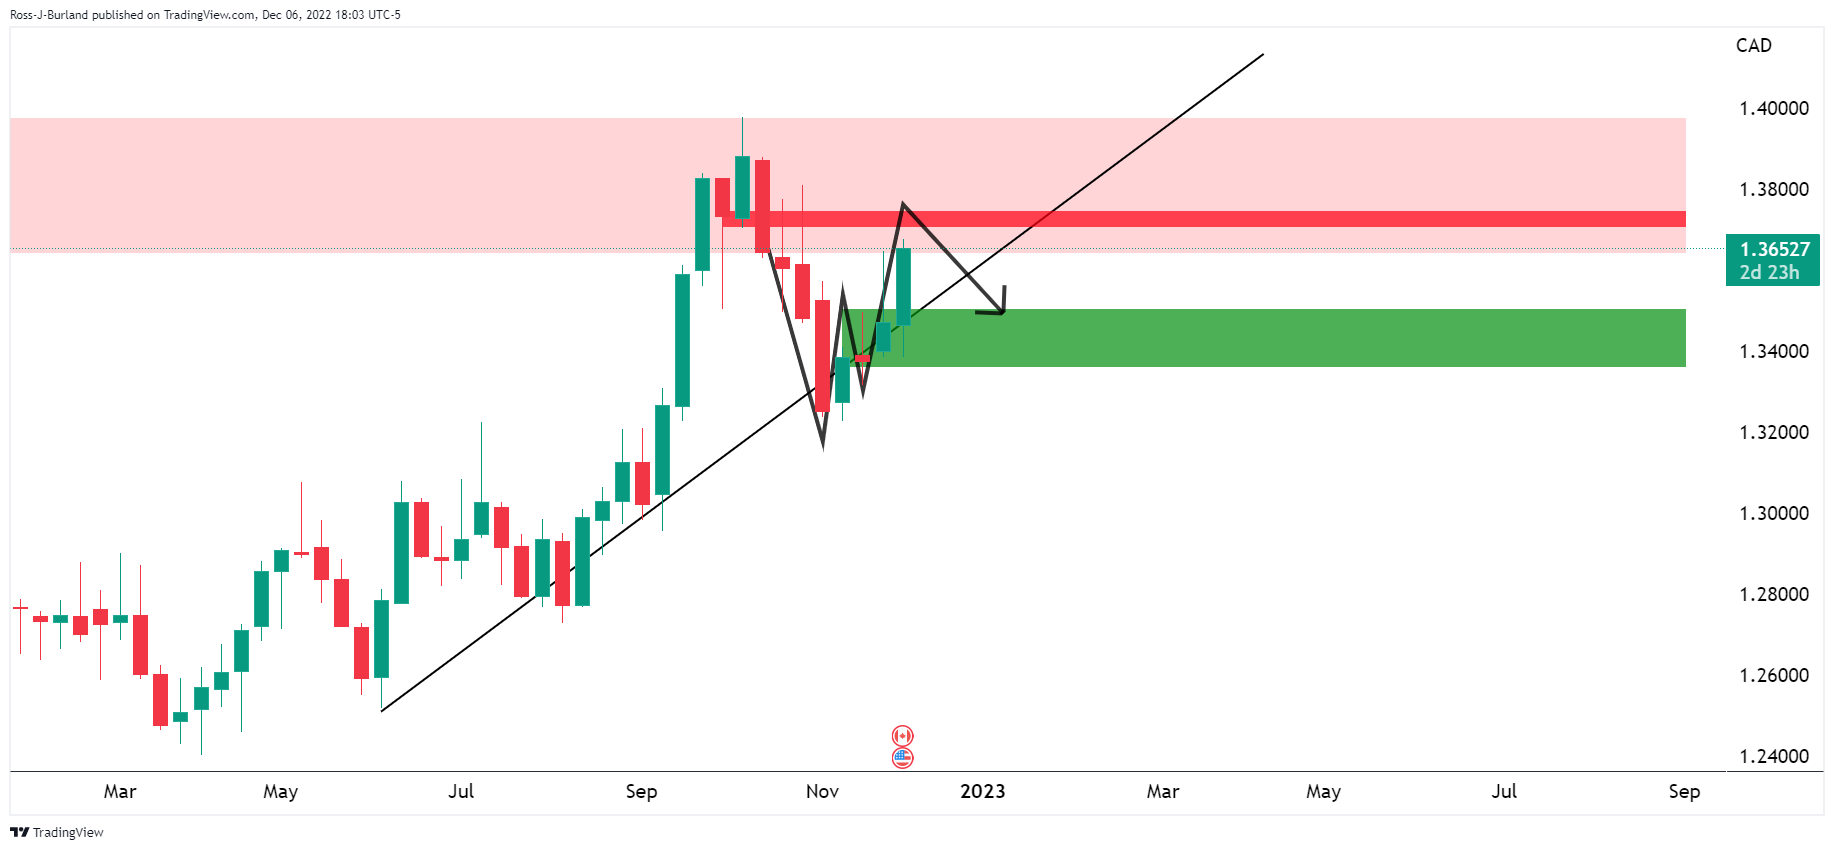
There are conflicting patterns on the weekly chart, wit the W-formation, on the chart above, and an M pattern on the chart below.
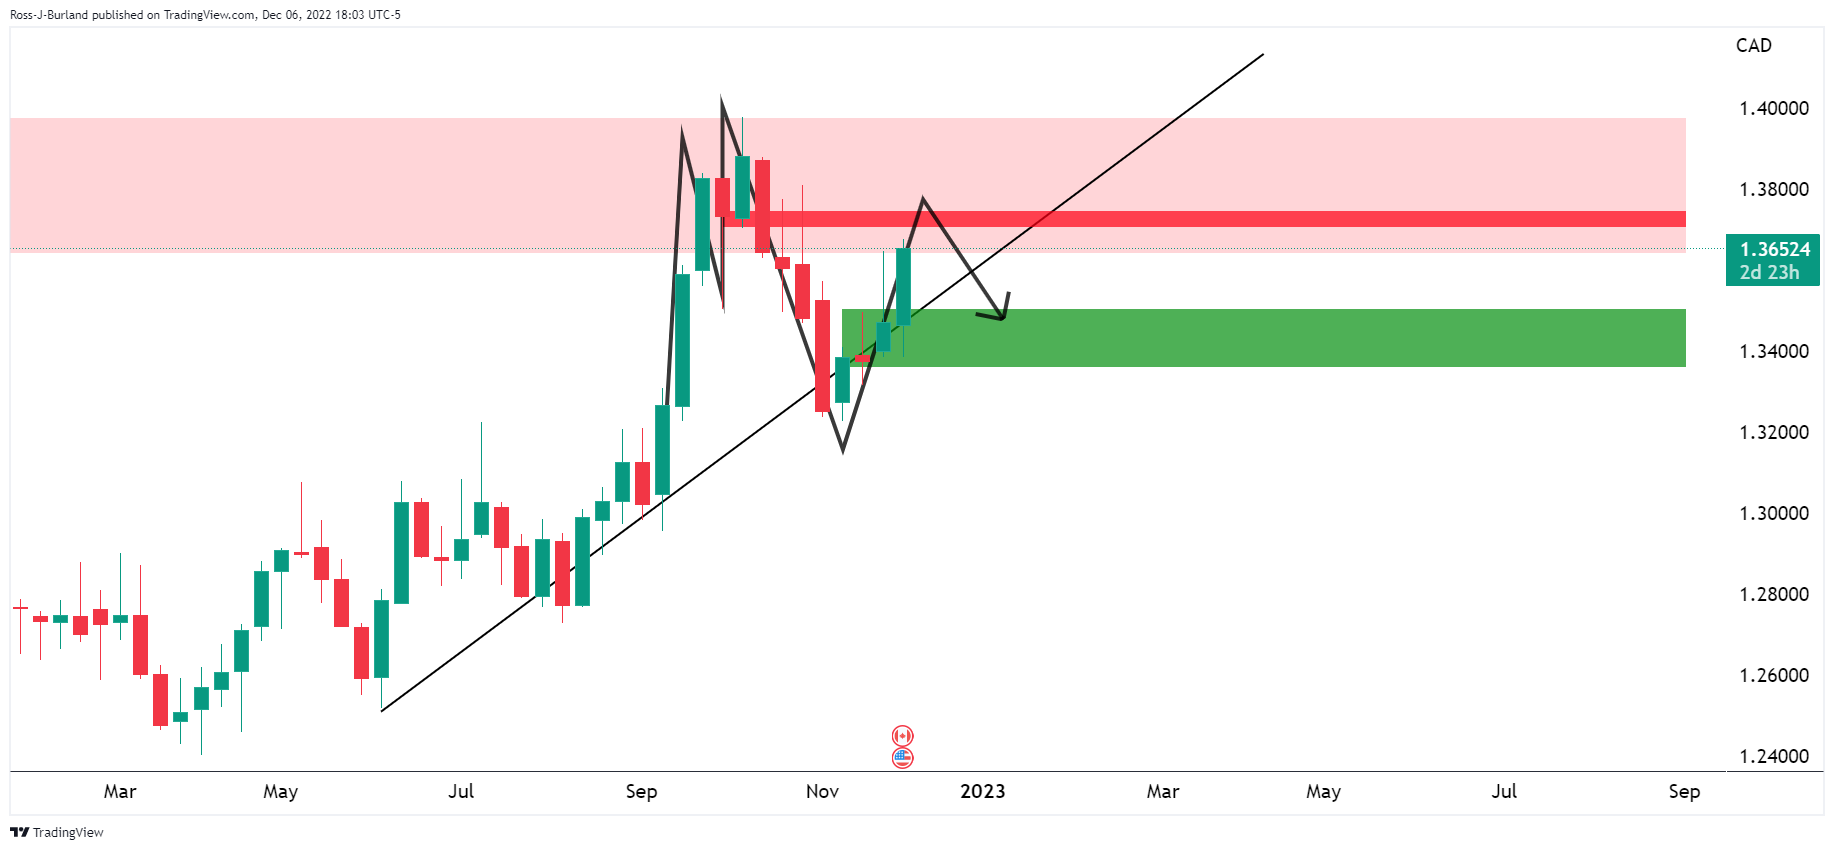
Given the price had rallied towards the neckline of the M-formation, the path of least resistance was expected to be to the downside as the following daily chart showed:
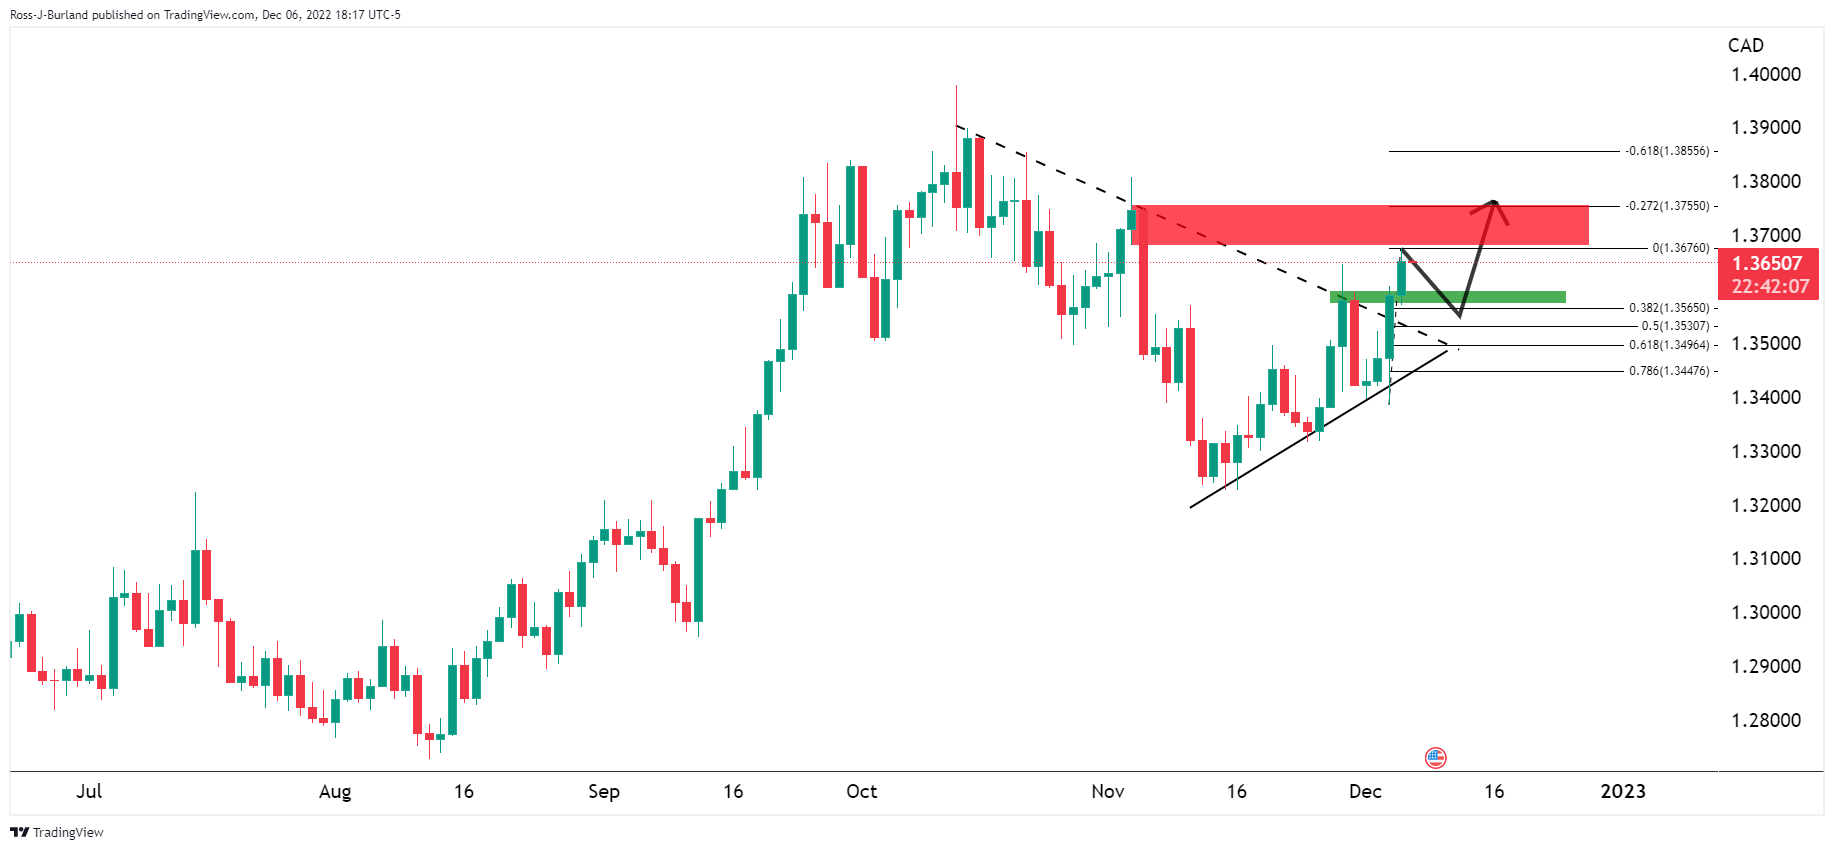
USD/CAD broke out of the triangle meeting the 1.3650s and a correction was anticipated into prior highs near 1.3580.
USD/CAD update, daily & H4 chart
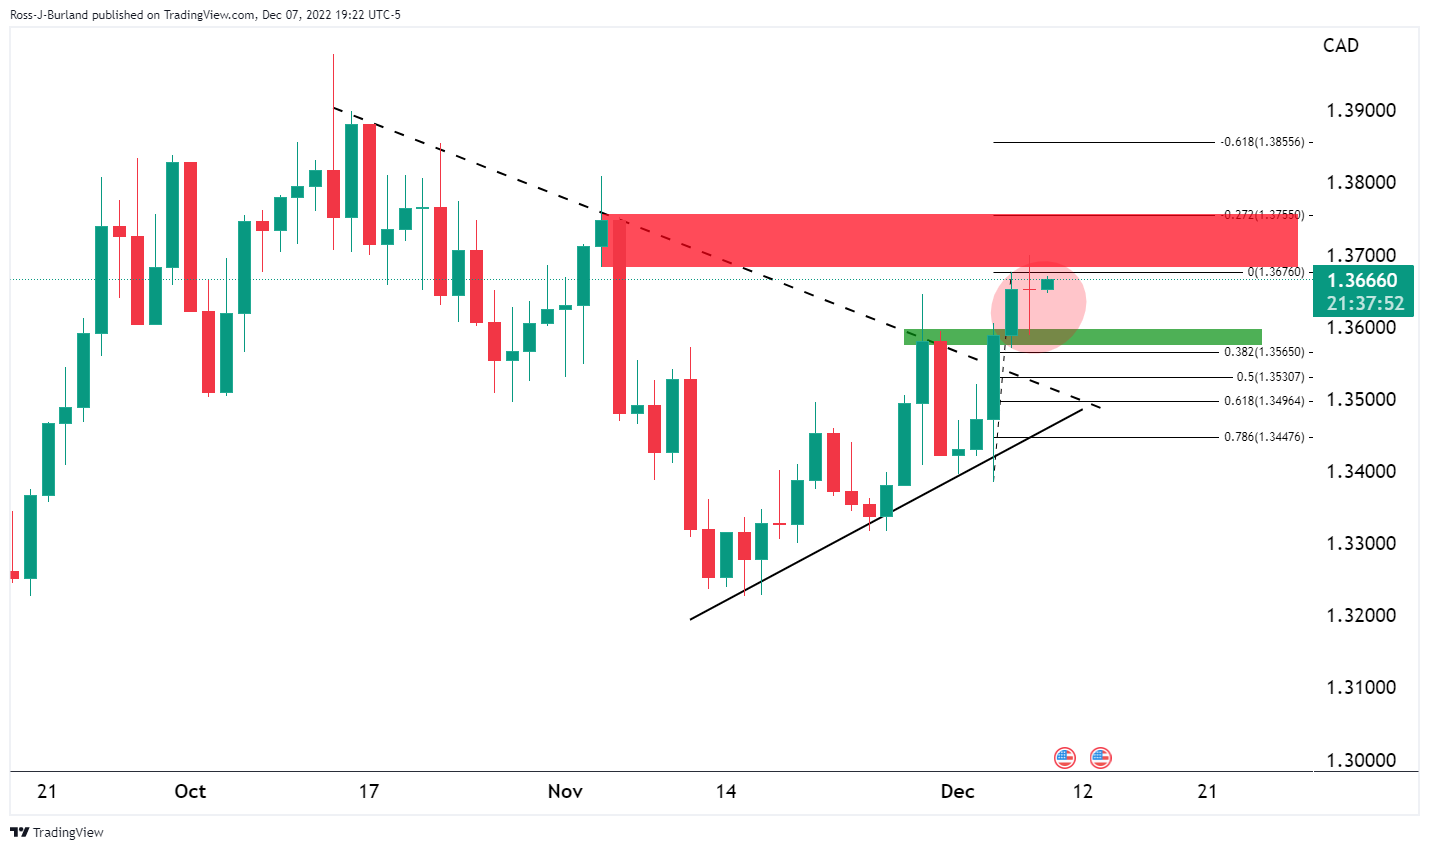
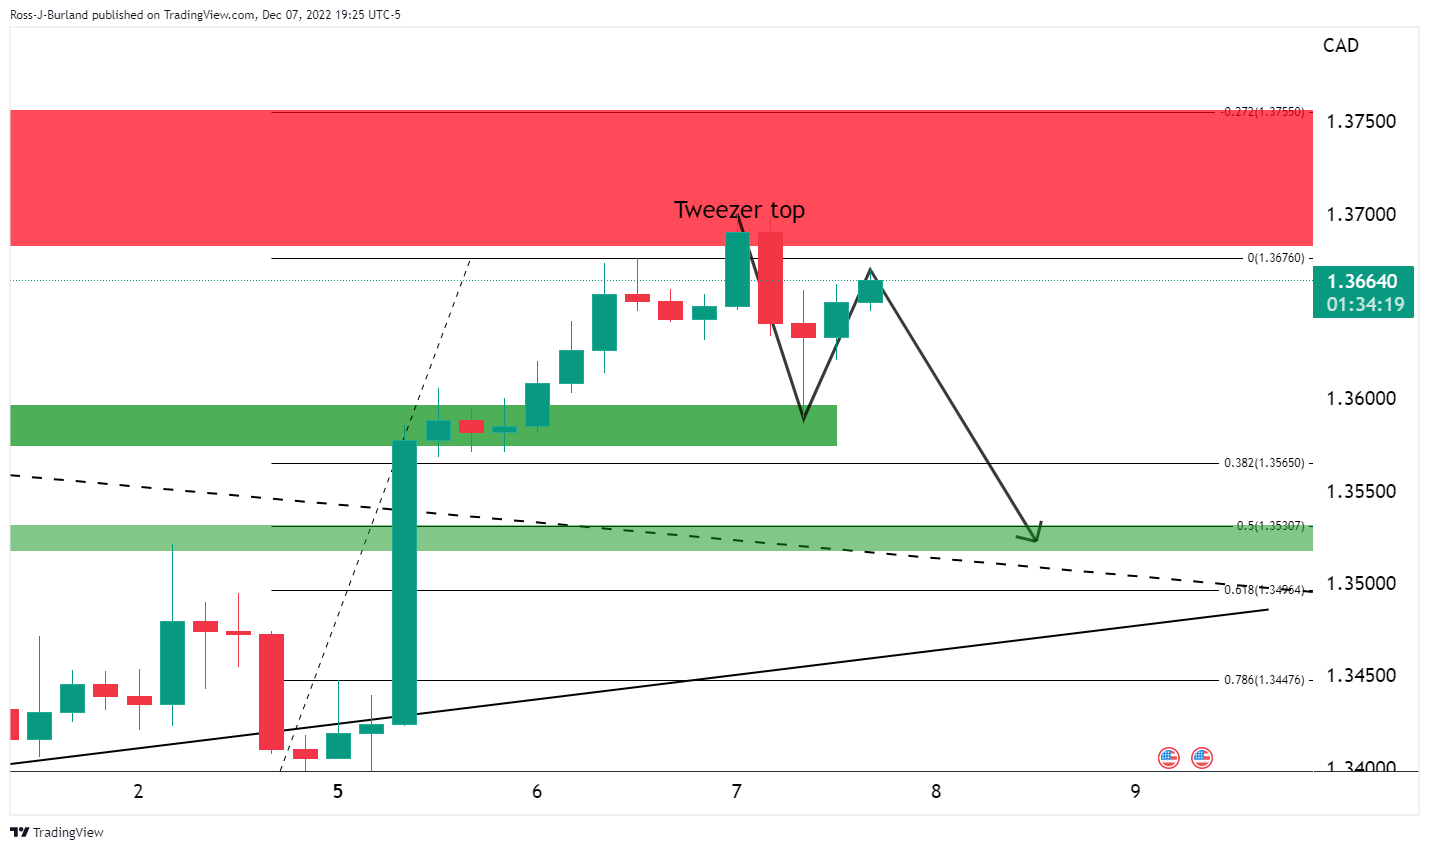
While the bias remains to the upside with the price on top of the triangle, a deeper correction could be on the cards given the strength of the correction and prospects of mitigation of a price imbalance below 1.3600.
The Trade Balance has been released as follows:
- Australia Trade Balance Oct: A$12.217Bln (est A$ 12Bln, prev A$12.444Bln).
- Exports MoM Oct: -1% (est 1%, prev 7%).
- Imports MoM Oct: -1% (est 2%, prev 0%).
AUD/USD update
AUD/USD is sliding following the data, down some 0.2% and making a low of 0.6709 so far for the session.
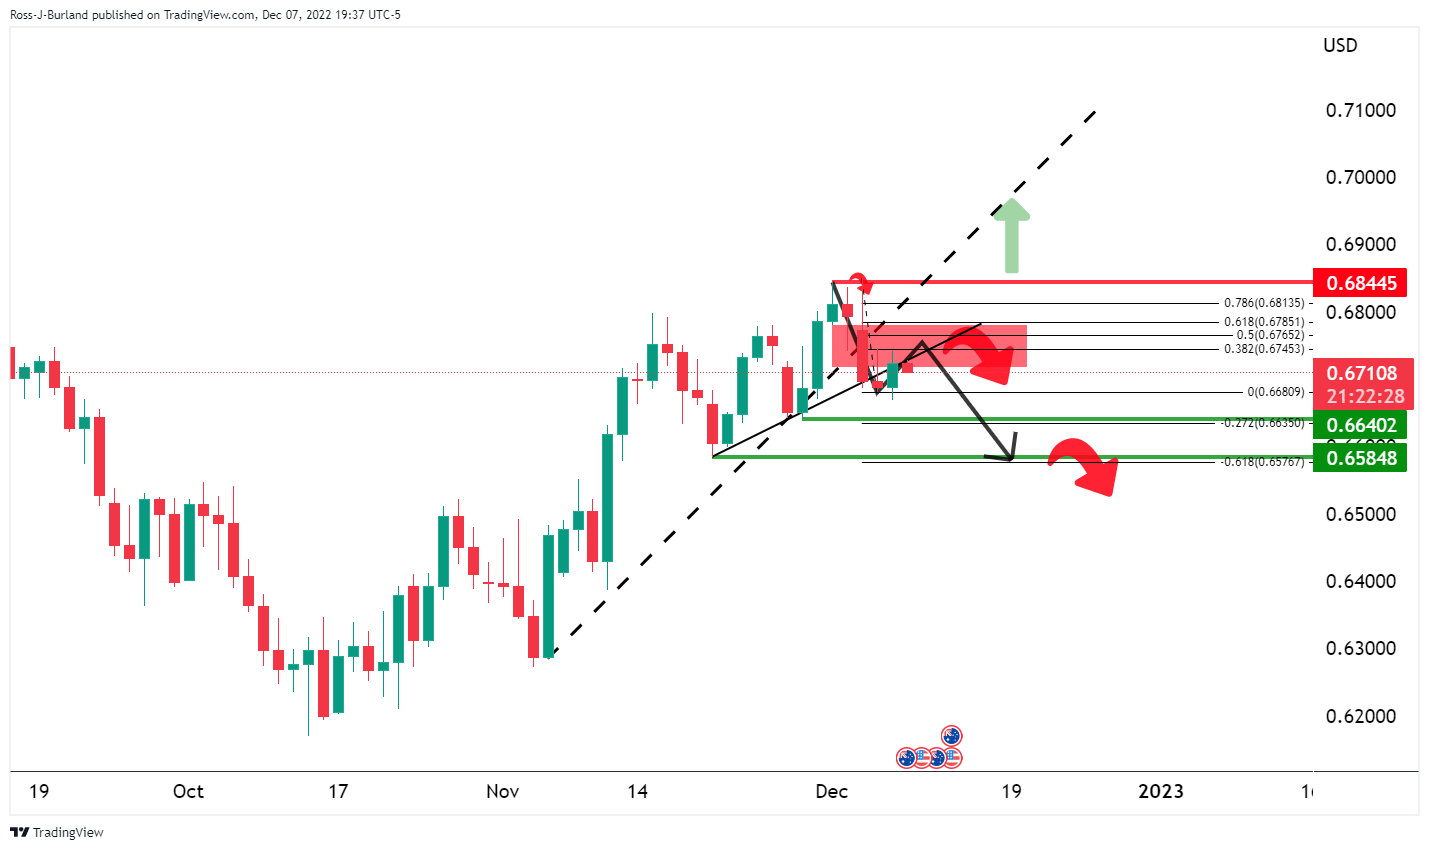
Technically, the price is bearish while below the prior trendline support and pressured by supply at a key daily resistance area.
About the Trade Balance
The data that is released by the Australian Bureau of Statistics is the difference in the value of its imports and exports of Australian goods. Export data can give an important reflection of Australian growth, while imports provide an indication of domestic demand. Trade Balance gives an early indication of the net export performance. If a steady demand in exchange for Australian exports is seen, that would turn into a positive growth in the trade balance, and that should be positive for the AUD.
| Index | Change, points | Closed | Change, % |
|---|---|---|---|
| NIKKEI 225 | -199.47 | 27686.4 | -0.72 |
| Hang Seng | -626.36 | 18814.82 | -3.22 |
| KOSPI | -10.35 | 2382.81 | -0.43 |
| ASX 200 | -61.9 | 7229.4 | -0.85 |
| FTSE 100 | -32.21 | 7489.19 | -0.43 |
| DAX | -82 | 14261.19 | -0.57 |
| CAC 40 | -27.2 | 6660.59 | -0.41 |
| Dow Jones | 1.58 | 33597.92 | 0 |
| S&P 500 | -7.34 | 3933.92 | -0.19 |
| NASDAQ Composite | -56.34 | 10958.55 | -0.51 |
- The US Dollar is struggling to cross the immediate hurdle of 105.20 as the risk-on impulse has capped the upside.
- US Treasury yields dived, and S&P500 remained choppy amid escalating recession fears.
- A policy change by the FOMC from 2023 will result in a prolonged decline in the US Dollar.
The US Dollar Index (DXY) is facing barricades while attempting to cross the immediate hurdle of 105.20 in the Asian session. The upside in the US Dollar seems capped as the risk appetite of the market participants has improved significantly. Investors shrugged off uncertainty over higher interest rate peak guidance in December monetary policy meeting by the Federal Reserve (Fed) and poured funds into the risk-sensitive assets.
Yields refresh 11-week low amid escalating recession fears
US Treasury bonds remained in the spotlight as the street started talking about a recession in the United States on further policy tightening by the Fed. Investors parked their money into US government bonds to dodge recession fears. No doubt, the Fed policymakers have favored a slowdown in the interest rate hike pace from December but fresh evidence of strength in the United States economy led by a tight labor market and strong demand for the service sector has triggered the risk of a reversal in the inflation rate.
Concerns over forward recession weigh immense pressure on the returns from US Treasury bonds. The 10-year US Treasury yields refreshed its 11-week low near 3.4%. S&P500 remained choppy in Wednesday’s trading session despite investors underpinned risk-on traction.
US Dollar to shift in a prolonged decline from CY2023
The US Dollar has started facing pressure from market participants as investors believe that the Federal Open Market Committee (FOMC) will pause policy tightening moves from next year after reaching the neutral rate.
Economists at the National Bank of Canada believe that the greenback could recover some ground in the near term before sustaining a prolonged decline next year. They further added that a policy change from the FOMC in the first quarter of 2023 would set the stage for a more prolonged decline in the Greenback.
- GBP/JPY sellers attack short-term key support line to reverse the previous day’s gains.
- Japan Q3 GDP came in better than initial forecasts, improved to -0.2% QoQ.
- Bearish MACD signals add strength to the downside bias, 100-HMA acts as additional support.
- Nine-day-old horizontal area appears a tough nut to crack for buyers.
GBP/JPY remains pressured around 166.47 during Thursday’s Asian session, as bears jostle with an upward-sloping support line from Monday. In doing so, the cross-currency pair justifies firmer Japan data and the Moving Average Convergence and Divergence (MACD) indicator’s bearish signals.
That said, Japan’s final readings of the third quarter (Q3) Gross Domestic Product (GDP) came in better than initial forecasts as the QoQ figures improved to -0.2% versus -0.3% while the GDP Annualized came in -0.8% versus -1.1% expected and -1.2% prior.
Technically, the quote’s failure to cross a horizontal region comprising multiple tops marked since November 28, around 167.40-50, keeps sellers hopeful.
However, the 100-HMA level of 166.15 acts as an extra downside filter to break for the GBP/JPY sellers before approaching the monthly low of 164.00.
In a case where GBP/JPY remains bearish past 164.00, November’s trough surrounding 163.00 will be in focus.
Alternatively, an upside clearance of the 167.40-50 region needs validation from the late November swing high surrounding 169.00 to convince the buyers.
GBP/JPY: Hourly chart
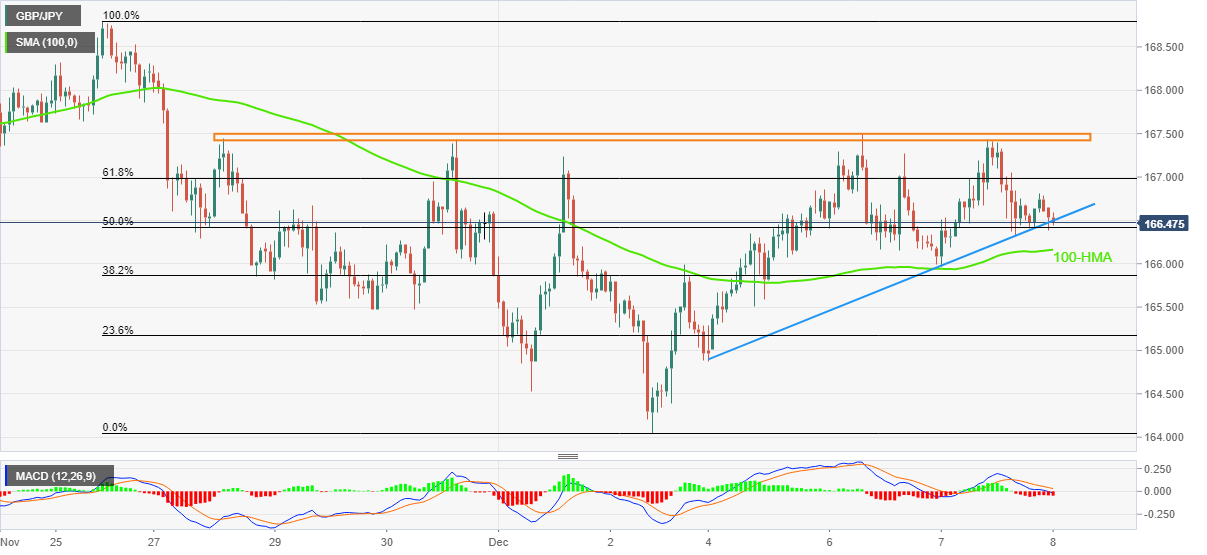
Trend: Further downside expected
| Pare | Closed | Change, % |
|---|---|---|
| AUDUSD | 0.67234 | 0.58 |
| EURJPY | 143.505 | 0.18 |
| EURUSD | 1.05059 | 0.41 |
| GBPJPY | 166.77 | 0.45 |
| GBPUSD | 1.22097 | 0.64 |
| NZDUSD | 0.63533 | 0.63 |
| USDCAD | 1.36536 | -0.02 |
| USDCHF | 0.94087 | -0.04 |
| USDJPY | 136.592 | -0.25 |
- AUD/JPY has continued to remain sideways around 91.70 despite better-than-anticipated Japan’s GDP data.
- The Japanese economy is still in a contraction phase and demands economic stimulus to spurt the growth rate.
- Aussie investors are awaiting China’s inflation data for fresh impetus.
The AUD/JPY pair has continued its sideways auction profile despite Japan’s Cabinet Office having reported better-than-projected Gross Domestic Product (GDP) data for the third quarter of CY2022. The annualized data has contracted by 0.8% vs. the contraction of 1.1% as expected and the prior release of -1.2%. While the quarterly data has contracted by 0.2% against the consensus and the prior release of 0.3% contraction.
No doubt, Japan’s GDP figures are better than projected but the economy is still in a contraction phase and needs economic stimulus to accelerate the extent of economic activities in the economy.
Bank of Japan (BOJ) Governor Haruhiko Kuroda is making significant efforts in pushing wage inflation higher to achieve sustainability of the inflation target at 2%. He dictated that a rise in wage inflation by 3% could support the central bank in achieving the inflation target effectively.
Meanwhile, Aussie investors are awaiting China’s Consumer Price Index (CPI) data, which will release on Friday. As per the consensus, the annual inflation is seen lower at 1.0% vs. the prior release of 2.1%. This may force the People’s Bank of China (PBOC) to favor more policy easing to strengthen economic prospects. More economic stimulus will accelerate economic activities and will also support the Australian Dollar, a leading trading partner of China.
On Wednesday, the Australian Dollar remained highly volatile after the release of the weak GDP data. The annual GDP data has landed at 5.9%, lower than the expectations of 6.3% but higher than the prior release of 3.6%. While quarterly GDP data has been reported lower at 0.6% vs. the projections of 0.7% and the former release of 0.9%.


© 2000-2026. All rights reserved.
This site is managed by Teletrade D.J. LLC 2351 LLC 2022 (Euro House, Richmond Hill Road, Kingstown, VC0100, St. Vincent and the Grenadines).
The information on this website is for informational purposes only and does not constitute any investment advice.
The company does not serve or provide services to customers who are residents of the US, Canada, Iran, The Democratic People's Republic of Korea, Yemen and FATF blacklisted countries.
Making transactions on financial markets with marginal financial instruments opens up wide possibilities and allows investors who are willing to take risks to earn high profits, carrying a potentially high risk of losses at the same time. Therefore you should responsibly approach the issue of choosing the appropriate investment strategy, taking the available resources into account, before starting trading.
Use of the information: full or partial use of materials from this website must always be referenced to TeleTrade as the source of information. Use of the materials on the Internet must be accompanied by a hyperlink to teletrade.org. Automatic import of materials and information from this website is prohibited.
Please contact our PR department if you have any questions or need assistance at pr@teletrade.global.
transfers