- Analytics
- News and Tools
- Market News
CFD Markets News and Forecasts — 07-12-2022
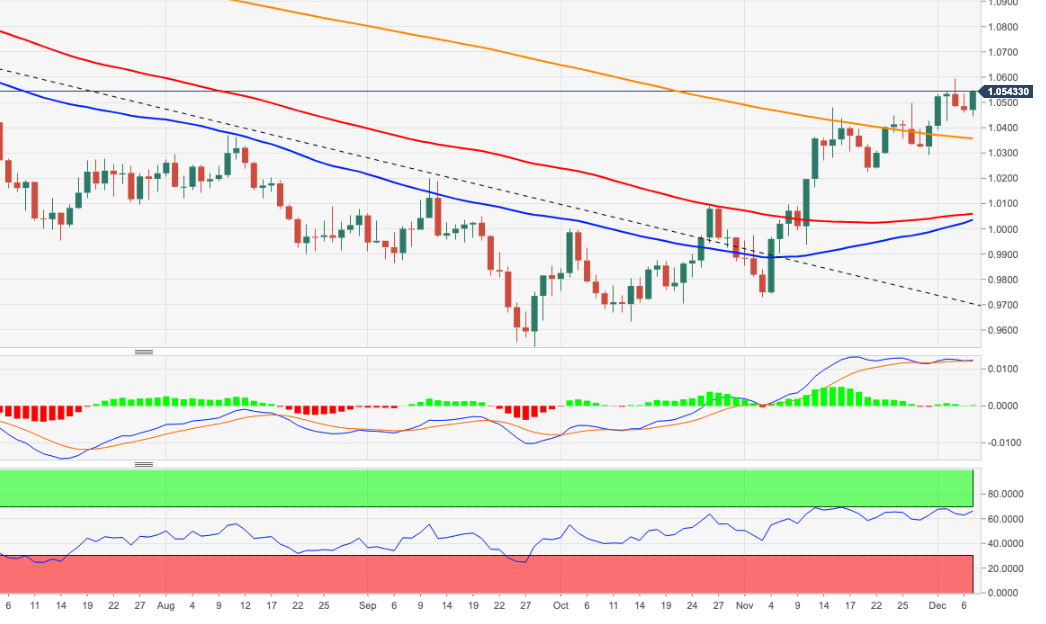
- USD/JPY holds lower ground after reversing from weekly top the previous day.
- Final readings of Japan’s Q3 GDP improved to -0.2% QoQ.
- US Treasury yields slumped on recession fears, downbeat US data.
USD/JPY remains on the back foot around 136.40 after witnessing downbeat data from Japan during early Thursday in Tokyo. Even so, the Yen pair remains mostly sidelined, maybe due to the initial hours of trading, after reversing from the one-week high on Wednesday.
Japan’s final readings of the third quarter (Q3) Gross Domestic Product (GDP) came in better than initial forecasts as the QoQ figures improved to -0.2% versus -0.3% while the GDP Annualized came in -0.8% versus -1.1% expected and -1.2% prior.
In addition to the firmer Japan data, downbeat US Treasury yields and softer US data also weigh on the USD/JPY prices.
That said, the benchmark 10-year Treasury bond yields dropped to the lowest levels since early September by losing 3.30% on Wednesday, close to 3.43% level at the latest. Further, the two-year counterpart dropped 2.54%, near the 4.26% mark by the press time. With this, the US Treasury bond yield curve, the difference between the long-dated and the short-term bond yields, inverted the most in over forty years.
On the other hand, the US Goods and Services Trade Balance deteriorated to $-78.2 billion versus $-79.1 billion expected and $-73.28 billion prior. Further, the final readings of the Unit Labour for Q3 eased to 2.4% QoQ versus 3.5% first estimations.
On a different page, the latest fears emanating from China and Russia seem to also exert downside pressure on the USD/JPY prices.
Technical analysis
A 12-day-old descending resistance line near 137.50 restricts immediate USD/JPY upside, which in turn joins downbeat MACD and RSI (14) to direct sellers towards the 200-DMA re-test, around 134.95 by the press time.
Japan's Gross Domestic Product has been released as follows:
- Japan GDP SA QoQ Q3F: -0.2% (est -0.3%, prev -0.3%).
- Japan GDP Annualised Q3F: -0.8% (est -1.0%, prev -1.2%).
- Japan GDP Nominal SA Q/Q Q3F: -0.7% (est -0.4%, prev -0.5%).
Japan's economy shrank at an annualised 0.8% in the July-September quarter, slower than the initial estimate of a 1.2% contraction, revised government data showed on Thursday.
The revised figure for gross domestic product (GDP) released by the Cabinet Office compared with economists' median forecast for a 1.1% decline in a Reuters poll.
On a quarter-on-quarter basis, GDP contracted 0.2%.
USD/JPY update
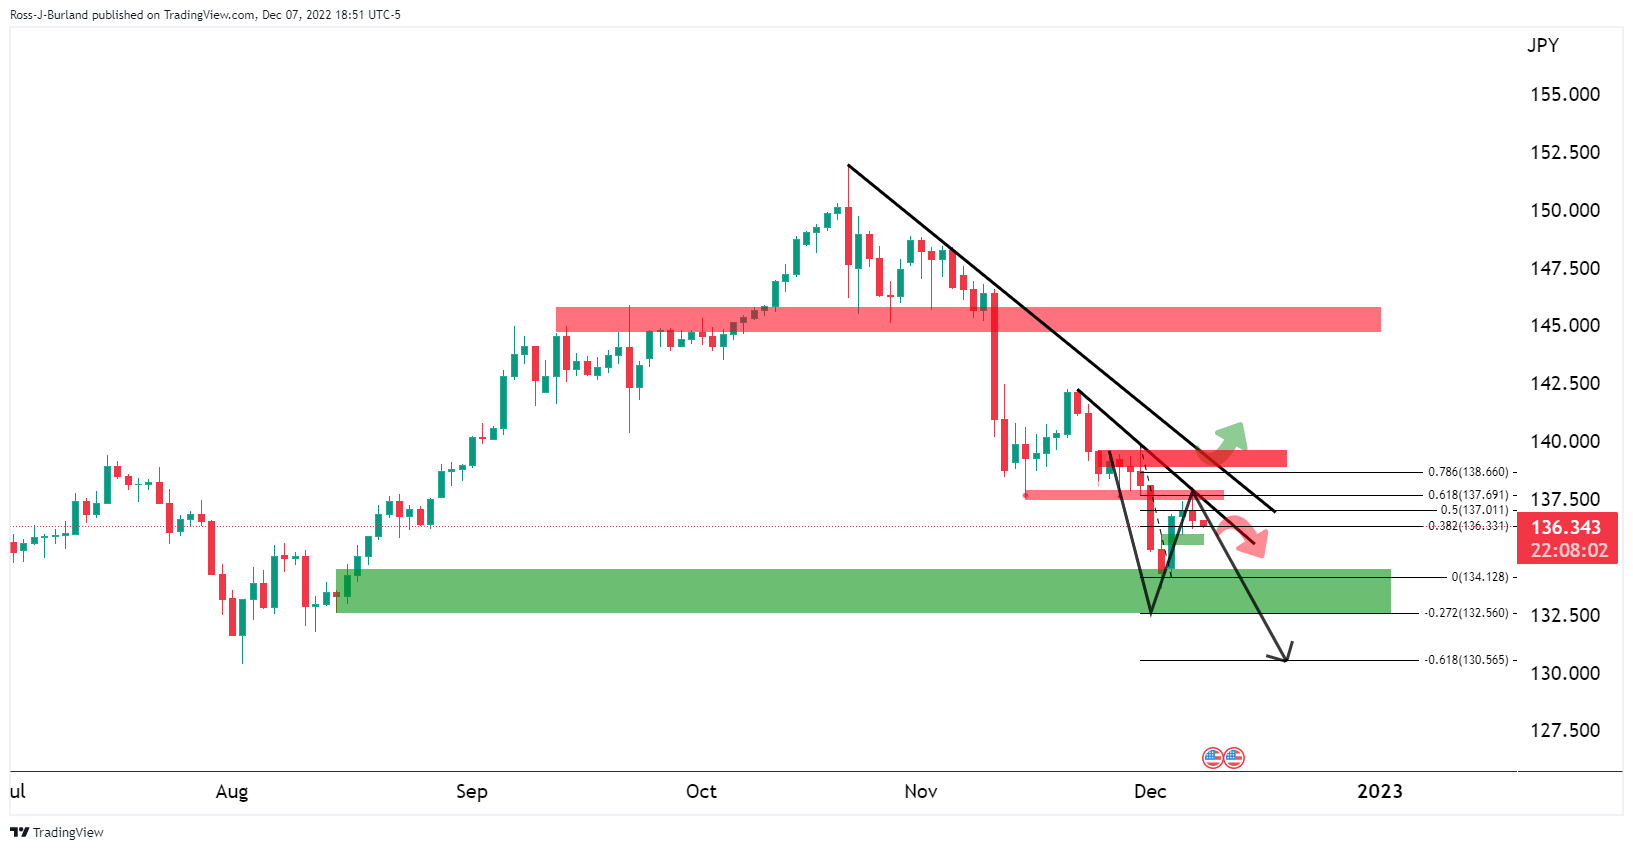
The bears are moving in from a key area of resistance and a break of 132.50 opens prospects of amove into 130.00.
About Japan GDP
The Gross Domestic Product released by the Cabinet Office shows the monetary value of all the goods, services and structures produced in Japan within a given period of time. GDP is a gross measure of market activity because it indicates the pace at which the Japanese economy is growing or decreasing. A high reading or a better-than-expected number is seen as positive for the JPY, while a low reading is negative.
- EUR/USD treads water after snapping two-day downtrend, stays defensive of late.
- Downbeat US Treasury yields, softer US data favor broad-based US Dollar weakness.
- Firmer EU statistics, hawkish ECB survey underpin bullish bias amid sluggish session.
EUR/USD struggles to defend the previous day’s corrective bounce around 1.0510-15 during Thursday’s Asian session. In doing so, the major currency pair portrays the market’s inaction amid a light calendar and mixed sentiment. However, the scheduled speech from European Central Bank (ECB) President Christine Lagarde and weekly prints of the US Initial Jobless Claims will be important for near-term clear directions for the pair traders.
Final prints of the Eurozone Gross Domestic Product (GDP) for the third quarter (Q3) improved to 0.3% QoQ versus 0.2% previous estimations. On the same line was the YoY number of 2.3% and the upward revision of the yearly prior figures to 4.2% versus 2.1% flash estimations. Further, German Industrial Production also improved to -0.1% MoM versus -0.5% expected and 0.6% prior while Eurozone Employment Change rose to 1.8% YoY during the Q3 2022 against 1.7% expected and previous readings. Additionally, strong prints of the ECB survey of consumer expectations for inflation also favor the Euro.
On the other hand, US Dollar Index (DXY) dropped 0.37% to 105.17 by the end of Wednesday’s North American session. The DXY weakness could also be linked to the softer US data, namely the trade balance and Unit Labour Costs for the third quarter (Q3). It should be noted that the US Goods and Services Trade Balance deteriorated to $-78.2 billion versus $-79.1 billion expected and $-73.28 billion prior. Further, the final readings of the Unit Labour for Q3 eased to 2.4% QoQ versus 3.5% first estimations.
Also exerting downside pressure on the DXY could be the weaker US Treasury bond yields. That said, the benchmark 10-year Treasury bond yields dropped to the lowest levels since early September by losing 3.30% in a day to 3.42% level at the latest. Further, the two-year counterpart dropped 2.54% to the 4.26% mark. With this, the US Treasury bond yield curve, the difference between the long-dated and the short-term bond yields, inverted the most in over forty years.
Elsewhere, China announced multiple measures to ease the three-year-long Zero-Covid policy and bolstered the market sentiment before the risk appetite weakened. The dragon nation’s downbeat prints of the Trade Balance, Imports and Exports seemed to have probed the positive vibes. On the other hand, Russian President Vladimir Putin teased a nuclear war by saying that nuclear weapons could be used to defend itself and its allies.
Moving on, a speech from ECB President Lagarde and the weekly prints of the US Jobless Claims will be important for the EUR/USD traders.
Technical analysis
A one-month-old rising wedge bearish chart formation keeps EUR/USD sellers hopeful unless the quote crosses the 1.0625 hurdle. Alternatively, 1.0435 acts as the trigger for the pair’s theoretical downward trajectory backed by the rising wedge confirmation.
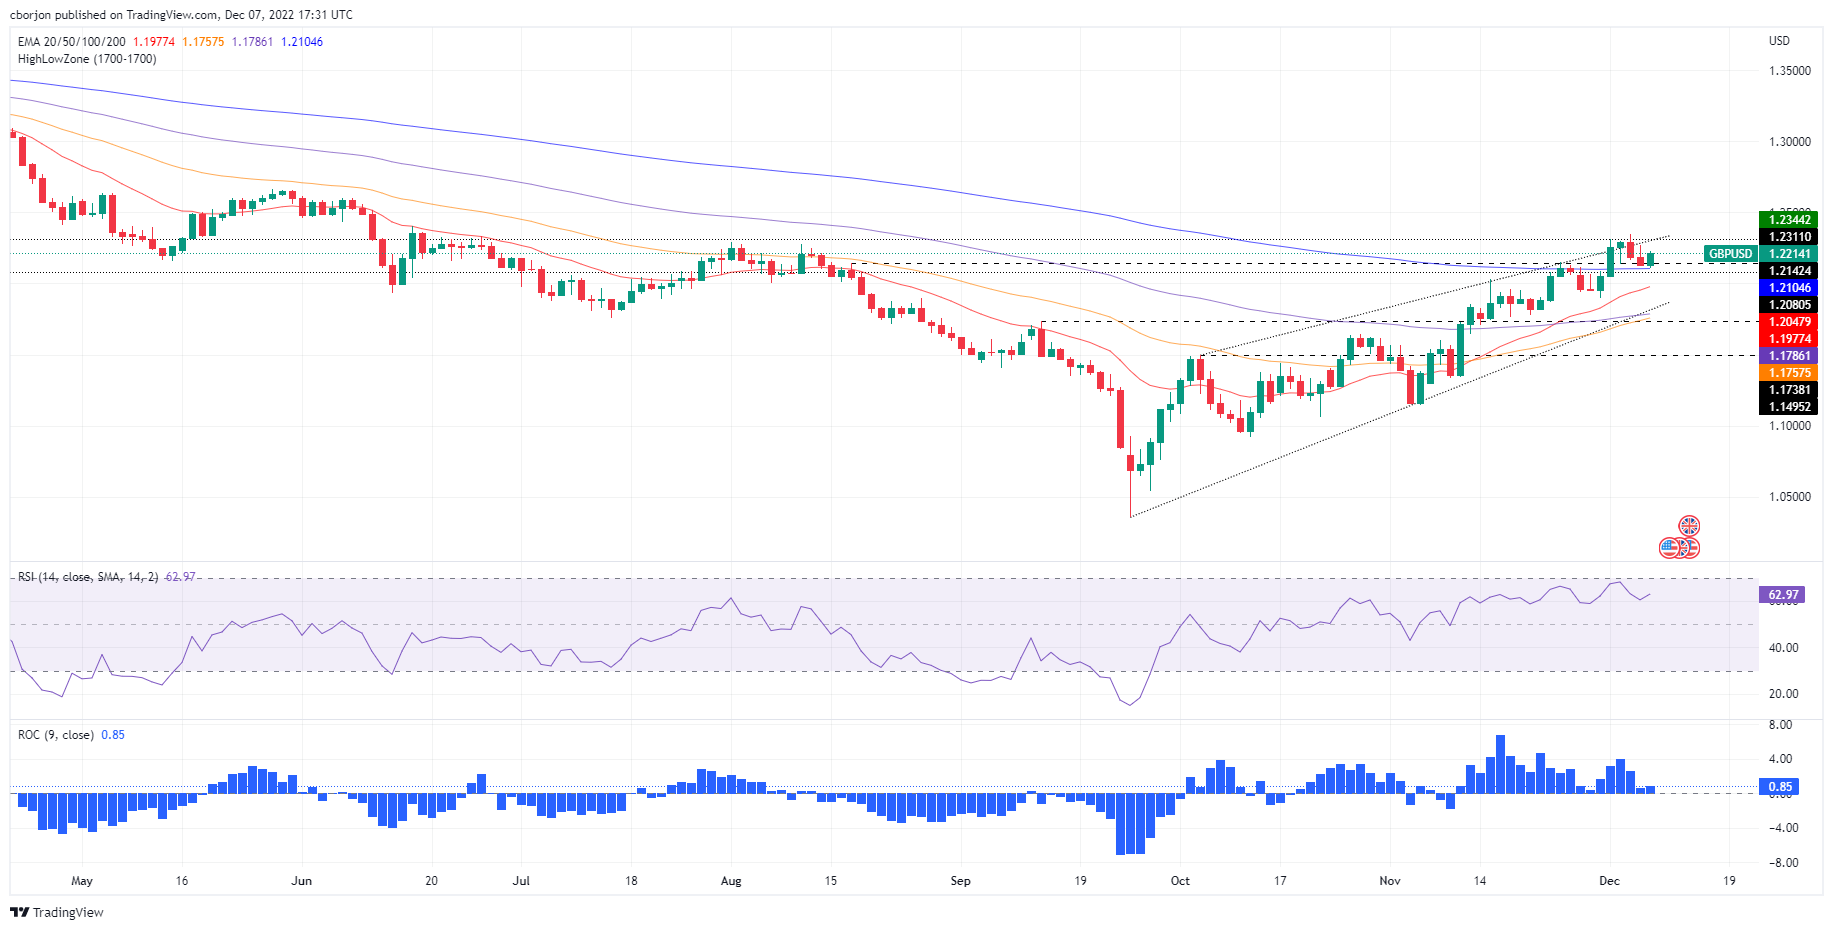
- GBP/USD bulls move and take out key 4-hour resistance.
- A bullish structure is being formed and eyes are on 1.2350.
As per the prior analyses, GBP/USD Price Analysis: Bears stay the course and eye trendline support, the British Pound has managed to find its feet and is now forming a bullish structure as the following will illustrate.
GBP/USD prior analysis
On the 4-hour chart, the H&S pattern was playing out as follows:
Zoomed in...
GBP/USD update
It was explained that the M-formation is a reversion pattern so a return to the neckline was a strong possibility prior to further declines towards the trendline support. However, the bulls took out the resistance and so long as 1.2150 holds, there will be prospects of a rally towards 1.2350 and then 1.2450 for the days ahead:
- AUD/NZD struggles to defend the bounce off yearly low.
- Oversold RSI conditions, Wednesday’s Doji candlestick signal further recovery.
- Ascending trend line from March 2020 appears to be the key support.
AUD/NZD remains sidelined around 1.0585 during Thursday’s Asian session, after bouncing off the yearly low the previous day. In doing so, the quote justifies Wednesday’s Doji candlestick, as well as oversold conditions of the Relative Strength Index (RSI) line, placed at 14.
AUD/NZD: Daily chart
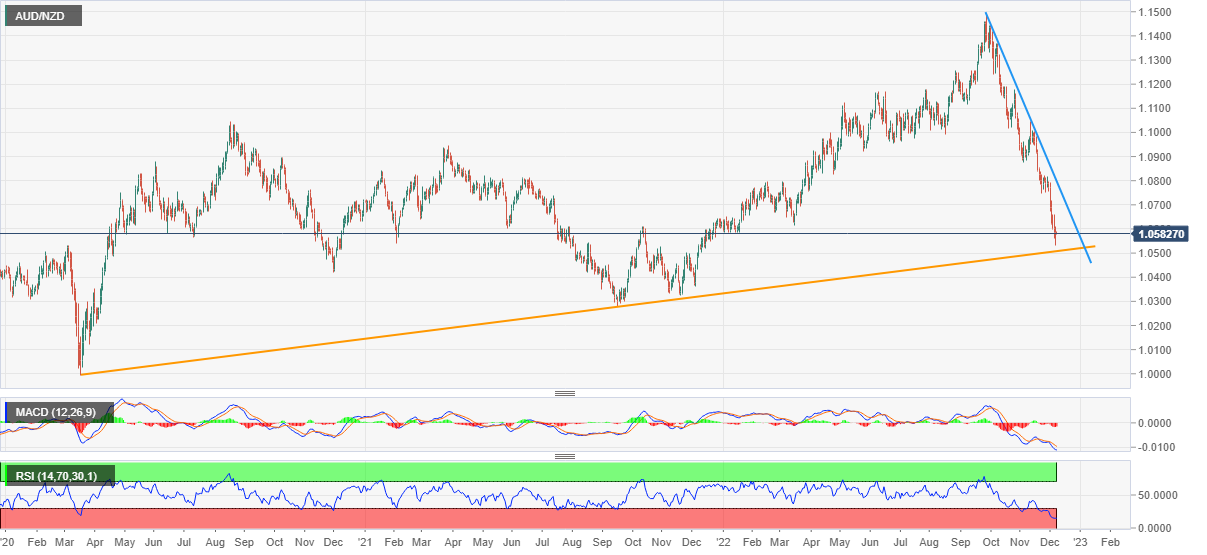
A closer look at the chart shows that the recovery needs validation from a horizontal resistance line comprising October 2020 top and March 2022 low surrounding 1.0610-15.
Even so, downward-sloping resistance lines from November 11 and September 28, respectively near 1.0710 and 1.0780, challenge the AUD/NZD pair’s further upside.
It’s worth noting, however, that the pair’s successful break of 1.0780 enables the AUD/NZD bulls to retake control.
AUD/NZD: Daily chart
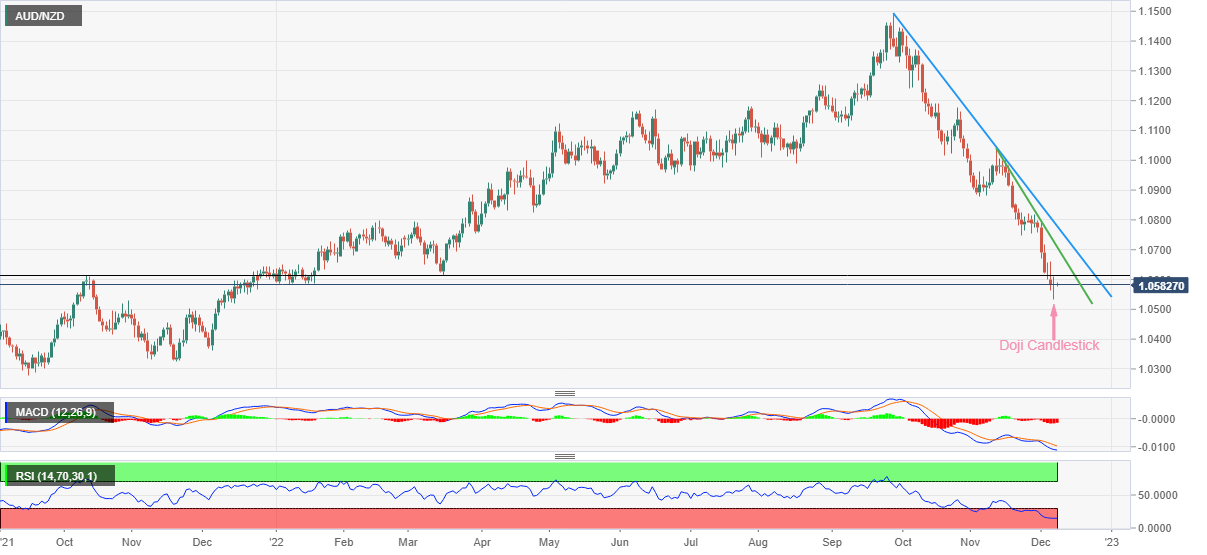
Alternatively, an ascending trend line from March 2020, around 1.0500, appears the key support for the AUD/NZD pair bears to watch during the quote’s further downside.
Following that, the quote’s gradual downside towards the lows marked in November and September of 2021, close to 1.0325 and 1.0280 in that order, can’t be ruled out.
Overall, AUD/NZD is likely to witness a corrective bounce but the recovery has a long way to go before convincing the buyers.
- West Texas Intermediate falls to the lowest in nearly a year.
- Traders fret over recession fears and the Federal Reserve that looks to raise interest rates again.
West Texas Intermediate (WTI ) crude fell to the lowest in nearly a year on Wednesday despite the good news in China's steps to move down from the zero-Covid policies. Instead, analysts fret over a weakening economic backdrop and low liquidity across markets. At the time of writing, Oil is down some 2.8%, sliding from a high of $75.36 to a low of $71.77.
China has moved to relax the zero-Covid policies that had slashed economic growth and oil demand. However, the nation announced that frequent testing and health passes will no longer be needed for travel in the country. The easing of restrictions would be expected to aid recovery in the economy o the country is the world's No.1 oil importer. Additionally, a European Union embargo against maritime shipments of crude oil from Russia went into effect Monday, along with a price cap agreed to by the Group of Seven leading industrialized economies and Australia.
However, ahead of the Federal Reserve that looks to raise interest rates again when its policy committee meets next week, prospects of a recession in the US are weighing on Oil.
''Despite European sanctions on Russian oil beginning this week, the market has refocused on the economic backdrop amid tighter monetary policies from central banks,'' analysts at ANZ Bank said.
''The relatively high price cap also eased concerns of additional supply disruptions to Russian crude oil. Recent softness in the physical markets has also weighed on futures. Distillate inventories in the US rose by more than 6mbbl last week, according to Energy Information Administration data.''
- A successful test of the consolidation breakout will trigger a buying opportunity for the market participants.
- The 50-EMA is acting as major support for the New Zealand Dollar.
- The US Dollar lost strength as investors shrugged off uncertainty and channelized funds into risky assets.
The NZD/USD pair has picked demand after correcting below the crucial support of 0.6350 in early Asia. The Kiwi asset displayed a rebound on Wednesday after the US Dollar lost strength as investors shrugged off uncertainty and propelled reversal in risk-sensitive assets.
At the time of writing, the US Dollar Index (DXY) is facing barricades around 105.20. S&P500 remained choppy on Wednesday as accelerating recession fears capped the upside. The 10-year US Treasury yields have dropped to near 3.42%.
On an hourly scale, the kiwi pair is testing the breakout of the consolidation that placed in a range of 0.6300-0.6355. The 50-period Exponential Moving Average (EMA) at 0.6344 is acting as major support for the counter.
Meanwhile, the Relative Strength Index (RSI) (14) has dropped into the 40.00-60.00 range but that doesn’t resemble a reversal. The oscillator has lost upside momentum for now but may achieve this after stepping into the bullish range of 60.00-80.00.
Going forward, a break above Thursday’s high at 0.6372 will drive the kiwi asset towards Monday’s high at 0.6444, followed by December 1 high at 0.6477.
On the flip side, a break below the round-level resistance of 0.6300 will drag the asset towards November 29 high at 0.6254 and November 30 low at 0.6190.
NZD/USD hourly chart
-638060511555675363.png)
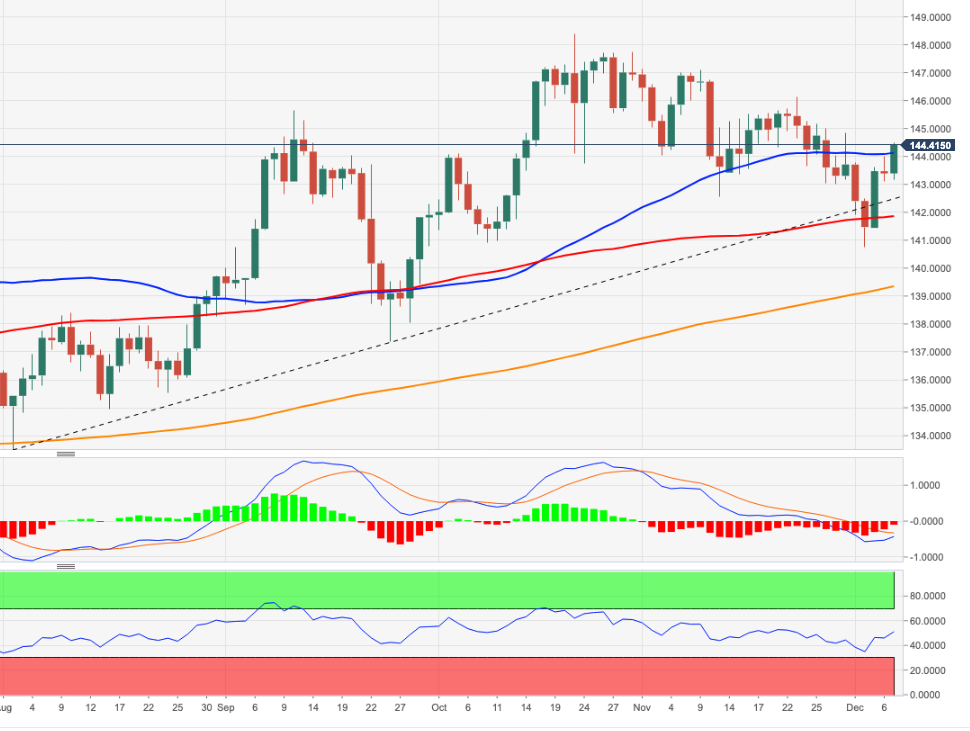
- The EUR/JPY is subdued around 143.40s due to a risk-off impulse.
- The 20 and 50-day Exponential Moving Averages capped the EUR/JPY rally towards 144.00.
- EUR/JPY: Once it clears 143.80, a test of the MTD high of 144.85 is on the cards.
The EUR/JPY edged higher after hitting a daily low of 143.16 and traveling all the way towards its daily high if 144.58 amidst a deteriorated market mood that keeps safe-haven peers, like the Japanese Yen (JPY), on the defensive. As the Asian Pacific session begins, the EUR/JPY is trading at 143.50, registering minuscule gains of 0.01%.
EUR/JPY Price Analysis: Technical outlook
The EUR/JPY remains neutral-to-upward biased, trading within the boundaries of a descending channel formed since the beginning of November. The EUR/JPY soared towards 144.50s, but the intersection of the 20 and 50-day Exponential Moving Averages (EMAs), around 143.80/95, capped the rally. With oscillators like the Relative Strength Index (RSI) and the Rate of Change (RoC) flashing signs, the selling pressure is fading, which could open the door for further gains.
The EUR/JPY key resistance levels are the 143.80/95 area. A breach of the latter and the 144.00 psychological price level would be up for grabs, followed by November’s monthly high of 144.85.
As an alternate scenario, a EUR/JPY break below December’s 6 daily low of 143.09 could lay the ground for further downside pressure. Once cleared, the following support would be the 100-day EMA at 142.43, followed by the December 5 daily low of 141.49, followed by December’s MTD low at 140.76.
EUR/JPY Key Technical Levels
- AUD/USD stays defensive after bouncing off one-week low.
- Headlines from Russia, pre-data anxiety challenge Aussie pair buyers.
- Optimism surrounding China contrasts with downbeat data to also test upside momentum.
- Light calendar elsewhere, Fed policymakers’ blackout could allow AUD/USD bulls to keep the reins even if Aussie data disappoints.
AUD/USD struggles to defend the latest bullish impulse around 0.6725-30, after bouncing off a one-week low the previous day, as traders await updates/data from Australia during early Thursday. Also likely to have challenged the Aussie pair buyers could be the latest swing in the market’s sentiment, mainly due to Russian President Vladimir Putin’s comments and headlines from the US Congress.
Russian President Putin teased a nuclear war by saying that nuclear weapons could be used to defend itself and its allies. On the other hand, Bloomberg came out with the news suggesting more tension between the US and China due to the latest bills the US Congress is up for passing. “The US is set to pass legislation revamping US policy toward Taiwan and restricting government use of Chinese semiconductors, moves that appear certain to antagonize Beijing even as President Joe Biden seeks to ease tensions,” said Bloomberg.
Previously, the US Dollar traced downbeat Treasury bond yields to snap a two-day uptrend and favor the AUD/USD bulls. That said, the benchmark 10-year Treasury bond yields dropped to the lowest levels since early September by losing 3.30% in a day to 3.42% level at the latest. Further, the two-year counterpart dropped 2.54% to the 4.26% mark. With this, the US Treasury bond yield curve, the difference between the long-dated and the short-term bond yields, inverted the most in over forty years.
The US Dollar Index (DXY), on the other hand, dropped 0.37% to 105.17 by the end of Wednesday’s North American session. The DXY weakness could also be linked to the softer US data, namely the trade balance and Unit Labour Costs for the third quarter (Q3).
It should be noted that China’s easing of the three-year-long Zero-Covid policy and readiness for more monetary and fiscal measures to stimulate the economy also helped the AUD/USD bulls.
Alternatively, downbeat prints of Australia’s Q3 Gross Domestic Product (GDP) and China's Trade Balance for November could be noted as the key upside barriers.
Looking forward, AUD/USD traders may witness further hardships in extending the latest upside. However, the Reserve Bank of Australia (RBA) Bulletin and Aussie Trade Balance for October could help the bulls in case of positive outcomes. Following that, US weekly jobless claims and risk catalysts will be crucial for clear directions.
Technical analysis
A clear rebound from the 100-DMA, around 0.6680 by the press time, keeps AUD/USD buyers hopeful. However, a convergence of the two-week-old ascending trend line and the 61.8% Fibonacci retracement level of the June-October downside, near 0.6860, appears a tough nut to crack for the bulls.
- USD/CAD is oscillating around 1.3650 as BOC’s interest rate peak and weak oil prices have capped the upside.
- The downside in the Canadian Dollar is being supported by investors' improved risk appetite.
- Growing signs of recession in the United States have impacted oil prices.
The USD/CAD pair is displaying back-and-forth moves in a narrow range of around 1.3650 in the early Tokyo session. The Loonie asset rebounded in the New York session after sensing strength near the round-level support of 1.3600. The move was against the risk-appetite theme in the global market but the ‘less-hawkish’ sound adopted by Bank of Canada (BOC) Governor Tiff Macklem justified the same.
Meanwhile, the US Dollar Index (DXY) is displaying signs of volatility contraction and is oscillating in a 105.00-105.10 range. S&P500 remained sideways as the upside was capped by soaring recession fears and the downside was restricted after the risk-on impulse resurfaced. The US Treasury bonds witnessed a sheer demand from the market participants as a higher interest rate peak by the Federal Reserve (Fed) alarmed recession fears. The 10-year US Treasury yields have plunged to near 3.42%.
Meanwhile, Loonie investors are not capitalizing on the risk-appetite theme as interest rates by the BOC have reached near their peak. On Wednesday, the Canadian central bank announced a 50 basis points (bps) rate hike consecutively for the second time to 4.25%, the highest since 2008. The move was in line with the expectations of the street.
The absence of a statement dictating ‘more hikes are needed further’ indicated that the bigger rate hike regime by the BOC is over and interest rates have reached near neutral one. It is high time that the central bank will evaluate the efforts made by BOC policymakers.
On the oil front, fresh annual lows by West Texas Intermediate (WTI) at $72.00 led by growing signs of recession in the United States have impacted the Canadian Dollar. It is worth noting that Canada is a leading exporter of oil to the US and weaker oil prices impact Canada’s fiscal budget.
- Gold price grinds higher after the two-day winning streak.
- United States 10-year Treasury bond yields dropped to the lowest in three months and drowned the US Dollar.
- Optimism surrounding China adds strength to Gold price but headlines from Russia tests XAU/USD bulls.
- Light calendar, softer US data could offer another mixed trading session.
Gold price (XAU/USD) seesaws around $1,785, after posting the biggest daily gains in a week, as buyers seek more clues to approach the five-month top marked earlier in the week.
The yellow metal’s latest run-up could be linked to the downbeat performance of the United States Treasury bond yields, as well as the US Dollar weakness. In doing so, the Gold price also cheered upbeat headlines from China. It should be noted that the latest pause in the XAU/USD run-up could be linked to fears emanating from Russia.
Gold price trace United States Treasury bonds
A rush towards risk safety could easily be witnessed as the United States Treasury bond prices rallied, together with the Gold price, which in turn drowned the bond yields and the US Dollar. That said, the benchmark 10-year Treasury bond yields dropped to the lowest levels since early September by loosing 3.30% in a day to 3.42% level at the latest. Further, the two-year counterpart dropped 2.54% to 4.26% mark. With this, the US Treasury bond yield curve, the difference between the long-dated and the short-term bond yields, inverted the most in over forty years.
While checking the underlying reasons, the fears of global economic slowdown and the Federal Reserve’s (Fed) readiness to go easy on the interest rate hikes gain the major attention.
In addition to this, the recently softer prints of the United States second-tier data, namely the trade balance and Unit Labour Costs for the third quarter (Q3), become additional catalysts to weigh on the US Dollar and propel the Gold price.
Mixed headlines from China, Russia confuse XAU/USD bulls
China announced multiple measures to ease the three-year-long Zero-Covid policy and bolstered the market sentiment before the risk appetite weakened. The dragon nation’s downbeat prints of the Trade Balance, Imports and Exports seemed to have probed the positive vibes. On the other hand, Russian President Vladimir Putin teased a nuclear war by saying that nuclear weapons could be used to defend itself and its allies.
Light calendar to tease gold traders
Although the softer United States Treasury bond yields and US Dollar keep the Gold buyers hopeful, a lack of major data/events could test the metal’s short-term upside. Even so, the weekly prints of the US Jobless Claims may gain attention after the recent disappointment from the Unit Labour Costs for Q3, which in turn could please the XAU/USD buyers in case of downbeat outcome.
Gold price technical analysis
Gold price flirts with a three-week-old horizontal resistance area surrounding $1,785, after multiple bounces off the 100-bar Simple Moving Average (SMA), close to $1,764 by the press time.
The XAU/USD recovery also takes clues from the firmer Relative Strength Index (RSI) line, placed at 14. Additionally keeping buyers hopeful is the impending bull cross on the Moving Average Convergence and Divergence (MACD) indicator.
That said, the Gold price appears all set to cross the $1,800 threshold. However, an upward-sloping resistance line from early October, around $1,815 at the latest, could challenge the XAU/USD buyers afterward.
Alternatively, pullback remains elusive unless the quote stays beyond the 100-SMA level near $1,764.
Even if the Gold bears manage to conquer the key SMA support, a broad horizontal area comprising levels marked since October 04, close to $1,730-32, will be in focus.
Gold price: Four-hour chart
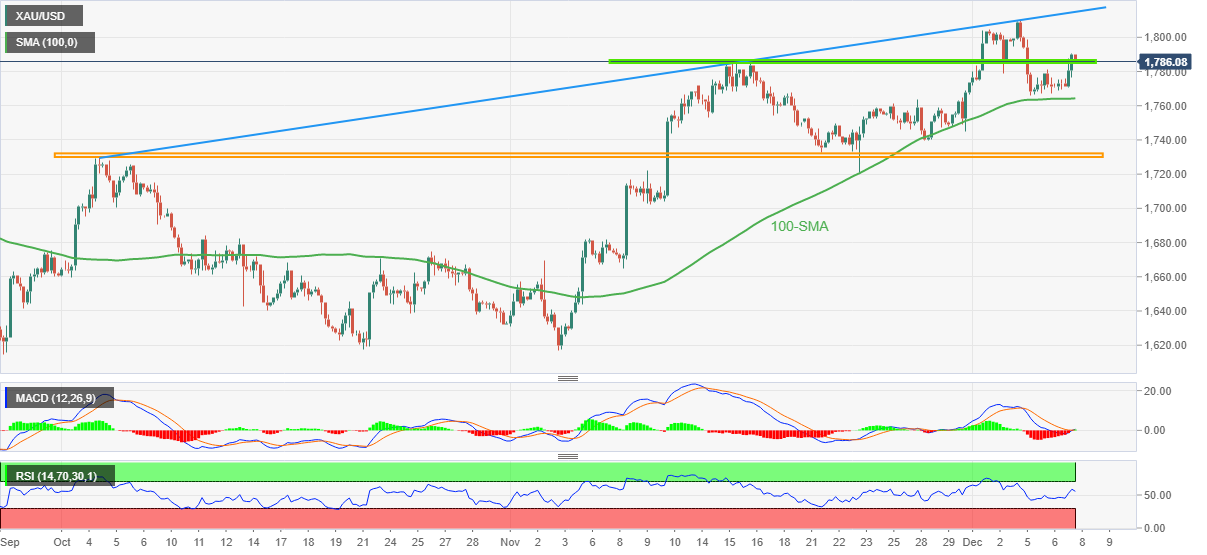
Trend: Further upside expected
- Silver price rallies more than 2.40% on Wednesday due to falling US T-bond yields.
- XAG/USD: Break above $23.00 could open the door for a re-test of an 8-month high.
Silver price bounces off the daily low at $22.10, and prints a fresh two-day high around $22.81, due to broad US Dollar (USD) weakness and falling US Treasury bond yields, as investors seeking safety and pricing in a recession bought US Treasuries. Therefore, the XAG/USD is rallying, trading at $22.72, gaining some 2.49%.
Silver Price Analysis: XAG/USD Technical Outlook
The daily chart shows that the XAG/USD uptrend remains intact. Tuesday’s price action formed an inverted hammer following Monday’s collapse of 3.85%, and even though it closed below near-term support of the December 5 low of $22.17, it climbed sharply on Wednesday.
Like the Relative Strength Index (RSI) and the Rate of Change (RoC), oscillators depict that buyers are gathering momentum. Hence that could prepare the territory for a re-test of the eight-month high at around $23.51.
Therefore, the XAG/USD first resistance would be the psychological $23.00 figure. Above it lies the December 5 swing high of $23.51 (also the 8-month high), which, once broken, could send XAG/USD rallying toward the psychological $24.00.
As an alternate scenario, the XAG/USD first support would be the December 6 swing low of $22.03, followed by the 20-day Exponential Moving Average (EMA) at $21.74, followed by the 200-day EMA at $21.06.

Silver Key Technical Levels
- GBP/USD is looking to shift its business above 1.2200 amid an improvement in investors’ risk appetite.
- The US Dollar will witness a prolonged decline after a policy change by the FOMC from Q1CY2023.
- Concerns over recession due to Fed’s higher interest rate peak guidance have sidelined S&P500.
The GBP/USD pair is aiming to shift its auction profile above the round-level hurdle of 1.2200 in the early Asian session. Earlier, the Cable displayed a firmer recovery after dropping to near 1.2100 on Wednesday. A responsive buying action from the market participants pushed the Cable significantly higher. Investors shrugged off United States data-inspired volatility and cheered the easing Covid-19 lockdown measures in China.
Stellar recovery in the risk appetite theme terminated a two-day recovery in the US Dollar index (DXY). The USD Index sensed extreme selling pressure while attempting to reclaim the critical resistance of 106.00. S&P500 remained sideways but signs of a rebound are available. Meanwhile, the 10-year US Treasury yields witnessed an intense sell-off and dropped to near 3.42%.
Concerns over higher borrowing costs expectations due to fresh strength in the United States economy led by firmer Nonfarm Payrolls (NFP) data and solid demand for the service sector are muddling investors. The market participants are in a fix on whether to cheer strength in the US economy or turn anxious over rising expectations for recession due to higher interest rate peak guidance by the Federal Reserve (Fed) policymakers.
Meanwhile, Economists at the National Bank of Canada believe that the greenback could recover some ground in the near term before sustaining a prolonged decline next year. But for the long term, a stage of prolonged decline will take place after a policy change from the Federal Open Market Committee (FOMC) in the first quarter of CY2023.
Going forward, investors will keep an eye on US five-year Consumer Inflation Expectations, which will release on Friday. Long-term inflation expectations are still anchored as the Fed has already accelerated its interest rates vigorously.
- 1.0550 is capping the bulls that look for space above 1.0600.
- EUR/USD bears eye a break of the micro trendline and below 1.0480 for a downside bias.
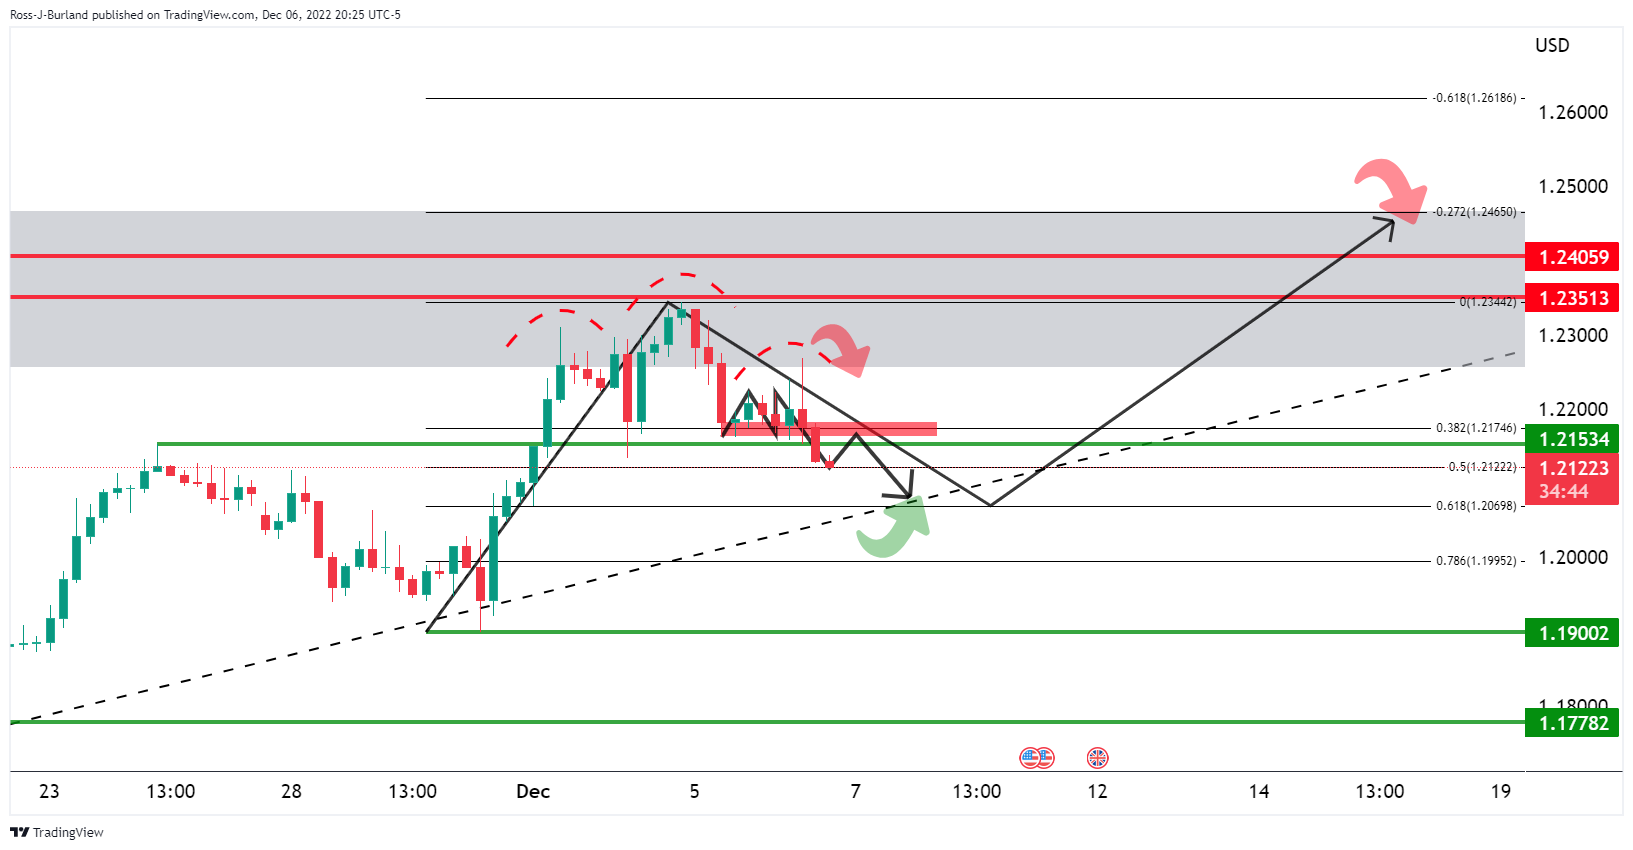
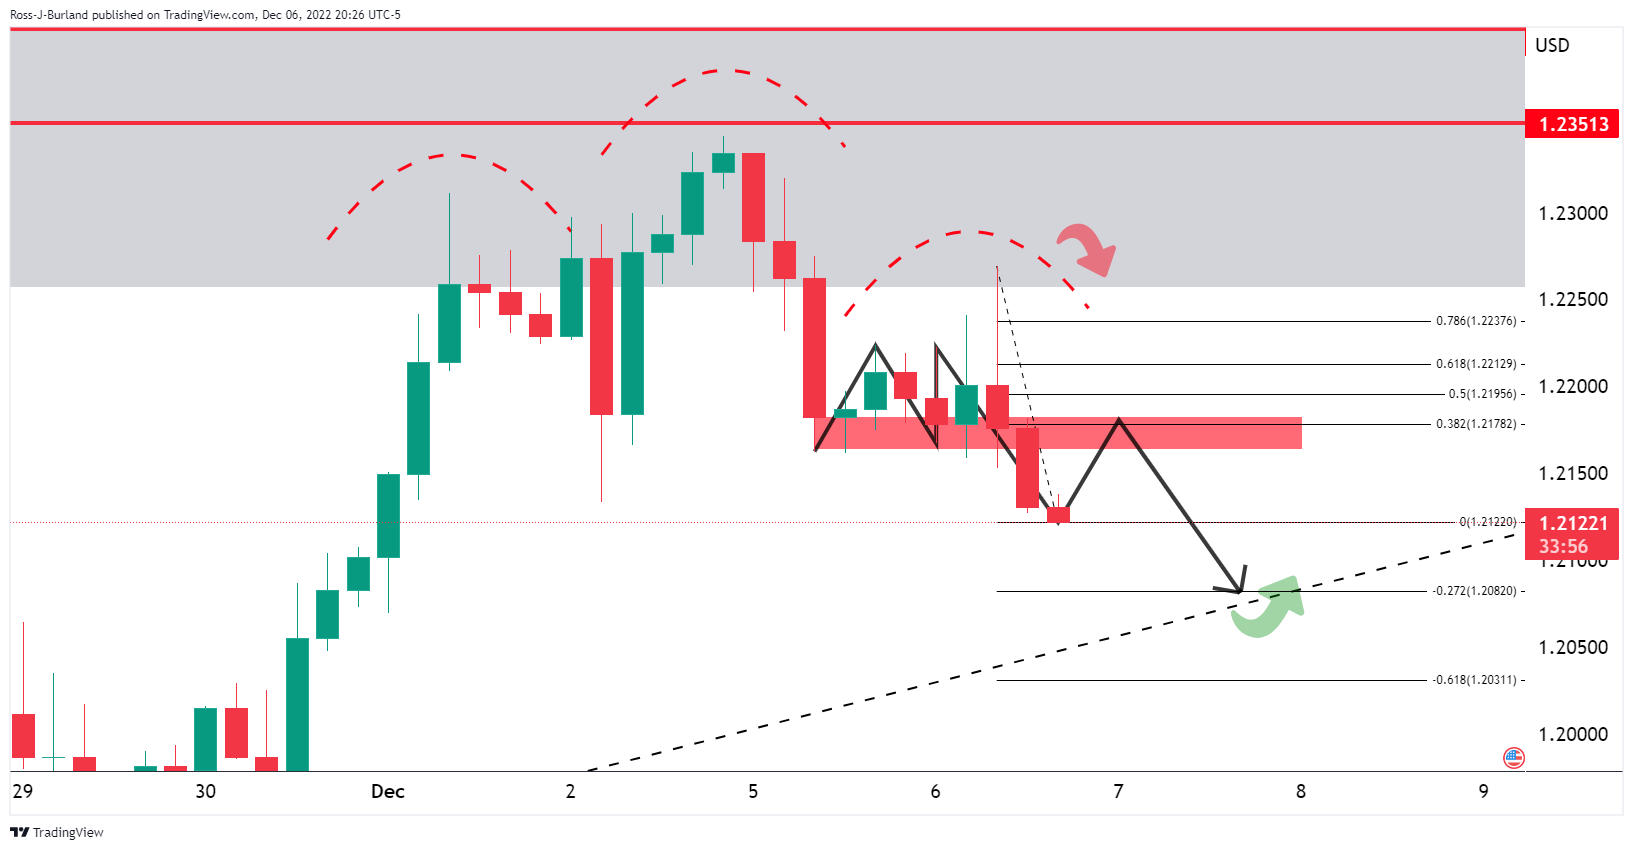
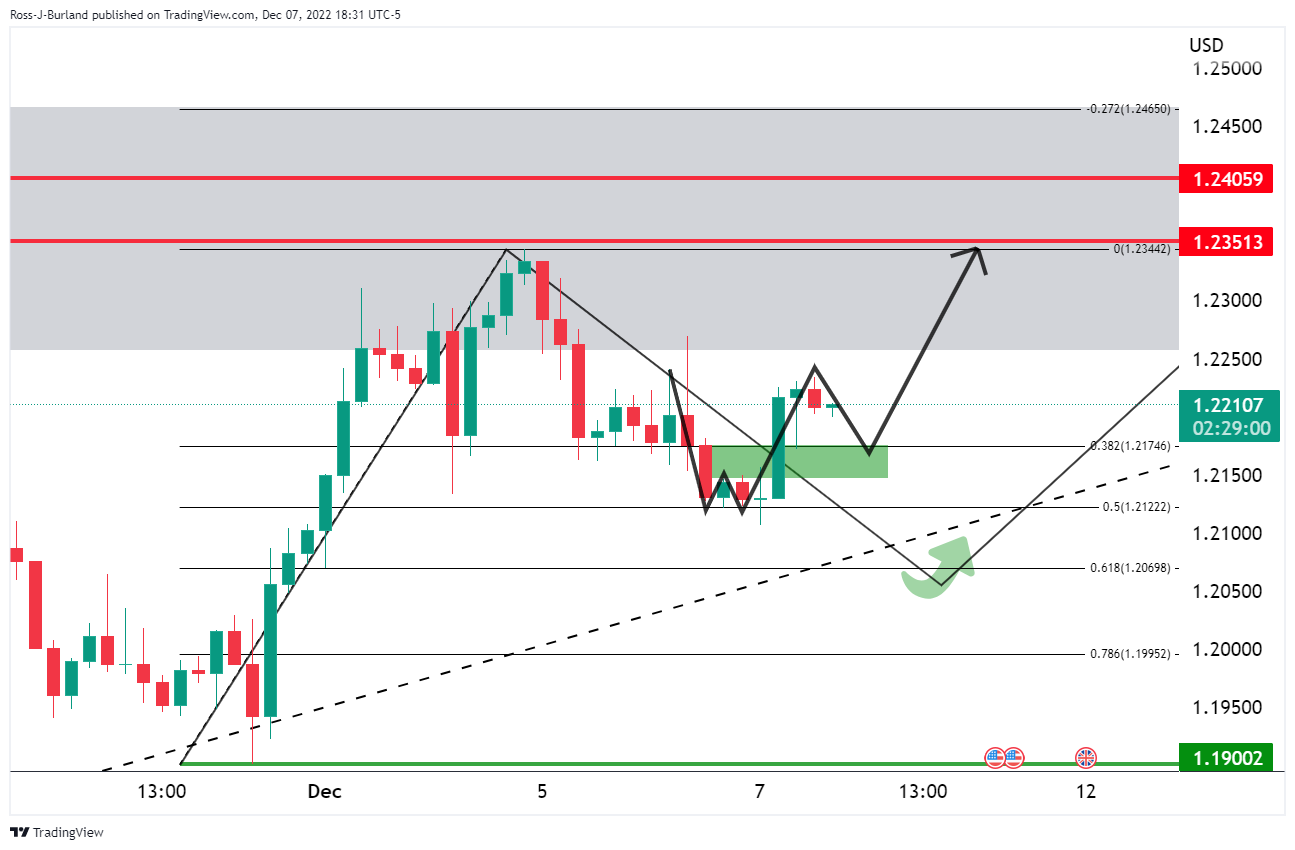
As per the prior analysis, EUR/USD Price Analysis: Bulls eye higher highs in the 1.05 area, whereby an inverse head & shoulders was identified on the daily chart, the price has stayed with the bullish course as follows:
EUR/USD prior analysis
EUR/USD update
The price moved in on the support zone and has found buyers again. The bulls eye an upside continuation with 1.0600 on the radar on a break of the bull cycle highs. A break of the 1.0450s, however, will put the bullish bias into jeopardy and open risk to 1.0350/00 for the foreseeable future as per the hourly chart below:
Bears eye a break of the micro trendline and below 1.0480 for a downside bias.
- USD/JPY drops weighed by falling US 10-year bond yields and a soft US Dollar.
- Weaker than expected, China’s data triggered risk aversion, despite easing Covid-19 restrictions.
- US economic data revealed since last Friday suggests the Federal Reserve has work to do.
USD/JPY tumbles as Wall Street closes after hitting a daily high of 137.85 and a low of 136.21, weighed by broad US Dollar (USD) weakness, as China’s economic data threatens to derail the global economic recovery amidst relaxing Covid-19 restrictions. Those factors amongst demand for US Treasuries sent yields tumbling, undermining the USD/JPY. At the time of writing, the USD/JPY is trading at 136.32.
Risk aversion keeps US equities trading with losses. The US Dollar remains soft in the session, blamed on falling US Treasury yields, with the US 10-year benchmark rate plummeting 11 bps to 3.422%. Meanwhile, the US 10s-2s yield curve inverted the most in 40 years, down at -0.842%, a signal of a possible upcoming recession in the United States.
Aside from this, China reported the Balance of Trade for November, which missed expectations, while Exports plunged 8.7% YoY vs. a 3.5% contraction estimated. Concerning the Covid-19 restrictions, Chinese authorities announced that people with Covid can isolate at home if they have mild or no symptoms. Additionally, PCR tests are no longer needed when visiting most venues.
In the meantime, the last two weeks economic data from the United States (US) has proved the economy’s resilience. An upbeat US employment data, wages rising above the 5% threshold, and The US ISM Services PMI exceeding estimates further cemented the case for the 50 bps rate hike by the Federal Reserve. Also, ahead of the Fed’s decision, inflation data from the US would give USD/JPY traders clues regarding the size of the rate hike.
In the Japanese front, the economic docket will feature GDP Growth Rate for Q3, expected to contract 0.3% MoM, while the annual reading is expected to drop 1.1%. Furthermore, the Current Account Balance is estimated to be ¥623.4B
USD/JPY Key Technical Levels
- NZD/USD firms up on US Dollar weakness as focus switched to the Fed next week.
- China lifted sentiment with the nation announcing some easing in its zero-COVID strategy.
NZD/USD is higher by some 0.75% in the day so far having climbed from a low of 0.6309 to a high of 0.6384 while the US Dollar gives up the prior day's gains as the DXY moves into a key level of resistance ahead of the 106 level.
The greenback is under pressure as news from China lifted sentiment with the nation announcing some easing in its zero-COVID strategy. There were reports that people with Covid can now isolate at home rather than in state facilities if they have mild or no symptoms. They also no longer need to show tests for most venues and can travel more giving risk sentiment a lift mid-week.
Meanwhile, weaker US unit labour costs may have weighed on Wednesday leading to a move in both US bond yields and the greenback. ''The focus remains global, and while we are somewhat sceptical about the sustainability of lower US bond yields given Fed rhetoric, markets clearly want to move onto the next cycle and are fading end-of-cycle factors and hawkish Fed overtones,'' analysts at ANZ Bank said. ''That speaks to volatility going into and in the wake of next week’s Fed meeting; that seems the key takeaway.''
Looking ahead to next week's meeting, Federal Reserve's Chair Jerome Powell most recently said that the US central bank could scale back the pace of its rate increases "as soon as December." Futures contracts tied to the Fed policy rate still imply a 70% chance that central bankers will slow the pace of rate hikes when they meet Dec. 13-14.
The Fed's chair Powell's comments have prompted the market to price in a lower peak interest rate, which Fed funds futures showed on Wednesday was 4.933%, down from a recent high of 5.1%. Markets are now rethinking this to a 5%-5.25% range by May, as per the futures contract prices and the CME Fed watch tool.
Meanwhile, noting that the USD has stopped appreciating and is now in full retreat, analysts at ANZ Bank argued that ''even if the USD has peaked and further depreciation occurs (strengthening the NZD), volatility has picked up and it could be a bumpy ride.''
What you need to take care of on Thursday, December 8:
The US Dollar finishes Wednesday with losses against most of its major rivals, despite a dismal market mood. The decline was contained, but it’s clear that the American currency
Earlier in the day, China announced a series of measures relaxing coronavirus restrictions, moving away from the zero-Covid policy. However, macroeconomic figures were discouraging. The November Trade Balance posted a surplus of $69.84 billion, as exports fell by 8.7%, while imports were down 1.1%. The poor figures exacerbated concerns about global economic progress.
Another risk-off factor came from Moscow, mid-US session. Russian President Vladimir Putin warned t the threat of a nuclear war is rising, adding that nuclear weapons could be used to defend itself and its allies.
The US Treasury yield curve inverted the most in over forty years, amid concerns related to the global economic growth and uncertainty ahead of the looming US Federal Reserve monetary policy decision. Yields finished the day in the red, as demand for government bonds resurged following news coming from Russia. The 10-year note currently yields 3.43%, while the 2-year note pays 4.26%.
The Euro Area Gross Domestic Product came in better than anticipated in the third quarter of the year, posting an annualized growth of 2.3%. The quarterly gain was o 0.3%, better than the 0.2% anticipated. EUR/USD battles the 1.0500 level, trading a handful of pips above it.
The Bank of Canada hiked its benchmark interest rate by 50 basis points to 4.25% as expected. Policymakers noted that there is growing evidence that the tighter monetary policy is training domestic demand while acknowledging inflation remains elevated. The central ban will be considering whether the policy rate needs to rise further. USD/CAD seesawed between gains and losses, ending the day at around 1.3640.
GBP/USD trades just above 1.2200, while AUD/USD hovers around 0.6730. The USD/JPY pair is down to 136.30, while USD/CHF settled at around 0.9400.
Gold benefited from the broad dollar weakness and trades at around $1,787 a troy ounce, while crude oil prices remained under selling pressure. WTI trades at $72.10 a barrel, its lowest since December 2021
Like this article? Help us with some feedback by answering this survey:
- Gold has broken the bullish trendline but is now coming up to test the bearish commitments.
- Bulls eye a move beyond $1,790 on a strong correction that threatens a continuation to the upside.
Gold price is higher on the day having climbed from a low of $1,768.82 and reaching a high of $1,789.05 so far as the US Dollar tails off in the mid-afternoon session in the US.
At the time of writing, XAU/USD is 1% higher at $1,789 as the greenback slides while China announces some easing in its zero-COVID strategy. People with Covid can now isolate at home rather than in state facilities if they have mild or no symptoms. They also no longer need to show tests for most venues and can travel more giving risk sentiment a lift mid-week.
Nevertheless, US equities have struggled for direction as investors digest the recent data of late within the US Federal Reserve officials in the blackout ahead of next week’s meeting. At the start of this week, the Institute for Supply Management (ISM) said its Non-Manufacturing PMI rose to 56.5 last month from 54.4 in October, indicating that the services sector, which accounts for more than two-thirds of US economic activity, remained resilient in the face of rising interest rates. Additionally, last Friday's surprisingly strong Nonfarm Payrolls data in November has raised optimism that a recession could be avoided in 2023.
Meanwhile, the Fed Chair Jerome Powell said last week that the US central bank could scale back the pace of its rate increases "as soon as December," and futures contracts tied to the Fed policy rate still imply a 70% chance that central bankers will slow the pace of rate hikes when they meet Dec. 13-14.
The Fed's chair Powell's comments have prompted the market to price in a lower peak interest rate, which Fed funds futures showed on Wednesday was 4.933%, down from a recent high of 5.1%. Markets are now rethinking this to a 5%-5.25% range by May, as per the futures contract prices and the CME Fed watch tool.
Gold technical analysis
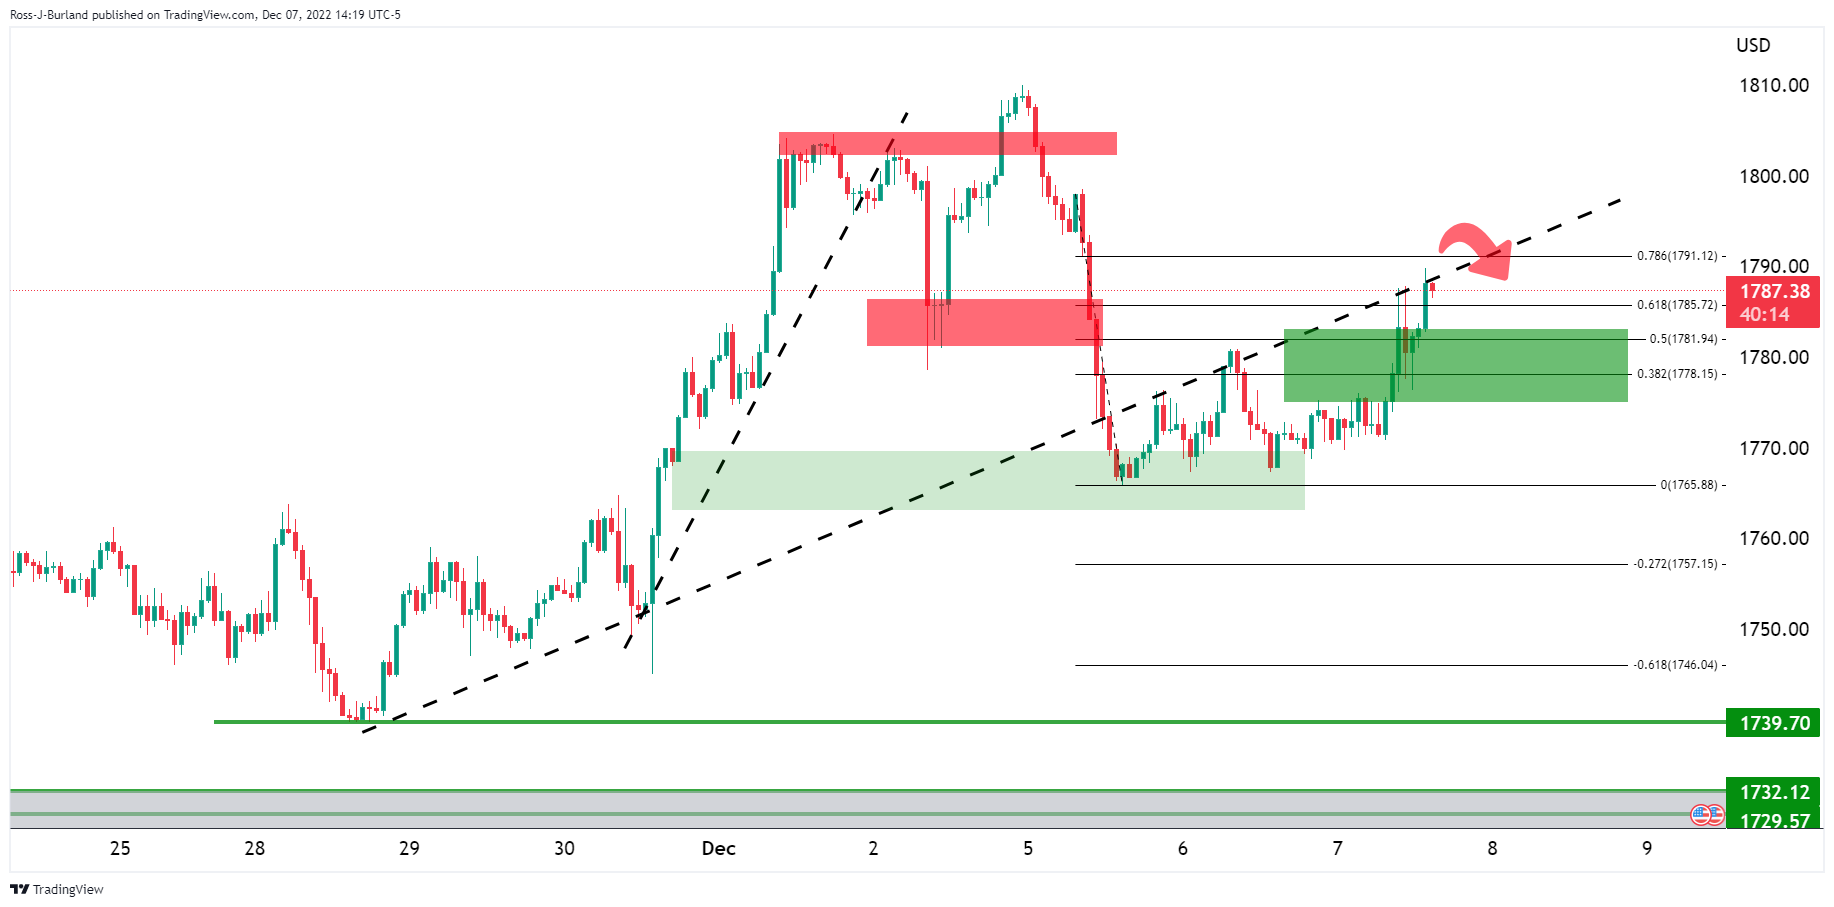
Gold has broken the bullish trendline but is now coming up to test the bearish commitments near $1,790 on a strong correction that threatens a continuation to the upside.
- Broad US Dollar weakness across the board, a headwind for the USD/CHF.
- A falling wedge in the USD/CHF daily chart suggests the pair might break upwards
- USD/CHF: A break below 0.9326 might pave the way to 0.9300; otherwise, a rally to 0.9400 is on the cards.
The USD/CHF extends its losses for two consecutive trading sessions, down by a minuscule 0.22%, after hitting a daily high of 0.9437. At the time of writing, the USD/CHF is trading at 0.9396, as the US Dollar Index (DXY) plunges 0.51%.
USD/CHF Price Analysis: Technical outlook
From a daily chart perspective, the USD/CHF daily chart suggests the pair is downward biased. Since mid-November, the USD/CHF has formed a falling wedge, a bullish continuation chart pattern, which appeared, following the massive swing from around 2022 highs of 1.0147, towards the last week’s 0.9326 low. Therefore, the USD/CHF might consolidate between the wedge boundaries before breaking upwards/downwards.
Oscillators give mixed signals, with the Relative Strength Index (RSI) aiming downwards, while the Rate of Change (RoC) portrays selling pressure fading. Unless the USD/CHF breaks below 0.9326 and poses a challenge to break the wedge on the downside, that could lay the ground for a test of the 0.9300 figure.
As an alternate scenario, the USD/CHF first resistance would be the 0.9400 figure, followed by the September 13 daily low-turned-resistance at 0.9479, followed by the wedge’s top-trendline at 0.9505, and the 20-day Exponential Moving Average (EMA) At 0.9510.
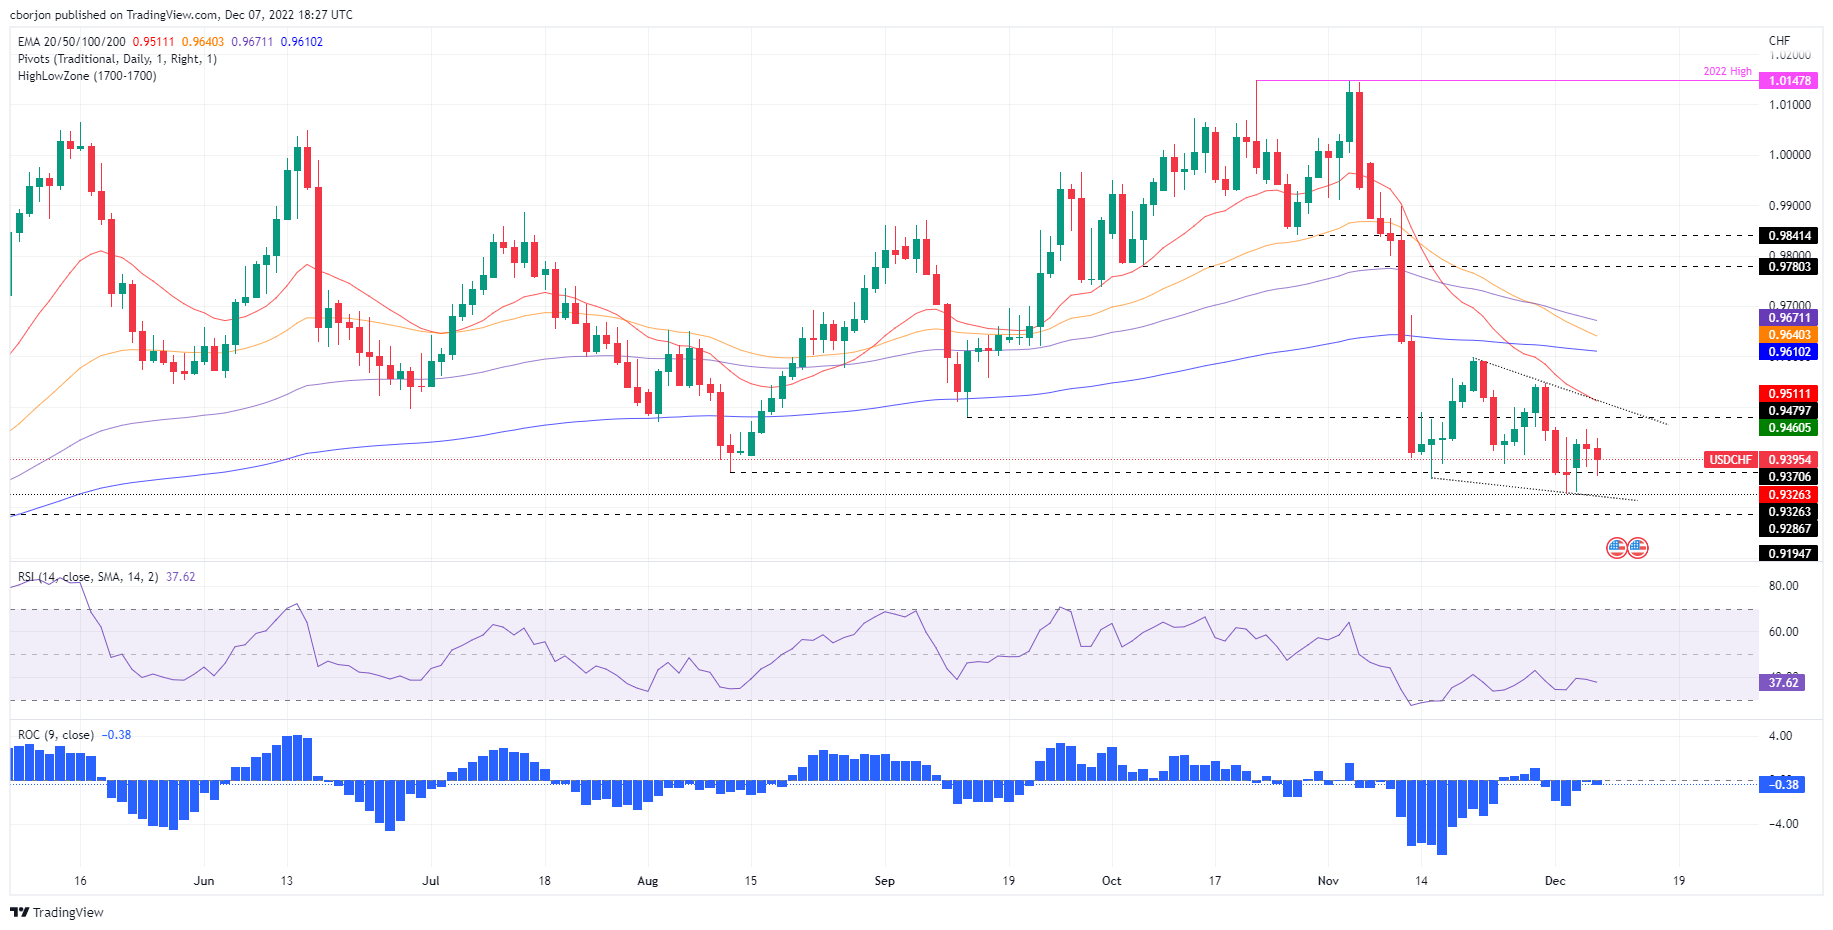
USD/CHF Key Technical Levels
- AUD/USD holds on positive grounds despite risk-off mood.
- The Australian economy expanded less than expected in the third quarter, eyes stay on data.
AUD/USD is higher on the day having climbed from a low of 0.6668 and reaching a high of 0.6734 so far. News that authorities have loosened some of the country's zero-COVID rules sparked a risk on mood in Asia that followed through into North American markets on Wednesday. The greenback has weakened amid concerns that rising interest rates could push the US economy into recession.
Investors have cheered the news that China is preparing its people to live with the disease, although there are still fears that the US central bank might stick to a longer rate-hike cycle which is weighing on US equities on Wednesday.
At the start of this week, the Institute for Supply Management (ISM) said its Non-Manufacturing PMI rose to 56.5 last month from 54.4 in October, indicating that the services sector, which accounts for more than two-thirds of US economic activity, remained resilient in the face of rising interest rates.
The data beat forecast the Non-manufacturing PMI would fall to 53.1. While the data combined with last Friday's surprisingly strong Nonfarm Payrolls data in November had raised optimism that a recession could be avoided in 2023, investors are concerned that the Fed will subsequently hike rates by 75 Bps again at the December meeting.
Last Friday's surprisingly strong Nonfarm Payrolls data in November had also raised optimism that a recession could be avoided in 2023, yet investors are concerned that the Fed will subsequently hike rates by 75 Bps again at the December meeting which is a weight on high beta currencies such as the Aussie. More economic data, including weekly jobless claims, the Producer Price Index and the University of Michigan's Consumer Sentiment survey are due this week that will be watched for clues on what to expect from the Fed on Dec. 14.
Meanwhile, the Australian Dollar was facing some pressure overnight after data showed that the Australian economy expanded less than expected in the third quarter as persistent inflation and rising interest rates dampened consumption. The data follows the comments from the Reserve Bank of Australias Governor Philip Lowe who said that “the size and timing of future interest rate increases will continue to be determined by incoming data.”
- Weaker-than-expected economic data in China threatens to derail economic growth and trigger risk aversion.
- Federal Reserve pressured by Solid US economic data released since last Friday and US inflation data looming.
- GBP/USD: Remains upward biased, could test Tuesday’s high of 1.2269 ahead of 1.2300.
The British Pound (GBP) turned positive despite overall risk aversion triggered by China’s exports weakening. Additionally, the latest headlines involving Russian President Vladimir Putin, saying that “the threat of nuclear war is increasing,” bolstered the US Dollar (USD), giving another leg-down to the GBP/USD pair. Nevertheless, the Sterling has recovered, and the GBP/USD is trading at 1.2215, above its opening price, after reaching a high of 1.2226.
Exports in China plunged, sparking global recession fears
Sentiment remains deteriorated after China’s Trade Balance data weakened, showing that Exports plunged 8.7% YoY, below estimates of 0.3% contraction. Economic data since the second half of the last week from the United States (US) showed that the labor market remains tight and that wages are rising, a signal that is not going to be liked by Federal Reserve (Fed) Chair Jerome Powell. Given that Powell’s speech last Wednesday gave the green light to lower interest rate hikes, further inflation data to be revealed this Thursday with the Producer Price Index (PPI) and next week’s Consumer Price Index (CPI) would be crucial to assess the following week’s rate hike by the Federal Reserve.
The lack of economic data on the United Kingdom (UK) front keeps the Pound Sterling adrift to US Dollar dynamics. However, it appears that the political drama spurred during the premiership of Lizz Truss has abated so far, due to a fiscally responsible budget, by the new Prime Minister Rishi Sunak. Nevertheless, it should be said that the UK economy is “likely” already in recession, and a gloomy outlook with labor shortages, wage inflation, Brexit jitters, and weak investment, could hurt the prospects for higher GBP/USD spot prices.
In the next week, the Federal Reserve and the Bank of England are expected to raise rates by 50 bps, leaving interest rates differentials unchanged. What could rock the boat is the Summary of Economic Projections (SEP) released by the Fed, which will update Fed officials’ projections for the Federal Fund rates (FFR). A higher peak for the FFR would be hawkish and could spur US Dollar strength towards the end of 2022.
GBP/USD Price Analysis: Technical outlook
The GBP/USD daily chart suggests the pair remains upward-biased after bouncing off the 200-day Exponential Moving Average (EMA) at 1.2104. Geopolitical headlines linked to Putin and nuclear war issues spurred a flight to safety, but nerviosism faded as the GBP/USD approaches Tuesday’s high of 1.2269. Therefore, the GBP/USD next resistance level would be 1.2269, followed by the psychological 1.2300. As an alternate scenario, the GBP/USD first support would be 1.2200, followed by the 200-day EMA at 1.2104 and the 20-day EMA at 1.2048.
On Wednesday, the Bank of Canada (BoC) raised its key interest rate by 50 bases points to 4.25%, in line with market consensus. Analysts at CIBC, point out the BoC sounded more cautious. They see the central bank plateauing at the 4.25% level.
Key Quotes:
“The Bank of Canada flashed a yellow card on its rate hiking team by sounding more cautious about its willingness to press on to even higher interest rates in 2023, even as it tightened today. As we expected, the Bank lifted the overnight rate by 50 basis points to 4.25%, but having previously concluded these messages by saying that rates “will need to rise further,” it now says only that it will “be considering whether the policy interest rate needs to rise further”.
“We see the overnight rate plateauing at this 4.25% level, but unlike what financial markets have been presuming in the last couple of weeks as bond yields tumbled, we expect the Bank of Canada to keep the overnight rate there through 2023, and ease only gradually in 2024.”
“We expect to see enough further evidence that demand growth is slowing to keep the Bank on hold in Q1, but even then, the Bank might want to leave the door ajar for a later hike by retaining the wording it used today. Indeed, it might not be until the spring of 2023, when we've put a couple of quarters of negligible growth behind us and have clearer signs of economic slack, when the language of these statements changes to indicate that the Bank is no longer "considering" further hikes.”
“We see the Fed pressing on to higher rates than the Bank of Canada, so a strengthening in the loonie awaits a general turn to a weaker US dollar globally, something we expect to see as we get to the end of the Fed's hiking cycle in Q1 2023.”
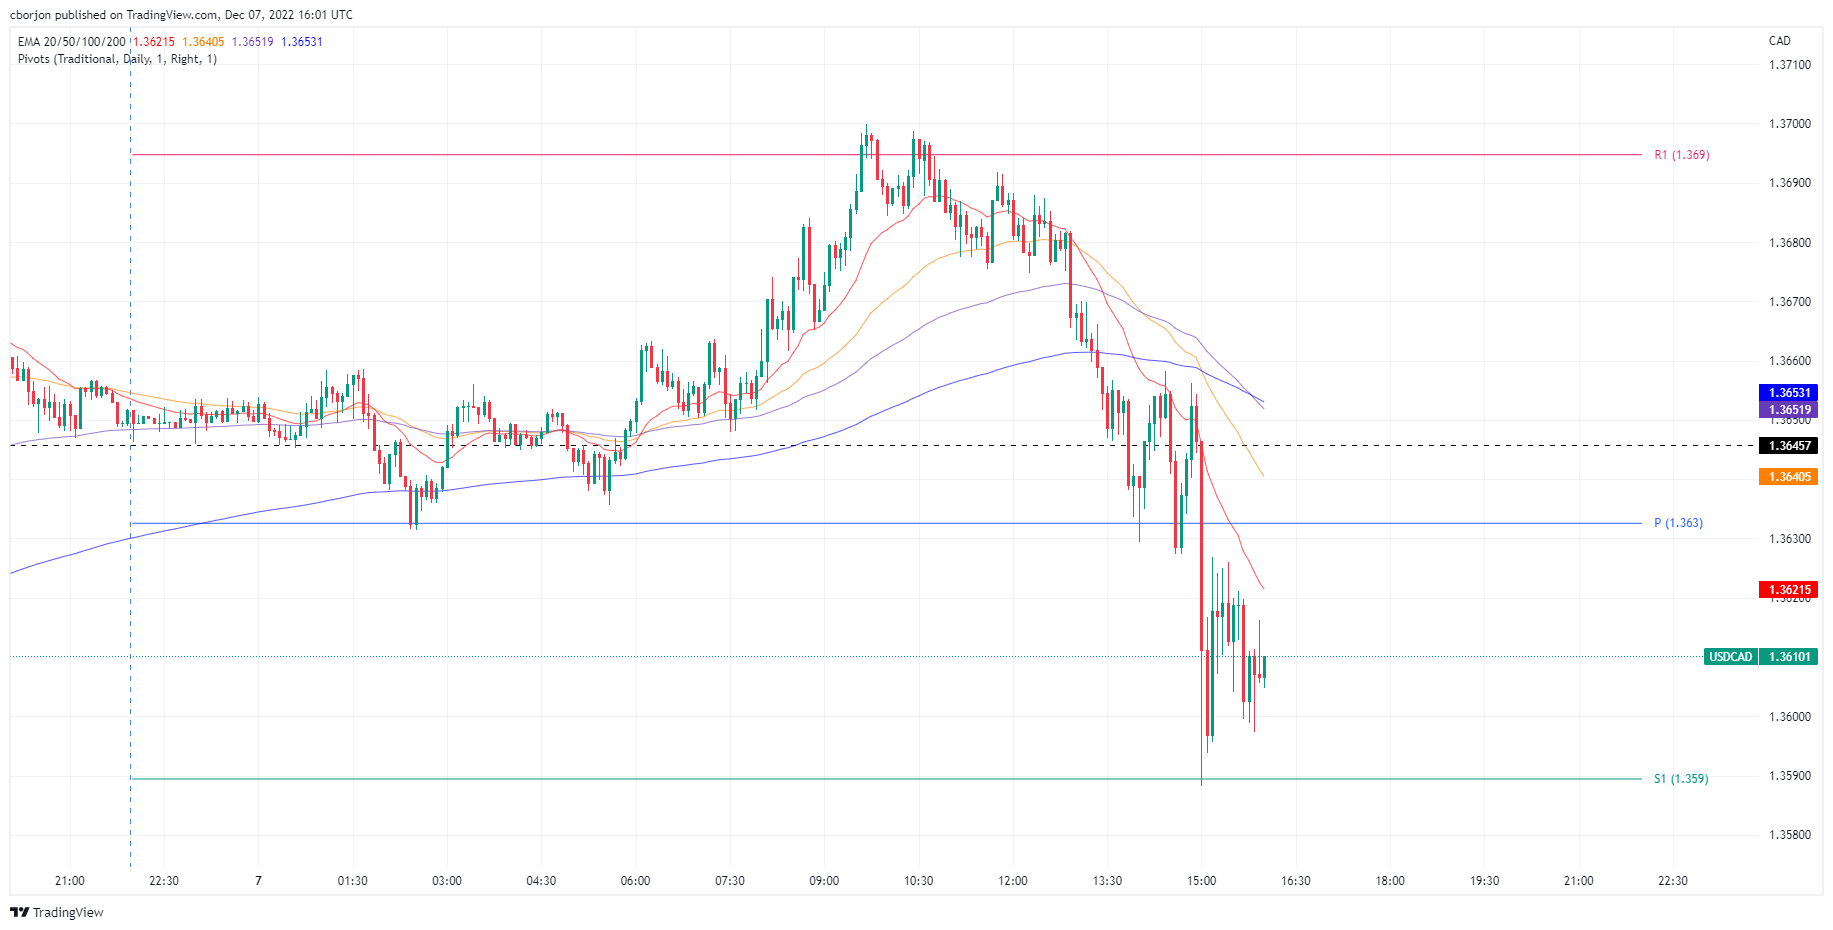
- The Loonie appreciates against the US Dollar following the Bank of Canada 50 bps rate hike.
- The Bank of Canada expects further tightening as core CPI persists at 5%.
- After the BoC’s decision, the USD/CAD tumbled from around 1.3660 to its daily low of 1.3588.
The USD/CAD tumbled during the North American session after the Bank of Canada (BoC) lifted rates by 50 bps, from 3.75% to 4.25%, in line with analysts’ expectations, triggering a fall from around 1.3700 to 1.3505. At the time of writing, the USD/CAD remains volatile, trading around 1.3600-1.3615.
Bank of Canada remarks of its monetary policy statement
The Bank of Canada mentioned that inflation worldwide remains high and broadly based. Even though growth is slowing, the BoC said that the US economy is proving to be resilient, with consumption rising and the labor market “overheated.” They commented that supply bottlenecks are easing, though geopolitical events could disrupt it.
The BoC acknowledged that the labor market is tight, and the Q3 GDP was stronger than expected and commented that “there is growing evidence that tighter monetary policy is restraining domestic demand, consumption moderated in the third quarter, and housing market activity continues to decline.”
The Governing Council noted that inflation remains too high, and short-term inflation expectations remain elevated. Traders should know that CPI is at 6.9%, while core CPI is around 5%.
The BoC finished its statement by saying that further rate hikes would be needed to bring supply and demand into balance, adding that Quantitative Tightening (QT) “is complementing increases in the policy rate.”
USD/CAD Reaction to the Bank of Canada decision
The USD/CAD 5-minute chart portrayed the pair as seesawing around the daily pivot point at 1.3630 and the 1.366 area before the decision crossed newswires. After the headline, the USD/CAD tumbled towards its daily low of 1.3587 before stabilizing in the 1.3600-1.3620 range, below the 20-Exponential Moving Average (EMA) at 1.3623.
- Russian President Putin warns of increased nuclear war risks.
- Market sentiment deteriorates briefly after comments, then rebounds.
- EUR/USD up for the day but off highs.
The EUR/USD dropped below 1.0500 following comments from Russian President Putin. The Euro is among the weakest currencies of the American session. Earlier it peaked at 1.0549, the highest level in two days.
A choppy session
Market sentiment deteriorated briefly after Russian President Vladimir Putin said the threat of nuclear war is on the rise. He added they have the most advanced weapons but they don’t want to use them. He considers it possible using nukes as a response to an attack.
Wall Street is moving between gains and losses. The S&P 500 is up 0.28%, after falling during the previous four trading days. Crude oil prices are back in negative territory. The US Dollar is mixed, with the DXY down 0.35%, off lows.
Unclear signs
The Euro is rising versus the US Dollar after two consecutive daily losses, recovering from the three-day lows. The main trend remains bullish with a focus on the 1.0600 area which is the critical resistance for the moment. On the flip side, the key area is seen around the 1.0400 area; before that level support levels are seen at 1.0480 and then 1.0440.
As of writing, EUR/USD is hovering around 1.0500, up for the day but off highs. The 20-hour Simple Moving Average stands at 1.0480 and a slide below would change the intraday bias to bearish.
Technical levels
Gold showed an extremely positive performance in the month of November. However, economists at Commerzbank do not expect the yellow metal to hold its gains.
Fragile recovery of Gold price
“The potential for further gains is likely to gradually diminish. Even though the rate hike cycle will end in the foreseeable future, interest rates will probably remain at the elevated level they will then have reached for quite some time after.”
“Rate cuts would presumably require inflation to fall significantly and lastingly and to approach the Fed’s inflation target of 2% again. Powell says that this will necessitate a restrictive interest rate level for a prolonged period. If interest rate expectations increase any further following the upcoming Fed meeting because the Fed believes a higher rate level to be necessary, Gold could come under pressure.”
“The same would happen if the USD were to appreciate again. A foretaste of this came following the publication of a much more buoyant ISM Non-Manufacturing Index than anticipated. It caused the Gold price to slide by around $40.”
The trade-weighted US Dollar index has suffered its worst monthly depreciation since 2009. Economists at the National Bank of Canada believe that the greenback could recover some ground in the near term before sustaining a prolonged decline next year.
US Dollar appears oversold
“The US Dollar appears oversold and we would expect a partial retracement in the coming weeks.”
“Looking ahead to next year, we still anticipate a policy change from the FOMC in the first quarter of 2023, which would set the stage for a more prolonged decline in the greenback.”
Russian President Vladimir Putin said on Wednesday that the threat of a nuclear war is on the rise, as reported by Reuters.
Key takeaways
"Russia will defend its allies with all available means."
"Russia does not have tactical nuclear weapons in other countries unlike the United States."
"We didn't speak about usage of nuclear weapons."
"Russia has not gone mad."
"We have most advanced weapons, but do not want to wave them around."
"Russia considers such weapons as deterrent."
Market reaction
These comments don't seem to be having a significant impact on risk perception. As of writing, the S&P 500 Index was virtually unchanged on the day at 3,940.
Measured since the middle of November the Pound is the second best performing G10 currency after the NZD. Going forward, the question is whether these gains are sustainable? Economists at Rabobank expect GBP/USD to turn back lower in 2023.
Potential for further sharp dips in Cable next year
“We expect choppy conditions in Cable and for near-term activity to be mostly guided by movement in the USD.”
“While we are not expecting to see Cable re-visit it post mini-budget low in the coming months, we do see the potential for further sharp dips in Cable next year. This assumes another wave of concerns regarding heightened energy costs for Europe looking ahead to winter 2023 which would pressure European currencies vs. the greenback.”
“We continue to view GBP as vulnerable as see strong risk that Cable will spend much of next year below 1.20.”
- Japanese Yen rises across the board on American hours as stocks slide and bonds rise.
- DXY turns negative and extends losses toward 105.00.
- USD/JPY retreats after hitting weekly highs.
The USD/JPY broke below the 137.55 area and fell to 136.39, printing a fresh daily low. The pair is retreating from weekly highs amid a weaker US Dollar. It is trading modestly lower for the day, after rising for two consecutive days.
Data released on Wednesday, showed an increase in Unit Labor Cost in the US during the third quarter of 2.4%, below the 3.2% of markets consensus. Nonfarm Productivity rose by 0.8% surpassing expectations of an increase of 0.5%. On Thursday, Jobless Claims data is due and on Friday, the Producer Price Index. Next week, on Tuesday, is the Consumer Prices Index and on Wednesday the FOMC decision.
Equity prices in Wall Street are falling modestly, with the S&P 500 down 0.25%, on its way to the fifth decline in a row. At the same time, US yields are also lower. The 10-year Treasury bond yield stands at 3.44%, the lowest since mid-September.
The rally in Treasuries and the decline in equity prices are boosting the Japanese Yen which is among the top performers of the American session. On the contrary, the US Dollar is falling across the board. The DXY is down by 0.43%, approaching 105.00.
USD/JPY downside contained so far by 136.30
The decline in USD/JPY found support around 136.30, a relevant support. Below the 20-Simple Moving Average in four-hour charts emerges at 136.15. So a confirmation under 136.15 would point to more losses for the pair targeting initially 135.55.
The US Dollar needs to break and hold above 137.70/80 in order to open the doors to 138.00 and more.
Technical levels
- Sentiment shifted negatively on weaker Exports from China as recession fears increased.
- Economic data revealed in the United States warrants further Federal Reserve tightening.
- Gold Price Forecast: Reclaiming $1780, put in play a test to $1800.
Gold price climbs back above $1770 amidst a risk-off impulse due to negative data from China increasing concerns of a global recession, while worldwide central banks continue to raise borrowing costs. The last rounds of economic data released in the United States (US), depicting a resilient economy, add pressure on the Federal Reserve (Fed) to act. Nevertheless, the US Dollar (USD) edges lower, a tailwind for the yellow metal. At the time o typing, the XAU/USD is trading at $1783., after hitting a low of $1768.
China’s exports tumbled, spurring recession woes
US equities fall, depicting a risk-off mood. Data released in the Asian session that China’s exports plunged 8.7% YoY in November, well beneath the 3.5% contraction expected, triggered pessimism that the economy would further slow down, despite Chinese authorities relaxing Covid-19 restrictions.
Economy in the United States remains resilient, pressures the Federal Reserve
Recent data from the United States had shown that the Federal Reserve would need to continue to tighten monetary policy. The US economy adding 263K new jobs, as demonstrated by November’s Nonfarm Payrolls (NFP) report, showed the tightness of the labor market. Additionally, Average Hourly Earnings jumped by 5.1% YoY vs. 4.9%, adding to inflationary pressures.
In the meantime, the ISM Non-Manufacturing PMI grew by 56.6, exceeding forecasts of 53.3, bolstered by the holiday season. According to Bloomberg analysts, “the price subindex confirmed the inflationary impulse in services is still strong despite more widespread disinflation in goods sectors.”
Federal Reserve to diggest PPI, Consumer Sentiment, and next week’s CPI
Given the backdrop mentioned above, the next week’s Federal Reserve Open Market Committee (FOMC) meeting would be crucial, albeit the Federal Reserve Chair Jerome Powell gave the green light on 50 bps rate hikes. However, with US data looming, like the Producer Price Index, the University of Michigan (UoM), and the following week’s Consumer Price Index (CPI), it would shed some cues about inflation elevating or easing.
Gold Price Forecast: XAU/USD Technical Outlook
From a technical perspective, Gold remains upward biased. However, after breaching the $1800 figure last Friday, the yellow metal failed to capitalize on broad US Dollar weakness, as XAU/USD tumbled below the $1800 mark. Gold buyers’ lack of strength is well portrayed by the Relative Strength Index (RSI), registering a series of lower peaks, while price action is aimed upwards. Also, the Rate of Change (RoC) confirms buying momentum is fading.
Nevertheless, Gold’ was capped around $1766, and XAU/USD is back above $1780, eyeing a break of the November 15 swing high at $1786.53. If XAU/USD breaches the latter, the next resistance will be the $1800 figure. The break above will expose the June 17 daily high at $1857.20, followed by the June 13 pivot high at $1879.45.
The Bank of Canada (BoC) announce that it hiked its benchmark interest rate by 50 basis points to 4.25% following the December policy meeting. This decision came in line with the market expectation. In its policy statement, the BoC said that it will be considering whether the policy rate needs to rise further.
Market reaction
With the initial reaction, USD/CAD edged lower and was last seen losing 0.3% on the day at 1.3610.
Key takeaways from policy statement
"There is growing evidence that tighter monetary policy is restraining domestic demand."
"Three-month rates of change in core inflation have come down in an early indicator that price pressures may be losing momentum."
"Inflation is still too high and short-term inflation expectations remain elevated."
"Data since October monetary policy report support the bank's outlook that growth will essentially stall through the middle of 2023."
"Inflation around the world remains high and broadly based."
"Global economic growth is slowing, although it is proving more resilient than predicted in October Monetary Policy Report."
"Gradual easing of global supply bottlenecks continues, although further progress could be disrupted by geopolitical events."
"Q3 Canada GDP was stronger than expected, the economy continues to operate in excess demand; labor market remains tight."
Although it has recovered from some of its recent losses, the Loonie has performed disappointingly over the past month. Looking ahead, economists at the National Bank of Canada expect the CAD to outperform the USD in 2023.
Imminent pause by the Bank of Canada
“The improvement in inflationary trends sets the stage for an imminent pause by the BoC to assess the impact of previous rate hikes. Such a pause would certainly help allay fears of a recession and a prolonged period of house price deflation.”
“We sill see the possibility of a significant appreciation of the CAD against the greenback in 2023.”
S&P 500 is starting to turn more decisively lower. Analysts at Credit Suisse now look for a closing break below 3938 to complete a short-term top.
Initial resistance seen at 3984
“We look for a sustained move below 3938 to confirm that a top is in place to clear the way for further weakness to 3868/58 initially, which is the 38.2% retracement of the October/December rally. Whilst we would look for this to hold at first, below in due course should see the 63-day average at 3835 next, with the ‘measured top objective’ seen at 3775.
“Big picture, we maintain our base case the October/December has been a bear market rally only.”
“Resistance is seen at 3984 initially, with 3999/4015 now ideally capping. Above can see a recovery back to 4042/52.”
Since the end of August through to now, the Pound is the top performing G10 currency, having advanced 4.9%. However, economists at MUFG Bank expect GBP underperformance from here.
Underperformance set to re-emerge
“It is the imminent economic disruption from strikes that could soon start to undermine sentiment once again. We are not convinced market participants have priced appropriately the disruptions that are coming and if these strikes materialise as scheduled, the hit to confidence and growth could be notable. Train operators, Royal Mail, nurses in the NHS, ambulance technicians, bus drivers, road maintenance workers, Heathrow ground handlers, the Eurostar, and civil servants are all scheduled to strike in December and announced strikes of nearly 50 days have so far been confirmed with more yet to be announced.”
“The global risk-on that has been evident since mid-October looks to be coming to an end while domestic specific factors here in the UK will likely undermine confidence further with December kicking off the winter with severe disruptions and with more to come.”
- The index keeps the bearish noted unchanged near 105.00.
- The favourable risk-on mood continues to weigh on the dollar.
- US yields add to Tuesday’s decline across the curve.
The greenback, when measured by the USD Index (DXY), remains under pressure and near the 105.00 neighbourhood on Wednesday.
USD Index weaker on stronger risk appetite
The index probes the area of 2-day lows in the 104.90/85 band midweek, as investors’ preference for the risk complex seems to have gathered extra pace in response to further re-opening in China.
In line with the daily retracement in the dollar, US yields accelerate the decline to new multi-week lows in the belly and the long end of the curve, while the short end trade in 3-session lows so far.
In the calendar, MBA Mortgage Applications contracted 1.9% in the week to December 2, while Consumer Credit Change is due later in the NA session.
What to look for around USD
The dollar remains offered as investors seem to have digested the recent hawkish messages from some Fed’s policy makers as well as above-expectations results from some US fundamentals.
While hawkish Fedspeak maintains the Fed’s pivot narrative in the freezer, upcoming results in US fundamentals would likely play a key role in determining the chances of a slower pace of the Fed’s normalization process in the short term.
Key events in the US this week: MBA Mortgage Applications, Consumer Credit Change (Wednesday) – Initial Jobless Claims (Thursday) – Producer Prices, Advanced Michigan Consumer Sentiment, Wholesale Inventories (Friday).
Eminent issues on the back boiler: Hard/soft/softish? landing of the US economy. Prospects for further rate hikes by the Federal Reserve vs. speculation of a recession in the next months. Fed’s pivot. Geopolitical effervescence vs. Russia and China. US-China persistent trade conflict.
USD Index relevant levels
Now, the index is retreating 0.47% at 105.06 and the breakdown of 104.11 (monthly low December 5) would open the door to 103.41 (weekly low June 16) and finally 101.29 (monthly low May 30). On the other hand, the next hurdle comes at 105.82 (weekly high December 7) seconded by 107.19 (weekly high November 30) and then 107.99 (weekly high November 21).
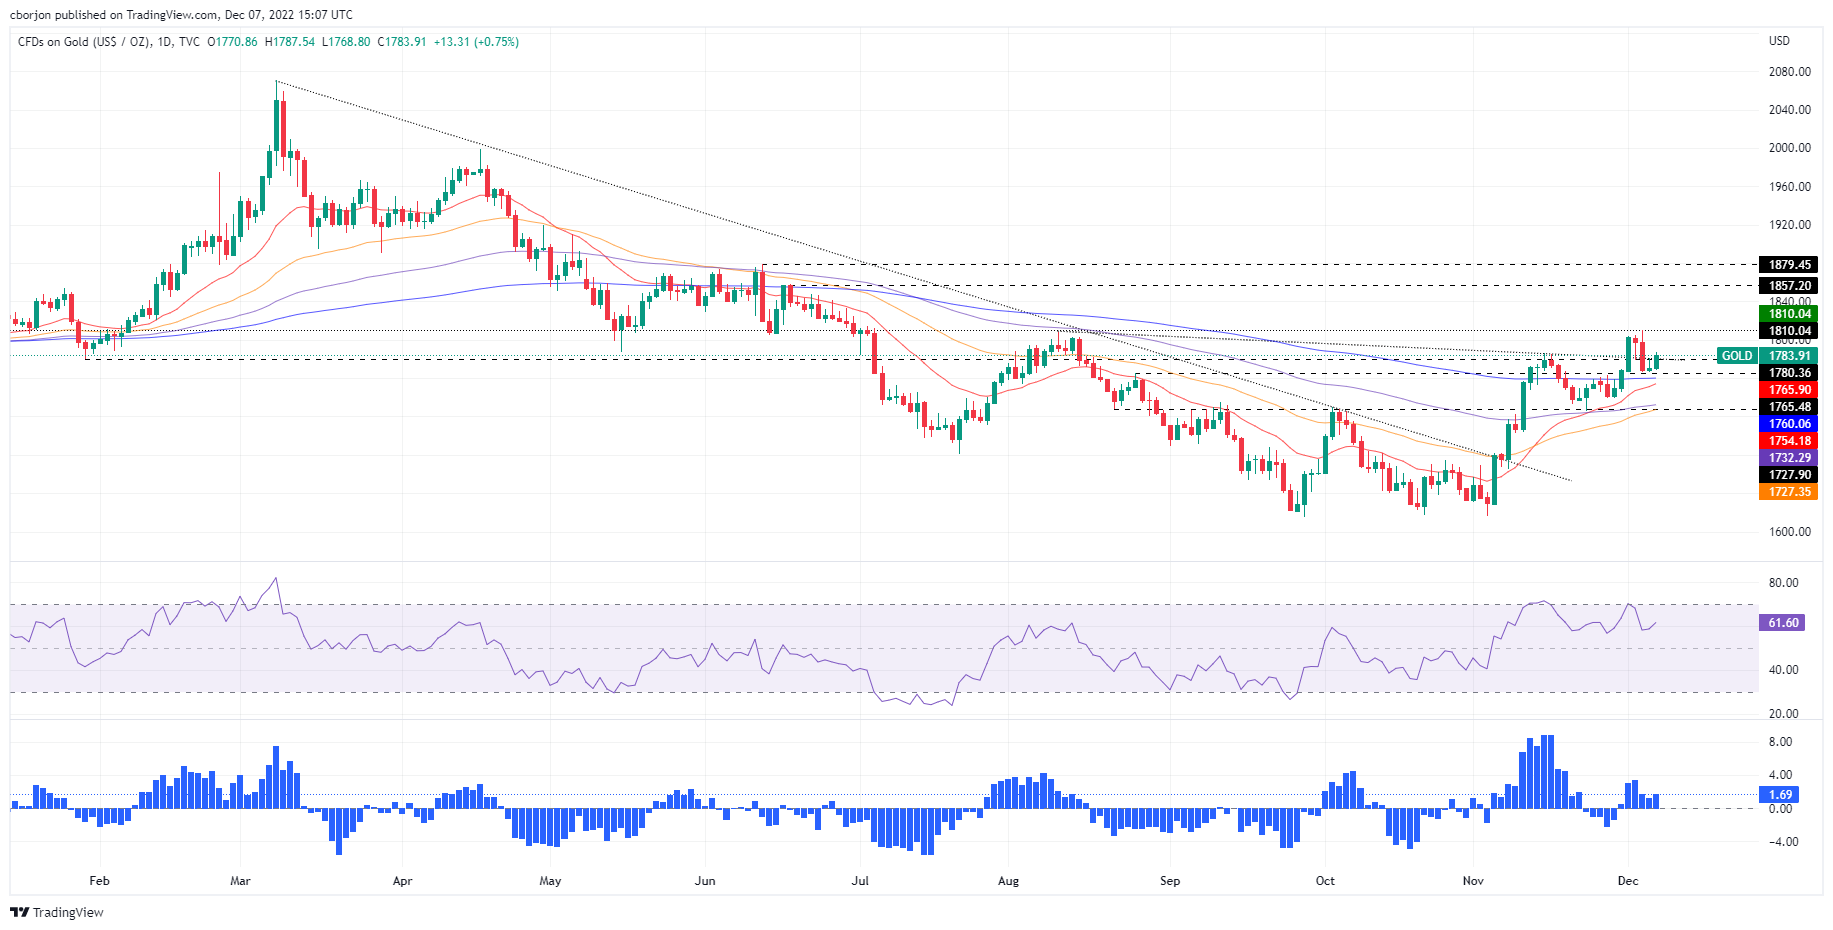
Gold continues to fluctuate in a narrow range near $1,770. The yellow metal needs a weekly close above the 200-Day Moving Average (DMA) at $1,796 to see further gains, strategists at Credit Suisse report.
Move below support at $1,729 to ease the immediate upward bias
“Gold remains capped by the crucial 200DMA, currently seen at $1,796 and we expect a consolidation to emerge from here. Below support at $1,729 though is needed to ease the immediate upward bias in the range with support seen next at the 55DMA at $1,698.”
“A weekly close above $1,796 would be seen to open the door to a more meaningful recovery for a rise to the 50% retracement of the 2022 fall at $1,843 next, then the $1,877 June high.”
Alvin Liew, Senior Economist at UOB Group, comments on the latest results from Retail Sales in Singapore.
Key Takeaways
“Singapore’s retail sales continued to rise in Oct but by a more subdued 0.1% m/m SA, 10.4% y/y (from 3.2% m/m, 11.3% y/y in Sep), but it was still the seventh consecutive month of double-digit on-year growth. Excluding motor vehicle sales, the m/m increase was more pronounced at +0.8%, (but still a significant slowdown from 4.1% in Sep), translating to a 14.3% y/y increase (from 16.9% y/y in Sep).”
“Delving into the details of the latest retail sales growth, five of the 14 main segments recorded m/m decreases in Oct, up from four in Sep. As for the Oct y/y increase, it was due to larger growth in some retail sales segments including wearing apparel & footwear, food & alcohol, department stores and watches & jewellery. The estimated total retail sales value rose further to S$4.0 bn (from a decent S$3.8bn for Sep) and continued to signal an improving domestic retail and F&B environment in tandem with a tighter labour market, pent-up demand from the re-opening and more importantly, a return of tourist demand.”
“Outlook – Year-to-date, retail sales grew by 11.3% y/y. We continue to expect domestic retailers to enjoy domestic and external support, complemented by the return of major events such as various sports, concerts and BTMICE activities (Business Travel and Meetings, Incentive Travel, Conventions and Exhibitions) attracting tourist arrivals, while the tight domestic labour market will also contribute to domestic consumption demand. End-year festive demand is another positive. Importantly, households will likely front-load big ticket item purchases in Nov and Dec ahead of the GST hike from 7% to 8% on 01 Jan 2023."
"The key downside is elevated inflation pressures that may increasingly curb discretionary spending of households. The low base effect is also likely to fade going into 4Q 22, rendering less uplift. Barring the re-emergence of fresh COVID19 or other health-related risks in Singapore and around the region (leading to re-imposition of social and travel restrictions, which is not our base case), we continue to project retail sales to expand by 10% in 2022 which implies a more moderate forecast of around 6.0% retail sales growth in 4Q22. That will help support our projected 2.5% y/y services growth for 4Q 22. We have conservatively penciled in a 2.3% retail sales growth for 2023."
GBP/USD finds firm support in low 1.21 region. Economists at Scotiabank expect the pair to continue trading on a solid foot.
Intraday support is 1.2085/95
“Fundamental news is thin on the ground and what little there is is not that encouraging (lower house prices, more strikes on the way), suggesting gains are perhaps more technically inspired than anything else today, at least.”
“The underlying trend in the Pound looks constructive – higher highs and higher lows on the daily chart – with Pound also supported by constructive trend momentum signals.”
“Intraday support is 1.2085/95. Resistance is 1.2220.”
- EUR/USD rises to 2-day highs and revisits the 1.0550 zone.
- Further upside is expected to meet the next barrier at 1.0614.
EUR/USD reverses the weekly leg lower and reclaims the 1.0500 barrier and above on Wednesday.
Further upside in the pair is now likely to pick up pace following the recent surpass of the 200-day SMA and the 10-month resistance line. Against that, there are no resistance levels of note until the June high at 1.0614 (June 27).
Further upside in EUR/USD remains on the cards while above the 200-day SMA, today at 1.0355.
EUR/USD daily chart
BoC Monetary Policy Decision – Overview
The Bank of Canada (BoC) is scheduled to announce its monetary policy decision this Wednesday at 15:00 GMT. The Canadian central bank is widely expected to lift its benchmark rate by 50 bps to 4.25% at the end of the November meeting amid elevated inflation, robust economic activity and a super-tight jobs market. Investors will take cues from the accompanying monetary policy statement in the absence of the post-meeting press conference.
Analysts at ING offer a brief preview of the central bank event and write: “Both markets and economists are split down the middle on whether it will be a 25 bps or 50 bps hike. We favour the latter given a robust 3Q GDP outcome, the tight jobs market and the ongoing elevated inflation readings. But we acknowledge there are signs of softening in the economy. The housing market is looking vulnerable and Canadian households are more exposed to higher rates than elsewhere due to high borrowing levels so we recognise this is a very close call. We are getting very close to the peak though, which we think will be 4.5% in 1Q 2023.”
How Could it Affect USD/CAD?
Ahead of the key risk, the USD/CAD pair touches a fresh one-month high, albeit struggles to capitalize on the move beyond the 1.3700 round-figure mark. A modest US Dollar pullback from the weekly top acts as a headwind for spot prices. Furthermore, an intraday recovery in crude oil prices from the YTD low offers some support to the commodity-linked Loonie and caps the upside for the major.
The BoC is unlikely to hint towards a more aggressive tightening. Moreover, any dovish signals by the Canadian central bank will be enough to exert additional downward pressure on the domestic currency. This, in turn, suggests that the path of least resistance for the USD/CAD pair is to the upside. Spot prices seem poised to surpass the 1.3700 mark and test the next relevant hurdle near the 1.3740 zone. The momentum could get extended towards reclaiming the 1.3800 round figure.
Key Notes
• Bank of Canada Preview: The end of the tightening cycle is around the corner
• BoC Preview: Forecasts from nine major banks, very close call
• USD/CAD Forecast: Move beyond 1.3700 remains on the cards, BoC decision awaited
About the BoC Interest Rate Decision
BoC Interest Rate Decision is announced by the Bank of Canada. If the BoC is hawkish about the inflationary outlook of the economy and raises the interest rates it is positive, or bullish, for the CAD. Likewise, if the BoC has a dovish view on the Canadian economy and keeps the ongoing interest rate, or cuts the interest rate it is seen as negative, or bearish.
- Unit Labor Costs in the US rose less than expected in the third quarter.
- US Dollar Index stays in negative territory near 105.00.
Unit Labor Costs in the nonfarm business sector rose by 2.4% in the third quarter of 2022, the US Bureau of Labor Statistics (BLS) reported on Wednesday. This reading came in lower than the market expectation for an increase of 3.2%.
Further details of the publication revealed that Nonfarm Productivity rose by 0.8% in the same period, compared to the market expectation of 0.5%.
Market reaction
These figures don't seem to be having a significant impact on the US Dollar's performance against its major rivals. As of writing, the US Dollar Index was down 0.4% on the day at 105.15.
USD/CAD has broken trend resistance at 1.3585. Therefore, economists at Scotiabank expect the pair to advance well above the 1.38 level.
Weakness back below needed to temper gains
“Spot gains above short-term trend resistance off the Oct high (1.3585) leave the USD with a clearer path to retest 1.38+ from here.”
“Resistance is 1.3805 and 1.3970/75.”
“Support is 1.3645 and 1.3585; weakness back below here is needed to temper USD gains.”
USD/JPY preserves its bullish momentum and climbs above 137.00. Economists at BBH note that the pair could test last week’s high near 140.
BoJ Board Member Nakamura remains dovish
“USD/JPY is trading at the highest level since December 1 near 137.65 and a clean break above 137.50 sets up a test of last week’s high near 140.”
“Bank of Japan Board Member Nakamura said the bank needs to continue with monetary easing as the economy is still recovering from the pandemic. He warned that tightening monetary policy could bring back deflation as the economy still has a negative output gap. Lastly, Nakamura said that is not yet time for a BoJ policy review. These comments are consistent with Kuroda’s earlier this week and support our view that the BoJ is on hold for the time being.”
- NZD/USD gains some positive traction amid a modest USD pullback from the weekly high.
- Hawkish Fed expectations, rising US bond yields should help limit losses for the greenback.
- Recession fears weigh on investors’ sentiment and might cap gains for the risk-sensitive Kiwi.
The NZD/USD pair edges higher for the second straight day on Wednesday, albeit struggles to capitalize on the move and remains confined within the previous day's trading range. Nevertheless, the pair sticks to its intraday gains through the early North American session and is currently placed near the daily top, just below mid-0.6300s.
Having failed to find acceptance above the very important 200-day SMA, the US Dollar retreats from a multi-day peak touched earlier today and offers some support to the NZD/USD pair. The USD, for now, seems to have stalled this week's goodish recovery move from over a five-month low, though hawkish Fed expectations should help limit the downside.
The recent upbeat US macro data suggests that the economy remains resilient despite rising borrowing costs and fuel speculations that the Fed may lift rates more than projected. This, in turn, pushes the US Treasury bond yields higher, which, along with a generally weaker tone around the equity markets, should offer support to the safe-haven buck.
Despite the latest optimism over the easing of COVID-19 restrictions in China, worries about a deeper global economic downturn continue to weigh on investors' sentiment. The fundamental backdrop favours the USD bulls and warrants some caution before placing aggressive bullish bets around the NZD/USD pair amid the absence of any relevant market-moving economic data.
Traders might also prefer to move to the sidelines and wait for next week's key US data/even risk - the release of the US consumer inflation figures and the highly-anticipated FOMC policy meeting. Market participants will look for fresh clues about the Fed's rate-hike path, which will influence the USD and provide a fresh directional impetus to the NZD/USD pair.
Technical levels to watch
EUR/USD regains 1.05 area. Economists at Scotiabank to extend its stretch higher above the 1.0525 zone.
Underlying trend signals are tilting bullish
“Relatively resilient growth and stubborn inflation expectations (the ECB’s Oct survey showed a rise in 12m inflation expectations to 5.4%, from 5.1%) will keep policy makers in tightening mode (50 bps priced in for the Dec 15th meeting), underpinning the EUR.”
“Underlying trend signals are tilting bullish, which is helping limited EUR drawdowns and bolster support on weakness.”
“Support is 1.0430/35. Resistance above 1.0525 is 1.0595/00.”
The Bank of Canada (BoC) is expected to raise its policy rate by 50 basis points to 4.25%. Such a decision could spark knee-jerk buying in the Loonie, economists at Société Générale report.
BoC rate decision is a toss-up between 25 bps and 50 bps
“The BoC rate decision is a toss-up between 25 bps and 50 bps today but we suspect the bank may opt for the latter after GDP growth surpassed expectations in 3Q thanks in part to strong exports.”
“Money markets are pricing in about 33 bps today so 50 bps to 4.25% or 125 bps above 2-3% neutral rate band would be a surprise and could spark knee-jerk buying in the Loonie.”
See – BoC Preview: Forecasts from nine major banks, very close call
- The index comes under pressure after faltering in the 105.80 region.
- A breakout of the 200-day SMA is needed to allow for extra recovery.
DXY now looks offered after two daily drops in a row and following an unsuccessful attempt to retest the 1.0600 region earlier in the session on Wednesday.
A sustainable close above the 200-day SMA at 105.67 should provide extra legs to the index and the possibility to extend the recovery to, initially, the weekly high at 107.19 (November 30).
Below the 200-day SMA, the dollar’s outlook should remain negative.
DXY daily chart
- EUR/JPY looks firm and advances to multi-day highs past 144.00.
- Further upside now looks at the weekly high past 146.00.
EUR/JPY rapidly leaves behind Tuesday’s pullback and advances north of the 144.00 hurdle to clinch fresh multi-session peaks on Wednesday.
Further upside now appears on the cards and the cross could now challenge the weekly high at 146.13 (November 23) in the relatively short term.
The outlook for EUR/JPY is expected to remain positive while above the 200-day SMA, today at 139.31.
EUR/JPY daily chart
EUR/USD rose to the highest levels since June, at around 1.0595, by the start of this week. Still, economists at Credit Suisse stick to their 1.0130-1.0610 range set for the rest of 2022.
Not yet minded to try to fade range extremes
“As things stand, we are not yet minded to try to fade the topside of our anticipated EUR/USD 1.0130-1.0610 range, even if this week’s highs get re-tested.”
“As well as positioning, lower oil prices, an improved China story and possible strong euro area wage data are near-term risks.”
- Silver finds support near $22.00 and stalls this week’s pullback from a multi-month high.
- The technical set-up favours bullish traders and supports prospects for additional gains.
- A sustained break below $21.00 will negate the near-term positive bias for the XAG/USD.
Silver attracts fresh buyers on Wednesday and steadily climbs back closer to the mid-$22.00s during the mid-European session.
Looking at the broader picture, this week's sharp retracement slide from the highest level since late April stalls near the $22.00 round-figure mark. The said handle coincides with the 200-hour SMA and should act as a pivotal point, which if broken decisively will set the stage for a deeper corrective decline.
The XAG/USD might then accelerate the fall towards the $21.40 support zone. This is closely followed by the very important 200-day SMA, around the $21.30-$21.25 region, and the $21.00 mark. The latter should act as a strong base for spot prices, which if broken decisively will negate the near-term positive outlook.
That said, oscillators on the daily chart are holding comfortably in the bullish territory and have again started gaining positive traction on hourly charts. This, in turn, supports prospects for the emergence of some dip-buying at lower levels, which should help limit any meaningful near-term fall for the XAG/USD.
Meanwhile, any subsequent move up beyond the overnight swing high, around the $22.60 area, is likely to confront stiff resistance near the $23.00 mark. A sustained strength beyond should lift the XAG/USD to the multi-month peak, around the $23.50-$23.55 zone. Some follow-through buying should pave the way for additional gains.
Bulls might then aim to reclaim the $24.00 round-figure mark for the first time since April. The positive momentum could get extended and lift the XAG/USD further towards the next relevant hurdle around the $24.25-$24.30 zone en route to the $24.55-$24.60 region.
Silver 1-hour chart
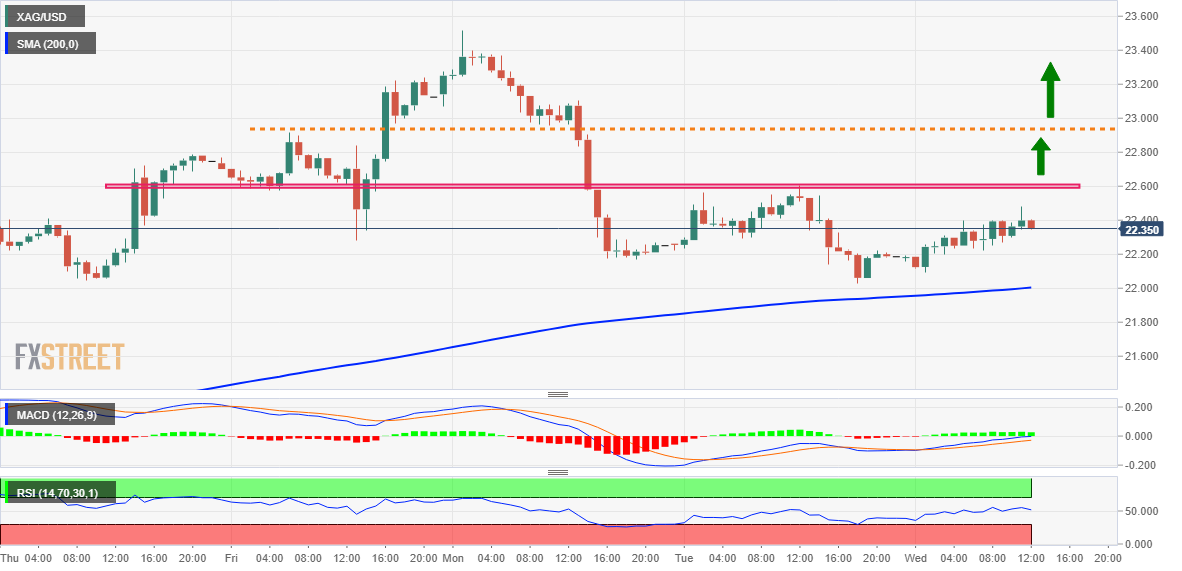
Key levels to watch
The Bank of Canada (BoC) will announce monetary policy today. A 50 bps hike would likely send CAD higher, but the FX reaction should be short-lived, economists at ING report.
Not many long-term implications for CAD
“The consensus is split between a 25 bps and 50 bps hike, but we believe a half-point move looks more appropriate given strong economic activity and a very tight labour market. Still, we admit it is a very close call given that the expected economic slowdown and fragility of the Canadian housing market argue for a smaller rate increase.”
“In our base-case 50 bps scenario, the Canadian Dollar should rally on the back of the hawkish surprise. However, we don’t see the BoC impact on CAD to be very long-lasting, as external factors remain more important.”
“A sustained recovery in CAD from these levels undoubtedly requires a rebound or at least a stabilisation in oil prices. Today, USD/CAD could trade back below 1.3600, but short-term upside risks remain high.”
See – BoC Preview: Forecasts from nine major banks, very close call
UOB Group’s Senior Economist Julia Goh and Economist Loke Siew Ting assess the latest inflation figures in the Philippines.
Key Takeaways
“Headline inflation accelerated for the third straight month to a 14-year high of 8.0% y/y in Nov (from +7.7% in Oct), matching our estimate but surpassing Bloomberg consensus’ 7.8% gain. It was driven by higher prices of almost all consumer price index (CPI) components, particularly food, passenger transport services, restaurants & accommodation, and personal care services, amid a weak currency (PHP) during the month.”
“Given that the year-to-date inflation (+5.6%) has exceeded our full-year target of 5.5% and Dec inflation is likely to jump further to 8.5% y/y, we tweak our 2022 full-year inflation estimate to 5.9% (from 5.5% previously, BSP est: 5.8%). But we maintain our inflation projection for 2023 at 4.5% (BSP est: 4.3%), in view of base effects, impact of restrictive monetary policy on consumption, and a weaker global growth next year.”
“Record headline and core inflation readings in Nov have reinforced the case for a 50bps hike in the overnight reverse repurchase (RRP) rate when the BSP’s Monetary Board meets next Thu (15 Dec). It will mark the final meeting of this year, taking the RRP rate to 5.50%. However, it is unlikely to mark the end of BSP’s rate hike cycle as yet given that the US Fed signaled a higher terminal rate for longer, and the Philippine inflation would remain above BSP’s 2.0%-4.0% medium-term target range through 1H23. We reiterate our RRP rate projection of 50bps hike in 1Q23 (+25bps each in Feb and Mar 2023), before taking a pause at 6.00% thereafter.”
- GBP/USD gains some positive traction amid a modest USD pullback from the weekly top.
- A combination of factors should limit deeper USD losses and cap the upside for the pair.
- Hawkish Fed expectations and a softer risk tone should act as a tailwind for the greenback.
The GBP/USD pair shows some resilience below a technically significant 200-day SMA and attracts some buyers near the 1.2100 mark on Wednesday. The intraday uptick pushes spot prices to a fresh daily high, around the 1.2175-1.2180 region during the mid-European session, though any meaningful positive move seems elusive.
The US Dollar struggles to find acceptance above the very important 200-day SMA and for now, seems to have stalled this week's goodish recovery move from over a five-month low. This, in turn, is seen as a key factor acting as a tailwind for the GBP/USD pair. Meanwhile, the intraday USD pullback from a fresh weekly high lack any obvious fundamental catalyst and is likely to remain limited amid hawkish Fed expectations.
The recent upbeat US macro data suggests that the economy remains resilient despite rising borrowing costs and fuel speculations that the Fed may lift rates more than projected. This acts as a tailwind for the US Treasury bond yields and should lend support to the buck. Apart from this, the cautious mood - amid growing recession fears - supports prospects for the emergence of some buying around the safe-haven USD.
The market sentiment remains fragile amid worries about a deeper global economic downturn. This is evident from a softer tone around the equity markets, which tends to drive some haven flows towards the greenback. In the absence of any major market-moving economic releases, the fundamental backdrop warrants some caution before placing aggressive bullish bets around the GBP/USD pair and positioning for any further gains.
Technical levels to watch
Bank of Japan (BoJ) Board Member Toyoaki Nakamura said that it would be premature to tweak the monetary policy. Thus, economists at Commerzbank maintain a beairsh bias on the Japanase Yen.
BoJ supports JPY bears
“BoJ Board member Nakamura today once again encouraged the JPY bears (that means us too). According to his speech text, he said that the BoJ needs to continue with monetary easing persistently. He pointed out that inflation in Japan did not yet have an impact on wages. Hence, next spring's shift in wages has to be carefully monitored.”
“For the time being, we maintain that no significant turnaround in Japanese monetary policy could be expected in such an environment and therefore see the JPY with only limited appreciation potential.”
Senior Economist Alvin Liew reviews the release of US November’s Nonfarm Payrolls.
Key takeaways
“The US jobs creation engine again exceeded expectations, adding 263,000 jobs in Nov while the jobless rate stayed at 3.7% (same as Oct), even as labor force participation rate dipped 0.1pt to 62.1%, matching the lowest this year while the unemployed numbers fell by 48,000 to 6.01 million. Wage growth accelerated in Nov, to 0.6% m/m, 5.1% y/y (above Bloomberg estimates and Oct prints).”
“The Nov jobs report pointed to continued hiring momentum in most sectors and wage growth back above 5% in a still tight labor market environment, reinforcing the case for the Federal Reserve (Fed) to keep to its hiking stance at the Dec FOMC. That said, we and the markets still assign a high probability the Fed will dial down the rate hike magnitude to 50-bps in Dec.”
Economists at Credit Suisse revise their December forecast for the USD/CNH pair to 6.80-7.10, from the previous range of 7.05-7.35.
Headline risks and heightened CNH volatility could persist
“It is too early to say precisely when China’s transition to ‘living with Covid’ will yield positive results in economic data and domestic demand.”
“Year-end illiquidity means that headline risks and heightened CNH volatility could persist.”
“We revise our December forecast for USD/CNH to 6.80-7.10 (from the previous range of 7.05-7.35).”
See – USD/CNH: Solid support lines up at 6.9300 – UOB
The Bank of Canada’s (BoC) last meeting of the year today is likely to attract considerable attention. USD/CAD climbed to a monthly high of 1.3677 on Tuesday. A small rate step and a not very hawkish statement could weigh on the Loonie, economists at Commerzbank report.
More than a large rate step needed to once again fuel rate hike expectations
“Will the Loonie be able to benefit if the BoC surprises with a large rate step? We do not consider the prospects of that to be particularly promising. The CAD was unable to benefit from the recent labour market data. As a result of the falling oil price, it recorded losses against USD.”
“It is likely to take more than a large rate step to once again fuel rate hike expectations. The BoC would probably have to signal at the same time that more needs to be done about inflation risks, so that an end of the rate cycle is not yet in sight and adjust its projections accordingly.”
“The combination of a small rate step and a not very hawkish statement and projections might lead to disappointment and thus to further CAD losses.”
See – BoC Preview: Forecasts from nine major banks, very close call
- EUR/USD leaves behind the recent weakness and revisits the 1.0480 region.
- Germany’s Industrial Production contracted 0.1% MoM in October.
- EMU Flash GDP Growth Rate surprised to the upside in Q3.
The European currency regains the smile and pushes EUR/USD back to the 1.0480/85 band on Wednesday.
EUR/USD appears supported near 1.0440
EUR/USD manages to regain some upside traction following two consecutive daily retracements amidst alternating risk appetite trends and a so far inconclusive price action around the dollar.
In the German money markets, the 10-year bund yields extend the side-lined theme around the 1.80% region, while their American peers show the same range bound performance.
In addition, the single currency is deriving extra support from auspicious results from the euro calendar, where the GDP Growth Rate in the broader Euroland is now seen expanding 0.3% QoQ and 2.3% YoY in Q3.
Data wise in the US, weekly Mortgage Applications are due along with Consumer Credit Change results.
What to look for around EUR
EUR/USD seems to have bottomed out in the 1.0440 region so far and now intends to reclaim the 1.0500 mark and above amidst a tepid rebound and a directionless dollar.
In the meantime, the European currency is expected to closely follow dollar dynamics, the impact of the energy crisis on the region and the Fed-ECB divergence. In addition, markets repricing of a potential pivot in the Fed’s policy remains the exclusive driver of the pair’s price action for the time being.
Back to the euro area, the increasing speculation of a potential recession in the bloc emerges as an important domestic headwind facing the euro in the short-term horizon.
Key events in the euro area this week: EMU Flash Q3 GDP Growth Rate (Wednesday) – ECB Lagarde (Thursday).
Eminent issues on the back boiler: Continuation of the ECB hiking cycle vs. increasing recession risks. Impact of the war in Ukraine and the protracted energy crisis on the region’s growth prospects and inflation outlook. Risks of inflation becoming entrenched.
EUR/USD levels to watch
So far, the pair is gaining 0.13% at 1.0475 and is expected to meet the next up barrier at 1.0584 (monthly high December 5) ahead of 1.0614 (weekly high June 27) and finally 1.0773 (monthly high June 27). On the other hand, the breach of 1.0355 (200-day SMA) would target 1.0330 (weekly low November 28) en route to 1.0222 (weekly low November 21).
- Q3 GDP growth for the Euro area got revised higher.
- EUR/USD continues to trade in a tight channel below 1.0500.
Seasonally adjusted Gross Domestic Product (GDP) in the Euro area expanded at an annual rate of 2.3% in the third quarter, Eurostat reported on Wednesday. This reading followed the 4.2% growth recorded in the second quarter and came in higher than the initial estimate and the market expectation of 2.1%.
Other data from the Euro Area revealed that the Employment Change was up 1.8%on a yearly basis in the third quarter, slightly higher than the market expectation of 1.7%.
Market reaction
EUR/USD clings to modest daily gains at around 1.0480 after the data.
The continuation of the downside in USD/CNH remains on the cards with a tough support at the 6.9300 region, comment UOB Group’s Market Strategist Quek Ser Leang and Senior FX Strategist Peter Chia.
Key Quotes
24-hour view: “Yesterday, we held the view that USD ‘has likely moved into a consolidation phase’ and we expected it to ‘trade within a range of 6.9400/7.0000’. USD subsequently traded between 6.9530 and 7.0000. Further consolidation would not be surprising, expected to be between 6.9600 and 7.0000.”
Next 1-3 weeks: “We continue to hold the same view as yesterday (06 Dec, spot at 6.9650). As highlighted, while further USD weakness is not ruled out, oversold short-term conditions could lead to a couple of days of consolidation first. That said, 6.9300 is a strong support and might not be easy to break. Looking ahead, the next support is at 6.9000. On the upside, a breach of 7.0400 (no change in ‘strong resistance’ level) would indicate that the USD weakness from late last week has come to an end.”
Markets settle into more recessionary trading. And as long as the Federal Reserve stays hawkish, the Dollar should perform well, economists at ING report.
DXY could well make a run to 107 ahead of next week's FOMC meeting
“Recessionary fears are building, yet the Fed has yet to cave in. We continue to see this as a positive environment for the Dollar and a negative one for commodity and pro-cyclical currencies.”
“DXY has found support under 105 and could well make a run to 107 ahead of next week's FOMC meeting, where we think it is too early for the Fed to signal the 'all-clear' on inflation with its influential Dot Plots.”
“The main threat to our bullish Dollar view comes from the risk of any softer US November price data (PPI released tomorrow, CPI next Tuesday) or a more positive re-assessment of Chinese growth prospects on the back of relaxed Covid measures.”
USD/CAD climbed to a monthly high of 1.3677 on Tuesday and closed in positive territory for the fourth straight trading day. Economists at Société Générale expect the pair to extend its advance towards 1.3810 and October high of 1.3980.
First layer of support is located at 1.3510
“USD/CAD has negated the previous Head and Shoulders formation by crossing above the neckline. It has moved beyond a descending resistance line pointing towards a short-term bounce. This is also highlighted by daily MACD which has entered positive territory.”
“The pair is expected to head higher gradually towards 1.3810 and October high of 1.3980.”
“First layer of support is located at 1.3510, the 38.2% retracement of recent bounce.”
- USD/JPY gains traction for the third successive day, though lacks bullish conviction.
- Expectations that the Fed will hike rates more than projected underpins the USD.
- The set-up warrants caution before positioning for any further appreciating move.
The USD/JPY pair builds on its recent bounce from the lowest level since August 16 and edges higher for the third successive day on Wednesday. The pair sticks to its modest gains through the first half of the European session and is currently trading around the 137.50-137.55 region, up nearly 0.40% for the day.
The US Dollar stands tall near a multi-day peak amid the prospects for further policy tightening by the Fed, which, in turn, acts as a tailwind for the USD/JPY pair. Friday's upbeat US jobs report (NFP), especially wage growth data, pointed to the possibility of a further rise in inflationary pressures. Adding to this, the better-than-expected US ISM Services PMI released on Monday suggested that the economy remained resilient despite rising borrowing costs. This, in turn, fuels speculations that the US central bank may lift interest rates more than recently projected and continues to lend support to the greenback.
The Japanese Yen, on the other hand, is undermined by dovish-sounding remarks by Bank of Japan (BoJ) policymakers. In fact, BoJ board member NakamuraToyoaki said that Japan's economy is still in the midst of recovering from a pandemic-induced slump and that the central bank must patiently maintain monetary easing. Apart from this, a mildly positive tone around the equity markets is seen as another factor weighing on the safe-haven JPY and acting as a tailwind for the USD/JPY pair. That said, the overnight comments by BoJ Governor Haruhiko Kuroda, on exiting the ultra-loose monetary policy, keep a lid on any further gains.
Traders also seem reluctant and prefer to wait for the key US macro data and central bank event risk next week - the release of the US consumer inflation figures and the FOMC policy meeting. This will play a key role in influencing the near-term USD price dynamics and provide a fresh directional impetus to the USD/JPY pair. Hence, it will be prudent to wait for strong follow-through buying before confirming that spot prices have bottomed out and positioning for any further gains amid absent relevant economic releases on Wednesday.
Technical levels to watch
EUR/USD trading has become more settled over the last week. Economists at ING note that the pair could move lower to 1.0400.
There is a case that 1.0595 was the corrective high in EUR/USD
“There is a case that last week's 1.0595 print was the corrective high in EUR/USD – we should know a lot more by next Wednesday evening after the FOMC meeting – and it will be interesting to see what the European Central Bank has to say on the 15th.
“Some are speculating that the current calm in European bond markets could prompt the ECB to be slightly more aggressive in its quantitative tightening plans – so let's see.”
“For today, EUR/USD could drift down to 1.0400 in quiet markets.”
The European Central Bank (ECB) conducted a survey of consumer expectations for inflation, with the key findings noted below.
Median expectations for inflation over the next 12 months increased from 5.1% to 5.4%.
Median expectations for inflation three years ahead were unchanged at 3.0%.
Consumers expected their nominal income to grow by 0.7% over the next 12 months, up from 0.6% in September.
Economic growth expectations for the next 12 months declined from -2.4% in September to -2.6%.
Consumers expected the growth in the price of their home over the next 12 months to slow to 3.0% from 3.4% in September.
The previous survey results saw consumers expecting Eurozone inflation at 5.1% over the next 12 months.
Market reaction
The above survey findings fail to impress Euro bulls, as EUR/USD holds near-intraday highs of 1.0480, at the time of writing. The pair is trading 0.05% higher on the day.
- AUD/USD touches a fresh weekly low amid some follow-through buying around the USD.
- Expectations that the Fed may lift interest rates more than projected underpins the buck.
- Softer Australian GDP print and Chinese trade balance data contribute to the downfall.
The AUD/USD pair attracts fresh sellers near the 0.6715 region on Wednesday and drops to a fresh weekly low during the early part of the European session. The pair is currently flirting with the 100-day SMA support, around the 0.6680 region, and seems vulnerable amid some follow-through US Dollar buying.
In fact, the USD Index, which measures the greenback's performance against a basket of currencies, is prolonging this week's recovery move from over a five-month low for the third straight day. The recent upbeat US macro data suggests that the economy remains resilient despite rising borrowing costs and fuel speculations that the Fed may lift rates more than projected. This, in turn, acts as a tailwind for the US Treasury bond yields and continues to lend support to the greenback.
The Australian Dollar, on the other hand, is pressured by Wednesday's softer domestic GDP print, which showed that the economy expanded by 0.6% during the third quarter. This marks a notable slowdown from the 0.9% growth recorded in the previous quarter and also fell short of the 0.7% rise anticipated. Apart from this, a sharp drop in China's Trade Balance outlines deep cracks running in the world's second-largest economy and exerts additional pressure on the China-proxy Aussie.
The fundamental backdrop now seems tilted in favour of bearish traders and supports prospects for some meaningful downside for the AUD/USD pair. That said, firming expectations that the US central bank will slow the pace of its rate-hiking cycle might hold back the USD bulls from placing aggressive bets and help limit losses for the major. It is worth mentioning that the markets have been pricing in a greater chance of a relatively smaller 50 bps Fed rate hike in December.
This, in turn, warrants some caution before confirming that the AUD/USD pair has topped out in the near term amid absent relevant market-moving economic releases from the US. Traders might also prefer to wait on the sidelines ahead of next week's key data/event risks - the release of the latest US consumer inflation figures and the highly-anticipated FOMC monetary policy meeting on December 13-14.
Technical levels to watch
Economists at Credit Suisse nudge their USD/CAD target range slightly higher to 1.3225-1.3900, even as they see mild potential for CAD-supportive developments from today’s Bank of Canada rate decision.
BoC to provide some marginal support for CAD
“We tempered our bearishness on CAD setting a 1.3000-1.3650 USD/CAD target range. With the top end of our target range breached, we raise our target range slightly to 1.3225-1.3900, with the extremes of the range consistent with the highs and the lows of Q4 thus far.”
“Our underlying assumptions is that CAD will remain more influenced by broader risk sentiment than by domestic factors, even if we see potential for the BoC to provide some marginal support for CAD today. A dovish surprise by the BoC would likely bring us to revisit our USD/CAD target further to the upside.”
See – BoC Preview: Forecasts from nine major banks, very close call
- The index extends the advance and flirts with 106.00.
- The absence of traction prevails in the US yield curve.
- Weekly Mortgage Applications, Consumer Credit Change next on tap.
The USD Index (DXY), which gauges the greenback vs. a bundle of its main rival currencies, climbs further and approaches the 106.00 neighbourhood on Wednesday.
USD Index remains bid, looks to data, Fed
The index posts gains for the third session in a row and disputes the key 200-day SMA in the upper-105.00s on the back of the knee-jerk in the risk complex and firm speculation on further tightening by the Federal Reserve.
Indeed, positive results from the US docket in past sessions appear to have lent extra support to the view that the Fed might not pause its tightening cycle in the short-term horizon, all morphing into renewed oxygen for the buck.
In the US data space, the usual MBA Mortgage Applications are due in the first turn seconded by the Consumer Credit Change.
What to look for around USD
The dollar remains firm amidst renewed speculation around the Fed and its normalization process, while the 106.00 mark now emerges as the immediate target of the current bounce.
While hawkish Fedspeak maintains the Fed’s pivot narrative in the freezer, upcoming results in US fundamentals would likely play a key role in determining the chances of a slower pace of the Fed’s normalization process in the short term.
Key events in the US this week: MBA Mortgage Applications, Consumer Credit Change (Wednesday) – Initial Jobless Claims (Thursday) – Producer Prices, Advanced Michigan Consumer Sentiment, Wholesale Inventories (Friday).
Eminent issues on the back boiler: Hard/soft/softish? landing of the US economy. Prospects for further rate hikes by the Federal Reserve vs. speculation of a recession in the next months. Fed’s pivot. Geopolitical effervescence vs. Russia and China. US-China persistent trade conflict.
USD Index relevant levels
Now, the index is gaining 0.10% at 105.67 and faces the next up barrier at 107.19 (weekly high November 30) followed by 107.99 (weekly high November 21) and the 108.98 (100-day SMA). On the other hand, the breakdown of 104.11 (monthly low December 5) would open the door to 103.41 (weekly low June 16) and finally 101.29 (monthly low May 30).
Top of today's agenda is the monetary policy meeting of the National Bank of Poland (NBP). Economists at ING expect unchanged rates and EUR/PLN moving beyond the 4.720 level.
NBP ending the tightening cycle
“After last week's surprisingly low inflation, it is hard to expect any outcome other than stable interest rates. Although we think the peak in inflation is still ahead and inflation will slow only very gradually next year, the prospect of a weak economic performance will prevail at the MPC and we expect the same story next year. However, the bigger focus will be on tomorrow's press conference by Governor Adam Glapinski and any potential mention of interest rate cuts, which could be a red rag to a bull for the markets.”
“The gap between the zloty and the interest rate differential is the largest in the region at the moment and together with EUR/USD heading lower, this is not good news for FX. EUR/PLN is thus vulnerable, especially to the upside and we could see a move above the 4.720 level which was already tested on Monday.”
China’s Health Official said on Wednesday, “the latest covid measures are aimed at domestic prevention and control.”
Additional takeaways
China's COVID-19 vaccines are very safe after vaccination, with benefits far outweighing risks.
China will gradually advance in accordance with the law on further optimising cross-border covid curbs.
China to hold epidemic control and prevention press conference on Thursday.
Related reads
- Forex Today: Markets remain cautious despite easing of Covid curbs in China, eyes on BOC
- China’s NHC: Scraps requirement for negative Covid test in most public venues
Extra losses in USD/JPY seems unlikely for the time being, exposing instead a potential consolidation between 134.00 and 139.00, suggest UOB Group’s Market Strategist Quek Ser Leang and Senior FX Strategist Peter Chia.
Key Quotes
24-hour view: “We expected USD to ‘trade between 135.00 and 137.20’ yesterday. USD subsequently traded within a range of 135.00/137.20. The price actions appear to be part of a broad consolidation range and USD is likely to trade between 136.00 and 137.70 today.”
Next 1-3 weeks: “There is not much to add to our update from yesterday (06 Dec, spot at 134.65). As highlighted, the recent USD weakness has come to an end. The current price movement is likely the early stages of a consolidation phase and we expect USD to trade between 134.00 and 139.00 for the time being.”
GBP/USD stays on the back foot and continues to stretch lower toward 1.2100. Economists at ING expect the pair to trade back to the 1.19 zone.
Mildly bearish
“If we are turning to a more macro-led trading environment, then Sterling should underperform.”
“A Fed staying hawkish into a recession should see equity markets come under renewed pressure. Typically, this is a negative environment for Sterling, where the UK's large current account deficit is penalised.”
“GBP/USD has turned from a strong resistance level at 1.23 and our bias into next week would be for a return to the 1.19 area.”
- USD/CAD holds steady near a one-month top and draws support from a combination of factors.
- Bearish oil prices continue to undermine the Loonie and act as a tailwind amid a stronger USD.
- Bulls, however, seem reluctant and prefer to wait for the BoC decision before placing fresh bets.
The USD/CAD pair oscillates in a narrow trading band near mid-1.3600s on Wednesday and consolidates its recent gains to a one-month high touched the previous day.
Traders now seem reluctant to place aggressive bets and prefer to wait on the sidelines ahead of the latest monetary policy update from the Bank of Canada (BoC). The Canadian central bank is scheduled to announce its decision later during the early North American session and is widely expected to hike interest rates by 50 bps. The focus, meanwhile, will be on the accompanying rate statement, which will influence the domestic currency and provide some meaningful impetus to the USD/CAD pair.
In the meantime, a combination of factors continues to act as a tailwind for spot prices and limits a modest intraday downtick to the 1.3630 area. Crude oil prices remain depressed for the fourth straight day and languished near the YTD low amid worries that a deeper global economic downturn will hurt fuel demand. This, in turn, is seen undermining the commodity-linked Loonie and lending support to the USD/CAD pair amid some follow-through US Dollar buying, bolstered by hawkish Fed expectations.
Friday's better-than-expected US jobs report (NFP), especially an upside surprise in wage growth data, points to the possibility of a further rise in inflationary pressures. Adding to this, the upbeat US ISM Services PMI released on Monday suggested that the economy remained resilient despite rising borrowing costs. This, in turn, fuels speculations that the Fed might lift rates more than projected, which lends support to the buck and adds credence to the positive outlook for the USD/CAD pair.
Hence, any meaningful corrective pullback is more likely to attract fresh buyers and remain limited. The USD/CAD pair seems poised to prolong its recent upward trajectory and aim to reclaim the 1.3700 round-figure mark. The positive momentum could get extended towards the next relevant barrier, around the 1.3740 supply zone.
Technical levels to watch
Economists at Credit Suisse remain optimistic on Indian GDP, but that optimism is negative for the trade balance and the Rupee. They forecast USD/INR to trade in a 82-84 range in the short term.
RBI will limit weakness at 84.00 in the short term
“We remain optimistic on the outlook for Indian GDP, but that optimism (and associated high consumption) is negative for the trade balance and for INR. India will continue importing oil to fuel its strong growth. It will also continue importing discounted Russian oil, but that will not blunt the impact of higher oil import volumes.”
“The RBI will likely limit rupee weakness at 84.00 in the short term, but unlike for China, we think the ongoing re-opening in India points to rupee weakness.”
“We forecast USD/INR to trade in a 82-84 range in the short term.”
EUR/USD is going into a consolidation phase at around 1.0450. As economists at Commerzbank note, the pair heads toward Fed meeting without much sense of direction.
In limbo
“EUR/USD remains susceptible to sudden changes in sentiment and as a result, it seems unlikely that on a day with little data like today a clear direction will emerge. It seems likely that the pair will remain in limbo as was the case over the past few days.”
“The stronger the data turns out to be until the FOMC meeting in a week’s time (producer prices and inflation expectations on Friday as well as consumer prices next Tuesday) the greater the risk that the FX market might have to reconsider this view once again. That might provide a dampener for EUR/USD over the course of the week. However, FX traders will no doubt wait for the Fed’s decision and new projections before making any fundamental adjustments to their expectations.”
- EUR/GBP holds steady near the weekly high, though lacks follow-through buying.
- The better-than-expected German data underpin the Euro and extend support.
- The mixed setup warrants some caution before placing aggressive bullish bets.
The EUR/GBP cross edges higher for the fourth successive day on Wednesday and looks to build on the recent bounce from a three-month low, around the 0.8545 area touched last week. The cross sticks to its modest gains through the early European session and is currently placed near the weekly top, around the 0.8620-0.8630 region.
The shared currency's relative outperformance could be attributed to the better-than-expected German macro data, which, in turn, is seen acting as a tailwind for the EUR/GBP cross. According to the official data released by the federal statistics authority Destatis this Wednesday, German Industrial Production in Germany declined by 0.1% in October against the 0.5% fall anticipated.
This comes on the back of Tuesday's release of the upbeat German Factory Orders, which rose 0.8% in October against the 0.2% fall estimated. Furthermore, a bleak outlook for the UK economy undermines the British Pound and offers support to the EUR/GBP cross. The upside for the EUR/GBP cross, however, remains capped amid bets for less aggressive rate hikes by the European Central Bank (ECB).
Even from a technical perspective, spot prices, so far, have been struggling to move back above the 100-day SMA. This further makes it prudent to wait for strong follow-through buying before confirming that the EUR/GBP cross has formed a near-term bottom and positioning for any further gains.
Technical levels to watch
The Bank of Canada (BoC) is set to announce its interest rate decision on Wednesday, December 7 at 15:00 GMT and as we get closer to the release time, here are the expectations as forecast by the economists and researchers of nine major banks, regarding the upcoming announcement.
The BoC is set to hike its benchmark rate by 50 bps from the current 3.75% to 4.25% though it could slow the pace of tightening without warning. In such a scenario, there is a chance the bank will opt for a smaller hike of 25 bps.
ING
“Both markets and economists are split down the middle on whether it will be a 25 bps or 50 bps hike. We favour the latter given a robust 3Q GDP outcome, the tight jobs market and the ongoing elevated inflation readings. But we acknowledge there are signs of softening in the economy. The housing market is looking vulnerable and Canadian households are more exposed to higher rates than elsewhere due to high borrowing levels so we recognise this is a very close call. We are getting very close to the peak though, which we think will be 4.5% in 1Q 2023.”
TDS
“We look for the BoC to lift rates by 25 bps in December in what is admittedly a close call. We see the BoC's terminal rate at 4.25%, and as such expect the BoC to signal that it expects to lift rates further. The BoC is unlikely to offer much to move the needle on the CAD.”
RBC Economics
“The BoC won’t hit the brakes on interest rate increases but it is likely to slow them down. And we believe this week’s increase could be the last in this cycle. We expect a 25 bps increase in the overnight rate to 4.0% from the central bank. Perhaps more important than the size of Wednesday's interest rate hike is how many more could follow. The answer to that question depends on inflation. Inflation is still running well above the 2% target rate, but a 4.00% overnight rate is likely enough to slow economic growth and inflation pressures further. The BoC will almost certainly (and correctly) keep the option to hike interest rates further if necessary. But our own base case expectation is that December will mark the last rate hike of this cycle.”
NBF
“We concede the 25-50 bps debate is a close call, but we’re officially looking for the BoC to hike by 25 bps, bringing the policy rate to 4%. We think there’s sufficient evidence in recent data most important to the Bank to support that decision. Just as important as the decision itself will be changes to guidance. We see a decent chance they get rid of their go-to line that ‘interest rates will need to rise further’ and put even more emphasis on data dependence. On balance, a more hawkish Fed might have some gravitational pull on the BoC but we definitely don’t expect a one-for-one impact and still believe this hike could be the Bank’s last.”
Citibank
“While market expectations are split between a 50 bps hike and a 25 bps hike from the BoC this week, we expect another larger-than-’usual’ 50 bps hike as there has not been any notable progress on cooling demand or inflation. This is certainly still the case with the average of the preferred measures (CPI-trim and CPI-median) rising from 5.0% before the October meeting to 5.1% in the latest released data. We expect a 50 bps hike this week followed by successive 25 bps hikes in January and March, to take the terminal rate to 4.75%.”
CIBC
“We’ve stuck with our call for a 50 bps move, but the language of the statement no longer guarantees further hikes ahead.”
BMO
“We lean to the 50 bps option, but readily admit that there is a decent case for a slower pace of hikes.”
Wells Fargo
“We expect a 25 bps rate hike, bringing the policy rate to 4.00%. As of October, headline inflation in Canada came down from a recent peak, but remained stuck at a 6.9% YoY rate. While the headline rate of inflation remained the same from September to October, underlying prices accelerated. The average of trim and median inflation, two measures of core inflation tracked closely by the central bank, quickened to 5.1% YoY, showing that even though headline inflation may have peaked, underlying price pressures remain persistent. This should keep the BoC on its tightening path for the time being.”
Goldman Sachs
“We expect the BoC to deliver another 50 bps hike, but under-delivery remains a risk on two fronts. First, it is possible that the BoC sees enough justification to hike by 25 bps only, given the moderation in sequential underlying inflation. Second, we think that the BoC is likely to pause soon and the statement or press conference may already signal this.”
In November, the South African Rand strengthened sharply against the US dollar from 18.340 to 16.956. However, the USD/ZAR could move back higher amid slowing global growth, economists at MUFG Bank report.
Global growth will continue to slow sharply heading into next year
“There is still a risk in the near-term that global growth will continue to slow sharply heading into next year and financial market volatility could pick-up again.”
“The Rand remains sensitive to the outlook for global growth and external financial conditions with South Africa’s current account surplus moves back into deficit as the pandemic impact reverses further. South Africa’s terms of trade have deteriorated throughout most of this year but have started to improve in November offering more for support for the rand as well.”
“We expect the Rand to strengthen further in the year ahead although not without setbacks in the coming quarters with the global growth set to be weak at the start of next year.”
Here is what you need to know on Wednesday, December 7:
Choppy market action continues mid-week as investors refrain from taking large positions ahead of next week's highly-anticipated central bank meetings. Investors remain cautious despite China's decision to move away from the zero-Covid policy and the US Dollar preserves its strength against its risk-sensitive rivals. The European economic docket will feature the third-quarter Gross Domestic Product. Later in the day, third-quarter Nonfarm Productivity and Unit Labor Costs data from the US will be looked upon for fresh impetus. Finally, the Bank of Canada (BOC) will announce its interest rate decision and release the monetary policy statement.
China announced earlier in the day that positive cases with mild symptoms or who are asymptomatic will be allowed to quarantine at home for seven days rather. "Any form of mobility-control should not be implemented," the Chinese government noted in a statement and explained that mass PCR testing will be largely abandoned and be restricted to hospitals, nursing homes and schools. Despite this development, the Shanghai Composite Index is down 0.4% and Hong Kong's Hang Seng Index is losing nearly 2%. Meanwhile, US stock index futures trade flat on the day following the two-day slide witnessed in Wall Street's main indexes.
USD/CAD climbed to a monthly high of 1.3677 on Tuesday and closed in positive territory for the fourth straight trading day. In addition to broad-based US Dollar strength, falling crude oil prices provided a boost to the pair by weighing on the commodity-sensitive Canadian Dollar. The BOC is expected to raise its policy rate by 50 basis points to 4.25%. Some experts see the BOC opting for a smaller 25 bps hike. In its previous policy statement, the BOC set its terminal rate at 4.25% and a 50 bps hike would bring the bank's tightening cycle to an end.
BOC Preview: Getting ready for a dovish pivot?
EUR/USD continued to edge lower on closed in negative territory on Tuesday before going into a consolidation phase at around 1.0450 early Wednesday. The data from Germany revealed that Industrial Production contracted by 0.1% on a monthly basis in October, beating the market expectation for a decrease of 0.5%.
GBP/USD stays on the back foot and continues to stretch lower toward 1.2100 in the European morning. The Halifax House Prices fell 2.3% on a monthly basis in November but this data had little to no impact on Pound Sterling's performance against its rivals.
USD/JPY preserved its bullish momentum early Wednesday and climbed above 137.00. Bank of Japan (BoJ) Board Member Toyoaki Nakamura said earlier in the day that it would be premature to tweak the monetary policy now with service prices remaining low.
Australian Bureau of Statistics reported during the Asian trading hours that the Australian GDP grew at an annual rate of 5.9% in the third quarter, falling short of the market expectation of 6.3%. AUD/USD edged lower after the data and was last seen trading slightly below 0.6700.
Gold price closed virtually unchanged at around $1,770 on Tuesday as the retreating US Treasury bond yields helped XAU/USD hold its ground despite the US Dollar strength. The pair continues to fluctuate in a narrow range near $1,770 early Wednesday.
Bitcoin extends its sideways grind near $17,000 into a seventh straight day on Wednesday. Ethereum struggles to find demand and loses over 3%, closing in on $1,200.
Considering advanced prints from CME Group for natural gas futures markets, open interest extended the uptrend on Tuesday, this time by around 4.7K contracts. On the other hand, volume shrank by around 58.2K contracts following two daily builds in a row.
Natural Gas: Next on the downside comes $4.75
Natural gas prices dropped for the fifth session in a row on Tuesday. The daily decline this time was on the back of rising open interest, which is supportive of extra retracement in the very near term. That said, the October low at $4.75 per MMBtu still emerges as the next target for bears for the time being.
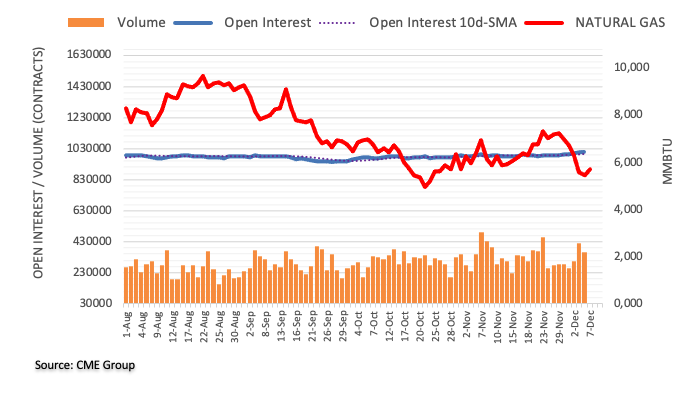
- Gold price oscillates in a range near the weekly low amid some follow-through USD buying.
- Expectations that the Fed will continue to tighten its policy act as a tailwind for the buck.
- The easing of COVID-19 curbs in China also contributes to capping the safe-haven XAU/USD.
Gold price struggles to gain any meaningful traction on Wednesday and oscillates in a narrow trading band through the early European session. The XAU/USD is currently placed just below the $1,775 level and remains well within the striking distance of the weekly low touched on Monday.
The US Dollar prolongs this week's recovery move from over a five-month low for the third straight day, which, in turn, is seen weighing on the Dollar-denominated Gold price. The recent strong US macro data points to the resilient economy and fuels speculations that the might lift rates more than projected. This continues to act as a tailwind for the US Treasury bond yields and pushes the greenback to a one-week high on Wednesday.
Apart from this, the latest optimism led by the easing of COVID-19 restrictions in China turns out to be another factor undermining the safe-haven XAU/USD. That said, expectations that the Fed will slow the pace of its rate-hiking cycle should help limit deeper losses for the non-yielding Gold price. In fact, the markets have been pricing in a relatively smaller 50 bps lift-off at the upcoming FOMC meeting on December 13-14.
Heading into the key central bank event risk, investors will also confront the release of the latest US consumer inflation figures next week. The data will influence the Fed's policy outlook, which should play a key role in driving the near-term USD demand and provide a fresh directional impetus to Gold price. In the meantime, the XAU/USD is likely to extend its sideways consolidative price move in the absence of any relevant economic data.
Technical levels to watch
Industrial Production in Germany declined in October, the official data showed on Wednesday, suggesting that the manufacturing sector remains vulnerable.
Eurozone’s economic powerhouse’s Industrial Output decreased by 0.1% MoM, the federal statistics authority Destatis said in figures adjusted for seasonal and calendar effects, vs. a -0.5% expected and 0.6% prior.
On an annualized basis, German Industrial Production arrived at 0% in October versus a 2.6% increase booked previously and 2.3% consensus forecasts.
FX implications
The shared currency shrugs off mixed German industrial figures. At the time of writing, EUR/USD is trading at around 1.0450, down 0.13% on the day.
About German Industrial Production
The Industrial Production released by the Statistisches Bundesamt Deutschland measures the outputs of German factories and mines. Changes in industrial production are widely followed as a major indicator of strength in the manufacturing sector. A high reading is seen as positive (or bullish) for the EUR, whereas a low reading is seen as negative (or bearish).
Gold price extends the downside consolidation phase into the second straight day on Wednesday. For how long can XAU/USD defend 50-Simple Moving Average on 4H? FXStreet’s Dhwani Mehta analyzes the pair’s technical outlook.
Gold price on the defensive
“A four-hourly candlestick closing below the mildly bullish 50-Simple Moving Average (SMA) at $1,770 is critical to unleashing further downside toward the 100SMA at $1,764. The rising trendline support at $1,761 will be next on sellers’ radars.”
“The Relative Strength Index (RSI) turns lower below the midline, backing the bearish potential in the near term.”
“If the bulls manage to defend the 50SMA support yet again, the Gold price could stage a modest comeback toward the downward-pointing 21SMA at $1,785. Buyers will try hard to seek acceptance above the $1,800 threshold.”
- GBP/USD stays pressured around the short-term key support confluence.
- Convergence of 200-DMA, one-month-old ascending trend line restricts immediate downside.
- The looming bear cross on MACD keeps sellers hopeful, previous resistance line from June acts as additional downside filter.
GBP/USD bears keep the reins as they battle with the 1.2100 key support amid the early Wednesday morning in London. In doing so, the Cable pair drops for the third consecutive day.
That said, the looming bear cross on the MACD indicator hints at the quote’s further downside. However, the 200-DMA and an upward-sloping trend line from November 10 restrict the quote’s immediate declines.
In a case where the GBP/USD bears manage to post a daily close below 1.2100, the resistance-turned-support line from June, near 1.1965, could lure the sellers. It should be noted that the 1.2000 psychological magnet may act as a buffer during the fall.
If at all the GBP/USD price fails to reverse from 1.1965, the 61.8% Fibonacci retracement level of the May-September downside, near 1.1780, will be in focus while checking for the quote’s further weakness.
On the flip side, highs marked in August around 1.2300 and the monthly peak near 1.2345 could challenge immediate GBP/USD recovery.
Following that, the mid-June low near 1.2410 holds the key to the GBP/USD pair upside towards the mid-2022 high, close to 1.2665.
Overall, GBP/USD is likely to witness further downside but the room towards the south is bumpy.
GBP/USD: Daily chart
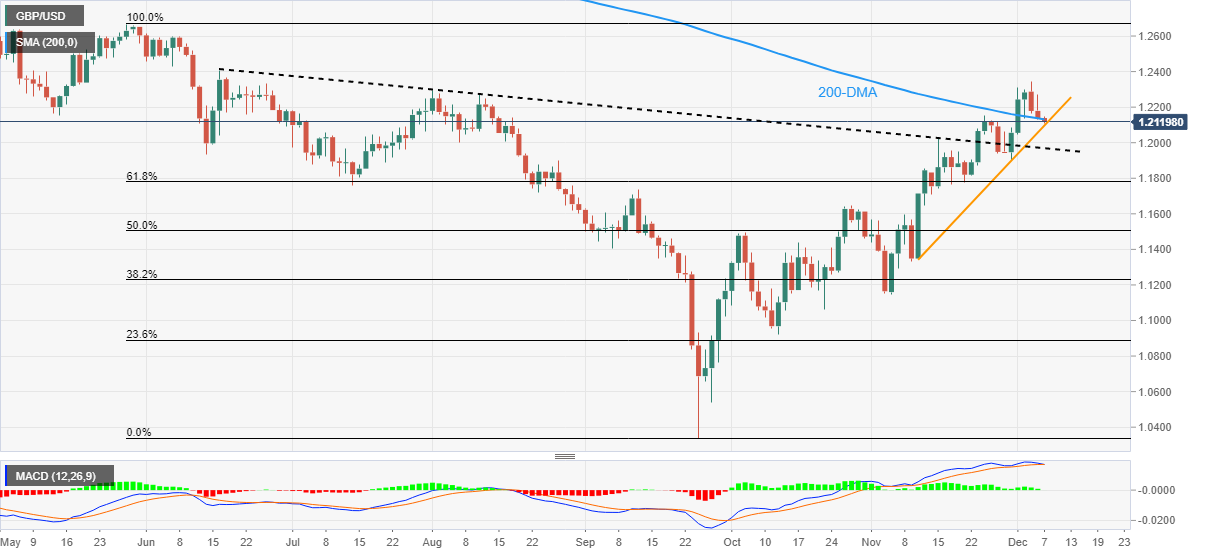
Trend: Further downside expected
FX option expiries for Dec 7 NY cut at 10:00 Eastern Time, via DTCC, can be found below.
- EUR/USD: EUR amounts
- 1.0360 1.07b
- 1.0600 1.01b
- GBP/USD: GBP amounts
- 1.2050 398m
- USD/JPY: USD amounts
- 134.00 920m
- 136.15 270m
- 138.00 435m
- 140.00 411m
- USD/CHF: USD amounts
- 0.9225 250m
- 0.9320 600m
- 0.9425 420m
- 0.9560 400m
- AUD/USD: AUD amounts
- 0.6600 225m
- USD/CAD: USD amounts
- 1.3200 1.3b
- 1.3300 571m
- 1.3395 200m
- 1.3540 2.2b
- 1.3600 1.27b
- NZD/USD: NZD amounts
- 0.6350 261m
- 0.6450 811m
- EUR/GBP: EUR amounts
- 0.8650 324m
- EURCHF: EUR amounts
- 0.9750 281m
According to UOB Group’s Market Strategist Quek Ser Leang and Senior FX Strategist Peter Chia, AUD/USD now looks side-lined within the 0.6600-0.6815 range in the short term.
Key Quotes
24-hour view: “Our expectations for ‘the sharp decline in AUD to extend’ did not materialize as it traded between 0.6681 and 0.6744. The risk still appears to be tilted slightly to the downside even though the major support at 0.6640 is unlikely to come under threat. The downside risk is intact as long as AUD does not move above 0.6740 (minor resistance is at 0.6720).”
Next 1-3 weeks: “We continue to hold the same view as yesterday (06 Dec, spot at 0.6705). As indicated, the recent upward pressure has dissipated and AUD is likely to consolidate between 0.6600 and 0.6815 for the time being.”
CME Group’s flash data for crude oil futures markets noted traders scaled back their open interest positions by just 492 contracts on Tuesday, partially reversing the previous daily build. Volume, instead, increased fir the second session in a row, now by around 81.4K contracts.
WTI: A drop to $70.00 emerges on the horizon
Crude oil prices remained under pressure and dropped to fresh 2022 lows on Tuesday. The daily uptick was on the back of diminishing open interest, indicative that further decline could take a breather in the very near term. The broader bearish sentiment in WTI, however, leaves the door open to a probable revisit to the $70.00 mark per barrel.
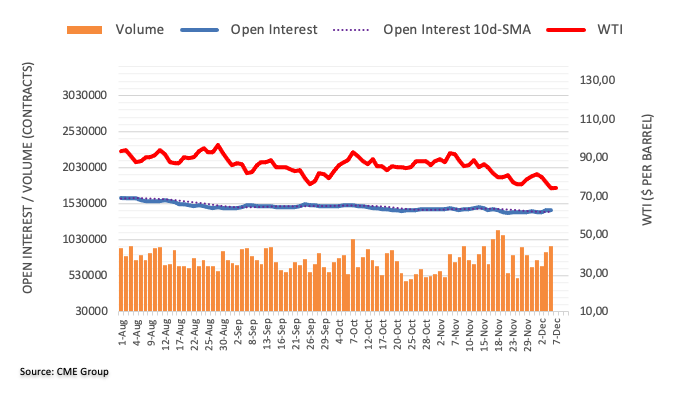
USD/JPY picks up bids to refresh intraday high around 137.60 during early Wednesday in Europe. In doing so, the Yen pair portrays the market’s risk-on mood amid a light calendar.
However, the options market signals are in contrast with the USD/JPY price run-up. That said, the one-month risk reversal (RR) for the Yen pair, the ratio between call and put premiums, braces for the biggest weekly print in three by flashing -0.325 at the latest. In doing so, the weekly RR drops for the third consecutive week. Further, the daily RR snaps a two-day uptrend by printing the -0.435 figure at the latest.
It’s worth noting that China’s announcement of the new Covid policy appeared to have triggered the latest risk-on mood.
Also favoring the USD/JPY could be the comments from various policymakers at the Bank of Japan (BOJ). Recently, BOJ Board Member Toyoaki Nakamura said that it is ‘premature to tweak monetary policy now as service prices remain low.
Also read: USD/JPY Price Analysis: Retreats from monthly resistance around 137.00
- Bearish S&P500 has faded optimism in Asian indices.
- China’s easing Covid-19 restrictions-inspired optimism has dwindled the impact of a weaker Trade Balance.
- The oil price has refreshed its 11-month low at $74.54 amid downside revision in economic forecasts.
Markets in the Asian domain have failed to continue Tuesday’s optimism and are facing pressure due to negative market sentiment. Indices are following bearish cues from S&P500 as the latter has witnessed selling pressure consecutively for two trading sessions. Volatility inspired by Federal Reserve (Fed)’s interest rate peak chaos is still breathing and impacting risk-sensitive assets.
At the press time, Japan’s Nikkei225 dropped 0.69%, ChinaA50 added 0.20%, Hang Seng eased 0.10%, and Nifty50 slipped 0.35%.
Growing concerns over Fed’s interest rate peak have strengthened the risk-off mood in global markets. Evidence of fresh strength in the United States economy is compelling for a higher neutral rate as inflation is set to rebound again amid rising fears of wage inflation. No doubt, a higher interest rate peak by the Fed will accelerate recession fears ahead.
Meanwhile, optimism in Chinese equities led by easing Covid-19 lockdown restrictions has faded weaker Trade Balance data. In US Dollar terms, Exports dropped by 8.6% against the consensus of 3.5% and Imports tumbled by 10.6% vs. the projections of 6.0%. China’s Trade Balance has slipped sharply to $69.84B in comparison with the estimates of $78.1B.
Meanwhile, Indian indices are displaying volatility as the Reserve bank of India (RBI) has raised the repo rate by 35 basis points (bps). Also, RBI Governor Shaktikanta das has trimmed Gross Domestic Product (GDP) forecast to 6.8% for FY2023. The 50-stock Indian basket has slipped by 0.35%.
On the oil front, the oil price has refreshed its 11-month low at $74.54 as expectations for a higher interest rate peak by the Fed have revised down economic projections. A fresh downside revision in the growth forecast has offset supply worries from Russia.
In the opinion of UOB Group’s Market Strategist Quek Ser Leang and Senior FX Strategist Peter Chia, GBP/USD is now seen within the 1.2000-1.2280 range in the next weeks.
Key Quotes
24-hour view: “Yesterday, we expected GBP to ‘trade within a range of 1.2130/1.2290’. Our expectation for range trading was not wrong even though GBP traded within a narrower range than expected (1.2129/1.2266). GBP closed on a soft note at 1.2135 (-0.41%) and downward momentum is beginning to build, albeit tentatively. As long as GBP does not move above 1.2200 (minor resistance is at 1.2160), it is likely to trade with a downward bias today. That said, any decline is expected to encounter solid support at 1.2060.”
Next 1-3 weeks: “We highlighted yesterday (06 Dec, spot at 1.2190) that ‘upward momentum is beginning to wane and the likelihood of GBP advancing to 1.2400 has diminished considerably’. GBP subsequently rose to 1.2266 before dropping to a low of 1.2129 in late NY trade. While our ‘strong support’ at 1.2130 was marginally breached, upward momentum has dissipated. In other words, the GBP strength that started late last week (see annotations in the chart below) has come to an end. From here, the underlying tone has softened a tad and while GBP is likely to edge lower, any decline is viewed as part of a 1.2000/1.2280 consolidation range. To look at it another way, a sustained decline below 1.2000 is unlikely.”
- NZD/USD remains sidelined as sellers attack short-term key support line.
- Bearish MACD signals, RSI divergence keeps sellers hopeful.
- 21-SMA guards immediate recovery, 0.6470-75 region is the key hurdle to the north.
NZD/USD treads waters around 0.6320-30 as bears flirt with the short-term key support line during early Wednesday. Even so, the Kiwi pair’s failure to cross the 21-SMA and bearish MACD signals hint at the quote’s further downside.
Also keeping sellers hopeful is the bearish RSI divergence on the chart. The oscillator-price divergence could be witnessed when the NZD/USD prints higher lows but the RSI, placed at 14, fails to print the commensurate bottoms, which in turn suggests the lack of momentum strength even if the prices remain firmer.
As a result, the bearish move could quickly be materialized at the first chance.
That said, an upward-sloping support line from November 10, near 0.6315, gains major attention as a downside break of the same might work as a trigger for the NZD/USD south-run.
In that case, lows marked on November 28 and 17, respectively near 0.6155 and 0.6065, could lure the bears before highlighting the previous monthly low of 0.5740.
On the flip side, a clear break of the 21-SMA level surrounding 0.6360 appears necessary to convince NZD/USD buyers.
Even so, multiple hurdles surrounding 0.6470-75, comprising the highs marked in August and December, appear a tough nut to crack for the bulls before retaking control.
NZD/USD: Four-hour chart
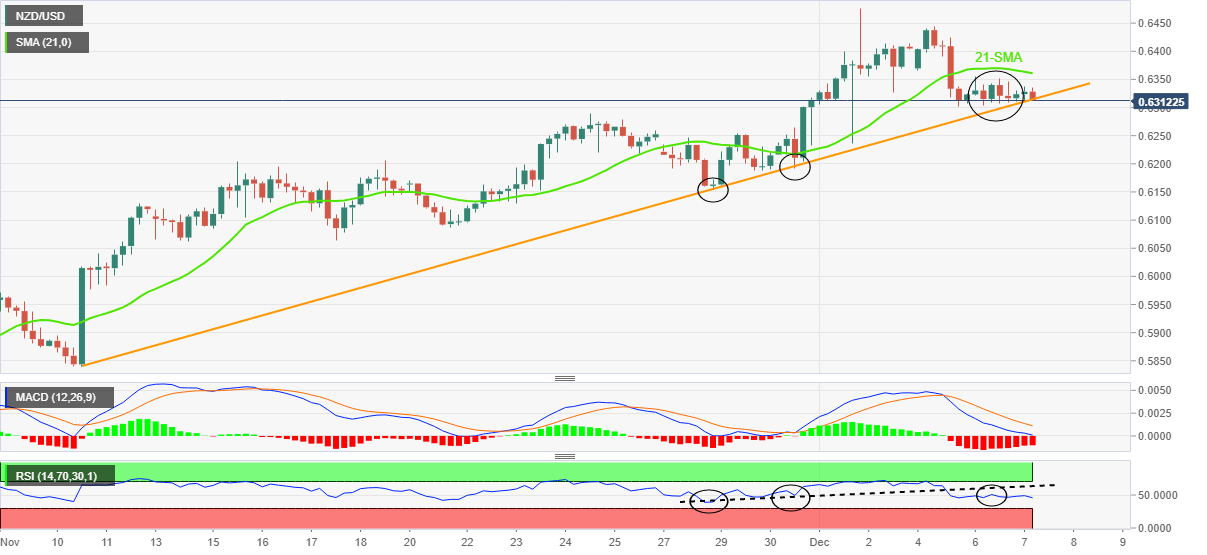
Trend: Further weakness expected
Further comments crossing the wires from Bank of Japan (BoJ) Board Member Toyoaki Nakamura, as he continues to speak about the inflation and monetary policy outlook.
Key to future policy will depend on whether inflation will rise sustainably.
Not convinced yet whether consumer inflation will exceed 2% in fiscal 2023 onward.
Rate of wage increase in next year's spring wage negotiations alone won't lead to policy tweak debate.
Don't see need to change current monetary policy framework now.
Market reaction
USD/JPY was last seen trading at 137.52, accelerating its advance on the dovish BoJ comments. The spot is up 0.35% on the day.
Open interest in gold futures markets shrank for the third session in a row on Tuesday, this time by nearly 4K contracts according to preliminary readings from CME Group. Volume followed suit and went down by around 58.3K contracts, reaching the third daily drop in a row.
Gold: Upside remains capped by the $1,800 region
Gold prices attempt to stabilize in the lower end of the weekly range around the $1,770 zone. Tuesday’s small uptick was amidst shrinking open interest and volume, which warns against extra upside in the very near term. That said, occasional bullish attempts remain limited by the $1,800 zone per ounce troy for the time being.
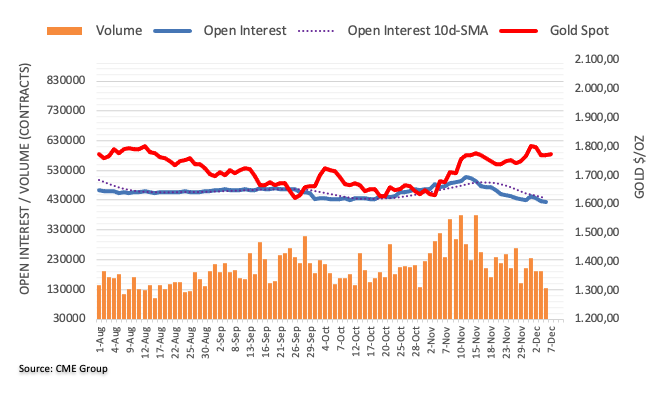
Bank of Japan (BoJ) Board Member Toyoaki Nakamura said on Wednesday, it is “premature to tweak monetary policy now as service prices remain low.”
Additional comments
Not sure now is right timing to conduct a review of monetary policy framework.
Once there are brighter prospects on outlook, BoJ can of course discuss policy normalization.
It may take quite some time for japan to achieve wage hikes.
UOB Group’s Market Strategist Quek Ser Leang and Senior FX Strategist Peter Chia note that a test of 1.0620 is not ruled out for EUR/USD in the near term.
Key Quotes
24-hour view: “We highlighted yesterday that EUR ‘appears to have moved into a consolidation phase’ and expected it to ‘trade sideways between 1.0455 and 1.0560’. Our view for consolidation was not wrong even though EUR traded within a narrower range than expected (1.0457/1.0532). The underlying has softened and while EUR is likely to edge lower, it is unlikely to break the strong support at 1.0420. Resistance is at 1.0495, a breach of 1.0530 would indicate the current mild downward pressure has eased.”
Next 1-3 weeks: “Our update from yesterday (06 Dec, spot at 1.0495) is still valid. As highlighted, short-term momentum is beginning to wane and EUR is likely to consolidate for a couple of days. However, as long as 1.0420 (no change in ‘strong support’ level) is not breached, there is still chance, albeit not a high one for EUR to advance to 1.0620. Looking ahead, a breach of 1.0420 would indicate that the EUR strength from late last week has ended.”
- AUD/USD picks up bids to print the first daily positive in four.
- Downbeat China trade numbers, softer-than-expected Aussie GDP fail to convince bears amid pre-Fed blackout.
- Beijing announces new COVID-19 prevention and control guidelines.
- Light calendar emphasizes risk catalysts for fresh impulse.
AUD/USD prints mild gains around 0.6700 as buyers struggle to defend the first daily gains in four heading into Wednesday’s European session.
The Aussie pair’s latest gains could be linked to the recently released Covid guidelines from China. That said, China’s National Health Commission (NHC) mentioned that asymptomatic patients, cases with mild symptoms can undergo home quarantine. The updates also mentioned, “High-risk zones with no new infections for 5 straight days should be released from lockdown in a timely manner.”
On the contrary, fears of global recession, as conveyed by the key representatives of major banks and Bloomberg economics seem to challenge the AUD/USD bulls. Additionally, softer-than-expected Australia Gross Domestic Product (GDP) for the third quarter (Q3) and downbeat prints of China’s November monthly trade data also weighed on the AUD/USD prices.
However, hopes of overcoming China-linked virus fears and faster economic transition, due to the NHC guidelines, seem to have triggered the latest risk-on mood, which in turn favors AUD/USD bulls.
Amid these plays, the S&P 500 Futures print mild gains while the US 10-year Treasury yields print mild gains near 3.55%.
Moving on, China’s risk-positive announcements and second-tier data may entertain AUD/USD traders ahead of Thursday’s China inflation numbers and Friday’s preliminary readings of the US Michigan Consumer Sentiment Index.
Technical analysis
Tuesday’s Doji candlestick above the 21-DMA, around 0.6700 by the press time, keeps AUD/USD buyers hopeful.
- EUR/USD is eyeing a cushion around 1.0460 as the US Dollar is displaying topsy-turvy moves.
- Fresh strength in the United States economy has triggered Federal Reserve’s interest rate peak chaos.
- European Central Bank policymakers are expecting the interest rate to peak sooner.
- EUR/USD is declining towards the upward-sloping trendline plotted from November low around 0.9730.
EUR/USD is displaying topsy-turvy moves after dropping to near 1.0460 in the early European session. The major currency pair is oscillating in a range of 1.0456-1.0476 after an intense sell-off in the late New York session. Earlier, the Euro asset witnessed a steep fall after a breakdown of the broad consolidation formed in a 1.0476-1.0533 range.
Renewed strength in the United States economy after upbeat economic data has propelled pessimism for risk-sensitive assets. Meanwhile, the US Dollar Index (DXY) has turned sideways around 105.60 after an open rejection-reverse move in early Asia. S&P500 futures are attempting hard to regain traction but a solid risk-averse theme is fading signs of recovery. The 10-year US Treasury yields are attempting firm to extend gains above 3.55%.
US data-inspired optimism unlocks inflation barriers
For the past year, the Federal Reserve (Fed) is working day and night to contain mounting inflation. Federal Reserve chair Jerome Powell announced a balance sheet reduction and escalated interest rates at a significant pace to bring a slowdown in inflation. However, synergy generated by the hot labor market and stellar demand in the service sector has displayed signs of sheer strength in the United States economy.
Strength in an economy is a significant filter for accelerating inflation in an economy. To augment the tight labor market and upbeat demand in service sectors, firms will get forced to continue the recruitment process. Also, a tight labor market will be delighted with higher earnings, which may trigger retail demand ahead. It seems that the next opponent, which will present a tough fight in front of the Federal Reserve is the wage-inflation. Therefore, the interest rate peak in the United States economy is far from reach for now.
Federal Reserve’s higher interest rate peak supports recession
Odds are favoring a higher interest rate peak by the Federal Reserve rather than the continuation of the current interest rate hike pace to offset fresh evidence of strength in the United States economy. There is no denying the fact that a higher neutral rate will weigh significantly on the inflationary pressures but will simultaneously lead to an economic crash.
Firms are still unhappy with accelerating interest rates and now higher guidance for a neutral rate will force them to call-off expansion plans. This may also push the economy into recession and the equities will face the heat again. It may also result in higher delinquency costs for commercial banks as households could miss payments of interest obligations due to higher interest rates.
European Central Bank policymakers expected interest rate to peak sooner
Eurozone inflation has displayed signs of exhaustion in its preliminary November report led by higher unemployment and interest rates by the European Central Bank (ECB). Also, monthly Retail Sales data contracted by 1.8% while expectations were aiming for a 1.7% contraction this week. And, annual Retail Sales contracted 2.7% against the consensus of 2.6% contraction. Ceteris Paribus, a decline in consumer spending is hinting that inflation will fell under the control.
In response to that, European Central Bank policymakers believe that the central bank will continue to hike interest rates but the neutral rate is not so far from here, which is impacting the Euro.
ECB Chief Economist Phillip Lane is dubious about the inflation peak as it has been achieved or still to come next year. He further added that he expects more rate hikes ahead but "a lot has been done already".
While, Constantinos Herodotou, Governor of the Central Bank of Cyprus said that “There will be another hike in rates, but we are very near neutral rate.”
Going forward, the speech from European Central Bank President Christine Lagarde will be of utmost importance, which is scheduled for Thursday.
EUR/USD technical outlook
-638059883112319177.png)
EUR/USD is declining towards the upward-sloping trendline placed from November 3 low at 0.9730. The major currency pair has dropped below the 20-period Exponential Moving Average (EMA) at 1.0487 while the 50-EMA at 1.0451 is still untouched.
The Relative Strength Index (RSI) (14) has shifted into the 40.00-60.00 range, which indicates a consolidation ahead.
China’s National Health Commission (NHC) announces new Covid prevention and control guidelines ahead of the official government press conference on further optimization of Covid control at 07:00 GMT.
Key takeaways
Asymptomatic patients, cases with mild symptoms can undergo home quarantine.
To accelerate vaccination of elderly against Covid.
To allow home quarantine for close contacts.
Scraps requirement for negative Covid test in most public venues nationwide.
Bans movement restrictions in non-high risk zones.
No longer require negative Covid test and health codes for domestic travel.
High-risk zones with no new infections for 5 straight days should be released from lockdown in a timely manner.
To accurately define high-risk zones by building, units, households (not arbitrarily expand it to residential compounds, communities).
Market reaction
AUD/USD is seeing renewed demand on the Chinese covid restrictions relaxation, trading 0.16% higher at 0.6702, as of writing.
- GBP/JPY picks up bids to reverse the previous day’s pullback from one-week high.
- Bullish MACD signals, sustained bounce off 21-SMA favor buyers.
- 200-SMA, five-week-old descending trend line challenge upside moves.
GBP/JPY picks up bids to print mild gains around 166.65 heading into Wednesday’s London open. In doing so, the cross-currency pair bounces off the 21-SMA to reverse the previous day’s losses from the one-week high.
The recovery moves also take clues from the bullish MACD signals to keep the GBP/JPY buyers hopeful.
However, a convergence of the 200-SMA and downward-sloping resistance line from the October-end, near 167.30, appears a tough nut to crack for the pair buyers.
In a case where the GBP/JPY crosses the 167.30 hurdle, a run-up towards the late November swing high near 169.00 and then to the 170.00 psychological magnet appears imminent.
It’s worth noting that the previous monthly peak surrounding 171.00 and October’s high around 172.15 could please the GBP/JPY buyers past 170.00.
Alternatively, pullback moves remain elusive beyond the 21-SMA support of 166.00.
Following that, an ascending trend line from November 11, close to 164.25 by the press time, could act as the last defense of the GBP/JPY buyers.
Should the cross-currency pair remains bearish past 164.25, and also break the 164.00 threshold, the odds of witnessing a slump toward October’s low near 159.70 can’t be ruled out.
GBP/JPY: Four-hour chart
Trend: Limited upside expected
- USD/INR eases from one-month high on the Reserve Bank of India (RBI) rate hike.
- RBI announces 0.35% increase to benchmark Repo rate, as expected.
- Sluggish US Dollar, cautious optimism surrounding China and sticky Oil price also favor Indian Rupee.
USD/INR fades upside momentum, after an initial pullback from the monthly high, as the Reserve Bank of India’s (RBI) interest rate increased on Wednesday. That said, the Indian Rupee (INR) pair remains firmer around a one-month high near 82.70 by the press time.
RBI matches market forecasts of announcing 35 basis points (bps) of increase into the benchmark Repo Rate to 6.25%. The Indian central bank also increased the standing deposit facility rate and marginal standing facility rate by 35 bps. It’s worth noting, however, that RBI Governor Shaktikanta Das signaled that Inflation remains elevated and the economy is resilient.
Ahead of the RBI’s verdict, a Reuters poll mentioned that the battered Indian Rupee will not recoup most of its recent losses over the coming year thanks to a persistent current account deficit and a central bank nearing the end of its rate-hiking cycle. The survey also mentioned, “A widening trade deficit driven by rising oil prices along with expectations for a prolonged U.S. Federal Reserve policy tightening cycle is partly responsible for an 11% year-to-date fall in the Rupee to a record low of 83.29 per the US Dollar in October.”
On Tuesday, the World Bank mentioned that India is well placed to navigate global headwinds while also stating, “An unexpected hike by the US Fed could lead to rupee depreciation, rise in retail inflation in India.”
Elsewhere, fears of economic recession contrast with China’s Covid-linked headlines and downbeat trade numbers to challenge the USD/INR traders. Also likely acting as trade filters could be the inaction of Oil prices and mixed performance of the global markets amid the pre-Fed blackout period for the US central bank officials.
Against this backdrop, US stock futures print mild gains but stocks in the Asia-Pacific zone trade mixed. Further, the US 10-year Treasury yields pick up bids to 3.55% by reversing the previous day’s losses.
Having witnessed the initial reaction to the RBI’s moves, USD/INR traders should rely on the risk catalysts amid a light calendar ahead of Thursday’s China inflation numbers and Friday’s preliminary readings of the US Michigan Consumer Sentiment Index.
Technical analysis
A daily closing beyond the seven-week-old resistance line, around 82.75 by the press time, appears necessary for the USD/INR bulls to keep the reins. Otherwise, nearly overbought RSI (14) suggests a pullback towards the 81.90 support confluence including the 50-DMA and multiple levels marked since late October.
- GBP/USD is aiming to build a cushion around 1.2120 as the US Dollar is displaying chaotic moves.
- Phenomenal strength in the United States economy is not favorable for Fed’s current monetary policy.
- UK’s food supply crisis is expected to accelerate already higher food inflation further.
The GBP/USD pair has witnessed a marginal correction after picking demand near the crucial support of 1.2120 in the Asian session. The Cable has attempted a recovery backed by volatile moves shown by the US Dollar Index (DXY). It would be early to cite that the risk aversion theme has faded amid an absence of a positive trigger. Therefore, the Cable’s recovery moves need to pass more filters ahead.
The USD Index is displaying topsy-turvy moves after failing to extend gains above the critical hurdle of 105.70. Meanwhile, S&P500 futures have also picked up minimal demand after remaining lackluster in early Tokyo. The United States equities witnessed a sharp sell-off consecutively for two trading sessions as expectations for a higher interest rate peak by the Federal Reserve (Fed) have renewed fears of recession. The 10-year US Treasury yields are hovering around 3.55%.
The synergy created by upbeat US Nonfarm Payrolls (NFP) and robust service sector demand has triggered expectations of positive de-anchoring in short-term inflation expectations. Phenomenal strength in the United States economy is not favorable for Fed’s current monetary policy. Fed chair Jerome Powell is putting efforts into achieving price stability and solid economic prospects to propel inflationary pressures.
This has fuelled expectations for a higher interest rate peak to contain runaway inflation. However, the odds of a slowdown in the current pace for the interest rate hike have not faded yet.
On the United Kingdom front, the soaring food supply crisis has triggered expectations of higher food inflation. Earlier, the British Retail Consortium (BRC) reported UK food price inflation hit a new high of 12.4%. As the food supply crisis has soared led by a shortage of labor and sky-rocketing input costs, food inflation will receive more strength and may accelerate headline inflation ahead.
- USD/CAD seesaws around one-month high ahead of the key Bank of Canada (BOC) Monetary Policy Meeting.
- Clear break of previously important resistance line, 50-DMA join bullish MACD signals to favor buyers.
- The 1.3300 threshold is the last defense of USD/CAD buyers.
USD/CAD struggles for clear directions as bulls take a breather after a three-day uptrend, making rounds to the monthly high near 1.3650 during early Wednesday. In doing so, the Loonie pair portrays the trader’s anxiety ahead of the BOC Interest Rate Decision.
Even so, the successful break of the 50-DMA and downward-sloping resistance line from October 13, respectively near 1.3570 and 1.3535, keeps the USD/CAD buyers hopeful.
On the same line could be the bullish MACD signals and the recent failures to welcome bears despite a sluggish session.
That said, November’s high of around 1.3810 lures the short-term USD/CAD bulls before pushing them to confront multiple hurdles near 1.3850.
However, a sustained break of the 1.3850 mark could help the pair to challenge the yearly top marked in October around 1.3980.
On the contrary, pullback moves may initially test the 50-DMA and the resistance-turned-support, close to 1.3570 and 1.3535 in that order.
Following that, a three-week-old ascending trend line near 1.3410 could challenge the USD/CAD bears.
It’s worth noting that a convergence of the 100-DMA and an ascending trend line from late August, around 1.3310-3300 could act as the final defense for the USD/CAD buyers, a break of which will give control to the bears.
Also read: USD/CAD bulls brace for BOC’s interest rate hike amid downbeat oil prices, firmer US Dollar
USD/CAD: Daily chart
Trend: Further upside expected
- Gold price lacks clear directions as sellers attack the key support amid mixed clues.
- XAU/USD traders remain confused as recession woes contrast with China losing Zero-Covid policy.
- Pre-Fed caution, downbeat US inflation expectations also act as trading filters.
- Risk catalysts could entertain Gold traders ahead of the busy days starting from Thursday.
Gold price (XAU/USD) treads water around $1,770 as bulls and bears jostle amid light calendar and mixed clues during early Wednesday.
The yellow metal’s struggle for clear directions recently got amplified as China’s trade surplus eased in November as the Imports and Exports both dropped during the stated month. On the same line is the gradual pick-up in the US Treasury yields amid fears of a global economic slowdown.
It’s worth noting that multiple top-notch company representatives and bank officials have recently raised fears of a global recession. On the same line were comments from Bloomberg Economics.
However, China’s readiness for announcing prudent fiscal and monetary policies, as well as hints of gradually removing the three-year-old Zero-Covid policy, seems to put a floor under the Gold price.
Amid these plays, US stock futures print mild gains but stocks in the Asia-Pacific zone trade mixed. That said, the US inflation expectations fail to defend the hawkish bets on the Fed’s next move during the pre-FOMC blackout.
Looking forward, China’s likely risk-positive announcements and second-tier data may entertain Gold traders ahead of Thursday’s China inflation numbers and Friday’s preliminary readings of the US Michigan Consumer Sentiment Index.
Gold price technical analysis
Not only a clear U-turn from the six-month-old horizontal resistance zone, around $1,805, but the sustained downside break of the 200-DMA, close to $1,794, also keeps the Gold sellers hopeful despite the sluggish MACD signals.
Also acting as a downside filter, as well as the immediate challenge for the XAU/USD bears, is an upward-sloping support line from November 08, close to $1,765.
In a case where the yellow metal remains bearish past $1,765, the previous week’s low surrounding $1,740 may lure the sellers before directing them to the tops marked in September and October, respectively near $1,735 and $1,730.
Alternatively, the 61.8% Fibonacci retracement level of the metal’s June-September downside and the 200-DMA, around $1,779 and $1,794 in that order, could test the Gold buyers before portraying another attempt to cross the $1,805 hurdle.
Overall, the Gold price remains bearish but a clear break of the $1,765 appears necessary for the sellers.
Gold price: Daily chart
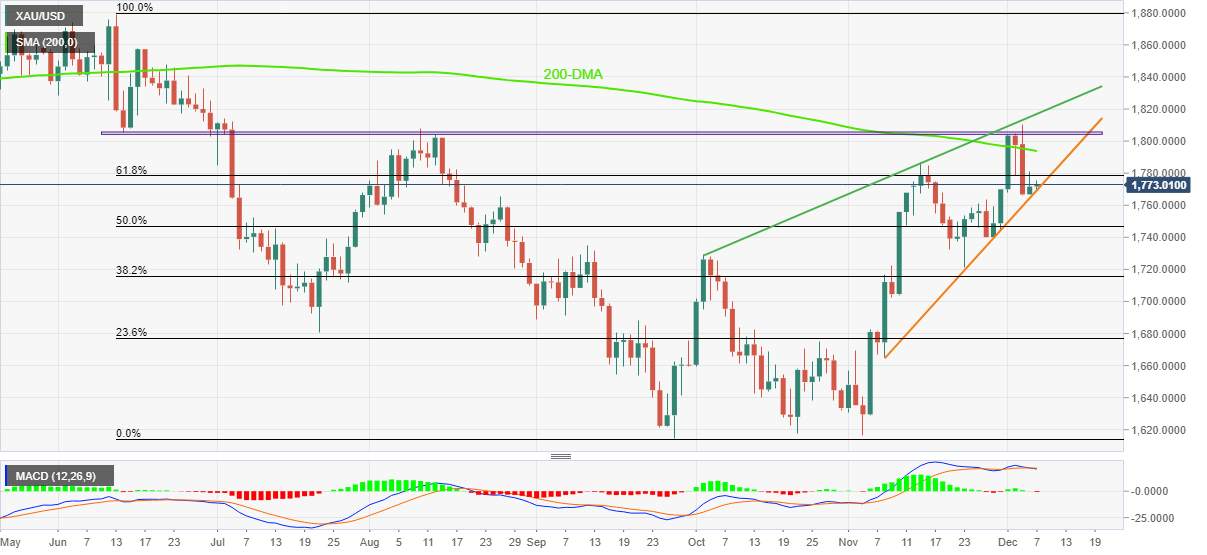
Trend: Further downside expected
- NZD/USD has dropped below 0.6320 on the downbeat China Trade Balance and a recovery in risk-off impulse.
- China’s Trade Balance has slipped sharply to $69.84B in comparison with the estimates of $78.1B.
- This week, China’s inflation is seen lower at 1.0% vs. the former release of 2.1%.
The NZD/USD pair has witnessed intense selling pressure after failing to cross the critical resistance of 0.6350 in the Asian session. The Kiwi asset has been dumped by the market participants as China’s National Bureau of Statistics has reported downbeat Trade Balance data.
In US Dollar terms, Exports have dropped by 8.6% vs. the consensus of 3.5% and Imports have tumbled by 10.6% against the projections of 6.0%. China’s Trade Balance has slipped sharply to $69.84B in comparison with the estimates of $78.1B. It is worth noting that New Zealand is one of the leading trading partners of China and a weak China Trade Balance has a significant impact on New Zealand Dollar.
Meanwhile, the risk-aversion theme has strengthened further, and the appeal for safe-haven assets has increased. The US Dollar Index (DXY) has rebounded firmly after dropping to near 105.50 and is expected to extend its gains above the fresh four-day high of 105.69. S&P500 futures are displaying a rangebound structure after a sell-off on Tuesday, portraying pessimism for risk-sensitive assets. The 10-year US Treasury yields have resurfaced above 3.55%.
Going forward, investors will focus on the release of China’s Consumer Price Index (CPI), which will release on Friday. As per the projections, the annual CPI is expected to drop vigorously to 1.0% from the prior release of 2.1%. This could force the People’s Bank of China (PBOC) to ease policy further. Also, easing Covid19 restrictions in China has fuelled optimism, which could be carried further by stimulus packages effectively.
- AUD/USD has slipped below the 0.6700 cushion again on weak China Trade Balance data.
- China’s November Exports and Imports have dropped by 8.7% and 10.6% respectively.
- The risk-off impulse has trimmed marginally as investors are shrugging off US data-inspired pessimism.
The AUD/USD pair has sensed selling pressure and has dropped below 0.6700 again as China’s National Bureau of Statistics has reported weaker-than-projected Trade Balance data. In US Dollar terms, Exports have dropped by 8.6% vs. the consensus of 3.5% and Imports have tumbled by 10.6% against the projections of 6.0%. China’s Trade Balance has slipped sharply to $69.84B in comparison with the estimates of $78.1B.
Earlier, the AUD/USD pair scrolled above the round-level resistance of 0.6700 after the Australian economy reported weak Gross Domestic Product (GDP) data. The annual GDP data landed at 5.9%, lower than the expectations of 6.3% and the prior release of 3.6%. While quarterly GDP data dropped to 0.6% vs. the projections of 0.7% and the former release of 0.9%.
A slowdown in the Australian economy is expected to cheer the Reserve Bank of Australia (RBA) as it is a sign of a forward decline in inflation. A lower growth rate indicates a decline in economic activities, which forces firms to trim the prices of goods and services.
It is worth noting that the RBA hiked its Official Cash Rate (OCR) by 25 basis points (bps) to 3.10% on Tuesday. This was the third consecutive 25 bps rate hike by RBA Governor Philip Lowe. The Australian central bank has shifted to smaller rate hike culture to avoid financial risks to the economy.
Meanwhile, the risk-aversion theme has eased marginally as investors are shrugging off United States data-inspired pessimism in the global markets. The US Dollar Index (DXY) has slipped below the immediate support of 105.60. It would be early calling the minor correction in the US Dollar a reversal amid an absence of any potential positive trigger for the risk-sensitive currencies.
China's Trade Balance for November, in Chinese Yuan terms, came in at CNY494.3 billion versus CNY575.45 expected and CNY586.81 billion last.
The exports rose by 0.9% last month vs. 7.0% previous.
The country’s imports dropped by 1.1% vs. 4.1% expected and 6.8% prior.
In US Dollar terms,
China reported a reduction in the trade surplus, as exports and imports showed a bigger-than-expected slump.
Trade Balance came in at +69.84B versus +78.10B expected and +85.15B previous.
Exports (YoY): -8.7% vs. -3.5% exp. and -0.3% prior.
Imports (YoY): -10.6% vs. -6.0% exp. and -0.7% last.
Meanwhile, China’s Jan-Nov Yuan-denominated Exports arrived at +11.9% YoY.
China’s Jan-Nov Yuan-denominated Imports came in at +4.6% YoY.
China’s Jan-Nov Trade Balance stood at CNY+5.34 trillion.
China’s Jan-Nov Dollar-denominated Exports: +9.1% YoY.
China’s Jan-Nov Dollar-denominated Imports: +2.0% YoY.
FX implications
AUD/USD has come under fresh selling pressure on disappointing Chinese trade figures, slipping below 0.6700 once again. The spot is trading flat on the day at 0.6690, as of writing.
- USD/JPY eases from one-week high, fades bounce off 200-DMA.
- Impending bull cross on MACD, falling wedge formation keeps buyers hopeful.
- Sellers have a bumpy road to travel unless breaking August month’s low.
USD/JPY takes offers to refresh intraday low around 136.90, extending pullback from a one-week high during early Wednesday.
In doing so, the Yen pair reverses from a downward-sloping resistance line from early November while fading the weak-start bounce off the 200-DMA.
However, the looming bull cross on the MACD indicator joins the falling wedge bullish chart formation to challenge the USD/JPY sellers.
That said, the 200-DMA level surrounding 134.70 restrict the short-term downside of the pair ahead of the lower line of the stated wedge, near 132.70.
Following that, lows marked in August month around 131.75 and 130.40 will precede the 130.00 psychological magnet to challenge the USD/JPY pair’s further downside.
It’s worth noting, however, that the Yen pair’s sustained trading below 130.00 could make it vulnerable to slump toward May’s low near 126.35.
Meanwhile, recovery moves need to provide a successful break of the stated wedge’s upper line, near 137.45 by the press time.
Even so, a downward-sloping resistance line from late October could challenge the USD/JPY bulls around 139.80.
Following that, the 140.00 round figure and the late November swing high near 142.25 may act as buffers during the run-up towards the theoretical target of the falling wedge, close to 151.40.
USD/JPY: Daily chart
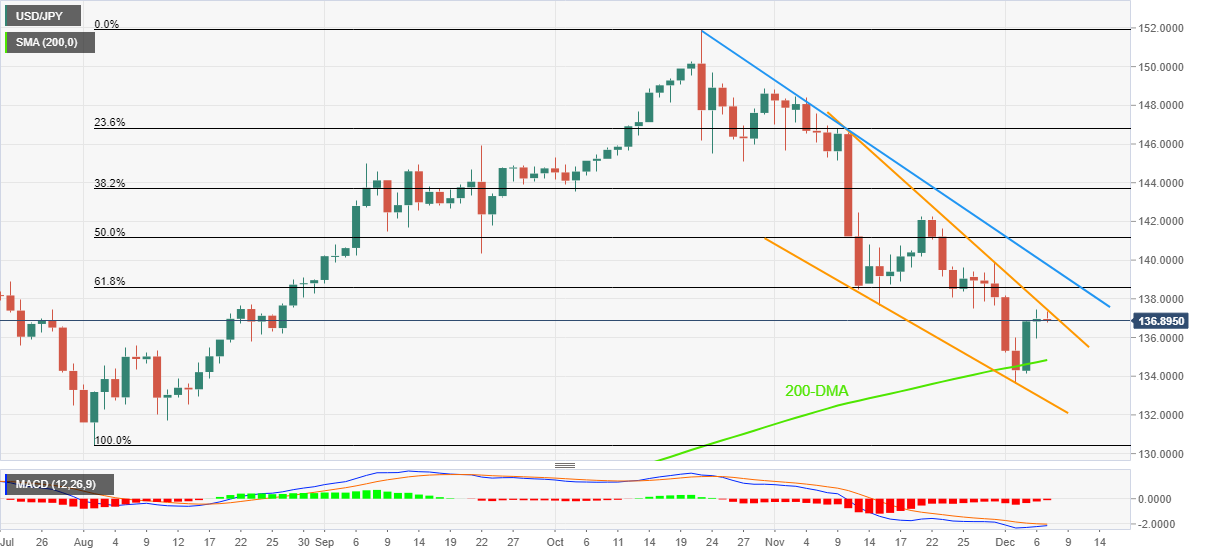
Trend: Further upside expected
Chinese Communist Party's Politburo held its annual meeting on December 6, with the key highlights reported by Xinhua News Agency.
Will implement active fiscal policy and prudent monetary policy next year.
China to seek progress while maintaining stability next year.
To optimize epidemic prevention and control measures.
Plan to allow home quarantine, to ease Covid testing.
Efforts should be made to expand domestic demand.
Necessary to effectively prevent and defuse major economic, financial risks.
Hold the bottom-line of preventing systemic risks.
Necessary to promote high-level opening up to the outside world, attract and utilize foreign capital.
Market reaction
AUD/USD is unfazed by the above comments, holding gains above 0.6700 ahead of Chinese trade data. Meanwhile, USD/CNY was last seen trading 0.29% lower at 6.9746.
| Raw materials | Closed | Change, % |
|---|---|---|
| Silver | 22.198 | -0.12 |
| Gold | 1771.12 | 0.19 |
| Palladium | 1842.88 | -1.39 |
- EUR/USD renews intraday high as bears take a breather after two-day downtrend.
- Fear of economic slowdown jostle with China-linked optimism to challenge market sentiment.
- Mixed comments from ECB policymakers, firmer German Factory Orders underpin bullish bias.
- Softer US trade numbers, absence of Fed talks add strength to the recovery hopes as traders await final reading of Eurozone Q3 GDP.
EUR/USD picks up bids to refresh intraday high near 1.0470 during early Wednesday. However, the quote remains on the bear’s radar as it fails to print major gains ahead of the final readings of the Eurozone Gross Domestic Product (GDP) for the third quarter (Q3).
The reason for the pair’s recent uptick could be linked to the market’s mixed sentiment and a lack of major data/events. However, broad-based fears of recession, recently backed by the United States Heads of Goldman Sachs, Bank of America Corp and JPMorgan Chase, keeps the EUR/USD bears hopeful.
That said, Bloomberg Economics also forecasted the lowest economic growth since 1993, to 2.4% for 2023.
Alternatively, hopes of China’s easing to its three-year-old Zero-Covid policy on Wednesday, per Reuters, underpin the bullish bias for the EUR/USD pair. Beijing’s latest move could be linked to the receding virus infections from the record high, as well as multiple announcements suggesting more unlocking of the virus-hit economy that’s the second biggest in the world.
Further, mixed comments from the European Central Bank (ECB) officials and mixed Eurozone data appear to challenge the EUR/USD bears.
On Tuesday, Constantinos Herodotou, Governor of the Central Bank of Cyprus and member of the ECB Governing Council said, “There will be another hike in rates, but we are very near neutral rate.” On the same line, ECB Chief Economist Phillip Lane expressed his take on inflation and interest outlook on Tuesday while saying, “Expect more rate hikes but ‘a lot has been done already’”. It should be noted that Germany’s Factory Orders for October improved to -3.2% YoY versus -7.5% market forecasts and -10.8% prior.
On the other hand, the US Goods and Services Trade Balance deteriorated to $-78.2 billion versus $-79.1 billion expected and $-73.28 billion prior.
Sluggish US Treasury bond yields and the stock futures favor the bullish bias for the EUR/USD pair as traders await China’s likely risk-positive announcements, as well as the Eurozone GDP. That said, the looming fears of the recession could weigh on the pair if the scheduled growth numbers drop below the initial forecasts of 0.2% QoQ and 2.1% YoY.
Technical analysis
EUR/USD trades inside a one-month-old rising wedge bearish chart formation. Also keeping the sellers hopeful are downbeat MACD signals and the steady RSI line, placed at 14.
However, a clear downside break of the 1.0420 support, as well as the sustained trading below the 200-DMA level surrounding 1.0355, becomes necessary for the EUR/USD bears to dominate further.
Speaking at a Wall Street Journal (WSJ) event on Tuesday, Goldman Sachs Chief Executive Officer (CEO) David Solomon said that he sees about 65% odds of the US economy entering a recession in 2023.
Key quotes
“Probability of a "soft landing", that is, a slowdown in inflation that doesn't tip the economy into recession for the US economy at 35%.”
"I would define a soft landing as we get inflation back close to 4% inflation, maybe we have a 5% terminal rate and we have 1% growth"
"I think there's a reasonable possibility we could navigate a scenario like that."
"But I also think there's a very reasonable possibility that we could have a recession of some kind.”
He said “stocks will be lower, oil lower and the US Dollar to rise slightly.”
- Silver price snaps two-day downtrend after printing bullish candlestick the previous day.
- Rebound from 10-day EMA, bullish MACD signals also keep the XAG/USD buyers hopeful.
- Monthly bullish channel keeps also favors silver bulls, $21.60 holds the key to bear’s entry.
Silver price (XAG/USD) picks up bids to $22.25 as it justifies the previous day’s bullish candlestick formation during early Wednesday. In doing so, the bright metal also bounces off the 10-day Exponential Moving Average (EMA).
It’s worth noting that the bullish MACD signals and a one-month-old ascending trend channel also keep the XAG/USD buyers hopeful.
That said, the $23.00 round figure and the latest peak surrounding $23.50 lure the Silver buyers of late.
Following that, the upper line of the aforementioned bullish channel, close to $23.70 by the press time, could challenge the XAG/USD upside.
In a case where the commodity prices rally beyond $23.70, March month’s low near $24.00 could act as the last defense of the silver bears.
On the flip side, the 10-day EMA restricts the immediate downside of the Silver around the $22.00 round figure.
However, a convergence of the 21-day EMA and the stated bullish channel’s lower line, around $21.60, appears a tough nut to crack for the Silver bears.
Should the metal price break the $21.60 support confluence, October’s high near $21.25 might act as the validation point for the metal’s further downside.
Silver price: Daily chart
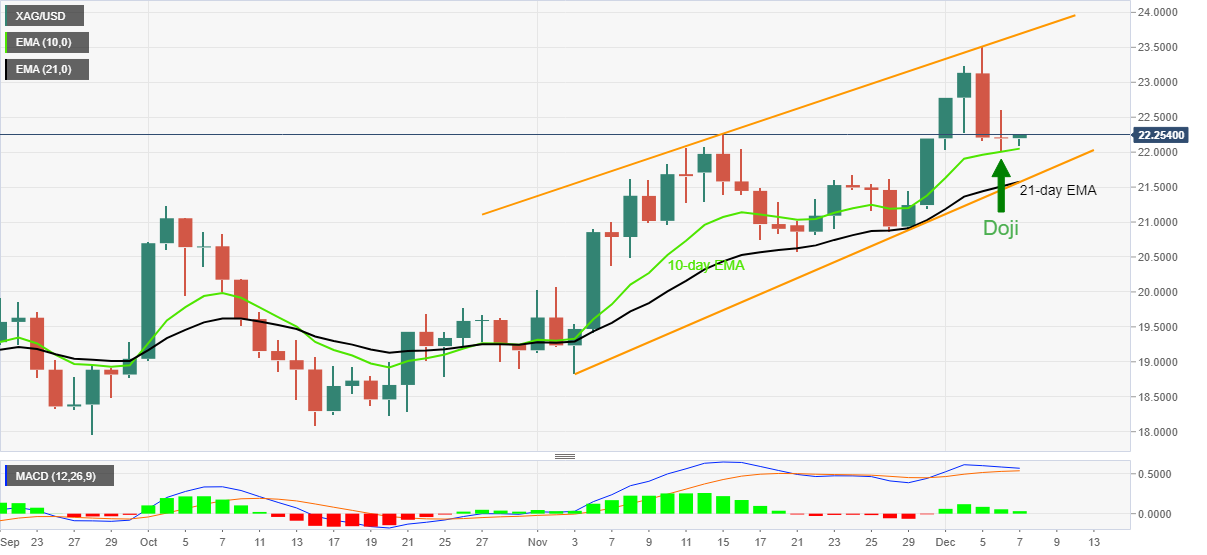
Trend: Recovery expected
According to the latest Reuters poll of market strategists, the US Dollar is set to make a solid comeback against most currencies next year amid growing fears of a US recession, which will revive its safe-haven appeal.
Key takeaways
“The greenback will trade around current levels a year from now and hold on to its near-10% gains so far this year, despite its recent setback.”
“Nearly two-thirds or 33 of 51 strategists who answered an additional question said the greater dollar risk over the coming month was that it would rebound rather than falling further.”
“An overwhelming 80% majority, or 42 of 51 respondents, said there was not much scope for dollar upside based on monetary policy.”
more to come ...
- USD/CAD grinds near the highest levels in a month, pauses three-day uptrend.
- Mixed sentiment keeps US Dollar on the front foot, WTI crude oil fades bounce off yearly low.
- BOC is expected to announce 0.50% rate hike, clues on the end of tightening cycle will be crucial for clear directions.
USD/CAD grinds higher around 1.3660 even as the Loonie pair traders turn cautious ahead of Wednesday’s Bank of Canada (BOC) Interest Rate Decision. In doing so, the quote remains sidelined after rising in the last three consecutive days to the highest levels in one month.
The reason for the USD/CAD pair’s upside could be linked to the market’s rush towards the US Dollar amid fears surrounding the global economic slowdown. Additionally weighing the Loonie pair could be the downbeat prices of Canada’s key export item, namely WTI crude oil.
That said, WTI crude oil prints a four-day downtrend around the yearly low by flashing 0.30% intraday loss near $74.25 at the latest. The black gold’s weakness is easily traceable to the firmer US Dollar and economic fears.
On the other hand, the US Dollar Index (DXY) extends the week-start recovery from the five-month low as top executives from the major US banks raised fears of a global economic slowdown. Among them were the United States Heads of Goldman Sachs, Bank of America Corp and JPMorgan Chase. Additionally, Bloomberg Economics also forecasted the lowest economic growth since 1993, to 2.4% for 2023.
It’s worth noting that optimism surrounding China challenges the USD/CAD bulls. China is up for conveying more easing to its three-year-old Zero-Covid policy on Wednesday, per Reuters, which in turn could trigger the risk-on mood and weigh on the US Dollar. Beijing’s latest move could be linked to the receding virus infections from the record high, as well as multiple announcements suggesting more unlocking of the virus-hit economy that’s the second biggest in the world.
While portraying the mood, the S&P 500 Futures print mild gains near 3,950 whereas the US 10-year Treasury yields cling to 3.54% mark after the previous day’s downbeat performances of Wall Street and the key Treasury bond yields.
Looking forward, a light calendar and mixed sentiment, not to forget the pre-BOC anxiety, may restrict the USD/CAD moves. However, China's trade numbers and the aforementioned risk catalysts could entertain the traders.
It should be observed that the BOC is widely anticipated to announce 50 basis points (bps) rate hike to its benchmark interest rate. However, the USD/CAD bulls will be more interested in hearing about the end of the tightening cycle.
Also read: Bank of Canada Preview: The end of the tightening cycle is around the corner
Technical analysis
A clear upside break of the 50-DMA and a two-month-old descending trend line, respectively near 1.3570 and 1.3535, keep the USD/CAD buyers hopeful ahead of the key event.
- GBP/USD H4 M-formation makes for a possibility of correction prior to further declines.
- Bears eye trendline support for their days ahead.
As per the prior analyses, GBP/USD bears step up the pace, eye break of 1.2150s, and GBP/USD Price Analysis: Bulls look to 1.2450 while bears eye test of 1.2100, the British Pound has continued to chip away into commitments below 1.2200 and at 1.2150. The low of the week so far has been 1.2121 and the following illustrates the prospects of a deeper correction should the bears stay the course.
GBP/USD prior analysis
While it was stated that the British Pound's bullish trend would still be intact while structures 1.2150 and 1.1900 are yet to be broken:
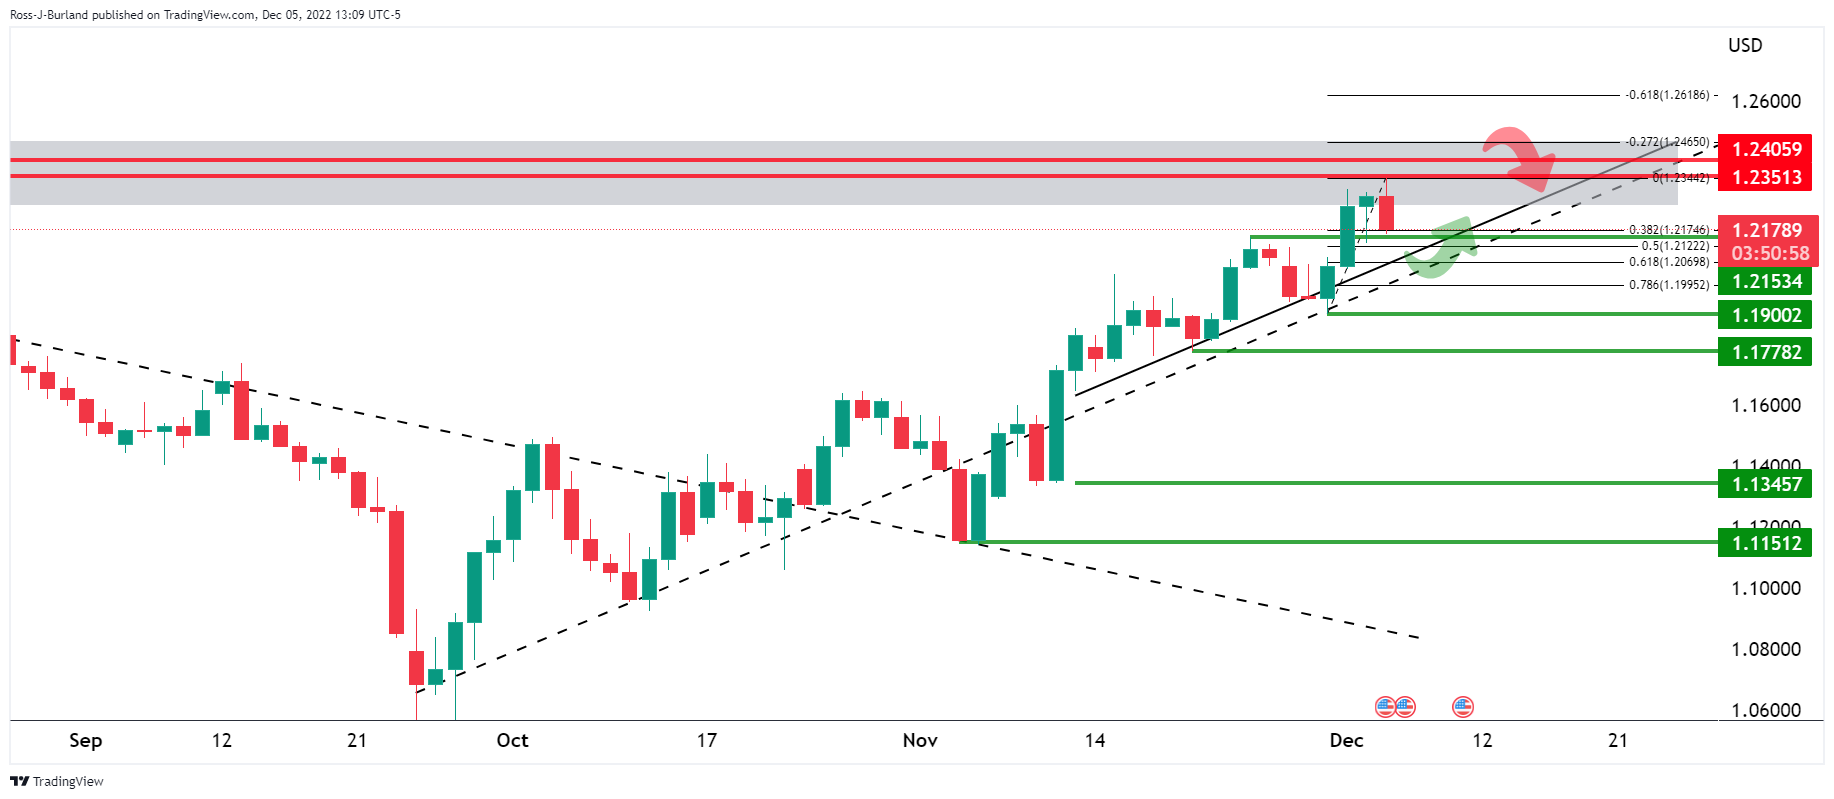
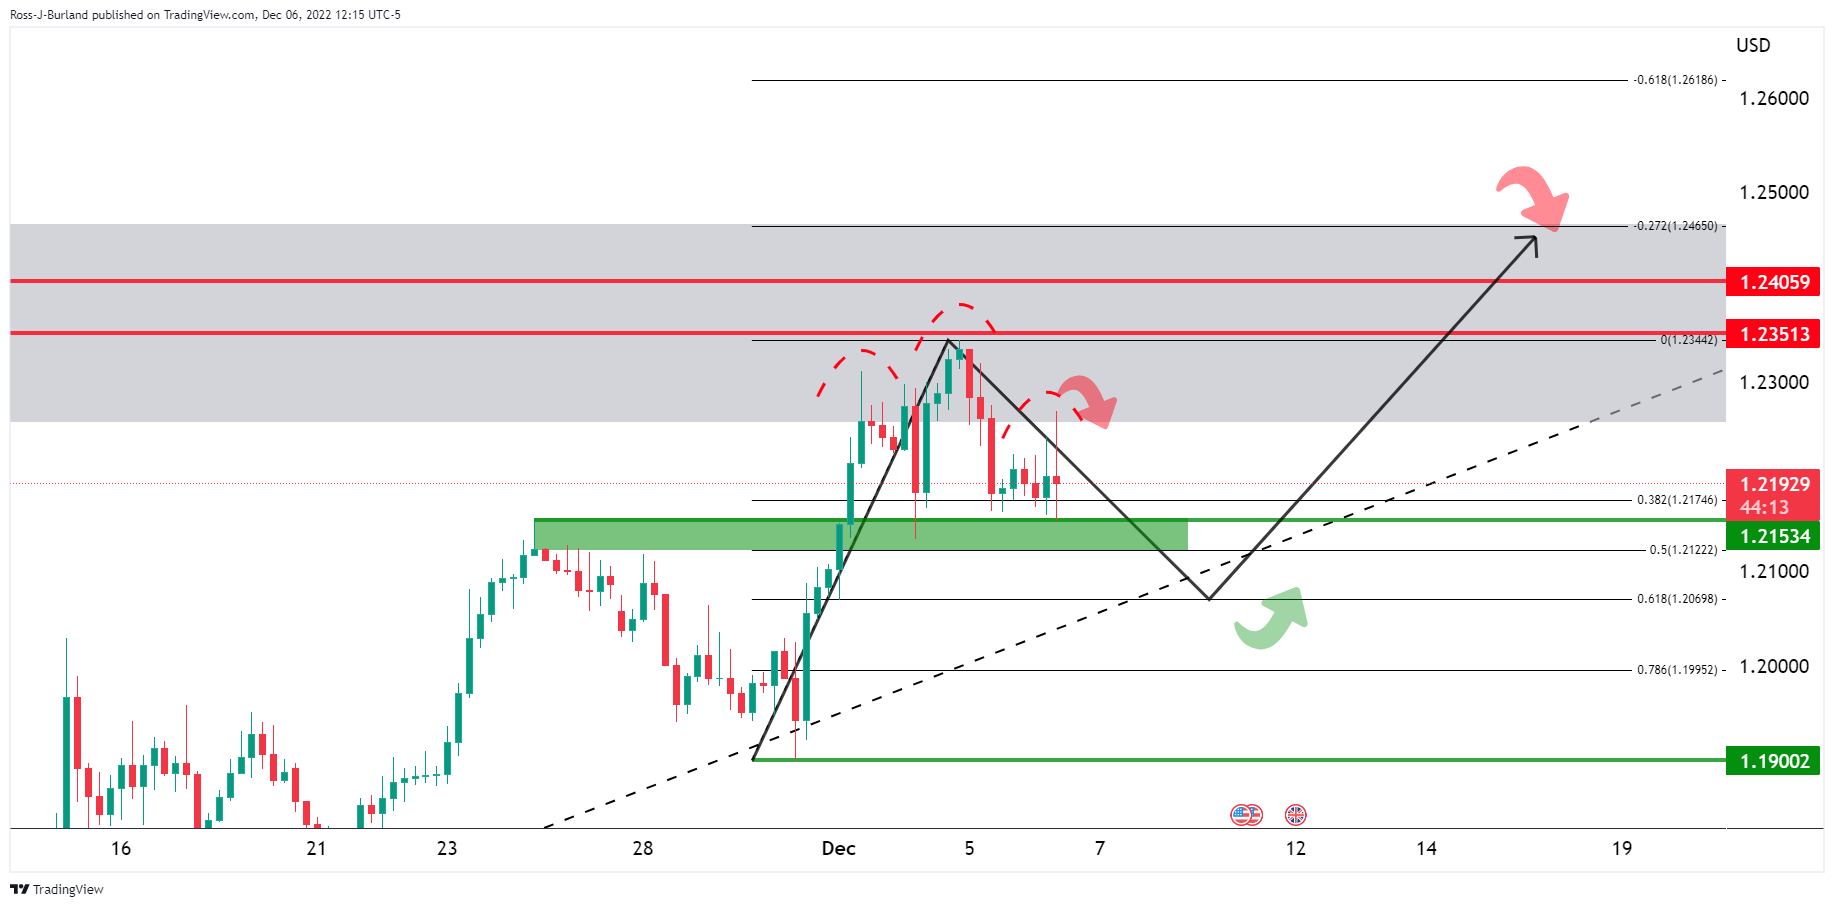
In the 4-hour chart, we could see that the price was forming a head & shoulders pattern with lower highs in the right-hand shoulder. This gave rise to the prospects of a break of structure in the 1.2150s for a move into testing the trendline support and commitments at 1.21 the figure.
GBP/USD update
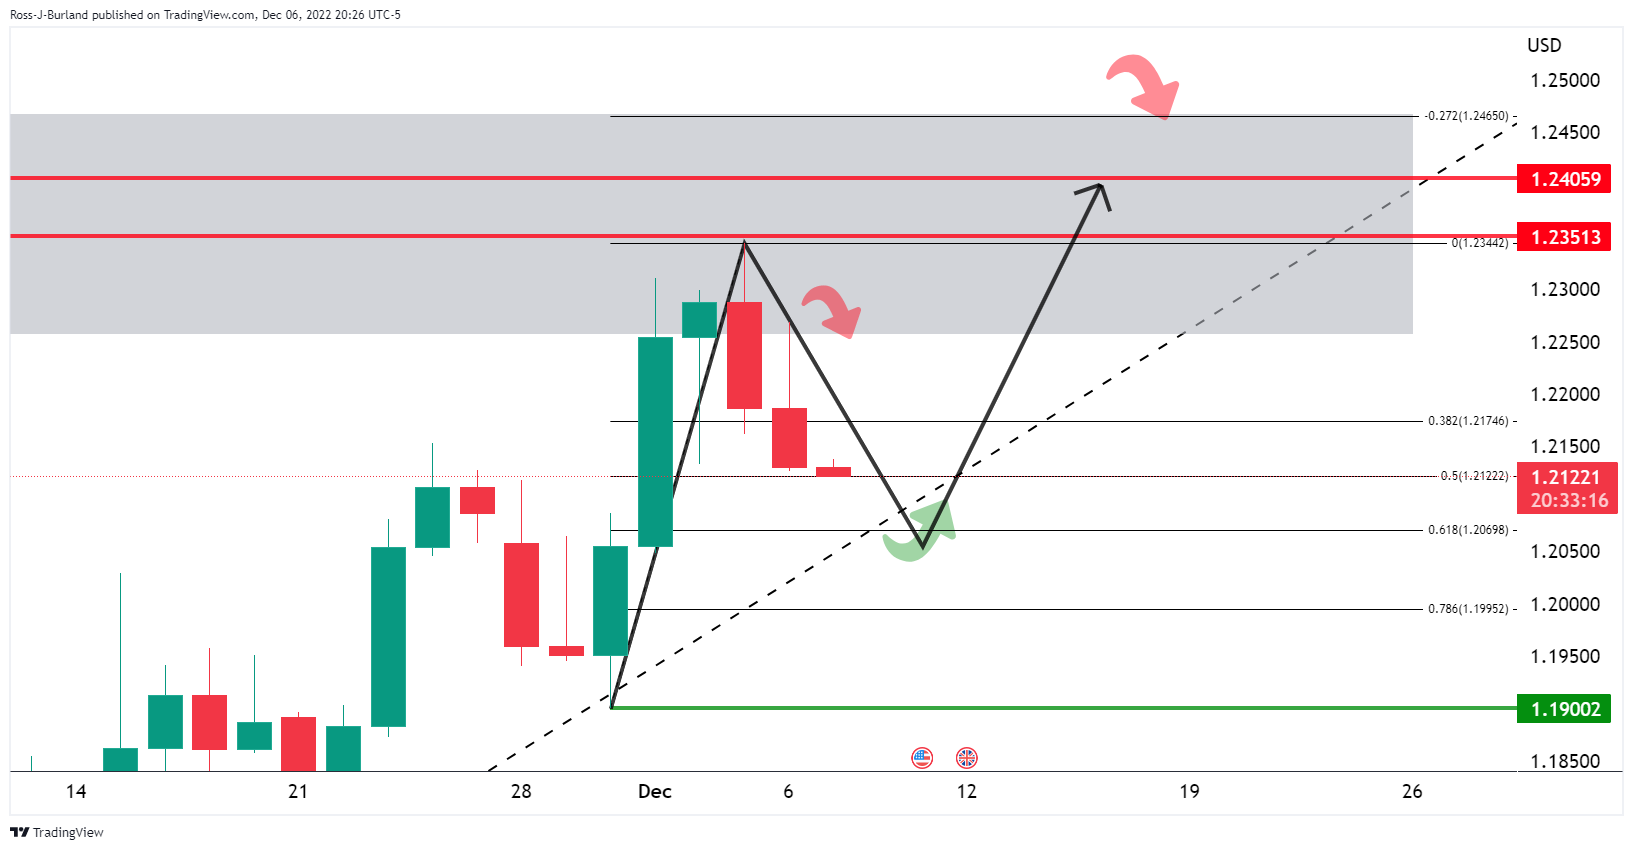
As illustrated, the price continues to decline on the daily chart as anticipated.
On the 4-hour chart, the H&S pattern is playing out as follows:
Zoomed in...
The M-formation is a reversion pattern so a return to the neckline is a strong possibility prior to further declines towards the trendline support.
Bank of Japan's board member NakamuraToyoaki said that Japan's economy is still in the midst of recovering from a pandemic-induced slump and that the central bank must patiently maintain monetary easing.
Key comments
Current price rises not accompanied by wage hikes.
Japan is far from situation where wage-inflation spiral becomes a concern.
Japan's economy picking up, likely to recover.
Japan's consumer inflation accelerating but likely to slow pace of rise next year as boost from energy, food price hikes dissipate.
Global financial, capital conditions could tighten more than expected depending on fallout from overseas central banks' rate hikes.
Domestic, overseas economies may weaken further if rises in raw material, grain costs are prolonged.
USD/JPY update
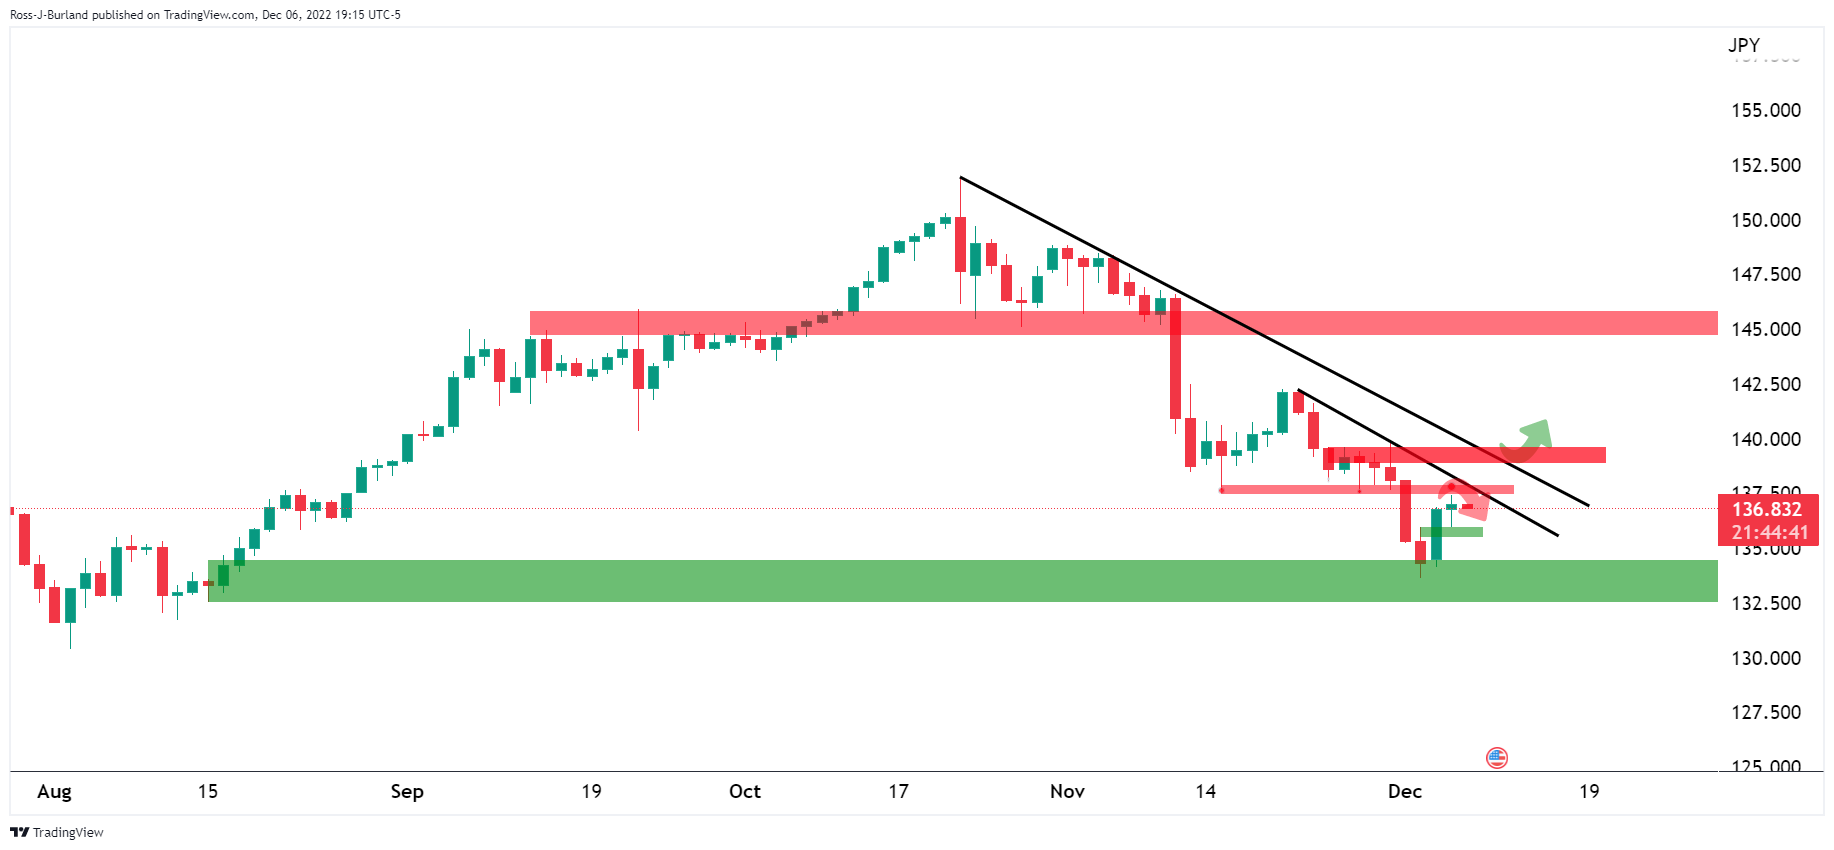
As per the pre-Tokyo-open analysis, USD/JPY is meeting a potential resistance area on the daily chart as the bulls move in on the 137.00s.
''If these were to hold, USD/JPY could face supply that may lead to a downside extension. On the flip side, a move in USD/JPY beyond the trendlines and 138.00 will leave the scope for a significant bullish correction with 140.00 and beyond eyed.''
- Gold price has sensed supply near the critical hurdle of $1,770.00.
- Fresh evidence of a rebound in inflation has propelled US Dollar’s upside above 105.60.
- The Fed is expected to provide a higher peak for interest rates in its December monetary policy meeting.
Gold price (XAU/USD) has sensed selling interest around the immediate hurdle of $1,770.00 in the Asian session. The precious metal is facing the heat as the US Dollar Index (DXY) has extended its upside journey above a four-day high at 105.60.
S&P500 futures are majorly lackluster after a sell-off consecutively for the second trading session, portraying a risk-averse approach from investors for the time being. Meanwhile, the 10-year US Treasury yields have recovered some of their losses and have reached 3.56%, at the press time.
Fresh evidence of a rebound in inflation from strength shown by the United States economy through services and labor demand in November has turned the market mood sour. This has triggered the risk of higher interest rate peak guidance by the Federal Reserve (Fed) in its monetary policy meeting next week.
But before that, five-year consumer inflation expectations have hogged the limelight. Long-term inflation expectations are still anchored as inflation has shown signs of a slowdown in the past. Earlier, the forward-inflation data landed at 3%.
Gold technical analysis
On an hourly scale, Gold price has slipped below the upward-sloping trendline placed from November 3 low at $1,616.69. The precious metal is also playing with the 200-period Exponential Moving Average below $1,770.00, which indicates that the long-term trend is not solid anymore.
Also, the Relative Strength Index (RSI) (14) is looking to slip inside the bearish range of 20.00-40.00.
Gold hourly chart
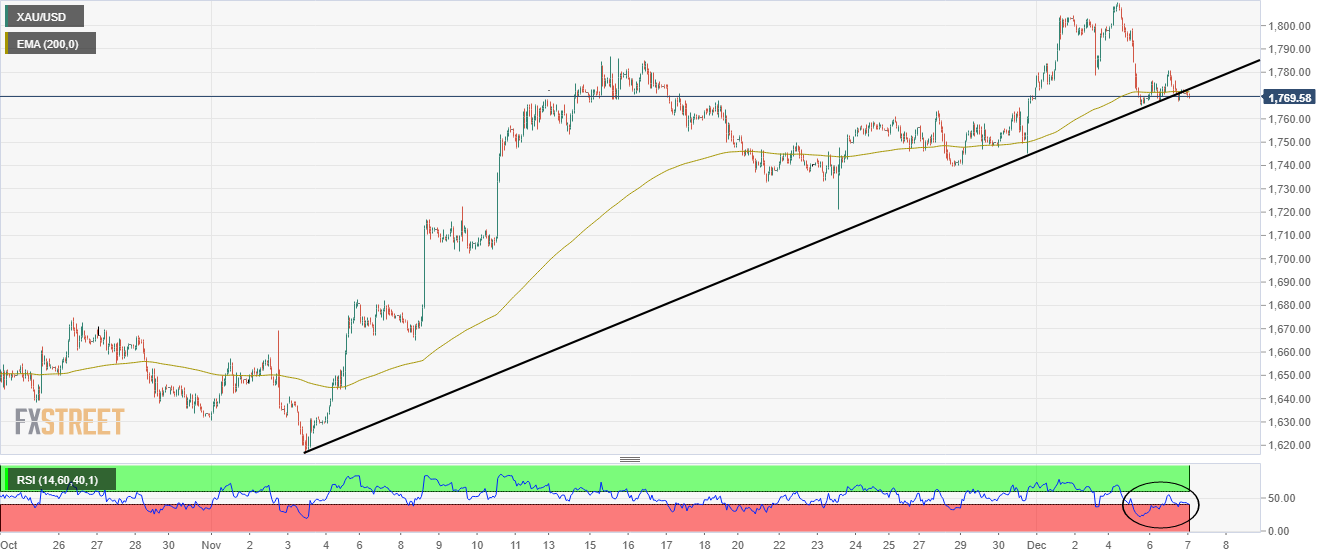
- USD/CNH picks up bids to extend early week rebound from the key Fibonacci retracement level.
- Convergence of 100-DMA, previous support line from October challenges buyers.
- MACD, RSI conditions suggest further hardships for bulls.
USD/CNH prints a two-day uptrend around 6.9870 while extending the week-start rebound from the lowest levels in three months.
That said, the offshore Chinese Yuan (CNH) pair prints mild gains while defending the bounce off the 61.8% Fibonacci retracement level of the August-October upside.
Although the recovery moves from the key Fibonacci retracement level, also known as the golden ratio, teases the USD/CNH bulls, the downbeat RSI (14) and bearish MACD signals challenge the quote’s further upside.
Also raising doubts on the USD/CNH run-up is the joint of the 100-DMA and the support-turned-resistance line from October, near 7.0265-70.
It’s worth noting that the pair’s advances past 7.0270 need validation from the 50% Fibonacci retracement level surrounding 7.0465 before giving control to the buyers.
In that case, a gradual run-up towards the late October swing low near 7.1660 can’t be ruled out.
Alternatively, a daily closing below the 61.8% Fibonacci retracement level of 6.9688 could quickly drag the USD/CNH prices to the latest trough surrounding 6.9300.
Following that, the lows marked during mid-September, close to 6.9100, acts as the last defense of the USD/CNH bulls.
USD/CNH: Daily chart
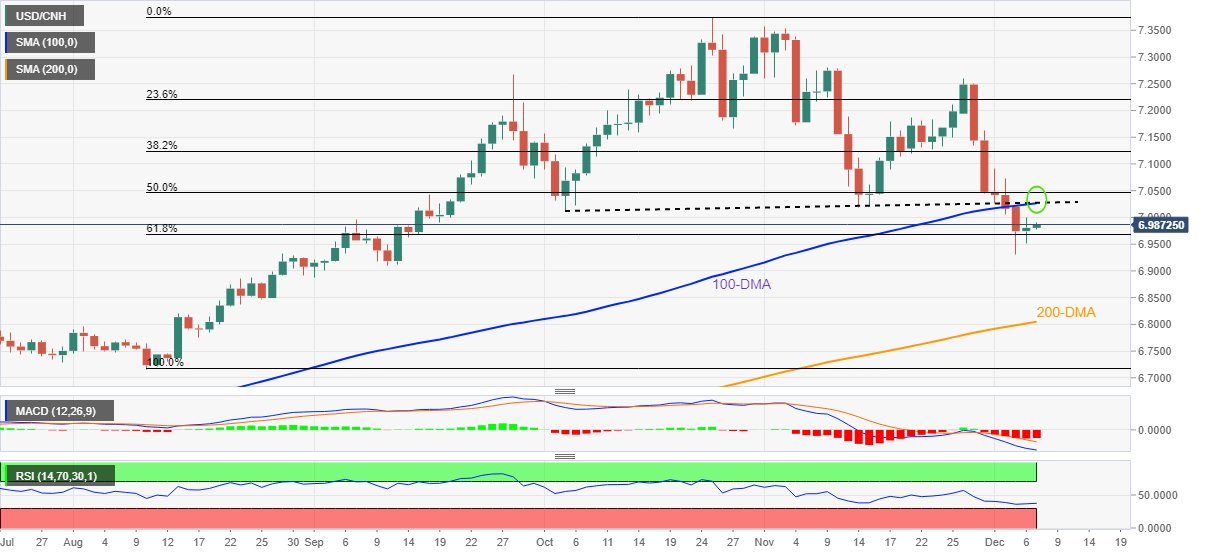
Trend: Pullback expected
In recent trade today, the People’s Bank of China (PBOC) set the yuan (CNY) at 6.9975 vs. the last close of 6.9950.
About the fix
China maintains strict control of the yuan’s rate on the mainland.
The onshore yuan (CNY) differs from the offshore one (CNH) in trading restrictions, this last one is not as tightly controlled.
Each morning, the People’s Bank of China (PBOC) sets a so-called daily midpoint fix, based on the yuan’s previous day's closing level and quotations taken from the inter-bank dealer.
- US Dollar Index picks up bids to refresh intraday high, stays firmer at one-week top.
- Softer US trade numbers, inflation expectations fail to cool down hawkish Fed bets.
- Hopes of China easing its Zero-Covid policy favor cautious optimism even as global economic slowdown looms.
- Mixed sentiment, light calendar may restrict DXY moves ahead of next week’s FOMC.
US Dollar Index (DXY) stays mildly bid around 106.65 during Wednesday’s Asian session, up for the third consecutive day amid mixed clues. In doing so, the greenback’s gauge versus the six major currencies pokes the highest level in a week despite a light calendar.
That said, China's state media underpins the market’s optimism by showing the dragon nation’s readiness to ease the three-year-old Zero-Covid policy. "Beijing readies itself for life again," read a headline in the government-owned China Daily newspaper, adding that people were "gradually embracing" newfound freedoms, reported Reuters.
On the same line could be the downbeats prints of the US inflation expectations, as per the 10-year and 5-year breakeven inflation rates per the St. Louis Federal Reserve (FRED) data. That said, the inflation precursors dropped for the second consecutive day on Tuesday.
Additionally, softer prints of US trade numbers should have also probed the US Dollar Index bulls. US Goods and Services Trade Balance deteriorated to $-78.2 billion versus $-79.1 billion expected and $-73.28 billion prior.
However, the last week’s firmer US employment data and Monday’s strong US ISM Services PMI seemed to command major attention and hence keep the hawkish bets on the Fed’s next move intact, which in turn favored DXY bulls.
Furthermore, the warnings of grim economic conditions from multiple US banks and downbeat earnings weighed on the market sentiment and allowed the US Dollar to stay firmer. Among them were the United States Heads of Goldman Sachs, Bank of America Corp and JPMorgan Chase. Additionally, Bloomberg Economics also forecasted the lowest economic growth since 1993, to 2.4% for 2023.
Against this backdrop, the S&P 500 Futures seesaw near 3,950, mildly bid of late, whereas the US 10-year Treasury yields cling to 3.54% mark after the previous day’s downbeat performances of Wall Street and the key Treasury bonds.
Looking forward, DXY remains on the bull’s radar as traders hope the Fed stays away from a pivot. However, headlines from China and an absence of Fed talks could restrict the US Dollar Index moves ahead of the next week’s Federal Open Market Committee (FOMC).
Technical analysis
Although recently firmer MACD and RSI tease US Dollar Index buyers, a 12-day-old downward-sloping resistance line, around 106.55 by the press time, restrict immediate DXY upside. Meanwhile, lows marked in August around 104.65 precede the 104.00 threshold to challenge the downside moves.
- AUD/JPY has attempted a break above the 91.70 hurdle despite weaker-than-projected Australian GDP data.
- The annual and quarterly Australian GDP has declined to 5.9% and 0.6% respectively.
- A decline in China’S inflation would propel PBOC to announce more policy-easing measures.
The AUD/JPY pair has overstepped the critical resistance of 91.70 despite a weaker-than-projected Australian Gross Domestic Product (GDP). The annual GDP data has landed at 5.9%, lower than the expectations of 6.3% and the prior release of 3.6%. While quarterly GDP data has been reported lower at 0.6% vs. the projections of 0.7% and the former release of 0.9%.
Weaker-than-projected Australian GDP data is going to support the Reserve Bank of Australia (RBA) in meeting its agenda of achieving price stability. The cross remained extremely volatile on Tuesday after the RBA hiked its Official Cash Rate (OCR) consecutively for the third time by 25 basis points (bps). This has pushed the Australian interest rates to 3.10%. The decision of a 25 bps rate hike was very much in line with the estimates.
On interest rate guidance, RBA Governor Philip Lowe that further tightening of monetary policy is likely to be forthcoming. The RBA is not in a hurry to pause interest rate hikes any time sooner as the current inflation rate at 6.9% is far from the targeted rate of 2%, therefore, more policy tightening measures cannot be ruled out.
This week, investors will keep an eye on China’s Consumer Price Index (CPI) data, which will release on Friday. The annual CPI is expected to drop vigorously to 1.0% from the prior release of 2.1%. This could force the People’s Bank of China (PBOC) to ease policy further. It is worth noting that Australia is a leading trading partner of China and monetary easing in China will strengthen the Australian Dollar.
Meanwhile, Japanese yen investors are awaiting Thursday’s GDP data. The economic data is expected to contract by 1.1% against the prior contraction of 1.2%. While the quarterly data is likely to contract by 0.3%, similar to the prior release.
- AUD/USD eases from intraday high amid softer-than-expected Australia Q3 GDP.
- Market sentiment remains cautiously optimistic as China signals easing of Zero-Covid policy as soon as Wednesday.
- Declines in the US inflation expectations and softer US data add strength to the risk-on mood but light calendar probes traders.
- China’s trade numbers for November can offer immediate directions, risk catalysts are the key.
AUD/USD justifies the weaker-than-expected Australian Gross Domestic Product (GDP) data as it retreats from intraday high surrounding 0.6700 after the data release during early Wednesday. In doing so, the Aussie pair struggles to justify the market’s cautious optimism, mainly backed by catalysts surrounding China and the Federal Reserve (Fed).
That said, Australia’s third quarter (Q3) GDP eased to 0.6% QoQ versus 0.7% expected and 0.9% prior while the YoY readings also dropped to 5.9% compared to 6.3% market forecasts and 3.6% previous reading.
Also read: Aussie GDP misses the mark and slightly weighs on AUD
Earlier in the day, Australia’s AiG Performance of Services Index for November declined to 45.6 versus 47.7 prior.
It’s worth noting that the downbeat Aussie data justify the Reserve Bank of Australia’s (RBA) resistance in cutting the benchmark interest rates, despite showing readiness for the same.
On the positive side, China state media renews the market’s optimism by showing the dragon nation’s readiness to ease the three-year-old Zero-Covid policy. "Beijing readies itself for life again," read a headline in the government-owned China Daily newspaper, adding that people were "gradually embracing" newfound freedoms, reported Reuters.
Additionally, downbeats prints of the US inflation expectations, as per the 10-year and 5-year breakeven inflation rates per the St. Louis Federal Reserve (FRED) data, also allow the AUD/USD bulls to keep the reins.
While portraying the mood, the S&P 500 Futures seesaw near 3,950, mildly bid of late, whereas the US 10-year Treasury yields cling to 3.54% mark after the previous day’s downbeat performances of Wall Street and the key Treasury bonds.
That said, the AUD/USD pair traders may now await China’s November month trade balance, expected to deteriorate to $78.1B versus $85.15B prior, for fresh impulse. It’s worth noting that the risk catalysts, like headlines surrounding China’s Covid conditions and geopolitical fears emanating from Russia, Europe and Beijing, should be watched carefully for clear directions.
Technical analysis
AUD/USD rebound remains elusive unless crossing the 61.8% Fibonacci retracement level of the June-October downside, near 0.6855. That said, bearish MACD and multiple attempts to conquer the 100-DMA, around 0.6690 by the press time, keeps the pair sellers hopeful.
The Australian Bureau of Statistics (ABS) released Australia's Gross Domestic Product (GDP) on a quarterly basis as follows:
- Q3 GDP +0.6% QoQ vs. the expected +0.7% and the prior +0.9%.
- YoY Q3: 5.9% (est 6.3%, prev 3.6%).
AUD/USD update
AUD/USD is a touch offered after the data but remains within familiar ranges for the session so far, trading just below 0.6700.
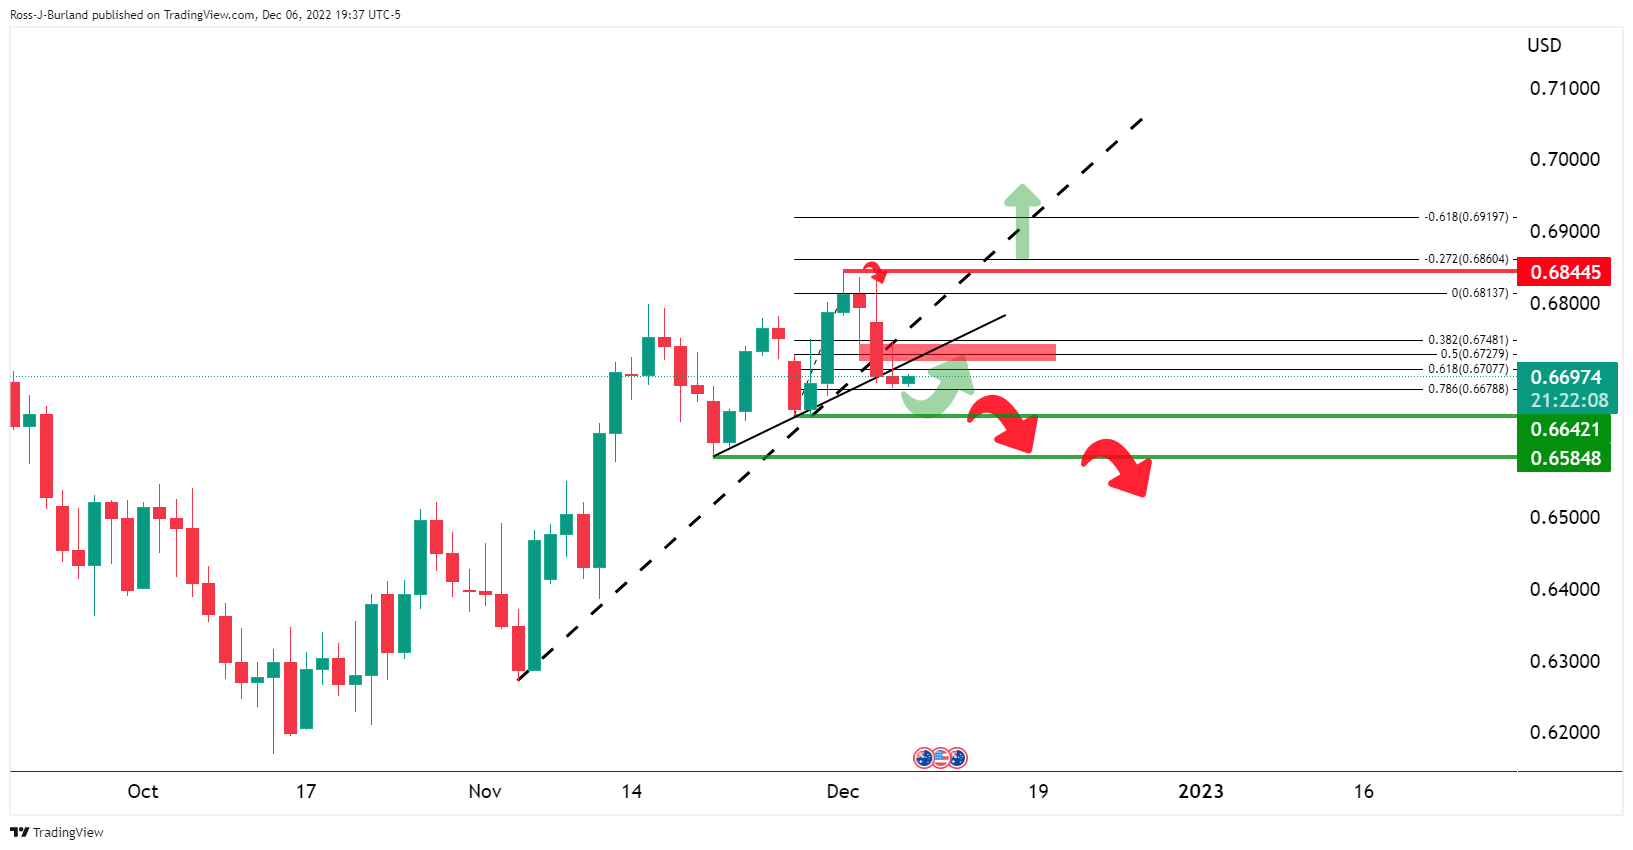
On the daily chart, the price is holding around the trendlines but a break of 0.6670/50 and below opens the risk of a move to test 0.6580 and below:
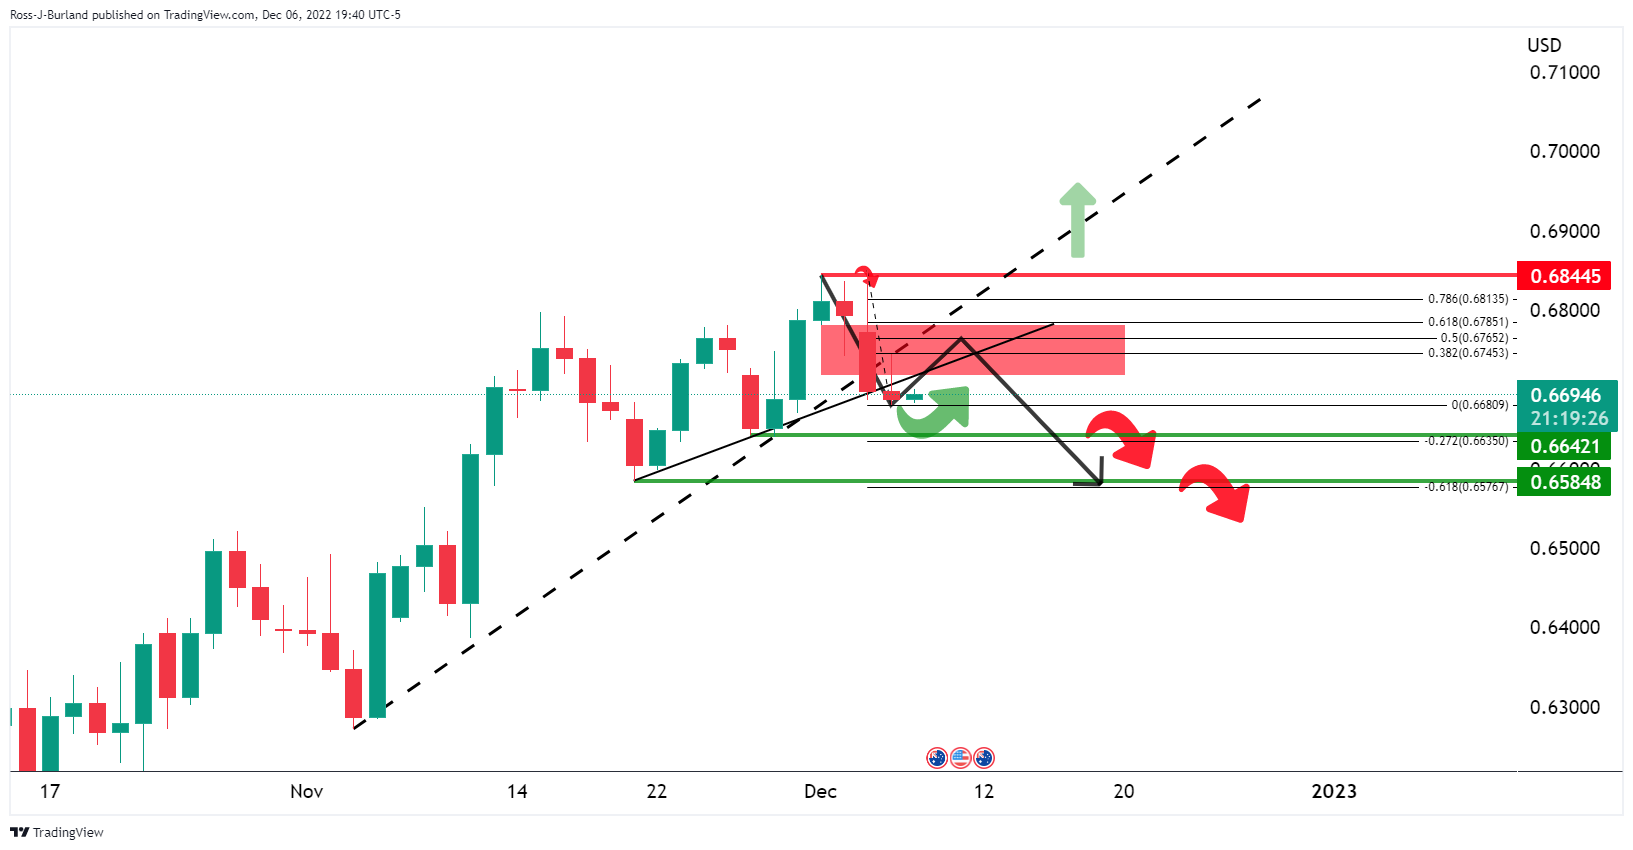
However, tf the bulls commit at this juncture, near a 0.78.6% Fibonacci area, then there will be prospects of a move in resistance near 0.6850.
About Aussie GDP
The Australian Bureau of Statistics (ABS) releases the Gross Domestic Product (GDP) on a quarterly basis. It is published about 65 days after the quarter ends. The indicator is closely watched, as it paints an important picture for the economy. A strong labor market, rising wages and rising private capital expenditure data are critical for the country’s improved economic performance, which in turn impacts the Reserve Bank of Australia’s (RBA) monetary policy decision and the Australian dollar. Actual figures beating estimates is considered AUD bullish, as it could prompt the RBA to tighten its monetary policy.
| Index | Change, points | Closed | Change, % |
|---|---|---|---|
| NIKKEI 225 | 65.47 | 27885.87 | 0.24 |
| Hang Seng | -77.11 | 19441.18 | -0.4 |
| KOSPI | -26.16 | 2393.16 | -1.08 |
| ASX 200 | -34.3 | 7291.3 | -0.47 |
| FTSE 100 | -46.11 | 7521.39 | -0.61 |
| DAX | -104.42 | 14343.19 | -0.72 |
| CAC 40 | -9.17 | 6687.79 | -0.14 |
| Dow Jones | -350.76 | 33596.34 | -1.03 |
| S&P 500 | -57.58 | 3941.26 | -1.44 |
| NASDAQ Composite | -225.05 | 11014.89 | -2 |
- USD/JPY is meeting a potential resistance area on the daily chart.
- USD/JPY could face supply that may lead to a downside extension.
- Federal Reserve sentiment is switching and weighing on risk, supportive of the US Dollar.
USD/JPY has been flat in Asia so far, tucked in below 137.00 having traded between 136.84 and 137.02 as traders contemplate the recessionary fears in financial markets following a sea of red in global equities on Tuesday.
US Treasury yield curve signals US recession
MSCI's all-country world index, a gauge of stock performance in 47 countries, dropped 1.26% to mark its third down day in a row after hitting a three-month high last week. The US dollar rose on Tuesday as the market weighed how long the Federal Reserve would keep interest rates high.
US Treasury yields also fell, but more at the long end of maturities than the short end. This is a strong indication that a recession is on the cards as the yield curve has deepened with the gap between yields on two- and 10-year notes at -83.7 basis points. Consequently, risk sentiment deteriorated as markets weighed up the economic impacts of a possible recession in 2023. The 2-year government bond yields were 3bps lower, ending at 4.36%, and 10-year government bond yields fell 5bps to 3.52%.
Improved US economic data sparks risk-off
The Institute for Supply Management (ISM) said its Non-Manufacturing PMI rose to 56.5 last month from 54.4 in October, indicating that the services sector, which accounts for more than two-thirds of US economic activity, remained resilient in the face of rising interest rates.
The data beat forecast the Non-manufacturing PMI would fall to 53.1. While the data combined with last Friday's surprisingly strong Nonfarm Payrolls data in November had raised optimism that a recession could be avoided in 2023, investors are concerned that the Fed will subsequently hike rates by 75 Bps again at the December meeting.
Eyes on the Federal Reserve
After Powell’s speech last week, the narrative swung towards dovish. After Average Hourly Earnings and Services PMI, that narrative is moving swiftly back to hawkish and this is supportive of the US Dollar.
''We imagine there will be some whispers about 75 bp from the Fed next week but we think it will depend in large part on the CPI data out the day before the decision,'' analysts at Brown Brothers Harriman said.
''That said, we think it was a mistake for Powell to take 75 bp off the table last week. World Interest Rate Probabilities, (WIRP) still suggests that a 50 bp hike on December 14 is fully priced in, with only 5% odds of a larger 75 bp move. The swaps market is pricing in a peak policy rate of 5.0% but odds of a higher 5.25% peak have crept back in,'' the analysts added.
However, hawkishly, the analysts at BBH say that they ''don't think two more 50 bp hikes will do it, not when the labour market remains so firm and consumption is holding up.'' The analysts argue that getting core Personal Consumption Expenditures (PCE) back down to the Fed’s target of 2% will be much more difficult than markets are pricing in.
USD/JPY technical analysis
USD/JPY is meeting a potential resistance area on the daily chart as the bulls move in on the 137.00s. If these were to hold, USD/JPY could face supply that may lead to a downside extension. On the flip side, a move in USD/JPY beyond the trendlines and 138.00 will leave the scope for a significant bullish correction with 140.00 and beyond eyed.
- EUR/GBP is aiming to deliver more gains above 0.8630 as the focus shifts to ECB Lagarde’s speech.
- ECB policymakers see interest rates peaking in the near term.
- UK’s food supply crisis is impacting Pound Sterling dramatically.
The EUR/GBP pair has witnessed a firmer recovery from 0.8580 and has reached near the critical hurdle of 0.8630 in the Asian session. The Euro bulls have witnessed significant demand despite the European Central Bank (ECB) being near to reaching an interest rate peak ahead. Therefore, the monetary policy meeting scheduled for next week is going to be very crucial ahead.
The cross is attempting a decisive break above the critical resistance of 0.8630 for the fourth time this week. Hawkish commentary from ECB policymakers is keeping reins in the Euro bulls.
Constantinos Herodotou, Governor of the Central Bank of Cyprus said that “There will be another hike in rates, but we are very near neutral rate.” ECB Chief Economist Phillip Lane is dubious about the inflation peak as it has been achieved or is still to come next year. He further added that he expects more rate hikes ahead but "a lot has been done already".
Meanwhile, investors are awaiting the speech from ECB President Christine Lagarde, which will be announced on Thursday. ECB President is expected to trim inflation guidance in her speech amid weaker Retail Sales data.
Monthly Eurozone Retail Sales data contracted by 1.8% while expectations were aiming for a 1.7% contraction this week. Also, the economic data contracted by 2.7% on an annual basis against the consensus of a 2.6% contraction. A decline in demand by the households indicates that policy tightening measures adopted by the European Central Bank (ECB) are augmenting their job effectively. This might force firms to look for a decline in prices for goods and services to keep up their sales target.
On the United Kingdom front, the soaring food supply crisis led by soaring costs and labor shortages has impacted the Pound Sterling. Minette Batters, president of the National Farmers Union said “We need government and the wider supply chain to act now. Tomorrow could well be too late.” as reported by Financial Times. The economy is already facing higher food inflation and now the food supply crisis will accelerate food inflation further.
- EUR/USD prints a three-day downtrend inside a bearish chart formation.
- Downbeat MACD signals and steady RSI adds strength to the bearish bias.
- 200-DMA adds to the downside filters, 1.0615 is the key hurdle.
EUR/USD holds lower ground near 1.0460 as bears keep the reins for the third consecutive day despite the market’s inaction during early Wednesday.
In doing so, the major currency pair trades inside a one-month-old rising wedge bearish chart formation.
Also keeping the EUR/USD sellers hopeful are downbeat MACD signals and the steady RSI line, placed at 14.
However, a clear downside break of the 1.0420 support, as well as the sustained trading below the 200-DMA level surrounding 1.0355, becomes necessary for the EUR/USD bears to dominate further.
Following that, the theoretical target of 0.9760 and November’s low of 0.9730 could gain the market’s attention.
Alternatively, recovery remains elusive unless the EUR/USD pair remains below the 1.0600 threshold.
Even so, a convergence of the late June swing high and upper line of the stated wedge, around 1.0615, appears crucial resistance to watch during the quote’s advances past 1.0600.
In a case where EUR/USD stays firmer past 1.0600, the bulls won’t hesitate to challenge May’s peak surrounding 1.0790.
To sum up, EUR/USD has interesting chart pattern to keep sellers hopeful despite the latest sluggish moves.
EUR/USD: Daily chart
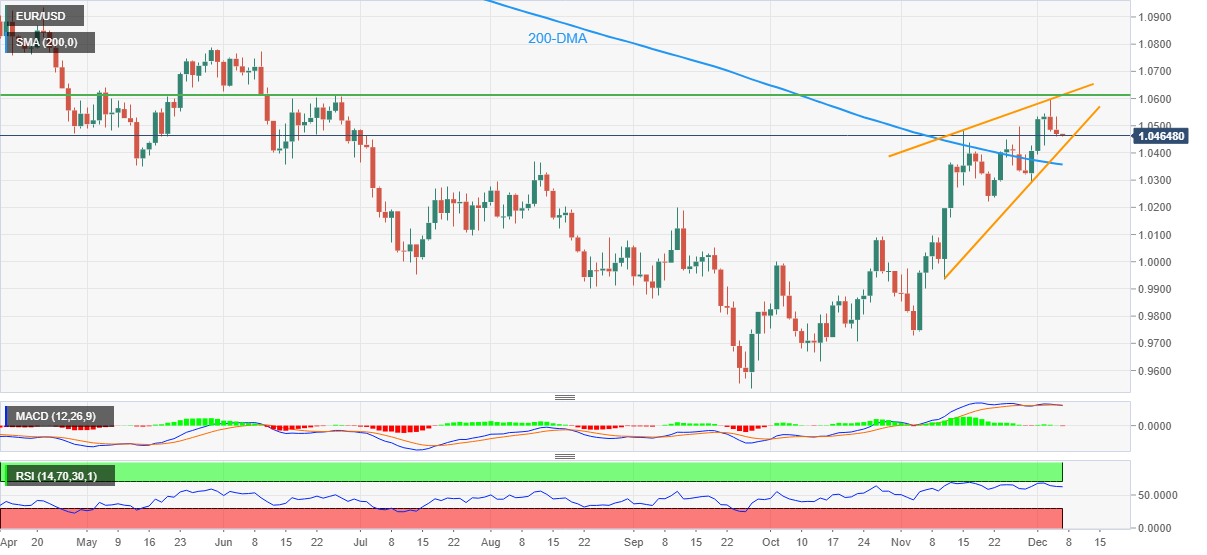
Trend: Further downside expected
| Pare | Closed | Change, % |
|---|---|---|
| AUDUSD | 0.66881 | -0.14 |
| EURJPY | 143.434 | 0.08 |
| EURUSD | 1.0466 | -0.18 |
| GBPJPY | 166.258 | -0.11 |
| GBPUSD | 1.21317 | -0.35 |
| NZDUSD | 0.63174 | 0.06 |
| USDCAD | 1.36496 | 0.43 |
| USDCHF | 0.942 | 0.29 |
| USDJPY | 137.049 | 0.28 |
- USD/CHF struggles for clear directions after snapping two-day uptrend the previous day.
- Light calendar, pre-FOMC blackout restrict immediate moves of the market.
- Mixed concerns surrounding Fed, cautious mood ahead of China data and announcements also test momentum traders.
USD/CHF aptly portrays the market’s indecision as it makes rounds to 0.9420 during Wednesday’s Asian session.
The Swiss Franc (CHF) pair printed the first daily loss in three the previous day while reversing from 0.9456 but the pullback failed to last longer than 0.9380, before printing the last inaction.
A lack of major data and events join no comments from Federal Reserve (Fed) officials ahead of the mid-December Federal Open Market Committee (FOMC) to restrict the market’s immediate moves. Also likely to have challenged the traders could be the mixed signals surrounding Fed and risk appetite.
After the last week’s firmer US employment data and Monday’s strong US ISM Services PMI, the nation’s downbeat trade numbers joined the extended retreat in the inflation expectations to probe the Fed hawks. That said, US inflation expectations, as per the 10-year and 5-year breakeven inflation rates per the St. Louis Federal Reserve (FRED) data, extend the previous retreat from a one-month high by printing the second day of downside. The latest prints of the 5-year and 10-year inflation expectations are 2.38% and 2.43% respectively. It should be noted that the US Goods and Services Trade Balance deteriorated to $-78.2 billion versus $-79.1 billion expected and $-73.28 billion prior.
Additionally, China is up for conveying more easing to its three-year-old Zero-Covid policy on Wednesday, per Reuters, which in turn could trigger the risk-on mood and weigh on the US Dollar. Beijing’s latest move could be linked to the receding virus infections from the record high, as well as multiple announcements suggesting more unlocking of the virus-hit economy that’s the second biggest in the world.
On the contrary, the warnings of grim economic conditions from multiple US banks and downbeat earnings weighed on the market sentiment during late Tuesday. Among them were the United States Heads of Goldman Sachs, Bank of America Corp and JPMorgan Chase. Additionally, Bloomberg Economics also forecasted the lowest economic growth since 1993, to 2.4% for 2023.
Amid these plays, the S&P 500 Futures seesaw near 3,950 whereas the US 10-year Treasury yields cling to 3.54% mark after the previous day’s downbeat performances of Wall Street and the key Treasury bonds.
Looking forward, China trade numbers and the Swiss Unemployment Rate for November may offer immediate directions to the USD/CHF traders. However, major attention will be given to the risk catalysts.
Technical analysis
A convergence of the two-week-old descending trend line and the 21-DMA, around 0.9485, restricts the short-term upside of the USD/CHF price. That said, a three-week-long descending trend line, near 0.9320, restricts the pair’s immediate declines.


© 2000-2026. All rights reserved.
This site is managed by Teletrade D.J. LLC 2351 LLC 2022 (Euro House, Richmond Hill Road, Kingstown, VC0100, St. Vincent and the Grenadines).
The information on this website is for informational purposes only and does not constitute any investment advice.
The company does not serve or provide services to customers who are residents of the US, Canada, Iran, The Democratic People's Republic of Korea, Yemen and FATF blacklisted countries.
Making transactions on financial markets with marginal financial instruments opens up wide possibilities and allows investors who are willing to take risks to earn high profits, carrying a potentially high risk of losses at the same time. Therefore you should responsibly approach the issue of choosing the appropriate investment strategy, taking the available resources into account, before starting trading.
Use of the information: full or partial use of materials from this website must always be referenced to TeleTrade as the source of information. Use of the materials on the Internet must be accompanied by a hyperlink to teletrade.org. Automatic import of materials and information from this website is prohibited.
Please contact our PR department if you have any questions or need assistance at pr@teletrade.global.
transfers