- Analytics
- News and Tools
- Market News
CFD Markets News and Forecasts — 05-12-2022
- USD/JPY bias remains bearish and a fade on rallies could be in store.
- Bulls eye a move towards 137.50 and then a break of 138.00.
As per the prior analysis, USD/JPY Price Analysis: Bears eye a break of key support structures, USD/JPY sank into the proposed area of support as the following will illustrate:
USD/JPY prior analysis
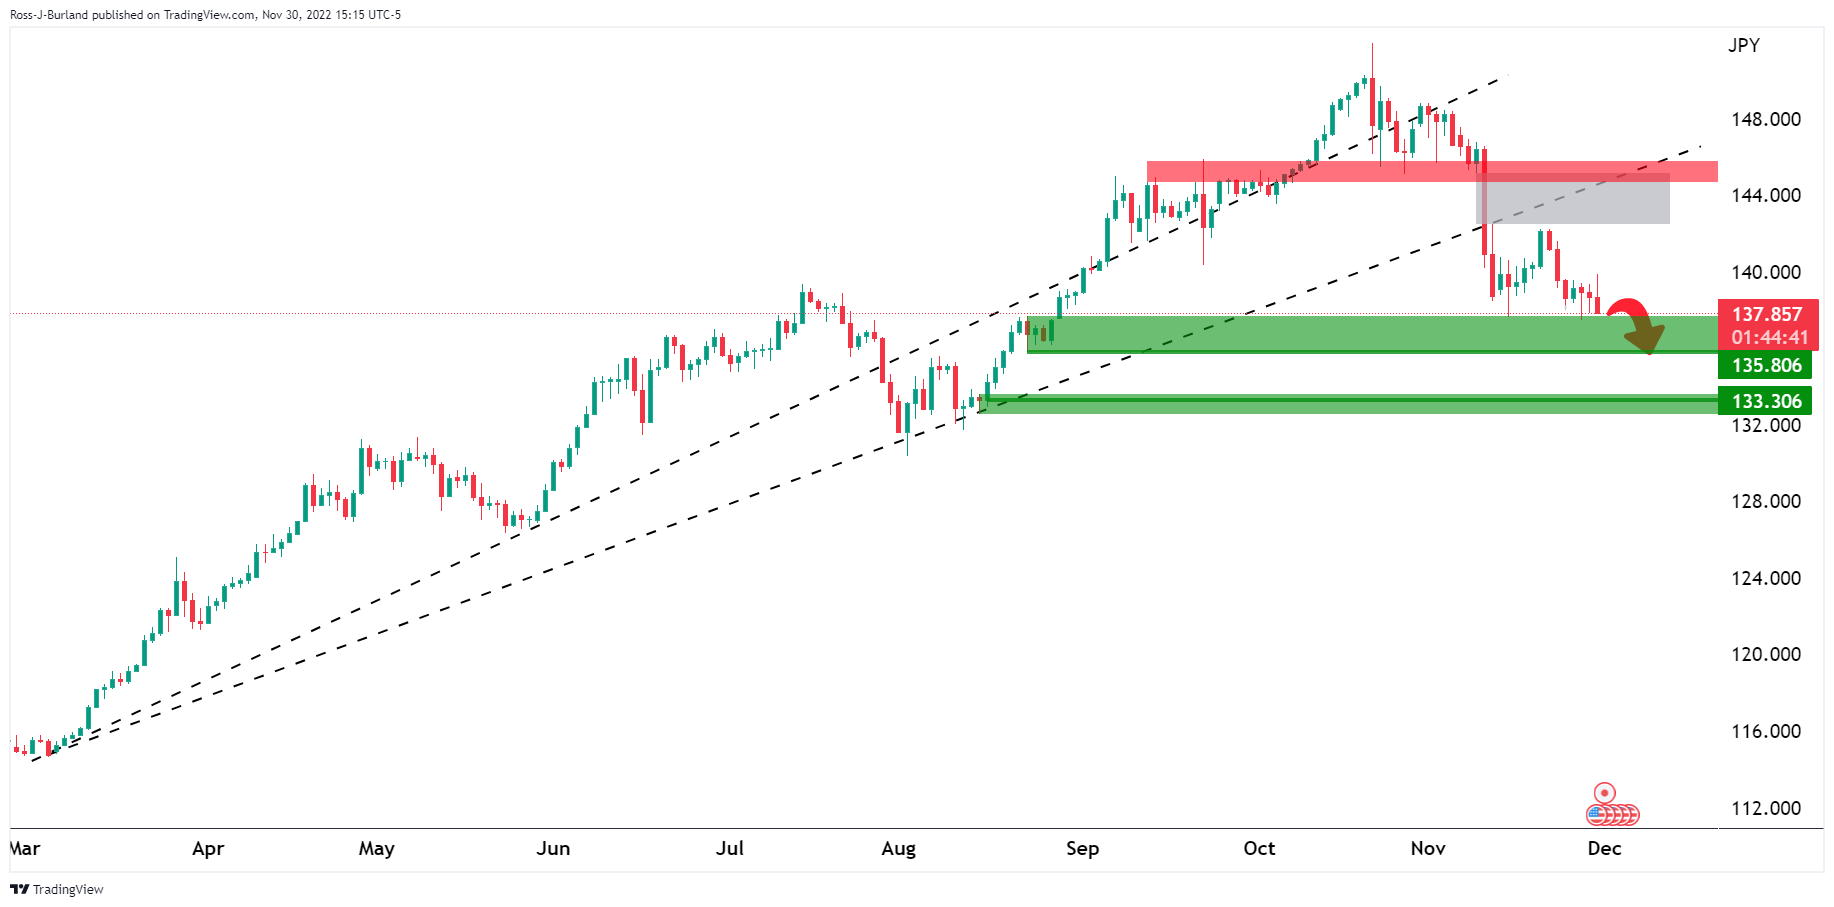
USD/JPY was trading on the back side of the daily trend lines which exposed 135.80 on the downside and below.
The bears were embarking on an equal low as seen more easily on the following zoomed-in chart:
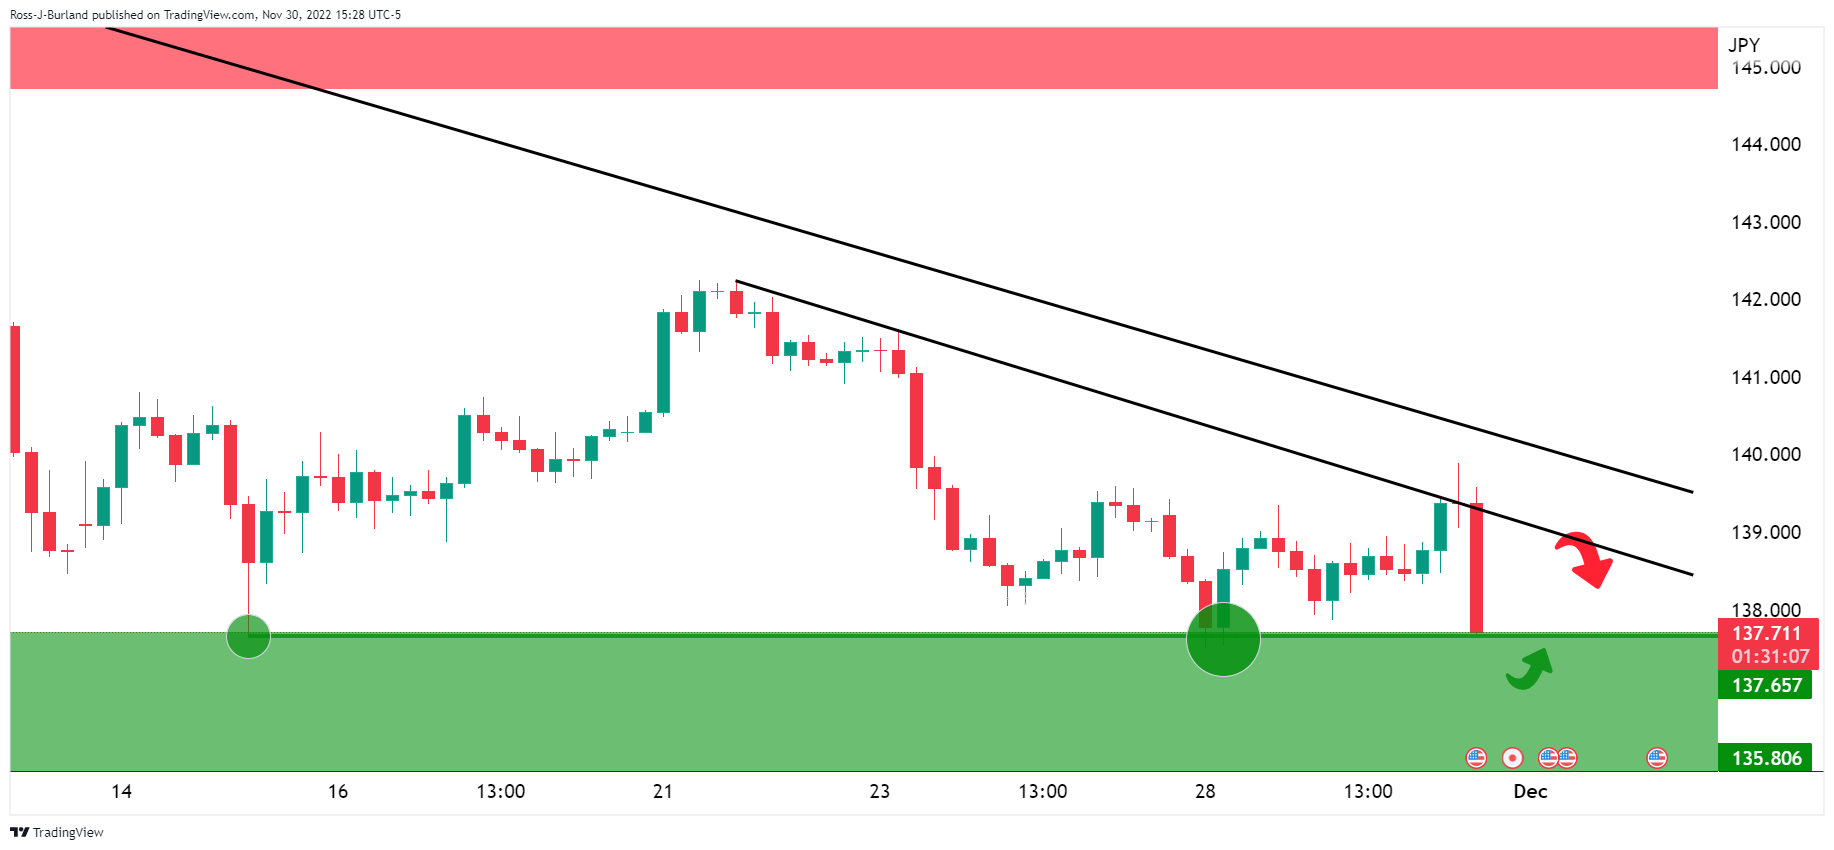
It was stated that there would be liquidity in here that could lead to a move back into the horizontal resistance. However, it was stated, that so long as the 139 area held, the emphasis would remain on the downside. A break of 135.80 opened risk to the lower end of the 133 area:
USD/JPY update
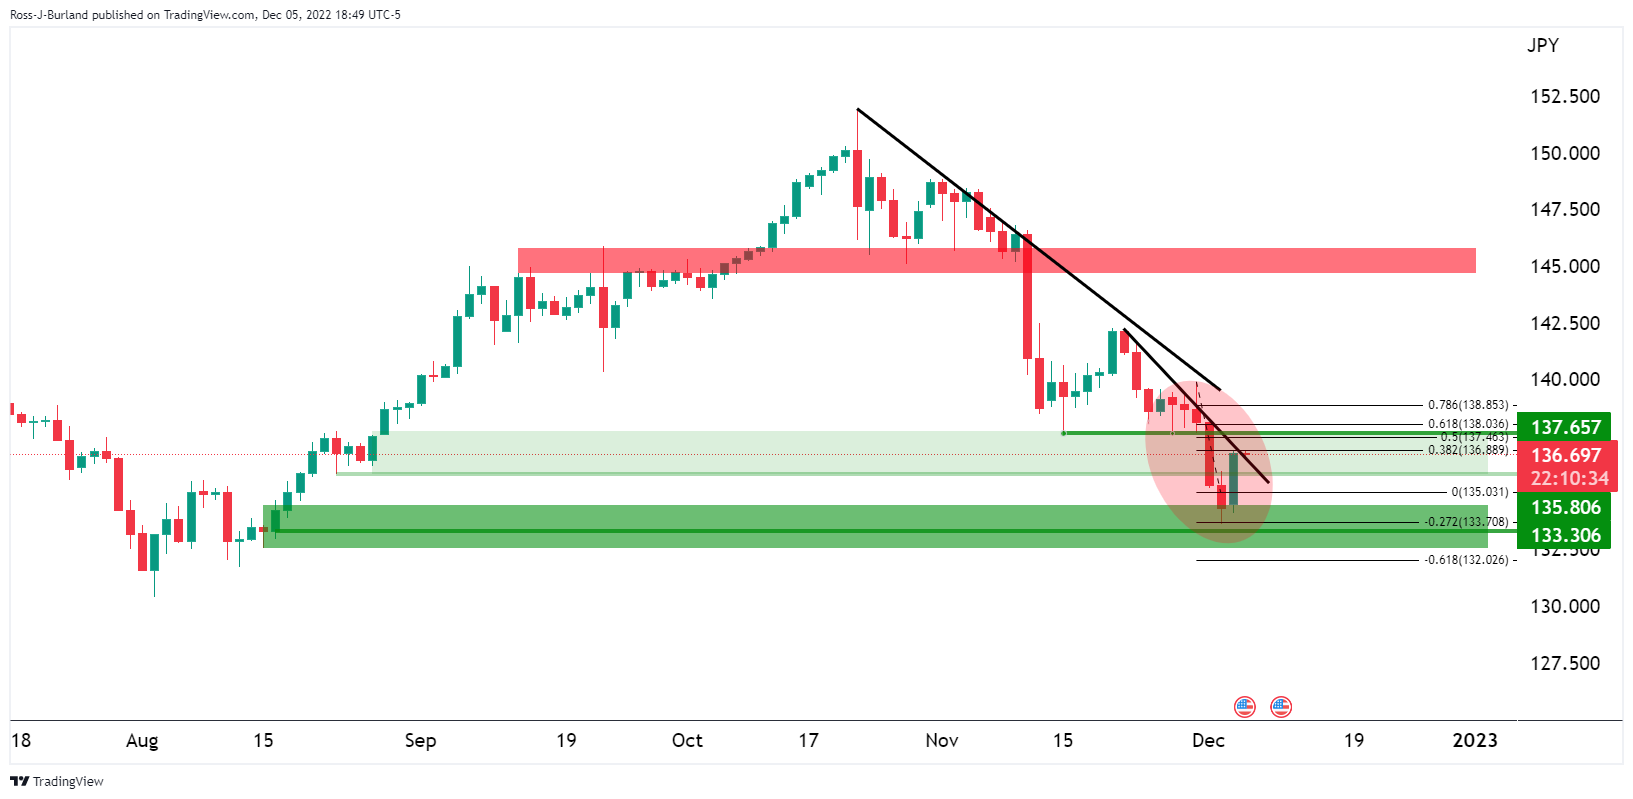
Bulls now eye 137.50:
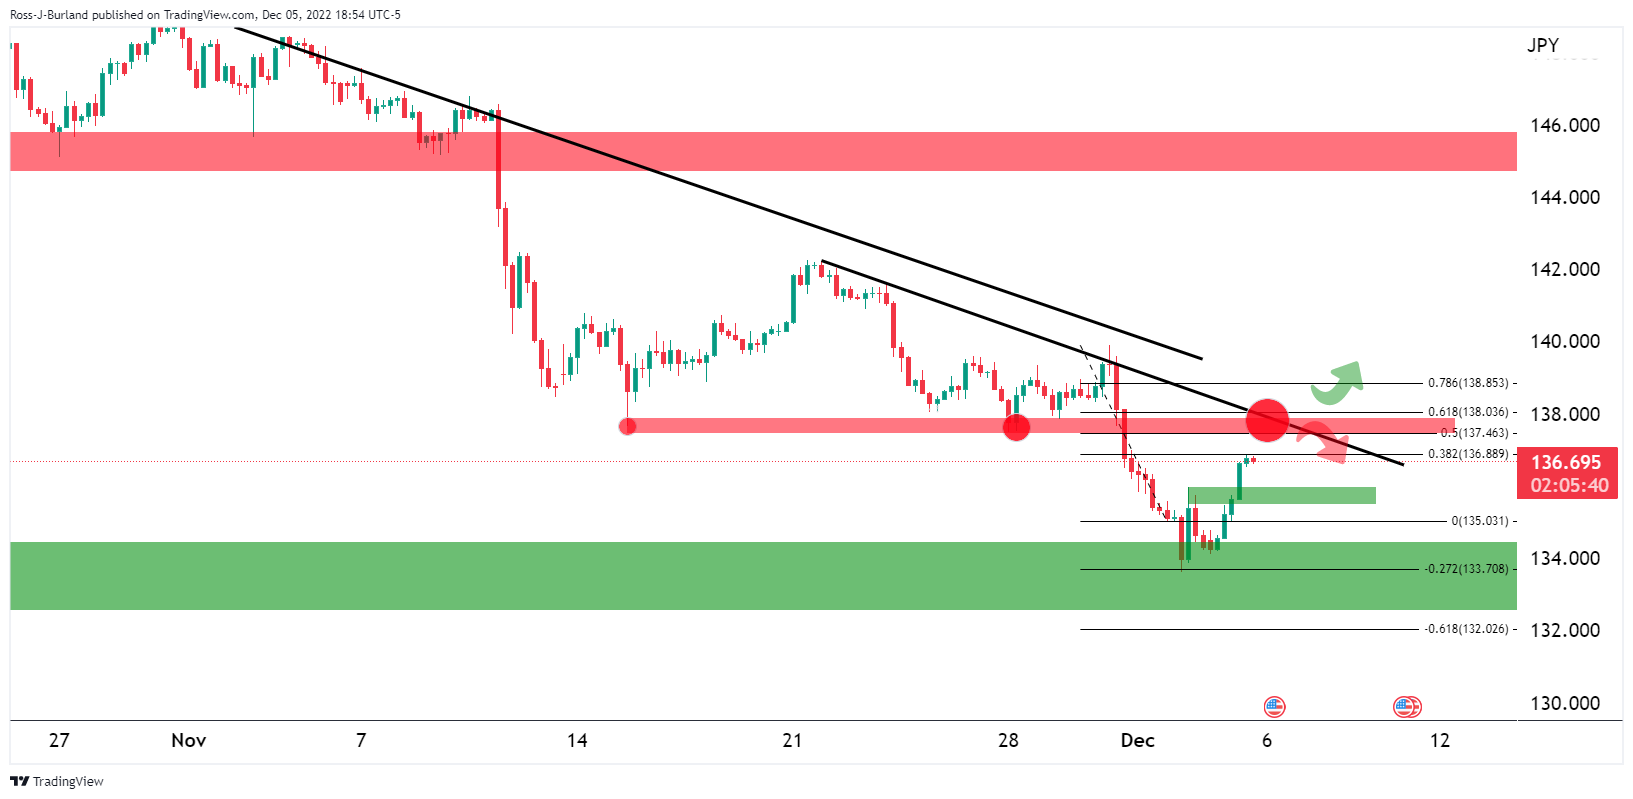
The price could now be embarking on a move beyond 138.00 but resistance needs to give. While on the front side of the micro trendlines, the bias remains bearish and a fade on rallies could be in store.
- WTI remains defensive after posting the biggest daily loss in two weeks.
- Ukrainian drones renew fresh geopolitical fears by attacking deep inside Russia.
- Moscow rejects supplying Oil under the G7 price.
- Firmer US Dollar adds strength to the bearish bias, China-linked optimism favor commodity bulls.
WTI crude oil consolidates the biggest daily loss in two weeks by making rounds to $77.50 early Wednesday. In doing so, the black gold also justifies the optimism surrounding China and supply-crunch fears emanating from China.
Recently, the New York Times (NYT) released a piece of news suggesting Ukrainian drones attacked military bases hundreds of miles inside Russia and escalated war. The same renews the geopolitical tension which previously propelled the black gold.
On the same line, Reuters mentioned that the Group of Seven (G7) price cap on Russian seaborne oil came into force on Monday as the West tries to limit Moscow's ability to finance its war in Ukraine, but Russia has said it will not abide by the measure even if it has to cut production.
It should be noted that firmer US data renewed hawkish expectations from the US Federal Reserve (Fed) and challenged the commodity buyers. That said, US ISM Services PMI rose to 56.5 in November versus 53.1 market forecast and 54.4 previous readings whereas the Factory Orders also registered 1.0% growth compared to 0.7% expected and 0.3% prior. Further, S&P Global Composite PMI improved to 46.4 versus 46.3 initial estimations while the Services counterpart rose to 46.2 compared to 46.1 flash forecasts. On Friday, the US Nonfarm Payrolls (NFP) surprised markets by rising to 263K versus 200K expected and an upwardly revised prior of 284K while the Unemployment Rate matched market forecasts and prior readings of 3.7% for November.
Alternatively, optimism surrounding China’s economic growth, due to the latest easing of virus woes and re-opening appears to keep the WTI crude oil buyers hopeful. Reuters reported on Monday that China is on course to downgrade its management of COVID-19 from a top-level Category A infectious disease to a less strict Category B disease as early as January. The news came after Chinese President XI Jinping termed the previous jump in the virus cases as Omicron and mostly of mild nature. Furthermore, the OPEC+ verdict to defend the supply cuts also keeps the oil buyers positive.
Moving on, Oil traders should pay close attention to the geopolitical and Covid-linked headlines for clear directions. Also important will be the private inventory data from the American Petroleum Institute (API) for the week ended on December 02, prior 61.3.
Technical analysis
A U-turn from the 21-DMA hurdle, currently around $81.45, directs WTI bears toward April’s low near $76.10. However, further downside appears limited considering the quote’s latest bounce off $73.66.
- Gold price has shifted its business below $1,770.00 as US Dollar Index sensed bumper demand on soured market sentiment.
- The tight labor market and solid United States service sector have triggered signs of a rebound in inflation.
- Federal Reserve might decelerate the interest rate hike pace but will escalate guidance on interest rate peak.
- Gold price is declining towards the lower portion of the Rising Channel chart pattern around $1,760.00.
Gold price (XAU/USD) has shifted its auction profile below the critical support of $1,770.0 in the early Asian session. The precious metal has been dragged below the cushion of $1,770.0 after surrendering the $1,780.00 support on Monday. Failing to climb above the ultimate resistance of $1,810.00 brought significant selling pressure on Gold price.
Soured market mood after the release of the stronger-than-projected US ISM Services PMI data triggered a sell-off in the risk-perceived currencies. Gold price faced immense pressure as upbeat service demand in the United States economy cemented expectations of a rebound in inflation. The risk aversion theme improved safe-haven’s appeal vigorously. The US Dollar Index (DXY) drove to 105.40 after registering a fresh five-month low at 104.10.
The risk aversion theme underpinned by the solid US service sector brought a stellar recovery in the returns from US Treasury bonds. The 10-YEAR us Treasury yields rebounded to near 3.59% after days of ignorance by the market participants.
Solid US service sector refreshes higher inflation expectations fears
Last week, upbeat US Nonfarm Payrolls (NFP) data cleared that labor demand is stellar led by strong demand from households. However, the market ignored the surprise rise in employment data and supported Gold price further. But now, the tight labor market in the United States economy has been followed by robust demand for the service sector. It is worth noting that a tight labor market and firmer service demand are catalysts that de-anchor short-term inflation expectations and carry the potential of ruining the recent drawdown in the October inflation report.
The US Services PMI has accelerated to 56.5, higher than the projections of 53.1 and the prior release of 54.4. Higher services PMI eventually demands more labor to augment the operations, which could incentivize firms to continue escalating prices for end use ahead.
Robust demand drives Federal Reserve’s bigger rate hike fears
Federal Reserve (Fed) chair Jerome Powell is putting his blood and sweat into triggering a slowdown in the United States economy to phase out extra inflation apart from the targeted one. The Federal Reserve has already announced four consecutive 75 basis points (bps) rate hikes to achieve price stability as early as possible. This time, the Federal Reserve policymakers were planning to decelerate the interest rate hike pace as their agenda is to trim inflation without crashing the economy.
No doubt, additional requirements for labor to augment overall robust demand will delight the Federal Reserve in hiking interest rates but rates have reached sufficiently higher to curtail inflation. Therefore, the novel robust demand has created havoc for the Federal Reserve policymakers.
Expectations for a higher interest rate peak by the Federal Reserve soared
The minutes from Federal Open Market Committee (FOMC) indicated that Federal Reserve policymakers favored a slowdown in the current pace adopted for an interest rate hike from December monetary policy meeting. The reasoning behind the small rate hike was to reduce financial risks and to observe the progress made from efforts by Federal Reserve in bringing price stability. A fresh increment in overall demand has renewed fears of hawkish Federal Reserve bets but various policymakers still favor a higher interest rate peak rather than calling a recession by passing a bigger rate hike judgment.
Chicago Fed President Charles Evans said on Friday, "We are probably going to have a slightly higher peak to Fed policy rate even as we slow pace of rate hikes," as reported by Reuters.
Gold price technical outlook
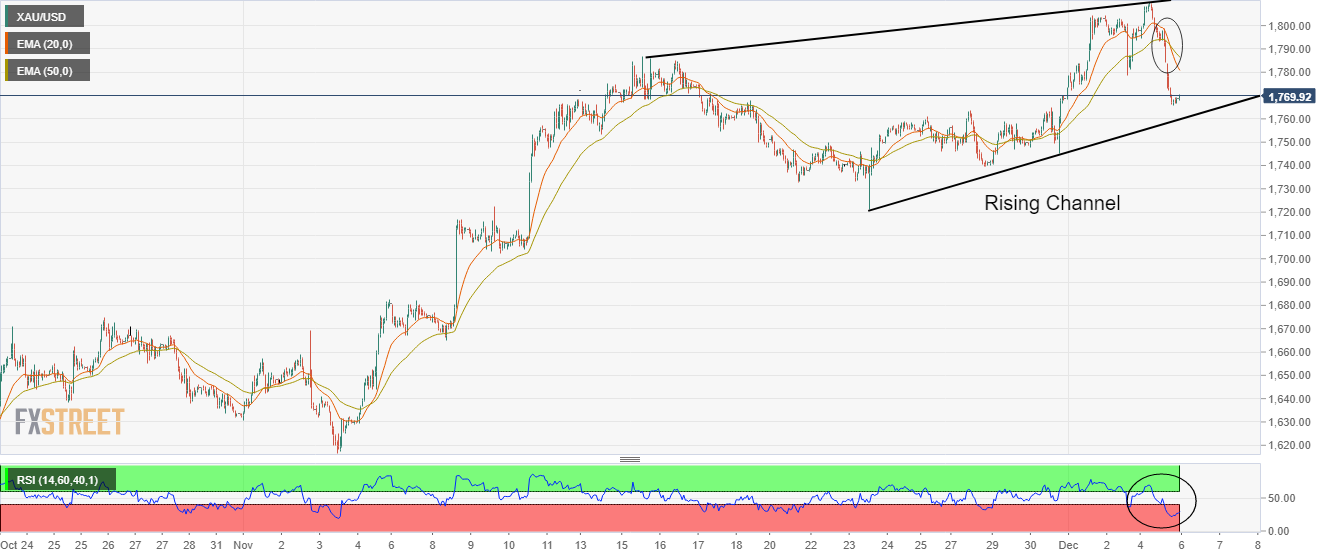
Gold price is declining towards the lower portion of the Rising Channel chart pattern plotted on an hourly scale. A bear cross, represented by the 20-and 50-period Exponential Moving Averages (EMAs) at $1,791.25, adds to the downside filters.
Meanwhile, the Relative Strength Index (RSI) (14) has shifted into the bearish range of 20.00-40.00, which indicates more weakness ahead.
- USD/CHF probes two-day rebound with mild losses, struggles of late.
- Resistance-turned-support line challenges bears even as 200-HMA restricts immediate upside.
- Bullish MACD signals, sustained break of 50-HMA adding strength to upside bias.
USD/CHF snaps a two-day rebound from the eight-month low as it prints mild losses near 0.9425 during Tuesday’s Asian session.
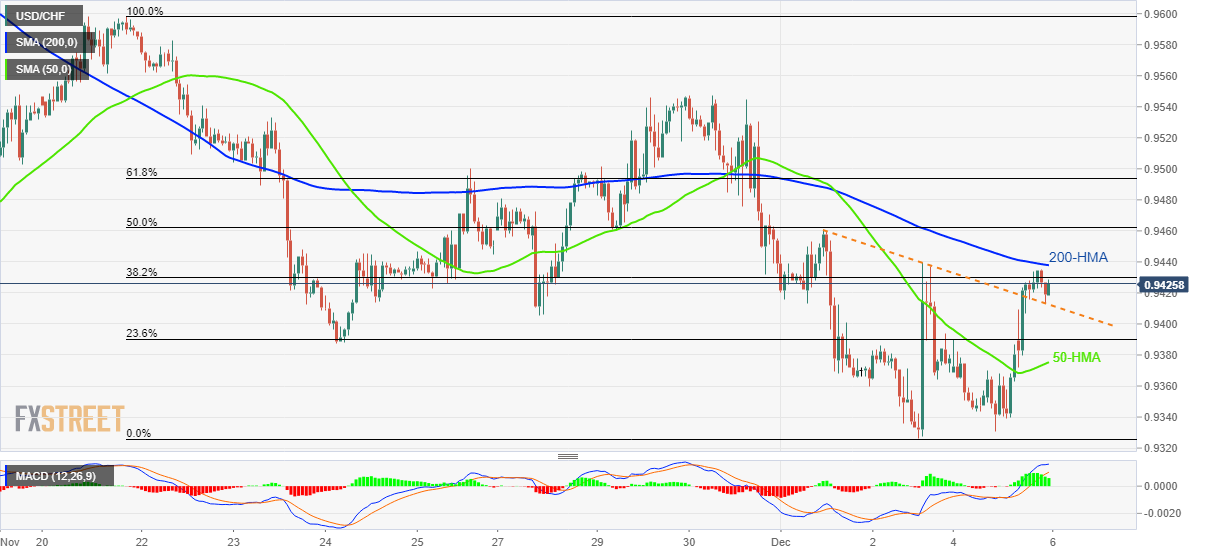
Even so, the Swiss Franc (CHF) pair defends the previous day’s upside break of a downward-sloping resistance line from December 01, now support. Also keeping the USD/CHF pair buyers hopeful is the quote’s successful trading above the 50-HMA and bullish MACD signals.
That said, the quote’s recovery moves need validation from the 200-HMA hurdle surrounding 0.9440, to keep the USD/CHF buyers hopeful.
Following that, the 50% and the 61.8% Fibonacci retracement levels of the pair’s November 21 to December 02 downside, close to 0.9465 and 0.9495, as well as the 0.9500 threshold, could challenge the USD/CHF bulls.
In a case where the pair remains firmer past 0.9500, multiple hurdles around 0.9500 can test the pair’s further upside.
Alternatively, pullback moves need to break the resistance-turned-support line, close to 0.9410, to tease the USD/CHF bears.
However, the 50-HMA level of 0.9375 and the latest trough surrounding 0.9325, also the lowest levels since April, could challenge the pair’s additional weakness before directing sellers toward the 0.9300 round figure.
USD/CHF: Hourly chart
Trend: Further upside expected
- The GBP/JPY hurdled the 100, 50, and 20-day EMAs on Monday and gained 170 pips.
- GBP/JPY Price Analysis: Short term, the pair might pull back before resuming the uptrend.
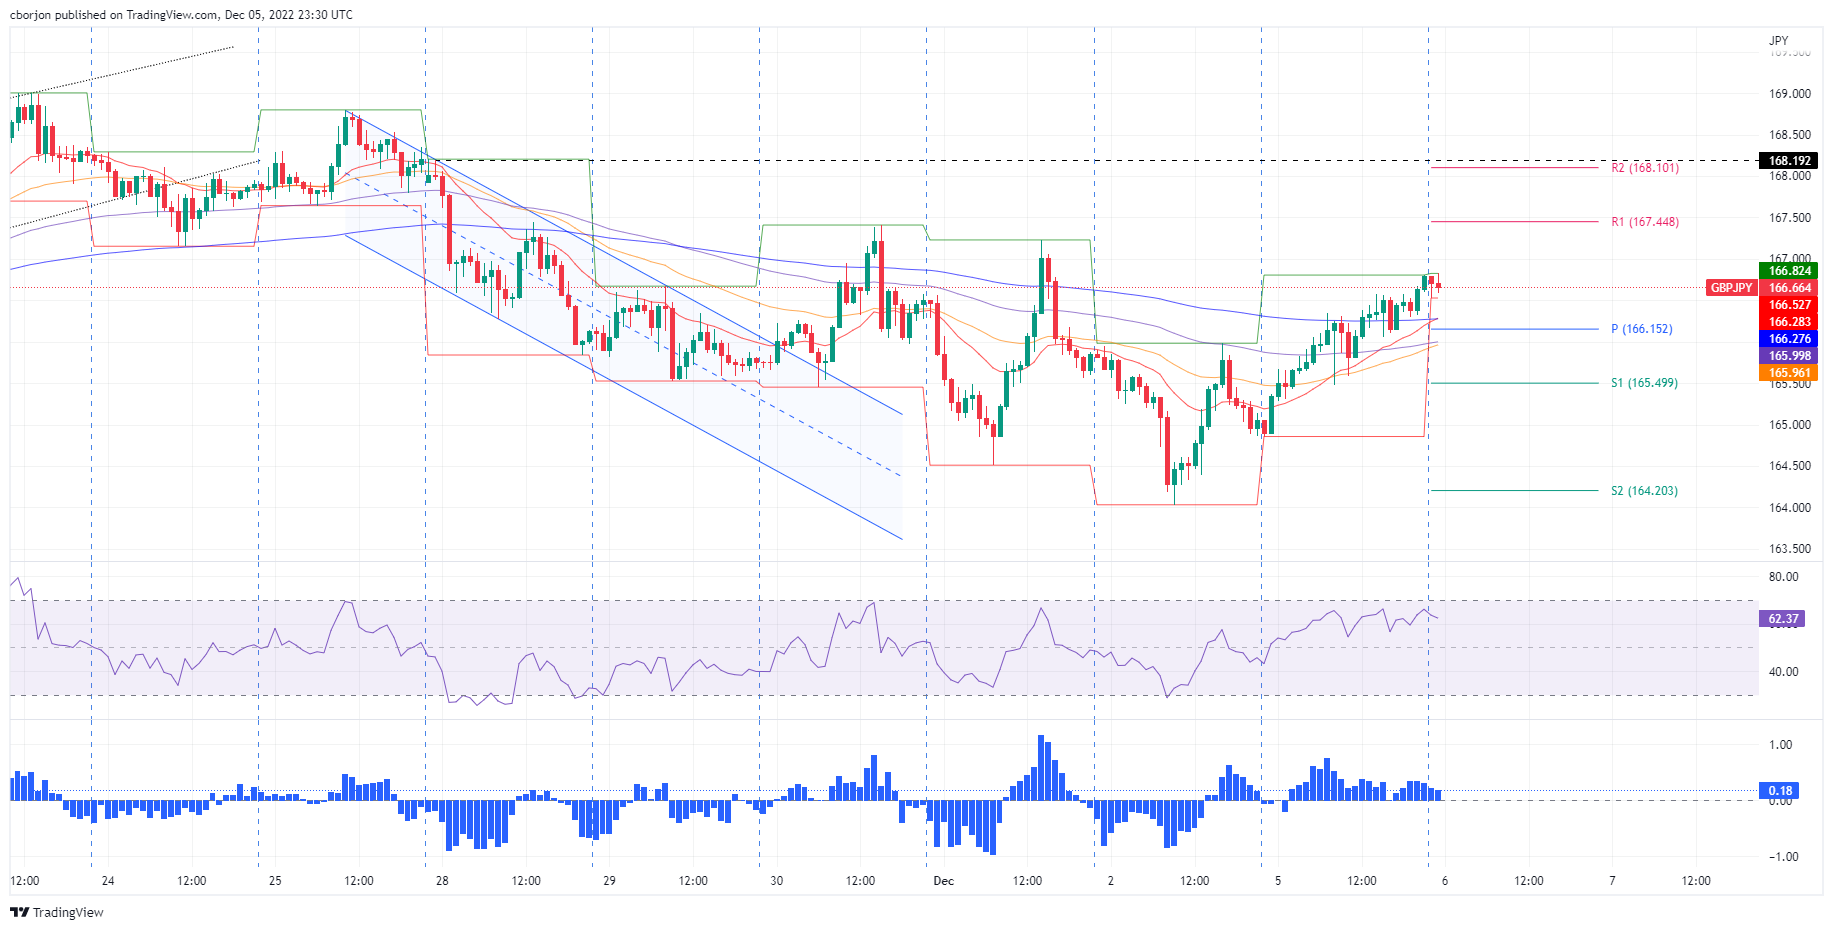
The GBP/JPY snaps two days of consecutive losses and breaches the 100, 50, and 20-day Exponential Moving Averages (EMAs), rallying more than 170 pips on Monday. In the meantime, the GBP/JPY is trading at 166.68 as the Asian Pacific session begins, registering minuscule losses of 0.07%.
GBP/JPY Price Analysis: Technical outlook
From a daily chart perspective, the GBP/JPY is neutral-upward biased, testing the 20-day EMA at 166.61 after bouncing from daily lows around the 100-day EMA at 164.83. Nevertheless, as the daily EMAs remain almost flat and the Relative Strength Index (RSI) and the Rate of Change (RoC) are practically horizontal, it suggests that the pair might consolidate.
Short term, the GBP/JPY 1-hour chart illustrates the pair as upward biased. Albeit price action is registering successive series of higher highs/lows, the RSI and the ROC are doing the opposite, portraying a negative divergence.
Hence, the GBP/JPY could fall further before resuming its uptrend. Therefore, the GBP/JPY first support would be the daily pivot at 166.15, followed by the S1 pivot level at 165.49. Break below will expose the December 5 low of 164.85.
US inflation expectations as per the 10-year and 5-year breakeven inflation rates per the St. Louis Federal Reserve (FRED) data, challenge the recently hawkish bias over the US Federal Reserve (Fed). The inflation precursors might have taken clues from the Fed policymakers’ dovish comments, including those from Chairman Jerome Powell, to challenge the US Dollar bulls. However, the previous day’s strong US data joins fresh fears from Ukraine to test the market’s optimism.
That said, the latest prints of the 5-year and 10-year inflation expectations portray a pullback from the one-month high to 2.46% and 2.39% respectively.
On Monday, US ISM Services PMI rose to 56.5 in November versus 53.1 market forecast and 54.4 previous readings whereas the Factory Orders also registered 1.0% growth compared to 0.7% expected and 0.3% prior. Further, S&P Global Composite PMI improved to 46.4 versus 46.3 initial estimations while the Services counterpart rose to 46.2 compared to 46.1 flash forecasts.
It should be noted that Friday’s US Nonfarm Payrolls (NFP) surprised markets by rising to 263K versus 200K expected and an upwardly revised prior of 284K while the Unemployment Rate matched market forecasts and prior readings of 3.7% for November. Following the upbeat data, Chicago Fed President Charles Evans said, "We are probably going to have a slightly higher peak to Fed policy rate even as we slow pace of rate hikes.”
Recently, the New York Times (NYT) released a piece of news suggesting Ukrainian drones attacked military bases hundreds of miles inside Russia and escalated war.
Amid these plays, the S&P 500 Futures print mild gains and US Treasury yields stay unchanged after the week-start fall in the prices of shares and bonds.
Also read: Forex Today: US Dollar’s comeback in the making?
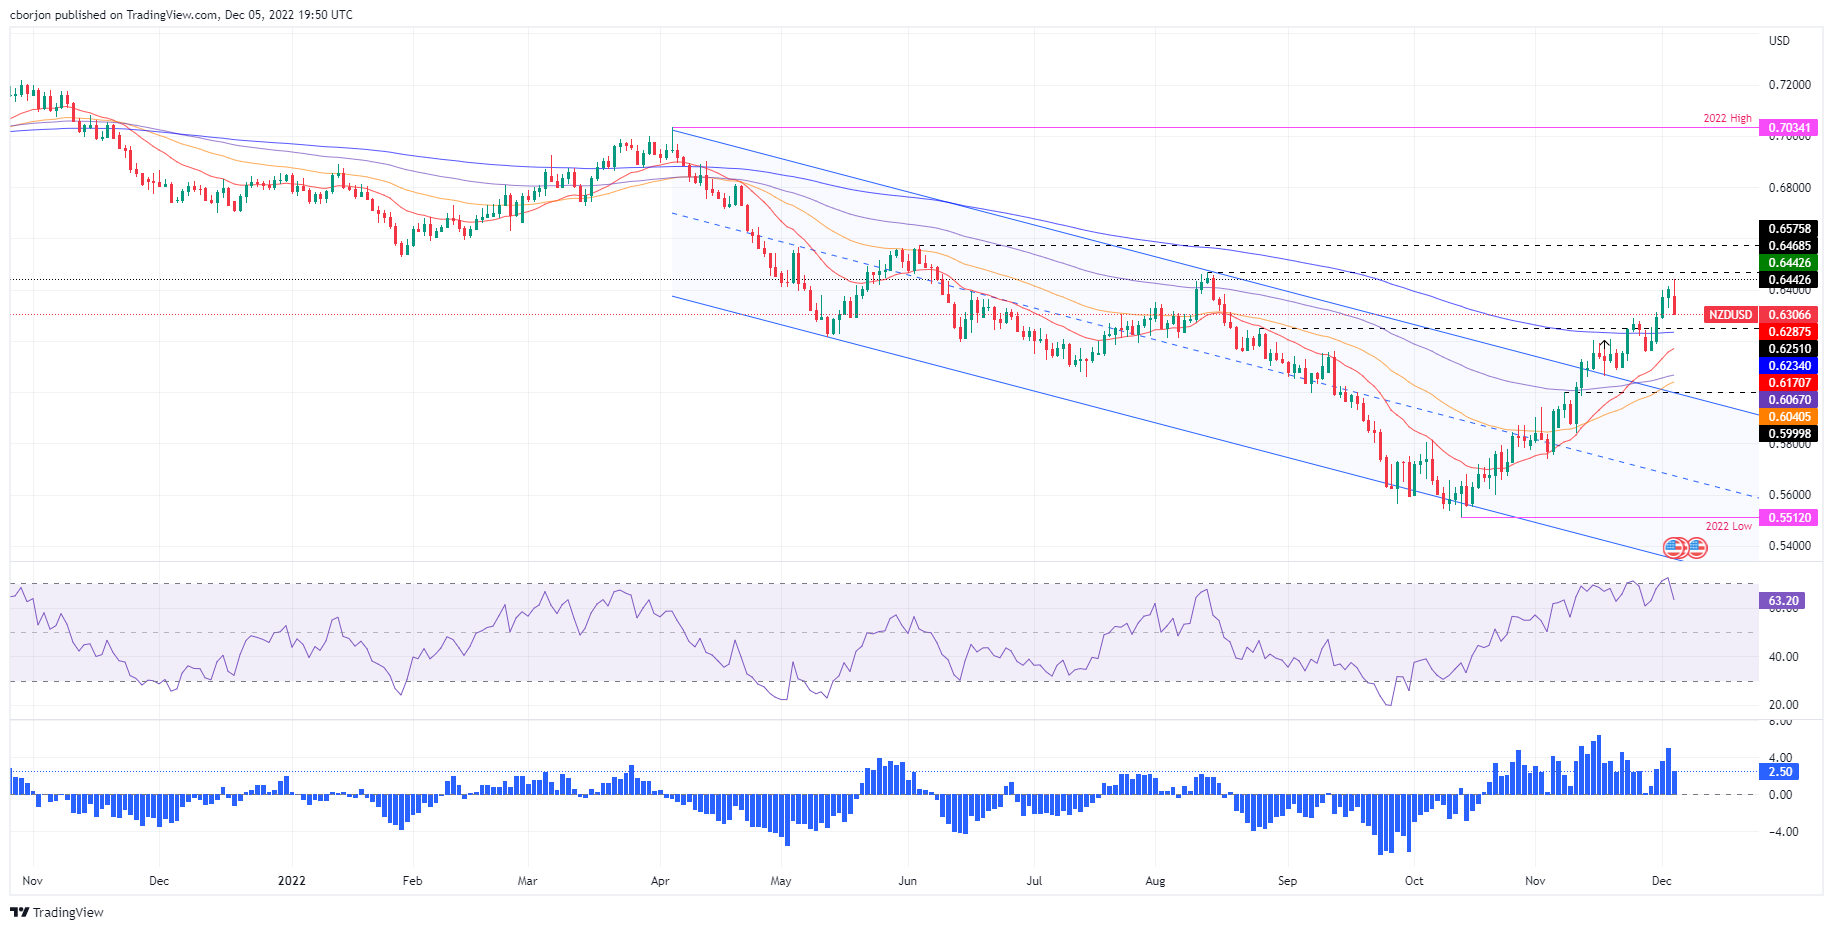
- NZD/USD holds lower ground after reversing from six-month high.
- Bearish chart formation, impending bear cross on the MACD challenge recovery moves.
- 200-DMA, monthly support line restrict immediate downside, bulls need validation from 0.6480.
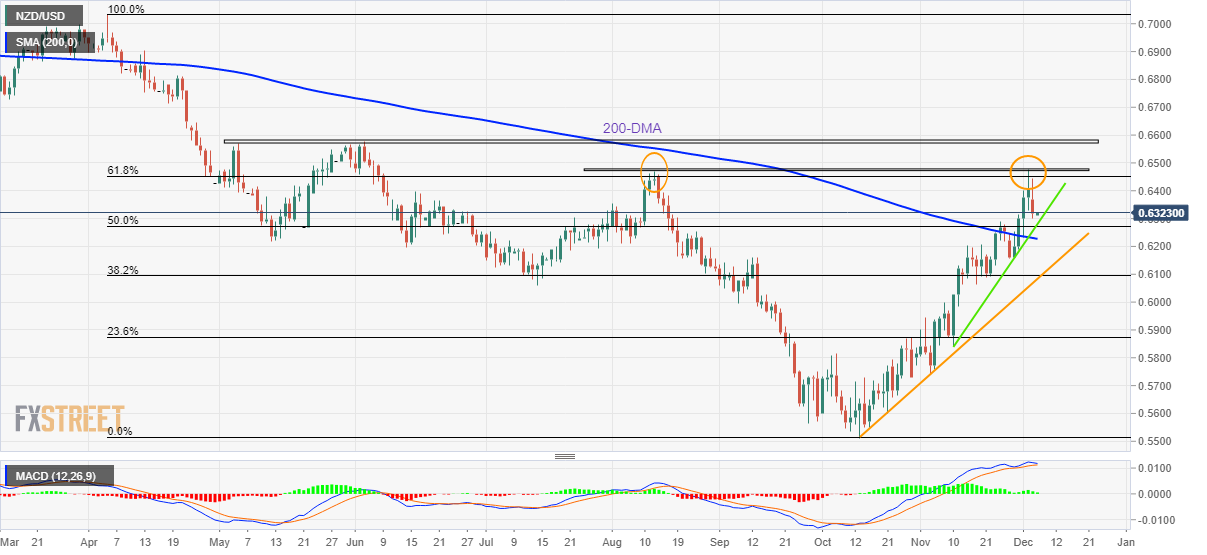
NZD/USD retreats from an intraday high of 0.6323 as it fades the corrective bounce after a two-day downtrend amid Tuesday’s Asian session.
Given the looming bearish cross on the MACD indicator, coupled with the last week’s failure to stay beyond the August month’s high near 0.6470, the Kiwi pair is likely to remain bearish.
That said, a one-month-old ascending support line near 0.6280 and the 50% Fibonacci retracement level of the pair’s April-October downside, close to 0.6275, could restrict short-term declines of the NZD/USD pair.
However, the 200-DMA and an upward-sloping trend line from October’s low, respectively near 0.6225 and 0.6080, appear tough nuts to crack for the NZD/USD bears afterward.
On the flip side, the 61.8% Fibonacci retracement level of 0.6452, also known as the golden ratio, challenges the intraday pair buyers ahead of the double tops marked near 0.6470-75.
It’s worth noting that highs marked in May and June, around 0.6570-75, act as the last defense of the NZD/USD bears.
Overall, NZD/USD remains on the bear’s radar despite the recent hesitance to break the 0.6300 threshold.
NZD/USD: Daily chart
Trend: Further downside expected
The New York Times has said that Ukraine executed its most brazen attack into Russian territory targeting two military bases hundreds of miles inside the country, using unmanned drones, according to the Russian Defense Ministry and a senior Ukrainian official.
''The drones were launched from Ukrainian territory, and at least one of the strikes was made with the help of special forces close to the base who helped guide the drones to the target, said the official, speaking on condition of anonymity to convey sensitive information.''
Market implications
A risk-off tone has struck markets at the start of the week and this news will likely embolden the US Dollar bulls.
-
US Dollar comes up for air and eyes 106.00
US data has encouraged a flight to safety after an injection of investor enthusiasm over signs of possible loosening in COVID restrictions in China faded. Renewed speculation that the Federal Reserve may not be able to pivot as soon as December is driving the forex board at the start of this week.
- USD/CAD grinds near one-week high after breaking the key hurdles to the north.
- Firmer US data triggered US Dollar run-up but pre-BOC woes test the bulls.
- 50-DMA, previous resistance line from October 13 restricts immediate downside.
- Previous weekly top restricts nearby advances, monthly resistance line adds to the upside filters.
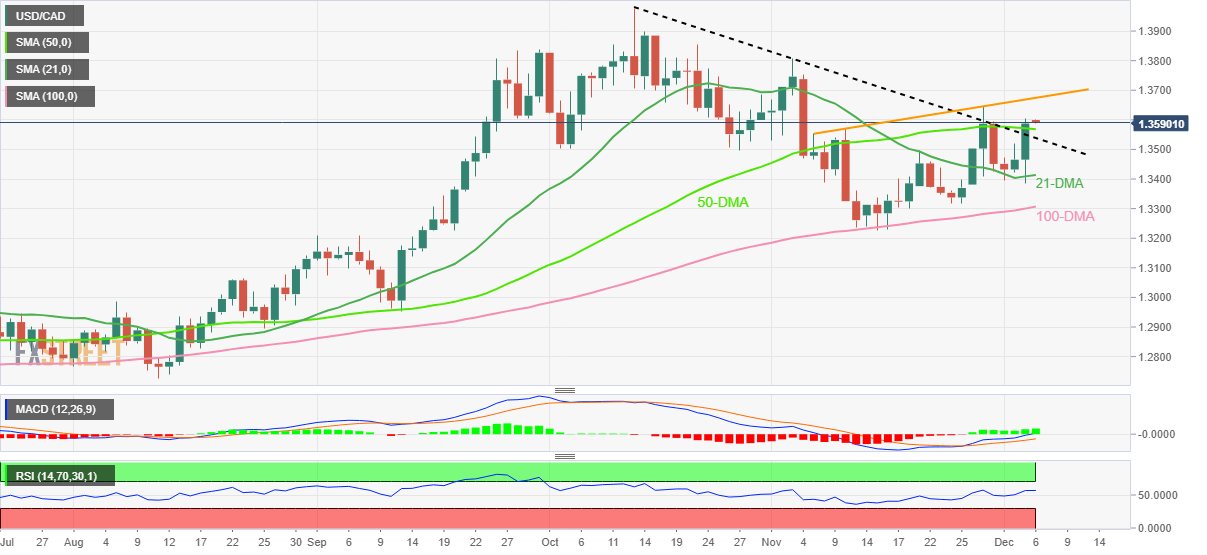
USD/CAD seesaws around a one-week high as bulls flirt with the 1.3600 threshold following a strong run-up to cross the previous key resistances. That said, the Loonie pair’s latest moves appear less lucrative for sellers as the quote stays beyond important resistance-turned-support and the US Dollar bulls are back to the table early Tuesday.
The Loonie pair began the week on the negative side amid the market amid hopes of a faster recovery in China as multiple states from the Dragon nation announced an easing of the Covid-led activity restrictions. However, strong US data raised doubts over the Fed’s easy rate hike trajectory and underpinned the USD/CAD run-up.
Also favoring the quote’s upside moves were the weaker prices of Canada’s key export WTI crude oil. WTI crude oil dropped to a one-week low while marking over 3.5% daily slump for Monday. The energy benchmark’s latest declines could be linked to the strong USD while the Covid hopes and OPEC+ inaction, as well as chatters over the Group of Seven Nations’ (G7) price cap on Russian Oil exports, test the bears.
Elsewhere, Canadian Building Permits recovered in October with -1.4% figure versus -2.0% expected and a revised down -18.2% MoM prior.
On the other hand, US ISM Services PMI rose to 56.5 in November versus 53.1 market forecast and 54.4 previous readings whereas the Factory Orders also registered 1.0% growth compared to 0.7% expected and 0.3% prior. Further, S&P Global Composite PMI improved to 46.4 versus 46.3 initial estimations while the Services counterpart rose to 46.2 compared to 46.1 flash forecasts. On Friday, the US Nonfarm Payrolls (NFP) surprised markets by rising to 263K versus 200K expected and an upwardly revised prior of 284K while the Unemployment Rate matched market forecasts and prior readings of 3.7% for November. Following the upbeat data, Chicago Fed President Charles Evans said, "We are probably going to have a slightly higher peak to Fed policy rate even as we slow pace of rate hikes.”
Amid these plays, Wall Street closed in the red while the US 10-year Treasury yields rose eight basis points to 3.58% by the end of Monday’s North American session.
Looking forward, the market’s cautious mood ahead of the Bank of Canada’s (BOC) monetary policy meeting could restrict immediate USD/CAD moves. However, the dovish hopes from the Canadian central bank challenge the pair sellers despite hopes of 0.50% rate increase.
Technical analysis
Among the key immediate supports, the 50-DMA level surrounding 1.3570 could gain the intraday seller’s attention before the previous resistance line from October 13, close to 1.3535 at the latest.
In a case where the USD/CAD price drops below 1.3535, the odds of witnessing a slump to the 21-DMA support near 1.3415 can’t be ruled out.
Even so, the 100-DMA level around 1.3300 will be a tough nut to crack for the USD/CAD bears before taking control.
Alternatively, last week’s top of 1.3645 restricts the nearby upside of the USD/CAD pair before directing the buyers towards a one-month-old upward-sloping trend line, close to 1.3675 by the press time.
USD/CAD: Daily chart
Trend: Further upside expected
- The US Dollar is testing prior lows and there is room to go.
- A retest of 106.00 could be in order in the meantime.
- The greenback is on the back side of the daily trendline and the downside is favoured while below 108.00.
The US Dollar is up after data showed that the US Services industry activity unexpectedly rose in Novemberederal Reserve may lift interest rates more than recently projected. DXY, an index that measures the US Dollar vs. the greenback is back into the 105 area following a rise from the lows of the November bearish cycle of 104.11.
The data helped to encourage a flight to safety after an injection of investor enthusiasm over signs of possible loosening in COVID restrictions in China faded. Renewed speculation that the Federal Reserve may not be able to pivot as soon as December is driving the forex board at the start of this week.
US major indexes ended in the red which is a bearish setup for Tokyo today due to the concerns that the US Federal Reserve might continue on its aggressive policy tightening path despite fears of a recession next year. The Institute for Supply Management (ISM) said its Non-Manufacturing PMI rose to 56.5 last month from 54.4 in October, indicating that the services sector, which accounts for more than two-thirds of US economic activity, remained resilient in the face of rising interest rates. The data beat forecast the Non-manufacturing PMI would fall to 53.1.
When combined with the end of last week's data and the surprisingly strong Nonfarm Payrolls, wage growth and consumer spending that had accelerated in October, the US Dollar is set to benefit. Before the Nonfarm Payrolls report, the market pricing of the terminal rate was seen topping out at 4.75%-5%. However, the Fed is now seen raising its policy rate, currently in the 3.75%-4% range, to 4.92% by March of next year and more likely than not into the 5%-5.25% range by May, based on futures contract prices and the CME Fed watch tool.
With all that being said, however, Fed Chair Jerome Powell said last week that the US central bank could scale back the pace of its rate increases "as soon as December." Futures contracts tied to the Fed policy rate still imply a 70% chance that central bankers will slow the pace of rate hikes when they meet Dec. 13-14, rather than adding to a string of 75-basis-point rate hikes over the past four meetings.
US Dollar bears will be keeping an eye out for any follow-through in risk appetite on the back of several cities easing their COVID restrictions in China in what appears to be a shift toward gradual reopening as the country nears entering the fourth year of the pandemic. However, despite the partial relaxation, many restrictions remain in place. In some parts of China, new lockdowns and travel restrictions are still being imposed.
US Dollar technical analysis
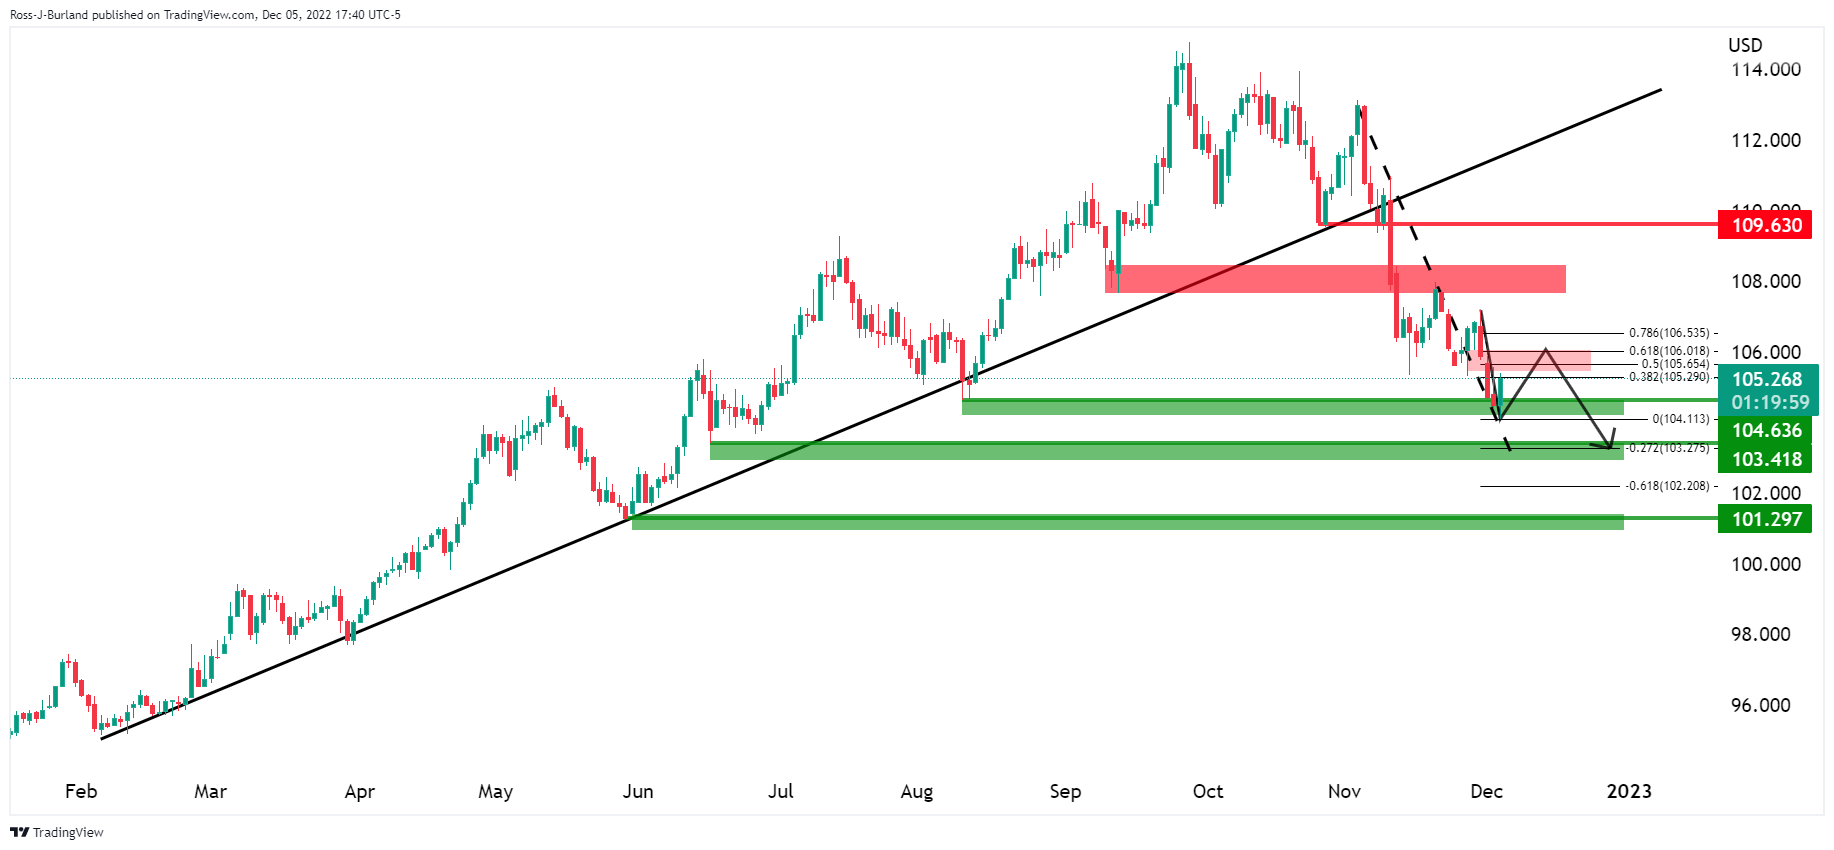
The Greenback is on the back side of the daily trendline and the downside is favoured while below 108.00. A retest of 106.00 could be in order in the meantime, however.
- Sour market sentiment has dragged the Cable below 1.2200.
- An oscillation in the bullish range by the RSI (14) indicates that the bullish momentum is still solid.
- A mean reversion to the 20-EMA around 1.1970 is highly expected.
The GBP/USD pair has sensed barricades around the immediate hurdle of 1.2200 in the early Tokyo session. The three-day winning streak of the Cable ended on Monday after it failed to extend its rally above 1.2340. A cautious market mood hammered the Pound Sterling and sent it to lower below the round-level cushion of 1.2200.
Meanwhile, the US Dollar Index (DXY) has witnessed a significant buying interest and has advanced to near 105.40 after refreshing its fresh- foe-month low at 104.10.
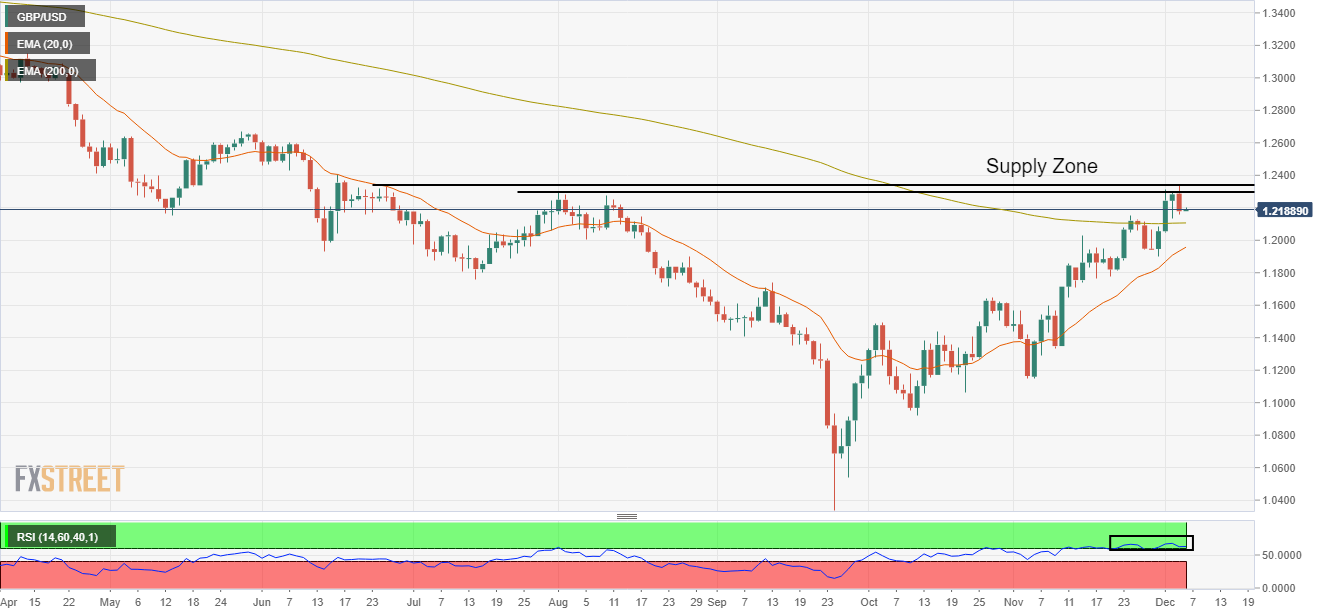
On a daily scale, Cable has faced selling pressure after testing the supply zone placed in a narrow range of 1.2292-1.2351. The gap between the Cable and the 20-period Exponential Moving Average (EMA) has escalated, therefore, a mean reversion cannot be ruled out. The Cable is still holding the 200-EMA at 1.2108, which indicates that the long-term trend is still bullish.
Meanwhile, the Relative Strength Index (RSI) (14) is oscillating in a bullish range of 60.00-80.00, which indicates that the bullish momentum is still active.
Going forward, a decline below Friday’s low at 1.2134 will drag the Cable toward the psychological resistance at 1.2000, followed by the 20-EMA around 1.1971.
On the flip side, a break above Monday’s high at 1.2345 will drive the Cable toward June 16 high of around 1.2400. A breach of the latter will send the major toward June 1 low at 1.2460.
GBP/USD daily chart
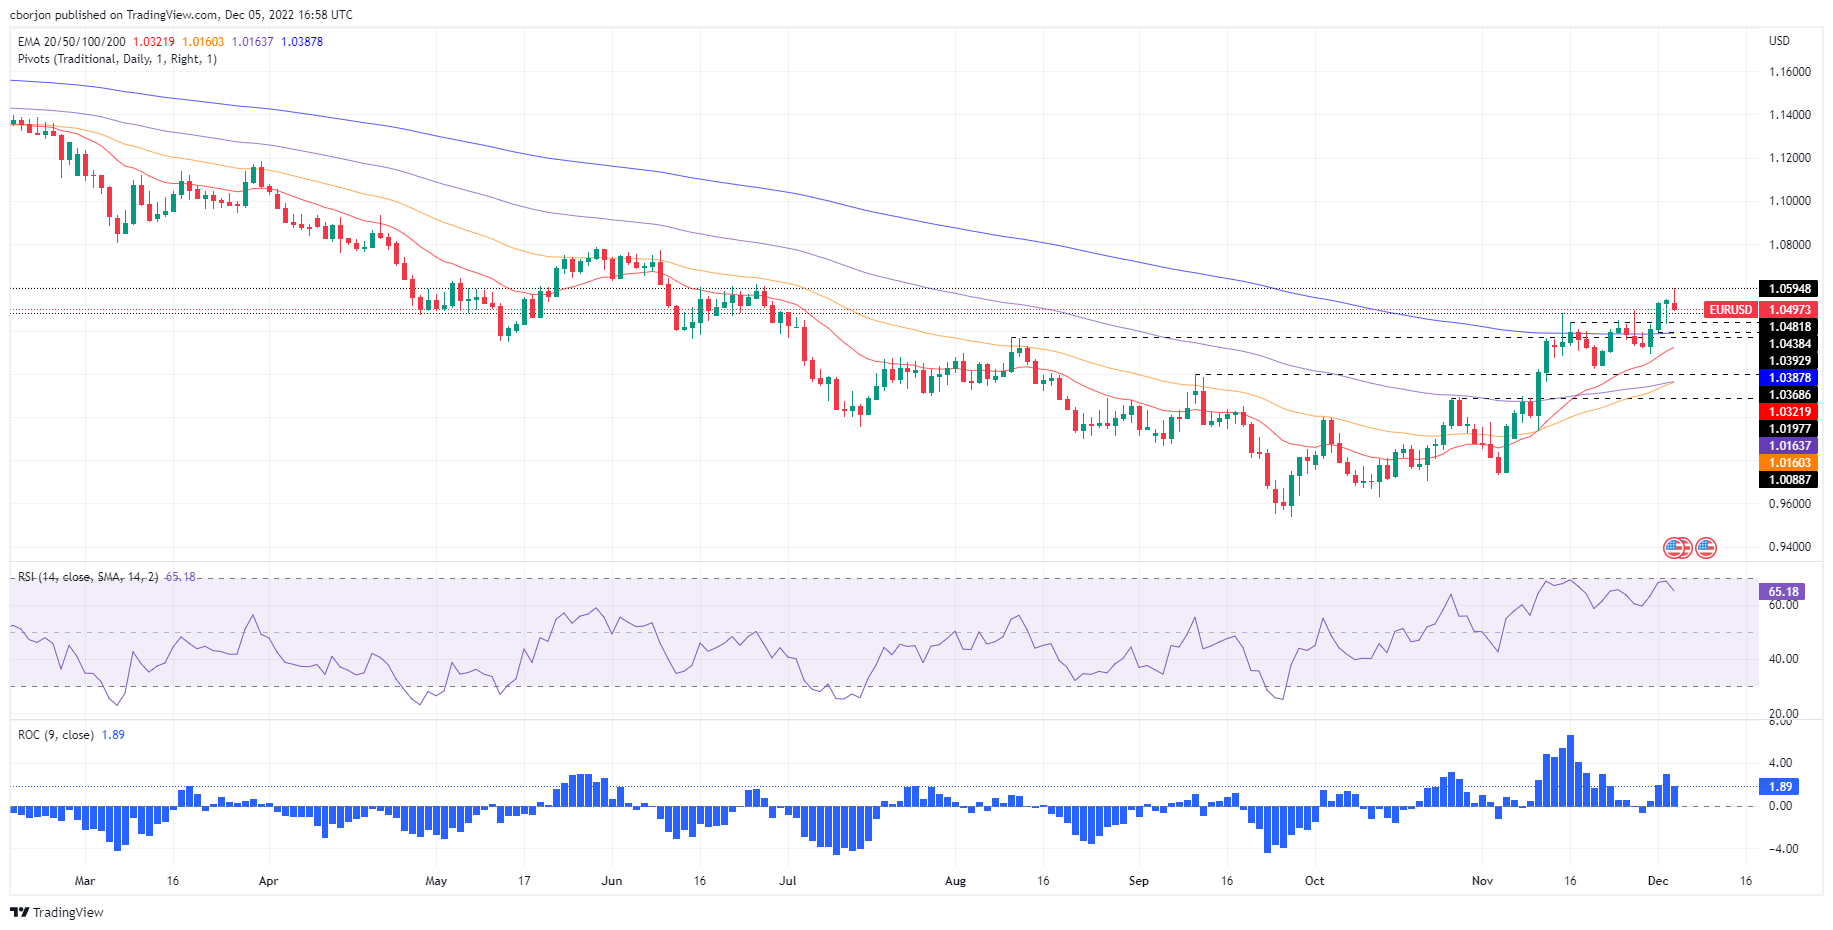
- EUR/USD tanks below the 1.0500 figure as buying pressure fades.
- EUR/USD Price Analysis: The 200-DMA at sight if the pair tumbles below 1.0400.
On Monday, the EUR/USD stumbled from around 1.0594 due to some factors, including positive economic data from the United States (US), and high US Treasury yields, amidst China’s easing Covid restrictions. At the time of writing, as the Asian Pacific session begins, the EUR/USD is trading at 1.0488.
EUR/USD Price Analysis: Technical outlook
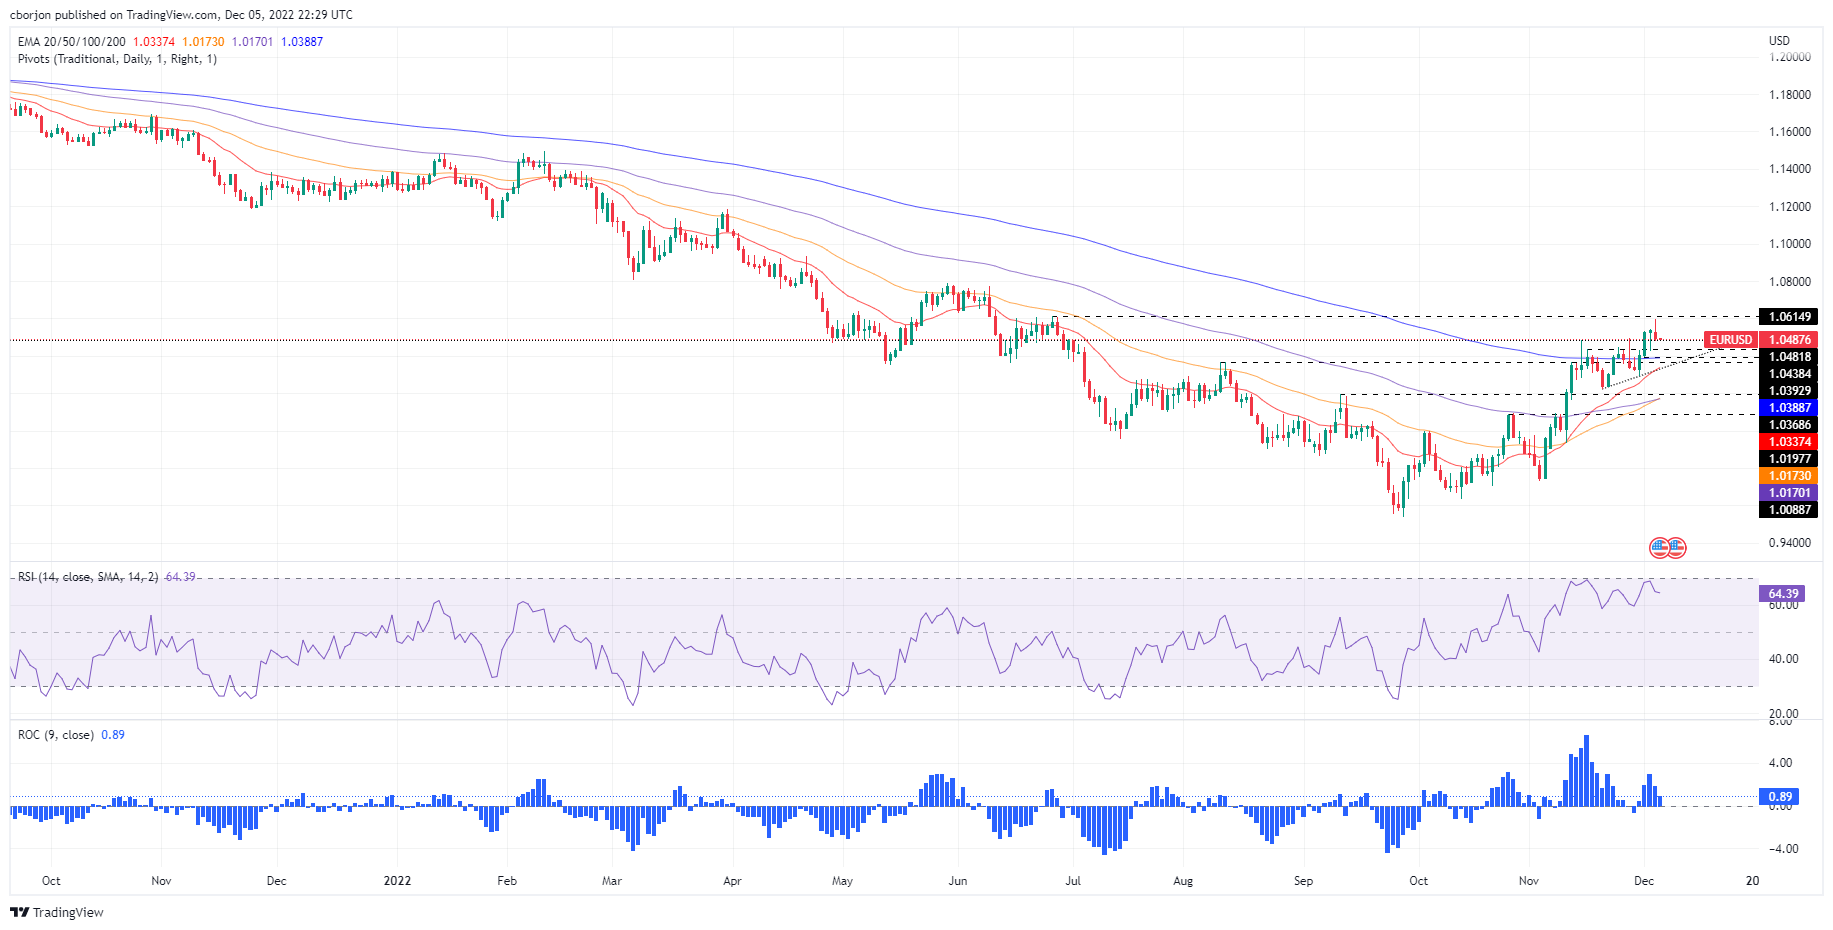
From a daily chart perspective, the EUR/USD is upward biased once it cleared the 200-day Exponential Moving Average (EMA) on November 30, extending its gains to three consecutive days. However, Monday’s story is different, after US economic data revealed that the US Federal Reserve (Fed) would need to keep increasing rates. Therefore, the EUR/USD dropped and eyes a test of the December 2 daily low of 1.0392.
Albeit in bullish territory, the Relative Strength Index (RSI) aims downwards, while the Rate of Change (RoC) depicts buyer pressure is fading.
All that said, the EUR/USD path of least resistance is downward biased. Therefore, the EUR/USD first support would be the December 2 daily low of 1.0392. A breach of the latter will expose the 200-day EMA at 1.0388, followed by the 50-day EMA at 1.0173
.
- AUD/JPY struggles to defend the bounce off seven-week low.
- Sour sentiment ahead of the key RBA event challenge the pair’s rebound.
- RBA is expected to unveil 0.25% rate hike, future tightening of monetary policy will be in focus.
- Easing Covid woes, talks of BOJ’s exit from ultra-easy monetary policy act as additional catalysts.
AUD/JPY justifies its risk-barometer status as it fades the previous day’s rebound from a nearly four-month low, taking rounds to 91.60 during early Tuesday morning in Asia.
The cross-currency pair began the week on a firmer footing amid hopes of a faster recovery in China as multiple states from the Dragon nation announced an easing of the Covid-led activity restrictions. However, challenges for the Bank of Japan’s (BOJ) easy monetary policy appeared to have weighed on the pair afterward. It’s worth noting that the Reserve Bank of Australia (RBA) is up for announcing its latest monetary policy decision at 03:30 AM GMT on Tuesday and hence the AUD/JPY price remains sidelined ahead of the key event.
That said, Reuters reported on Monday that China is on course to downgrade its management of COVID-19 from a top-level Category A infectious disease to a less strict Category B disease as early as January. The news came after Chinese President XI Jinping termed the previous jump in the virus cases as Omicron and mostly of mild nature.
Additionally, doves at the Bank of Japan (BOJ) appear losing their previous status as talks of altering the inflation target and a gradual exit from the easy-money policies are taking rounds of late. The last week, Japanese media Asahi quotes Bank of Japan (BOJ) Board Member Naoki Tamura as saying, “The Bank of Japan should conduct a review of its monetary policy framework and the feasibility of its 2% inflation target.” However, BOJ Governor defended the policy status while saying, “A global economic slowdown has been observed, and Japan's inflation is expected to decelerate from 2023.”
Talking about the data, there wasn’t much from Japan but Australia’s AiG Performance of Construction Index for November rose to 48.2 versus 43.3 whereas S&P Global Services PMI rose more than 47.2 initial forecasts to 47.6 while the Composite PMI also improved to 48.0 versus 47.7 prior. Further, TD Securities Inflation for November jumped to 5.9% YoY and 1.0% MoM compared to 5.2% and 0.4% respective priors.
Additionally, China Caixin/S&P Global Services Purchasing Managers' Index (PMI) fell to 46.7 from 48.4, marking the third monthly contraction in a row. In doing so, the private services gauge also dropped lowest levels in six months.
It should be noted that the doubts over the Fed’s easy rate hike trajectory also recently challenged the market sentiment and weighed on the AUD/JPY prices.
That said, Wall Street closed in the red while the US 10-year Treasury yields rose eight basis points to 3.58% by the end of Monday’s North American session.
Looking forward, AUD/JPY may witness inaction ahead of the RBA’s verdict as traders doubt the latest hopes of witnessing an easy rate hike hopes from the Aussie central bank amid firmer data. It should be observed the that RBA is expected to announce a 25 basis point rate increase to 3.10% but the Monetary Policy Statement will be more important to watch for clear directions.
Technical analysis
Although a four-month-old ascending support line, around 91.00 by the press time, restricts immediate AUD/JPY downside, the pair buyers remain off the table unless witnessing a clear break of the 200-DMA hurdle, close to 93.00 at the latest.
- AUD/USD has plunged below 0.6700 as the market mood has soured on upbeat US Services PMI data.
- A tight labor market and solid demand for services in the US indicate that short-term inflation is still de-anchored.
- The RBA is expected to announce a third consecutive 25 bps rate hike ahead.
The AUD/USD pair has witnessed an intense sell-off after refreshing its 11-week high at 0.6851 on Monday. The Aussie asset has plunged below the round-level support of 0.6700 in the early Asian session and is expected to remain on tenterhooks ahead of the interest rate decision by the Reserve Bank of Australia (RBA).
The risk profile turned extremely bearish on Monday after the US economy reported better-than-projected US ISM Services PMI data. This has renewed fears of a bigger rate hike announcement by the Federal Reserve (Fed) in its December monetary policy meeting.
The sour market mood improved safe-haven’s appeal dramatically. The US Dollar Index (DXY) recovered sharply to near 105.40 after registering a fresh five-month low near 104.10. S&P500 witnessed extreme selling pressure amid the risk aversion theme. Meanwhile, the 10-year US Treasury yields have recovered firmly to near 3.59%.
The US ISM Services PMI soared to 56.5, higher than the projections of 53.1 and the prior release of 54.4. Also, Friday’s Nonfarm Payrolls (NFP) were extremely stronger than projections, which indicated that the overall demand is robust and short-term inflation expectations are still de-anchored. This could ruin the plan of deceleration of interest rate hike pace by the Fed as expected for the monetary policy meeting scheduled for next week.
On the Australian front, investors are keeping an eye on RBA’s interest rate decision. RBA Governor Philip Lowe is expected to continue its 25 basis points (bps) rate hike culture for the third time consecutively despite signs of exhaustion in the inflationary pressures. This may push RBA’s Official Cash Rate (OCR) to 3.10%.
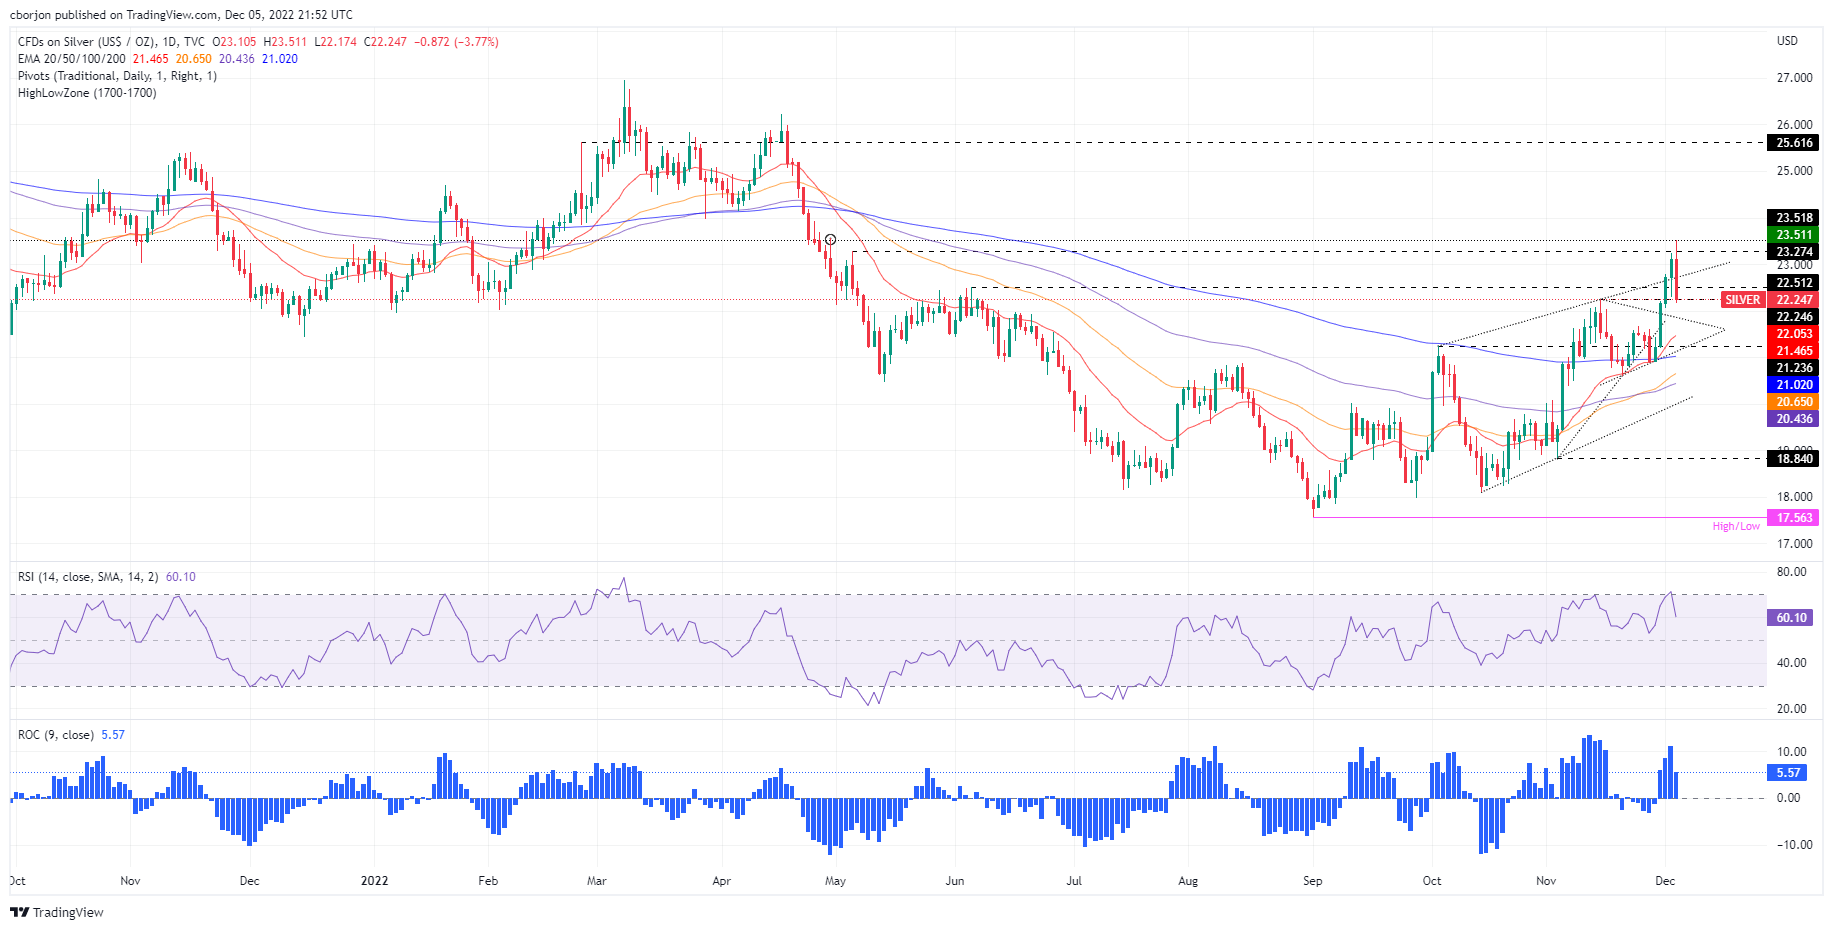
- Silver price plunges 3.74%, on high US Treasury yields, back below $22.30.
- Silver Price Analysis: A daily close below $22.24 would exacerbate a fall further; otherwise, a re-test of $23.00 is possible.
Silver price collapsed from around $23.51 daily high down to $22.23, spurred by high US Treasury yields caused by upbeat US economic data justifying the Federal Reserve’s (Fed) need to continue increasing borrowing costs. Therefore, the XAG/USD drops 3.90%, trading at $22.25.
Silver Price Analysis: XAG/USD Technical Outlook
The XAG/USD daily chart portrays the white metal as upward biased, despite falling from multi-month highs. Should be noted that XAG/USD is testing the November 15 daily high of 22.24, which, once cleared, would exacerbate a deeper correction toward the $22.00 psychological mark, followed by the 200-day Exponential Moving Average (EMA) at $21.02.
The Relative Strength Index (RSI) exited from overbought conditions, triggering a sell signal that caused Monday’s dive, while the Rate of Change (RoC) depicts buyers losing momentum.
Therefore, the XAG/USD might be headed for a pullback. However, if XAG/USD holds its reins above $22.24, that could open the door for consolidation. Hence, the XAG/USD first resistance would be the $22.50 mark, followed by the $23.00 figure. Break above will expose the multi-month high of $23.50.
Silver Key Technical Levels
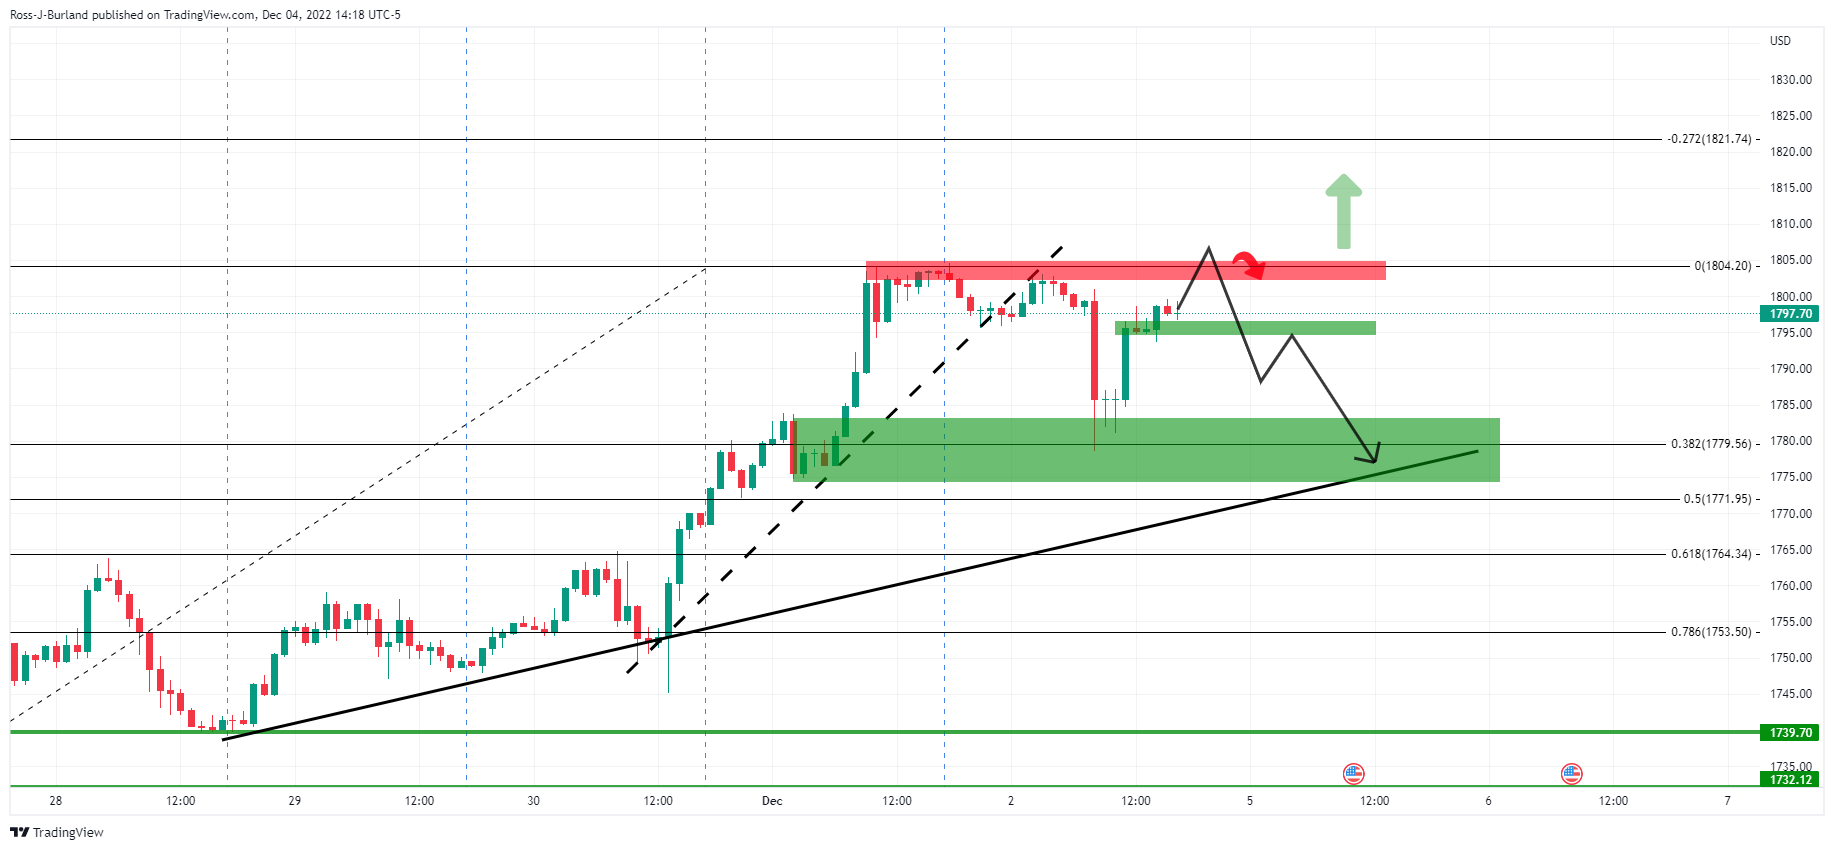
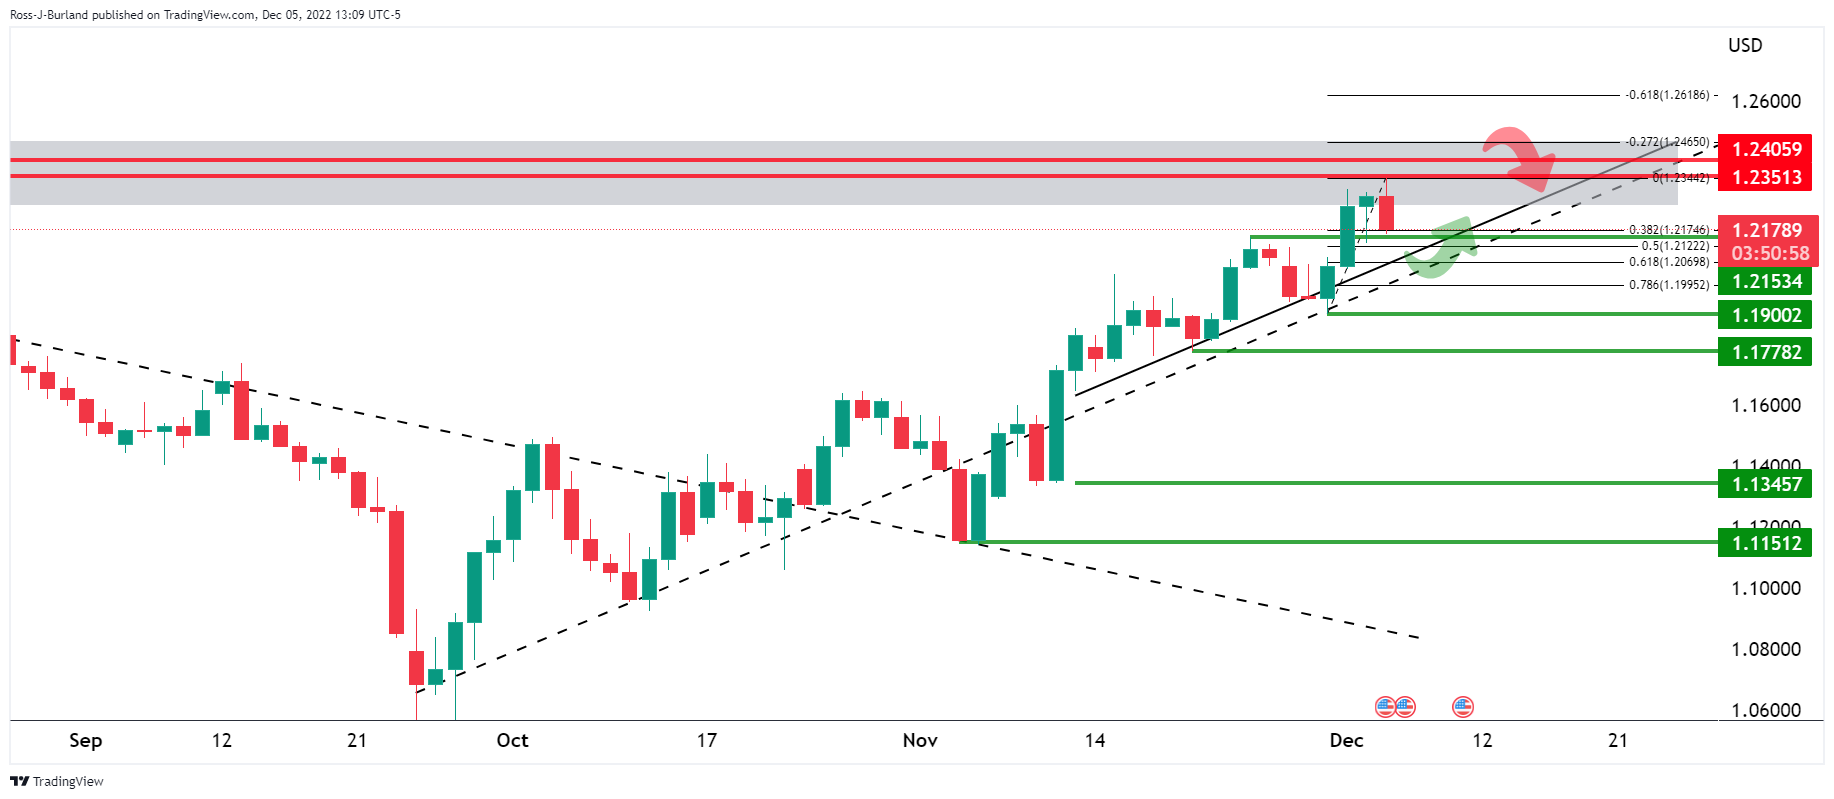
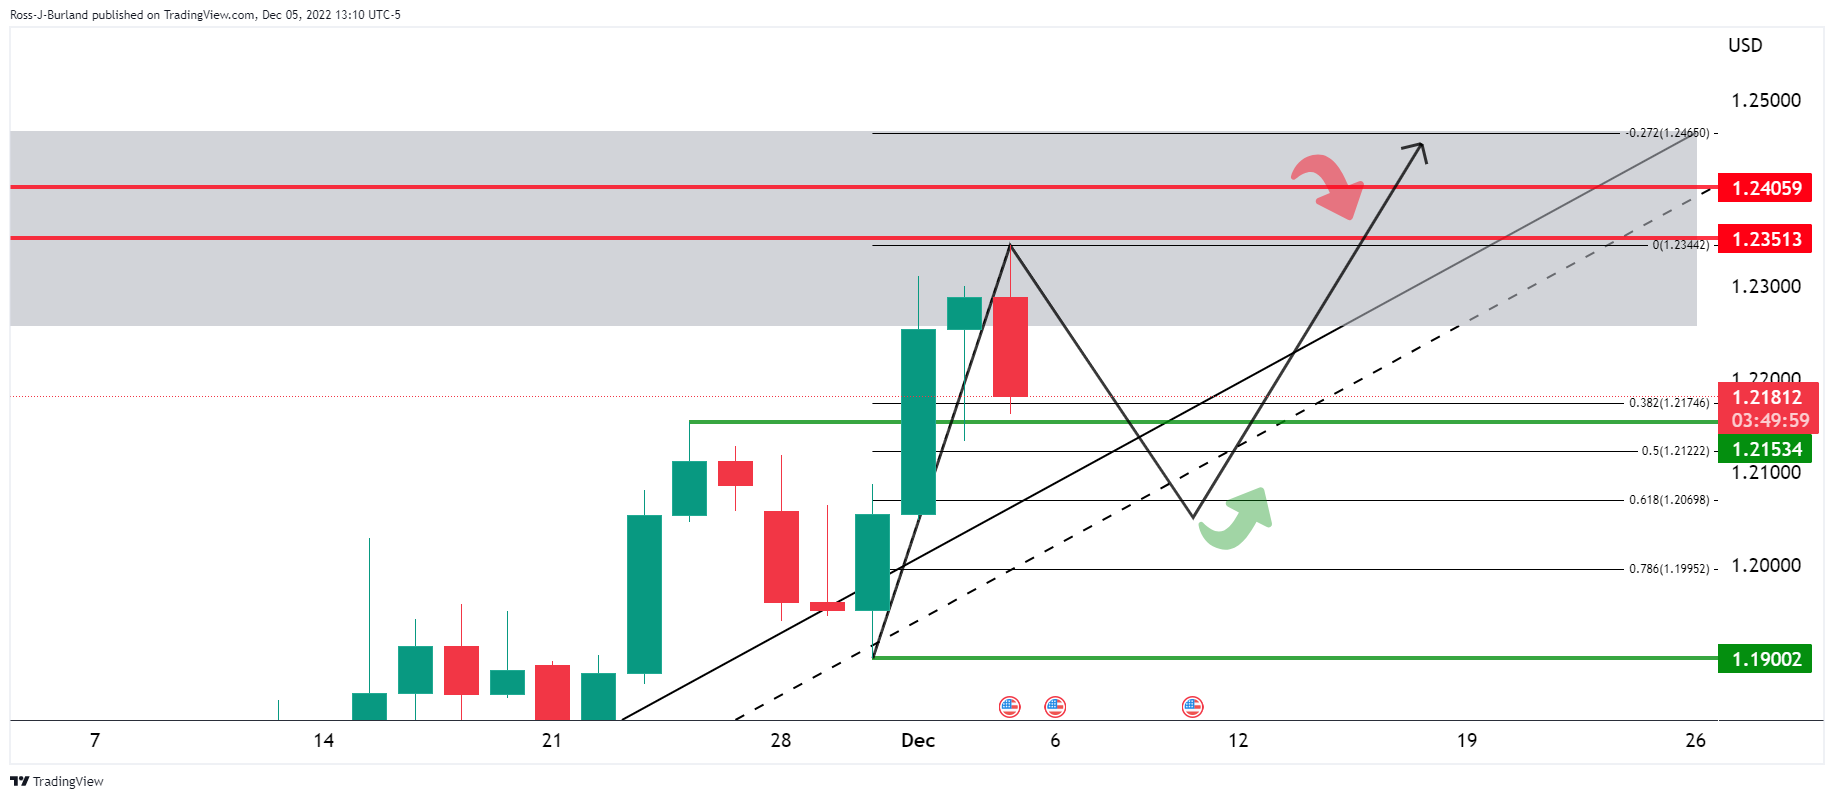
- Gold bears have charged in and the price is now at a fresh layer of support.
- Gold price is now on the backside of the micro trend, testing the daily W-formations' neckline support.
- A bullish correction could be on the cards with $1,780 eyed.
Gold price was smashed lower at the start of the week and is ending the North American session lower by some 1.65%. XAU/USD printed a low of $1,765.91 and fell from a high of $1,810.01 in a move that was forecasted in this week's pre-market analysis: Gold, Chart of the Week: XAU/USD bears eye a typical corrective opportunity below critical resistance
While there was a technical bias to the downside for the start of the week, the fundamentals drove the move as investors fretted that better-than-expected service-sector activity could point to the Federal Reserve hiking interest rates for longer.
US data switch flipped
The Institute for Supply Management (ISM) said its Non-Manufacturing PMI rose to 56.5 last month from 54.4 in October, indicating that the services sector, which accounts for more than two-thirds of US economic activity, remained resilient in the face of rising interest rates.
The data beat forecast the Non-manufacturing PMI would fall to 53.1. This data combined with Friday's surprisingly strong Nonfarm Payrolls and wage growth data in November as well as news that consumer spending had accelerated in October gives has raised optimism that a recession could be avoided in 2023.
The switch has flipped since the recently weaker Consumer Price Index, prior ISM data and dovish Federal Reserve chairman Jerome Powell's comments that combined had started to weigh on the market's pricing of the terminal rate that had declined to below 5%. The rate was seen topping out at 4.75%-5% before the series of bullish data.
However, the Fed is now seen raising its policy rate, currently in the 3.75%-4% range, to 4.92% by March of next year and more likely than not into the 5%-5.25% range by May, based on futures contract prices and the CME Fed watch tool. However, futures contracts tied to the Fed policy rate still imply an 89% chance that the US central bank will increase interest rates by 50 basis points next week to 4.25%-4.50%, with the rates peaking at 4.984% in May 2023.
Nevertheless, US bond yields are still rising, bearish for gold since it offers no interest. The yield on the US 10-year note was last seen up 3.4% to 3.605%. The Federal Open Market Committee (FOMC) meets on Dec. 13-14.
Gold technical analysis
Prior analysis:
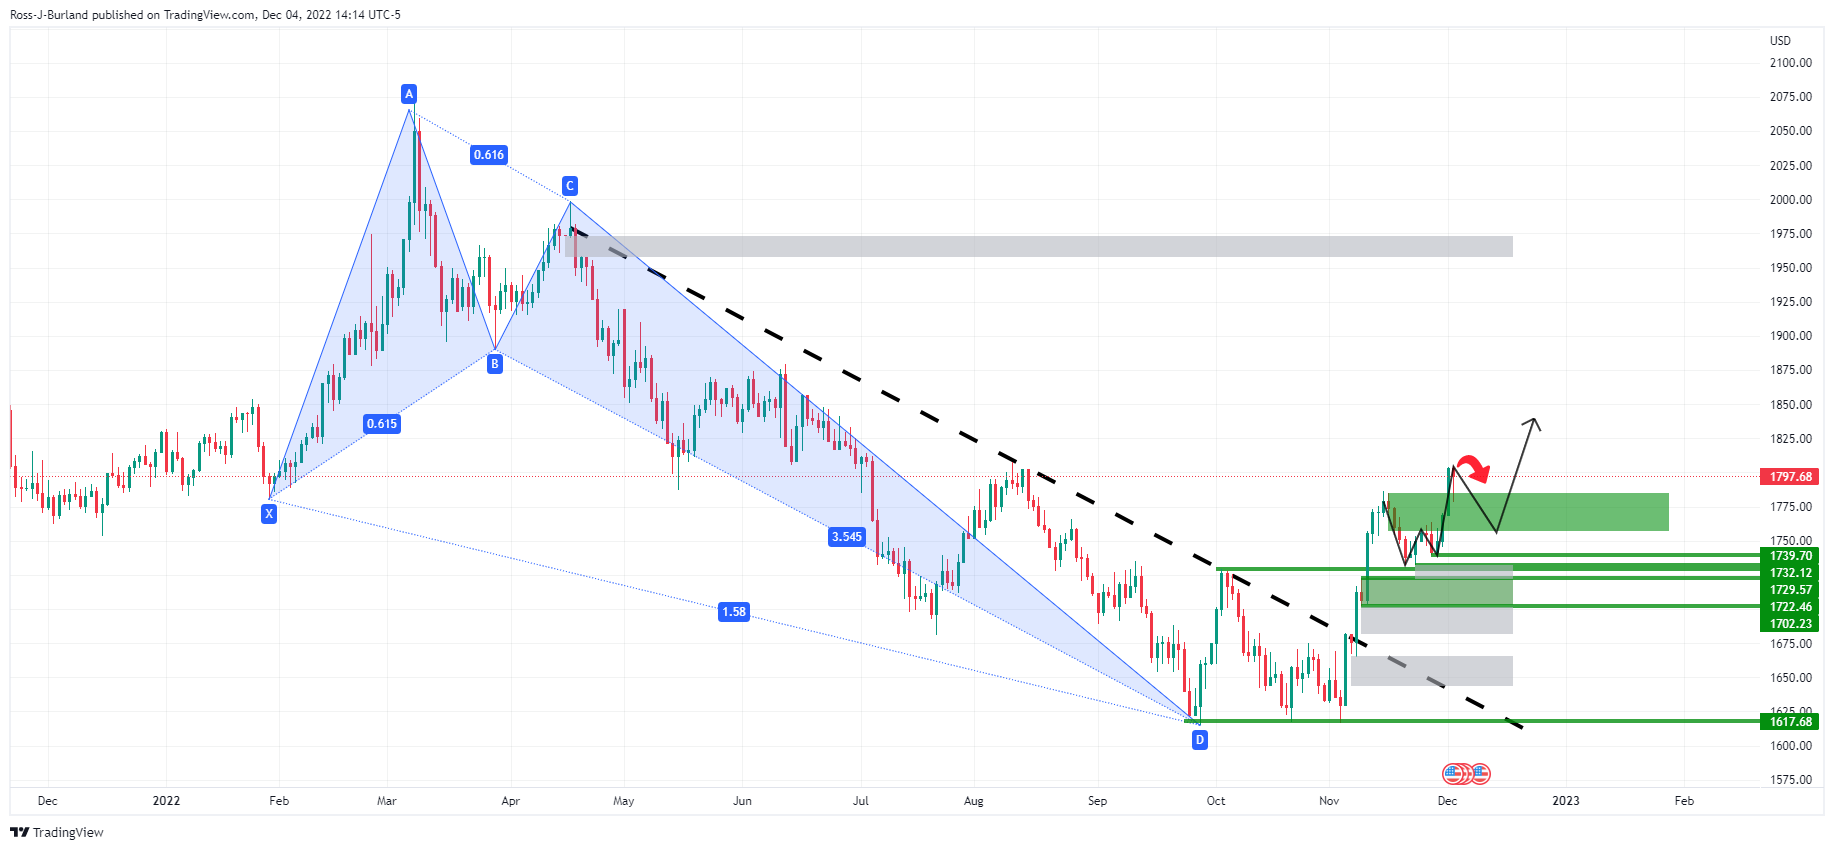
As per this week's pre-open analysis, it was stated that the price was on the back side of the trend, which is overall bullish as per the harmonic pattern while above the W-formation's lows near $1,730.
Zooming in ...
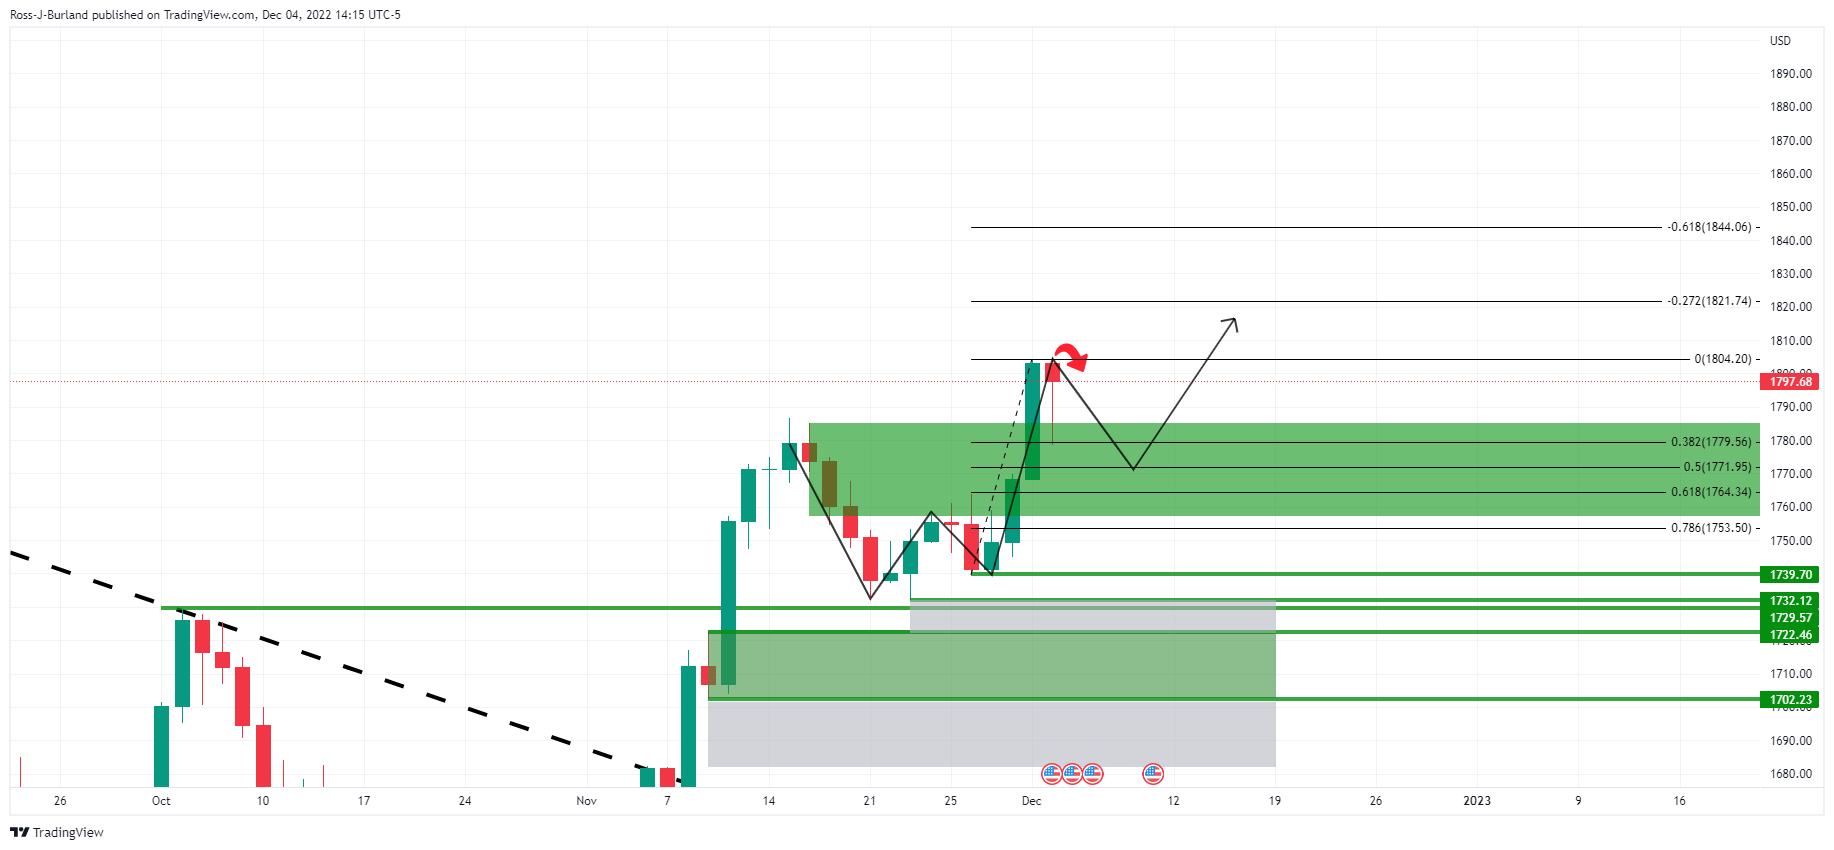
There were prospects of a correction towards the neckline of the W-formation as illustrated above and below, down on the hourly chart:
With the price potentially basing, for the meantime, in the $1,790s, a move into test into the $1,800s was expected to ''draw in the sellers again for the opening sessions with a move into the dynamic support that meets the daily 38.2% Fibonacci and a 50% mean reversion below that.''
Gold update:
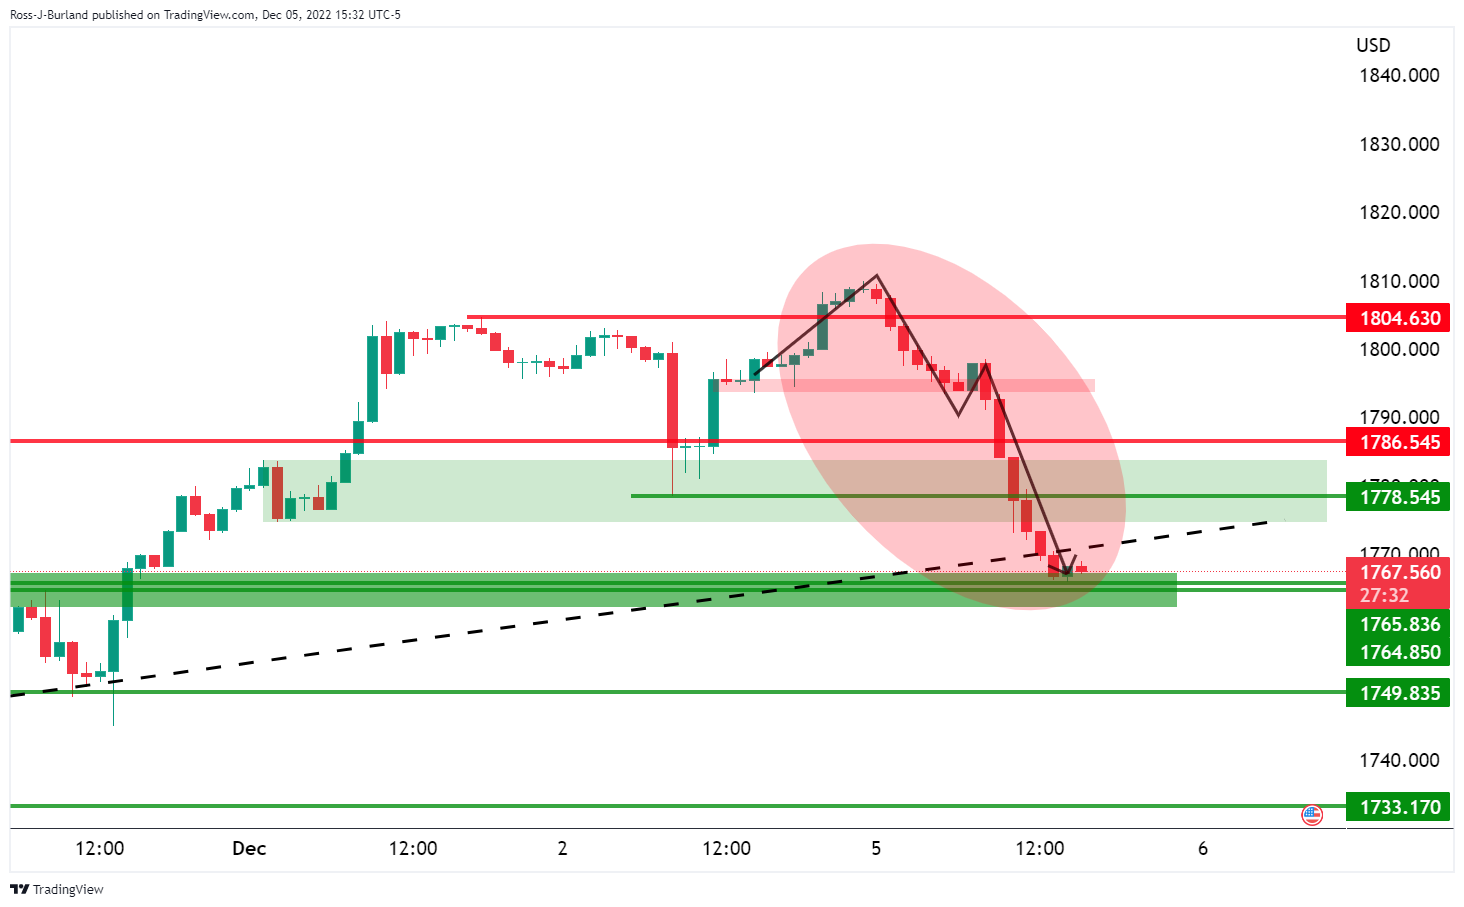
The price action has followed the projection to the tee as illustrated above.
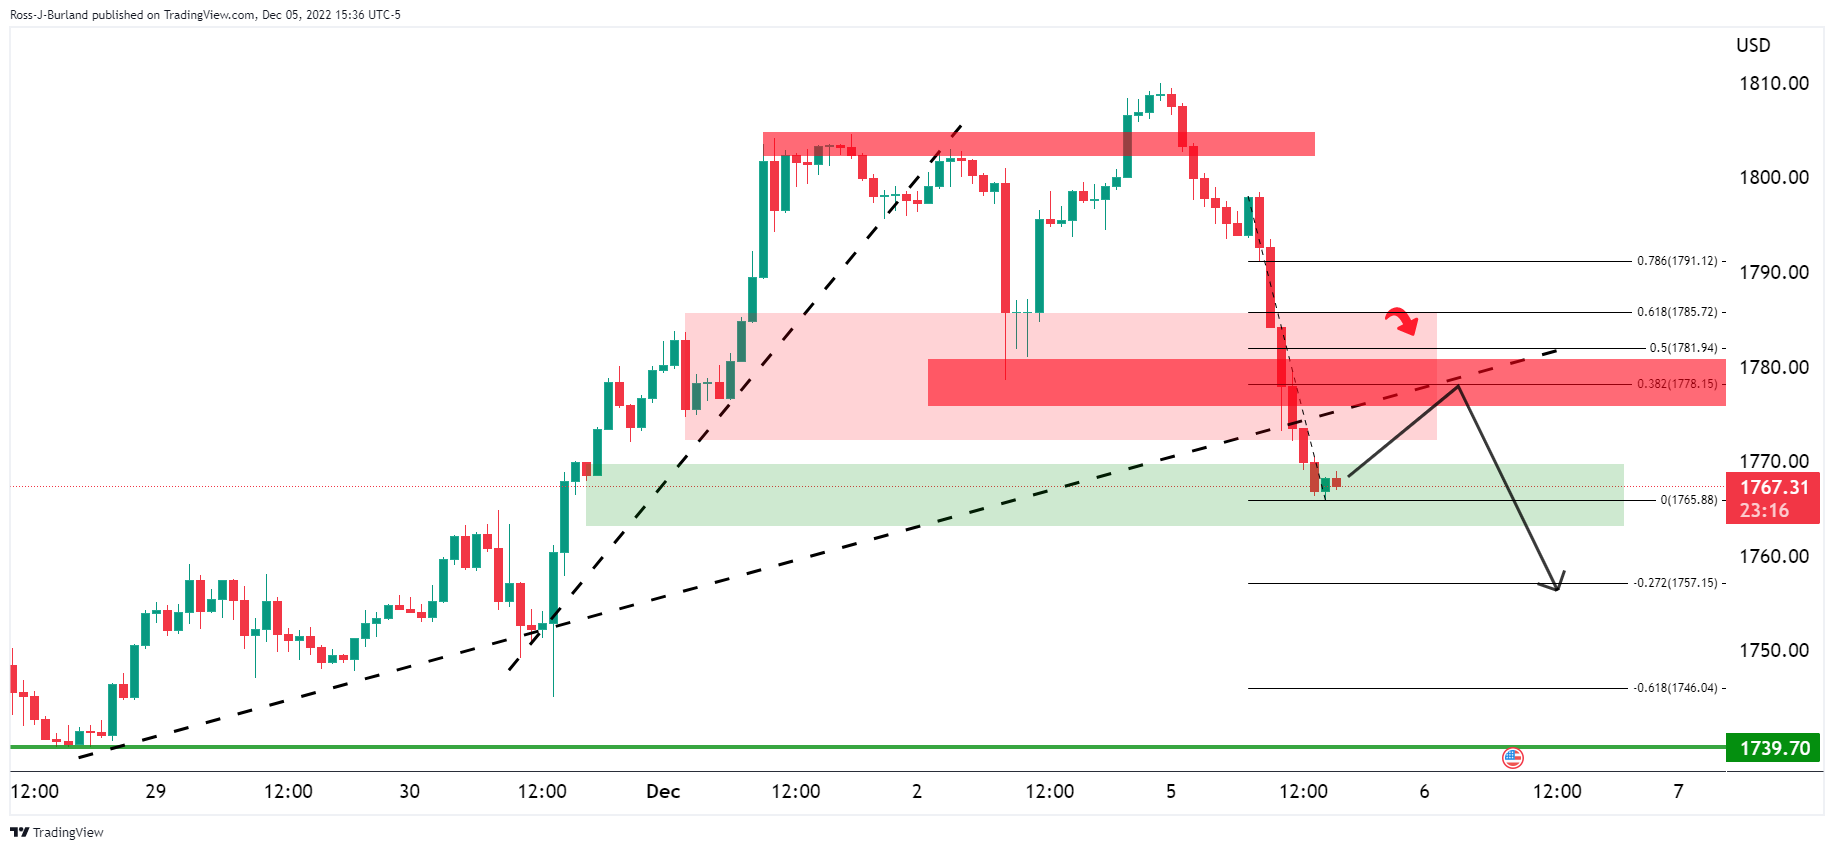
While the price is now on the backside of the micro trend, testing the daily W-formations's neckline support, a bullish correction could be on the cards with $1,780 eyed.
What you need to take care of on Tuesday, December 6:
The American dollar finished Monday with substantial gains after starting the day on the back foot. The Greenback initially fell on the back of news coming from China, as different districts are easing their restrictive COVID-19 measures, while market talks pointed at further loosening in January.
Markets changed course following the release of upbeat US data, with the US Dollar accelerating its advance ahead of Wall Street’s close. The official ISM Services PMI for November improved by more than anticipated, surging to 56.5 from 54.4 and beating the 53.1 expected. Additionally, Factory Orders rose by 1% MoM in October, better than the 0.7% advance expected, while S&P Global upwardly revised its November Services PMI to 46.2 from a preliminary estimate of 46.1.
Ahead of the December central bank’s meeting, European Central Bank (ECB) policymaker Gabriel Makhlouf said that a 50 bps rate hike is the minimum necessary, adding that he would not rule out a 75 bps hike. The ECB and the US Federal Reserve (Fed) will announce their decisions on December 15 and 14, respectively, and policymakers will enter their blackout period next Thursday.
EUR/USD trades around 1.0480, while GBP/USD plunged to the 1.2160 price zone. Commodity-linked currencies were also under strong selling pressure, with AUD/USD now struggling around 0.6670 and USD/CAD nearing 1.3600.
Crude oil prices surged at the beginning of the day amid Chinese news, which means steady demand, and as OPEC+ announced its decision to maintain its decision of reducing oil production by 2 million barrels per day. Another factor weighing on oil prices was the latest EU decision to put a cap on oil prices. Moscow said it will not recognize the price cap and is preparing a decision. The black gold turned south early in the US afternoon and posted sharp losses amid the broad USD strength. WTI settled at $77.20 a barrel.
Gold surged to $1,810 a troy ounce at the beginning of the day but plunged amid renewed USD demand and ends the day around $1,766 troy ounce.
The greenback surged also vs safe-haven currencies, with USD/JPY recovering towards the 136.70 price zone.
The Reserve Bank of Australia will announce its decision on monetary policy first thing Tuesday.
Cryptocurrencies collapsed with the resurgent US demand. BTC/USD trades around $16,900, down over $1,000 on the day
Like this article? Help us with some feedback by answering this survey:
- US ISM Non-Manufacturing PMI surprised to the upside, weighing on the NZD/USD.
- An absent New Zealand docket would keep the NZD leaning on investors’ mood.
- NZD/USD Price Analysis: Upward biased, but a pullback to the 200-DMA is on the cards.
The New Zealand Dollar (NZD) tumbles from three-month highs around 0.6442 vs. the US Dollar (USD) after the release of positive US economic data, despite last week’s dovish speech by the Federal Reserve Chair, Jerome Powell. Therefore, the NZD/USD is trading at 0.6317, below its opening price by 1.33%.
Sentiment remains sour, following goodish US data
US equities remain depressed due to sentiment turning sour. The Institute for Supply Management (ISM) reported that the ISM Non-Manufacturing PMI for November smashed expectations e 53.3 estimates, coming at 56.5 while showing that the price index subcomponent added to inflationary pressures in the US. At the same time, the US Factor Orders for November jumped 1%, vs. the 0.7% consensus, above September’s data.
Elsewhere, the Federal Reserve (Fed) Chair Jerome Powell, in last week’s speech saying that moderating interest rate hikes could happen as soon as December, plunged the USD. Nevertheless, last Friday’s US Nonfarm Payrolls report cemented the case for additional action by the Federal Reserve. The US economy added 263K new jobs to the economy, beating the consensus of 200K, while the Average Hourly Earnings jumped by 5.1% YoY, above 4.9% forecasts.
On the New Zealand front, the lack of economic data revealed during the week, with only the release of the Electronic Retail Card Spending and Manufacturing Sales, would lean on the dynamics of the US Dollar and market sentiment.
NZD/USD Price Analysis: Technical outlook
The NZD/USD daily chart depicts the major as upward biased as long as it stays above the 200-day Exponential Moving Average (EMA) at 0.6234.OF note, price action is registering a series of successive higher highs, while the Rate of Change (RoC) didn’t, opening the door for a correction. At the same time the Relative Strength Index (RSI) exited from overbought conditions, suggesting that buying pressure is fading.
The NZD/USD key support levels lie at 0.6300, followed by the 200-day EMA at 0.6234 and the 0.6200 figure. On the flip side, the NZD/USD first resistance would be the 0.6400 mark, followed by 0.6442, ahead of the 0.6300 psychological level.
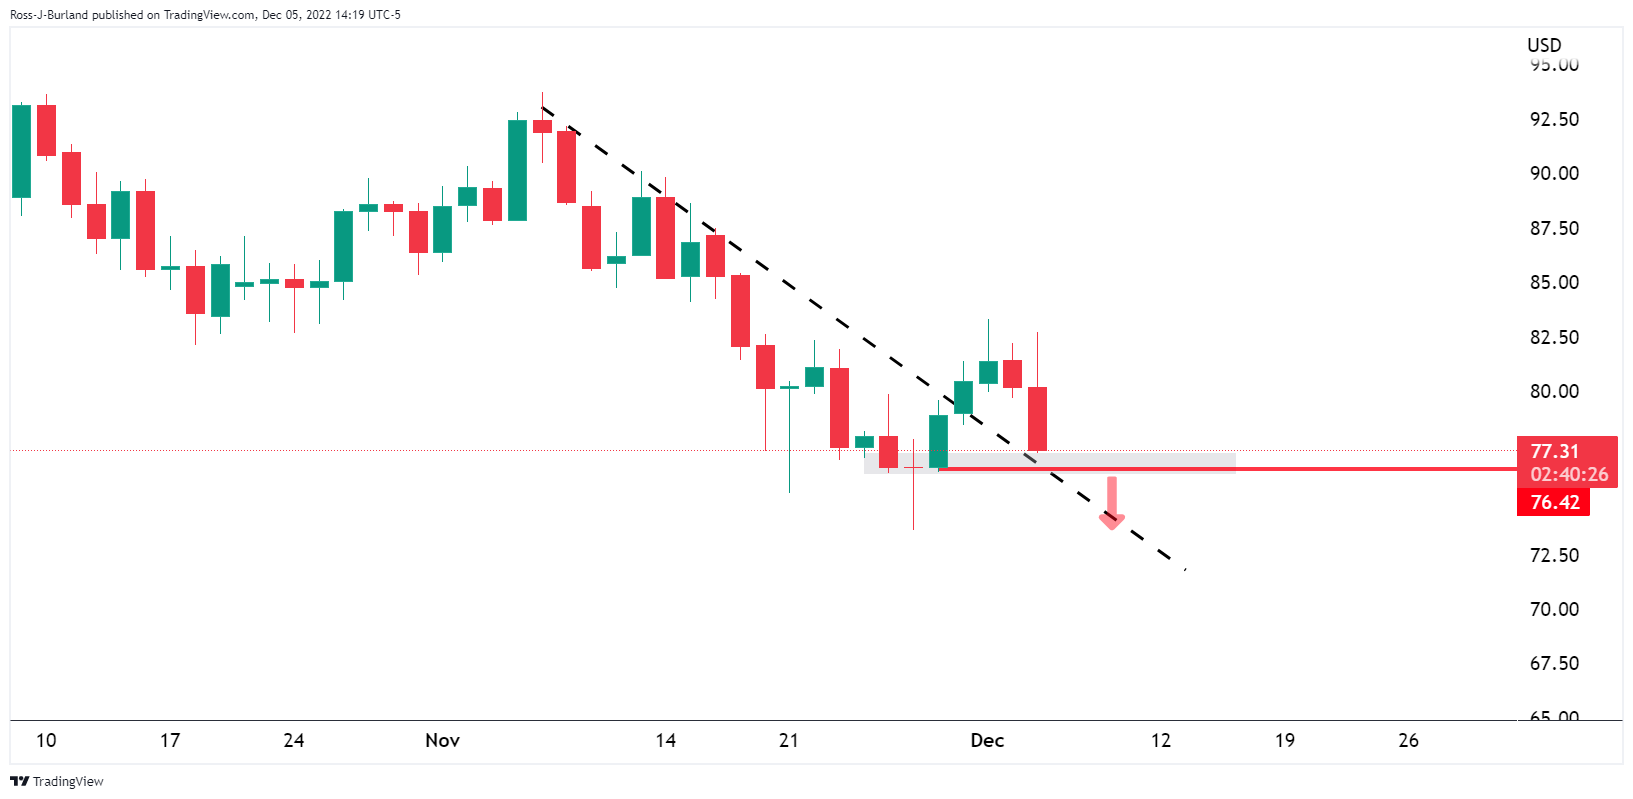
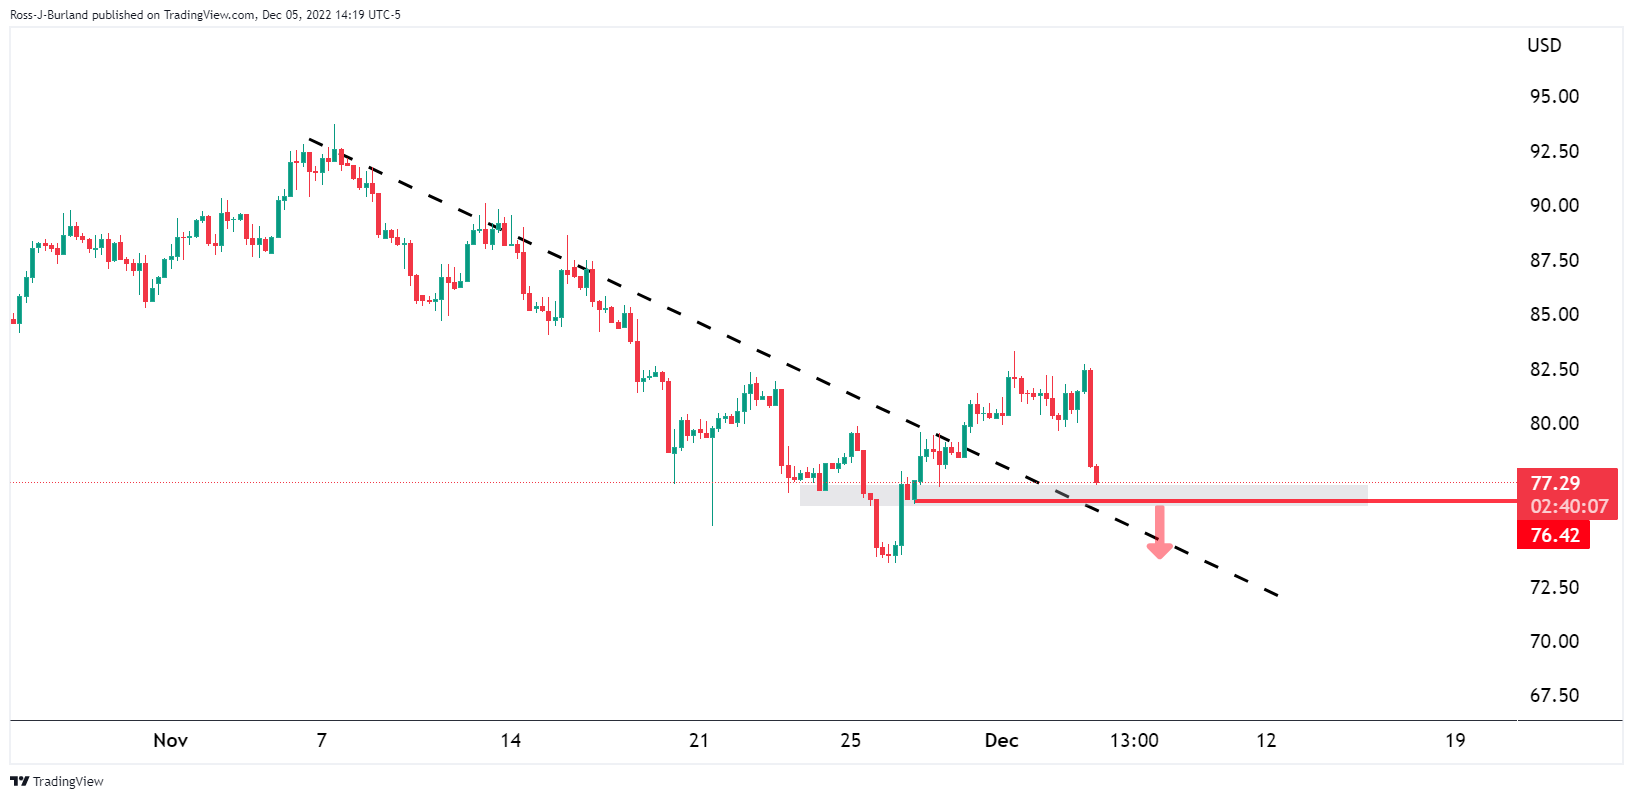
- WTI price is on the back side of the channel, so that is longer-term bullish.
- WTI H4 M-formation is bullish and a break of the neckline will likely put the bias back in favour.
- Break below $76.40 will be putting on some serious heat on the committed bulls.
As per the prior analysis, the price has been in a phase of distribution for the month of December, so far, following a break of a major bear channel as the following analysis will illustrate:
WTI prior analysis
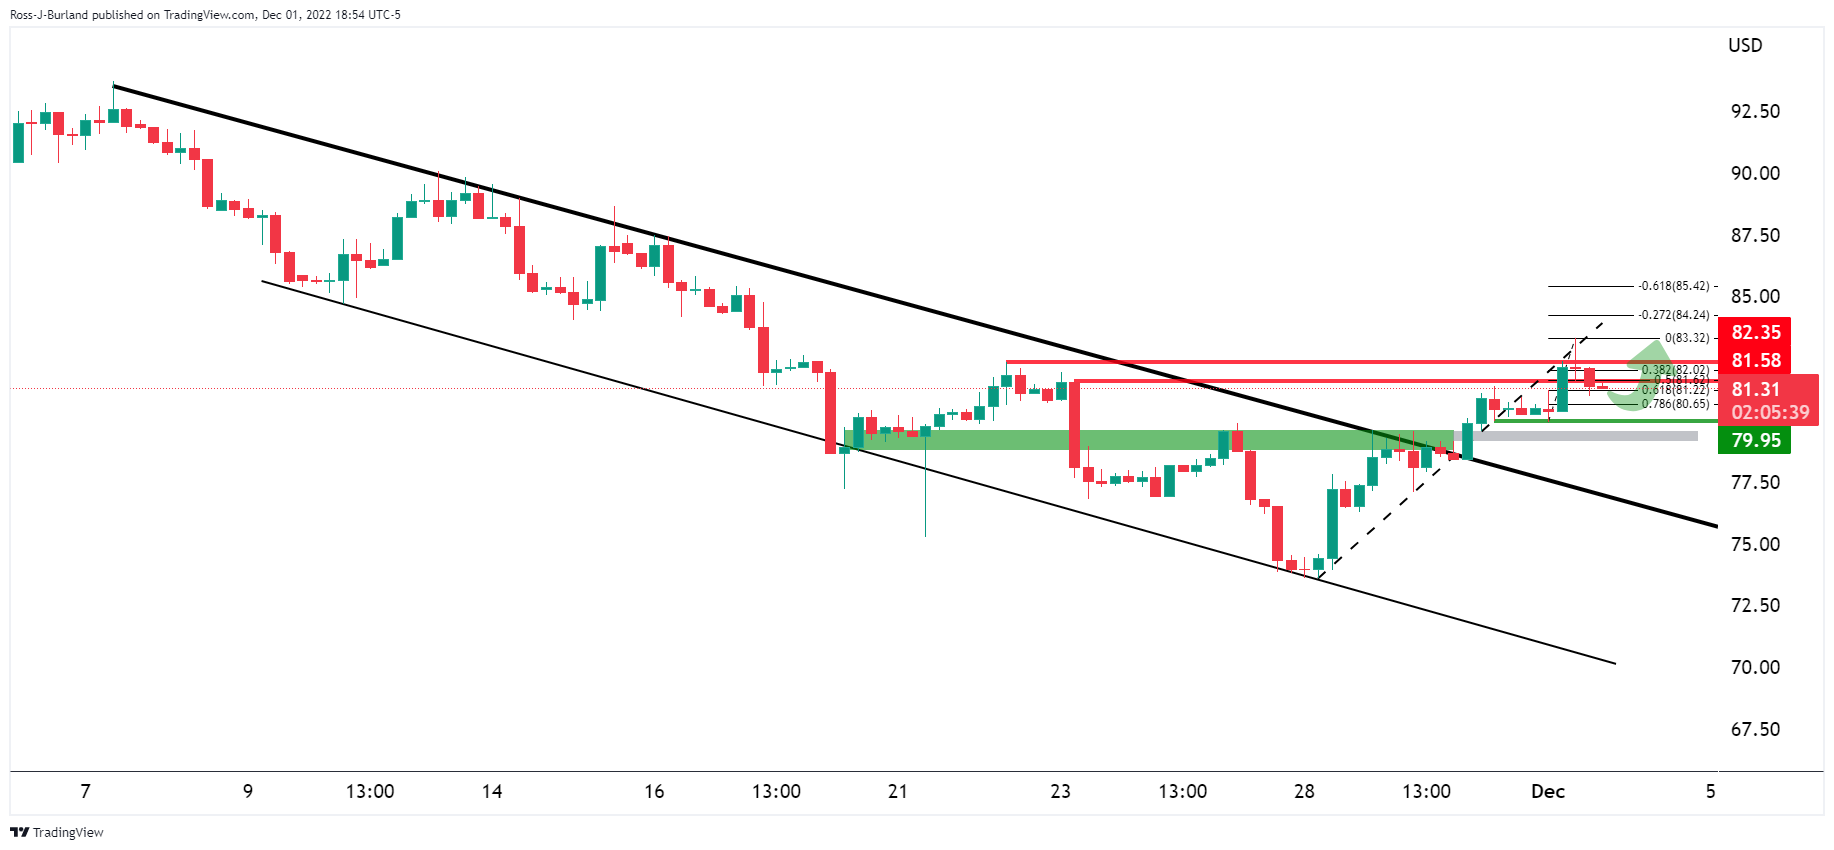
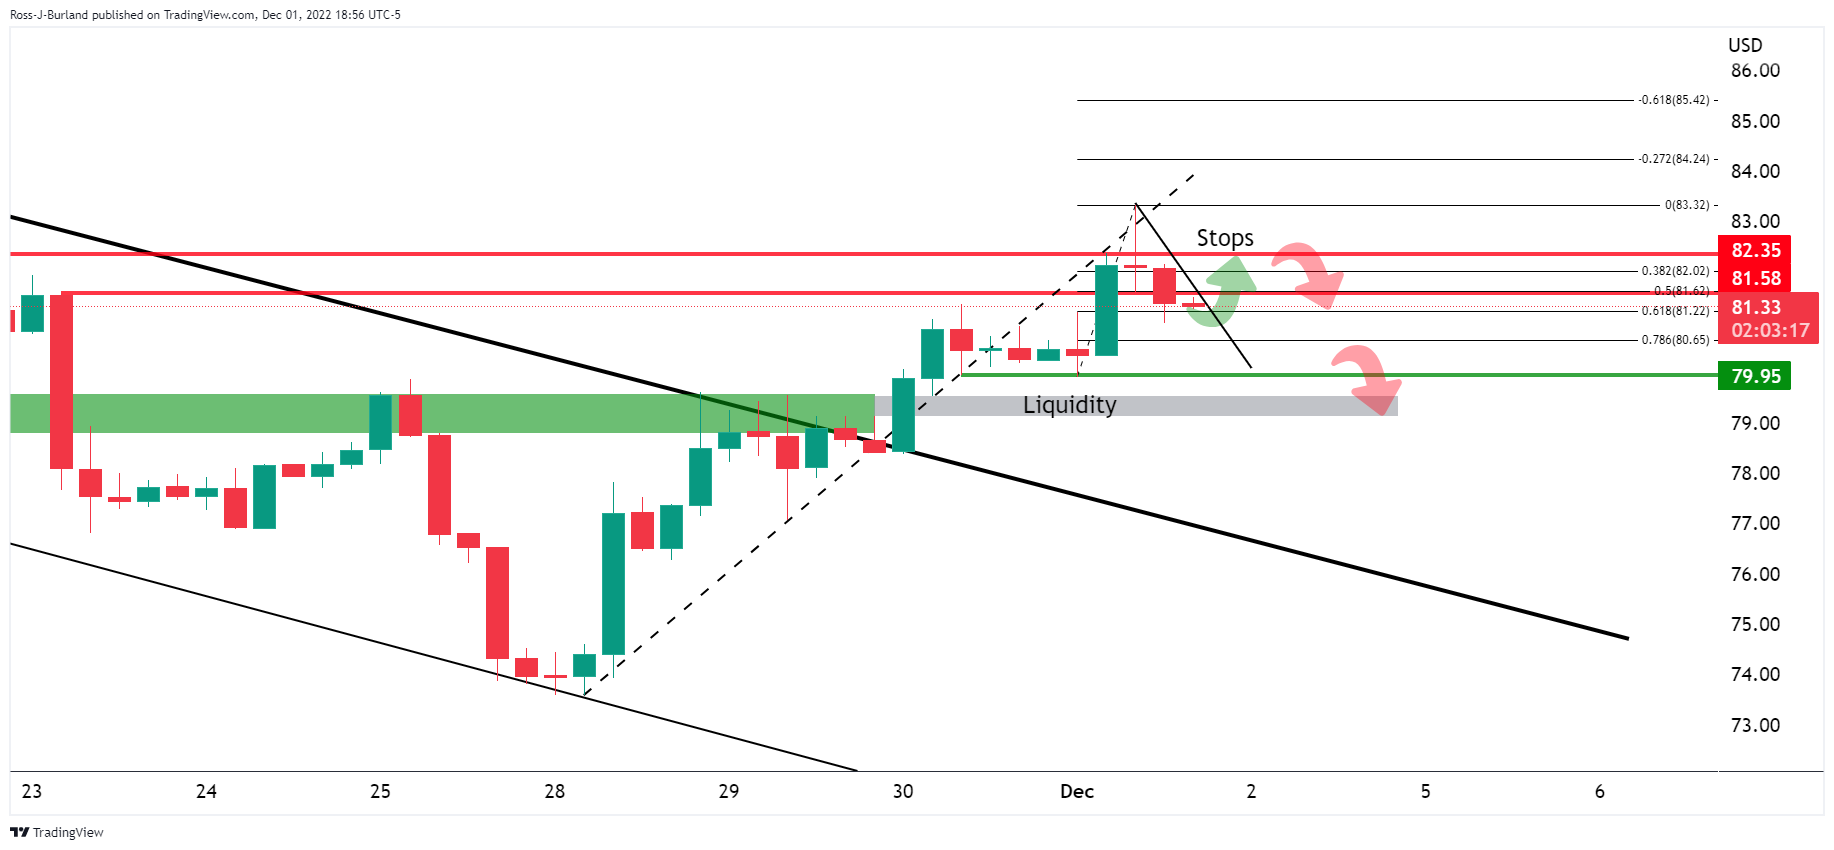
In the above daily charts, it was shown that WTI was seen moving into prior highs and this had swept liquidity where a schematic of distribution was being printed:
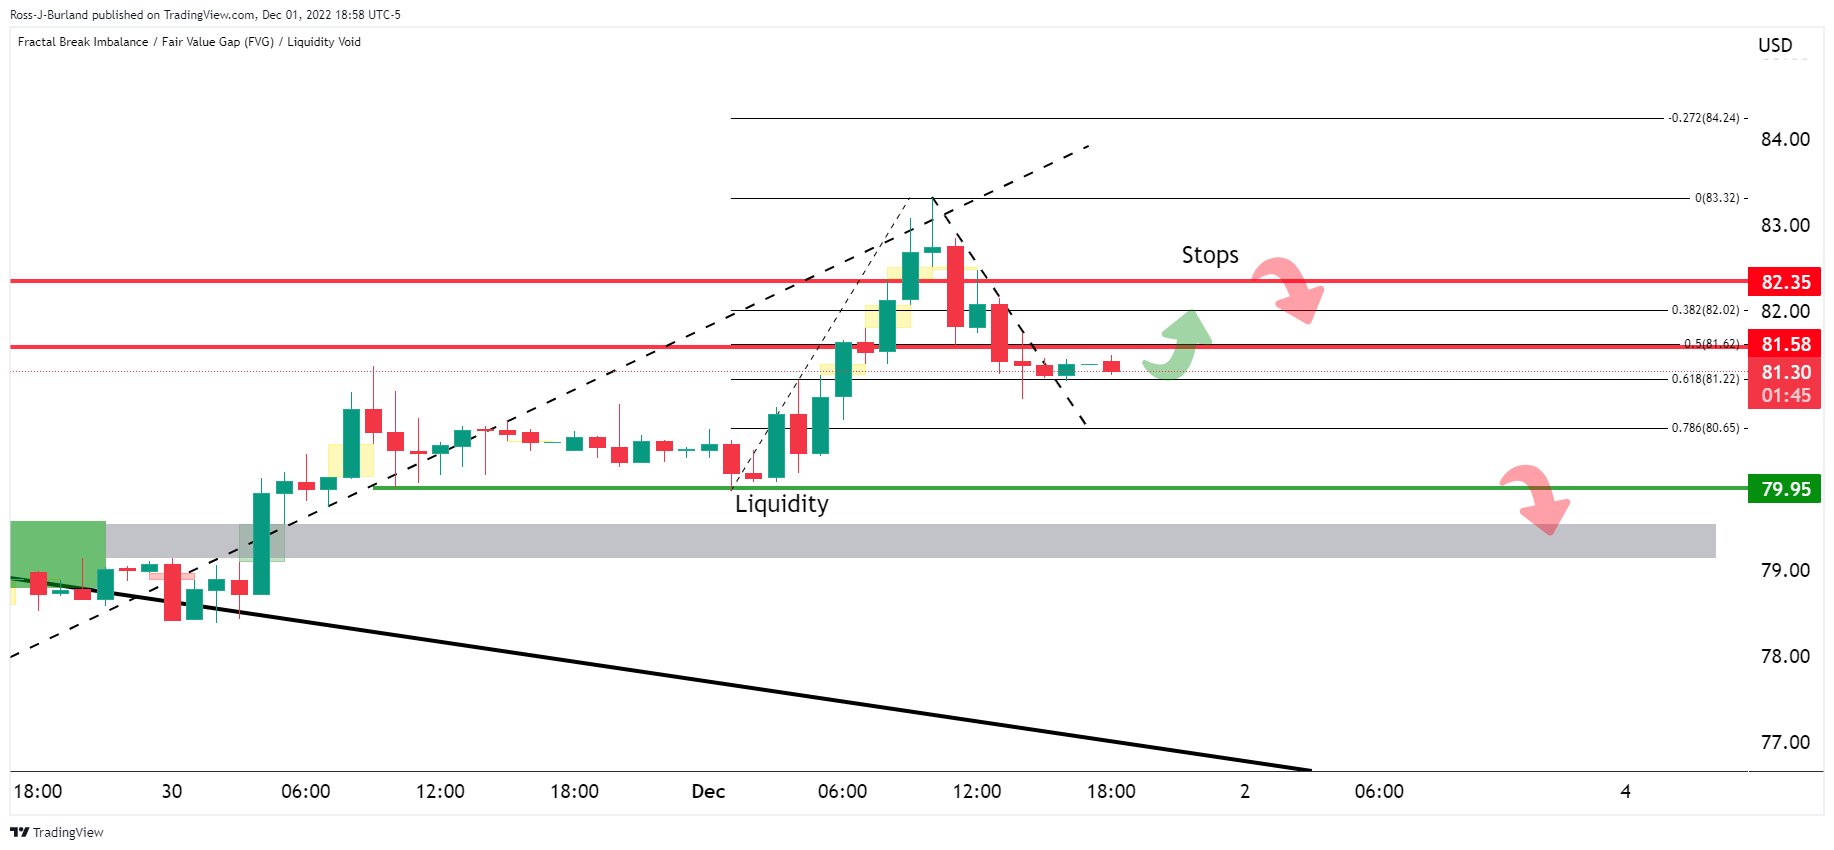
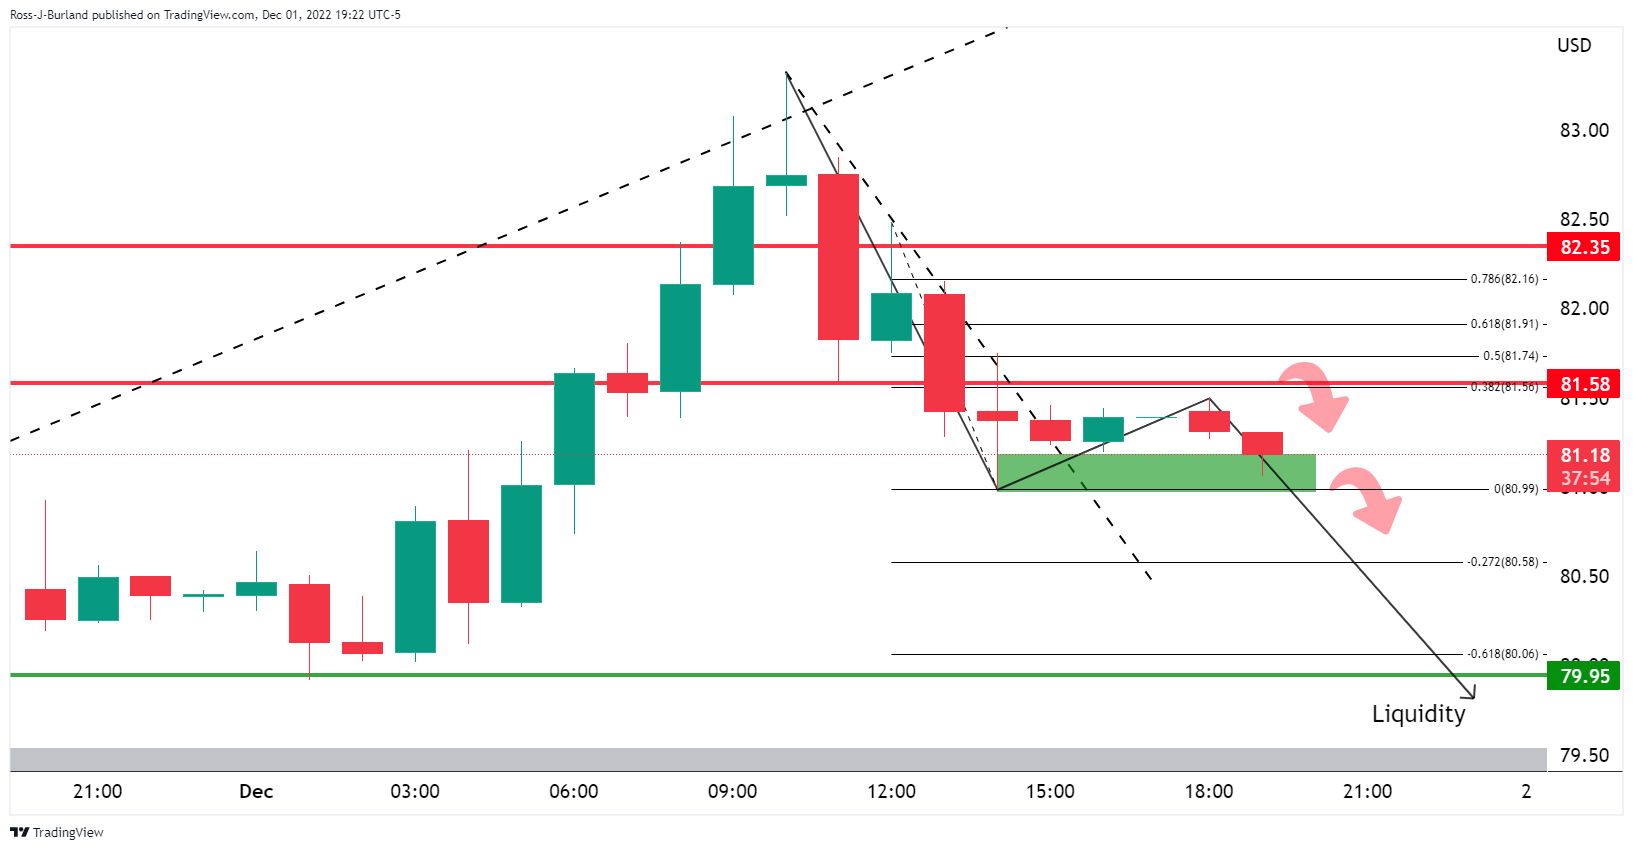
A move towards where WTI short position stops were likely located was anticipated as per the above hourly chart.
A continuation of the downside in Oil to target liquidity below $78.00 was expected eventually while below $81.50:
WTI update
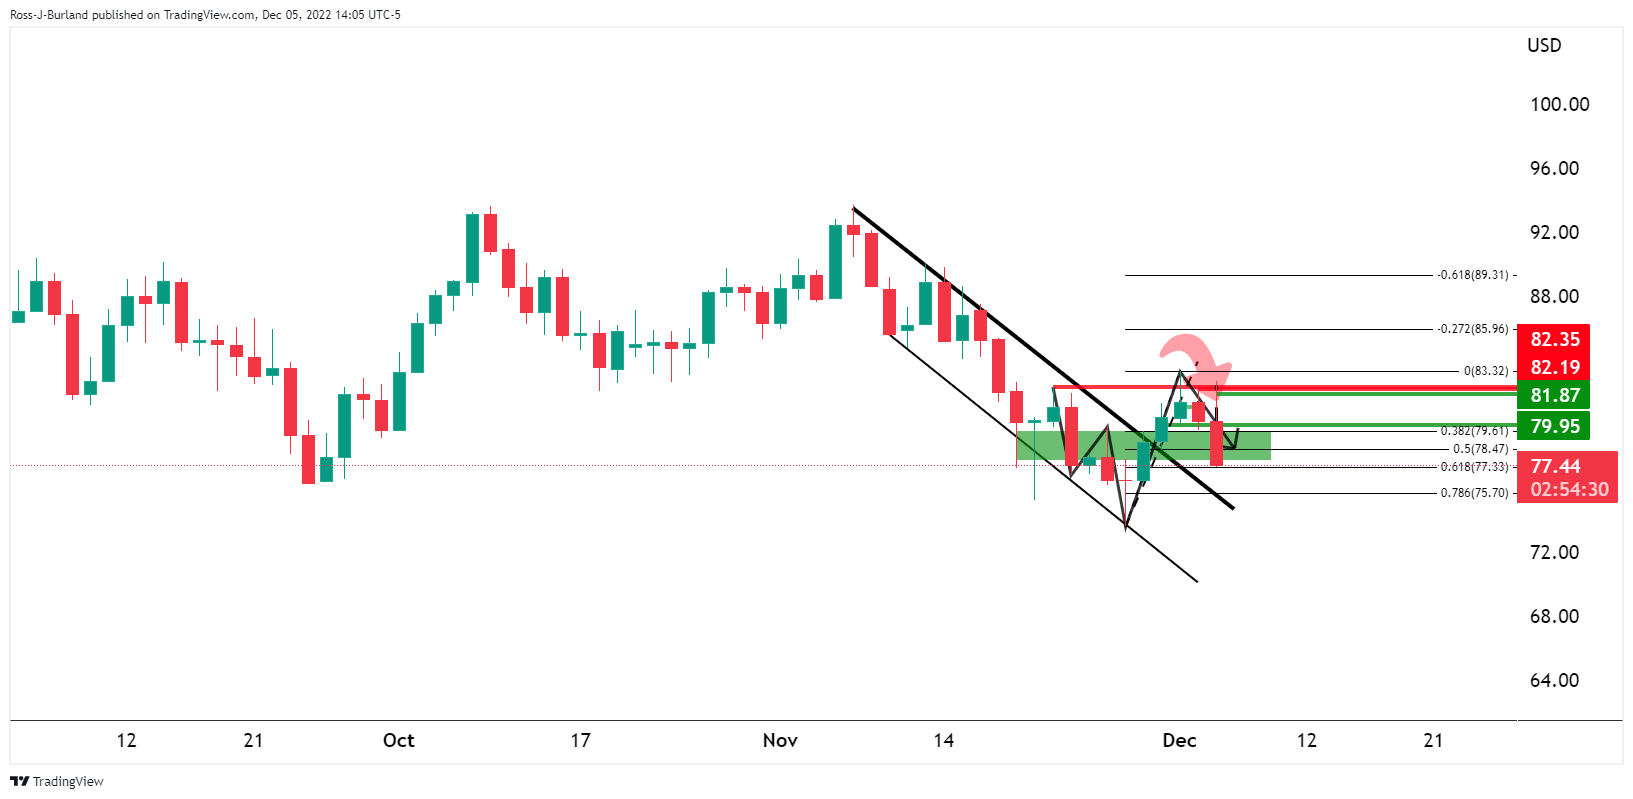
The W-formation on the daily chart has seen the price move to test the neckline.
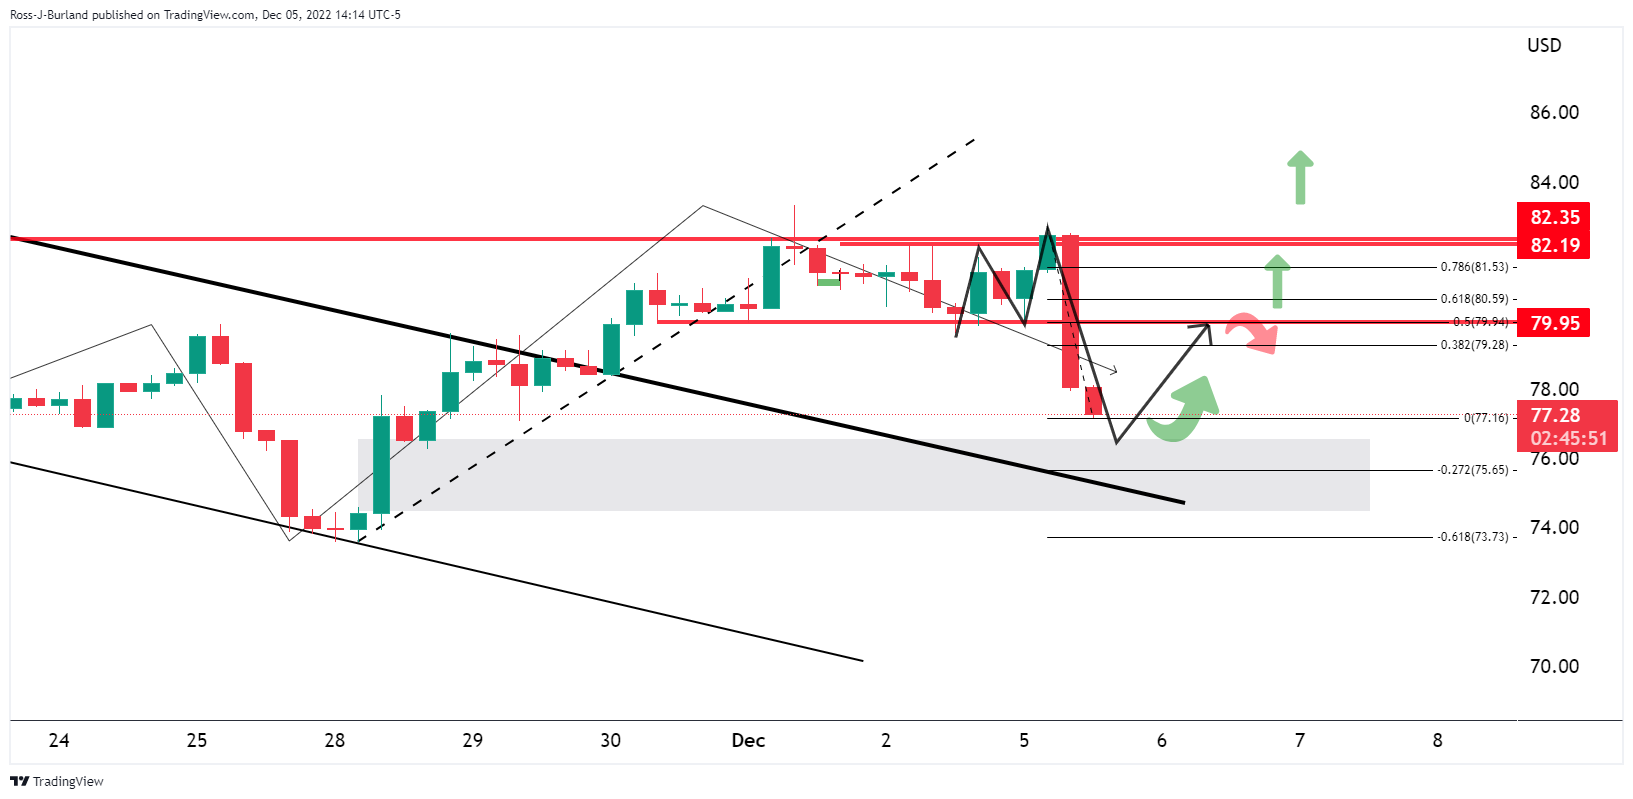
On the 4-hour chart, the M-formation is bullish and a break of the neckline, or a 50% mean reversion, will likely put the bias back in favour of the bull for a continuation higher. After all, the price is on the back side of the channel, so that is longer-term bullish. However, a break below $76.40 will be putting on some serious heat on the committed bulls as per the following daily and 4-hour charts:
- A risk-off impulse bolstered the US Dollar to the detriment of the Canadian Dollar.
- November US ISM Services PMI was better than expected, spurring a 120 pip jump on the release.
- The Bank of Canada is expected to hike rates by 25 bps on Wednesday.
- USD/CAD Price Analysis:
The Canadian Dollar (CAD) weakens against the US Dollar (USD), while the USD/CAD reclaims the 1.3500 figure, spurred by positive economic data from the United States (US) revealed on Monday and a solid November employment report last Friday. Hence, the USD/CAD is trading at 1.3576 after hitting a daily low of 1.3384.
Sour sentiment and upbeat US ISM Services PMI underpinned the USD
Risk aversion is the name of the game. The Institute for Supply Management (ISM) reported that the Services Index for November grew at a faster pace than the 53.3 estimated, at 56.5, while showing that the price index subcomponent added to inflationary pressures in the US. Meanwhile, the US Factor Orders for November jumped 1% vs. expectations of a 0.7% increase, above September’s data.
The USD/CAD reacted upwards, rallying more than 120 pips in three hours, from 1.3400 to 1.3520. Of late, the major extended its rally towards fresh daily highs of 1.3581.
Aside from this, last week’s dovish speech by the Federal Reserve (Fed) Chair Jerome Powell, saying that moderating interest rate hikes could happen as soon as December, plunged the USD. Nevertheless, last Friday’s US Nonfarm Payrolls report cemented the case for additional rate hikes. November figures came at 263K beating the consensus of 200K, while the Average Hourly Earnings jumped by 5.1% YoY, above 4.9% forecasts.
In the meantime, the last week’s Canadian docket featured Q3’s Gross Domestic Product (GDP) surprisingly jumped 2.9% QoQ, while employment data showed the economy added 10.1K jobs, aligned with the consensuses.
Ahead into the week, the Bank of Canada (BoC) Wednesday’s monetary policy looms, with analysts split between a 25 or 50 bps rate hike. Analysts at TD Securities expect a 25 bps rate hike, taking rates to the 4.00% threshold. Later in the week, the BoC’s Deputy Governor Kozicki will cross newswires, followed by the Balance of Trade and Building Permits for October.
USD/CAD Price Analysis: Technical outlook
The daily chart shows that the USD/CAD is upward biased, breaking above a three-month-old downslope resistance trendline drawn from October highs. Traders should be aware that a daily close above the latter would expose the November 29 daily high of 1.3645. Nevertheless, on its way north, the USD/CAD needs to clear the psychological 1.3600 figure, followed by the former, and then the 1.3700 mark.

- GBP/USD slides in a risk-off environment at start of week US session.
- The British Pound is vulnerable to soured UK politics and economy.
- The US Dollar bulls are moving in on the face of stronger US economic data.
- Federal Reserve terminal rate is the driver for the US Dollar.
The British Pound is under pressure in the North American session as risk appetite drops on Wall Street. US major indexes have fallen following better-than-expected service-sector activity that has added to jitters that the US Federal Reserve might continue on its aggressive policy tightening path despite fears of a recession next year.
At the time of writing, GBP/USD is down 0.78% after falling from a high of 1.2344 to a low of 1.2162 so far. The US Dollar is climbing in a risk-off environment as an initial boost of investor enthusiasm over signs of possible loosening in COVID restrictions in China faded and on some speculation that the Federal Reserve may not be able to pivot as soon as December.
US economic data improves outlook for US Dollar
The Institute for Supply Management (ISM) said its Non-Manufacturing PMI rose to 56.5 last month from 54.4 in October, indicating that the services sector, which accounts for more than two-thirds of US economic activity, remained resilient in the face of rising interest rates. The data beat forecast the Non-manufacturing PMI would fall to 53.1. This data combined with Friday's surprisingly strong Nonfarm Payrolls and wage growth data in November as well as news that consumer spending had accelerated in October gives has raised optimism that a recession could be avoided in 2023.
Eyes on the Federal Reserve
The data comes in contrast to a recently weaker Consumer Price Index, prior ISM data and dovish Federal Reserve chairman Jerome Powell's comments that combined had started to weigh on the market's pricing of the terminal rate that had declined to below 5%. Before the Nonfarm Payrolls report, the rate was seen topping out at 4.75%-5% before the report. However, the Fed is now seen raising its policy rate, currently in the 3.75%-4% range, to 4.92% by March of next year and more likely than not into the 5%-5.25% range by May, based on futures contract prices and the CME Fed watch tool.
Nevertheless, in the near term, Fed Chair Jerome Powell said last week that the US central bank could scale back the pace of its rate increases "as soon as December." Futures contracts tied to the Fed policy rate still imply a 70% chance that central bankers will slow the pace of rate hikes when they meet Dec. 13-14, rather than adding to a string of 75-basis-point rate hikes over the past four meetings.
GBP/USD positioning remains bearish
According to the latest weekly data from the Commodity Futures Trading Commission (CFTC), Money managers are still bearish towards the British Pound.
A net short position is, however, reducing and is now more than 50% smaller than the depths seen earlier this year but that is largely due to the US Dollar being trimmed in the improved risk environment. Nevertheless, while there might be less room for strong rallies in GBP, a reversal in risk appetite could leave the currency exposed to a sharp move lower.
''In the spot market the pound has recovered a significant amount of ground vs. the softer USD,'' analysts at Rabobank said.
UK politics in the spotlight
''While the UK political backdrop has retained a calmer air since the start of PM Rishi Sunak’s premiership, neither the economy nor this own party is proving easy to manage,'' the analysts argued.
''Recessionary conditions appear to be taking root, strike action is on the rise and a slew of Tories has already indicated they will throw in the towel at the general election rather than face the possibility that the party could be in opposition for some years,'' the analysts added.
Prime Minister Rishi Sunak, in power for just over a month, faces a raft of problems in the run-up to an election that opinion polls suggest the Conservatives will lose which could ultimately spell more weakness for the pound.
GBP/USD technical analysis
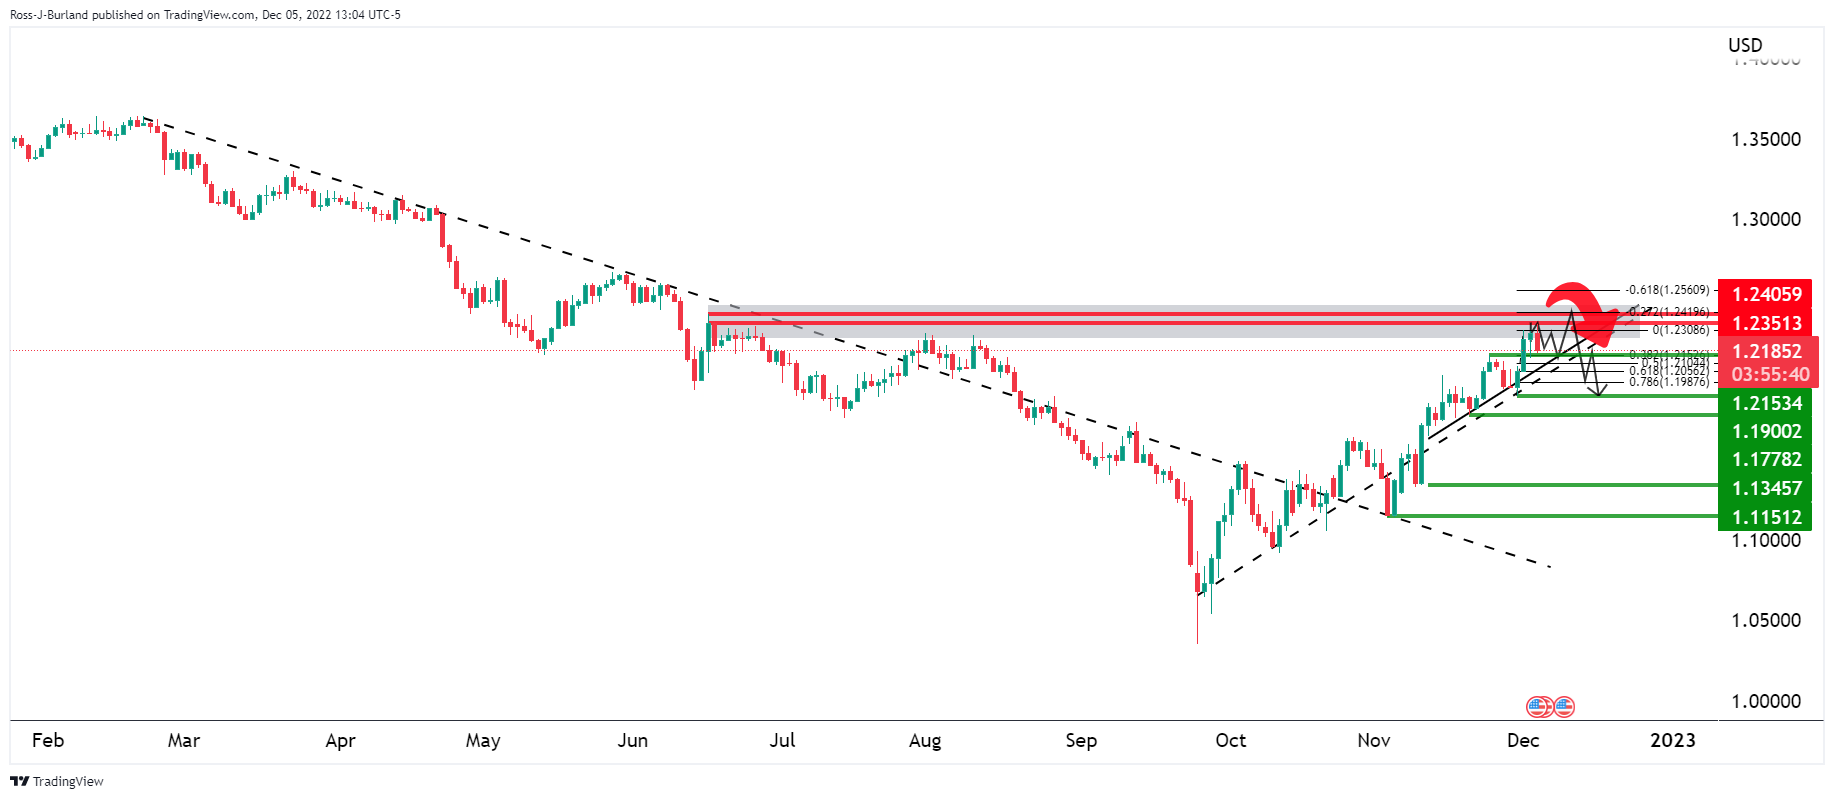
GBP/USD is potentially moving into a phase of distribution below 1.2350, 1,2400 areas on the daily chart as illustrated above. However, the British Pound's bullish trend is still intact while structures 1.2150 and 1.1900 are yet to be broken:
This leaves the focus on the upside in GBP/USD while above 1.1900. A move into test below 1.2150 could result in a deeper correction through the Fibonacci scale with eyes on a 50% mean reversion at 1.2120 and then a 61.8% ratio confluence with the upper quarter of the 1.20 area near 1.2070.
- The Euro is falling against the US Dollar after hitting a six-month high nearby 1.0600.
- US ISM Non-Manufacturing activity surprisingly jumped in the United States.
- Eurozone data was mixed, though tilted negative as Retail Sales dropped.
- EUR/USD Price Analysis: Upward biased, but could pull back to 1.0400 before testing 1.0600.
The Euro (EUR) is almost unchanged against the US Dollar (USD) following the release of an upbeat US ISM Services PMI that underpinned the USD, while last week’s solid November US employment report shows the labor market remains tight. At the time of writing, the EUR/USD is trading at 1.0494, down by 0.40%.
US ISM Services was better than expected, weighed on the Euro
Sentiment remains deteriorated, even though China is beginning to ease Covid-19 measures. The US ISM Non-Manufacturing Index for November rose by 56.5, above estimates of 53.3, crushing October’s 54.4. According to Bloomberg, “The service sector expanded at a faster pace in November, with the holiday season bolstering business activity.” It should be noted that the price index subcomponent confirmed that inflationary pressure is skewed to the upside.
On the economic data release, the EUR/USD dived from around 1.0550 to 1.0503.
At the same time, US Factory Orders grew by 1% in November against expectations of a 0.7% increase and also smashed September’s data of 0.3%. “New orders for manufactured durable goods in October, up seven of the last eight months, increased $3.0 billion or 1.1%to $277.4 billion, up from the previously published 1% increase,” the publication further read.
Aside from this, last week’s employment report, November’s Nonfarm Payrolls (NFP) rose by 263K, beating the 200K estimates, while the Unemployment Rate, at 3.7%, remained unchanged. Average Hourly Earnings increased by 5.1%, vs. 4.9% forecasts, which would keep the US Federal Reserve (Fed) lifting rates, even if it means at 50 bps increases, as the Federal Reserve (Fed) Chair Jerome Powell said last Wednesday.
In the meantime, across the pond, S&P Global PMIs Services and Composite indices across the Eurozone remained unchanged, while the Euro area Retail Sales came worse than expected, at -1.8% MoM vs. -1.7% foreseen and -2.7% YoY, below -2.6% estimated. Additionally, several European Central Bank (ECB) officials, Villeroy and Makhlouf, backed a 50 bps rate hike in the December meeting.
EUR/USD Price Analysis: Technical outlook
From a technical perspective, the EUR/USD daily chart is neutral-upward biased after breaking above the 200-day Exponential Moving Average (EMA) at 1.0388. As the EUR/USD rose to six-month highs at 1.0594, registering successive series of higher highs, oscillators like the Relative Strength Index (RSI) and the Rate of Change (RoC) did not, so a negative divergence between price action/oscillators, emerged.
Therefore, the EUR/USD first support would be the 1.0500 figure, followed by the December 2 daily low at 1.0428 and the 1.0400 psychological figure.
The ISM Service sector PMI rose above expectations in November to 56.5 from 54.4 in October. Analysts at Wells Fargo point out employment crossed back into expansion territory, wait times shortened and prices came down slightly. As a negative, they see a drop in orders sullied, an otherwise encouraging report for the service sector.
Key Quotes:
“A surge in business activity lifted ISM services to a consensus-defying print of 56.5 in November. Employment crossed back into expansion territory, wait times shortened and prices came down slightly. Only a drop in orders sullied an otherwise encouraging report for the service sector.”
“The ISM suggests service-sector activity is holding up better than manufacturing, but the gain in the headline number does not mean that all categories are improving. The better-than-expected gain was due almost entirely to a 9.0 point gain in the business activity index, which marks the largest one-month gain since March 2021. This component is also now at its highest reading in almost a year, signaling current activity remained widespread through November. Only one industry, finance and insurance, reported a decrease in business activity last month.”
“The only headline-feeding decline was in the new orders component, though this should not be glossed over. This key leading indicator slid for the fourth-consecutive month to 56.0. This still marks expansion but is consistent with lost momentum and could foreshadow a more significant slowdown is yet to come.”
- US Dollar gains momentum across the board, DXY turns positive.
- Economic data from the US shows numbers above market consensus.
- USD/JPY with a bullish outlook in the very short-term.
The USD/JPY broke above 135.50 and jumped above 136.00 extending the recovery from multi-month lows. The US Dollar is rising across the board supported by better-than-expected economic data and higher Treasury bond yields.
Dollar strengthens further after US data
US economic data surpassed expectations on Monday, helping the US Dollar. The S&P Global Composite PMI was revised from the 46.3 preliminary reading to 46.4 in November. Factory Orders in October rose 1% surpassing expectations of a 0.7% increase. The ISM Service PMI in November rose from 54.4 to 56.5. The Price Paid Index fell from 70.7 to 70.
The US Dollar Index (DXY) is up 0.40% after hitting earlier on Monday at 104.11, the lowest level since June. The more positive tone around the Greenback helped the USD/JPY move further to the upside.
The pair broke above 135.50 and climbed to 136.40, reaching the highest level since Thursday. It remains near the high, with the bullish momentum intact. The next resistance area is seen around 136.60 followed by 137.00.
The 136.00 level has become the immediate support followed by 135.50/55. The recovery of the Dollar is being supported by indicators in the 4-hour chart with the RSI moving north, breaking the 30 level and Momentum turning also to the upside. According to indicators, more gains seem likely before a new leg lower.
Technical levels
The US Dollar Index is now trading 8% off its early November high. Economists at ING suspect that the Dollar correction may have run its course, and several factors should allow for some re-appreciation into year-end.
Fed to remain hawkish
“Our suspicion is that the Fed will maintain its hawkish narrative for longer, implicitly or explicitly protesting against the recent drop in yields. After all, endorsing the market’s dovish narrative may be premature and risky for the Fed whose plan should be to let markets do the heavy lifting in tightening – and we are bearish on Treasuries in the near term. A still highly inflationary global environment may struggle to live with sub-3.50% 10-year yields.”
China's optimism being misplaced
“USD/CNY is trading below 7.00 for the first time since September, with the Yuan following Chinese risk assets higher after the government announced an easing of Covid rules. The government’s move appears to be a direct consequence of recent demonstrations against its Covid policy, but a further untightening of restrictions may prove complicated. At the same time, the real estate and export sectors remain a key concern for the medium outlook in China, and one that may prevent the Yuan from appreciating much further.”
Energy prices rising again
“With Russia rejecting the cap on oil prices at $60/bbl and threatening output cuts, along with a projected drop in temperatures in many parts of Europe, the energy crisis may return and we see ample room for gas and oil prices to climb back. That would be a positive development for the Dollar.”
The US Dollar stumbled again last week. But in the view of economists at TD Securities the Greenback should consolidate ahead of November Consumer Price Index (CPI) data and the December Fed meeting.
USD/JPY to retest 140 before year-end
“A shift in momentum signals could keep the USD on the back foot in the very short-term. Yet, USD downside looks contained ahead of November CPI and the Fed meeting.”
“We like fading the rally in GBP/USD and see USD/JPY retesting 140 before year-end.”
“We also see dovish risks for RBA and BoC this week and like USD/NOK topside, especially if risk sentiment peaks.”
NZD/USD is stabilizing its gains above the 200-Day Moving Average of 0.6285. Analysts at Credit Suisse look for an eventual move above 0.6468/87.
Immediate support is seen at 0.6351
“Whilst we stay cautious of daily RSI’s overbought condition, the medium-term momentum remains supportive and with the recent key break in the USD space also in place, we think that a move above 0.6468/87 is likely.”
“A sustained break above key resistance at the 50% retracement of the whole 2021/22 decline and the August high at 0.6468/87 would mark another major break of technical resistance to confirm further sustained medium-term upside, with resistance above here next seen at 0.6568/76, which is the June high and then 0.6591.”
“Immediate support is seen at 0.6351 and next at 0.6326/10, though only quick move back below the 200DMA at 0.6285 would raise suspicion of a brief consolidation phase.”
- US Dollar soars across the board after US data.
- Aussie under pressure versus the Dollar ahead of the RBA.
- AUD/USD drops more than a hundred pips from monthly highs to the lowest since Wednesdays.
The AUD/USD dropped further after breaking under 0.6800 and recently it reach its lowest since Wednesday at 0.6740. The pair remains near the low, under pressure amid a stronger US Dollar across the board following US economic data.
Good US data bad news for Wall Street
Economic data from the US came in above expectations on Monday, helping the US Dollar. The S&P Global Composite PMI for November was revised from the 46.3 preliminary reading to 46.4. Factory Orders in October rose 1% surpassing expectations of a 0.7% increase. The ISM Service PMI in November rose from 54.4 to 56.5. The Price Paid Index fell from 70.7 to 70.
Following the latest reports, the US Dollar gained momentum across the board and hit fresh daily highs. Metals extended the decline and US stocks hit fresh lows.
RBA next
On Tuesday, the Reserve Bank of Australia (RBA) will announce its decision on monetary policy. The consensus is for a 25 basis points rate hike. The decision and the guidance offered in the statement will likely have a large impact on the Aussie.
“The Statement would read dovish if the Bank states it will assess the data over the holiday break to determine its next cash rate move. Alternatively, the Bank explicitly stating 300 bps of cumulative hikes would also be dovish (the RBA assumed 300 bps by Jul '23)”, explained analysts at TD Securites.
Short-term technical outlook
The AUD/USD has reversed sharply and the outlook has deteriorated significantly for the bulls. A recovery back above 0.6800 would shift the momentum back to the Aussie. Above the next resistance stands at 0.6820. If the pair holds above 0.6840, a new test of the recent high at 0.6850 seems likely.
On the flip side, a support area emerges around 0.6720. A break lower would put attention on 0.6700 with the next barrier seen at 0.6665.
Technical levels
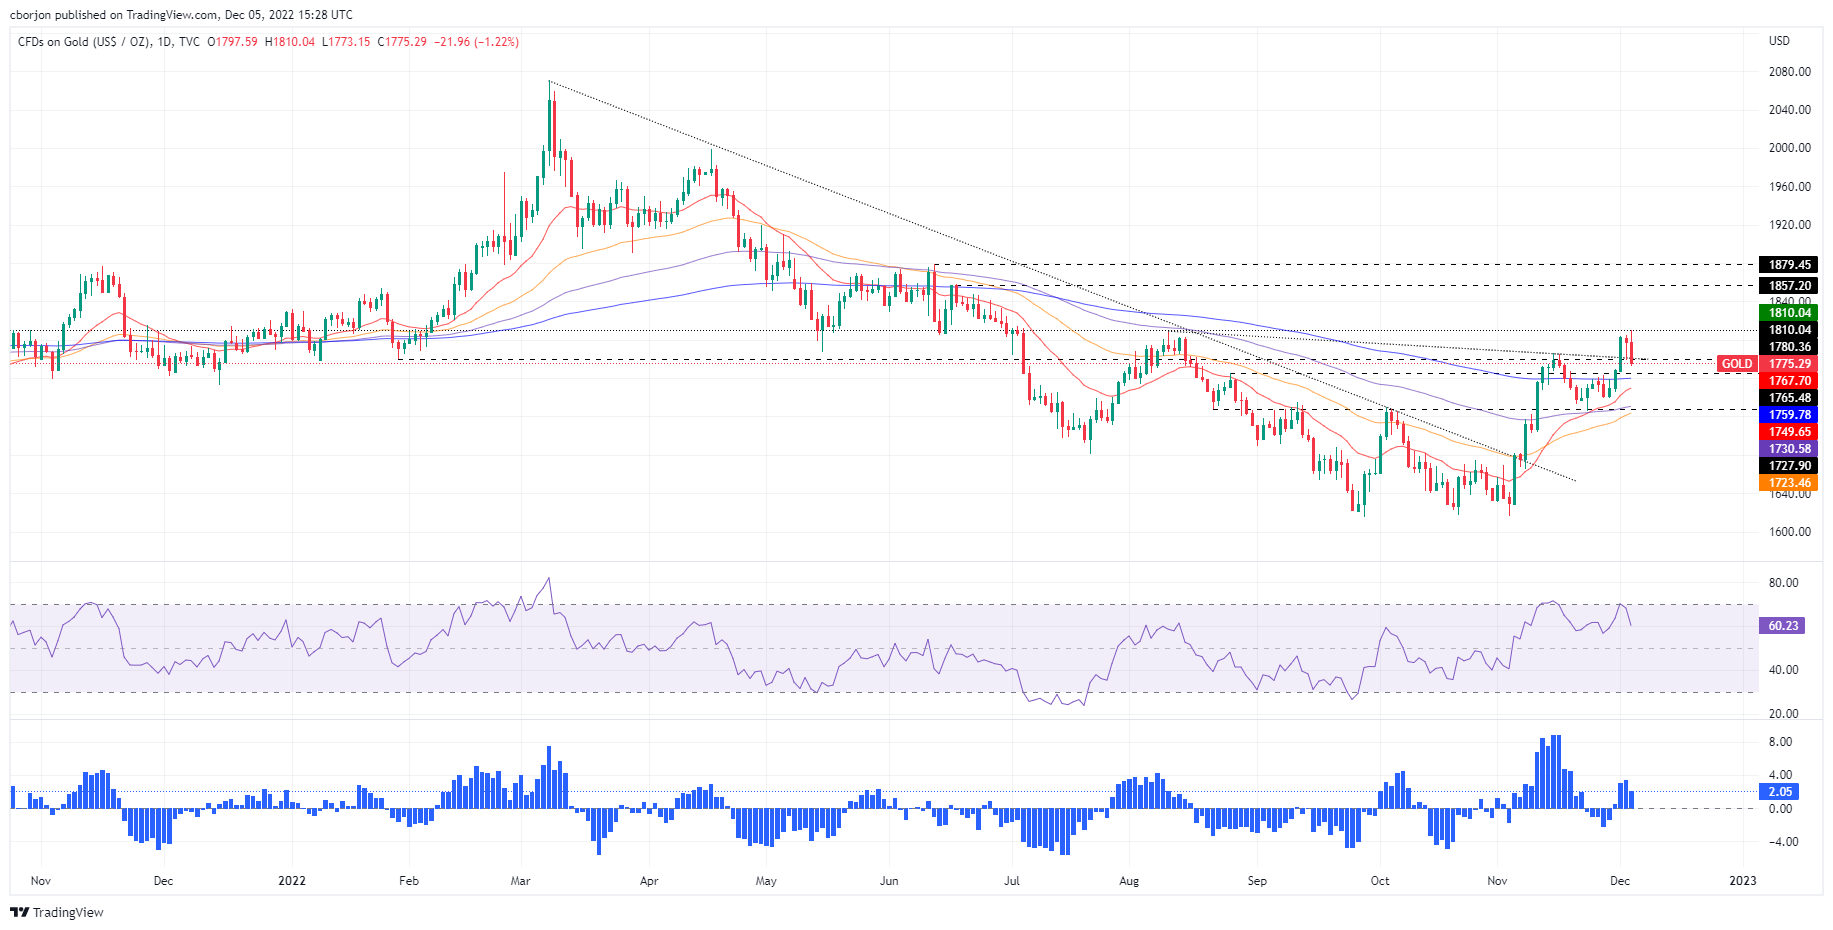
- Robust United States Nonfarm Payrolls data to keep the Federal Reserve tightening policy.
- US Treasury bond yields remain elevated, weighing on Gold prices.
- China’s eases testing measures as Beijing shifts to new “optimized and adjusted measures.”
- Gold Price Forecast: To consolidate around $1770-$1800, as oscillators aim downwards.
Gold price retraces after hitting a multi-month high at $1810, spurred by high US Treasury yields and a risk-off impulse. Factors like the latest employment report in the United States (US) cementing the tightness of the labor market caused a jump in US bond yields. China’s easing Covid-19 restrictions kept the yellow metal from appreciating. At the time of writing, the XAU/USD is trading at $1776., down 1.30%.
Gold capped by a solid US employment report
US stocks are set to open lower, as depicted by equity futures. Last week’s employment report, November’s Nonfarm Payrolls (NFP) jumped 263K, above 200K estimates, while the Unemployment Rate, at 3.7%, remained unchanged. Average Hourly Earnings rose by 5.1%, vs. 4.9% forecasts, which would keep the US Federal Reserve (Fed) liftin rates, even if it means at 50 bps increases. In his Wednesday speech, Fed Chairman Jerome Powell said, “the principal wage measures that we look at, I would say that you’re one and half or two percent above that (which is consistent with two percent inflation over time).”
US yields rise on Monday, stalling Gold’s rally
Aside from this, the US 10-year Treasury bond yield is rising nine bps, from 3.502% to 3.597%, while US Real Yields, which reflect the interest of the nominal yield minus inflation expectations, remain at 1.16% as of Friday, a headwind for Gold. XAU/USD remains heavy, falling more than 1%, as Wall Street opened.
China’s progresses towards easing Covid-19 restrictions
Over the weekend, Chinese authorities are beginning to relax testing requirements across major cities, as Beijing shifts from Covid-19 zero-tolerance measures, amid elevated reports of the virus contagion. Chinese Vice Premier Sun Chunlan said last week that the country’s pandemic control had entered a new phase. Confronted with evolving challenges and tasks, the government will take small, consistent steps to optimize Covid measures.
Gold Price Forecast: XAU/USD Technical Outlook
The XAU/USD daily chart suggests Gold is still upward biased but could consolidate soon. Oscillators like the Relative Strength Index (RSI) and the Rate of Change (RoC) portray negative divergence with price action, which exacerbated the fall beneath $1800. Nevertheless, if XAU/USD price remains above the Exponential Moving Averages (EMAs), that could keep the non-yielding metal uptrend intact.
Hence, the XAU/USD first resistance would be the psychological $1800. Break above will expose December’s 5 high of $1810, followed by the June 17 high of $1857.20, followed by June’s 13 daily high at $1879.45. On the other hand, the XAU/USD first support would be $1778.68, followed by December’s low at $1767.70 and the 200-day EMA at $1759.92.
India’s Monetary Policy Committee (MPC) is scheduled to announce its Interest Rate Decision on Wednesday, December 7 at 04:30 GMT and as we get closer to the release time, here are the expectations forecast by the economists and researchers of five major banks for the upcoming central bank's meeting.
The Reserve Bank of India (RBI) is expected to hike the repo rate by 35 basis points to 6.25%. At the last policy meeting on September 30, the bank hiked the repo rate by 50 bps to 5.90%.
ANZ
“We expect a 35 bps hike in the policy repo rate to 6.25%, reflecting the need to tame high inflation amid persistent domestic demand strength, as also shown in the Q3 GDP print. However, going forward, the pace of rate hikes will be tempered as external headwinds have eased considerably after the recent sell-off in the Dollar, oil prices, and the US Fed’s expected pivot to smaller rate hikes. The RBI’s FX reserves, too, have also risen on the back of revaluation gains. The wording of the monetary policy committee’s stance will have to be scrutinised as both nominal and real policy rates arenow entering growth restrictive territory.”
Standard Chartered
“We expect it to hike the repo rate by 35 bps to 6.25%. The likely smaller rake hike compared to the three previous 50 bps hikes may be driven by (1) softening domestic inflation (with the October print at 6.77% versus an average of 7.2% in H1-FY23) on base effects, easing commodity prices and lower prices of perishables, (2) the need to assess the impact of rate increases so far (190bps since May 2022) on inflation and economic activity in the face of global headwinds, and (3) a slowing pace of rate increases globally. We see inflation slipping back below the 4+/-2% target band only by March/April 2023, after staying above an average of 6% on a quarterly basis since Q1- 2022. We, therefore, expect the MPC to stay vigilant on inflation risks and maintain its guidance of ‘withdrawal of accommodation’ with no change in stance. We see the terminal repo rate reaching 6.50% with an additional 25 bps rate hike in Q1-2023.”
ING
“Inflation remains higher than it would like but is showing some signs of peaking, while rates have already been raised a lot. It is not inconceivable that it will hike by only 25 bps, less than the 35 bps expected by the market.”
TDS
“We think the RBI can afford to step down the pace of its tightening. The worst of inflation is probably over after CPI inflation hit a high of 7.4% YoY in Sep and has since fallen to 6.8% YoY in Oct. Looking ahead, inflation pressures should moderate further. Sep MPC Minutes also indicated a preference among some members for a tapering of the tightening cycle going ahead. Thus, we expect the RBI to hike by 35 bps to 6.25%.”
SocGen
“The lower October inflation print (6.8% YoY vs 7.4% in September) will soon give way to inflation perking up as the high statistical base effect reverses from December, and we believe the RBI will hike the policy rate twice more, for a cumulative rate hike of 60 bps, of which we expect a 35 bps rate hike in the meeting this week. This will likely be followed by a final hike of 25 bps in February 2023, which would take the terminal rate to 6.5%. We also believe that sustained disinflation would be visible from 2Q23 onward, which would result in India’s real policy rate eventually turning positive after a rather prolonged period of remaining in the negative zone.”
- Factory Orders in the US rose more than expected in October.
- US Dollar Index stays in positive territory at around 104.90.
The data published by the US Census Bureau revealed on Monday that new orders for manufactured goods, Factory Orders, increased $5.8 billion, or by 1%, in October to $556.6 billion. This print followed September's growth of 0.3% and came in better than the market expectation for an increase of 0.7%.
"New orders for manufactured durable goods in October, up seven of the last eight months, increased $3.0 billion or 1.1%to $277.4 billion, up from the previously published 1% increase," the publication further read.
Market reaction
Combined with the better-than-expected ISM Services PMI report, the data helps the US Dollar continue to outperform its rivals in the second half of the day on Monday. As of writing, the US Dollar Index was up 0.4% on the day at 104.90.
USD/CHF has breached the bottom of the key support zone at 0.9355, which in the view of analysts at Credit Suisse, indicates further weakness is likely over the next month.
Further sustained downside
“USD/CHF broke the bottom of the key support zone at 0.9355 on Friday. This move paired with the DXY breaking its 200-Day Moving Average in our eyes signals that further gradual downside is likely to unfold, and we thus look for further weakness to develop over the next month.”
“Support is seen at 0.9325/12 and then at 0.9287/84, below which would solidify the current weakness and clear way to the late March low at 0.9193.”
“A quick move back above the 13-Day Exponential Average at 0.9460/68 would see scope for a near-term pause to unfold, though only above the recent highs at 0.9546/98 would raise the prospect of a firmer correction.”
- US ISM Services PMI rose modestly in November.
- US Dollar Index gained traction after the data and climbed to the 105.00 area.
The business activity in the US service sector continued to expand at an accelerating pace in November with the ISM Services PMI rising to 56.5 in November from 54.4 in October. This reading came in better than the market expectation of 53.1.
The inflation component of the survey, the Prices Paid Index, declined to 70 from 70.7, compared to analysts' estimate of 73.6. The Employment Index rose to 51.1 from 49.1 and the New Orders Index edged lower to 56 from 56.5.
Commenting on the data, "based on comments from Business Survey Committee respondents, increased capacity and shorter lead times have resulted in a continued improvement in supply chain and logistics performance," said Anthony Nieves, Chair of the Institute for Supply Management Services Business Survey Committee. "A new fiscal period and the holiday season have contributed to stronger business activity and increased employment."
Market reaction
The US Dollar gathered strength against its rivals with the initial reaction and the US Dollar Index was last seen rising 0.46% on the day at 105.00.
Gold’s rally has started to show signs of exhaustion. An epic bull-trap could be developing in XAU/USD, economists at TD Securities report.
Macro headwinds are unlikely to relent in coming months
“We see signs of buying exhaustion in Gold, but a notable consolidation in prices will be needed before CTA trend followers spark renewed outflows.”
“At this juncture, positioning risks are no longer tilted to the upside, as a rally north $1,830 only points to marginal CTA buying from current positioning levels. This suggests that the pain trade in precious metals may finally be running out of steam, setting the stage for an epic bull-trap in precious metals, as the recently strong price action attracts discretionary interest in the complex, whereas macro headwinds are unlikely to relent in coming months.”
The Russian Rouble has been one of only a handful of EM currencies that has outperformed the US Dollar this year. Economists at MUFG Bank expect the exceptionally strong gains for the RUB to reverse in the year ahead.
Scope for further weakness USD in the year ahead
“Even after the recent correction lower, the US Dollar remains at significantly overvalued levels against other major currencies leaving scope for further weakness in the year ahead. At the same time, we expect the Rouble to weaken in the year ahead following the sharp gains between March and June of this year.”
“We expect the exceptionally strong gains for the Rouble this year to reverse in the year ahead driven in part by curtailed energy export revenues (sanctions + lower prices) and a further easing of capital controls.”
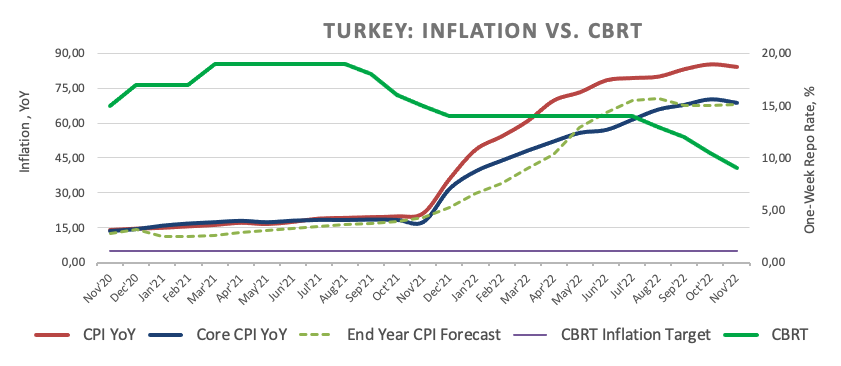
- USD/TRY extends the range bound theme above 18.6000.
- Turkish inflation seems to have peaked in recent months.
- Turkish CPI rose less than expected in November.
The Turkish lira starts the week on the defensive and motivates USD/TRY to resume the upside above 18.6300 on Monday.
USD/TRY looks bid post-CPI
USD/TRY fades Friday’s downtick and manages to gather some upside traction at the end of the new week, although the broader side-lined theme remains largely unchanged for the time being.
The selling bias in the lira picks up pace on Monday after Türkiye’s inflation figures measured by the CPI rose a tad below consensus at 84.39% in the year to November, while the Core CPI gained 68.91% over the last twelve months and Producer Prices increased 136.02% from a year earlier.
What to look for around TRY
USD/TRY remains side-lined above/around the 18.6000 region amidst omnipresent intervention in the FX markets.
So far, price action around the Turkish lira is expected to keep gyrating around the performance of energy and commodity prices - which are directly correlated to developments from the war in Ukraine - the broad risk appetite trends and the Fed’s rate path in the next months.
Extra risks facing the Turkish currency also come from the domestic backyard, as inflation gives no signs of abating and real interest rates remain entrenched well in the negative territory.
In addition, the lira is poised to keep suffering against the backdrop of Ankara’s plans to prioritize growth via transforming the current account deficit into surplus, always following a lower-interest-rate recipe.
Key events in Türkiye this week: Inflation Rate (Monday).
Eminent issues on the back boiler: FX intervention by the CBRT. Progress of the government’s scheme oriented to support the lira via protected time deposits. Constant government pressure on the CBRT vs. bank’s credibility/independence. Bouts of geopolitical concerns. Structural reforms. Presidential/Parliamentary elections in June 2023.
USD/TRY key levels
So far, the pair is gaining 0.15% at 18.6247 and faces the next hurdle at 18.6664 (all-time high December 2) followed by 19.00 (round level). On the downside, a break below 18.5339 (55-day SMA) would expose 18.3642 (monthly low November 7) and finally 18.2967 (100-day SMA).
The Reserve Bank of Australia (RBA) will announce its next monetary policy decision on Tuesday, December 6 at 03:30 GMT and as we get closer to the release time, here are the forecasts by the economists and researchers of 10 major banks regarding the upcoming central bank's decision.
The RBA is set to hike the Official Cash Rate (OCR) by 25 bps from 2.85% to 3.10%, summing up to a total of 300 bps in rate increases in eight months.
ANZ
“We do think a December pause will be considered, but with the RBA not meeting again until February and the recent wages and employment data being robust we expect the cash rate target to be lifted 25 bps to 3.10%.”
Westpac
“We anticipate that the RBA will lift the cash rate by 25 bps, to 3.10%. Inflation is still too high and more work needs to be done in our view. Annual headline inflation is expected to hit the 8% mark in the December quarter and to still be above the 2-3 target band at the end of 2023 (at about 4%, we expect).”
Standard Chartered
“We expect the RBA to hike the cash rate by 25 bps to 3.10% from 2.85% previously. At the November meeting, the central bank reiterated its view that monetary policy operates with a lag and recent rate hikes are yet to be reflected in mortgage payments. In addition, latest data shows that housing prices are already falling on a YoY basis. However, inflation levels remain elevated. The labour market remains very tight and wage pressures remain. As such, we think the RBA may have to continue hiking, but at 25 bps increments instead of 50 bps.”
UOB
“We are penciling in another 25 bps hike, which will take the OCR to 3.10%. Thereafter, we look for a hold.”
ING
“We have decided that the central bank is no longer particularly concerned with the flow of data, and will hike rates another 25 bps despite recent softer-than-expected inflation.”
Danske Bank
“We expect a 25 bps hike.”
TDS
“We expect a 25 bps increase in the target rate to 3.10%, but all eyes will be on any shift in the language suggesting the RBA will pause in early 2023. We don't expect the RBA to shut the door to further rate hikes in 2023 but given the Bank has raised the cash rate 300 bps, 7 months ahead of assumptions, a dovish tweak cannot be ruled out.”
SocGen
“We expect the RBA to increase its cash rate target from 2.85% to 3.10%. While policymakers continue to say that they have not ruled out returning to 50 bps hike if necessary, we don’t think that the current environment justifies returning to a 50 bps hike. We reiterate our recently revised terminal policy rate forecast of 3.85%, which matches our forecast of the terminal Fed Funds rate at 5.25% (upper bound).”
Citibank
“The final meeting of the year will likely see the RBA hike for the eighth consecutive month. Citi analysts keep their quarterly inflation forecast unchanged at 1.7% and still expect a terminal rate next year unchanged at 3.35% with another 25 bps hike in February to be the last in the cycle, though risks are still tilted to the upside.”
NAB
“We expect a 25 bps increase. High inflation, a tight labour market and accelerating inflation mean it is too early for the RBA to pause, even as they prioritise keeping the economy on an ‘even keel’. As for the post-Meeting Statement, this could equivocate a little further on the guidance that the Board expects further interest rate hikes in the period ahead.”
US ISM Services PMI Overview
The Institute of Supply Management (ISM) will release the Non-Manufacturing Purchasing Managers' Index (PMI) - also known as the ISM Services PMI – at 15:00 GMT this Monday. The gauge is expected to edge down to 53.1 in November from 54.4 in the previous month. Given that the Fed looks more at inflation than growth, investors will keep a close eye on the Prices Paid sub-component, which is anticipated to rise from 70.7 in October to 73.6 during the reported month.
How Could it Affect EUR/USD?
Ahead of the key release, the US Dollar drops to over a five-month low amid growing acceptance that the Fed will slow the pace of its rate-hiking cycle. Any disappointment from the US ISM Services PMI will reinforce expectations for a less aggressive policy tightening by the US central bank and exert additional downward pressure on the greenback. Conversely, a stronger reading might fail to impress the USD bulls, suggesting that the path of least resistance for the EUR/USD pair is to the upside.
Valeria Bednarik, Chief Analyst at FXStreet, offers a brief technical overview and explains: “The EUR/USD pair holds on to most of its early gains, and the daily chart shows that the risk is skewed to the upside. The pair is posting a third consecutive higher high, also higher lows, while extending gains beyond its 200 Simple Moving Average (SMA), currently at 1.0360. The 20 SMA kept advancing below the longer one and is close to crossing above it. Technical indicators, in the meantime, remain directionless, with the Momentum within positive levels and the Relative Strength Index (RSI) at around 70, without signs of bullish exhaustion.”
“The 4-hour chart shows that bulls retain control. An early dip to 1.0518 was quickly reverted, reflecting strong buying interest. At the same time, moving averages maintain their upward slopes below the current level, with the 20 SMA accelerating north and providing dynamic support at around 1.0480. Technical indicators lack directional strength but hold well above their midlines, in line with the absence of selling power,” Valeria adds further.
Key Notes
• EUR/USD Forecast: Bulls working to overtake 1.0600
• EUR/USD Price Analysis: Immediately to the upside aligns 1.0614
• EUR/USD eyes additional gains to the 1.0650/1.0750 range – Scotiabank
About the US ISM manufacturing PMI
The Institute for Supply Management (ISM) Manufacturing Index shows business conditions in the US manufacturing sector. It is a significant indicator of the overall economic condition in the US. A result above 50 is seen as positive (or bullish) for the USD, whereas a result below 50 is seen as negative (or bearish).
- GBP/USD retreats a bit from a multi-month high, though lacks follow-through.
- The technical setup still favours bulls and supports prospects for further gains.
- A sustained break below the 200 DMA is needed to negate the positive outlook.
The GBP/USD pair reverses a mid-European session dip to the 1.2235-1.2230 area and remains well within the striking distance of its highest level since June 17 touched earlier this Monday.
The attempted intraday US Dollar recovery from over a five-month low lacks bullish conviction amid bets that the Fed will slow the pace of its policy tightening as soon as in December. This, in turn, is seen as a key factor lending support to the GBP/USD pair. That said, a bleak outlook for the UK economy acts as a headwind for the British Pound and keeps a lid on spot prices, at least for now.
From a technical perspective, the top end of over a two-month-old upward-sloping channel, currently around mid-1.2300s, continues to cap the upside for the GBP/USD pair. That said, last week's sustained move and acceptance above a technically significant 200-day Simple Moving Average (SMA) for the first time in 2022 support prospects for an eventual breakout through the ascending channel.
That said, oscillators on the daily chart have moved on the verge of breaking into the overbought zone and warrant some caution. This makes it prudent to wait for some near-term consolidation or a modest pullback before positioning for the next leg up. Nevertheless, the bias still seems tilted firmly in favour of bullish traders and supports prospects for a further near-term appreciating move.
In the meantime, the daily low, around the 1.2235-1.2230 region, now seems to protect the immediate downside ahead of the 1.2200 round-figure mark. Any subsequent decline could still be seen as a buying opportunity and remain limited near the 1.2150 region (200-DMA). The latter should act as a pivotal point, which if broken decisively will negate the positive outlook for the GBP/USD pair.
GBP/USD daily chart
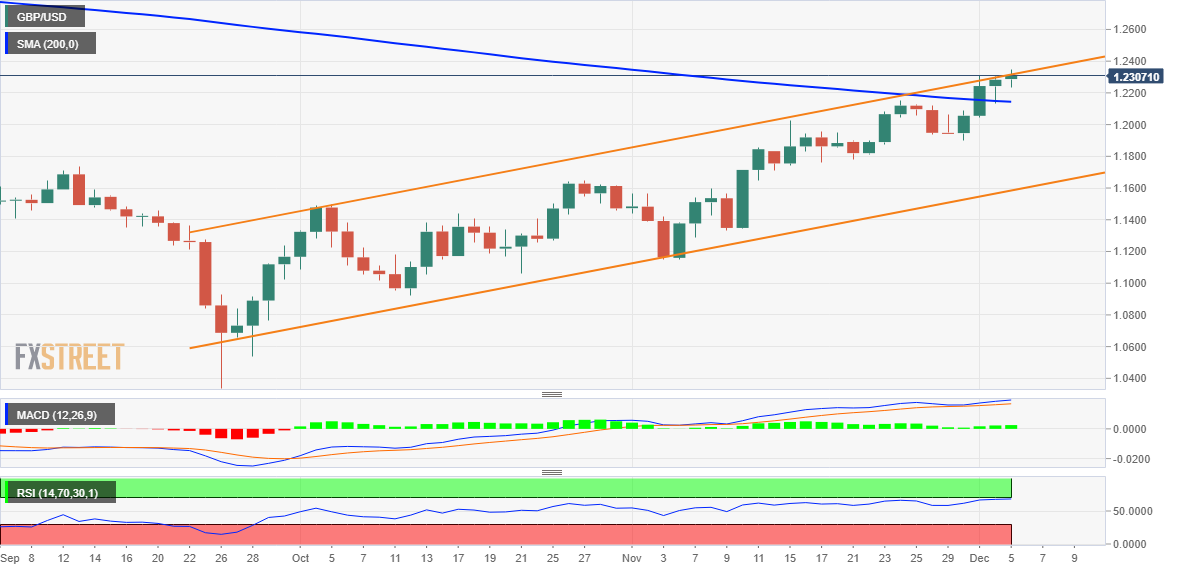
Key levels to watch
A strong week for GBP/USD has seen the pair clear with ease the key 200-Day Moving Average, now at 1.2144. Analysts at Credit Suisse look for further strength to the May high at 1.2668.
Initial support seen at 1.2251
“Cable achieved and briefly exceed the 50% retracement of the 2021-2022 fall and August highs at 1.2278/98. With the pair pulling back below here, we continue to look for a consolidation phase to emerge in the near term. Big picture, we look for this to be temporary if indeed seen, with further strength expected in due course to resistance next at 1.2408, ahead of 1.2519 and eventually the May high at 1.2668, potentially even as far as the 61.8% retracement at 1.2758.”
“Support is seen at 1.2251 initially, with 1.2155/35 ideally holding. A break can see a deeper setback to the 13-Day Exponential Average at 1.2049, but with fresh buyers expected here.”
EUR/USD is inching towards next resistance zone of 1.0630/1.0690. Failure to surpass this area could lead to a short-term pullback, economists at Société Générale report.
The bounce is likely to persist
“EUR/USD has given a break above the brief consolidation since mid-November; this crossover highlights the bounce is likely to persist.”
“The pair is gradually inching towards next potential resistance zone at 1.0630/1.0690 representing projections, the low of March 2020 and the descending trend line connecting highs of June 2021 and February 2022. In case the up-move falters near this hurdle, a short-term pullback is not ruled out.”
“EUR/USD has recently reclaimed its 200DMA and ideally this Moving Average (1.0365) should provide support should a pullback develop. Failure can lead to a revisit of the lower end of recent consolidation zone near 1.0220.”
The Turkish Lira has continued to display remarkable stability against the US Dollar in November. Nonetheless, risks remain heavily tilted to the downside for the TRY, in the view of economists at MUFG Bank.
Intervention is helping to support TRY
“According to Bloomberg, Turkey has stepped up interventions to support the Lira over the last couple of months which had raised total intervention close to USD100 billion through to October. The recent pick-up in intervention has coincided with further rate cuts from the CBRT who have continued to lower rates despite elevated inflation.”
“Looser monetary policy and credit growth is being deployed to support growth ahead of next year’s elections. Turkey is also acting to secure additional financing from Saudi Arabia and Qatar to support the Lira.”
“We continue to expect recent TRY stability to be followed by further weakness.”
- USD/JPY gains some positive traction and snaps a five-day losing streak to a multi-month low.
- A modest USD recovery from over a five-month low is seen as a key factor offering support.
- Expectations for smaller Fed rate hikes hold back the USD bulls from placing aggressive bets.
- Traders now look forward to the release of the US ISM Services PMI for short-term impetus.
The USD/JPY pair attracts some buyers near the 134.15-134.10 area on Monday and snaps a five-day losing streak to its lowest level since August 16. Spot prices, however, retreat a few pips from the daily top and slide back closer to the 135.00 psychological mark heading into the North American session.
The US Dollar stages a modest recovery from over a five-month low touched earlier today and turns out to be a key factor acting as a tailwind for the USD/JPY pair. The upbeat US monthly jobs report released on Friday, including an upside surprise in wages, reaffirmed expectations that the Federal Reserve will continue to hike interest rates in coming months. This, in turn, helps ease the recent bearish pressure surrounding the Greenback amid extremely oversold conditions.
Apart from this, the optimism over the easing of COVID-19 restrictions in China undermines the safe-haven Japanese Yen and further offers support to the USD/JPY pair. That said, expectations that the US central bank will begin to slow the pace of its policy tightening as soon as in the December meeting is holding back the USD bulls from placing aggressive bets. Furthermore, a weaker risk tone helps limit losses for the safe-haven JPY and seems to cap the major.
The market sentiment remains fragile amid growing worries about a deeper global economic downturn. This, in turn, warrants some caution before confirming that the USD/JPY pair has formed a near-term bottom and positioning for any meaningful recovery. Even from a technical perspective, Friday's break below the very important 200-day SMA for the first time since February 2021 supports prospects for an extension of the recent sharp pullback from a 32-year peak.
Hence, any subsequent positive move might still be seen as a selling opportunity and runs the risk of fizzling out rather quickly. Traders now look forward to the release of the US ISM Services PMI. Apart from this, the US bond yields will influence the USD price dynamics and provide some impetus to the USD/JPY pair. This, along with the broader risk sentiment, might further contribute to producing short-term trading opportunities around the major.
Technical levels to watch
USD/JPY lost nearly 500 pips last week. Analysts at Credit Suisse continue to look for the 38.2% retracement of the 2021/2022 uptrend at 133.09 to hold for a consolidation phase, albeit now only a temporary one.
Initial resistance seen at 135.97/136.02
“USD/JPY has seen a further sharp fall for a break of its long-term 200-Day Average (currently at 134.62) for a move to just shy of our lower target of the 38.2% retracement of the 2021/2022 uptrend at 133.09. We continue to look for a floor in this (broad) 134.62 /133.09 zone for now for the unfolding of a consolidation phase.”
“Big picture, we now look for an eventual close below 133.09 to clear the way for further weakness to the 130.40 August low next, then the 50% retracement and ‘neckline’ to the multi-year base at 127.47/27.
“Resistance is seen at 135.57 initially, with a break above 135.97/136.02 needed to clear the way for a recovery back to 137.50, potentially the 13DMA at 138.14/18.”
- EUR/USD keeps the bid bias unchanged around 1.0550.
- Extra gains are expected to meet the next hurdle at 1.0614.
EUR/USD manages to accelerate gains and visit the 1.0580/85 band at the beginning of the week.
Further upside in the pair is now likely to pick up pace following the recent surpass of the 200-day SMA and the 10-month resistance line. Against that, there are no resistance levels of note until the June high at 1.0614 (June 27).
Further upside in EUR/USD remains on the cards while above the 200-day SMA, today at 1.0362.
EUR/USD daily chart
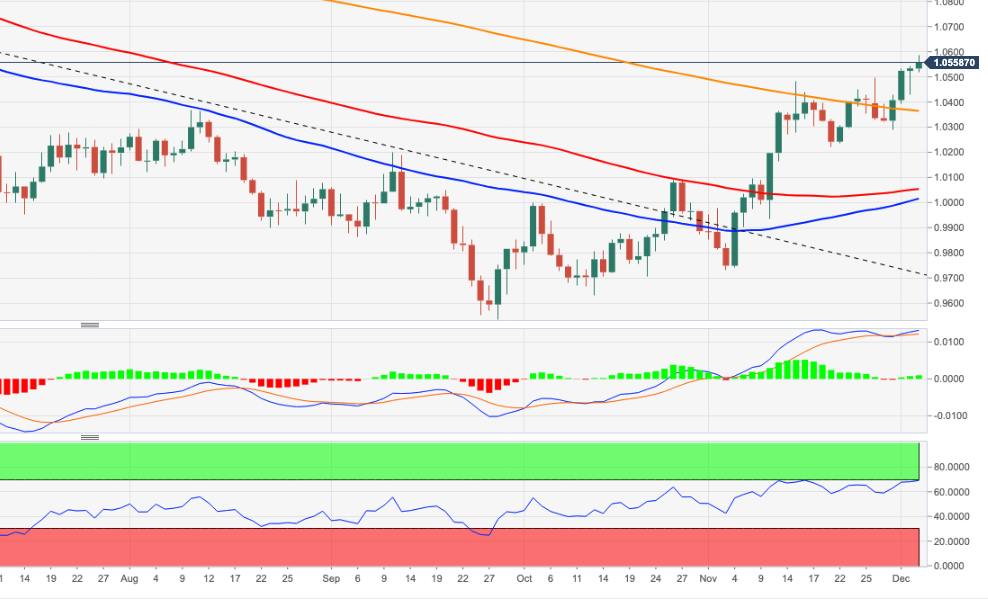
EUR/USD holds strength above 1.05. Economists at Scotiabank expect the pair to extend its gains toward the 1.0650/1.0750 range.
Sentiment shifts constructively
“We look for the EUR to remain well supported on modest dips as investors rather focus on the Fed rate cycle than Eurozone fundamentals – at least for now – to support steadily improving EUR-bullish sentiment.”
“Bull trend momentum is solidly EUR-bullish across the short-, medium- and long-term DMI studies, which continues to suggest limited scope for counter-trend EUR corrections.”
“The pair has established a clear foothold above 1.05 which should provide a platform for additional gains to the 1.0650/1.0750 range (1.0749 is the 61.8% Fibonacci retracement of the YTD decline in the EUR).”
The Kiwi strengthened sharply in November, by a large 7.2%. Economists at MUFG Bank expect the NZD/USD pair to correct lower before staging a sustained recovery.
NZD encouraged by hawkish repricing of RBNZ rate hike expectations
“The RBNZ rate hike of 75 bps was partially priced but the key takeaway was the substantial upward revision by the RBNZ to the estimated terminal rate – from 4.10% previously in August to 5.50%.”
“NZD was also propelled higher by the gradual shift away from zero-covid policies in China that are encouraging more optimism over growth next year.”
“With the Fed still set to hike further and remain hawkish, we see the NZD correcting weaker before gaining again.”
- USD/CAD kicks off the new week on a weaker note, though shows resilience below 1.3400.
- Rallying oil prices underpins the Loonie and exerts some downward pressure on the major.
- A modest USD bounce from a multi-month low help limit losses, at least for the time being.
The USD/CAD pair comes under heavy selling pressure on Monday and drops to over a one-week low, though shows some resilience below the 1.3400 mark. Spot prices, however, remain in the negative territory and now seem to have stabilized around the 1.3420-1.3425 region heading into the North American session.
Crude oil prices rally nearly 2.5% on the first day of a new week in reaction to the OPEC+ decision to cut output by 2 million barrels per day from November through 2023. Adding to this, positive signs for fuel demand recovery in China, amid the easing of strict COVID-19 curbs, boost the black liquid. This, in turn, underpins the commodity-linked Loonie and exerts some downward pressure on the USD/CAD pair.
The downside, however, remains cushioned amid an intraday US Dollar recovery from its lowest level since late June touched earlier this Monday. Worries about a deeper global economic downturn continue to weigh on investors' sentiment, which is evident from a weaker tone around the equity markets. This, along with an uptick in the US Treasury bond yields, offers some support to the safe-haven buck.
The upbeat US monthly jobs report (NFP) released on Friday and an upside surprise in wages point to a further rise in inflationary pressures. The data reaffirmed expectations that the US central bank will continue to tighten its monetary policy and validates Fed Chair Jerome Powell's forecast that the peak interest rate will be higher than expected. This, in turn, is seen acting as a tailwind for the US bond yields.
That said, the recent comments by several FOMC Officials support prospects for relatively smaller interest rate hikes by the US central bank. This, in turn, is holding back the USD bulls from placing aggressive bets and should keep a lid on any meaningful recovery for the USD/CAD pair. Next on tap is the release of the US ISM Services PMI, which might influence the USD and provide some trading impetus.
Technical levels to watch
- The index wobbles in the low-104.00s amidst unclear risk trends.
- The continuation of the downtrend could drop to the 103.40 zone.
The DXY remains under pressure and so far manages to hold the downside just above the 104.00 mark on Monday.
The continuation of the selling pressure could motivate the US Dollar to accelerate losses and challenge the weekly low at 103.67 (June 27) ahead of another weekly low at 103.41 (June 16).
Below the 200-day SMA at 105.59, the Dollar’s outlook should remain negative.
DXY daily chart
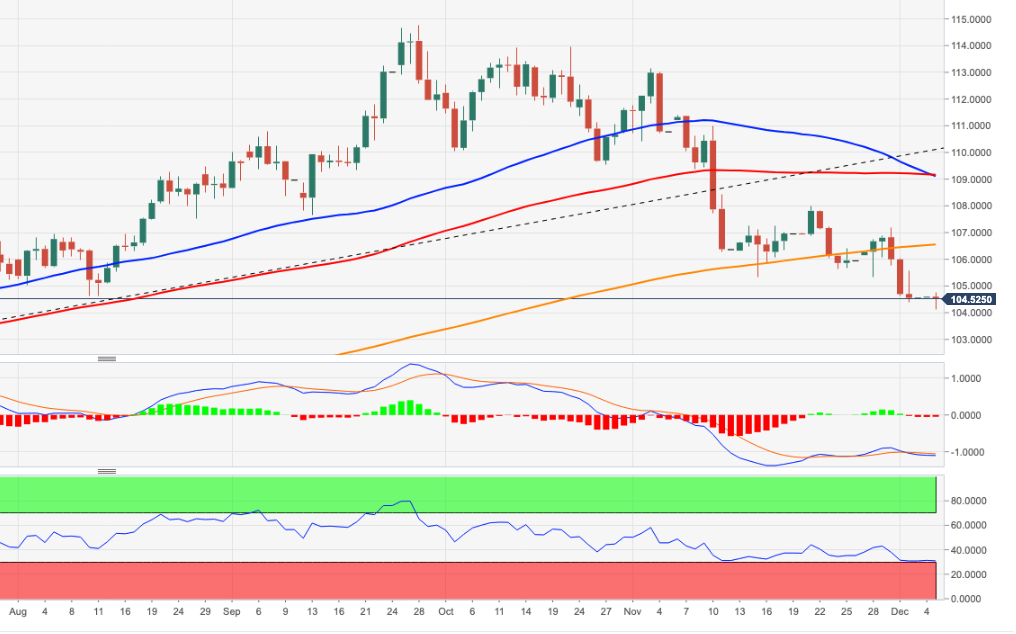
Economists at MUFG Bank see Bank of Canada caution at its meeting this Wednesday. Thus, the Loonie could come under pressure.
BoC should revert to a 25 bps rate increase
“We expect to see a degree of caution from the BoC given the flow of economic data clearly points to downside risks. We see the terminal rate pricing (4.25%) as reasonable although we believe there is a bigger risk of the markets moving to price an end after Wednesday’s hike, although it is unlikely the BoC will indicate that at this juncture but if the data on inflation improved and economic data worsened, the BoC could pause in January.”
“Weaker economic data in Canada, optimism globally over peak inflation, and slower growth emerging more clearly in the US all suggest the BoC is close to ending its tightening cycle. Any sense of that this week would reinforce our view of CAD underperformance versus G10 becoming the norm going forward.”
In the view of Markets Strategist at UOB Group Quek Ser Leang, the downside momentum could drag USD/IDR to the 15,280 region.
Key Quotes
“The sharp drop in USD/IDR last week was accompanied by strong downward momentum and further losses are likely this week. The support levels to watch are at 15,280 and 15,100”.
“Resistance is at 15,560, a break above 15,640 would indicate that the weakness in USD/IDR has stabilized.”
- EUR/JPY reverses two daily drops in a row and approaches 143.00.
- A deeper pullback could still test the key 200-day SMA at 139.15.
EUR/JPY rebounds from Friday’s 3-month lows and manages to flirt with the round level at 143.00 at the beginning of the week.
Despite the ongoing rebound, the cross remains under pressure and could still shed further ground and revisit the critical 200-day SMA in the short-term horizon.
The outlook for EUR/JPY is expected to remain positive while above the latter.
EUR/JPY daily chart
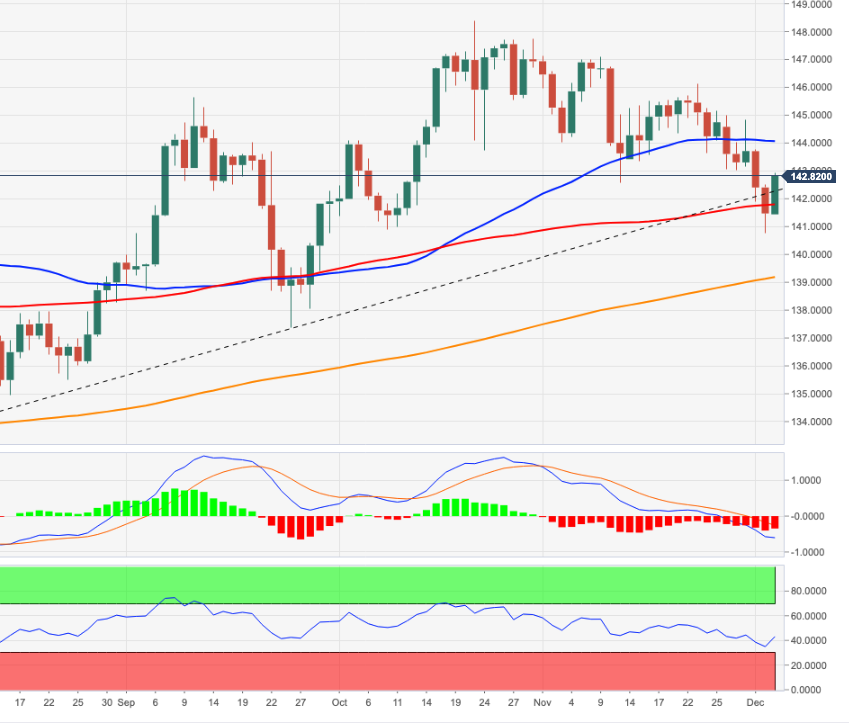
USD/MYR remains under pressure and poised to drop further in the near term, suggests Markets Strategist at UOB Group Quek Ser Leang.
Key Quotes
“USD/MYR closed sharply lower for the fourth week in a row last Friday (4.3830, -2.06%). While further weakness is not ruled out, deeply oversold conditions suggest any decline is likely to be at a slower pace and a clear break of 4.3240 is unlikely.”
“Resistance is at 4.4180; a breach of 4.4450 would indicate the current weakness has stabilized.”
The US Dollar weakened further and more substantially in November. After a period of swings back and forth between renewed USD strength and weakness, only later in 2023, we will see a sustained turn weaker for the Dollar, according to economists at MUFG Bank.
A period of some rebound for the Dollar seems likely
“We do not yet see grounds for a sustained weakening of the USD and expect the coming three-to-four months to be a period of swings back and forth as the fundamental driver of Dollar strength becomes less compelling but equally broader financial conditions remain challenging for a sustained retracement of Dollar strength.”
“QT is ongoing, global dollar liquidity is shrinking and equity valuations remain stretched, all USD supportive factors.”
“A peak for the US Dollar may have passed but we would expect swings back and forth between renewed dollar strength and weakness and only later in 2023 will we see a sustained turn weaker for the Dollar.”
OPEC and its allied producers (OPEC+) have agreed to maintain their current oil-output targets despite a recent decline in energy prices. Oil prices showed no immediate reaction, which bode ill for the Norwegian Krone, economists at Commerzbank report.
OPEC+’s long-term price setting scope seems limited
“In the run-up to the OPEC+ meeting there had been speculation that the oil cartel might decide in favour of raising oil production volumes. That did not happen, as we found out over the weekend. However, that is not good news for the Norwegian Krone as the price for Brent Oil reacted only very cautiously to these reports.”
“Long-term inflation expectations remain well below the peaks of the first half of the year, OPEC+’s long-term price setting scope also seems limited – at least if one assumes that the cartel will continue to play the role of a monopolist it used to play.”
“And if there is no significant reaction in the oil price then there is no reason to trade NOK at stronger levels either.”
European Central Bank (ECB) Governing Council member Gabriel Makhlouf said on Monday, “I do not think we're in restrictive monetary policy rate territory now.”
Additional quotes
“Anticipates that 50 basis point rise is where we’ll end up.”
“We haven’t reached the stage that we’re confident we have inflation under control.”
“Anticipates that there will be further interest rate increases in the new year.”
“Do not see quantitative tightening starting in January, expects to see some changes implemented by end-Q1.”
“Fiscal policy potentially becoming marginally unhelpful in the euro zone to bringing inflation under control.”
Market reaction
EUR/USD is drawing support from the latest hawkish remarks from the ECB policymaker. The pair was last seen trading up 0.16% on the day at 1.0555.
- Eurozone Retail Sales came in at -1.8% MoM in October vs. -1.7% expected.
- Retail Sales in the bloc arrived at -2.7% YoY in October vs. -2.6% expected.
Eurozone’s Retail Sales dropped by 1.8% MoM in October versus -1.7% expected and 0.8% last, the official figures released by Eurostat showed on Monday.
On an annualized basis, the bloc’s Retail Sales came in at -2.7% in October versus 0% recorded in September and -2.6% consensus forecast.
FX implications
The euro shrugs off the downbeat Eurozone data amid a renewed weakness in the US Dollar across the board. At the time of writing, the major is trading at 1.0556, up 0.16% on the day.
About Eurozone Retail Sales
The Retail Sales released by Eurostat are a measure of changes in sales of the Eurozone retail sector. It shows the performance of the retail sector in the short term. Percent changes reflect the rate of changes of such sales. The changes are widely followed as an indicator of consumer spending. Usually, positive economic growth anticipates "Bullish" for the EUR, while a low reading is seen as negative, or bearish, for the EUR.
EUR/USD has now rebounded by nine big figures since reaching a trough on 28th September. Economists at MUFG Bank analyze the EUR/USD seasonal outlook in December and note that the pair has gained on 14 occasions over a twenty-year period.
Watch the seasonal EUR bias in December
“There is a strong seasonal bias to be mindful of in December. In the last ten years, EUR/USD has gained on eight occasions in December, by an impressive average of 1.5%.”
“Over a twenty-year period, EUR/USD has gained on 14 occasions. This could be a reflection of position squaring ahead of year-end. On average over these periods, market participants have run EUR short positions. That influence could be powerful this year given the scale of long Dollar positioning given the huge move in 2022. That said, the EUR/USD gains in October and November may mean this has already started.”
- AUD/USD kicks off the new week on a positive note and hits a fresh multi-month high.
- A combination of factors helps revive the USD demand and caps the upside for the pair.
- Traders look to the US ISM Services PMI for some impetus ahead of the RBA on Tuesday.
The AUD/USD pair climbs to its highest level since August 13 on the first day of a new week, albeit struggles to capitalize on the move beyond mid-0.6800s. The pair trims a part of its intraday gains and retreats to the 0.6800 mark during the first half of the European session.
A combination of factors assists the US Dollar to stage a modest recovery from over a five-month low touched earlier this Monday, which, in turn, acts as a headwind for the AUD/USD pair. Worries about a deeper global economic downturn overshadow the latest optimism over the easing of COVID-19 curbs in China. This is evident from a generally softer tone around the equity markets, which drives some haven flows towards the buck and weighs on the risk-sensitive Aussie. Apart from this, an intraday uptick in the US Treasury bond yields offers some support to the greenback.
The upbeat US monthly jobs report (NFP) released on Friday and an upside surprise in wages point to a further rise in inflationary pressures. The data validates Fed Chair Jerome Powell's forecast that the peak interest rate will be higher than expected and suggests that the US central bank will continue to tighten its monetary policy. This, in turn, is seen pushing the US Treasury bond yields higher. That said, the recent comments by several FOMC Officials support prospects for relatively smaller interest rate hikes by the US central bank, which might cap gains for the USD.
Traders might also refrain from positioning for a deeper corrective pullback for the AUD/USD pair as the focus now shifts to the Reserve Bank of Australia (RBA) meeting on Tuesday. Heading into the key central bank event risk, the US ISM Services PMI might provide some impetus to the AUD/USD pair, later during the early North American session on Monday. This, along with the US bond yields and the broader risk sentiment, will influence the USD price dynamics and further contribute to producing short-term trading opportunities around the AUD/USD pair.
Technical levels to watch
Markets Strategist at UOB Group Quek Ser Leang noted USD/THB could lose further traction and deflates to the 34.00 region.
Key Quotes
“USD/THB closed sharply lower by 2.88% last week (Friday’s close of 34.70) before extending its loss in Asian trade today. The rapid improvement in downward momentum is likely to lead to further USD/THB weakness this week.”
“The level to watch is at 34.30, followed by 34.05. On the upside, a breach of 35.05 (minor resistance is at 34.85) would indicate that USD/THB is unlikely to weaken further.”
- EUR/USD advances to new multi-month highs past 1.0580.
- The EMU Sentix Index surprises to the upside in December.
- Markets’ attention will be on the US ISM Non-Manufacturing.
The optimism around the European currency remains well and sound and lifts EUR/USD to new 6-month peaks in the 1.0580/85 band on Monday.
EUR/USD up on USD-weakness
EUR/USD advances for the fourth consecutive session and extends further the recent breakout of the key 200-day SMA (1.0362), approaching at the same time the 1.0600 neighbourhood.
The continuation of the uptrend in the pair once again comes in tandem with extra decline in the Greenback, which morphed into fresh multi-month lows in the USD Index (DXY).
In the German money markets, the 10-year Bund yield look flatish around 1.85% in a context where a 50 bps rate raise by the ECB at the December 15 gathering appears to be shaping up.
Data wise in the broader Euroland, the Investor Confidence tracked by the Sentix Index ticked higher to -21.0 for the current month, while November’s final Services PMI dropped marginally to 48.5. In Germany, the final Services PMI receded to 46.1 during last month.
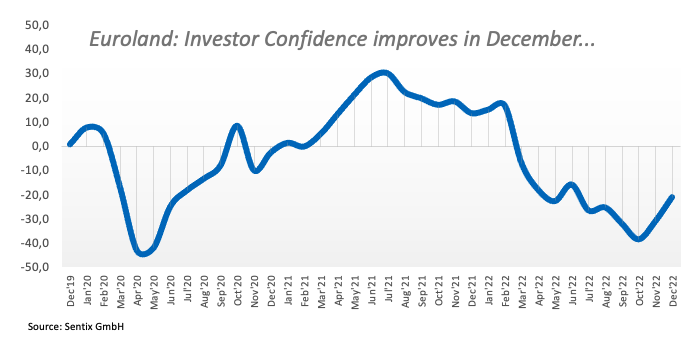
In the NA session, the ISM Non-Manufacturing will take centre stage seconded by Factory Orders and the final Services PMI.
What to look for around EUR
EUR/USD pushes higher and trades at shouting distance from the key 1.0600 region at the beginning of a new trading week.
In the meantime, the European currency is expected to closely follow US Dollar dynamics, the impact of the energy crisis on the region and the Fed-ECB policy divergence. In addition, markets repricing of a potential pivot in the Fed’s policy remains the exclusive driver of the pair’s price action for the time being.
Back to the euro area, the increasing speculation of a potential recession in the bloc emerges as an important domestic headwind facing the Euro over the short-term horizon.
Key events in the euro area this week: Eurogroup Meeting, ECB Lagarde, Germany Final Services PMI, EMU Retail Sales, Final Services PMI (Monday) - Germany Construction PMI (Tuesday) – EMU Flash Q3 GDP Growth Rate (Wednesday) – ECB Lagarde (Thursday).
Eminent issues on the back boiler: Continuation of the ECB hiking cycle vs. increasing recession risks. Impact of the war in Ukraine and the protracted energy crisis on the region’s growth prospects and inflation outlook. Risks of inflation becoming entrenched.
EUR/USD levels to watch
So far, the pair is gaining 0.11% at 1.0551 and is expected to meet the next up barrier at 1.0584 (monthly high December 5) ahead of 1.0614 (weekly high June 27) and finally 1.0773 (monthly high June 27). On the other hand, the breach of 1.0362 (200-day SMA) would target 1.0330 (weekly low November 28) en route to 1.0222 (weekly low November 21).
The Eurozone Sentix Investor Confidence index improved to -21.0 in December from -30.9 in November vs. -27.1 expected.
The current situation in the Eurozone rose to -20.0 points in December from -29.5 in November.
An expectations index jumped to -22.0 from -32.3, hitting its highest value since March 2022.
Key takeaways
"The surprisingly high gas levels and the continued stable labor markets are not consistent with a recession.”
"In our opinion, however, this correction in assessments should not be misinterpreted as a general trend reversal.”
"The dangers of recession have by no means been averted."
EUR/USD reaction
The shared currency picked up fresh bids on the upbeat Eurozone Sentix data. EUR/USD is trading at 1.0560, up 0.20% on the day.
US Dollar is dropping again today despite a strong labour market report. Economists at Commerzbank do not expect the greenback to recover.
What could save the Dollar at this stage?
“I could make it easy for myself and simply say: ‘If not even a labor market as strong as this one can provide sustainable support to the US dollar it clearly is beyond saving’.”
“One could of course assume now that the Fed would not have reason to lower interest rates again. However, this assumption would only be correct if the US financial market were to remain solid. Following years of cheap money, followed by a rate hike cycle of unparalleled speed some market participants might question that too.”
“Even in the absence of rising unemployment, there might be reasons for the Fed to lower its key rate once inflation pressure eases.”
- Gold price corrects from a five-month high amid modest intraday US Dollar recovery move.
- Rebounding US Treasury bond yields revives the USD demand and weighs on the XAU/USD.
- Bets for less aggressive rate hikes by Federal Reserve should help limit losses for Gold price.
Gold price struggles to capitalize on the intraday positive move and retreats from the $1,810 area, or a five-month peak touched earlier this Monday. The XAU/USD slips below the $1,800 mark during the first half of the European session and is now flirting with a technically significant 200-day Simple Moving Average (SMA).
Modest US Dollar recovery exerts pressure on Gold price
The US Dollar reverses an early dip and stages a modest recovery from its lowest level since late June, which, in turn, is seen acting as a headwind for the Dollar-denominated Gold price. The upbeat monthly jobs report released from the United States on Friday and an upside surprise in wage growth pointed to the possibility of a further rise in inflationary pressures. This fuels speculation that the Federal Reserve will continue to tighten its monetary policy and offers some support to the Greenback.
Rebounding US Treasury bond yields further weighs on XAU/USD
Furthermore, Federal Reserve Chair Jerome Powell last week indicated that the peak interest rate will be higher than expected. This leads to an intraday uptick in the US Treasury bond yields, which is seen as another factor benefitting the US Dollar and driving flows away from the non-yielding Gold price. Apart from this, the latest optimism over the easing of COVID-19 restrictions in several Chinese cities dents demand for traditional safe-haven assets and further seems to weigh on the XAU/USD.
Bets for smaller rate hikes by Federal Reserve to limit losses
The downside, however, is likely to remain cushioned, at least for the time being, amid rising bets for a relatively smaller 50 bps rate hike by the Federal Reserve at its upcoming meeting on December 13-14. This should continue to lend some support to Gold price, warranting some caution positioning for any meaningful corrective pullback. Traders now look forward to the US ISM Services PMI, due for release later during the early North American session, for short-term opportunities.
Gold price technical outlook
From a technical perspective, last week’s sustained move beyond the very important 200-day SMA was seen as a fresh trigger for bullish traders. Hence, any subsequent decline is more likely to attract some buyers near the $1,783-$1,782 region. This, in turn, should help limit the downside for Gold price near the $1,761-$1,760 horizontal resistance breakpoint, now turned support.
On the flip side, bulls might now wait for some follow-through buying beyond the $1,810 area before placing fresh bets. Gold price might then accelerate the positive momentum towards testing the next relevant hurdle near the $1,830 zone en route to the $1,843-$1,845 supply zone.
Key levels to watch
“I see a 50 basis point increase in interest rates as the minimum needed at our December meeting,” European Central Bank (ECB) Governing Council member Gabriel Makhlouf said on Monday.
Additional quotes
We have to be open to policy rates moving into restrictive territory for a period in 2023.
It is premature to be talking about the end-point for policy rates amid the prevailing levels of uncertainty.
There are complex issues involved in quantative tightening.
It would be wrong to ascribe our current inflation problem solely to supply shocks.
As price pressures broaden across the basket, the risks of persistently high inflation becoming embedded rises, and the case for tighter monetary policy becomes stronger.
Increasing share of forecasters expecting high rates of inflation is a development that needs closely monitoring.
Broad based fiscal policy response to high inflation may necessitate a stronger response from monetary policymakers.
Related reads
- ECB’s de Guindos: Central bank needs to avoid “M-shaped evolution of inflation”
- EUR/USD Forecast: Euro could extend correction on safe-haven flows
USD/CNH could extend the downside to the 6.9300 region in the next weeks, comment Markets Strategist Quek Ser Leang and Senior FX Strategist Peter Chia at UOB Group.
Key Quotes
24-hour view: “We did not anticipate the choppy price actions in USD last Friday as it swung between 7.0050 and 7.0719 before closing at 7.0220 (0.24%). USD fell sharply in early Asian trade and further decline is likely. That said, the pace of any further decline is likely to be slower and the major support level of 6.9600 could be out of reach today. Resistance is at 7.0250, followed by 7.0480.”
Next 1-3 weeks: “We turned negative on USD last Thursday (01 Dec, spot at 7.0400). We indicated ‘the recent outsized drop is likely to extend to 7.0200, possibly as low as 7.0000’. USD easily took out both support levels as it plummeted to 7.0050 on Friday and 7.0000 in Asian trade today. We continue to expect USD weakness. The next levels to watch are at 6.9600 and 6.9300. On the upside, a break of 7.0810 (‘strong resistance’ was at 7.1250 last Friday) would indicate that the weakness in USD has stabilized.”
European Central Bank (ECB) Vice-President Luis de Guindos provides his outlook on growth and inflation during his latest appearance on Monday.
Key quotes
Inflation is starting to decelerate but still sees inflation hovering around 7% by mid-2023.
The ECB needs to avoid "M-shaped evolution of inflation" whereby there is a re-acceleration after slowing down.
The economic deceleration is not as deep as expected.
Market reaction
Amidst slightly hawkish comments from the ECB policymakers, EUR/USD is advancing 0.12% on the day to 1.0550, at the press time.
GBP/USD has climbed above 1.2300 for the first time since late June. Economists at ING believe that the pair is unlikely to extend its race higher beyond 1.25.
Cable is still a Dollar story
“We struggle to see Cable extend its rally to 1.25 and beyond, but it will undoubtedly be primarily a Dollar/risk sentiment story driving the pair before the BoE meeting.”
“A contraction below 1.20 seems more appropriate given global and UK macro fundamentals.”
See: GBP/USD now looks at 1.2400 – UOB
- The index attempts a mild rebound in the mid-104.00s.
- The dollar drops to new 6-month lows near 104.00 earlier on Monday.
- ISM Non-Manufacturing, Factory Orders next of note in the US docket.
The greenback, when tracked by the USD Index (DXY), appears to regain some poise early in the European morning around the 104.50 region on Monday.
USD Index now focuses on data
Following an earlier drop to fresh 6-month lows near the 104.00 neighbourhood, the index regains some upside traction and stages a so far lacklustre comeback in the wake of the opening bell in Euroland.
The recovery in the dollar comes in line with so far marginal price action in US yields across the curve, as market participants continue to digest Friday’s Nonfarm Payrolls figures while investors seem to have already fully priced in a half-point interest rate hike at the Fed’s meeting on December 14.
Later in the NA session, the focus of attention is expected to be on the release of the ISM Non-Manufacturing for the month of November seconded by Factory Orders and the final prints of the S&P Global Services PMI.
What to look for around USD
The dollar attempts a bounce after dropping to as low as the boundaries of 104.00 the figure, or 6-month lows, at the beginning of the week.
While hawkish Fedspeak maintains the Fed’s pivot narrative in the freezer, upcoming results in US fundamentals would likely play a key role in determining the chances of a slower pace of the Fed’s normalization process in the short term.
Key events in the US this week: Final Services PMI, ISM Non-Manufacturing PMI, Factory Orders (Monday) – Balance of Trade (Tuesday) – MBA Mortgage Applications, Consumer Credit Change (Wednesday) – Initial Jobless Claims (Thursday) – Producer Prices, Advanced Michigan Consumer Sentiment, Wholesale Inventories (Friday).
Eminent issues on the back boiler: Hard/soft/softish? landing of the US economy. Prospects for further rate hikes by the Federal Reserve vs. speculation of a recession in the next months. Fed’s pivot. Geopolitical effervescence vs. Russia and China. US-China persistent trade conflict.
USD Index relevant levels
Now, the index is gaining 0.07% at 104.58 and faces the next up barrier at 105.59 (200-day SAM) followed by 107.19 (weekly high November 30) and then 107.99 (weekly high November 21). On the other hand, the breakdown of 104.11 (monthly low December 5) would open the door to 103.41 (weekly low June 16) and finally 101.29 (monthly low May 30).
EUR/USD continues to push higher toward 1.0600. Economists at ING expect the pair’s rally to run out of steam around the 1.0600/1.0650 area.
Energy scares coming back?
“Given the high sensitivity of EUR/USD to the eurozone’s terms of trade (which is primarily driven by energy prices), further upside risks for energy commodities equal downside risks for the Euro.”
“This week, some Dollar stabilisation could make the EUR/USD rally run out of steam around the 1.0600/1.0650 area, and possibly lead to a more sustainable drop below 1.0450/1.0500.”
“We remain bearish on the pair into year-end.”
Citing two sources with knowledge of the matter, Reuters reported on Monday, China is on course to downgrade its management of COVID-19 as a top-level Category A infectious disease to a less strict Category B disease as early as January.
Additional takeaways
“China may announce 10 new COVID-19 management measures as early as Wednesday.”
“These supplement the 20 measures unveiled in November that set off a wave of COVID-easing steps across the nation.
Market reaction
Encouraging headlines from China fail to provide any lift to the souring risk sentiment, as the US S&P 500 futures drop 0.36% on the day while the US Dollar Index looks to stabilize at around 104.50.
According to Markets Strategist Quek Ser Leang and Senior FX Strategist Peter Chia at UOB Group, USD/JPY could attempt some consolidation in the very near term ahead of the probable resumption of the downside.
Key Quotes
24-hour view: “Last Friday, we highlighted that ‘While further weakness is not ruled out, the massive drop over the past couple of days is overextended and it remains to be seen if USD could challenge the next support at 134.00’. USD subsequently plummeted to 133.60, rebounded to 135.97 before dropping back down to close at 134.30 (-0.72%). Downward pressure appears to have eased somewhat and this combined with oversold conditions suggests USD is unlikely to weaken further. Today, USD is more likely to trade sideways between 133.80 and 135.65.”
Next 1-3 weeks: “Last Friday (01 Dec, spot at 137.20), we highlighted that downward momentum is still strong but it is left to be seen if USD can maintain the frenetic pace of decline. We indicated, the next level to watch is at 134.00. USD subsequently plummeted to 133.60 before rebounding. Further USD still appears likely even though oversold short-term conditions could lead to 1-2 days of consolidation first. The next level to monitor is at 133.00. On the upside, a breach of 136.70 (‘strong resistance’ level was at 137.05 last Friday) would indicate that the weakness in USD that started late last month has stabilized.”
- GBP/USD retreats from a multi-month top amid a modest intraday USD recovery.
- An uptick in the US bond yields and a softer risk tone underpin the safe-haven buck.
- A bleak outlook for the UK economy further contributes to capping gains for the pair.
The GBP/USD pair kicks off the new week on a positive note and hits its highest level since September 16, though the momentum runs out of steam ahead of mid-1.2300s. The pair trim a part of its intraday gains and retreats below the 1.2300 mark during the early part of the European session.
A combination of factors assists the US Dollar to stage a modest recovery from over a five-month low touched earlier this Monday, which, in turn, acts as a headwind for the GBP/USD pair. Despite the easing of COVID-19 restrictions in China, worries about a deeper global economic downturn continue to weigh on investors' sentiment. This is evident from a softer tone around the equity markets, which, along with an uptick in the US Treasury bond yields, offer some support to the safe-haven buck.
The upbeat US monthly jobs report (NFP) released on Friday and an upside surprise in wages point to a further rise in inflationary pressures. This validates Fed Chair Jerome Powell's forecast that the peak interest rate will be higher than expected and pushes the US Treasury bond yields higher. That said, firming expectations that the US central bank will slow the pace of its policy tightening might keep a lid on any further gains for the USD. In fact, the markets expect a 50 bps rate hike in December.
The British Pound, on the other hand, is undermined by a bleak outlook for the UK economy. Apart from this, Bank of England (BoE) Chief Economist Huw Pill's dovish comments last week, indicating that inflation could begin to fall, might hold back bullish traders from placing aggressive bets around the GBP/USD pair. The mixed fundamental backdrop, meanwhile, suggests that the major is more likely to consolidate its recent strong gains ahead of the final Services PMIs from the UK and the US.g
Later during the early North American session, traders will take cues from the release of the US ISM Services PMI. This, along with the US bond yields and the broader risk sentiment, will influence the USD price dynamics and produce short-term trading opportunities around the GBP/USD pair.
Technical levels to watch
Following his weekend’s remarks, European Central Bank (ECB) Governing Council member and French central bank governor Francois Villeroy de Galhau said on Monday, it is “too soon to talk about the terminal rate.”
He added that the central bank will “decide what is needed on a meeting-by-meeting basis.”
On Sunday, Villeroy noted that “the European Central Bank should raise interest rates by 50 basis points at its next meeting (December 15).”
Market reaction
At the time of writing, EUR/USD is adding 0.07% on the day to trade at 1.0545.
The Kiwi ended the week on a high, closing above 0.64, a level not seen since August. Economists at ANZ Bank expect the NZD/USD pair to test the 0.6450 mark.
USD could be volatile into next week’s Fed meeting
“We start the week with the USD on its knees despite data suggesting that even if the Fed hike by ‘only’ 50 bps next week (not a small hike; just not a gigantic one!) they may lift their terminal rate projection above 5%. If that occurs, the question we’re pondering is; how will the USD fare? We may be shaping up for an epic battle between the ‘recessionists’ and the ‘rate-watchers’, all of which portends USD volatility.”
“We see NZD fair value at ~0.65; that suggests it can maintain its strength, but it may be a bumpy ride.”
“The next major technical target is 0.6450 (the Aug high).”
European Central Bank (ECB) board member and Bank of Portugal Governor Mario Centeno said on Monday that the inflation peak may be reached in the fourth quarter of this year.
Contradicting Centeno, France's Finance Minister Bruno Le Maire said that the “inflation peak is not yet over, will last for some months.”
Market reaction
The Euro is unfazed by these above comments, as EUR/USD is holding steady at around 1.0540, as of writing.
Both the Chinese Renminbi as well as the Pacific G10 currencies (AUD and NZD) are benefitting quite clearly from the fact that several cities in China decided to ease coronavirus curbs. Nonetheless, excessive AUD and NZD are not justified, according to economists at Commerzbank.
China’s leadership is reacting
“Corona measures are being eased more quickly than one might have assumed even last week. In particular as the introduction of these measures had initially caused CNY, AUD and NZD weakness the FX market had potential for a correction. I completely agree with that, in particular as I was critical about the initial market reaction. At the same time, I caution against throwing out the baby with the bath water.”
“I know that everyone blamed the corona lockdowns (and fears of them) for weak growth in China. However, even if we see a reversal in China’s lockdown policy that does not mean that everything will be happiness ever after. That means that excessive AUD and NZD strength is not justified.”
In light of advanced results from CME Group for natural gas futures markets, open interest extended the uptrend on Friday, now by around 4.3K contracts. In the same direction, volume reversed two daily drops in a row and increased by around 45.7K contracts.
Natural Gas: A drop to $4.75 appears in store
Prices of natural gas dropped further on Friday amidst increasing open interest and volume, which is supportive of the continuation of the decline in the very near term. Against that, a potential test of the October low at $4.75 per MMBtu seems to have started to emerge on the horizon.
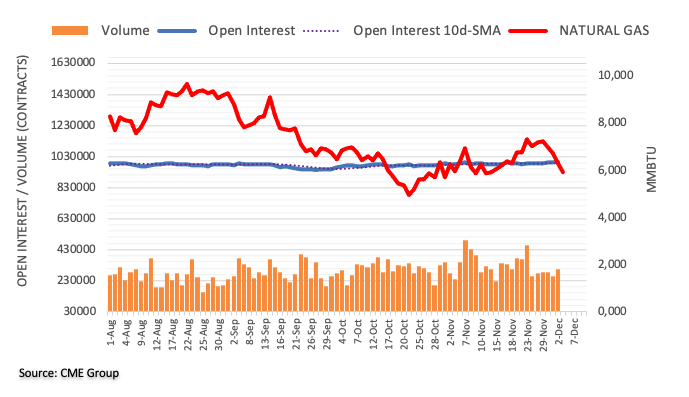
A potential move to 0.6915 remains on the cards once AUD/USD clears 0.6850, suggest Markets Strategist Quek Ser Leang and Senior FX Strategist Peter Chia at UOB Group.
Key Quotes
24-hour view: “We expected AUD to ‘trade between 0.6765 and 0.6845’ last Friday. AUD subsequently dropped to 0.6743 before rebounding quickly. We view the price movements as part of a consolidation and expect AUD to trade within a range of 0.6760/0.6850 today.”
Next 1-3 weeks: “There is not much to add to our update from last Friday (02 Dec, spot at 0.6800). As highlighted, while further AUD strength is not ruled out, it has to break clearly above 0.6850 before an advance to 0.6915 is likely. The likelihood of a clear break of 0.6850 would remain intact as long as AUD does not move below 0.6730 (no change in ‘strong support’ level from last Friday).”
- Silver surrenders its intraday gains to the highest level since late April touched earlier this Monday.
- The technical setup still favours bullish traders and supports prospects for further appreciating move.
- A convincing breakdown below the 200-day SMA is needed to negate the near-term positive outlook.
Silver retreats from the mid-$23.00s or the highest level since late April touched earlier this Monday and drops to the lower end of its daily range during the early European session. The XAG/USD is currently trading just above the $23.00 round-figure mark, up around 0.10% for the day.
Slightly overbought RSI (14) on the daily chart turns out to be the only factor prompting some profit-taking around the XAG/USD. The near-term bias, however, remains tilted in favour of bullish traders in the wake of last week's sustained breakout through a technically significant 200-day SMA and the $22.00 mark. Hence, any subsequent pullback might still be seen as a buying opportunity and is more likely to remain limited, at least for the time being.
From current levels, any further slide below the $23.00 mark is likely to find decent support near the $22.60-$22.55 horizontal resistance breakpoint. The next relevant support is pegged near the $22.00 mark, below which the XAG/USD could slide further to the $21.40 area. The latter marks the 200 DMA and should act as a strong base. A convincing break below will negate the near-term positive outlook and pave the way for a deeper corrective pullback.
On the flip side, the multi-month peak, around the $23.50-$23.55 region, could act as an immediate resistance. Some follow-through buying should allow the XAG/USD to aim back to reclaim the $24.00 mark for the first time since April. The positive momentum could get extended towards the $24.25-$24.30 zone en route to the $24.55-$24.60 region.
Silver daily chart
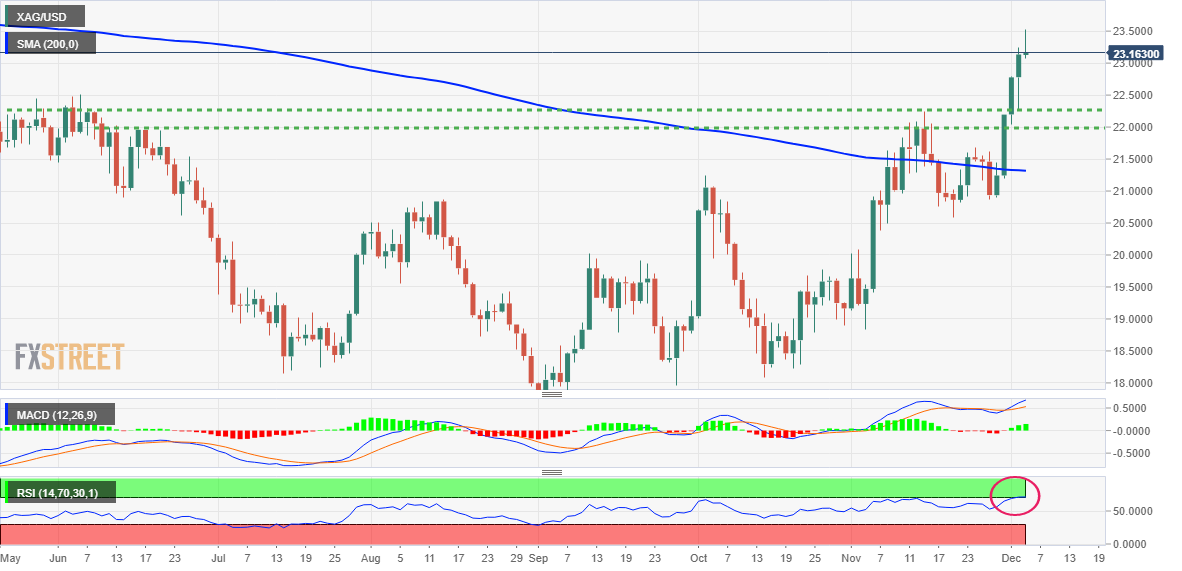
Key levels to watch
The US Dollar Index (DXY) has retraced 40% of the up-move since spring 2021, and economists at Société Générale expect more.
Time to sell the Dollar
“We expect the Dollar to be the weakest of the G10 currencies in 2023, though it won’t fall in a straight line.”
“The Fed is closer to the end of its rate-hiking cycle than most. If taming inflation triggers a harder economic landing than expected, that will happen later rather than sooner. For now, a soft landing isn’t good for the Dollar.”
“A backdrop of soft economic landings, monetary policy pivots and a correction in energy prices (which have been very dollar-supportive) suggests the Dollar Index will reverse most if not all the gains it saw between January and September 2022, taking it back below 100.”
CME Group’s flash data for crude oil futures markets noted traders trimmed their open interest positions for the second day in a row on Friday, this time by around 9.3K contracts. In the same line, volume dropped by around 79.4K contracts, partially reversing the previous build.
WTI: Immediately to the upside comes $83.32
Friday’s downtick in prices of the WTI was in tandem with shrinking open interest and volume, exposing the probability of a short-term rebound. That said, the next hurdle of note for the commodity comes at the so far December peak at $83.32 (December 1).
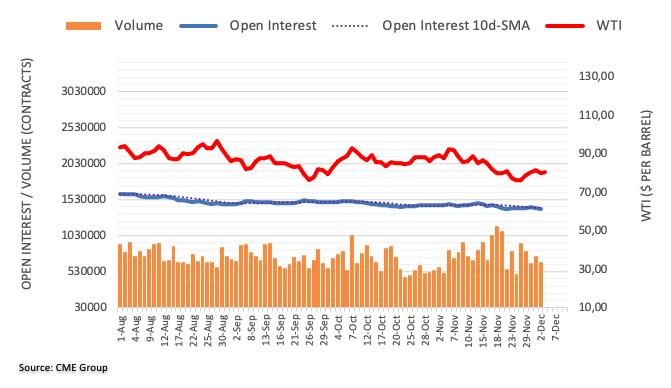
In the opinion of Markets Strategist Quek Ser Leang and Senior FX Strategist Peter Chia at UOB Group, GBP/USD now shifts the focus to the 1.2400 region.
Key Quotes
24-hour view: “Last Friday, we highlighted that ‘there is room for another leg higher in GBP to 1.2350 before the risk of a pullback increases’. However, GBP plunged to 1.2137 in NY trade. The decline was however, short-lived as GBP rebounded strongly from the low and closed slightly higher at 1.2293 (+0.24%). We still see room for GBP to edge higher but a break of 1.2350 appears unlikely today. Support is at 1.2245, followed by 1.2200.”
Next 1-3 weeks: “There is no change in our view from last Friday (02 Dec, spot at 1.2260) where GBP is likely to continue to advance and the next level to monitor is at 1.2400. However, after the sharp but brief drop to 1.2137 in NY trade, upward momentum has eased somewhat. To look at it another way, while we continue to expect GBP to advance, it may take a while before 1.2400 comes into the picture.”
Here is what you need to know on Monday, December 5:
US Dollar struggles to find demand to start the week with the US Dollar Index, which lost nearly 1.5% last week, trading at its weakest level since late June below 104.30 in the early European session. S&P Global will release the final November Composite PMI surveys for Germany, the Eurozone, the UK and the US on Monday. Sentix Investors Confidence and Retail Sales data will also be featured in the European economic docket. Finally, market participants will watch the ISM Services PMI from the US closely in the second half of the day.
On Sunday, several cities in China decided to ease coronavirus curbs, helping the risk sentiment improve during Asian trading hours. Urumqi, the capital of the Xinjiang region, said that shopping centres, restaurants and markets will open from Monday. Zhengzhou residents will not be required to show COVID test results to take public transport, taxis and to visit public areas. Officials also announced that people living in Nanning will not have to provide a negative COVID test to take the subway. Although the data from China revealed that the Caixin Services PMI declined to 46.7 in November from 48.4 in October Asian equity indexes performed well on Monday. The Shanghai Composite gained 1.5% and Hong Kong's Hang Seng rose more than 3%.
Nevertheless, US stock index futures trade virtually unchanged and the 10-year US Treasury bond yield stays in positive territory slightly above 3.5%.
Meanwhile, following its meeting over the weekend, OPEC and its allied producers (OPEC+) have agreed to maintain their current oil-output targets despite a recent decline in energy prices. Crude oil prices showed no immediate reaction to this decision and the barrel of West Texas Intermediate was last seen trading in a narrow channel at around $80.
EUR/USD continued to push higher toward 1.0600 and reached its strongest level in over five months early Monday. Europen Central Bank (ECB) board member François Villeroy de Galhau said on Sunday that he is in favour of a 50 basis point rate hike in December but this comment doesn't seem to be having a significant impact on the Euro's performance against its rivals.
After having closed the fourth straight week in positive territory, GBP/USD preserved its bullish momentum early Monday and climbed above 1.2300 for the first time since late June. Although the pair edged slightly lower in the early European morning, it continues to trade in positive territory above 1.2300.
USD/JPY lost nearly 500 pips last week and started the new week in a calm manner. The data from Japan showed that the Jibun Bank Services PMI came in at 50.3 in November, slightly higher than the flash estimate of 50. USD/JPY largely ignored this data and was last seen moving sideways above 134.50.
AUD/USD gained traction during the Asian trading hours and climbed above 0.6800. Early Tuesday, the Reserve Bank of Australia will announce monetary policy decisions early Tuesday.
Reserve Bank of Australia Preview: Hinting toward an end to its rate hike cycle?
Gold price edged lower on Friday after the upbeat November jobs report from the US but managed to climb above $1,800 early Monday. With the 10-year US T-bond yield holding steady, however, XAU/USD seems to be having a difficult time gathering bullish momentum for now.
Bitcoin gained traction to start the new week and was last seen trading at its highest level in three weeks at around $17,300. Ethereum is up more than 1% on Monday, trading near $1,300.
Open interest in gold futures markets shrank by around 7K contracts at the end of the week, partially reversing the previous build according to preliminary readings from CME Group. Volume followed suit and went up by around 43.6K contracts following two daily pullbacks in a row.
Gold: Next target now comes at $1,879
Gold prices closed Friday’s session with modest losses following a sharp advance in the previous sessions. The corrective decline, however, came on the back of shrinking open interest and volume, removing strength from further losses and opening the door to the continuation of the uptrend instead. The next target of note for the yellow metal is now seen at the June high at $1,879 per ounce troy (June 13).
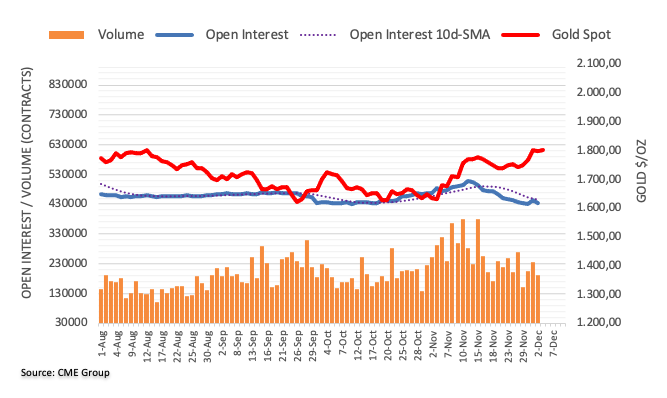
Gold price resumes the uptrend and hits five-month highs beyond the $1,800 mark. What’s next? FXStreet’s Dhwani Mehta analyzes XAU/USD’s technical outlook.
Bulls remain in control
“Gold price has taken out the August 10 high at $1,808, now heading closer toward the July 4 high at $1,814. The next bullish target is seen at the $1,820 round figure.”
“The 14-day Relative Strength Index (RSI) has turned flat just beneath the overbought territory, suggesting the potential upside in Gold price.”
“In case of any retracement in Gold price, if the 200-Daily Moving Average (DMA) at $1,796 gives way, then a drop toward the November 15 high at $1,787 cannot be ruled out. The correction could then extend toward the previous day’s low of $1,778.”
- USD/JPY lacks any firm directional bias and oscillates in a narrow range on Monday.
- The underlying bearish sentiment around the USD continues to act as a headwind.
- An uptick in the US bond yields, the easing of COVID-19 curbs in China offer support.
The USD/JPY pair struggles to gain any meaningful traction on Monday and oscillates in a narrow trading band around the very important 200-day SMA through the early European session. The pair is currently trading just above mid-134.00s and remains well within the striking distance of a four-month low set on Friday amid sustained US Dollar selling.
As investors look past the upbeat US monthly jobs report released on Friday, expectations that the Fed will slow the pace of its policy tightening continue to weigh on the buck. In fact, the USD Index, which measures the greenback's performance against a basket of currencies, sinks to its lowest level since late June. Apart from this, the recent hawkish comments by Bank of Japan (BoJ) board member Asahi Noguchi underpins the Japanese Yen and act as a headwind for the USD/JPY pair.
That said, the latest optimism over the easing of COVID-19 restrictions in several Chinese cities keeps a lid on any meaningful gains for the safe-haven JPY. Furthermore, a generally positive tone around the US Treasury bond yields offers some support to the USD/JPY pair and helps limit the downside, at least for the time being. The mixed fundamental backdrop is holding back traders from placing aggressive bets and leading to subdued/range-bound price action on the first day of a new week.
From a technical perspective, Friday's breakdown below the 200 DMA for the first time since February 2021 could be seen as a fresh trigger for bearish traders. Furthermore, the USD/JPY pair's inability to attract any buyers or register a meaningful recovery adds credence to the negative outlook. This, in turn, suggests that the path of least resistance for the major is down and supports prospects for an extension of the recent sharp pullback from a 32-year peak touched in October.
Market participants now look forward to the US economic docket, highlighting the release of the ISM Services PMI for a fresh impetus later during the early North American session. Apart from this, the US bond yields will influence the USD price dynamics. Traders will further take cues from the broader risk sentiment to grab short-term opportunities around the USD/JPY pair.
Technical levels to watch
FX option expiries for Dec 5 NY cut at 10:00 Eastern Time, via DTCC, can be found below.
- EUR/USD: EUR amounts
- 1.0300 560m
- 1.0445-50 1.02b
- 1.0500 728m
- 1.0570-75 1.04b
- GBP/USD: GBP amounts
- 1.2300 253m
- USD/JPY: USD amounts
- 134.00 980m
- 135.45 362m
- 136.00 291m
- USD/CHF: USD amounts
- 0.9400-10 1.34b
- 0.9575 720m
- USD/CAD: USD amounts
- 1.3550 440m
- 1.3600-15 476m
- EUR/GBP: EUR amounts
- 0.8500 1.7b
Markets Strategist Quek Ser Leang and Senior FX Strategist Peter Chia at UOB Group noted further upside momentum in EUR/USD still remains on the table in the next few weeks.
Key Quotes
24-hour view: “Our expectations for EUR to break the major resistance at 1.0550 did not materialize as it plummeted to 1.0426 in NY trade before rebounding strongly to close at 1.0538 (+0.15%). While upward momentum has eased somewhat, we see room for EUR to edge above 1.0550. However, EUR is unlikely to challenge the next resistance at 1.0620. Support is at 1.0505, followed by 1.0480.”
Next 1-3 weeks: “We continue to hold the same view as last Friday (02 Dec, spot at 1.0525). As highlighted, the risk for EUR remains on the upside and the next level to focus on is at 1.0620, followed by 1.0690. That said, after the sharp and brief drop to 1.0426 in NY trade on Friday (the decline came close to breaking our ‘strong support’ level at 1.0420), upward momentum has eased somewhat. While we continue to see upside risk, the 1.0620 level may not come into view so soon. On the downside, there is no change in the ‘strong support’ level at 1.0420.”
- USD/CAD is at a make or a break near the round-levels support of 1.3400.
- Upbeat US Nonfarm Payrolls have failed to provide a cushion to the US Dollar.
- The Bank of Canada is set to hike its interest rates by 50 bps consecutively for the second time.
- USD/CAD is expected to deliver more losses on a breakdown of the Ascending Triangle pattern.
USD/CAD has witnessed a sheer downside after surrendering the critical support of 1.3442 in the Asian session. The loonie asset has dropped firmly below the round-level support of 1.3400 in the Tokyo session as a significant improvement in risk appetite has impacted the US Dollar.
The US Dollar Index (DXY) has turned sideways after registering a fresh five-month low at 104.14. The USD Index is expected to extend its losses ahead as the risk-on impulse has strengthened dramatically. The US Dollar is facing immense pressure as the Federal Reserve (Fed) is shifting its mindset towards a slow rate hike culture to safeguard the United States economy from financial risks. S&P500 futures are displaying a lackluster performance as investors are awaiting the release of US ISM Services PMI data for fresh impetus.
Meanwhile, the 10-year US Treasury yields have recovered firmly to near 3.53% on upbeat US Nonfarm Payrolls (NFP) data. Also, hawkish commentary from the Federal Reserve policymaker about interest rate peak has weakened US Treasury bonds. Chicago Fed President Charles Evans said on Friday, "We are probably going to have a slightly higher peak to Fed policy rate even as we slow pace of rate hikes," reported Reuters.
Upbeat US Nonfarm Payrolls failed to provide cushion to the US Dollar
Markets participants were expecting that only better-than-projected US labor market data could add life to the US Dollar. The Greenback has been facing immense pressure from investors after Federal Reserve policymakers started sounding ‘less hawkish’ on interest rate guidance. On the labor front, the United States economy added 261K fresh jobs against the projections of 200K. The jobless rate remained unchanged at 3.7%.
The catalyst that could support the US Dollar ahead is the improvement in Average earnings data. The labor cost index has improved to 5.1%. Robust labor demand along with higher wage rates possess the capability of accelerating inflation as higher wages would force households to more spending on durables. This could refresh troubles for Federal Reserve chair Jerome Powell.
Recovery in oil prices and upbeat Canadian employment data supported the Canadian Dollar
The Canadian Dollar has been supported by a recovery in oil prices and better-than-projected payroll data. Oil prices recovered sharply amid multiple tailwinds. Easing lockdown curbs in China and upbeats US Nonfarm Payrolls (NFP) data strengthened global economic projections. It is worth noting that Canada is a leading oil exporter to the United States economy and solid oil prices support the Canadian Dollar.
The Canadian economy added 10.1K jobs in November vs. the projections of 5K. Also, the Unemployment Rate has eased to 5.1% against the projections of 5.3%. This is going to delight the Bank of Canada (BOC) to announce a higher rate hike in its mission of bringing price stability.
Bank of Canada is set to hike interest rates further
Canada’s inflation rate remained unchanged in October at 6.9%, which indicates that the Bank of Canada is required to continue its policy tightening measures further to curtail inflationary pressures. In October’s monetary policy, Bank of Canada Governor Tiff Macklem hiked interest rates by 50 basis points (bps). As per the estimates from CIBC, the Canada central bank will continue its 50 bps rate hike regime. Analysts at CIBC point out that the Bank of Canada will increase rates by 50 bps on Wednesday, before pausing in 2023.
A 50 bps rate hike by the Bank of Canada will accelerate the interest rate to 4.25%. This is going to widen the BOC-Fed policy divergence, which is impacting the Loonie asset for now.
USD/CAD technical outlook
-638058173438634809.png)
USD/CAD is at a make or a break near the edge of the upward-sloping trendline of the Ascending Triangle chart pattern on a four-hour scale. The upward-sloping trendline of the chart pattern is placed from November 16 low at 1.3228 while the horizontal resistance is plotted from November 10 high at 1.3571.
The Loonie asset has dropped below the 50-and 200-period Exponential Moving Averages (EMAs) at 1.3436 and 1.3459 respectively, which indicates that the short-term and long-term trend is bearish.
Meanwhile, the Relative Strength Index (RSI) (14) is hovering around 40.00. A breakdown of the same will trigger a bearish momentum.
- EUR/USD scales higher for the fourth successive day and climbs to a fresh multi-month high.
- Bets for smaller Fed rate hikes continue to weigh heavily on the USD and remain supportive.
- Hopes for easing COVID-19 curbs in China further seem to undermine the safe-haven buck.
- Traders now look to the final Services PMI from the Eurozone and the US For a fresh impetus.
The EUR/USD pair is seen building on last week's breakout momentum beyond the very important 200-day SMA and gaining traction for the fourth straight day on Monday. The upward trajectory lifts spot prices to the 1.0585 area, or the highest level since late June and is sponsored by the prevalent bearish sentiment surrounding the US Dollar.
In fact, the USD Index, which measures the greenback's performance against a basket of currencies, sinks to over a five-month low amid expectations for a less aggressive policy tightening by the Fed. Market participants seem convinced that the US central bank will soften its stance and deliver a relatively smaller 50 bps rate hike at its upcoming meeting on December 13-14. This, along with the optimism over hopes for the easing of COVID-19 restrictions in China, continues to undermine the safe-haven buck.
That said, the upbeat US monthly jobs report released on Friday validates the view that the Fed will continue to tighten its monetary policy, although at a slower pace. An upside surprise in US job gains and wages points to a further rise in inflationary pressures, adding credence to Fed Chair Jerome Powell's forecast that the peak rate will be higher than expected. This, in turn, offers some support to the US Treasury bond yields, which should help limit the USD losses and keep a lid on the EUR/USD pair.
Furthermore, the European Central Bank (ECB) policymaker Francois Villeroy de Galhau sounded less hawkish and backed the case for a 50 bps rate hike in December. This might further hold back bulls from placing fresh bets around the EUR/USD pair, at least for the time being. Traders now look to the release of the final Services PMI prints from the Eurozone and the US. Later during the early North American session, the US ISM Services PMI should contribute to producing short-term opportunities around the EUR/USD pair.
Technical levels to watch
- Chinese equities have soared as the economy has started focusing on easing Covid-19 restrictions.
- Higher interest rate peak projections by Fed’s Evans have supported US Treasury yields.
- Oil prices lost strength as OPEC didn’t extend production cuts.
Markets in the Asian domain are displaying mixed responses as the risk impulse is turning precautionary ahead of US ISM Services PMI data. S&P500 futures have turned subdued as hawkish commentary from Federal Reserve (Fed) policymaker on targeted interest rate has restricted the upside while Friday’s upbeat Nonfarm Payrolls (NFP) strengthened the cushion.
Chicago Fed President Charles Evans said on Friday, "We are probably going to have a slightly higher peak to Fed policy rate even as we slow pace of rate hikes," reported Reuters. This has resulted in a significant recovery in the 10-year US Treasury yields above 3.54%.
At the press time, Japan’s Nikkei225 eased marginally, ChinaA50 jumped 1.70%, Hang Seng soared 3.38% and Nifty50 dropped 0.46%.
Nikkei225 is following the footprints of the S&P500 futures, displaying lackluster performance on Monday. Also, investors are awaiting Overall Household Spending for further guidance. The economic data is seen higher at 3.4% vs. the former release of 2.3%. A better-than-projected household spending would indicate higher expectations for short-term inflation.
Meanwhile, Chinese equities are performing stronger as the economy is reopening after a prolonged Covid-19 lockdown to contain the mess. The administration has decided to ease curbs after a severe protest from the general public as restrictions on the movement of men, materials, and machines didn’t leave sufficient funds to offset payment for perishable goods. This has also resulted in a recovery for economic projections ahead.
On the oil front, oil prices have surrendered the majority of Monday morning gains and have dropped to near $80.60 after a firmer recovery from $79.66. The absence of further production cuts by OPEC+ in its December 4 meeting dented the sentiment of oil bulls. The oil cartel will stick to two million barrels cut per day till November 2023 for now. Also, easing China’s Covid curbs and upbeat US NFP supported oil recovery.
- AUD/USD has been accelerated above 0.6850 amid a cheerful market mood.
- A third consecutive 75 bps rate hike is expected from the RBA.
- Fed’s Evans sees a higher interest rate pace but has favored a deceleration in the interest rate hike pace.
The AUD/USD pair has extended its recovery from 0.6770 to above 0.6850 in the Asian session. The Aussie asset has witnessed stellar buying interest from the market participants as the Reserve Bank of Australia (RBA) is all set to tighten its policy further for bringing price stability.
Apart from the RBA’s monetary policy, a positive market mood has also strengthened the Australian Dollar. A sheer decline in safe-haven’s appeal has dragged the US Dollar Index (DXY) to a fresh five-month low at 104.14. S&P500 futures have turned subdued as Federal Reserve (Fed) policymaker has proposed a higher interest rate peak despite a slowdown in rate pace. This has also brought a significant recovery in the 10-year US Treasury yields to near 3.53%.
Chicago Fed President Charles Evans said on Friday, "We are probably going to have a slightly higher peak to Fed policy rate even as we slow pace of rate hikes," as reported by Reuters.
On the Australian front, RBA Governor Philip Lowe is set to hike its Official Cash rate (OCR) further to trim the inflation rate. In October month, the Australian Consumer Price Index (CPI) dropped to 6.9% after printing a high of 7.3%. Economists at UOB Group cited that “We are penciling in another 25 basis points (bps) hike at the final monetary policy meeting of the year on 6 Dec, which will take the OCR to 3.10%. This would be the third consecutive 25 bps rate hike by the RBA.
Going forward, investors will keep an eye on Australian Gross Domestic Product (GDP) data, which will release on Wednesday. The Australian economy is likely to deliver a decline in the growth rates to 0.7% and 1.8% on a quarter and an annual basis.
- GBP/USD has refreshed its five-month high above 1.2340 and is expected to extend its rally amid risk-on profile.
- After an upbeat US NFP data, a better-than-projected US ISM Services PMI release would trigger negative market impulse.
The GBP/USD pair has shifted its auction profile above the critical hurdle of 1.2300 in the Asian session. The Cable has witnessed significant buying interest from the market participants as the risk-on profile has strengthened further. The major has refreshed its five-month high above 1.2340 and is expected to extend its rally amid significant interest for risk-perceived assets.
The US Dollar Index (DXY) has refreshed its five-month low at 104.14 amid rising odds of a slowdown in current interest rate hike pace by the Federal Reserve (Fed). To reduce financial risks and to observe the outcome of efforts made yet to bringing price stability, the Fed will decelerate its rate expansion pace.
S&P500 futures are displaying a subdued performance as investors have turned precautionary ahead of US ISM Services PMI data. Meanwhile, the 10-year US Treasury yields have jumped to near 3.53%.
The upbeat US Nonfarm Payrolls (NFP) data reported on Friday failed to propel the US Dollar, however, a better-than-projected US ISM Services PMI release could fetch firmer cushion for the same. As per the consensus, the economic data is seen at 55.6 vs. the prior release of 54.4. Apart from that, the catalyst which will impact Cable is the ISM Services New Orders Index data, which is seen higher at 58.5 against the former release of 56.5.
After displaying decent demand for labor by the United States economy, firmer forward demand for services would trigger risk-off mood. Robust demand in the US economy would indicate higher expectations for short-term inflation, which could compel the fed to continue current rate hike pace.
On the UK Front,
Following a meeting where the OPEC and its allies (OPEC+) decided to continue its existing policy, Kuwait's Oil Minister Bader al Mulla said late Sunday that OPEC+'s decisions are based on oil market data and ensure the market's stability.
He added that the impact of slow global economic growth, soaring inflation and high -nterest rates on oil demand are a cause for "continuous caution".
Related reads
- OPEC+ agrees to maintain their current oil-output targets
- WTI jumps firmly above $81.50 amid US Dollar’s weakness and easing China’s Covid curbs
In its latest forecasts on the UK economy, the Confederation of Business Industry (CBI) said on Monday, they see Britain entering a year-long recession in 2023 amid high inflation and falling business investment.
Key takeaways
“Britain is in stagflation - with rocketing inflation, negative growth, falling productivity and business investment. Firms see potential growth opportunities but ... headwinds are causing them to pause investing in 2023.”
“Britain's economy is on course to shrink 0.4% next year, marking a sharp downgrade from its last forecast in June, when it predicted growth of 1.0% for 2023.”
“CBI predicts inflation will be slow to fall, averaging 6.7% next year and 2.9% in 2024.”
“The CBI forecast business investment at the end of 2024 will be 9% below its pre-pandemic level, and output per worker 2% lower.”
Market reaction
GBP/USD is little affected by the CBI’s gloomy economic outlook, trading 0.32% higher on the day at 1.2325.
| Raw materials | Closed | Change, % |
|---|---|---|
| Silver | 23.165 | 1.92 |
| Gold | 1797.7 | -0.25 |
| Palladium | 1883.72 | -2.7 |
- Gold price kicks off the week on a solid footing, as the US Dollar extends weakness.
- China reopening optimism and dovish Fed expectations offset higher US Treasury yields.
- Gold price eyes a fresh upswing toward $1,822 amid a lack of healthy resistance levels.
Gold price is trading close to its best levels in five months above $1,800 at the start of a new week, with risk flows dominating as China expands the covid reopening to Shanghai and Hangzhou. A better risk profile and dovish Federal Reserve expectations continue to remain a weight on the US Dollar, despite a big beat on the US Nonfarm Payrolls data. The US economy added 263,000 jobs in November, better than 200,000 but below 284,000 in October, according to the latest data released last Friday. Following the upbeat US payrolls data, markets appear convinced that the Fed’s dovish pivot could help the economy with a ‘soft landing’. The Fed has entered the ‘blackout period’ and, therefore, all eyes now remain on the US ISM Services PMI and Preliminary UoM Consumer Sentiment data due for release this week for fresh trading impetus in Gold price.
Also read: Gold Price Weekly Forecast: XAU/USD to attract additional buyers above $1,800
Gold Price: Key levels to watch
more to come ...
Here is how it looks on the tool
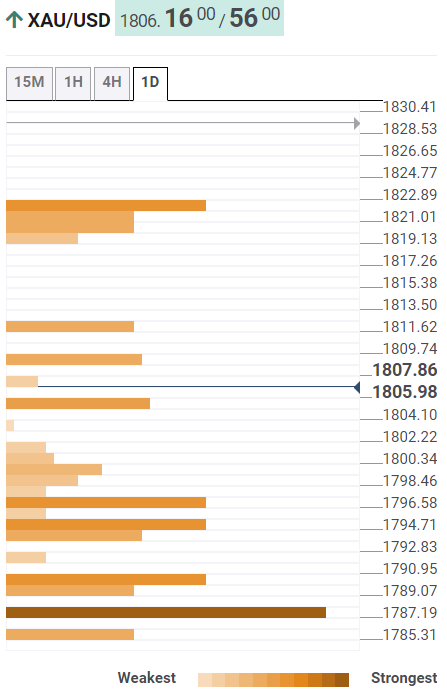
About Technical Confluences Detector
The TCD (Technical Confluences Detector) is a tool to locate and point out those price levels where there is a congestion of indicators, moving averages, Fibonacci levels, Pivot Points, etc. If you are a short-term trader, you will find entry points for counter-trend strategies and hunt a few points at a time. If you are a medium-to-long-term trader, this tool will allow you to know in advance the price levels where a medium-to-long-term trend may stop and rest, where to unwind positions, or where to increase your position size.
- WTI has accelerated to near $81.60 as the Chinese economy is easing Covid-lockdown measures.
- A significant decline in the US Dollar has also strengthened oil prices.
- OPEC+ has not announced fresh supply cuts, continuing current cuts till November 2023.
West Texas Intermediate (WTI), futures on NYMEX, has displayed a stellar rebound to near $81.63 in the Tokyo session as easing lockdown restrictions in China has infused an adrenaline rush into the oil bulls. The oil price has recovered dramatically after correcting to near the round-level support of $80.00.
The responsive buying action in oil prices is backed by easing Covid-19 curbs in China after their severe protest for reopening the economy. This has reaffirmed higher oil demand projections as the reopening of the Chinese economy indicates no restrictions on the movement of men, materials, and machines. Economic activities in the Chinese economy will start gearing up and will cement oil demand in the largest oil-purchasing country.
Also, weakness in the US Dollar Index (DXY) is strengthening the oil prices. The USD Index has refreshed its five-month low below 104.20 as the risk appetite theme has been strengthened by the market participants amid rising expectations for deceleration of the interest rate hike pace by the Federal Reserve (Fed). Apart from that, a solid United States labor market indicates robust demand for oil.
On the supply front, OPEC+ didn’t announce further production cuts in its meeting on December 4 apart from the extension of the prior promise of cutting two million barrels of oil production per day till November 2023. This resulted in a corrective move in the oil prices but a firmer recovery backed by easing zero-Covid policy in China has resumed oil’s upside journey.
- NZD/USD has been inching higher on the charts into daily resistance.
- China data capped the advance in NZD/USD on the release.
- Bears are lurking and eye a correction, but focus is on the greenback.
Following poor China data, NZD/USD is perched at the highs of the bullish cycle following a series of daily bullish closes since mid-November. The price has rallied to a high of 0.6417 following a move towards the August 0.6468 high. The US Dollar has been the driver with a switch in sentiment that has been supportive of risk appetite and the high beta complex.
Reuters reported that China's services activity shrank to six-month lows in November as widening COVID containment measures weighed on demand and operations, a private-sector business survey showed on Monday, pointing to a further hit to economic growth. The Caixin/S&P Global services purchasing managers' index (PMI) fell to 46.7 from 48.4, marking the third monthly contraction in a row. The 50-point index mark separates growth from contraction on a monthly basis.
Meanwhile, a surprisingly strong US jobs report weighed on the greenback and fell to test the 104.50s. Even though the US Nonfarm Payrolls data showed that stronger-than-expected hiring reflected the tightness of the labour market, investors faded the US dollar as Fed officials spoke dovish on the outlook. Average hourly earnings arrived at 0.6%, well above expectations for a 0.3% gain, and the participation rate also declined to 62.1%.
Analysts at ANZ bank explained that ''we start the week with the USD on its knees despite data suggesting that even if the Fed hike by ‘only’ 50bp next week (not a small hike; just not a gigantic one!) they may lift their terminal rate projection above 5%. If that occurs, the question we’re pondering is; how will the USD fare? We may be shaping up for an epic battle between the “recessionists” and the “rate-watchers”, all of which portends USD volatility.''
The analysts see NZD fair value at ~0.65; ''that suggests it can maintain its strength, but it may be a bumpy ride. The next major technical target is 0.6450 (the Aug high).''
NZD/USD technical analysis
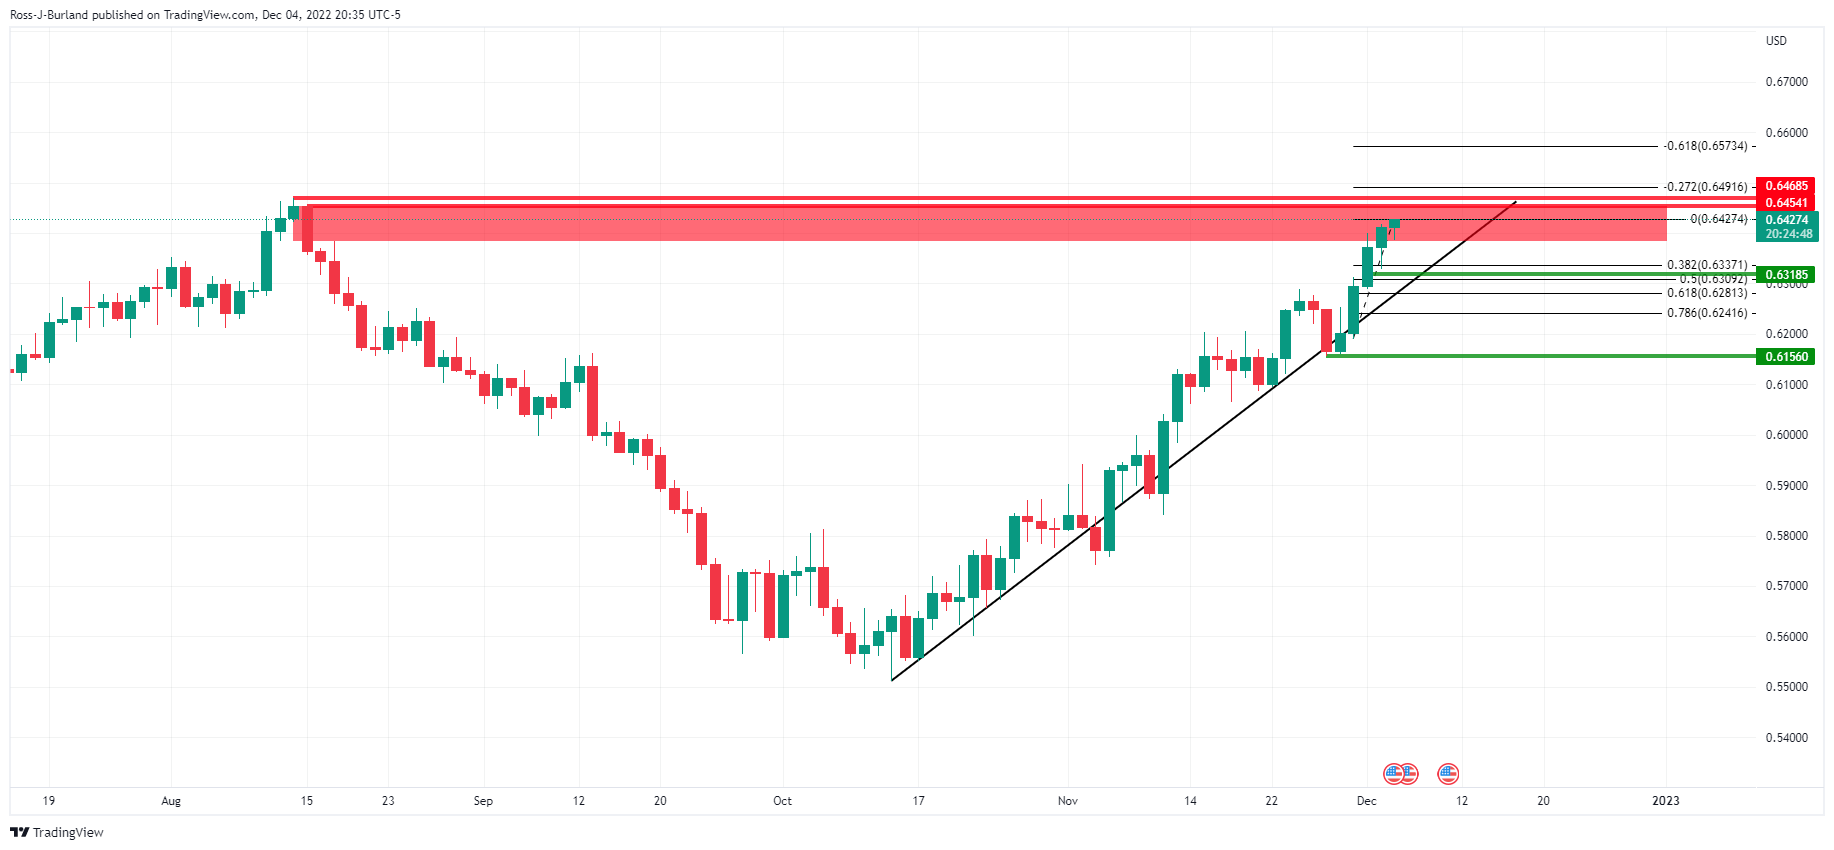
The NZD is riding the dynamic support into resistance but a correction could be on the cards. The Fibonacci scale sees the prospects of a move towards the 61.8% ratio near 0.6281.
Reuters reports that China's services activity shrank to six-month lows in November as widening COVID containment measures weighed on demand and operations, a private-sector business survey showed on Monday, pointing to a further hit to economic growth.
The Caixin/S&P Global services purchasing managers' index (PMI) fell to 46.7 from 48.4, marking the third monthly contraction in a row. The 50-point index mark separates growth from contraction on a monthly basis.
AUD/USD update
AUD/USD has been firm in the open and continues to print fresh bull cycle highs, testing towards 0.6850. On the daily time frame, however, support is expected in the 50% mean reversion area and lower quarter of the 0.6700s. This could be targeted in the days ahead if the bulls throw in the towel. Should the supporting trendline be broken, a move below 0.6640/50 could be a significant bearish development ahead of the critical remaining calendar events for the year that include the Reserve Bank of Australia and the Federal Reserve. On the flip side, a continuation opens risk towards September highs near 0.6920.
About the Caixan Services PMI
The Caixin Services PMI™, released by Markit Economics, is based on data compiled from monthly replies to questionnaires sent to purchasing executives in over 400 private service sector companies. The panel has been carefully selected to accurately replicate the true structure of the services economy.
- EUR/USD has refreshed a five-month high above 1.0550 on positive market sentiment.
- A breakout of the neutral channel has exposed the pair for a fresh upside.
- The RSI (14) is aiming to shift into the bullish range of 60.00-80.00 for sheer bullish momentum.
The EUR/USD pair has refreshed its five-month high at 1.0549 in the Asian session. The major currency pair has witnessed a juggernaut rally after a responsive buying action below 1.0440 on Friday. The US Dollar has witnessed immense pressure amid the risk appetite theme and is an inch far from testing the previous week’s low around 104.38.
Meanwhile, S&P500 is displaying a subdued performance ahead of US Services PMI data. The 10-year US Treasury yields have recovered to near 3.53% portraying a cautious mood despite improvement in risk-sensitive assets.
The EUR/USD pair has shifted its business above the psychological resistance of 1.0500 after a breakout of the neutral channel formation on an hourly scale. The breakout of the aforementioned chart pattern indicates more upside ahead.
The 20-and 50-period Exponential Moving Averages (EMAs) at 1.0526 and 1.0494 respectively are aiming higher, which adds to the upside filters.
Meanwhile, the Relative Strength Index (RSI) (14) is attempting to shift into the bullish range of 60.00-80.00, which indicates more upside ahead.
Going forward, a break above a fresh five-month high at 1.0552 will drive the major currency pair toward the round-level resistance at 1.0600, followed by May 5 high at 1.0642.
On the flip side, a drop below Friday’s low at 1.0429 will drag the major currency pair toward December 1 low at 1.0393. A slippage below the latter will drag the asset toward November 30 low at 1.0290.
EUR/USD hourly chart
-638058010697245546.png)
In recent trade today, the People’s Bank of China (PBOC) set the yuan (CNY) at 7.0384 vs the last close of 7.0500.
About the fix
China maintains strict control of the yuan’s rate on the mainland.
The onshore yuan (CNY) differs from the offshore one (CNH) in trading restrictions, this last one is not as tightly controlled.
Each morning, the People’s Bank of China (PBOC) sets a so-called daily midpoint fix, based on the yuan’s previous day's closing level and quotations taken from the inter-bank dealer.
- AUD/USD has advanced firmly to near 0.6820 as the focus has shifted to RBA monetary policy.
- The RBA is expected to hike its interest rates by 25 bps consecutively for the third time.
- Solid US NFP failed to infuse fresh blood into the US Dollar.
The AUD/USD pair has witnessed a sharp recovery in the Tokyo session after a corrective move below 0.6780. The Aussie asset has accelerated to near 0.6820 and is expected to extend its gains toward the previous week’s high around 0.6845 amid the risk appetite profile.
Meanwhile, the US Dollar Index (DXY) has turned sideways marginally above Friday’s low around 104.40 as positive market sentiment has trimmed safe-haven’s appeal. The upbeat United States Nonfarm Payrolls (NFP) has failed to fetch ground for the US Dollar. In November, the US economy added fresh 263K jobs vs. the prior release of 200K. Also, the labor cost index has improved to 5.1% on an annual basis.
A solid labor market along with escalating wages indicates a further increment in inflationary pressures as households carries higher funds for disposal. This may accelerate demand for perishable and durable goods, which could keep price growth active.
On the antipodean front, investors are awaiting an interest rate decision by the Reserve Bank of Australia (RBA), which will be announced on Tuesday. Economists at UOB Group cited that “We are penciling in another 25 basis points (bps) hike at the final monetary policy meeting of the year on 6 Dec, which will take the OCR to 3.10%.
It is worth noting that this could be the third consecutive 25 bps rate hike by RBA Governor Philip Lowe. The monthly Consumer Price Index (CPI) dropped to 6.9% in October against the prior release of 7.3%. Still, the inflation rate is significantly far from the targeted rate of 2%, which compels for the continuation of policy tightening.
Apart from that, investors will keep an eye on Caixin Service PMI data. The economic data is seen marginally higher at 48.8 vs. the former release of 48.4.
- US Dollar bears eye a break below daily support.
- Bulls could be attracted which could open risk towards 105.50 or a 50% mean reversion near 105.75.
The US dollar fell on Friday despite a surprisingly strong jobs report and fell to test the 104.50s where the price is consolidating in the Tokyo open. Even though the Nonfarm Payrolls data showed that stronger-than-expected hiring reflected the tightness of the labour market, investors faded the US dollar as Fed officials spoke dovish on the outlook.
Average hourly earnings arrived at 0.6%, well above expectations for a 0.3% gain, and the participation rate also declined to 62.1%.
Nevertheless, following a strong move by the US dollar bulls, Chicago Fed President Charles Evans made dovish comments that put an end to the rally in the greenback. The central banker said that the pace of increases is likely to slow and added that the Fed will likely need to raise borrowing costs to a "slightly higher" peak than envisioned in forecasts from September. The comments turned sentiment although, as analysts at ANZ Bank argued, ''the data were a well-timed reminder that the path to lower inflation is going to be hard fought.''
Meanwhile, analysts at TD Securities argued, that the jobs data should help to stem some of the USD's bleeding, but suggested a reversal is unlikely to materialize. ''We think the USD positioning squeeze is advanced but a reassessment is unlikely to occur until US CPI and the December Fed.''
US Dollar daily chart
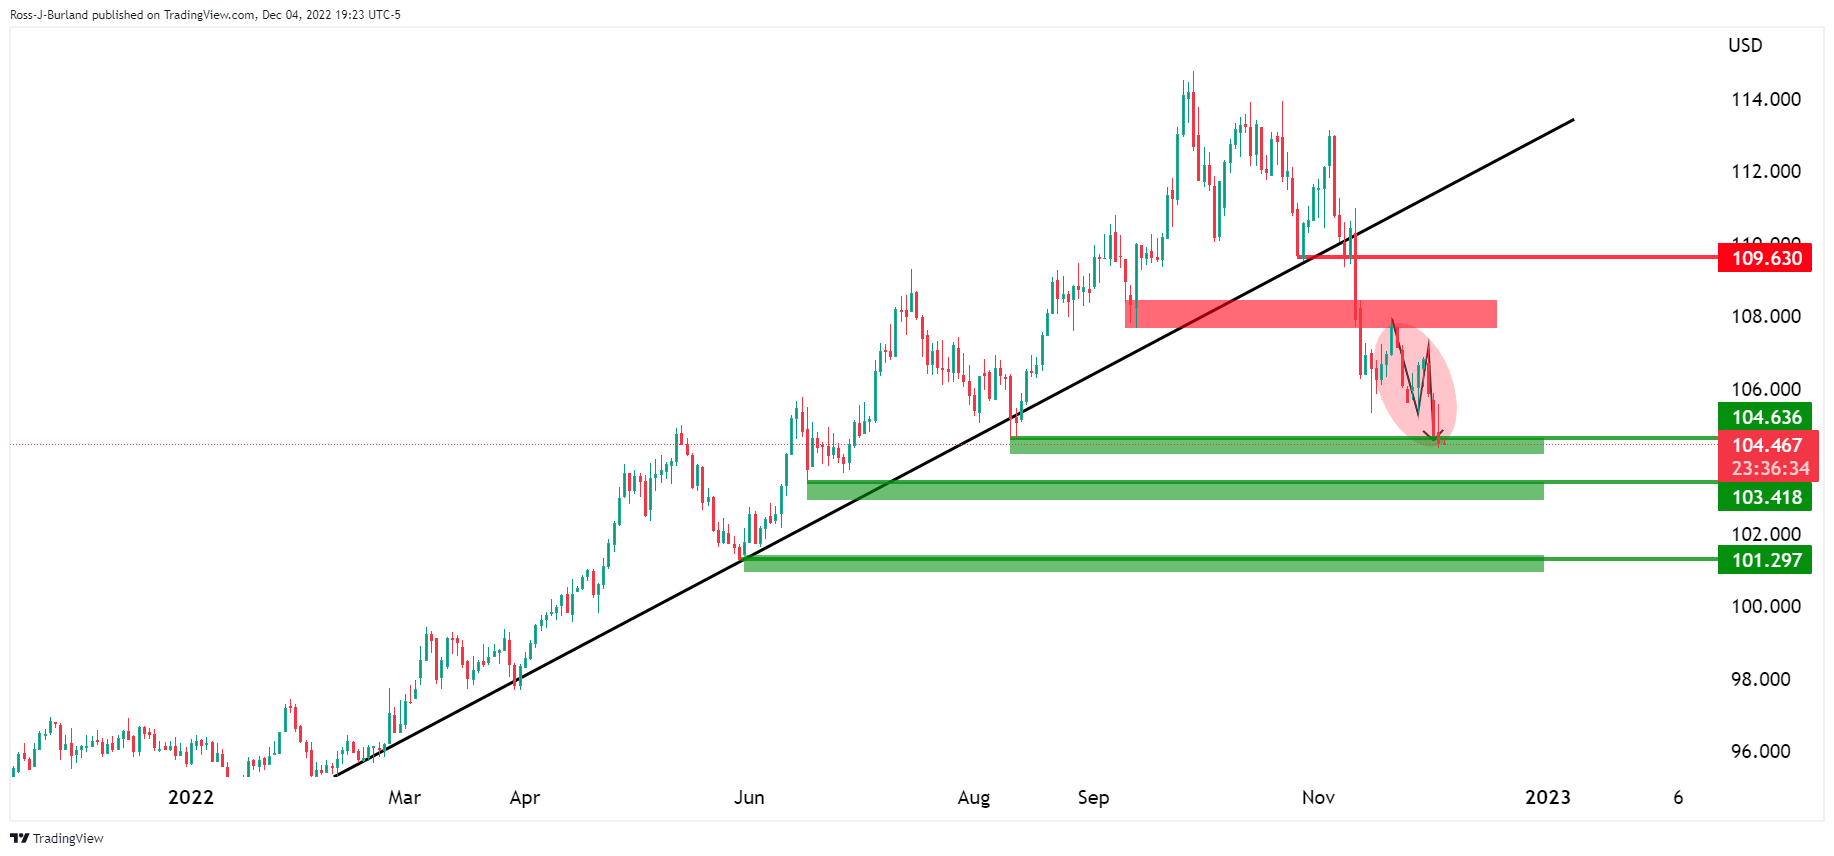
As seen, the price is sandwiched between support and resistance following the break below the daily trendline support.
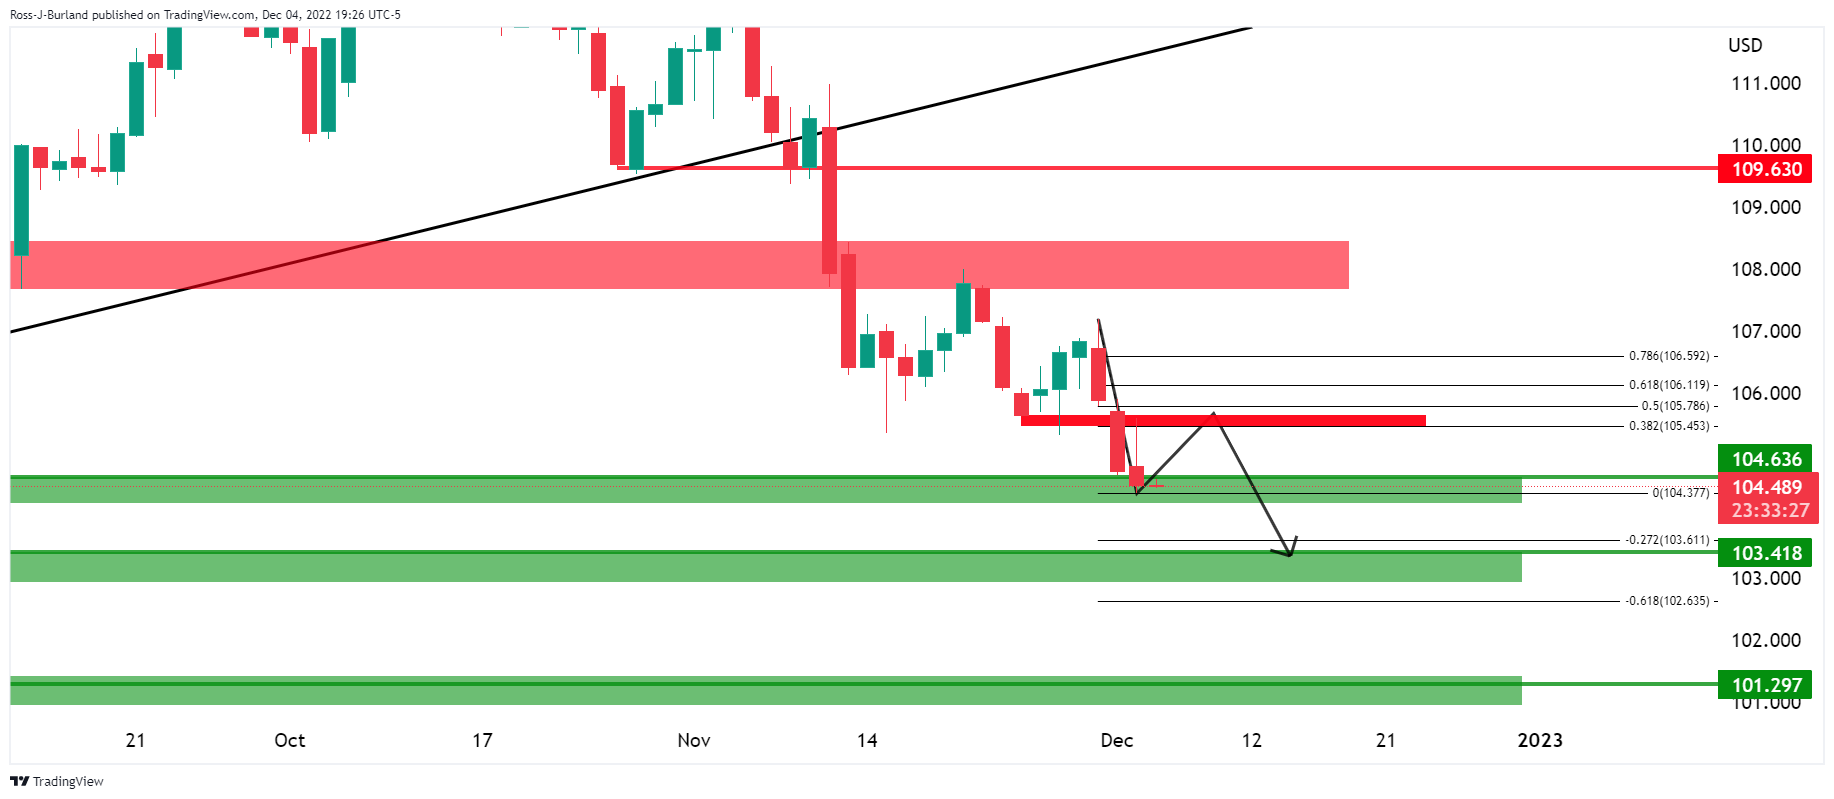
A break below support is needed to avoid a correction into the prior lows near 105.50 or a 50% mean reversion towards 105.75. Should these areas hold on a retest, there will be prospects of a downside continuation towards 1.0350 and the figure.
- USD/JPY is likely to drag to near 134.00 as investors have turned precautionary ahead of US Services PMI data.
- Fed’s Evans has favored a higher interest rate peak despite a slowdown in the rate hike pace.
- An upbeat US Services New Orders Index data could propel short-term inflation expectations.
The USD/JPY pair has attempted a break above the immediate hurdle of 134.50 in the Tokyo session. The asset is expected to remain on the tenterhooks as investors are awaiting United States Services PMI data for fresh impetus. The risk profile is still optimistic as Federal Reserve (Fed) policymakers don’t call for the continuation of the current interest rate hike pace.
Chicago Fed President Charles Evans said on Friday, "We are probably going to have a slightly higher peak to Fed policy rate even as we slow pace of rate hikes," as reported by Reuters.
The US Dollar Index (DXY) is hovering around its immediate support of 104.50 and is looking to test Friday’s low around 104.40. The risk appetite theme is likely to keep hammering the US Dollar bulls amid a significant decline in safe-haven’s appeal.
Meanwhile, 10-year US Treasury yields have rebounded after dropping below 3.50% in the Asian session as the market mood is turning precautionary ahead of the US Services PMI data. As per the projections, the economic data is seen at 55.6 lower than the prior release of 54.4.
In the US Services PMI gamut, the New Orders Index is seen solid at 58.5 against the former release of 56.5. This indicates robust demand ahead, which could de-anchored short-term inflation expectations and henceforth, ruin the risk-on profile.
On the Tokyo front, Bank of Japan (BOJ) Governor Haruhiko Kuroda highlighted the risk of a slowdown in inflation from CY2023. This may propel the BOJ to continue with policy easing in order to keep inflation near the targeted rate of 2%. Going forward, the Overall Household Spending data will be of utmost importance. The economic data is expected to improve to 3.4% from the prior release of 2.3% on an annual basis.
| Index | Change, points | Closed | Change, % |
|---|---|---|---|
| NIKKEI 225 | -448.18 | 27777.9 | -1.59 |
| Hang Seng | -61.09 | 18675.35 | -0.33 |
| KOSPI | -45.51 | 2434.33 | -1.84 |
| ASX 200 | -52.9 | 7301.5 | -0.72 |
| FTSE 100 | -2.3 | 7556.2 | -0.03 |
| DAX | 39.09 | 14529.39 | 0.27 |
| CAC 40 | -11.72 | 6742.25 | -0.17 |
| Dow Jones | 34.87 | 34429.88 | 0.1 |
| S&P 500 | -4.87 | 4071.7 | -0.12 |
| NASDAQ Composite | -20.95 | 11461.5 | -0.18 |
| Pare | Closed | Change, % |
|---|---|---|
| AUDUSD | 0.68055 | -0.07 |
| EURJPY | 141.463 | -0.53 |
| EURUSD | 1.05327 | 0.16 |
| GBPJPY | 164.925 | -0.5 |
| GBPUSD | 1.22794 | 0.22 |
| NZDUSD | 0.64076 | 0.73 |
| USDCAD | 1.34702 | 0.31 |
| USDCHF | 0.93756 | 0.11 |
| USDJPY | 134.31 | -0.72 |


© 2000-2026. All rights reserved.
This site is managed by Teletrade D.J. LLC 2351 LLC 2022 (Euro House, Richmond Hill Road, Kingstown, VC0100, St. Vincent and the Grenadines).
The information on this website is for informational purposes only and does not constitute any investment advice.
The company does not serve or provide services to customers who are residents of the US, Canada, Iran, The Democratic People's Republic of Korea, Yemen and FATF blacklisted countries.
Making transactions on financial markets with marginal financial instruments opens up wide possibilities and allows investors who are willing to take risks to earn high profits, carrying a potentially high risk of losses at the same time. Therefore you should responsibly approach the issue of choosing the appropriate investment strategy, taking the available resources into account, before starting trading.
Use of the information: full or partial use of materials from this website must always be referenced to TeleTrade as the source of information. Use of the materials on the Internet must be accompanied by a hyperlink to teletrade.org. Automatic import of materials and information from this website is prohibited.
Please contact our PR department if you have any questions or need assistance at pr@teletrade.global.
transfers