- Analytics
- News and Tools
- Market News
CFD Markets News and Forecasts — 01-12-2022
- USD/CAD struggles for clear directions after two-day downtrend.
- 100-HMA approaches 50-HMA from below, suggesting short-term downside.
- Four-day-old resistance line adds to the upside filters.
- Bears need validation from a two-week-old ascending support line.
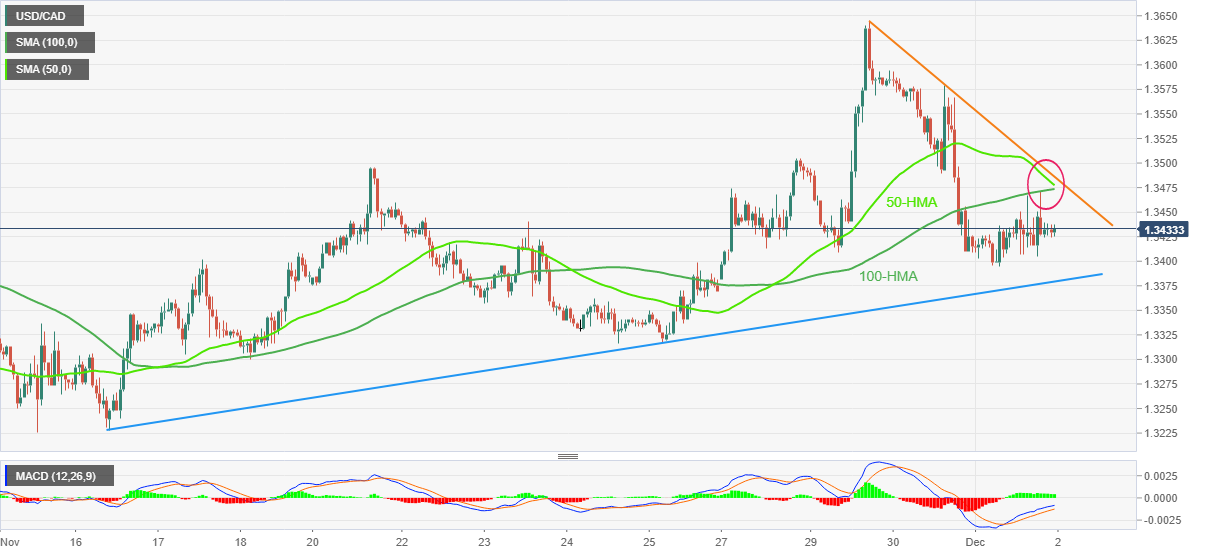
USD/CAD treads water around 1.3430 during the early Friday in Asia, following a two-day losing streak. The Loonie pair’s latest inaction could be linked to the trader’s cautious mood ahead of the key employment data from the US and Canada.
Even so, a looming bear cross between the 100-HMA and 50-HMA keeps the USD/CAD sellers hopeful. It’s worth noting that the 100-HMA has to successfully pierce the 50-HMA to confirm the bearish bias.
That said, the bullish MACD signals challenge the quote’s downside after the latest fall, which in turn suggests a corrective bounce toward the HMA convergence area near 1.3475.
Also acting as an upside filter is a downward-sloping resistance line from Tuesday, close to 1.3490, as well as the 1.3500 threshold.
Hence, the USD/CAD pair remains on the bear’s radar unless crossing the 1.3500 mark, a break of which could direct the buyers toward the weekly top surrounding 1.3645.
On the flip side, an ascending trend line from November 16, close to 1.3380 at the latest, restricts the short-term downside of the Loonie pair.
Following that, the 1.3315 level may probe the USD/CAD bears before directing them to the monthly low near 1.3225.
USD/CAD: Hourly chart
Trend: Further downside expected
- Gold price grind near the key hurdle after refreshing four-month high.
- Hopes of slower Federal Reserve rate hikes drowned the United States Treasury bond yields, US Dollar and favored XAU/USD.
- Optimism surrounding China also allowed Gold buyers to keep the reins.
- United States Nonfarm Payrolls will be crucial amid talks of Fed’s 50 bps rate hike in December.
Gold price (XAU/USD) refreshed a four-month high above $1,800 before taking rounds to $1,805-07 during early Friday morning in Asia. In doing so, the yellow metal portrays the market’s cautious mood ahead of the key catalysts. Also likely to have probed the Gold buyers could be the recently mixed updates from the Fed, as well as the data from the United States.
Dovish Federal Reserve drowns the United States Treasury bond yields, US Dollar and Gold Price
The dovish bias of the Federal Reserve (Fed) Chairman Jerome Powell, as well as downbeat comments from US Treasury Secretary Janet Yellen, initially raised hopes of easy rate hikes.
Recently, Federal Reserve (Fed) Governor Michelle Bowman stated that (It is) appropriate for us to slow the pace of increases. Before him, Fed Governor Jerome Powell also teased the slowing of a rate hike while US Treasury Secretary Yellen also advocated for a soft landing. Further, Vice Chair of supervision, Michael Barr, also said, “We may shift to a slower pace of rate increases at the next meeting.” It’s worth noting that the recent comments from New York Fed’s John Williams seemed to have tested the US Dollar bears as the policymakers stated that the Fed has a ways to go with rate rises.
The comments favoring a 50 bps Fed rate hike in December allowed the US Treasury bond yields to refresh a four-month low amid receding market pessimism and a rush toward the riskier assets.
It’s worth noting, however, that the Bank of Japan’s (BOJ) hints of adjusting the easy money policies seemed to have challenged the bond yields of late amid fears of less demand from the biggest customer in Asia.
That said, the benchmark US 10-year Treasury bond yields slumped to 3.50% while the two-year counterpart printed 4.23% while poking the lowest levels since October by the press time.
With this, US Dollar Index (DXY) slumped to the lowest levels in four months, pressured around 104.70 at the latest.
China’s Covid conditions, mostly downbeat United States data also weigh on XAU/USD
The consecutive three days of the downtrend of Chinese daily Covid infections from a record high allowed the policymakers to tease the “next stage” in battling the virus while announcing multiple easing of the activity-control measures.
Elsewhere, US Core Personal Consumption Expenditures (PCE) Price Index, the Federal Reserve’s preferred inflation gauge, matched 5.0% market forecasts on YoY but eased to 0.2% MoM versus 0.3% expected. Further, US ISM Manufacturing PMI for November eased to 49.0 versus 49.7 expected and 50.2 prior.
US Nonfarm Payrolls are the key for Gold buyers
While the aforementioned catalysts are well in place to weigh on the Gold price, it’s the market’s anxiety ahead of the US employment report for November that probes XAU/USD bulls of late, especially when the Fed is dovish.
Forecasts suggest that the headlines Nonfarm Payrolls (NFP) is likely to ease with a 200K print versus 261K prior while the Unemployment Rate could remain unchanged at 3.7%. It should be noted that a likely easing in the Average Hourly Earnings for the stated month could also weigh on the Gold price.
Hence, a downbeat US jobs report may allow the XAU/USD buyers to keep the reins. However, the historical analysis suggests fading of NFP-led moves within four hours and hence any surprises might not harm the latest moves of the yellow metal.
Also read: US November Nonfarm Payrolls Preview: Analyzing gold's reaction to NFP surprises
Gold price technical analysis
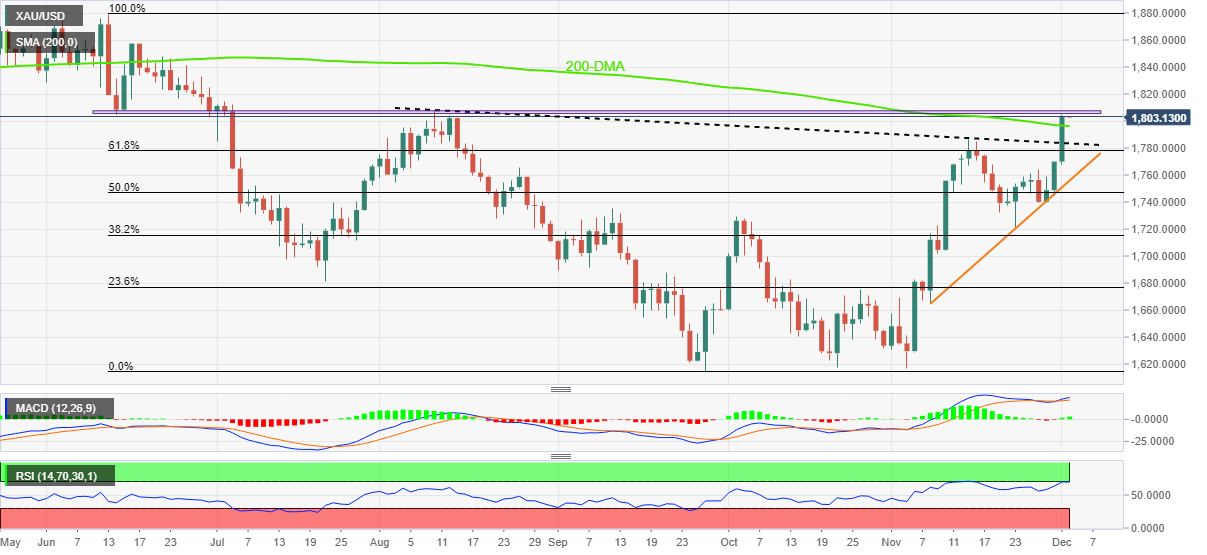
Gold buyers take a breather at the highest levels since early August amid the overbought conditions of the Relative Strength Index (RSI) line, placed at 14. Also challenging the metal buyers is the horizontal area surrounding $1,805-07 comprising multiple levels marked since mid-June.
That said, the Moving Average Convergence and Divergence (MACD) indicator’s bullish signals join the previous day’s upside break of the 200-Day Moving Average (DMA) and a downward-sloping trend line from August to keep the Gold price on the bull’s radar.
Hence, a clear upside break of the $1,807 appears necessary for the bullion to let the buyers sit in the driver’s seat. Following that, a run-up toward a mid-June high of $1,858 and then to June’s peak surrounding $1,880 can’t be ruled out.
Alternatively, pullback moves remain elusive unless the quote stays beyond the 200-DMA level near $1,796, a break of which could quickly drag the Gold price towards the resistance-turned-support line from early August, close to $1,782 at the latest.
In a case where the XAU/USD remains weak past $1,782, a one-month-old ascending support line near $1,758 will be crucial for the Gold traders to watch as it holds the key to the bear’s entry.
Gold price: Daily chart
Trend: Further upside expected
- Risk aversion weighed on the Australian Dollar, bolstering the safe-haven status of the Japanese Yen.
- AUD/JPY Price Analysis: Break below the 200-day EMA to exacerbate a fall towards 90.00.
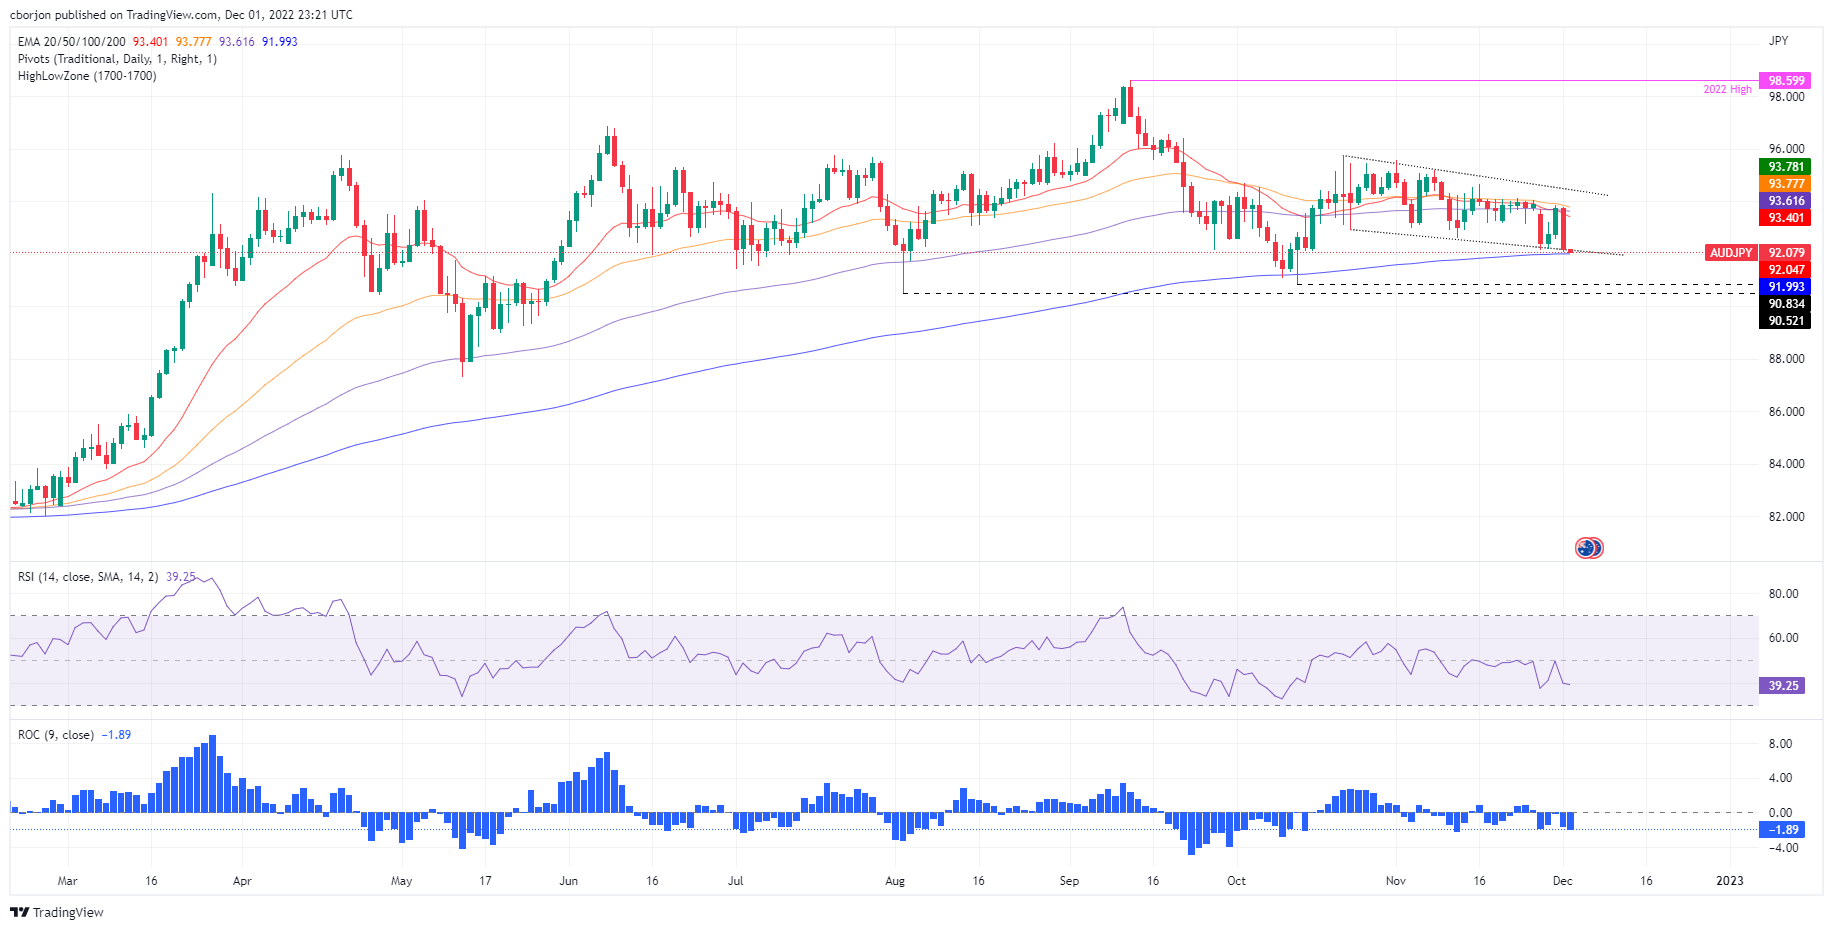
The Australian Dollar (AUD) losses ground against the Japanese Yen (JPY) amid a risk-off impulse as the prospects for a recession in the United States (US) increased, blamed on a worst-than-expected US ISM PMI, and flashed manufacturing activity is deteriorating. At the time of writing, the AUD/JPY is trading at 92.16.
AUD/JPY Price Analysis: Technical outlook
The AUD/JPY daily chart portrays the pair trading within a descending channel, with the 20, 50, and 100-day Exponential Moving Averages (EMAs) sitting above the exchange rate, further confirming the downtrend. Additionally, the AUD/JPY Thursday close below the former weekly low of 92.14, has paved the way for additional losses.
Oscillators with the Relative Strength Index (RSI) at bearish territory, and the 9-day Rate of Change (RoC) aiming downwards, suggests bears are gathering momentum. Therefore, the AUD/JPY path of least resistance is downwards.
The AUD/JPY key support levels are the 200-day EMA at 91.99, followed by the October 13 swing low of 90.83, followed by the August 2 pivot low of 90.52, ahead of the 90.00 figure.
As an alternate scenario, the AUD/JPY first resistance would be the 93.00 figure. Break above will open the AUD/JPY path to the confluence of the 20 and 100-day EMA at 93.40/60, ahead of the 50-day EMA at 93.78
AUD/JPY Key Technical Levels
- EUR/USD remains sidelined after refreshing multi-day high, probes three-day uptrend.
- Hopes of slower Fed rate hike drowned the US Treasury bond yields, US Dollar.
- Mixed data from Eurozone, United States, failed to tame the bulls.
- ECB’s Lagarde should remain hawkish to defend buyers, US NFP may print softer outcome for November.
EUR/USD cheered the broad-based US Dollar weakness to march towards the highest levels since late June, before recently taking rounds to 1.0520-30 during the generally quiet early Asian session. It’s worth noting that the cautious mood ahead of the speech from European Central Bank (ECB) President Christine Lagarde and monthly employment data from the United States seems to probe the pair buyers of late.
Even so, dovish bias about the Federal Reserve’s (Fed) next move joins optimism surrounding China’s Covid conditions and record Unemployment Rate from Eurozone seemed to have drowned the EUR/USD prices.
Having witnessed comments favoring easy rate hikes from the Fed and safe passage for the soft landing, the second-tier Fed officials also confirmed the need to go slow on the rates during their latest speeches.
Recently, Federal Reserve (Fed) Governor Michelle Bowman stated that (It is) appropriate for us to slow the pace of increases. Before him, Fed Governor Jerome Powell also teased the slowing of a rate hike while US Treasury Secretary Yellen also advocated for a soft landing. Further, Vice Chair of supervision, Michael Barr, also said, “We may shift to a slower pace of rate increases at the next meeting.”
It’s worth noting that the recent comments from New York Fed’s John Williams seemed to have tested the US Dollar bears as the policymakers stated that the Fed has a ways to go with rate rises.
Elsewhere, the consecutive three days of the downtrend of Chinese daily Covid infections from a record high allowed the policymakers to tease the “next stage” in battling the virus while announcing multiple easing of the activity-control measures.
Talking about the data, US Core Personal Consumption Expenditures (PCE) Price Index, the Federal Reserve’s preferred inflation gauge, matched 5.0% market forecasts on YoY but eased to 0.2% MoM versus 0.3% expected. Further, US ISM Manufacturing PMI for November eased to 49.0 versus 49.7 expected and 50.2 prior.
At home, Eurozone Unemployment Rate refreshed a record low of 6.5% in October versus 6.6% expected and prior while the final prints of November’s S&P Global/CIPS Manufacturing PMI dropped to 47.1 versus 47.3 initial forecast. Further, Germany’s Retail Sales growth shrank by 5.0% YoY in October, the biggest drop since June, versus -2.8% expected and -0.9% previous readings. Also, the final prints of German S&P Global/CIPS Manufacturing PMI for November declined to 46.2 compared to 46.7 flash estimations.
Against this backdrop, Wall Street closed mixed but the US 10-year Treasury bond yields plummeted to a four-month low, which in turn drowned the US Dollar Index, pressured around 104.70 by the press time.
Looking forward, likely hawkish comments from ECB President Lagarde during a panel discussion on growth and inflation at the Bank of Thailand might help the EUR/USD to remain firmer. However, the anxiety ahead of the US Nonfarm Payrolls (NFP), expected to ease to 200K versus 261K prior, might restrict the pair’s immediate moves.
Also: Nonfarm Payrolls Preview: Dollar selling opportunity? Low expectations to trigger temporary bounce
Technical analysis
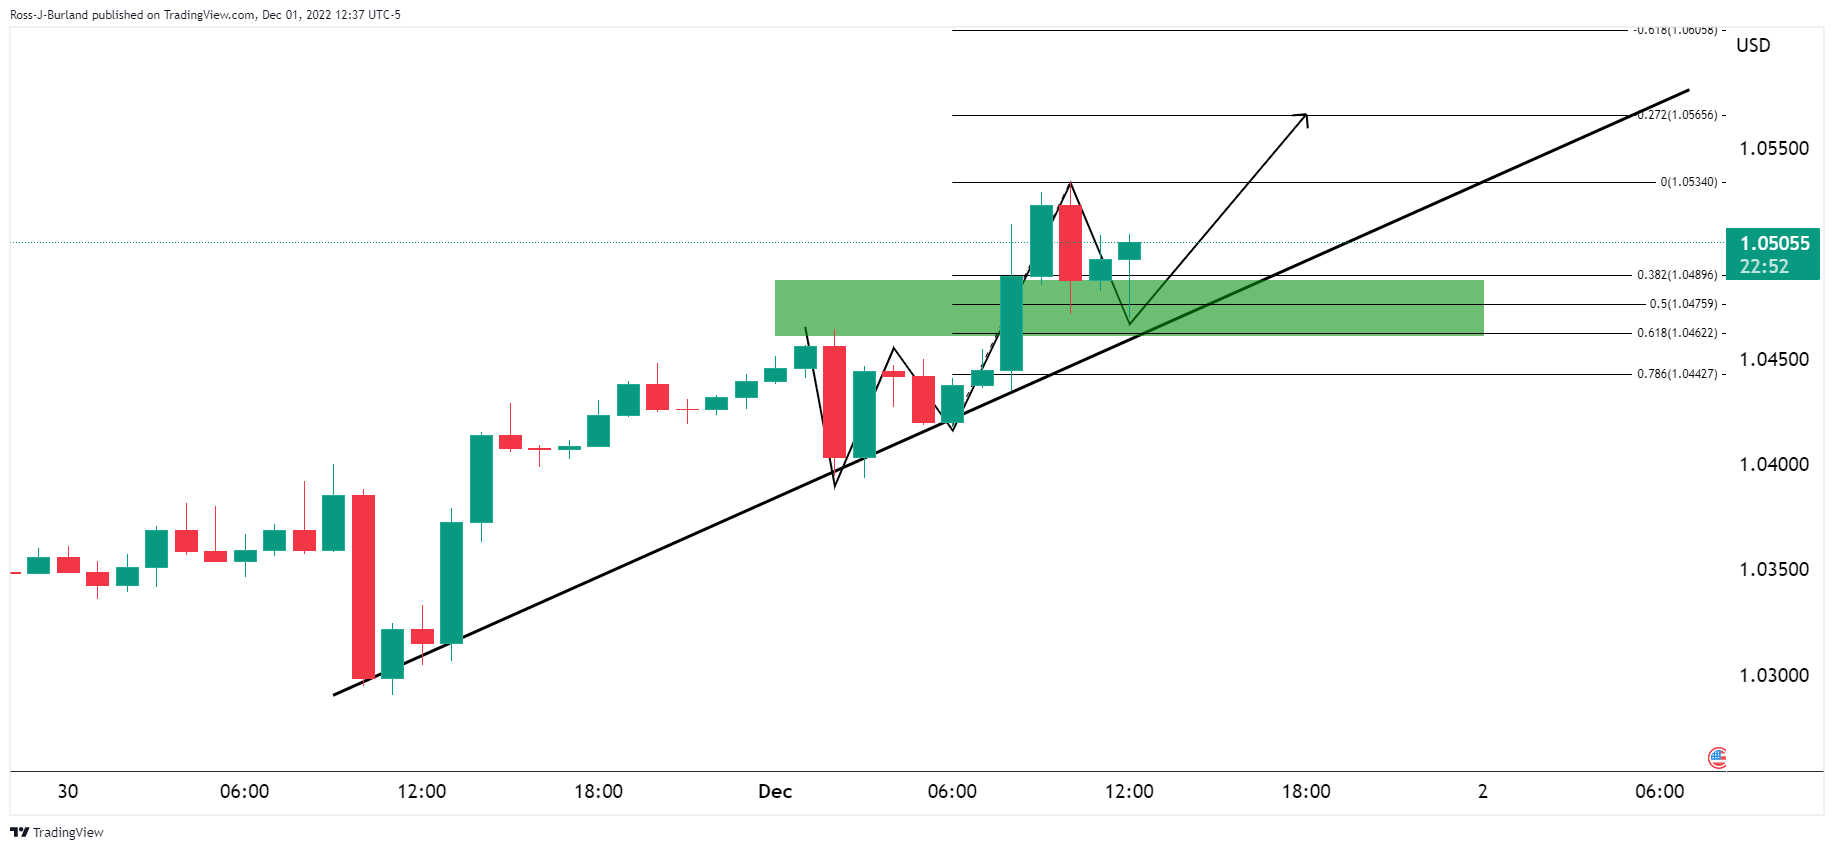
A clear upside break of the four-month-old ascending resistance line, now support near 1.0500, keeps EUR/USD bulls hopeful of poking the late June swing high near 1.0615.
Early Friday morning in Asia, Reuters quoted an Official from the Group of Seven Nations (G7) Price Cap Coalition to convey the update over the Russian Oil export price cap.
Key comments
Expected agreement calls for maintaining price cap at 5% below market price for Russian crude.
There is some discretion, flexibility in determining market price for Russian crude for price cap.
Oil markets seem pretty comfortable with cap mechanism on Russian Oil prices.
Not sure how Russia will react to $60 price cap but Russia has no good options.
Price cap will limit Russia's ability to fight the war against Ukraine.
Price caps will be adjusted on a range of considerations including market prices, could go up or down.
Optimistic about agreeing on refined products price cap by February 5.
Oil buyers take a breather, for now
The news is yet to shake the WTI crude oil prices as the quote seesaws near $81.35 after rising to the fresh high in two weeks the previous day.
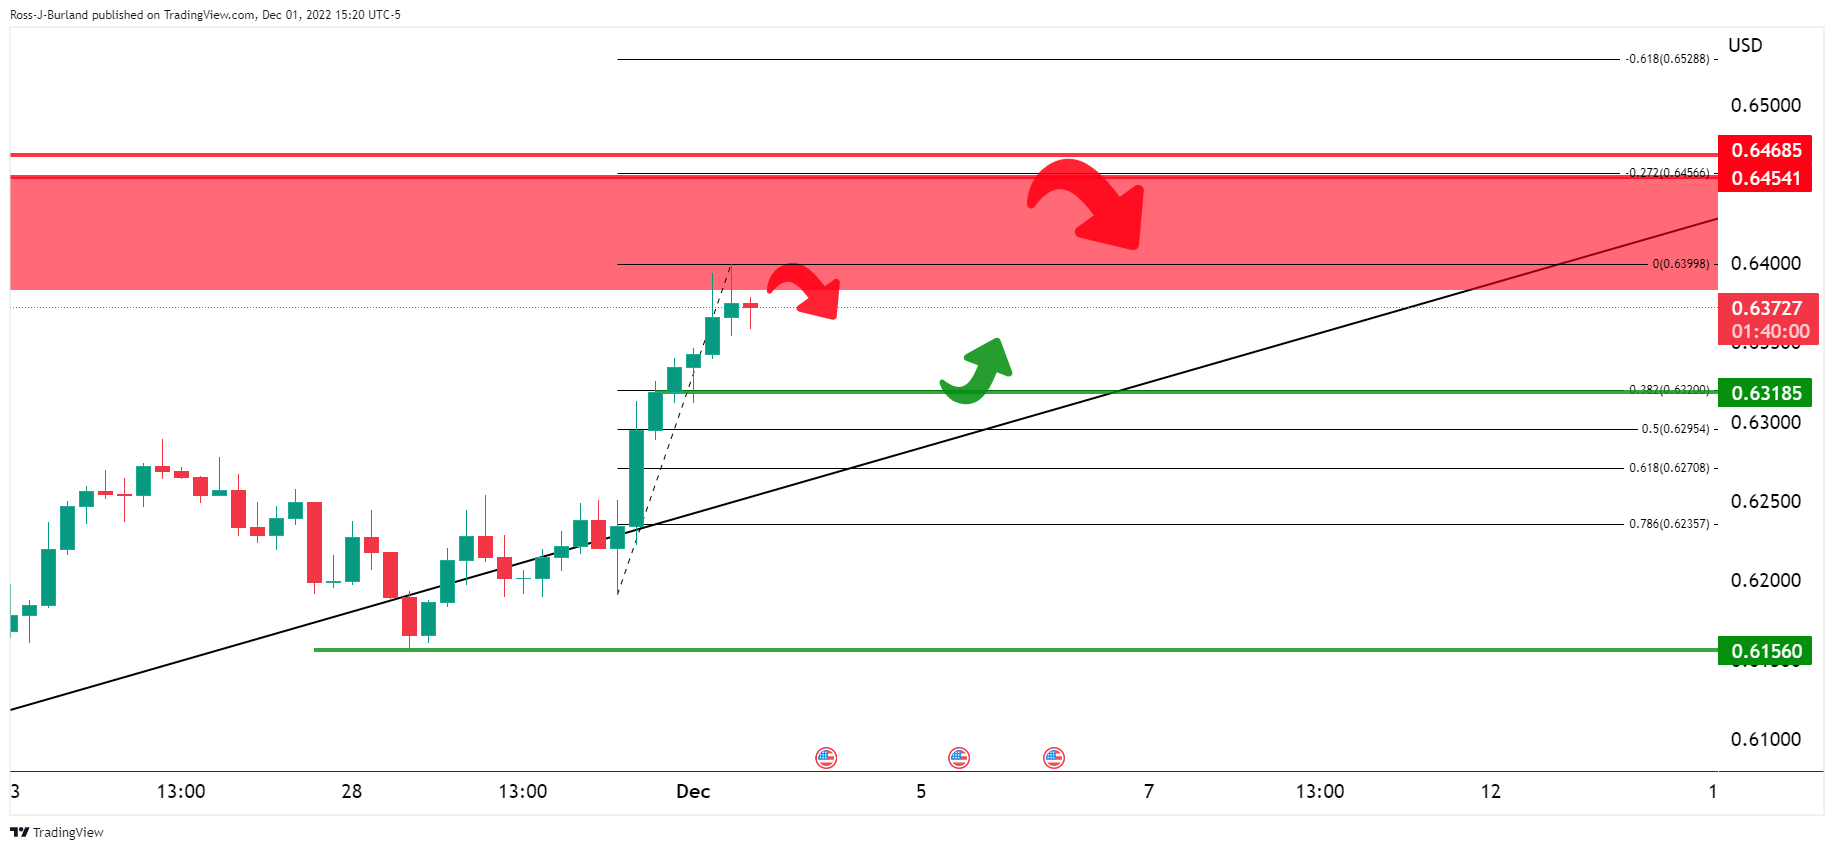
- AUD/USD grinds at the highest levels in 11 weeks after refreshing the top.
- Dovish Fed, China-linked optimism and downbeat US data weighed on the US Dollar.
- Mixed performance of equities, Aussie data probed bulls ahead of the key catalysts.
- Likely dovish tone from RBA’s Lowe, softer US jobs report may favor bulls.
AUD/USD portrays the typical pre-data/event anxiety as it seesaws near 0.6800 during the early Asian session on Friday, after refreshing the 11-week high the previous day. That said, the Aussie pair rose during the last three consecutive days amid broad US Dollar weakness and the market’s optimism surrounding China’s Covid conditions, adding strength to the run-up could be the downbeat US data.
US Dollar Index (DXY) slumped to the lowest levels in four months, pressured around 104.70 by the press time, as the dovish bias of the Federal Reserve (Fed) policymakers, as well as downbeat comments from US Treasury Secretary Janet Yellen, raised hopes of easy rate hikes.
Recently, Federal Reserve (Fed) Governor Michelle Bowman stated that (It is) appropriate for us to slow the pace of increases. Before him, Fed Governor Jerome Powell also teased the slowing of a rate hike while US Treasury Secretary Yellen also advocated for a soft landing. Further, Vice Chair of supervision, Michael Barr, also said, “We may shift to a slower pace of rate increases at the next meeting.” It’s worth noting that the recent comments from New York Fed’s John Williams seemed to have tested the US Dollar bears as the policymakers stated that the Fed has a ways to go with rate rises.
Not only the Fedspeak but the mostly downbeat US data also drowned the US Dollar. That said, the US Core Personal Consumption Expenditures (PCE) Price Index, the Federal Reserve’s preferred inflation gauge, matched 5.0% market forecasts on YoY but eased to 0.2% MoM versus 0.3% expected. Further, US ISM Manufacturing PMI for November eased to 49.0 versus 49.7 expected and 50.2 prior.
Furthermore, the consecutive three days of the downtrend of Chinese daily Covid infections from the record high allowed the policymakers to tease the “next stage” in battling the virus while announcing multiple easing of the activity-control measures. Given the Aussie-China ties, positives for Beijing often get cheered by the AUD/USD buyers.
At home, Australia’s Private Capital Expenditure dropped to -0.6% for the third quarter (Q3) versus 1.5% expected and -0.3% prior. Further, downbeat prints of Australia’s AiG Performance of Mfg Index and S&P Global Manufacturing PMI for November also appeared to have probed the AUD/USD bulls at the multi-day high.
It should be observed that the mixed performance of Wall Street and multi-month low US Treasury yields seemed to also have probed the AUD/USD bulls ahead of a speech from Reserve Bank of Australia (RBA) Governor Philip Lowe. The policymaker has already teased easy rates during his speech earlier in the week and hence the bull’s fears are justified. Also challenging the prices could be the cautious mood ahead of the key US jobs report for November, the earlier signals for which have been downbeat and may favor the Aussie buyers if matching forecasts.
Also: Nonfarm Payrolls Preview: Dollar selling opportunity? Low expectations to trigger temporary bounce
Technical analysis
Although August month’s low near 0.6855 joins nearly overbought RSI to challenge the immediate AUD/USD upside, a clear break of the previous key resistance line from September 13, now support near 0.6765, directs the Aussie pair towards September’s peak of 0.6916.
- Fundamental news in the United States debilitated the US Dollar and boosted the Swiss Franc.
- Oscillators like RSI and the Rate of Change suggests sellers are gathering momentum.
- USD/CHF Price Analysis: Break below 0.9300 will exacerbate a fall to 0.9200.
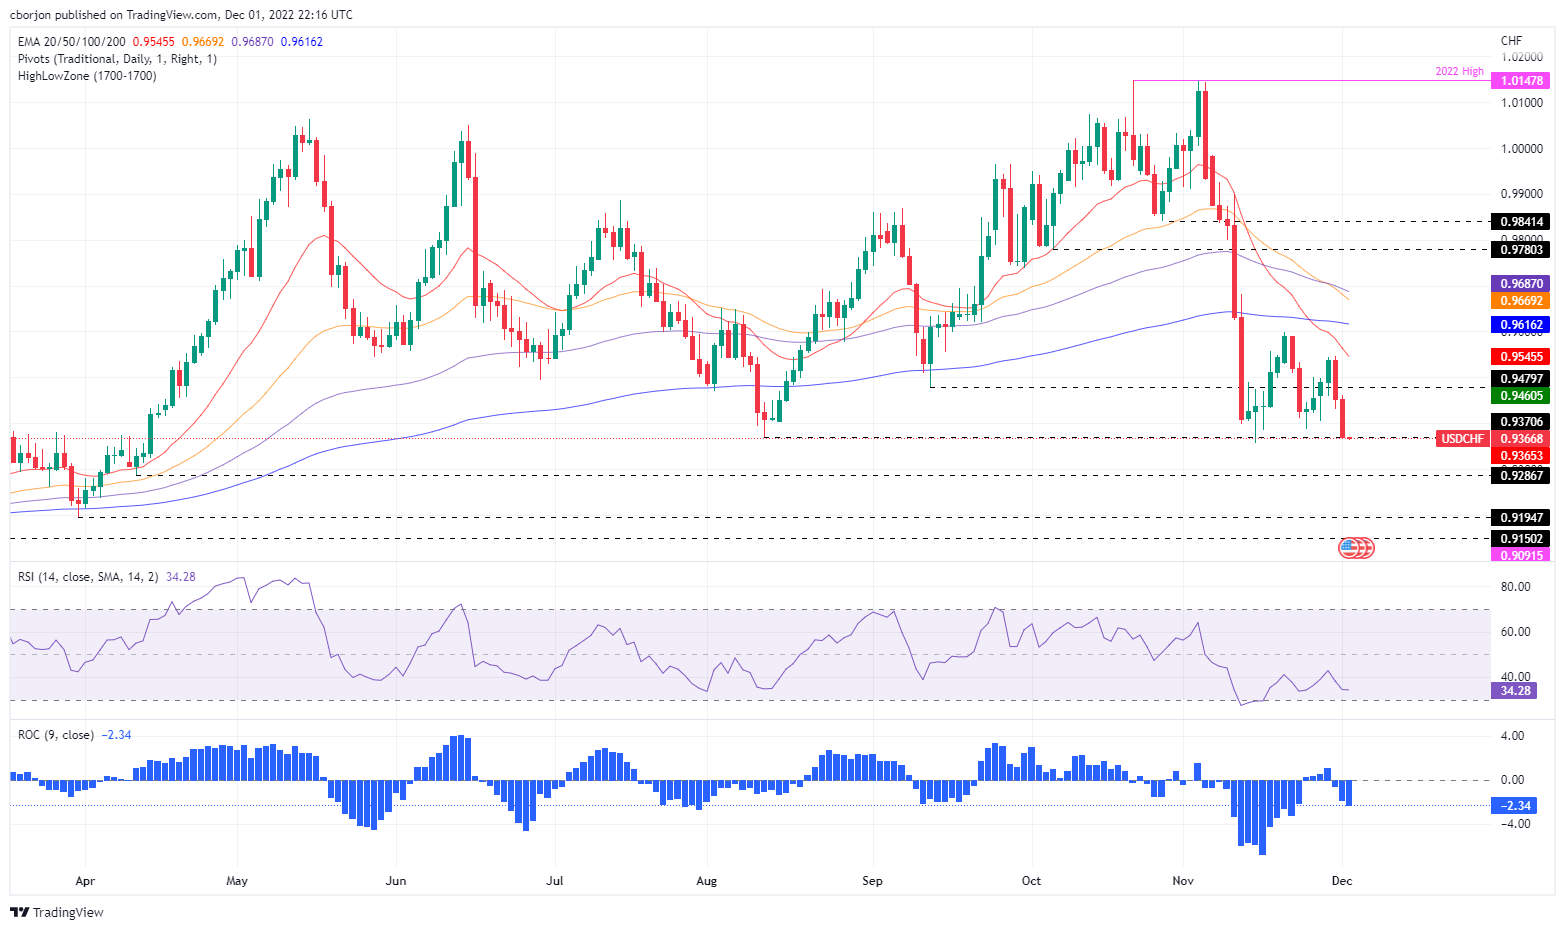
The USD/CHF extended its losses for two-straight days, courtesy of a gloomy economic outlook in the United States (US), as manufacturing activity shrank while the US Federal Reserve (Fed) tightened monetary conditions. Therefore, the US Dollar (USD) weakened, contrarily to the Swiss Franc (CHF). At the time of writing, the USD/CHF is trading at 0.9366, beneath its opening price by 0.92%.
USD/CHF Price Analysis: Technical outlook
The USD/CHF is dropping sharply, as shown in the daily chart. The 170-pip fall spurred by the Federal Reserve, slowing the speed of rate hikes, exacerbated the fall from around 0.9530s. Even though the USD/CHF dived sharply, oscillators, like the 9-period Rate of Change (ROC) and the Relative Strength Index (RSI) showed that sellers are gathering momentum, cementing the case for a bearish bias.
Therefore, the USD/CHF first support would be the November 15 daily low at 0.9356. A breach of the latter will expose the 0.9300 figure, followed by the April 12 daily low at 0.9286, ahead of the March 31 swing low of 0.9194.
As an alternate scenario, the USD/CHF first resistance would be 0.9400. Break above will pave the way towards the 20-day Exponential Movin Average (EMA) at 0.9545, but on its way up, the major needs to surpass the psychological 0.9500.
USD/CHF Key Technical Levels
Early Friday morning in Asia, Japanese media Asahi quotes Bank of Japan Board Member Naoki Tamura as saying, “The Bank of Japan should conduct a review of its monetary policy framework and the feasibility of its 2% inflation target.”
The policymaker also added, “Whether the BOJ needs to tweak its (ultra-easy) monetary policy will depend on the outcome of the review."
Additional comments
Timing of review could come soon or somewhat later, which will depend on price, wage, economic outlook.
BOJ should consider 2% price target as flexible goal as that level may have been excessively high for Japan.
Market implications
Chatters surrounding the Bank of Japan’s (BOJ) monetary policy tightening allowed the USD/JPY to refresh the multi-month low the previous and are exerting downside pressure on the Yen pair of late.
Also read: USD/JPY Price Analysis: Plunges 200-pips after sellers stepped in eyeing the 200-DMA around 135.00
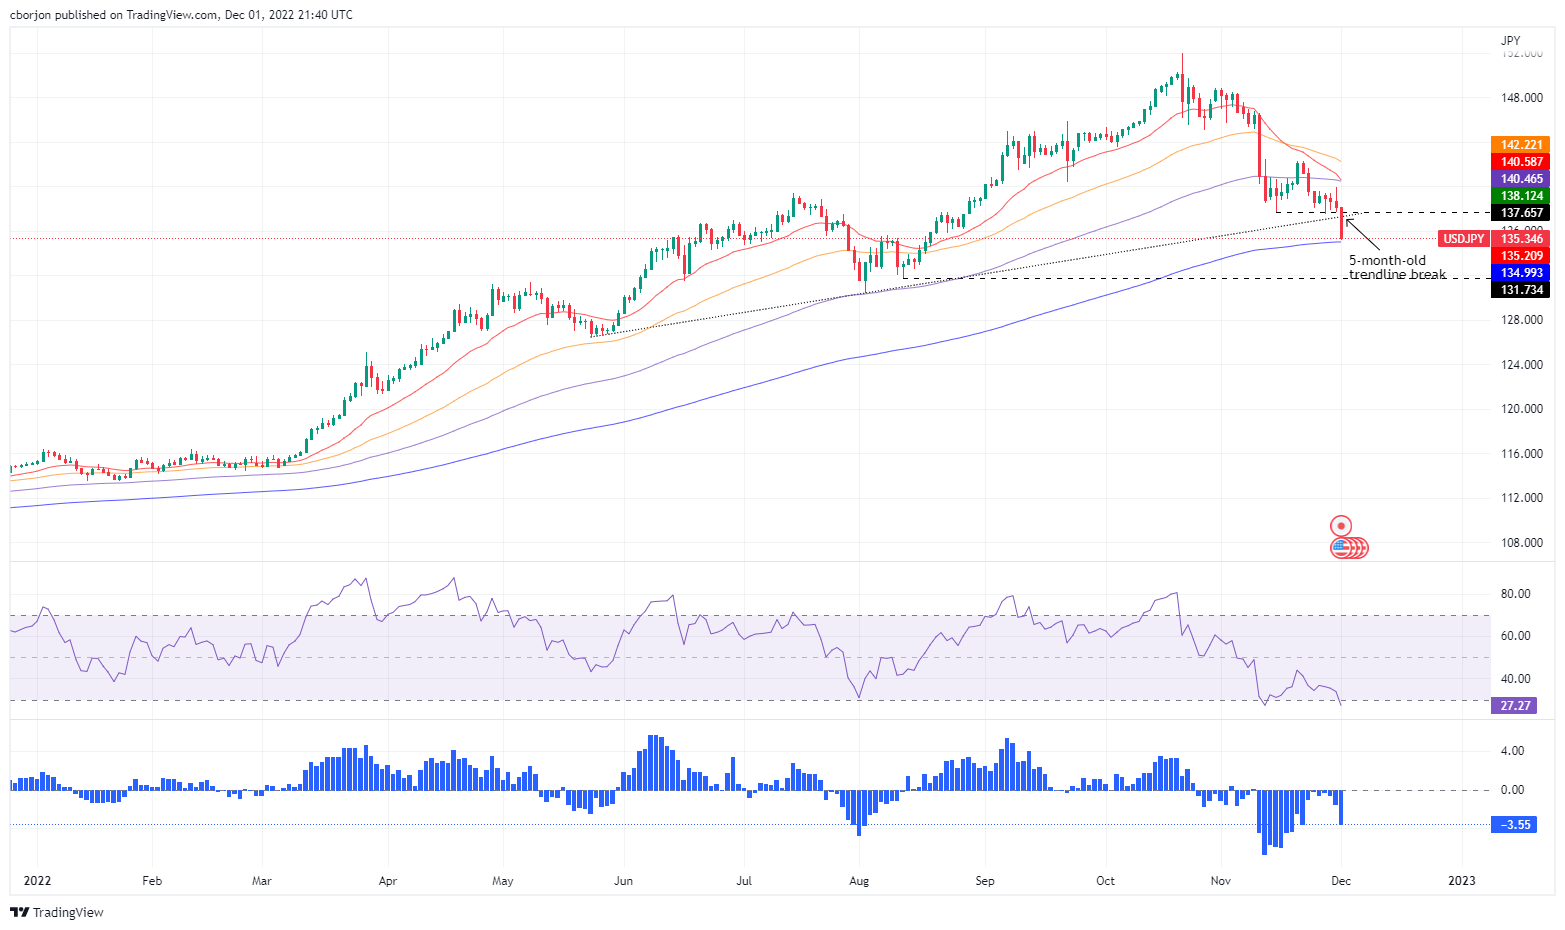
- The USD/JPY breaks a five-month-old trendline, eyeing the 200-day EMA around 134.99.
- Oscillators in bearish territory cement the downtrend, but overbought RSI might refrain USD/JPY short traders.
- USD/JPY: After reclaiming the 200-DMA, a fall toward 131.70 is on the cards.
The USD/JPY plunges below 136.00, extending its losses towards the 135.20s area, spurred by a risk-off impulse and manufacturing activity weakening in the United States (US), posing a recession risk. Therefore, USD/JPY sellers stepped in, below Wednesday's low, of 137.64, and sent the pair tumbling more than 250 pips. At the time of writing, the USD/JPY is trading at 135.34.
USD/JPY Price Analysis: Technical outlook
The USD/JPY shifted neutral-to-downward biased once it cleared the confluence of the 20, and 100-day EMA around 140.46/50. OF note, the 9-period Rate of Change (ROC) is gathering momentum, meaning sellers are in charge. Still, the Relative Strength Index (RSI) entered oversold conditions, meaning that the USD/JPY might consolidate around the 200-day Exponential Moving Average (EMA) at 134.99 before continuing to the downside.
Additionally, the USD/JPY tumbled below a 5-month-old upslope trendline draw from June lows, which exacerbated the downfall. To conclude, the USD/JPY is downward biased in the near term.
Hence, the USD/JPY first support would be 200-day EMA at 134.99. Break below will expose crucial psychological levels like the 134.00 and 133.00 figures, followed by the August 11 low at 131.73.
USD/JPY Key Technical Levels
- The Pound Sterling has reached fresh bull cycle highs on US Dollar weakness.
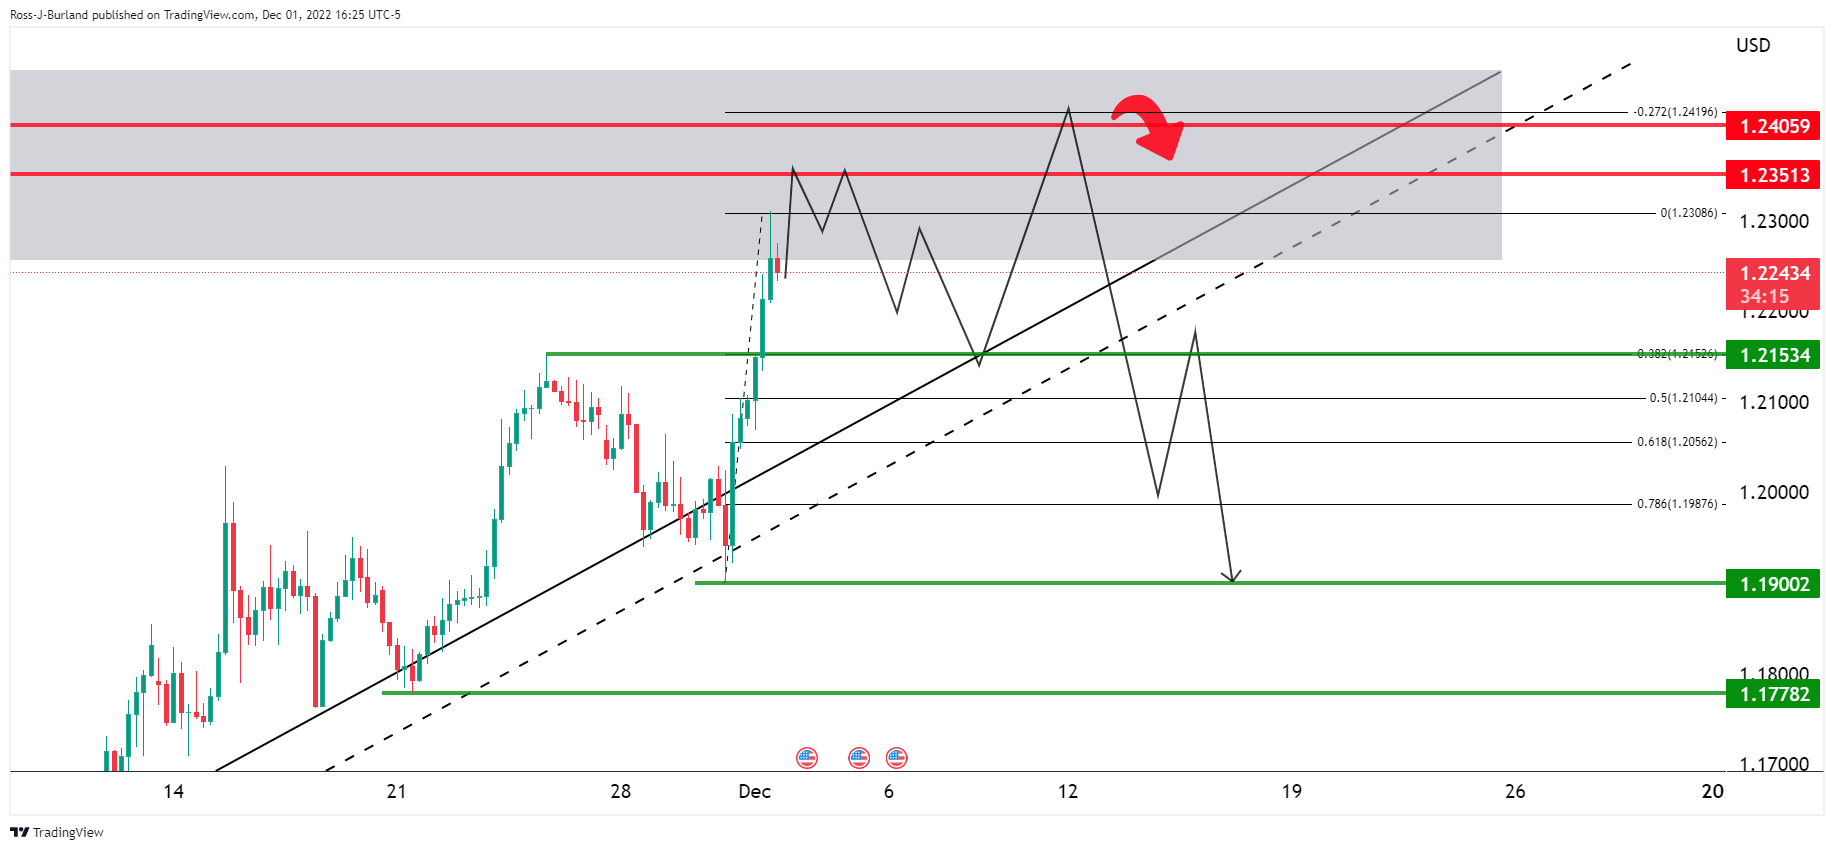
- GBP/USD bulls could be throwing in the towel below 1.2300, although 1.250 is also a near-term prospect.
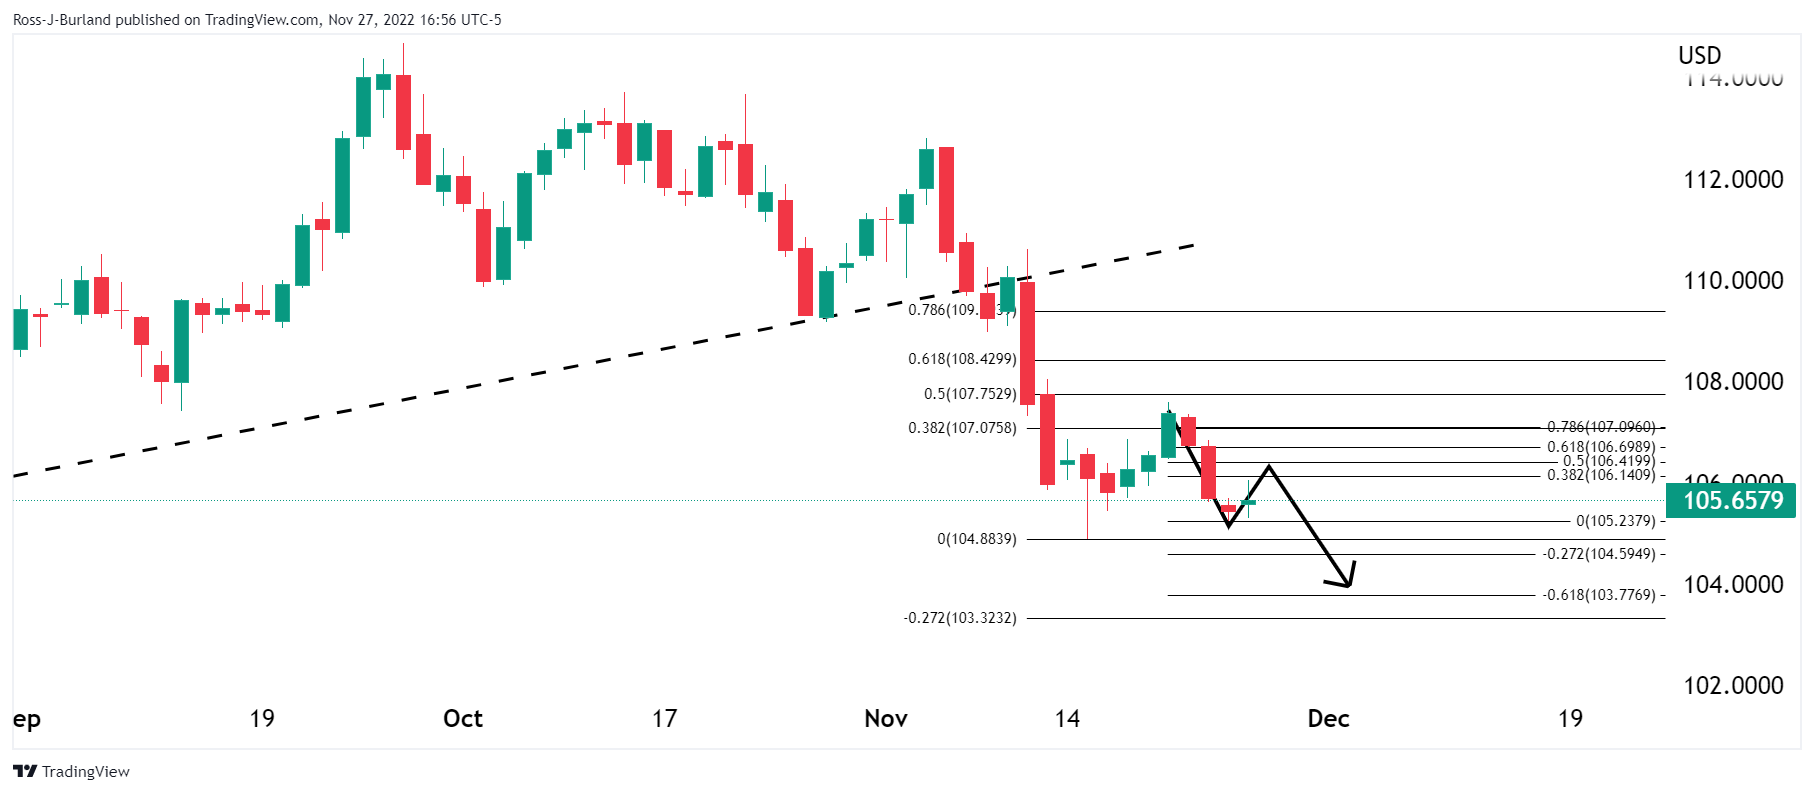
The US Dollar weakened to three-month-lows against the Pound Sterling on Thursday, after comments by Federal Reserve Chair Jerome Powell that US rate hikes could be scaled back "as soon as December". GBP/USD took on 1.2300 and is showing signs of exhaustion on the charts as the following illustrates:
GBP/USD daily charts
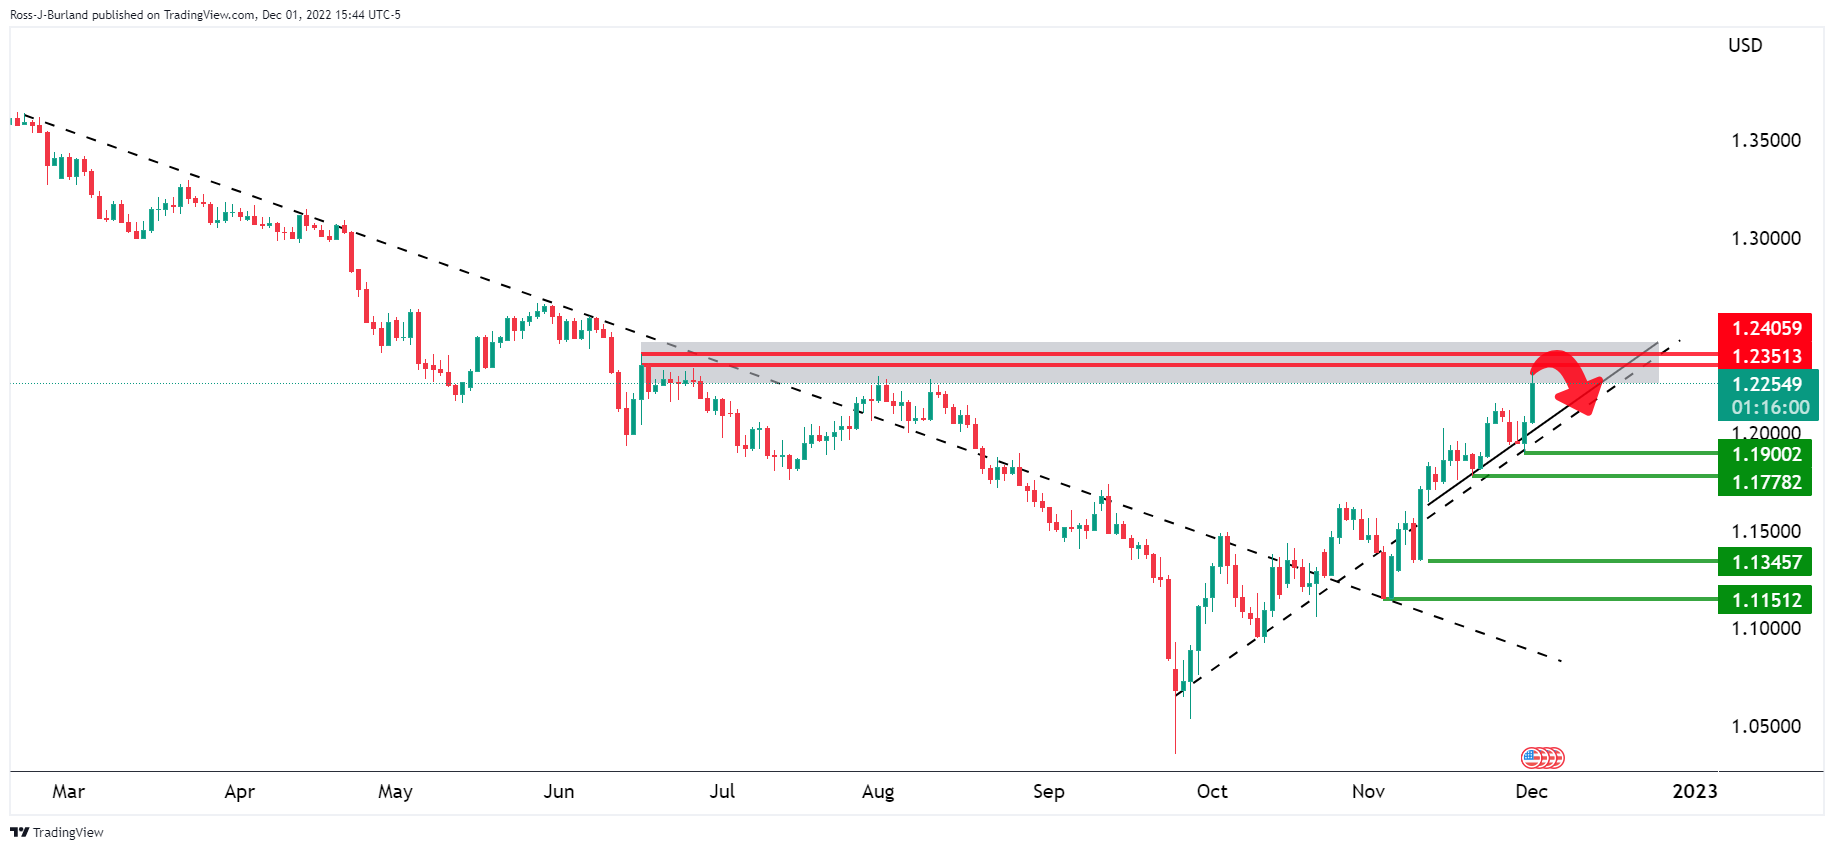
The price has moved sharply away from the trendline support and has swept the liquidity, to some degree, above the early August highs. However, that is not to say that this rally is over and there are prospects of a move into the 1.2400 area of which would be expected to hold on initial tests and potentially cap the rally.
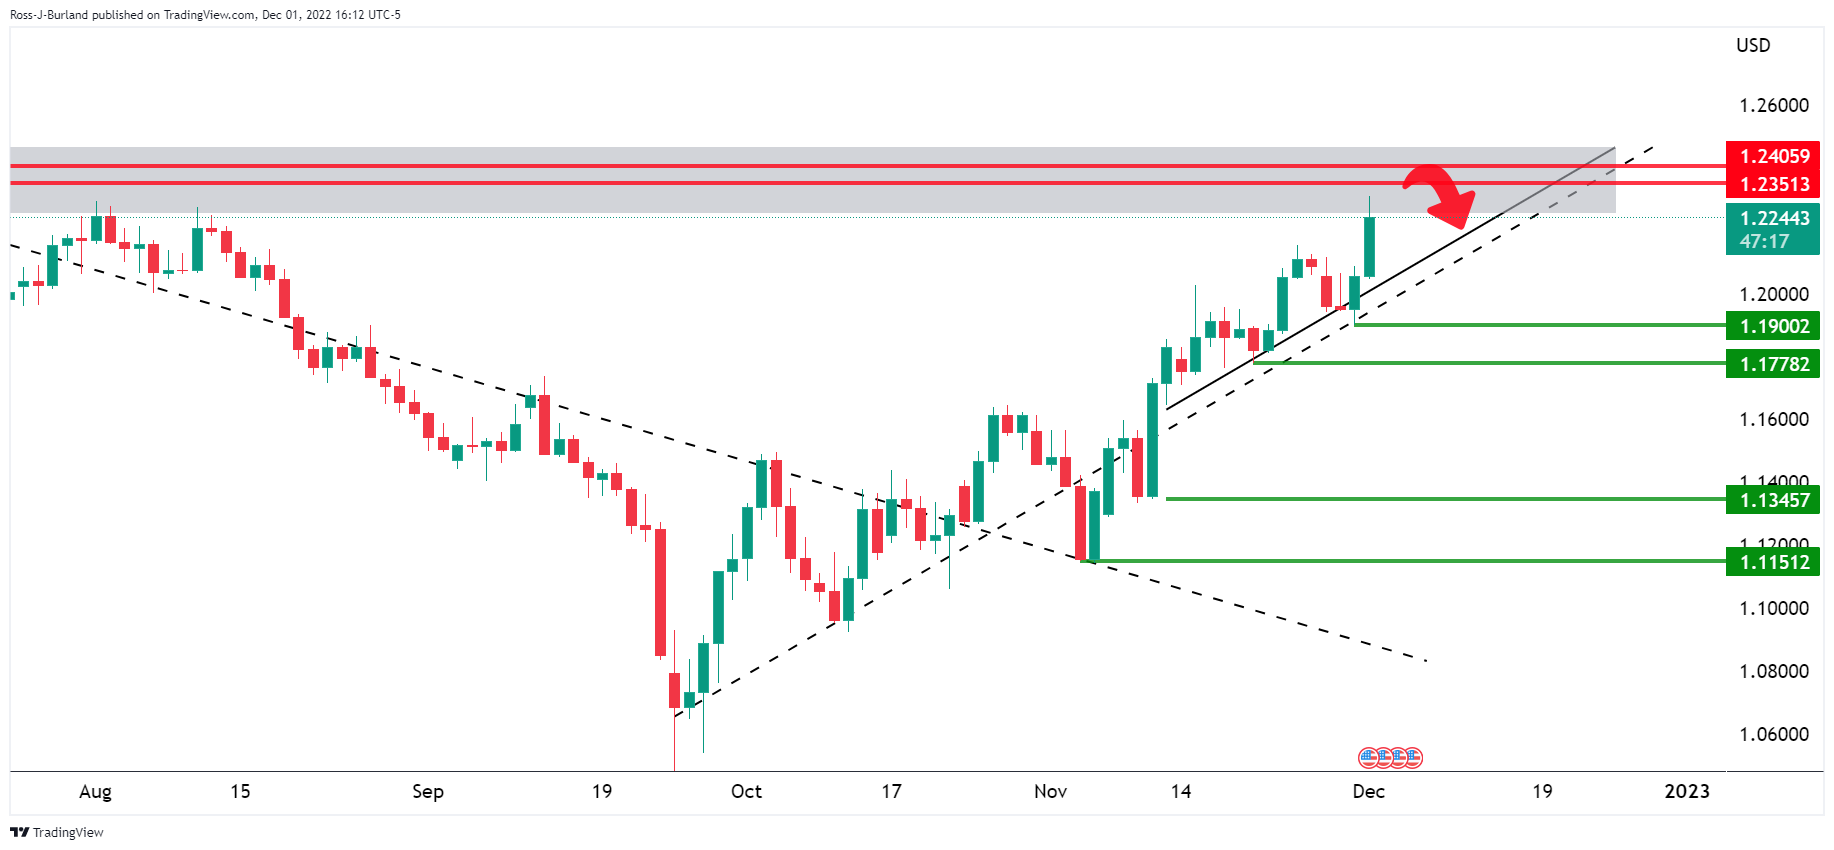
GBP/USD H1 charts
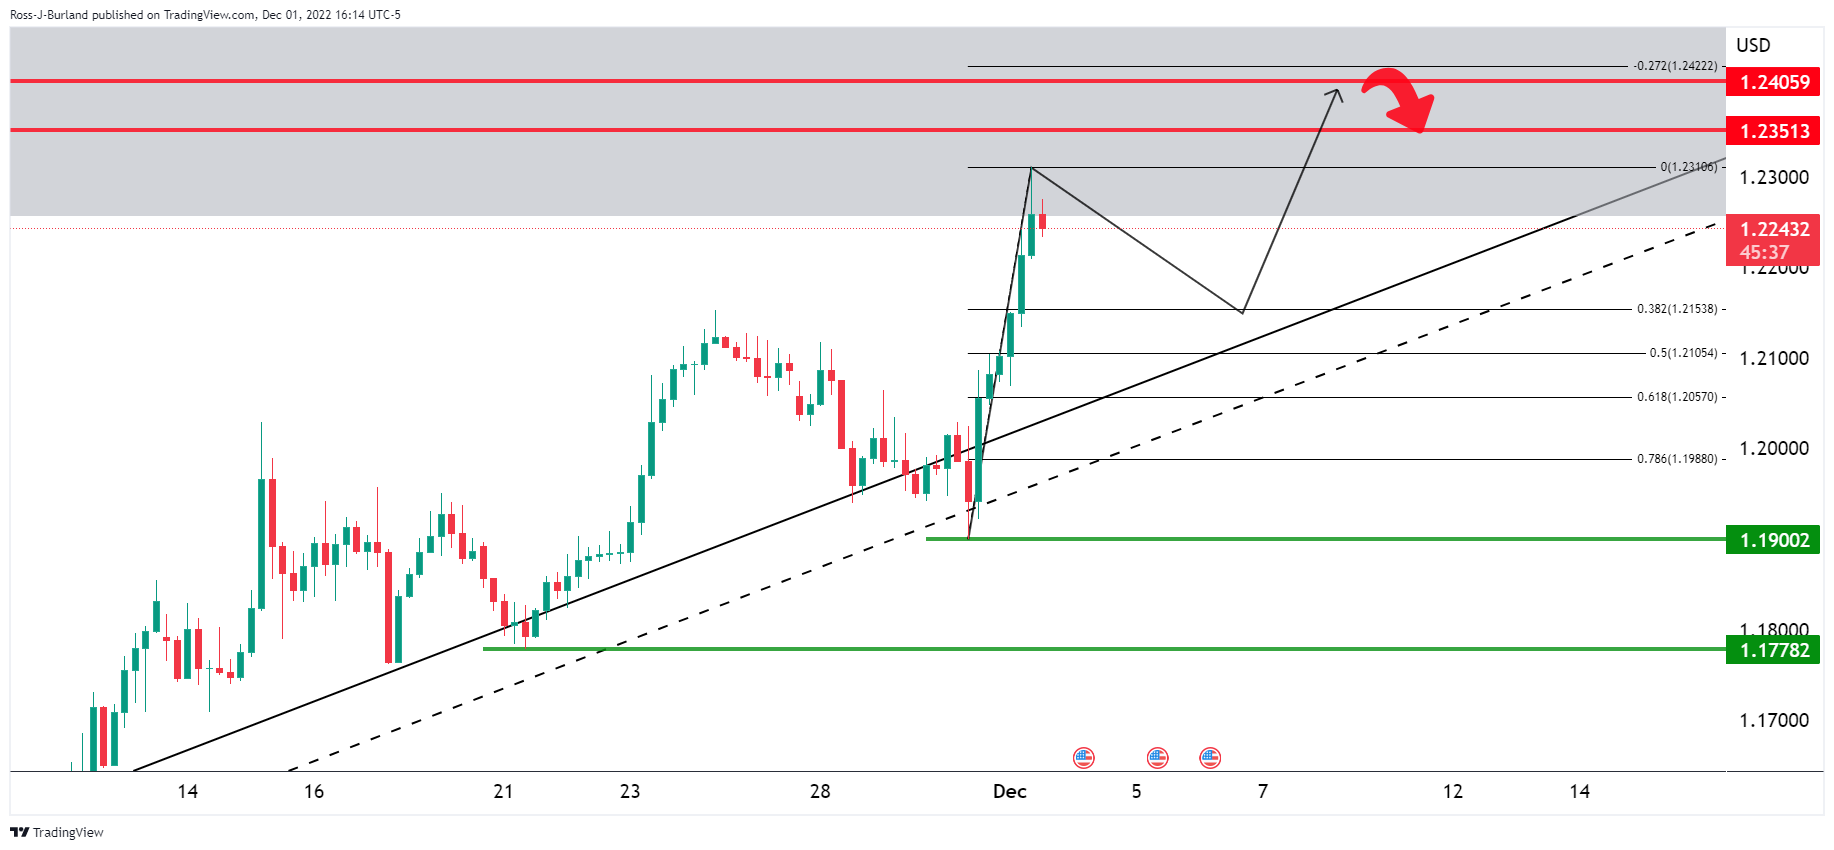
However, at this juncture, there are prospects of a deep correction of the current bullish impulse towards 1.2150. On one hand, we could see a correction that moves progressively lower into the trendline support or price action that more resembles something like the following schematic:
The Federal Reserve’s vice chair of supervision, Michael Barr, inflation is far too high.
Key comments
Fed is quite focused on bringing inflation down to 2%.
We've moved quickly this year to restrictive territory.
We are now at a point where we can pay more attention to the rate we are getting to, less on pace.
We may shift to slower pace of rate increases at next meeting.
It's 'smart' to modulate on rate hike pace.
Current fed policy is restrictive.
Broadly the view of colleagues that fed policy is in restrictive territory now.
The question is how much more restrictive do we need to be to bring down inflation.
We have some work still to do.
We have more work to do on rates later this year and next year.
US Dollar update
The price of DXY is headed to a test into the mid-range of the 104 area that guards a slide into the 103s and 101s.
- NZD/USD advances towards a test of 0.6400 and has eyes on the 0.6450s.
- 0.6450 comes as a confluence between Aug high and the 61.8% retracement of the whole 2022 move.
NZD/USD is stalling below 0.6400 as the US Dollar attempts to correct what has been a significant move to the downside in the currency markets this week. At the time of writing, NZD/USD is down by over 1% and has fallen from a high of 105.896 to a low of 104.664 so far.
The move in the greenback has been driven by dovish remarks from the Federal Reserve's chair, Jerome Powell, or at least the comments that the market prefers to listen to. Fed's Powell gave a speech on Wednesday indicating that the Fed would ease the historically-high pace of interest rate rises at its next policy meeting in December.
“The time for moderating the pace of rate increases may come as soon as the December meeting,” Powell said in remarks at the Brookings Institution. Consequently, the US Dollar dropped, US yields eased and stocks rose. The S&P 500 ended its three-day losing streak and closed up 2.7% while the Dow officially entered a bull market.
However, Powell’s admission that “the path ahead for inflation remains highly uncertain” and when he said “by any standard, inflation remains much too high,” and “it will take substantially more evidence to give comfort that inflation is actually declining,'' likely means the Fed will keep hiking well into 2023. Additionally, earlier on in the week, St. Louis Federal Reserve President James Bullard warned that the stock market is underpricing the risk of a continually aggressive Fed. On Thursday, the New York Fed’s John Williams who recently said that he predicts a time, “probably 2024”, when the Fed will lower the federal funds rate, said on Fox News that the Fed has a ways to go on rate hikes.
Nevertheless, the market is running with the dovish comments from a speech that had something for both hawks and doves and that has seen the Kiwi rally strongly over the past 24 hrs through the resistance at 0.6325 (the 76.4% Fibo of the Aug-Oct sell-off) as the following technical analysis will show:
NZD/USD technical analysis
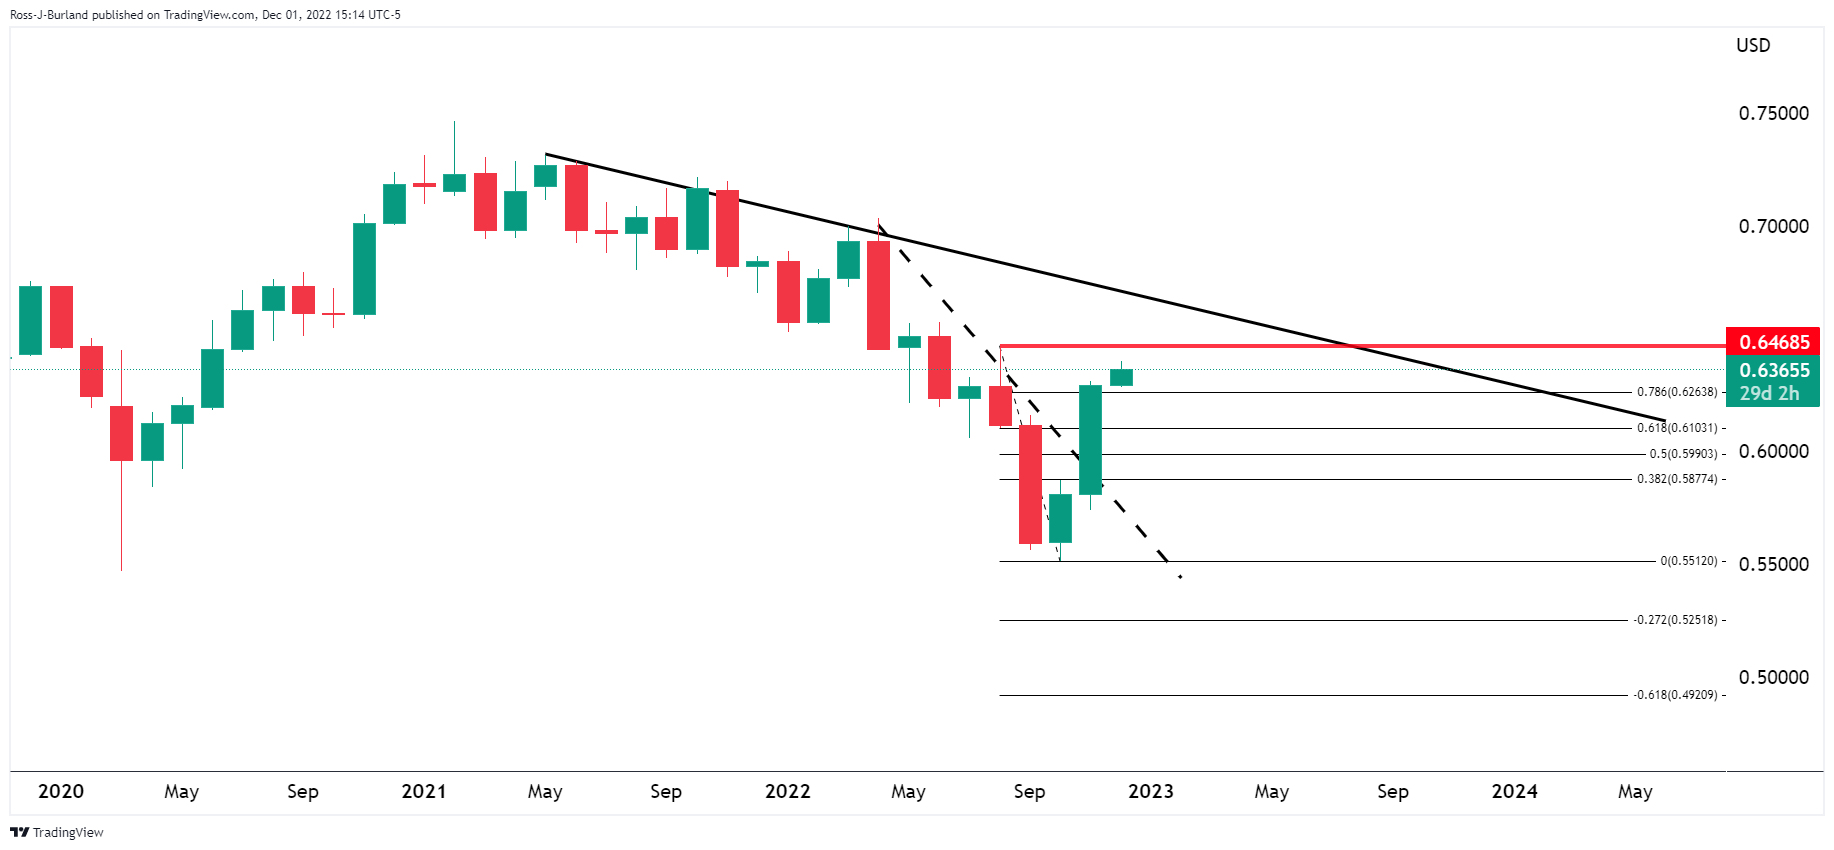
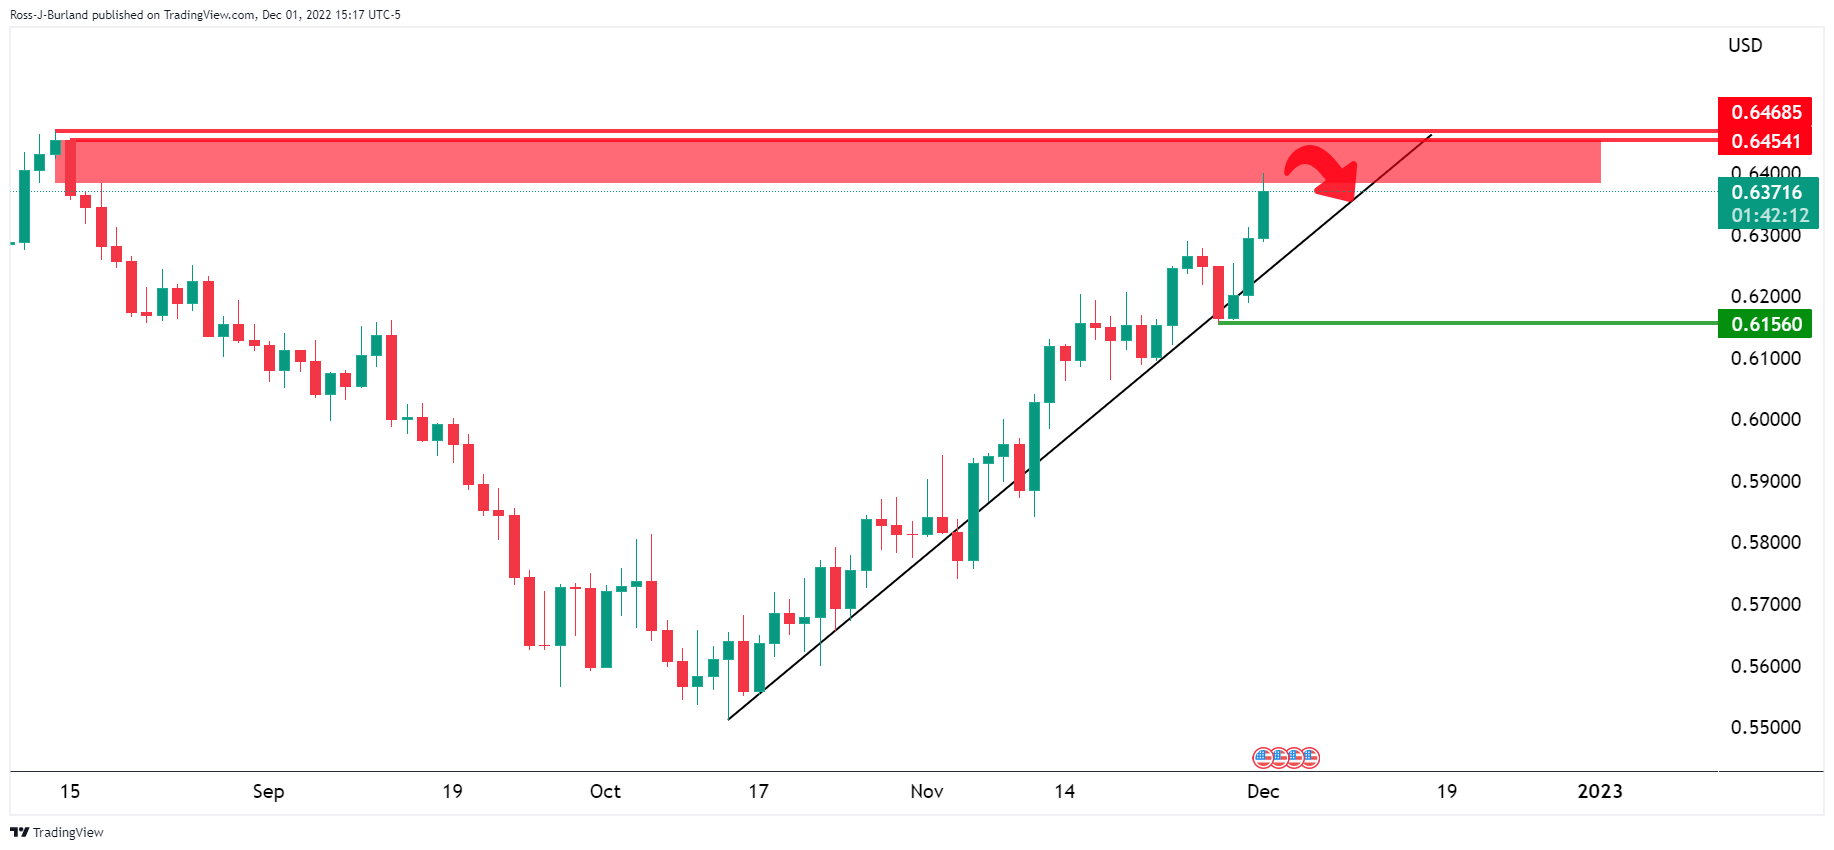
The above series of charts, weekly, daily and H4, illustrate the prospects of a move into the 0.6450s. Analysts at ANZ Bank argued that the ''price action looks extremely solid, and technically, the next major target level is 0.6450 (marking both the Aug high and the 61.8% retracement of the whole 2022 move).''
What you need to take care of on Friday, December 2:
The US Dollar extended its decline to multi-month lows against most of its major rivals amid persistent optimism and tepid US data, supportive of the Federal Reserve’s monetary policy pivot.
At the beginning of the day, the Greenback was hit by the BOJ. Bank of Japan board member Asahi Noguchi surprised investors by saying the central bank is ready to withdraw stimulus if inflation numbers appear too strong. “BOJ could withdraw stimulus preemptively if underlying inflation perks up higher than expected,” said the policymaker. USD/JPY trades in the 135.40 price zone.
Meanwhile, some Chinese cities announced they are easing their testing and control coronavirus-related policies. The country has entered a new stage in fighting the virus, according to one top zero-Covid enforcer. The relief news pushed Asian and European equities higher, which in turn, undermined demand for the Greenback.
The US Personal Consumption Expenditures (PCE) Price Index rose by 6% YoY in October, easing from 6.3%. Core PCE inflation came in at 5% in the same period, down from 5.2% in September. Also, the ISM Manufacturing PMI fell to 49 in November, down from the previous 50.2, being the first time the indicator signals contraction since May 2020.
EUR/USD regained the 1.0500 threshold and trades above it despite softer Euro Area growth figures. GBP/USD hovers around 1.2250 ahead of the US close. The AUD/USD pair trades around 0.6810, while the worst performer was the Canadian Dollar, as USD/CAD ended the day in the 1.3430 price zone.
Gold soared and settled at $1,802 a troy ounce, its highest since August. Crude oil prices were also up, with WTI changing hands at $81.30 a barrel.
On Friday, the US will publish the Nonfarm Payrolls report, while Canada will also publish its monthly employment report.
Bitcoin price witnesses 44% increase of deposits to all exchanges in November
Like this article? Help us with some feedback by answering this survey:
- US Dollar remains on the defensive, spurred by the ISM manufacturing PMI dropping to the contractionary territory.
- Inflation in the United States remained unchanged, while unemployment claims fell.
- The Australian Dollar got bolstered by a weaker US Dollar as traders eye RBA’s Governor Lowe.
- AUD/USD Price Analysis: Could test 0.7000 if the AUD/USD clears the 200-DMA.
The Australian Dollar (AUD) advances in the New York session but retraces after hitting a new two-month high around 0.6840s as sentiment shifted sour. United States (US) economic data portrays a gloomy economic outlook while increasing borrowing costs by the Federal Reserve (Fed) would keep the economy under pressure. That said, the US Dollar (USD) remains on the defensive, undermined by falling US Treasury yields. At the time of writing, the AUD/USD clings above the 0.6800 figure.
US Dollar weakened as the ISM Manufacturing PMI shrank
US equities are trading with losses. The Institute for Supply Management (ISM) for November revealed that the Manufacturing PMI dropped below the expansionary/contractionary 50 levels, down to 49.0 from 49.2 estimated by analysts. Timothy R. Fiore, Chair of the ISM, commented that US manufacturing activity dived into a contraction, with the PMI reaching its lowest level since the pandemic began. The report “reflects companies’ preparing for lower output.” Following the report, the AUD/USD dropped from the day’s high of 0.6845 to 0.6810.
Tightness in the labor market pressures the Federal Reserve
Before Wall Street opened, the Department of Labor revealed that Initial Jobless Claims for the last week increased by 225K, a decrease of 16K compared to the previous week’s and below the expected 235K by analysts. Continuing claims jumped from 1.57M to 1.603M, showing that the labor market remains tighter than Federal Reserve officials’ expectations.
US Core PCE rose by 5%, but failed to bolster the US Dollar
At the same time, the US Department of Commerce (DoC) revealed the Federal Reserve preferred measure of inflation, the US Core Personal Consumption Expenditure (PCE), which rose by 5% YoY, beneath October’s 5.2%. Even though the report flashes that inflation is beginning to ease, it remains too high. Although prices stabilized in the last couple of months, Federal Reserve Chair Jerome Powell commented that he needs “substantial evidence” that inflation is cooling.
What to watch
Aside from this, in Australia, the calendar will feature October Retail Sales, Housing data, and the Reserve Bank of Australia (RBA) Governor Philip Lowe, which will cross wires. On the US front, the US Nonfarm Payrolls report for November would update the labor market situation, while Fes speakers, ahead of the blackout period, will cross wires.
AUD/USD Price Analysis: Technical outlook
Although the AUD/USD failed to break the 200-day Exponential Moving Average (EMA) around 0.6840, its bias remains upward, further cemented by the Relative Strength Index (RSI) at bullish territory aiming upwards. However, the AUD/USD needs to hold above Wednesday’s high of 0.6801, so the pair could consolidate within the 0.6800-0.6850 area if buyers would like to push prices higher. If that scenario plays out, the AUD/USD first resistance would be the 0.6900 figure, followed by the August 26 high of 0.7000. As an alternate scenario, the AUD/USD first support would be 0.6800, followed by the November 29 high at 0.6748, above the 0.6700 figure.
- US Dollar bears head toward the mid-range of the 104 area that guards a slide into the 103s and 101s.
- Are investors putting the cart before the horse?
The US Dollar is falling to test a 16-week low in the DXY, an index that measures the greenback vs. a basket of currencies. The August 11 low was made at 104.64 and today's low reached 104.66 so far. The index has fallen from a high of 105.89 and has been pressured on the back of Wednesday's dovish remarks from the Federal Reserve's chair, Jerome Powell.
Fed's Powell gave a speech on Wednesday while strongly indicating that the Fed would ease the historically-high pace of interest rate rises at its next policy meeting in December. “The time for moderating the pace of rate increases may come as soon as the December meeting,” Powell said in remarks at the Brookings Institution, his last public appearance before the central bank enters a blackout period ahead of its December 13-14 policymaking meeting. Consequently, the US Dollar dropped, US yields eased and stocks rose. The S&P 500 ended its three-day losing streak and closed up 2.7% while the Dow officially entered a bull market.
Meanwhile, on Thursday, easing inflation supported the Fed chair's indication that rate hikes could slow. Data has shown that in the 12 months through October, the personal consumption expenditures (PCE) price index increased 6.0% after advancing 6.3% in September compared with the Fed's 2% target.
In current trade, Benchmark 10-year yields are down 1.5% to 3.5565 and the more Fed sentiment-sensitive 2-year note yields are down 0.6% to 4.287%. Fed funds futures are pricing that the Fed’s benchmark rate will peak at 4.91% in May, up from 3.83% now. The traders had priced for a top of over 5% before Powell’s remarks on Wednesday.
However, investors who are expecting a full pivot may be putting the cart before the horse. Prior to Powell's speech, St. Louis Federal Reserve President James Bullard warned that the stock market is underpricing the risk of a continually aggressive Fed. Powell’s admission that “the path ahead for inflation remains highly uncertain” leaves prospects on the table for a protracted period of rate hikes. Additionally, the US dollar tends to perform around the sentiment of a US recession. Powell said on Wednesday that there is still a chance the economy avoids recession but the odds are slim. “To the extent we need to keep rates higher longer, that’s going to narrow the path to a soft landing,” Powell warned. US PMIs on Thursday were testimony to such rhetoric.
The bottom line is that “by any standard, inflation remains much too high,” and “it will take substantially more evidence to give comfort that inflation is actually declining,” as per Powell's comments on Wednesday. However, for now, despite such hawkish jaw-boning, and signals that the Fed will keep hiking well into 2023, for now, investors don't mind and that is weighing on the greenback.
US Dollar and yields technical analysis
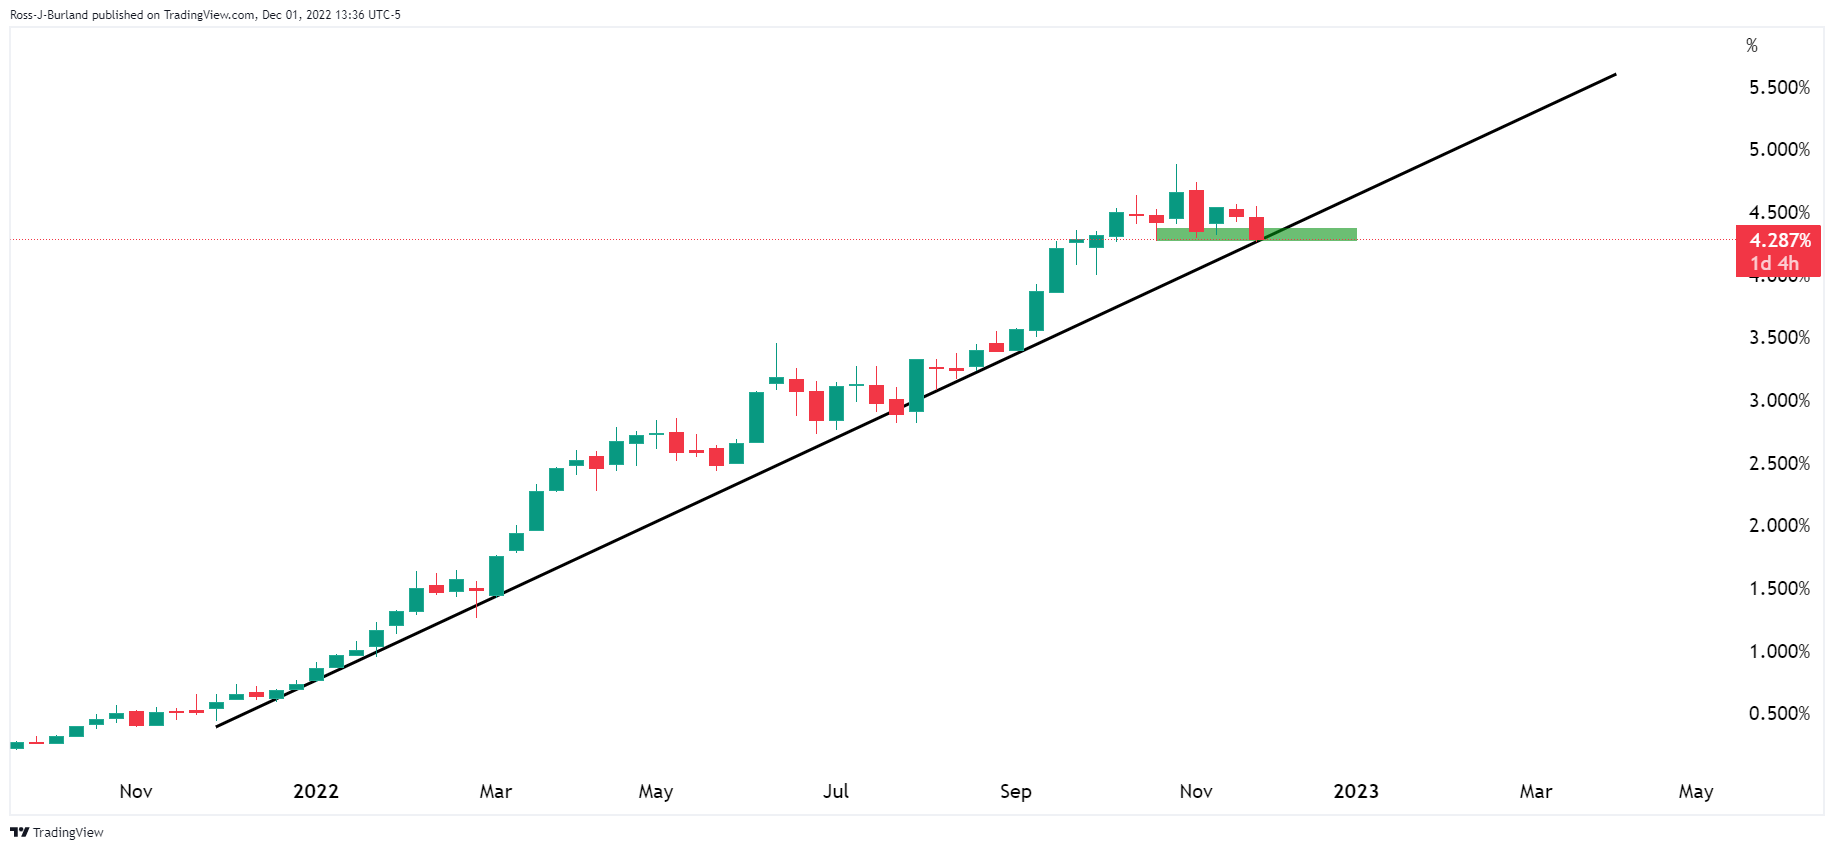
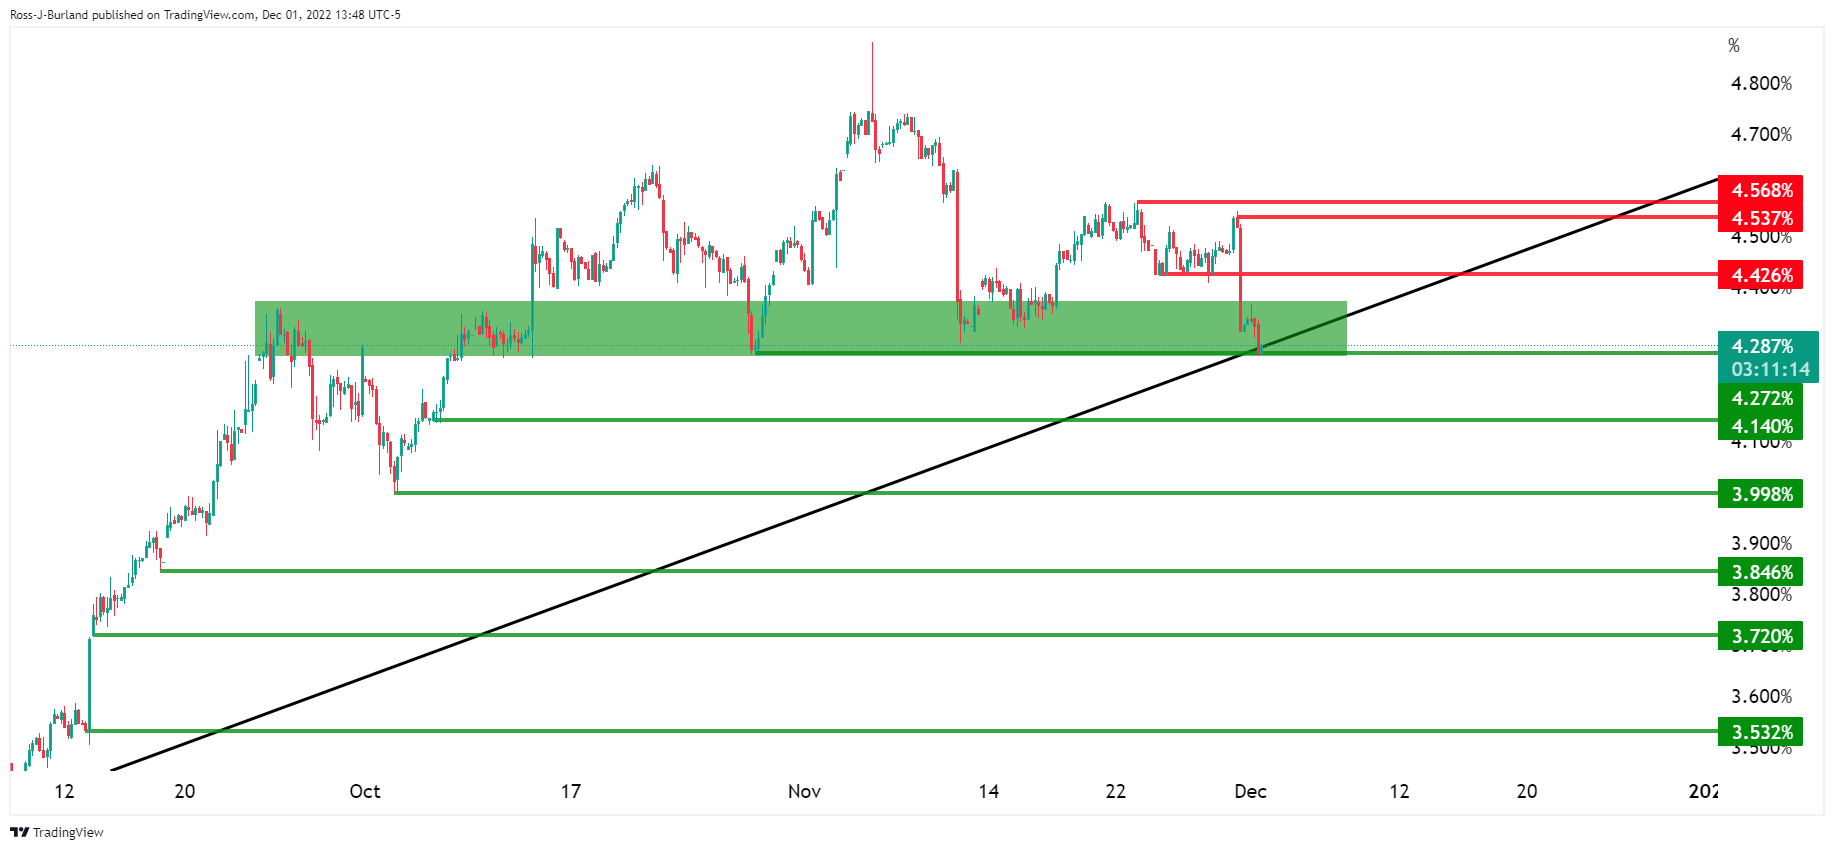
The 2-year yield has carved out an H&S topping pattern and is on the verge of a break of the long-term trendline as seen on the weekly chart above and the 4-hour chart below
US Dollar daily chart
As per prior analysis, US Dollar is firm in a risk-off start to the week, whereby the US Dollar was expected to correct higher before the next slide, the greenback is following a bearish trajectory below the prior bullish trend"
Prior analysis:
Update:
The price is headed to a test into the mid-range of the 104 area that guards a slide into the 103s and 101s.
The New York Fed’s John Williams who recently said that he predicts a time, “probably 2024”, when the Fed will lower the federal funds rate, has today said on Fox News that the Fed has a ways to go on rate hikes.
Key comments
Inflation still far too high.
Will take a couple of years for inflation to ease to target.
High inflation not yet embedded in economy.
Fed job is to balance demand with supply.
Seeing signs of welcome ebbing in inflation, but unsure if its peaked.
Doesn't believe there is a wage price spiral happening.
Demand still far exceeding available supply in us economy.
Tighter monetary policy needed to restore economic balance.
Fiscal stance not a big factor right now in driving inflation.
Fed has a ways to go with rate rises.
Fed rate rise resting place depends on economy.
More to come ...
- EUR/USD H1 W-formation has seen a correction into the 50% mean reversion area.
- The bulls are in control on the front side of the trendline support.
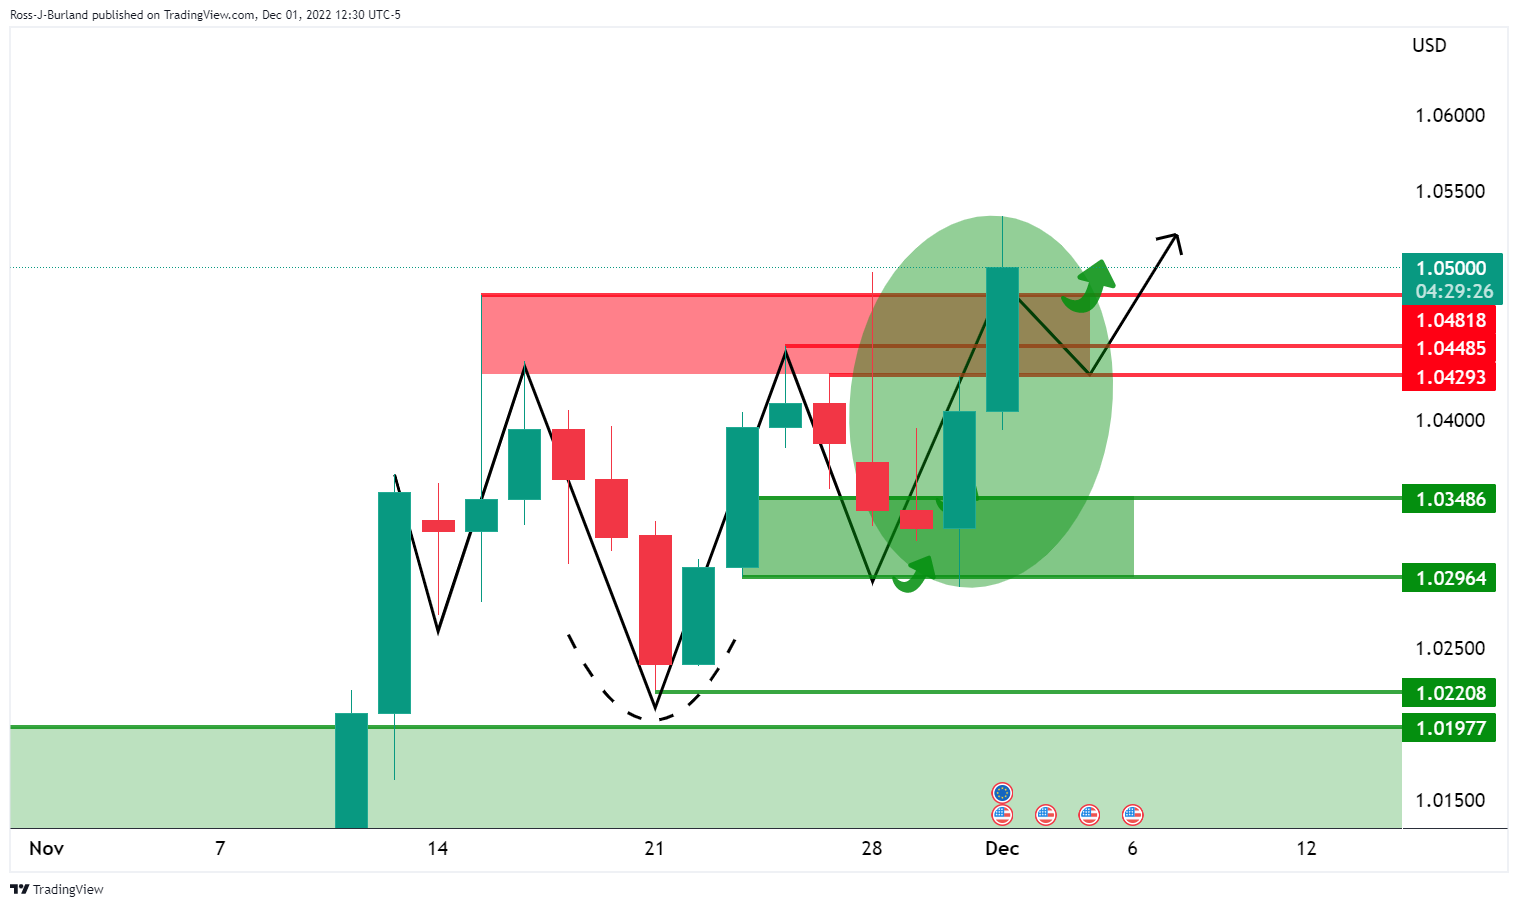
As per the prior analysis, EUR/USD Price Analysis: Bears move in and eye a break towards key 1.0300 support, whereby an inverse head & shoulders was identified on the daily chart, the price has rallied into the 1.05 area as follows:
EUR/USD prior analysis
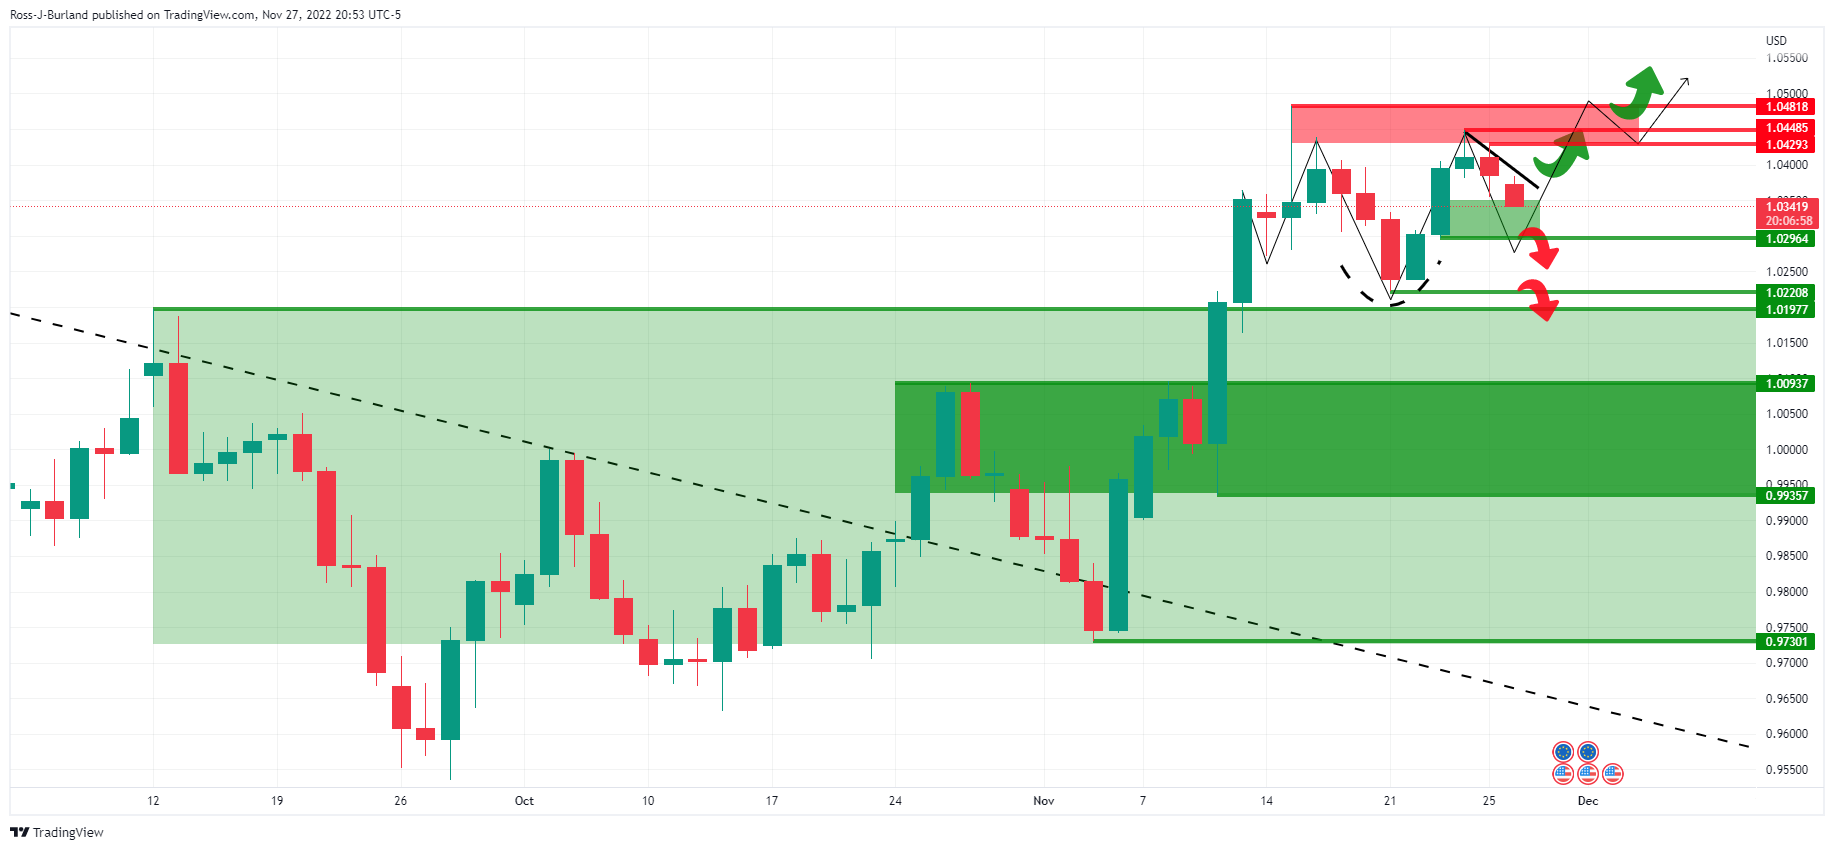
It was stated that an inverse head & shoulders could be in the making at this juncture. ''Bullish commitments around 1.0300/50 would be forming the right-hand shoulder of the bullish pattern.''
Update:
EUR/USD H1 charts
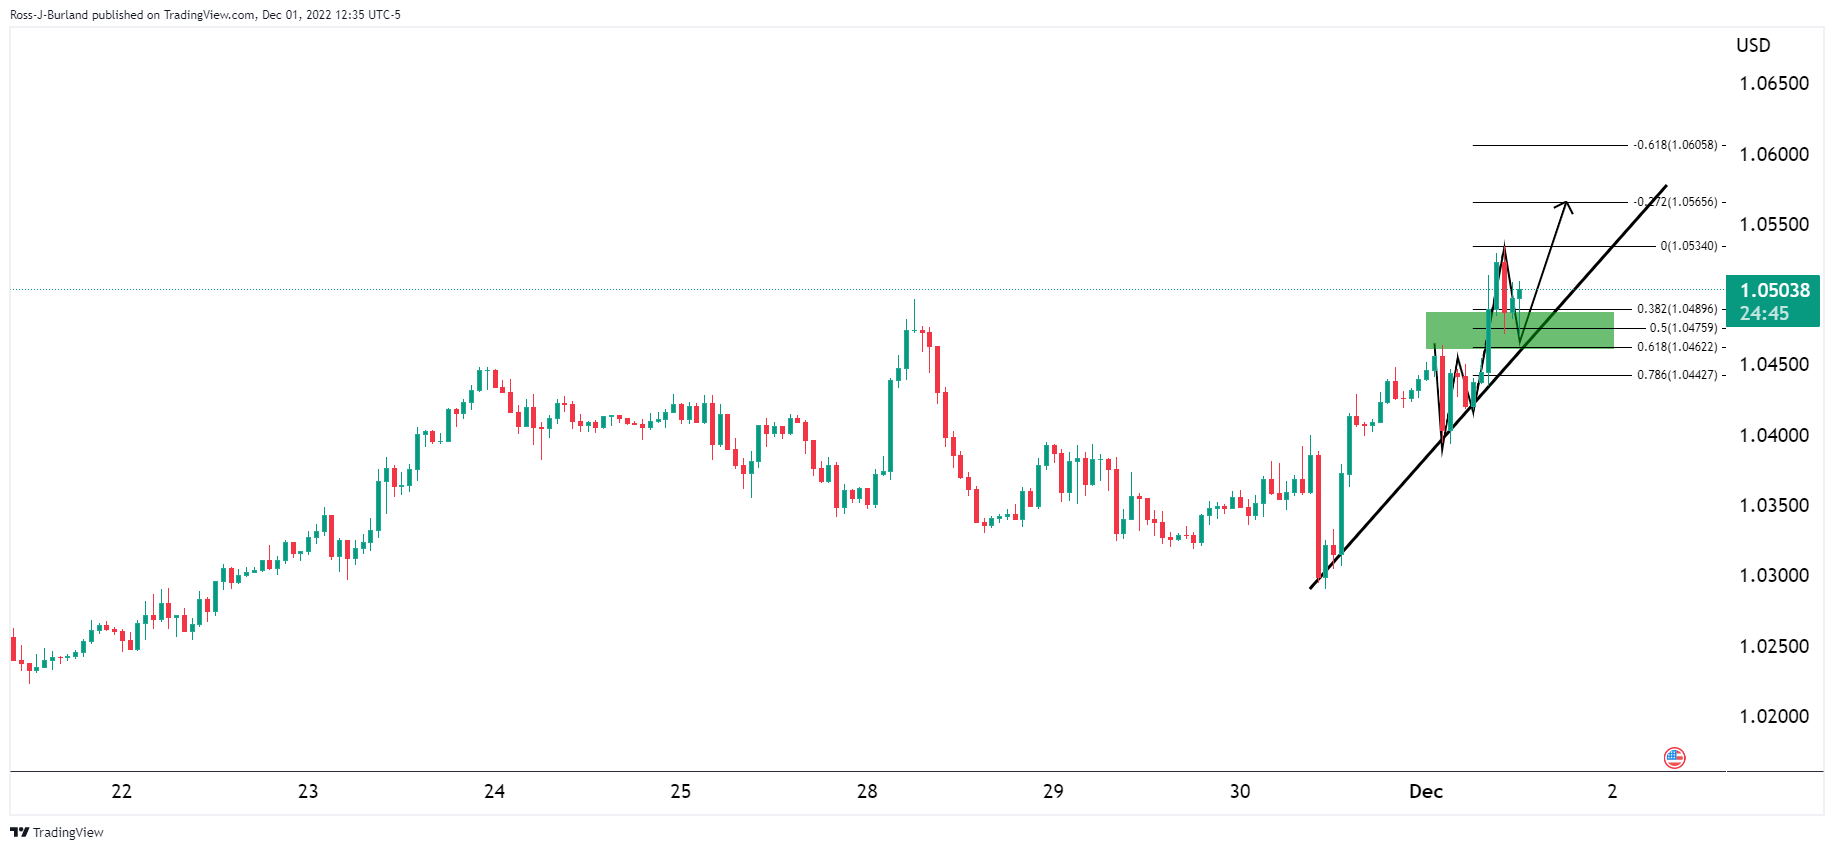
At this juncture, the W-formation has seen a correction into the 50% mean reversion area and support. The bulls are in control on the front side of the trendline support and eye higher highs before the week is out.
- The USD/CAD halted its fall as US data showed signs of further deterioration in the economy of the United States.
- Risk aversion spurred by weaker-than-expected US ISM Manufacturing PMI.
- Fed’s Bowman said there’s work to do by the US central bank.
The USD/CAD trims some of Wednesday’s losses spurred by a weak ISM Manufacturing activity report which threatens to tap the economy of the United States (US) into a recession. However, dovish commentary by the Federal Reserve (Fed) Chair Jerome Powell capped the USD/CAD gains. At the time of writing, the USD/CAD is trading at 1.3420.
Sentiment shifted negatively as US ISM Manufacturing PMI flashes a recession
Investors’ mood deteriorated after the Institute for Supply Management (ISM), released the Manufacturing PMI report for November, which dropped to the contractionary territory at 49.0, beneath 49.2 expectations, and trailed October’s 50.2. Timothy Fiore, the ISM’s Manufacturing Business Survey Committee chair, said the report “reflects companies’ preparing for lower output.” Additionally, the US Department of Labor (DoL) revealed that Initial Jobless Claims for the last week increased by 225K, below the expected 235K by analysts and less than the previous week’s reading.
Earlier, the US Department of Commerce (Doc) revealed that the Fed’s preferred inflation gauge, the US Core Personal Consumption Expenditure (PCE), rose by 5% YoY, below the previous month’s 5.2% reading, and aligned with consensus.
Elsewhere, the US Federal Reserve Chair Jerome Powell gave the green light to slow rate hikes. He said moderation could happen as soon as the December meeting, though he emphasized the Fed’s commitment to tackle inflation. Echoing some of his comments was Fed Governor Michell Bowman, saying,” We still have a lot of work to do to bring our policy rate to a level that is sufficiently restrictive to bring down inflation over time.”
Aside from this, the Canadian economic calendar, which featured November’s S&P Global PMI Manufacturing report, persisted in contractionary territory for the fourth consecutive month, rising by 49.6 above October’s 48.8. Paul Smith, economics director at S&P Global Market Intelligence, said, “Both output and new orders continued to fall, although perhaps of some comfort is that the degrees of decline were softer than in October.”
All that said, the USD/CAD daily chart showed the major found support at around 1.3400, though it failed to crack the confluence of the 20 and 50-day Exponential Moving Averages (EMAs) around 1.3440/45. That could pave the way for a break under 1.3400, sending the pair sliding toward the 100-day EMA at 1.3321. Otherwise, the USD/CAD might consolidate around the 1.3400-1.3440 area.
What to watch
The US and Canadian economic dockets will feature employment figures, which could shed some clues about the current economic status.
USD/CAD Key Technical Levels
- Silver price rose more than 1%, spurred by Federal Reserve Jerome Powell’s dovish speech.
- Soft US Dollar and US Treasury bond yields plummeting, a tailwind for XAG/USD.
- Silver Price Analysis: Once it cleared $22.00, a rally above $23.00 is on the cards.
Silver price soars more than 2% following a “dovish” perceived speech by the Federal Reserve (Fed) Chair Jerome Powell, who laid the ground for lower rate hikes Wednesday. The United States (US) economic docker revealed mixed data, undermining the US Dollar (USD), as shown by the rise of precious metals and most FX peers. At the time of writing, the XAG/USD is trading at $22.55.
Upbeat sentiment, dovish Fed, and mixed US data weighed on the US Dollar
Traders’ mood remains upbeat after Powell’s speech. The Federal Reserve Chair said that “the time for moderating the pace of rate increases may come as soon as the December meeting,” spurring US Dollar weakness and sending Silver prices up. He added that most Fed policymakers would not want to “overtighten,” stating that he does not want to cut rates soon.
Data-wise, the Institute for Supply Management (ISM) revealed that manufacturing activity in the United States fell to 49.0 below 49.2 estimates and trailed October’s 50.2 reading, the lowest since May 2020. Usually, when the ISM Manufacturing PMI drops below 50, activity is in contractionary territory. However, lower readings would help to tame inflation, though it opens the door for a recession.
Earlier, the US Department of Commerce (Doc) revealed that the Fed’s preferred inflation gauge, the US Core Personal Consumption Expenditure (PCE), rose by 5% YoY, below the previous month’s 5.2% reading, and aligned with consensus. At the same time, the US Department of Labor (DoL) revealed that Initial Jobless Claims for the week ending on November 26 rose by 225K, below the expected 235K by analysts and less than the previous week’s reading.
Silver Price Analysis: Technical outlook
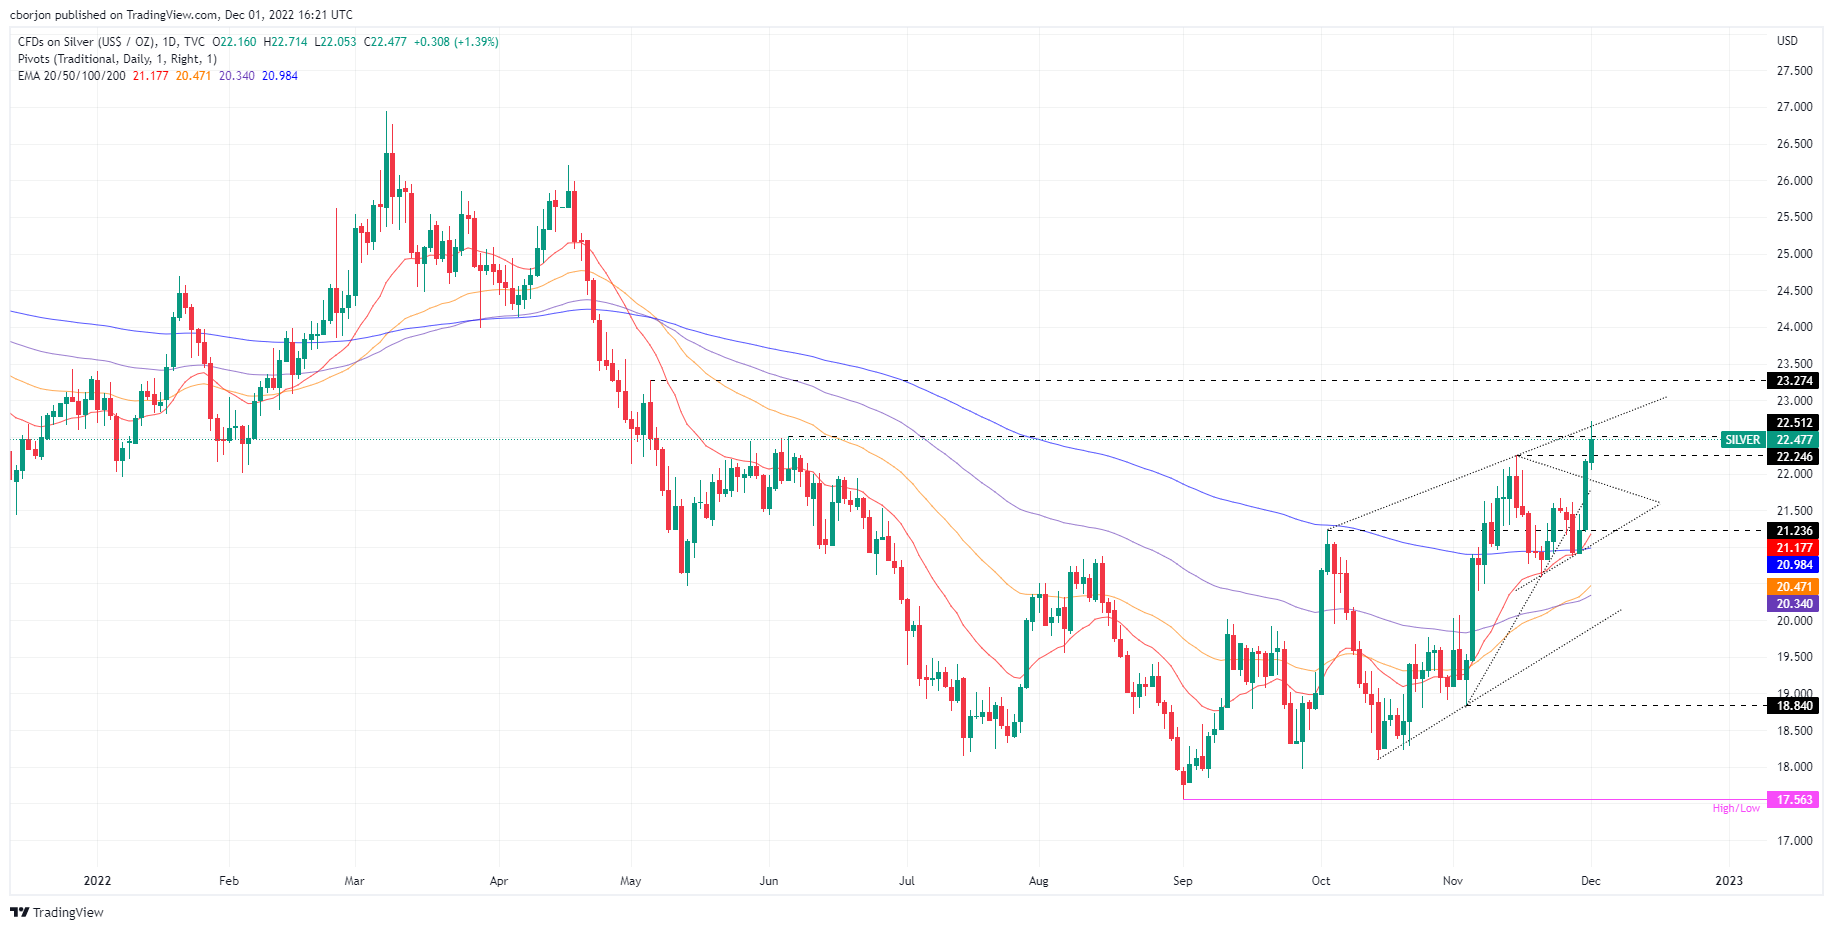
From a daily chart perspective, the XAG/USD is upward biased, trading above the daily Exponential Moving Averages (EMAs). After bottoming around the year-to-date (YTD) lows of around $17.56, the white metal followed an upward trajectory, which initially failed to clear the October 4 swing high of $21.23. Still, once cleared, XAG/USD hurdle the $22.00 psychological level. That said, the Silver price path of least resistance is upwards.
The XAG/USD first resistance is the June 6 high of $22.51, followed by the $23.00 figure, ahead of the May 5 high of $23.27.
Data released on Thursday, showed Persona Spending rose by 0.8% in October while Personal Income increased by 0.7%. Analysts at Wells Fargo, point out that the rising cost of goods and services means that nominal spending would increase even if the volume of goods and services consumed were flat. In other words, consumers are increasing their spending even after adjusting for inflation.
Key Quotes:
“Yet even as prices grow faster than paychecks, consumers are still buying more even in volume terms. This is a real pickle for inflation fighters at the Federal Reserve because firms who find that they can pass along price increases without a concomitant decline in demand have no financial incentive to lower prices.”
“The monthly change in the PCE deflator was unchanged at 0.3%, but due to base effects, the year-over-year rate did cool to 6.0% in October from an upwardly revised 6.3% in the prior month. The year-over-year rate of core inflation also came down slightly to 5.0% in October.”
“Monetary policy acts with a lag, and while it still may be early days, consumers' relentless spending suggests they remain unfazed by high inflation and the rate hikes intended to get prices under control.”
“The staying power of the consumer has been uncanny thus far, but consumers are no exception to the same macro headwinds that have plagued the rest of the economy.”
- Broad based decline of the US Dollar triggers volatility across financial markets.
- USD/MXN gives up Wednesday’s rally showing Mexican Peso still in command.
- Another test of 19.00/05 should not be ruled out.
The USD/MXN is falling sharply on Thursday, after a wild Wednesday. Yesterday, the pair jumped, rising not only above 19.30 but also to 19.46. It respected a downtrend line and resume the downside, amid a broad slide of the US Dollar.
On Wednesday, USD/MXN peaked at 19.46, trading momentarily above the 20-day Simple Moving Average. The upside was capped by a downtrend line and closed the day below 19.30: a sign that the Greenback is not ready yet for a sustainable rebound.
All the positive developments for the Dollar, have been reversed during the last 24 hours. The bearish trend and momentum have been reaffirmed. While under 19.30, the Mexican Peso could likely test again the 19.00/05 psychological area. A break lower would target 18.85.
USDMXN daily chart
-638055071892970358.png)
With US inflation forecast by economists at Société Générale to decrease from 8.0% in 2022 to 4.3% in 2023, the impact on Gold via real rates should continue to be extremely bearish.
Headwinds gathering
“In 2023, we expect a Fed pivot toward more dovish policies, and the 10-year rate should gradually decrease. By itself, this is bullish for Gold. But we expect inflation to drop faster than rates from an average headline CPI of 8.0% in 2022 to 4.2% in 2023 As a result, we expect real rates to surge, driving down Gold prices sharply.”
“After Q3-23, Gold’s fortunes should reverse, as we expect a mild US recession in early 2024 and sluggish EU and China growth. Investors are likely to hedge such risks by transferring part of their allocations to Gold. At this point, we would expect the Fed to turn dovish again, with inflation somewhat under control, albeit higher than before COVID.”
- US Dollar Index is down by 0.90%, at lowest in almost four months.
- Pound also rises sharply versus the Euro on Thursday.
- GBP/USD heads for the first close above the 200-day SMA since September 2021.
The GBP/USD is having the best day in weeks, boosted by a weaker US Dollar across the board. The pound is also rising versus the Euro. Cable peaked at 1.2310, the highest since June and then pulled back to 1.2260.
During the last hours, the US Dollar trimmed losses but it is still sharply lower, after extending the slide that started on Wednesday following Fed Chair Jerome Powell's speech. Fed officials sign that at the December meeting rates will be raised again but at a slower pace.
Expectations about a less hawkish are pushing the Dollar sharply lower. Economic data released on Thursday showed easing inflation signs (declines in the Core PCE and the Prices Paid Index of the ISM Manufacturing) and weakening conditions in the Manufacturing sector (ISM Manufacturing fell in November to 49).
Beyond the Dollar's weakness, the Pound is also rising versus the Euro. The EUR/GBP broke below the 0.8570 critical support, and fell so far to 0.8552, the lowest since August 30.
Above the 200-day SMA
The GBP/USD is on its way to the first close above the 200-day Simple Moving Average (today at 1.2150) another positive technical development for the bulls. So far, spot price has been unable to consolidate above 1.2300 that is the resistance level to break; if it manages to do it would open the doors to more gains.
Technical levels
EUR/USD has moved back above the 1.05 level. But energy issues are set to weigh on the Euro, dragging the pair down to parity in 2023, economists at Rabobank report.
Re-opening of China will increase the competition for global LNG supplies
“While the EUR has been lifted by a decline in gas prices from their highs and hopes that Germany may face less bad recessionary risks, this respite may be short-lived.”
“In spring and summer 2023 Europe could be struggling to refill its gas storage facilities at today’s prices. A re-opening of China will increase the competition for global LNG supplies.”
“While we have lifted our one and three-month EUR/USD forecasts to reflect the recent improvement in risk appetite, we continue to see risk of the EUR dropping back through parity next year as the next wave of the gas price crisis hits.”
- ISM Manufacturing PMI dropped into contraction territory below 50 in November.
- US Dollar Index continues to push lower, losing more than 1% on the day.
The economic activity in the United States manufacturing sector contracted in November with the ISM Manufacturing PMI declining to 49 from 50.2 in October. This reading came in below the market expectation of 49.8.
Further details of the publication showed that the Prices Paid Index component dropped to 43 from 46.6, the Employment Index edged lower to 48.4 from 50 and the New Orders Index declined to 47.2 from 49.2.
Assessing the data, "with Business Survey Committee panellists reporting softening new order rates over the previous six months, the November composite index reading reflects companies' preparing for future lower output," said Timothy R. Fiore, Chair of the Institute for Supply Management (ISM) Manufacturing Business Survey Committee.
Market reaction
The US Dollar stays under constant selling pressure following this report and the US Dollar Index was last seen losing 1.1% on the day at 104.70.
- Gold price climbs above $1800 for the first time since August 2022.
- Dovish speech by the Federal Reserve Chair Jerome Powell weakened the US Dollar.
- The US Dollar Index tumbles below the 105.000 mark, while US T-bond yields plunge to 3.60%.
Gold price rallies and hits a fresh three-month high following a more “dovish” than expected message from US Federal Reserve (Fed) Chairman Jerome Powell. Another factor denting demand for the US Dollar (USD) is that the Federal Reserve preferred gauge for inflation was unchanged, while unemployment claims were lower than expected. At the time of writing, the XAU/USD is trading above the $1800 mark for the first time since August.
Gold soars on dovish remarks by Fed Chair Powell as US bond yields plummet
XAU/USD remains in the driver’s seat after hitting a daily low of $1767, Wednesday’s high, towards $1803.40, following dovish remarks from Jerome Powell on Wednesday. Powell said that “moderating the pace of rate increases may come as soon as the December meeting,” cementing expectations that the Fed will move away from the 75 bps hikes they’ve pursued at the last four meetings in favor of a slower 50 bps pace. In the Q&A after the speech, he said that “my colleagues and I do not want to overtighten,” referring to monetary policy.
Data-wise, the economic docket for the United States (US) did not help the US Dollar, which remains on the back foot following Powell’s speech. The US Core Personal Consumption Expenditure (PCE), the Fed gauge for inflation, rose by 5% YoY, below the previous month’s 5.2% reading, and aligned with consensus, Commerce Department data revealed Thursday.
In the meantime, initial Jobless Claims for the week ending in the last week on November 26 rose by 225K, below the expected 235K by analysts and less than the previous week’s reading.
Elsewhere as the US Dollar Index (DXY) drops below the 105.000 mark, extending its daily losses to 1%, US Treasury bond yields are plunging, with the US 10-year Treasury bond yield reaching 3.600%, while Gold prices extended its gains.
Gold 1-hour Chart
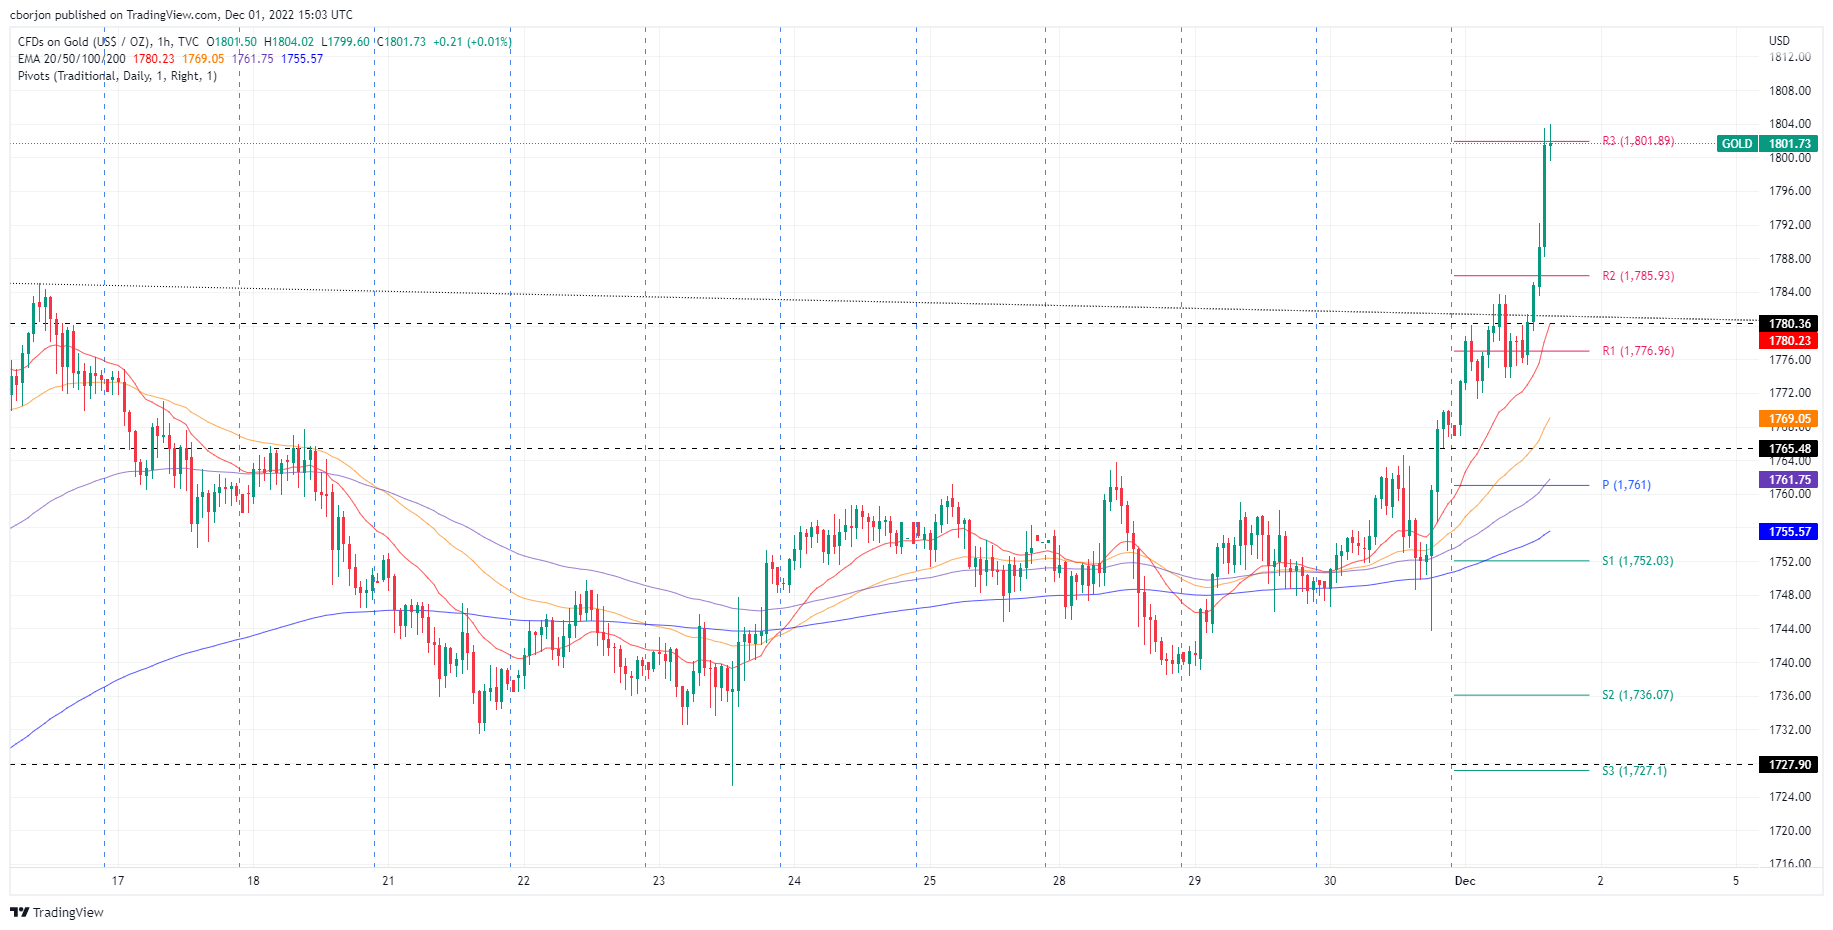
Gold Key Technical Levels
Economists at the Bank of America Global Research expect the US Dollar to remain on a solid foot at the beginning of 2023 but to drift lower as the year unfolds.
Positive USD forces remain, but will fade gradually
“For now, the forces that have supported the USD this year remain valid, despite the recent correction lower.”
“In our baseline, the USD remains strong early next year and starts a more sustained downward path after the Fed pauses.”
“We forecast EUR/USD at parity and USD/JPY at 146 by 1Q23. However, in our baseline the USD gradually weakens starting in Q2, to 1.10 for EUR/USD and to 135 for USD/JPY by end-2023, with our EUR/USD forecast above the consensus.”
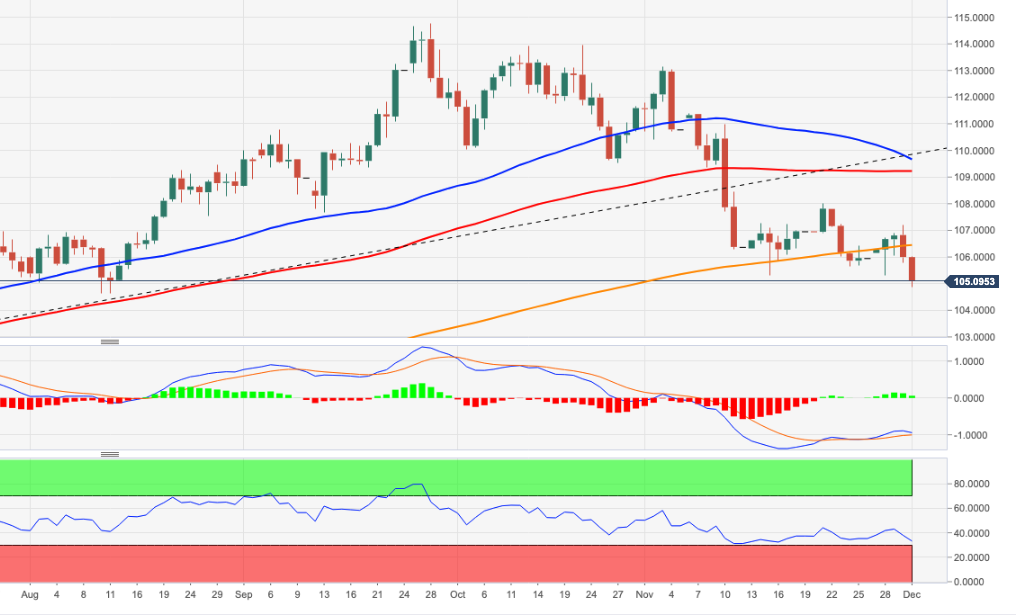
- Japanese Yen among top performers as the US Dollar remains under pressure.
- Greenback resumes slide after United States’ economic reports.
- USD/JPY down more than 200 pips, but no signs of stabilization seen so far.
The USD/JPY printed a fresh three-month during Thursday’s American session, following the release of US economic data at 135.73. It then bounced modestly toward the 136.00 zone. It remains under pressure, with the US Dollar down across the board.
Easing inflation in the US hits the Dollar
On Wednesday, Federal Reserve Chairman Jerome Powell pointed toward a slowdown in rate hikes, as soon as December. His comments were no surprise but triggered a rally in stocks and in Treasuries. The US Dollar began a decline that is still going on.
Inflation data released on Thursday showed a slowdown, although still at elevated levels with the Core PCE at 5% (annual) in October down from the 5.2% of September. Personal income and Spiting rose 0.7% and 0.8% respectably. Continuing Jobless Claims rose for the seventh week in a row to the highest level since March.
The numbers did not help the Dollar and US yields held near monthly lows, supporting the Japanese Yen. Not even higher equity prices in Wall Street are offsetting the strength of the yen.
Oversold?
The USD/JPY is on its way to the lowest daily close since mid-August, falling for the fourth consecutive day. The pair is challenging the 136.00 area and below the next support emerges at 135.50. Below a horizontal line is seen around 134.60 and then appears the 200-day Simple Moving Average at 134.40.
No signs of consolidation are seen at the moment. Despite oversold reading in many technical indicators, the Momentum remains extremely negative. A rebound back above 137.00 could alleviate the bearish pressure. Above 137.70 the outlook for the Dollar could improve (or become less negative).
Technical levels
Federal Reserve (Fed) Governor Michelle Bowman noted on Thursday that the headline and core inflation have slowed slightly but added that they are still unacceptably high, as reported by Reuters.
Additional takeaways
"I expect ongoing increases in rate hikes at coming meetings."
"We still have a lot of work to do but it is appropriate for us to slow the pace of increases."
"That will allow us to more fully assess the impact of our actions."
"My views on size and pace of rate hikes will be guided by incoming data."
"Looking for signs inflation has peaked and is on a downward path."
"Policy will have to remain restrictive for some time to get inflation down."
"I'll continue to watch labor market to assess the impact of our actions there."
"We are not seeing a significant impact on reducing inflation."
"They are still at high levels and I need to see our actions have an impact."
"Until then, I expect we will have a slightly higher terminal rate than I had anticipated at sept meeting."
"Balance sheet not creating issues at this point, we need to continue to monitor."
Market reaction
The US Dollar stays under heavy bearish pressure following these comments and the US Dollar Index was last seen losing 0.92% on the day at 104.90.
- EUR/USD extends the upside momentum above 1.0500.
- The June high past 1.0600 now emerges as the next target.
EUR/USD trades on a firm foot and manages to surpass the 1.0500 barrier to clinch fresh multi-month tops on Thursday.
Gains in the pair are now likely to pick up pace following the breakout of the 200-day SMA and the 10-month resistance line. Against that, there are no resistance levels of note until the June high at 1.0614 (June 27).
Further upside in EUR/USD remains on the cards while above the 200-day SMA, today at 1.0369.
EUR/USD daily chart
Strategists at Société Générale update their Crude Oil price forecasts. They expect the black gold to remain elevated in the first half of next year before declining towards $93.50 in the last quarter of 2023.
Oil market looks set to remain in deficit every quarter until the end of Q4 '23
“According to our models, the market looks set to remain in deficit every quarter until the end of Q4 '23, pulling yet more Oil from inventories.”
“We forecast Oil prices to average $98/bbl in Q1 '23 and $108/bbl in Q2 '23, with the China reopening/Russian sanctions kicking in. For the second half of 2023, we forecast a decline in Oil prices, implying an average of $93.5/bbl in Q4 '23. This view assumes fading risk premium due to Russian sanctions, a slowdown in economic activity due to a recession in the US and China reopening proving choppy and probably gradual.”
“In 2024 and 2025, we expect prices to rise back toward $100/bbl and $110/bbl respectively, as inventories would still be very low and significant backwardation re-emerges.”
- EUR/USD gathers extra steam and surpasses the 1.0500 mark.
- The dollar remains offered and trades in multi-week lows.
- US ISM Manufacturing comes next in the calendar.
EUR/USD extends the upside momentum to new multi-month peaks north of the 1.0500 barrier on Thursday.
EUR/USD now looks to US ISM
EUR/USD looks strong and extends the recent brewakout of the key 200-day SMA as well as the 10-month resistance line, opening the door at the same time to the continuation of the uptrend, at least in the near term.
The renewed and pronounced selling pressure in the greenback lent further wings to the rebound in spot so far, all after Chief Powell reinforced the idea that the Fed could slow the pace of the upcoming interest rate hikes in the next months at his speech on Wednesday.
Following the above, the probability of a half-point rate raise at the Fed’s 14 December meeting is now at almost 80% according to CME Group’s FedWatch Tool.
Earlier in the euro area, German Retail Sales contracted 2.8% MoM in October and 5.0% over the last twelve months, while the final Manufacturing PMI rose to 46.2 in November (from 45.1). In the broader Euroland, the Unemployment Rate improved to 6.5% in October, while the final Manufacturing PMI also advanced to 47.1 (from 46.4).
In the US, the headline PCE rose 6.0% YoY in October and 5.0% when comes to the Core PCE. In addition, weekly Claims rose by 225K in the week to November 26 and Personal Income and Personal Spending expanded at a monthly 0.7% and 0.8%, respectively, in October.
Later in the session, the US ISM Manufacturing is expected to grab all the attention ahead of speeches by Fed’s Logan, Bowman and Barr.
What to look for around EUR
EUR/USD sees its upside bias renewed on Thursday in response to the continuation of the downside bias in the dollar.
In the meantime, the European currency is expected to closely follow dollar dynamics, the impact of the energy crisis on the region and the Fed-ECB divergence. In addition, markets repricing of a potential pivot in the Fed’s policy remains the exclusive driver of the pair’s price action for the time being.
Back to the euro area, the increasing speculation of a potential recession in the bloc emerges as an important domestic headwind facing the euro in the short-term horizon.
Key events in the euro area this week: Germany Retail Sales, ECB General Council Meeting, Germany/EMU Final Manufacturing PMI, EMU Unemployment Rate (Thursday) - ECB Lagarde, Germany Balance of Trade (Friday).
Eminent issues on the back boiler: Continuation of the ECB hiking cycle vs. increasing recession risks. Impact of the war in Ukraine and the persistent energy crunch on the region’s growth prospects and inflation outlook. Risks of inflation becoming entrenched.
EUR/USD levels to watch
So far, the pair is gaining 0.95% at 1.0505 and faces the next up barrier at 1.0513 (weekly high December 1) ahead of 1.0614 (weekly high June 27) and finally 1.0773 (monthly high June 9). On the flip side, a breach of 1.0330 (weekly low November 28) would target 1.0222 (weekly low November 21) en route to 1.0042 (100-day SMA).
The Rand has sold off aggressively today, with USD/ZAR rising over 4%. The pair could extend its rally if South Africa President Cyril Ramaphosa resigns today, economists at TD Securities report.
Ramaphosa likely to announce his resignation
“President Ramaphosa will make an announcement soon, likely resigning from his post. Speculation started to spread earlier today, and all eyes are on the 3:00 PM London time press conference. At the time of writing, we think the odds that Ramaphosa resigns today have exceeded 50%.”
“We think that USD/ZAR has room to extend the upside move to over 5% today, and possibly more in the coming days. This is predicated on Ramaphosa's resignation today, which would start a succession crisis within the ANC and bring about political confusion to South Africa.”
Eurozone inflation for November surprised to the downside but data was unable to move EUR/USD significantly. Economists at Commerzbank expect the pair to remain at current levels for now.
ECB is likely to continue moving in sync with the Fed
“Inflation data is likely to be sufficient to give the doves on the ECB board the upper hand at the December meeting. Even though yesterday’s data did not provide a convincing picture of falling inflation pressure due to the heavy fluctuation of energy prices. But for now, it is quite possible that inflation might have peaked in the euro zone too. That means the ECB is likely to continue moving in sync with the Fed and also reduce the speed of its rate hikes.”
“If the hawks amongst the Fed and ECB do not manage to influence market expectations significantly again there is a lot to suggest that EUR/USD will trade around current levels for now.”
- The index remains well on the defensive and breaks below 105.00.
- The continuation of the downside could drop to the August low.
DXY extends the leg lower to the area below the 105.00 level for the first time since mid-August.
The continuation of the selling pressure could motivate the dollar to shed further ground and challenge the August low at 104.63 (August 10) in the short-term horizon.
Below the 200-day SMA at 105.51, the dollar’s outlook should remain negative.
DXY daily chart
- Initial Jobless Claims in the US declined by 16,000 in the week ending November 26.
- US Dollar Index stays deep in negative territory near 105.00.
There were 225,000 initial jobless claims in the week ending November 26, the weekly data published by the US Department of Labor (DOL) showed on Thursday. This print followed the previous week's print of 241,000 (revised from 240,000) and came in better than the market expectation of 235,000.
Further details of the publication revealed that the advance seasonally adjusted insured unemployment rate was 1.1% and the 4-week moving average was 228,750, an increase of 1,750 from the previous week's revised average.
"The advance number for seasonally adjusted insured unemployment during the week ending November 19 was 1,608,000, an increase of 57,000 from the previous week's unrevised level of 1,551,000," the DOL noted in its publication.
Market reaction
The US Dollar stays under heavy selling pressure and the US Dollar Index was last seen losing 0.8% on the day at 105.00.
US ISM Manufacturing PMI overview
The Institute of Supply Management (ISM) will release its latest manufacturing business survey result, also known as the ISM Manufacturing PMI for October at 15:00 GMT this Thursday. The index is expected to show a contraction in the manufacturing sector activity during November and fall below the 50 mark for the first time since June 2020. Given that the Fed looks more at inflation than growth, investors will keep a close eye on the Prices Paid sub-component, which is anticipated to edge higher from 46.6 in October to 47.5 during the reported month.
How could it affect EUR/USD?
Ahead of the key release, the US Dollar drops to a nearly four-month low on Thursday in the wake of the overnight dovish remarks by Fed Chair Jerome Powell. A weaker-than-expected ISM Manufacturing PMI will be seen as another sign of a slowdown in the US economy and exert additional downward pressure on the greenback. This, in turn, should assist the EUR/USD pair to capitalize on its intraday positive move beyond the very important 200-day SMA.
Conversely, a stronger print is unlikely to provide any respite to the USD bulls amid rising bets for a less aggressive policy tightening by the Fed. This, in turn, suggests that the path of least resistance for the USD is to the downside and supports prospects for a further near-term appreciating move for the EUR/USD pair.
Valeria Bednarik, Chief Analyst at FXStreet, offers a brief technical overview and outlines important technical levels to trade the major: “The EUR/USD pair daily chart shows that the pair has advanced above its 200 Simple Moving Average (SMA), while the 20 SMA accelerated north below the longer one, reflecting increased buying interest. The Momentum indicator keeps heading lower within positive territory amid a weak daily opening, while the Relative Strength Index (RSI) consolidates at around 64. Overall, the risk is skewed to the upside, although the pair needs to clear its recent high at 1.0496 to confirm a sustainable rally.”
“The 4-hour chart favors another leg higher, although additional confirmations are needed. The pair is developing above all of its moving averages, with the 20 SMA picking up above bullish longer ones. Technical indicators, however, have lost their directional strength and stand pat within positive levels. Whether EUR/USD can storm through 1.0500 will depend on the upcoming US first-tier figures,” Valeria adds further.
Key Notes
• EUR/USD: Break above 1.05 could open the door to an extended rebound up toward 1.08 – MUFG
• EUR/USD outlook: The Euro keeps firm tone on weaker dollar, improved economic data
• EUR/USD: High volatility still in play
About the US ISM manufacturing PMI
The Institute for Supply Management (ISM) Manufacturing Index shows business conditions in the US manufacturing sector. It is a significant indicator of the overall economic condition in the US. A result above 50 is seen as positive (or bullish) for the USD, whereas a result below 50 is seen as negative (or bearish).
Inflation in the US, as measured by the Personal Consumption Expenditures (PCE) Price Index, declined to 6% on a yearly basis in October from 6.3% in September, the US Bureau of Economic Analysis announced on Thursday. This reading came in below the market expectation of 6.2%.
The annual Core PCE Price Index, the Federal Reserve's preferred gauge of inflation, declined to 5% from 5.2% as expected.
Further details of the publication revealed that Personal Spending and Personal Income rose by 0.8% and 0.7%, respectively, on a monthly basis in October.
Market reaction
The US Dollar continued to weaken against its rivals and the US Dollar Index was last seen losing 0.75% on the day at 105.05.
The US Dollar has continued to trade at weaker levels after falling sharply following a keynote speech from Fed Chair Powell. A strong Nonfarm Payrolls report is needed to reverse the Greenback’s decline, economists at MUFG Bank report.
Financial conditions continue to ease
“The lack of strong pushback against loosening of financial conditions has given market participants the green light to continue chasing recent risk-on trends including a weaker US Dollar.”
“The latest US economic data releases yesterday were also unfavourable for the USD showing a further loss of growth momentum in the labour market and a worrying drop in business confidence.”
“The developments leave the US Dollar in desperate need of a solid NFP report tomorrow to stem further losses.”
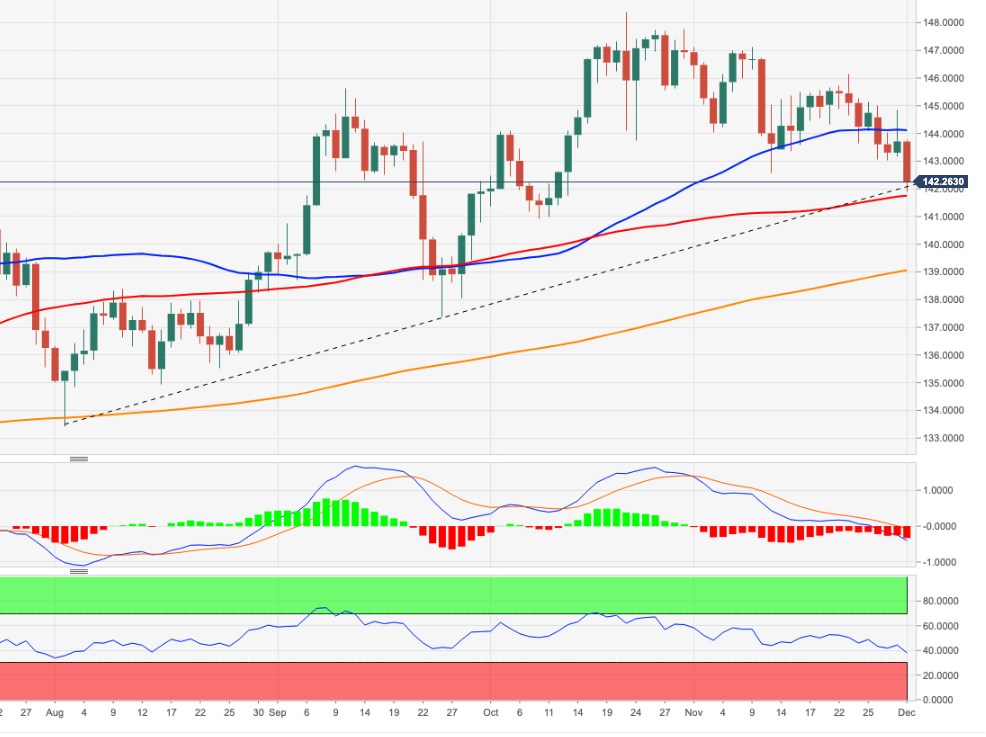
- EUR/JPY accelerates the decline below the 142.00 mark.
- Further losses could revisit the October low in the sub-141.00 area.
EUR/JPY looks well offered and drops to new 2-month lows in the 141.00 region on Thursday.
The sharp pullback below the 4-month support line opens the door to a deeper retracement in the short term, with the immediate target at the October low at 140.89 (October 10).
Below the latter emerges the key 200-day SMA, today at 139.02. The outlook for the cross is expected to remain positive while above this region.
EUR/JPY daily chart
- GBP/USD rallies to a fresh multi-month high on Thursday amid the prevalent USD selling bias.
- Powell’s dovish remarks on Wednesday drags US bond yields lower and weigh on the buck.
- The technical set-up favours bullish traders and supports prospects for further near-term gains.
The GBP/USD pair builds on the overnight solid bounce from the 1.1900 mark, or the weekly low and gains strong follow-through traction for the second successive day on Thursday. The positive momentum remains uninterrupted through the early North American session and lifts spot prices to the 1.2200 mark, or the highest level since August 12.
The US Dollar struggles to gain any meaningful traction and remains depressed near a multi-month low, which, in turn, acts as a tailwind for the GBP/USD pair. Fed Chair Jerome Powell sent a clear message on Wednesday that the US central bank could soon slow the pace of its policy tightening as soon as in December. This leads to a further decline in the US Treasury bond yields and continues to weigh on the Greenback.
Apart from this, a generally positive tone around the equity markets is seen as another factor exerting downward pressure on the safe-haven buck and benefiting the high beta British Pound. The aforementioned supporting factors help offset the overnight dovish remarks by Bank of England (BoE) Chief Economist Huw Pill. Even a bleak outlook for the UK economy fails to dent the bullish sentiment surrounding the GBP/USD pair.
With the latest leg up, spot prices move back above a technically significant 200-day Simple Moving Average (SMA) for the first time in 2022. This could be seen as a fresh trigger for bullish traders and might have already set the stage for a further near-term appreciating move. Traders now look to the US economic docket, featuring the Personal Consumption Expenditures Price Index (the Fed's preferred inflation gauge) and the ISM Manufacturing PMI.
The data, along with the US bond yields and the broader risk sentiment, will influence the USD price dynamics and provide some impetus to the GBP/USD pair. The focus will then shift to the release of the closely-watched US monthly jobs report - popularly known as NFP. Nevertheless, the technical set-up seems tilted in favour of bullish traders and suggests that the path of least resistance for the pair is to the upside.
Technical levels to watch
GBP/USD extends gains through the mid-1.21 area. Economists at Scotiabank expect the pair to test the 1.24/25 area in the next few weeks.
More upward pressure on Cable in the short and medium term
“Marginal new highs for the GBP through 1.2150 suggest more upward pressure on Cable in the short and medium term.”
“GBP/USD is breaking out bullishly from a downward sloping channel (bull flag) that has developed over the past week, implying the resumption of short-term trend gains, while sustained strength through 1.2060 on the week (50% retracement of the 2022 decline) pave the way for the pair to push on to the 1.24/1.25 zone (61.8% Fib at 1.2458) in the next few weeks.”
“Support is 1.2055/60 intraday.”
- Gold price rallies back closer to a three-month high amid sustained US Dollar selling.
- Federal Reserve Chair Powell’s dovish comments continue to weigh on Greenback.
- Sliding US Treasury bond yields further contribute to driving flows toward XAU/USD.
- Traders now await the Fed’s preferred inflation gauge for some meaningful impetus.
Gold price gains traction for the third successive day on Thursday and climbs to over a two-week high during the mid-European session. The XAU/USD is currently placed just above the $1,780 level, with bulls eyeing a move beyond the three-month high touched in November.
Powell’s dovish remarks weigh on US Dollar and benefit Gold price
The US Dollar languished near a technically significant 200-day Simple Moving Average (SMA) in the wake of the overnight dovish remarks by Federal Reserve Chair Jerome Powell. A weaker Greenback turns out to be a key factor acting as a tailwind for the Dollar-denominated Gold price. Powell sent a clear message that the US central bank will soften its stance and said that it was time to moderate the pace of interest rate hikes.
Declining US Treasury bond yields provides an additional lift to XAU/USD
The prospects for a less aggressive policy tightening by the Federal Reserve contribute to an extension of the recent decline in the US Treasury bond yields. In fact, the yield on the benchmark 10-year US Treasury note drops to a nearly two-month low, which continues to weigh on the US Dollar and further benefits the non-yielding Gold price. That said, uncertainty over peak interest rates in the United States might cap the XAU/USD.
US Personal Consumption Expenditures Price Index eyed for fresh impetus
In fact, Powell warned on Wednesday that interest rates could continue to rise to even higher levels than previously expected, largely due to stubbornly high inflation. Hence, the market focus shifts to the US Personal Consumption Expenditures (PCE) Price Index for November. The Federal Reserve's preferred inflation is expected to remain well above the 2% target, though signs of easing price pressures could dent the US Dollar and boost Gold price.
Thursday's US economic docket also features the release of ISM Manufacturing PMI. This, along with the US bond yields, might influence the USD price dynamics. Apart from this, the broader market risk sentiment should allow traders to grab short-term opportunities around Gold price ahead of the closely-watched US monthly jobs (NFP) on Friday.
Gold price technical outlook
From a technical perspective, momentum beyond the $1,785-$1,786 region should allow Gold price to reclaim the $1,800 psychological mark. The latter coincides with the very important 200-day SMA, which if cleared will be seen as a fresh trigger for bullish traders and set the stage for a further near-term appreciating move. The XAU/USD might then climb to the $1,807-$1,808 region before eventually rallying to the next relevant hurdle near the $1,820 area.
On the flip side, a meaningful slide back below the $1,775 level is likely to find decent support near the $1,762-$1,760 horizontal zone. Any further decline is more likely to attract fresh buyers around the $1,740 region. The latter should act as a strong base for Gold price, which if broken decisively will negate the positive outlook and shift the near-term bias in favour of bearish traders.
Key levels to watch
Economists at Nordea expect more short-term pain for the Norwegian Krone and the Swedish Krona before they strengthen.
Stronger scandi currencies in the long run
“In the short-term, we have kept our forecast for EUR/NOK and EUR/SEK still looking for a weaker EUR/NOK and the EUR/SEK to remain weak as risk-sentiment is likely to deteriorate.”
“Longer out, we see a Chinese reopening and central banks pausing their rate hikes after the historic rate hiking cycle in 2022 as supportive for both the NOK and SEK.”
EUR/USD holds yesterday’s gains and looks poised to test levels above 1.05, economists at Scotiabank report.
“Peak Fed” pricing will exert more pressure on the USD
“We think solid returns in European stocks relative to US markets will help keep the EUR underpinned in the short run while ‘peak Fed’ pricing will exert more pressure on the USD in the longer term, paving the way for additional, if modest, EUR gains into 2023.”
“EUR/USD is holding this week’s consolidation range below 1.05 and just under retracement resistance at 1.0517 (50% Fibonacci retracement of the 2022 decline).”
“Solid (technically bullish) gains overall yesterday will offset the bearish price action in the EUR we saw at the start of the week to some extent but new highs are needed to give the EUR a more obvious and sustained lift.”
“Support is 1.0390/00 and 1.0300/20.”
UOB Group’s Economist Ho Woei Chen reviews the latest PMIs results in the Chinese economy.
Key Takeaways
“China’s official manufacturing and non-manufacturing PMIs slumped further in Nov amid a worsening COVID-19 outbreak and anti-lockdown protests. This is the second straight month that both PMIs are concurrently in contraction (defined as a reading <50).”
“Both PMI readings were below Bloomberg’s consensus expectation as they fell to their lowest since Apr which marked the start of a 2-month lockdown in Shanghai.”
“Due to the more challenging environment including rising recession risks in the developed economies, we have lowered our forecast for 4Q22 GDP to 3.9% y/y from earlier 4.5% y/y. For 2022 GDP, our forecast remains at 3.3%, after incorporating the stronger than expected 3Q22 data. We are also maintaining our 2023 GDP forecast for China at 4.8%.”
In light of the recent price action, USD/CNH could extend the decline to the 7.0200 region in the short term, note Economist Lee Sue Ann and Markets Strategist Quek Ser Leang at UOB Group.
Key Quotes
24-hour view: “The sharp plunge in USD yesterday came as a surprise (we were expecting sideways trading). The decline appears to be overdone but USD could test the 7.0200 first before the risk of rebound increases. The next support at 7.0000 is unlikely to come under threat today. Resistance is at 7.0800, followed by 7.1000.”
Next 1-3 weeks: “USD fell sharply the second straight day. The outsized drop is likely to extend to 7.0200, as low as 7.0000. The downside risk is intact as long USD does not move above 7.1450.”
Gold gained after Fed Chair Jerome Powell indicated the Fed will slow the pace of interest rate increases next month. Nevertheless, strategists at TD Securities expect the yellow metal to drift lower into the first quarter of next year.
Still considerable risks that policy keeps on tightening
“Fed Chair Powell signaled the Federal Reserve will slow the pace of interest-rate increases next month, but this does not mean rates will not go past 5%. However, market pricing of the terminal rate is now just under 5%.”
“The confirmation of a slower pace of tightening prompted the market to go bid for Gold. Still, given that inflation will be a problem for some time suggests that even though the rate of tightening may moderate, there are still considerable risks that policy keeps on tightening.”
“Current price action may be the result of the last short positions being covered. We still expect Gold will trend lower into Q1-23.”
See – Gold Price Forecast: Miles to go before XAU/USD shows a sustained shine – TDS
- EUR/GBP drifts lower for the second straight session and challenges the 0.8575-0.8570 support.
- Wednesday’s softer Eurozone inflation figures weigh on the Euro and exert downward pressure.
- The overnight dovish remarks by BoE’s Chief Economist Huw Pill should limit losses for the cross.
The EUR/GBP cross comes under heavy selling pressure on Thursday and drops to a fresh weekly low, back closer to the 0.8575-0.8570 support zone during the mid-European session.
The shared currency's relative underperformance against its British counterpart could be attributed to softer-than-expected Eurozone consumer inflation figures released on Wednesday. In fact, the flash estimate published by Eurostat showed that the annualized Eurozone Harmonised Index of Consumer Prices (HICP) decelerated to a 10.0% YoY rate in November from 10.6% in the previous month. This might have cooled expectations for more aggressive interest rate hikes by the European Central Bank (ECB), which, in turn, is seen dragging the EUR/GBP cross lower for the second straight day.
The high beta Sterling, on the other hand, benefits from the upbeat market mood and the prevalent US Dollar selling bias. This is seen as another factor exerting some downward pressure on the EUR/GBP cross. That said, the overnight dovish remarks by Bank of England (BoE) Chief Economist Huw Pill might keep a lid on any meaningful gains for the British pound. Apart from this, a bleak outlook for the UK economy should limit the downside for the EUR/GBP cross, at least for the time being.
Even from a technical perspective, repeated failures to find bearish acceptance below the 100-day SMA warrants some caution before positioning for any further depreciating move. That said, sustained weakness below the 0.8575-0.8570 horizontal support will mark a fresh breakdown and make the EUR/GBP cross vulnerable to challenge the very important 200-day SMA, currently around the 0.8535 region. This is followed by the 0.8500 psychological mark, which should now act as a pivotal point.
Technical levels to watch
The US Dollar stays on the back foot as markets position themselves for a smaller Federal Reserve rate increase. A possible cut of interest rates by the end of next year is the cornerstone of the USD weakness, economists at Commerzbank report.
Monetary policy is swinging to a more sustainable path
“Powell sounded a little dovish, emphasizing the high uncertainty for the inflation outlook and the risks that would be associated with a premature easing. Nevertheless, for the time being, the only thing that seems relevant for the financial markets is that Fed monetary policy is ‘normalizing.’ The 75 bps rate hikes to compensate for the too-long hesitation in 2021 are history.”
“Monetary policy is swinging to a more sustainable path. And that means that if inflation declines significantly next year and fears of a recession materialize, the market believes that interest rate cuts could be justified again as early as the end of 2023 which is the cornerstone of the USD weakness we also expect over the coming year.”
In recent weeks, EUR/USD has failed to break above the 1.0500 level. A move beyond here would clear the way towards 1.0800, economists at MUFG Bank report.
Inflation close to peaking in eurozone
“The next important resistance level for the pair comes in at the 1.0500 level which has held so far this month. A break above that level could open the door to an extended rebound up towards the late May/early June highs at around the 1.0800 level.”
“The latest eurozone CPI report revealed that headline inflation unexpectedly dropped to 10.0% in November although the core rate held at 5.0%. It has added to optimism that inflation is now in the process of peaking out which alongside much weaker activity data over the winter period should encourage the ECB to adopt a less hawkish policy stance. Nevertheless, a modest dovish repricing of ECB rate expectations is unlikely on its to prevent EUR/USD from continuing to rebound if the broad-based USD sell-off.”
“There is a strong seasonal pattern for the Euro strengthen against the US Dollar in December as well.”
- The index loses further ground and revisits 105.30.
- The dollar appears weak following Powell’s remark on Wednesday.
- Markets’ attention remains on inflation tracked by the PCE.
The greenback, in terms of the USD Index (DXY), adds to Wednesday’s pullback and drops to the 105.30 region, where decent contention has so far emerged.
USD Index focuses on data
The index retreats for the second session in a row and navigates the low-105.00s amidst increasing bearishness surrounding the buck, which was particularly, exacerbated after Chair Powell reinforced the case for a slower pace of future interest rate hikes. This new stance by the Fed could be announced as soon as at the December 14 gathering.
The current downside in the dollar comes in tandem with a tepid bounce in US yields in the short end and the belly of the curve, while the long end remains marginally on the defensive.
Later in the NA session, investors’ attention is expected to be on the publication of inflation figures measured by the PCE and the ISM Manufacturing. In addition, usual Initial Claims are due long with Personal Income, Personal Spending, the final Manufacturing PMI and Construction Spending.
Furthermore, Dallas Fed L.Logan (2023 voter, centrist) and FOMC’s Governors M.Bowman (permanent voter, centrist) and M.Barr (permanent voter, centrist) are also due to speak ahead of the Fed’s blackout period.
What to look for around USD
The dollar loses further ground and puts once again the contention area near 105.30 to the test in the wake of Powell’s speech and amidst the solid rebound in the risk complex.
While hawkish Fedspeak maintains the Fed’s pivot narrative in the freezer, upcoming results in US fundamentals would likely play a key role in determining the chances of a slower pace of the Fed’s normalization process in the short term.
Key events in the US this week: PCE, Initial Jobless Claims, Personal Income/Spending, Final Manufacturing PMI, ISM Manufacturing, Construction Spending (Thursday) - Nonfarm Payrolls, Unemployment Rate (Friday).
Eminent issues on the back boiler: Hard/soft/softish? landing of the US economy. Prospects for further rate hikes by the Federal Reserve vs. speculation of a recession in the next months. Fed’s pivot. Geopolitical effervescence vs. Russia and China. US-China persistent trade conflict.
USD Index relevant levels
Now, the index is retreating 0.36% at 105.48 and the breakdown of 105.30 (weekly low December 1) would open the door to 104.63 (monthly low August 10) and finally 103.41 (weekly low June 16). On the other hand, the immediate resistance emerges at 107.19 (weekly high November 30) seconded by 107.99 (weekly high November 21) and then 109.07 (100-day SMA).
The latest survey conducted by the Bank of England (BoE) decision maker panel (DMP) showed that “businesses expect higher interest rates to lead to lower investment and employment,” per Reuters.
Key findings
Private-sector output price inflation 7.2% in November vs 7.8% in October.
Expected year-ahead output price inflation 5.7% in November, down 0.5 pp from October.
Looking ahead, DMP members expected cpi inflation to be 7.2% one-year ahead, down from 7.6% in October.
Recruitment difficulties are reported to have begun to ease.
Overall business uncertainty was slightly down in November.
The Dollar is around 1% lower across the board. Economists at ING expect the US Dollar Index (DXY) to find solid support around the 105 level.
Overreaction?
“The Dollar came off sharply late yesterday on comments from Federal Reserve Chairman Jerome Powell which signalled that December would probably be the occasion to shift to a slower pace of rate hikes.”.
“We are tempted to say that looks an overreaction in that while Chair Powell did acknowledge the slowing in the pace of hikes, his core message was one of stubbornly high core inflation, particularly in the core services ex-housing category.”
“On the day, the core PCE inflation data is the biggest input, and we prefer DXY to find support near 105.00.”
“Consensus expects October core PCE to decelerate to 0.3% month-on-month from 0.5%. Any upside surprise in today’s core PCE reading could see the Dollar reverse overnight losses.”
- GBP/USD climbs to a fresh weekly high on Thursday amid sustained USD selling bias.
- Dovish remarks by Fed Chair Powell, weaker US bond yields weigh on the greenback.
- The technical set-up favours bullish traders and supports prospects for further gains.
The GBP/USD pair builds on the previous day's goodish rebound from a one-week low and gains traction for the second successive day on Thursday. The pair maintains its bid tone through the first half of the European session and hits a fresh weekly high, around the 1.2130-1.2135 area in the last hour.
The overnight dovish-sounding remarks by Fed Chair Jerome Powell, along with a further decline in the US Treasury bond yields, keep the US Dollar bulls on the defensive near a multi-month low. Apart from this, a generally positive tone around the equity markets is seen undermining the safe-haven buck and acting as a tailwind for the GBP/USD pair.
From a technical perspective, spot prices have now moved well within the striking distance of the very important 200-day SMA. The said barrier is currently pegged near the 1.2150 area, which if cleared will be seen as a fresh trigger for bullish traders and set the stage for an extension of the near-term appreciating move for the GBP/USD pair.
Given that oscillators on the daily chart are holding in the bullish territory and are still far from being in the overbought zone, the GBP/USD pair might then aim to reclaim the 1.2200 mark. The momentum could further get extended and lift spot prices to the top boundary of over a two-month-old ascending channel, currently around the 1.2300 round figure.
On the flip side, any meaningful pullback below the 1.2100 mark now seems to find decent support near the daily low, around the 1.2045 region. A convincing break below might prompt some technical selling and drag the GBP/USD pair back toward the 1.2000 psychological mark. Some follow-through selling will expose the 1.1945-1.1940 horizontal support.
The latter should act as a strong base for spot prices, which if broken decisively will negate any near-term positive bias and pave the way for a deeper corrective decline. The GBP/USD pair might then turn vulnerable to weaken further below the 1.1900 mark and test the next relevant support near the 1.1860-1.1855 horizontal zone.
GBP/USD daily chart
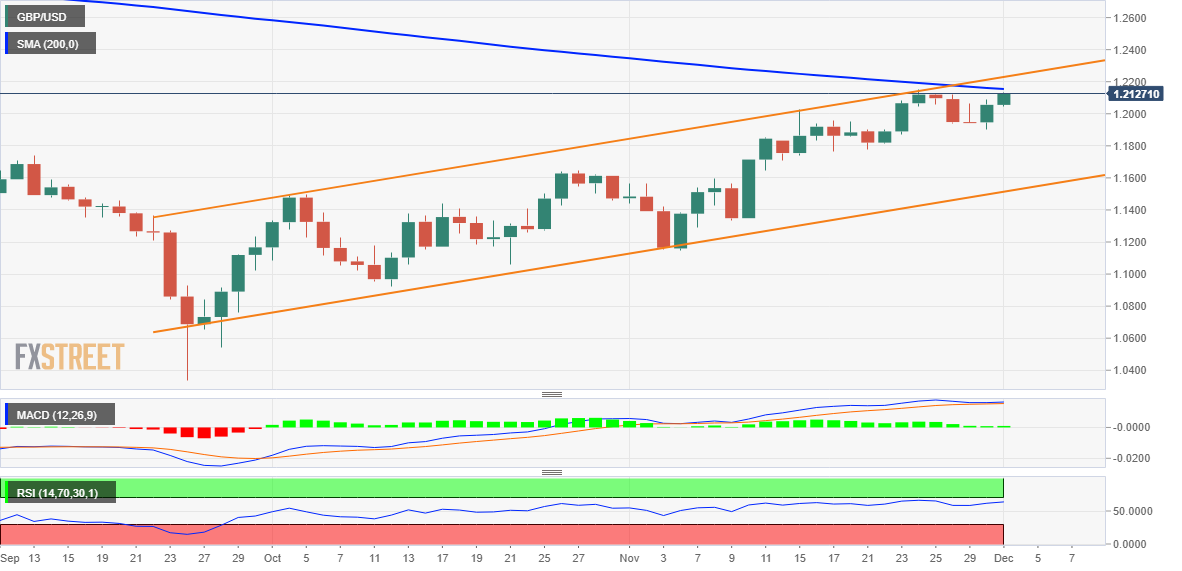
Key levels to watch
Extra downside could force USD/JPY to retest the 135.50 zone in the next few weeks, comment Economist Lee Sue Ann and Markets Strategist Quek Ser Leang at UOB Group.
Key Quotes
24-hour view: “USD soared briefly to 139.89 in NY trade before plunging to 137.64. USD fell further in early Asian trade, and the strong downward momentum is likely to continue. The support levels to monitor are at 136.40 and 135.50. The latter level is unlikely to come into view today. On the upside, 138.05 is a rather solid resistance now (minor resistance is at 137.80).”
Next 1-3 weeks: “In our most recent narrative from Monday (29 Nov, spot at 138.75), we indicated that further USD weakness is not ruled out but the chance of a drop to the next support at 137.00 is not high. In NY trade, USD popped briefly above our ‘strong resistance’ level at 139.60 (high of 139.89) before plummeting. The strong surge in momentum is likely to lead to further USD weakness to 136.40, as low as 135.50. The ‘strong resistance’ level is at 138.55.”
The softer Dollar environment is giving Cable another lift. Economists at ING expect the GBP/USD to test the 1.22/23 zone.
BoE and the ECB should be hiking by 50 bps in December
“This rally could extend to the 1.22/23 area unless either today’s US core PCE data or tomorrow’s US jobs data can put a floor back under US yields.”
“EUR/GBP continues to hold support near 0.86 and that may well be the case into year-end. Both the Bank of England (BoE) and the European Central Bank (ECB) should be hiking by 50 bps in December. But we are taking the view that risk assets will come under more pressure over coming months – which will lead to renewed – if mild – Sterling underperformance.”
- AUD/USD scales higher for the third straight day and climbs to a fresh multi-month high.
- Dovish remarks by Fed Chair Powell keep the USD depressed and offers some support.
- China’s COVID-19 woes turn out to be the only factor capping the upside for the major.
The AUD/USD pair gains traction for the third successive day on Thursday and maintains its bid tone through the first half of the European session. The pair, however, trims a part of its intraday gains and retreats to the 0.6815-0.6810 region during the first half of the European session.
The US Dollar languishes near a multi-month low in the wake of the overnight dovish comments by Federal Reserve Chair Jerome Powell and acts as a tailwind for the AUD/USD pair. In fact, Powell sent a clear message that the US central bank will soften its stance and said that it was time to moderate the pace of interest rate hikes. This leads to a further decline in the US Treasury bond yields and continues to weigh on the greenback.
Apart from this, a positive tone around the equity markets is seen as another factor undermining the safe-haven buck and benefitting the risk-sensitive Aussie. The AUD/USD bulls further took cues from a slight improvement in China's Caixin Manufacturing PMI, which unexpectedly rose to 49.4 in November from 49.2 in the previous month. The reading, however, marks the fourth successive monthly contraction amid widespread COVID-19 curbs.
This might keep a lid on any optimistic move in the markets and act as a headwind for the AUD/USD pair. That said, the underlying bearish sentiment surrounding the USD, along with a sustained breakout through the 0.6755-0.6765 horizontal resistance, supports prospects for additional gains. Hence, any meaningful pullback below the 0.6800 mark might still be seen as a buying opportunity and is more likely to remain limited.
Market participants now look to Thursday's US economic docket, highlighting the release of the Fed's preferred inflation gauge - the Core PCE Price Index - and ISM Manufacturing PMI. This, along with the US bond yields and the broader risk sentiment, will influence the USD price dynamics and provide some meaningful impetus to the AUD/USD pair.
Technical levels to watch
In light of preliminary readings from CME Group for natural gas futures markets, open interest increased for the second session in a row on Wednesday, this time by around 5.5K contracts. On the flip side, volume reversed two daily builds in a row and shrank by around 4.5K contracts.
Natural Gas: Further losses likely below the 200-day SMA
Prices of natural gas retreated markedly on Wednesday and closed around the 200-day SMA, today near $6.98 per MMBtu. The downtick was in tandem with increasing open interest, which leaves the door open to a deeper pullback in the very near term. A sustained break below the 200-day SMA should be supportive of extra losses for the time being.
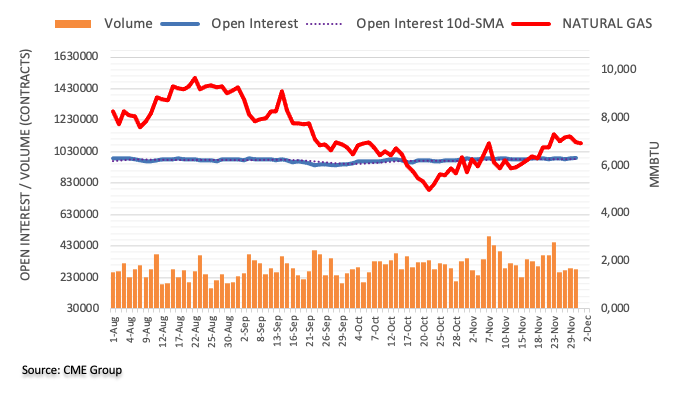
USD/INR has dropped to near 81.00. Economists at Commerzbank expect the pair to drift towards the lower end of the 80-82 range.
RBI to persist with more rate hikes
“We expect RBI to persist with more rate hikes albeit at a slower pace than the 50 bps hikes of the past three meetings. RBI has hiked by 190 bps so far this year from May to 5.90%.”
“We look for another 30-40 bps hike on 7 December to 6.20-6.30%. This should provide some support for INR along with the softer USD tone.”
“We see room for USD/INR to drift towards the lower end of the 80-82 range near term.”
- USD/JPY rebounds from its lowest level since August 23 amid a modest USD uptick.
- The Fed’s dovish pivot keeps the US bond yields depressed and should cap the buck.
- Hawkish signals by BoJ member underpins the JPY and acts as a headwind for the pair.
The USD/JPY pair stages a modest bounce from its lowest level since August 23 touched during the early European session on Thursday and climbs back above mid-136.00s in the last hour.
Having shown some resilience below a technically significant 200-day SMA, the US Dollar is attempting a recovery from the vicinity of a multi-month low set on November 15. This turns out to be a key factor that is lending some support to the USD/JPY pair. That said, any meaningful upside seems elusive in the wake of the overnight dovish-sounding remarks by Federal Reserve Chair Jerome Powell.
Powell sent a clear message that the US central bank will soften its stance and said that it was time to moderate the pace of interest rate hikes. This leads to an extension of the recent sharp downfall in the US Treasury bond yields. In fact, the yield on the benchmark 10-year US Treasury note languished near a two-month low and should continue to act as a headwind for the greenback.
Furthermore, Bank of Japan (BoJ) board member Asahi Noguchi signalled chances of pre-emptive stimulus withdrawal if inflation overshoots expectations. The hawkish remarks offset a downward revision of Japan's Manufacturing PMI, which fell to 49.0 in November from 50.7 previous. This, in turn, could underpin the Japanese Yen and contribute to capping the upside for the USD/JPY pair.
Hence, the modest rebound could still be attributed to some intraday short-covering amid an oversold RSI (14) on the 1-hour chart. Market participants now look to the US macro data - the Core PCE Price Index (the Fed's preferred inflation gauge) and ISM Manufacturing PMI. This, along with the US bond yields and the broader market risk sentiment, might provide some impetus to the USD/JPY pair.
Technical levels to watch
According to Economist Lee Sue Ann and Markets Strategist Quek Ser Leang at UOB Group, NZD/USD could retest 0.6355 ahead of 0.6400 in the near term.
Key Quotes
24-hour view: “The strong surge in NZD to a high of 0.6312 is accompanied by strong upward momentum. The risk remains on the upside toward 0.6355. The major resistance at 0.6400 is unlikely to come into view today. On the downside, 0.6250 (minor support is at 0.6280) is likely strong enough to hold any pullback.”
Next 1-3 weeks: “The manner in which NZD blasted higher suggests it is likely to continue to advance. The levels to monitor are at 0.6355 and 0.6400. Support-wise, a breach of 0.6220 would indicate the current upward pressure has eased.”
CME Group’s flash data for crude oil futures markets noted traders increased their open interest positions for the second straight day on Wednesday, this time by nearly 9K contracts. On the other hand, volume went down by around 167.3K contracts, adding to the previous day’s drop.
WTI: Interim hurdle comes at $84.60
Wednesday’s recovery in prices of the WTI was on the back of rising open interest. Against that, the rebound could extend further and revisit the temporary hurdle at the 55-day SMA, today near $84.60 per barrel.
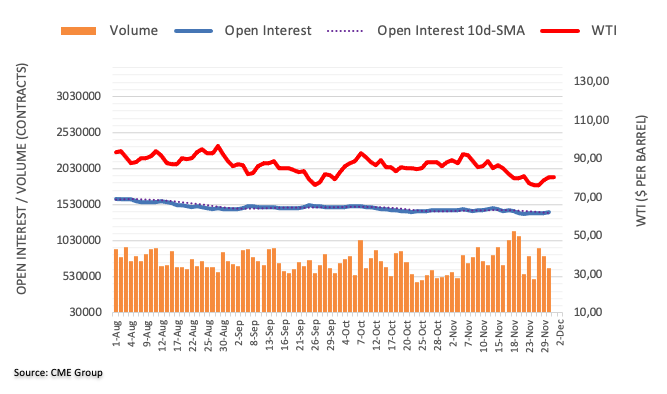
EUR/USD is well above 1.04. 1.05/1.06 is the risk for the world’s most popular currency pair, economists at ING note.
Weak global demand is not a good story for the pro-cyclical Euro
“Resistance is clearly set at the 1.0480/1.0500 area, above which we could see a spike to the 1.0600/0620 area. That is not our preferred view, but thinning December markets and seasonal Dollar weakness mean that such a scenario cannot be ruled out.”
“Bigger picture, however, weak global demand is not a good story for the pro-cyclical Euro. Additionally, colder weather coming to northern Europe is starting to push gas prices higher again and keep the eurozone trade balance under pressure.”
“We would like to think that 1.05/1.06 is as good as it gets for EUR/USD in December.”
In the opinion of Economist Lee Sue Ann and Markets Strategist Quek Ser Leang at UOB Group, further upside in GBP/USD needs to clear the 1.2155 region in the near term.
Key Quotes
24-hour view: “GBP plunged to a low of 1.1900 yesterday before rocketing to a high of 1.2086. While overbought, the rally has scope to extend above 1.2120. In view of the overbought conditions, GBP might not be able to hold above this level. The next resistance at 1.2155 is unlikely to come into view. Support is at 1.2040, followed by 1.2010.”
Next 1-3 weeks: “On Monday (29 Nov, spot at 1.1965), we indicated that GBP is likely to consolidate within a range of 1.1850/1.2080. Yesterday, GBP soared in NY trade and moved a few pips above 1.2080 (high of 1.2086). Further GBP strength appears likely but in order to keep the momentum going, GBP has to continue to move higher and break above the major resistance at 1.2155 within the next 1 to 2 days. The next major resistance is some distance away at 1.2300. On the downside, a breach of the ‘strong support’ at 1.1960 would indicate that GBP is not ready to head higher.”
Open interest in gold futures markets shrank for yet another session on Wednesday, this time by around 4.1K contracts according to advanced prints from CME Group. Volume, instead, reversed the previous daily drop and went up by around 50.6K contracts.
Gold: the $1,800 area emerges on the horizon
Prices of the ounce troy of gold advanced strongly on Wednesday. The uptick, however, was on the back of shrinking open interest, which suggest that the upside momentum could be running out of steam in the very near term. On the upside, the next target of relevance is seen at the $1,800 region, an area reinforced by the proximity of the 200-day SMA, today at $1,796.
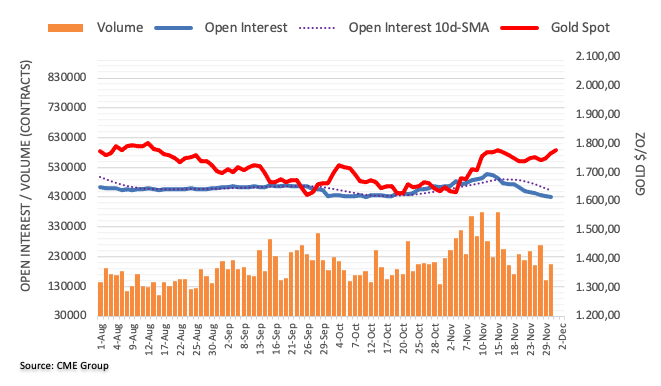
On the Swiss franc front, investors keep an eye on Consumer Price Index (CPI) data. As the SNB is set to continue fighting excessive inflation, the EUR/CHF is unlikely to trade above parity, economists at Commerzbank report.
Swiss inflation stands at 3%
“Swiss inflation stands at 3%, as inflation data for November due today is likely to confirm. That means that inflation exceeds the Swiss National Bank’s target. The Vice-President of the SNB Martin Schlegel has made clear that the SNB will not lean back and do nothing, but will instead continue to take action against excessive inflation levels.”
“Even though the SNB has quietly accepted the Franc’s depreciation of just over 3.5% against the Euro since the end of September, the FX market can never be entirely sure when the SNB’s patience will run out while inflation remains well above its target. Hence, we assume that it will still take some time before EUR/CHF will seriously tackle parity.”
- Silver hits a fresh multi-month peak on Thursday, albeit lacks follow-through buying.
- The technical set-up favours bullish traders and supports prospects for further gains.
- Dips to the $21.70-60 resistance breakpoint could be seen as a buying opportunity.
Silver climbs to a nearly six-month high on Thursday, though the intraday positive move stalls ahead of the mid-$22.00s. The white metal retreats to the lower end of its daily trading range during the early European session and is currently placed around the $22.25-$22.20 region.
From a technical perspective, the overnight sustained breakout through the $21.60-$21.70 supply zone and a subsequent move beyond the $22.00 mark was seen as a fresh trigger for bulls. Moreover, oscillators on the daily chart are holding comfortably in the positive territory and are still far from being in the overbought zone. This, in turn, supports prospects for a further near-term appreciating move for the XAG/USD.
Hence, any follow-through pullback below the $22.00 mark might still be seen as a buying opportunity and is more likely to remain limited near the $21.70-$21.60 resistance breakpoint. This is followed by the very important 200-day SMA, around the $21.35-$21.30 region, which should act as a pivotal point. A convincing break below the latter could drag the XAG/USD below the $21.00 mark, to the $20.85-$20.80 support zone.
On the flip side, the multi-month peak, around the $22.40 region, could offer some resistance to the XAG/USD. Some follow-through buying, however, will reaffirm the positive outlook and set the stage for an extension of the upward trajectory. The XAG/USD might then accelerate the momentum and aim to reclaim the $23.00 round figure, with some intermediate resistance near the $22.70 area.
Silver 4-hour chart
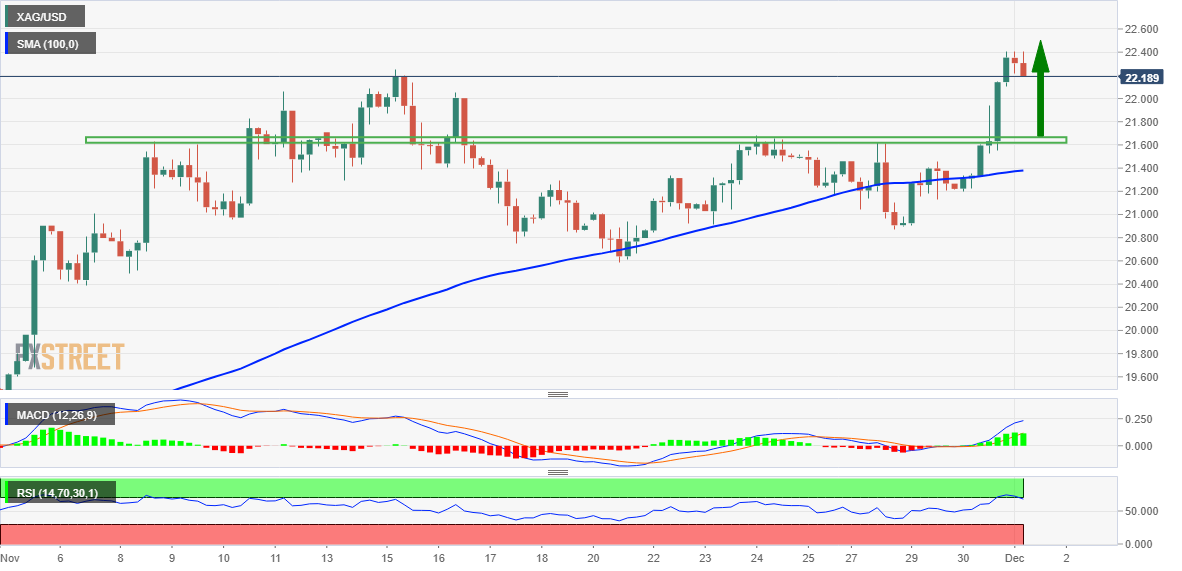
Key levels to watch
Demographics considerably impact countries' economic situation. As analysts at Natixis note, there is a significant gap between the economic vigour of a “young” country and that of a country affected by population ageing.
Population ageing weakens growth
“A decline in the working-age population directly reduces growth. But population ageing also reduces growth through indirect mechanisms: Lower productivity gains if the labour force is old; In the first stage of ageing, a high household savings rate; A reduced need to invest; Declining foreign direct investment.”
“It is not surprising that the economies of ageing countries are less vigorous.”
Further upside in EUR/USD is expected to meet a tough resistance at the 1.0500 region in the near term, suggest Economist Lee Sue Ann and Markets Strategist Quek Ser Leang at UOB Group.
Key Quotes
24-hour view: “EUR traded in a choppy manner yesterday as it plummeted briefly to 1.0288 before reversing sharply and soared to a high of 1.0428. Further EUR strength is not ruled out but the major resistance at 1.0500 is unlikely to come into view today (there is another resistance at 1.0465). Support is at 1.0390, followed by a rather strong level at 1.0365.”
Next 1-3 weeks: “Our most recent narrative was from Tuesday (29 Nov, spot at 1.0345) where EUR is likely to trade between 1.0260 and 1.0430. Yesterday (30 Nov), EUR surged to within a couple of pips of 1.0430 (high of 1.0428). The rapid buildup of momentum suggests that EUR will continue to strengthen, albeit at a slower pace. That said, 1.0500 is a solid resistance and might not be easy to break. The upside risk is intact as long as EUR does not move below 1.0330.”
- USD/CAD struggles to gain any meaningful traction amid the prevalent USD selling bias.
- A modest downtick in oil prices undermines the Loonie and helps limit the downside.
- Traders now look to the US PCE inflation data and ISM PMI short-term opportunities.
The USD/CAD pair consolidates the previous day's heavy losses and oscillates in a narrow range, around the 1.3400 mark through the early European session on Thursday.
The US Dollar languishes near a multi-month low in the wake of dovish comments by Federal Reserve Chairman Jerome Powell on Wednesday and acts as a headwind for the USD/CAD pair. In fact, Powell sent a clear message that the US central bank will soften its stance and said that it was time to moderate the pace of interest rate hikes. This leads to an extension of the recent sharp decline in the US Treasury bond yields and keeps the USD bulls on the defensive.
Apart from this, the risk-on mood - as depicted by a positive tone around the equity markets - is seen as another factor weighing on the safe-haven Greenback. That said, a modest retracement in Crude Oil prices from a one-week high touched on Wednesday undermines the commodity-linked Loonie and lends support to the USD/CAD pair. The likelihood that OPEC+ will leave output unchanged at its meeting on Sunday and demand concerns act as a headwind for the black liquid.
Nevertheless, the underlying bearish sentiment surrounding the USD suggests that the path of least resistance for the USD/CAD pair is to the downside. This, in turn, supports prospects for an extension of this week's sharp pullback from the vicinity of mid-1.3600s, or the highest level since November 4 set on Tuesday. Hence, any attempted recovery could be seen as a selling opportunity and runs the risk of fizzling out rather quickly.
Market participants now look forward to the US economic docket, highlighting the release of the Fed's preferred inflation gauge - the Core PCE Price Index - and ISM Manufacturing PMI. This, along with the US bond yields and the broader risk sentiment, will influence the USD. Traders will further take cues from oil price dynamics to grab short-term opportunities around the USD/CAD pair.
Technical levels to watch
- WTI crude oil retreats from one-week high to snap three-day uptrend.
- Sustained trading beyond monthly resistance line, now support, joins 10-DMA breakout to favor bulls.
- 21-DMA, 50% Fibonacci retracement level adds to the upside filters.
WTI crude oil prints the first intraday loss of the week as bulls step back to $80.00 after renewing the weekly top during early Thursday.
In doing so, the black gold pares the previous day’s upside break of a downward-sloping resistance line from November 07, now support around $79.30.
Even if the WTI bears manage to conquer the previous resistance near $79.30, the oil sellers will find it difficult to keep the reins unless successfully breach the 10-DMA level surrounding $78.95.
Following that, a southward trajectory towards the horizontal area comprising the lows marked since late September, around $76.10, quickly followed by the $76.00 round figure, could test the commodity sellers before directing them to the yearly low marked in the last week near $73.65.
On the contrary, WTI recovery needs validation from the tops marked on November 18 and 22, around $82.30-40.
Even so, a convergence of the 21-DMA and a 50% Fibonacci retracement level of the black gold’s downturn marked in November, around $83.10-30, appears a tough nut to crack for the bulls before taking control.
It should be noted that the receding bearish bias of the MACD and steady RSI keep oil buyers hopeful.
WTI: Daily chart
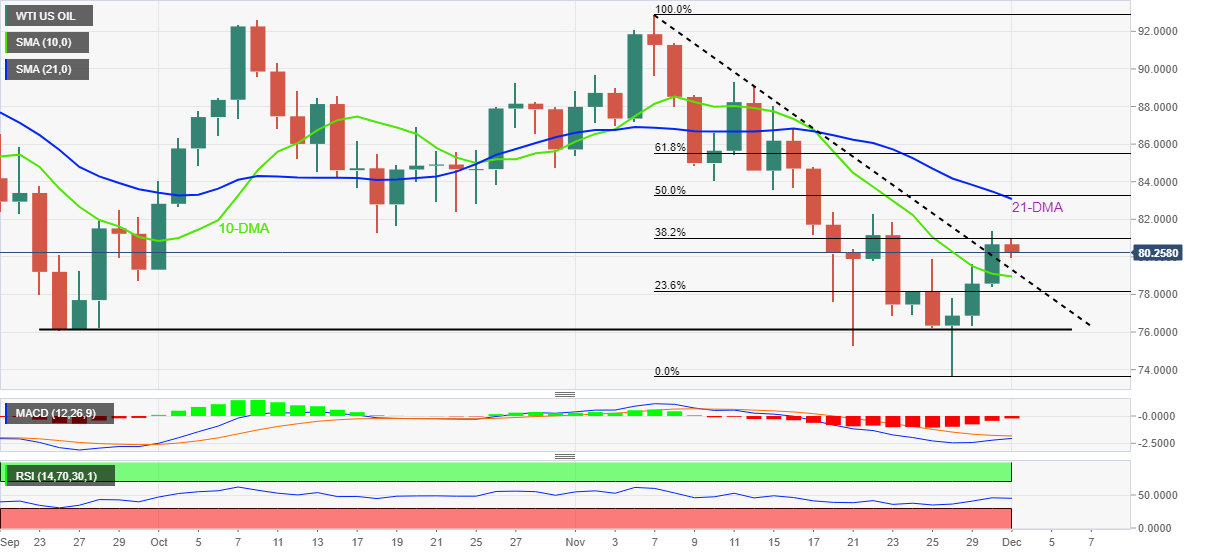
Trend: Further upside expected
- German Retail Sales arrived at -5.0% YoY in October vs. -2.8% expected.
- Retail Sales in Germany came in at -2.8% MoM in October vs. -0.6% expected.
Germany's Retail Sales decreased by 2.8% MoM in October versus -0.6% expected and 0.9% previous, the official figures released by Destatis showed on Thursday.
On an annualized basis, the bloc’s Retail Sales came in at -5.0% in October versus the -2.8% expected and a 0.9% drop recorded in September.
FX implications
The Euro shrugs off the downbeat German data. At the time of writing, the major trades at 1.0455, up 0.47% so far.
About German Retail Sales
The Retail Sales released by the Statistisches Bundesamt Deutschland is a measure of changes in sales of the German retail sector. It shows the performance of the retail sector in the short term. Percent changes reflect the rate of changes of such sales. The changes are widely followed as an indicator of consumer spending. Positive economic growth is usually anticipated as "bullish" for the EUR, while a low reading is seen as negative, or bearish, for the EUR.
Here is what you need to know on Thursday, December 1:
The US Dollar stays on the back foot on the first trading day of December as markets position themselves for a smaller Federal Reserve rate increase. The 10-year US Treasury bond yield stays near after having lost nearly 4% on Wednesday and US stock index futures trade in positive territory. Later in the session, the US Bureau of Economic Analysis will release the Personal Consumption Expenditures (PCE) Price Index data, the Fed's preferred gauge of inflation, for October. The ISM's Manufacturing PMI report for November will also be featured in the US economic docket.
US October PCE inflation & ISM Manufacturing PMI Preview: Seen through Fed’s eyes.
In his last appearance before the Fed goes into the blackout period on Saturday, FOMC Chairman Jerome Powell said that it would make sense to moderate the pace of interest rate hikes. Powell further added that rates must ultimately go "somewhat higher" than what policymakers thought in September. Following Powell's remarks, the CME Group's FedWatch Tool shows that markets are pricing a nearly-80% probability of a 50 basis points Fed hike in December, compared to 66% on Tuesday.
Meanwhile, Beijing officials announced that they will allow people who have tested positive for Covid in a number of residential communities to quarantine at home. Hong Kong's Hang Seng is up 1.5% on the day and Shanghai Composite remains on track to close modestly higher, pointing to an improving market mood early Thursday.
After dropping to a fresh weekly low below 1.0300, EUR/USD gathered bullish momentum and ended up closing above 1.0400 on Wednesday, gaining more than 100 pips. The pair preserves its bullish momentum early Thursday and trades near 1.0450.
GBP/USD made a sharp U-turn from 1.1900 and registered strong daily gains on Thursday. The pair continues to push higher and trades above 1.2100 in the European morning.
USD/JPY fell sharply on Wednesday and extended its slide early Thursday. The pair was last seen trading at its lowest level since late August below 136.50, losing more than 1% on a daily basis. In addition to the broad-based US Dollar weakness, comments from Bank of Japan (BOJ) officials seem to be putting additional weight on the pair. BOJ board member Asahi Noguchi said, depending on data, the timing of exiting from the easy policy could be pushed forward.
Fueled by the sharp decline witnessed in US T-bond yields, Gold price surged higher on Wednesday. XAU/USD preserves its bullish momentum and trades at its highest level in three weeks above $1,780.
Bitcoin benefited from risk flows and gained more than 4% on Thursday. BTC/USD was last seen consolidating its recent gains at around $17,100. Ethereum trades in a tight range slightly below $1,300 after having climbed over 6% on Thursday.
Gold price sets off December on a positive note, at the highest levels in two weeks, as heads toward $1,800, FXStreet’s Dhwani Mehta notes.
Break below $1,766 could trigger a fresh downswing
“Bulls need to cross the $1,780 round figure on a sustained basis if they look to retest the three-month highs at $1,787. The next relevant upside target aligns at the $1,800 threshold.”
“Alternatively, the previous day’s low at $1,766 could limit any retracements from higher levels. A break below the latter could trigger a fresh downswing toward the triangle resistance-turned-support, now at $1,757. The bullish 21-Simple Moving Averages (SMA) at $1,755 will challenge buyers’ commitments before testing the $1,750 psychological level.”
- EUR/USD advances to 3-day highs above 1.0450.
- The dollar melts amidst solid risk-on sentiment.
- Final PMIs, US ISM Manufacturing next of note in the docket.
The European currency remains well bid and lifts EUR/USD well north of the 1.0400 hurdle on Thursday.
EUR/USD stronger on USD-selling, looks to data
EUR/USD adds to Wednesday’s gains and manages to reclaim the 1.0400 mark and beyond on Thursday, as market participants continue to digest Chair Powell’s speech on Wednesday and the appetite for the riskier assets gathers extra pace.
Indeed, the greenback accelerates its sell-off after Fed’s Powell reinforced the view that a moderation in the pace of future interest rate hikes would be appropriate. So far, a 50 bps interest rate hike at the Fed’s December 14 event looks the most likely scenario.
In the docket, Germany’s Retail Sales are due next ahead of final Manufacturing PMIs in the rest of the region. Across the pond, inflation tracked by the PCE and the ISM Manufacturing will take centre stage.
What to look for around EUR
EUR/USD sees its upside bias renewed on Thursday in response to the continuation of the downside bias in the dollar.
In the meantime, the European currency is expected to closely follow dollar dynamics, the impact of the energy crisis on the region and the Fed-ECB divergence. In addition, markets repricing of a potential pivot in the Fed’s policy remains the exclusive driver of the pair’s price action for the time being.
Back to the euro area, the increasing speculation of a potential recession in the bloc emerges as an important domestic headwind facing the euro in the short-term horizon.
Key events in the euro area this week: Germany Retail Sales, ECB General Council Meeting, Germany/EMU Final Manufacturing PMI, EMU Unemployment Rate (Thursday) - ECB Lagarde, Germany Balance of Trade (Friday).
Eminent issues on the back boiler: Continuation of the ECB hiking cycle vs. increasing recession risks. Impact of the war in Ukraine and the persistent energy crunch on the region’s growth prospects and inflation outlook. Risks of inflation becoming entrenched.
EUR/USD levels to watch
So far, the pair is gaining 0.46% at 1.0453 and faces the next up barrier at 1.0496 (monthly high November 28) ahead of 1.0500 (round level) and finally 1.0614 (weekly high June 27). On the flip side, a breach of 1.0330 (weekly low November 28) would target 1.0222 (weekly low November 21) en route to 1.0042 (100-day SMA).
FX option expiries for Dec 1 NY cut at 10:00 Eastern Time, via DTCC, can be found below.
- EUR/USD: EUR amounts
- 1.0300-10(1.58b
- 1.0350 393m
- 1.0385 256m
- 1.0400 275m
- 1.0450 212m
- 1.0500-05 556m
- 1.0525 246m
- 1.0550 261m
- 1.0600 1.2b
- GBP/USD: GBP amounts
- 1.1890 309m
- 1.1990-00 359m
- USD/JPY: USD amounts
- 137.00 215m
- 137.50 250m
- 137.90 290m
- AUD/USD: AUD amounts
- 0.6800 300m
- USD/CAD: USD amounts
- 1.3550 295m
- EUR/GBP: EUR amounts
- 0.8710 316m
- 0.8750 497m
- GBP/USD stays firmer around weekly high after the biggest monthly jump since July 2020 in November.
- US Dollar remains depressed as Fed’s Powell, US Treasury Secretary Yellen favor hopes of easy rate hikes.
- Optimism surrounding China, softer US data adds strength to the Cable’s upside momentum.
- Easing UK inflation expectations contrast with the US numbers but traders stay focused on top-tier signals, data.
GBP/USD seesaws around the weekly top as the Cable pair buyers cheer broad-based US Dollar weakness during early Thursday. In doing so, the quote pokes the 1.2100 threshold during the two-day uptrend ahead of the key UK/US data.
US Federal Reserve Chairman Jerome Powell’s first public appearance after November’s Federal Open Market Committee (FOMC) meeting turned out as dovish for the US Dollar as the policymaker stated that it makes sense to moderate the pace of interest rate increases. Fed’s Powell also suggested that the time to slow the pace of rate hikes could come as soon as the next meeting in December. On the same line were the latest comments from US Treasury Secretary Janet Yellen who teased a soft landing and pushed back the need for aggressive rate lifts.
Furthermore, the easing in the virus-led activity controls in China, as the dragon nation reports the third day of declining daily infections after refreshing the record top, also seemed to have weighed on the US Dollar due to its safe-haven status. Recently, Global Times mentioned that China is speeding up to cast aside large-scale lockdowns.
It’s worth noting that the latest increase in the US inflation expectations, as per the 10-year and 5-year breakeven inflation rates per the St. Louis Federal Reserve (FRED) data, should have also probed the GBP/USD bulls, but did not. Additionally acting as an upside barrier for the Cable pair could be the latest monthly survey data from Citi/YouGov suggesting less pressure on the Bank of England to raise rates. “The British public's expectations for inflation over the coming years eased back further in November from record highs reached in August,” said the survey reports per Reuters.
Against this backdrop, S&P 500 Futures print mild gains and the equities in the Asia-Pacific region tracked Wall Street’s upbeat performance. Further, the US 10-year Treasury bond yields remain pressured around 3.62% after refreshing a two-month low the previous day.
Looking forward, the final readings of the UK’s November month S&P Global/CIPS Manufacturing PMI, expected to confirm 46.2 initial forecasts, could offer immediate directions. However, major attention will be given to Fed’s preferred inflation gauge, namely US Core Personal Consumption Expenditure (PCE) Price Index for October, expected 5.0% YoY versus 5.1% prior. Additionally important will be the monthly prints of the US ISM Manufacturing PMI for November, expected 49.8 versus 50.2 prior.
Technical analysis
A clear upside break of the one-week-old descending trend line, now support near 1.2070, directs GBP/USD buyers towards the monthly high near 1.2155.
- GBP/JPY pokes a short-term key support line amid downbeat oscillators.
- Clear break of two-month-old support line becomes necessary for the bears to keep reins.
- Monthly resistance line restricts corrective rebound below 169.00 hurdle.
GBP/JPY jostles with the key support near 165.00 as bears keep the reins near the lowest levels in a fortnight heading into Thursday’s London open. In doing so, the cross-currency pair braces for the first weekly loss in three as sellers poke an upward-sloping support line from early October.
That said, bearish MACD signals and downbeat RSI (14), not oversold, keeps GBP/JPY sellers hopeful of breaking the immediate support surrounding 165.00.
However, the 100-DMA and the 200-DMA could challenge the GBP/JPY pair afterward around 164.35 and 162.80 in that order.
Following that, a downward trajectory toward October’s low surrounding 159.73 can’t be ruled out. During the fall, the 160.00 psychological magnet may act as a buffer.
Meanwhile, recovery moves will have to cross a descending resistance line from October 31, near 167.85 to convince GBP/JPY buyers.
Even so, multiple tops marked in November around 169.00 could challenge the upside momentum.
It’s worth noting that the 170.00 round figure and the yearly top marked in October around 172.15 may test the pair buyers before giving them control.
Overall, GBP/JPY is likely to remain bearish but the room towards the south appears limited.
GBP/JPY: Daily chart
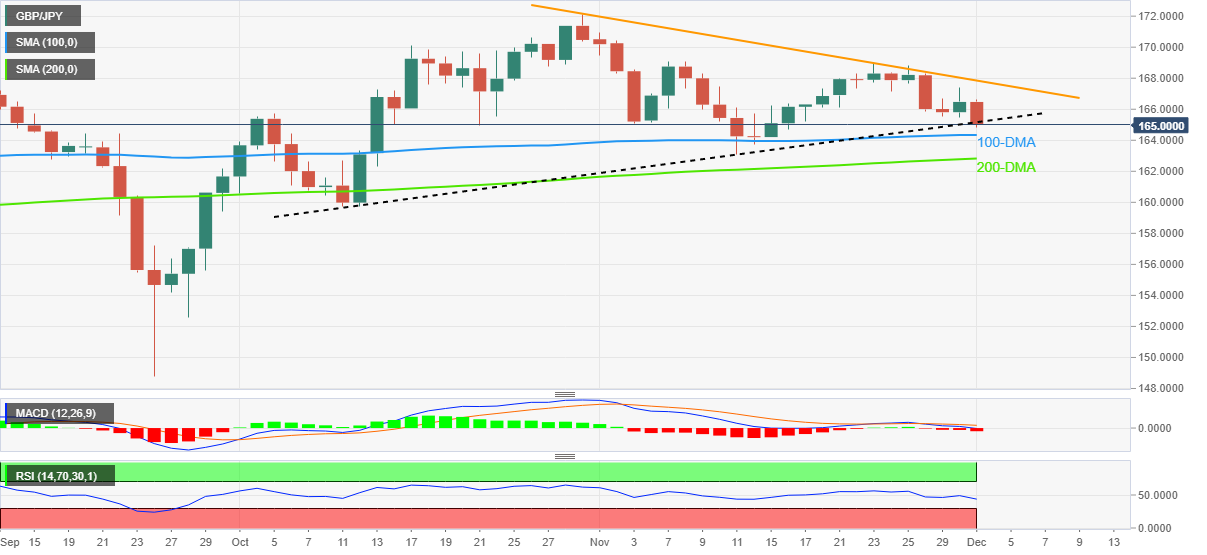
Trend: Limited downside expected
- NZD/USD has refreshed its three-month high at 0.6335 on upbeat market sentiment.
- The speech from Jerome Powell confirmed the termination of a 75 bps rate hike spell in December meeting.
- New Zealand Dollar has picked strength on upbeat Caixin Manufacturing PMI and the reopening of the Chinese economy.
- NZD/USD is expected to smash 0.6350 as the US Dollar is seeing more downside on policy moderation fears.
NZD/USD is marching north firmly after shifting its auction profile above the round-level resistance of 0.6300 in the Asian session. The kiwi asset has refreshed its three-month high at 0.6335 as the New Zealand Dollar has been strengthened by a surprise rise in Caixin Manufacturing PMI data and a significant improvement in investors’ risk appetite post-Federal Reserve (Fed)’s commentary.
Fed Powell’s promise to moderate the extreme-tight monetary policy in the December meeting has infused fresh blood into risk-sensitive assets. S&P500 futures are gathering momentum adding more upside to Wednesday’s gains. The US Dollar Index (DXY) has surrendered its short-lived recovery attempt and is on the verge of refreshing its day’s low below 105.50. Meanwhile, the 10-year US Treasury yields have slipped again to 3.60% amid healthy demand for US government bonds by investors.
Federal Reserve’s Powell is set to terminate the 75 bps rate hike culture
The commentary from Fed chair Jerome Powell has confirmed that the central bank is looking to slow down its interest rate hike pace. Catalysts that have compelled Fed Chair to sound less hawkish while providing interest rate guidance for December’s monetary policy meeting are a slowdown in labor demand, a decline in economic activities, and a soft October inflation report.
The Federal Reserve is bound to bring price stability to the United States economy but not at the cost of the economy. Fed Chair in his speech cited that it is not appropriate to ‘Crash the economy and clean it afterward’. This has confirmed that the Federal Reserve (Fed) won’t continue the 75 basis points (bps) rate hike spell now and may shift to a lower rate hike to 50 bps. As per the CME FedWatch tool, the chances of a 50 bps rate hike announcement by the Fed in the December meeting holds around 80%.
US Dollar to remain volatile ahead of Nonfarm Payrolls
Another critical trigger that is going to keep US Dollar bulls on the tenterhooks in the United States Nonfarm Payrolls (NFP) data, which will release on Friday. As per the consensus, the United States economy added 200K jobs in November, lower than the prior release of 261K. Cues from US Automatic Data Processing (ADP) Employment data indicate that the additional payrolls in November are merely 127K. The Unemployment Rate is seen unchanged at 3.7%.
Apart from that, investors will keep an eye on Average Hourly Earnings data. The street is expecting that the next trigger that could create troubles for the Federal Reserve is rising wage prices. Wage inflation carries the capability of driving price inflation higher. Post a slowdown in inflation led by accelerating interest rates, the United States households will remain with higher earnings that could trigger retail demand.
Upbeat Caixin Manufacturing PMI drove New Zealand Dollar
In early Tokyo, IHS Markit reported a surprise rise in Caixin Manufacturing data. The economic data was released at 49.4 for November month vs. 48.9 as projected and October’s release of 49.2. Despite extreme lockdown measures in November by Chinese authorities to contain the COVID-19 epidemic, the economy has managed to display better-than-projected performance. This has strengthened the kiwi asset significantly as New Zealand is one of the leading trading partners of China.
Meanwhile, signs of the gradual opening of the Chinese economy led by relaxations in zero Covid-19 policy to return economic prospects on track have also strengthened the New Zealand Dollar.
NZD/USD technical outlook
-638054712326484287.png)
NZD/USD has comfortably established above the 200-period Exponential Moving Average (EMA) at around 0.6200, which indicates that the long-term trend has turned bullish. Also, a bull cross, represented by the 20-and 50-EMAs at 0.5871, indicates a continuation of the upside. Going forward, the ultimate resistance is placed from August 12 high at 0.6470.
Apart from that, the Relative Strength Index (RSI) (14) is oscillating in a bullish range of 60.00-80.00, which indicates that the upside momentum is intact.
China’s President Xi Jinping told European Council President Charles Michel on Thursday. Beijing will continue strengthening strategic communication and coordination with the European Union (EU).
Additional comments
Hope EU institutions and member states will establish an objective and correct perception of China.
China, EU should strengthen macroeconomic policy coordination and complementary advantages, jointly create new growth engines.
China, EU should jointly ensure safety, stability, reliability of industrial supply chains.
China will remain open to European companies and hope EU can provide a fair and transparent business environment for Chinese companies.
Related reads
- China is speeding up to cast aside large-scale lockdowns – Global Times
- China's housing market seen to rebound in Q2 2023 – Yicai
Hu Xijin, a commentator at the highly-influential Chinese state media, Global Times, tweeted on Thursday, “Guangzhou has announced the lifting of all lockdowns. Beijing has been gradually lifting lockdowns over the past few days. Vice Premier Sun Chunlan on Wed formally noted the virus' weakening pathogenicity for the first time...China is speeding up to cast aside large-scale lockdowns.”
Market reaction
Risk sentiment remains lifted on China’s reopening optimism, with Hu’s tweet adding credence to the recent specutions of Beijing softening its stance on the zero-Covid policy. The US S&P 500 futures rise 0.16% on the day while the AUD/USD extends gains above 0.6800 in Thursday’s trading so far.
- USD/JPY takes offers to refresh 14-week low during four-day downtrend.
- BOJ’s Noguchi teases pre-emptive withdrawal of stimulus to propel JPY of late.
- Fed’s Powell, US Treasury Secretary Yellen favored hopes of smaller rate hikes.
USD/JPY stands on slippery grounds, extending the previous south-run towards the lowest levels since late August after Bank of Japan (BOJ) policymaker signaled withdrawal of stimulus during early Thursday. That said, the bears attack 136.00 level by the press time during the four-day downtrend.
Bank of Japan (BoJ) board member Asahi Noguchi recently signaled the Japanese central bank’s readiness to withdraw stimulus if inflation numbers appear too strong. “BOJ could withdraw stimulus pre-emptively if underlying inflation perks up higher than expected,” said the policymaker.
On the other hand, the latest comments from the Federal Reserve (Fed) officials, including Chairman Jerome Powell, as well as from US Treasury Secretary Janet Yellen, underpin the hopes of the US central bank’s easy rate hikes. On the same line was the easing in the virus-led activity controls in China as the dragon nation reports the third day of declining daily infections after refreshing the record top.
It’s worth noting that the recent increase in the US inflation expectations, as per the 10-year and 5-year breakeven inflation rates per the St. Louis Federal Reserve (FRED) data, should have also probed the USD/JPY bears, but could not. Also a likely negative for the current downtrend could be the comments from US National Security Adviser Jake Sullivan suggesting fresh challenges for the Sino-American optimists. The diplomat said, “The US sees China as a growing strategic threat.” Additionally, the cautious mood ahead of the Fed’s preferred inflation gauge, namely the US Core Personal Consumption Expenditure (PCE) Price Index for October, expected 5.0% YoY versus 5.1% prior, might have also probed the bears if the BOJ versus the Fed play would have been silent like previously.
Other than the US inflation precursors, the US ISM Manufacturing PMI for November, expected 49.8 versus 50.2 prior, as well as a speech from BOJ Governor, Haruhiko Kuroda also become crucial to be watched by the USD/JPY traders.
Also read: US October PCE inflation & ISM Manufacturing PMI Preview: Seen through Fed’s eyes
Technical analysis
A clear downside break of an ascending trend line from late May, around 137.30 by the press time, directs USD/JPY bears towards the 200-DMA support of 134.41.
Bank of Japan (BoJ) board member Asahi Noguchi made some comments on the central bank’s potential exit strategy, noting that they remain data-dependent.
Key quotes
Positive cycle of rising wages and inflation is one important condition for BoJ’s 2% inflation target to be met.
Wages must rise about 3% for BoJ’s 2% inflation target to be met.
We're seeing early signs of change in Japan public's norm based on view prices won't rise much.
Just achieving 3% wage growth once, or a single year, won't be enough to withdraw stimulus.
Hard to say now in what order boj will tweak tools in event it were to exit easy policy.
Decision on when BoJ will roll back stimulus would be data dependent.
Looking at data, don't think now conditions will fall into place to exit easy policy any time soon.
BoJ could withdraw stimulus pre-emptively if underlying inflation perks up higher than expected.
- AUD/USD grinds higher after refreshing multi-day top, firmer during three-day uptrend.
- Convergence of previous resistance line, 61.8% Fibonacci retracement restricts downside.
- September’s high, 200-DMA lure buyers amid firmer oscillators.
AUD/USD juggles around 0.6810 heading into Thursday’s European session, after rising to the highest levels since September 13 earlier in the day.
That said, the Aussie pair prints a three-day uptrend as bulls cheer the previous day’s run-up beyond the downward-sloping resistance line from the mid-September, as well as the 61.8% Fibonacci retracement level of the pair’s August-October upside, surrounding 0.6770.
Also keeping the buyers hopeful are the bullish MACD signals and the firmer RSI (14), not overbought.
As a result, the AUD/USD bulls are on the way to approaching the next key hurdle to the north, namely September’s high surrounding 0.6915.
However, the RSI line is near the overbought conditions and may challenge the bull’s upside past 0.6915, if not then the 200-DMA resistance of 0.6925 could restrict the Aussie pair’s further advances.
Meanwhile, a downside break of the 0.6770 support confluence isn’t an open welcome to the AUD/USD bears as a three-week-old horizontal support zone near 0.6580 could restrict the pair’s further declines.
In a case where the quote drops below 0.6580, an ascending trend line from October 13, near 0.6410 acts as the last defense of the bulls.
AUD/USD: Daily chart
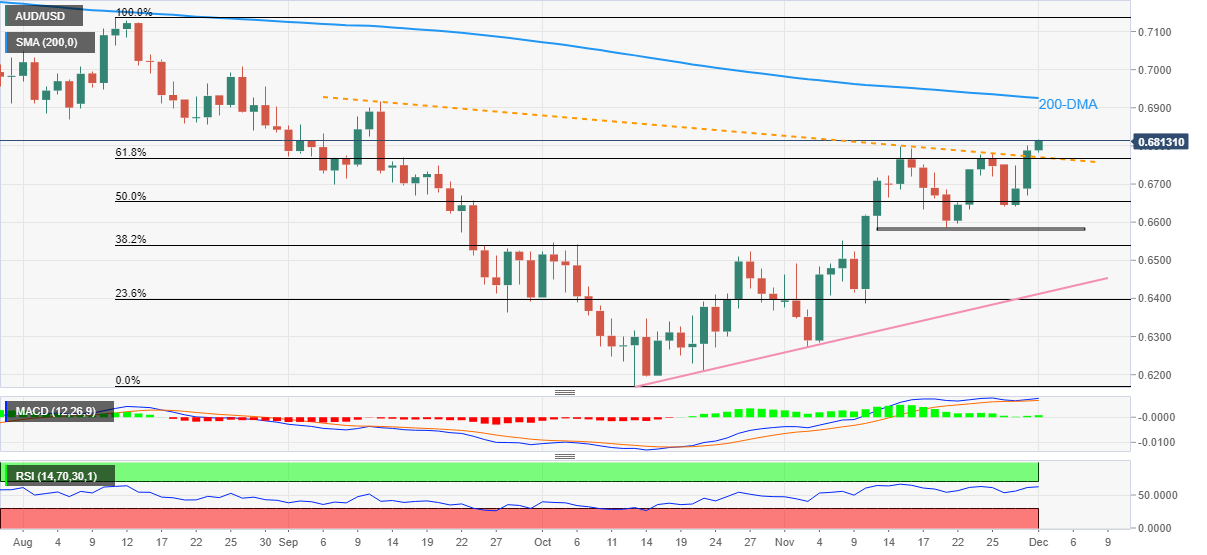
Trend: Further upside expected
- Asian equities have roared strongly as Fed confirmed a less-hawkish December monetary policy.
- Chinese indices have hogged the limelight on upbeat Caixin Manufacturing PMI data.
- Oil prices are holding gains above $80.00, awaiting the OPEC+ meeting outcome for fresh impetus.
Markets in the Asian domain are gaining like there is no tomorrow as the Federal Reserve (Fed) chair Jerome Powell has confirmed moderation of extreme-tight monetary policy in a December meeting. A slowdown in labor demand and economic activities, and a surprise drop in October’s inflation report have set the stage for a decline in the interest rate hike pace to 50 basis points (bps).
The odds of termination of the 75 bps rate hike spell by the Fed are extremely solid as the Fed is required to safeguard the United States economy from economic shocks along with the agenda of bringing price stability.
At the press time, Nikkei225 jumped 1.06%, ChinaA50 soared 2.20%, Hang Seng ramped up 1.74% and Nifty50 added 0.48%.
Fed Powell’s positive commentary on the interest rate hike slowdown has strengthened the risk-appetite theme in the global market. This may also force analysts to trim their contracted economic projections.
Chinese equities are advancing like there is no tomorrow led by a surprise rise in Caixin Manufacturing PMI data. The economic data has been recorded at 49.4 for November month vs. 48.9 as projected and October’s release of 49.2. Despite extreme lockdown measures in November by Chinese authorities to contain the COVID-19 epidemic, the economy has managed to display better-than-projected performance.
Meanwhile, Japanese investors are awaiting the speech from Bank of Japan (BOJ) Governor Haruhiko Kuroda, which is scheduled for Friday. The BOJ Governor is likely to provide guidance about the likely monetary policy action. In the Asian session, BOJ policymaker Asahi Noguchi favored the continuation of policy easing to keep inflation around 2% as he sees the maintenance of inflation uncertain at desired levels. He further added that wages must rise at a faster pace than the rate of inflation to achieve the appropriate level of inflation in a stable manner.
On the oil front, oil prices have turned sideways above $80.00 as investors are awaiting the OPEC+ meeting, scheduled for December 4 for fresh impetus. On Wednesday, oil prices displayed a significant rally after the US Energy Information Administration (EIA) reported a third consecutive drawdown in oil inventories.
- USD/IDR bounces off two-week low on softer Indonesia Inflation.
- Indonesia Inflation, Core Inflation missed upbeat forecasts in November.
- Hopes of Fed’s smaller rate hikes, China-linked optimism underpin bearish bias.
- US Core PCE Price Index, ISM Manufacturing PMI appears crucial for immediate directions.
USD/IDR rebounds from intraday low to $15,635 during early Thursday as downbeat Indonesia inflation numbers allowed bears to take a breather at the lowest level in a fortnight. Also likely to have probed the pair sellers could be the latest shift in the market’s mood ahead of the key US data.
Indonesia's Inflation number eased to 5.42% YoY versus 5.49% expected and 5.71% prior whereas the Core Inflation dropped to 3.30% compared to 3.40% market forecasts and 3.31% previous readings. Even so, the inflation number remains beyond Bank Indonesia’s target range of 2% to 4.0% and hence favors the Indonesia Rupiah (IDR) buyers.
It’s worth noting that BI Governor Perry Warjiyo said on Wednesday that they would maintain a front-loaded and pre-emptive interest rate policy next year to control inflation.
On the other hand, dovish comments from the Federal Reserve (Fed) officials, including Chairman Jerome Powell, joined softer US employment-linked data to weigh on the USD/IDR price the previous day. On the same line was the easing in the virus-led activity controls in China as the dragon nation reports the third day of declining daily infections after refreshing the record top.
Even so, a recent increase in the US inflation expectations, as per the 10-year and 5-year breakeven inflation rates per the St. Louis Federal Reserve (FRED) data, should have also probed the USD/IDR downside. Additionally pleasing the USD/IDR bears could be the downbeat comments from US National Security Adviser Jake Sullivan suggesting fresh challenges for the Sino-American optimists. The diplomat said, “The US sees China as a growing strategic threat.”
Moving on, the Fed’s preferred inflation gauge, namely US Core Personal Consumption Expenditure (PCE) Price Index for October, expected 5.0% YoY versus 5.1% prior. Additionally important will be the monthly prints of the US ISM Manufacturing PMI for November, expected 49.8 versus 50.2 prior, as well as headlines surrounding China and comments from the Fed policymakers.
Technical analysis
A clear downside break of three-month-old ascending support line, now resistance near $15,660, favors the USD/IDR bears targeting the monthly low near $15,310.
- Gold price remains sidelined after refreshing two-week high.
- Cautious mood ahead of key data, mixed concerns surrounding China and firmer US inflation expectations probe XAU/USD buyers.
- Strong US data could test dovish bias over the Fed’s next move and tease Gold sellers.
Gold price (XAU/USD) seesaws near a two-week high surrounding $1,780 as buyers await the key US inflation signals during early Thursday. In doing so, the bullion price edges higher around the multi-day high, marked a few minutes before, during the three-day uptrend.
It’s worth noting that the dovish comments from the Federal Reserve (Fed) officials, including Chairman Jerome Powell, joined softer US employment-linked data to propel the Gold price the previous day. On the same line was the easing in the virus-led activity controls in China as the dragon nation reports the third day of declining daily infections after refreshing the record top.
However, a recent increase in the US inflation expectations, as per the 10-year and 5-year breakeven inflation rates per the St. Louis Federal Reserve (FRED) data, should have also probed the metal’s latest upside. Additionally challenging the XAU/USD bulls could be the downbeat comments from US National Security Adviser Jake Sullivan suggesting fresh challenges for the Sino-American optimists. The diplomat said, “The US sees China as a growing strategic threat.”
While portraying the market’s mood, S&P 500 Futures print mild gains and the equities in the Asia-Pacific region grind higher by tracking Wall Street gains. Further, the US 10-year Treasury bond yields remain pressured around 3.62% after refreshing a two-month low the previous day.
Recently, US Treasury Secretary Janet Yellen said that the US economy will likely be able to achieve a so-called "soft landing," in which inflation slows without tipping the economy into a sharp recession. The same keeps the Gold buyers hopeful as they await the Fed’s preferred inflation gauge, namely US Core Personal Consumption Expenditure (PCE) Price Index for October, expected 5.0% YoY versus 5.1% prior.
Additionally important will be the monthly prints of the US ISM Manufacturing PMI for November, expected 49.8 versus 50.2 prior, as well as headlines surrounding China and comments from the second-order Fed policymakers.
Technical analysis
Gold price grinds higher past the 200-day Exponential Moving Average (EMA) as bulls take a breather around the highest levels in a fortnight.
In doing so, the yellow metal fades upside momentum, as portrayed by the sluggish MACD signals, below a four-month-old resistance line, near $1,783. It’s worth noting that the nearly overbought RSI (14) also challenges the XAU/USD’s further upside near the key hurdle.
Even if the Gold buyers manage to cross the $1,783 hurdle, the monthly high near $1,787 and August month’s peak near $1,807 could challenge the bullion’s additional run-up.
Alternatively, the 200-day EMA, around $1,759 by the press time, restricts the immediate downside of the bullion, a break of which highlights an upward-sloping support line from November 08, near $1,751 at the latest.
It’s worth noting that the resistance-turned-support line from September 12, close to $1,718, appears as the last defense of the Gold buyers.
Gold price: Daily chart
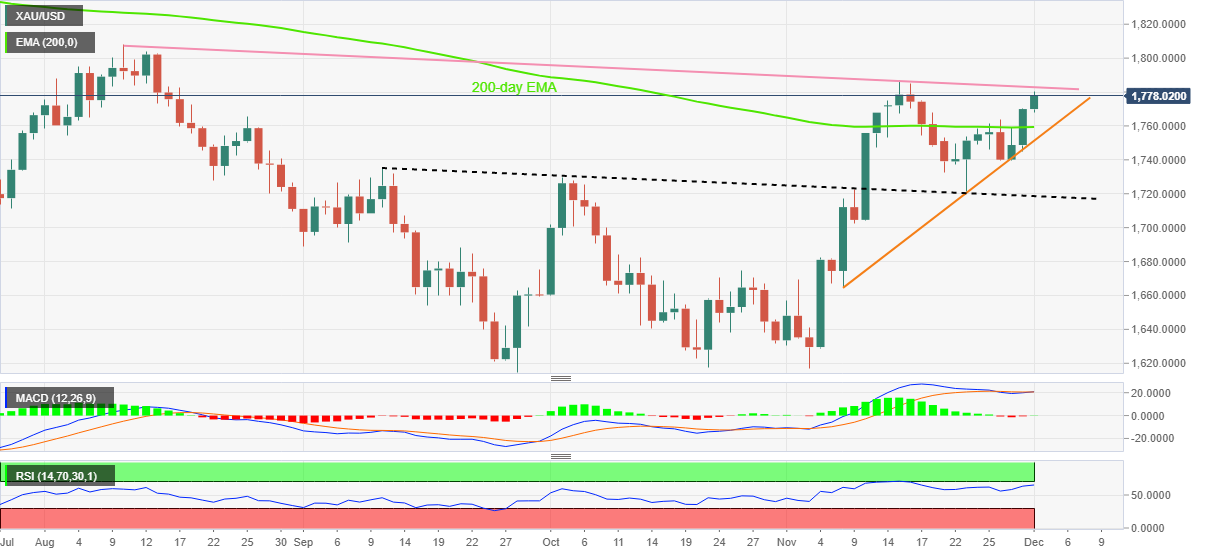
Trend: Limited upside expected
- USD/INR has dropped to near 81.00 as the Fed has confirmed the moderation of policy tightening.
- The US Dollar has faced immense pressure on less-hawkish Fed commentary and weaker US ADP Employment data.
- Gains in the Indian rupee could remain capped due to firmer oil prices.
The USD/INR pair has witnessed intense selling pressure at open as the risk aversion theme has vanished entirely. The asset has dropped to near the round-level support of 81.00 amid a sharp sell-off in the US Dollar Index (DXY). The pair has continued its three-day losing streak and has refreshed its two-week low at 81.03.
Meanwhile, the USD Index has turned lackluster after dropping to near 105.50. S&P500 futures are holding their Wednesday’s gains and showing no signs of exhaustion. The 10-year US Treasury yields are showing a minor recovery after dropping to near 3.60%. The US Treasury bonds have received significant interest from the market participants as Fed Powell’s commentary bolstered rate hike slowdown chatters.
As the Federal Reserve (Fed) has decided to consider economic prospects too along with the foremost priority of bringing price stability, the US Dollar might lose its dictatorship ahead.
Going forward, investors will focus on the United States Nonfarm Payrolls (NFP) data, which will release on Friday. The official payrolls report could disclose subdued employment generation if the US Automatic Data Processing (ADP) Employment data is being considered. Apart from that, average earnings data also holds significant importance.
After containing galloping perishable and durable goods prices, higher earnings will create troubles for the Fed policymakers. Post a slowdown in inflation led by accelerating interest rates, households will remain with higher earnings that could trigger retail demand.
On the Indian rupee front, aggressive buying in Indian equities is indicating robust buying by Foreign Institutional Investors (FIIs), which is strengthening the Indian rupee. The Indian rupee rally is expected to remain capped as oil prices have soared vigorously led by three consecutive drawdowns in oil inventories reported by the US Energy Information Administration (EIA).
Speaking at a New York Times event early Thursday, US Treasury Secretary Janet Yellen said that the US economy will likely be able to achieve a so-called "soft landing," in which inflation slows without tipping the economy into a sharp recession.
Key quotes
“I believe there is a path by which a soft landing could happen.”
“I believe there are risks to that path, but I believe it is certainly possible for us to have a soft landing.”
- Test of the descending triangle breakout will provide a buying opportunity at bargain prices.
- Fed’s view of policy moderation has infused fresh blood into risk-sensitive currencies.
- Oscillation in the bullish range of 60.00-80.00 by the RSI (14) adds to the upside filters.
The GBP/USD pair is displaying a lackluster performance after dropping from the round-level resistance of 1.2100 in the Asian session. Exhaustion in the upside momentum has faded Cable’s rally for a while, however, the upside bias is still intact amid the risk appetite theme.
Meanwhile, the US Dollar Index (DXY) is aiming to build a cushion around 105.50 as Federal Reserve (Fed) chair Jerome Powell has supported moderation of policy tightening to safeguard the United States economy from any crash.
On an hourly scale, the Cable is expected to test the breakout of the descending triangle chart pattern near 1.2060. The downward-sloping trendline of the aforementioned chart pattern is placed from November 24 high at 1.2154 while the horizontal support is plotted from November 28 low at 1.1941.
It is worth noting that Cable witnessed a responsive buying action on Wednesday around 1.1900 that safeguarded the descending triangle breakdown. This has also strengthened the odds of an upside move ahead.
Advancing 20-period Exponential Moving Average (EMA) at 1.2030 adds to the upside filters. Also, the Relative Strength Index (RSI) (14) is oscillating in a bullish range of 60.00-80.00, which indicates a continuation of bullish momentum.
Going forward, a corrective move near the 1.2060 area will present a bargain buying opportunity for the market participants, which will drive the Cable towards Monday’s high at 1.2118, followed by November 24 high at 1.2154.
Alternatively, a decisive drop below Wednesday’s low at 1.1900 will drag the Cable toward November 22 low at 1.1825. A slippage below the latter will drag the pair to near November 21 low at 1.1779.
GBP/USD hourly chart
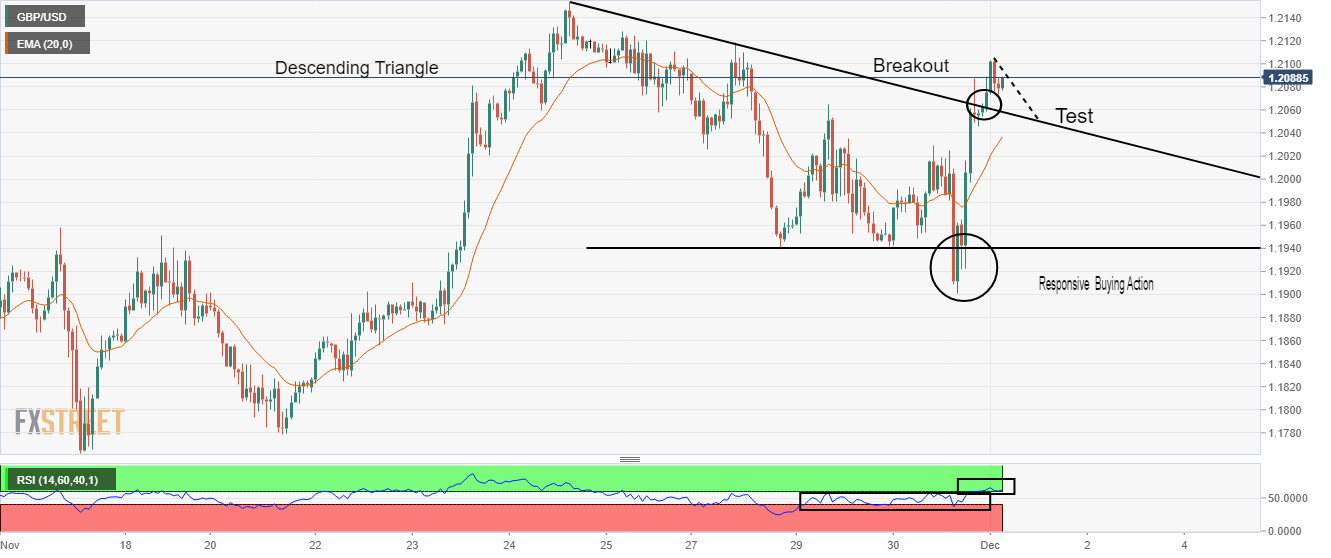
- EUR/USD retreats from intraday high to pare daily gains.
- Bullish MACD signals, steady RSI favor the rebound from 100-SMA.
- Double tops around 1.0480 appears a tough nut to crack for bulls.
- Sellers have a bumpy road to return unless breaking 200-SMA.
EUR/USD grinds higher past 1.0400, taking rounds to 1.0430 during early Thursday, as bulls await the key data/events after posting the biggest monthly jump since September 2010.
Also read: EUR/USD bulls approach 1.0500 hurdle ahead of German Retail Sales, Fed’s preferred inflation data
In doing so, the major currency pair struggles to extend the previous day’s U-turn from the 100-SMA.
However, recent bullish signals on the MACD and steady RSI keep EU/USD buyers hopeful as they approach the 1.0480 key hurdle comprising the tops marked on November 15 and 28.
In a case where EUR/USD manages to cross the 1.0480 resistance, the 1.0500 threshold may act as an additional upside filter before directing the prices toward the 61.8% Fibonacci Expansion (FE) of the pair’s November 10-21 moves, near 1.0570. Following that, the late June peak surrounding 1.0615 will be in focus.
Alternatively, pullback remains elusive beyond the 100-SMA support level surrounding 1.0315.
Also acting as a downside filter is the horizontal support including levels marked since November 10, around 1.0225.
Should the EUR/USD bears keep the reins past 1.0225, the 200-SMA level surrounding 1.0100 could act as the last defense of the bulls.
EUR/USD: Four-hour chart
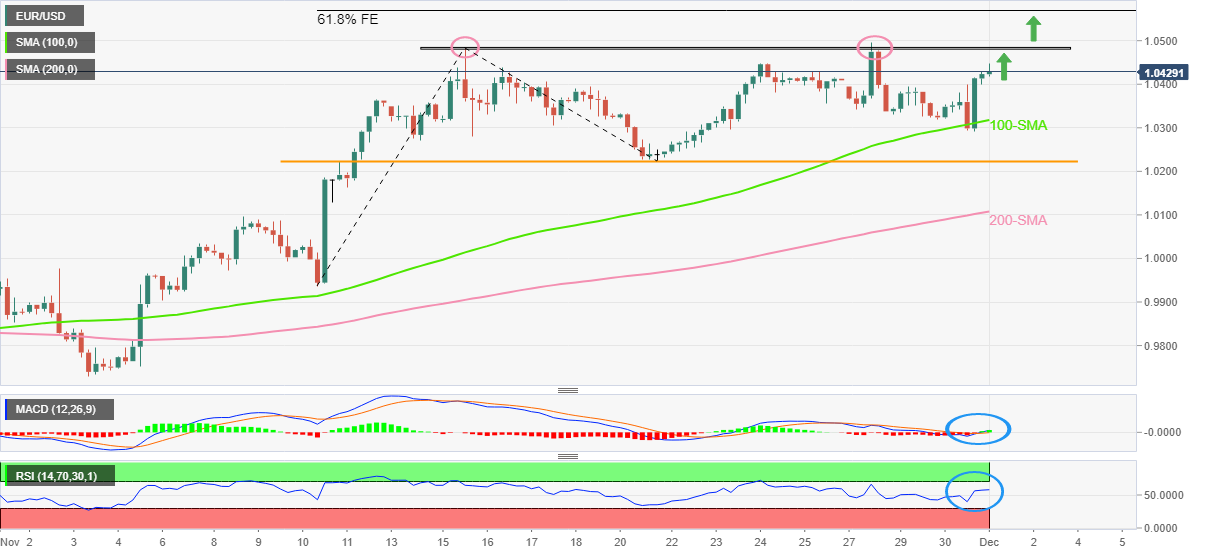
Trend: Limited upside expected
“China's housing market could bottom out by the second quarter next year as potential homebuyers may enter the market as confidence is restored following recent support for the sector,” Yicai.com reported, citing a report by China Real Estate Information Corporation.
Additional takeaways
“Recent measures to restore developers' financing ability will ease their default risks and offset the downbeat expectations of the industry. “
“The market may rebound in Q2 if the policy intensity can be maintained or strengthened into next year, but there is still uncertainty how long the market would consolidate near the bottom after the low appears.”
“In November, property sales by floor area in the key 30 cities decreased by 14% m/m, hitting a new low in a single month over the past six months, and the year-on-year decline further increased to 30%.”
Related reads
- USD/CNH faces resistance around 7.0600 as Caixin Manufacturing PMI rises to 49.4
- US National Security Adviser Sullivan: The US sees China as a growing strategic threat
- AUD/USD seesaws near the highest levels since September 13.
- China Caixin PMI crosses market forecasts, prior data in November but signals activity contraction.
- Higher US inflation expectations, risk surrounding US-China relations also probe buyers.
- Dovish Fedspeak keeps sellers off the table unless the US data prints too strong numbers.
AUD/USD bulls take a breather around 0.6810, after refreshing the 13-week high, as concerns surrounding the US and China challenge the upside momentum during early Thursday. Also likely to have probed the Aussie buyers could be the cautious sentiment ahead of the key US data.
After posting downside official activity data the previous day, China’s Caixin Manufacturing PMI rose to 49.4 in November versus 48.9 market forecasts and 49.2 previous readings. Even so, the private activity gauge remains in the contraction region for the fourth consecutive month.
Earlier in the day, Australia’s Private Capital Expenditure dropped to -0.6% for the third quarter (Q3) versus 1.5% expected and -0.3% prior.
That said, a recent increase in the US inflation expectations, as per the 10-year and 5-year breakeven inflation rates per the St. Louis Federal Reserve (FRED) data, should have also probed the AUD/USD. On the same line were the downbeat comments from US National Security Adviser Jake Sullivan suggesting fresh challenges for the Sino-American optimists. The diplomat said, “The US sees China as a growing strategic threat.”
It should, however, be noted that the dovish comments from the Federal Reserve (Fed) officials, including Chairman Jerome Powell, joins softer US employment-linked data to keep the AUD/USD buyers hopeful. Also likely to signal the quote’s further upside could be the recently easing virus-led activity controls in China as the dragon nation reports the third day of declining daily infections after refreshing the record top.
Amid these plays, S&P 500 Futures print mild gains and the equities in the Asia-Pacific region grind higher by tracking Wall Street gains. Further, the US 10-year Treasury bond yields remain pressured around 3.62% after refreshing a two-month low the previous day.
Looking forward, the Fed’s preferred inflation gauge, namely US Core Personal Consumption Expenditure (PCE) Price Index for October, expected 5.0% YoY in October versus 5.1% prior, will be crucial for near-term directions. Also important to watch will be the monthly prints of the US ISM Manufacturing PMI for November, expected 49.8 versus 50.2 prior.
Technical analysis
Unless breaking the downward-sloping trend line from mid-September, around 0.6765, the AUD/USD pair remains on the way to approaching September’s top surrounding 0.6915, quickly followed by the 200-DMA hurdle near 0.6925.
- USD/CAD seesaws around intraday low during two-day downtrend.
- China data, cautious mood ahead of the key US statistics probes US Dollar bears.
- WTI crude oil eases amid hopes of OPEC+ policy rollover, higher US crude oil output.
- US Core PCE Price Index, ISM Manufacturing PMI and Canada S&P Global Manufacturing PMI will decorate calendar.
USD/CAD pares intraday losses around 1.3425 amid dicey markets during early Thursday, especially after the previous day’s heavy momentum. In doing so, the Loonie pair also takes clues from the recently downbeat prices of Canada’s main export item WTI crude oil, as well as justifies the cautious mood ahead of the key US data.
It’s worth noting that China’s latest activity numbers also seemed to have challenged the USD/CAD bears of late. That said, China’s Caixin Manufacturing PMI rose to 49.4 in November versus 48.9 market forecasts and 49.2 previous readings. Even so, the private activity gauge remains in the contraction region for the fourth consecutive month.
WTI crude oil prints mild losses around $80.60, pausing the three-day uptrend near the weekly high, amid speculations that the global oil producers may announce no policy change during this weekend’s OPEC+ meeting. Also likely to have probed the oil buyers could be the higher US supplies as Reuters quotes the US Energy Information Administration as saying, “US crude oil output surpassed 12 million barrels a day, the highest since before the onset of the coronavirus pandemic.”
Furthermore, a recent increase in the US inflation expectations, as per the 10-year and 5-year breakeven inflation rates per the St. Louis Federal Reserve (FRED) data, should have also probed the USD/CAD bears. On the same line were the downbeat comments from US National Security Adviser Jake Sullivan suggesting fresh challenges for the Sino-American optimists.
Previously, Fed’s Powell stated that it makes sense to moderate the pace of interest rate increases while also suggesting that the time to slow the pace of rate hikes could come as soon as the next meeting in December. On the same line was a member of the Fed Board of Governors Lisa D. Cook who praised the inflation data to signal that the Fed would likely take smaller steps as it moves forward.
Additionally, the recently easing virus-led activity controls in China and downbeat US data also weighed on the US Dollar the previous day. That said, the US ADP Employment Change data for November as it marked the lowest readings since January 2021 with a 127K figure for November versus the 200K forecast and 239K previous readings.
Moving on, risk catalysts could entertain USD/CADpair traders but major attention will be given to the Fed’s preferred inflation gauge, namely US Core Personal Consumption Expenditure (PCE) Price Index for October, expected 5.0% YoY in October versus 5.1% prior. Also important to watch will be the monthly prints of the US ISM Manufacturing PMI and Canadian S&P Global Manufacturing PMI for November, expected 49.8 and 49.3 versus 50.2 and 50.0 respective priors.
Also read: US October PCE inflation & ISM Manufacturing PMI Preview: Seen through Fed’s eyes
Technical analysis
Unless crossing the 1.3510 resistance confluence including the 200-SMA and 38.2% Fibonacci retracement level of the October-November downside, the USD/CAD buyers are likely to remain off the table.
| Raw materials | Closed | Change, % |
|---|---|---|
| Silver | 22.191 | 4.5 |
| Gold | 1768.32 | 1.11 |
| Palladium | 1877.53 | 2.71 |
- Gold price rises for the third-straight day, hitting two-week highs on Thursday.
- Dovish Fed Chair Powell’s message and China’s reopening optimism smash the US Dollar.
- Gold price sees a smooth sail toward the previous month’s highs and SMA200 one-day.
Gold price is sitting at the highest level unseen in two weeks near $1,780, consolidating the three-day winning streak so far this Thursday. The main underlying reason behind the Gold price upsurge is a clear dovish message from Federal Reserve Chair Jerome Powell, sealing in a 50 basis points (bps) rate hike in December. Powell’s dovish take leaves the US Dollar licking its wounds across the board. China’s reopening optimism is boding well for risk appetite, boosting Gold price at the expense of the safe-haven US Dollar. Mixed US economic data offered a mixed picture of the state of the American economy, collaborating with the US Dollar weakness. All eyes now remain focussed on Friday’s US Nonfarm Payrolls release, as the Fed enters the ‘blackout period’ ahead of the December 13-14 monetary policy meeting. In the meantime, the US Core PCE inflation and ISM Manufacturing PMI data could be also closely scrutinized.
Also read: US October PCE inflation & ISM Manufacturing PMI Preview: Seen through Fed’s eyes
Gold Price: Key levels to watch
The Technical Confluence Detector shows that the gold price needs a clear break above the previous high four-hour at $1,780 in order to initiate a fresh advance toward the previous month’s high of $1,787.
Doors will then open up toward the SMA200 one-day at $1,796, with the next bullish target seen at the $1,800 threshold.
Alternatively, the immediate support is envisioned at $1,772, the pivot point one-week R1, below which the previous day’s high at $1,770 will get tested.
Further south, the Fibonacci 23.6% one-day support at $1,765 will come into play. The previous week’s high at $1,761 will be a tough nut to crack for Gold bears.
Here is how it looks on the tool
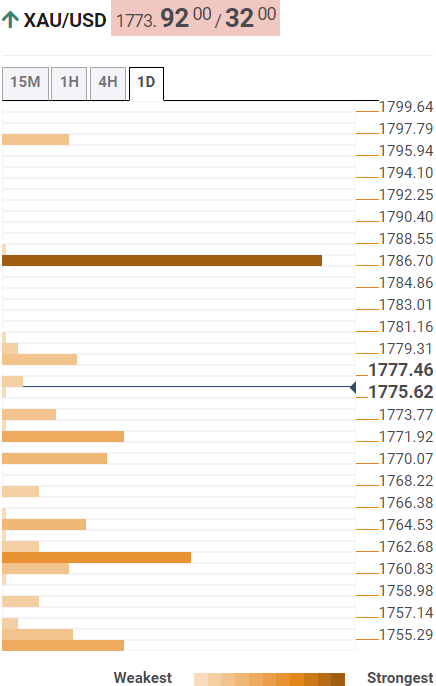
About Technical Confluences Detector
The TCD (Technical Confluences Detector) is a tool to locate and point out those price levels where there is a congestion of indicators, moving averages, Fibonacci levels, Pivot Points, etc. If you are a short-term trader, you will find entry points for counter-trend strategies and hunt a few points at a time. If you are a medium-to-long-term trader, this tool will allow you to know in advance the price levels where a medium-to-long-term trend may stop and rest, where to unwind positions, or where to increase your position size.
- AUD/JPY snaps two-day uptrend, holds lower ground of late.
- China’s Caixin Manufacturing PMI came in firmer but failed to project activity increase in November.
- Convergence of 50-HMA, ascending trend line from Tuesday restricts immediate downside.
- 200-HMA, Fortnight-old resistance line and bearish MACD signals challenge recovery moves.
AUD/JPY struggles to justify upbeat China activity numbers during early Thursday as sellers poke short-term key support around 93.00 by the press time.
China’s Caixin Manufacturing PMI rose to 49.4 in November versus 48.9 market forecasts and 49.2 previous readings. Even so, the private activity gauge remains in the contraction region for the fourth consecutive month.
As a result, the bears poke a convergence of the 50-HMA and a three-day-old ascending support line near 93.00.
In addition to the data, the cross-currency pair’s downside break of the 200-HMA, around 93.45 by the press time, also keeps the AUD/JPY bears hopeful, not to forget the bearish MACD signals and a U-turn from the fortnight-long resistance line.
Due to these signals, the AUD/JPY price is likely to break the 93.00 support confluence and can poke the latest trough surrounding 92.15.
However, any further downside past 92.15 could make the pair vulnerable to challenging October’s low near 90.85.
On the contrary, recovery moves need a clear upside break of the 200-HMA level surrounding 93.45 before challenging the aforementioned resistance line, close to 93.80 at the latest.
Following that, multiple hurdles around 94.00 and 94.10 could challenge the AUD/JPY bulls before giving them control.
AUD/JPY: Hourly chart
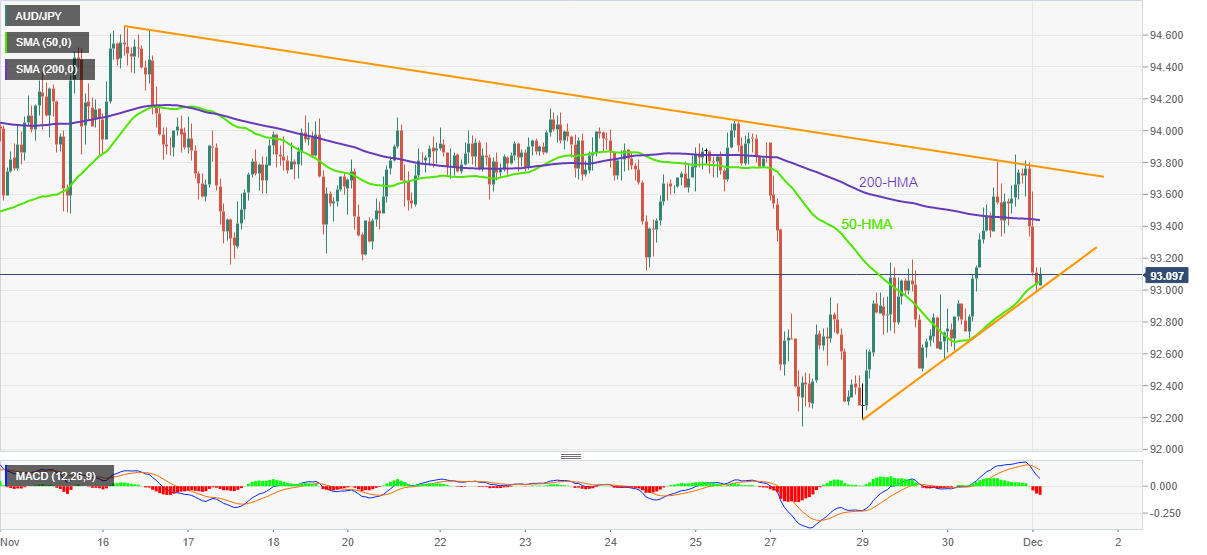
Trend: Limited downside expected
- USD/CNH has sensed barricades after a mild recovery around 7.0600 amid upbeat Caixin Manufacturing PMI.
- China‘s official Manufacturing PMI has landed at 49.4 vs. expectations of 48.9.
- Weak cues from US ADP Employment are suggesting a decline in US NFP ahead.
The USD/CNH pair is looking to conclude its recovery move around 7.0600 as China’s official Manufacturing PMI has landed better than expectations. The Caixin Manufacturing PMI has been recorded at 49.4 for November month vs. 48.9 as projected and October’s release of 49.2. A surprise rise in the official Manufacturing PMI is expected to support the Chinese yuan ahead.
Meanwhile, the risk profile in the global market is extremely bullish as the Federal Reserve (Fed) has given a green signal to deceleration in interest rate hike pace from December monetary policy meeting. The US Dollar Index (DXY) has attempted a recovery after dropping to near 105.50, however, the downside bias is rock solid.
S&P500 futures are displaying a muted start in the Asian session after a juggernaut rally in New York. A significant rise in investors’ risk appetite has impacted returns on US Treasury bonds. The 10-year US Treasury yields have dropped to near 3.61%.
Weak employment numbers in November, a slowdown in economic activities, and a surprise decline in October’s inflation report have backed less-hawkish commentary from Fed chair Jerome Powell. The Fed chair is not ready to crash the economy in lieu of cleaning the inflation mess. Accelerating interest rates by the Fed has triggered fears of financing risks dramatically, therefore, the Fed has preferred to go a little light on interest rates this time and hike the interest rates by 50 basis points (bps).
Going forward, investors will keep an eye on US Nonfarm Payrolls (NFP) data, which will release on Friday. Expectations favor a steep decline in the number of fresh payrolls following cues from the US Automatic Data Processing (ADP) Employment data.
- NZD/USD takes the bids to defend post-Powell rally as China data favor the Kiwi pair bulls.
- China Caixin Manufacturing PMI for November rose past market forecasts and prior readings.
- Easing Covid controls in Beijing, dovish Fedspeak favor buyers despite the Sino-American tension.
- Fed’s preferred inflation gauge, US ISM Manufacturing PMI will decorate the calendar.
NZD/USD stays firmer around 0.6325, the highest level since mid-August, after higher-than-expected China activity data during early Thursday. In doing so, the Kiwi pair defends the recent upward trajectory backed by the broad-based US Dollar weakness and risk-on mood.
China Caixin Manufacturing PMI rose to 49.4 in November versus 48.9 market forecasts and 49.2 previous readings.
Earlier in the day, the NZD/USD pair cheered the broad US Dollar weakness amid the risk-on mood and recently dovish bias of the Federal Reserve (Fed) officials, including Chairman Jerome Powell.
On Wednesday, Fed’s Powell stated that it makes sense to moderate the pace of interest rate increases while also suggesting that the time to slow the pace of rate hikes could come as soon as the next meeting in December. On the same line was a member of the Fed Board of Governors Lisa D. Cook who praised the inflation data to signal that the Fed would likely take smaller steps as it moves forward.
It should be noted that the recently easing virus-led activity controls in China and downbeat US data also weighed on the US Dollar the previous day. That said, the US ADP Employment Change data for November as it marked the lowest readings since January 2021 with a 127K figure for November versus the 200K forecast and 239K previous readings.
Alternatively, a recent increase in the US inflation expectations, as per the 10-year and 5-year breakeven inflation rates per the St. Louis Federal Reserve (FRED) data. Additionally, the downbeat comments from US National Security Adviser Jake Sullivan also challenge the market sentiment and the NZD/USD buyers.
Even so, S&P 500 Futures print mild gains and the equities in the Asia-Pacific region grind higher by tracking Wall Street gains. Further, the US 10-year Treasury bond yields remain pressured around 3.61% after refreshing a two-month low the previous day.
Looking forward, risk catalysts could entertain NZD/USD pair traders but major attention will be given to the Fed’s preferred inflation gauge, namely US Core Personal Consumption Expenditure (PCE) Price Index for October, expected 5.0% YoY in October versus 5.1% prior. Also important to watch will be the monthly prints of the US ISM Manufacturing PMI for November, expected 49.8 versus 50.2 prior.
Also read: US October PCE inflation & ISM Manufacturing PMI Preview: Seen through Fed’s eyes
Technical analysis
A six-month-old resistance line, near 0.6330 at the latest, appears the key hurdle for the NZD/USD bulls to cross to keep the reins. Otherwise, a pullback towards the 200-DMA level around 0.6235 can’t be ruled out.
Bank of Japan's Asahi Noguchi said that they must see wages rise at a faster pace than the rate of inflation to achieve the appropriate level of inflation in a stable manner.
Also, he said that Japan must see domestic maco-economic factors, such as steady rise in nominal wages, to push up prices to stably achieve BoJ's 2% inflation target.
Key comments
BoJ must maintain monetary easing, keep interest rates at low levels now as achievement of 2% inflation target remains uncertain.
Desirable for fx rates to move stably reflecting fundamentals.
Excessively sharp fx fluctuations cause demerits, so must be vigilant to impact of fx moves and impact on japan's economy and prices.
There is risk monetary tightening undertaken by central banks could hurt global growth.
Recent rise in japan's consumer inflation due mostly to rising imported goods prices.
Japan's trend inflation, which is more important in guiding monetary policy, remains low.
More companies are passing on rising costs to consumers, which could affect trend inflation.
Cannot say japan has stably, sustainably achieved boj's 2% inflation target yet.
Japan's consumer inflation likely to fall back below 2% once cost-push factors dissipate.
The Caixin China Manufacturing PMI, released by Markit Economics has been released as follows:
49.4 (vs. estimated 48.9 and the previous 49.2.
AUD/USD update
On the data, the Aussie has not budged. However, AUD/USD increased to an 11-week high of 0.6816 after the US dollar fell across the board after Federal Reserve Chairman Jerome Powell said that the US central bank could scale back the pace of its interest rate hikes. This sent the US Dollar index on track for its worst month since 2010.
About the Caixin China Manufacturing PMI
The Caixin China Manufacturing PMI™, released by Markit Economics, is based on data compiled from monthly replies to questionnaires sent to purchasing executives in over 400 private manufacturing sector companies.
US National Security Adviser Jake Sullivan said on Thursday that “the US sees China as a growing strategic threat.”
Sullivan added: “The US, South Korea, And Japan are working on new sanctions against North Korea.”
Market reaction
AUD/USD is unfazed by the above comments, holding higher ground above 0.6800, up 0.31% on the day. The Aussie pair await China’s Manufacturing PMI data for fresh trading impetus, as bulls cheer Chinese reopening optimism.
-
AUD/USD Price Analysis: Bulls eye 0.6850 while bears look to 0.6650
- GBP/JPY has declined firmly below 165.50 as UK food inflation has soared.
- A significant jump in UK inflation has cemented a bleak winter season ahead.
- The speech from BOJ Kuroda will provide fresh cues on the interest rate and inflation guidance.
The GBP/JPY pair has dropped sharply below 165.50 firmly after failing to overstep the critical hurdle of 166.50 in early Tokyo. The Pound Sterling is facing immense heat and has tested Wednesday’s low at 165.50 as a significant surge in the United Kingdom's food inflation rate has dampened the sentiment of households.
The UK food inflation has surged to a 45-month high at 12.4% in November, higher than the prior release of 11.6% in October. A fresh impulsive move in the food category has weakened projections for the Christmas season ahead. Higher food prices are expected to leave households with lower earnings for disposable, which could hit their Christmas purchases.
As per the Financial Times, this is the biggest inflation rate in the food category since records began in 2005, and higher than overall shop price annual inflation, which was a record 7.4% in November, up from 6.6% in October.
While responding to the spiraling cost of food products, British Retail Consortium (BRC) chief executive Helen Dickinson said: “Winter looks increasingly bleak as pressures on prices continue unabated.”
Meanwhile, UK’s new freeport regime is hurting the European Union as the latter believes that the Freeport regime could attract fresh investments. The Freeport regime could provide the UK benefits of tax breaks and simplified customs controls ahead.
On the Tokyo front, investors are awaiting the speech from the Bank of Japan (BOJ) Governor Haruhiko Kuroda, which is due on Friday. The speech from Haruhiko Kuroda will provide fresh cues for monetary policy action ahead. Apart from that, inflation guidance will also be crucial as Tokyo's inflation surged dramatically in October.
In recent trade today, the People’s Bank of China (PBOC) set the yuan (CNY) at 7.1225 vs. the last close of 7.0929.
About the fix
China maintains strict control of the yuan’s rate on the mainland.
The onshore yuan (CNY) differs from the offshore one (CNH) in trading restrictions, this last one is not as tightly controlled.
Each morning, the People’s Bank of China (PBOC) sets a so-called daily midpoint fix, based on the yuan’s previous day's closing level and quotations taken from the inter-bank dealer.
Reuters reported that the giant Chinese cities of Guangzhou and Chongqing announced an easing of COVID curbs on Wednesday, a day after demonstrators in southern Guangzhou clashed with police amid a string of protests against the world's toughest coronavirus restrictions.
This in part has given a sigh of relief to financial markets midweek and has enabled the Australian Dollar to rally to fresh highs as follows:

-
AUD/USD Price Analysis: Bulls eye 0.6850 while bears look to 0.6650
Meanwhile, China reports 34,942 new local covid cases for November 30 (previous 36,683).
Nevertheless, China’s most senior official in charge of its Covid response told health officials Wednesday that the country faced a “new stage and mission” in pandemic controls, state media Xinhua reported – potentially indicating an adjustment to Beijing’s “zero-Covid” strategy which has sparked days of nationwide protests.
“With the decreasing toxicity of the Omicron variant, the increasing vaccination rate and the accumulating experience of outbreak control and prevention, China’s pandemic containment faces new stage and mission,” Sun Chunlan, China’s vice premier, said Wednesday, according to Xinhua.
The US Federal Reserve (Fed) policymakers, including Chairman Jerome Powell, recently praised the easing in inflation numbers to signal easy rate hikes starting in December.
However, the US inflation expectations as per the 10-year and 5-year breakeven inflation rates per the St. Louis Federal Reserve (FRED) data, challenge the dovish bias by refreshing the multi-day high. The same should challenge the US Dollar bears ahead of the Fed’s preferred inflation gauge, namely US Core Personal Consumption Expenditure (PCE) Price Index for October, expected 5.0% YoY in October versus 5.1% prior.
The latest prints of the 5-year and 10-year inflation expectations rose to 2.41% and 2.34% respectively to reach the highest levels since November 15.
That said, the US Dollar Index (DXY) snapped a three-day uptrend while portraying the biggest daily loss in a week the previous day, not to forget mentioning the biggest monthly fall since September 2010. It’s worth noting that the Wall Street benchmarks cheered the dovish remarks from Fed Chair while the United States 10-year Treasury bond yields reversed the early gains to end November on a negative footing around 3.61%.
It should be observed that the DXY extends the previous day’s losses to 105.55 while S&P Futures print mild gains and the Asia-Pacific shares are also up by the press time.
To sum up, the inflation precursors warrant the USD bears to remain cautious ahead of the key US data.
Also read: US October PCE inflation & ISM Manufacturing PMI Preview: Seen through Fed’s eyes
- Silver price remains firmer at the highest levels in six months.
- Clear break of descending trend line from March, sustained bounce off 200-day EMA favor bulls.
- June’s peak could challenge further upside as RSI approaches overbought territory.
Silver price (XAG/USD) renews a six-month high of around $22.40 early Thursday, after crossing the key resistance line stretched from March.
The bright metal registered the biggest daily jump in three weeks the previous day while portraying a sustained bounce from the 200-day Exponential Moving Average (EMA).
However, the nearly overbought Relative Strength Index (RSI) line, placed at 14, challenges the XAG/USD bulls as they approach June’s peak surrounding $22.50.
Hence, a daily closing beyond the same becomes necessary for the Silver buyers to keep control.
In that case, May’s peak near $23.30 and March’s low around $24.00 could lure the XAG/USD bulls.
On the flip side, pullback moves remain elusive unless staying beyond the aforementioned eight-month-old resistance-turned-support line, currently around $22.15.
Following that, October’s high near $21.25 and the 200-day EMA level surrounding $21.00 could challenge Silver sellers.
Also acting as the downside filter is August month’s high near $20.85 and May’s low near $20.45.
Overall, the Silver price remains on the buyer’s radar but the metal’s further upside hinges on a $22.50 breakout.
Silver: Daily chart
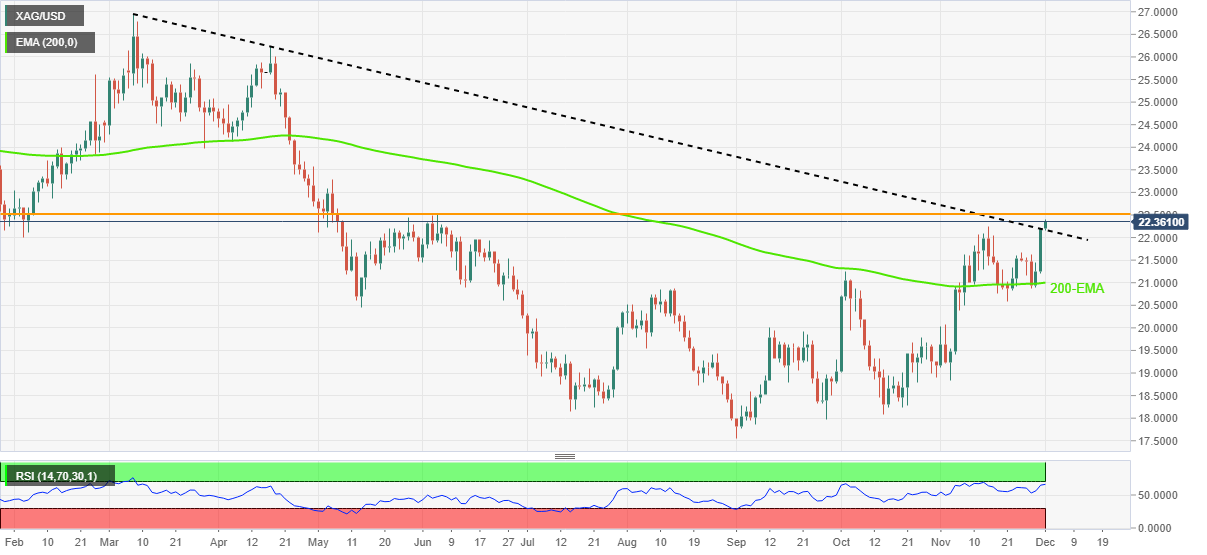
Trend: Limited upside expected
- AUD/USD bulls eye a move towards 0.6850.
- A break of the micro trendline opens risk to 0.6650.
AUDUSD increased to an 11-week high of 0.6813 after the US dollar fell across the board after Federal Reserve Chairman Jerome Powell said that the US central bank could scale back the pace of its interest rate hikes. This sent the US Dollar index on track for its worst month since 2010.
The following illustrates the technical outlook for AUD/USD on the daily and 4-hour charts:
AUD/USD daily chart
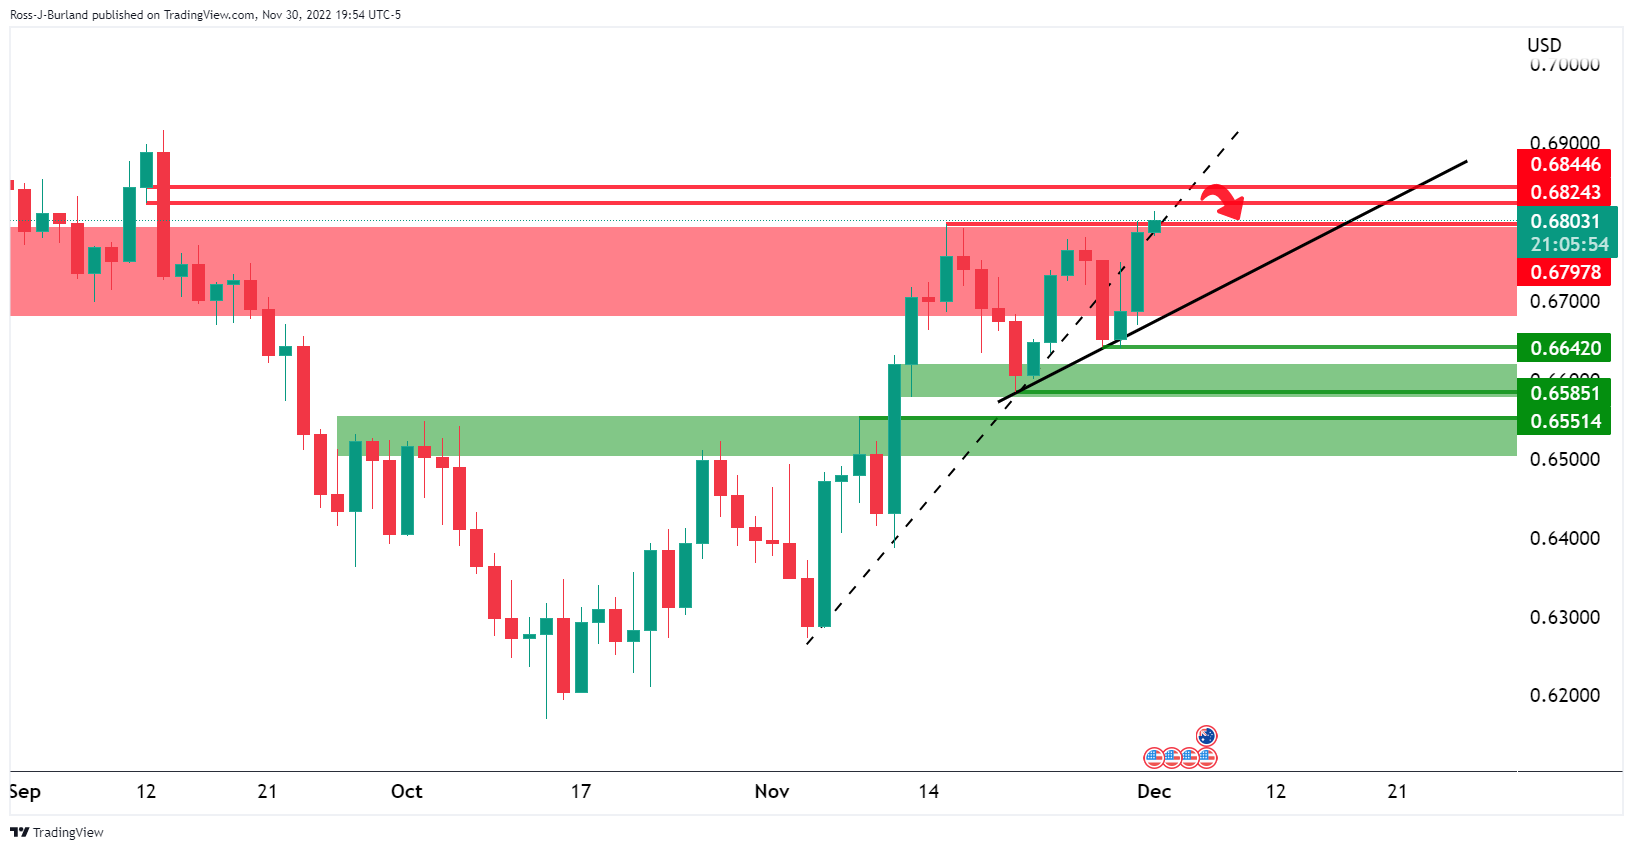
AUD/USD is heading into an area of liquidity and prior resistance between 0.6420/50. Should the US Dollar find buyers in its decent, AUD/USD find itself on the way to test the rising trendline on the daily chart near 0.6750.
AUD/USD H4 chart
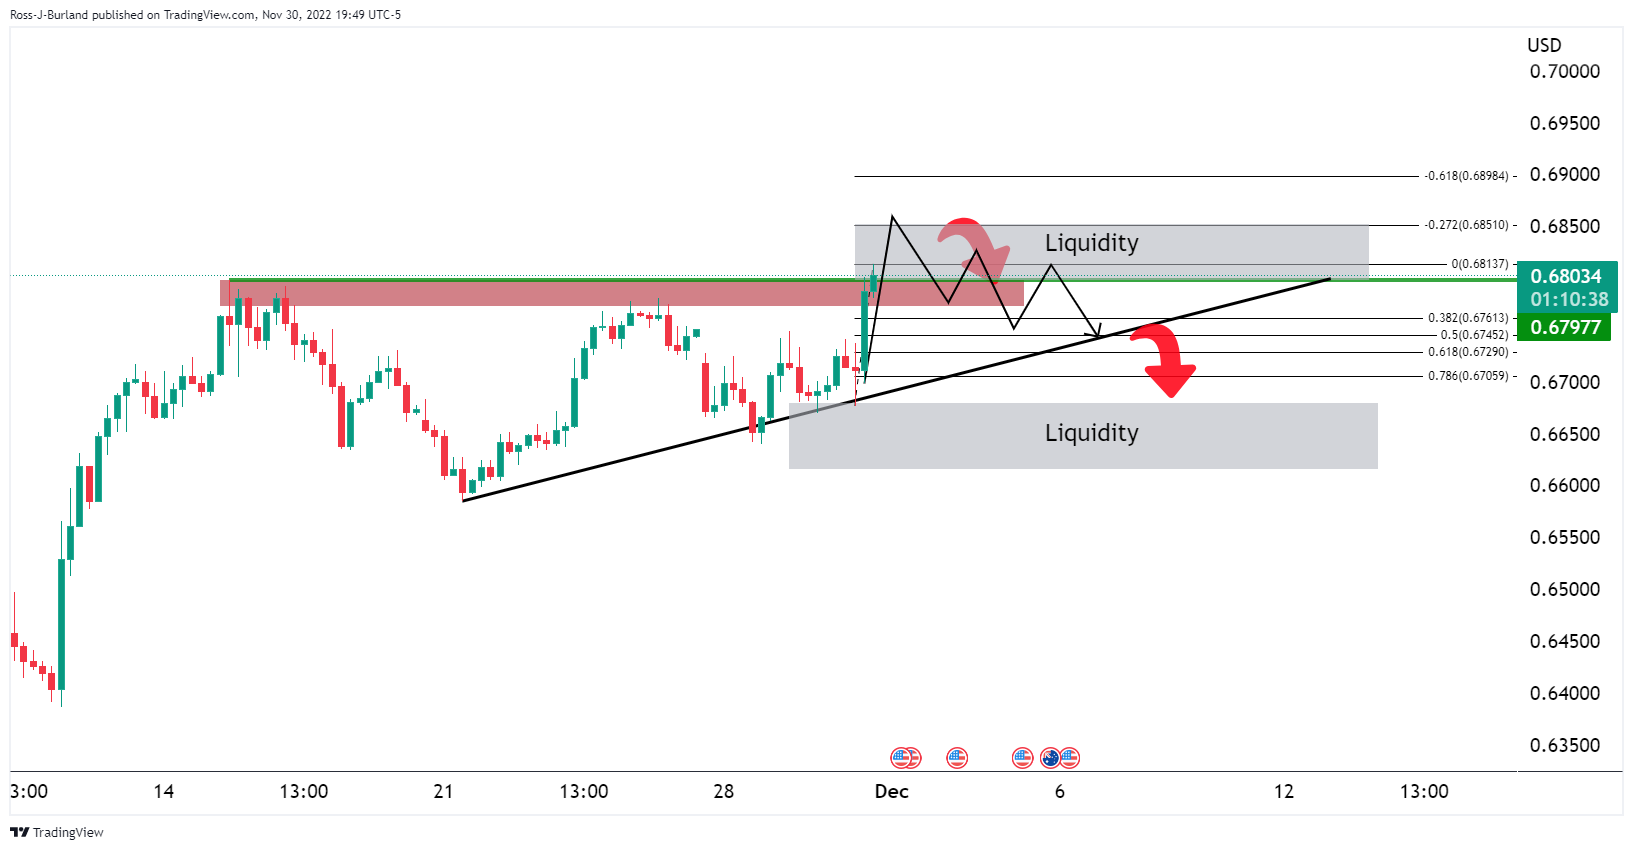
Moving down to the lower time frames we can see the possible areas of interest above and below the price. A break of the micro trendline opens risk to 0.6650.
- EUR/USD takes the bids to refresh intraday high.
- US Dollar extends Fed Chair Powell-inspired losses amid downbeat Treasury bond yields.
- Easing rate hike fears surrounding ECB, Fed adds strength to the EUR/USD rebound ahead of the key data/events.
EUR/USD stays on the front foot around 1.0435 while renewing its intraday top amid the broad-based US Dollar weakness during early Thursday. In doing so, the major currency pair extends the previous day’s run-up ahead of the key data from Eurozone and the United States.
The quote rose the most in a week while allowing the EUR/USD bulls to cheer the biggest monthly gains in 12 years as the US Dollar slumped after Federal Reserve Chairman Jerome Powell’s dovish remarks.
In his first public appearance after November’s Federal Open Market Committee (FOMC) meeting, Fed Chair Powell stated that it makes sense to moderate the pace of interest rate increases. The policymaker also suggested that the time to slow the pace of rate hikes could come as soon as the next meeting in December. On the same line was a member of the Fed Board of Governors Lisa D. Cook who praised the inflation data to signal that the Fed would likely take smaller steps as it moves forward.
Additionally favoring the EUR/USD bulls were the downbeat prints of the US ADP Employment Change data for November as it marked the lowest readings since January 2021 with a 127K figure for November versus the 200K forecast and 239K previous readings.
On the other hand, Eurozone inflation, as per the preliminary readings of the Harmonized Index of Consumer Prices (HICP) rose 10.0% YoY compared to 10.4% expected and 10.6% prior. However, the Core HICP remained unchanged at the all-time high of 5.0% YoY and highlights the inflation woes in the bloc. Furthermore, Germany’s Unemployment Rate rose to 5.6% in November versus 5.5% market expectations and prior. The details suggest that the Unemployment Change arrived at 17K versus 13K expected and 8K previous readout.
It should be noted that the gradual easing of the Covid-led activity controls in China joined hopes of speedy recovery from recession to also favor the EUR/USD upside.
Amid these plays, the US Dollar Index (DXY) snapped a three-day uptrend while portraying the biggest daily loss in a week, not to forget mentioning the biggest monthly fall since September 2010. It’s worth noting that the Wall Street benchmarks cheered the dovish remarks from Fed Chair while the United States 10-year Treasury bond yields reversed the early gains to end November on a negative footing around 3.61%.
Moving ahead, Germany’s Retail Sales for October, expected -2.8% YoY versus -0.9% prior, could offer immediate directions to the EUR/USD pair ahead of the Fed’s preferred inflation gauge, namely US Core Personal Consumption Expenditure (PCE) Price Index for October, expected 5.0% YoY in October versus 5.1% prior. Also important will be the monthly prints of the US ISM Manufacturing PMI for November, expected 49.8 versus 50.2 prior.
Other than the data, comments from the Federal Reserve and the European Central Bank (ECB) policymakers will also be crucial for the EUR/USD traders to watch.
Technical analysis
EUR/USD’s sustained closing beyond the 200-DMA, around 1.0370 by the press time, keeps the buyers hopeful. On the same line could be the quote’s successful rebound from the 61.8% Fibonacci retracement level of June-September downside, close to 1.0300.
That said, EUR/USD bulls keep their eyes on an upward-sloping resistance line from August 10, near 1.0500 at the latest, before targeting the late June swing high around 1.0615 and June’s peak surrounding 1.0775.
- EUR/GBP is sideways in a 40-pip range broadly ahead of German Retail Sales.
- A surprise decline in Eurozone inflation has weakened hawkish ECB bets.
- The sentiment of UK households was dampened as food inflation soared to a 45-month high.
The EUR/GBP pair has picked bids after dropping to near 0.8620 in the Asian session. The asset is broadly sideways in a 0.8620-0.8660 range for the past three trading sessions despite a decline in the Eurozone Harmonized Index of Consumer Prices (HICP). A recovery move in the cross is feeble for now and requires more filters for being a stronger one.
On Wednesday, the headline Eurozone HICP released lower at 10.0% than the expectations of 10.4% and the prior release of 10.6%. Ease in energy prices after electrifying moves resulted in a slowdown in inflationary pressures while food prices are still solid in the Eurozone economy. The core HICP numbers remained flat at 5.0% due to supply chain bottlenecks.
Meanwhile, the European Central Bank (ECB) policymakers are worried about increments in wages. At a point of time, when inflationary pressures will cool down higher wages will stay, which could de-anchor long-term inflation expectations.
A decline in the preliminary November inflation report has cemented a drop in rate hike extent to 50 basis points (bps) as suggested by Commerzbank.
Also, an unfavorable German unemployment report is supporting a decline in an interest rate hike by the ECB in its December monetary policy meeting.
Going forward, investors will keep an eye on German Retail Sales data. The economic data is expected to expand its contraction to 2.8% vs. a prior contraction of 0.9% on an annual basis. Also, monthly figures are expected to contract by 0.6% against an expansion of 0.9%. A decline in retail demand will delight ECB policymakers.
On the United Kingdom front, 45-year high annual growth in food inflation to 12.4% in November, released by the British Retail Consortium (BRC), has dampened sentiment of households as they will be unable to offset higher food prices with subdued earnings.
Responding to the figures, BRC chief executive Helen Dickinson said: “Winter looks increasingly bleak as pressures on prices continue unabated”, as reported by Financial Times. This might impact Pound Sterling ahead.
| Index | Change, points | Closed | Change, % |
|---|---|---|---|
| NIKKEI 225 | -58.85 | 27968.99 | -0.21 |
| Hang Seng | 392.55 | 18597.23 | 2.16 |
| KOSPI | 39.14 | 2472.53 | 1.61 |
| ASX 200 | 30.9 | 7284.2 | 0.43 |
| FTSE 100 | 61.05 | 7573.05 | 0.81 |
| DAX | 41.59 | 14397.04 | 0.29 |
| CAC 40 | 69.58 | 6738.55 | 1.04 |
| Dow Jones | 737.24 | 34589.77 | 2.18 |
| S&P 500 | 122.48 | 4080.11 | 3.09 |
| NASDAQ Composite | 484.22 | 11468 | 4.41 |
- USD/CAD holds lower ground after falling the most in three weeks the previous day.
- Convergence of 100-SMA, fortnight-old ascending trend line challenges sellers.
- Any recovery remains elusive below downwards-sloping resistance line from mid-October.
USD/CAD remains depressed around 1.3420, despite bouncing off the intraday low of 1.3408, as sellers cheer a downside break of 200-SMA during early Thursday. That said, the Loonie pair dropped the most in three weeks the previous day while breaking the key Simple Moving Average (SMA).
In addition to the SMA breakdown, the bearish MACD signals and a clear U-turn from the seven-week-old resistance line, around 1.3585 by the press time, also keep the USD/CAD bears hopeful.
However, the 100-SMA and an ascending support line from mid-November, close to 1.3380, appear a tough nut to crack for the USD/CAD bears.
Following that, a downward trajectory to poke November’s low of 1.3226 can’t be ruled out.
Alternatively, recovery moves may initially aim for the 1.3500 round figure before jostling with the 1.3510 resistance confluence including the 200-SMA and 38.2% Fibonacci retracement level of the October-November downside.
In a case where USD/CAD remains firmer past 1.3510, the bulls could challenge the aforementioned key resistance line from October near 1.3585 before taking control.
Overall, USD/CAD bears may take a breather around 1.3380 but aren’t likely to relinquish control.
USD/CAD: Four-hour chart
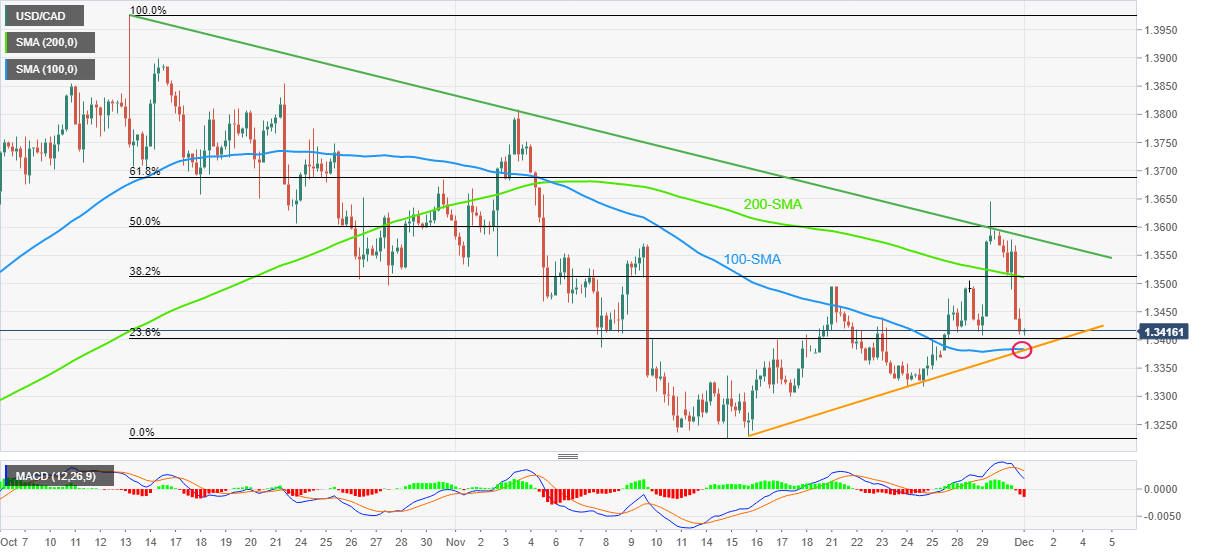
Trend: Limited downside expected
| Pare | Closed | Change, % |
|---|---|---|
| AUDUSD | 0.67863 | 1.51 |
| EURJPY | 143.694 | 0.31 |
| EURUSD | 1.04051 | 0.77 |
| GBPJPY | 166.513 | 0.5 |
| GBPUSD | 1.20581 | 0.87 |
| NZDUSD | 0.62966 | 1.6 |
| USDCAD | 1.34324 | -1.06 |
| USDCHF | 0.94538 | -0.52 |
| USDJPY | 138.096 | -0.35 |
- Oil prices juggle around $80.50 as investors await Caixin Manufacturing PMI and OPEC+ meet for fresh cues.
- The oil cartel is expected to extend production cuts to offset the broader decline in oil prices.
- A third consecutive drawdown in US EIA’s oil inventories has strengthened black gold.
West Texas Intermediate (WTI), futures on NYMEX, have turned sideways around $80.50 in the early Asian session after dropping from a fresh weekly high at $81.37. The oil prices are displaying back-and-forth moves as investors are awaiting the release of the Caixin Manufacturing PMI data and the outcome of the OPEC+ meeting, scheduled for December 4.
The black gold witnessed a significant jump on Wednesday after the United States Energy Information Administration (EIA) reported a sheer plunge in oil inventories for the week ending November 25. The EIA showed a decline in oil stockpiles by 12.58 million barrels. This is the third consecutive decline in oil stockpiles shown by the official oil inventory report.
Apart from that, expectations of a less-hawkish commentary from the Federal Reserve (Fed) chair Jerome Powell on interest rate guidance also supported the oil price rally. The oil demand is expected to gain strength as a slower rate hike pace by the Fed won’t dent the oil requirements to a greater extent.
On the supply side, headlines from Russia that the nation won’t provide oil under price cap in any case, cited by the country’s Deputy Prime Minister Alexander Novak, have bolstered the case of supply worries. Adding to that, growing fears of extension in supply cuts by OPEC+ in its meeting beyond the continuation of the two million barrels supply cut per day announced earlier is fueling an adrenaline rush into the oil bulls. A sheer supply cut from OPEC+ and Russia would make the oil market vulnerable.
Going forward, investors will keep an eye on Caixin Manufacturing PMI data. China’s official manufacturing PMI is seen lower at 48.9 vs. the prior release of 49.2. It is worth noting that China is the leading importer of oil and a slowdown in manufacturing activities in China could have a significant impact on oil prices.
- USD/JPY refreshes multi-day low amid broad-based US Dollar weakness, downbeat Treasury bond yields.
- Fed Chair Powell affirmed slower rate hikes and drowned the Greenback and bond yields.
- Softer US data added strength to the risk-on mood and weighed on the Yen pair.
- Risk catalysts, comments from BOJ’s Kuroda can entertain traders ahead of Fed’s preferred inflation gauge.
USD/JPY bears cheer US Dollar weakness to print the lowest level in more than three months around 137.30 as Tokyo opens on Thursday. The Yen pair’s latest weakness could also be linked to the downbeat US Treasury bond yields, as well as the risk-on mood in the market.
Fed Chair Jerome Powell marked his first public appearance after November’s Federal Open Market Committee (FOMC) meeting while speaking at the Brookings Institute on the economic outlook, inflation and employment. The policymaker stated that it makes sense to moderate the pace of interest rate increases while also suggesting that the time to slow the pace of rate hikes could come as soon as the next meeting in December. On the same line was a member of the Fed Board of Governors Lisa D. Cook who praised the inflation data to signal that the Fed would likely take smaller steps as it moves forward.
Following Powell’s speech, the market’s wagers favoring a 50 basis points (bps) rate hike from the Federal Reserve in December increased from 69.9% ahead of the speech to above 75%, which in turn drowned the US Dollar and the Treasury yields while fueling the equities.
As a result, the US Dollar Index (DXY) snapped a three-day uptrend while portraying the biggest daily loss in a week on Wednesday, not to forget mentioning the biggest monthly fall in 12 years. It’s worth noting that the Wall Street benchmarks cheered the dovish remarks from Fed Chair while the United States 10-year Treasury bond yields reversed the early gains to end November on a negative footing around 3.61%.
Other than Fedspeak, the downbeat US data and optimism surrounding China’s Covid conditions also weighed on the USD/JPY prices. Among them, US ADP Employment Change gained major attention as it marked the lowest readings since January 2021 with a 127K figure for November versus the 200K forecast and 239K previous readings. Further, China reported just around 38,000 daily Coronavirus cases on Tuesday, conveyed on Wednesday, marking the second consecutive day of receding virus numbers after refreshing the record high. Not only the easy cases but the gradual reliefs in the virus-led activity controls in major cities like Zhengzhou, Guangzhou and Chongqing, also seemed to have favored the Yen pair sellers.
Moving on, the Fed’s preferred inflation gauge, namely US Core Personal Consumption Expenditure (PCE) Price Index for October, expected 5.0% YoY in October versus 5.1% prior, will be crucial for immediate USD/JPY moves. Also important will be the monthly prints of the US ISM Manufacturing PMI for November, expected 49.8 versus 50.2 prior. It should be noted that the latest chatters over the likely policy tightening by the Bank of Japan (BOJ) in 2023 highlight today’s speech from BOJ Governor Haruhiko Kuroda.
Technical analysis
Repeated failures to cross a three-week-old resistance line, currently around 138.45, direct USD/JPY bears towards a downward-sloping support line from late September, near 136.75.


© 2000-2026. All rights reserved.
This site is managed by Teletrade D.J. LLC 2351 LLC 2022 (Euro House, Richmond Hill Road, Kingstown, VC0100, St. Vincent and the Grenadines).
The information on this website is for informational purposes only and does not constitute any investment advice.
The company does not serve or provide services to customers who are residents of the US, Canada, Iran, The Democratic People's Republic of Korea, Yemen and FATF blacklisted countries.
Making transactions on financial markets with marginal financial instruments opens up wide possibilities and allows investors who are willing to take risks to earn high profits, carrying a potentially high risk of losses at the same time. Therefore you should responsibly approach the issue of choosing the appropriate investment strategy, taking the available resources into account, before starting trading.
Use of the information: full or partial use of materials from this website must always be referenced to TeleTrade as the source of information. Use of the materials on the Internet must be accompanied by a hyperlink to teletrade.org. Automatic import of materials and information from this website is prohibited.
Please contact our PR department if you have any questions or need assistance at pr@teletrade.global.
transfers