- Analytics
- News and Tools
- Market News
CFD Markets News and Forecasts — 06-12-2022
- EUR/JPY is oscillating below 143.40 ahead of ECB Lagarde’s speech.
- ECB policymakers believe that current interest rates are near to neutral rate.
- The BOJ may look for more easing to accelerate the economy’s growth in times of lower inflation.
The EUR/JPY pair is displaying a lackluster performance in early Asia as investors are awaiting the speech from European Central Bank (ECB) President Christine Lagarde for fresh impetus. The cross is hovering around the critical hurdle of 143.40 and is likely to remain sideways amid the unavailability of a fresh trigger.
The speech from ECB President is going to provide fresh cues about the likely monetary policy action. Meanwhile, ECB policymakers delivered similar responses on interest rate guidance on Tuesday. ECB Chief Economist Phillip Lane is dubious about the inflation peak as it has been achieved or is still to come next year. He further added that he expects more rate hikes ahead but "a lot has been done already".
While, Constantinos Herodotou, Governor of the Central Bank of Cyprus said that “There will be another hike in rates, but we are very near neutral rate.”
On the Japanese yen front, Bank of Japan (BOJ) Governor Haruhiko Kuroda is not ready to call for a termination of policy easing till wag inflation reaches around 3% to push inflation sustainably to the 2% target, as reported by Reuters. The BOJ is bound to keep flushing liquidity into the economy until the economy gets strengthened as desired.
For further guidance, the release of Japan’s Gross Domestic Product (GDP) data will provide significant cues. As per the projections, Japan’s GDP is expected to contract by 1.1% against the prior contraction of 1.2%. While the quarterly data is likely to contract by 0.3%, similar to the prior release. A contraction in Japan’s GDP in times when the economy is struggling to push inflation higher may force more policy easing measures by the BOJ.
Australian GDP overview
Reserve Bank of Australia’s (RBA) readiness for further increases in interest rates and expectations of solid economic recovery highlights Australia’s third-quarter (Q3) Gross Domestic Product (GDP) figures, up for publishing at 00:30 GMT on Wednesday, for the AUD/USD pair traders.
The recent data from Australia portray a mixed picture as downbeat housing market data and labor participation rate contrasts with upbeat export growth and consumer spending. Even with these statistics in mind, the Aussie Q3 GDP is likely to print slightly better figures.
That said, forecasts suggest the annualized pace of economic growth to come in at 6.3%, above the previous period's 3.6%, while the quarter-on-quarter (QoQ) numbers could mark the 0.7% growth figures versus 0.9% prior.
Ahead of the outcome, Westpac said,
The economic rebound should continue at a robust pace, supported by the reopening from COVID-19 and tailwinds from earlier policy stimulus. Hence, consumer spending and business investment should grow solidly in the quarter, though housing is expected to be flat on lower renovation work. After the various partial surveys released this week, Westpac’s forecast remains 0.8%qtr, 6.4%yr, with the median forecast on Bloomberg 0.7% quarterly.
How could it affect the AUD/USD?
AUD/USD remains pressured around the 0.6700 round figure, making rounds to the 100-DMA support, as a lack of major data/events joins the pre-GDP anxiety to challenge the pair traders.
That said, Australia’s Q3 GDP is likely to carry less importance for the pair traders, considering the present focus on the risk-aversion and hawkish Fed bets. Also likely to dilute the importance of the data is the latest Reserve Bank of Australia (RBA) monetary policy meeting that stated household spending is expected to slow over the period ahead while also confirming that the Australian economy is continuing to grow solidly.
Hence, positive data from Australia might offer a knee-jerk rebound in the AUD/USD prices but not affect the overall bearish trend. On the contrary, downbeat figures won’t hesitate to please bears with a fresh multi-month low.
Technically, failure to cross the 61.8% Fibonacci retracement level of the June-October downside, near 0.6855, joins bearish MACD signals and steady RSI to favor AUD/USD bears. However, a clear break of the 100-DMA support near 0.6690 becomes necessary for the sellers to aim for a late November swing low near 0.6585.
Key notes
AUD/USD floats above 100-DMA support ahead of Australia GDP
AUD/USD Forecast: Bears gearing up for a test of 0.6500
About the Aussie GDP release
The Gross Domestic Product released by the Australian Bureau of Statistics is a measure of the total value of all goods and services produced by Australia. The GDP is considered a broad measure of economic activity and health. A rising trend has a positive effect on the AUD, while a falling trend is seen as negative (or bearish) for the AUD.
The media is reporting that Chinese authorities are considering downgrading Covid-19. This could be a positive for risk appetite for the day ahead in markets that have otherwise been on the back foot.
Global stocks posted a third straight day of losses on Tuesday as investors fret over how long the Federal Reserve will maintain interest rates as so restrictive to the US economy.
However, China downgrading Covid-19 from the top class of infectious diseases would allow it to be managed more flexibly in a move that would relieve local governments of the legal obligations to introduce strong controls such as lockdowns, freeing up the economy once again. It would likely be welcomed news amongst an otherwise pessimistic outlook on the global economy and looming recessions. MSCI's all-country world index, a gauge of stock performance in 47 countries, dropped 1.26% to mark its third down day in a row after hitting a three-month high last week.
''While China’s emergence from almost three years of pandemic isolation is paved with uncertainty, technical charts signal Chinese stocks may enjoy some smooth gains as the economy reopens,'' Bloomberg wrote.
''The incremental easing of Covid restrictions in cities from Beijing to Hangzhou has brightened the outlook for Chinese stocks, and both onshore and offshore gauges may rise toward levels reached earlier this year when optimism over an end to lockdowns and an economic recovery drove gains.''
- WTI crude oil prices dribble around weekly low after three-day downtrend.
- U-turn from 21-DMA, bearish MACD signals favor sellers.
- 10-week-old descending trend line lures bears, monthly resistance line adds to the upside filters.
WTI crude oil bears await more clues as they pause around $74.80, the lowest level in a week, during Wednesday’s sluggish Asian session. In doing so, the commodity price pauses the three-day downtrend.
That said, the black gold’s sustained U-turn from the 21-DMA and bearish MACD signals keep the sellers hopeful. However, a downward-sloping trend line from late September, around $73.20 appears a tough nut to crack for the bears. Adding strength to the $73.20 support is the nearly oversold RSI line, placed at 14.
It should be noted that the previous monthly low and Tuesday’s bottom, respectively around $73.65 and $73.55, may act as immediate supports for the energy benchmark.
In a case where the quote drops below $73.20, the $73.00 round figure might act as an intermediate halt before dragging the $70.00 psychological magnet and then to the late December 2021 low near $66.15.
Alternatively, the $80.00 threshold could restrict the WTI’s recovery moves ahead of the 21-DMA hurdle surrounding $80.70.
Following that, a downward-sloping trend line from early November, near $81.70, acts as an extra filter to the north.
Overall, WTI crude oil remains on the bear’s radar but the downside room appears limited.
WTI: Daily chart
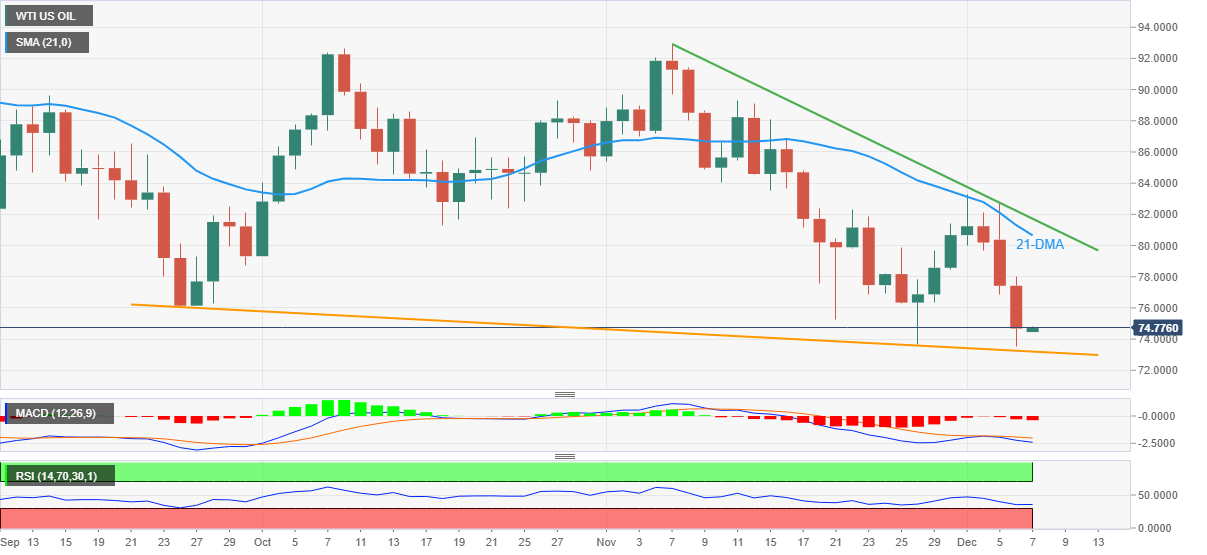
Trend: Limited downside expected
- USD/CAD is making moves to the upside, but bears are lurking.
- Bulls eye a longer-term target beyond 1.4000.
We have seen USD/CAD break out of a symmetrical triangle on the daily chart and the focus is on the upside while the price continues to ride weekly trendline support.,
A correction at this juncture into prior highs near 1.3580, could act as support offering a discount to the bulls seeking a run on liquidity towards 1.3800/25 stops in a continuation of the short squeeze.
USD/CAD weekly charts
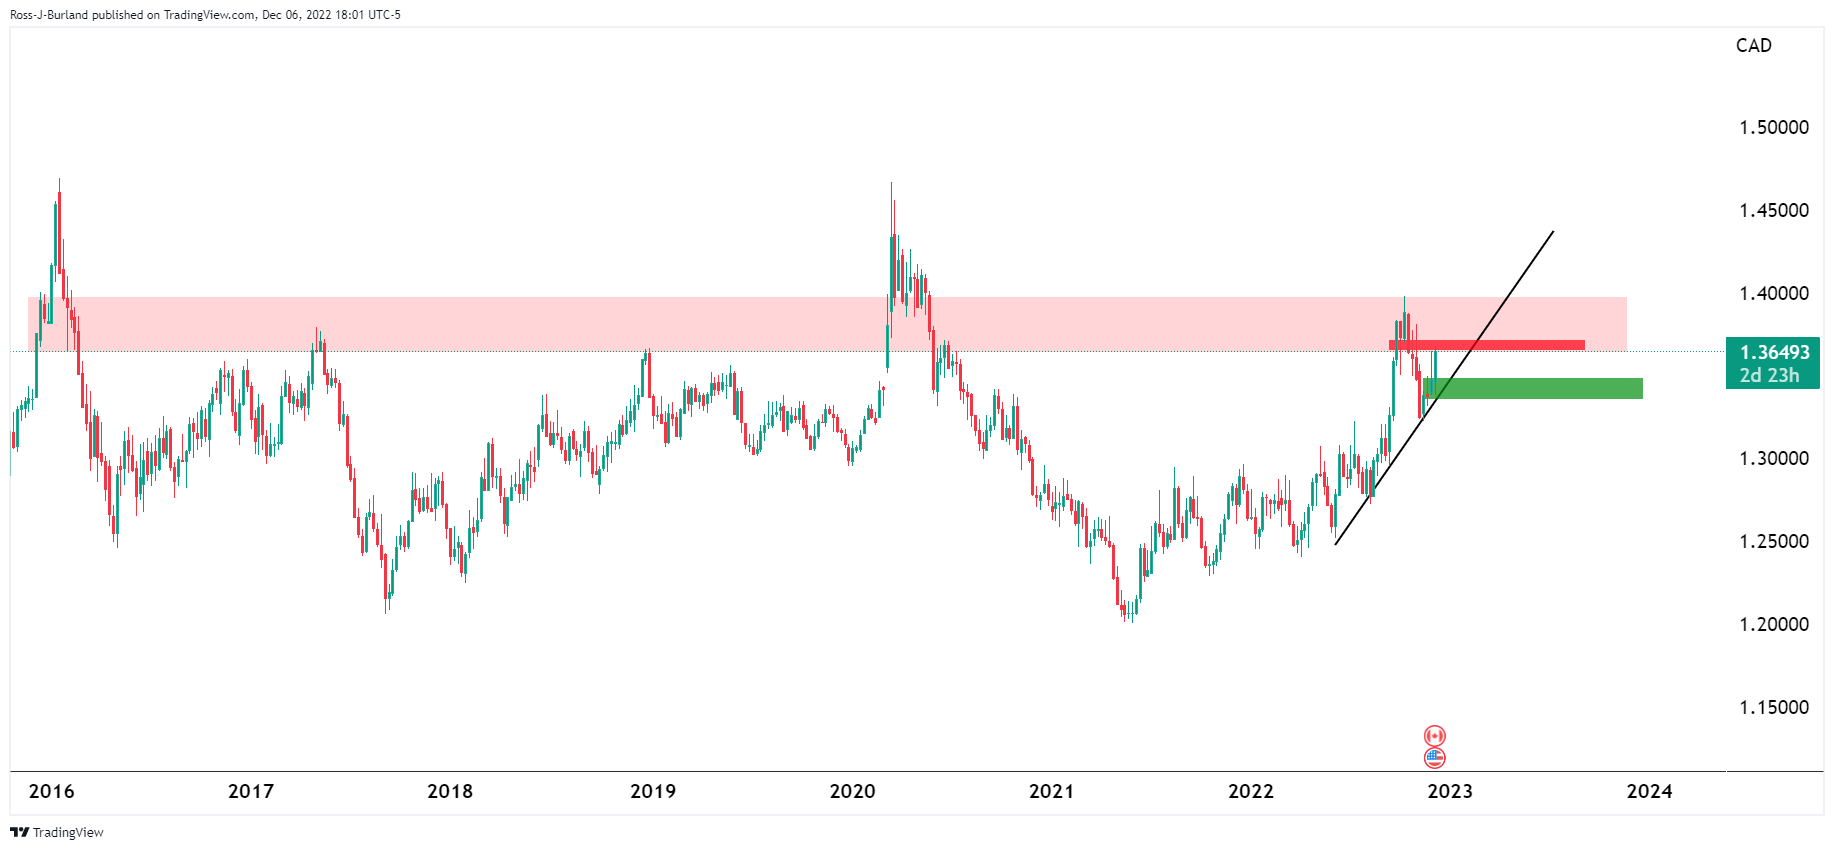
USD/CAD is in an uptrend with eyes on a break of 1.4000. However, there is a long way to go until the bulls are out of the woods as the following charts will illustrate:
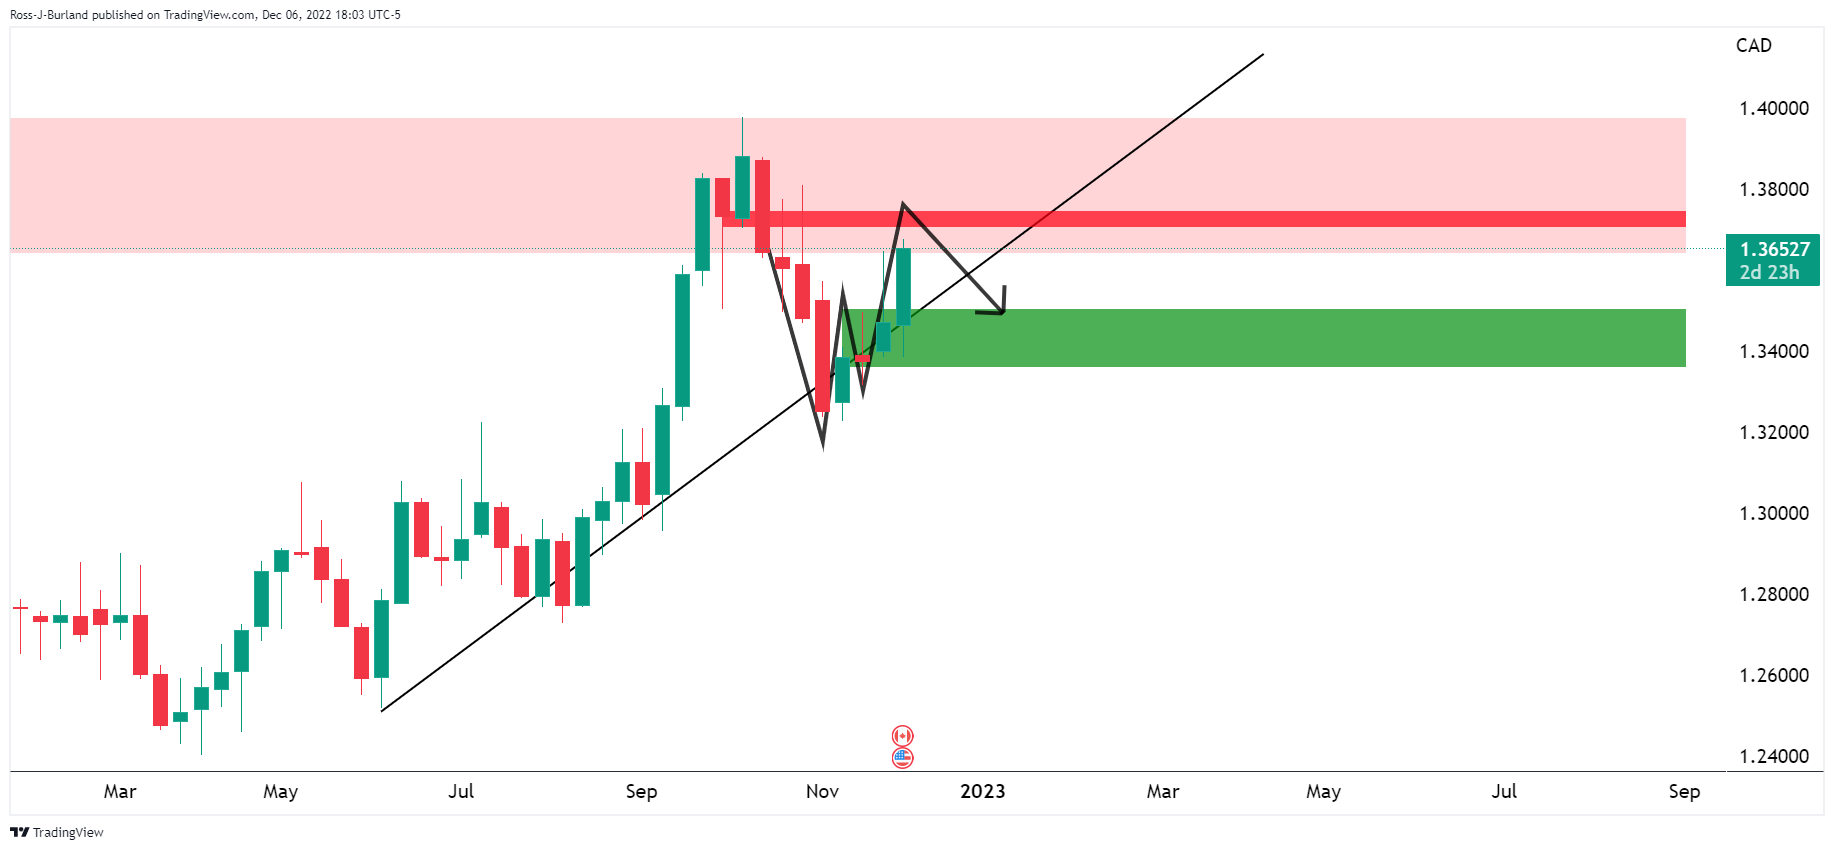
There are conflicting patterns on the weekly chart, as we zoom in.
We have a W formation, on the chart above, and an M pattern on the chart below.
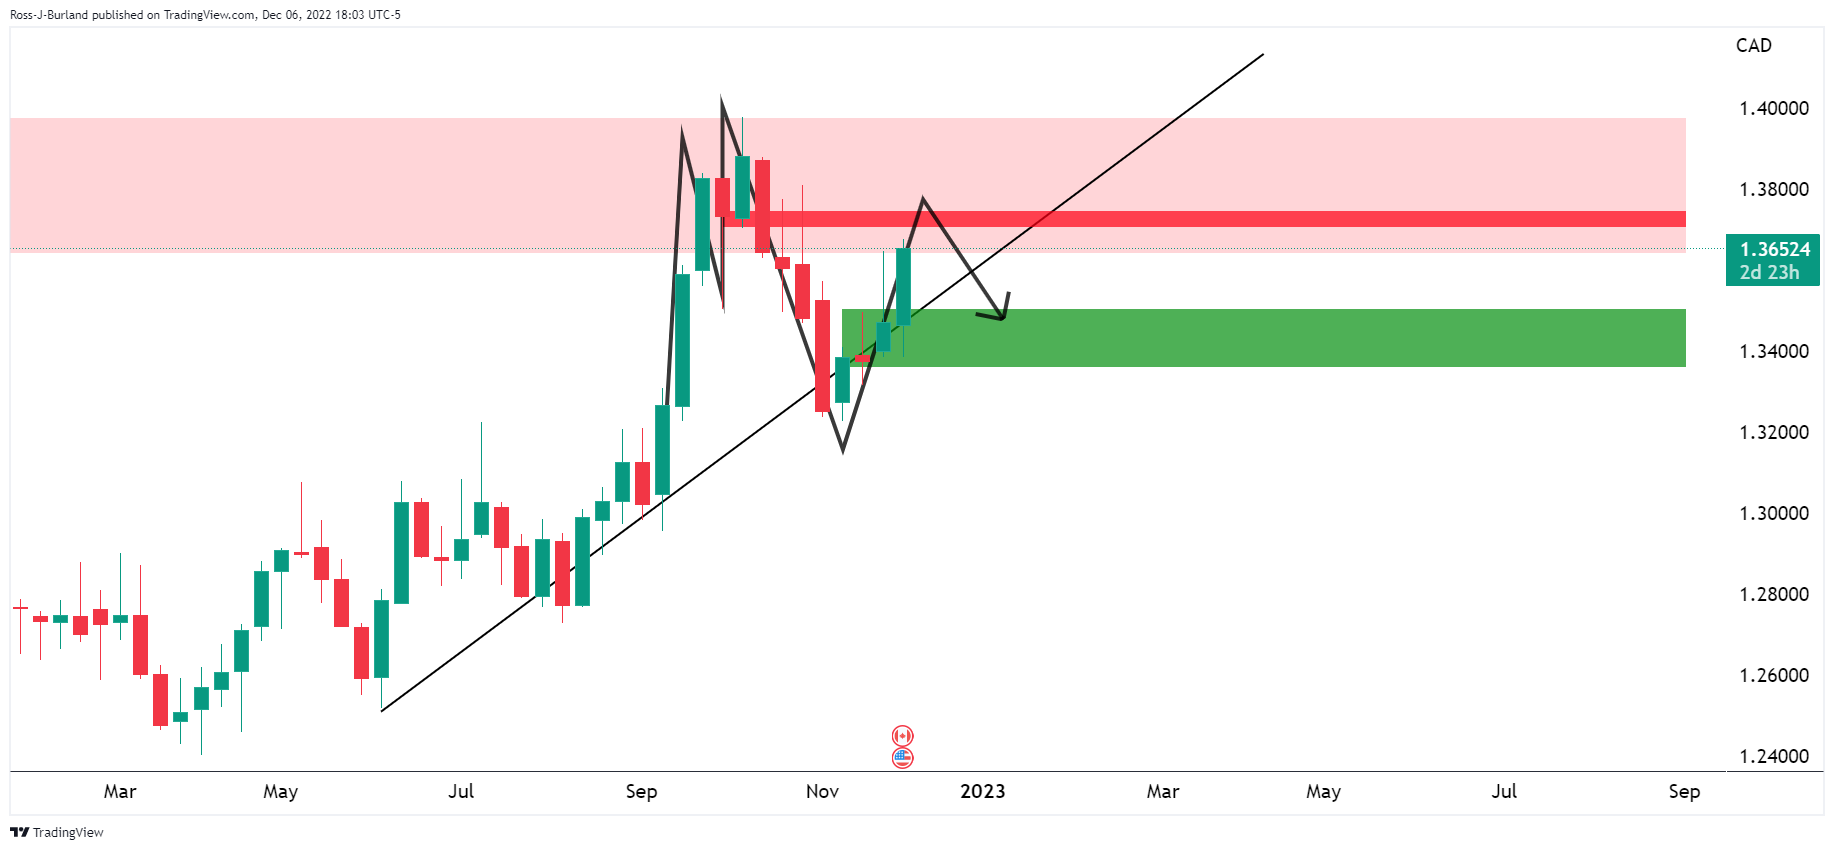
Given the price has rallied towards the neckline of the M-formation, the path of least resistance could now be to the downside for the near term.
USD/CAD daily chart
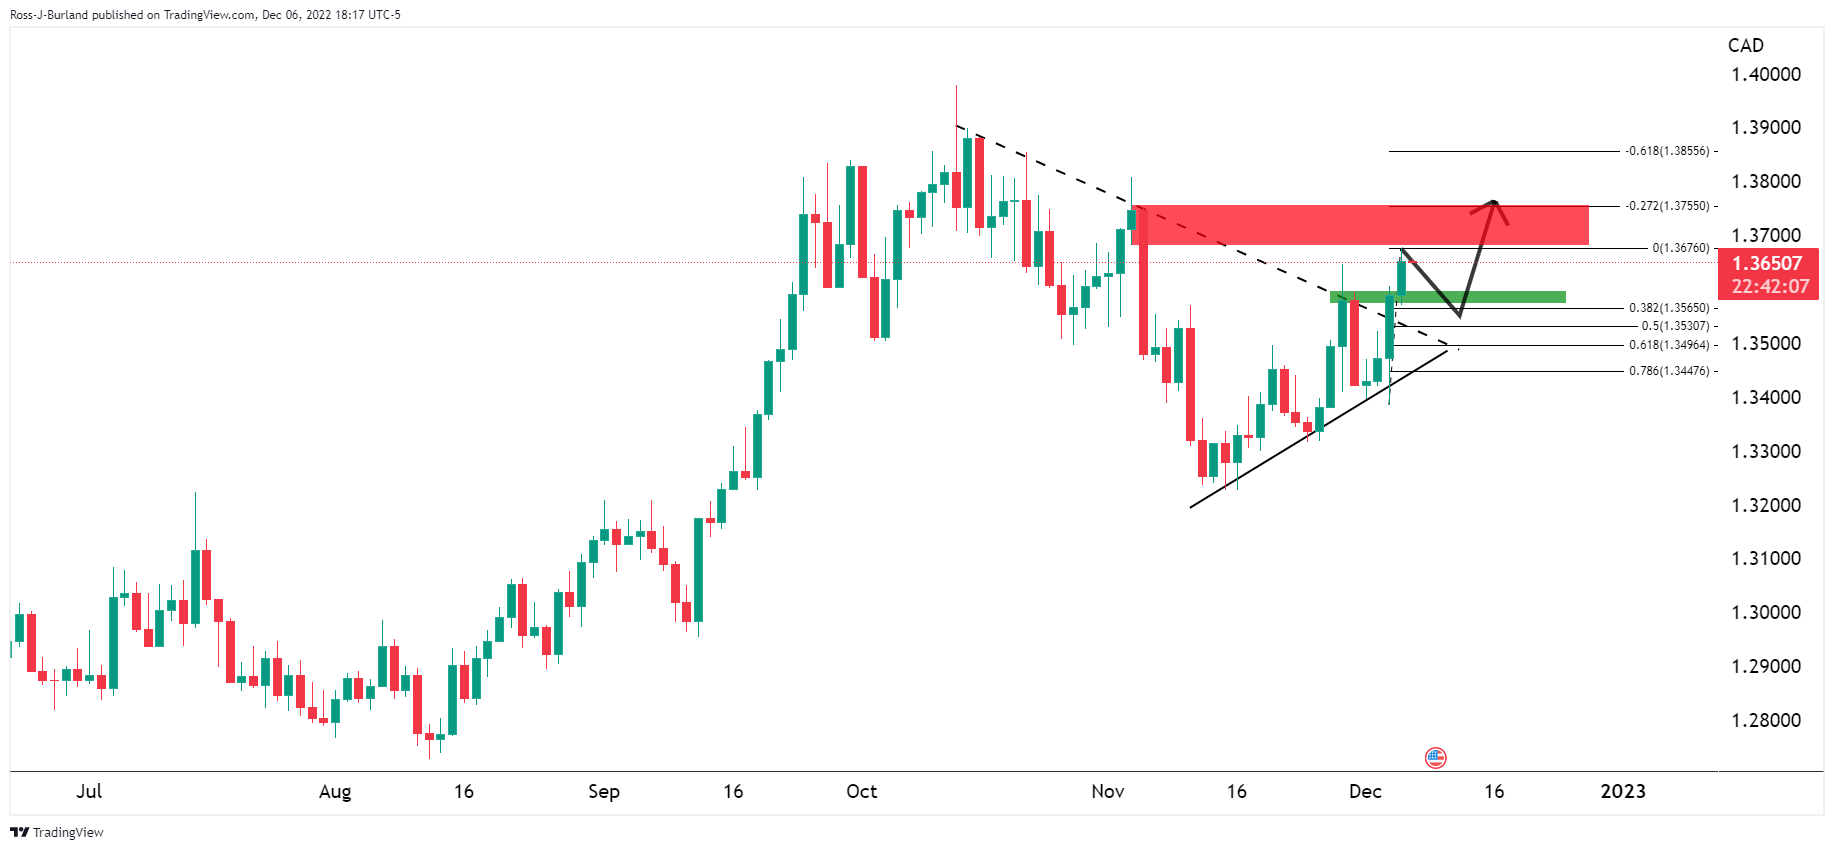
We have seen USD/CAD break out of the triangle meeting the 1.3650s. A correction at this juncture into prior highs near 1.3580, could act as support offering a discount to the bulls seeking a run on liquidity towards 1.3800/25 stops in a continuation of the short squeeze.
- Doji, in the USD/JPY daily chart, would it mean consolidation around 136.00-137.00?
- USD/JPY Price Analysis: Positive divergence would exacerbate a rally, but a doji clouds the USD rally.
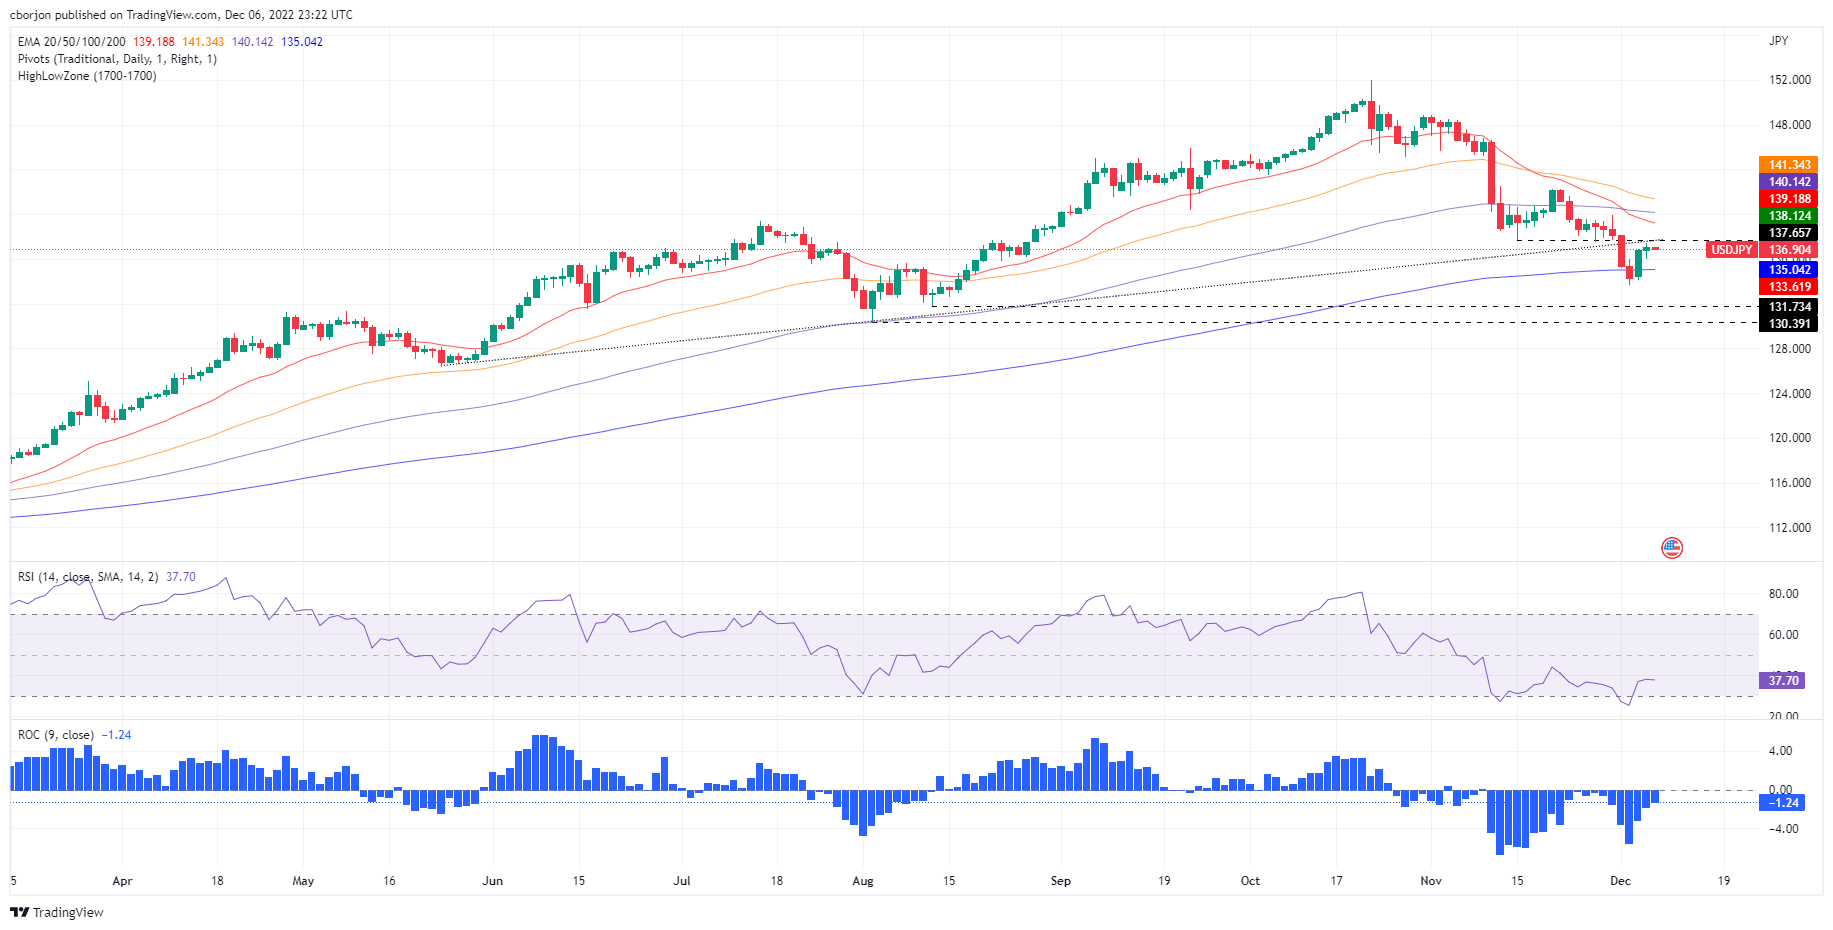
The USD/JPY struck a seven-month-old upslope previous support trendline turned resistance around 137.60, retraced towards its Tuesday daily close at 137.02 for a minuscule 0.02% gain. As the Asian Pacific session begins, the USD/JPY is trading at 136.90, below its opening price by 0.09%.
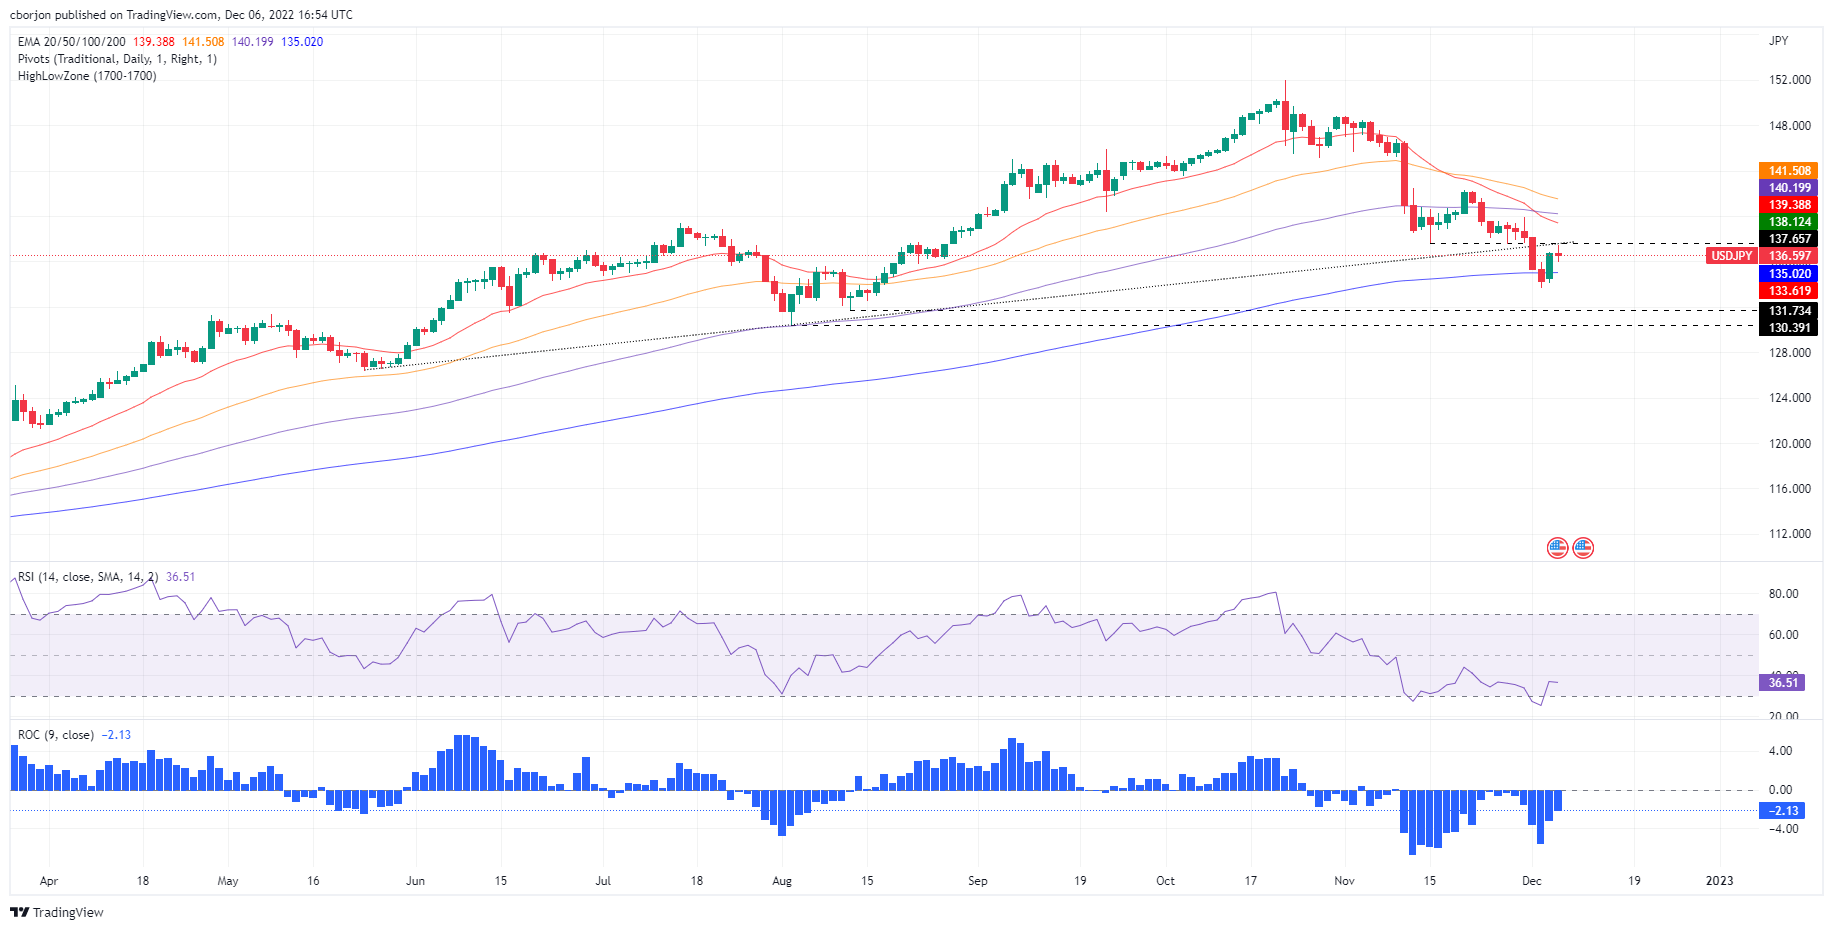
USD/JPY Price Analysis: Technical outlook
The USD/JPY is neutral-to-upward biased, though a doji emerging in the daily chart suggests the uptrend might halt, or perhaps the USD/JPY might consolidate, around the 136.00-137.00 area. Since mid-November, the USD/JPY registered successive series of lower lows, while the Relative Strength Index (RSI) did the opposite, suggesting that a positive divergence emerged. Furthermore, the Rate of Change (RoC) edges toward zero, implying that selling pressure is fading.
If the USD/JPY clears the weekly high above 137.42, that will invalidate the doji mentioned above and exacerbate a rally toward the 20-day Exponential Moving Average (EMA) at 139.18. Once that resistance level is breached, the next resistance would be the 100-day EMA at 140.14
On the flip side, the USD/JPY first support would be the December 6 daily low of 135.96. A breach of the latter will expose the 200-day EMA at 135.04, followed by the December 2 swing low at 133.61.
- Solid risk aversion theme is propelling the US Dollar for more upside.
- The kiwi asset has not challenged the 200-EMA around 0.6300 yet.
- A slippage inside the bearish range of 20.00-40.00 by the RSI (14) will trigger a bearish momentum.
The NZD/USD pair is struggling to climb above the immediate hurdle of 0.6320 in the early Tokyo session. The kiwi asset is facing immense pressure from the risk aversion theme. Meanwhile, investors are parking their funds in the US Dollar to dodge volatility in the global markets.
The US Dollar Index (DXY) is aiming to extend its gains above the immediate hurdle of 105.60. Meanwhile, the 10-year US Treasury yields have dropped to near 3.53% after a decent recovery.
On an hourly scale, the kiwi asset is displaying back-and-forth moves in a range of 0.6300-0.6350 after dropping from the critical hurdle above 0.6450. The major has yet not surrendered the 200-period Exponential Moving Average (EMA) marginally below 0.6300, which indicates that the long-term trend is still intact but with caution. Meanwhile, the 20-EMA at 0.6326 is acting as a major barricade for the asset.
The Relative Strength Index (RSI) (14) is hovering around 40.00. A slippage inside the bearish range of 20.00-40.00 will trigger a bearish momentum.
Going forward, a downside move below the round-level cushion of 0.6300 will explode volatility contraction and will drag the kiwi asset toward November 29 high around 0.6250, followed by November 29 low below 0.6200.
On the contrary, a breakout of the consolidation by overstepping Monday’s high at 0.6350 will drive the major towards the round-level resistance at 0.6400. A breach of the latter will expose the major to retest the previous week’s high at 0.6477.
NZD/USD hourly chart
-638059650286277502.png)
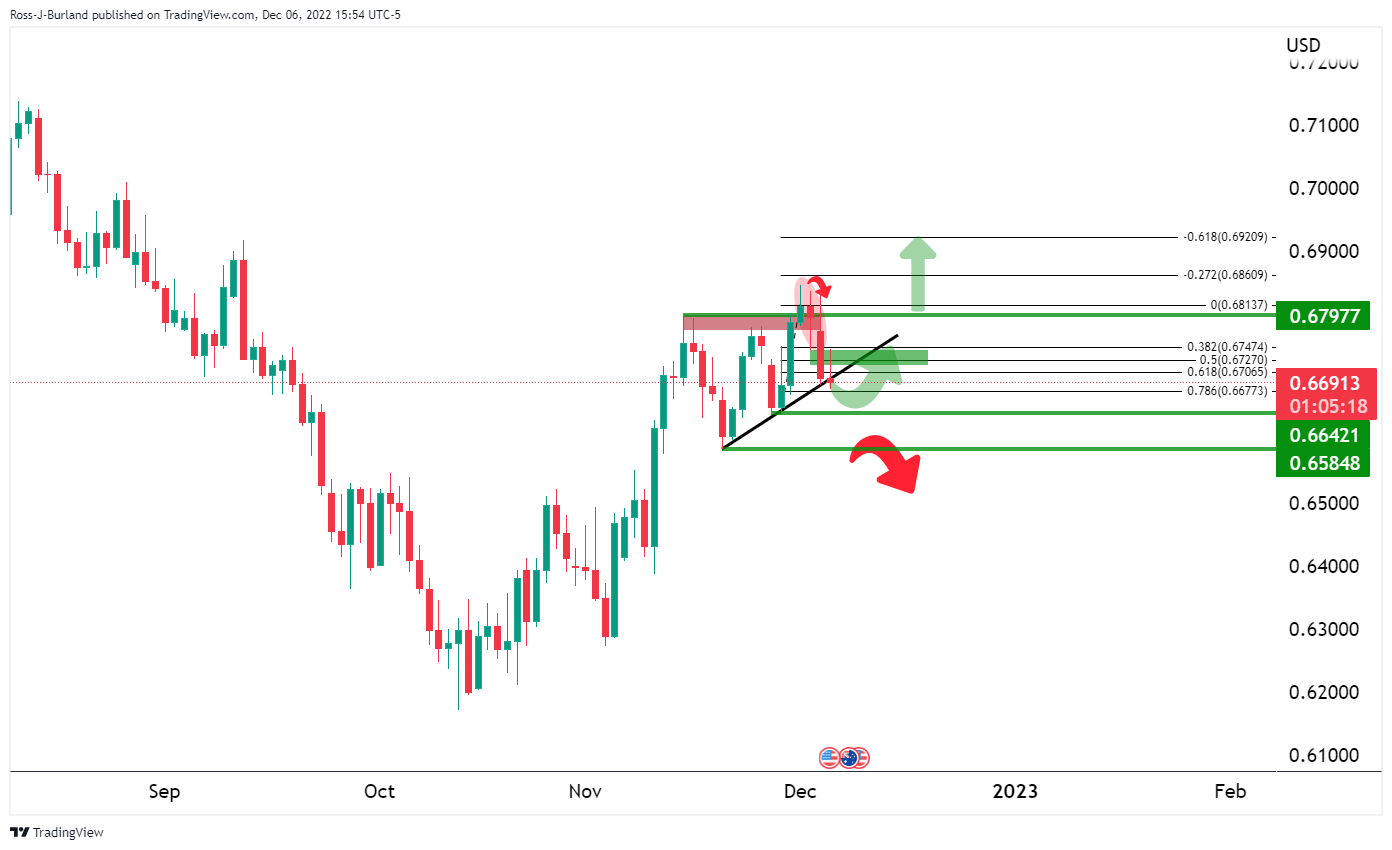
- AUD/USD pokes 100-DMA after failing to defend RBA-led gains.
- Risk-aversion wave, pre-data anxiety weighs on prices amid a quiet session.
- Australia’s Q3 GDP is likely to deteriorate on QoQ and improve on YoY basis.
- China trade numbers for October, risk catalysts are also important for clear directions.
AUD/USD remains pressured around 0.6690, after reversing the Reserve Bank of Australia-led (RBA) gains as traders await the Aussie Gross Domestic Product (GDP) data on early Wednesday. That said, the market’s indecision amid a light calendar and mixed clues also challenge the pair traders.
The warnings of grim economic conditions from multiple US banks and downbeat earnings weighed on the market sentiment during late Tuesday. Among them were the United States Heads of Goldman Sachs, Bank of America Corp and JPMorgan Chase. Additionally, Bloomberg Economics also forecasted the lowest economic growth since 1993, to 2.4% for 2023.
However, downbeat prints of the US trade numbers and the inflation expectations join the optimism surrounding China to challenge the AUD/USD bears.
That said, US Goods and Services Trade Balance deteriorated to $-78.2 billion versus $-79.1 billion expected and $-73.28 billion prior. Further, US inflation expectations, as per the 10-year and 5-year breakeven inflation rates per the St. Louis Federal Reserve (FRED) data, extend the previous retreat from a one-month high by printing the second day of downside. The latest prints of the 5-year and 10-year inflation expectations are 2.38% and 2.43% respectively.
It should be noted that China, Australia’s biggest customer, is up for conveying more easing to its three-year-old Zero-Covid policy on Wednesday, per Reuters. Beijing’s latest move could be linked to the receding virus infections from the record high, as well as multiple announcements suggesting more unlocking of the virus-hit economy that’s the second biggest in the world.
Additionally, the RBA’s hawkish hike of 0.25%, with hints of more rate increases, allowed the AUD/USD to remain firmer during early Tuesday. However, the details of the RBA Rate Statement raise concerns over the Aussie economic growth, which in turn highlights today’s Australian GDP for the third quarter (Q3), expected 0.7% QoQ versus 0.9% prior, as well as 6.3% YoY versus 3.6% previous readouts. Following the Australian GDP outcome, China’s trade numbers for November will also entertain the AUD/USD pair traders.
Technical analysis
Failure to cross the 61.8% Fibonacci retracement level of the June-October downside, near 0.6855, joins bearish MACD signals and steady RSI to favor AUD/USD bears. However, a clear break of the 100-DMA support near 0.6690 becomes necessary for the sellers to aim for a late November swing low near 0.6585.
Gold price remains pressured amid inactive markets, recent sour sentiment underpins US Dollar.
Headlines surrounding global economic growth, Russia portray contrast with China’s Covid-linked optimism.
Mixed concerns surrounding Federal Reserve’s next move also weigh on the XAU/USD prices.
Equities drop, United States Treasury bond yields remain sluggish to challenge Gold price moves amid a light calendar.
Gold price (XAU/USD) remains pressured around $1,770, struggling with short-term key support during the early Asian session on Wednesday. The metal’s latest weakness could be linked to the market’s sour sentiment that underpinned the US Dollar’s rebound, as well as the Covid-linked optimism in China. It’s worth noting, however, that a light calendar and mixed updates surrounding the US Federal Reserve (Fed) seemed to have challenged the XAU/USD moves.
Risk-off mood weighs on the Gold price
Following an upbeat start to Tuesday’s trading, Gold price witnessed downside pressure as risk appetite soured after multiple warnings of grim economic conditions from multiple US banks and downbeat earnings. Among them were the United States Heads of Goldman Sachs, Bank of America Corp and JPMorgan Chase. Additionally, Bloomberg Economics also forecasted the lowest economic growth since 1993, to 2.4% for 2023.
It’s worth noting that escalating tension between European Union (EU) and Russia, as well as between Kyiv and Moscow, also exerts downside pressure on the Gold price by favoring the rush to risk safety. That said, the Oil price cap and Ukraine’s drone attack in Russia are the key catalysts fueling the risk-aversion of late.
Concerns over Federal Reserve keep XAU/USD bears hopeful
Officials from the Federal Reserve (Fed) are on the pre-Federal Open Market Committee (FOMC) blackout and hence the Fed talks are absent. However, the last dossier from the policymakers wasn’t confirming the previous bearish bias due to the strong United States employment report for November.
That said, the US Nonfarm Payrolls (NFP) surprised markets by rising to 263K versus 200K expected and an upwardly revised prior of 284K while the Unemployment Rate matched market forecasts and prior readings of 3.7% for November. Following the upbeat data, Chicago Fed President Charles Evans said, "We are probably going to have a slightly higher peak to Fed policy rate even as we slow pace of rate hikes.”
Following that, Monday’s strong prints of the United States ISM Services PMI also bolstered the hawkish hopes of the Fed. That said, the private services gauge rose to 56.5 in November versus 53.1 market forecast and 54.4 previous readings whereas the Factory Orders also registered 1.0% growth compared to 0.7% expected and 0.3% prior. Further, S&P Global Composite PMI improved to 46.4 versus 46.3 initial estimations.
On Tuesday, US Goods and Services Trade Balance deteriorated to $-78.2 billion versus $-79.1 billion expected and $-73.28 billion prior.
It should, however, be noted that the recent downside in the US inflation expectations challenges the hawkish concerns surrounding the Federal Reserve’s (Fed) next move and hence challenge the Gold sellers. US inflation expectations, as per the 10-year and 5-year breakeven inflation rates per the St. Louis Federal Reserve (FRED) data, extend the previous retreat from a one-month high by printing the second day of downside. The latest prints of the 5-year and 10-year inflation expectations are 2.38% and 2.43% respectively.
China defends Gold buyers
Being one of the biggest Gold consumers an increase in optimism surrounding China challenges the Gold sellers. That said, the dragon nation is up for conveying more easing to its three-year-old Zero-Covid policy on Wednesday, per Reuters. Beijing’s latest move could be linked to the receding virus infections from the record high, as well as multiple announcements suggesting more unlocking of the virus-hit economy that’s the second biggest in the world.
To sum up, Gold price struggles for clear directions amid mixed clues but remains on the bear’s radar as sentiment sours.
Gold price technical analysis
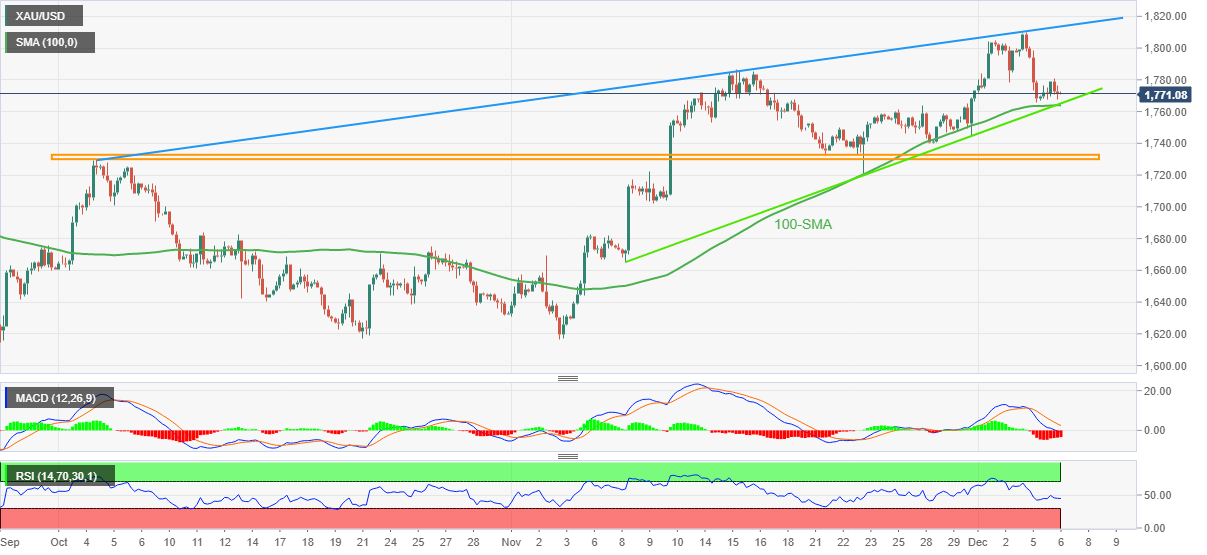
Having failed to cross a two-month-old ascending resistance line, the Gold price dropped to the 100-bar Simple Moving Average (SMA).
However, a failure to stay much beyond the key SMA level joins the bearish signals from the Moving Average Convergence and Divergence (MACD) indicator and the normal conditions of the Relative Strength Index (RSI) line, placed at 14, to suggest a further extension of the downbeat moves.
That said, a convergence of the 100-SMA and upward-sloping support line from November 08 highlights $1,765 as the short-term key support to watch for the Gold price traders.
In a case where the XAU/USD bears manage to smash the said support confluence near $1,765, a horizontal area comprising multiple levels marked since October 04, close to $1,730, should gain major attention.
Meanwhile, Gold price recovery could aim for the $1,780 and the mid-November swing high surrounding $1,786 before targeting the $1,800 threshold.
Following that, the monthly high near $1,810 and the previously mentioned multi-day-old resistance line around $1,813 might challenge the XAU/USD bulls.
Overall, the Gold price remains pressured around the short-term key support with a preferred move on the downside.
Gold price: Four-hour chart
Trend: Further weakness expected
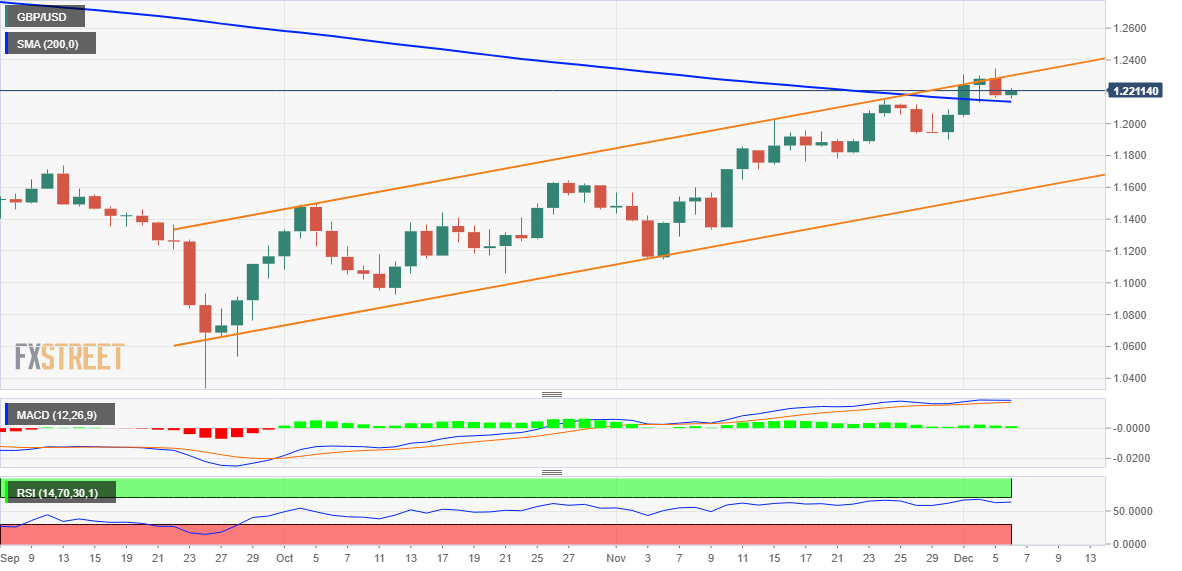
- GBP/USD is expected to decline to near 1.2100 as the Fed is set to escalate the interest rate peak target.
- United States wage inflation has triggered the risk of higher consumer spending ahead.
- United Kingdom’s food supply crisis has escalated led by skyrocketing costs and labor shortages.
The GBP/USD pair has shifted its business below the crucial support of 1.2150 in the early Asian session. The Cable is declining towards the immediate cushion of 1.2100 as the risk aversion theme is gaining more traction. The major is expected to remain on tenterhooks as the US Dollar is looking to add more gains amid a significant improvement in safe-haven’s appeal.
The US Dollar Index (DXY) has climbed to near Friday’s high around 105.60 and is expected to deliver more gains as the Federal Reserve (Fed) is expected to continue severe policy tightening measures to safeguard the economy from wage inflation fears.
Meanwhile, S&P500 futures witnessed a sell-off consecutively on Tuesday as a higher interest rate peak by the Fed triggered recession fears. The US Treasury yields have failed to keep up the bullish momentum and have declined despite renewed fears of a rebound in inflation.
A tight labor market and robust demand in the US service sector are going to keep wages reported on a firmer note ahead. Higher wages to households will allow them more purchases of durable goods and robust consumer spending will keep inflation comfortably in a strong position. Fresh evidence of a rebound in inflationary pressures has forced market participants to presume a higher interest rate peak ahead.
Going forward, investors will look for five-year consumer inflation expectations for further guidance. Long-term inflation expectations are still anchored as the Fed has already accelerated its interest rates dramatically.
On the United Kingdom front, risks of a food supply crisis have escalated led by skyrocketing costs and labor shortages. Minette Batters, president of the National Farmers Union said “We need government and the wider supply chain to act now. Tomorrow could well be too late.” as reported by Financial Times.
This week, investors will focus on annual consumer inflation expectations, which will release on Friday. The forward inflation indicator is expected to remain solid as the retail demand is firmer in the UK economy. UK’s Like-For-Like Retail Sales reported by the British Retail Consortium (BRC) escalated to 4.1% from the prior release of 1.2% in November on an annual basis. Households’ robust demand indicates a higher price rise index ahead.
- The Australian Dollar appreciates against the Japanese Yen, though it drops below 92.00 after hitting a new weekly high.
- AUD/JPY Price Analysis: Would fall to 90.00 once it clears December’s low at 91.08.
The Australian Dollar (AUD) rose against the Japanese Yen (JPY), though it gave back some of its earlier gains after hitting a daily high of 92.33. The 200-day Exponential Moving Average (EMA) at 91.97 was the main reason for the AUD/JPY to retrace from three-day highs, and at the time of writing, the AUD/JPY trades at 91.63, below its opening price by 0.12%.
AUD/JPY Price Analysis: Technical outlook
From a daily chart perspective, the cross-currency pair is neutral to downward biased, as it should be remembered that a break below the 200-day EMA is used as a barometer for long-term trends. Additionally to the 200-day EMA capping the rally, the bottom-trendline of a descending channel that intersects with the 200-EMA are two technical signals that would keep the AUD/JPY downward biased. Both oscillators lack direction, with the Relative Strength Index (RSI) almost flat at bearish territory and the Rate of Change (RoC) unchanged.
If the AUD/JPY breaks below December’s 5 daily low at 91.08, that will pave the way for substantial losses. The following support would be the October 13 swing low at 90.83, followed by the August 2 daily low at 90.52. A decisive break would expose the 90.00 psychological level.
On the upside, the AUD/JPY first resistance would be the 200-day EMA at 91.97. Breach above will clear the way to the 20-day EMA at 92.88, followed by the 93.00 figure.

- EUR/USD is eyeing more weakness towards 1.0440 as investors have underpinned the risk aversion theme.
- Expectations for a higher interest rate peak have triggered recession fears in the United States economy.
- Investors are awaiting ECB Lagarde’s speech for fresh impetus.
The EUR/USD pair has turned sideways after dropping vertically to near 1.0465 in the early Tokyo session. The major currency pair has extended its losses after dropping below the critical support of 1.0480 and is expected to deliver more weakness to near 1.0440 as the risk-off impulse has escalated amid a firmer US Dollar.
The US Dollar Index (DXY) is hovering around Friday’s high at 105.60 after overstepping the critical hurdle of 105.50. The US Dollar is expected to witness more demand as investors have underpinned safe-haven assets amid the risk-aversion theme. Meanwhile, S&P500 witnessed a sell-off on Tuesday as a higher interest rate peak by the Federal Reserve (Fed) could trigger a recession in the United States.
The returns on US Treasury bonds failed to keep the upside momentum and dropped as expectations of a decline in interest rate hike pace by the Fed are extremely solid. The 10-year US Treasury yields have declined to near 3.53%.
Surprise rise in the US service sector and November’s employment report have cleared that inflation is here to stay for a while as demand has not slowed down yet. The road to 2% inflation is far from over, therefore, the Fed is bound to hike the interest rate further but with less velocity this time.
On the Eurozone front, investors are keeping an eye on the speech from European Central Bank (ECB) President Christine Lagarde, which is scheduled for Thursday. The speech from ECB President will provide cues about the likely monetary policy action in December. Meanwhile, a surprise rise in Factory Orders in Germany has indicated that demand is returning despite accelerating interest rates.
- USD/CHF consolidates around 0.9380-9450s amidst the lack of a catalyst.
- USD/CHF Price Analysis: Break above the 200-EMA could pave the way towards 0.9550.
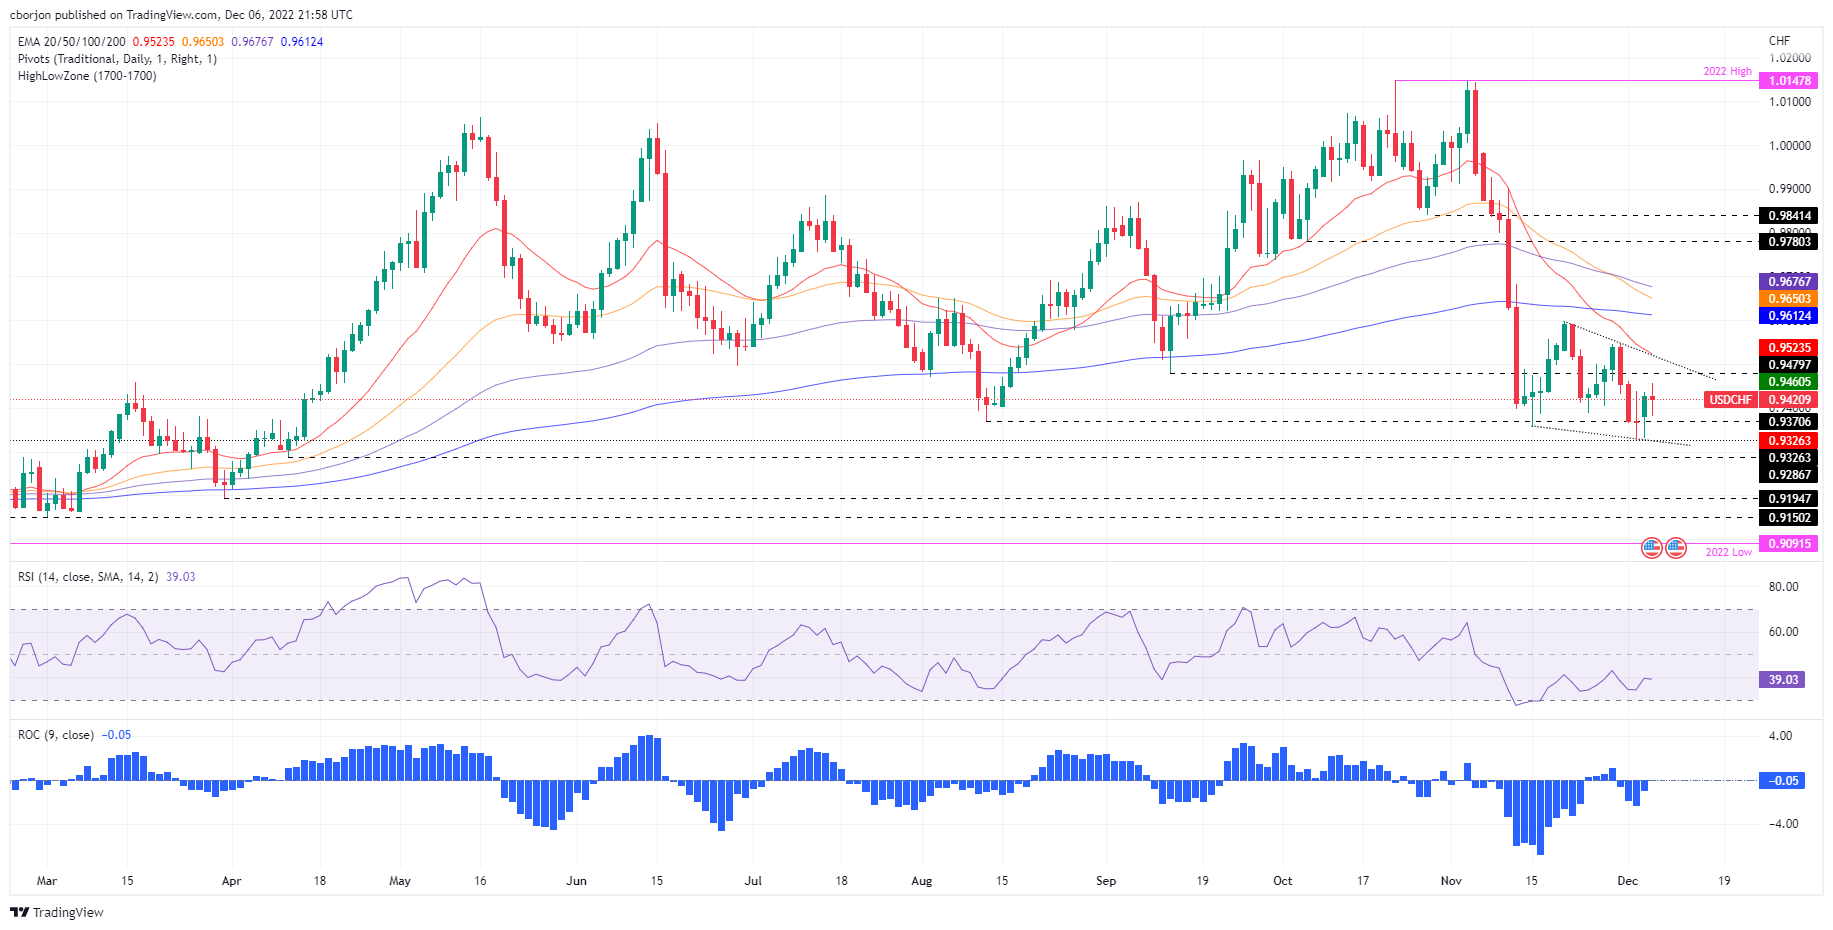
The USD/CHF hit a fresh three-day high at 0.9455 but shifted downwards as US Treasury bond yields weakened the US Dollar (USD) against the Swiss Franc (CHF). At the time of writing, the USD/CHF is trading at 0.9419., below its opening price by a minuscule 0.07%.
USD/CHF Price Analysis: Technical outlook
From a daily chart perspective, the USD/CHF is downward biased, though it’s forming a falling wedge that suggests prices would break to the upside. Of note, the USD/CHF registered a new 8-month low of around 0.9326 last Friday, and so far, the USD/CHF has remained subdued around 0.9320-0.9455.
Oscillators like the Relative Strength Index (RSI) is almost flat at bearish territory, while the Rate of Change (RoC) suggests that selling pressure is fading. If the USD/CHF breaks above 0.9455, that could open the door toward 0.9500.
Short term, the USD/CHF 1-hour chart depicts the pair as neutral-upward biased. The EMAs are almost flat, around the spot price, though the 200-EMA at 0.9436 has been acting as solid resistance as prices tumbled around that area. Break above the latter could open the door towards the 0.9500 figure, followed by the November 30 daily high at 0.9547. As an alternate scenario, the USD/CHF first support would be the intersection of the 20 and 50-EMAs around 0.9411-13, followed by the 100- EMA at 0.9405 and the 0.9400 mark.
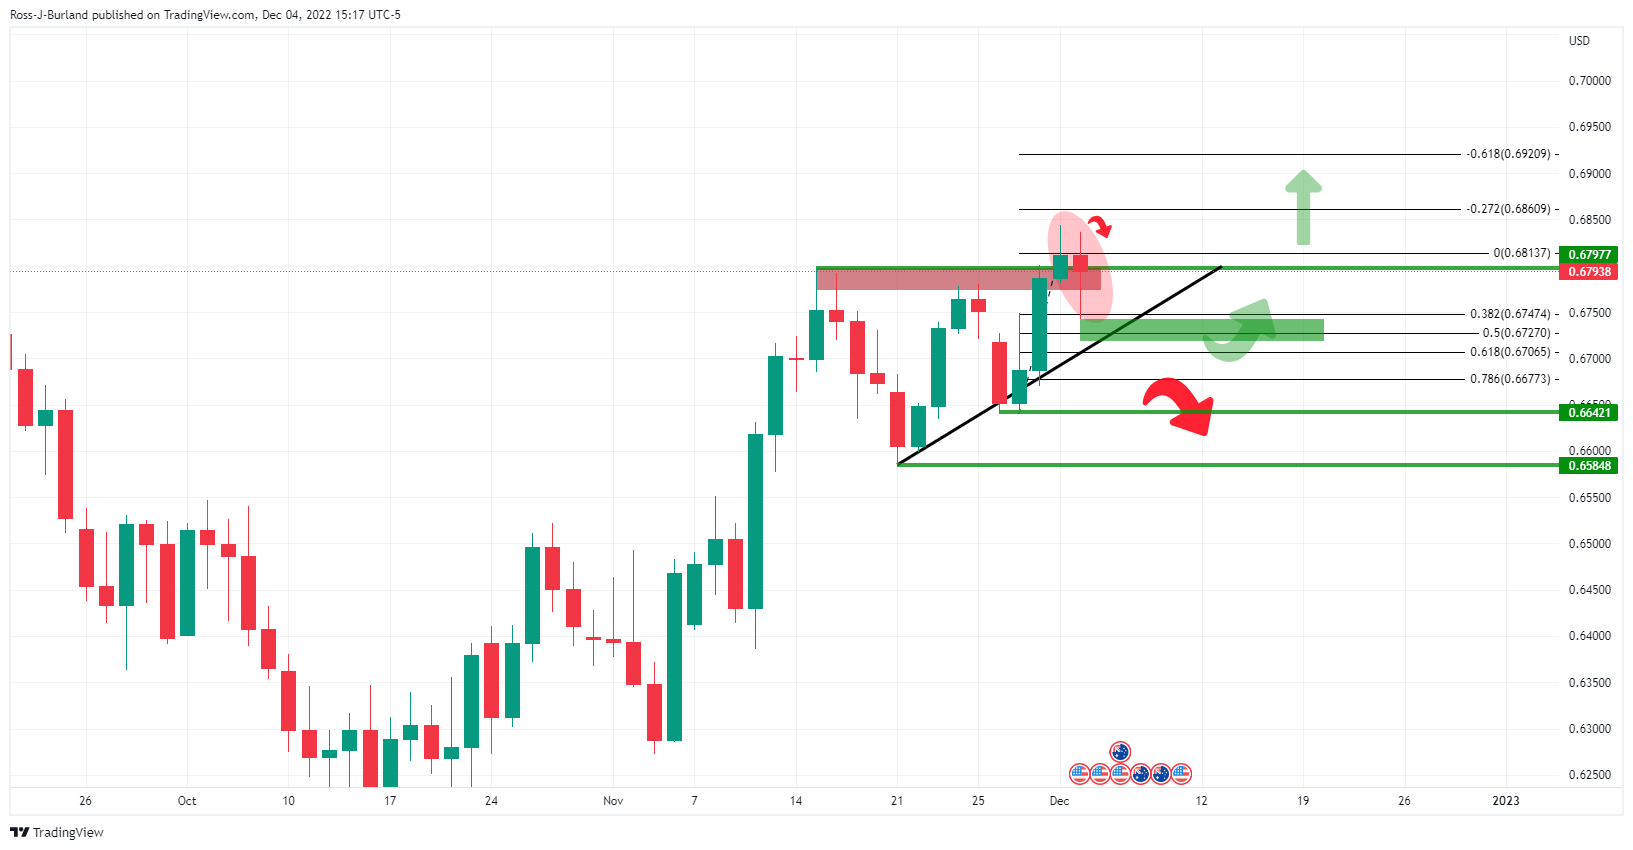
- AUD/USD dropped to test a key technical area on the daily chart.
- AUD/USD bears eye a test below the trendline and a move below 0.6640/50 could be significant.
AUD/USD was under pressure and down by some 0.14% into the close on Wall Street following the prior day's Reserve Bank of Australia, RBA, meeting within a risk-off environment in financial markets.
The RBA delivered a 25bps hike as expected but stopped short of signalling a pause as some forecasters were anticipating. The RBA said it was not on a preset course to tighten policy but said inflation was still high. The Bank reaffirmed its tightening bias, noting a further increase in inflation and wages. Meanwhile, today’s Gross Domestic Product (GDP) data for Australia is expected to show growth of 0.7% QoQ with annual GDP growth expected to increase to 6.3%.
As for the greenback, it was nearly unchanged on Tuesday after strong gains the day before, in a risk-off environment. Data this week showed that the Institute for Supply Management (ISM) said its Non-Manufacturing PMI rose to 56.5 last month from 54.4 in October, indicating that the services sector, which accounts for more than two-thirds of US economic activity, remained resilient in the face of rising interest rates.
This data combined with Friday's surprisingly strong Nonfarm Payrolls and wage growth data in November as well as news that consumer spending had accelerated in October raised optimism that a recession could be avoided in 2023. Consequently, traders currently expect a half-point hike from the Fed next week and they expect a terminal rate of just above 5% in May.
AUD/USD technical analysis
As per the prior analysis, AUD/USD Price Analysis: Eyes are on critical daily dynamic support, where a 50% mean reversion area was eyed in the lower quarter of the 0.6700s, bears have moved in as follows:
Prior analysis:
AUD/USD update
Should the supporting trendline be broken now, a move below 0.6640/50 could be a significant bearish development ahead of the critical remaining calendar events for the year.
What you need to take care of on Wednesday, December 7:
Financial markets remained risk-averse, helping the US Dollar to advance on Tuesday. The American currency shed some ground throughout the first half of the day, but gathered momentum after Wall Street’s opening as US indexes fell for a fourth consecutive session.
The American Dollar finished the day at fresh weekly highs, particularly against its high-yielding rivals. The EUR/USD pair hovers around 1.460, while GBP/USD trades in the 1.2140 price zone.
Financial markets reflect increased uncertainty about the US Federal Reserve’s future actions. The central bank has hinted at an easing pace of quantitative tightening starting as soon as this month, despite economic resilience and signs of easing inflation. Both, policymakers and investors fear the aggressive pace of tightening will result in a long-lasting recession.
Meanwhile, European Central Bank Governing Council member Constantinos Herodotou said the central bank would hike rates again but warned they are near the neutral rate
Tensions between Europe and Russia escalate, as the latter is considering reducing oil production while setting a floor for oil sales in response to the G-7 decision to cap prices.
Crude oil prices were sharply down, with the barrel of WTI currently changing hands at $74 per barrel. The USD/CAD pair surged towards the 1.3660 price zone, where it currently trades.
The AUD/USD pair ended the day around 0.6680, following the lead of stocks and despite a hawkish RBA. Safe-haven CHF and JPY trimmed early gains vs the dollar and the pair ended the day pretty much unchanged.
Spot gold attempted to recover ground but closed Tuesday unchanged at around $1,770 a troy ounce.
Australia will publish its Q3 Gross Domestic Product early on Wednesday, and the economy is expected to have grown at an annualized pace of 6.3%.
Like this article? Help us with some feedback by answering this survey:
- NZD/USD bulls could be throwing in the towel here.
- Bears eye a move to test the trendline support.
NZD/USD is trading around flat on the day, sitting near 0.6320 having stuck to a tight range of 0.6303 and 0.6354. There has been little in the way of a catalyst this week so far, instead the bird has been inching away from the recent highs in what has been a fragile risk environment for financial markets so far, weighing on the high beta currencies such as NZD.
Friday's Nonfarm Payrolls data combined with the start of the week's US Services PMIs have surfaced the prospects of a hawkish Federal Reserve interest rate decision at next week's meeting. In turn, the stock markets and commodity complex have been pressured at the start of the week.
Analysts at ANZ Bank think that the meeting will be tricky to interpret. ''A smaller hike is all but assured, leaving the focus on the terminal rate, which will have to strike the right balance: high enough to credibly bring down inflation, but not so high that it stokes recession fears. We still think it speaks mostly of US dollar volatility into year-end, with a good chance of a correction higher, but let’s see,'' the analysts explained.
''Next week’s HYEFU is also important for the NZD. It’s unlikely to be bond friendly, but potentially higher bond yields and the need for offshore buyers may translate to NZD buy flows,'' the analysts added.
NZD/USD technical analysis
If the bulls commit at this juncture, then there could be the case being made for another rejection at resistance as the bull cycle begins to decelerate and teeter out in the 0.6400s.
However, should there be a significant correction into liquidity near 0.6250, then if the bulls were to re-engage, then there could be a build-up for momentum to run the bird through resistance in the coming days/weeks.
- Gold price registers a minimal advance, even though the US Dollar is rising.
- Solid economic data from the United States would keep the Federal Reserve pressured.
- Gold Price Forecast: A break below $1760 will exacerbate a fall to $1725; otherwise, a rally to $1786 is on the cards.
Gold price turns positive after diving to new weekly lows around $1766.90 and grinds higher amidst a buoyant US Dollar (USD), even though US Treasury yields are weakening, amidst a risk-off impulse spurred by increasing recessionary jitters. That said, the XAU/USD is trading at $1769.48, almost flat, at the time of typing.
US data put the Federal Reserve in the spotlight
Since last Friday, US economic data revealed had increased likelihood of additional Federal Reserve tightening. The US Nonfarm Payrolls report showed that the economy added 263K new jobs, above estimates, and depicted that workers are looking for higher wages. Why? Because the Average Hourly Earnings on a YoY comparison jumped from 4.9% to 5.1%.
Monday’s data further cemented the case for a hotter-than-expected US economy. Even though last week’s ISM Manufacturing PMI dropped to contractionary territory, the services component rose 56.6, above 53.3 forecasts. According to Bloomberg, “The service sector expanded faster in November, with the holiday season bolstering business activity. The price subindex confirmed the inflationary impulse in services is still strong despite more widespread disinflation in goods sectors.”
Earlier, the US Department of Commerce (DoC) revealed that Trade Balance in the United States widened to $-78.2B compared to September’s $-74.1B, beneath estimates of $-80B. Although the trade deficit expanded, data was mainly ignored as investors assessed the US economy.
Given the backdrop mentioned above, the next week’s Federal Reserve Open Market Committee (FOMC) meeting would be crucial, albeit the Federal Reserve Chair Jerome Powell gave the green light on 50 bps rate hikes. However, with US data looming, like the Producer Price Index, the University of Michigan (UoM), and the following week’s Consumer Price Index (CPI), it would shed some cues about inflation elevating or easing.
Gold Price Forecast: XAU/USD Technical Outlook
From a technical perspective, Gold remains upward biased. However, after breaching the $1800 figure last Friday, the yellow metal failed to capitalize on broad US Dollar weakness, as XAU/USD tumbled below the $1800 mark. Gold buyers’ lack of strength is well portrayed by the Relative Strength Index (RSI), registering a series of lower peaks, while price action is aimed upwards. Also, the Rate of Change (RoC) confirms buying momentum is fading.
If XAU/USD drops below the 200-day Exponential Moving Average (EMA) at $1759.79, that could pave the way for further losses. Otherwise, if XAU/USD buyers reclaim the November 15 daily high of $1786.53, that could exacerbate a re-test of the $1800 psychological level.
- WTI bulls could be on the verge of moving on following as strong down move.
- US recession concerns are playing into financial markets creating a risk-off mood.
West Texas Intermediate crude is down over 4% on the day so far, falling back into the bearish trend once again and on the front side of what was momentary a counter-trendline. At the time of writing, WTI is trading at $73.80 near the lows of the day having fallen from $77.86.
Recession worries have reared their ugly head again as traders about a risk-off mood following the start of the week's US data that fanned the flames of the Federal Reserve's hawkish narrative in financial markets. On Monday, the Institute for Supply Management (ISM) said its Non-Manufacturing PMI rose to 56.5 last month from 54.4 in October, indicating that the services sector, which accounts for more than two-thirds of US economic activity, remained resilient in the face of rising interest rates. The data beat forecasts that the Non-manufacturing PMI would fall to 53.1.
This has been raising concern the Federal Open Market Committee will potentially stick to the 75 basis point hiking tact when its two-day meeting wraps up on Dec.14, over-shadowing developments that could tighten the market. Concerns about a steep increase in borrowing costs have boosted the US Dollar this year, pressing negatively on US equities and bond markets, with the S&P 500 down 17.5%.
Meanwhile, the Energy Information Administration lifted its forecast for 2023 global oil inventories in its December Short-Term Energy Outlook (STEO), raising its outlook by 0.2-million barrels after expecting a drop of 0.3-million barrels in its November release. The EIA also trimmed its forecast for the average price of Brent crude oil next year to US$92.00, down from its November estimate of US$95.00 on the expectation of a recession in the US.
Meanwhile, the agency took into account the European Union's ban on seaborne Russian oil imports and the US$60 price cap on Russian crude that came into effect at the start of this week following a decision made on Friday. The cap is expected to tighten supply as Russia looks for alternative buyers.
WTI technical analysis
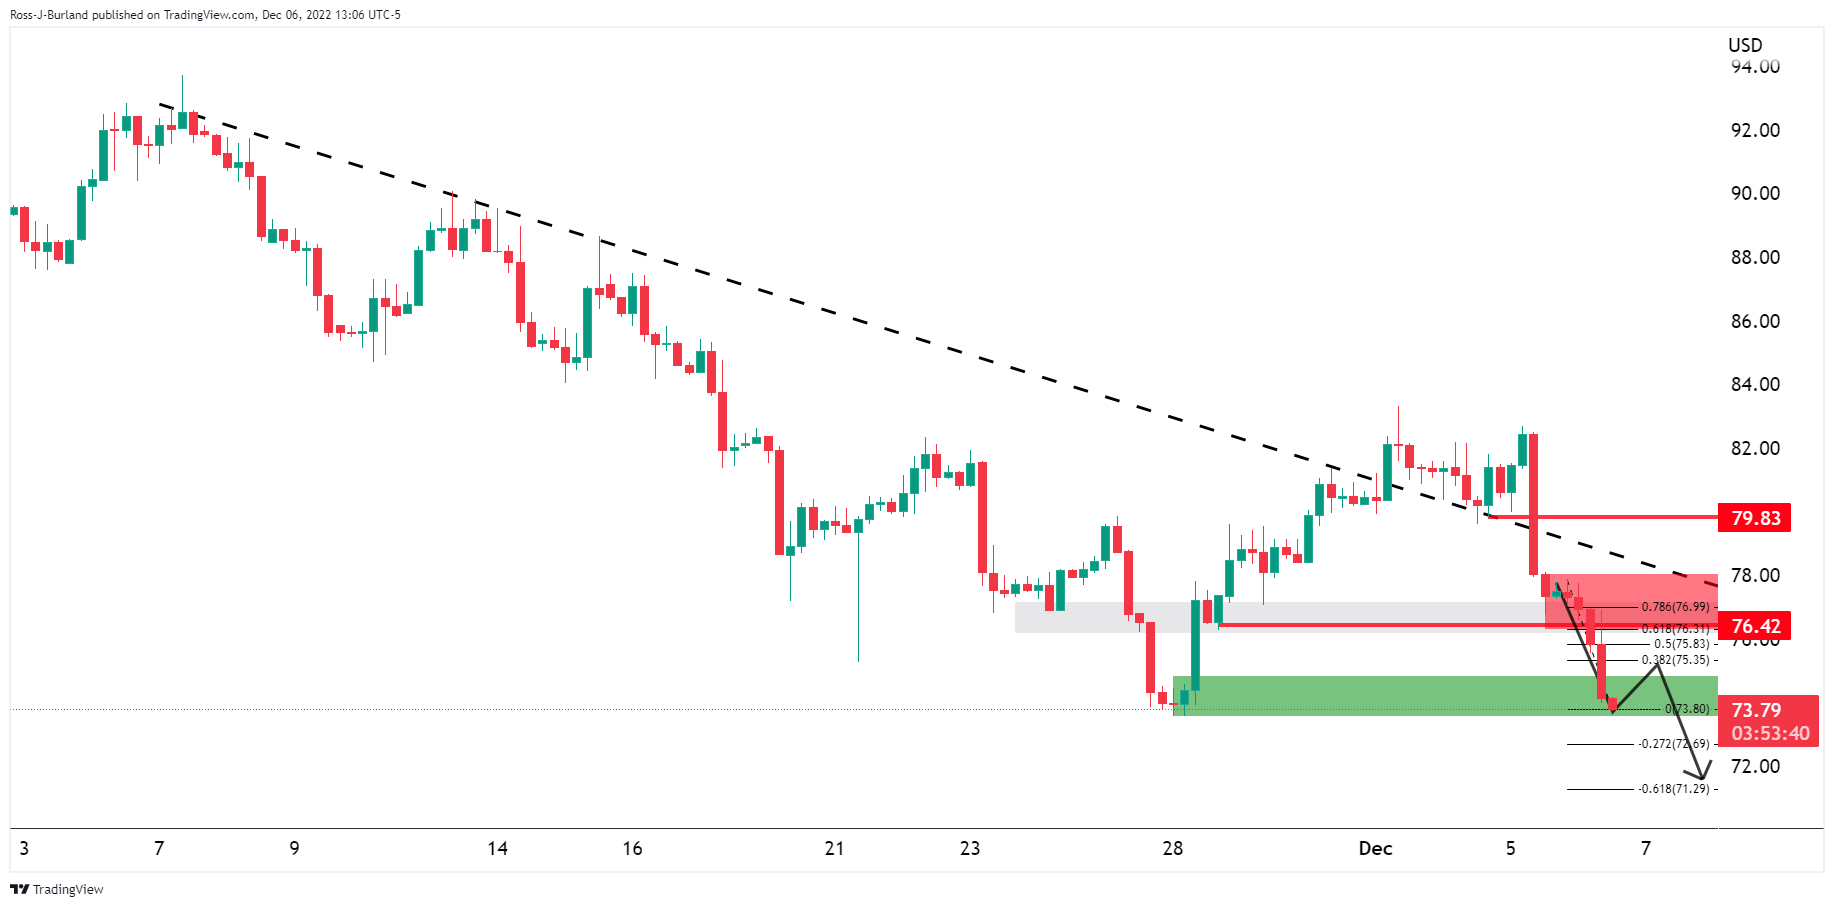
A prior analysis, that favoured the upside of the market so long as the price remained on the back side of the counter trendline, acknowledged a break below $76.40 that would be putting on some serious heat on the committed bulls as per the following daily and 4-hour charts:
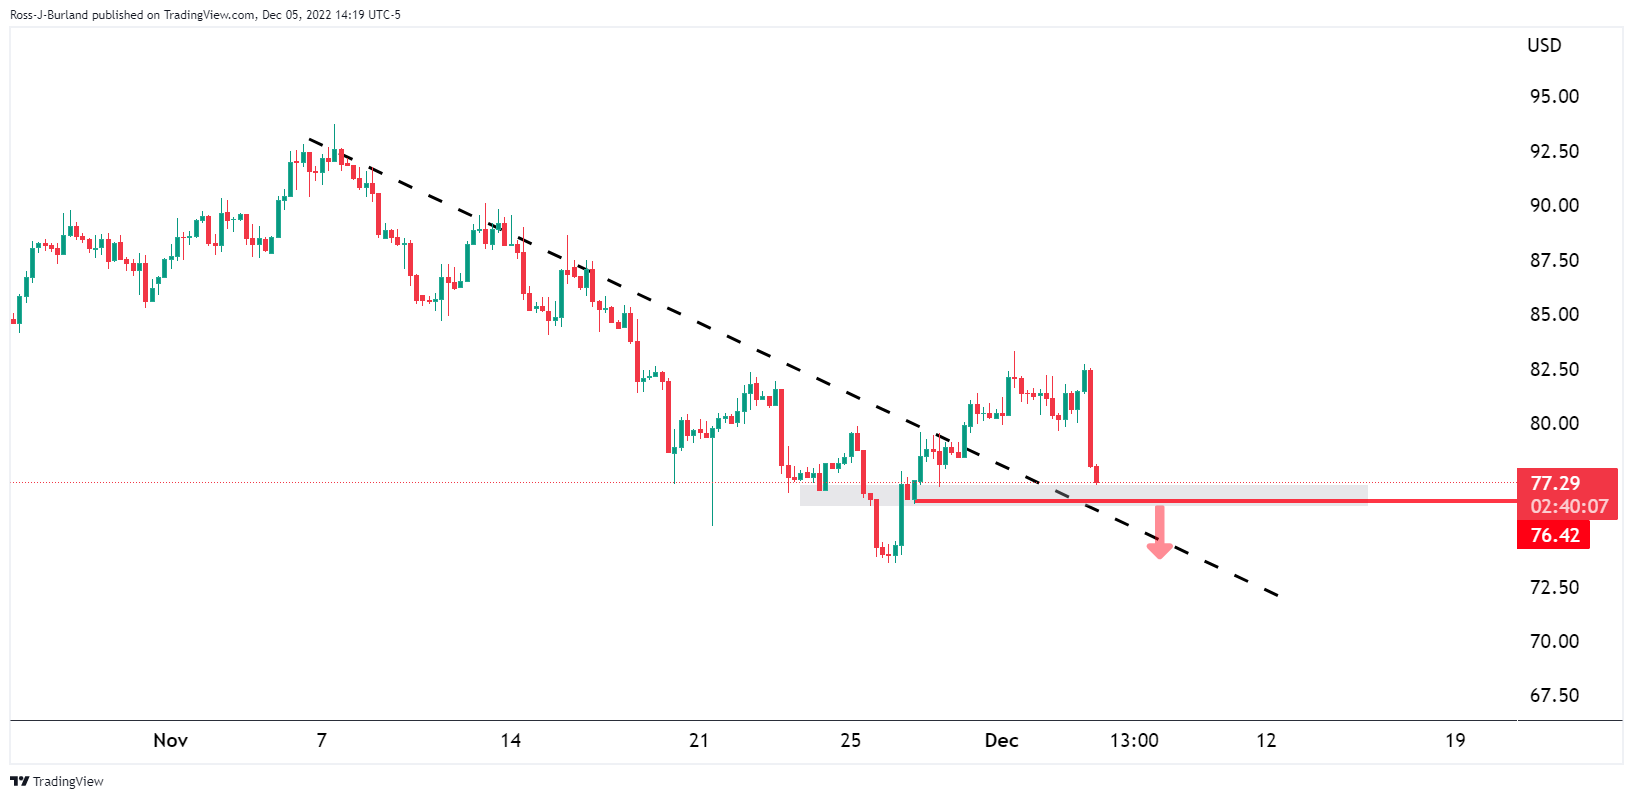
Meanwhile, there are prospects for a correction at this juncture:
- Silver price stumbles beneath $22.14 amidst overall USD strength.
- Silver Price Analysis: Break below $22.00 would exacerbate a test of a symmetrical triangle break around $21.80.
Silver price dropped from daily highs hit at 22.59, testing the current week's lows of 22.14, due to speculations that the Federal Reserve (Fed) would continue to tighten monetary conditions, even though recessionary risks are skewed to the upside. Therefore, the US Dolla (USD) got bolstered by safe-haven flows, to the detriment of precious metals. At the time of writing, the XAG/USD is trading at 22.19.
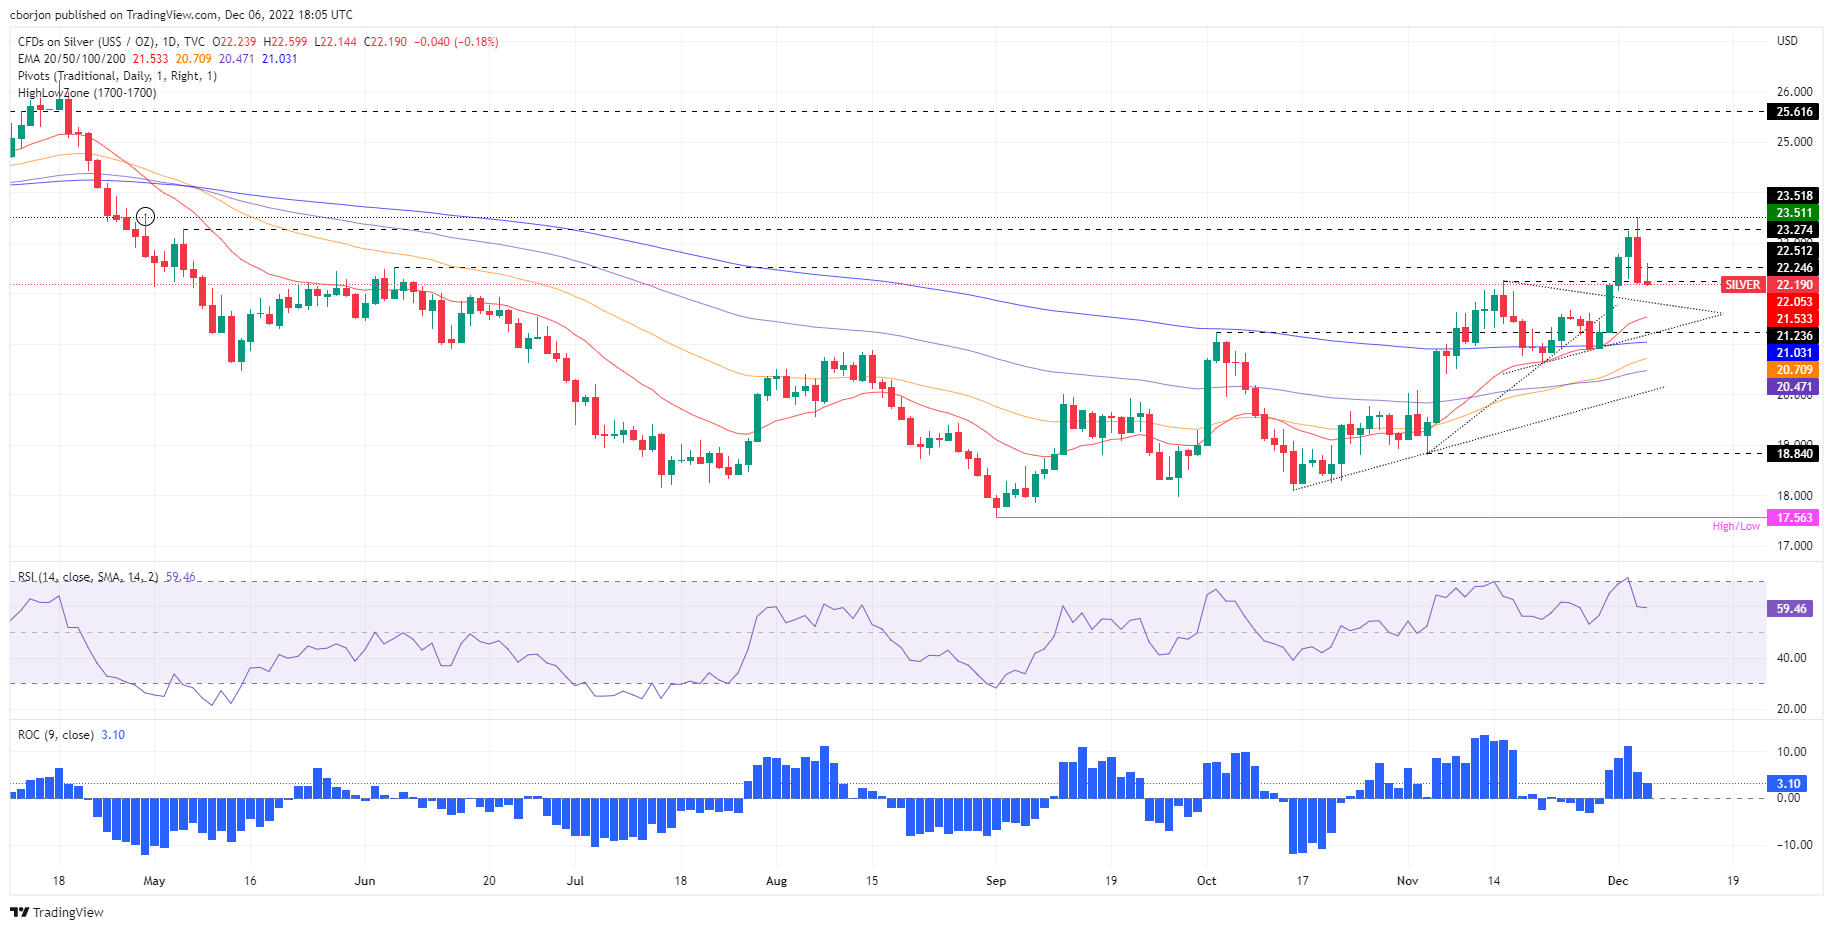
Silver Price Analysis: XAG/USD Technical Outlook
Since tumbling more than 3.80% on Monday, the XAGU/USD remains downward pressured, registering fresh two-day lows beneath $22.17, which would exacerbate a fall towards the top trendline of a symmetrical triangle broken last Thursday. Of note, the Relative Strength Index (RSI) and the Rate of Change (RoC), depict the white metal buying pressure fading, and unless buyers step in around $22.00, further downward action is warranted.
Therefore, the XAG/USD first support would be the $22.00 figure. Break below will expose the 20-day Exponential Moving Average (EMA) at 22.21.53, followed by the trend-setter 200*day EMA at $21.03. On the flip side, the XAG/USD first resistance would be the $23.00 psychological level. A breach of the latter will expose the December 5 swing high at $23.51, followed by the $24.00 mark.
Silver Key Technical Levels
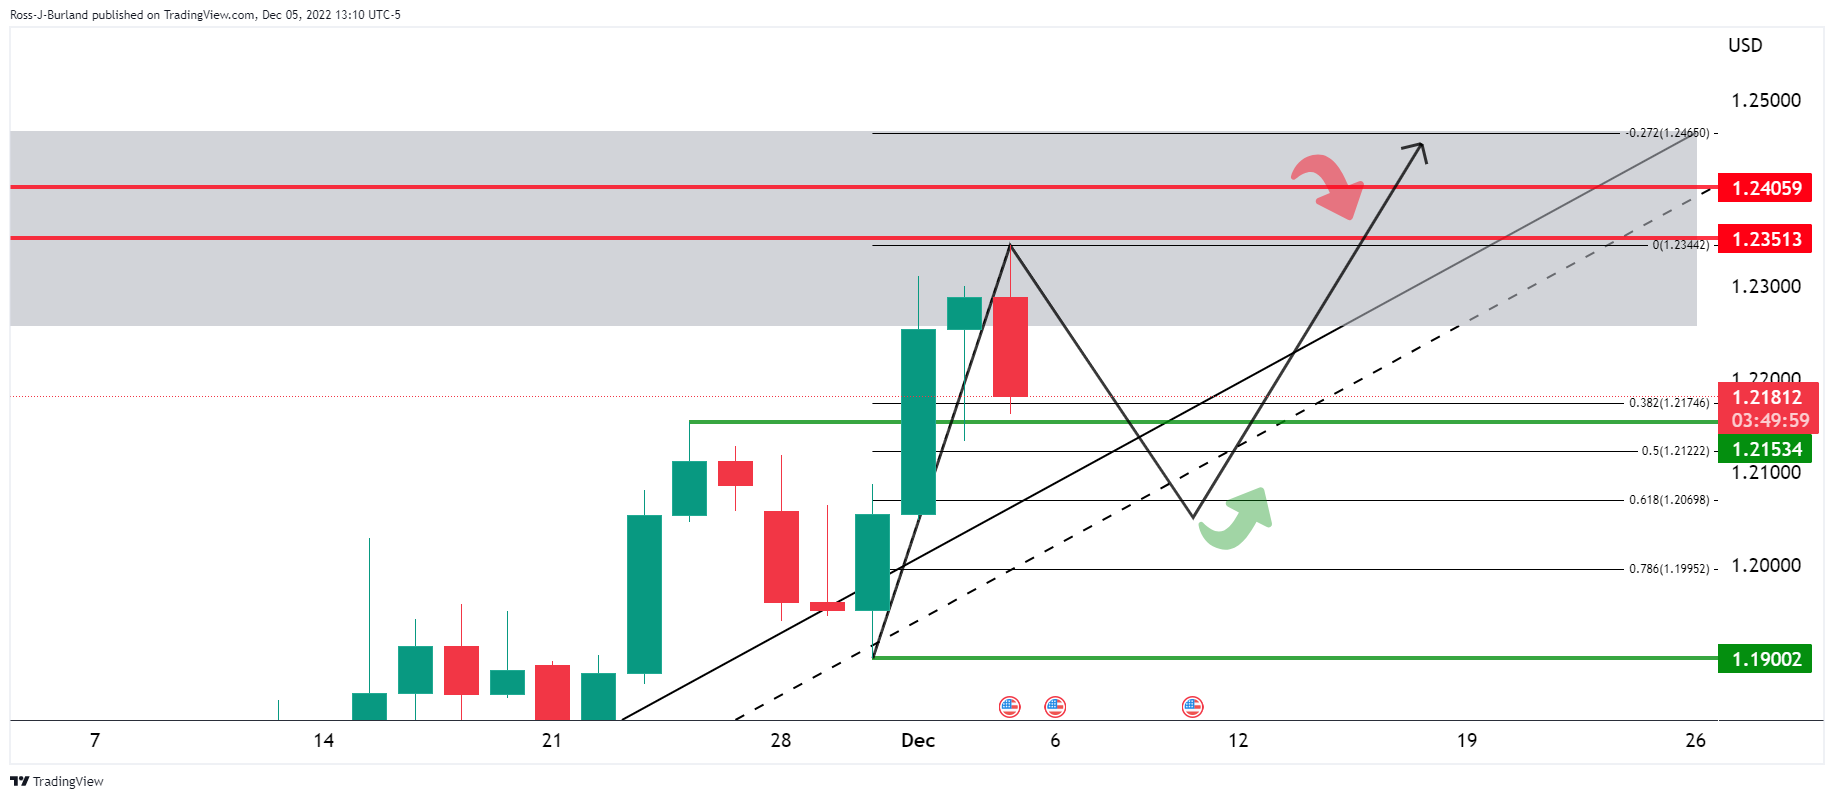
- In the 4-hour chart, we can see that the price is forming a head & shoulders pattern.
- A break of structure in the 1.2150s is required for a move into testing the trendline support and commitments at 1.2100.
- If the bulls were to commit, then the case for a higher bull cycle high would be on the cards with 1.2450 eyed.
As per the prior analysis, GBP/USD bears step up the pace, eye break of 1.2150s, the British Pound remains within the bullish trend but is testing the commitments below 1.2200 and at 1.2150. The low of the week so far has been 1.2152 and the following illustrates the prospects of a deeper correction should the bears stay the course.
GBP/USD prior analysis
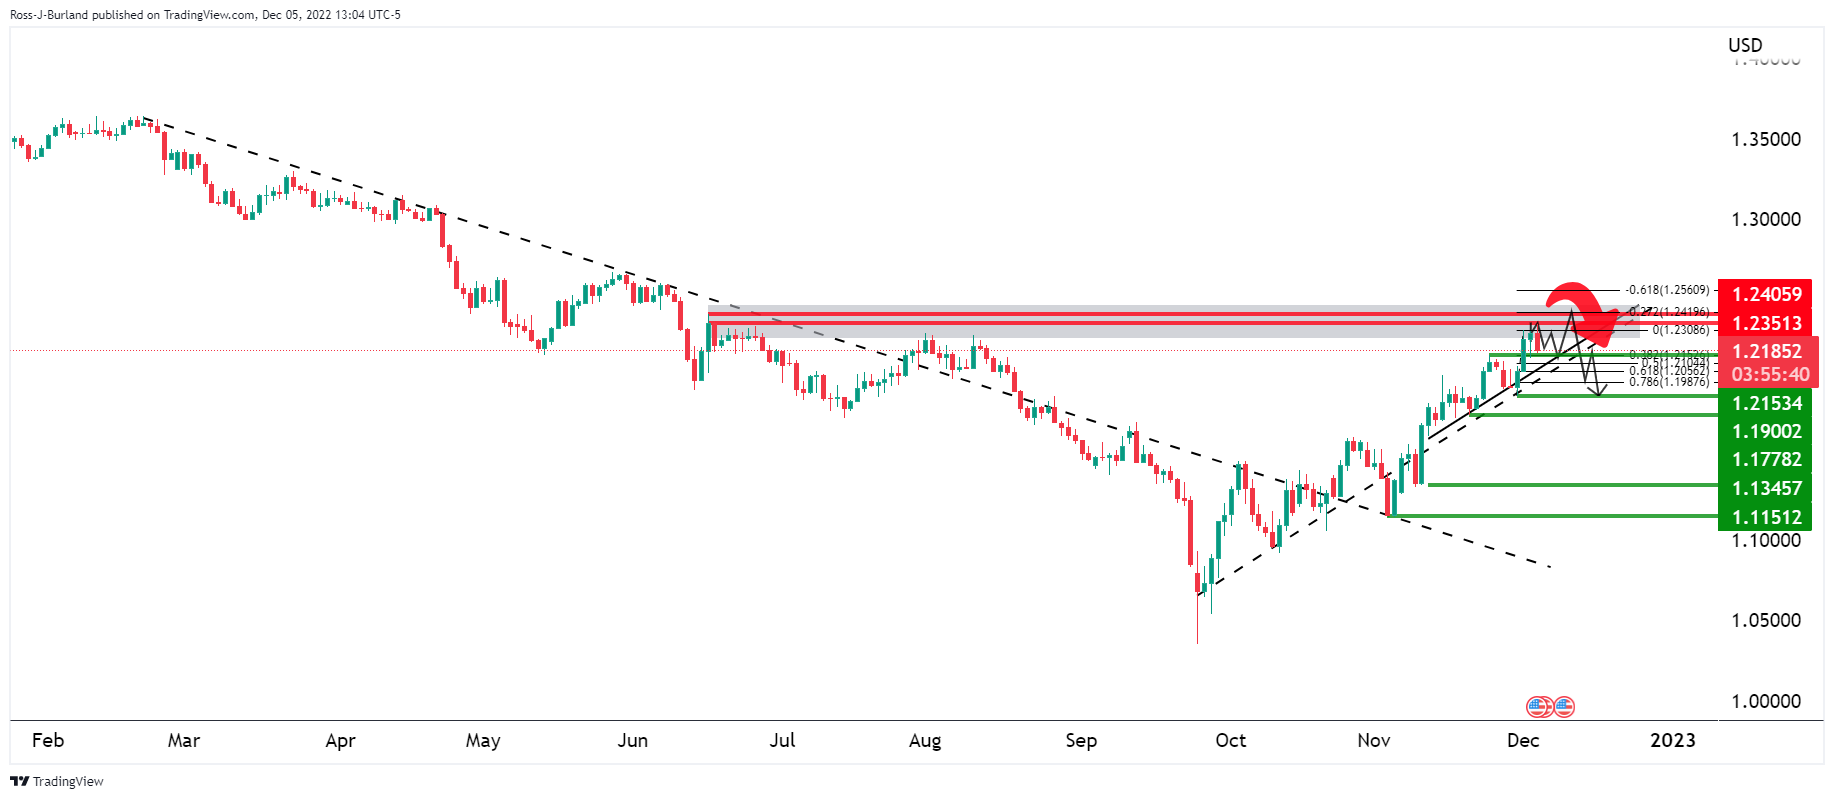
It was stated that GBP/USD has been potentially starting to move into a phase of distribution below the 1.2350, 1.2400 areas on the daily chart as illustrated above.
However, the British Pound's bullish trend would still be intact while structures 1.2150 and 1.1900 are yet to be broken:
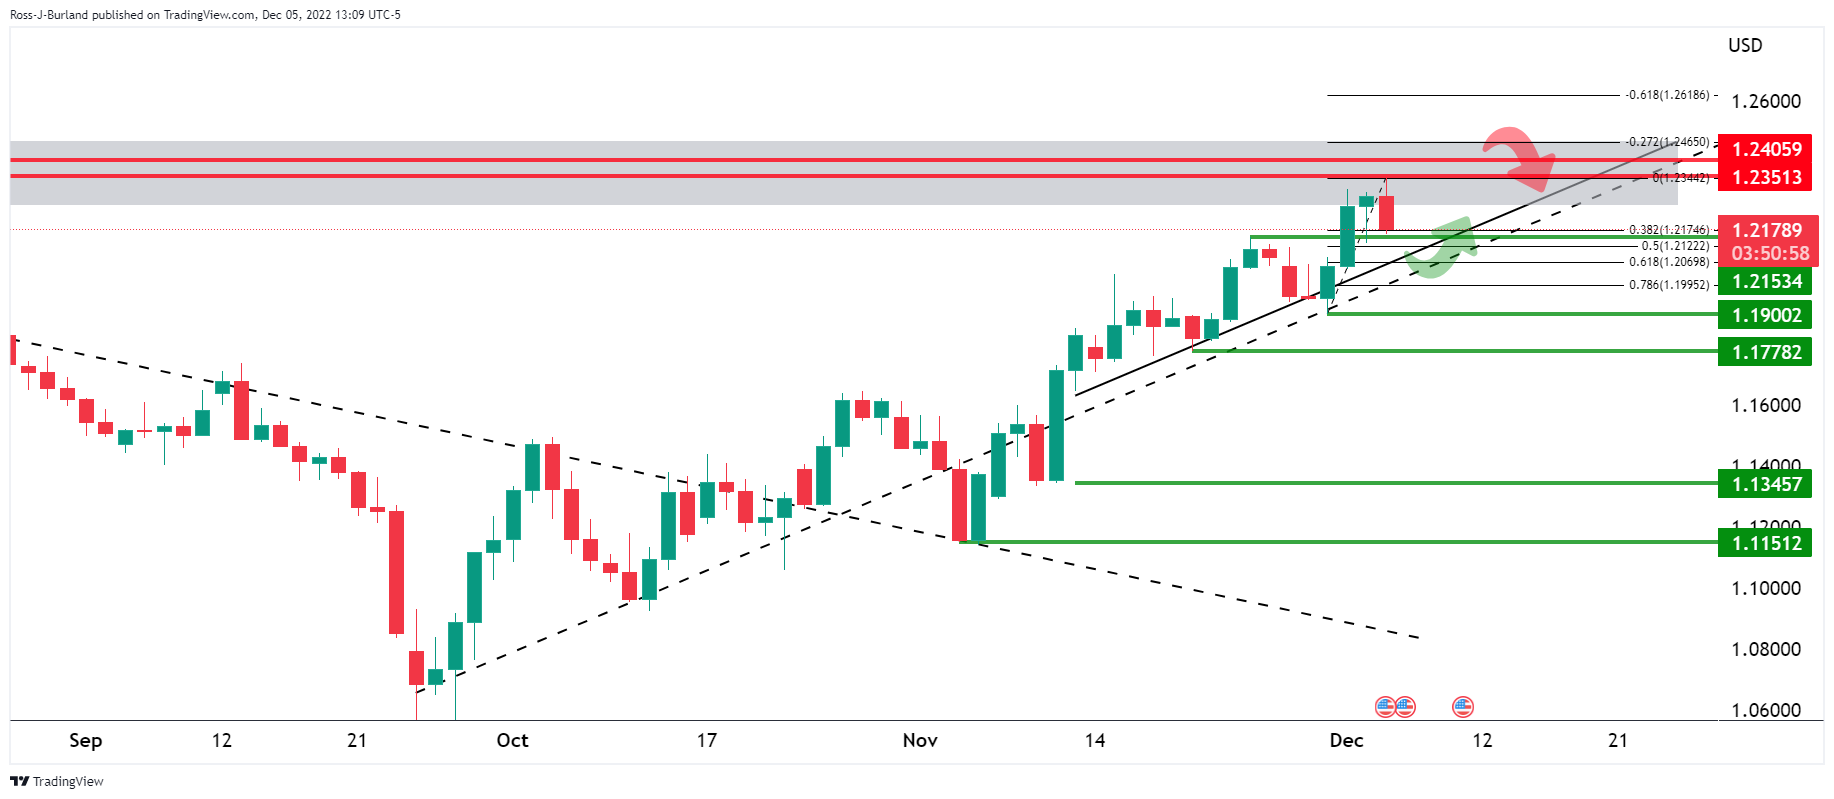
A move below 1.2150 could, however, result in a deeper correction through the Fibonacci scale with eyes on a 50% mean reversion at 1.2120 and then a 61.8% ratio confluence with the upper quarter of the 1.20 area near 1.2070.
GBP/USD update, H4 chart
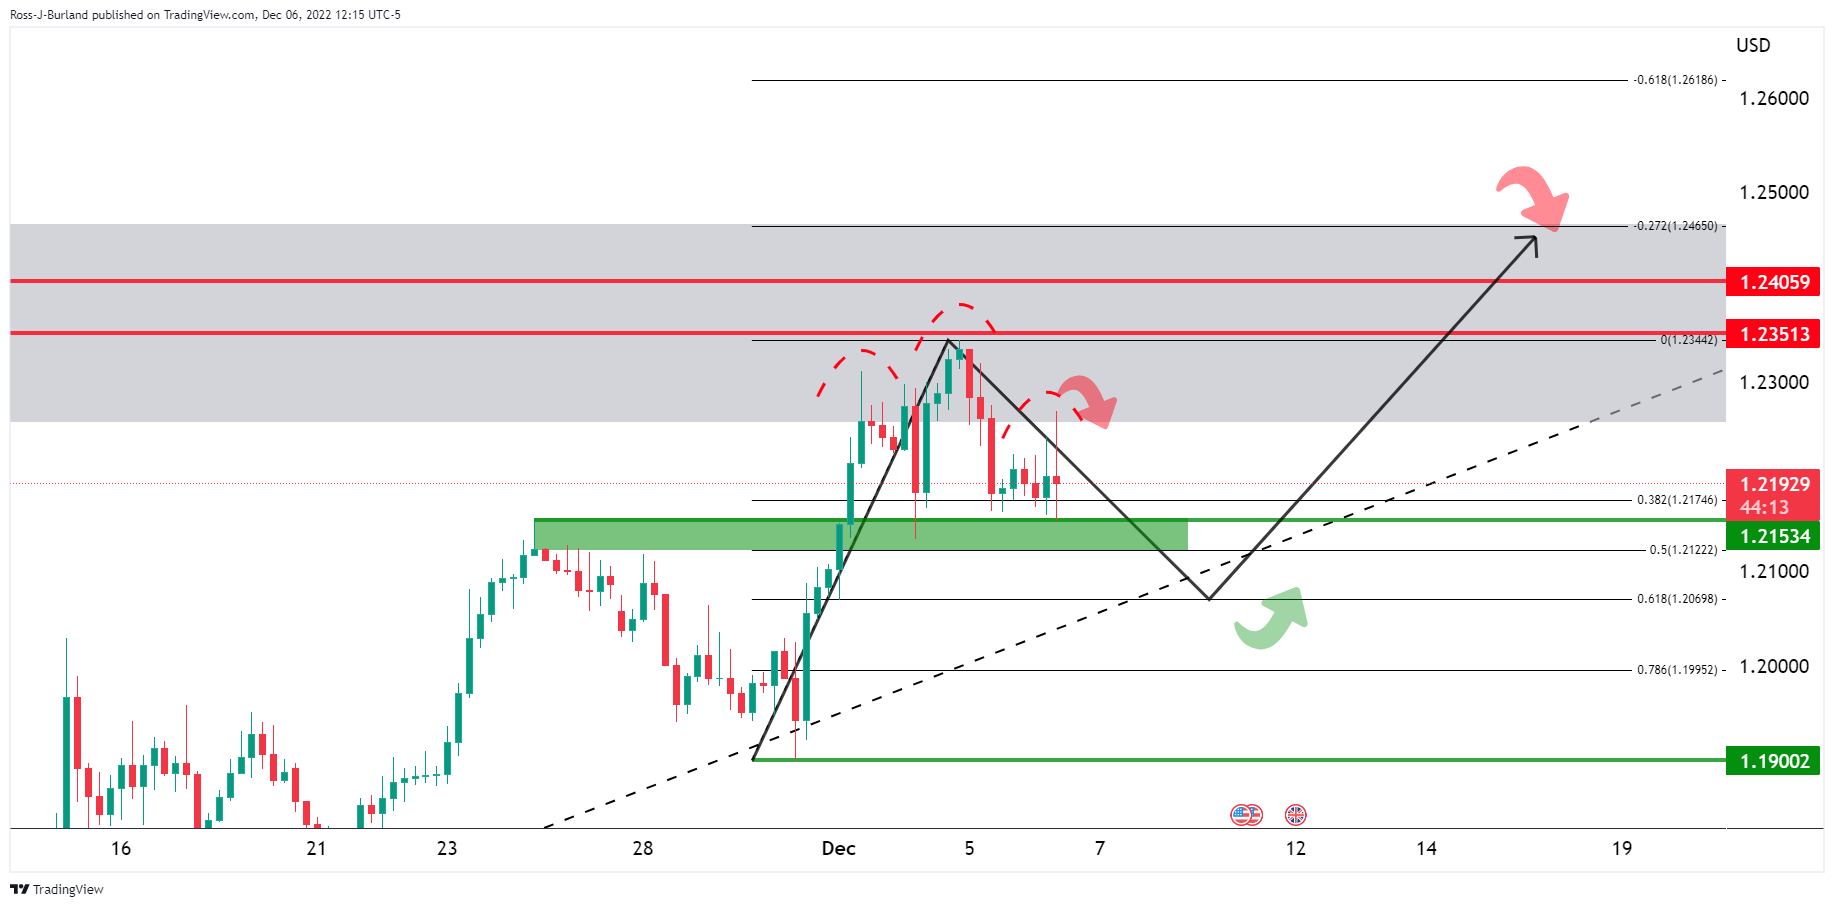
In the 4-hour chart, we can see that the price is forming a head & shoulders pattern with lower highs in the right-hand shoulder. This gives rise to the prospects of a break of structure in the 1.2150s for a move into testing the trendline support and commitments at 1.21 the figure for other sessions ahead.
If the bulls were to commit around the dynamic support of the trendline, then the case for a higher bull cycle high would be on the cards with 1.2450 eyed.
- The US Dollar fails to capitalize on a risk-off mood, blamed on falling US bond yields.
- Recently released US economic data would keep the Federal Reserve tightening monetary policy.
- USD/JPY Price Analysis: Upward biased, but might consolidate around 135.00/136.00.
The USD/JPY remains pressured in the North American session, spurred by dented risk appetite produced by the last three days’ economic data from the United States (US) suggesting further tightening needs by the Federal Reserve (Fed). Nonetheless, the USD/JPY edges lower, trading at 136.61, partly due to falling US Treasury yields.
Before Wall Street opened, the US Department of Commerce (DoC) revealed that Trade Balance in the United States widened to $-78.2B compared to September’s $-74.1B, beneath estimates of $-80B. Delving into the data, the Exports rose by $256.6B below September’s data, while Imports jumped $334.8B above the previous month’s $332.6B.
Meanwhile, data revealed since last Friday portrays that the labor market in the US remains tight, while Average Hourly Earnings jimping 5.1% YoY added to inflationary pressures. Aside from employment data, the US Institute for Supply Management (ISM) revealed that the Service PMI Index rose 56.6, better than the 53.3 expected.
Elsewhere, investors’ sentiment has dampened since the beginning of the week due to their assessment of the Federal Reserve’s (Fed) reaction to data. Wednesday’s speech by the Federal Reserve Chair Jerome Powell, pivoting towards less aggressive rate hikes in the 50 bps size, spurred a rally in risk-perceived assets. However, last week’s data put Powell at a crossroads, with the Producer Price Index (PPI) to be released on Thursday, followed by the University of Michigan (UoM) Consumer Sentiment and next week’s Consumer Price Index (CPI) before December’s meeting. Any hints that inflation remains high could put an aggressive 75 bps hike back into play.
Hence, the USD/JPY failed to sustain the rally on Tuesday due to the US bond yields falling. The US 10-year Treasury yield creeps down two and a half bps, at 3.550%.
USD/JPY Price Analysis: Technical outlook
From the daily chart perspective, the USD/JPY is neutral-upward biased. Since last Friday’s breach of the 200-day Exponential Moving Average (EMA), the major recovered some ground, though it’s testing the bottom trendline of a previous upslope support trendline at around 137.40s. The USD/JPY key support levels lie at 136.00, followed by the December 2 daily high of 135.98, followed by the 200-day EMA at 135.01. On the other hand, the USD/JPY first resistance would be the psychological 137.00 mark. Break above will expose the upslope trendline drawn since August 2022 at around 137.40, followed by the December 1 daily high of 138.12.
Data released on Tuesday showed the US trade deficit widened in October. Analysts at Wells Fargo point out exports were held back by a decline in natural gas specifically, but there were signs of slower growth beginning to bite, which they expect to remain a headwind for exports into next year. They warn net exports now look to be a considerable drag on fourth-quarter growth.
Key Quotes:
“The U.S. trade deficit widened for the second straight month to -$78.2 billion in October as import growth (+$2.2 billion) outpaced exports (-$1.9 billion). Despite the sharp widening the past two months, the deficit still sits smaller in October than the average that prevailed over the past 12 months.”
“The October data thus position net exports to be a considerable drag on fourth quarter growth. Exports will remain under pressure as there is a clear sign of economic deceleration abroad and a stronger U.S. dollar is making U.S. goods more expensive and less competitive in global markets. At the same time, imports should remain supported into next year amid further normalization in supply chains and continued domestic demand for end product.”
“These dynamics will likely cause net exports to remain a drag on headline growth for a few quarters. But as the economy falls into a mild recession by the second half of next year, net exports are set to boost growth as demand for imports dries up.”
- Bank of Canada to announce monetary policy on Wednesday.
- The Loonie is the worst G10 performer on Tuesday.
- USD/CAD up for the fourth day in a row, heads for highest close in a month.
The USD/CAD rose further during the American session amid risk aversion and a decline in crude oil prices, ahead of the Bank of Canada decision. The pair climbed to 1.3670, hitting the highest level since November 4 and then pulled back toward 1.3620.
A weak Loonie boosts USD/CAD
As of writing, USD/CAD is hovering around 1.3645, about to post the fourth consecutive gain and the highest daily close in a month. The Canadian dollar is on Tuesday the worst performer among the G10 space.
The decline in crude oil prices (WTI down 1.80%, at fresh weekly lows) and in equity price weighs on the Canadian Dollar. The Dow Jones is falling by 0.53% and the Nasdaq drops by 1.58%. Crude and equity indexes are adding to yesterday’s losses.
On Wednesday, the Bank of Canada will announce its decision on monetary policy. A 50 basis points rate hike to 4.25% is expected. Some analysts see a smaller rate hike. Volatility around the decision is expected to increase significantly on CAD’s crosses.
“The BOC is unlikely to offer much to move the needle for CAD. CAD underperformance on crosses has occurred quickly and looks tactically stretched. A case for a reversal can be made, but we will look to fade that strategically given idiosyncratic drags”, said analysts at TD Securities.
Technical levels
- Trade Balance in the United States shows the deficit widening, a headwind for the US Dollar.
- Factory Orders in Germany kept the Euro buoyant amid a gloomy outlook.
- Federal Reserve and European Central Bank December meetings to keep the pair in familiar ranges.
- EUR/USD Price Analysis: Upward biased, but a pullback towards 1.0400 is on the cards.
The Euro (EUR) is extending some of its Monday losses against the US Dollar (USD), stuck below the 1.0500 figure amidst a risk-off impulse, as data released in the United States (US) did not bolster the USD. Factory Orders in Germany surprisingly exceeded estimates, underpinning the Euro. Therefore, the EUR/USD is trading at 1.0487 after hitting a daily low of 1.0475.
US Trade Balance deficit widened and could weigh on Q4 GDP
Wall Street is set to open lower, portraying a dismal mood. The Department of Commerce (DoC) in the United States revealed the October Trade Balance, which showed the deficit widening for two-consecutive months, as figures came at $-78.2B exceeding estimates of $-80B, though trailed by September’s $-74.1B. Delving into the data, the Exports rose by $256.6B below September’s data, while Imports jumped $334.8B above the previous month’s $332.6B.
Germany Factory Orders boosted the Euro
In the Euro area, Germany revealed its October Factory Orders, which rose above estimates of 0.1% and smashed September’s figures. Worth noting that orders grew for the first time since July. Compared to October 2021, orders fell at an adjusted 3.2%. The report added that companies still have difficulties fulfilling their orders as supply chains are interrupted, blamed on the war in Ukraine and distortions spurred by the Covid-19 crisis.
US jobs data and robust ISM Services PMI keep the USD buoyant
Elsewhere, the EUR/USD has not been able to rally back toward multi-month highs at 1.0594 due to last week’s solid US Nonfarm Payrolls (NFP) data for November, with companies hiring more than 263K jobs, exceeding 200K estimates. Also, Average Hourly Earnings jumped to 5.1% YoY, and Monday’s release of an upbeat US Institute for Supply Management (ISM) Non-Manufacturing PMI at 56.5 vs. 53.3 estimated will keep the US Dollar bid.
Meetings of the Federal Reserve and the European Central Bank loom
Given the backdrop, investors are assessing that the US Federal Reserve (Fed) would keep tightening monetary conditions. Money market futures odds for a 50 bps increase in the Federal Funds rate (FFR) at the December meeting are at 79.4%, while odds for a 75 bps are at 20.6%. Regarding the European Central Bank (ECB), some policymakers like Villeroy, Makhlouf, and Herodotou, expressed their support for a 50 bps rate hike, contrary to Knots and Holtzman, which backed an aggressive 75 bps.
EUR/USD Price Analysis: Technical outlook
The EUR/USD daily chart suggests the pair remains upward biased but losing some momentum, as Monday’s candlestick printed an inverted hammer, which usually appears at the end of an uptrend/downtrend. Since Monday, the Relative Strength Index (RSI) has been aiming downward, while the Rate of Change (RoC) proves sellers are losing momentum. Therefore, the EUR/USD might pull back before resuming its uptrend.
The EUR/USD first support would be the 1.0480 December 5 low, followed by the 1.0400 figure and the 200-day Exponential Moving Average (EMA) at 1.0388.

Analysts at TD Securities noted that they expect the Bank of Canada (BoC) to raise the policy rate by 25 basis points in December but noted that this was admittedly a "close call."
Terminal rate at 4.25%
"We see the BoC's terminal rate at 4.25%, and as such expect the BoC to signal that it expects to lift rates further."
"The BOC is unlikely to offer much to move the needle for CAD. CAD underperformance on crosses has occurred quickly and looks tactically stretched. A case for a reversal can be made, but we will look to fade that strategically given idiosyncratic drags."
- AUD/USD trims gains as the US dollar turns positive on risk aversion.
- RBA raises rates by 25 bps as expected.
- Australia to report Q3 GDP growth on Wednesday.
The AUD/USD is rising only modestly on Tuesday, recovering a small portion of Monday’s losses. The recovery from under 0.6700 found resistance below 0.6750. The US Dollar is posting mixed results as Wall Street drops again.
After RBA, attention turns to data
On Tuesday, the Reserve Bank of Australia (RBA) raised the key interest rate by 25 basis points as expected. The central bank said it expected further increases. “Size and timing of future increases determined by data and outlook for inflation and labour market”, the RBA said in the monetary policy statement. The Aussie gained ground modestly after the decision.
Growth data is due in Australia on Wednesday, with Q3 figures. Market consensus is for a GDP increase of 0.7% with the annual rate rising from 3.6% to 6.3%.
The AUD/USD failed to benefit and remains pressured amid global risk aversion on Tuesday. The Dow Jones is falling by 0.43%, adding to Monday’s losses. Crude oil prices are down 0.40%, approaching 2022 lows and gold is erasing daily gains.
“We think the reopening in China and the uptick in Australia's commodity export prices could provide AUD some relative support against other cyclical currencies, even if we expect AUD/USD to decline modestly amid tightening financial conditions and broad USD strength”, said Danske Bank analysts.
The AUD/USD is approaching 0.6700 again. A consolidation below would further weaken the short-term outlook, suggesting a test of the next support seen around 0.6660/65. On the upside, the immediate resistance is located at 0.6745/50. A recovery above 0.6775 would strengthen the Aussie.
Technical levels
- Gold price catches fresh bids amid the emergence of some selling around US Dollar.
- Sliding US Treasury bond yields weighs on USD and benefits the non-yielding metal.
- The upside seems capped amid uncertainty over future rate hikes by Federal Reserve.
Gold price regains positive traction on Tuesday and reverses a part of the previous day's retracement slide from a five-month peak. The steady intraday ascent extends through the early North American session and lifts the XAU/USD to a fresh daily high, around the $1,780-$1,781 region in the last hour.
Weaker US Dollar lends support to Gold price
The US Dollar struggles to capitalize on the overnight solid rebound from its lowest level since late June and attracts some sellers near a technically significant 200-day Simple Moving Average (SMA). As investors seek clarity on the Federal Reserve's rate-hike path, a fresh leg down in the US Treasury bond yields weighs on the Greenback. This, in turn, is seen as a key factor driving flows towards the Dollar-denominated Gold price.
Against the backdrop of Friday's upbeat monthly jobs report from the United States, the better-than-expected ISM Services PMI released on Monday pointed to a resilient economy. The incoming positive US macro data raises fears that the Federal Reserve might lift rates more than projected. Investors, however, seem convinced that the US central bank will slow the pace of its policy-tightening cycle and anticipate a 50 bps rate hike in December.
Focus remains on next week’s key data/event risks
Hence, the market focus will remain glued to the Federal Open Market Committee (FOMC) policy meeting on December 13-14. Heading into the key event risk, investors will confront the release of the latest US consumer inflation figures for November, which might influence the Federal Reserve's near-term policy outlook. This, in turn, will play a key role in driving the non-yielding Gold price and help determine the next leg of a directional move.
Recession fears further underpin safe-haven XAU/USD
In the meantime, growing worries about a deeper global economic downturn overshadow the optimism led by the easing of COVID-19 restrictions in China. This is evident from the prevalent cautious mood around the equity markets and should continue to lend some support to the safe haven Gold price. Traders, however, might refrain from placing aggressive bets and prefer to move to the sidelines in the absence of any major market-moving US macro data.
Gold price technical outlook
From a technical perspective, repeated failures to find acceptance or build on the momentum beyond the very important 200-day SMA favours the XAU/USD bears. That said, the emergence of fresh buying on Tuesday warrants some caution before confirming a near-term top for Gold price and positioning for a deeper corrective pullback.
Meanwhile, a subsequent move back above the $1,782-$1,783 horizontal resistance could lift Gold price back to the 200 DMA, closer to the $1,800 mark. The next relevant hurdle is pegged near the $1,810 area, or the multi-month top touched on Monday, above which Gold price seems poised to appreciate further. The momentum could then accelerate towards the $1,830 intermediate hurdle en route to the $1,843-$1,845 supply zone.
On the flip side, the overnight swing low, around the $1,769-$1,768 region, now becomes immediate support to defend ahead of the $1,761-$1,760 horizontal resistance breakpoint. A convincing break below will negate any near-term positive outlook and shift the bias in favour of bearish traders. Gold price might then turn vulnerable to accelerate the fall further towards the $1,738-$1,737 area before dropping to the $1,725 level.
Gold price key levels to watch
- US October Goods and Services Trade Balance came in at -$78.2 billion in October.
- US Dollar Index stays in negative territory at around 105.00.
The United States (US) international goods and services deficit rose by $4 billion to $78.2 billion in October, the data published jointly by the US Census Bureau and the US Bureau of Economic Analysis revealed on Tuesday. This reading came in slightly lower than the market expectation for a deficit of $79.1 billion.
"October exports were $256.6 billion, $1.9 billion less than September exports," the publication further read. "October imports were $334.8 billion, $2.2 billion more than September imports."
Market reaction
This report doesn't seem to be having a noticeable impact on the US Dollar's performance against its rivals. As of writing, the US Dollar Index was down 0.24% on the day at 105.05.
Economists at Brown Brothers Harriman & Co. (BBH) suggest that the recent dovish turn by the Federal Reserve might continue to weigh on the US Dollar, though the fundamental backdrop favours bulls.
Key Quotes:
“DXY is trading near 105.15 but has held on to the bulk of yesterday’s gains. While we still believe the fundamental outlook favors the dollar, we acknowledge that near-term dollar weakness is likely to continue after Powell’s unexpected dovish turn. If the U.S. data continue to come in firm like ISM services, that dovish Fed narrative could start to crack.”
“After Powell’s speech last week, the narrative swung towards dovish. After AHE and services PMI, that narrative is swinging back to hawkish. We imagine there will be some whispers about 75 bp from the Fed next week but we think it will depend in large part on the CPI data out the day before the decision. “
“That said, we think it was a mistake for Powell to take 75 bp off the table last week. WIRP still suggests that a 50 bp hike on December 14 is fully priced in, with only 5% odds of a larger 75 bp move. The swaps market is pricing in a peak policy rate of 5.0% but odds of a higher 5.25% peak have crept back in.”
“Both AHE and core PCE have flat-lined near 5% for most of this year despite falling CPI and PPI readings. We believe that getting core PCE back down to the Fed’s target of 2% will be much more difficult than markets are pricing in. We don't think two more 50 bp hikes will do it, not when the labor market remains so firm and consumption is holding up.”
- EUR/USD regains positive traction amid the emergence of fresh USD selling on Tuesday.
- Expectations for a 50 bps Fed rate hike in December act as a headwind for the greenback.
- The upbeat German Factory Orders data underpin the Euro and offer additional support.
The EUR/USD pair attracts fresh buying on Tuesday and for now, seems to have stalled the previous day's retracement slide from the vicinity of the 1.0600 mark, or its highest level since late June. The pair extends its steady ascent heading into the North American session and hits a fresh daily high, around the 1.0525-1.0530 area in the last hour.
The US Dollar recovery from over a five-month low touched on Monday runs out of steam ahead of the very important 200-day SMA, which, in turn, is seen offering some support to the EUR/USD pair. Rising bets for a relatively smaller 50 bps rate hike in December, to a larger extent, overshadow speculations that the Fed may raise interest rates more than projected. This keeps the US Treasury bond yields depressed, which, along with signs of stability in the equity markets, undermine the safe-haven greenback.
The shared currency, on the other hand, draws additional support from better-than-expected German data, showing that Factory Orders rose 0.8% in October against the 0.2% fall estimated. That said, worries about a deeper economic downturn and diminishing odds for a more aggressive policy tightening by the European Central Bank (ECB) could act as a headwind for the EUR/USD pair. In the absence of any major market-moving economic data, this warrants some caution before placing aggressive bullish bets.
The emergence of some dip-buying on Tuesday, meanwhile, adds credence to the recent breakout through a technically significant 200-day SMA. This, in turn, supports prospects for the resumption of the recent positive trend, which should allow the EUR/USD pair to make a fresh attempt to conquer the 1.0600 mark. Investors, however, might prefer to move to the sidelines ahead of next week's key data/event risks - the US consumer inflation figures, the FOMC decision and the ECB monetary policy meeting.
Technical levels to watch
Dr. Ralph Solveen, Senior Economist at Commerzbank, offer a brief analysis of the upbeat German data releases earlier this Tuesday, which showed that Factory Orders increased by 0.8% in October.
Key Quotes:
“The trend in orders continues to point downwards despite the increase in October. This is also supported by the results of the Ifo survey, in which companies revised their assessment of the demand trend downwards until recently. Obviously, the noticeable interest rate increases by many central banks are increasingly dampening demand for German industrial products.”
“As many companies continue to have a very high order backlog, weaker demand is unlikely to impact production as strongly this time as in previous cycles. However, the trend is still likely to be downward in the coming months, partly because production in the energy-intensive sectors is likely to be cut further due to the sharp rise in energy prices. As a result, manufacturing is likely to contribute to the German economy contracting in the first half of the coming year, even if the risk of a slump triggered by gas rationing has been noticeably reduced.”
Analysts at TD Securities (TDS) offer a brief preview of the Australian GDP report, due on Wednesday, and forecast a 0.7% growth during the third quarter.
Key Quotes:
“TD forecasts Q3 GDP to have grown 0.7% q/q and 6.3% y/y. In terms of the breakdown, we are looking at domestic demand to have ticked up 0.9% q/q, for net exports to subtract 0.5ppts and for inventories to add 0.3ppts. We will watch the savings rate as a guide to see how much more buffer households have to spur future consumption with the long term average hovering around 6% vs 8.7% as of June.”
- GBP/USD attracts some buying near the 200-day SMA, though lacks follow-through.
- The overnight failure near the trend-channel resistance warrants caution for bulls.
- A sustained break below the 1.2100 mark should pave the way for deeper losses.
The GBP/USD pair finds some support near the very important 200-day SMA and stalls the previous day's retracement slide from its highest level since June 17. Spot prices, however, struggle to gain any meaningful traction and seesaw between tepid gains/minor losses around the 1.2200 mark through the mid-European session.
The US Dollar struggles to capitalize on the overnight solid recovery move from over a five-month low and turns out to be a key factor lending support to the GBP/USD pair. That said, expectations that the Fed may raise interest rates more than projected act as a tailwind for the buck. This, along with a bleak outlook for the UK economy, keeps a lid on any meaningful upside for spot prices.
From a technical perspective, the overnight failure near a resistance marked by the top end of over a two-month-old ascending channel could be seen as the first sign of bullish exhaustion. The lack of follow-through selling, however, warrants some caution before confirming that the GBP/USD pair might have formed a near-term top and positioning for any meaningful corrective downfall.
In the meantime, the daily swing low, around the 1.2160-1.2155 area, could act as immediate support ahead of the 200 DMA, currently around the 1.2135 region. This is followed by the 1.2100 mark, which if broken decisively will make the GBP/USD pair vulnerable to weaken further to the 1.2000 psychological mark. The downward trajectory could get extended to the 1.1935-1.1930 horizontal support.
On the flip side, any meaningful intraday positive move might confront hurdle near the 1.2250-1.2255 zone, above which the GBP/USD pair could reclaim the 1.2300 mark. Some follow-through buying should allow bulls to aim back to the multi-month peak, around the 1.2345 area touched on Monday. Spot prices could eventually climb to the trend-channel barrier, currently around the 1.2400 mark.
GBP/USD daily chart
Key levels to watch
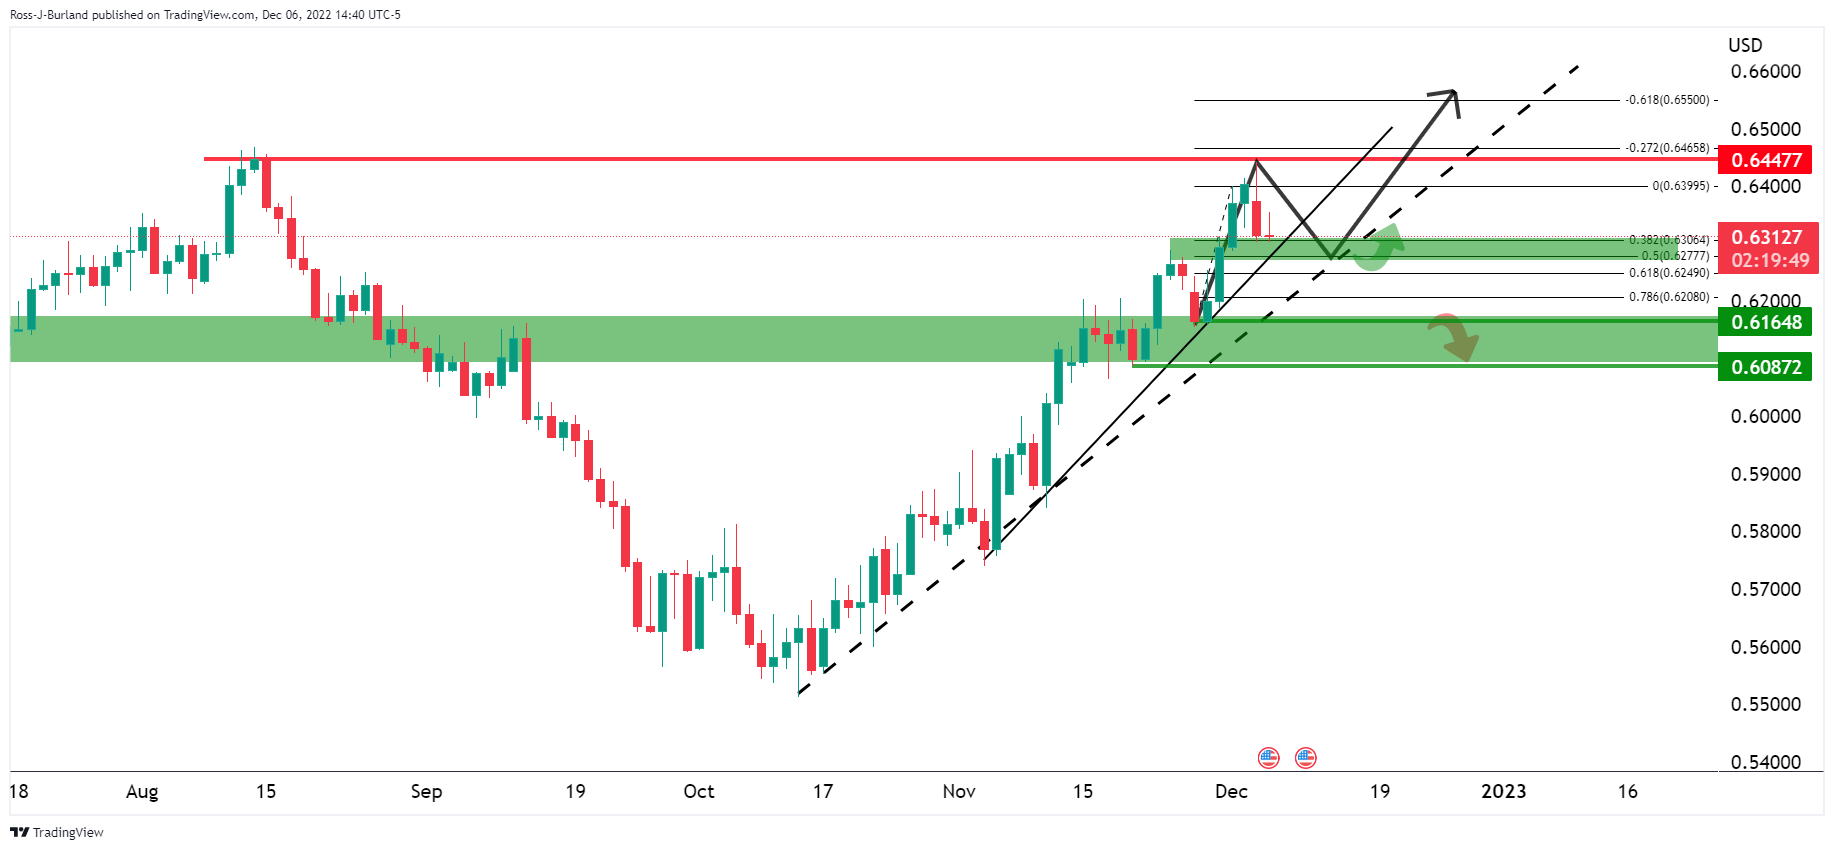
Analysts at Westpac provide their first impressions of New Zealand’s construction sector activity report for the third quarter.
Key quotes
“Construction activity has continued to charge higher, with the amount of building work put in place rising by 3.8% in the September quarter.”
“Underlying September’s rise was a 3.1% lift in residential work and a 4.9% increase in non-residential construction.”
“The result was above our forecast for a 1.1% rise, and was also stronger than the average analyst forecast for only 0.8% growth.”
- AUD/USD regains some positive traction and draws support from a combination of factors.
- The easing of COVID-19 curbs in China and the hawkish RBA lifts the risk-sensitive Aussie.
- Bets that the Fed will continue to hike interest rates underpin the USD and cap the upside.
The AUD/USD pair attracts some buying near the 100-day SMA support on Tuesday and stalls the overnight sharp pullback from its highest level since September 13. The pair maintains its bid tone through the first half of the European session and is currently placed around the 0.6715-0.6720 region, just a few pips below the daily peak.
The latest optimism over the easing of strict COVID-19 curbs in China leads to a modest recovery in the risk sentiment and benefits the risk-sensitive Aussie. Furthermore, the Reserve Bank of Australia (RBA) decided to hike the Official Cash Rate (OCR) by 25 bps and indicated further rate increases over the period ahead. The combination of aforementioned factors offers some support to the AUD/USD pair, though some follow-through US Dollar buying keeps a lid on any further gains.
Against the backdrop of Friday's upbeat US monthly jobs report, the stronger US ISM Services PMI print on Monday suggested that the economy remained resilient despite rising borrowing costs. This, in turn, fuels speculations that the Fed may lift interest rates more than projected and is seen acting as a tailwind for the greenback. That said, firming expectations for a relatively smaller 50 bps Fed rate hike move in December seem to cap the buck, at least for the time being.
Nevertheless, the mixed fundamental backdrop warrants some caution for aggressive traders and before positioning for a firm intraday direction amid a relatively thin US economic docket, featuring the release of Trade Balance data That said, the broader market risk sentiment might still influence the safe-haven USD and produce short-term trading opportunities around the AUD/USD pair.
Technical levels to watch
Constantinos Herodotou, Governor of the Central Bank of Cyprus and member of the European Central Bank (ECB) Governing Council, touched upon the topics of inflation and interest rates in his speech on Tuesday.
Key quotes
“There will be another hike in rates, but we are very near neutral rate.”
“Don't see a "hard landing" in Eurozone economy.”
“No material de-anchoring of inflation expectations. “
Market reaction
These above comments have little to no impact on the Euro, as EUR/USD remains stuck in a narrow range near 1.0500 so far this Tuesday.
Russian Deputy Prime Minister Alexander Novak said on Tuesday, “Russia might reduce oil production, but not by much.”
Additional quotes
“Oil production in Russia in December 2022 will remain at the November level.”
“Introduction of the oil price cap will affect companies, but oil will be in demand on the market.”
“Russia is changing logistics chains for oil, does not see this as a tragedy.”
“Russian mechanism of banning sales of oil subject to the Western price cap should start working before the end of the year.”
Market reaction
WTI was last seen trading flat at $77.50, consolidating the rebound from near $76.75 levels.
Analysts at TD Securities noted that the Reserve Bank of Australia hiked its policy rate by 25 basis points as expected but refrained from signalling a pause in rate increases as anticipated by some forecasts.
RBA views the risks to the upside
"Today's statement offered no suggestion the Bank was considering a pause just yet. It reiterated its forward guidance as it has since the October meeting that "The Board expects to increase interest rates further over the period ahead...."."
"The RBA's decision to retain this segment of its forward guidance was the right course of action. Pre-empting the Q4'22 inflation print and signalling a potential pause in today's Statement would not have stacked up as prudent 'risk management' in our view."
"In today's Statement the Bank removed reference to its Central CPI forecast for 2023. It also removed reference to its central unemployment rate forecast over coming months. In contrast, it reiterated its GDP forecasts for 2023 and 2024."
"The way we are reading these omissions is that a clear source of uncertainty for the RBA comes from the strong labour market and the upside risk to inflation it poses to its 2023 forecasts. For sometime the RBA has telegraphed that Australian wages growth "....remains lower than in many other advanced economies". However this was absent from today's Statement and suggests the RBA views the risks to the upside."
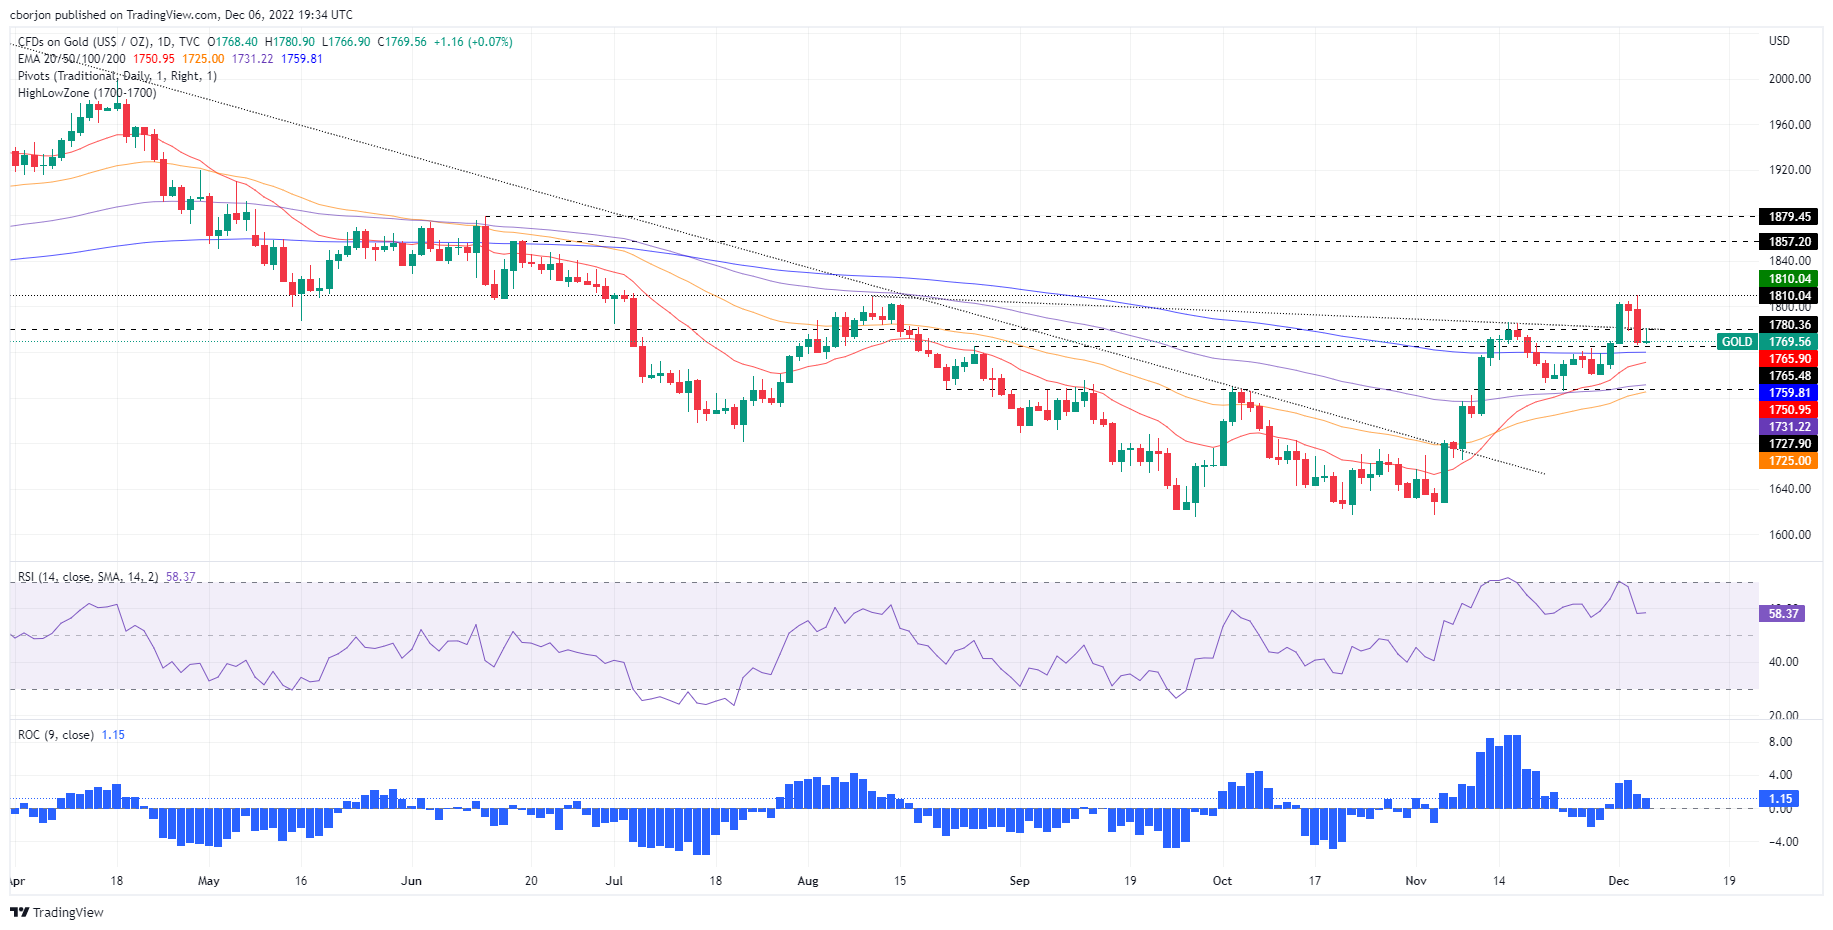
- Gold price licks its wounds around below $1,800 as the US Dollar holds firm.
- Robust US economic data revive hawkish Federal Reserve tightening bets.
- Downside appears more compelling for Gold price after rejection above $1,800.
Gold price is consolidating a two-day downtrend below the $1,800 threshold, as bears gather strength before initiating a fresh leg lower. A quiet calendar is also contributing to the listless performance of Gold price. Meanwhile, investors turn cautious and help underpin the safe-haven demand for the US Dollar, in turn, capping the recovery attempts in the bright metal. The US Dollar continues to capitalize on the recent strong US ISM Services PMI and Factory Orders data, which have renewed expectations of more rate increases from the Federal Reserve (Fed), extending into the next year. However, stalled upside in the US Treasury yields across the curve is allowing Gold price stage a modest comeback. Amid a lack of top-tier US economic data and the Fed’s ‘blackout period’, the broad market sentiment and the Fed rate hike expectations will continue to play a pivotal role in influencing the USD-denominated Gold price.
Also read: Gold Price Forecast: XAU/USD risks further downside on renewed hawkish Federal Reserve view
Gold Price: Key levels to watch
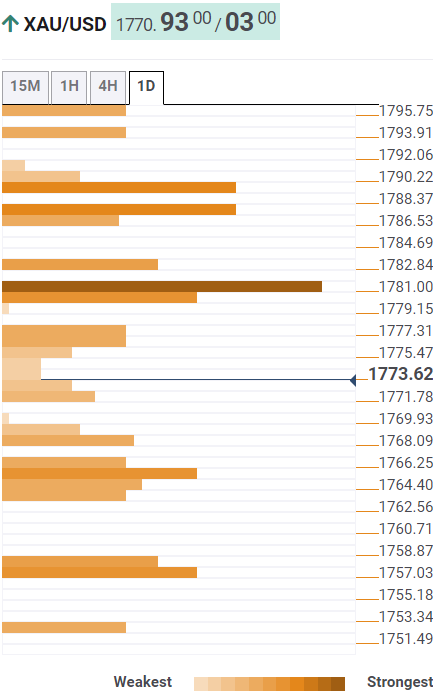
The Technical Confluence Detector shows that the gold price is eyeing a big break to the downside, targeting the initial support at the SMA50 four-hour at $1,768.
The next strong cushion is seen at around $1,765, the convergence of the Fibonacci 61.8% one-week, the previous day’s low and the SMA100 four-hour.
A sharp drop toward the pivot point one-week S1 at $1,758 cannot be ruled out if the abovementioned support fails to hold.
Alternatively, Gold buyers need to find a strong foothold above the confluence of the Fibonacci 23.6% one-day and SMA5 one-day at $1,777.
Further upside will open beyond a break of the Fibonacci 38.2% one-week at $1,781. The next stop for bulls is envisioned at the intersection of the Fibonacci 38.2% one-day and SMA100 one-hour at around $1,783.
Here is how it looks on the tool
About Technical Confluences Detector
The TCD (Technical Confluences Detector) is a tool to locate and point out those price levels where there is a congestion of indicators, moving averages, Fibonacci levels, Pivot Points, etc. If you are a short-term trader, you will find entry points for counter-trend strategies and hunt a few points at a time. If you are a medium-to-long-term trader, this tool will allow you to know in advance the price levels where a medium-to-long-term trend may stop and rest, where to unwind positions, or where to increase your position size.
- USD/JPY touches a three-day high on Tuesday, albeit lacks follow-through or bullish conviction.
- Bets for further policy tightening by the Fed underpin the USD and lends support to the pair.
- BoJ Governor Kuroda's comments on exiting the ultra-loose monetary policy cap the upside.
The USD/JPY pair struggles to capitalize on its modest intraday gains and attracts some sellers in the vicinity of mid-137.00s, or a three-day high touched this Tuesday. Spot prices retreat below the 137.00 mark during the first half of the European session, though the downside seems cushioned amid a modest US Dollar strength.
In fact, the USD Index, which measures the greenback's performance against a basket of currencies, is looking to build on the previous day's solid bounce from over a five-month low and acting as a tailwind for the USD/JPY pair. The incoming strong US macro data suggests that the economy remains resilient despite rising borrowing costs and fuel speculations that the Fed may lift interest rates more than projected. This, in turn, is seen as a key factor lending some support to the greenback.
The Japanese Yen, on the other hand, is undermined by dismal domestic data, showing that Japan's real wage posted its biggest fall in more than seven years in October. That said, Bank of Japan (BoJ) Governor Haruhiko Kuroda's comments on exiting the ultra-loose monetary policy helped limit losses for the JPY. Kuroda also acknowledged the upside risk to inflationary pressures, which, in turn, holds back bulls from placing aggressive bets and caps the USD/JPY pair, at least for the time being.
The aforementioned fundamental factors make it prudent to wait for strong follow-through buying before confirming that spot prices have formed a near-term bottom and positioning for any further gains. In the absence of any major market-moving economic releases from the US, traders will take cues from the USD price dynamics. Apart from this, the broader risk sentiment will influence demand for the safe-haven JPY and further contribute to producing short-term opportunities around the USD/JPY pair.
Technical level to watch
You-Na Park-Heger, an Analyst at Commerzbank, offers his afterthoughts on the Reserve Bank of Australia (RBA) interest rate decision and its impact on the Australian Dollar (AUD).
Key quotes
“The Reserve Bank of Australia (RBA) today raised its key interest rate by 25 bp to 3.1%, as widely expected. It also signaled that further tightening of monetary policy is likely to be forthcoming. Expectations that the RBA would signal a pause were thus not met. In this respect, the decision was somewhat more hawkish than expected.”
“However, the AUD could not really benefit. This is because the accompanying statement supports the basic assessment on the market that the RBA will soon take a break. Whether this comes a tad later than thought should not make too much of a difference for the currency market. In this respect, Australia's monetary policy should continue not to offer much support for the AUD.”
Analysts at Australia and New Zealand (ANZ) Banking Group offer a sneak peek at what to expect from Wednesday’s Australian thrid quarter Gross Domestic Product (GDP) release.
Key quotes
“Key partial indicators released over the past two days have largely netted out, and we are leaving our expectation for Q3 GDP growth unchanged at 0.7% QoQ.”
“Annual GDP growth is forecast to jump up to 6.3%, reflecting the very weak result for Q3 2021 when much of the economy was subject to lockdown. This is a solid result and suggests the economy had quite a bit of momentum in the September quarter in the early stages of monetary policy tightening.”
“While the partial data suggest a solid outturn for GDP, from a policy perspective it will be the inflation and wages indicators in tomorrow’s GDP report that will be key. “
- NZD/USD fails to preserve its modest intraday gains amid some follow-through USD buying.
- Bets that the Fed will continue to raise interest rates offer some support to the greenback.
- The optimism over the easing of restrictions in China limits losses for the risk-sensitive Kiwi.
The NZD/USD pair attracts some intraday selling near the 0.6355 area on Tuesday and drops to the lower end of its daily range during the early European session. The pair is currently trading around the 0.6300 mark, which if broken decisively will set the stage for an extension of the overnight sharp pullback from the highest level since mid-August.
The US Dollar gains some positive traction and looks to build on the overnight solid recovery move from over a five-month low, which, in turn, acts as a headwind for the NZD/USD pair. Against the backdrop of Friday's upbeat US monthly jobs report, the stronger US ISM Services PMI print on Monday suggested that the economy remained resilient despite rising borrowing costs. This fueled speculations that the Fed may lift interest rates more than projected and is seen as a key factor acting as a tailwind for the greenback.
Market participants, however, seem convinced that the US central bank could scale back the pace of its rate-hiking cycle and have been pricing in a relatively smaller 50 bps lift-off in December. Apart from this, the latest optimism over the easing of COVID-19 curbs in China keeps a lid on the safe-haven buck and helps limit the downside for the NZD/USD pair, at least for the time being. The mixed fundamental backdrop warrants some caution for aggressive bearish traders and before confirming that the major has topped out.
Tuesday's relatively thin US economic docket, featuring the release of Trade Balance data, might do little to provide any impetus to the NZD/USD pair. That said, the US Treasury bond yields, along with the market risk sentiment, could influence the USD price dynamics and produce short-term opportunities around the major.
Technical levels to watch
- EUR/USD struggles to capitalize on its intraday uptick amid some buying around the USD.
- The better-than-expected German Factory Orders data also does little to provide impetus.
- The fundamental backdrop supports prospects for some meaningful corrective pullback.
The EUR/USD pair surrenders its modest intraday gains to the 1.0520 area and refreshes the daily low during the early European session. Spot prices remain on the defensive below the 1.0500 psychological mark and move little following the release of better-than-expected German data.
The latest data published by the Federal Statistics Office showed that German Factory Orders rose 0.8% in October against the 0.2% decline estimated and the 4.0% fall recorded in the previous month. The data, however, did little to impress bullish traders or provide any meaningful impetus to the EUR/USD pair amid some follow-through US Dollar buying.
In fact, the USD Index, which measures the greenback's performance against a basket of currencies, is seen building on the overnight bounce from over a five-month low and acts as a headwind for the EUR/USD pair. The incoming stronger US economic data fuels speculations that the Fed may raise interest rates more than projected and offers support to the USD.
Against the backdrop of the upbeat US monthly jobs report released on Friday, the Institute for Supply Management (ISM) reported on Monday that the US Service PMI unexpectedly climbed to 56.5 in November. This points to a resilient US economy, despite rising borrowing costs, and validates expectations that the Fed will continue to tighten its monetary policy.
Furthermore, the recent less hawkish remarks by European Central Bank (ECB) policymakers, backing the case for a 50 bps rate hike in December, favour the EUR/USD bears. That said, it will still be prudent to wait for strong follow-through selling before confirming that spot prices have topped out in the near term amid a relatively thin US economic docket.
Technical levels to watch
Here is what you need to know on Tuesday, December 6:
Following Monday's decisive rebound, the US Dollar Index clings to modest daily gains early Tuesday as investors adopt a cautious stance. The 10-year US Treasury bond yield stays in positive territory at around 3.6% in the European morning and US stock index futures trade flat on the day. October Goods Trade Balance will be the only data featured in the US economic docket later in the day. Ivey November PMI from Canada and the GDT Auction from New Zealand will also be looked upon for fresh impetus.
The data published by the ISM revealed on Monday that the business activity in the US service sector expanded at a strengthening pace in November with the Services PMI rising to 56.5 from 54.4 in October. This reading came in better than the market expectation of 53.1 and helped the US Dollar outperform its rivals in the second half of the day. Nevertheless, the CEM Group's FedWatch Tool shows that markets are still pricing in a nearly 80% probability of a 50 basis points (bps) Fed rate hike in December.
During the Asian trading hours, the Reserve Bank of Australia (RBA) announced that it hiked its policy rate by 25 bps to 3.1% as expected. In its policy statement, the RBA noted that policymakers expect to continue to raise rates. Regarding the price developments, the RBA further noted that inflation is forecast to increase over the months ahead. Following Monday's sharp decline, AUD/USD managed to stage a rebound and was last seen trading in positive territory above 0.6700.
Breaking: RBA hikes OCR by 25 bps to 3.10% in December.
Pressured by the renewed US Dollar strength and the risk-averse market atmosphere, EUR/USD ended the day in negative territory below 1.0500 on Monday. The pair stays relatively quiet near Monday's closing level early Tuesday. The data from Germany revealed that Factory Orders rose by 0.8% in October, beating the market expectation for a decrease of 0.2%.
GBP/USD lost more than 50 pips on Monday and seems to have gone into a consolidation phase at around 1.2200 in the European morning on Tuesday. S&P Global Construction PMI will be featured in the UK economic docket but it's unlikely to have a significant impact on the Pound Sterling's performance against its rivals.
With the 10-year US T-bond yield gaining more than 2% on Monday, Gold price turned south and erased a large portion of last week's gains. At the time of press, XAU/USD was moving sideways at around $1,770.
USD/JPY gained more than 100 pips on Monday and continued to push higher in the Asian session on Tuesday. The pair was last seen rising 0.5% on the day at 137.35. Earlier in the day, Bank of Japan (BoJ) Governor Haruhiko Kuroda explained that they will consider exiting the ultra-loose policy once the 2% inflation target is consistently met.
Bitcoin struggled to gain traction on Monday and registered small daily losses. BTC/USD continues to move sideways near $17,000 early Tuesday. Ethereum fell more than 1% on Monday and was last seen consolidating its losses at around $1,250.
- German Factory Orders rebounded 0.8% MoM in October vs. -0.2% expected.
- German Factory output decreased 3.2% YoY in October vs. -7.5% expected.
- EUR/USD keeps its range near 1.0480 despite the upbeat German data.
The German Factory Orders surprised markets to the upside in October, suggesting that the manufacturing sector activity is staging a modest recovery.
Contracts for goods ‘Made in Germany’ jumped 0.8% on the month vs. -0.2% expected and -4.0% last, the latest data published by the Federal Statistics Office showed on Tuesday.
On an annualized basis, Germany’s Industrial Orders arrived at -3.2% in the reported month vs. -7.5% expected and -10.8% previous.
FX implications
The shared currency remains unimpressed by the encouraging German factory data. At the time of writing, EUR/USD is losing 0.09% on the day, trading at 1.0482.
- USD/CAD struggles for a firm intraday direction and remains confined in a range on Tuesday.
- A modest uptick in crude oil prices underpins the Loonie and acts as a headwind for the pair.
- The downside remains cushioned amid the emergence of some buying around the US Dollar.
The USD/CAD pair oscillates in a narrow band on Tuesday and consolidates the overnight strong rally of around 220 pips from sub-1.3400 levels. The pair holds steady near a one-week high through the early European session, with bulls now awaiting a sustained strength beyond the 1.3600 round-figure mark.
Crude oil prices edge high and recover a part of the previous day's slump of nearly 6.5% amid hopes for a recovery in fuel demand amid the easing of COVID-19 curbs in China. This, in turn, underpins the commodity-linked Loonie and acts as a headwind for the USD/CAD pair. The downside, however, remains cushioned amid the emergence of some US Dollar buying, bolstered by bets that the Federal Reserve may raise interest rates more than projected.
The Institute for Supply Management (ISM) reported that the US Service PMI unexpectedly increased to 56.5 in November from 54.4 in the previous month. This comes on the back of the upbeat US monthly jobs report released on Friday and suggests that the economy remained resilient despite rising borrowing costs. The incoming strong US macro data validates Fed Chair Jerome Powell's forecast that the peak interest rate will be higher than expected.
The mixed fundamental backdrop, meanwhile, warrants some caution before placing aggressive directional bets around the USD/CAD pair. Traders might also prefer to move to the sidelines and await the latest monetary policy update by the Bank of Canada (BoC) on Wednesday. In the meantime, traders on Tuesday might take cues from the release of Trade Balance data from the US and Canada. Apart from this, the USD and oil price dynamics should provide some impetus.
Technical levels to watch
- GBP/JPY picks up bids to challenge six-week-old resistance.
- Cautious optimism underpins recovery moves amid sluggish session.
- BOE hawks, indecision surrounding BOJ’s next move favor pair buyers.
GBP/JPY prints 0.30% intraday gains as it pokes a multi-day-old resistance line surrounding $167.60 heading into Tuesday’s European session.
In doing so, the cross-currency pair cheers the market’s risk-on mood, as well as sluggish US Treasury bond yields and the indecision over the Bank of Japan’s (BOJ) next moves.
Reuters quotes Takeo Hoshi, an academic with close ties to incumbent central bank policymakers, to mention that the Bank of Japan (BoJ) could do away with its 10-year Japanese government bond (JGB) yield cap in 2023 on increasing odds that inflation and wages will exceed expectations.
Earlier in the day, BOJ’s Kuroda mentioned that Japan has not achieved stable 2% inflation accompanied by wage rises. However, the policymaker also stated, “Once 2% inflation target is consistently met, will consider exiting ultra-loose policy.”
Hence, the BOJ policymaker’s hesitance in accepting tighter monetary policies favors the GBP/JPY buyers. The same could be linked to the recently sluggish US Treasury yields and mildly bid S&P 500 Futures.
It’s worth noting that the British Retail Consortium’s (BRC) Like-For-Like Retail Sales jumped 4.1% YoY in November versus 1.2% prior. Even so, Reuters said, “British consumer spending ticked up last month at a rate that greatly lagged behind inflation, according to surveys on Tuesday that underscored the pressure on household budgets ahead of the Christmas holidays.” On the contrary, the final readings of the UK’s November month S&P Global/CIPS Composite PMI eased to 48.2 versus 48.3 initial forecasts whereas the S&P Global/CIPS Services PMI confirmed the 48.8 flash estimates.
Amid these plays, US stock futures print mild gains and the Treasury bond yields also reverse the early Asian session declines.
Moving on, headlines surrounding the BOJ’s next move and the BOE’s optimism could entertain the GBP/JPY traders amid a light calendar.
Technical analysis
GBP/JPY justifies the last Friday’s rebound from the 100-DMA, around 164.40 by the press time, to lure the bulls. Even so, a downward-sloping resistance line from October 10, close to 167.60 at the latest, restricts the short-term upside of the pair.
That said, steady RSI (14) and sluggish MACD signals, mostly in the red, keep the pair sellers hopeful.
GBP/JPY: Daily chart
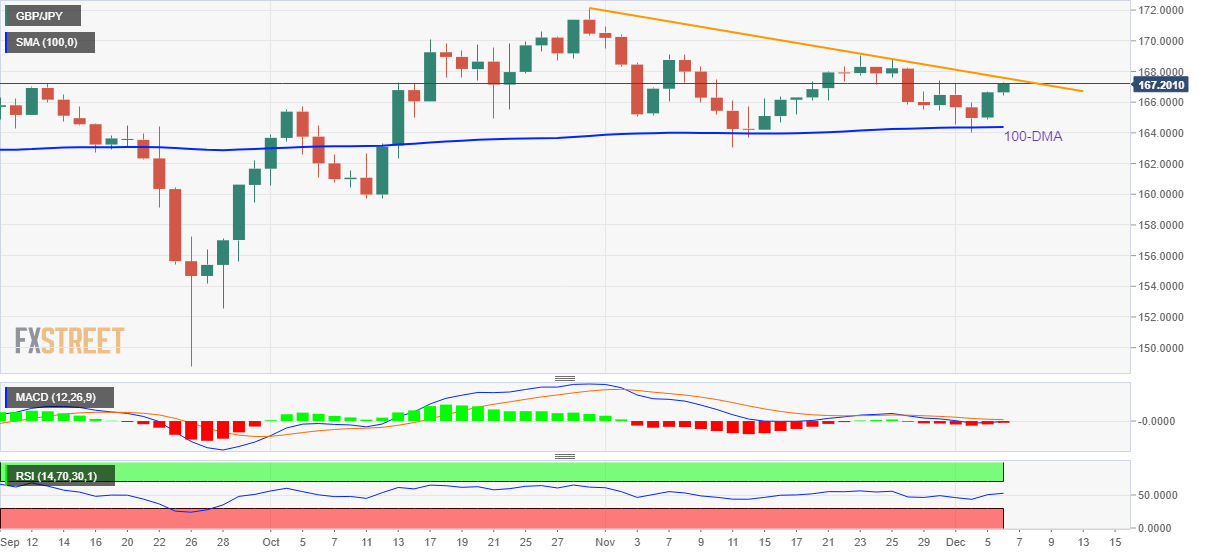
Trend: Further weakness expected
FX option expiries for Dec 6 NY cut at 10:00 Eastern Time, via DTCC, can be found below.
- EUR/USD: EUR amounts
- 1.0325 214m
- 1.0410-15 252m
- 1.0425-35 876m
- 1.0550 787m
- 1.0575 240m
- USD/JPY: USD amounts
- 139.50 370m
- 140.00 1.71b
- USD/CHF: USD amounts
- 0.9375 200m
- 0.9420 365m
- 0.9600 300m
- AUD/USD: AUD amounts
- 0.6700 410m
- 0.6750 292m
- 0.6800 593m
- 0.6820 327m
- USD/CAD: USD amounts
- 1.3615-25 1.04b
- 1.3660 310m
- NZD/USD: NZD amounts
- 0.6370 527m
- EUR/GBP: EUR amounts
- 0.8550 450m
An official at the World Bank offers his outlook on the Indian economy and the Rupee.
Key quotes
"India well placed to navigate global headwinds."
"The impact of global headwinds on India is relatively lower compared to other emerging economies."
"Have no concerns about India's debt sustainability at this stage."
"An unexpected hike by the US fed could lead to rupee depreciation, rise in retail inflation in India."
Also read: USD/INR Price News: Indian Rupee renews monthly low past 82.00 with eyes on RBI
- Silver pares intraday gains after reversing from seven-month high.
- 50-HMA breakdown keeps sellers hopeful but sluggish MACD immediate support line restricts downside moves.
- 200-HMA, nearly descending trend line act as additional trading filters.
Silver price (XAG/USD) retreats to $22.35 heading into Tuesday’s European session. Even so, the bright metal remains mildly bid while consolidating the biggest daily loss in 10 weeks, marked the previous day.
It should be noted that the bullish MACD signals challenge the quote’s downside momentum.
That said, the bullion’s latest losses could be linked to the failure to cross a one-week-old horizontal resistance area surrounding $22.40-45.
However, an upward-sloping trend line from November 29, near $22.25, restricts the immediate downside of the XAG/USD price.
Should the metal breaks immediate support, the 200-HMA level surrounding $21.90, could act as the last defense of the Silver bulls.
On the contrary, an upside break of $22.45 isn’t an open welcome to the XAG/USD buyers as a downward-sloping trend line from Monday restricts immediate upside near $22.55. Also acting as an upside hurdle is the 50-HMA level near $22.75.
To sum up, the Silver price remains sidelined between the 50-HMA and the 200-HMA but the odds favoring upside are higher.
Silver price: Hourly chart
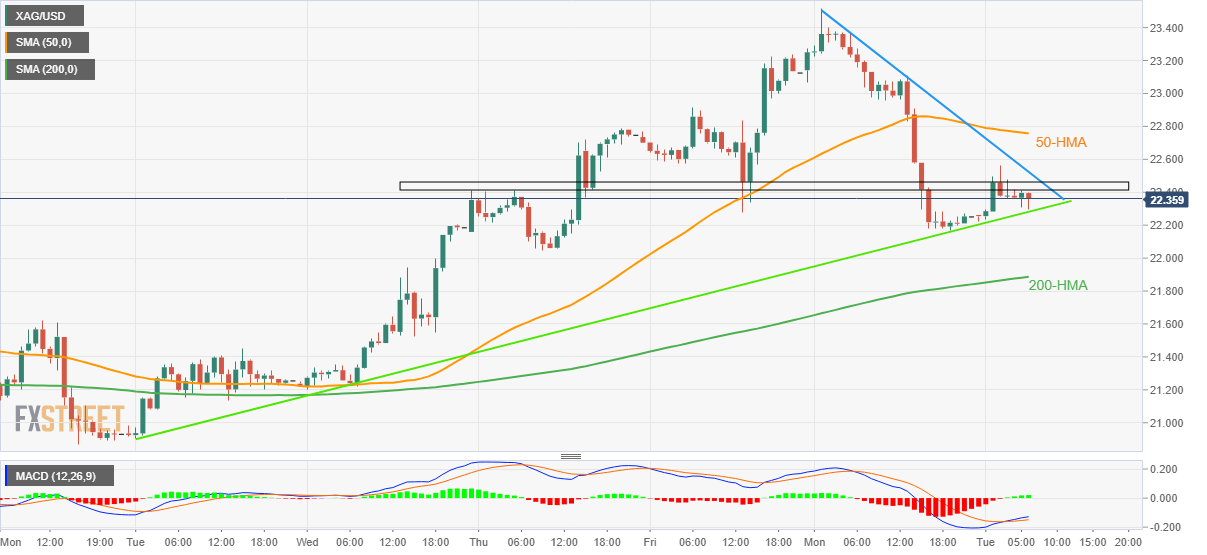
Trend: Limited upside expected
- GBP/USD has surrendered the psychological support of 1.220 amid negative market sentiment.
- The US Dollar is aiming higher as investors are expected that Fed’s interest rate will peak around 5.50-5.75%.
- Upbeat UK consumer spending is going to create more troubles for the BOPE ahead.
The GBP/USD pair surrendered the psychological support of 1.2200 in the early European session. The Cable witnessed selling pressure after failing to extend recovery above 1.2220 displayed in Tokyo. The major is expected to remain in the grip of bears amid a risk-off market mood.
An improvement in safe-haven’s appeal has supported the US Dollar index (DXY) to extend gains to near Monday’s high of around 105.40. Also, the 10-year US Treasury yields have scrolled above 3.59% and are expected to advance further amid rising expectations of a higher interest rate peak by the Federal Reserve (Fed). Meanwhile, S&P500 futures are displaying a lackluster performance showing an inability in recovering losses reported on Monday.
Positive synergy from US Nonfarm Payrolls and US ISM Services PMI data have cemented a higher interest rate peak by the Federal Reserve (Fed). Fed policymakers have already promised for a slowdown in the interest rate hike to reduce financial risks. Therefore, a deceleration in the interest rate hike pace seems solid but a higher interest rate peak cannot be ruled out as the current inflation rate is far from the targeted rate of 2%.
Chicago Fed President Charles Evans said on Friday, "We are probably going to have a slightly higher peak to Fed policy rate even as we slow pace of rate hikes," as reported by Reuters.
As per the CME Fedwatch tool, investors are expecting an interest rate peak around 5.50-5.75% by the end of CY2023.
On the United Kingdom front, upbeat consumer spending data failed to keep reins in the Pound Sterling. Like-For-Like Retail Sales reported by the British Retail Consortium (BRC) escalated to 4.1% from the prior release of 1.2% in November on an annual basis. This might create more troubles for the Bank of England (BOE) as upbeat retail sales cement higher inflation expectations in the near term.
European Central Bank (ECB) Chief Economist Phillip Lane expresses his take on the inflation and interest rate outlooks on Tuesday.
Key quotes
It is unclear if inflation peak has been reached or still to come next year.
Cannot exclude some inflation at the start of next year.
Must take past rate hikes into account when considering next ones.
Expect more rate hikes but "a lot has been done already"
Market reaction
EUR/USD is unfazed by the above comments, keeping its range near 1.0490, down 0.07% on the day.
- AUD/USD snaps two-day downtrend on 0.25% rate hike from Reserve Bank of Australia, signals of further rate hikes.
- Firmer data from United States contrast with inflation expectations and probe US Dollar bulls.
- Hoes of China repealing its Zero-Covid policy also favor Australian Dollar bulls amid the sluggish session.
- Confirmation of rising wedge bearish technical pattern challenge AUD/USD upside.
AUD/USD justifies the Reserve Bank of Australia’s (RBA) hawkish hike as it prints the first daily gains in three around 0.6730 heading into Tuesday’s European session. In doing so, the Aussie pair also cheers the US Dollar’s retreat amid a sluggish day.
Reserve Bank of Australia pushes back policy doves to favor AUD/USD bulls
Reserve Bank of Australia matched market forecasts of announcing 25 basis points (bps) of a rate hike during its seventh consecutive increase in the benchmark rate to 3.10%. It’s worth noting, however, that the RBA hawks managed to keep the reins as the Rate Statement mentioned, “Board expects to increase interest rates further over the period ahead.”
Also read: RBA: Board expects to increase interest rates further over the period ahead
Additionally favoring the AUD/USD bulls could be the RBA statements suggesting, “Australian economy is continuing to grow solidly.” However, the policymaker’s rejection of hawkish moves teases the AUD/USD bears.
It should be noted that hopes of witnessing no rate hikes from early 2023 previously weighed on the AUD/USD prices. The RBA next meets on February 2023.
Recently, Australia's Treasurer Jim Chalmers signaled more hardships for Australian economy and tested the AUD/USD pair buyers.
China-linked optimism underpins Aussie Dollar bulls
Hopes that China would soon dial back its strict Zero-COVID policy seemed to have favored the market’s optimism, as well as the AUD/USD bulls. The reason could be linked to trade between Canberra and Beijing. Reuters quoted an anonymous source to report, “China is set to announce a further easing of some of the world's toughest COVID curbs as early as Wednesday.”
“Management of the disease may be downgraded as soon as January, to the less strict Category B from the current top-level Category A of infectious disease, the sources said on Monday, speaking on condition of anonymity,” said Reuters.
On early Tuesday, Reuters quotes Chinese state media to state that the Beijing Capital International Airport no longer requires a negative COVID-19 test result for entry to terminals, starting from Tuesday.
United State inflation expectations probe hawkish concerns over Federal Reserve
The recent economics from the United States and comments from the Federal Reserve (Fed) officials seemed to have renewed hawkish hopes from the Fed and weighed on the AUD/USD prices. However, the fresh inflation expectations from the US challenge the bearish bias.
US inflation expectations, as per the 10-year and 5-year breakeven inflation rates per the St. Louis Federal Reserve (FRED) data, retreat from a one-month high. The latest prints of the 5-year and 10-year inflation expectations portray a pullback from the one-month high to 2.46% and 2.39% respectively.
On Monday, the market’s hawkish hopes from the Fed bolstered after the US ISM Services PMI rose to 56.5 in November versus 53.1 market forecast and 54.4 previous readings whereas the Factory Orders also registered 1.0% growth compared to 0.7% expected and 0.3% prior. Further, S&P Global Composite PMI improved to 46.4 versus 46.3 initial estimations
It should be noted that the US Nonfarm Payrolls (NFP) surprised markets by rising to 263K versus 200K expected and an upwardly revised prior of 284K while the Unemployment Rate matched market forecasts and prior readings of 3.7% for November. Following the upbeat data, Chicago Fed President Charles Evans said, "We are probably going to have a slightly higher peak to Fed policy rate even as we slow pace of rate hikes.”
Moving on, positive sentiment surrounding China and the RBA’s latest hawkish move can please AUD/USD bulls. However, the technical analysis signals something else and makes it interesting together with a light calendar and an absence of Federal Reserve (Fed) talks ahead of December Federal Open Market Committee (FOMC).
AUD/USD technical analysis
Despite the AUD/USD pair’s latest rebound, the Aussie pair remains on the bear’s radar as it confirmed the rising wedge bearish chart pattern the previous day.
Also keeping the sellers hopeful are the bearish signals from the Moving Average Convergence and Divergence (MACD) indicator and the normal conditions suggesting a further extension of the downbeat moves by the Relative Strength Index (RSI) line, placed at 14.
Hence, the AUD/USD bears remain hopeful unless the quote stays below the stated wedge’s support line near 0.6855. Even if the quote crosses the 0.6740 hurdle, the upper line of the bearish chart pattern, close to 0.6855 at the latest, could challenge the upside moves.
Alternatively, the 200-bar Simple Moving Average (SMA) level surrounding 0.6580 appears the immediate support for the pair bears to watch ahead of an upward-sloping support line from October 13, around 0.6415 by the press time.
AUD/USD: Four-hour chart
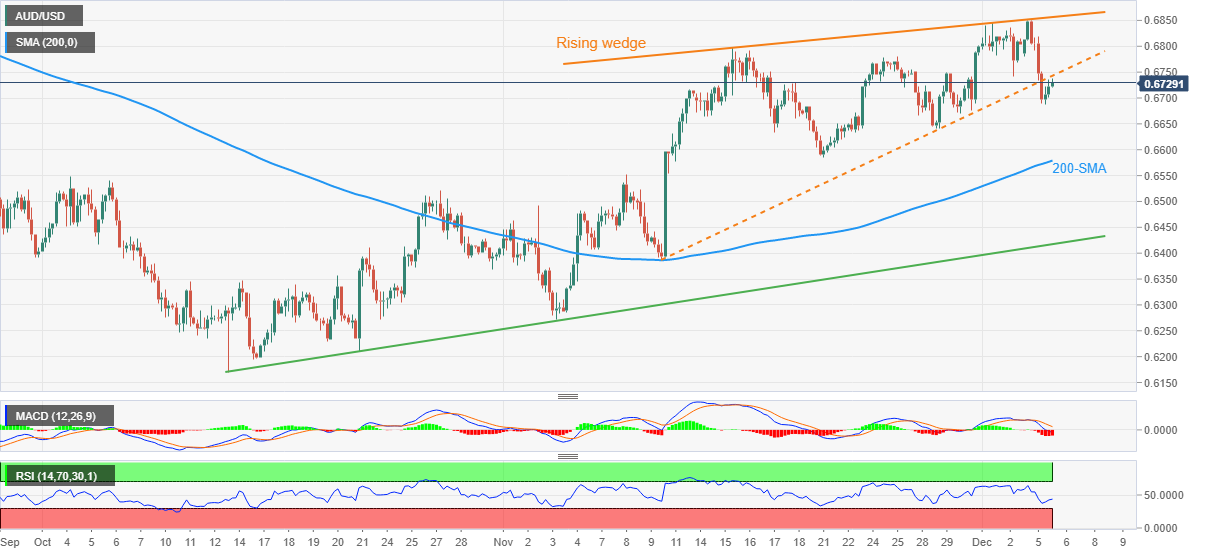
Trend: Further downside expected
- USD/JPY has extended its recovery to near 137.00 amid a downbeat market mood.
- Positive de-anchored inflation expectations could force the Fed for extreme policy tightening measures.
- Contraction in Japan’s GDP may compel more policy easing by the BOJ.
The USD/JPY pair has extended its upside move to near 137.00 after sustaining above the critical hurdle of 136.00 in the Tokyo session. The asset is witnessing time correction after printing the day’s high at 137.17. The major is expected to deliver more gains ahead amid a risk-off market mood.
Meanwhile, the US Dollar Index (DXY) is gathering momentum to test Friday’s high around 105.60. The US Dollar is expected to remain solid amid rising expectations for a higher interest rate peak by the Federal Reserve (Fed). Also, the risk aversion theme is supporting the US Treasury yields for further gains. The 10-year US Treasury yields are oscillating around 3.59%.
A stellar recovery in US Nonfarm Payrolls (NFP) and ISM Services PMI data are clarifying that the United States economy is healthy in spite of displaying slowdown signs. The Federal Reserve (Fed) has been escalating interest rates to bring a slowdown in the economy so that inflation could come down. Upbeat US data has screwed the efforts of Fed chair Jerome Powell and has also faded expectations of a deceleration in the current rate hike pace by the Fed.
This week, investors will keep an eye on five-year Consumer Inflation Expectations data, which will release on Friday. Positive de-anchored inflation expectations could force the Fed to look for extreme policy tightening measures to curtail the same.
On the Japanese yen front, the market participants are awaiting the release of Friday’s Gross Domestic Product (GDP) data. On an annualized basis, Japan’s GDP is expected to contract by 1.1% against the prior contraction of 1.2%. Also, the quarterly data is expected to contract by 0.3%, similar to the prior print. A contraction in Japan’s GDP may compel more policy easing by the Bank of Japan (BOJ).
- EUR/USD remains sidelined after taking a U-turn from the highest levels since late June.
- US Dollar struggles to extend the previous day’s rebound from five-month low.
- US inflation expectations challenge Fed hawks but firmer data keeps pair bears hopeful.
- Downbeat EU data fails to justify hawkish hopes from the ECB and weigh on prices.
EUR/USD treads water around 1.0500, struggling to extend the previous day’s pullback from a multi-day top, as traders await more clues during early Tuesday morning in Europe.
The major currency pair rallied to the highest levels since June 28 before reversing from 1.0594 the previous day. The bearish bias seemed to have taken clues from the downbeat data from Eurozone, as well as firmer US statistics.
Even so, the recent retreat in the US inflation expectations from a one-month high, per the St. Louis Federal Reserve (FRED) data, from a one-month high challenge the recently hawkish bias over the US Federal Reserve’s (Fed) next move. The latest prints of the 5-year and 10-year inflation expectations portray a pullback from the one-month high to 2.46% and 2.39% respectively. Also likely to have challenged the EUR/USD bears could be the market’s cautious optimism amid talks of China’s likely removal of the Zero-Covid policy.
On Monday, Eurozone Retail Sales dropped more than -2.6% YoY forecasts and 0.0% (revised up) prior readings to -2.7% yearly figures for October. Further, the bloc’s S&P Global Services PMI eased to 48.5 in November versus 48.6 initial forecasts but the Composite PMI confirmed 48.7 flash predictions. It’s worth noting, however, that Germany’s S&P Global/BME Composite PMI declined to 46.3 from 46.4 previous forecasts while the Services PMI dropped to 46.1 versus 46.4 initial forecasts.
Alternatively, US ISM Services PMI rose to 56.5 in November versus 53.1 market forecast and 54.4 previous readings whereas the Factory Orders also registered 1.0% growth compared to 0.7% expected and 0.3% prior. Further, S&P Global Composite PMI improved to 46.4 versus 46.3 initial estimations while the Services counterpart rose to 46.2 compared to 46.1 flash forecasts.
It should be noted that the US Nonfarm Payrolls (NFP) surprised markets by rising to 263K versus 200K expected and an upwardly revised prior of 284K while the Unemployment Rate matched market forecasts and prior readings of 3.7% for November. Following the upbeat data, Chicago Fed President Charles Evans said, "We are probably going to have a slightly higher peak to Fed policy rate even as we slow pace of rate hikes.”
At home, the Europen Central Bank board members François Villeroy de Galhau and Gabriel Makhlouf both favored a 50 basis point hike to the benchmark rate on December 15. Further, ECB board member and Bank of Portugal Governor Mario Centeno said on Monday that the inflation peak may be reached in the fourth quarter of this year. On the contrary, France's Finance Minister Bruno Le Maire said that the “inflation peak is not yet over, will last for some months.” Additionally, ECB Vice-President Luis de Guindos mentioned that the central bank needs to avoid "M-shaped evolution of inflation". The policymaker also stated that the economic deceleration is not as deep as expected.
While portraying the mood, S&P 500 Futures print 0.20% intraday gains around 4,011 while snapping a three-day downtrend. That said, the US 10-year Treasury bond yields fade the bounce off an 11-week low marked the last Friday, down three basis points (bps) to 3.56% by the press time.
Looking forward, German Factory Orders for October precede the US Goods Trade Balance for the said month to populate the economic calendar. However, major moves aren’t expected amid the pre-Fed blackout of policymakers.
Technical analysis
EUR/USD remains sidelined unless breaking the area comprising the one-week-old previous support line near 1.0550 and three-week-long horizontal support area surrounding 1.0480.
- NZD/USD has faced hurdles while reclaiming the immediate hurdle of 0.6350.
- A rebound in the risk-aversion theme has dented demand for risk-sensitive assets.
- Investors are expecting a higher interest rate peak by the Fed to contain price pressures.
The NZD/USD pair has sensed selling pressure while reclaiming the critical hurdle of 0.6350 in the Asian session. Earlier, the Kiwi asset attempted a recovery after dropping to near the round-level support of 0.6300. It seems that the risk aversion theme has regained traction and risk-perceived assets are facing the heat again.
It would be early to call for a fresh downside for now as the asset is expected to turn sideways amid the unavailability of a potential trigger. The US Dollar Index (DXY) has recovered after correcting to near 105.00. The USD Index is hovering around 105.30 and is awaiting a fresh trigger for further guidance.
S&P500 futures bulls are putting efforts into recovering Monday’s losses, however, renewed fears of a higher interest rate peak by the Federal Reserve (Fed) are capping the recovery. Meanwhile, the returns on US Treasury bonds are facing pressure in recovering their morning losses. The 10-year US Treasury yields are hovering marginally below 3.59%.
The release of the stronger US ISM Services PMI data on Monday has created havoc in the market. Federal Reserve (Fed) policymakers are working hard to spurt a slowdown in the economy so that eased demand could weigh pressure on firmer inflation. But a stellar recovery in the service sector has pushed all efforts into vain. The odds of a deceleration in an interest rate hike by the Fed are still solid but investors are expecting a higher interest rate peak to curtail inflationary pressures.
On the New Zealand front, investors awaiting China’s Consumer Price Index (CPI) data, which will release on Friday. The annual CPI is expected to drop vigorously to 1.0% from the prior release of 2.1%. This could force the People’s Bank of China (PBOC) to ease policy further. It is worth noting that New Zealand is one of the leading trading partners of China and monetary easing in China will strengthen New Zealand Dollar.
- Gold price bounces off one-month-old support line to pare the biggest daily loss in 10 weeks.
- US inflation expectations challenge hawkish hopes from Federal Reserve.
- Optimism surrounding China adds strength to XAU/USD recovery.
Gold price (XAU/USD) remains in recovery mode around $1,778 as the US Dollar struggles to keep the week-start upside during early Tuesday. In addition to the greenback’s moves, the technical analysis also favors the bullion buyers to keep the reins even as the markets dwindle pre-Fed blackout of the policymakers.
On Monday, US ISM Services PMI rose to 56.5 in November versus 53.1 market forecast and 54.4 previous readings whereas the Factory Orders also registered 1.0% growth compared to 0.7% expected and 0.3% prior. Further, S&P Global Composite PMI improved to 46.4 versus 46.3 initial estimations while the Services counterpart rose to 46.2 compared to 46.1 flash forecasts.
On Friday, the US Nonfarm Payrolls (NFP) surprised markets by rising to 263K versus 200K expected and an upwardly revised prior of 284K while the Unemployment Rate matched market forecasts and prior readings of 3.7% for November. Following the upbeat data, Chicago Fed President Charles Evans said, "We are probably going to have a slightly higher peak to Fed policy rate even as we slow pace of rate hikes.”
It should, however, be noted that a surprise retreat in the US inflation expectations, as per the 10-year and 5-year breakeven inflation rates per the St. Louis Federal Reserve (FRED) data, from a one-month high challenge the recently hawkish bias over the US Federal Reserve’s (Fed) next move. The latest prints of the 5-year and 10-year inflation expectations portray a pullback from the one-month high to 2.46% and 2.39% respectively.
Elsewhere, hopes that China would soon dial back its strict Zero-COVID policy seemed to have favored the market’s optimism. China is set to announce a further easing of some of the world's toughest COVID curbs as early as Wednesday, Reuters quotes an anonymous source to report.
Against this backdrop, S&P 500 Futures print 0.20% intraday gains around 4,011 while snapping a three-day downtrend. That said, the US 10-year Treasury bond yields fade the bounce off an 11-week low marked the last Friday, down three basis points (bps) to 3.56% by the press time.
Moving on, Gold may witness further recovery amid a likely sluggish day but concerns surrounding China and the Fed appear important for near-term directions.
Gold price technical analysis
Gold reverses the previous day’s U-turn from a six-month-old horizontal resistance, around $1,805-07 as it bounces off an upward-sloping support line from early November, around $1,765 by the press time. Also keeping the buyers hopeful is the steady RSI and sluggish MACD signals.
It should, however, be noted that the 61.8% Fibonacci retracement level of the bullion’s June-September downside, near $1,778, as well as the 200-DMA hurdle surrounding $1,795, also act as upside filters.
Meanwhile, a downside break of the aforementioned support line near $1,765 won’t hesitate to direct the Gold price toward the late November swing low of around $1,721.
During the fall, the tops marked during September and October, around $1,735 and $1,730, could act as an intermediate halt.
Overall, Gold is likely to remain firmer but the upside room appears limited.
Gold price: Daily chart
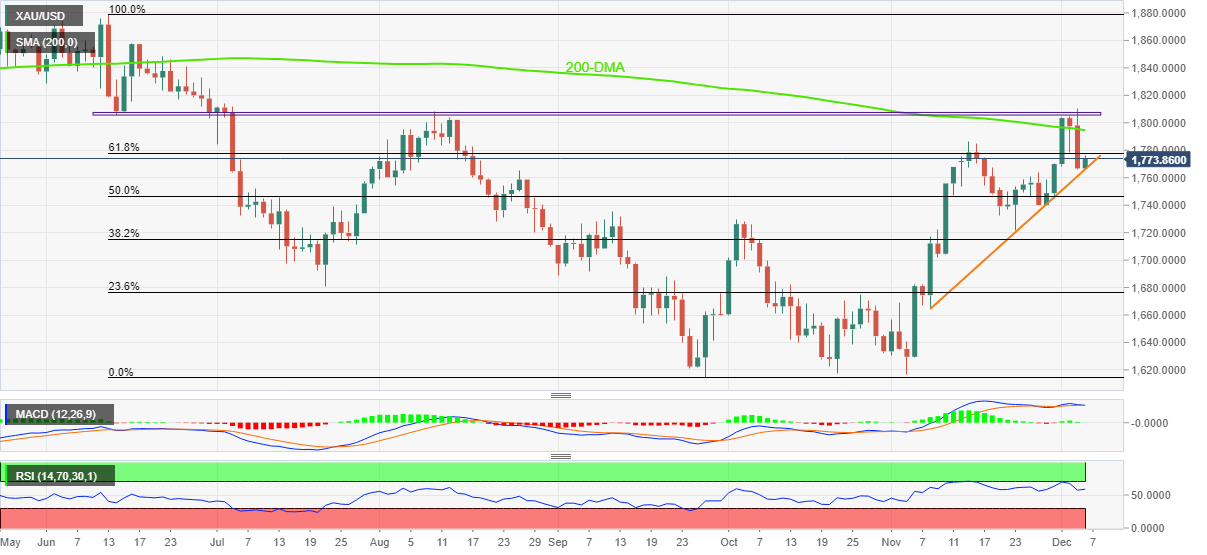
Trend: Further upside expected
Australia's Treasurer Jim Chalmers said on Tuesday, the “full impact of rate rises still to be felt in the Australian economy.”
"The economy is expected to soften next year and growth is expected to slow as a consequence of higher interest rates as well as the downturn in the global economy,” Chalmers added.
Also read: RBA hikes OCR by 25 bps to 3.10% in December
Market reaction
AUD/USD is preserving gains above 0.6700, induced by the hawkish RBA rate hike decision. The pair was last seen trading at 0.6732, adding 0.55% on the day.
- Asian indices maintained harmony despite the sell-off in the US markets.
- Easing Covid-19 lockdown measures in China have strengthened respective indices.
- The oil price has turned sideways after a bloodbath amid renewed fears of extreme policy tightening by the Fed.
Markets in the Asian domain are trading positively despite intense volatility in the European and the United States markets on Monday. Asian equities are defending the risk aversion theme inspired by renewed fears of a bigger rate hike by the Federal Reserve (Fed) in its monetary policy meeting next week. Meanwhile, S&P500 futures have attempted a recovery in Tokyo session after plunging on Monday.
At the press time, Japan’s Nikkei225 added 0.30%, ChinaA50 jumped 1.27%, Hang Seng dropped 0.90%, and Nifty eased 0.55%.
Equities in the United States faced immense pressure after the release of the solid US ISM Services PMI as it indicated that the US economy is healthy, demand is robust and the Federal Reserve (Fed) is needed to tighten policy extremely to propel a slowdown. Last week, an upbeat November employment report failed to provide a cushion to the US Dollar Index (DXY). But now, the upbeat service sector has fueled optimism in the US economy.
Chinese equities are aiming higher as easing Covid-19 lockdown measures in various cities has infused optimism. Investors are of the view that the reopening of the dragon economy will force institutions to roll back weak economic projections. Going forward, the market participants will keep an eye on Consumer Price Index (CPI), which will release on
In the Asia-Pacific region, the Reserve Bank of Australia (RBA) has hiked its Official Cash Rate (OCR) by 25 basis points (bps) to 3.10%. This is the third consecutive 25 bps rate hike by RBA Governor Philip Lowe.
On the oil front, the oil price has turned sideways in Tokyo after a bloodbath on Monday. Renewed fears of a bumper rate hike by the Fed have resulted in weaker economic projections. A continuation of the current rate hike pace by the Fed would accelerate financial risks ahead. Going forward, Russia’s denial of providing oil at a novel price cap could provide a cushion to oil prices.
- USD/INR picks up bids to refresh multi-day top during three-day uptrend.
- Strong US data, fears surrounding RBI’s rate hike favor buyers.
- Sluggish oil prices, pre-Fed blackout test upside momentum.
USD/INR traders prepare for Wednesday’s Reserve Bank of India (RBI) rate hike as the quote jumps to the one-month high near 82.32 during early Tuesday. In doing so, the Indian Rupee (INR) pair takes clues from the firmer US data, as well as downbeat economic concerns at home.
That said, the RBI is expected to announce a 35 basis point of rate hike, to 6.25%, during Wednesday’s monetary policy meeting. However, Reuters said, “With India's annual inflation remaining sticky, the Reserve Bank of India is likely to raise its key repo rate by another 50 basis points to 6.4% on Wednesday, to decisively demonstrate its inflation-fighting credibility.”
Elsewhere, US Dollar remains on the front foot amid doubts over the Fed’s dovish hike in December, mainly due to the firmer US data.
On Monday, US ISM Services PMI rose to 56.5 in November versus 53.1 market forecast and 54.4 previous readings whereas the Factory Orders also registered 1.0% growth compared to 0.7% expected and 0.3% prior. Further, S&P Global Composite PMI improved to 46.4 versus 46.3 initial estimations while the Services counterpart rose to 46.2 compared to 46.1 flash forecasts. On Friday, the US Nonfarm Payrolls (NFP) surprised markets by rising to 263K versus 200K expected and an upwardly revised prior of 284K while the Unemployment Rate matched market forecasts and prior readings of 3.7% for November. Following the upbeat data, Chicago Fed President Charles Evans said, "We are probably going to have a slightly higher peak to Fed policy rate even as we slow pace of rate hikes.”
Additionally, fears surrounding the Indian economic growth, after multiple research houses cut the nation’s Gross Domestic Product (GDP) forecasts, also favor the USD/INR bulls.
It should be noted that softer oil prices and hawkish hopes from the RBI seem to challenge the pair’s further upside.
Moving on, an absence of major data/events and the pre-RBI anxiety could challenge the USD/INR pair buyers.
Technical analysis
A daily closing beyond the 50-DMA hurdle, now support near 81.90 favors USD/INR bulls to aim for the seven-week-old ascending resistance line near 82.70.
USD/INR: Daily chart

Trend: Further upside expected
- AUD/JPY jumped 30+ pips as RBA announced 0.25% rate hike and expects further lifts in the key rates.
- Cautious optimism in the market also underpins the bullish bias.
- Chatters surrounding the BOJ’ monetary policy tightening challenge upside moves.
AUD/JPY rose over 30 pips on the Reserve Bank of Australia’s (RBA) 0.25% interest rate hike during early Tuesday. In addition to the rate lift, the hawkish comments from the RBA Rate Statement also seemed to have propelled the AUD/JPY prices of late.
RBA matched market forecasts of announcing 25 basis points (bps) of a rate hike but tamed bears expecting a pause in the Aussie central bank’s hawkish moves during early 2023.
Also read: RBA: Board expects to increase interest rates further over the period ahead
The AUD/JPY pair also cheered the market’s firmer sentiment, due to its risk-barometer status. However, recent talks over the Bank of Japan’s (BOJ) exit from the easy money policies seemed to have probed the pair.
That said, Reuters quotes Takeo Hoshi, an academic with close ties to incumbent central bank policymakers, to mention that the Bank of Japan (BoJ) could do away with its 10-year Japanese government bond (JGB) yield cap in 2023 on increasing odds that inflation and wages will exceed expectations. Earlier in the day, BOJ’s Kuroda mentioned that Japan has not achieved stable 2% inflation accompanied by wage rises. However, the policymaker also stated, “Once the 2% inflation target is consistently met, will consider exiting ultra-loose policy.”
The risk-on mood could be linked to the doubts over the Fed’s hawkish play amid the recent retreat in the US inflation expectations, as well as optimism surrounding China’s Covid conditions.
While portraying the mood, S&P 500 Futures print 0.20% intraday gains around 4,011 while snapping a three-day downtrend. That said, the US 10-year Treasury bond yields fade the bounce off an 11-week low marked the last Friday, down three basis points (bps) to 3.56% by the press time.
Looking forward, an absence of major data/events could challenge the AUD/JPY pair buyers as BOJ hawks seem to flex their muscles.
Technical analysis
A clear upside break of the 200-DMA hurdle, close to 93.00 at the latest, becomes necessary for the AUD/JPY bulls to keep the reins.
- The pound Sterling has picked demand on ease in risk-off mood and firmer Like-For-Like Retail Sales data.
- A loss in upside momentum resulted in a sell-off in Cable.
- A bear cross, represented by the 20-and 50-period EMAs at 1.2230, adds to the downside filters.
The GBP/USD pair has extended its recovery above the psychological resistance of 1.2200 in the Tokyo session. The Cable picked reversal after dropping to near 1.2167 as the risk-off impulse has trimmed marginally. Apart from that, upbeat Like-For-Like Retail Sales by the British Retail Consortium (BRC) have supported Pound Sterling.
Meanwhile, the US Dollar Index (DXY) is putting efforts into sustaining above the round-level cushion of 105.00. The 10-year US Treasury yields have sensed selling pressure after printing a high of 3.59%.
On an hourly scale, Cable has witnessed selling pressure from market participants after failing to keep the upside momentum intact. The asset was making higher highs while the momentum oscillator, Relative Strength Index (RSI) (14), formed a lower high on Monday. A loss in the upside momentum forced investors to book longs.
A bear cross, represented by the 20-and 50-period Exponential Moving Averages (EMAs) at 1.2230, adds to the downside filters.
Meanwhile, the RSI (14) is hovering around 40.00. A slippage inside the bearish range of 20.00-40.00 will trigger a bearish momentum.
Going forward, a decline below Friday’s low at 1.2134 will drag the Cable toward the psychological resistance at 1.2000, followed by the 20-EMA around 1.1971.
On the flip side, a break above Monday’s high at 1.2345 will drive the Cable toward June 16 high of around 1.2400. A breach of the latter will send the major toward June 1 low at 1.2460.
GBP/USD hourly chart
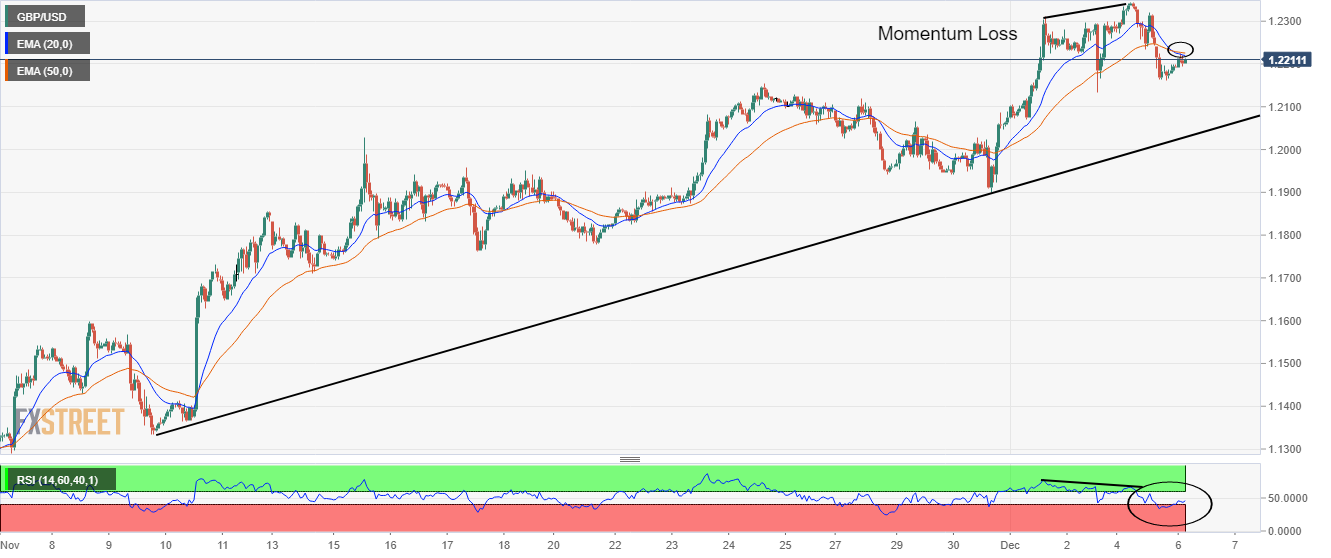
- AUD/USD has inched higher towards 0.6730 after the RBA hiked interest rates by 25 bps to 3.10%.
- This is the third consecutive 25 bps rate hike by the RBA to trim inflationary pressures.
- Upbeat US Services PMI data brought a significant recovery in the US Dollar.
The AUD/USD pair has tested its day’s high at 0.6730 as the Reserve Bank of Australia (RBA) has hiked its Official Cash Rate (OCR) by 25 basis points (bps). This is the third consecutive 25 bps rate hike by RBA Governor Philip Lowe, which has pushed its OCR to 3.10%. The decision has remained in line with the expectations.
Economists at UOB Group cited that “We are penciling in another 25 basis points (bps) hike at the final monetary policy meeting of the year on 6 Dec, which will take the OCR to 3.10%. This would be the third consecutive 25 bps rate hike by the RBA.
The market participants were expecting a continuation of the 25 bps rate hike spell despite a decline in the Australian Consumer Price Index (CPI) in October. The October CPI report showed a decline in the inflation rate to 6.9% from the prior release of 7.3%. This indicated that tight monetary policy is performing its job but the current inflation rate is quite far from the targeted rate of 2%, therefore continuation of the interest rate hike is necessary.
Meanwhile, a cautiously optimistic market mood has pushed the risk-perceived assets on the edge. Stellar numbers from US ISM Services PMI released on Monday triggered a sell-off in risk-sensitive assets. Escalating bets for a risk-aversion theme brought a smart recovery in the US Dollar Index (DXY). At the press time, the USD Index is struggling to hold itself above the critical hurdle of 105.20.
A stronger-than-projected US Services PMI refreshed fears of a bigger rate hike by the Federal Reserve (Fed) as robust demand for services could be curtailed by severe policy tightening measures. Fed policymakers promised in prior monetary policy meetings to favor for a slowdown in the interest rate hike pace to safeguard the economy from financial risks. Attainment of price stability at a cost of crashing the economy is not an optimal way.
Following are the key headlines from the December RBA monetary policy statement, via Reuters, as presented by Governor Phillip Lowe.
Board resolute in determination to return inflation to target, will do what is necessary to achieve that.
Board expects to increase interest rates further over the period ahead.
Inflation in australia is too high.
Board closely monitoring the global economy, household spending and wage and price-setting behaviour.
Size and timing of future increases determined by data and outlook for inflation and labour market.
A further increase in inflation is expected over the months ahead.
Australian economy is continuing to grow solidly.
Board is not on a pre-set course.
Labor market remains very tight.
Household spending is expected to slow over the period ahead.
Path to achieving the needed decline in inflation and achieving a soft landing for the economy remains a narrow one.
Board’s priority is to re-establish low inflation and return inflation to the 2–3 per cent range over time.
-
AUD/USD retests day’s high near 0.6730 as RBA hikes interest rate by 25 bps
About RBA rate decision
RBA Interest Rate Decision is announced by the Reserve Bank of Australia. If the RBA is hawkish about the inflationary outlook of the economy and rises the interest rates it is positive, or bullish, for the AUD. Likewise, if the RBA has a dovish view on the Australian economy and keeps the ongoing interest rate, or cuts the interest rate it is seen as negative, or bearish.
At its December 6 monetary policy meeting, the Reserve Bank of Australia (RBA) board members decided to raise its official cash rate (OCR) by another 25 basis points (bps) from 2.85% to 3.10%, as widely expected.
Tuesday’s rate hike decision marked the third straight quarter percentage point increase by the RBA, summing up to a total of 300 bps in rate increases in eight months.
According to the latest Reuters poll, the median expectation is for a 3.60% terminal rate.
AUD/USD reaction
In an immediate reaction to the RBA decision, the AUD/USD pair jumped nearly 15 pips to 0.6730. At the time of writing, the aussie is up 0.37% on the day, trading at 0.6721.
About RBA rate decision
RBA Interest Rate Decision is announced by the Reserve Bank of Australia. If the RBA is hawkish about the inflationary outlook of the economy and rises the interest rates it is positive, or bullish, for the AUD. Likewise, if the RBA has a dovish view on the Australian economy and keeps the ongoing interest rate, or cuts the interest rate it is seen as negative, or bearish.
- EUR/USD remains pressured after reversing from five-month high, retreats from intraday high of late.
- Clear downside break of one-week-old ascending trend line, bearish MACD signals favor sellers.
- Double tops near 1.0480 precede 100-SMA to challenge bears.
EUR/USD pares intraday gains around 1.0500 during early Tuesday, fading the bounce off three-week-old horizontal support.
In doing so, the major currency pair also justifies the bearish MACD signals and the previous day’s downside break of the weekly support line, now resistance near 1.0550.
However, the double tops surrounding 1.0480 challenge the EUR/USD pair’s latest weakness. Also acting as a downside filter is the 100-SMA level surrounding 1.0385.
Should the quote stay bearish past 1.0385, the odds of witnessing a slump toward the 200-SMA level surrounding 1.0385 can’t be ruled out, which in turn holds the key for the bear’s dominance.
On the contrary, recovery moves need to stay firmer beyond the previous support line, close to 1.0550.
Even so, an ascending trend line from early November, near 1.0635 at the latest, could challenge the EUR/USD bulls.
It should be noted that the EUR/USD pair’s successful run-up beyond 1.0635 won’t hesitate to challenge the mid-2022 peak surrounding 1.0785.
Overall, EUR/USD is likely to witness a pullback unless crossing the 1.0635 hurdle. Though, the buyers could remain hopeful beyond 1.0385.
EUR/USD: Four-hour chart
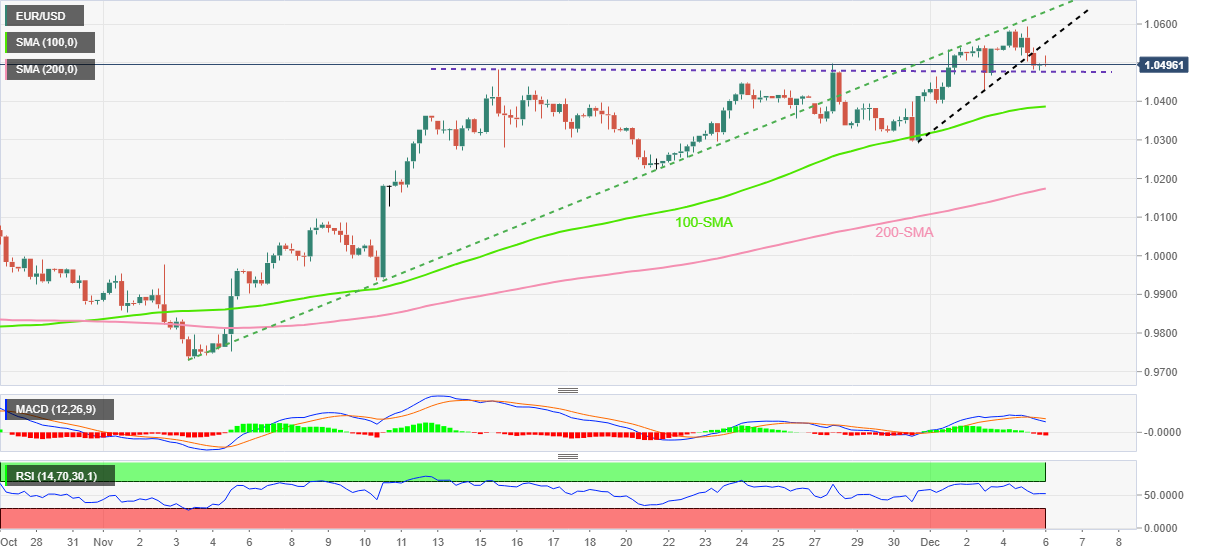
Trend: Further downside expected
After announcing consecutive seven rate increases, the Reserve Bank of Australia (RBA) is up for another hawkish monetary policy outcome, despite teasing doves of late, during the scheduled Interest Rate Decision around 03:30 AM GMT on Tuesday.
The RBA is expected to slow down on the rate hike trajectory by lifting the benchmark interest rate by 25 basis points (bps) to 3.10%, mainly to fight inflation and match the tune with other major central banks. Given the recently dovish remarks by the RBA officials, the AUD/USD traders will be more interested in hearing about the end of the rate hike trajectory.
Ahead of the event Westpac said,
The RBA, in responding to a significant inflation challenge and the tightest labor market in 50 years, has quickly raised interest rates. Rates have lifted from a record low of 0.1% at the start of May, with moves at each monthly Board meeting, including 50bps hikes for the four meetings from July to September. The RBA slowed the pace of tightening at the October meeting, back to 25bp increments, with that policy arguably moving into the contractionary zone. Inflation is still too high and more work needs to be done in our view. Annual headline inflation is expected to hit the 8% mark in the December quarter and to still be above the 2–3 target band at the end of 2023 (at about 4%, we expect).
On the same line, FXStreet’s Dhwani Mehta said,
Markets are expecting the RBA to take note of easing inflationary pressures, with all eyes now focused on any changes to this statement - “the Board expects to increase interest rates further over the period ahead.”
How could the RBA decision affect AUD/USD?
AUD/USD picks up bids to renew intraday high around 0.6720 amid the market’s cautious optimism during early Tuesday. The quote’s recent recovery takes clues from headlines suggesting optimism surrounding China’s Covid conditions and recently easy US inflation expectations that challenge the hawkish bias over the Federal Reserve (Fed), especially after Friday’s US jobs report.
As per the latest Aussie data, inflation jumped to a multi-year high but the economic fears also grew as markets remain divided over the central banks’ next moves. The housing market problem also challenges the RBA hawks and dims the bullish bias surrounding the AUD/USD.
It should be noted that RBA Governor Philip Lowe recently stated that the central bank’s decision to downshift reflects monetary policy lags.
That said, a 0.25% rate hike appears already priced in and may offer a knee-jerk reaction, which in turn highlights the pace of bond purchase and the signal for the RBA’s next rate increase as the key catalysts.
Should the RBA shows readiness to pause the rate hike trajectory from the next meeting, scheduled for February, the AUD/USD may have further upside to trace. However, the need for more rate hikes could challenge the Aussie pair buyers.
Technically, a clear downside break of the five-week-old bullish channel keeps AUD/USD bears hopeful unless the quote rises back beyond 0.6760.
Key quotes
Reserve Bank of Australia Preview: Hinting toward an end to its rate hike cycle?
AUD/USD Forecast: Further declines expected on a break below 0.6685
About the RBA interest rate decision
RBA Interest Rate Decision is announced by the Reserve Bank of Australia. If the RBA is hawkish about the inflationary outlook of the economy and rises the interest rates it is positive, or bullish, for the AUD. Likewise, if the RBA has a dovish view of the Australian economy and keeps the ongoing interest rate, or cuts the interest rate it is seen as negative, or bearish.
| Raw materials | Closed | Change, % |
|---|---|---|
| Silver | 22.241 | -3.65 |
| Gold | 1768.63 | -1.46 |
| Palladium | 1874.03 | -1.17 |
- USD/JPY consolidates the biggest daily gains since mid-June.
- Mixed concerns over Fed, BOJ challenge traders amid lack of major data/events.
- Pre-Fed blackout, pullback in US inflation expectations tease bears.
- Inflation woes challenge BOJ’s easy money policies, luring the USD/JPY bears.
USD/JPY fails to extend the week-start bounce off the 200-DMA as it prints mild losses near 136.50 during Tuesday’s Asian session.
That said, the Yen pair’s latest losses could be linked to the chatters surrounding the Bank of Japan’s (BOJ) monetary tightening amid inflation fears. In doing so, the USD/JPY traders pay little to BOJ Governor Haruhiko Kuroda’s defense of the easy money policy.
Reuters quotes Takeo Hoshi, an academic with close ties to incumbent central bank policymakers, to mention that the Bank of Japan (BoJ) could do away with its 10-year Japanese government bond (JGB) yield cap in 2023 on increasing odds that inflation and wages will exceed expectations.
Earlier in the day, BOJ’s Kuroda mentioned that Japan has not achieved stable 2% inflation accompanied by wage rises. However, the policymaker also stated, “Once 2% inflation target is consistently met, will consider exiting ultra-loose policy.”
On the other hand, US inflation expectations, as per the 10-year and 5-year breakeven inflation rates per the St. Louis Federal Reserve (FRED) data, retreat from a one-month high and challenge the recently hawkish bias over the US Federal Reserve’s (Fed) next move. The latest prints of the 5-year and 10-year inflation expectations portray a pullback from the one-month high to 2.46% and 2.39% respectively.
It’s worth mentioning that Friday’s upbeat US data and Fedspeak challenge the dovish calls from the Fed, which in turn test the latest optimism. That said, US ISM Services PMI rose to 56.5 in November versus 53.1 market forecast and 54.4 previous readings whereas the Factory Orders also registered 1.0% growth compared to 0.7% expected and 0.3% prior. Further, S&P Global Composite PMI improved to 46.4 versus 46.3 initial estimations while the Services counterpart rose to 46.2 compared to 46.1 flash forecasts.
On Friday, the US Nonfarm Payrolls (NFP) surprised markets by rising to 263K versus 200K expected and an upwardly revised prior of 284K while the Unemployment Rate matched market forecasts and prior readings of 3.7% for November. Following the upbeat data, Chicago Fed President Charles Evans said, "We are probably going to have a slightly higher peak to Fed policy rate even as we slow pace of rate hikes.”
Elsewhere, optimism surrounding China’s Covid conditions jostles with headlines surrounding Ukraine’s drone attack deep inside Russia.
Amid these plays, S&P 500 Futures print 0.20% intraday gains around 4,011 while snapping a three-day downtrend. That said, the US 10-year Treasury bond yields fade the bounce off an 11-week low marked the last Friday, down three basis points (bps) to 3.56% by the press time.
Moving on, a light calendar can restrict USD/JPY moves but chatters surrounding the BOJ’s exit from the easy money policy could keep bears hopeful.
Technical analysis
A one-month-old descending resistance line restricts immediate USD/JPY upside near 136.80, which in turn directs the pair towards the 200-DMA restrict, close to 134.70 at the latest.
Japanese Finance Minister Shunichi Suzuki said on Tuesday, “it is important for FX to move steadily and reflect fundamentals.”
He added that there is “nothing to comment on daily forex moves.”
Further comments
Will continue to monitor fx market with sense of urgency.
FX rates should be set by market.
No change to stance of responding appropriately to FX moves.
Excess FX volatility, disorderly moves can hurt economy.
Market reaction
USD/JPY is trimming losses to recapture 136.50, as investors digest comments from BoJ Governor Kuroda on exiting ultra-loose monetary policy.
Bank of Japan (BoJ) Governor Haruhiko Kuroda made some comments on exiting its ultra-loose monetary policy during his appearance on Tuesday.
Additional comments
BoJ has acknowledged upside inflationary risks.
Japan likely to see wages rise in next year's wage negotiations reflecting the underlying rise in inflation heightening medium-, and long-term inflation expectations.
Rise in labour productivity likely to lead to higher real wage growth in the long run.
Even if wages rise by 3%, the BoJ will maintain its current easy policy until inflation reaches 2%.
Related reads
- BoJ may abandon yield cap next year as inflation perks up – Reuters
- Gold bulls have eyes on the $1,780s but failures to break through the 50% mean reversion area will be bearish.
- The break of the recent bull trendline support opens risk in a mid-week test of the $1,750s.
Gold price is correcting the moves from the US session in a busy start to the week. XAU/USD is up by some 0.3% following a recovery from the overnight lows that touched below the $1,770s on broad US Dollar strength. Robust economic data reignited the prospect of bigger interest rate hikes by the Federal Reserve.
The US Services industry activity unexpectedly rose in November leading observers to expect that the Federal Reserve may lift interest rates more than recently projected. The Institute for Supply Management (ISM) said its Non-Manufacturing PMI rose to 56.5 last month from 54.4 in October, indicating that the services sector, which accounts for more than two-thirds of US economic activity, remained resilient in the face of rising interest rates. The data beat forecast the Non-manufacturing PMI would fall to 53.1.
There has been a shift in the markets following last Friday's surprisingly strong Nonfarm Payrolls whereby wage growth and consumer spending accelerated the prior months so far in the last quarter of 2022. As a consequence, the market that has been pricing below 5% at around 4.75%-5%, markets are now rethinking this to 4.92% by March of next year and more likely than not into the 5%-5.25% range by May, as per the futures contract prices and the CME Fed watch tool.
Nevertheless, the Fed Chair Jerome Powell said last week that the US central bank could scale back the pace of its rate increases "as soon as December."
Meanwhile, futures contracts tied to the Fed policy rate still imply a 70% chance that central bankers will slow the pace of rate hikes when they meet Dec. 13-14, rather than adding to a string of 75-basis-point rate hikes over the past four meetings.
Elsewhere, several Chinese cities are easing their COVID restrictions in what could be a shift toward gradual reopening as the country nears entering the fourth year of the pandemic had given risk appetite a boost. In recent trade, it was said that Beijing no longer requires tests for entering supermarkets and commercial buildings.
Analysts at TD Securities said that they see signs of buying exhaustion in Gold but a notable consolidation in prices will be needed before CTA trend followers spark renewed outflows. ''At this juncture, positioning risks are no longer tilted to the upside, as a rally north $1,830 only points to marginal CTA buying from current positioning levels,'' the analysts said.
Gold technical analysis
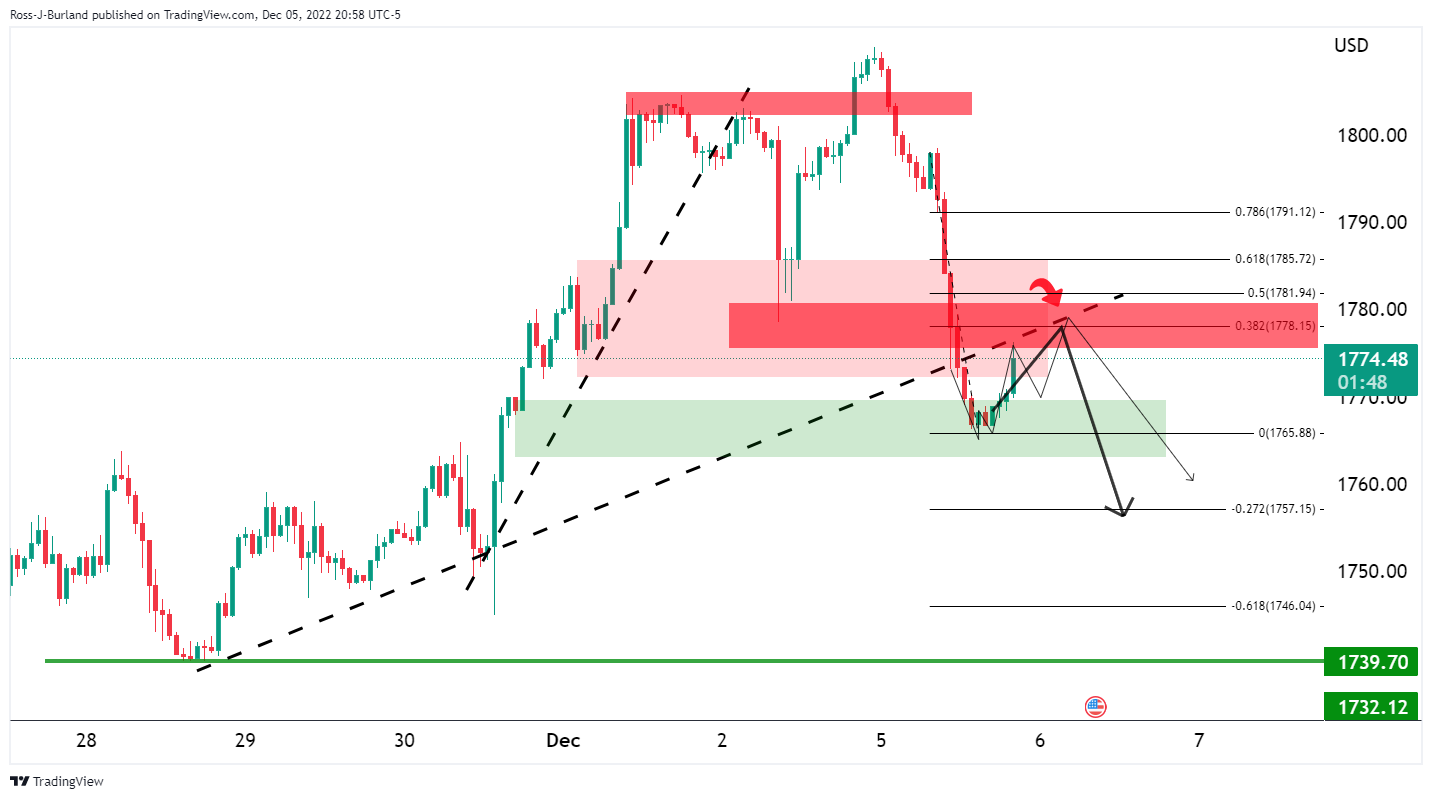
Gold is now on the backside of the micro trend but it is making a bullish correction with $1,780 eyed. Failures to break through the 50% mean reversion area could develop into supply for a downside continuation for a mid-week test of the $1,750s.
Citing Takeo Hoshi, an academic with close ties to incumbent central bank policymakers, Reuters reported on Tuesday, the Bank of Japan (BoJ) could do away with its 10-year Japanese government bond (JGB) yield cap in 2023 on increasing odds that inflation and wages will exceed expectations.
Key takeaways
“The BOJ must maintain an ultra-loose policy for the time being to convince the public that it is serious about reflating the economy long enough to generate sustained inflation.”
“With inflation expectations already "sufficiently" high, core consumer inflation could exceed the BOJ's 2% target next fiscal year, and open scope for the central bank to abandon its 0% target for the 10-year bond yield.”
"Prices didn't rise much in Japan in the past, but that's changing. Japan might enter an era of high inflation. The BOJ must start worrying about the possibility of inflation accelerating more than expected."
Market reaction
USD/JPY was last seen trading 0.17% lower at 136.50, undermined by the latest leg down in the US Dollar across the board in tandem with the Treasury bond yields.
- USD/CNH remains pressured at three-month low, down for the sixth consecutive day.
- Clear break of multi-day-old support line, bearish MACD signals favor sellers.
- Lows marked in October, November guard immediate upside.
USD/CNH bears keep the reins during early Tuesday, printing a six-day south-run around 6.9570 by the press time. In doing so, the offshore Chinese Yuan (CNH) pair justifies the previous week’s downside break of an ascending trend line from April.
Given bearish MACD signals favoring the USD/CNH pair’s trend line break, the sellers are well-set to challenge the monthly low marked the previous day around 6.9300.
Following that, September 10 swing low near 6.9100 may act as an intermediate halt during the likely fall towards a six-month-old ascending support line, close to 6.8940 at the latest.
In a case where USD/CNH remains bearish past 6.8940, the 50% Fibonacci retracement level of the pair’s run-up from late March to October, around 6.8600, will precede the 200-DMA support near 6.8015 to challenge the further downside.
Alternatively, recovery remains elusive unless the quote stays below the support-turned-resistance line stretched from April, near 7.0700 by the press time.
That said, an area comprising lows marked during November and October, around 7.0130-200, restricts the pair’s immediate upside.
It’s worth noting that multiple hurdles surrounding 7.2600-2700 could question the USD/CNH bulls before giving them control.
USD/CNH: Daily chart
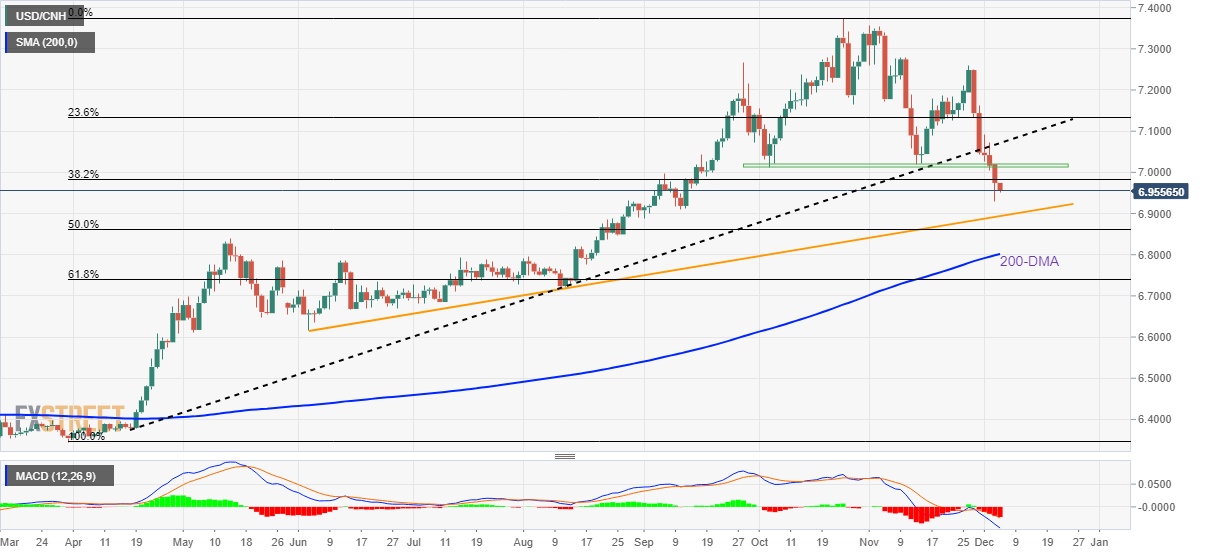
Trend: Further downside expected
Economists at Goldman Sachs provide their expectations for this Wednesday’s Bank of Canada (BoC) interest rate hike.
Key quotes
"At this week's BoC meeting, our economists expect the Bank to deliver another 50bp hike, but under-delivery remains a risk on two fronts. First, it is possible that the BoC sees enough justification to hike by 25bps only, given the moderation in sequential underlying inflation. Second, we think that the BoC is likely to pause soon and the statement or press conference may already signal this next week.”
"CAD has had a solid performance this year on the BoC's aggressive hiking cycle but has underperformed the rest of G10 recently. This is mostly related to lower oil prices and lower yields (and a weaker USD on crosses). However, CAD on crosses remains our preferred expression in an environment of USD strength, which we expect to persist over the next 3 to 6 months."
- A Spring formation below 0.8600 strengthened the Euro bulls for a firmer recovery.
- The RSI (14) has shifted into the 40.00-60.00 range, which indicates a consolidation ahead.
- The speech from ECB Lagarde will provide cues about the likely monetary policy action ahead.
The EUR/GBP pair is struggling to cross the immediate hurdle of 0.8610 in the Asian session. Earlier, the cross resurfaced after dropping marginally below the cushion of 0.8600. The asset is expected to display volatile performance ahead as investors are awaiting the speech from European Central Bank (ECB) President Christine Lagarde scheduled for Thursday.
Meanwhile, accelerated consumer spending in the United Kingdom has triggered the risk of higher inflation ahead. UK’s Like-For-Like Retail Sales reported by the British Retail Consortium (BRC) escalated to 4.1% from the prior release of 1.2% in November on an annual basis.
On a four-hour scale, the cross has witnessed a significant recovery after a Spring formation below the horizontal support plotted from October 17 low around 0.8578, which indicates that market participants considered the asset a value-buying.
The cross has managed to sustain above the 20-period Exponential Moving Average (EMA) at around 0.8600. While the 50-EMA at 0.8616 has not been conquered yet.
Meanwhile, the Relative Strength Index (RSI) (14) has shifted into the 40.00-60.00 range, which indicates a consolidation ahead.
For further upside, the cross needs to overstep Monday’s high at 0.8635, which will drive the asset towards November 30 high at 0.8661, followed by the round-level resistance at 0.8700.
On the contrary, a break below December 1 low at 0.8547 will drag the cross for a fresh three-month low near the round-level cushion of 0.8500. A slippage below the latter will expose the asset for more downside toward August 26 low at 0.8425.
EUR/GBP four-hour chart
-638058880327700177.png)
- Market sentiment dwindles as concerns over Russia, Fed challenge China-linked optimism.
- S&P 500 Futures lick its wounds after falling the most in a month, US 10-year Treasury bond yields fade week-start recovery.
- Pre-Fed blackout, absence of major data/events could allow traders to pare recent moves.
Global markets turn mildly optimistic during early Tuesday, after witnessing a downbeat start to the week. The reason could be linked to the absence of major data/events, as well as mixed catalysts surrounding the US Federal Reserve’s (Fed) next move.
While portraying the mood, S&P 500 Futures print 0.20% intraday gains around 4,011 while snapping a three-day downtrend. That said, the US 10-year Treasury bond yields fade the bounce off an 11-week low marked the last Friday, up three basis points (bps) to 3.56% by the press time.
It should be noted that optimism surrounding China’s economic growth, due to the latest easing of virus woes and re-opening appears to keep the traders hopeful. Reuters reported on Monday that China is on course to downgrade its management of COVID-19 from a top-level Category A infectious disease to a less strict Category B disease as early as January. The news came after Chinese President XI Jinping termed the previous jump in the virus cases as Omicron and mostly of mild nature.
US inflation expectations, as per the 10-year and 5-year breakeven inflation rates per the St. Louis Federal Reserve (FRED) data, also weigh on the US Dollar bulls and challenge the recently hawkish bias over the US Federal Reserve (Fed) by taking a U-turn from a one-month high. The latest prints of the 5-year and 10-year inflation expectations portray a pullback from the one-month high to 2.46% and 2.39% respectively.
On the other hand, New York Times (NYT) released a piece of news suggesting Ukrainian drones attacked military bases hundreds of miles inside Russia and escalated war fears.
It’s worth mentioning that Friday’s upbeat US data and Fedspeak challenge the dovish calls from the Fed, which in turn test the latest optimism. That said, US ISM Services PMI rose to 56.5 in November versus 53.1 market forecast and 54.4 previous readings whereas the Factory Orders also registered 1.0% growth compared to 0.7% expected and 0.3% prior. Further, S&P Global Composite PMI improved to 46.4 versus 46.3 initial estimations while the Services counterpart rose to 46.2 compared to 46.1 flash forecasts.
On Friday, the US Nonfarm Payrolls (NFP) surprised markets by rising to 263K versus 200K expected and an upwardly revised prior of 284K while the Unemployment Rate matched market forecasts and prior readings of 3.7% for November. Following the upbeat data, Chicago Fed President Charles Evans said, "We are probably going to have a slightly higher peak to Fed policy rate even as we slow pace of rate hikes.”
Looking forward, an absence of major data/events challenges the momentum traders and may allow them to consolidate the previous moves.
In recent trade today, the People’s Bank of China (PBOC) set the yuan (CNY) at the weakest level since September 21, 6.9746 vs. the last close of 6.9605.
About the fix
China maintains strict control of the yuan’s rate on the mainland.
The onshore yuan (CNY) differs from the offshore one (CNH) in trading restrictions, this last one is not as tightly controlled.
Each morning, the People’s Bank of China (PBOC) sets a so-called daily midpoint fix, based on the yuan’s previous day's closing level and quotations taken from the inter-bank dealer.
- USD/CAD fades upside momentum near one-week high, renews intraday low of late.
- Overbought RSI teases bears to challenge the resistance-turned-support.
- Bullish MACD signals, sustained trading beyond 100-SMA suggest further upside.
USD/CAD bulls take a breather around the weekly high as the quote declines to 1.3585 during Tuesday’s Asian session.
In doing so, the Loonie pair takes clues from the overbought RSI conditions to challenge the latest upward trajectory.
However, the previous resistance line from October 13, close to 1.3550, joins the bullish MACD signals to challenge the USD/CAD bears.
Even if the USD/CAD pair drops below 1.3550 resistance-turned-support, a three-week-old ascending trend line and the 100-SMA could question the quote’s further downside around 1.3400 and 1.3395 in that order.
In a case where the Loonie pair declines below 1.3395, a southward trajectory towards November’s low surrounding 1.3230 can’t be ruled out.
On the flip side, a downward-sloping resistance line from October 14, close to 1.3615 by the press time, restricts the short-term upside moves of the pair.
Following that, the previous weekly top near 1.3645 appears crucial for the USD/CAD bulls as a break which could allow them to retake control.
To sum up, USD/CAD bulls can stay hopeful, despite the latest pullback, unless the quote breaks 1.3395 level.
USD/CAD: Four-hour chart
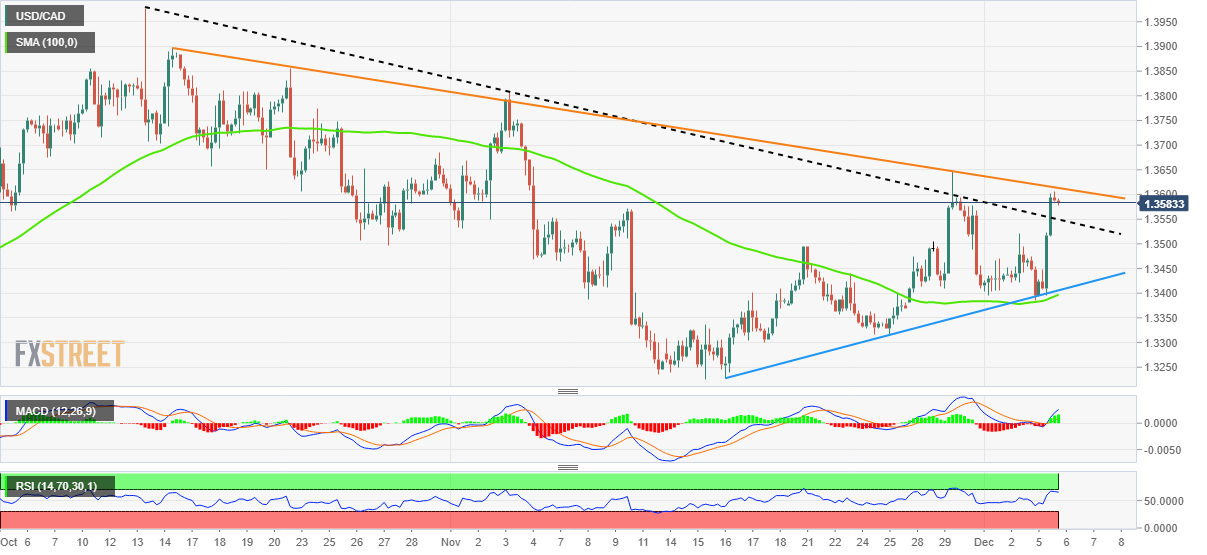
Trend: Limited downside expected
- EUR/JPY is facing barricades in extending its rally above 143.50.
- The speech from Christine Lagarde will dictate the likely monetary policy action by the ECB ahead.
- A contraction in Japan’s GDP may force more policy easing by the BOJ.
The EUR/JPY pair has sensed selling pressure after struggling to surpass the critical hurdle of 143.50 in the Asian session. The cross is displaying signs of exhaustion in the upside momentum after a juggernaut rally from below 141.00 on Monday. Monday’s rally in the cross got wings after the release of the downbeat Eurozone Retail Sales data.
Monthly Eurozone Retail Sales data contracted by 1.8% while expectations were aiming for a 1.7% contraction. Also, the economic data contracted by 2.7% on an annual basis against the consensus of a 2.6% contraction. A decline in demand by the households indicates that policy tightening measures adopted by the European Central Bank (ECB) are augmenting their job effectively. This might force firms to look for a decline in prices for goods and services to keep up their sales.
No doubt, a decline in retail demand is clear evidence that inflation will fall ahead but the size of the inflation monster is extremely large from the targeted inflation rate of 2%. This may force the ECB to continue hiking interest rates further.
Meanwhile, European Economy Commissioner Paolo Gentiloni said on Monday Europe will fall into a recession this winter and growth will not return before spring before the Eurogroup meeting, reported by Deccan Herald. He further added that “Inflation Seems to Be Peaking, Decline to Be Gradual.”
Going forward, investors will look for the speech from ECB President Christine Lagarde, which is scheduled for Thursday. The speech from ECB President will dictate the likely monetary policy action by the ECB in its December monetary policy meeting.
On the Tokyo front, the release of the Gross Domestic Product (GDP) data for the third quarter will be of significant importance. On an annualized basis, Japan’s GDP is expected to contract by 1.1% against the prior contraction of 1.2%. Also, the quarterly data is expected to contract by 0.3%, similar to the prior print. A contraction in Japan’s GDP may force more policy easing by the Bank of Japan (BOJ).
Reuters has reported that the Bank of Japan Governor Haruhiko Kuroda said on Tuesday it was premature to debate the chance of reviewing the bank's monetary policy framework as more time will be needed to sustainably achieve its 2% inflation target.
''Kuroda made the comment in parliament when asked about BOJ board member Naoki Tamura's recent remarks that the central bank should review its monetary policy framework and tweak its massive stimulus programme depending on the outcome.''
USD/JPY update
-
USD/JPY Price Analysis: Bulls and bears in battle between key territories
Bulls eye a break ok 138.00 . However, while on the front side of the micro trendlines, the bias remains bearish and a fade on rallies could be in store.
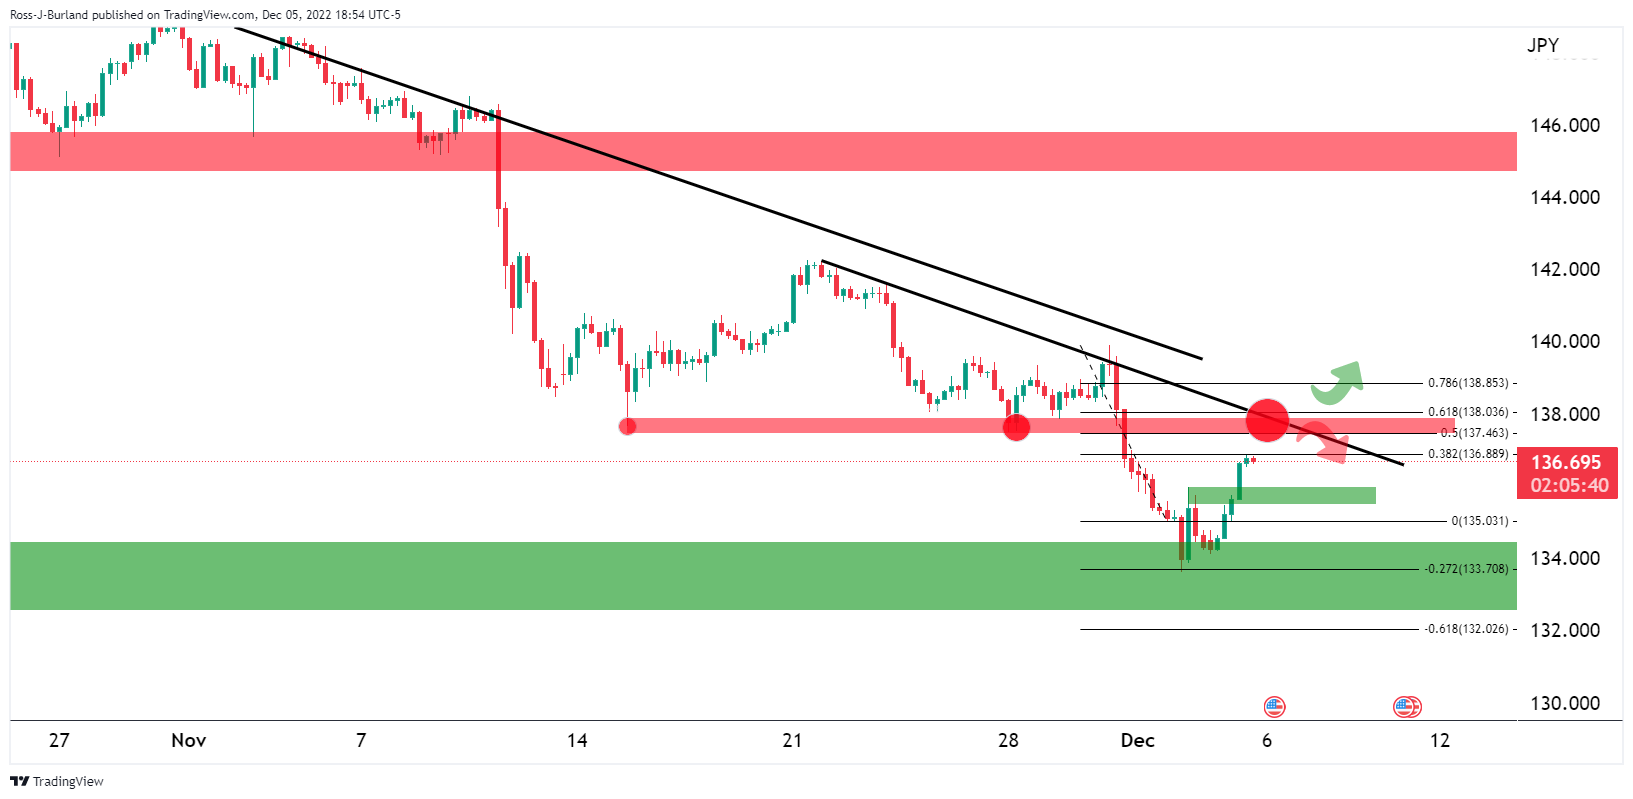
- GBP/USD picks up bids to reverse the pullback from six-month high.
- UK’s BRC Like-For-Like Retail Sales improved in November.
- US Dollar retreats amid softer inflation expectations but strong data keeps Greenback bears off the table.
- Pre-Fed blackout, light calendar to restrict short-term moves and may allow traders to pare recent losses.
GBP/USD renews its intraday high around 1.2210 as it reverses the week-start pullback from a six-month top during Tuesday’s Asian session. The Cable pair’s latest run-up could be linked to the US Dollar’s retreat amid dovish expectations from the US Federal Reserve, as well as the UK’s firmer data.
That said, the British Retail Consortium (BRC) Like-For-Like Retail Sales jumped 4.1% YoY in November versus 1.2% prior. Even so, Reuters said, “British consumer spending ticked up last month at a rate that greatly lagged behind inflation, according to surveys on Tuesday that underscored the pressure on household budgets ahead of the Christmas holidays.”
Elsewhere, US inflation expectations as per the 10-year and 5-year breakeven inflation rates per the St. Louis Federal Reserve (FRED) data, challenge the recently hawkish bias over the US Federal Reserve (Fed) by taking a U-turn from a one-month high. The latest prints of the 5-year and 10-year inflation expectations portray a pullback from the one-month high to 2.46% and 2.39% respectively.
It should be noted that the downbeat UK data and firmer US statistics allowed the GBP/USD pair to reverse from the multi-day top on Monday.
Final readings of the UK’s November month S&P Global/CIPS Composite PMI eased to 48.2 versus 48.3 initial forecasts whereas the S&P Global/CIPS Services PMI confirmed the 48.8 flash estimates.
On the other hand, US ISM Services PMI rose to 56.5 in November versus 53.1 market forecast and 54.4 previous readings whereas the Factory Orders also registered 1.0% growth compared to 0.7% expected and 0.3% prior. Further, S&P Global Composite PMI improved to 46.4 versus 46.3 initial estimations while the Services counterpart rose to 46.2 compared to 46.1 flash forecasts.
Other than the UK data, hopes of China’s fast recovery from Covid also seemed to have favored the GBP/USD rebound. Reuters reported on Monday that China is on course to downgrade its management of COVID-19 from a top-level Category A infectious disease to a less strict Category B disease as early as January. The news came after Chinese President XI Jinping termed the previous jump in the virus cases as Omicron and mostly of mild nature.
Against this backdrop, S&P 500 Futures print mild gains despite Wall Street’s downbeat close whereas the US 10-year Treasury bond yields retreat to 3.57% after rising eight basis points (bps) the previous day.
To sum up, mixed sentiment in the market and an absence of major data, as well as optimism surrounding China and the pre-Fed blackout, allow GBP/USD to stay firmer. However, the bulls may have limited upside room as the Bank of England (BOE) hawks seem less convincing and the chatters surrounding the UK’s economic transition turn grim as of late.
Technical analysis
Unless providing a daily closing below the 200-DMA support near 1.2135, the GBP/USD buyers remain hopeful.
- US data beat expectations and sends the US Dollar into a bull correction.
- EUR/USD bulls are moving in from the lows and eye correction towards 1.0550.
EUR/USD is perched at the upper end of the bull cycle that started at the end of September's business on the US Dollar's weakness. At 1.0507, the Euro is 0.12% on Tuesday so far and has climbed from a low of 1.0489 to a high of 1.0507.
The driver at the start of the week, however, has been in the US Dollar and today's bid does little to reflect what happened on Monday to risk appetite. US Services industry activity unexpectedly rose in November leading observers to expect that the Federal Reserve may lift interest rates more than recently projected.
DXY, an index that measures the US Dollar vs. the greenback is back into the 105 area following a rise from the lows of the November bearish cycle of 104.11. Consequently, the Euro was on its back foot for the start of the week's US session while the data helped to encourage a flight to safety after an injection of investor enthusiasm over signs of possible loosening in COVID restrictions in China faded.
Several cities easing their COVID restrictions in China in what appears to be a shift toward gradual reopening as the country nears entering the fourth year of the pandemic had given risk appetite a boost. However, despite the partial relaxation, many restrictions remain in place and in some parts of the nation, new lockdowns and travel restrictions are still being imposed.
| Index | Change, points | Closed | Change, % |
|---|---|---|---|
| NIKKEI 225 | 42.5 | 27820.4 | 0.15 |
| Hang Seng | 842.94 | 19518.29 | 4.51 |
| KOSPI | -15.01 | 2419.32 | -0.62 |
| ASX 200 | 24.1 | 7325.6 | 0.33 |
| FTSE 100 | 11.34 | 7567.54 | 0.15 |
| DAX | -81.78 | 14447.61 | -0.56 |
| CAC 40 | -45.29 | 6696.96 | -0.67 |
| Dow Jones | -482.78 | 33947.1 | -1.4 |
| S&P 500 | -72.86 | 3998.84 | -1.79 |
| NASDAQ Composite | -221.56 | 11239.94 | -1.93 |
- The Australian Dollar bulls have attempted a recovery after plummeting below 0.6700 but still need more filters.
- Volatility is to remain at its peak ahead of the interest rate decision by the RBA.
- A slippage inside the bearish range of 20.00-40.00 by the RSI (14) will trigger a bearish momentum.
The AUD/USD pair has attempted a recovery after dropping below the round-level cushion of 0.6700 in the early Asian session. The Aussie asset has managed to reclaim the 0.6700 hurdle again but is still on the tenterhooks ahead of the monetary policy announcement by the Reserve Bank of Australia (RBA).
Meanwhile, the US Dollar Index (DXY) has corrected marginally to near 105.30, however, the upside bias is still intact amid the risk-off market mood. The upbeat US Services data triggered the risk aversion theme in global markets.
The Aussie asset is hovering around the upward-sloping trendline plotted from November 21 low at 0.6585 on an hourly scale. Monday’s sell-off in AUD/USD dragged it below the 20-and 50-period Exponential Moving Averages (EMAs) at 0.6766 and 0.6748 respectively, which indicates that the short-term trend has tilted south and more downside is expected.
Meanwhile, the Relative Strength Index (RSI) (14) is hovering around 40.00. A slippage inside the bearish range of 20.00-40.00 will trigger a bearish momentum.
Should the asset break below Friday’s low at 0.6687, the US Dollar bulls will drag the Aussie pair towards November 29 low at 0.6640 and the horizontal support plotted from November 8 high at 0.6551.
Alternatively, a break above November 29 high around 0.6750 will drive the Aussie asset toward the round-level resistance at 0.6800, followed by Monday’s high around 0.6850.
AUD/USD four-hour chart
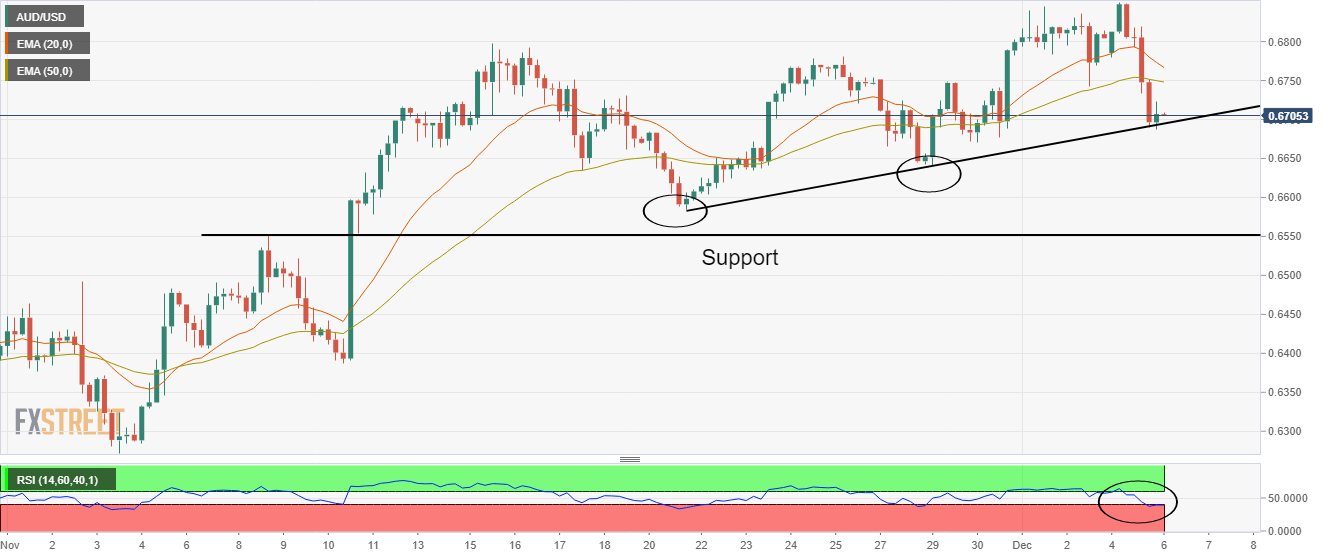
- AUD/NZD stays defensive at the lowest levels since late January 2022.
- Fresh challenges to sentiment, RBA versus RBNZ divergence challenge the buyers.
- RBA braces for 0.25% rate hike but the future guidance will be crucial for clear directions.
AUD/NZD drops to a fresh low since late January as bears poke 1.0590 mark while waiting for the Reserve Bank of Australia’s (RBA) Interest Rate Decisions during early Tuesday. In doing so, the cross-currency pair reverses the previous day’s corrective bounce amid a broad-based pullback in the Australia Dollar (AUD) amid mixed sentiment.
Fresh fears emanating from Russia join the market’s doubts over the US Federal Reserve’s (Fed) next moves seemed to have recently weighed on the AUD/NZD bears. Also favoring the pair sellers could be the dovish expectations from the RBA, as well as hopes of more rate hikes from the Reserve Bank of New Zealand (RBNZ).
The New York Times (NYT) released a piece of news suggesting Ukrainian drones attacked military bases hundreds of miles inside Russia and escalated war fears. The news joins recent hawkish expectations from the Fed and the RBNZ, backed by firmer economics, as well as dovish bias surrounding the RBA to keep the AUD/NZD bears hopeful.
That said, the RBA is expected to announce a 0.25% rate hike and may signal the end of hawkish moves, which becomes more of interest to the market players of late. However, RBA Governor Philip Lowe recently stated that the central bank’s decision to downshift reflects monetary policy lags. The same challenges the AUD/NZD sellers amid recently strong Aussie inflation numbers.
On Monday, Australia’s AiG Performance of Construction Index for November rose to 48.2 versus 43.3 whereas S&P Global Services PMI rose more than 47.2 initial forecasts to 47.6 while the Composite PMI also improved to 48.0 versus 47.7 prior. Further, TD Securities Inflation for November jumped to 5.9% YoY and 1.0% MoM compared to 5.2% and 0.4% respective priors.
Looking forward, the RBA Rate Statement will be more important than the Interest Rate Decision and should be observed for clear directions.
Technical analysis
A clear downside break of the 14-month-old horizontal support area surrounding 1.0610-15 directs AUD/NZD bears towards an upward-sloping support line from September 2021, close to 1.0580 at the latest.
| Pare | Closed | Change, % |
|---|---|---|
| AUDUSD | 0.66971 | -1.37 |
| EURJPY | 143.523 | 1.31 |
| EURUSD | 1.04926 | -0.37 |
| GBPJPY | 166.771 | 1.03 |
| GBPUSD | 1.21928 | -0.64 |
| NZDUSD | 0.63161 | -1.13 |
| USDCAD | 1.35877 | 0.96 |
| USDCHF | 0.94259 | 0.6 |
| USDJPY | 136.784 | 1.68 |


© 2000-2026. All rights reserved.
This site is managed by Teletrade D.J. LLC 2351 LLC 2022 (Euro House, Richmond Hill Road, Kingstown, VC0100, St. Vincent and the Grenadines).
The information on this website is for informational purposes only and does not constitute any investment advice.
The company does not serve or provide services to customers who are residents of the US, Canada, Iran, The Democratic People's Republic of Korea, Yemen and FATF blacklisted countries.
Making transactions on financial markets with marginal financial instruments opens up wide possibilities and allows investors who are willing to take risks to earn high profits, carrying a potentially high risk of losses at the same time. Therefore you should responsibly approach the issue of choosing the appropriate investment strategy, taking the available resources into account, before starting trading.
Use of the information: full or partial use of materials from this website must always be referenced to TeleTrade as the source of information. Use of the materials on the Internet must be accompanied by a hyperlink to teletrade.org. Automatic import of materials and information from this website is prohibited.
Please contact our PR department if you have any questions or need assistance at pr@teletrade.global.
transfers