- Analytics
- News and Tools
- Market News
CFD Markets News and Forecasts — 17-11-2021
- WTI grinds lower at multi-day bottom, keeps downside break of 50-DMA.
- Bearish MACD signals back downside momentum towards July’s top.
- Three-week-old resistance line adds to the upside filters.
WTI crude oil dribbles around $77.50, following the heaviest daily fall in a week to test early October lows. Even so, the black gold extends the previous day’s downside break of the 50-DMA amid bearish MACD signals.
That said, the commodity prices remain directed towards July’s peak of $76.40 before challenging the 100-DMA surrounding $73.80.
Should the oil sellers keep reins past $73.80, the pair’s downside towards 50.0% and 61.8% Fibonacci retracement of August-October upside, respectively near $73.35 and $70.60, can’t be ruled out.
Alternatively, corrective pullback needs to provide a daily closing beyond the 50-DMA level of $78.10 to recall the WTI buyers.
Following that, the weekly resistance line and a descending trend line from late October, close to $79.20 and $83.00 in that, will be in focus.
If at all the oil prices cross the $83.00 hurdle, the previous month’s high near $85.00 should return to the chart.
WTI: Daily chart
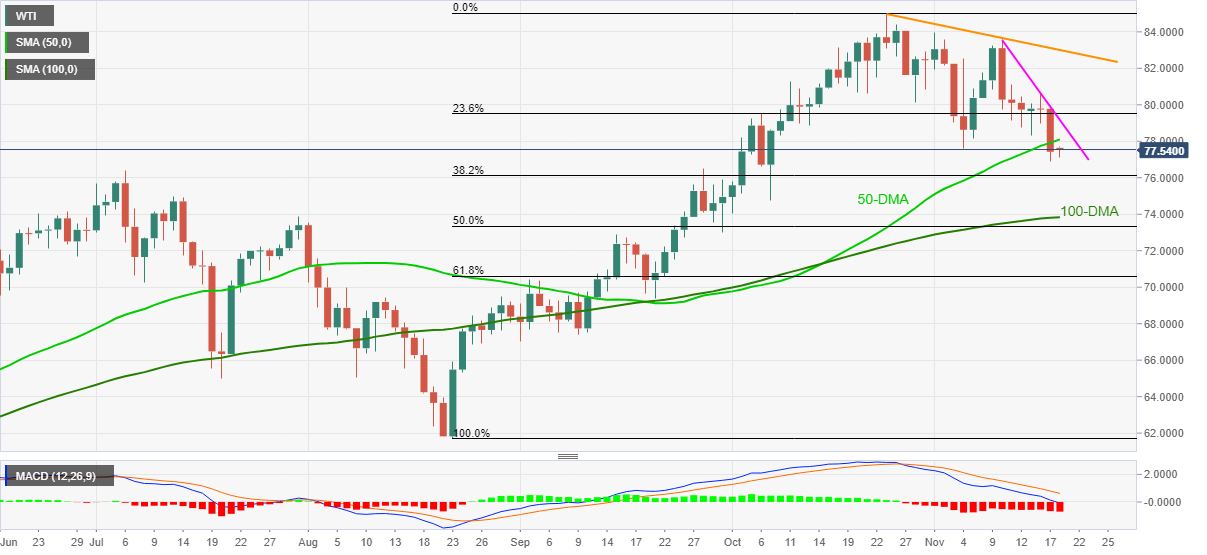
Trend: Further weakness expected
US inflation expectations, as measured by the 10-year breakeven inflation rate per the St. Louis Federal Reserve (FRED) data, drop for the second consecutive day by the end of Wednesday’s North American session, per the data source Reuters.
In doing so, the inflation gauge widens the gap from the highest levels since 2005 tested earlier in the week, around 2.70% at the latest.
The receding inflation expectations could be linked to the recent retreat in the US Treasury yields and the US Dollar Index (DXY). The White House optimism regarding the US supply chain seems to underpin the receding inflation fears.
However, the Fed policymakers remain divided on the reflation woes and the rate hike concerns, which in turn challenge market sentiment. That said, Chicago Fed’s Chief Executive Officer Charles L. Evans recently mentioned, per Reuters, “It will take until the middle of next year to complete the Fed's wind-down of its bond-buying program, even as the central bank remains 'mindful' of inflation.”
Moving on a lack of major data/events may keep the markets gyrated but receding inflation woes may exert additional downside pressure on the US bond yields and the greenback, which in turn could help the gold buyers to remain hopeful of visiting the $1,900 mark.
Read: Gold Price Forecast: XAU/USD grinds higher towards $1,900 on softer yields
- Silver struggles to extend bounce off weekly low inside immediate bearish chart pattern.
- Sustained trading below previous support, sluggish Momentum keep sellers hopeful.
- Bulls need $25.40 breakout for fresh entries to target August month’s top.
Silver (XAG/USD) remains sidelined around $25.00, inside a one-week-old symmetrical triangle bearish formation during Thursday’s Asian session.
That said, the bright metal’s failure to jump back beyond the support-turned-resistance line from October 03, around $25.20, joins Momentum line’s retreat to tease silver sellers.
However, a clear downside break of the stated triangle’s support, around $24.85 at the latest, as well as a break of the 200-HMA level of $24.75, becomes necessary for the bear’s entry.
Following that, November 08 swing high near $24.50 and a two-week-long horizontal area near $24.00 will gain the market’s attention.
Meanwhile, the stated previous support line, around $25.20, guards the quote’s immediate upside ahead of the triangle’s resistance line near $25.40.
Should the silver buyers keep reins past $25.40, a run-up towards the August month’s high of $26.00 can’t be ruled out.
Silver: Hourly chart
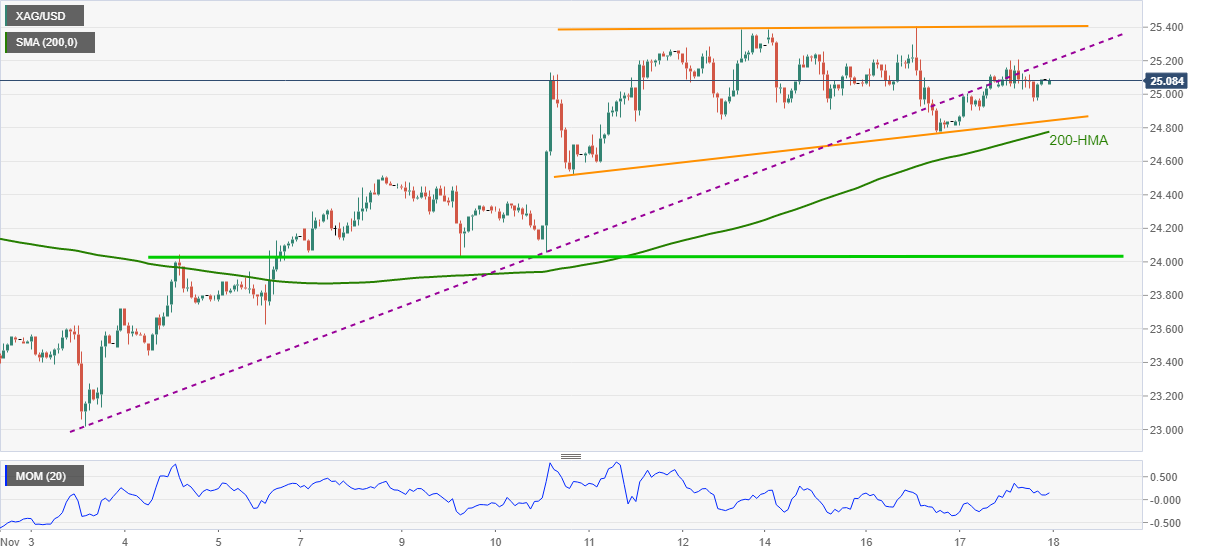
Trend: Pullback expected
- EUR/USD bears take no heed, consolidate toward the 1.300 level.
- The pair may find impetus from several speeches lined up for the day.
- The euro area fresh COVID-19 spread worry investors.
The EUR/USD pair grinds lower towards 1.1300 level in the early Asian session on Thursday, on the back of receding US dollar and Treasury yields.
The shared currency pair has developed a mood of late and remained at its lowest since July last year. Now, expectations remain that the European Central Bank (ECB) would stick to its dovish policy settings in the near term. Against the backdrop of a slowing economy and as Covid-19 cases resurge throughout the continent.
On Thursday morning, Charles L. Evans, the chief executive officer of the Federal Reserve Bank of Chicago, sounds cautiously optimistic while saying, “It will take until the middle of next year to complete the Fed’s wind-down of its bond-buying program, even as the central bank remains ‘mindful’ of inflation.”
The Fed policymaker’s mixed comments weighed on the market sentiment and dragged the US equities down, keeping the Treasury yields pressured.
Previously, ECB president Christine Lagarde said that tightening monetary policy to curb inflation could choke off the Eurozone’s recovery. She further iterated factors pushing prices higher would fade next year, increasing contrast from hawkish hints from other central banks.
The Eurozone inflation for October rose by 4.1% YoY, in line with expectations. The MoM figure is at 0.8%, also in line with estimations and failed to trigger any reaction in the EUR/USD. Additionally, both Austria and the Netherlands announced lockdown measures. Germany is also due to meet next week to discuss tightening standards as infections start to peak.
Meanwhile, the greenback continued ardour reaching fresh 2021 highs and went out of steam on Wednesday, with the DXY falling back to the 95.80s.
Looking ahead, investors will be eyeing several Fed speeches and comments from ECB’s Fabio Panetta, Philip Richard Lane in addition to ECB President Lagarde.
EUR/USD technical levels
- EUR/JPY is flat as the Asian Pacific session begins, near Wednesday’s low around the 129.20s.
- EUR/JPY: Broke below a descending channel, accelerating the downtrend towards 129.00.
- EUR/JPY: A break below 129.00 could pave the way for a deeper correction, firstly 128.00, followed by 126.00.
The EUR/JPY is subdued as the Asian session begins, flat trading at 129.21 during the day at the time of writing.
On Wednesday, during the overnight session, the shared currency failed to break above the 50-hour simple moving average (HSMA). It also broke below the bottom-trendline of a descending channel, accelerating the downtrend, dropping 100 pips throughout the day, reaching a low around the 129.00 flat.
EUR/JPY Price Analysis: Technical outlook
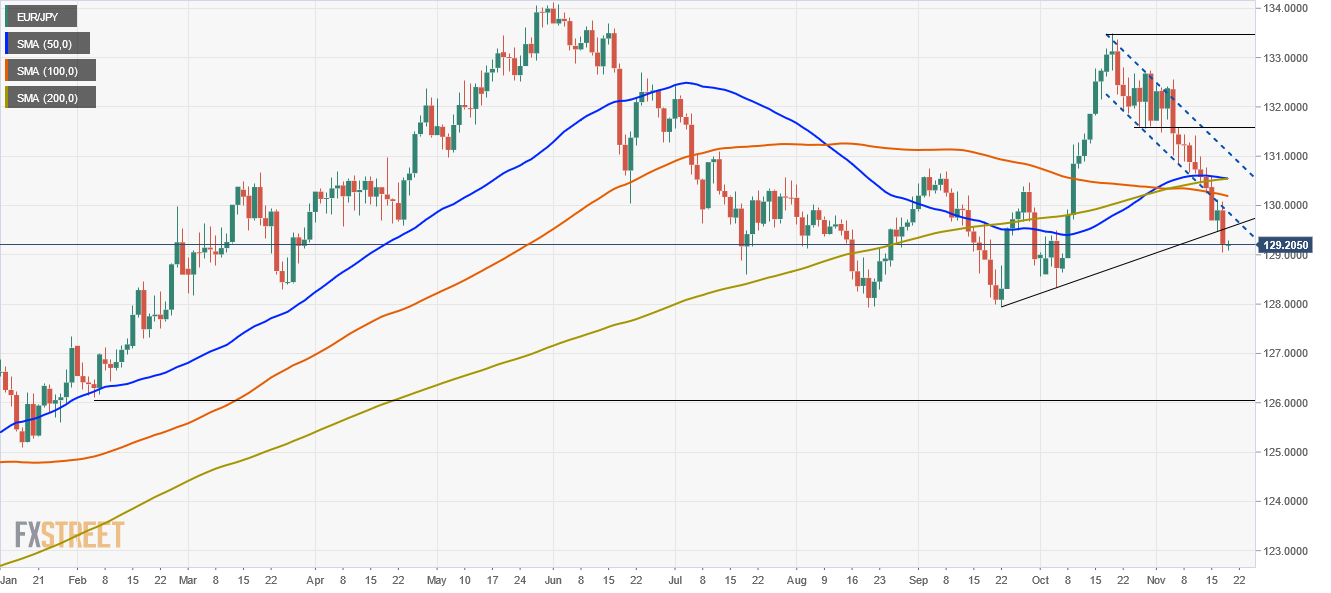
The daily chart depicts that the EUR/JPY pair broke below the descending channel, which seemed to be a bullish flag. However, once the spot price broke the bottom-trendline, it negated the validity of the pattern. Additionally, it broke a four-week upward trendline, cementing the downward bias in the pair.
Further, the 50-day moving average (DMA) just crossed under the 200-DMA, forming a death-cross usually viewed as a bearish signal.
If EUR/JPY sellers want to accelerate the downtrend, they will need to break below the October 6 low at 128.33. A breach of the latter would expose key support levels, like 128.00, followed by the February 4 low at 126.10.
On the flip side, if EUR buyers would like to reclaim control, they would need a daily close above the 100-DMA at 130.19. In that outcome, the following supply zone would be the convergence of the 50 and the 200-DMA around the 130.50-60 area.
- AUD/USD fails to cheer USD pullback, stays pressured around six-week low.
- RBA’s rejection of rate hike precedes subdued Q3 Australian wage growth data to back the bears.
- Fed tapering concerns remain elevated but US Treasury yields retreat amid a lack of major data/events.
- RBA’s Ellis will be eyed to confirm the bearish bias ahead of US second-tier data.
AUD/USD grinds lower around the six-week bottom, taking rounds to 0.7265 during Thursday’s initial Asian session. In doing so, the Aussie pair drops for the third consecutive day amid sour sentiment and receding odds of the Reserve Bank of Australia’s (RBA) rate hike.
Although the US Dollar Index (DXY) track Treasury yields in stepping back from the multi-day high, the AUD/USD prices remain pressured and dropped to the lowest levels since early October as the Aussie wage price data backed RBA’s rejection of rate lift the previous day.
That said, Australia Wage Price Index matches the 2.2% YoY forecast and crossed 0.5% QoQ market consensus for the Q3. Earlier in the week, the RBA Minutes and Governor Philip Lowe both pushed back rate hike concerns.
It’s worth noting that an absence of any major positive news from the virtual meeting between US President Joe Biden and his Chinese counterpart Xi Jinping adds to the bearish bias for the AUD/USD. Additionally, the hawkish Fedspeak keeps the US central bank (Fed) on top of its counterparts while watching for a rate hike, which in turn exert downside pressure on the Aussie prices. Recently, Charles L. Evans, the Chief Executive Officer of the Federal Reserve Bank of Chicago said, “It will take until the middle of next year to complete the Fed's wind-down of its bond-buying program, even as the central bank remains 'mindful' of inflation.”
Alternatively, the US efforts to increase oil supply and the White House comments suggesting receding supply chain issues join mixed housing data from the US to offer breathing space to the AUD/USD sellers.
Amid these plays, US 10-year Treasury yields retreat from the highest levels since October 26 to post the heaviest daily fall in a week while ending Wednesday’s US trading session around 1.59%, down 4.3 basis points (bps). DXY tracks bond yields and marks a first negative daily closing in three after refreshing the 16-month top during early Wednesday. It’s worth noting that the Wall Street benchmarks remained negative for the second consecutive day.
Looking forward, RBA Assistant Governor (Economic) Luci Ellis is up for a speech at an online event hosted by the Committee for Economic Development of Australia around 02:00 GMT. His comments will be watched to confirm the latest bearish impulse for the AUD/USD. Following that, the US Jobless Claims and Fedspeak will be eyed for clearer direction.
Technical analysis
A 12-day-old resistance line precedes convergence of the 100-DMA and the 50-DMA, respectively around 0.7310 and 0.7360-65, to restrict the short-term upside of the AUD/USD prices. Also keeping the pair sellers hopeful is the latest downside break of the 61.8% Fibonacci retracement (Fibo.) of August-October uptrend, around 0.7275. it should be noted, however, that an ascending support line from August near 0.7250, challenges further downside amid oversold RSI conditions.
- USD/CAD grinds higher following the run-up to refresh seven-week top.
- Short-term ascending trend line, 61.8% Fibonacci retracement tests immediate upside overbought RSI conditions.
- 50-SMA restricts immediate downside, late September peak lures bulls past 1.2660.
USD/CAD picks up bids in a 20-pip trading range above 1.2600 after rising to the highest levels since early October the previous day. That said, the quote rises to 1.2613 amid the initial Asian session on Thursday.
Sustained trading beyond 50-SMA and a six-week-old horizontal area keeps USD/CAD buyers hopeful. However, a convergence of an ascending trend line from October 27 and 61.8% Fibonacci retracement (Fibo.) of September-October fall, challenge the bulls around 1.2660 amid the overbought RSI conditions.
Hence, the pair buyers should wait for a clear upside break of 1.2660 for fresh entry. Following that, the 1.2700 threshold and late September high near 1.2775 will be in focus.
Even if the USD/CAD upside remains intact past 1.2775, September’s top around the 1.2900 threshold should attract the buyers.
Alternatively, pullback moves may aim for the 50% Fibo. level of 1.2592 before targeting the 50-SMA, around 1.2515 at the latest.
However, USD/CAD should watch for entry if the quote breaks a horizontal region comprising multiple levels since October 08, around 1.2480-95.
USD/CAD: Four-hour chart
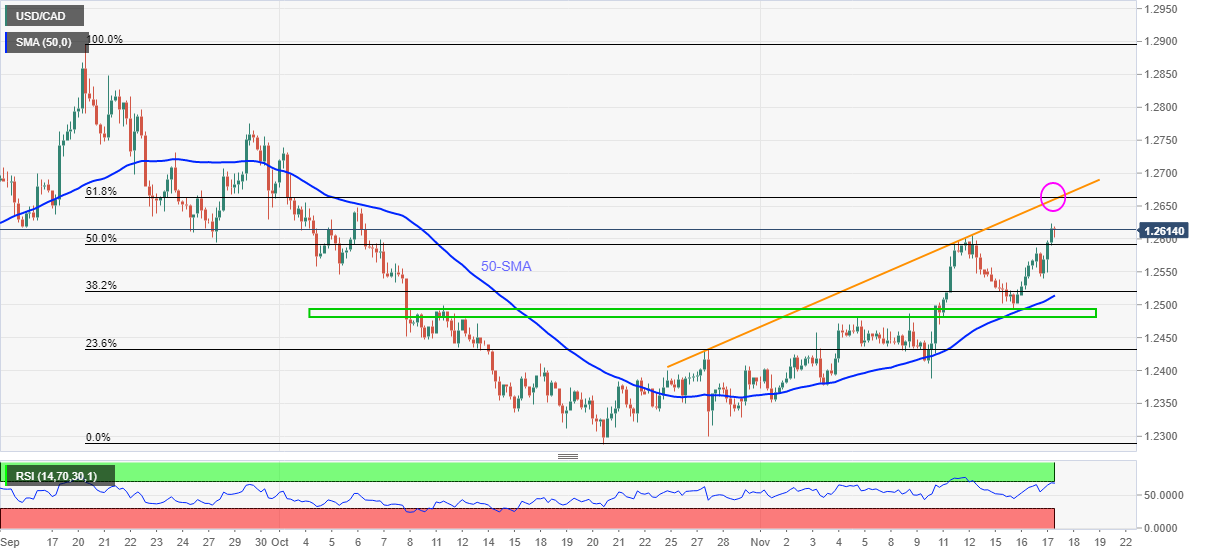
Trend: Pullback expected
Early Thursday morning in Asia, the White House crossed wires, via Reuters, to convey the US supply chain position.
Key quotes
Ocean carrier alliances immune from antitrust laws, but FMC can challenge such pacts if they result in unreasonable costs or lessen competition.
Federal Maritime Commission (FMC) should use all tools at its disposal to ensure free and fair competition in shipping sector.
US Justice Department ready to aid FMC in promoting competition in maritime sector.
Congress should take action to improve transparency in shipping, boost protections for exporters, importers and consumers.
October data shows US goods supply chain working better, velocity of goods leaving L.A. Long beach ports increasing.
White House official sees need to look at holding carriers accountable to retailers, ensuring retailers can get goods on ships at fair prices.
Fx implications
Although the comments could be considered encouraging as supply chain issues are the key to the latest inflation woes, the market reaction was muted on the release. The reason could be linked to the early Asian session and a light calendar.
Read: Gold Price Forecast: XAU/USD grinds higher towards $1,900 on softer yields
- Gold bulls keep reins inside weekly trading range at five-month high.
- DXY tracked yields to step back from multi-day low, allows bulls to tighten the grips.
- Mixed US data, Fedspeak favor price run-up amid inflation fears, US Jobless Claims, Fed policymakers’ speeches eyed.
- Gold Price Forecast: XAU/USD bulls eager to end consolidation phase, critical drop in yields eyed
Gold (XAU/USD) ends Wednesday’s North American trading session with the highest daily gains in a week, edges around $1,867 as Asian traders braces for Thursday’s bell.
The yellow metal cheers the heavy pullback of the US Treasury yields that weighed on the US Dollar Index (DXY) amid a lack of major catalysts and ongoing inflation chatters. Also favoring the gold buyers is the mixed US housing numbers and policymakers’ indecision over the next moves of the Federal Reserve (Fed).
That said, US 10-year Treasury yields retreat from the highest levels since October 26 to posting heaviest daily fall in a week while ending Wednesday’s US trading session around 1.59%, down 4.3 basis points (bps). DXY tracks bond yields and marks a first negative daily closing in three after refreshing the 16-month top during early Wednesday.
A light calendar and mixed US housing numbers allowed the traders to consolidate recent moves but the ongoing inflation fears and talks of the monetary policy tightening underpin gold’s safe-haven demand as the greenback steps back. US Housing Starts mark a surprise fall in October and the previous readings were also revised down while the Building Permits rose past expectations and prior during the stated period.
Fedspeak keeps trying to push back the inflation fears and tame the rate hike talks. However, the policy hawks aren’t defeated and hence challenge gold buyers. Recently, Charles L. Evans, the chief executive officer of the Federal Reserve Bank of Chicago said, “It will take until the middle of next year to complete the Fed's wind-down of its bond-buying program, even as the central bank remains 'mindful' of inflation.”
It’s worth noting that US President Joe Biden signaled that they have a lot to follow up on despite having a “good meeting” with China’s Xi after the first round of virtual meeting. Alternatively, US Treasury Secretary Janet Yellen announced the extension of the debt ceiling to December 15, versus the previous expiry of December 03, to underpin the risk-on mood earlier the previous day.
Amid these plays, US stocks closed lower and oil had to bear the burden of the US push to the key global energy players to release their strategic reserves.
Moving on, US Weekly Jobless Claims and Fedspeak could entertain gold traders amid a light calendar going forward. However, inflation and rate hike remain the key catalysts to watch.
Technical analysis
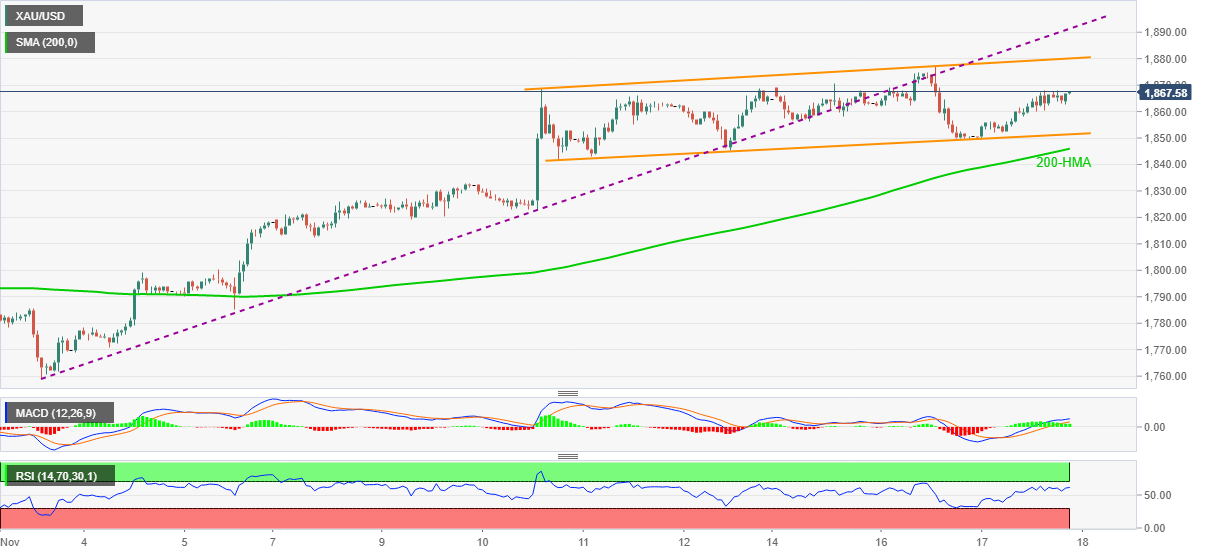
Gold remains on a front foot inside a weekly ascending trend channel. Also validating the bullish bias are the MACD signals, upward sloping but not overbought RSI line and sustained trading beyond 200-HMA.
However, sustained trading below a fortnight-long ascending trend line, around $1,887, restricts short-term advances of the metal. Adding to the upside filter is the upper line of the stated channel near $1,880 and the $1,900 threshold.
Meanwhile, a downside break of the channel’s support line, at $1,850, will defy the bullish formation but the gold sellers will need validation from the 200-HMA level of $1,843 to retake controls.
Following that, gold prices become vulnerable to revisit $1,830 and $1,813-12 support levels before directing the bears to the $1,800 psychological magnet.
Gold: Hourly chart
Trend: Further upside expected
Charles L. Evans, the chief executive officer of the Federal Reserve Bank of Chicago crossed wires, via Reuters, amid early Thursday morning in Asia. The policymaker sounds cautiously optimistic while saying, “It will take until the middle of next year to complete the Fed's wind-down of its bond-buying program, even as the central bank remains 'mindful' of inflation.”
Additional comments
We're going to be looking to see how much additional accommodation is boosting inflation.
If indeed that is the case, we'll be thinking about when the right time to start raising rates will be.
Then at some point we'll let the balance sheet's maturing assets roll off so that we get the size of the balance sheet back down south of where we are.
Gasoline prices are hitting household budgets, will be an economic headwind.
On the other hand, the stock market is high, financial conditions are good.
Optimistic will have a vibrant labor market in 2022.
Looking for inflationary pressures to recede, will be monitoring this well in the middle of 2022.
Would not be surprised if the unemployment rate is 4.5% by the end of 2021.
Had expected a more resilient supply chain than what we have seen.
FX implications
The Fed policymaker’s mixed comments weigh on the market sentiment and dragged the US equities down, also keeping the Treasury yields pressured, following the release.
Read: US 10-year Treasury yield pulls back below 1.60% after earlier hitting three week highs at 1.65%
“The Biden administration has asked some of the world's largest oil-consuming nations to consider releasing some of their crude reserves in a coordinated effort to lower prices and stimulate the economic recovery,” Reuters quotes anonymous sources to convey the news on late Wednesday night.
Key quotes
The Organization of the Petroleum Exporting Countries and allied producers including Russia have resisted calls from President Joe Biden to speed up the rate of their supply increases.
In recent weeks, Biden and top aides have raised the issue with close allies including Japan, as well as with China, the sources said.
White House spokesperson says no decision made on oil reserve release.
US tap of SPR (Strategic Petroleum Reserve) could either be in form of sale and/or loan from the reserve.
US release of oil from reserve needs to be more than 20 mln-30 mln barrels to get message to OPEC.
US asked India, South Korea to consider oil reserve release.
US did not ask European countries to release oil from reserves.
US officials asked large oil-consuming countries to release oil after pleas to OPEC to supply more failed.
FX implications
WTI crude oil prices take offers to refresh the lowest levels in seven weeks, around $77.85 at the latest, following the news.
Read: WTI drops to fresh daily lows under $79.50 despite bullish inventory report
- Despite that UK’s high inflation report increased the odds of a BoE’s rate hike, the British pound fell against the Japanese yen.
- UK’s Consumer Price Index (YoY) for October rose by 4.2%, higher than the 3.9% estimated.
- GBP/JPY: Failure at 154.00 could pave the way for a further correction towards 153 or below.
The British pound gave back some of its weekly gains, despite a higher than expected jump in UK’s inflation. The GBP/JPY declines 0.10%, trading at 153.96 during the day at press time.
On Wednesday in the European session, the Office for National Statistics (ONS) in the UK revealed that CPI for October rose by 4.2%, higher than the 3.9% estimated on a yearly basis, spurring expectations that the December Bank of England’s (BoE) monetary policy meeting, could witness the first rate hike by a major economy central bank, other than the Reserve Bank of New Zealand.
The GBP/JPY in the overnight session slid from 154.70 two-week tops, below the 154.00 as market sentiment dampened throughout the day. That hurt risk-sensitive currencies like the GBP, the AUD, and the NZD, favoring safe-haven peers like the Japanese yen.
Moving back to UK’s macroeconomic data, the Core Consumer Price Index (Core CPI), which excludes volatile items like food and energy for October, also beat estimations, increasing by 3.4%, higher than the 3% foreseen by economists. Wednesday’s macroeconomic data coupled with strong UK employment figures on Tuesday raised the odds of a rate hike by the BoE. That outcome would boost the prospects of higher prices for the British pound, as spreads between the UK and Japan would widen.
GBP/JPY Price Forecast: Technical outlook
-637727813724685050.png)
The daily chart shows the long up-wick on Wednesday’s candlestick price action, which reached a daily top around 154.73, but later retreated beneath the 154.00 figure. Also, GBP bulls failed to break above the top-trendline of a bullish flag, exposing the 50-day moving average (DMA) at 153.42 as the first support level. If the pair extends its correction, the following demand zone would be 153.00, followed by the 100-DMA at 152.64.
Contrary, if GBP/USD bulls reclaim the 154.00 figure, that would expose the November 17 high at 154.73 nearby the top-trendline of the bullish-flag pattern, followed by 155.00, and then the June 24 high at 155.14.
- AUD/JPY has been battered this week but there could still be plenty to go.
- The cross is a risk-off and high beta pair, so inflation risks matter.
AUD/JPY, the forex market's risk barometer, is meeting a critical level of daily support that if broken will potentially lead to the next waterfall sell-off. Inflation concerns are weighing on the pair and the Aussie is out of favour due to the central bank divergences. The following illustrates the latest price action and what could be in store next.
AUD/JPY daily chart

As illustrated, there is potentially a lot of room to go to the downside at this juncture. However, a correction could be in order first:
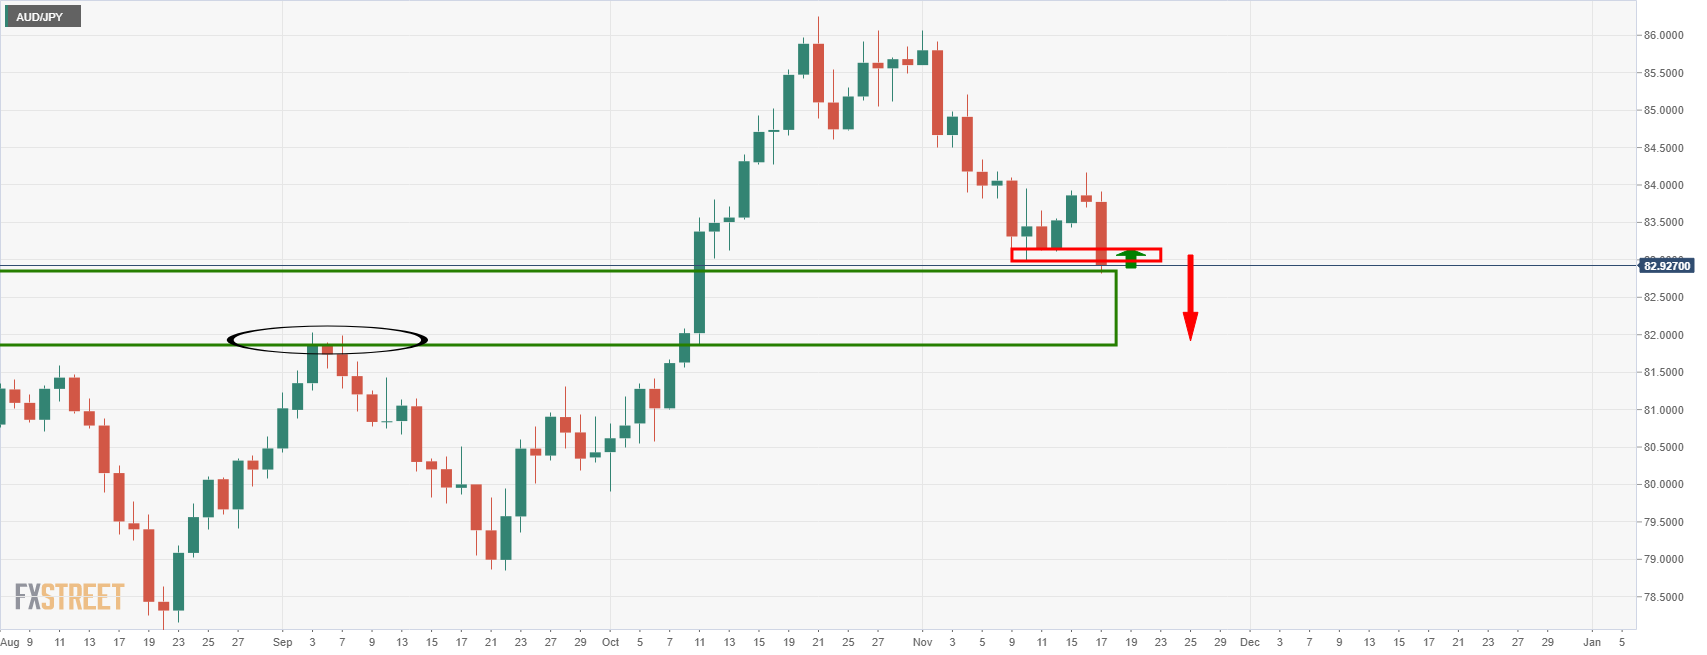
A correction to the old support near 83.16 is probable.
AUD/JPY H1 chart
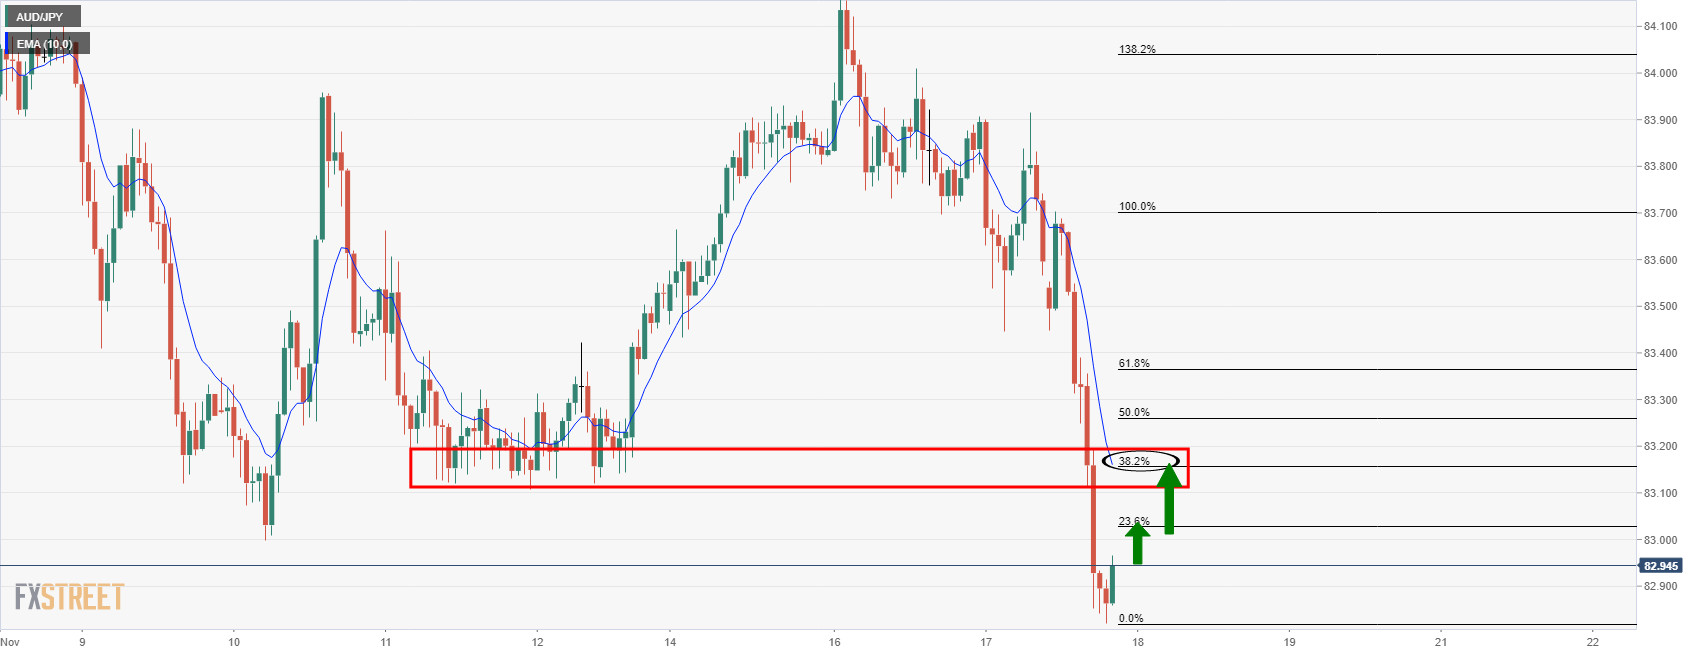
A correction to the old support, as illustrated on the hourly chart above, has a confluence with the 38.2% Fibonacci level. This would be expected to hold and in doing so, attract bears which would result in further supply and a downside continuation in the price for the sessions ahead.
- US 10-year yields pulled back under 1.60% after hitting three-week highs at 1.65% earlier in the session.
- Investors may have to wait until Thanksgiving for a decision on the Fed chair to be announced.
US 10-year treasury yields pulled back from the three-week highs at 1.65% that it printed earlier in the session on Wednesday, eventually falling back below 1.60% for an on-the-day drop of about 3.5bps. Yields were down across the curve, though the decline was most pronounced in the belly. 2s fell 2bps to 0.50%, 5s fell 3.5bps to 1.23%, 7s fell 4bps to under 1.48% and 30s fell 2.5bps to back under 2.0%.
There was no one specific catalyst for the decline. Bond prices have been hit hard in recent sessions by positive US data surprises and seemingly took the opportunity on Wednesday amid the lack of tier one US data to recover some recently lost ground. As bond prices rise, yields fall. US housing data on Wednesday was mixed and did shift thinking on the current state of the US economy or the Fed policy debate. According to the White House, investors may have to wait until Thanksgiving (25 November) before a decision on the Fed chair nomination is announced.
Yields saw short-lived pop higher midway through the session in wake of a $23B 20-year bond auction at 1800GMT. The bonds sold at a high yield of 2.065%, 1.4bps above the When Issued (i.e. the 20-year yield prior to the start of the auction). That compares to a six-auction average tail of 0.5bps, which some traders took as a sign of weaker demand for the 20-year bond. 20-year yields continue to trade higher than 30-year yields. According to Reuters, the 20-year bond is suffering from relatively less demand than for other maturities since its reintroduction back in May 2020.
5-year break-even inflation expectations, calculated by subtracting the 5-year real yield from the 5-year nominal yield, fell on Wednesday. Having been as high as 3.31% on Tuesday, they currently trade at 3.24%. That’s because 5-year TIPS yields were unable to match the rally seen in nominal 5-year yields, instead trading within a -1.90-95% range and set to end the session flat.
What you need to know on Thursday, November 18:
The US dollar’s recent charge higher ran out of steam on Wednesday, with the DXY falling back to the 95.80s by the end of the US session having printed fresh 16-month highs at 96.26 in early Asia trade. The White House said a final decision on the Fed chain nominee would be made before Thanksgiving (25 November, or next Thursday).
Mixed US housing data failed to spur the greenback higher as positive retail sales, regional Fed manufacturing survey and Consumer Price inflation data did in recent sessions. US yields pulled back a little, with the dropping 2bps back to 1.60%, eroding the dollar’s rate advantage somewhat.
JPY was the best performing G10 currency, gaining 0.6% versus the buck as US/Japan rate differentials tightened. USD/JPY fell sharply lower from earlier session highs close to 1.1500, the pair’s highest level since Q1 2017, to test 1.1400.
Pound sterling was the second-best performer, gaining 0.4% versus USD, sending GBPUSD through above a key downtrend that has been capping the price action since the end of October. GBP/USD’s gains have been halted for now at the 1.3500 level, but technicians will eye a move towards the next key resistance at 1.3600.
UK inflation data was hotter than expected, with the Consumer Price Index rising at its quickest YoY pace in more than 10 years at 4.2% in October, supporting hawkish BoE bets and the pound. Brexit newsflow has also been positive, with the UK and EU reportedly on the cusp of agreement on the movement of medicine in and out of Northern Ireland.
Consumer Price Inflation data was also released out of Canada and also showed that price pressures growing there too, though this did not come CAD’s aid, which got battered on Wednesday amid a sharp drop in crude oil prices. USD/CAD hit fresh seven-week highs above 1.2600, up 0.4% on the day.
But the loonie wasn’t the worst performing G10 currency on the day. That title went to AUD, with AUD/USD losing 0.6% and hitting fresh six-week lows under 0.7260 as the pair continues to head lower within a bearish trend channel. Subdued Q3 Australian wage growth data supported the RBA’s dovish stance and undermined the case for rate hikes next year, weighing on the Aussie.
EUR/USD was subdued having recovered from its earlier session plunge to 16-month lows at 1.1260 and was set to end the day flat slightly above the 1.1300 level. US equities were mixed, with the S&P 500 dropping back modestly from 4700, but remains very close to the record highs it printed above 4720 earlier in the month.
In EM FX, the standout mover was the lira, which continued to plunge. USD/TRY rose to fresh record levels above 10.60, a gain of 2.6% on the day, as investors continue to dump the lira amid concerns that the CBRT is sleep walking into hyper inflation. The bank is expected to cut interest rates by another 100bps on Thursday to 15%, despite inflation nearing 20% in October.
- The kiwi was little changed by the end of the North American session.
- NZD/USD will now become a significant focus in forex markets.
- The RBNZ Survey of Expectations for Q4 is released today.
NZD/USD is under pressure in the close of Wall Street as the US dollar attempts to correct some of the losses on the session. The kiwi, however, is little changed in the absence of domestic drivers so far this week. At the time of writing, the pair trades flat at 0.6993 and has stuck to a tight 0.6979 / 0.7020 range.
The day was slightly risk-off which weighed on the higher beta currencies. Equities were down on the day due to concerns over inflation following the UK's stronger Consumer Price Index coupled with the US's earlier in the week.
The mighty US dollar drifted to the downside and ducked below a 16-month high that was printed on Tuesday. Nevertheless, it can be expected to remain elevated and money markets are now pricing in a high probability of a Fed rate increase in June, followed by another in November. CME data suggest a 50% probability of a 25 bps rate hike by July 2022.
The dollar index, DXY, which measures the currency against a basket of six rivals, was down around 0.08% into the close on Wall Street. It was trading at 95.843 at the time of writing and within the day's range of between 95.734 and 96.241. Yesterday's high was 96.266, the best level marked since mid-July 2020. The dollar's rise has also pushed broader FX market volatility higher, with one gauge rising to an 8-month high of nearly 7%.
Time to focus on NZD
''This is all part and parcel of the volatility that we have seen as global markets grapple with turning points and rising inflation, and locally ahead of next week’s RBNZ MPS,'' analysts at ANZ Bank said.
''As the inflation theme takes hold elsewhere (eg UK CPI was stronger overnight), that is seeing a relative re-pricing of the NZD, potentially fanning headwinds. In the wake of a slew of bumper NZ data releases, upside surprises may now be harder to come by.''
This brings us to today's key even. The RBNZ releases the Q4 Survey of Expectations. The headline figure here is the 2-year-ahead inflation expectations measure – which is watched closely for signs that expectations are drifting away from the 2% target.
''The RBNZ’s survey usually lines up well with our own Business Outlook – and if that continued in Q4, then we should see a sizeable uptick in expectations,'' the analysts at ANZ Bank explained.
''But with inflation running at 4.9% (and we think it’ll flirt with 6% in Q1), an increase wouldn’t be too much of a surprise. The real test will be if the 5- and 10-year-ahead measures remain at 2%, since that’s an indication of whether people believe the RBNZ will be successful at getting surging inflation under control. The Survey is the final key data the RBNZ gets before next week’s MPS.''
- EUR/USD sellers, take a breather before resuming another leg-down in the pair.
- EUR/USD recovered amid greenback weakness across the board, blamed on lower US bond yields.
- ECB’s members reinforced the dovish monetary policy stance by the central bank.
The euro trims some weekly losses in the day, gains 0.04%, trading at 1.1318 during the New York session at press time. The shared currency recovers some ground after dipping to a new year-to-date low around 1.1263, mainly driven by US dollar strength as the US T-bond benchmark note rose close to 1.65%, but as of writing, clings to 1.60% falling almost five basis points.
Meanwhile, the US dollar seems to be affected by falling yields. The US Dollar Index (DXY), which measures the greenback’s performance against a basket of six rivals, slides 0.12%, down to 95.79, retreating from 16-months highs, near the 96.00 figure.
The weakening of the US dollar comes despite that the Federal Reserve is tightening its monetary policy. Further, money market futures have fully priced in a rate hike by July of 2022 and increased the odds of another adjustment to the US interest rate by the end of 2022. Therefore, Wednesday’s move could be viewed as a correction before resuming the undergoing downtrend.
Data-wise, in the Eurozone, inflation for October rose by 4.1% on a yearly basis, in line with expectations. The month-over-month reading, which significantly moves the pair, came at 0.8%, also in line with estimations, though it failed to trigger any reaction in the EUR/USD.
Across the pond, the US dollar economic docket features housing data. Building Permits for October rose to 1.65M, higher than the 1.638M expected by analysts. Contrarily, Housing Starts for the same period slowed their pace to 1.52M, lower than the 1.576M foreseen.
ECB policymakers expressions about Eurozone CPI above 4%
Once Eurozone CPI data was known, some policymakers crossed the wires. Olli Rehn, an ECB Governing Council Member, said that the price pressures would ease in the next year. In the same tone, Bruno Le Maire, French Finance Minister, reinforced the “temporary” thesis, saying that it is transitory, but added, “we need to remain vigilant on this.”
Contrarily, adopting a more neutral stance, ECB Governing Council Member and head of the National Bank of Belgium Pierre Wunsch said that “all of us need to be patient, but we shouldn’t exclude that the inflationary forces are quite strong and at some point will require a reaction.”
- AUD/USD extends losses despite a drift lower in the Us dollar.
- RBA uber dovishness finally kicks in and sends AUD off a cliff.
AUD/USD has fallen to fresh cycle lows to meet daily structure in the 0.7260s, sliding from a high of 0.7305. The perfect storm came this week when a stronger US dollar coupled with a dovish Reserve Bank of Australia and hawkish bets on the Federal Reserve fermented
On Wednesday, UK and US equities were softer as well. AUD, as a higher beta currency, suffered as a consequence due to the inflation concerns that are swelling in financial markets. In the same respect, UK inflation came in stronger than expected while supply constraints weighed on housing starts in the US.
Meanwhile, the US dollar has drifted lower from a new 16-month high that was printed on Tuesday as markets position for rate increases from the Federal Reserve. Money markets are now pricing in a high probability of a Fed rate increase in June, followed by another in November. CME data suggest a 50% probability of a 25 bps rate hike by July 2022.
The dollar index, DXY, which measures the currency against a basket of six rivals, is down around 0.13% at the time of writing, trading at 95.788 within the day's range of between 95.734 and 96.241. Yesterday's high was 96.266, the best level marked since mid-July 2020. The dollar's rise has also pushed broader FX market volatility higher, with one gauge rising to an 8-month high of nearly 7%.
RBA uber dovishness
As for the RBA, markets had been betting against the central banks dovish rhetoric. However, the RBA Board minutes and Governor Lowe’s speech were uber dovish and sent the Aussie off a cliff. Key takeaways of these events, courtesy of analysts at ANZ Bank, are as follows:
The RBA’s estimate of the neutral rate as being 2.5% or higher;
The RBA’s willingness to “look through” inflation of 3% or more if it is not accompanied by stronger wages growth;
The implications of a flat Phillips curve when the RBA does start to lift the cash rate; and
Lowe’s weaker wording around a rate hike in 2024 as “still plausible.”
- USD/CAD hit seven-week highs above 1.2610 in recent trade, though his since slipped back a few pips.
- The loonie is suffering from a drop in oil prices, with rising Canadian inflation failing to come to its aid.
USD/CAD hit fresh seven-week highs at 1.2610 on Wednesday, marginally eclipsing last week’s high 1.2604 high. The pair has since dropped back from session extremes a little. Crude oil markets have been under pressure in recent hours, with WTI and Brent both now down by more than $2.0 on the day each and this has been weighing on the oil price-sensitive loonie. Technicians appeared to see an earlier dip back towards the 50-day moving average in the 1.2530s as a buying opportunity. If the pair can break cleanly above 1.2600, then technicians may target resistance at 1.2650, the 6 October high.
CAD’s losses of about 0.25% on the day versus the US dollar make it the second-worst performing G10 currency on the day. Only the Aussie, down about 0.5% on the day versus the buck, is fairing worse. The loonie is underperforming despite the latest Canadian Consumer Price Inflation report confirming that price pressures increased in October earlier in the session. For reference, the headline rate of CPI rose to its highest level since 2003 at 4.7%, up from 4.4% in September. That was in line with median economist expectations, but the negative CAD reaction today suggests that market participants might have been expecting a positive surprise, as was seen in UK inflation data this morning and in the US last week.
In fairness, the Bank of Canada’s core measures of inflation did surprise to the upside. The core measure was up 3.8% YoY, above expectations for a 3.5% rise, while the core measure rose 0.6% MoM, above expectations for a 0.4% jump. Moreover, analysts expect inflation to rise further in the months ahead amid recent disruptions to the port in Vancouver, which has been impacted by deadly flooding and landslides. Analysts at Scotiabank said they see headline inflation surpassing 5.0% by the end of the year. Regarding what all of this means for the BoC, according to Canada-based TD Securities, “this doesn’t change anything” as it was broadly in line with the bank's forecasts.
- GBP/USD bulls stampede on BoE rate expectations.
- US dollar drifts lower following yesterday's spike to fresh cycle highs.
At 1.3490, GBP/USD is trading near to the highs of the day that came in just shy of 1.3495. The pair has moved from a low of 1.3396 and climbed to a one-week high after data showed UK inflation surged to a 10-year high last month.
The pound is firmer across the board due to the expectations of an interest rate hike as early as next month following a week, so far, of better than expected data. On Tuesday, for instance, UK data showed Britain's job market withstood the end of the government's furlough scheme.
Subsequently, the Bank of England is expected to join the Reserve Bank of New Zealand as one of the first major central banks to raise rates since the coronavirus pandemic hit the global economy. The markets are now pricing a 60% chance that the BoE will raise rates at a Dec. 16 meeting.
US dollar drifts below 16-month highs
Meanwhile, the US dollar has drifted lower from a new 16-month high that was printed on Tuesday as markets position for rate increases from the Federal Reserve that is now seen hiking rates by as early as mid-2022. The dollar index, DXY, which measures the currency against a basket of six rivals, is down around 0.13% at the time of writing, trading at 95.788 within the day's range of between 95.734 and 96.241. Yesterday's high was 96.266, the best level marked since mid-July 2020.
- USD/BRL has chopped either side of 5.50 on Wednesday and is currently broadly flat.
- The pair has seen a choppy reaction to new government economic forecasts which raised concerns about stagflation.
USD/BRL is currently trading flat on the day close to 5.50, with the pair having rallied from earlier session lows of just under 5.47. The Brazilian real took encouragement earlier in the session amid reassuring commentary from the Economy Ministry that the government’s spending plans continue to respect the constitutional spending cap, something which it sees as key. The Brazilian real has been weighed in 2021 by concerns about Brazil’s fiscal sustainability amid fears that President Jair Bolsanaro might be tempted to overstimulate the economy ahead of the October 2022 Presidential election.
However, the Economy Ministry also unveiled new fiscal and economic forecasts on Wednesday which seemed to weigh on sentiment amid stagflation fears. GDP growth forecasts for 2021 and 2022 were downgraded to 5.1% and 2.1% respectively (from 5.3% and 2.5%). Meanwhile, inflation forecasts (as measured by the IPCA consumer price index) were lifted higher to 9.7% from 7.9% for 2021 and to 4.7% from 3.75% for 2022.
The Economy Ministry cited higher interest rates as the main reason for the GDP downgrade. For reference, the Brazilian Central Bank (BCB) has been hiking rates aggressively in recent months as it seeks to get a handle on inflation that is not north of 10%, more than 6.0% above the bank’s 3.75% inflation target for 2021. In October, the bank hiked interest rates by 150bps to 7.75% and signaled further hikes would be forthcoming.
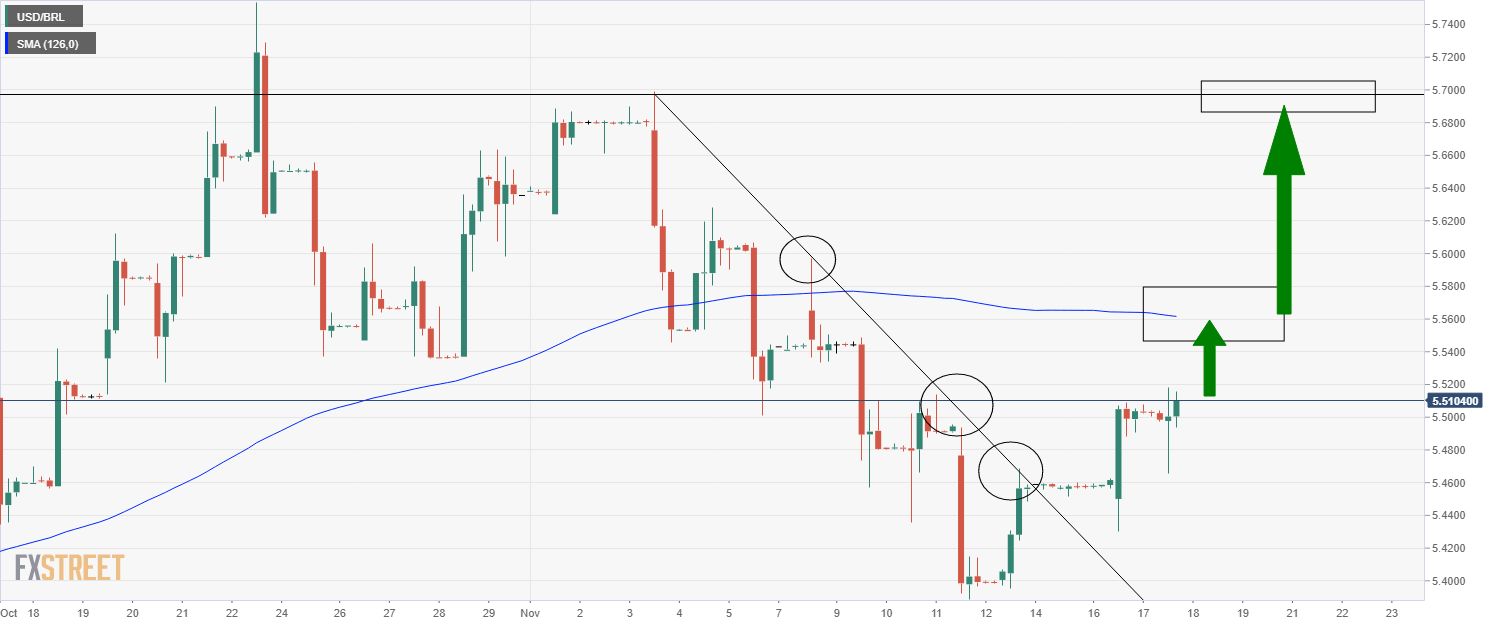
From a technical standpoint, things are looking bullish for USD/BRL. The pair this week broke to the north of a downtrend that had been capping the price action for much of November. This opens up the possibility of a run back towards to 21-day moving average at 5.55 and then the November high at 5.70 beyond it.
- The S&P 500 is losing 0.33%, at 4,684.81, as Target plunges.
- The Dow Jones Industrial follows the S&P lead, down 0.50%, at 35,965.49.
- The heavy-tech Nasdaq Composite rises 0.19%, up to 16,338.50, led by Apple and Tesla.
The S&P 500 retreats from Tuesday’s highs, down some 0.33%, currently at 4,684.81 during the New York session at the time of writing. The market mood is in risk-off mode, portrayed by falling US major equity indices. The Dow Jones Industrial Average (DJIA) also falls 0.50%, at 35,965.49, while the Nasdaq Composite rises 0.19%, up to 16,338.50.
On Wednesday, the US economic docket featured housing data, which came mixed. Building Permits for October rose to 1.65M, higher than the 1.638M expected by analysts. Contrarily, Housing Starts for the same period slowed their pace to 1.52M, lower than the 1.576M foreseen.
Once the data was released, it seemed that traders took some risk off the table as construction slowed down, implying that high material prices and labor shortages are to be blamed. Meanwhile, the tech-heavy Nasdaq rise is led by a rally in Apple and Tesla.
Sector-wise, consumer discretionary, and health advance 0.63%, and 0.26%, respectively. On the other hand, the main losers are energy, financials, and industrials, losing 1.42%, 1.26%, and 0.88% each.
In the bond market, the US 10-year benchmark note falls one basis point, sits at 1.616%, undermining the US Dollar Index, which falls 0.12% in the day, at 95.80.
S&P 500 Price Forecast: Technical outlook
-637727676837672481.png)
The daily chart depicts the S&P 500 has an upward bias, confirmed by the daily moving averages (DMA’s) well located below the index value, with an upward slope. Nevertheless, the Relative Strength Index (RSI) is at 70, well within overbought conditions, suggesting that a lower correction could happen.
In the case of a correction, the first support would be the October 26 high at 4,598.53 that confluences with the 78.6% Fibonacci retracement as the first support level. In the outcome of a further correction, the October 27 low at 4,553.53 would be the next demand zone.
According to the Telegraph, the UK and EU are reportedly closing in on an agreement to protect medical supplies being sent to Northern Ireland, which would mark their first deal in talks over the Northern Ireland protocol, breaking recent deadlock. The Telegraph also reported that the EU had backed down from threats to retaliate against the UK over Article 16.
UK Brexit Minister Lord David Frost and his EU counterpart Maros Sefcovic are scheduled to meet for talks on Friday. Sefcovic had in the past said getting a deal on medicines was "low hanging fruit" that could create momentum for broader talks.
Market Reaction
GBP/USD has recently pushed to session highs in the 1.3490s and the positive news on the Brexit front, which will embolden hopes for a deal before the year's end, may push the cross above 1.3500. GBP has been broadly underpinned on Wednesday by hotter than expected UK inflation data.
- USD/RUB has pulled back sharply from Tuesday’s multi-week highs above 73.50 and is back below 72.50.
- While geopolitics has weighed on the rouble recently, broader Russian fundamentals remain bullish for RUB, argue strategists.
USD/RUB has fallen sharply this Wednesday, reversing the entirety of a 0.8% rally on Tuesday that saw it at one point hit 73.50, its highest levels since mid-September. At present, the pair is trading just to the south of 72.50, though for now is being prevented from pressing any lower by resistance just above 72.00 in the form of the early November highs.
Following a prolonged decline during the summer months/early autumn that saw USD/RUB fall from highs above 75.00 to lows October lows just above 69.00, USD/RUB has been on the front foot in recent weeks. Part of that has to do with a broad strengthening of the US dollar amid a run of strong US inflation and economic data releases that has encouraged USD STIR markets to up their hawkish bets.
But part of the recent rally also has to do with a renewed build-up of risk premia in the RUB as geopolitical tensions mount. The US last week warned the EU that it was worried that Russia might be gearing up for a military intervention into Ukraine. That sent USD/RUB from around 71.50 to above 73.00. There are also concerns about the migrant crisis on the Belarusian/EU border (which Russia is seen as enabling given the country is Belarus’s key ally) and any fallout following a recent Russian anti-satellite missile test which was widely condemned.
Following news earlier in the week that German regulatory agencies had suspended the approval process for the Nord Stream 2 pipeline, European gas prices have spiked. According to German government sources, the suspension could delay the opening of the pipeline until March, after the winter peak of European gas demand. Surging gas prices are likely lending a hand to the energy export-dependent Russian rouble.
Energy prices aside, it seems that most analysts remain bullish on the rouble’s long-term prospects. Matthew Ryan, senior market analyst at Ebury, told Reuters on Wednesday that he was bullish on the rouble because of Russia's solid macro fundamentals and a rising differential between the Central Bank of Russia (CBR) and most other central banks. The CBR, which has hiked rates from record lows of 4.25% to 7.5% already this year to reign in inflation, may hike rates further, and said on Wednesday that a wide range of options would be available to its at its next meeting.
Data released on Wednesday showed inflation in Canada reached the highest level in 18 years. Analysts at the National Bank of Canada still believed the Bank of Canada will hike interest rate probably in April of next year.
Key Quotes:
“The Canadian CPI print for October was in line with the relatively high consensus expectations. As a result, annual inflation reached 4.7%, its highest level in 18 years. Gasoline prices jumped to a record high, registering another sharp increase of 5% during the month. Shelter prices were also propelled by the surge in energy prices. Consistent with the rise in food commodity prices earlier this year, food prices continued to post strong advances in October.”
“The average of the central bank's three preferred measures of annual inflation remained unchanged at 2.7%, above the mid-point of the central bank’s target range of 1 to 3 percent. These annual figures understate the recent trend for core inflation.”
“The central bank already expected high headline inflation for Q4, so this morning's print does not change our view that they will not raise the policy rate sooner as believed by the market. The Bank of Canada telegraphed a first hike in Q2 or Q3 in its last communication, and we continue to believe that April is the most likely scenario.”
- XAU/EUR bulls attack the €1,650 area for the second day in a row.
- XAU/EUR found strong support around the €1,630 area.
- German 10-year real yields keep falling below -2.0%, boosting gold prospects versus the euro.
Gold (XAU/EUR) against the EUR advances during the New York session, up 0.78%, trading at €1,648 at the time of writing. On Tuesday, the eight-day rally was capped as XAU/EUR printed its first close in the red, at €1,636, a tad above the top-trendline of Andrew Pitchfork’s indicator.
In the overnight session, XAU/EUR dropped to the 50-hour simple moving average (HSMA) at €1,634 but found bids around that area that pushed the pair towards a renewed test of the €1,650 year-to-date high, settling at current levels abovementioned.
German 10-year real yields keep falling below -2.0%, boosting gold prospects versus the euro
At press time, the German 10-year Bund yield is flat at the session at -.02405, while the German 10-year real yields are falling, down to -2.066, acting as a headwind for the XAU/EUR.
Earlier in the New York session, ECB’s Governing Council member Isabel Schnabel said that the rise in inflation expectations is a welcome development, per Reuters. She added that the ECB would continue buying bonds at a low level, signaling that a rate hike is not imminent. Hence, it reinforced the dovish posture by the European Central Bank (ECB).
Therefore, XAU/EUR outlook looks positive for the non-yielding metal as the German 10-year real yields keep pushing lower. In fact, that would also hurt the euro’s prospects against the US Dollar as bond spreads widen, extending its fall towards the 1.1300 figure and potentially lower.
XAU/EUR Price Forecast: Technical outlook
Daily chart
-637727629082511700.png)
Despite that XAU/EUR had a down day on Tuesday, the uptrend keeps intact, as long as the daily moving averages (DMA’s) reside below the spot price and if gold keeps trading above the €1,567 price level. Further, Tuesday’s price action formed a spinning-top, closing below Monday’s close, but it failed to break below Andrew Pitchfork’s top-trendline indicator, finding support around the €1,630 region.
The Relative Strength Index (RSI) keeps at overbought levels at 78, though it is flattish, suggesting that gold might consolidate before trying to break above €1,650 for the first time in the year.
In that outcome, the top of Andrew Pitchfork’s channel would be the first support area, around €1,630. Also, a break below the abovementioned could open the door for a further correction, towards November 13, 2020, high at €1,604.
- WTI has turned lower in recent trade, breaking out to fresh daily lows despite a bullish inventory report.
- The report has perhaps been interpreted as increasing the likelihood that the Biden administration taps the SPR.
Front-month futures of the American benchmark for sweet light crude oil, West Texas Intermediary or WTI, have traded on the back foot in recent trade. WTI has broken out to fresh daily lows under the $79.50 level and is now eyeing a test of earlier weekly lows in the $79.30 region. Should that level break, a run towards monthly lows at $78.30 may be in store.
A more bullish than expected official EIA US crude oil inventory report, released recently at 1530GMT, failed to substantially alter the mood in crude oil markets. For reference; headline crude oil stocks posted a surprise draw or 2.1M barrels in the week ending on 12 November versus expectations for a build of just under 1.4M barrels. API inventory data released on Tuesday had pointed to a weekly build of 655K barrels. EIA data showed that gasoline inventories fell by 700K barrels (versus forecasts a 575K barrel draw). Distillate stocks posted an 824K barrel draw (versus forecasts for a 1.229K barrel draw).
Typically, a bullish EIA inventory report would trigger upside in crude oil prices, as it suggests stronger than expected demand for oil and its products. But analysts have argued that larger than expected inventory draws right now might encourage the Biden administration to release crude oil reserves from the US Strategic Petroleum Reserve. The administration has been threatening to do so since the start of the month when OPEC+ refused to lift output by more than 400K barrels per day in December, given their worries about high US gas and energy prices. According to the Chinese press, the US administration has asked China to release crude oil reserves as part of its talks with the US on economic cooperation. US lawmakers are divided over whether or not the SPR should be tapped, with Democrat House Majority Leader Steny Hoyer coming out in disagreement with Senate Majority Leader Chuck Schumer’s call for the SPR to be tapper over the weekend.
- Mexican peso holds a negative bias against the US dollar.
- USD/MXN moving in a new higher, testing upper limit.
- Key support is seen at 20.30/35, horizontal line and trendline.
The USD/MXN is falling marginally on Wednesday after rising during two consecutive days and after posting on Tuesday, the second-highest close of the current month. The stronger US dollar across the board continues to be the key driver in the cross.
Key moving averages pointing north, technical indicators mixed and far from extreme readings, are tilted to the upside in USD/MXN. Also supporting the bullish outlook is price holding above the 20, 55 and 100 simple moving averages and above a short-term uptrend line that today stands at 20.30.
The positive outlook would be negated with a slide under 20.30 that would target initially the 20.20 area and below the October low at 20.10.
On the upside, the critical resistance is seen at around 20.85/90. A consolidation above would clear the way for a test of 21.00; above the next strong resistance is located at 21.15.
USD/MXN daily chart
-637727588198710703.png)
Economists at ING believe the Riksbank will not meet market expectations of tightening in 2022. Still, RB is expected to take a hawkish stance later next year, which should drive the EUR/SEK pair to 9.65, in their opinion.
Waiting for the Riksbank’s delayed hawkish turn
“The market is currently pricing in around 50bp of monetary tightening by the Riksbank in 2022. We think such hawkish expectations are unwarranted given a relatively subdued medium-term inflation outlook in Sweden. We expect no hikes before 2023, and we think the RB will push back against the market’s hawkish bets in November and possibly until early-2022. Still, tightening plans elsewhere and a robust domestic story should force a hawkish shift in communication by 2H22.”
“Our trade team expects global demand to stay strong, while supply strains may keep hindering the trade rebound in 1H22 before easing in 2H22. We expect a YoY increase in global trade by 2.9% in 2022. More than half of Swedish exports are intra-EU and while we do not see eurozone growth exceeding expectations, we still forecast a decent 3.9% YoY for 2022, which should keep supporting the Swedish export industry.”
“We expect SEK gains to prove more moderate. We target 9.65 in EUR/SEK for the end of 2022.”
The Norwegian krone has already benefitted in the past few months from being a large energy exporter, but the positive implications for the Norwegian economy are likely there to stay. Therefore, analysts at ING expect the EUR/NOK to edge lower towards 9.50.
Still a bright outlook for the krone
“We must remember that, unlike other exporters, Norway’s low hydro reserves makes it prone to a sharp rise in domestic energy costs. There is a non-negligible risk that the country may face a situation where higher costs of living may coincide with wider room for wage increases as investments rise and the job market tightens; the result could be a considerable heat-up of the economy and inflation.”
“We think the growth and inflation outlooks will continue to support the Norges Bank’s tightening plans, which currently imply three hikes in 2022 after the already announced hike in December. We think the risks are skewed towards the central bank overdelivering (four hikes in 2022). Still, even with three hikes next year, a policy rate at 1.0% means that NOK will be at the forefront of benefitting from any revamp of carry trade interest in G10.”
“Our bullish views on NOK rely on the assumption that global tightening cycles will not generate a persistently risk-averse environment in markets next year. Despite this year’s extended downtrend, EUR/NOK is still around 7% overvalued according to our medium-term BEER model, and we see room for a move to 9.50 by 4Q22.”
- USD/JPY slides from year-to-date tops near 115.00, as USD bulls take a breather.
- Money market futures have fully priced in a Fed 25 basis point rate hike by July 2022.
- The US 10-year Treasury yield and the US dollar are flat in the session, thus strengthening the Japanese yen.
The USD/JPY struggles at the 115.00 figure, is down 0.24%, trading at 114.55 during the New York session at the time of writing. Sentiment-wise, the market is a mixed bag, as European stocks fluctuate between gainers and losers. Also, US equity indices seem poised to open down, as futures trade in the red at press time, as investors worried about early rate hikes by the Federal Reserve on robust economic data.
In the overnight session, the USD/JPY attempted an attack towards the 115.00. However, it did not have the strength to overcome strong resistance, thus retreating towards Wednesday’s daily central pivot point at 114.57, where it found some buying pressure, jumping towards the 114.70 area.
The US Dollar Index, steady around 95.90, USD bulls prepare an attack towards 96.00
In the meantime, money markets futures have fully priced in a 25 basis point rate hike by the US central bank by July 2022, one month after the Federal Reserve stops buying assets. After a 30-year spike in the US CPI, investors seem convinced that the Federal Reserve will need to act fast, to curb elevating prices, reflecting it, in the bond market. Further, the US 10-year yield advances one basis point, sitting at 1.64%, acting as a headwind for the USD/JPY.
The US Dollar Index, which measures the buck’s performance against a basket of its peers, is flat in the day, at 95.90, underpinned by the US 10-year benchmark note.
Putting this aside, on the macroeconomic front, the Japanese economic docket, exports growth decelerate to an 8-month low, as demand for Autos slowed down, as global supply constraints hit Japanese manufacturers. According to sources cited by Reuters, “while carmakers are planning ‘revenge production’ in November and December, clouds still loom - semiconductor shortages will last until year-end at least, and no one knows if carmakers’ plans to avert the impact of chip shortages by adjusting their supply chains would succeed.”
In the US economic docket, housing data came mixed, although it seems to be ignored by investors. Building Permits for October rose to 1.65M, higher than the 1.638M expected by analysts. Contrarily, Housing Starts for the same period slowed their pace to 1.52M, lower than the 1.576M foreseen.
Therefore, the USD/JPY leans in the dynamics of the US bond yields, which act as a tailwind for the pair. If the 10-year benchmark note, remains unchanged, that could be positive for Japanese yen bulls, pushing the pair down. However, USD bulls seem to be pausing before launching an attack towards the 115.00 figure.
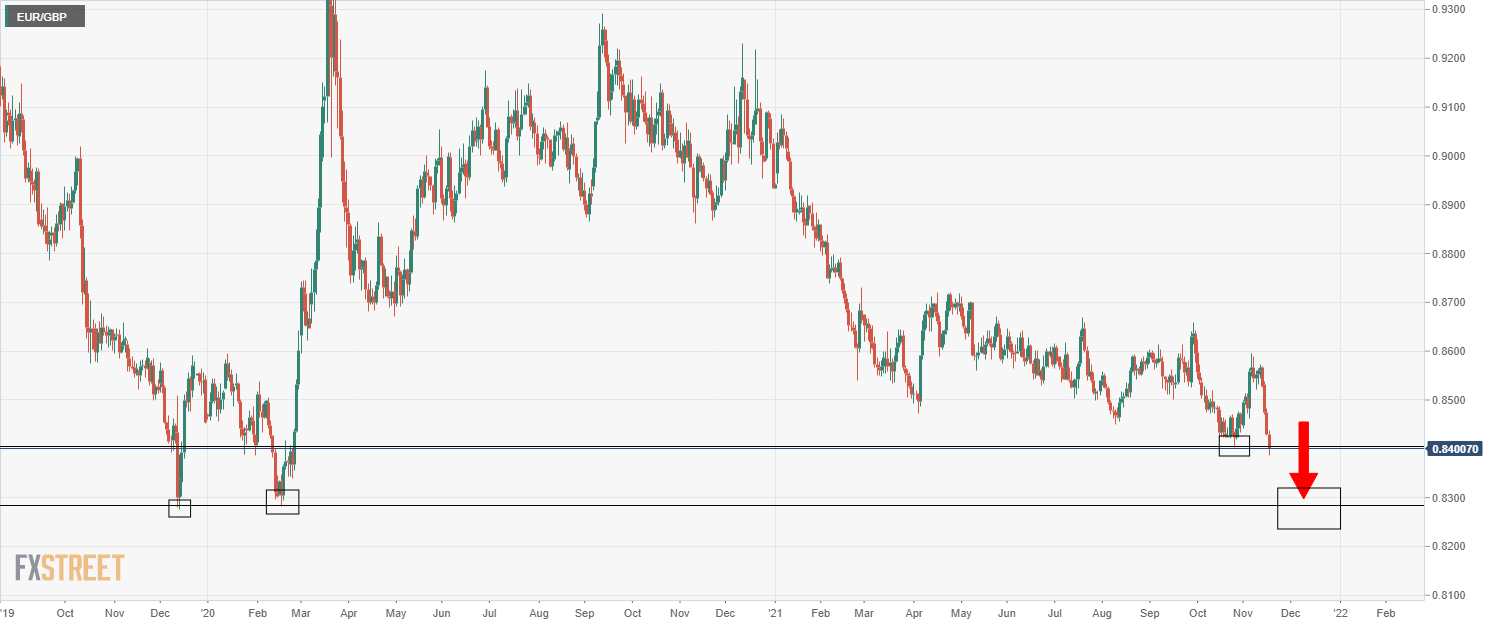
- EUR/GBP has printed fresh 21-month lows in recent trade under 0.8390.
- The pair has been weighed on Wednesday by strong UK inflation data.
- But the euro is also suffering from its own problems.
Over the last few hours, EUR/GBP has reversed lower, with the pair crossing back below the 0.8400 level in recent trade and printing new 21-month lows under the 0.8390 level. The pair has been trading heavily on Wednesday due to a hotter than expected UK Consumer Price Inflation (CPI) report for October. Headline UK CPI rose to 4.2%, above expectations for a rise to 3.9%. Analysts broadly agreed that the inflation data supported the case for a BoE rate hike in December. According to Lloyds, though CPI “is still generally expected to start to ease back from H2 2022 onwards... an extended period of above-target inflation and indications that the labour market remained strong after the furlough scheme ended means that a Bank of England interest rate rise next month remains in play”.
After a second consecutive day of positive UK data surprises (recall that jobs data released on Tuesday was broadly seen as better than expected), traders are clearly viewing EUR/GBP as a sell on rallies. That likely explains why EUR/GBP early European session to attempt to rally back towards the mid-0.8400s was faded. Now that the pair has cleared the previous year-to-date low from back in October at just above 0.8400 to the downside, technicians will be asking what is next. The next target for the bears is likely to be the late 2019/early 2020 lows just below 0.8300.
Euro weakness
Traders and analysts are noting the vulnerability of the euro on multiple fronts. Firstly, ECB rhetoric remains resolutely dovish, meaning the ECB monetary policy normalisation timeline remains well behind that of the Fed and BoE’s. Secondly, Covid-19 infections and hospitalisations are rising sharply in the Eurozone, prompting some countries to reimpose restrictions on day-to-day life, risking an economic slowdown in Q4 2021 and Q1 2022. Finally, European gas prices (the bloc is dependent on imports) are surging following the news of a delay to the approval process of the Nord stream two pipeline, which is now not expected by analysts to start pumping gas until the end of winter, after demand has peaked.
Chile’s peso has suffered. Despite likely aggressive hikes from the local central bank, economists at ING expect USD/CLP to press 875/900 as copper turns lower.
Peso needs some assistance
“Front and centre now is the first round of the presidential election to be held on 21 November. Most recent opinion polls point to the left-wing threat of Gabriel Boric fading and conservative candidate Jose Kast likely to win in a run-off on 19 December. That could provide a little more stability to the peso, as could any sign that Congress is blocking any further release of private pensions.”
“The CBC has been aggressive in its tightening and is talking about bringing the policy rate to neutral more quickly than expected. Where is neutral? The policy rate was 3.00% pre-pandemic, but we suspect that neutral now could be closer to the 5% area seen a decade ago.”
“Our commodities team warns that copper could average closer to the $8,650/MT area through 2022 – clearly a negative for the peso.”
“At this stage, we are concerned for the peso’s prospects next year and a stronger dollar/higher US rate environment could see USD/CLP pressing 850/900.”
As economists at ING note, the combination of loose fiscal policy and tight monetary policy has typically not been a positive one for the Brazilian real. They see USD/BRL heading towards 6.00 as the left makes a challenge for control into October.
Policy mix undermines BRL
“It looks as though Brazil’s post-pandemic policy mix could be heading in the wrong direction. This can be categorised as a pre-election government looking to find loopholes in the constitutional spending cap and deteriorating fiscal risk premia forcing the central bank into even more aggressive rate hikes.”
“Brazil holds presidential elections on 2 October 2022 with a run-off on 30 October, if necessary. Candidates have yet to declare, yet it seems that President Bolsonaro could be facing a challenge from former President Lula. Latest opinion polls favour Lula in a run-off. The previous Lula administration was synonymous with unfunded government spending and Brazil’s loss of investment grade status. Brazil’s fiscal credibility looks as though it will come under pressure through 2022.”
“Given a strong dollar environment and elections in 2022, we favour USD/BRL trading towards the 6.00 area through the year.”
- EUR/JPY recorded new lows near 129.40 earlier on Wednesday.
- The strong mood in the dollar keeps weighing on the single currency.
- US 10y yields trade without a clear direction around 1.64%.
Further selling pressure in the European currency dragged EUR/JPY to fresh lows in the 129.40 region on Wednesday.
EUR/JPY looks to yields, risk trends
EUR/JPY resumes the downside and rapidly leaves behind Tuesday’s uptick. The continuation of the downtrend reached the 129.40 region before bouncing earlier in the session. In this area also coincides a Fibo level (of the October rally) and is considered the last defense before an assault to the October lows around 128.30.
The lack of direction in yields of the key US 10y note motivated the greenback to give away part of the earlier advance, while mixed results from the US housing sector also collaborated with the knee-jerk in the buck.
Earlier in the euro docket, the final October CPI in the euro area rose 4.1% YoY and 2.0% when it comes to the Core CPI. In Japan, the trade deficit shrank to ¥67.4B in October (from ¥624.1B) and Machinery Tools Orders expanded 12.5% in the year to September.
EUR/JPY relevant levels
So far, the cross is losing 0.26% at 129.64 and a surpass of 130.18 (100-day SMA) would expose 130.49 (200-day SMA) and then 131.41 (high Nov.10). On the downside, the next support comes at 129.41 (78.6% Fibo of the October upside) followed by 128.33 (monthly low Oct.6) and finally 127.93 (monthly low Sep.22).
ECB Governing Council Member Isabel Schnabel said that the rise in inflation expectations is a welcome development on Wednesday, according to Reuters. The ECB is carefully monitoring German wage developments, she added, noting that union demands are relatively high but actual outcomes are likely to be much lower.
Schnabel added that continuing to buy bonds, even at a low level, could signal to markets that a rate hike is not imminent. Perhaps this is a lesson learned by observing the Fed's struggles to convince markets that the ending of its QE taper does not mean the start of rate hikes.
For reference, Eurozone 5-year 5-year forward inflation swaps (i.e. inflation expectations for the five years starting in five years time) rose back above 2.0% on Wednesday for the first time since late October, boosted by rising European gas prices.
Market Reaction
EUR/USD continues to struggle and is trading just above 1.1300, not far above annual lows in the 1.1260s.
Economists at ING believe the bright outlook of the Canadian economy is set to fuel the Canadian dollar. They expect the USD/CAD pair to hover around 1.20 next year.
Loonie is the safest commodity currency
“We expect oil to average $76/bll (Brent) in 2022, with a gradual return to surplus driving prices moderately lower. Such a gradual downtrend should not be enough to undermine the recovery in the Canadian oil and gas industry. Being a very open economy, Canada is also set to benefit from the further recovery in global trade. As 70% of Canada’s exports head to the US, long-CAD should continue to be a proxy trade for the strong US growth story.”
“In Canada, the jobs market is at pre-pandemic levels, record-level investments keep supporting the growth outlook and a very successful vaccination campaign is allowing a loosening of the so-far very strict border policy. The domestic economic story is set to remain a positive for CAD, and partly shield it from any risk-off waves or USD appreciation.”
“We currently forecast four 25-bp rate hikes in 2022, so expect only limited scope for a re-pricing of tightening expectations.”
“Having the lowest volatility among G10 commodity currencies, CAD may emerge as a popular carry bet against low-yielders next year. We think CAD has the lowest downside risk in the commodity FX space and expect USD/CAD to stay closer to 1.20 rather than to 1.25 in 2022.”
Bank of England Monetary Policy Committee member Catherine Mann said on Wednesday that, going into 2022, it is less clear if companies will have less pricing power, so we think core goods inflation will moderate.
Market Reaction
GBP/USD continues to push to fresh highs in the 1.3470s and EUR/GBP has recently fallen back under 0.8400. GBP has been performing well on Wednesday following strong UK Consumer Price Inflation (CPI) data which showed the YoY rate of CPI rising to 4.2% in October from 3.1% in September, a 10-year high.
The EUR/USD’s break of 1.1310 saw sharp selling past the figure before a reversal from the 1.1270. This level currently stands as a support, but economists at Scotiabank think the pair is set to slide below it.
Resistance is seen around 1.1325
“The 1.1270 level will stand as support through the session – while oversold conditions possibly limit downside. EUR/USD may see some buying interest on dips below the figure, but strong downward momentum should see the pair close under the level soon and there are no notable support markers except for the big figure areas.”
“Resistance is ~1.1325 followed by 1.1350/60.”
Economists at ING think the cable can hold onto its 2021 gains unlike a market generally more pessimistic on the pound. What’s more, the Bank of England (BoE) is set to hike rates in December, underpinning GBP.
Reports of sterling’s demise look exaggerated
“A common refrain now from GBP bears is that the Bank of England is about to make a policy error. The argument goes that the BoE is set to tighten policy at exactly the wrong moment. We see a reasonably healthy UK growth profile next year, initially running at 1% QoQ. That should allow the BoE to hike 15bp this December and a further 50bp in 2022.”
“GBP bears point to London’s thorny relationship with Brussels and the risk that the EU-UK Trade and Cooperation Agreement falls apart. We take on this is a reminder that this agreement is barely better than a No Deal Brexit. Additionally there is plenty of scope for last-minute position adjustment from both sides and we doubt 2022 becomes characterised as a year of looming Brexit deadlines.”
“We think GBP can withstand the strong dollar onslaught better than some. We doubt cable has to trade substantially under 1.30 and expect the early BoE tightening to provide GBP with a cushion.”
Gold has taken out the 2020-2021 downtrend at $1,832/34. However, Tuesday’s key day reversal points to some near-term consolidation ahead of further gains, Karen Jones, Team Head FICC Technical Analysis Research at Commerzbank, reports.
Previous resistance now acts as support at $1,832/34
“The close above $1,835 is key longer term, it has targeted $1,917/22, the May 2021 peak and 61.8% retracement and the 2011 high. This will act as the breakup point to the $1,965 November 2020 peak and the 78.6% retracement at $1,989. This is the last defence for the August 2020 peak at $2,072.”
“Please note that Tuesday’s price action was a key day reversal and we may see some near-term slippage/consolidation.”
“Dips lower should find initial support at $1,834 and is likely to be contained by the 200-day ma at $1,791.”
See – Gold Price Forecast: XAU/USD to struggle to rally on a peak in inflation expectations – Credit Suisse
Economists at ING expect the euro to underperform against the dollar in 2022. They forecast the EUR/USD pair at 1.10 by the end of 2022.
Most roads lead to a stronger dollar
“It now looks as though the Fed may hike rates next summer. Good growth momentum going into 2022 (we forecast GDP at 5%) backed by strong corporate and consumer balance sheets should mean that pricing power holds and inflation stays above 3% all year. A stronger dollar can play a role in tightening monetary conditions.”
“Pricing of the ECB policy path fell foul and at one point nearly 30bp of tightening was priced in for 2022. We view that pricing as extreme and unlikely, although it may take eurozone inflation dipping into next spring before the market backs away from that kind of pricing. The eurozone is still expected to run a 0.5% of GDP negative output gap in 2022 and the ECB has made it pretty clear it does not want to repeat the mistakes that Trichet made by tightening policy in July 2008.”
The main risk to the above scenario is probably stagflation, where early hikes to address a transitory price shock trigger a recession. The current Fed seems light years away from the Volcker Fed of the early 80s, thus we would see this scenario as unlikely. Even if it were to materialise, stagflation would be negative for risk assets and probably provide support for the anti-cyclical dollar.”
“Perhaps the only scenario for a much stronger EUR/USD in 2022 would be a strong global recovery, a eurozone renaissance and a Fed turning dovish. With supply chain disruptions expected to weigh on growth in manufacturing-heavy Europe next year, such a scenario seems unlikely.”
“ Recent terms of trade changes have depressed EUR/USD fair value to around 1.10. That is our year-end 2022 forecast which is well below the consensus of 1.18.”
In a speech on Wednesday, ECB Governing Council Member Isabel Schnabel said that global and Eurozone economic activity had started to moderate, and that uncertainty had increased around the pace and extent of the slowdown in inflation. Nonetheless, Schnabel said that the fear of stagflation appeared to be unfounded, and reflation, not stagflation, remained the defining theme of our times.
More persistent supply bottlenecks imply that part of the increase in production and demand that was expected in 2021 and 2022 may now materialise later on. However, Schnabel conceded that there were concerns that the slowdown may be more abrupt and more enduring.
Thus, Schnabel continued, monetary policymakers need to focus on the entire range of possible outcomes to ensure that they will be able to deliver on their mandate. On the one hand, she reasoned, this means avoiding the mistake of a premature tightening of monetary policy in response to a temporary and possibly short-lived inflation spike. On the other, she continued, it means keeping a watchful eye on the upside risks to inflation that financial markets currently anticipate and retain optionality to be able to act if needed.
ECB’s Schnabel added that, in all likelihood, the output gap in the Eurozone will turn positive in 2022 and will be significantly positive in 2023 and beyond.
Market Reaction
EUR/USD has not seen any notable reaction to Schabel's comments, with the pair going sideways around 1.1300 in recent trade. Her comments about the output gap turning positive in 2022 and then significantly positive in 2023 and beyond may lend support to market expectations for ECB rate hikes from 2023.
- USD/CAD gained positive traction for the second successive day on Wednesday.
- Weaker oil prices undermined the loonie and acted as a tailwind for the major.
- The underlying USD bullish tone remained supportive of the intraday move up.
- Canadian CPI/mixed US housing market data did little to provide any impetus.
The USD/CAD pair caught some bids during the early North American session and shot to the 1.2600 neighbourhood or fresh weekly highs in the last hour.
The pair gained some positive traction on Wednesday and built on the previous day's goodish rebound from levels below the key 1.2500 psychological mark. A softer tone around crude oil prices undermined the commodity-linked loonie and turned out to be a key factor that acted as a tailwind for the USD/CAD pair. The uptick, however, lacked strong bullish conviction amid some US dollar profit-taking from a 16-month peak touched earlier today.
On the economic data front, the headline Canadian CPI rose 0.7% in October from 0.2% previous, while the yearly rate accelerated to 4.7% from 4.4% in September. Meanwhile, the Bank of Canada's core CPI edged higher to 3.8% YoY rate as against estimates for a dip to 3.5% from 3.7% previous. From the US, the disappointment from Housing Starts was largely offset by an unexpected rise in Building Permits and did little to provide any meaningful impetus.
That said, the prevalent cautious mood around the equity markets, along with hawkish Fed expectations and elevated US Treasury bond yields continued lending some support to the greenback. This, in turn, was seen as a key factor that provided a fresh lift to the USD/CAD pair, with bulls now looking to reclaim and build on momentum beyond the 1.2600 mark.
Technical levels to watch
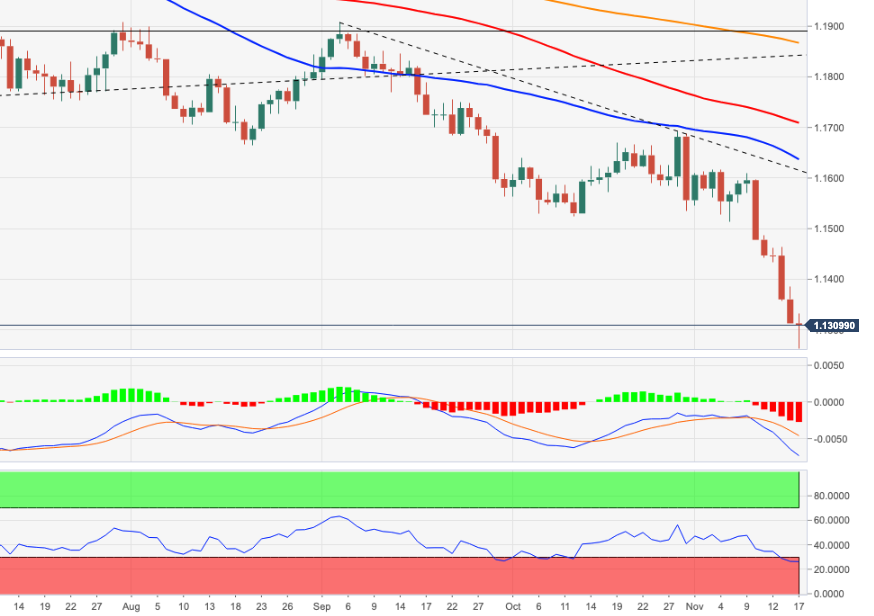
- EUR/USD recorded new lows near 1.1260 on Wednesday.
- A deeper move could see 1.1185 retested in the short term.
Sellers remain well in control of EUR/USD and dragged it to the area of fresh 16-month near 1.1260 earlier on Wednesday.
The continuation of the downtrend appears favoured in the short-term horizon. That said, a breach of YTD low at 1.1263 (November 17) should aim to a drop further south to July’s 2020 low at 1.1185 ahead of 1.1168 (low June 19 2020).
In the meantime, extra losses remain on the cards as long as the pair trades below the immediate resistance line (off September’s high) today near 1.1610. In the longer run, the negative outlook persists while below the 200-day SMA, today at 1.1865.
EUR/USD daily chart
- Headline CPI came in at 4.7% YoY, in line with forecasts.
- But the BoC's Core measures of inflation were hotter than expected.
The annual rate of headline Consumer Price Inflation (CPI) in Canada rose to 4.7% in October, in line with median economist forecasts and up from 4.4% in September, according to data published by Statistics Canada on Wednesday. MoM, headline CPI rose at a pace of 0.7%, also in line with forecasts.
The Bank of Canada's Core CPI measure, which excludes food and energy prices, saw a surprise jump to 3.8% YoY from 3.7% last month. The median analyst forecast was for the YoY rate to fall to 3.5%. The increase was driven by a faster than expected 0.6% MoM jump in the Core price index, which was above expectations for a 0.4% MoM rise.
Market Reaction
USD/CAD has seen kneejerk strength in wake of the inflation data, despite the BoC Core measures coming in hotter than expected. The pair jumped from around 1.2550 to current levels in the 1.2570s, where it currently trades higher by about 0.2% on the day. Perhaps some market participants had been positioned for a positive surprise on the headline measures of inflation.
Nonetheless, with inflationary pressures continuing to rise in Canada in October, pressure is growing on the BoC to respond with policy tightening. Money markets are betting their first rate hike will come in Q1 2022, despite the insistence from monetary policymakers that the output gas won't be closed until the middle quarters of 2022 (a necessary condition the bank has laid out for rate hikes).
- Housing starts fell 0.7% MoM in October versus forecasts for a 0.6% rise.
- But Building Permits beat expectations for a 3.5% MoM decline by a wide margin, coming in at +4.0%.
Housing starts in the US fell by 0.7% MoM in October after (a downwardly revised from -1.6%) 2.7% drop in September, according to data published jointly by the US Census Bureau and the US Department of Housing and Urban Development on Wednesday. That was below expectations for a 0.6% MoM rise.
Meanwhile, Building Permits rose 4.0% MoM in October following a 7.7% decline in September. That was well above expectations for a further drop of 3.5%.
Market Reaction
FX markets have seen a very minimal reaction to the latest US housing numbers so far and the DXY continues to consolidate slightly to the south of the 96.00 level.
USD/CHF is now at key medium-term resistance at 0.9322/30. Analysts at Credit Suisse expect a short-term pause here, ahead of further medium-term strength.
0.9323/30 remains a key medium-term inflection point
“Given the importance of the 0.9322/30 resistance and the confluence of USD levels across G10 FX, we expect to see a short pause here over the next couple of days. Thereafter though, given the bullish short and medium-term momentum, we expect a break above 0.9322/30 in due course, which would be a very bullish signal in our view to open up 0.9356/70 next.”
“Near-term support stays at 0.9236/32, then, more importantly, the ‘neckline’ to recently completed base at 0.9177/72, which we expect to hold to keep the market on a direct upward trajectory.”
- A combination of factors assisted gold to regain positive traction on Wednesday.
- Expectations for early policy tightening by major central banks should cap gains.
- Inflation fears should act as a tailwind and attract fresh buying on any pullback.
Gold regained some positive traction on Wednesday and reversed a part of the overnight retracement slide from the highest level since June. The UK consumer inflation figures released earlier today added to worries about the continuous surge in prices. This, along with the prevalent cautious market mood, benefitted the safe-haven precious metal's appeal as a hedge against inflation. Apart from this, the intraday US dollar pullback from a 16-month peak provided a modest lift to the dollar-denominated commodity. That said, expectations for early policy tightening by major central banks could act as a headwind for the non-yielding yellow metal and cap gains, at least for the time being.
The markets have been betting on yet another rate hike by the Reserve Bank of New Zealand (RBNZ) later this month. Moreover, Tuesday's upbeat UK employment details and the UK CPI print on Wednesday reassured an imminent rate hike move by the Bank of England in December. Investors also seem convinced that the Fed would be forced to adopt a more aggressive policy response to contain stubbornly high inflation. Tuesday's upbeat US Retail Sales data reaffirmed speculations for an eventual Fed rate hike by July 2022. Moreover, the Fed funds futures indicate a high likelihood of another raise by November, which was evident from the overnight rally in the US Treasury bond yields.
Nevertheless, gold, so far, has managed to stick to its intraday gains and was last seen hovering near daily highs, around the $1,865 region, heading into the North American session. Market participants now look forward to the US economic docket, featuring the second-tier releases of Building Permits and Housing Starts. The data might do little to provide any meaningful impetus. Hence, traders will take cues from speeches by influential FOMC members. This, along with the US bond yields, will drive the USD demand and provide some impetus to the commodity. Apart from this, the broader market risk sentiment could further assist traders to grab some short-term opportunities around the XAU/USD.
Gold daily chart
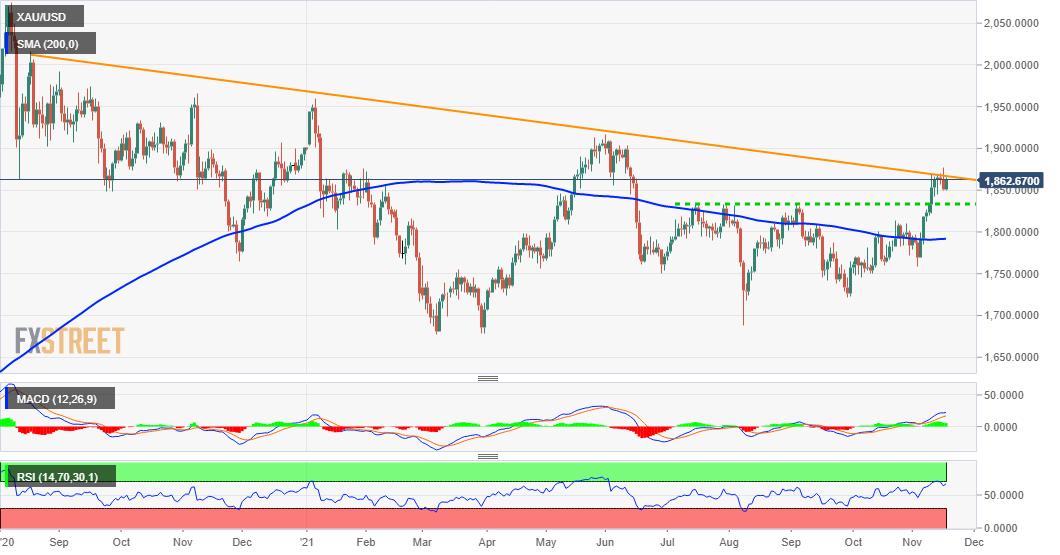
Technical outlook
From a technical perspective, the previous day’s downfall validated a downward-sloping trend-line resistance extending from August 2020. The mentioned barrier, currently, around the $1,870 area, should act as a key pivotal point and help determine the near-term trajectory for gold prices. A convincing breakthrough, leading to a subsequent move beyond the $1,877 level, or the overnight swing high, would be seen as a fresh trigger for bulls. This, in turn, should pave the way for a move towards reclaiming the $1,900 mark for the time since June. The momentum could further get extended towards the next relevant hurdle near the $1,910-12 supply zone.
On the flip side, the $1,850-48 region now seems to have emerged as immediate strong support. Some follow-through selling has the potential to drag gold back towards testing the $1,834-32 strong resistance breakpoint, now turned support. The corrective fall, however, might still be seen as a buying opportunity and remain limited.
Turkish state energy firm BOTAS will tap the CBRT's forex reserves to help support the lira as gas prices continue to climb ahead of peak consumption during winter months, Reuters reported citing two officials. The Turkish government reportedly hopes the move to draw on the central bank's foreign exchange reserves will help to limit any further losses for the Turkish lira, which has weakened to just under 10.50 per dollar on Wednesday.
Reuters notes that an increase in demand from BOTAS could limit the tepid recovery seen in the CBRT's forex reserve holdings, which were depleted in 2019 and 2020 after the bank spent some $128 billion to fight TRY weakness. At present, the CBRT has $125B in reserves, though net holdings are negative once swaps with local banks are factored into the calculation. Reuters cited one trader as saying that BOTAS demand for FX reserves could exceed $1B per month this winter.
Market Reaction
USD/TRY has seen a modest blip higher in recent trade from under 10.46 prior to the news to current levels around 10.48.
The Turkish lira remains under severe pressure, with USD/TRY having surged above 10.50 earlier in the session for the first time ever. Traders are concerned about the fact that the CBRT is expected to continue cutting interest rates despite Consumer Price Inflation (CPI) nearing 20% YoY in October. There are fears that Turkey might be headed towards hyperinflation and for a full-scale currency and balance of payments crisis. If higher demand from domestic companies puts downwards pressure on CBRT forex reserves, it hampers the ability of the central bank to purchase liras and fight currency weakness.
- AUD/USD continues to languish below the 0.7300 level in wake of not as strong as hoped Australian wage price growth.
- Analysts said the data supports the RBA’s dovish stance.
AUD/USD continues to struggle to reclaim a hold of the 0.7300 level, after the pair took a hit during Asia Pacific trade following not as strong as hoped for data on Australian wage price growth. The pair printed lows is the 0.7260s during the APac trade and then rejected an attempted move above 0.7300 shortly prior to the start of the European session. AUD/USD then fell back to the 0.7270s but has since recovered (again), though the pair has not been able to push back above 0.7300 just yet.
At current levels, the pair trades with losses of about 0.1% on the day, though is down about 0.5% on the week. The US dollar has been surging higher in recent sessions boosted by strong US data and an associated hawkish Fed tightening bets. But these gains have been concentrated against the low-yielding euro, yen and Swiss franc and less so against more risk-sensitive currencies like the Aussie. The US dollar’s surge has eased on Wednesday as traders take a breather ahead of more US data at 1330GMT (this time housing data), more Fed speak (six FOMC members are scheduled to appear) and a 20-year bond auction.
In terms of the technical outlook, while intra-day trading conditions remain consolidative and rangebound, the long-term outlook continues to look negative. AUD/USD failed to break to the north of its 50-day moving average, as well as to the north of descending trendline that has been capping the action since the start of the month on Monday. Thus, it seems likely that the path of least resistance for the pair is to continue heading lower. Technicians may target the 6 October low at 0.7225 as the next stop.
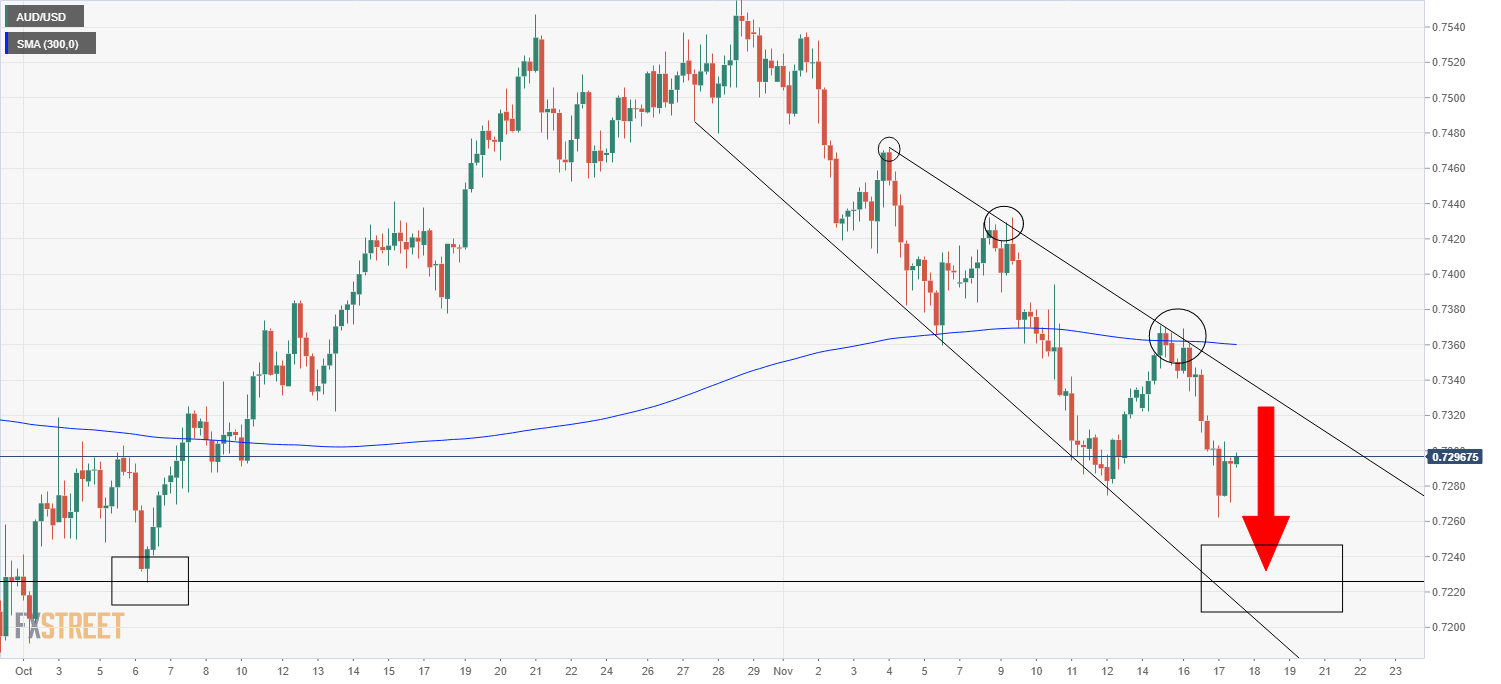
Sluggish Aussie wage growth supports RBA dovish stance
The Australian Wage Price index rose at 2.2% YoY in Q3, in line with economist forecasts. There had been some outside calls that the data would surprise to the upside and put pressure on the RBA to start hiking interest rates in 2022. The chief Australia economist at HSBC Paul Bloxham told Reuters that “it's clear that wages growth is well below the 3-4% rates that were the norm a decade ago and the sorts of rates the RBA needs to believe that inflation will sustainably run at 2-3%”. “Today's figures support the RBA's dovish perspective and our own view on the cash rate outlook - our central case has no hikes in 2022 or 2023” Bloxham added.
- USD/CHF struggled to preserve its intraday gains to a multi-week high level of 0.9330.
- The USD pullback from a 16-month peak prompted some profit-taking around the pair.
- The cautious market mood benefitted the safe-haven CHF and contributed to the slide.
The USD/CHF pair surrendered a major part of its intraday gains to a seven-week peak and was last seen hovering near the lower end of the daily trading range, around the 0.9300 mark.
The pair built on the hotter-than-expected US CPI-inspired rally from the 0.9100 mark and continued scaling higher through the first half of the trading action on Wednesday. This marked the sixth successive day of a positive move and pushed the USD/CHF pair to the highest level since early October.
The momentum, however, ran out of steam near the 0.9330 region amid a modest US dollar pullback from a 16-month high. The USD downtick lacked any obvious catalyst and could be solely attributed to some profit-taking, which is likely to be limited amid the prospects for an early policy tightening by the Fed.
The markets have been pricing in the possibility of a Fed rate hike move by July 2022 amid worries about rising inflation. The Fed funds futures indicate a high likelihood of another raise by November. This was reinforced by elevated US Treasury bond yields, which should act as a tailwind for the greenback.
Meanwhile, concerns about surging consumer prices dampened investors' appetite for perceived riskier assets. This was evident from the prevalent cautious mood around the equity markets. This, in turn, benefitted the Swiss franc's safe-haven appeal and further contributed to the USD/CHF pair's intraday downfall.
That said, it will still be prudent to wait for a strong follow-through selling before confirming that the USD/CHF pair has topped out and positioning for any meaningful corrective slide. Investors now look forward to the US housing market data – Building Permits and Housing Starts – for a fresh impetus.
This, along with speeches by influential FOMC members and the US bond yields, will drive the USD demand. Apart from this, the broader market risk sentiment would also play a key role in producing some meaningful trading opportunities around the USD/CHF pair.
Technical levels to watch
- DXY reaches new cycle highs past the 96.00 yardstick.
- Next on the upside is seen the round level at 97.00.
DXY pushes higher and surpassed the 96.00 barrier to record new 16-month highs on Wednesday.
If the buying interest picks up extra impulse and the index leaves behind recent tops, then the next hurdle is seen at the round level at 97.00 the figure before 97.80 (high June 30 2020).
Looking at the broader picture, the constructive stance on the index is seen intact above the 200-day SMA at 92.21.
DXY daily chart
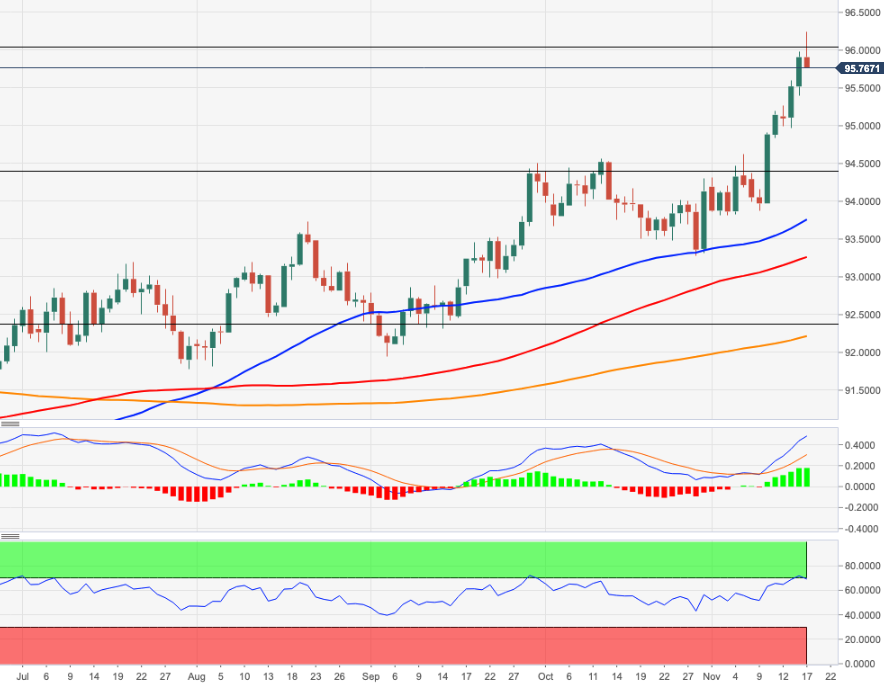
- EUR/JPY drops and rebounds from fresh lows near 129.40.
- Further south comes the October low around 128.30.
EUR/JPY’s sharp decline appears to have met some contention near 129.40, or fresh 6-week lows on Wednesday.
A deeper pullback remains well on the cards for the time being. That said, if the 129.40 area (Fibo level of the October rally) is cleared, then there are no significant stops until October’s low at 128.33 (October 6).
Below the 200-day SMA, today at 130.49, the outlook for the cross is seen as negative.
EUR/JPY daily chart
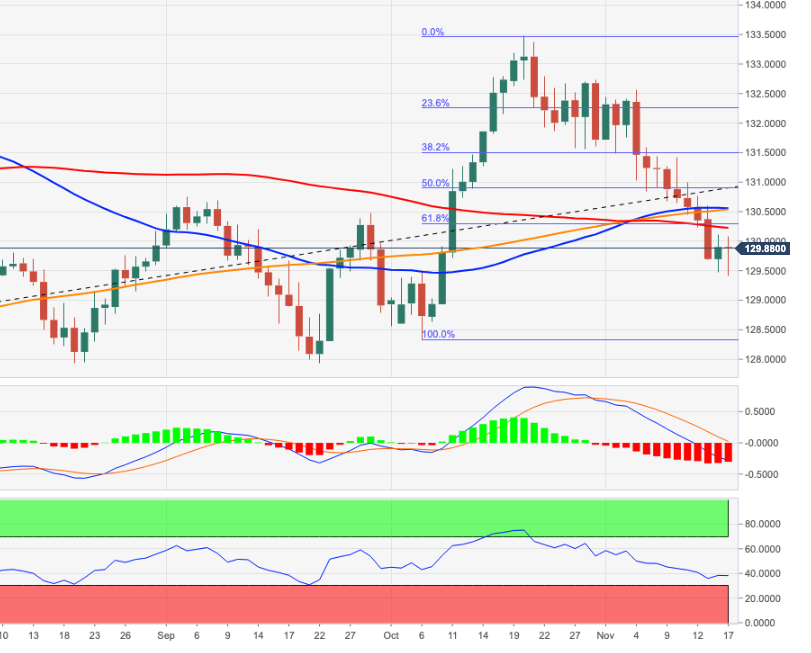
- GBP/USD shot to a one-week high in reaction to hotter-than-expected UK CPI print.
- Bulls struggled to find acceptance above 100-hour SMA amid persistent Brexit woes.
- Fed rate hike bets acted as a tailwind for the USD and also collaborated to cap gains.
The GBP/USD pair surrendered a major part of the stronger UK CPI-inspired gains and was last seen trading below mid-1.3400s, still up nearly 0.15% for the day.
Having shown some resilience below the 1.3400 mark, the GBP/USD pair regained positive traction on Wednesday and shot to a one-week high in reaction to hotter-than-expected UK CPI print. The UK Office for National Statistics (ONS) reported that consumer prices surged to 4.2% in October, marking the fastest pace since December 2011.
Against the backdrop of Tuesday's upbeat UK employment details, the data reassured expectations for an imminent rate hike by the Bank of England in December and provided a strong lift to the British pound. Apart from this, the intraday US dollar pullback from a 16-month peak further provided an additional boost to the GBP/USD pair.
Bulls, however, struggled to capitalize on the move or find acceptance above the 200-hour SMA amid worries that the UK government could trigger Article 16 of the Northern Ireland Protocol. The intraday uptick ran out of the steam near the 1.3470-75 region, which should now act as a key pivotal point for the GBP/USD pair's near-term trend.
Meanwhile, the prospects for an early policy tightening and elevated US Treasury bond yields continued lending some support to the greenback. In fact, the markets have been pricing in the possibility for an eventual Fed rate hike move by July 2022. This was seen as another factor that collaborated to cap any meaningful upside for the GBP/USD pair.
Looking at the broader picture, the emergence of fresh selling at higher levels warrants some caution before positioning for any meaningful appreciating move. A subsequent slide back below the 1.3400 mark will be seen as a fresh trigger for bearish traders and turn the GBP/USD pair vulnerable to challenge YTD lows, around mid-1.3300s touched last Friday.
Technical levels to watch
- USD/TRY records new record high near 10.6000.
- The lira depreciates further on Erdogan comments.
- The CBRT meets on Thursday and could reduce rates further.
The lira keeps suffering the wrath of sellers and now pushes USD/TRY to clinch new all-time peaks in the proximity of 10.6000 midweek.
USD/TRY up on USD rally, lira weakness
USD/TRY extends the upside for yet another session on Wednesday on the back of the better note in the US dollar and the tireless selloff in the Turkish currency ahead of the key meeting by the Turkish central bank (CBRT) on Thursday.
The lira saw its depreciation gathering extra steam after President Erdogan said earlier on Wednesday that inflation is the result of high interest rates, adding that he will not allow people to be crushed by rates and that he won’t stand with defenders of interest rates.
Comments from Erdogan not only seem to have precipitated the selloff in the lira, but they could have also paved the way for another reduction of the One-Week Repo Rare at the CBRT meeting on Thursday.
Consensus on the next move by the CBRT now appears somewhat divided, as many think that the recent collapse in the lira could motivate the central bank to take a break.
My call: A 100 bps cut.
USD/TRY key levels
So far, the pair is gaining 1.00% at 10.4331 and a drop below 9.8395 (high Oct.25) would expose 9.7410 (20-day SMA) and finally 9.4722 (monthly low Nov.2). On the other hand, the next up barrier lines up at 10.5583 (all-time high Nov.17) followed by 11.0000 (round level).
EUR/GBP is extending its aggressive rejection from its 200-day moving average (DMA) at 0.8575. Analysts at Credit Suisse look for a sustained break below 0.8402 for a test of long-term support at the 2019 and 2020 lows at 0.8281/39.
Near-term resistance moves to 0.8438
“EUR/GBP is attempting to remove to the 0.8414/02 lows of October and November. We look for a sustained move below here to open the door to a test of 0.8339/32 next and eventually long-term support from the 2019 and 2020 lows, as well as the 50% retracement of the upmove from 2015 at 0.8281/17. Whilst we would look for a fresh hold here for now, an eventual break would see a multi-year top established.”
“Near-term resistance moves to 0.8438, then 0.8463/68, with 0.8483 now ideally capping to keep the immediate risk lower. Above can see a recovery back to 0.8521/25, but with fresh sellers expected to show here.”
Palladium (XPD/USD) has eroded the four-month downtrend. Now, the precious metal looks to surpass the October high at $2,207 to extend its move higher.
Key near-term resistance lies at $2,207
“Palladium has eroded the downtrend and is poised to challenge the $2,207 October high. This has so far negated the downside, but a close above $2,207 will be key as it will imply that the market has based and introduce upside scope to at least the 200-day ma at $2,491 and the 55-week ma at $2,452.”
“Dips lower should be now contained by $2,022 short-term uptrend to maintain a positive bias. Failure here would trigger a retest of the $1,848/50 zone”
German Chancellor Angela Merkel noted that the coronavirus situation in the country was dramatic, as reported by Reuters. "It is not too late to decide to get your first COVID vaccination shot," Merkel added.
Earlier in the day, Germany's Robert Koch Institue announced that there were 52,826 new confirmed cases in Germany.
Market reaction
These comments don't seem to be having a significant impact on market sentiment. As of writing, Germany's DAX Index was up 0.1% at 16,264 and the EUR/USD pair was virtually unchanged on the day at 1.1316.
- USD/JPY was seen consolidating its recent gains to the highest level since March 2017.
- The cautious market mood benefitted the safe-haven JPY and acted as a headwind.
- Hawkish Fed expectations, elevated US bond yields continued lending some support.
The USD/JPY pair extended its sideways price move through the first half of the European session and remained confined in a range below the key 115.00 psychological mark.
The pair struggled to capitalize on its modest intraday uptick to a four-and-half-year peak and now seems to have entered a bullish consolidation phase. A softer tone around the equity markets benefitted the Japanese yen's safe-haven status, which, in turn, was seen as a key factor that acted as a headwind for the USD/JPY pair.
On the other hand, the US dollar witnessed some profit-taking from a 16-month high touched earlier this Wednesday. This was seen as another factor that kept a lid on any meaningful upside for the USD/JPY pair. However, the downside remains cushioned amid the recent widening of the US-Japanese government bond yield differential.
The markets have been pricing in the possibility for an early Fed rate hike amid worries about rising inflation. The speculations pushed the yield on the benchmark 10-year US bond back closer to the 1.65% threshold. Conversely, the yield on the 10-year Japanese government bond remained near zero due to the Bank of Japan's yield curve control policy.
The fundamental backdrop seems tilted in favour of bullish traders, though it will be prudent to wait for a sustained strength beyond the 115.00 mark before positioning for any further gains. Market participants now look forward to the US housing market data – Building Permits and Housing Starts – due later during the early North American session.
This, along with speeches by influential FOMC members and the US bond yields, will drive the USD demand and provide some impetus to the USD/JPY pair. Traders will further take cues from the broader market risk sentiment to grab some short-term opportunities around the major.
Technical levels to watch
US 10-year Bond Yields retraced sharply back higher. Economists at Credit Suisse now believe that a breakout for the US 10-year Bond Yields above 1.685/705% is getting closer, which would confirm a three-year base.
A major base looks increasingly imminent
“Medium and long-term moving averages have now posted a bearish ‘death cross’, which points to a further deterioration in the trend following setup, whilst short-term momentum is reaccelerating.”
“We believe a breakout above major support at 1.685/705% may be imminent which would confirm a three-year basing structure, which would very likely take us above the year-to-date highs and retracement support between 1.775% and 1.82%.”
“Going into 2022, we maintain our long-held view that a move to 1.965/2.00% is likely in the first quarter, followed by retracement support at 2.16/18%.”
- Eurozone inflation arrives at 4.1% YoY in October.
- Monthly CPI in the bloc rises to 0.8% in October.
- EUR/USD remains unfazed around 1.1315 on the EZ data.
According to Eurostat’s final reading of the Eurozone CPI report for October, the consumer prices came in at 4.1% on a yearly basis, in line with the flash estimate of 4.1% and 4.1% expectations. While the core figures rose by 2%, missing the 2.1% consensus forecasts.
On a monthly basis, the bloc’s CPI figure for October arrived at 0.8% versus 0.8% expectations and 0.5% previous while the core CPI numbers came in at 0.3% versus 0.3% expected and 0.3% last.
Key details (via Eurostat):
“The lowest annual rates were registered in Malta (1.4%), Portugal (1.8%), Finland and Greece (both 2.8%). The highest annual rates were recorded in Lithuania (8.2%), Estonia (6.8%) and Hungary (6.6%). Compared with September, annual inflation rose in all twenty-seven Member States.”
“In October, the highest contribution to the annual euro area inflation rate came from energy (+2.21 percentage points, pp), followed by services (+0.86 pp), non-energy industrial goods (+0.55 pp) and food, alcohol & tobacco (+0.43 pp).”
FX implications:
EUR/USD is almost unchanged on the day at 1.1313 on the data release.
Natural Gas has recently tested an ascending support line at 4.72 resulting in a bounce. Strategists at Société Générale notes that a break above 5.39 would clear the way for a potential rise to the 6.10 level.
4.65/4.60 to be an important support zone near-term
“Daily RSI has so far defended the lower band of its bullish territory which denotes a large downside is not envisaged; projections of 4.65/4.60 should be an important support zone near-term.”
“A break above 5.39, the 38.2% retracement of the pullback would denote an extended rebound towards 5.87 and even towards the upper band of a multi-month channel at 6.10.”
- EUR/USD accelerated the downside to the 1.1260 region.
- The dollar clinched new 16-month peaks past 96.00.
- Final October EMU CPI, ECB-speak due next.
The single currency manages to regain the composure somewhat and now motivates EUR/USD to regain the 1.1300 mark and beyond on Wednesday.
EUR/USD focuses on dollar, Lagarde
After bottoming out in the vicinity of 1.1260, or new cycle lows, EUR/USD seems to have met some dip buyers that pushed spot back above 1.1300 the figure.
The sharp pullback in the pair remains well sustained by dollar strength, in turned propped up by yields dynamics, inflation concerns and market chatter regarding the increasing possibility that the Fed could move on rates before expected (2022 maybe?).
No news from the cash markets on both sides of the Atlantic, as yields of the 10y Bund remain side-lined around -0.25% and the US 10y reference hover around the 1.63% zone so far.
In the docket, final inflation figures in the euro area for the month of October are due next. In addition, Chairwoman C.Lagarde will publish a video message and attend an event in Germany, while Board member I.Schnabel will speak on the economic and monetary policy outlook.
Across the pond, a slew of Fed-speakers are expected to keep investors entertained around the tapering/inflation/lift-off issues. In the US data space, Housing Starts, Building Permits and the MBA Mortgage Approvals are scheduled later in the session.
What to look for around EUR
EUR/USD sank to new lows near 1.1260 on Wednesday amidst the persistent deterioration in the pair and the indefatigable rebound in the buck. As usual, the pair’s price action is predicted to mainly track the dynamics around the dollar, while bouts of intermittent strength expected to come from the improvement in the risk complex. On the more macro view, the loss of momentum in the economic recovery in the region - as per some weakness observed in key fundamentals – coupled with rising cases of COVID-19 is also seen pouring cold water over investors’ optimism. Further out, the euro should remain under scrutiny amidst the implicit debate between investors’ speculations of a probable lift-off sooner than anticipated and the ECB’s so far steady hand, all amidst the tenacious elevated inflation in the bloc and increasing conviction that it could last longer than previously anticipated.
Key events in the euro area this week: EMU Final CPI, ECB Lagarde (Wednesday) – ECB Lagarde (Friday).
Eminent issues on the back boiler: Asymmetric economic recovery post-pandemic in the region. Sustainability of the pick-up in inflation figures. Pick-up in the political effervescence around the EU Recovery Fund in light of the rising conflict between the EU, Poland and Hungary on the rule of law. ECB tapering speculations.
EUR/USD levels to watch
So far, spot is down 0.05% at 1.1314 and faces the next up barrier at 1.1467 (10-day SMA) followed by 1.1539 (20-day SMA) and finally 1.1609 (weekly high Nov.9). On the other hand, a break below 1.1263 (2021 low Nov.17) would target 1.1185 (monthly low Jul.1 2020) en route to 1.1168 (low Jun.19 2020).
- USD/CAD was seen oscillating in a range through the first half of the European session.
- Bullish USD, weaker oil prices continued lending support and helped limit the downside.
- Investors await Wednesday’s key release of the Canadian CPI report for a fresh impetus.
The USD/CAD pair lacked any firm directional bias and seesawed between tepid gains/minor losses, around mid-1.2500s through the first half of the European session.
The pair struggled to capitalize on the previous day's goodish rebound from levels below the 1.2500 psychological mark and witnessed a subdued/range-bound price action on Wednesday. In the absence of a fresh catalyst, investors preferred to move on the sidelines and wait for today's release of the latest Canadian consumer inflation figures.
Meanwhile, the downside remains cushioned amid a strong bullish sentiment surrounding the US dollar, bolstered by the prospects for an early policy tightening by the Fed. In fact, the markets have been pricing in the possibility for an eventual Fed rate hike move by July 2022 and the Fed fund futures indicate a high likelihood of another raise by November.
Apart from this, a softer tone surrounding crude oil prices undermined the commodity-linked loonie and further extended some support to the USD/CAD pair. WTI crude oil languished near weekly lows and was pressured by Tuesday's API report, which heightened pressure on the Biden administration to release oil from emergency reserves to cap soaring fuel prices.
Nevertheless, the USD/CAD pair, so far, has struggled to gain any meaningful traction and has been oscillating in a range, warranting some caution before placing aggressive directional bets. Apart from the Canadian CPI report, traders on Tuesday will take cues from the US housing market data. This, along with oil price dynamics could provide some impetus.
Technical levels to watch
- Gold price rebounds from $1,850 key support as yields pullback.
- Gold remains unfazed by the Fed tightening calls after strong US data.
- Gold capitalizes on inflation fears, buyers look to retain control.
Gold price is staging an impressive rebound on Wednesday, having found strong support at the midpoint of the $1,800 level. The renewed upside in gold price comes on the back of a retreat in the US Treasury yields, which has taken the wind out of the dollar’s rally to 16-mnoth highs. Markets remain risk-averse amid growing concerns over inflation, adding to upturn in the inflation hedge, gold. In absence of first-tier US economic data, the dynamics in the yields and the dollar will continue to influence gold price alongside a slew of Fedspeak.
Read: Gold Price Forecast: XAU/USD pullback points to a fresh upswing towards $1,900?
Gold Price: Key levels to watch
The Technical Confluences Detector shows that gold price is eyeing a sustained move above $1,861, which is the convergence of the Fibonacci 38.2% one-day, SMA10 four-hour and SMA100 one-hour.
The next significant upside barrier for gold buyers is seen at $1,869, where the previous week’s high and pivot point one-day R1 coincide.
Acceptance above the latter will expose the Bollinger Band one-day Upper at $1,873, above which the previous day’s high of $1,877 will get challenged.
Alternatively, a firm break below $1,857, the confluence of the Fibonacci 23.6% one-day and one-week, will reinforce the recent bearish momentum towards the pivot point one-month R2 at $1,850.
Minor support of the Fibonacci 38.2% one-week at $1,847 will be the next stop for gold bears.
Here is how it looks on the tool
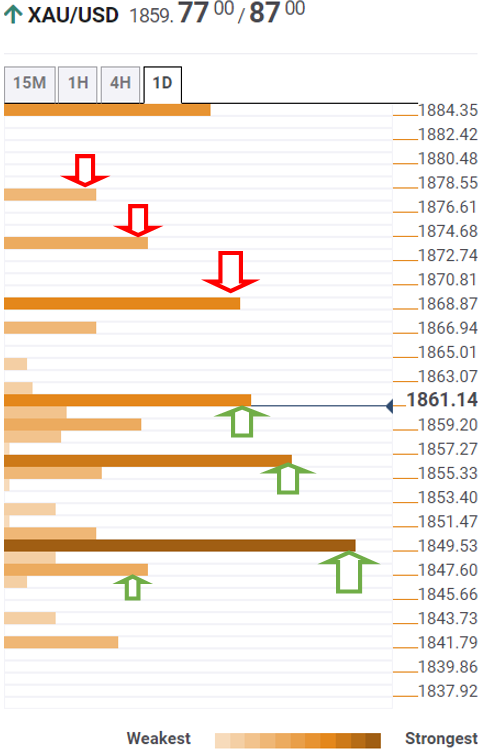
About Technical Confluences Detector
The TCD (Technical Confluences Detector) is a tool to locate and point out those price levels where there is a congestion of indicators, moving averages, Fibonacci levels, Pivot Points, etc. If you are a short-term trader, you will find entry points for counter-trend strategies and hunt a few points at a time. If you are a medium-to-long-term trader, this tool will allow you to know in advance the price levels where a medium-to-long-term trend may stop and rest, where to unwind positions, or where to increase your position size.
“Improved economic conditions have reduced near-term tail risks to financial stability,” the European Central Bank (ECB) said in its Financial Stability Review report released on Wednesday.
Additional takeaways
The remaining concerns relate to pockets of exuberance in credit, asset and housing markets as well as higher debt levels.
Corporate insolvencies could still rise but less than feared early in the pandemic.
Risks of property price corrections increased substantially amid rising estimates of house price overvaluations.
Outlook seems particularly poor for lower-quality commercial real estate.
Separately, Moody’s Investors Service said in its latest report, “Euro area sovereigns benefit from favorable economic conditions but debt levels could become a challenge.”
“Euro area's economy is recovering but an increase in bankruptcies or unemployment remains a risk,” the global ratings agency noted.
Market reaction
EUR/USD was last seen changing hands at 1.1311, down 0.06% on the day.
USD/JPY is on the cusp of returning over 115.00 for the first time since March 2017. Economists at Société Générale expect the pair to continue its march forward to 115.50, then 117.10.
Upmove extends
“USD/JPY is likely to head higher towards projections of 115.50 and 117.10.”
“July high of 112.23 cushions downside.”
EUR/HUF has evolved within a consolidation after facing resistance near 369.20/369.50 in April 2020. A break above here is needed to see another leg higher, economists at Société Générale report.
A struggle near October high of 367.00 points to a retracement
“The pattern resembles an ascending triangle which consists of a flat top and an up-sloping support line (now at 347.00). The formation highlights a lack of clear direction; a break above 369.20/369.50 will affirm the next leg of uptrend.”
“Short-term, the pair has struggled near October peak of 367.00. An initial pullback can’t be ruled out; 361.90 and the low formed this month at 358.00 are potential supports.”
Gold has cleared key resistance from the July and August highs and downtrend from August 2020 at $1,834 for the completion of a five-month base. XAU/USD may be set for the beginning of a more important turn higher but strategists at Credit Suisse are concerned is that gold strength may come to a swift end if inflation expectations peak.
Initial support is seen at $1,834
“Gold may be seeing the beginning of more important turn higher after completing a base. We thus look for a move to the June high at $1,917 initially. Beyond here can reinforce the likelihood of a more important move higher with resistance seen next at $1,959/77 and eventually the $2,075 record high.”
“Support is seen at $1,834 initially, then $1,814.”
“Our base case though is that we are close to a peak in inflation expectations, which if correct would suggest Real Yields should soon find a floor again around -1.25/1.26% and start to rise again. If our view is correct, it would suggest it may be difficult to see XAU/USD rally meaningfully on such a development, unless we see signs of a broader market ‘risk-off’ phase.”
See – Gold Price Forecast: XAU/USD to extend its upside momentum as yields will remain negative – ANZ
USD/JPY has registered impressive gains seeing its strongest level since March 2017. Economists at MUFG Bank maintain a bullish bias for the month ahead.
Yen weakness will not persist beyond the next month or two
“We are maintaining our bullish bias for USD/JPY conveyed here last month and have nudged the range one big figure higher (11.00-117.00) to reflect the prospect of Fed short-term rates potentially moving further higher, giving further upside impetus to USD/JPY.”
“The topside of our range at 117.00 ties in with a long-term trend resistance which we believe is unlikely to be breached. Monthly intraday highs from 1990 (159.30) 2015 (125.86) comes in just above current spot at around 117.00 by year-end.”
“The turn lower in crude oil prices next year that we expect (we expect the market to turn to surplus by Q2 2022) and the probability that supply constraint issues will gradually ease means some of the catalysts for yen weakness will not persist beyond the next month or two. In the meantime though and given the prospects of the US rates market to adjust further higher from here, there remains scope for USD/JPY to push further higher.”
See: USD/JPY set to advance nicely towards the 117.00 level – Credit Suisse
The UK Brexit Minister David Frost told BBC News; he believes a deal on the Northern Ireland (NI) Protocol “can be done” with the European Union (EU) before Christmas.
more to come ...
- NZD/USD recovered around 35-40 pips from five-week lows touched earlier this Wednesday.
- The USD witnessed some profit-taking from a 16-month peak and prompted short-covering.
- Hawkish Fed expectations to limit the USD losses and cap any meaningful upside for the pair.
The NZD/USD pair maintained its bid tone through the first part of the European session and was last seen hovering near the top end of its daily trading range, around the 0.7015-20 region.
The pair staged a goodish rebound from the 0.6980 region, or a five-week low touched earlier this Wednesday and recovered a part of the previous day's heavy losses. The US dollar struggled to preserve its intraday gains to the highest level since July 2020, instead witnessed some profit-taking and assisted the NZD/USD pair to regain positive traction.
Apart from this, rising bets for yet another rate hike by the Reserve Bank of New Zealand (RBNZ) later this month further acted as a tailwind for the kiwi. That said, the prospects for an early policy tightening by the Fed should help limit any meaningful USD losses. This, in turn, might cap the upside for the NZD/USD pair and warrants some caution for bulls.
Investors now seem convinced that the Fed would be forced to adopt a more aggressive policy response to contain stubbornly high inflationary pressures. In fact, the markets have been pricing in the possibility for an eventual Fed rate hike move by July 2022. Adding to this, the Fed fund futures indicate a high likelihood of another raise by November.
Even from a technical perspective, the overnight sustained break and close below the 100-day SMA supports prospects for an extension of the recent downward trajectory witnessed over the past three weeks or so. Hence, the intraday positive move might still be seen as a selling opportunity and runs the risk of fizzling out rather quickly.
Market participants now look forward to the US housing market data – Building Permits and Housing Starts – scheduled for release later during the early North American session. This, along with speeches by influential FOMC members and the US bond yields, will drive the USD demand and produce some trading opportunities around the NZD/USD pair.
Technical levels to watch
Vitol Senior Executive said on Wednesday, global oil demand has risen above 100 million barrels per day (bpd) despite roughly 2 million bpd jet fuel demand missing, Reuters reports, citing sources familiar with the matter.
Earlier this week, Russell Hardy, CEO of the commodity trading group, said: “Global oil market fundamentals will likely remain tight over the coming year as oil demand continues to build after having mostly fully recovered to 2019 pre-pandemic levels.”
Additional quotes
"So then when you begin to look forward into 2022, clearly demand is going to carry on increasing.”
"A US SPR release...should dampen a little bit the front end of the market but it doesn't change things fundamentally. Next year is still expected to remain in a reasonably tight [oil market] balance," Hardy added.
Elsewhere, Iranian news agency, Tasnim, reported about an explosion at an oil pipeline in southern Iran. Although no additional details are mentioned about the same.
WTI looks south
WTI is off the lows but remains vulnerable amid the recent strength in the US dollar and a likely release of the oil supplies from the US Strategic Petroleum Reserve (SPR).
At the time of writing, the US oil is trading at $79.25, down 0.53% on the day. Sellers are taking a breather before embarking on their next journey southwards.
The crucial demand area around $77.94-$77.70 is the price zone beat for oil bears. Within that region, the ascending 50-Daily Moving Average (DMA) and November 4 low lie.
WTI technical levels to watch
The bearish EUR trend is well established. Hence, economists at MUFG Bank expect the EUR/USD pair to continue trending lower heading into the end of the year.
Risks titled to the downside for the EUR
“We are maintaining a bearish bias for EUR/USD for the sixth consecutive month.”
“We still believe that risks are tilted to the downside in the near-term although the risk/reward balance is becoming less attractive. The EUR is now trading at more deeply undervalued levels against the USD. It should make it more challenging for the pair to keep drifting lower in the month ahead.”
“We expect the pair to find strong support at closer to the 1.1200-level which represents around one standard deviation below our PPP model estimate.”
“We see room for ECB-Fed policy divergence expectations to move further against the EUR heading into year-end.”
“Bearish sentiment towards the EUR reflects building concerns as well over downside risks to the outlook for the eurozone economic recovery. The eurozone economy is on track to expand robustly this year by around 5% but market participants are concerned that growth could slow more notably heading into next year.”
USD/JPY maintains a major base and the recent consolidation phase looks to be coming to an end. This would be confirmed above 114.70/92, with the next major resistance then seen at 117.00/01, analysts at Credit Suisse report.
Consolidation phase looks to be coming to an end
“USD/JPY extends its consolidation but with a major base in place above 112.40, we maintain our view this is a temporary and healthy pause only. We thus look for a move above 114.70/92 in due course for a test of the long-term downtrend from April 1990 at 117.00/01.”
“The ‘measured base objective’ stays seen at 122.90/123.00.”
“Support is seen at 112.73/57 initially, then the 55-day average at 112.03, which ideally holds.”
EUR/CHF is getting closer to major support levels at 1.0510/03, which economists at Credit Suisse expect to hold. Then, the pair should establish between 1.0510/03 and 1.0704/07.
Risk of a downside breakout to increase sharply if EUR TWI breaks 97.34/96.97
“The pair now testing the important 1.0510/00 support. Our base case is that this will hold for a reversal back higher, given the importance of the level and the tiring short-term momentum, with a break above 1.0605/10 needed to cement a floor. Thereafter, we expect further ranging between 1.0510/03 and 1.0704/07.”
“Whilst not our base case, we note that the next minor supports on a weekly close below 1.0510/03 are seen at 1.0400/0394, with the next medium-term support at 1.0251/0235.”
“We note that the risk of a downside breakout would increase sharply if the EUR TWI breaks 97.34/96.97.”
- DXY advances past 96.20 and clinches YTD highs.
- US yields shed some ground following earlier tops.
- Housing Starts, Building Permits, Fedspeak all next in the docket.
After hitting fresh cycle tops near 96.20 earlier in the session, the US Dollar Index (DXY) now returns to the sub-96.00 levels following the opening bell in the old continent.
US Dollar Index looks to yields, data
The index looks to extend the sharp upside for the third session in a row, although it came under some selling pressure soon after recording new tops in the area further north of the 96.00 barrier.
The knee-jerk in the buck follows the correction in US yields along the curve after reaching new weekly tops earlier in the session.
The recent move higher in the dollar appears underpinned by omnipresent inflation concerns, auspicious results from the docket – after improvements in Retail Sales, Industrial Production and the NAHB Index – as well as supportive Fedspeak. On the latter, FOMC’s J.Bullard (ex dove?) suggested on Tuesday that the Committee should shift to a more hawkish direction, opening the door at the same time to higher rates in 2022.
In the US calendar, the weekly report by the MBA on Mortgage Applications is due seconded by Housing Starts and Building Permits. In addition, FOMC’s Williams, Bowman, Mester, Daly, Waller, Evans and Bostic are all due to speak.
What to look for around USD
The index once again managed to hit new cycle highs on Wednesday, this time above the 96.00 yardstick. The intense move higher in the buck remains well underpinned by the “higher-for-longer” narrative around current elevated inflation, which in turn lend wings to US yields and bolster speculations of a sooner-than-estimated move on interest rates by the Federal Reserve, probably at some point in H2 2022. Further support for the dollar comes in the form of the solid recovery in the labour market, Biden’s infrastructure bill and positive results in US fundamentals.
Key events in the US this week: Building Permits, Housing Starts (Wednesday) – Initial Claims, Philly Fed Index (Thursday).
Eminent issues on the back boiler: US-China trade conflict under the Biden’s administration. Debt ceiling issue. Geopolitical risks stemming from Afghanistan.
US Dollar Index relevant levels
Now, the index is losing 0.04% at 95.88 and a break above 96.24 (2021 high Nov.17) would open the door to 97.00 (round level) and then 97.80 (high Jun.30 2020). On the flip side, the next down barrier emerges at 94.56 (monthly high Oct.12) followed by 93.87 (weekly low November 9) and finally 93.75 (55-day SMA).
AUD/USD has turned back lower over the past couple of weeks after being capped below the important cluster of resistances at 0.7541/57. As economists at Credit Suisse note, the aussie is threatening a major top, leaving the pair at risk of falling as low as 0.6758.
AUD/USD is still threatening a major top
“The aussie is still potentially threatening a large topping pattern, with key medium term supports starting at 0.7122/06 and stretching down to 0.6991, which includes the 38.2% retracement of the 2020/21 recovery and the ‘neckline’ to the 2020 base.”
“A break below 0.6991 would complete a major top to suggest a fall back to 0.6758, which is the 50% retracement of the 2020/21 upmove.”
EUR/JPY has sold off to the 2020-2021 uptrend at 129.47. The pair is expected to bounce from here and soar as high as the 2018 peak of 137.51, Karen Jones, Team Head FICC Technical Analysis Research at Commerzbank, reports.
EUR/JPY targets 134.12, the June high
“EUR/JPY has reached the 129.44/47 78.6% retracement and 2020- 2021 uptrend, which should hold the initial test. Resistance is the 131.86 near term downtrend and then the 134.12 June peak.”
“Below 129.40 lies 128.74, the 6th October low and the 127.94/50, August and September lows and the February 2019 high.”
“Longer-term, a break above the June peak is favoured, and will introduce scope to 137.51.”
See – EUR/JPY: Strong hint of bullish intentions, further gains ahead – DBS Bank
French Finance Minister Bruno Le Maire reiterated on Wednesday, inflation is transitory
However, he added that “we need to remain vigilant on this.”
Additional quotes
“Need to protect French people from inflationary pressures.”
“Need to increase wages in certain sectors that are facing difficulties in finding staff.”
Market reaction
EUR/USD has recovered the Asian decline to fresh 16-month lows of 1.1264, currently trading at 1.1317, modestly flat on the day.
GBP/USD extends its rejection from its now falling 200-day average with the past couple of weeks seeing a sharp acceleration lower for a break of the 1.3411 September low. The pair stays on course for an eventual fall to a cluster of supports at 1.3189/35, economists at Credit Suisse report.
Resistance moves to 1.3607 initially
“We maintain our core bearish outlook for a cluster of supports at 1.3189/35, including the 38.2% retracement of the 2020/2021 bull trend. We would look for this to then hold at first for a fresh consolidation phase. Should weakness directly extend, we see support next at 1.2855/29.”
“Resistance moves to 1.3607 initially, with 1.3699 now ideally capping.”
- GBP/JPY gained traction for the fourth successive day and shot to two-week tops on Wednesday.
- Hotter-than-expected UK CPI reaffirmed BoE rate hike expectations and boosted the British pound.
- The cautious market mood underpinned the safe-haven JPY and capped the upside amid Brexit woes.
The GBP/JPY cross retreated a few pips from a two-week peak touched in reaction to hotter-than-expected UK CPI print and was last seen trading with modest intraday gains, just below mid-154.00s.
The cross built on its recent bounce from over one-month lows and gained follow-through traction for the fourth successive day on Wednesday. The momentum picked up pace after the UK Office for National Statistics (ONS) reported that the headline CPI accelerated to a 4.2% YoY rate in October. This was well above market expectations for a rise to 3.9% from 3.1% previous.
Adding to this, the core inflation gauge (excluding volatile food and energy items) also surpassed consensus estimates and rose 3.4% YoY during the reported month. This comes on the back of Tuesday's mostly upbeat UK employment report and reassured an immediate rate hike by the Bank of England in December. This, in turn, was seen as a key factor that boosted the British pound.
Meanwhile, the GBP/JPY cross shot to an intraday high level of 154.73, albeit struggled to find acceptance or capitalize on the move beyond the 200-period SMA on the 4-hour chart. Worries that the UK government would trigger Article 16 of the Northern Ireland Protocol acted as a headwind for the sterling and held back bulls from placing fresh bets around the GBP/JPY cross.
Apart from this, the prevalent cautious market mood – amid persistent concerns about surging consumer prices – benefitted the Japanese yen's relative safe-haven status. This was seen as another factor that contributed to cap the upside for the GBP/JPY cross. This makes it prudent to wait for a sustained strength beyond 200-period SMA before positioning for any further gains.
Technical levels to watch
EUR/JPY is edging lower from recent 133.48 highs, with the decline gaining impetus on the break of 132.45. As Benjamin Wong, Strategist at DBS Bank, the current pullback sits within a technical pattern and should find stability before resuming to the upside.
EUR/JPY to resume to the upside
“The decline has shifted the cross to an oversold reading, as it approaches the pivotal 55-WMA of 129.26, which has held since June 2020 and provides the backdrop for a tactical long entry point. If 127.50 holds, the broader picture’s bull trend set from the 114.43 lows remains intact.”
“Checking in on seasonality, the closing months of the year typically net positive returns for the cross.”
“In the long-term monthly chart, the cross has surmounted the trendline resistance drawn from 169.96, the July 2008 highs. Hence, we would side with the bull given there is also a bullish inverse head-and-shoulders pattern in play. This is the big picture view.”
IDR’s higher yields and a healthy balance of payments point to gradual rupiah appreciation. Analysts at Credit Suisse expect USD/IDR ranges of 14,000-14,300 in the next six months.
The central bank would allow appreciation up to 13,900
“If the Fed remains in the ‘transitory’ camp and US yields remain low, we think Indonesia’s higher yields, along with its record exports and trade surplus point to gradual rupiah appreciation towards 14,000.”
“We expect USD/IDR ranges of 14,000-14,300 in the next six months.”
“On balance, we think BI still prefers a slightly stronger rupiah, and we think the central bank would allow appreciation up to 13,900.”
EUR/GBP has dived to the lowest level since February 2020. The ability of the UK economy to post upbeat data releases will be key to reinforce a hawkish Bank of England and underpin the pound, economists at Rabobank report.
Year-end EUR/GBP target stands at 0.85
“Given that policy tightening is well anticipated by the market, we expect that a December rate hike is only likely to lead to sustainable gains for the pound if it is backed by further strong UK data releases. The better data will likely be needed to erode scepticism over whether the Bank could be making a policy mistake.”
“Our year-end EUR/GBP target stands at 0.85.”
“We are expecting GBP to appreciate modestly vs the EUR in 2022 given continued dovish tone of the ECB. Other risks for the EUR stems from the fourth wave of covid that is currently crossing the continent and potentially the French presidential election in the spring.”
The rally in USD/TRY since last week elevates the importance of Thursday’s central bank meeting. Economists at Credit Suisse will wait for the rate decision outcome before formalising a new short-term target, which is most likely going to be above the current 9.60 target, even if the central bank remains on hold.
A few factors that limit the extent of USD/TRY upside are in play
“We will wait for Thursday’s rate decision outcome before formalising a new short-term target which is most likely going to be higher than the 9.60 target which we set on 20 October, even if the central bank remains on hold.”
“We highlight a few mitigating factors which could limit USD/TRY upside if the central bank does not surprise markets on the dovish side again tomorrow – these are historical sell-off retracements patterns in USD/TRY, possible FX interventions and light international positioning.”
“In the end, the central bank may feel forced to reverse its recent policy rate cuts by raising the policy rate; but we suspect that more USD/TRY upside is needed before that happens.”
- EUR/GBP witnessed heavy selling for the fourth successive day and dropped to fresh YTD lows.
- Hotter-than-expected UK CPI reinforced BoE rate hike expectations and boosted the sterling.
- Brexit woes might hold back traders from placing aggressive bets amid oversold conditions.
The EUR/GBP cross dived to the lowest level since February 2020 in reaction to hotter-than-expected UK CPI print, albeit recovered a few pips thereafter and was last seen hovering around the 0.8400 mark.
The cross remained heavily offered for the fourth successive day on Wednesday and extended its recent rejection slide from the very important 200-day SMA. The latest leg of a sudden drop over the past hour or so followed the release of UK consumer inflation figures, which reassured an immediate rate hike by the Bank of England in December.
The UK Office for National Statistics (ONS) reported that the headline CPI accelerated to a 4.2% YoY rate in October as against expectations for a rise to 3.9% from 3.1% previous. Adding to this, the core inflation gauge (excluding volatile food and energy items) also surpassed consensus estimates and rose 3.4% YoY during the reported month.
This comes on the back of Tuesday's mostly upbeat UK employment report, which showed that the unemployment rate declined to 4.3% in September and validated hawkish BoE expectations. On the other hand, the European Central Bank President Christine Lagarde stuck to the transitory inflation narrative and pushed back on market bets for tighter policy.
The divergence in monetary policy stance between the ECB and the BoE further contributed to the shared currency's underperformance. That said, worries that the UK government would trigger Article 16 of the Northern Ireland Protocol held back the GBP bulls from placing fresh bets and might help limit losses for the EUR/GBP cross, at least for now.
Technical levels to watch
The return on equity (RoE) is now very high. But economists at Natixis think it will have to decline in the future for three reasons.
The need to make long-term investments with low returns
“It will be necessary to make long-term investments (for example for the energy transition), the return on which is low; it will therefore be necessary to accept a lower return on equity, both for these investments to be made, whether by the public sector or the private sector and because making them will reduce the return on equity.”
The rise in energy prices due to the energy transition
“The energy transition will lead to a sharp rise in energy prices; to avoid the resulting loss of purchasing power, wages will have to compensate for this rise in prices, i.e. wages will have to be re-indexed to prices, which will reduce capital income. The same applies if purchasing power is maintained by public transfer payments financed by taxation of capital income.”
The internalisation of externalities
“Governments will want to reduce the negative externalities that result from corporate behaviour (climate, offshoring, redundancies, etc.). If companies internalise these externalities, the return on their equity will decline.”
USD/JPY is in new four-year highs as the pair is trading at its strongest level since March 2017 and closing in on 115.00. Karen Jones, Team Head FICC Technical Analysis Research at Commerzbank, believes that USD/JPY could surge as high as 119.41.
Nearby support seen at 112.73/112.56
“USD/JPY has eroded tough resistance at 114.55/69, the November 2017 high and the recent high. Above 114.55/69 we have 115.60, the 61.8% retracement of the move down from 2015 and then the 117.56 the 1998-2021 resistance line and the 119.41, the downtrend from 1975.”
“Nearby support lies 112.73/112.56 then the 111.66 July high, which should hold the downside.”
EUR/USD weakness has accelerated sharply over the past week, breaking key support at 1.1495/93. Next notable support is also seen nearby at 1.1310/1.1290, where economists at Credit Suisse expect a temporary pause. However, they expect to see further weakness towards 1.1020/00.
Resistance moves to 1.1513 initially
“EUR/USD is falling sharply again and has broken with ease below its next key support and our first objective at the March 2020 high and 50% retracement of the 2020/2021 uptrend at 1.1495/93. This already leaves the market on the cusp of our next key support/objective of the 61.8% retracement and Fibonacci projection support at 1.1310/1.1290.”
“Our bias remains for 1.1290 to hold at first for a phase of consolidation, but with a major ‘head and shoulders’ top in place, we continue to look for an eventual break in due course and a fall to 1.1020/00.”
“Resistance moves to 1.1513 initially, with 1.0609/18 now ideally capping.”
- AUD/USD dropped to multi-week lows on Wednesday amid sustained USD buying.
- Some US dollar profit-taking from a 16-month peak helped ease the bearish pressure.
- Hawkish Fed expectations should act as a tailwind for the buck and cap the upside.
The AUD/USD pair managed to recover a major part of its early lost ground to six-week lows and was last seen trading with only modest intraday losses, around the 0.7300 mark.
The pair extended the previous day's rejection slide from the 100-day SMA and witnessed some follow-through selling during the Asian session on Wednesday. The downward trajectory dragged the AUD/USD pair to the lowest level since October 6 and was sponsored by sustained US dollar buying interest.
The USD, however, struggled to capitalize on its early gains and witnessed some profit-taking near a 16-month peak. This, in turn, helped the bearish pressure surrounding the AUD/USD pair and led to a goodish bounce of around 35-40 pips from the 0.7260 area, though any meaningful recovery seems elusive.
Growing market acceptance that the Fed would be forced to adopt a more aggressive policy response to contain stubbornly high inflation should act as a tailwind for the greenback. In fact, the markets now seem to have started pricing in the possibility for an eventual rate hike move by July 2022.
Moreover, the Fed funds futures indicate a high likelihood of another raise by November. Tuesday's upbeat US macro data, showing that monthly Retail Sales jumped by the most since March, further boosted market bets and supports prospects for the emergence of some dip-buying around the USD.
This makes it prudent to wait for a strong follow-through buying before confirming that the AUD/USD pair might have formed a temporary bottom and positioning for any further gains. Hence, any subsequent move up is more likely to confront stiff resistance and remain capped near the 0.7330 region.
Traders now look forward to the US housing market data – Building Permits and Housing Starts – due later during the early North American session. This, along with speeches by influential FOMC members and the US bond yields, will drive the USD demand and provide some impetus to the AUD/USD pair.
Technical levels to watch
- GBP/USD attracted some dip-buying on Wednesday and jumped to one-week tops.
- Hotter-than-expected UK CPI reassured BoE rate hike and provided a goodish lift.
- Hawkish Fed expectations should underpin the USD and cap gains amid Brexit woes.
The GBP/USD pair shot to one-week highs, around the 1.3470-75 region in reaction to hotter UK consumer inflation figures, albeit quickly retreated a few pips thereafter. The pair was last seen trading just above mid-1.3400s, still up around 0.25% for the day.
Having shown some resilience below the 1.3400 mark on Wednesday, the GBP/USD pair attracted fresh buying amid some US dollar profit-taking from a 16-month peak. The intraday buying picked up pace following the release of stronger UK CPI print, which surpassed expectations and accelerated to a 4.2% YoY rate in October.
This comes on the back of Tuesday's mostly upbeat UK employment figures and reinforced the case for an immediate 15bps rate hike in December by the Bank of England. This, in turn, was seen as a key factor that provided a goodish lift to the GBP/USD pair, though Brexit woes acted as a headwind for the sterling and cap gains.
Investors remain worried that the UK government could trigger Article 16 and suspend parts of the Northern Ireland Protocol. Apart from this, expectations for an early policy tightening by the Fed should limit the USD downfall. The combination of factors would keep a lid on any meaningful upside for the GBP/USD pair.
Market participants now look forward to the US housing market data – Building Permits and Housing Starts – due later during the early North American session. This, along with speeches by influential FOMC members and the US bond yields, will drive the USD demand and produce some trading opportunities around the GBP/USD pair.
Technical levels to watch
Gold reached fresh multi-month highs near $1,880 on Tuesday but lost its traction during the American trading hours. XAU/USD is currently fluctuating in a tight range above $1,850 and points to a fresh upswing towards $1,900, in the view of FXStreet’s Dhwani Mehta.
Bull cross confirmation on daily sticks points to a fresh uptrend in the making
“Gold has managed to find strong bids at $1,850, now heading back towards the recent strong resistance at $1,870. If the recovery momentum sustains above the latter, then the June 14 tops of $1,878 will get tested once again. The next relevant upside target is then seen at the $1,900 psychological level.”
“The 100-Daily Moving Average (DMA) has pierced through the 200-DMA from below, representing a bull cross, adding credence to the renewed optimism.”
“Should gold bears fight back control the price could breach the $1,850 demand area, below which the November 11 lows of $1,843 could be back in play. Further south, the previous critical resistance now support at $1,834 will be the level to beat for gold bears.”
See – Gold Price Forecast: XAU/USD to face initial hurdle at $1,917/22 on its way to August 2020 peak at $2,072 – Commerzbank
- UK CPI rises by 4.2% YoY in October vs. +3.9% expected.
- Monthly UK CPI arrives at +1.1% in October vs. +0.8% expected.
- GBP/USD catches fresh bids towards 1.3500 on upbeat UK CPIs.
The UK Consumer Prices Index (CPI) 12-month rate came in at +4.2% in October when compared to +3.1% booked in September while beating expectations of a +3.9% print, the UK Office for National Statistics (ONS) reported on Wednesday.
Meanwhile, the core inflation gauge (excluding volatile food and energy items) rose by 3.4% YoY last month versus +2.9% registered in September, outpacing the consensus forecast of +3.0%.
The monthly figures showed that the UK consumer prices arrived at +1.1% in October vs. +0.8% expectations and +0.3% prior.
Main points (via ONS):
“The largest upward contribution to the October 2021 CPIH 12-month inflation rate came from housing and household services (1.23 percentage points), with further large upward contributions from transport (1.08 percentage points) and restaurants and hotels (0.43 percentage points).”
“CPIH increased by 0.9% on the month in October 2021, compared with no change in October 2020.”
“Housing and household services made the largest upward contribution to the change in the CPIH 12-month inflation rate between September and October 2021, with further large upward contributions to change from several divisions, including transport, restaurants and hotels, education, furniture and household goods, and food and non-alcoholic beverages.”
FX implications:
In an initial reaction to the upbeat UK CPI numbers, the GBP/USD pair popped nearly 35-pips to test 1.3470 highs.
The spot was last seen trading at 1.3459, still up 0.23% on the day.
FX option expiries for November 17 NY cut at 10:00 Eastern Time, via DTCC, can be found below.
- EUR/USD: EUR amounts
- 1.1280 474m
- 1.1390 964m
- 1.1500 1.6b
- USD/JPY: USD amounts
- 115.00 609m
- AUD/USD: AUD amounts
- 0.7300 984m
- USD/CAD: USD amounts
- 1.2500 551m
- 1.2525 810m
- 1.2545 700m
- EUR/GBP: EUR amounts
- 0.8445 839m
Ahead of the critical Eurozone inflation data release, the European Central Bank (ECB) Governing Council Member Olli Rehn said that the price pressures in the bloc will ease next year.
Additional comments
“Inflation accelerating on energy, supply crunch.”
“Inflation not showing up in wages yet.”
-
EUR/USD Price Analysis: Sees a quick rebound to 1.1300 amid oversold conditions
Here is what you need to know on Wednesday, November 17:
The greenback continues to gather strength against its major rivals mid-week with the US Dollar Index climbing above 96.00 for the first time in 16 months. The upbeat Retail Sales data from the US and rising US Treasury bond yields on inflation fears helped the dollar outperform its rivals. Investors await October inflation data from the UK and the EU. Housing Starts and Building Permits from the US will be looked upon for fresh impetus in the second half of the day. Several FOMC policymakers will be delivering speeches during the American trading hours as well.
The benchmark 10-year US Treasury bond yield advanced to its highest level in three weeks at 1.65% earlier in the day and stays relatively quiet during the European trading hours. Wall STreet's main indexes posted modest daily gains and US stocks futures indexes are moving sideways.
St. Louis Fed President James Bullard called for the FOMC to turn "more hawkish" in the upcoming meetings, arguing that would smooth out the policy normalization process. On a dovish note, San Francisco Fed President Mary Daly said the Fed should stay patient when it comes to hiking its policy rate to battle high inflation.
EUR/USD fell below 1.1300 for the first time since July 2020 during the Asian session on Wednesday. Meanwhile, Germany suspended the approval of the Nord Stream 2 project and natural gas prices shot up in Europe, further weighing on the shared currency. Eurostat is expected to report that the Consumer Price Index (CPI) was up 4.1% on a yearly basis in October.
GBP/USD manages to hold above 1.3400 as investors await the UK CPI inflation data, which could ramp up the probability of the Bank of England hiking its policy rate by 20 basis points in December.
UK CPI Preview: Buy the rumour, sell the fact? Three scenarios for GBP/USD.
USD/JPY registered impressive gains on the back of rising US T-bond yields and broad dollar strength on Tuesday. Currently, the pair is trading at its strongest level since March 2017 and closing in on 115.00.
Gold reached fresh multi-month highs near $1,880 on Tuesday but lost its traction during the American trading hours. Since the hot CPI report from the US, gold had been capitalizing on inflation fears but the precious metal seems to be struggling to continue to find demand amid rising US T-bond yields. XAU/USD is currently fluctuating in a tight range above $1,850.
Cryptocurrencies: Bitcoin lost more than 5% on Tuesday and trades below the key $60,000 mark on Wednesday. India is reportedly looking to ban transactions in crypto and China renews efforts to clamp down on mining activities. Ethereum closed the fifth straight day in the negative territory on Tuesday and lost more than 10% during the period. ETH/USD is staying under bearish pressure on Wednesday and approaches $4,000.
In light of advanced prints from CME Group for natural gas futures markets, open interest reversed two straight sessions with losses and rose by just 62 contracts on Tuesday. Volume followed suit and went up by around 67.7K contracts, reversing at the same time four consecutive daily pullbacks.
Natural Gas remains supported near $4.70
Prices of natural gas rose for the second session in a row on Tuesday amidst rising open interest and volume, allowing for the continuation of the recovery in the very near term and with the immediate target at the weekly top near $5.40 per MMBtu (November 16). On the downside, the $4.70 area continues to emerge as a firm contention area.
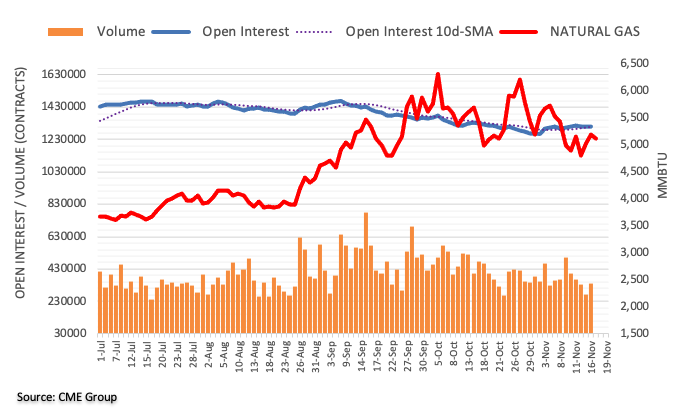
- USD/CAD holds onto 1.2570, bullish MACD supports the price action.
- The pair appends Tuesday trade, sustained upside favors buyers.
- The loonie grinds to stay above 38.2% Fibo. level, Key Fibonacci retracement levels ahead.
The USD/CAD pair continues to ride on the higher side for the second consecutive day on Wednesday. At the time of writing, the currency pair is firmly holding its ground above the 1.2570 level with a high of 1.2586 and a low of 1.2553.
As per the daily chart, the loonie fancies a journey up, as seen from September 21 onwards. The line just crosses in between 200-day Simple Moving Average (SMA) and 21-day SMA. The price action has just been supported last week on November 10.
To further support the argument, Tuesday's FX action is mirroring the August 16 value, with a high 1.2570 and low 1.2550 (round figure). It is to be noted the bull run from then onwards continued till August 19 with a high of 1.2830. This will undoubtedly keep the loonie buyer hopeful.
As per Fibonacci Retracement (Fibo.) drawn from the August 20 sell-off, the loonie remains between 38.2% Fibo. and 50.0% Fibo. Now, if the pair is able to break above 1.2605, it's a weekly high, it will have to further move towards 1.2739 after taking out the goodish 61.8% barrier sitting at 1.2700 level.
The USD/CAD pair's downside momentum from 38.2% Fibo. will call for a test of a confluence of 100-50-Day SMA at 1.2500 (round figure). The next support is at 200-day SMA, aligned at 1.2471. Further south, 21-day SMA, 1.2436 can be found defending the pair's descent.
The Moving Average Convergence Divergence (MACD) shows a bullish bias. The Relative Strength Index (RSI) level is holding above the 50-line horizon, backing the upward momentum.
USD/CAD daily chart
-637727254999076079.png)
USD/CAD additional levels
- EUR/USD rebounds swiftly from 16-month lows, battles 1.1300.
- Oversold RSI conditions could offer temporary reprieve to EUR bulls.
- All eyes on Eurozone inflation for the next big move in the pair.
EUR/USD is struggling to extend the recovery from a new 16-month lows of 1.1264, currently battling 1.1300, as the US dollar clings onto the recent upside.
However, retreating US Treasury yields offer some relief to the EUR bulls while oversold conditions on the daily technical chart also come to the rescue of the bullish traders.
The main currency pair extended its losing streak into a sixth straight session on Wednesday, having witnessed a sharp 40-pips sell-off on a breach of the 1.1300 psychological level.
The 14-day Relative Strength Index (RSI) is pointing south while within the oversold territory, justifying the quick rebound in EUR/USD over the last hours.
However, if the bears defy the oversold conditions, then the daily low could be put to test once again, below which the 1.1250 barrier will be on the sellers’ radars.
EUR/USD: Daily chart
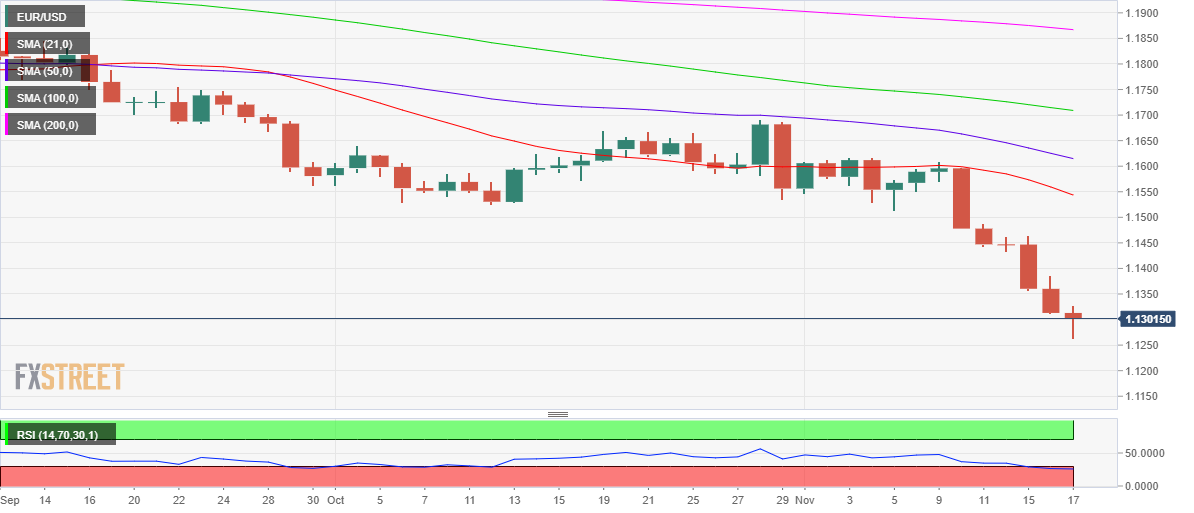
On the flip side, any recovery will need acceptance above the daily highs of 1.1327 to sustain.
Further up, the 1.1350 psychological barrier will challenge the bullish commitments.
EUR/USD: Additional levels to consider
- GBP/CAD extends previous day’s gains on confirming bullish chart pattern.
- Upbeat MACD signals direct short-term buyers to 21-day EMA.
- Bears have multiple barriers before retaking controls.
GBP/CAD stays firmer around 1.6875, keeping the previous day’s upside break of the key resistance ahead of Wednesday’s European session.
In doing so, the cross-currency pair confirms the bullish formation called falling wedge amid the bullish MACD signals before the release of the UK’s Consumer Price Index (CPI).
Read: When are the UK CPIs and how could they affect GBP/USD?
That said, the 21-day EMA level of 1.6910 guards the quote’s immediate upside ahead of the 1.7000 threshold and the late October’s peak surrounding 1.7090.
In a case where the UK inflation numbers propel the GBP/CAD prices beyond 1.7090, late August month’s low near 1.7275 and September’s peak close to 1.7445 will be in focus.
Alternatively, a pullback below the previous resistance line, around 1.6800, should challenge the monthly low of 1.6721.
However, any further downside will be challenged by the support line of the stated wedge formation, near 1.6690 at the latest.
GBP/CAD: Daily chart
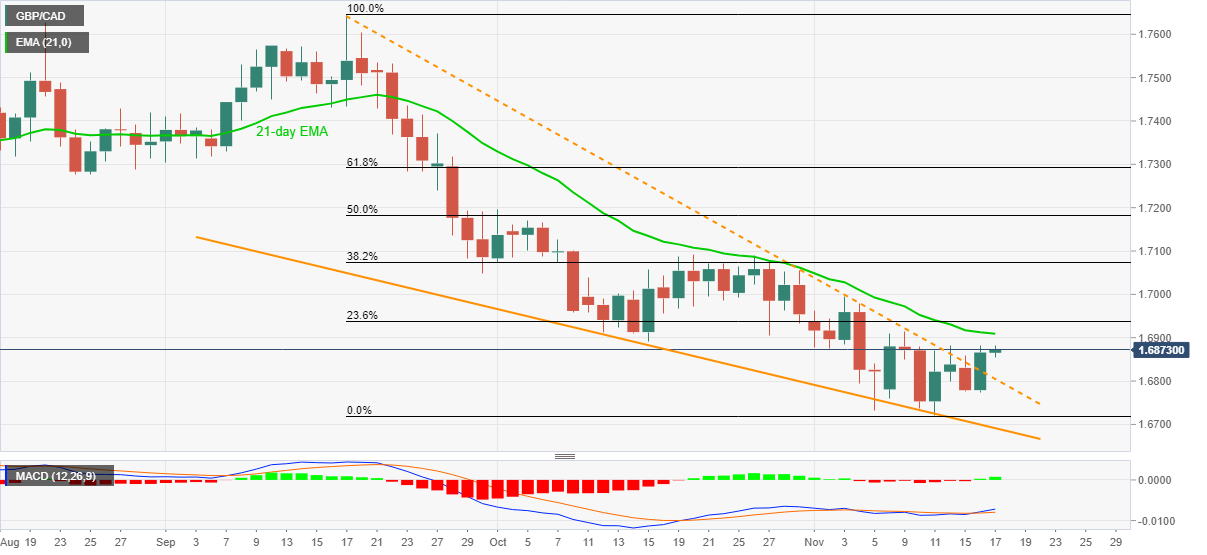
Trend: Further upside expected
CME Group’s flash data for crude oil futures markets noted traders trimmed their open interest positions for the third session in a row on Tuesday, this time by around 13.1K contracts. Volume, instead, increased by around 48.6K contracts after four consecutive daily drops.
WTI faces support near $78.00
Tuesday’s negative price action in WTI came in tandem with shrinking open interest. Against this, the likeliness of a deeper retracement appears not favoured in the very near term. In the meantime, the monthly low at $78.28 should hold the downside for the time being.
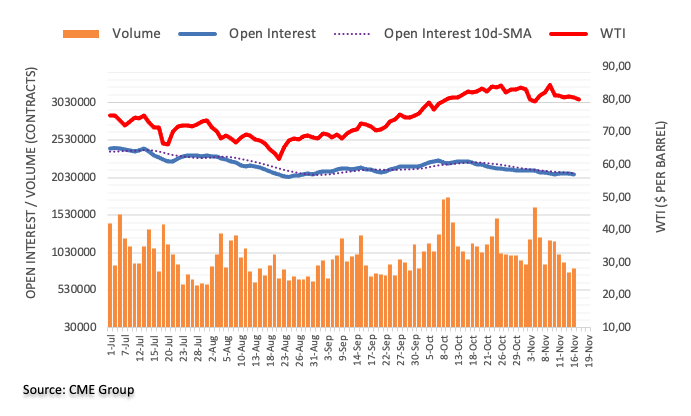
Open interest in gold futures markets resumed the upside and rose by around 3.7K contracts on Tuesday, reversing the previous daily pullback, all considering preliminary figures from CME Group. On the other hand, volume went down by around 71.4K contracts.
Gold could retreat to $1,830
Prices of gold extended the corrective decline for the second session in a row on Tuesday. The move was amidst rising open interest, which is indicative that extra losses remain in the pipeline. That said, the former tops in the $1,830 region per ounce troy now emerge as the initial contention area in the near term.
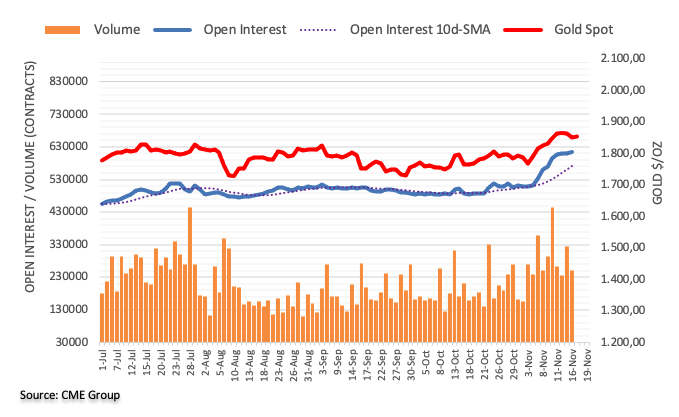
Global rating giant Moody’s came out with their analysis on the Chinese bond markets during early Wednesday.
Read: China eyes easing developer funding restriction in $152 billion ABS market
The report initially mentions that the number of defaulters and amount of defaulted bonds in 2022 to remain low relative to China's total onshore and offshore bonds.
“Chinese authorities will encourage debt restructuring or liquidation through the courts for distressed Chinese companies,” said Moody’s. “But the authorities will step in to ensure stability if bond defaults were to spike and trigger systemic risk."
Given the risks emanating from Chinese real-estate firms like Evergrande and Kaisa, such news should build investor morale. However, firmer US Treasury yields weigh on the Chinese stocks at the latest.
Read: Asian Stock Market: Grinds lower amid firmer Treasury yields, China headlines
- USD/INR fades bounce off 100-DMA, consolidates weekly gains.
- Buyers remain hopeful as MACD teases bullish cross, on sustained trading above 200-DMA.
- 74.70, July’s peak on the bull’s radar, ascending trend line from May adds to the downside filter.
USD/INR takes offers to refresh intraday low around 74.40 ahead of Wednesday’s European session.
In doing so, the Indian rupee (INR) pair reverses the previous day’s bounce off the 100-DMA below a downward sloping trend line from October 12.
The quote’s ability to stay beyond the 200-DMA and the MACD line’s nearness to the bullish cross keeps the USD/INR buyers hopeful to overcome the stated resistance line, around 74.55 by the press time.
However, lows marked during late October and July’s top, respectively around 74.70 and 75.00, will challenge the bulls before directing them to the double tops marked near 75.65.
On the contrary, a daily closing below the 100-DMA level of 74.30 will redirect the quote to the 200-DMA level of 73.87.
Also acting as a downside filter is the six-month-old support line near 73.30 and the 74.00 threshold.
USD/INR: Daily chart
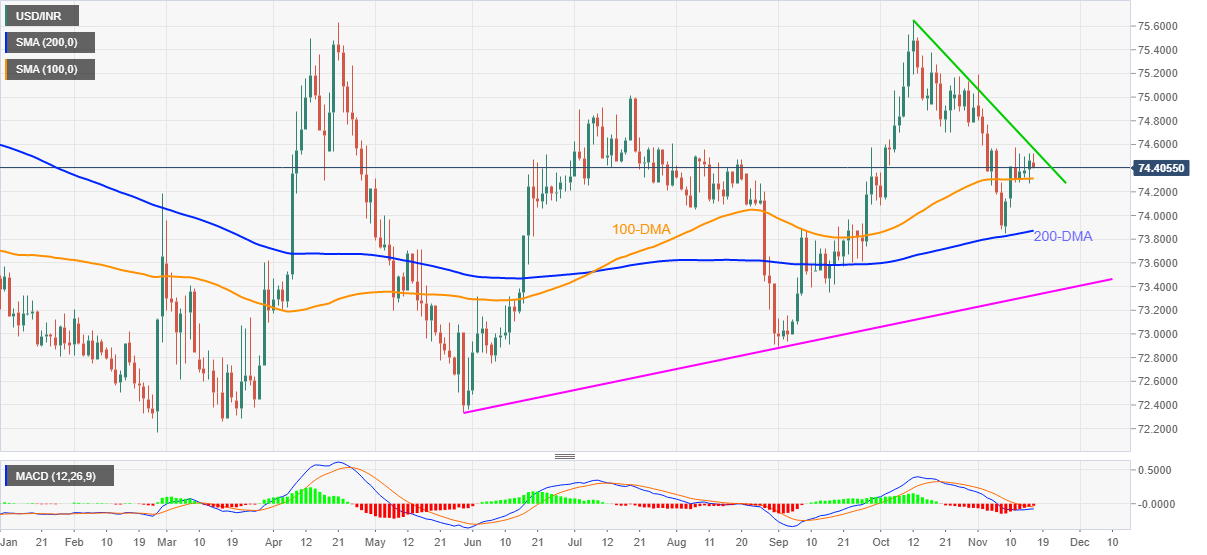
Trend: Bullish
Bloomberg came out with news, during early Wednesday, suggesting a relief to the Chinese developers.
The news suggests that the Chinese regulator is up for easing the lending restrictions for the domestic developers as far as the Asset-Backed Securities (ABS) market is concerned. It’s worth noting that the market size turns out to be $152 billion and hence provides a good boost to the investor morale.
AUD/USD licks its wounds
Following the news, AUD/USD bounces off the recently flashed monthly low around 0.7260 to 0.7282. However, broad US dollar strength, backed by the firmer Treasury yields weighs on the quote.
Read: AUD/USD Price Analysis: Takes offers at fresh monthly low, 0.7225-20 in focus
The UK CPIs Overview
The cost of living in the UK as represented by the Consumer Price Index (CPI) for October month is due early on Wednesday at 07:00 GMT. Given the recently strong employment data, coupled with the Bank of England’s (BOE) emphasis on CPI to dial back the bond purchase, today’s inflation numbers will be watched closely by the GBP/USD traders.
The headline CPI inflation is expected to rise to 3.9% YoY versus 3.1% prior while the Core CPI, which excludes volatile food and energy items, is likely to improve to 3.0% from 2.9% in October. Talking about the monthly figures, the CPI could jump to 0.8% MoM from 0.3% marked in September.
It’s worth noting that the supply crunch also highlights the Producer Price Index (PPI) for immediate GBP/USD direction. That being said, the PPI Core Output YoY may jump from 6.5% to 5.9% on a non-seasonally adjusted basis whereas the monthly prints can rise to 0.7% from 0.5% prior. Furthermore, the Retail Price Index (RPI) is also on the table for release, expected 5.7% YoY versus 4.9% prior.
In this regard, analysts at TD Securities said,
A partial unwind of last year's VAT tax in the hospitality industry, coupled with a 12% increase in utility prices by Ofgem, and the impact of fuel shortages likely led to a sharp rise in inflation in the month. We look for a full percentage point rise in headline inflation to 4.1% y/y (expected: 3.9%) with core inflation reaching 3.1% (market forecast: 3.1%), thus extending the rapid increase in UK inflation from the beginning of the year. Inflation is only heading higher from here, and the risks to this print are to the upside.
How could it affect GBP/USD?
GBP/USD consolidates intraday losses around 1.3420, down 0.03% on a day, heading into Wednesday’s London open.
In doing so, the cable pair struggles to overcome the broad US dollar strength, backed by the firmer US Treasury yields. Hopes of overcoming the deadlock on the Northern Ireland (NI) protocol and hawkish bets on the Bank of England’s rate hike concerns favor the GBP/USD buyers of late. Though, a comparatively higher emphasis on the Fed rate hike and fresh covid woes in England test the cable’s upside momentum.
That said, today’s inflation numbers could help the BOE hawks to reiterate their policy adjustment demands. The latest comments from the BOE Governor Andrew Bailey also hint at the higher interest rate should the price pressure mount. BOE Governor Bailey speaking before the UK Parliament Treasury Select Committee TSC, said that all future BoE policy meetings are now “in play” for a rate rise.
Hence, a firmer CPI print should recall the GBP/USD buyers but daily close past the monthly resistance line, around 1.3445 by the press time, becomes necessary for the pair to ignore odds of visiting the yearly low surrounding 1.3350.
Key notes
GBP/USD drops back towards 1.3400 on Brexit woes, UK inflation eyed
UK CPI Preview: Buy the rumor, sell the fact? Three scenarios for GBP/USD
About the UK CPIs
The Consumer Price Index released by the Office for National Statistics is a measure of price movements by the comparison between the retail prices of a representative shopping basket of goods and services. The purchasing power of GBP is dragged down by inflation. The CPI is a key indicator to measure inflation and changes in purchasing trends. Generally, a high reading is seen as positive (or bullish) for the GBP, while a low reading is seen as negative (or Bearish).
- Asian equities trade mixed, mostly heavy, amid US bond selling.
- Xi-Biden talks have a lot to follow up, US Commerce Secretary alleges China not respecting trade deal terms.
- Aussie Wage Price Index renew RBA rate hike expectations, US data keeps Fed action needs in focus.
- US Treasury yields refresh three-week top, DXY rising to the highest since July 2020.
Asian investors struggle for clear direction as firmer US Treasury yields and mixed updates concerning China probe bulls heading into Wednesday’s European session. That said, the MSCI’s index of Asia-Pacific shares outside Japan drops 0.40% whereas Japan’s Nikkei 225 replicates the move by the press time.
Markets in Japan remain depressed even as the government pushed back talks over capital gain tax to the next year. The reason could be linked to the mixed trade numbers and ongoing talks over the US steel and aluminium tariffs. “Japanese trade and industry minister Koichi Hagiuda and U.S. Trade Representative Katherine Tai held talks in Tokyo on Wednesday over extra tariffs on Japan's exports of steel and aluminum to the United States imposed by former President Donald Trump,” said Kyodo News.
On a different page, US President Joe Biden signaled that they have a lot to follow up on despite having a “good meeting” with China’s Xi. The same join comments from US Commerce Secretary Gina Raimondo who said, per Bloomberg, “China is not living up to its commitments in the phase one trade deal.”
The absence of positives concerning China and strong US Treasury yields not only weigh on stock from China, Hong Kong and South Korea but also challenge investors in Australia and New Zealand.
It’s worth noting that Australia’s Wage Price Index matched the upbeat forecast for Q3 and renewed RBA rate hike call, dragging down the ASX 200 by 1.0% at the latest.
Elsewhere, New Zealand Prime Minister Jacinda Ardern’s unlock announcement failed to impress Kiwi bulls as RBNZ rate hikes gain more attention ahead of the next week’s monetary policy meeting.
It should be noted that Indonesia and India manage to battle the bears amid covid-linked good news at home.
On a broader front US 10-year Treasury yields renew three-week high whereas the US Dollar Index (DXY) jumps to the highest since July 2020 to weigh on the Asia-Pacific equities. Behind the moves could be the fresh Fed rate hike chatters backed by the strong US Retail Sales for October.
Read: US 10-year Treasury yields wobble at three-week top on mixed clues
- AUD/USD extends losses to renews multi-day low, ignores oversold RSI conditions.
- Bearish MACD, sustained trading below 61.8% Fibonacci retracement level directs sellers to two-month-old horizontal support.
AUD/USD remains on the back foot for the second consecutive day, refreshing monthly low to 0.7262 heading into Wednesday’s European session.
In doing so the Aussie pair extends pullback from a convergence of a fortnight-long resistance line and 50-SMA below the 61.8% Fibonacci retracement (Fibo.) of late September-October upside.
Given the bearish MACD signals favor AUD/USD sellers, the quote’s further declines towards a horizontal area comprising multiple lows marked since September 20, around 0.7225-20, can’t be ruled out.
However, the pair’s further weakness will be challenged by the oversold RSI conditions, which if ignored could drag the September’s low of 0.7170.
Meanwhile, the corrective pullback may eye the 61.8% Fibo. level of 0.7317 but remains ineffective until crossing the 0.7355 resistance confluence.
Even if the AUD/USD buyers manage to cross the 0.7355 hurdle, the 200-SMA around 0.7400 will be in focus.
AUD/USD: Four-hour chart
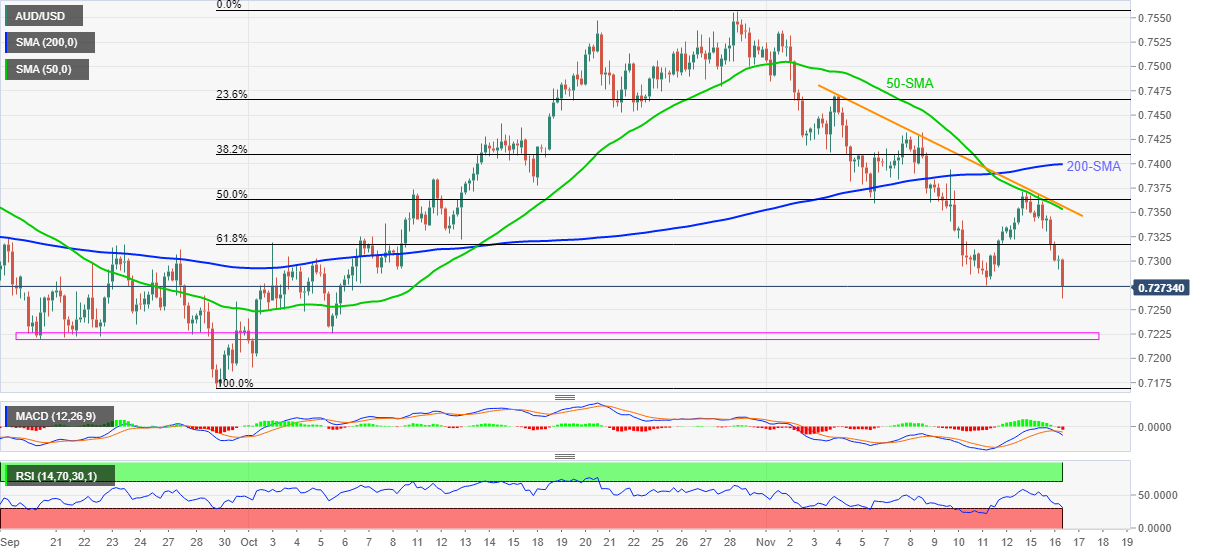
Trend: Further weakness expected
Amid resurgent US dollar demand across the board, EUR/USD accelerated its bearish momentum, breaching the 1.1300 level for the first time since July 2020.
more to come ...
EUR/USD: 15-minutes chart
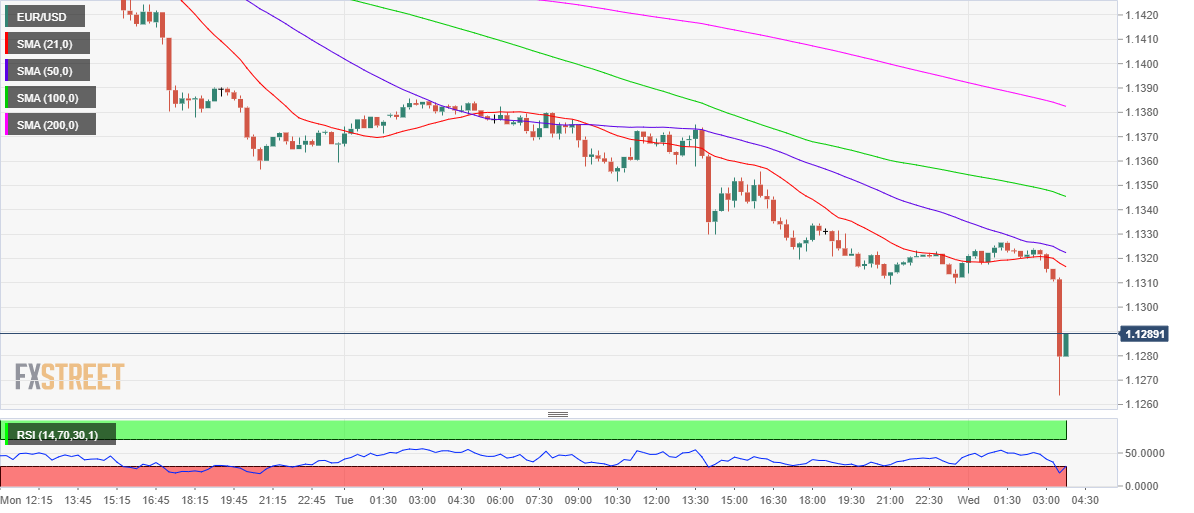
EUR/USD technical levels to watch
In an interview with Bloomberg TV on Wednesday, US Commerce Secretary Gina Raimondo said that China is not living up to its commitments in the phase one trade deal.
This comes a day after a virtual call between US President Joe Biden and Chinese leader Xi Jinping, emphasizing their responsibility to the rest of the world to avoid conflict and enhance communication.
Market reaction
AUD/USD is at fresh six-week lows near 0.7260 amid renewed US-Sino concerns. The spot is down 0.41% on the day.
In the view of the analysts at Goldman Sachs, the Antipodeans are likely to remain weaker against the US dollar. The kiwi dollar, however, is likely to outperform its Australian counterpart.
Key quotes
“Our views on the RBA are fairly dovish, as the economy faces softer wage and inflation dynamics, and risks from a potential slowdown in Chinese growth. Our forecasts for AUD, as a result, are fairly negative versus USD over a 12-month horizon. “
“In contrast, our forecasts for the RBNZ are far less dovish, though our projections of the terminal rate are lower than market expectations, and we expect NZD to be dragged down vs USD along with AUD.”
“Despite our forecasts for AUD and NZD lower vs USD, we still prefer NZD to AUD and project downside in AUD/NZD over the next 12 months.”
- AUD/JPY pays little heed to Australia’s wage growth data.
- The cross bears the brunt of mixed action on the Asian equities.
- The risk-sensitive pair now awaits RBA's Ellis speech and Japan’s National CPI data.
AUD/JPY extends its previous day’s negative trade on Wednesday. The currency pair eases below 84.00 during the Asian session. At the time of press, the pair is trading at 83.67, down 0.21%.
The cross-currency seems to ignore moderate growth in Australian wages in Q3, taking the local currency back to its pre-pandemic level. But the numbers are still short of the pace that the policymakers believe would justify any hike in the interest rates. On Tuesday, the Australian Bureau of Statistics (ABS) showed that the country’s price index rose 0.6% in the September quarter, marginally above the predicted number of 0.5%.
Minor seesawing movement in the currency pair is led by Wednesday's positive Japanese Merchandise Trade Balance Total (October) data. In its latest Merchandise Trade Balance, the export-dependent economy hit a trade surplus of 67.4 billion Yen (around ($586.60 million).
Investors of the safe haven, the yen, are looking forward to the release of Japan’s COVID-19 fiscal stimulus package. The stimulus package, worth 40 trillion yen ($350 billion), is expected to revive the pandemic and oil price-hit economy.
According to analysts at Rabobank, “JPY net short positions edged lower having reached their highest level since December 2018 the previous week.” It further said that “The Bank of Japan’s (BoJ) accommodative policy has been keeping speculative demand for the safe-haven JPY at bay, though the BoJ indicated in late October that it is closely watching JPY weakness and rising commodity prices.”
Amid a relatively shallow economic calendar, the risk-barometer pair will look for impetus from Reserve Bank of Australia (RBA) Assistant Governor Luci Ellis speech and Japan’s National Consumer Price Index scheduled on Friday.
AUD/JPY technical levels
US Treasury Secretary Janet Yellen offered some consolation to the market late Tuesday after she announced an extension to a deadline for a potential US government default to December 15 from December 3.
The extended deadline would give Congress more time to raise the federal debt ceiling.
Yellen told lawmakers that she now estimates that the US to reach its debt limit on December 15, almost two weeks later than her initial forecast of December 3.
In reaction to Yellen’s statement, the yields on the US 10-year Treasury bills extended its post-Retail Sales gains and reached the highest levels in three weeks at 1.644%.
Amidst rising inflationary pressures and Fed’s rate hike expectations, the returns on the US debt are once again looking attractive while the US dollar holds near 16-month peak against its main competitors.
Read: US 10-year Treasury yields wobble at three-week top on mixed clues
- Gold consolidates the heaviest daily fall in two weeks following a pullback from five-month high.
- Risk appetite dwindles amid stimulus hopes, immediate relief from US debt ceiling talks and Fed rate hike concerns.
- Sino-American ties may have a long way to impress markets, Fedspeak in focus.
- Gold Price Forecast: Corrective decline could reach 1,830
Gold (XAU/USD) prints mild intraday gains around $1,855 during early Wednesday. The metal witness a volatile session on Tuesday that snatched the quote from a multi-day peak towards marking the heaviest daily loss in a fortnight.
The metal’s latest consolidation could be linked to the sluggish US Treasury yields, as well as the US Dollar Index (DXY), after a two-day uptrend. That said, the US 10-year Treasury yields pause around 1.64% after the recent run-up to renew the highest levels since October 26 whereas the DXY clings to a 16-month high around 95.90. Also favoring the gold buyers could be the firmer stock futures, following the upbeat Wall Street close.
Comments from San Francisco Federal Reserve Bank President Mary Daly contradict the previously hyped need for the Fed rate hike, by St. Louis Fed President James Bullard, as well as ex-US Treasury Secretary Lawrence Summers and former New York Fed President Bill Dudley.
In addition to the challenges to Fed hawks, easing pressure to discuss the debt ceiling extension also helps the gold buyers to remain hopeful. Recently, US Treasury Secretary Janet Yellen offered some relief to the markets by announcing a bit more time before the debt ceiling expires, from December 03 to 15, due to US President Biden’s latest stimulus.
Additionally, a lack of major data/events in Asia and no major entertainment from the talks between US President Joe Biden and his Chinese counterpart Xi Jinping also allow gold traders to recover the previous day’s losses.
It’s worth noting that, an eight-month high US Retail Sales for October, 1.7% MoM versus 1.4% expected, joined strong US Industrial Production and housing market data to enable Fed policymakers in pushing the rate hike concerns.
Hence, Wednesday’s light calendar will highlight the Fedspeak to reconfirm the policymakers’ bullish bias and challenge the gold traders.
Technical analysis
Overbought RSI conditions triggered the gold prices pullback from a multi-day peak, not to forget dragging it back from a yearly resistance line, the previous day. However, the yellow metal remains above a longer-term previous resistance line from August 2020, around $1,828 by the press time.
Given the bullish MACD signals and the absence of overbought RSI at present, as well as sustained trading beyond the key trend line, gold prices are likely to remain directed towards the descending resistance line from January 2021, near $1,868.
Should gold buyers manage to conquer the $1,868 hurdle, the quote’s run-up towards another resistance line, from September 2020 close to $1,906, can’t be ruled out.
Meanwhile, further weakness may aim for the $1,828 level comprising resistance-turned-support line whereas sustained trading below the same could recall sellers targeting October’s peak of $1,813.
Gold: Daily chart
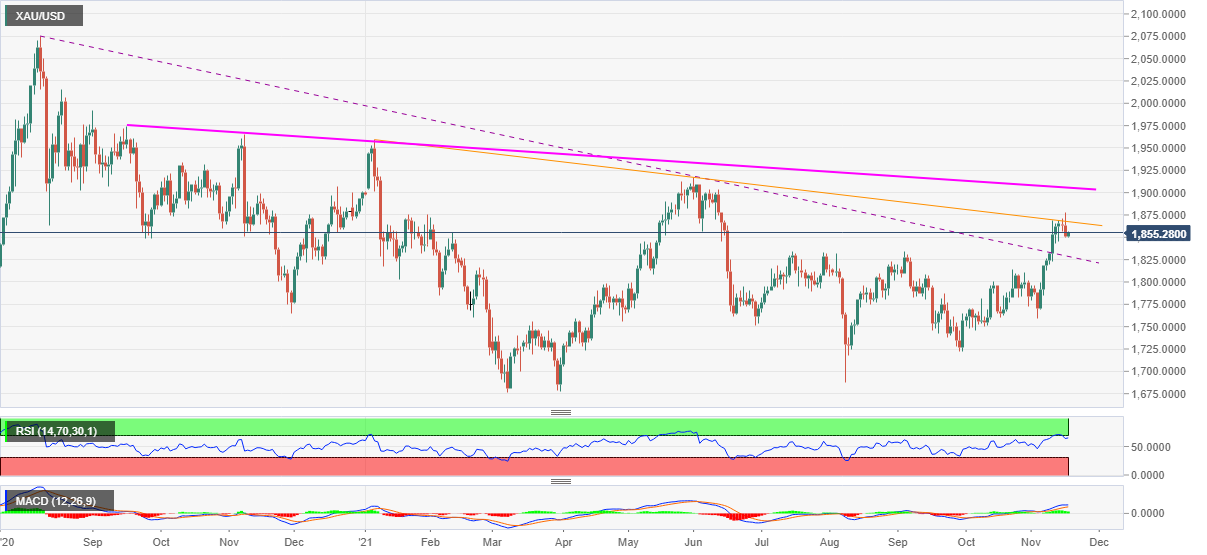
Trend: Bullish
New Zealand Prime Minister Jacinda Ardern announced on Wednesday, they will lift a temporary border around Auckland on December 15, reopening borders almost after four months.
Key quotes
“Aucklanders who have been vaccinated or tested will be able to reconnect with the rest of New Zealand in time for Christmas and summer.”
“Aucklanders have faced restrictions for an extended period of time to keep the rest of New Zealand safe. But with increased rates of vaccination, it’s time to open up the ability to travel again.”
It’s worth noting that Auckland, home to a third of New Zealand’s five million people, is close to achieving 90% of its eligible population being fully vaccinated.
Market reaction
NZD/USD has bounced off 0.6966 lows, cheering the re-opening optimism to now trade at 0.6993, up 0.04% on the day.
| Raw materials | Closed | Change, % |
|---|---|---|
| Brent | 82.46 | 0.49 |
| Silver | 24.8 | -0.99 |
| Gold | 1849.797 | -0.7 |
| Palladium | 2152.85 | 0.5 |
- USD/JPY traders will look for impetus from Japan's National CPI data on Thursday.
- US dollar remains upbeat, economic data released on Tuesday surpassed expectations.
- USD/JPY strengthens on a positive outlook, eyes towards major resistance 115.00.
USD/JPY was trading at its multi-year high on Wednesday at around 114.81, the strongest since October 20 and then pulled back modestly. The pair, however, could be heading towards a major resistance barrier of 115.00. At the time of reporting, it peaked at 114.93 with a low of 114.78. The combination of higher US T-bond yields, rising equity prices and a rally of the US dollar across the board helped the pair to take up more ground.
At this point, if the currency can break the near-side resistance of 115.00, there really aren't any significant chart points until the December 2016 high near 118.65.
In addition to this, positive Merchandise Trade Balance Total (October), released by the Japanese Finance Ministry on Tuesday, shows a trade surplus at 67.4 billion Yen ($586.60 million). However, a Reuters report suggests that Japan's export growth snapped 7-month double-digit expansion in October, led by a decrease in US and China-bound car shipments.
A slowdown in the shipments highlights risks for the Japanese economy, which is highly dependent on the exports and trade surplus, from global supply constraints. Any fluctuations in the exports will shift investors from other safe havens, directly impacting the currency pair's value.
Furthermore, the pair's investors are looking for the Japanese COVID-19 fiscal stimulus package, worth a few trillion Yen, likely to be announced by the end of the week. The stimulus package is aimed at reviving the Japanese economy, which witnessed a decline in consumption in the third quarter.
The US dollar has lately proven to be stronger compared to the local currency Yen, especially after better-than-expected Retail Sales Data posted by the US. The US inflation data last week rose and showed consumer prices surged to their highest rate since 1990. Investors now expect that the Federal Reserve will taper. Some experts even expect that the Fed could potentially hike interest rates sooner than first anticipated.
On Tuesday, US data showed US consumers looked past rising prices and drove Retail Sales higher by 1.7% in October, topping consensus expectations of a 1.4% rise. Additionally, US Industrial Production lifted 1.6% in October, with a higher surprise.
It is to be noted, two regional Federal Reserve chiefs on Tuesday were at odds over the inflation outlook and what it might mean for central bank interest rate policy.
Federal Reserve Bank of St. Louis President James Bullard said the US central bank needs to move more forcefully to confront high levels of inflation. Meanwhile, San Francisco Fed leader Mary Daly stressed that moves to tamp down on price pressures prematurely could cause unneeded pain later should those pressures weaken. It remains to be seen how this plays out and affect the price action of this safe-haven asset.
Traders on Wednesday will closely monitor several US Federal speakers' speeches and Japan's National Consumer Price Index Thursday to find impetus.
USD/JPY technical levels
- NZD/USD grinds lower around five-week low, retreats of late.
- Bearish candlestick, sustained trading below 200-DMA, 61.8% Fibo. favor sellers.
- Three-month-old support line on seller’s radar amid bearish MACD signals.
NZD/USD struggles to recovery as bears take a breather around monthly low, retreating to 0.6990 during early Wednesday.
The kiwi pair dropped the most in a week the previous day while justifying Monday’s bearish candlestick formation, as well as sustained trading below the key 200-DMA.
The declines broke 61.8% Fibonacci retracement (Fibo.) of September-October upside but a horizontal line from late August tests the NZD/USD pair of late.
However, bearish MACD signals keep sellers hopeful of conquering the 0.6980 immediate support, which in turn will direct the downtrend towards an ascending support line from August 20, near 0.6920.
Alternatively, corrective pullback needs a daily closing beyond the 61.8% Fibo. level of 0.7000 to direct the NZD/USD buyers towards the 50% Fibonacci retracement level of 0.7040.
Even so, the upside momentum remains challenged until crosses the 200-DMA surrounding 0.7095.
NZD/USD: Daily chart
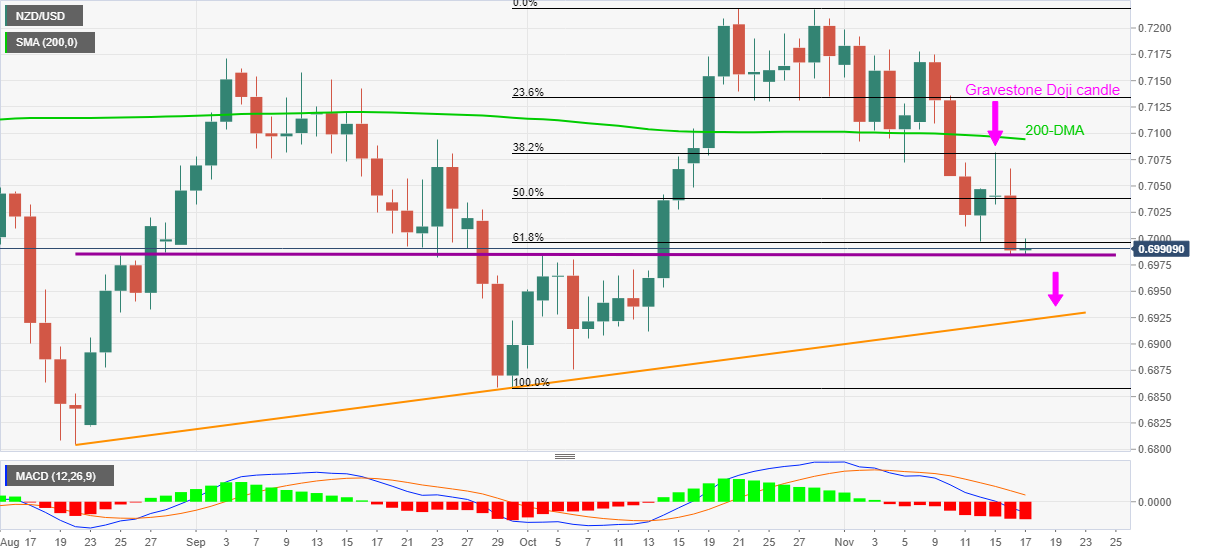
Trend: Further weakness expected
- US Treasury yields pause after two-day rally to refresh monthly high, stock futures grind higher.
- Fed’s Bullard teases monetary policy tightening but Daly turns it down.
- Yellen pushes back the debt ceiling expiry, Biden-Xi talks fall short of excitement.
- Fedspeak becomes important amid a light calendar, inflation is the key.
Market sentiment dwindles early Wednesday as Fed policymakers try to placate bond bears. However, firmer US data and chatters that the incoming stimulus will propel inflation keep bond bears hopeful.
That said, the US 10-year Treasury yields pause around 1.63% after the recent run-up to renew the highest levels since October 26. The lack of movement could also be witnessed in the US stock futures as the S&P 500 Futures seesaw around 4,700 after rising to a new one-week high the previous day.
An eight-month high US Retail Sales for October, 1.7% MoM versus 1.4% expected enables Fed policymakers like St. Louis Fed President James Bullard, as well as ex-US Treasury Secretary Lawrence Summers and former New York Fed President Bill Dudley, to back the Fed rate hike concerns. Also favoring the hawkish hopes, weighing on the bonds, were upbeat outcomes of the US Industrial Production and housing market data.
It should be, however, noted that San Francisco Federal Reserve Bank President Mary Daly recently said, “Rate hikes would not fix high inflation now, would curb demand and slow recovery.” The policymaker adds that today's inflation in mid-2022 is “a different conversation.”
Also challenging the mood and underpinning the US Treasury yields, as well as the US Dollar Index (DXY), is the lack of major positive updates from a virtual meeting between US President Joe Biden and his Chinese counterpart Xi Jinping. US President Biden signaled that they have a lot to follow up on despite having a “good meeting” with China’s Xi.
Though, US Treasury Secretary Janet Yellen offered some relief to the markets by announcing a bit more time before the debt ceiling expires, from December 03 to 15, due to US President Biden’s latest stimulus.
Given the sluggish markets and a light calendar, today’s Fedspeak and chatters concerning China will be important for fresh impulse.
Read: Forex Today: Dollar reaching overbought conditions, still poised to run
- EUR/USD bulls looking for a significant correction.
- US dollar could come under pressure as it stalls at 16-month highs.
EUR/USD was hit heavily on Tuesday by surging US yields and the US dollar flying to 16-month highs. The euro has been pressured for a number of fundamental reasons and the greenback lifted for the same.
DXY H1 chart
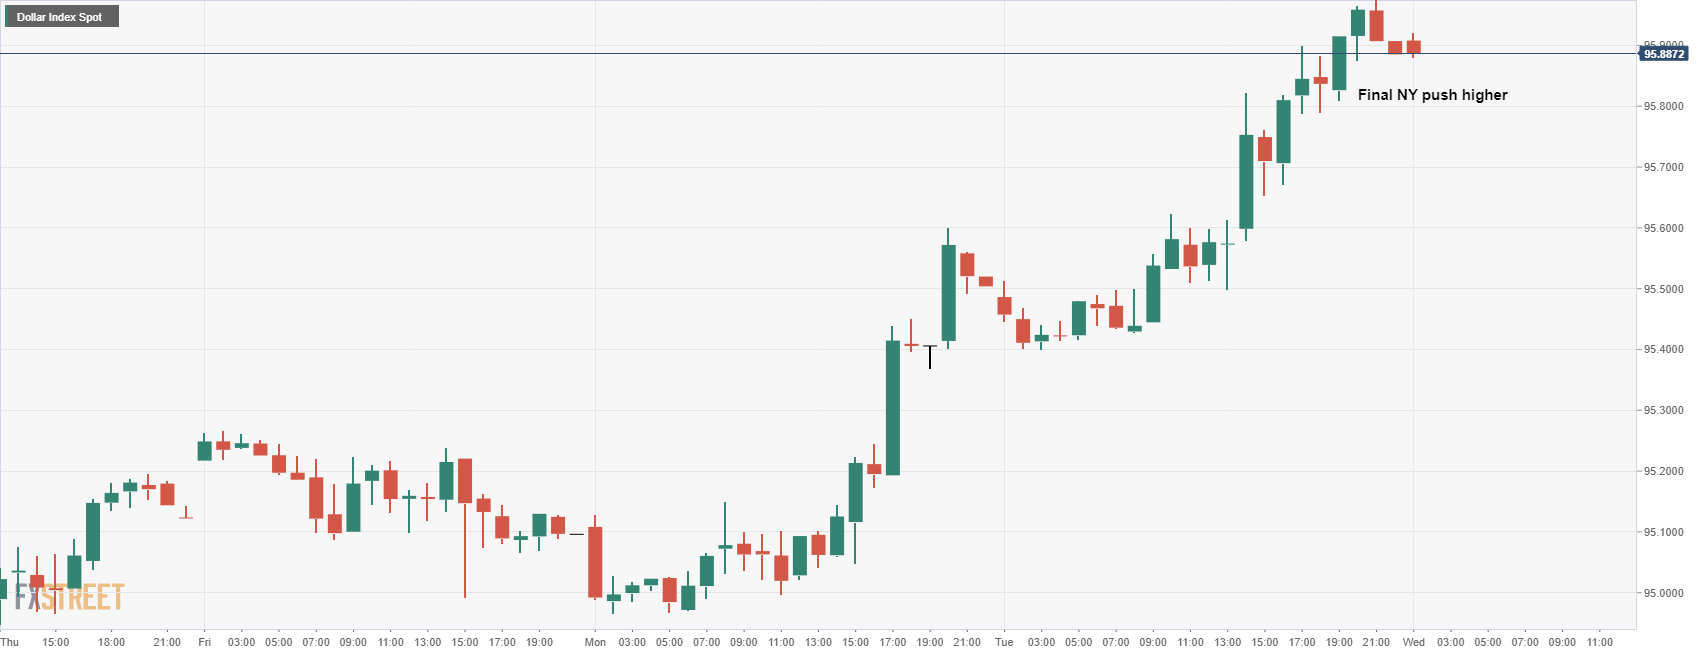
EUR/USD daily chart
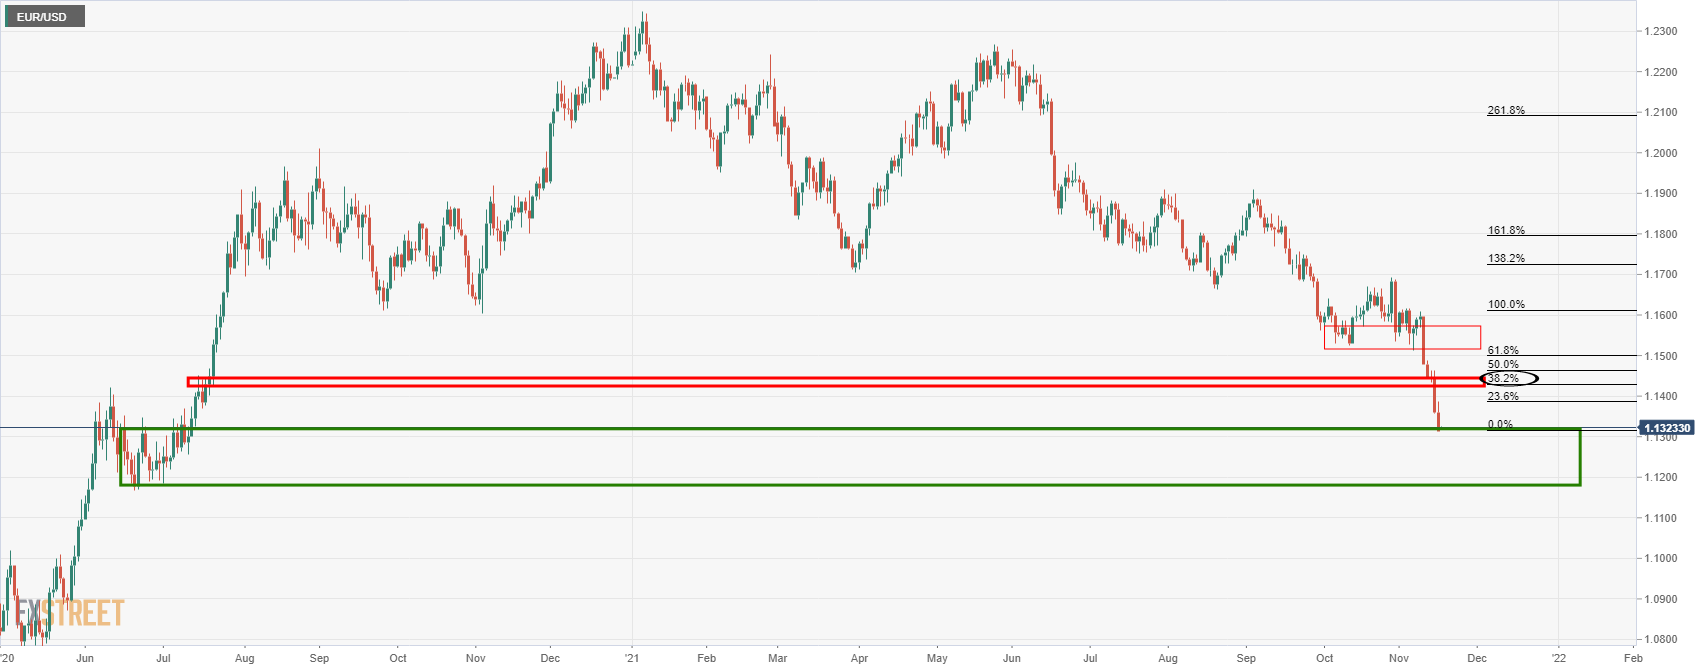
EUR/USD is meeting daily support and a correction to the 38.2% Fibonacci retracement level could be in order.
From an hourly perspective, the price is trying to base in the low 1.1300 area and it is on the approach to the 38.2% Fibonacci that meets the 10-EMA.
Beyond there, we have the 61.8% Fibo that is almost aligned with the prior structure near the 21-EMA as near them targets.
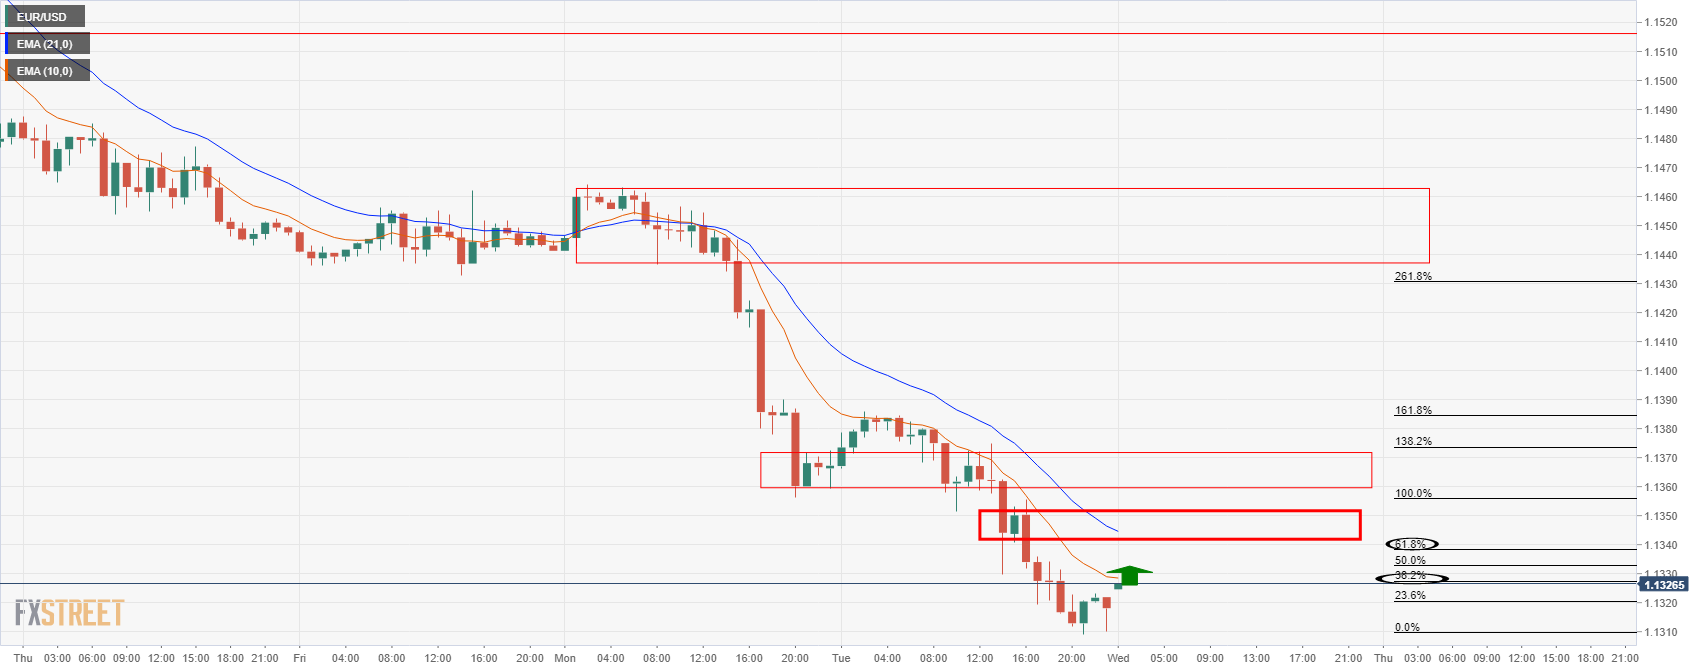
| Time | Country | Event | Period | Previous value | Forecast |
|---|---|---|---|---|---|
| 00:30 (GMT) | Australia | Wage Price Index, q/q | Quarter III | 0.4% | 0.5% |
| 00:30 (GMT) | Australia | Wage Price Index, y/y | Quarter III | 1.7% | 2.2% |
| 07:00 (GMT) | United Kingdom | Retail Price Index, m/m | October | 0.4% | 0.8% |
| 07:00 (GMT) | United Kingdom | Producer Price Index - Output (MoM) | October | 0.5% | 0.8% |
| 07:00 (GMT) | United Kingdom | Producer Price Index - Input (YoY) | October | 11.4% | 12.1% |
| 07:00 (GMT) | United Kingdom | Producer Price Index - Input (MoM) | October | 0.4% | 1.1% |
| 07:00 (GMT) | United Kingdom | Producer Price Index - Output (YoY) | October | 6.7% | 7.3% |
| 07:00 (GMT) | United Kingdom | Retail prices, Y/Y | October | 4.9% | 5.7% |
| 07:00 (GMT) | United Kingdom | HICP ex EFAT, Y/Y | October | 2.9% | |
| 07:00 (GMT) | United Kingdom | HICP, m/m | October | 0.3% | 0.8% |
| 07:00 (GMT) | United Kingdom | HICP, Y/Y | October | 3.1% | 3.9% |
| 10:00 (GMT) | Eurozone | Construction Output, y/y | September | -1.6% | |
| 10:00 (GMT) | Eurozone | Harmonized CPI | October | 0.5% | 0.8% |
| 10:00 (GMT) | Eurozone | Harmonized CPI ex EFAT, Y/Y | October | 1.9% | 2.1% |
| 10:00 (GMT) | Eurozone | Harmonized CPI, Y/Y | October | 3.4% | 4.1% |
| 13:30 (GMT) | U.S. | Housing Starts | October | 1.555 | 1.576 |
| 13:30 (GMT) | U.S. | Building Permits | October | 1.586 | 1.638 |
| 13:30 (GMT) | Canada | Consumer Price Index m / m | October | 0.2% | 0.7% |
| 13:30 (GMT) | Canada | Bank of Canada Consumer Price Index Core, y/y | October | 3.7% | |
| 13:30 (GMT) | Canada | Consumer price index, y/y | October | 4.4% | 4.7% |
| 14:10 (GMT) | U.S. | FOMC Member Williams Speaks | |||
| 15:30 (GMT) | U.S. | Crude Oil Inventories | November | 1.001 | 1.398 |
| 16:00 (GMT) | U.S. | FOMC Member Bowman Speaks | |||
| 16:40 (GMT) | U.S. | FOMC Member Mester Speaks | |||
| 17:40 (GMT) | U.S. | FOMC Member Daly Speaks | |||
| 18:30 (GMT) | Eurozone | ECB President Lagarde Speaks | |||
| 21:05 (GMT) | U.S. | FOMC Member Charles Evans Speaks | |||
| 21:10 (GMT) | U.S. | FOMC Member Bostic Speaks |
In recent trade today, the People’s Bank of China (PBOC) set the yuan (CNY) at 6.3935 vs. the last close of 6.3917 and an estimate of 6.3919.
About the fix
China maintains strict control of the yuan’s rate on the mainland.
The onshore yuan (CNY) differs from the offshore one (CNH) in trading restrictions, this last one is not as tightly controlled.
Each morning, the People’s Bank of China (PBOC) sets a so-called daily midpoint fix, based on the yuan’s previous day closing level and quotations taken from the inter-bank dealer.
- DXY bulls pause after two-day uptrend around 16-month high.
- Overbought RSI conditions, key Fibonacci retracement level hints at a pullback.
- 200-week SMA becomes the key support, further advances may eye August 2018 peak.
US Dollar Index (DXY) grinds higher around 95.90 during early Wednesday, after refreshing the highest levels since July 2020 the previous day.
The greenback gauge’s latest halt at the multi-day top could be linked to the overbought RSI conditions and the buyers’ battle with the 50.0% Fibonacci retracement (Fibo.) of a broad downtrend from early 2017 to February 2018.
It should be noted, however, that the pullback moves may remain less important until declining back below the 200-week SMA level of 94.85.
Also acting as downside filters are the tops marked during September 2020 and October 2021, respectively around 94.75 and 94.55.
On the contrary, a clear upside break of the 96.00 Fibo. hurdle will direct the DXY bulls towards the August 2018 high near the 97.00 threshold before aiming for the 61.8% Fibonacci retracement level surrounding 97.85.
To sum up, DXY remains in the uptrend but a short-term pullback can’t be ruled out.
DXY: Weekly chart
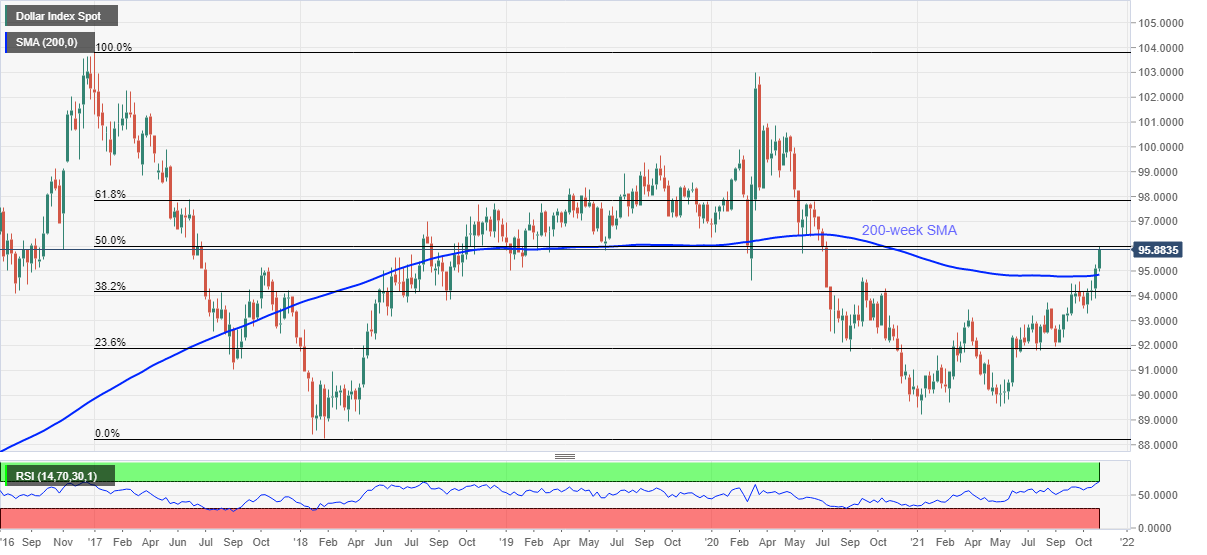
Trend: Pullback expected
- AUD/USD refreshes weekly low despite firmer Aussie Q3 Wage Price Index.
- US Treasury yields poke three-week top as inflation concerns remain elevated.
- Xi-Biden talks fail to impress, US Treasury Sec. Yellen extends debt ceiling date.
- Fedspeak, China headlines will be important after RBA updates pour cold water on the face of Aussie bulls.
AUD/USD takes offers to refresh intraday low around 0.7285 during early Wednesday. In doing so, the Aussie pair extends the heaviest daily fall in a week, posted the previous day, to refresh the week’s bottom.
That said, the quote ignores the recently released Australia Wage Price Index data for the third quarter (Q3). The WPI figures match 2.2% YoY expectations versus 1.7% prior while rising past 0.5% QoQ market consensus to 0.6%, compared to 0.4% previous readouts.
Market’s rush for risk-safety amid speculations over the US Federal Reserve’s (Fed) monetary policy tightening and an absence of encouraging details from a virtual meeting between US President Joe Biden and his Chinese counterpart Xi Jinping favors AUD/USD bears of late. On the same line was the rejection of rate hike concerns by the Reserve Bank of Australia (RBA) Minutes and Governor Philip Lowe.
It’s worth noting that the safe-haven demand underpins US bond selling and favors the US dollar. Also supporting the greenback bulls are the hopes of more stimulus and relief that the debt ceiling expiry is being extended to December 15.
With that in mind, the US Treasury yields stay firmer around 1.63% after rising 2.3 basis points (bps) to refresh a three-week high whereas the US Dollar Index (DXY) also pokes the 16-month top. Further, equities were also positive whereas the S&P 500 Futures remain firm by the press time.
Given the lack of major data/events, a slew of comments from various Fed policymakers will be in focus to determine the rate hike concerns after the latest Fedspeak has been mixed as ever. It should be noted that San Francisco Federal Reserve Bank President Mary Daly recently said, “Today's inflation in mid-2022 is a different conversation.”
Technical analysis
A convergence of the 100-DMA and the 50-DMA restricts the short-term upside of the AUD/USD prices around 0.7360-65. However, 61.8% Fibonacci retracement (Fibo.) of August-October upside and a three-month-old support line, respectively around 0.7275 and 0.7245, will challenge the immediate downside of the Aussie pair.
- AUD/NZD will gather some impetus from RBNZ Inflation Expectations data amid a light economic week.
- AUD/NZD steady around 1.0400 level, awaits Luci Ellis speech.
- RBNZ last rate hike could be the starting point of more hikes ahead.
AUD/NZD continues its positive streak for the 6th consecutive day in a row on Wednesday. The cross-currency pair seems to be defying the Reserve Bank of Australia's (RBA's) latest announcement. The pair is trading up by 0.05% at 1.0444 at the time of reporting.
On Tuesday, the RBA Governor Philip Lowe said that Australia is well-placed to tackle the inflationary pressures triggered by COVID-19 without restoring an early cash rate increase. The central bank has pushed back against market pricing for a rate hike in 2022, initially resulting in the decline of the Australian dollar.
“RBA's neutral rate estimate is higher than most,'' analysts at ANZ Bank said, adding, that the ''governor Lowe again pushed back against market pricing of 2022 rate hikes, but his estimate of a neutral cash rate of 2.5% or above will give interest rate bears some cause for comfort."
It is worth noting, rising new COVID-19 cases in Australia is worrying investors. According to The Guardian, Victoria has recorded 231 new cases in the last 24 hours. Authorities are concerned about any further spread in remote indigenous communities, which could lead to partial lockdowns, negatively affecting the market sentiments.
Previously, at the monetary policy meeting, the Reserve Bank of New Zealand (RBNZ) hiked its Overnight Cash Rate (OCR) by 25 basis points, up to 0.50%. In addition to this move, the bank said it would remove stimulus measures as the New Zealand economy continues its recovery.
As per Reuters, "RBNZ won't stop here. October marks the beginning of a new chapter for the cash rate: Onwards and upwards." Most experts believe in similar rate hikes in November, February, and May. Traders should note that the RBNZ will have its last monetary policy of the year by November 24.
AUD/NZD traders will want to shed some light and gather momentum from the Thursday event amid a light day. The Reserve Bank of New Zealand (RBNZ) Inflation Expectations (QoQ) for Q4 and RBA Assistant Governor Luci Ellis speech is scheduled in the economic docket, which can provide impetus.
AUD/NZD technical levels
- USD/CHF grinds higher around five-week top, snaps two-day uptrend.
- Bullish MACD, sustained trading beyond 200-DMA keeps buyers hopeful.
- 50% Fibonacci retracement, yearly support line add to the downside filters.
USD/CHF seesaws around 0.9300 following a two-day run-up towards the highest levels last seen on October 13.
In doing so, the quote clings to 23.6% Fibonacci retracement (Fibo.) of January-April upside during early Wednesday.
Given the quote’s ability to stay past the 200-DMA amid the bullish MACD signals, buyers aim for the descending resistance line from April, around 0.9340.
However, any further upside will need validation from September’s peak of 0.9368 before challenging the yearly top surrounding 0.9475.
Meanwhile, pullback moves may target July’s top of 0.9274 and August month’s high near 0.9240 ahead of the 200-DMA level of 0.9165.
In a case where the USD/CHF bears keep reins past 0.9165, 50% Fibo. will precede an ascending support line from January, respectively around 0.9115 and 0.9100, to challenge the pair’s further weakness.
USD/CHF: Daily chart
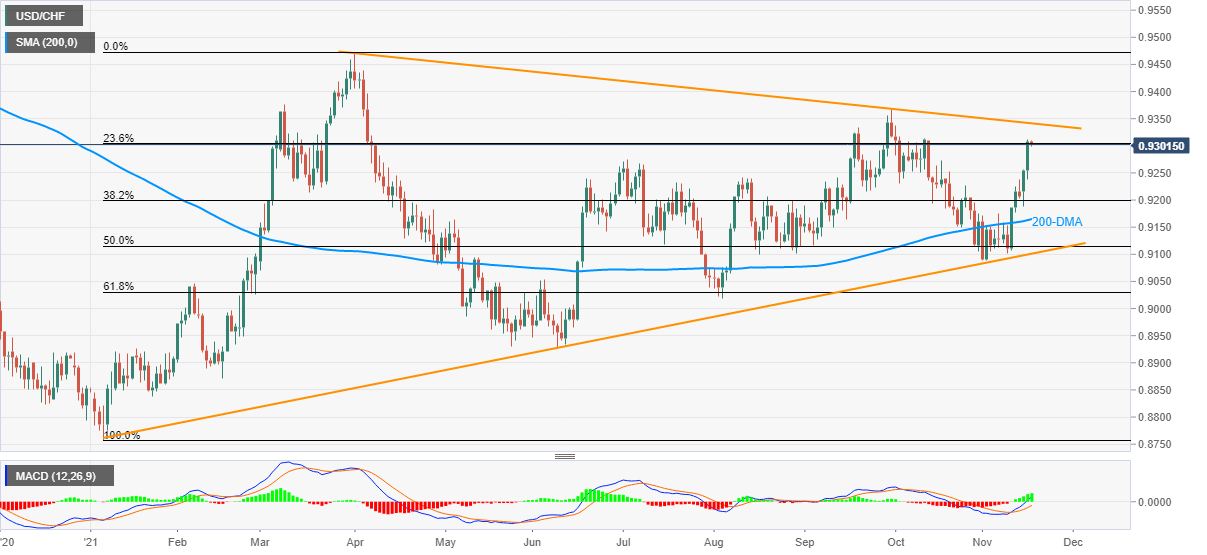
Trend: Further upside expected
| Pare | Closed | Change, % |
|---|---|---|
| AUDUSD | 0.73001 | -0.61 |
| EURJPY | 129.955 | 0.22 |
| EURUSD | 1.13175 | -0.43 |
| GBPJPY | 154.148 | 0.74 |
| GBPUSD | 1.34239 | 0.12 |
| NZDUSD | 0.69884 | -0.76 |
| USDCAD | 1.25607 | 0.45 |
| USDCHF | 0.93019 | 0.56 |
| USDJPY | 114.821 | 0.64 |
One-month risk reversal (RR) of USD/TRY, a gauge of calls to puts, retreats to 0.050 after jumping the most since March 23 the previous day, per the latest data from Reuters.
The receding bullish bias of the options market could be linked to the cautious sentiment ahead of Thursday’s Central Bank of the Republic of Turkey (CBRT) monetary policy meeting decision.
It’s worth noting, the Turkish central bank surprised markets with 200 basis points (bps) of a rate hike in the last meeting and is expected to announce a 100 bps cut to the benchmark rate tomorrow.
That said, the USD/TRY prices refreshed the record top to $10.39, around $10.36 during Wednesday’s Asian session.
Read: USD/TRY continues surge, nearly hits 10.40, as lira battered ahead expected CBRT rate cut


© 2000-2026. All rights reserved.
This site is managed by Teletrade D.J. LLC 2351 LLC 2022 (Euro House, Richmond Hill Road, Kingstown, VC0100, St. Vincent and the Grenadines).
The information on this website is for informational purposes only and does not constitute any investment advice.
The company does not serve or provide services to customers who are residents of the US, Canada, Iran, The Democratic People's Republic of Korea, Yemen and FATF blacklisted countries.
Making transactions on financial markets with marginal financial instruments opens up wide possibilities and allows investors who are willing to take risks to earn high profits, carrying a potentially high risk of losses at the same time. Therefore you should responsibly approach the issue of choosing the appropriate investment strategy, taking the available resources into account, before starting trading.
Use of the information: full or partial use of materials from this website must always be referenced to TeleTrade as the source of information. Use of the materials on the Internet must be accompanied by a hyperlink to teletrade.org. Automatic import of materials and information from this website is prohibited.
Please contact our PR department if you have any questions or need assistance at pr@teletrade.global.
transfers