- Analytics
- News and Tools
- Market News
CFD Markets News and Forecasts — 14-11-2021
- USD/JPY stays around 114.00, US dollar holds fort above 95.00.
- Investors look for impetus from Japan's GDP data, Biden and Xi meet crucial.
- USD/JPY carries on last week sentiments, US consumer inflation data affect pair.
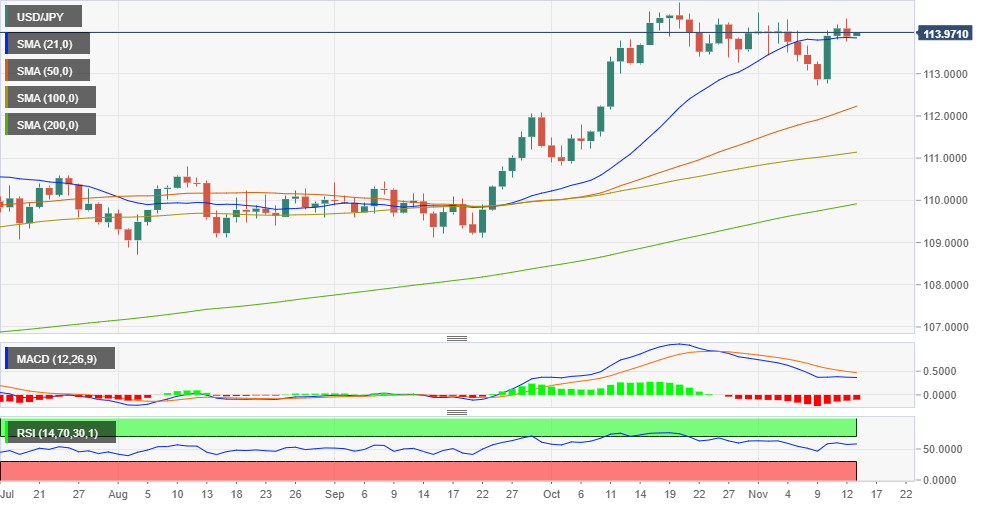
USD/JPY eases around 114.00 level and if the pair can break above monthly high near 114.70, there aren't any noteworthy chart points until the December 2016 high near 118.65.
The cross last week spiked on the back of US Treasury yields and gradually eased after annual consumer inflation in the US accelerated to a three-decade high of 6.2% in October. It also pushed for earlier interest rate hikes than expected from the Federal Reserve.
Apart from Japan's wholesale inflation, which rose four-decade high in October, the stimulus news has reciprocated in the pair's price action. To recapitulate, Bank of Japan (BoJ) policymakers opined that inflationary pressures arising from higher energy prices are moderate, but monetary policy easing should be upheld.
Amidst US mixed market China Retail Sales and Industrial Production data will be crucial to watch as Joe Biden and Xi Jinping will hold a virtual summit on Monday. It is intended to halt, or at least slowdown, the downward spiral in US-Chinese relations. The two leaders have talked twice via phone since Biden took office in January. This video conference will be their most substantial and investors of major forex will keep their eyes peeled.
The US dollar index, which tracks it against a basket of its peer, is firming a foothold above 95.00, after last week's monetary policy views that boosted the US Treasury yields. It is the highest rise in seven weeks, which propelled the greenback. The Index is trading at 95.11, down by 0.07%.
USD/JPY will find impetus from Japan's Gross Domestic Product (GDP) data and US Retail Sales MoM figures besides the China data.
USD/JPY Technical Levels
USD/JPY is sitting on 113.84, 21-day Simple Moving Average (SMA) for support on the daily chart. The resistance is weekly tops 114.30 and the next upside barrier is 114.70 (monthly high). The journey north for the pair will have 115.00 to test.
USD/JPY support side is rather laid with SMA support, wherein the support level is 50, 100 and 200-day SMAs with value 112.23, 111.14 and 109.91, respectively.
Daily Chart
Additional Levels
- USD/CAD eases from monthly top, sidelined of late.
- MACD teases bears as sellers eye 200-SMA retest.
- Early October’s swing highs add to the upside filters.
USD/CAD seesaws around 1.2550, following a U-turn from the monthly high, amid Monday’s Asian session.
That said, the Loonie pair struggles to extend the previous day’s U-turn from the 61.8% Fibonacci retracement (Fibo.) of late September-October downturn even as the MACD signals tease the sellers.
Hence, the latest moves remain contradictory but the bears have an upper hand, which in turn directs the quote further to the south, near the 200-SMA level of 1.2460.
However, a convergence of the 23.6% Fibo. and a 13-day-old support line, around 1.2400, will challenge the USD/CAD downside afterward.
Meanwhile, the pair’s recovery moves need to cross the 61.8% Fibonacci retracement level of 1.2588 to recall the USD/CAD buyers.
Even so, highs marked during October 06 and 01, respectively around 1.2650 and 1.2740, will challenge the quote’s further advances.
USD/CAD: Four-hour chart

Trend: Further weakness expected
- GBP/USD fades bounce off yearly low ahead of the heavy calendar week.
- EU’s Sefovic said there had been a change in tone, UK sets post-Brexit export strategy.
- British officials have compiled covid exit strategy from April, leaked report suggests.
- US stimulus, inflation chatters add to the watcher’s list.
GBP/USD looks hesitant while defending Friday’s rebound from yearly low, around 1.3415 during Monday’s Asian session. That said, the cable pair dropped for three consecutive weeks in the last despite the previous day’s corrective pullback from the lowest level since December 2020.
A 10-year low of the US Michigan Consumer Sentiment Index probed chatters concerning the rate hike and inflation, which in turn allowed the US Dollar Index (DXY) to consolidate the biggest weekly gains since mid-August.
The corrective pullback also took clues from the Brexit chatters as the Daily Mail conveyed, “European Commission vice-president Maros Sefcovic said yesterday there had been a ‘change in tone’ during talks in London with Brexit minister Lord Frost.” Also on the positive side were the headlines from the Financial Times (FT) suggesting the UK’s £1 trillion export strategy.
It should be noted, however, that the uncertainties over the Northern Ireland (NI) border restrictions challenge the latest talks with the UK’s threat of activating Article 16 being termed as a disaster by the mastermind behind the 2016 Brexit vote Dominic Cummings, per Bloomberg.
Elsewhere, The Guardian came out with a leaked report from Government while saying, “Officials have been working on a ‘Covid exit strategy’ called Operation Rampdown, under which the government could wind down testing and people would no longer be forced to isolate if they are ill from April.” It should be noted that the UK’s covid cases have been softer of late while the Europe registers jump in the daily infections.
On a different page, the US data flash mixed signals concerning the need for the Fed rate hike and more stimulus from President Joe Biden. Even so, US Treasury Secretary Janet Yellen and Federal Reserve Bank of Minneapolis President Neel Kashkari favor the much-awaited aide packages.
Amid these plays, S&P 500 Futures print mild gains while the US 10-year Treasury yields remain lackluster. That said, the US Dollar Index (DXY) edges higher around the highest levels last seen during July 2020.
Moving on, risk catalysts and comments from the BOE officials may entertain the GBP/USD traders and may keep bears hopeful. However, major attention will be given to this week’s slew of British data to confirm the Bank of England’s (BOE) mixed concerns over the rate hike prospects.
Technical analysis
Unless crossing the lows marked during February and July 2021, around 1.3565-75, GBP/USD bears keep reins.
- Gold is holding in a bullish territory in the open.
- Bears are n the lookout for a downside correction for the days ahead.
- XAU/USD capitalizes on inflation fears, buyers look to retain control.
The US dollar was mixed against the G10 Friday and gold recorded its biggest weekly gain in more than six months, following last week's inflation report in the US. XAU/USD rallied to $1,868 as the greenback fell from its 95.265 highs on the back of concerns among consumers. The November University of Michigan Consumer Sentiment survey surprised with a slump to a 10-year low as consumers fret over rising prices.
The spectre of higher entrenched inflation saw investor demand surge and the breakout in the yellow has also attracted new buyers as global markets search for inflation hedges. The sentiment is likely to stick around for the foreseeable future. the Bureau of Labor Statistics announced that consumer prices in the United States rose 6.2% over the past year. However, this is not a uniquely US phenomenon.
Eurostat, the statistical agency of the European Union, has released a flash estimate for annual inflation in the euro area and like the US report, this estimate showed inflation surging beyond what has been considered the norm. The data has come in at 4.1% in a preliminary estimate based on incomplete data. While it was considerably lower than the US rate. In fact, the world's four largest economies - the US (highest in 30 years), China, Japan (highest in more than 40-years) and Germany - have all reported record inflation numbers for October. Economists, politicians, Central Bank leaders had been insisting that the current inflation is temporary, but the markets think now, and that is bullish for gold.
One of the worst inflation calls ever by the Fed
We have already started to see policymakers back off from the transitory mantra but there is still a lot of work to do on the labour recovery, so there needs to be a fine balance in the communication in the past pandemic recovery. However, there are economists out there who are far more concerned. Mohamed El-Erian, for instance, a chief economic adviser at Allianz SE, says this will go down in history as one of the worst inflation calls ever by the Federal Reserve. He doesn't think inflation will come down anytime soon and the concern is that the time between ending the paper and interest rate hikes is not going to be significant and that they will have to raise rates much faster, tapping on the breaks at the wrong time. In this regard, for the week ahead, the bond markets and US yields are going to matter for the gold price.
Gold technical analysis
-
Gold Chart of the Week: More to come from the bulls for the week ahead?
The above link is a contrarian view of the current trajectory of the price in anticipation of a healthy bearish correction.
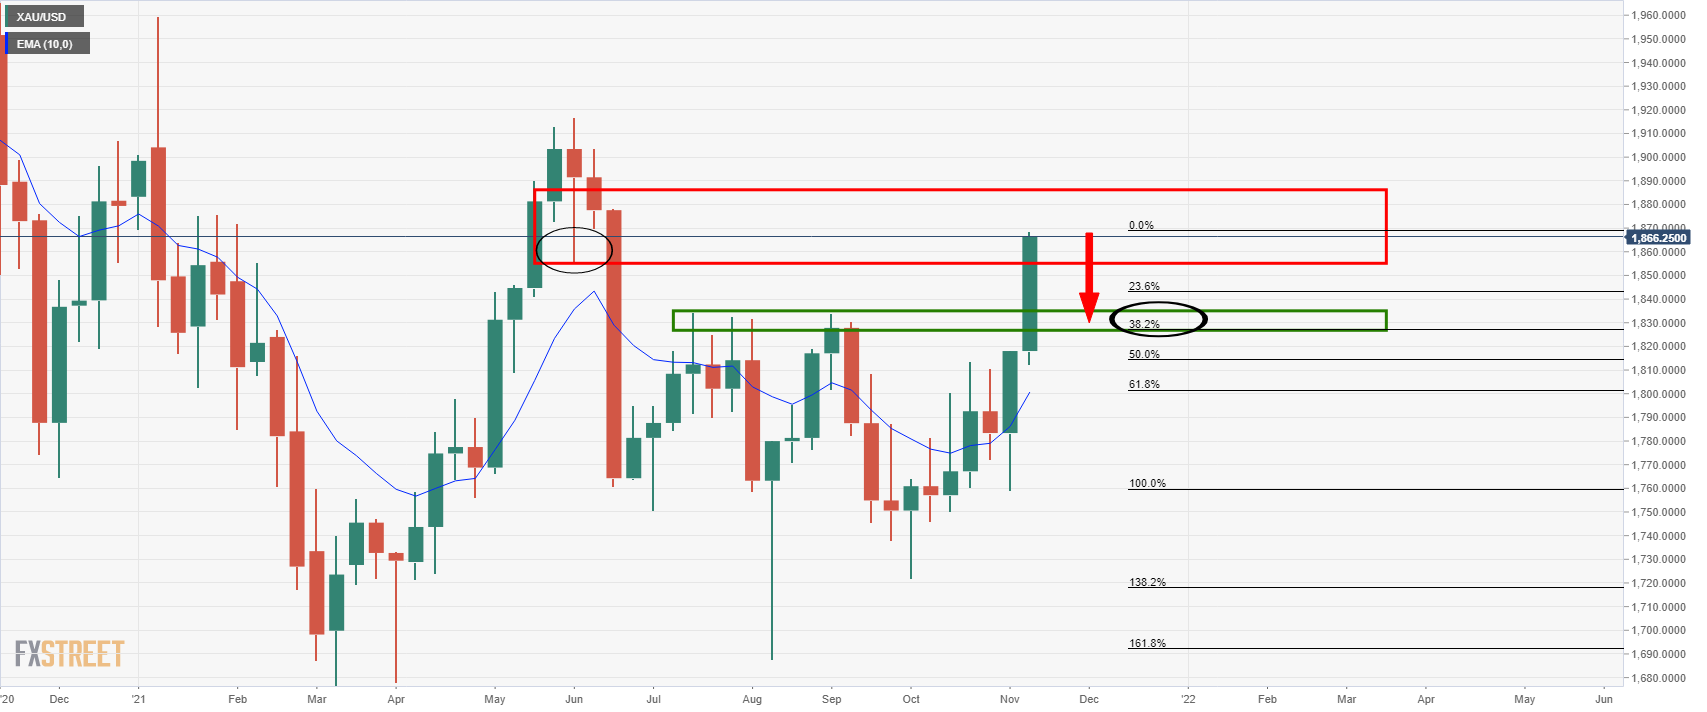
In this daily chart, it is illustrated that the price is reaching a critical level of resistance and a pullback could be expected towards the prior daily highs where a 38.2% Fibonacci retracement can be found near the $1,830s.
- EUR/USD fades bounce off 16-month low, struggles to justify bullish candlestick formation.
- Oversold RSI conditions, multiple supports challenge further downside.
- Previous support line from October, 10-DMA will test corrective pullback.
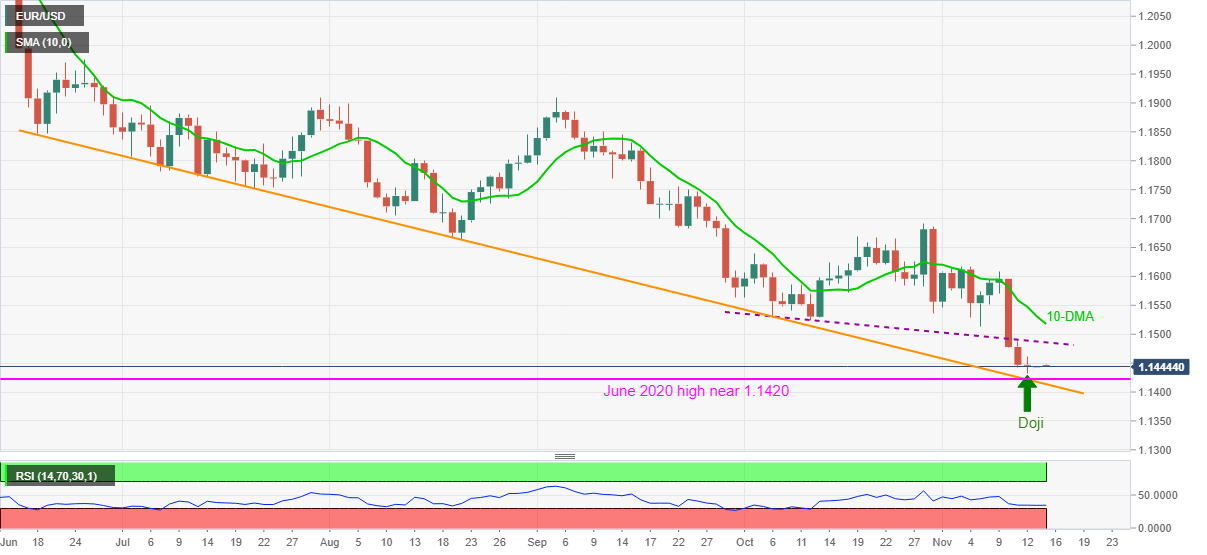
EUR/USD remains pressured around the lowest level since July 2020, a lackluster near 1.1445 during Monday’s initial Asian session. In doing so, the major currency pair struggles to justify the previous day’s Doji candlestick formation suggesting a corrective pullback.
Even so, nearly oversold RSI conditions and multiple supports to the downside keep EUR/USD buyers hopeful to challenge the support-turned-resistance line from October, near 1.1485.
Should the quote’s anticipated rebound crosses the 1.1485 hurdle, the 10-DMA figure of 1.1517 will test the pair buyers ahead of directing them to the monthly high near 1.1620.
It’s worth noting that the EUR/USD bulls will remain doubtful until witnessing a clear break of October’s high around 1.1695.
Meanwhile, the further downside will aim for the previous day’s low of 1.1432, a break of which will direct EUR/USD towards June 2020 top, surrounding 1.1422.
In a case where the pair remains weak past 1.1422, a descending support line from June, near 1.1410 and the 1.1400 threshold will be in the spotlight.
To sum up, EUR/USD bears seem to have tired and Friday’s Doji may trigger the much-awaited rebound considering RSI conditions. However, multiple hurdles do challenge the bull’s entry.
EUR/USD: Daily chart
Trend: Corrective pullback expected
- NZD/USD stays firmer above weekly resistance line despite sluggish start to the week.
- Market sentiment dwindles amid softer US data, push for more stimulus.
- New Zealand’s Business NZ PSI, Visitor Arrivals dropped, China data in focus.
- Chatters over US Inflation, RBNZ’s rate hike will be important as well.
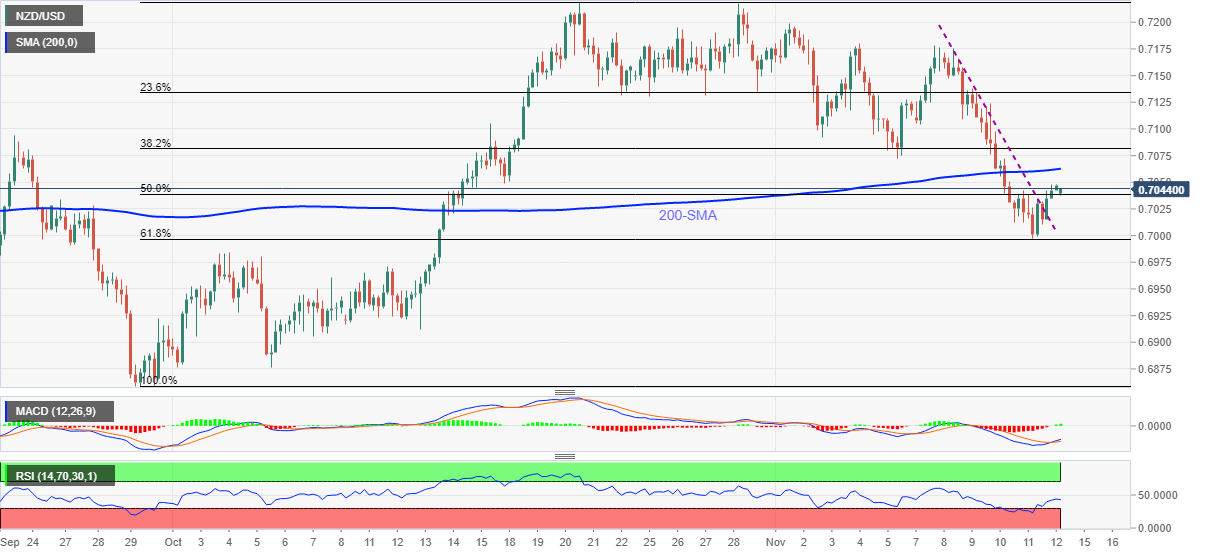
NZD/USD struggles to carry Friday’s upbeat performance, taking rounds to 0.7040 following the two consecutive weekly falls. Even so, the kiwi pair keeps the previous day’s upside break of a short-term key resistance line and awaits China data for fresh impulse amid the early Asian session on Monday.
In addition to the wait for China data, mixed catalysts concerning the US inflation and downbeat economics at home also challenge the NZD/USD traders of late.
Recently, New Zealand’s Business NZ PSI for October eased from 46.9 to 44.6 while Visitor Arrival for September dropped from -44.0% to -58.1% YoY in September.
Elsewhere, the weekend comments from US Treasury Secretary Janet Yellen and Federal Reserve Bank of Minneapolis President Neel Kashkari were indirectly favoring the need for more stimulus, taming the concerns over rising inflation. The same could be witnessed by Friday’s University of Michigan Consumer Sentiment Index figures that dropped to the 10-year low, per the provisional figures for November.
“Indeed, with markets still debating the merits of a 25 or 50 bp (basis points) hike, short-end interest rate volatility could easily spill over into the NZD. But once that decision has been made, it’ll lay the foundations for how the summer will unfold,” said the Australia and New Zealand Banking Group (ANZ).
Given the escalating chatters over US stimulus and the recently softer US data challenging the Fed rate hike concerns, the NZD/USD traders may welcome firmer China data to extend the latest technical breakout. However, the bulls should be mindful of the challenges that the Reserve Bank of New Zealand (RBNZ) faces before the next week’s interest rate decision.
Technical analysis
NZD/USD recovery from 61.8% Fibonacci retracement (Fibo.) of late September-October upside managed to cross a one-week-old resistance line, now support around 0.7025.
As the upward sloping RSI and recently positive MACD signals support the stated rebound, further upside towards the 200-SMA level near 0.7065 can’t be ruled out.
However, early November’s lows near 0.7075 and 0.7095, followed by the 0.7100 threshold, will test the pair bulls afterward.
Alternatively, a downside break of the resistance-turned-support line, close to 0.7025, will aim for the 61.8% Fibo. level surrounding 0.6995. Adding to the downside filter is the October 04 swing high near 0.6985-80.
NZD/USD: Four-hour chart
Trend: Further upside expected
President of the Federal Reserve Bank of Minneapolis Neel Kashkari crossed wires during the weekend, via the CBS News. The Fed policymaker conveyed his inflation outlook and terms it temporary although it causes pain.
Key comments
The high prices that families are paying, those are real and people are experiencing that pain right now.
We need to take it very seriously, but my view is we also need to not overreact to some of these temporary factors even though the pain is real.
If we overreact to a short-term price increase that can set the economy back over the long term.
Over the next three, six, nine months, I think we're going to get a lot more data on both the demand side and the supply side to get a better reading of where the economy is headed.
So, the sooner we can get this pandemic really under control, the more quickly people will have confidence to go back to work. That will help the economic recovery and that will certainly help bring down inflation.
FX implications
Although the early Asian session on Monday fails to react to the news, these comments from the Fed official are more or less in line with Treasury Secretary Jannet Yellen’s latest view on Inflation. The same should keep hopes of easy money on the table and favor the US dollar strength.
Read: US Treasury Sec. Yellen: Cause of this inflation is the pandemic
In a weekend interview with CBS, US Treasury Secretary Janet Yellen made some comments on the US inflation and its linkages with the COVID-19, per Bloomberg. White House economic adviser Brian Deese also appeared on the Sunday morning talk show and argued it would have the opposite impact by lowering the cost of child care, health care and housing, Bloomberg said.
Key quotes
It’s important to realize that the cause of this inflation is the pandemic.
If we want to get inflation down, I think continuing to make progress against the pandemic is the most important thing we can do.
When labor supply normalizes and the pattern of demand normalizes, I would expect that, if we’re successful with the pandemic, to be sometime in the second half of next year, I would expect prices to go back to normal.
Market reaction
Given the early hours of the Asian session, markets are yet to respond to the key comments. However, considering the absence of any strong moves, the US dollar may keep its upside momentum and test the Antipodeans due to the news.
Read: Fading US consumer confidence intensifies the Fed’s inflation dilemma
- AUD/JPY keeps Friday’s break of short-term trend line resistance.
- Steady RSI, sustained bounce off 50-day EMA also favor buyers.
- Bears seek 83.00 break for conviction, bulls have a bumpy road ahead.
AUD/JPY flirts with 83.50 during early Monday morning in Asia. In doing so, the cross-currency pair holds onto the corrective pullback from 50-day EMA, as well as an upside break of a descending trend line from November 01.
As RSI conditions do back the latest recovery moves, the quote is up for challenging a one-month-old horizontal hurdle around 83.80-85.
However, 23.6% Fibonacci retracement (Fibo.) of August-October upside and October 22 low, respectively around 84.30 and 84.60, will challenge any further upside past 83.85.
In a case where the AUD/JPY bulls keep reins past 84.60, the 85.50 and the 86.00 levels may test the run-up towards the previous month’s top of 86.25.
Alternatively, a downside break of the previous resistance and the 50-day EMA convergence around 83.15-10 stops the pair buyers. Though, 38.2% Fibo. level near 83.00 will test the bears before allowing entry.
Should the AUD/JPY bears keep reins past 83.00, 50% Fibonacci retracement level and September’s peak, close to 82.00, will be in focus.
AUD/JPY: Daily chart
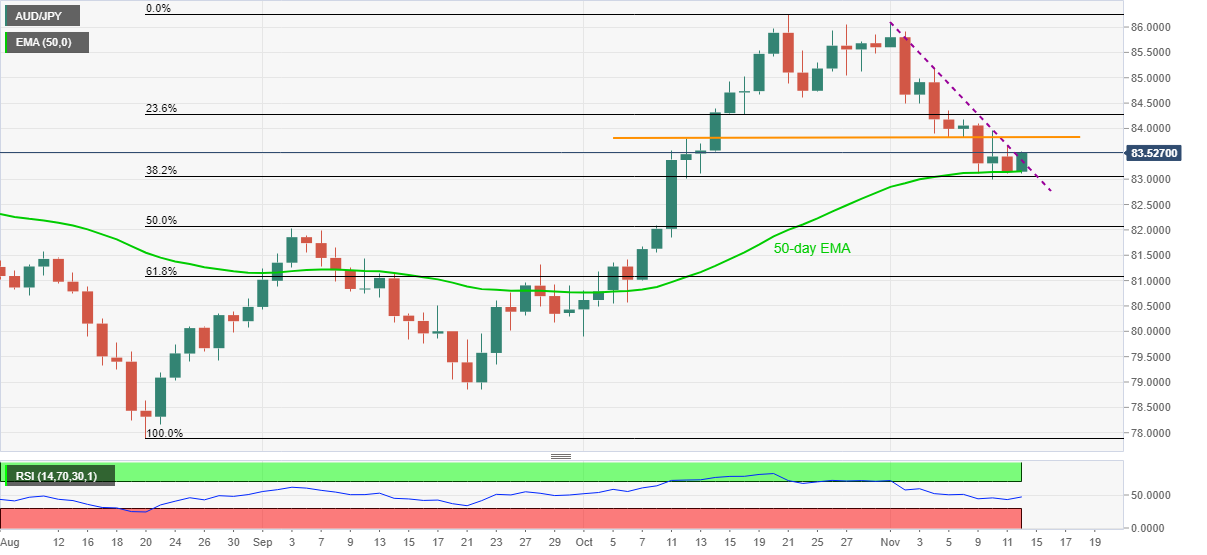
Trend: Further upside expected
- AUD/USD bulls are taking on the 38.2% Fibonacci for the open with prospects to 0.7380.
- A light calendar leaves the drivers with US and China markets.
At 0.73307, AUD/USD ended the day on Friday higher by some 0.57% and had travelled from a low of 0.7276 reaching a high of 0.7335 by the North American close. The US dollar gave back territory on Friday as consumer sentiment dived for fears of runaway inflation. The University of Michigan survey showed sentiment in November fell to its lowest level in a decade.
The earlier data from the week in US inflation drove fears that surging inflation will inevitably cut into households' living standards. Moreover, the markets are anticipating that the Federal Reserve will have to raise interest rates sooner than expected. Against a basket of its rivals, the US dollar index DXY was down 0.03% at 95.122 by the close of play, above the lows of the day 94.997 that were made in response to consumer sentiment. However, it had risen to its highest level since July 2020 at 95.265.
The week ahead
In a lack of domestic data, to start the week off, traders will be looking to China for clues as to how the nation is recovering. However, analysts at TD Securities argued that ''October's data slate is likely to reveal a further softening in momentum. As reflected in the October NBS PMI, a host of supply pressures have hurt manufacturers' sentiment and weighed on output. October is seasonally a strong month for spending, but retail sales will likely be impacted by China's "zero-tolerance" COVID policy, which has led to lockdowns across many provinces.''
What Aussie traders do have with respect to nation data for the week ahead will come in the form of the Reserve Bank of Australia meeting minutes, although it is unlikely to give us anything new. On the other hand, the RBA Governor Phillip Lowe will speak on "Recent Trends in Inflation" and his view on medium-term inflation should be keenly followed given the jump in Q3 inflation and inflation pressures globally running hotter. ''Wage growth is unlikely to pick up markedly over the quarter as the economy likely experienced a sharp contraction with both NSW and VIC in a prolonged lockdown in Q3,'' the analysts at TD Securities explained.
AUD/USD technical analysis
AUD/USD has trended lower since the start of the month but is in the process of an upside correction according to the daily chart and is on track for a test of the 38.2% Fibonacci retracement level for the open. This is located at 0.7336 and a pip higher than the highs of Friday.

The price, however, would be expected to linger for longer in a corrective phase and target the prior lows that have a confluence with the 61.8% Fibo around 0.7370 which puts the 0.7380 psychological targets on the map for the week ahead.


© 2000-2026. All rights reserved.
This site is managed by Teletrade D.J. LLC 2351 LLC 2022 (Euro House, Richmond Hill Road, Kingstown, VC0100, St. Vincent and the Grenadines).
The information on this website is for informational purposes only and does not constitute any investment advice.
The company does not serve or provide services to customers who are residents of the US, Canada, Iran, The Democratic People's Republic of Korea, Yemen and FATF blacklisted countries.
Making transactions on financial markets with marginal financial instruments opens up wide possibilities and allows investors who are willing to take risks to earn high profits, carrying a potentially high risk of losses at the same time. Therefore you should responsibly approach the issue of choosing the appropriate investment strategy, taking the available resources into account, before starting trading.
Use of the information: full or partial use of materials from this website must always be referenced to TeleTrade as the source of information. Use of the materials on the Internet must be accompanied by a hyperlink to teletrade.org. Automatic import of materials and information from this website is prohibited.
Please contact our PR department if you have any questions or need assistance at pr@teletrade.global.
transfers