- Analytics
- News and Tools
- Market News
CFD Markets News and Forecasts — 16-11-2021
- AUD/CHF has formed a topping pattern on the hourly chart.
- The daily chart is in confluence with the reversion pattern.
AUD/CHF bears have stepped in following a rally that started on Friday, Nov.12. However, the Australian dollar has faced some fundamental headwinds in the last 24-hours or so which leaves it vulnerable to the downside.
Moreover, the Swiss franc is regarded as a perfect hedge against stagflation and the recent growth concerns in the eurozone could also give it an edge. This makes for a compelling case for a technical breakout in AUD/CHF to the downside and a meaningful correction that opens risk to towards the mid point of the 0.67 area.
AUD/CHF daily chart
-637727021466331029.png)
The W-formation is a reversion pattern that would be expected to draw in the price towards at least a 38.2% Fibonacci retracement of the bullish impulse of the W. A break there opens prospects of a test all the way back to the neckline of the W-formation near 0.6750.
AUD/CHF H1 chart
-637727026197395066.png)
The hourly chart shows the price on the verge of a breakout below a head and shoulders formation, a topping pattern that would be expected to lead to a significant downside breakout. This would tie in nicely with the daily chart's reversion pattern's analysis for the sessions ahead.
- GBP/USD retreats from weekly top, bears attack intraday low of late.
- Ireland’s Coveney admits EU ready to compromise over NI protocol, Friday’s Frost- Šefčovič meeting will be the key.
- BOE rate hike hopes renew on strong UK jobs report, bulls await firmer CPI.
Having poked one-week high the previous day, GBP/USD bears return during Wednesday’s Asian session. That said, the cable pair remains pressured at around 1.3420 by the press time.
The latest UK employment data underpinned bullish bias towards the Bank of England’s (BOE) next moves.
That said, the UK's Office for National Statistics revealed that the ILO Unemployment Rate declined to 4.3% in September from 4.5% in August. This reading came in slightly better than the market expectation of 4.4%. Further details of the report showed that the Claimant Count Rate edged lower to 5.1% in October from 5.2% and the Average Earnings Including Bonus rose by 5.8% in September, surpassing analysts' estimate of 5.6%. Following the data, the target rate probabilities for the December 16 meeting of the BOE show 67.5% chances of a 20 pip rate hike.
Elsewhere, the UK Express said, “Ireland's foreign minister, Simon Coveney claimed the EU is ready to offer proposals on medicines to ally concerns in Northern Ireland.” The news was linked to UK’s Brexit Minister David Frost’s threat to trigger Article 16. However, The taoiseach (Irish prime minister) Mícheál Martin told the Dáil (Irish parliament) that he felt UK negotiators had indicated they want a resolution, per the BBC. “The Taoiseach said he believed political parties in NI want to remain part of the European Single Market,” adds the BBC. Hence, the complex headlines over Brexit keep fears of a hard Brexit on the table and challenge the GBP/USD buyers ahead of Friday’s meeting between UK’s Frost and European Commission Vice-President Maroš Šefčovič.
Alternatively, Fed rate hike expectations jumped following an eight-month high print of the US Retail Sales for October, 1.7% MoM versus 1.4% expected. Adding to the bullish bias were figures concerning the US Industrial Production and housing market data. It’s worth noting that Fed policymakers like St. Louis Fed President James Bullard joined ex-US Treasury Secretary and former New York Fed President, Lawrence Summers and Bill Dudley respectively, to back the need for the Fed’s action. However, San Francisco Federal Reserve Bank President Mary Daly recently said, “Rate hikes would not fix high inflation now, would curb demand and slow recovery.”
Against this backdrop, the US Treasury yields rose 2.3 basis points (bps) to refresh a three-week high whereas the US Dollar Index (DXY) jumped to the new 16-month top. Further, equities were also positive whereas the S&P 500 Futures remain firm by the press time.
Moving on, the UK’s Consumer Price Index (CPI) and Producer Price Index (PPI) data for October will be important to watch for immediate GBP/USD forecast. Given the upbeat expectations from the scheduled inflation data, the cable may witness another push towards the north but the Brexit headlines and the Fed rate hike calls may hinder the run-up.
Read: UK CPI Preview: Buy the rumor, sell the fact? Three scenarios for GBP/USD
Technical analysis
Failures to provide a daily close past the monthly resistance line, around 1.3445 by the press time, direct GBP/USD prices towards the yearly bottom surrounding 1.3350.
San Francisco Federal Reserve Bank President Mary Daly on Tuesday said now that the Fed has begun to taper its asset purchases, the next step is to tweak the communications the Fed gives about the future path of rate hikes.
Shre has said this in light of the market's reaction, most probably, to her colleagues today and in light of racing US Treasury yields and the greenback surging to fresh cycle highs.
"It's this forward guidance piece that I'm currently looking at myself, to say, do we need to think about the forward guidance we have so that we get that better aligned with the way that we are seeing the economy evolve," Daly told reporters after an event at the Commonwealth Club in San Francisco. "That’s the next step in my judgment."
Fed's Daly, key comments
I have a strong bias to stick to current taper pace.
If we hadn't had delta, I'd be thinking about raising rates; but that's not where we are.
If inflation is still high once pandemic subsides, that's a different conversation.
After taper, the next step is forward guidance, to get that better aligned with the economic outlook.
Market implications
On Tuesday, US data showed US consumers looked past rising prices and drove Retail Sales higher than expected last month. This helped to fuel a big bid in the US dollar index, DXY:
DXY H1 chart
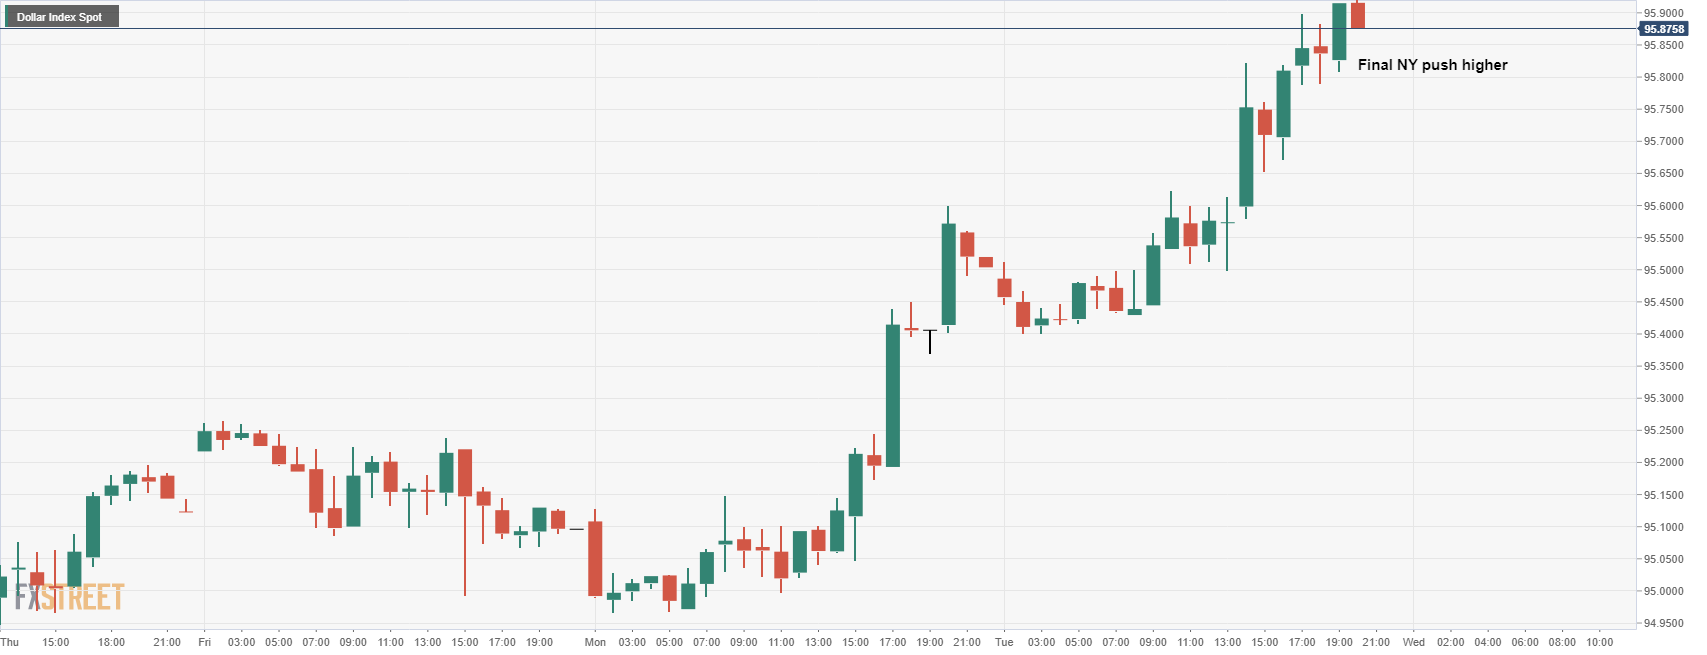
US Retail Sales rose 1.7% in October, topping consensus expectations of a 1.4% rise. Additionally, US Industrial Production lifted 1.6% in October which was considerably higher than expected.
The greenback has been better bid ever since US inflation data last week surprised to the upside and showed consumer prices surged to their highest rate since 1990.
US yields rallied on Tuesday as investors now expected that the Federal Reserve will taper their QE programme at a faster pace. More hawkishly, some observers even expect that the Fed could potentially hike interest rates sooner than first anticipated in the markets. Fed's James Bullard was an advocate of that overnight. He said that the US central bank should speed up its reduction of monetary stimulus in response to a surge in US inflation.
US Dollar Index retreats from a new year-to-date high around 95.97, steady around 95.80s
- Silver stays pressured after breaking two-week-old support line.
- Failures to cross 200-DMA replicate pullback in Momentum to keep sellers hopeful.
- Horizontal area from June adds to the upside filters.
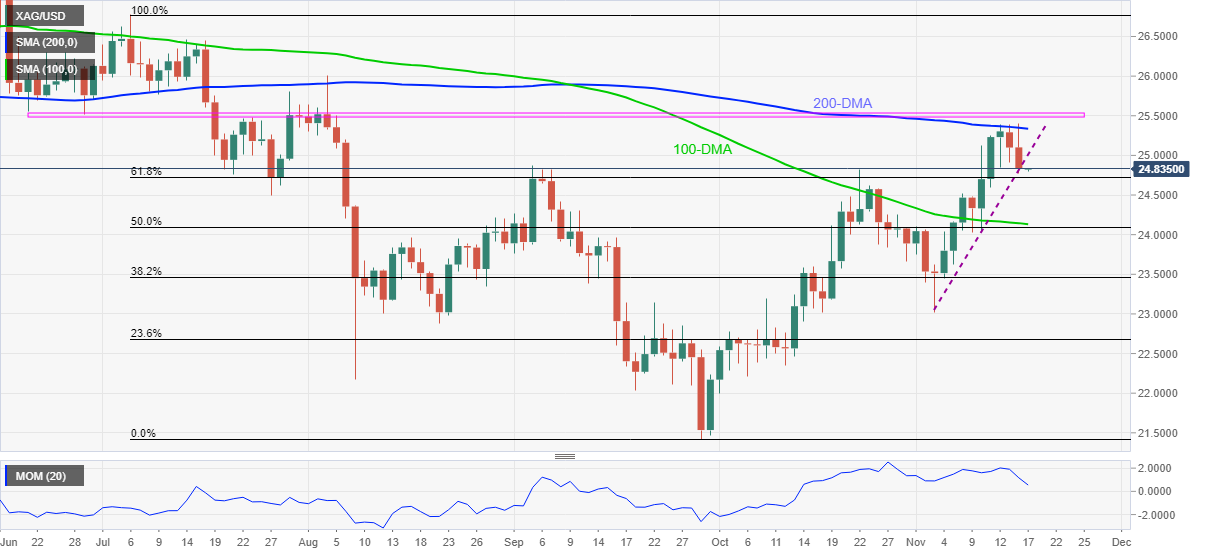
Silver (XAG/USD) extends the week-start U-turn from 200-DMA to $24.80 during the initial Asian session on Wednesday.
In doing so, the bright metal justifies the previous day’s downside break of an ascending trend line from November 03 amid a retreat in the Momentum line.
That said, the 61.8% Fibonacci retracement (Fibo.) of July-September fall, around $24.70, becomes immediate support for the metal before declining towards the $24.15-10 area comprising the 100-DMA and 50% Fibo.
In a case where the silver bears dominate past $24.10, the $24.00 threshold and highs marked during mid-October around $23.60 will be in focus.
Alternatively, the support-turned-resistance line around $25.00 and the 200-DMA level of $25.33 guards the quote’s recovery moves.
Also acting as the key resistance is the region including multiple levels marked since June around $25.50.
Silver: Daily chart
Trend: Further weakness expected
- The US Dollar Index extends to two-consecutive days its rally in the week.
- The US 10-year Treasury yield edges up to 1.64%, underpins the buck.
- DXY Technical outlook: A break above 96.00 exposes June 30, 2020, high at 97.80
- US Dollar Index retreats from a new year-to-date high around 95.40, bull's eye 96.00.
The US Dollar Index, also known as DXY, which measures the greenback’s performance against a basket of six rivals, advances 0.57%, sitting at 95.88 as the Asian session begins at the time of writing. The US dollar was boosted by upbeat comments of St. Louis Fed President Bullard, who will be an FOMC voter in 2022. Also, positive macroeconomic data from the biggest economy lifted the prospects of the buck, despite the risks of higher inflation.
On Tuesday, in the New York session, the US Census Bureau revealed that October’s Retail Sales in the US rose by 1.7%, higher than the 1.4% foreseen by economists. Further, it reported that sales excluding Autos increased by 1.7%, precisely at the same rhythm as the headline, more than the 1% estimated.
The jump in retail sales showed the resilience of consumers, despite having elevated prices to pay. It is worth noticing that the figure is not adjusted for any price changes that reflect the increased cost of goods and services. Receipts at gasoline pumps spiked almost 4%, the highest reading since March of 2021, reflecting how people are paying some of the highest prices in seven months.
Moreover, US Industrial Production for October rose by 1.6%, better than the 0.7% expected by economists.
US Dollar Index (DXY) Price Forecast: Technical outlook
-637727005462948888.png)
The daily chart depicts the DXY has broken above the Pitchfork’s indicator’s central line around the 95.50-60 region, which now would act as support. The daily moving averages (DMA’s) remain well below the current price action, with an upslope, supporting the upward bias. Also, the Relative Strength Index (RSI) at 71 in overbought conditions, though slightly flattish, indicates that the DXY might consolidate before resuming the upward move.
A break above 96.00 would expose its first resistance area on June 30, 2020, high at 97.80. A breach of the latter could send the US Dollar Index rallying towards May 25, 2020, high at 99.97.
- EUR/USD bears take charge, loses upside momentum.
- The euro hit 16-month low post dovish comments by the ECB chief.
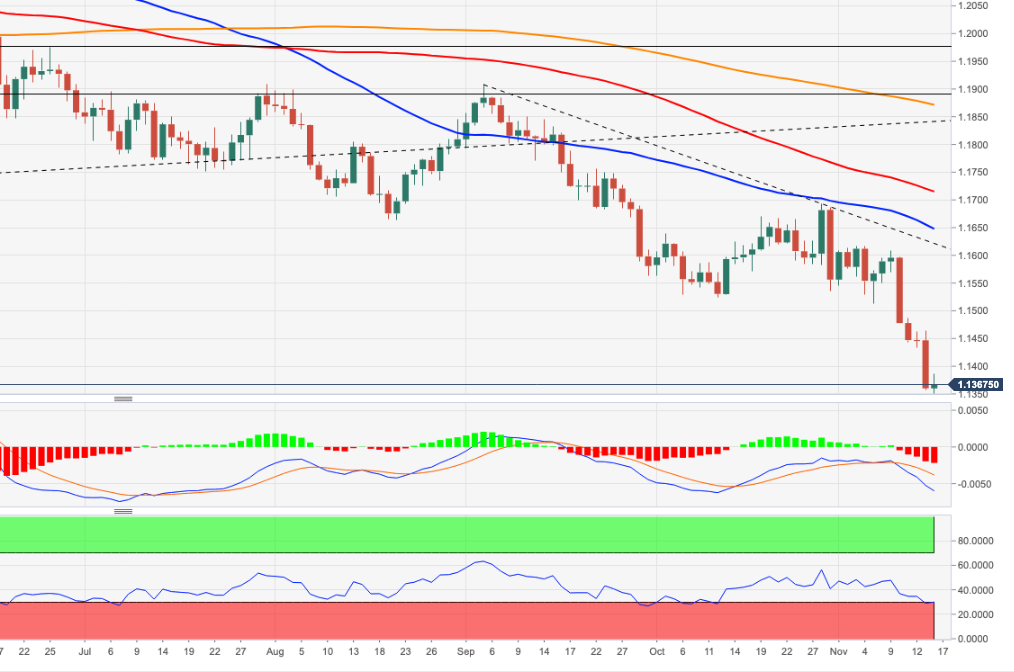
The EUR/USD pair renewed its vow and continues to slide at the Early Asian session on Wednesday, trading around yearly low levels of 1.1300 level. The pair expects that the European Central Bank (ECB) would stick to its dovish policy settings in the near term against the backdrop of a slowing economy.
The cross-currency pair is at its lowest since July last year. European Central Bank's ECB president Christine Lagarde said that tightening monetary policy to curb inflation could choke off the eurozone's recovery. She further iterated factors pushing prices higher would fade next year, increasing contrast from hawkish hints from other central banks.
Furthermore, Scotiabank expects "Widening Bunds-UST differentials remain a firm downward force on the euro. The spread between US and German debt in the 10-year space has risen to its largest since April as markets adjust for the Fed's tapering and eventual hikes."
The US T-bond yields remain strong ahead of Fed daily speak. Meanwhile, the greenback continued its strength forward, reaching fresh 2021 highs, further hitting the common currency. Both retail trade data and industrial activity in the US beat expectations signalling strength in the American economy, further pressuring the Federal Reserve to hike rates earlier. The US dollar now has weakened investor appetite, leaving EUR/USD vulnerable to a much-needed catalyst to show direction. To further add pressure, US President Joe Biden formally signed a $1.0 trillion, bi-partisan infrastructure bill underpinning the dollar value.
Looking ahead, investors will be eyeing for (ECB) Financial Stability Review, Consumer Price Index data release from Eurostat. ECB member Isabel Schnabel speech could provide some insight.
EUR/USD technical levels
- WTI fails to cheer industry stockpiles data after a mixed daily performance.
- Fears of increase in supply join expectations of tighter monetary policies to favor bears.
- OPEC’s Barkindo expects oil market surplus beginning in December, IEA eyes easy prices.
- US EIA inventory data, Fedspeak will provide fresh impulse.
WTI begins Wednesday’s trading session on a back foot around $79.60, teasing the biggest daily loss in a week. In doing so, the oil benchmark ignores private oil stocks change figures from the American Petroleum Institute (API) while tracking firmer USD and demand-supply matrix.
As per the latest API Weekly Crude Oil Stocks data for the period ended on November 12, the inventories rose 0.655M versus an expected addition of 1.55M and previous depletion of 2.485M.
It’s worth mentioning that the fresh fears of the coronavirus, mainly in Europe and the UK, challenge the oil bulls of late. On the same line is an absence of any chatters favoring supply disruptions and downbeat comments from the International Energy Agency (IEA) and OPEC Secretary-General Mohammed Barkindo.
The IEA left its forecast for oil demand growth largely unchanged at 5.5 million barrels per day (bpd) for 2021 and 3.4 million bpd in 2022, as reported by Reuters. However, the institute did mention that "Reprieve from oil price rally could be on the horizon due to rising supplies."
On the same line was the analysis from OPEC’s Barkindo who said, "The projections show throughout the quarters of next year that there could be oversupply in the market. This is also further evidence of why we should be very cautious, measured in the decisions we take every month."
Additionally, fears of tighter money supply and an absence of cordial relations between the US and China, despite the latest virtual meeting, join firmer US Retail Sales for October to underpin the US Dollar Index (DXY) strength around a fresh 16-month high.
Moving on, weekly official oil inventory data from the US Energy Information Administration (EIA), expected +1.550M versus +1.001M previous readouts, will be important for fresh direction. Also on the radars will be the Fedspeak and demand-supply talks.
Technical analysis
Failures to cross the 10-DMA, around $80.30 at the latest, joins a sustained trading below three-week-old resistance line near $82.35, to direct WTI bears towards 50-DMA level of $77.95.
GBP/JPY advances as good UK’s economic employment data boosted the British pound.
The market sentiment is upbeat, lifting risk-sensitive currencies, dampening the risk appetite of safe-haven peers.
GBP/JPY: An upside break of the bullish-flag chart pattern would expose 156.00.
The British pound advances against the Japanese yen, up 0.02%, trading at 154.19 during the day at the time of writing. Positive market sentiment through the New York session seems to carry on towards the Asia-Pac Wednesday one, as major Asian equity indices futures advance, between 0.03% and 0.82%.
In the European session, positive economic data from the UK lifted the pound. The ILO Unemployment Rate for the last 3-month reading ending in September rose to 4.3%, lower than the 4.4% expected, as the furlough scheme program ended in September. Also, the Claimant Count Change for October dropped by 14.9K less than the 51.1K contraction in September.
The GBP/JPY pair jumped from 153.20s towards 153.86 at the release before settling around the 153.40-60 range. As the American session began, the cross-currency broke to fresh two-week highs, around 154.15.
GBP/JPY Price Forecast: Technical outlook
-637726977403073527.png)
The GBP/JPY pair broke above the 50-day moving average (DMA) in the daily chart, accelerating towards the top-trendline of a bullish flag chart pattern formation. Further, all the DMA reside below the spot price, boosting the upward bias of the pair. Momentum indicator like the Relative Strength Index (RSI) at 50.11, though barely above the 50-central line, adds another bullish signal.
If GBP/JPY buyers want to accelerate the uptrend, they will need a break above the top-trendline of the bullish-flag chart pattern. In that outcome, the first resistance would be the 155.00 psychological round level. A breach of the latter would expose the November 4 high at 156.25, followed by the October 29 high at 157.10.
- USD/CAD grinds higher after bouncing off three-week-old support line.
- Bullish MACD, sustained trading beyond horizontal support stretched from August favor buyers.
- Key Fibonacci retracement levels add to the upside filters, bears have a bumpy road beyond 1.2400.
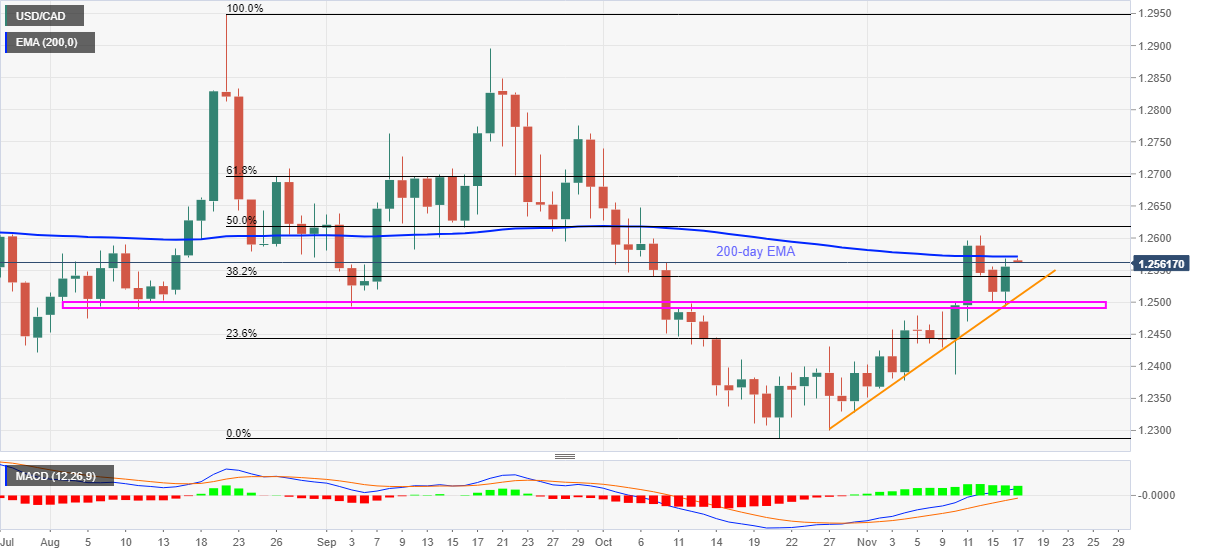
USD/CAD holds onto the bounce off 1.2490-2500 support confluence around the weekly top of 1.2568 during early Wednesday morning in Asia.
The loonie pair’s rebound from an ascending trend line from October 27, as well as a horizontal area from early August, gains support from the bullish MACD signals to keep the buyers hopeful.
That said, a clear upside break of the 200-DMA level near 1.2570 is on the cards to challenge 50% and 61.8% Fibonacci retracement (Fibo.) levels of August-October downside, respectively near 1.2620 and 1.2700.
However, the 1.2765-70 and September’s peak near the 1.2900 threshold will challenge the pair buyers afterward.
Alternatively, a downside break of the 1.2500-2490 support area won’t offer a green pass to the USD/CAD bears as 23.6% Fibo. level of 1.2443 and multiple tops marked during the latest October can keep challenging the downside before the 1.2400 round figure.
In a case where the quote remains weak past 1.2400, the yearly low of 1.2288 will be in focus.
USD/CAD: Daily chart
Trend: Further upside expected
San Francisco Fed President Mary C. Daly pushes back concerns that the infrastructure spending will propel inflation, per Reuters, during her speech late Tuesday.
Read: Fed's Daly calls for central bank patience in the face of high inflation
Key quotes
Running a sustained expansion gives people time to come back to the jobs market.
The decision on interest rates is not about a punch bowl, it's about millions of jobs.
Expect that infrastructure spending will increase growth potential going forward.
US stock market is euphoric.
Uncertainty is high over the next 6 to 9 months, not only for the US economy but also globally.
It's unclear how or if technology will boost productivity growth; investing in human capital is the surer way to get to higher productivity.
FX implications
Although the push for the US stimulus may help improve the market sentiment and can put an immediate floor under the falling Antipodeans, the market’s refrain from rejecting the Fed rate hike concerns can keep the US dollar on the upper hand.
Read: AUD/USD bears brace for fresh monthly low near 0.7300 amid firmer USD
- AUD/USD stays pressured following the biggest daily loss in a week.
- RBA Minutes, Governor Lowe pushed back rate hike expectations.
- Xi-Biden meeting falls short of positive surprises, US data adds to the Fed rate hike chatters.
- Australia Q3 Wage Price Index, Fedspeak to decorate calendar.
AUD/USD remains depressed around 0.7300, having dropped the most in a week the previous day, as Asian markets kick-start for Wednesday.
The Aussie pair took multiple scars from domestic and overseas catalysts to welcome the bears on Tuesday. Notable among them were updates from the Reserve Bank of Australia (RBA), headlines concerning US President Joe Biden and his Chinese counterpart Xi Jinping’s virtual meeting and the US data that propelled hopes of Fed action, backed by comments from some present and former US Federal Reserve (Fed) policymakers.
Minutes of the latest RBA meeting reconfirmed the Aussie central bank’s outlook that the rate hike is off the table before 2024. RBA Governor Philip Lowe backed the same ideal while saying, “The latest data do not warrant a rate hike next year,” while adding that it is still plausible that the first increase will be not before 2024. These updates cooled down rate hike expectations that soared especially after the jump in the Australia Q3 inflation figures.
Elsewhere, Xi-Biden talks couldn’t amuse optimists as both sides had their differences and US President Biden recently signaled that they have a lot to follow up despite having a “good meeting” with China’s Xi.
Furthermore, the Fed rate hike expectations jumped following an eight-month high print of the US Retail Sales for October, 1.7% MoM versus 1.4% expected. Adding to the bullish bias were figures concerning the US Industrial Production and housing market data. It’s worth noting that Fed policymakers like St. Louis Fed President James Bullard joined ex- US Treasury Secretary and former New York Fed President, Lawrence Summers and Bill Dudley respectively, to back the need for the Fed’s action. However, San Francisco Federal Reserve Bank President Mary Daly recently said, “Rate hikes would not fix high inflation now, would curb demand and slow recovery.”
Amid these plays, the US Treasury yields rose 2.3 basis points (bps) to refresh a three-week high whereas the US Dollar Index (DXY) jumped to the new 16-month top. Further, equities were also positive but gold prices dropped after rising to a fresh peak since June.
Looking forward, AUD/USD traders will wait for the third quarter (Q3) Wage Price Index, expected 0.5% versus 0.4% prior, for a corrective pullback even as the RBA has ruled out rate hike concerns. Following that, Fedspeak and risk catalysts will be the key. Overall, a firmer US dollar and push for the Fed action can keep the pair bears hopeful.
Technical analysis
AUD/USD pair’s failures to cross a convergence of the 50-SMA on the four-hour chart and a two-week-old resistance line, around 0.7360 by the press time, directs the quote towards refreshing the monthly low of 0.7278.
US President Joe Biden said on Tuesday that he had a good meeting with Chinese President Xi Jinping, according to Reuters. Biden said that he and Xi have a lot to follow up on and that their aides would be working together on a range of issues. Biden added that he made clear to President Xi that the US supports the Taiwan Act.
For reference, the US and China conducted talks during Tuesday's Asia Pacific trading hours (the talks started at 0046GMT on Tuesday and lasted about three hours). Analysts at the time said the meeting went well, offered signs of improvements in bilateral relations and even the chance of partial tariff removals.
According to analysts at ANZ, Tuesday's "virtual summit was only meant to ease tension... (and was) not intended to achieve normalisation of the bilateral relationship". "The summit paves the way for subsequent trade negotiations, during which the US may soften its trade measures against China" the bank added.
Market Reaction
Markets have not reacted to the latest comments from Joe Biden.
San Francisco Federal Reserve Bank President Mary Daly called for the Federal Reserve to be patient when it comes to interest rate hikes despite high inflation, according to a speech to the Commonwealth Club of California cited by Reuters. Daly said that patience is the boldest and best action and that it would be better to wait for more clarity on the economy and inflation than it would be to raise interest rates pre-emptively. Raising rates now would not fix high inflation, Daly argued, but would instead curb demand and slow the US recovery.
Daly said that there is good reason to think that inflation won't last beyond the pandemic and that over the next several quarters, the bank will watch to see if inflation eases and discouraged workers return to the labour force. Once the Fed has a clearer signal as to the state of the economy, Daly reasoned, the bank would be ready to act. Moreover, the Fed is well-positioned to act to reign in inflation if it does look to be more persistent.
Market Reaction
Daly's comments are more dovish than those from St Louis Fed President James Bullard earlier, who called for the Fed to accelerate its QE taper pace to $30B/month to make way for potential hikes in Q1 2022. Nonetheless, they have not been able to slow the USD's rise as the DXY continues to charge towards the 96.00 level.
- The NZD/USD retreats below 0.7000 despite investors’ expectations of an RBNZ rate hike on its next meeting.
- The US Dollar Index trades at year-to-date new highs around 95.92.
- US Retail Sales rose more than expected, topping seven-month highs.
The New Zealand dollar retreats below the 0.7000 figure last touched in the last week, down 0.62%, trading at 0.6997 during the New York session at the time of writing. Positive US macroeconomic data from the US boost the greenback, US T-bond yields barely advance, and major US equity indices edge higher, gaining between 0.43% and 0.78%, in the day.
The US Dollar Index, which tracks the greenback’s performance against a basket of its peers, advances 0.42%, sitting at 95.91, new year-to-date highs, weighing on the NZD/USD pair. The US dollar was boosted by positive comments of St. Louis Fed President Bullard, who will be an FOMC voter in 2022. Further, NZD bulls seem to be unable to hold their ground despite the hawkish monetary policy stance by the Reserve Bank of New Zealand (RBNZ), the first central bank of the G8 to hike rates and is widely expected to do it once more before 2021 end.
US Retail Sales post the biggest gain since March 2021
During the New York session, the US Census Bureau revealed that October’s Retail Sales in the US expanded by 1.7%, better than the 1.4% foreseen by economists. Excluding Autos, retail sales rose by 1.7%, at the same pace as the headline, more than the 1% estimated.
Further, the retail sales jump showed the resilience of consumers, despite having elevated prices. In fact, the figure is not adjusted for any price changes that reflect the above-mentioned. Receipts at gasoline stations jumped 3.9%, the highest since March of 2021, reflecting how people are paying some of the highest prices in seven years.
Some minutes later, US Industrial Production for October followed Retail Sales footsteps, rose by 1.6%, better than the 0.7% expected by economists.
NZD/USD Price Forecast: Technical outlook
In the daily chart, the NZD/USD pair retreated below the 50 and the 100-day moving averages (DMA’s) which are located above the spot price. Also, the 200-DMA lies on top of them, confirming the downward bias in the near term. Further, a downslope resistance trendline, broken to the upside on October 18, reclaimed its resistance status, lying near the 100-DMA.
To accelerate the downtrend, NZD/USD bears will need a daily close below 0.7000. In that outcome, the first demand zone would be the October 13 low at 0.6911.
On the flip side, If NZD/USD bulls want to regain control, they will need a daily close above the 50-DMA at 0.7060. In that outcome, the following resistance level would be the 200-DMA at 0.7095.
US President Joe Biden said he will make his final decision on who will be the next Fed Chair in about four days, according to Reuters.
According to PredictIt, a US-based betting website where punters can gamble on political outcomes, a 62 cents bet on Fed Chair Jerome Powell wins $1.0, while a 40 cents bet on Board of Governor member Lael Brainard wins $1.0. That marks the highest implied odds Brainard has ever had of being nominated as the next Fed Chair and the lowest odds for Powell since late September. In September, Powell's odds took a hit as the Fed was mired by a string of trading scandals involving regional Fed Presidents.
Market Reaction
There has not been any notable market reaction to this news, though the US Dollar Index (DXY) continues to push towards the 96.00 level.
USD/JPY has just printed a fresh cycle high of 114.70 as the US dollar takes up more ground on the bid to 95.925 vs a basket of rival currencies as measured by the DXY index.
USD/JPY H1 chart
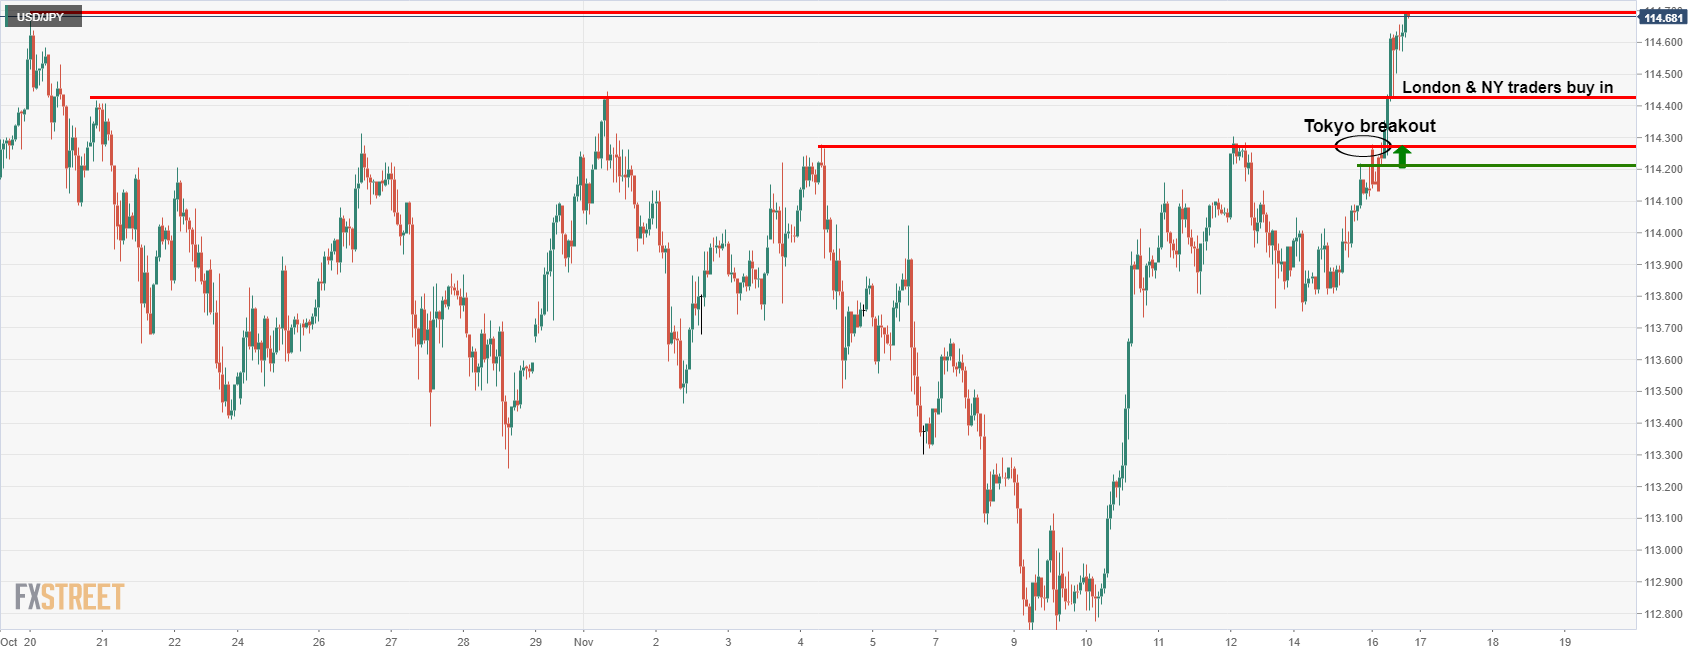
As illustrated, the move started in Tokyo and just kept on going throughout London and New York right into the final hours of Wall Street.
The US dollar has been better bid ever since US inflation data last week surprised to the upside and showed consumer prices surged to their highest rate since 1990. Investors now expected that the Federal Reserve will taper their QE programme at a faster pace. More hawkishly, some observers even expect that the Fed could potentially hike interest rates sooner than first anticipated in the markets.
DXY H1 chart
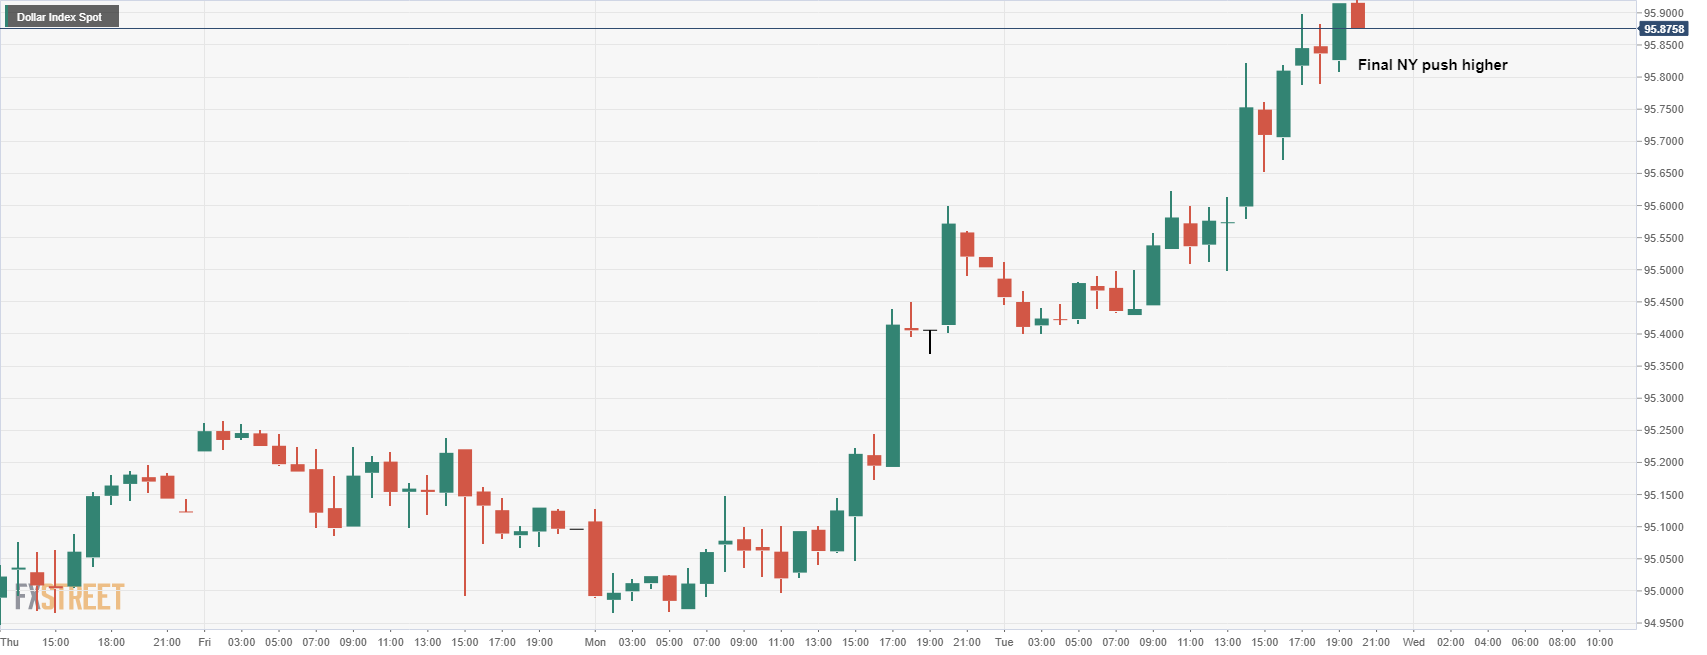
On Tuesday, US data showed US consumers looked past rising prices and drove Retail Sales higher than expected last month. US Retail Sales rose 1.7% in October, topping consensus expectations of a 1.4% rise. Additionally, US Industrial Production lifted 1.6% in October which was considerably higher than expected. Also, the Federal Reserve Bank of St. Louis President James Bullard said that the US central bank should speed up its reduction of monetary stimulus in response to a surge in US inflation.
- Gold is on the verge of a 38.2% Fibonacci correction to test prior daily highs.
- The US dollar is on fire as US data impress and Fed rate hike expectations resurface.
The price of gold sank by over 0.6% on Tuesday and printed a low of $1,849.77 following a big move in the US dollar. XAU/USD fell from a high of $1,877.14 after the greenback rallied to the highest levels since June 2020, reaching as high as 95.899.
The US dollar rallied to a fresh 16-month high as US yields took off on the back of impressive data and hawkish Federal Reserve speakers. US data showed US consumers looked past rising prices and drove Retail Sales higher than expected last month. US Retail Sales rose 1.7% in October, topping consensus expectations of a 1.4% rise.
The US dollar has been better bid ever since US inflation data last week surprised to the upside and showed consumer prices surged to their highest rate since 1990. Investors now expected that the Federal Reserve will taper their QE programme at a faster pace. More hawkishly, some observers even expect that the Fed could potentially hike interest rates sooner than first anticipated in the markets.
Fed speakers spur on the USD bulls
Also spurring up-the US dollar bulls was the well-known hawk, St. Louis Federal Reserve bank president James Bullard. "If inflation happens to go away we are in great shape for that. If inflation doesn't go away as quickly as many are currently anticipating it is going to be up to the (Federal Open Market Committee) to keep inflation under control," Bullard said on Bloomberg Television.
"The inflation rate is quite high," Bullard said. "It behoves the committee to tack in a more hawkish direction in the next couple of meetings so that we are managing the risk of inflation appropriately."
He also said that the Fed could also play up the idea that it does not have to wait to end the taper in order to raise rates.
This follows previous comments from Bill Dudley – former New York Fed President – who said “they’re going to have to get the taper done quicker”. The Fed has already said it could change the pace of tapering if warranted and thus far the inflation data supports the need to slow stimulus.
US stocks cheer positive data
Meanwhile, US stocks were boosted by the strong Retail Sales data, also alongside strong manufacturing and home-build data. However, US equity markets took little notice of comments from Federal Reserve members that monetary stimulus should be curbed more quickly to combat inflation. The S&P 500 lifted 0.6% into the close on Wall Street.
Overall, it was a setback for the price of gold despite the prospects of higher inflation and lower real US yields. Analysts at TD Securities' have forecasted slowing growth and inflation next year and that to them suggests that market pricing remains far too hawkish. However, they note that gold prices have managed to break out nonetheless as global markets scour for inflation hedges. This leaves a bullish bias on the fundamental side, but there could be a meanwhile correction left to play out still as follows:
Gold technical analysis
As per the prior analysis, Gold Price Forecast: Bulls could be throwing in the towel here, the price is correcting from a weekly resistance that was illustrated as follows:
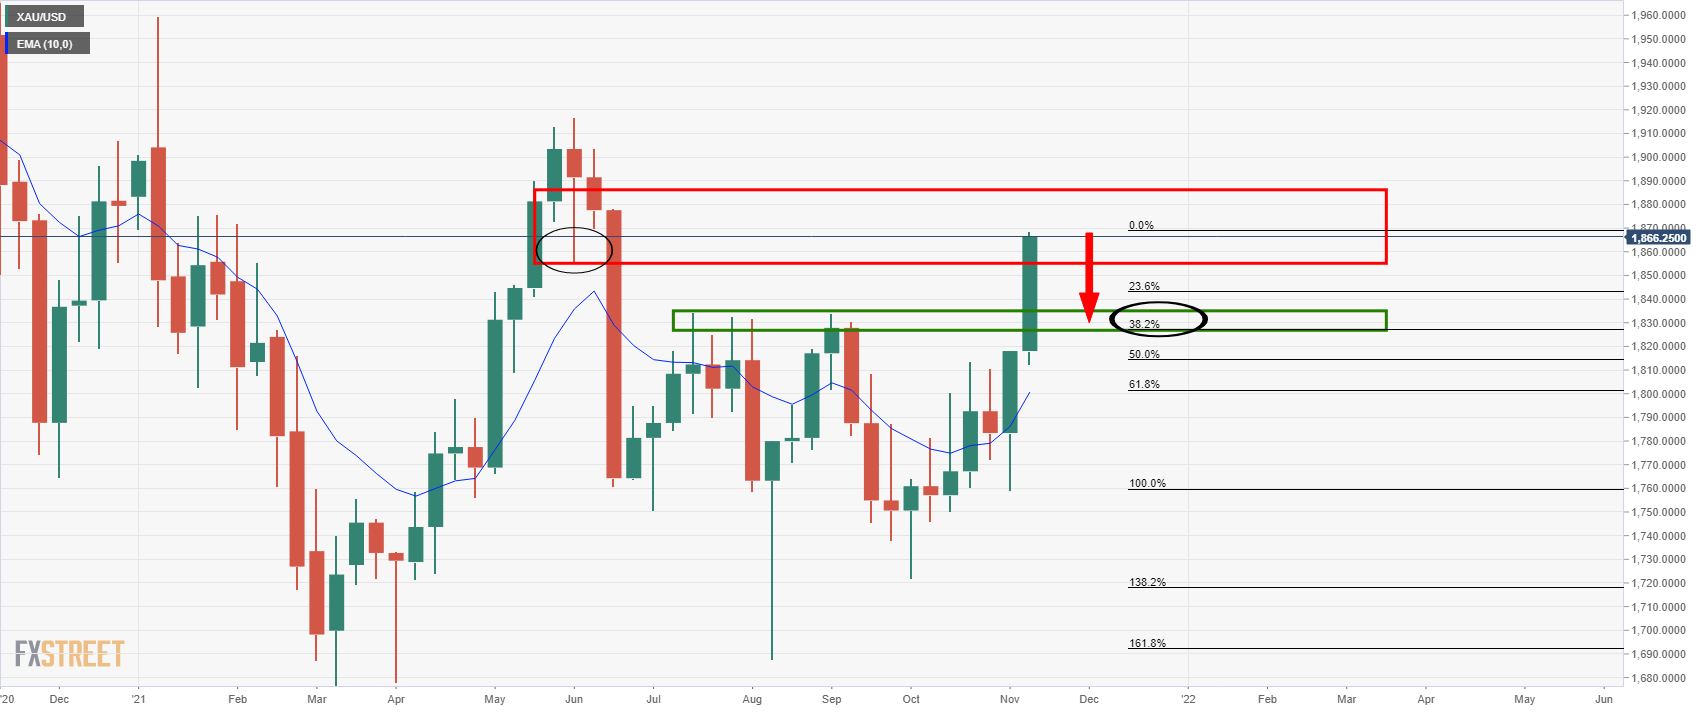
The following is an update with the price action and market structure drawn on the daily chart in confluence with the above prior analysis:
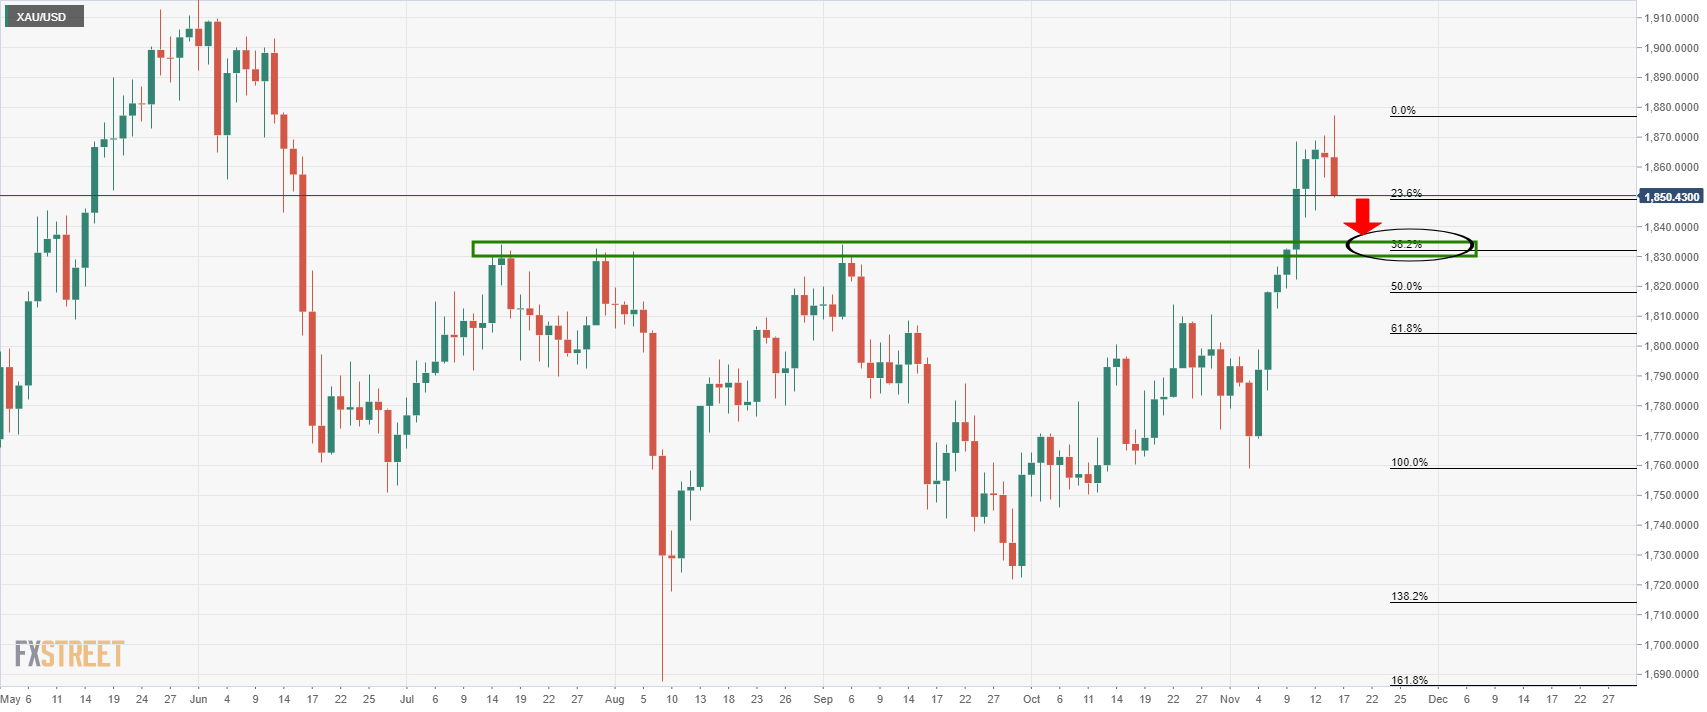
The bears could be on the verge of a test of prior resistance structure in the $1,830s.
- USD/CHF has risen for a fifth straight day and is now testing resistance at the 93.00 level.
- Strong US inflation and economic data and the associated divergence in central bank tightening expectations has been the main driver.
USD/CHF has seen substantial upside throughout Tuesday’s session and is now up around 0.6% on the day at 0.9300. The main catalyst for Tuesday’s upside was a further positive US data surprises, which triggered a broad strengthening of the US dollar (the DXY is now at year-to-date highs in the 95.80s). The US October Retail Sales report was much better than expected and there was a stronger than expected rebound in October Industrial Production from September’s Hurricane Ida disruption-related slump.
There is significant resistance at the 0.9300 level in the form of a triple top from early/mid-October. Should that resistance be broken, then it seems likely that the next stop for USD/CHF would be the annual high at 0.9360.
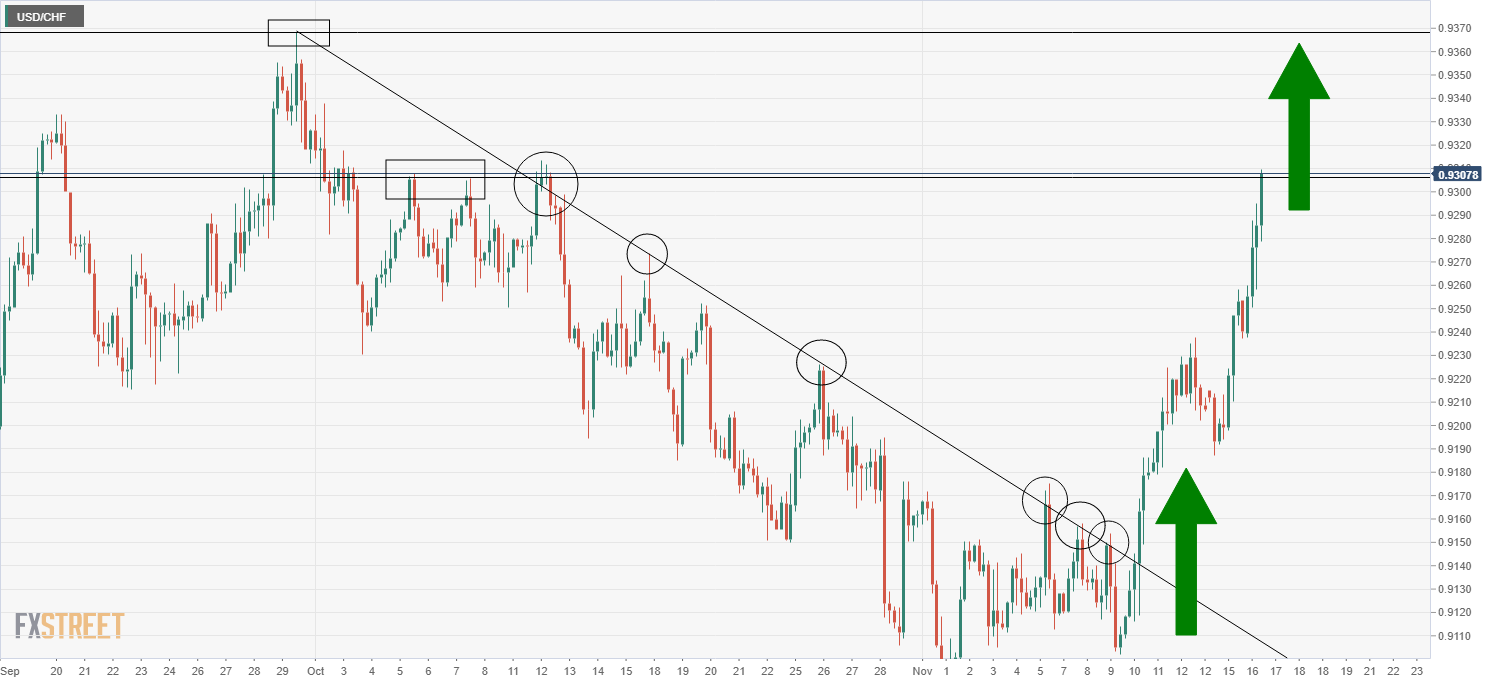
Bullish run continues
USD/CHF is now set to have risen for five straight sessions, during which time it will have rallied over 2.0% from the low 0.9100s to current levels at 93.00. The initial catalyst for the rally was last week’s much hotter than expected US Consumer Price Inflation report, which sent the pair shooting above a negative trendline that had been capping the price action for more than six weeks. Technical momentum has thus played a role, as has the broader theme of central bank divergence.
That is to say, in wake of recent inflation and economic data surprises, markets have been moving to price in a more hawkish Fed. This divergence can be examined by looking at Short-Term Interest Rate (STIR) future markets. December 2022 Swiss France LIBOR futures are broadly unchanged versus last Wednesday’s pre-US CPI data levels at 100.52, implying an SNB rate of roughly -0.5% at the end of 2022, or 25bps of tightening from the bank’s current -0.75% rate. Contrast that with the more than 15 point move lower in the December 2022 Eurodollar future to around 99.05 from previously above 99.20. In other words, USD money markets have pretty much moved to price in three rate hikes from the Fed in 2022, versus two prior to the CPI release.
Watch the EUR/CHF 1.05 floor
USD/CHF traders should key an eye on a key level in the EUR/CHF cross. The Swiss National Bank has been keen to not let EUR/CHF slip below 1.05, indeed, this was the level it defended in the early stages of the pandemic. The pair tested the level on Monday, but has since rebounded somewhat. Some analysts are of the view that this time, the SNB might be willing to let the pair fall below 1.05.
According to Capital Economics, the “persistent weakness of Swiss inflation, and the resulting trend appreciation in the nominal exchange rate, presents the SNB with a moving target when assessing when it will intervene during bouts of upward pressure on the franc... Having defended the CHF 1.05 per euro mark in earnest last year, we suspect that the SNB’s “line in the sand” may now be closer to CHF 1.025, and that it could live with the franc rising to parity with the euro over the coming years.”
A rise in Covid-19 infection rates and Eurozone countries rushing to re-impose restrictions is one reason for FX markets to favour the Swiss Franc over the euro. With regards to the pandemic situation in Europe, things are likely to get far worse before they get any better. Any sustained move below 1.05 in EUR/CHF would make it difficult for USD/CHF to continue its recent rally. In the long-run, though, this is likely to scupper the broader trend of USD/CHF appreciation driven by economic/central bank divergence.
What you need to know on Wednesday, November 17:
The greenback strengthened against most major rivals, reaching fresh 2021 highs against the shared currency. The dollar was partially underpinned by a sour market mood, later by upbeat US data.
The macroeconomic calendar was a bit busier on Tuesday. The UK published employment figures, which showed that those claiming unemployment benefits decreased by 14.9K MoM, while the ILO Unemployment rate for the three months to September contracted by more than anticipated to 4.3%. Average Earnings in the same period were up 4.9% excluding bonus, and 5.8% including bonus.
The EU published the second estimate of its Q3 Gross Domestic Product, which was confirmed at 2.2% QoQ. Employment change in the same quarter was up 0.9%, beating expectations. Finally, the US released September Retail Sales and Industrial Production figures, which came in better than anticipated, further supporting the greenback.
Meanwhile, EU gas prices were up over 12%, as Germany suspended Nord Stream 2 certification. Geopolitical tensions escalated in Europe, and higher gas prices would certainly will affect inflation.
The EUR/USD pair trades around 1.1320, while GBP/USD is stable at around 1.3430. Commodity-linked currencies lost ground vs the greenback although they held within familiar levels.
Gold reached a fresh multi-month high of $1,877.15 but pulled back to close in the red for a second consecutive day in the 1,850 price zone. Crude oil prices shed some ground, with WTI down to $79.70 a barrel.
US Treasury yields reached fresh weekly highs, with that on the 10-year note reaching 1.63%, further supporting the dollar’s demand.
Global indexes struggled to post gains, ending the day mixed. Wall Street opened with substantial gains but gave up to the risk-off mood.
Top 3 Price Prediction Bitcoin, Ethereum, Ripple: Cryptos face market-wide profit-taking
Like this article? Help us with some feedback by answering this survey:
- GBP/USD has fallen back from earlier highs after running into resistance in the form of a key downtrend.
- Wednesday’s UK CPI report, if much hotter than expected, could provide GBP/USD with the tailwinds it needs to break higher.
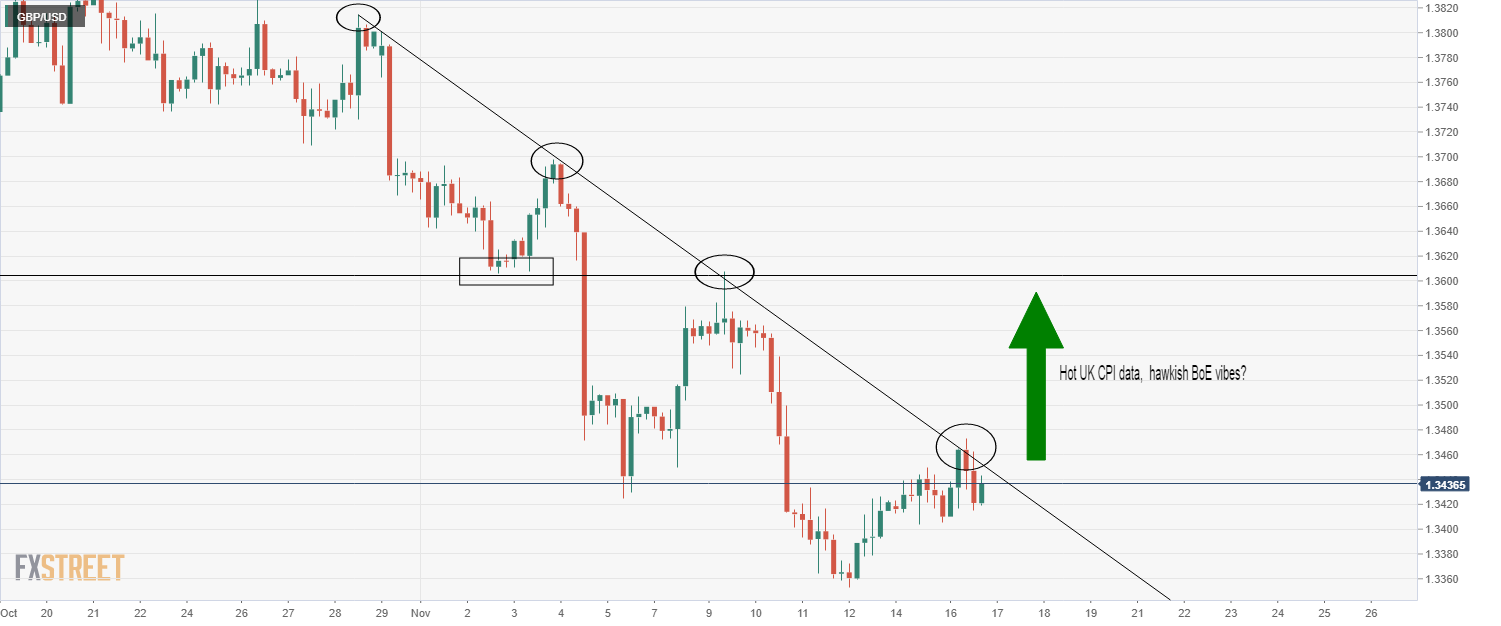
Amid a broad pick up in the fortunes of the US dollar following Tuesday’s strong retail sales and industrial production figures, GBP/USD has fallen back from earlier session highs in the 1.3470s and is back to trading in the 1.3430s. At the start of the European trading session, the pair had rallied as much as 0.5%, boosted by a strong labour market report that amny analysts saw as giving the BoE the green light to hike rates in December. While the pair has slipped back from highs, it still holds onto gains of about 0.2% on the session and is, at present, the best-performing currency in the G10.
While broad USD strength is likely the main reason why GBP/USD pulled back from earlier highs, technical selling likely also played a role. GBP/USD appeared to test and reject a descending trendline that has been capping the price action since the end of October. Whether or not the pair is able to break above this trend line and recover some lost ground may depend on how Wednesday’s October Consumer Price Inflation (CPI) report goes.
The latest jobs report showed employer payrolls growing by 160K in October, thus easing concerns about the post-end of furlough health of the UK labour market that prevented the BoE from hiking rates in November. Wednesday’s CPI report, if it comes in much hotter than expected as was the case in the US last week, could exacerbate inflation concerns at the bank, thus boosting market expectations for a more aggressive policy response.
GBP Short-Term Interest Rate (STIR) future market pricing has been gradually becoming more hawkish in recent days. In the aftermath of the BoE’s dovish November surprise, December 2022 sterling LIBOR futures rallied from under 98.70 to above 98.90. In other words, markets suddenly went from expecting more than 120bps of tightening by the end of 2022 to under 100bps. But the December 2022 sterling LIBOR futures has quietly fallen back to pre-BoE meeting levels in recent days, with Tuesday’s jobs report sending it under 98.70.
A hotter than expected UK inflation reading tomorrow could send it back to year-to-date lows at just above 98.50. This would be bullish for GBP/USD, and could be the catalyst it needs to break above its recent downtrend. If that were to be the case, bullish technicians may target the 9 November high at 1.3600 as the next key area of resistance. Conversely, should the data disappoint, thus taking hawkish pressure off of the BoE and should the euro continue its dovish ECB/Covid-19 infection surge-related decline, GBP/USD is likely to turn lower. Technical selling may then push it down to annual lows at 1.3350.
- AUD/USD bears move in on critical 4-hour support in a flash.
- This could be the makings of a fresh daily low, although the 4-hour support is a risk.
As per the prior analysis, AUD/USD Price Analysis: Bears to target 0.7220, bulls look for test of 0.7420, the bears have finally taken charge and with vigour. However, it could be too late to take advantage, at least from a swing trading perspective on the daily chart.
Nevertheless, the following is a breakdown of price action and where there still could be the possibility of an optimal entry on the 4-hour time frame.
AUD/USD prior analysis
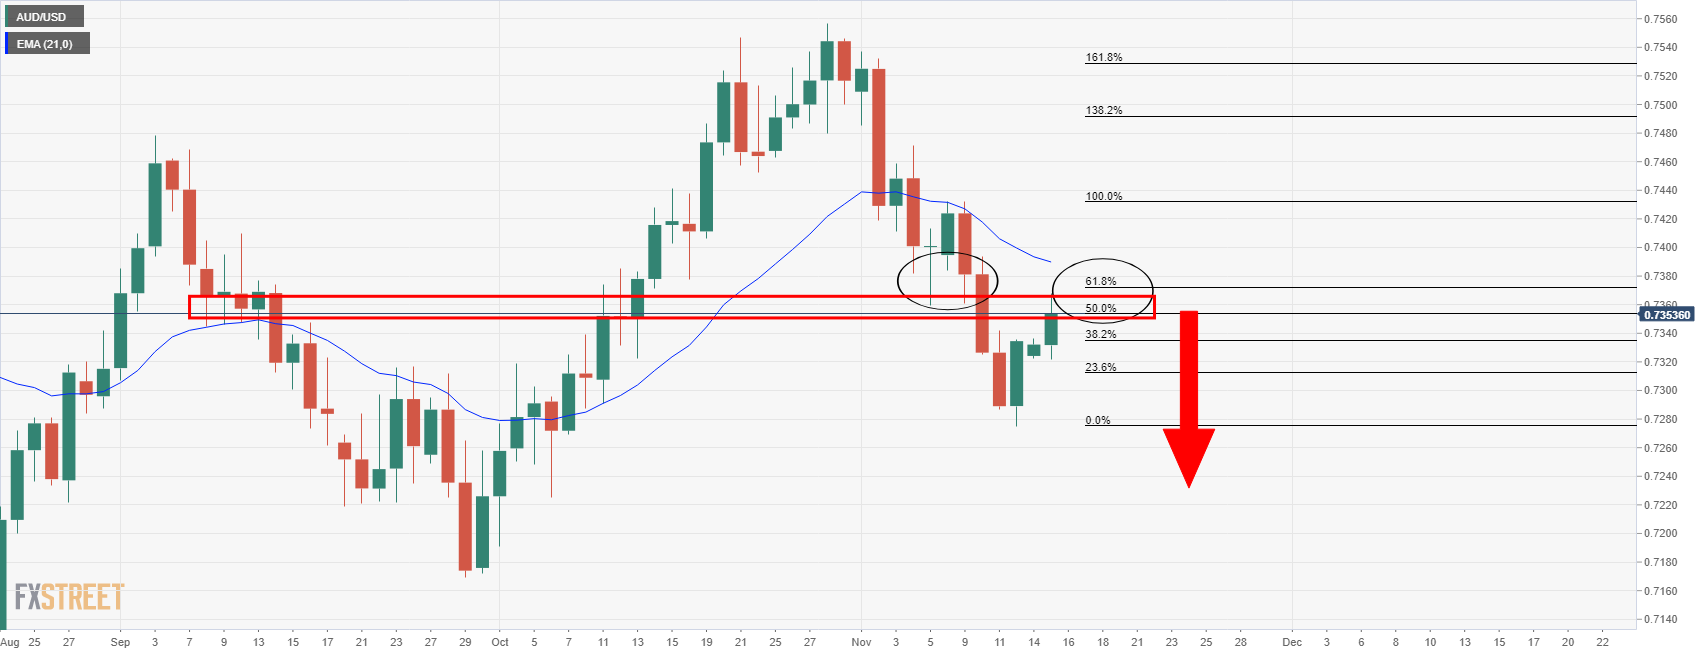
The above analysis was from the prior session and we have seen some superb bearish development as follows:
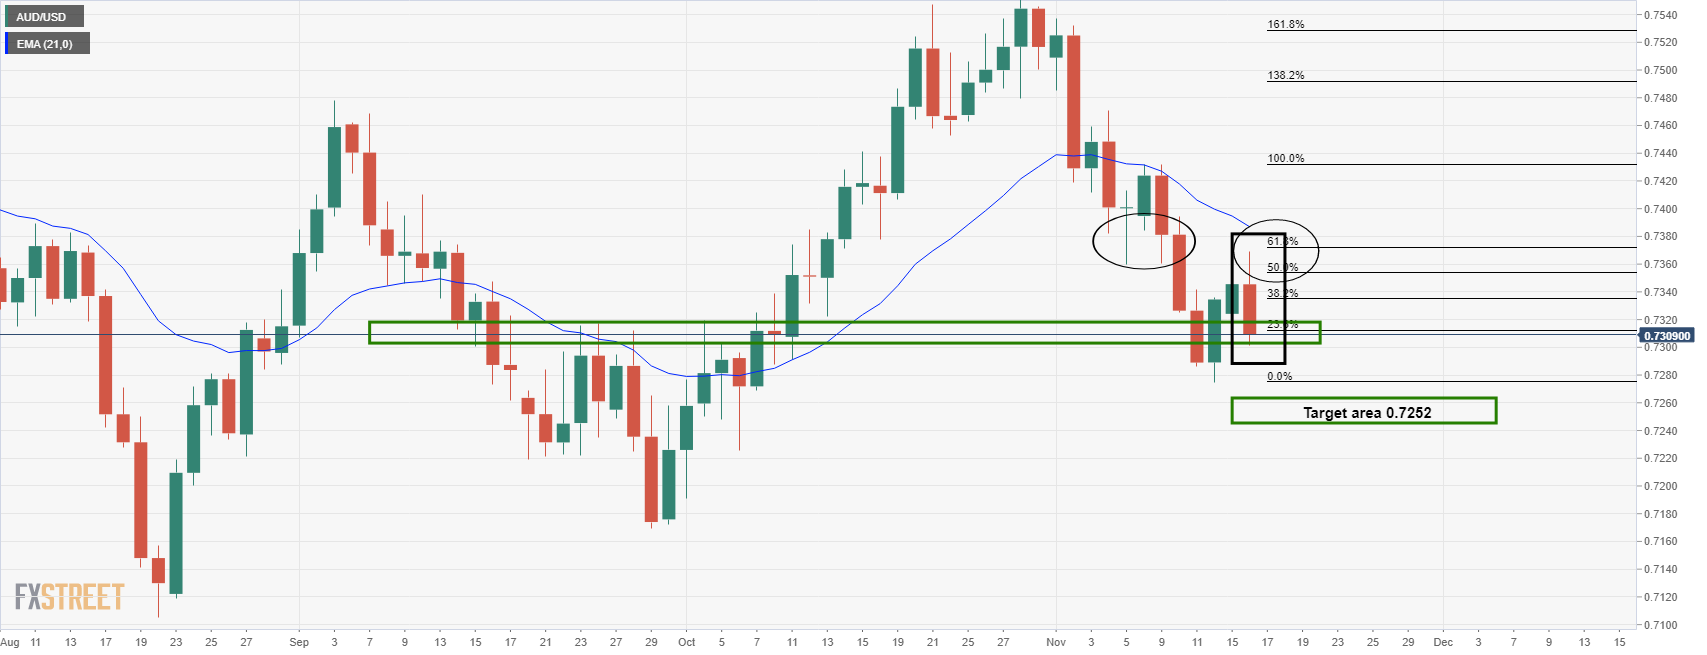
The price, as illustrated, has indeed fallen into the projected support area. However, it has done so in a sharp move which gives rise to the risk of a support structure forming which could be problematic from an entry perspective.
AUD/USD H4 chart
As per the prior analysis, it was stated that bears could be getting ''prepared for a downside continuation by monitoring for a bearish environment from the 4-hour chart as follows,'' ...
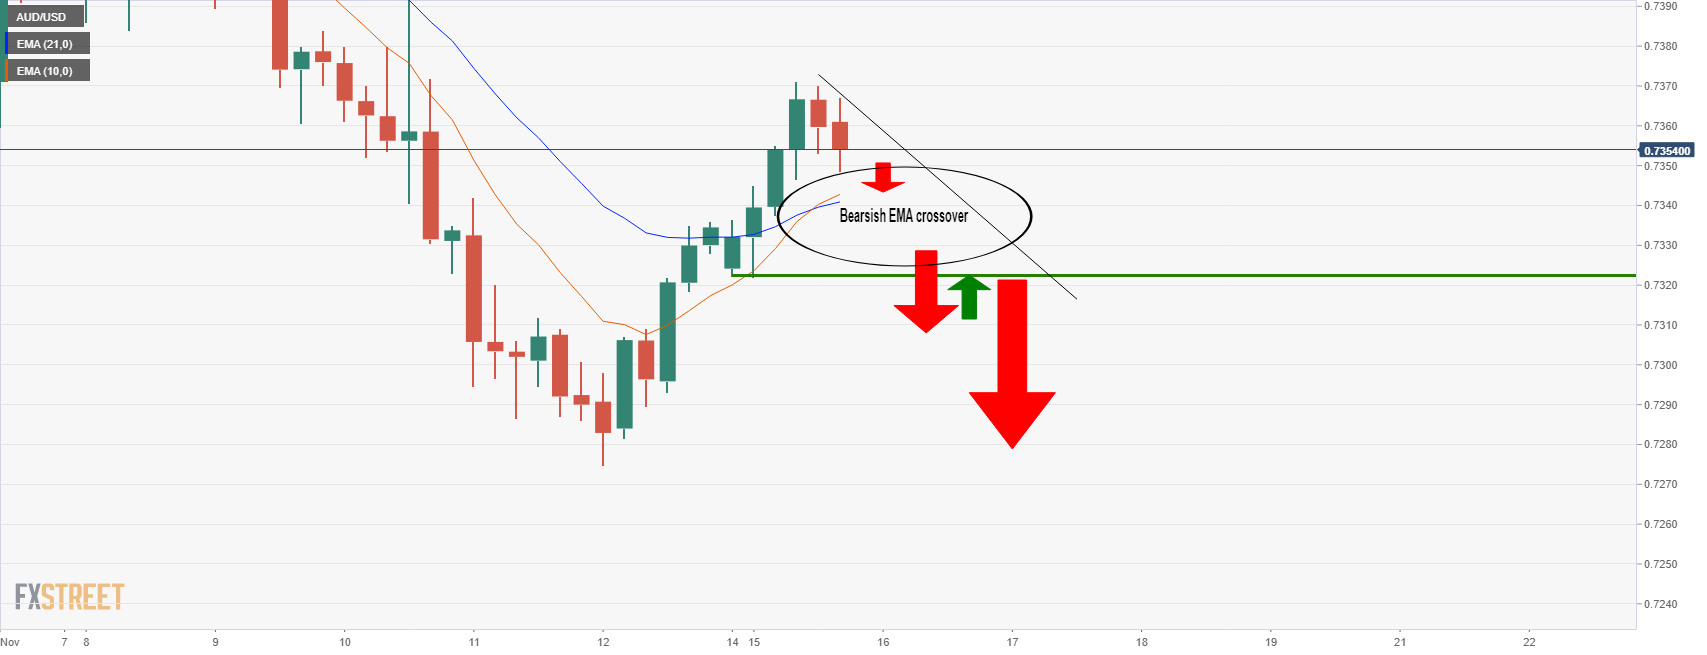
It was explained that the bears would be looking for the 21 and 10-EMAs to turn south and crossover to signal a bearish environment. ''A break of the 0.7320s will likely result in a downside continuation for a fresh daily low towards 0.7250 and then 0.7220.''
The price has followed suit as follows:
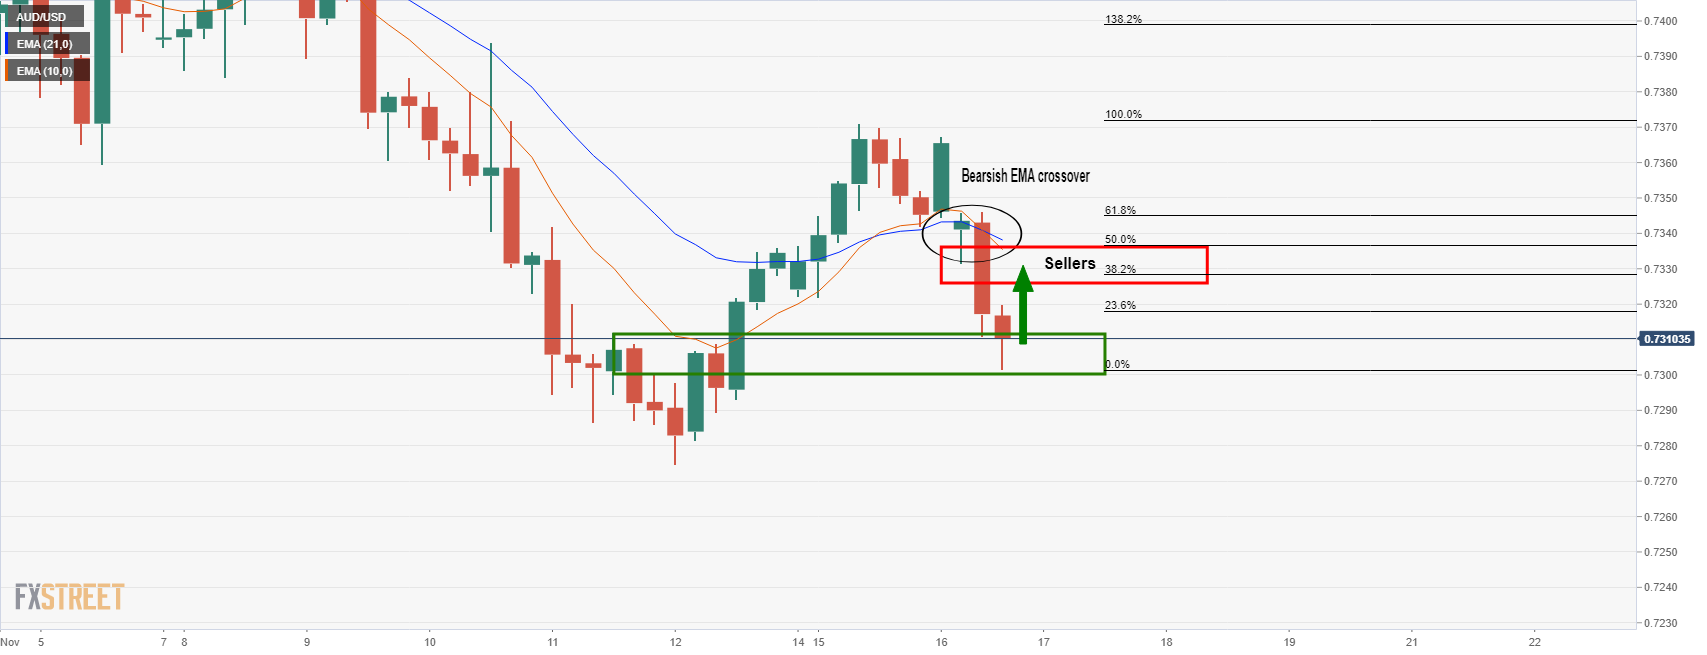
At this juncture, the bears could be seeking a discount near the EMA crossover and between the 38.2% and 50% ratios near 0.7330 that would be expected to act as resistance on a retest of the structure. This will enable bears that are late to the party to get on board what could turn out to be a continuation of the weekly bear trend.
With that being said, the M-formation is a reversion pattern that would be expected to pull the price in to test the neckline of the formation which has a confluence of the 61.8% Fibo near 0.7350. Considering that the price has already met support, there is the risk that the price basis there and potentially moves higher beyond the M-formation's structure towards 0.7380. Ideally, bears will have already engaged with this current impulse to the downside and have moved their stop loss to breakeven by now to protect against such a scenario.
- XAG/USD upward move, stalled around the 200-DMA, retreats $0.30, to $24.89.
- XAG/USD extends its slump to two days driven by broad US dollar strength across the board.
- Higher US bond yields weighed on the non-yielding metal.
Silver (XAG/USD) struggled at the 200-DMA around $25.10, slides below $25.00 for the first time in three days, down some 1.20%, trading at $24.80 during the New York session at the time of writing. The market mood is upbeat in the financial markets, spurred by good US macroeconomic data that produced a rally in US stocks. Further, the 10-year Treasury yield is barely flat in the US bond market, up one basis point sitting at 1.628%.
In the New York session, the US Retail Sales for October increased by 1.7%, more than the 1.4% foreseen by analysts, smashing the 0.8% September’s number. Excluding Autos, retail sales for the same period expanded at the same pace that the headline, 1.7%, higher than the 1% estimated.
It is the most significant jump in retail sales since March 2021 figures. Though it is worth noting that the figures are not adjusted for inflation, reflecting price adjustments passed to the consumer.
Moving back to XAG/USD, in the Asian Pacific session, the white metal remained subdued in a narrow trading range within the $25.00-25 area. However, once US economic data crossed the wires, the white-metal seesawed between the high and the low of the day at that time, finally settling below Monday’s low around $24.80.
Furthermore, broad US dollar strength across the board has weighed on the non-yielding metal, with the US Dollar Index advancing some 0.30% in the day, sitting at 95.80, acting as a headwind for silver.
XAG/USD Price Forecast: Technical outlook
-637726856392532897.png)
Silver is approaching the mid-line of Andrew Pitchfork’s indicator in the daily chart, around the October 22 high at $24.83. Further, that support area, which was previous resistance, was unsuccessfully tested three consecutive days, meaning that XAG/USD buyers could view the opportunity to open fresh bets against the US Dollar.
However, in the outcome of breaking below the abovementioned support, the following support would be $24.50, followed by the 100-day moving average at $24.14.
- EUR/JPY bulls looking for a retracement to 130.20 in the sessions ahead.
- US dollar is exceptionally strong as fundamentals play out in favour of the bulls.
EUR/JPY has started to resurface after a whitewash across the forex board as a tsunami of USD bids took down the single currency earlier in the day. At the time of writing, EUR/JPY is trading with its head back above water at 129.81 and is up 0.08%. It has come up from a low of 129.62 after sliding from 130.11 the high.
The euro fell to a new 16-month low versus the dollar on Tuesday, extending recent losses made on Monday after dovish comments from European Central Bank President Christine Lagarde. The euro was pressured further amid growth concerns and a surge in COVID-19 cases. It also suffered a surge in the greenback that rallied to the highest levels since June 2020, reaching as high as 95.899. This sank EUR/USD to as low as 1.1319 in the last hour of trade, (by 17.50 GMT).
US Retail Sales were the final straw
The US dollar rallied to a fresh 16-month high as US yields took off on the back of impressive data and hawkish Federal Reserve speakers. US data showed US consumers looked past rising prices and drove Retail Sales higher than expected last month. US Retail Sales rose 1.7% in October, topping consensus expectations of a 1.4% rise.
However, there is some speculation that the data was stronger due to the holiday season approaching and fears of higher prices. Americans may have also started their holiday shopping early to avoid empty shelves amid shortages of some goods as the ongoing pandemic squeezes supply chains. Nevertheless, the data was in the harmony with the inflationary pressures.
The dollar has been bid event since US inflation data last week showed consumer prices surged to their highest rate since 1990. This has led to sentiment in the markets that the Federal Reserve will have to curtail QE at a faster pace and potentially even hike interest rates sooner than first anticipated in the markets.
Additionally, covid in the US is seen to be less of a risk than in Europe again. COVID-19 is also surging there again which is causing some countries to contemplate lockdowns already. This, coupled with European Central Bank President Christine Lagarde saying that tightening monetary policy now to rein in inflation could choke off the euro zone's recovery, have both weighed on the outlook for the single currency.
EUR/JPY technical analysis
Meanwhile, the bulls are attempting to catch a falling knife:
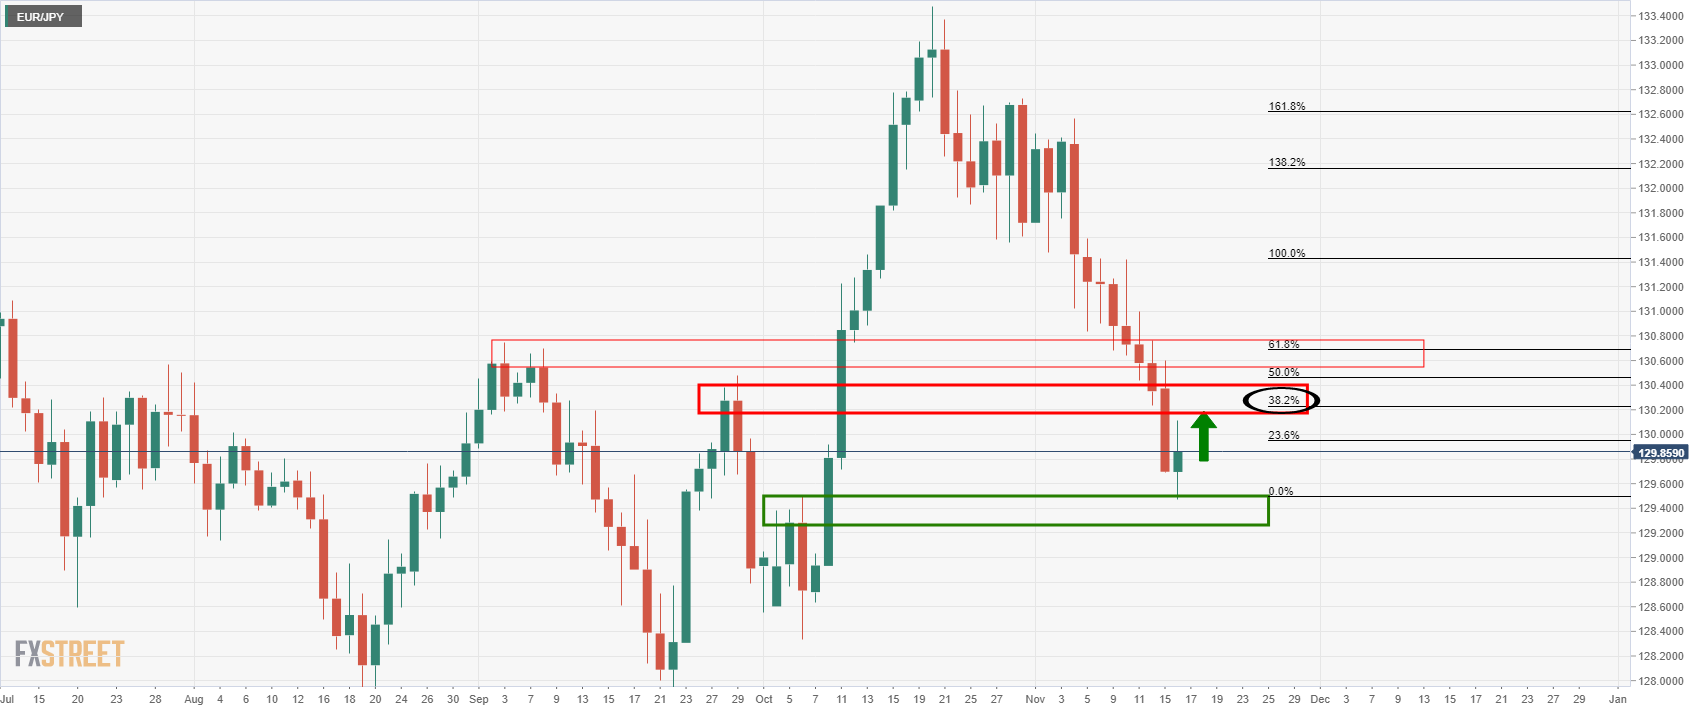
The price is in a strong downtrend, although there are prospects of a significant and healthy correction towards the 38.2% Fibonacci retracement level near 130.20.
- The S&P 500 advances up 0.51%, at 4,706.87.
- The Dow Jones climbs 0.50%, currently at 36,270.40.
- The heavy-tech Nasdaq Composite edges higher 0.65%, at 15,957.49.
The S&P 500 edges higher during the New York session, up some 0.51%, currently at 4,706.87 at the time of writing. As portrayed by major US equity indices, the market sentiment is upbeat, rising between 0.50% and 0.65%. Positive US macroeconomic data spurred a rally in US stocks, as the Retail Sales jumped to a seven-month new high, doubling September reading.
In the New York session, the US Retail Sales for October were unveiled, showing an increase of 1.7%, more than the 1.4% estimated by analysts, smashing the 0.8% September’s number. Moreover, excluding Autos, sales for the same period expanded at the same pace that the headline, 1.7%, higher than the 1% expected.
Consumers propelled sales to their most significant jump in seven months. However, it is worth noticing that the figures are not adjusted for price changes due to higher prices. In some gasoline stations, the receipt heightened almost 4%, its highest level since March, portraying the spike in energy prices in the last couple of months.
Sector-wise, consumer discretionary, technology, and health advance 1.29%, 0.90%, and 0.73%, respectively. On the other hand, the main losers are utilities, real estate, and consumer staples, down 0.48%, 0.47%, and 0.42% each.
S&P 500 Price Forecast: Technical outlook
-637726801829589811.png)
The daily chart depicts the S&P 500 has an upward bias, confirmed by the daily moving averages (DMA’s) well located below the index value, with an upward slope. Nevertheless, the Relative Strength Index (RSI) is at 70, well within overbought conditions, suggesting that a lower correction could happen.
At press time, is testing the all-time high at 4,716, which in case of a daily close above the latter, would expose the 4,800 as its following resistance area.
On the flip side, in the case of a correction, the first support would be the October 26 high at 4,598.53 that confluences with the 78.6% Fibonacci retracement as the first support level. In the outcome of a deeper correction, the October 27 low at 4,553.53.
In a videocast speech to a business group cited by Reuters, Bank of Canada Governor Lawrence Schembri said on Tuesday that the relationship between labour market conditions and inflation has weakened and become more difficult to measure, thus making it harder to know when economic slack has been absorbed.
Additional takeaways
“There is uncertainty about the level of maximum sustainable employment and the relationship between labour market conditions and inflation.”
“Understanding how high the level of employment can get without sparking inflation is crucial.”
“Evidence suggests that with firmly anchored inflation expectations, the relationship between inflation and the output gap has weakened.”
“Structural forces affecting the Canadian labour market are likely causing the level of maximum sustainable employment to change, making it harder to identify.”
“Traditional tools to measure employment aren't as useful as they once were” and the “bank is looking at new ways to measure spare capacity in the labour market.”
The “bank has developed new tools to measure impact of Covid-19 pandemic on workers and employers.”
“Despite the recent spike in inflation, medium-term inflation expectations have remained relatively well-anchored.”
“Considerable excess capacity remains in labour market” and “rates of unemployment and underemployment remain elevated.”
“We expect pandemic shock will have some scarring effects” and “could see skills of long-term unemployed workers erode and their attachment to labor market weaken.”
Market Reaction
The loonie has not seen any notable reaction to the latest BoC rhetoric. The comments mostly refer to a higher degree of uncertainty that BoC policymakers face, including with regards to NAIRU, or the non-accelerating inflation rate of unemployment. This is defined as the specific level of unemployment that is evident in an economy that does not cause inflation to increase.
The comments do not discuss the outlook for BoC policy and thus are unlikely to impact market expectations.
- USD/TRY continues to surge higher after it broke above 10.00 for the first time last week.
- The pair nearly hit 10.40 early in the US session but has since moderated back below 10.30.
- The CBRT is expected to cut interest rates by another 100bps on Wednesday despite surging inflation.
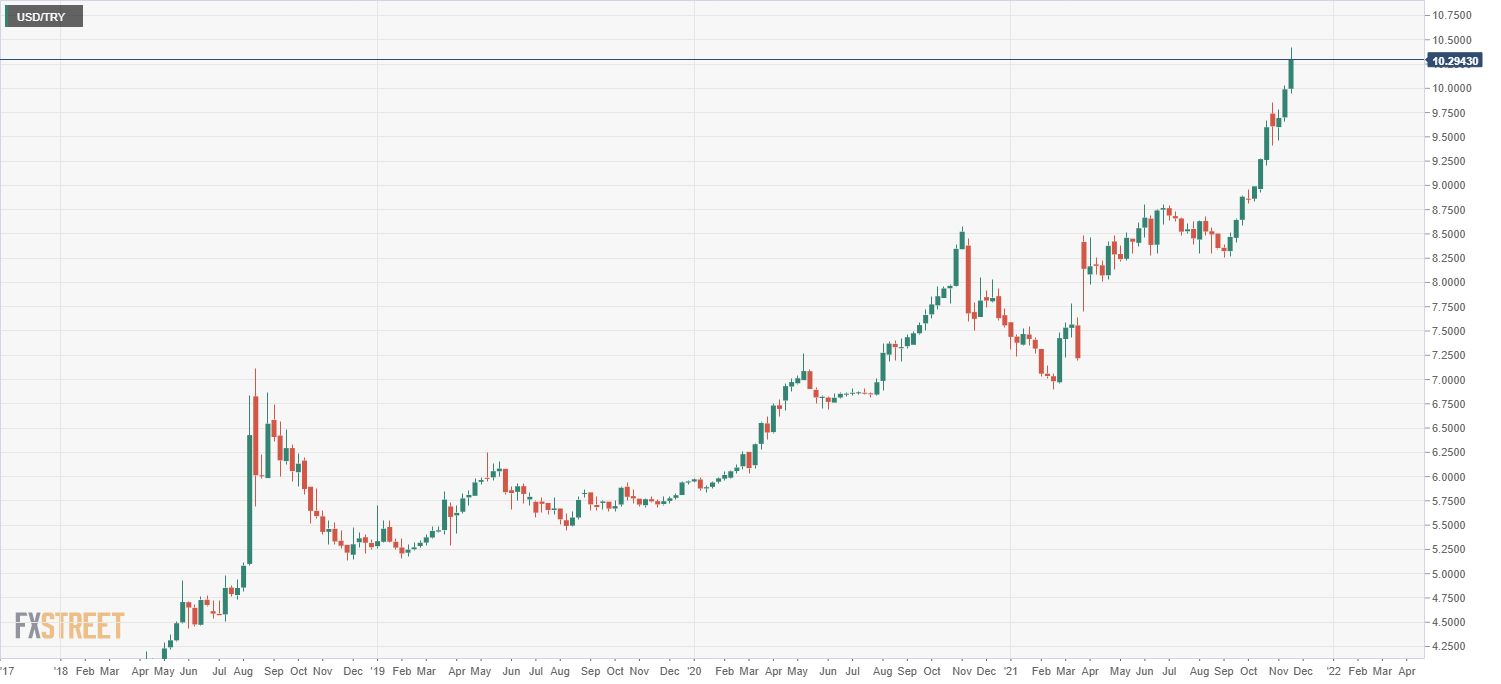
The Turkish Lira has been under intense selling pressure since the start of Tuesday European session. USD/TRY, which pushed above 10.00 for the first time since, picked up pace from 0600GMT upon the arrival of European market participants, and has since surged north of 10.20. At one point, about an hour after the US market open, the lira appeared to undergo a small flash crash, with USD/TRY surging from 10.28 to just under 10.40 in a matter of minutes. It has since reversed back below 10.30, where it trades higher by about 2.2% on the day and is the worst-performing major currency in the world.
There haven’t been any fresh fundamental catalysts to drive the upside in the lira on Tuesday. Rather, traders have cited concerns about another rate cut from the Turkish central bank (CBRT), who set policy on Wednesday, as the main reason for the lira’s ongoing woes.
Despite the fact that the YoY rate of CPI in Turkey surged to just shy of 20% in October, the is expected to lower interest rates by another 100bps to 15.0% on Wednesday. That would take Turkey’s real interest rate on bank deposits (when compared to current headline CPI) to around -5.0%, one of the lowest in the world - no wonder no one wants to hold liras.
The ongoing decline of the lira points to an ongoing lack of trust in the CBRT’s ability to get inflation back to its 5.0% target. That’s because the bank’s policymaking is tainted by the hand of Turkish President Recep Erdogan, who unconventionally believes that interest rates should be lowered to bring down inflation and has consistently fired governors who failed to cut rates. Only a few weeks ago, Erdogan fired three rate-setters who reportedly disapproved of the CBRT’s most recent 200bps rate cut back in September.
Erdogan, who served as the country’s PM from 2003-2014 and has since served as the country’s President, is not expected to lose the 2023 election. Therefore, the prospect that the CBRT manages to rebuild credibility and reverse the lira’s ongoing decline is very unlikely in the coming years. Fears continue to grow that Erdogan’s unconventional approach to economic policy, sometimes quipped as “Erdoganomics”, will ignite a financial crisis in the country. The lira has lost 40% of its value versus the dollar so far this year, with more than 20% of that decline coming in the past three months.
Leader of the House Majority Steny Hoyer said on Tuesday that a vote on the Biden administration's $1.75T "Build Back Better" social spending bill would take place on Friday at the latest. Whilst it would likely pass in the House, the fate of the bill in the Senate is far less certain.
The Democrats only hold a majority of one in the Senate and thus need all Democrat Senators to support the bill if they want it to pass via simple majority using the budget reconciliation process. Moderate Senate Democrat Joe Manchin is reportedly skeptical about the timing of the bill after he publically expressed grave concern about the build-up of inflationary pressures in the US economy after last week's higher than expected inflation figures. Reports last week suggested he may favour withholding his support for the bill until 2022, when he hopes the inflation situation will have improved.
Market Reaction
FX markets have not seen any reaction to the comments.
- XAU/EUR’s nine-day rally has gained almost 9% in the last couple of weeks.
- XAU/EUR: Fed and ECB monetary policy divergence could benefit gold against euro traders, as ECB interest rates are below zero.
- XAU/EUR: RSI’s in overbought conditions could spur a correction towards €1,604 before resuming an upward move.
Gold (XAU/EUR) extends its rally to nine days in a row gaining against the EUR, up 0.11% during the day, trading at €1,642 at the time of writing. The nine-day rally accumulated gains of almost 9% and showed no signs of pausing, as long as the European Central Bank (ECB) sticks to its dovish posture.
In the Asian session, gold dipped as low as €1,637, but bounced off the lows, reaching a new year-to-date high at 1651, then retreated some to stabilize around €1,641. Furthermore, the German 10-year bund yield is flat at -0.245%.
Fed and ECB monetary policy divergence offers gold traders another hedge option in the XAU/EUR
From the central bank divergence point of view, between the Fed and the ECB, gold against the euro offers some attractive inflation hedge options.
In the US, the Federal Reserve just began its bond taper to its pandemic-stimulus package, contrary to the ECB, which stills in the QE, pushing back the possibility of a hike rate in the near term. Further, recent Fed policymakers have turned to a more slight neutral-hawkish posture, something that market participants have noticed, as money markets futures have priced in a July 2022 rate hike by the Federal Reserve. The consequence of that is that higher US bond yields usually benefit the greenback, thus weakening gold.
Contrarily, the ECB dovish posture weighed on the EUR/USD pair, which has fallen almost 2.50%, in the last couple of weeks, printing new year-to-date lows. XAU/EUR has followed the EUR/USD footsteps, as gold against the euro has reached new year-to-date highs during the previous five trading days.
That said, and with the ECB interest rates below zero, XAU/EUR could be an interest option to trade.
XAU/EUR Price Forecast: Technical outlook
-637726759048713823.png)
On Monday, XAU/EUR broke above Andrew Pitchfork’s top-trendline indicator, which prompted an upside move to €1,651, which was rejected. At press time, gold is testing Monday’s close around €1,640, which seems to be forming a gravestone doji, meaning that the fight between bulls and bears is at equilibrium. Further, the Relative Strength Index (RSI) is at 78, well inside the overbought territory, suggesting exhaustion in the upward move, which could trigger a correction before resuming the uptrend.
In that outcome, the first demand area would be November 13, 2020, high at €1,604.
- US 10-year Treasury yields have pared earlier gains to trade a tad lower, but still above 1.60%.
- Strong US data and hawkish Fed commentary helped to boost yields earlier in the session.
US 10-year Treasury yields continue to consolidate slightly to the north of the 1.60% level, where they trade modestly lower by about 1bps on the session. Last week’s high at 1.60% is offering support for now. The 30-year yield is down by a similar very modest margin to just below 2.0%. Short-end yields are flat with the 2-year just below 0.52%.
Yields have pulled back from earlier session highs when the 2-year hit 0.54% and the 10-year hit three-week highs just under 1.64%. A much stronger than expected US Retail Sales report for October, as well as hawkish commentary from St Louis Fed President and 2022 FOMC voter James Bullard, had pushed yields higher earlier in the session. For reference, headline retail sales rose 1.7% MoM versus forecasts for a 1.2% rise and Bullard suggested the Fed accelerate the pace of QE taper to $30B per month to pave the way for a Q1 2022 rate hike.
Though the earlier upside has now mostly been given back, it would seem that risks are pointed towards higher US yields right now. Last week’s much hotter than expected US inflation data has put pressure on the Fed to turn more hawkish, while other US data has also been surprising to the upside. The NY Fed Manufacturing survey for November that was released on Monday was much stronger than expected and pointed at a further acceleration in US growth this month. The data sent yields higher at the time. Analysts do note that one key downside risk for bond yields if it ends up triggering a broad demand for safe-haven assets, could be a resurgence in Covid-19 infections in the US this coming winter.
Looking ahead, bond traders will be keeping an eye on further Fedspeak, with FOMC members Raphael Bostic and Thomas Barkin slated to speak at 1700GMT, followed by FOMC member Mary Daly at 2030GMT. For the rest of the week, bond markets will remain focused on Fed speak, US data and a $23B 20-year bonds auction on Wednesday. Note that last week’s $25B 30-year bond auction was poor.
The 1.6% increase in industrial production for October is partly a make-up for the 1.3% storm-related decline in September, explained analysts at Wells Fargo. They consider the enduring challenge for production is the supply chain crisis, something far more disruptive to output than a Hurricane.
Key Quotes:
“Industrial production gained 1.6% in October more than making up for the 1.3% dip in September. The gain handily exceeded expectations and the Federal Reserve attributes half of the gain in October to recovery from the effects of Hurricane Ida. This makes intuitive sense as you look into the underlying details.
The largest overall increase within manufacturing industries was motor vehicle and parts production which shot up 11.0% in October. That would ordinarily be a remarkably outsized gain. However, coming on the heels of back-to-back monthly declines that sum to just over 10% in August and September, the big surge in October begins to feel more like a matter of just getting back on track.”
“In this context it is an immense frustration to firms that find themselves unable to put their plants and equipment to profitable use despite core capital orders having risen more in this cycle than any other in the past 20 years. Capacity utilization rose, but at just 76.4% it remains below it long run 30-year average of 78.4%.”
“The rebound from Hurricane Ida was also behind the pickup in mining production. After the Hurricane limited oil & gas production in the Gulf of Mexico for the first half of September, mining output jumped 4.1% in October and oil & gas drilling specifically rose 9.3%, the highest monthly gain since January. Every category of energy production moved higher during the month. For utilities, relatively warmer-than-usual weather in October was behind the 1.2% gain.”
Analysts at Danske Bank expect renewed upward pressure on long-term yields, with 10Y US Treasury yields set to hit 2% within the next 6-12 months. They continue to expect 10Y German Bund yields to edge up to 0.25% in 2022.
Key Quotes:
“We expect 2Y US yields to rise in the coming 12 months as rate hikes approach. That would tend to flatten the curve. However, we can also see from the right-hand chart above that 10Y yields normally increase at the same time. In other words, we usually see the entire yield curve shift upwards when the curve flattens due to policy tightening.”
“We have a 2% target for 10Y Treasury yields and a 0.25% target for 10Y Bund yields. Hence, we expect higher 10Y US yields to push long European yields up.”
“We also expect real interest rates to rise in coming quarters. 10Y real interest rates have declined further this autumn. While inflation expectations (break-evens) in fixed-income markets have risen, nominal 10Y yields have remained broadly flat, sending real interest rates lower. We expect real interest rates to start increasing again in 2022, putting upward pressure on long nominal yields.”
Data released on Tuesday, showed retail sales in the US rose more than expected in October. According to analysts at Wells Fargo, the 1.7% increase in October retail sales sets up holiday sales for another record gain, but the real insight in is how wallet share is shifting as consumers reprioritize spending amid the highest inflation in 30 years.
Key Quotes:
“Retail sales increased 1.7% in October on the heels of upward revisions to the prior month's figures. E-commerce posted the largest monthly gain of 4.0% on the month. Prices played a role in lifting the monthly sales figures once again, with core goods consumer prices up another 1% in October. Encouragingly, even excluding some of the categories most associated with recent price hikes like autos and gas, the monthly gain of 1.4% was double the consensus expectation for a more modest 0.7% increase.”
“Even with declines in holiday sales in November and December, today's report still presents some upside to our call for holiday sales to rise 11% compared to last year. If sales are flat in November and December, holiday sales would rise 14.8% this year. When adjusting for inflation, we estimate real sales would rise a still-strong 10%, which would be the highest in at least seven years.”
- Higher equity prices and US yields weigh on the Japanese yen.
- US economic data released on Tuesday surpass expectations.
- USD/JPY breaks key resistance and strengthens positive outlook.
The USD/JPY broke above 114.30 and jumped to test the multi-year high below 114.70. It peaked at 114.63, the strongest in four weeks and then pulled back modestly. The combination of higher US yields, rising equity prices and a rally of the dollar across the board keeps boosting the pair.
US economic data released on Tuesday came in above expectations (retail sales and industrial production) and boosted US yields. The 10-year Treasury reached 1.63%, before pulling back.
The economic figures show an improvement in economic activity that fuels expectations about an adjustment in Federal Reserve’s monetary policy sooner than expected. The numbers also help the greenback that is rising sharply. The DXY stands at fresh 16-month highs above 95.10, up 0.20% for the day.
USD/JPY short-term outlook
The pair trades near the multi-year high area around 114.70. While above 114.40 the bullish tone will remain intact and another test of the recent top seems likely. A break above should clear the way to more gains.
A slide back under 114.30 would put USD/JPY back into the range between 114.30 and 113.40, with an intermediate level at 113.75.
Technical levels
- The Forint has seen choppiness in response to the latest Hungarian central bank rate decision.
- USD/HUF briefly hit 18-month highs above 322.00, but has since fallen back towards 320.00.
The Hungarian Forint has seen choppy conditions in recent trade, with USD/HUF at one point surpassing prior weekly highs at 322.00 to print fresh 18-month highs, before reverting back towards 320.00. At 1300GMT, the Hungarian central bank (the Magyar Nemzeti Bank of MNB) announced that it had decided to hike its base rate by 30bps to 2.1% as expected, marking a re-acceleration of the pace of monetary tightening. The overnight deposit rate was also lifted by 30bps to 1.15% as expected.
At the September meeting, the bank opted to slow the pace of rate hikes down from 30bps per meeting to 15bps and followed up with another 15bps hike in October. The forint didn’t like the decision to slow the pace of rate hikes and at current levels, USD/HUF is up nearly 4.0% from its September lows close to 308.00.
Despite the MNB’s decision to re-accelerate the pace of rate hikes, USD/HUF’s initial reaction was a kneejerk move higher to above 322.00 from previously around 320.50, suggesting some traders had been betting on a bigger rate hike. Some might have been betting/hoping that the Hungarian central bank would follow in the footsteps of its Polish and Czech counterparts in implementing a much larger than expected rate hike. The Polish central bank hiked interest rates by 75bps in November and the Czech National Bank by 1.25%.
USD/HUF was able to reverse lower, however, in wake of the MNB’s post-policy meeting press conference, which began at 1400GMT. The bank pledged to continue the tightening cycle as expected and noted that it might lift its one-week deposit rate above the base rate (the interest rate on its one-week deposit facility was 1.8% last Thursday). The Hungarian central bank also said tightening would continue until the inflation outlook had stabilised, before noting that the risks that inflation remains elevated for longer have grown. Furthermore, the bank announced that it would stop providing HUF liquidity via its FX swap facility.
After October Consumer Price Inflation surprised to the upside at 6.5%, the Hungarian central bank said it sees inflation surpassing 7.0% in November. Analysts argued that the MNB is nimble and if upwards inflation surprised persist, the bank could accelerate the pace of rate hikes again. Whether this would be enough to turn the tide for USD/HUF, which is now up about 7.5% on the year, remains to be seen.
- AUD/USD dipped 30 pips as US Retail Sales for October grew the most in seven months.
- US Industrial Production crushed expectations, boosting the greenback.
- RBA’s Governor Philip Lowe said that data would not support a rate hike in 2022.
During the New York session, the Australian dollar falls, as better than expected US Retail Sales, seems to convince USD bulls to support the greenback against the AUD, prompting a 23 pip downside move on the announcement. At the time of writing, the AUD/USD is down some 0.42%, trading at 0.7315.
US Retail Sales for October smashed September's reading
In the New York session, the US Census Bureau revealed October’s Retail Sales which increased by 1.7%, more than the 1.4% foreseen by analysts, crushing the 0.8% September’s number. Further, excluding Autos, sales for the same period expand at the same pace that the headline, 1.7%, higher than the 1% estimated.
The jump in retail sales is the largest in seven months and followed a revised September figure. It is worth noticing that figures are not adjusted for price changes to reflect elevated prices. Receipts at gasoline stations jumped 3.9%, the highest since March, reflecting how people are paying some of the highest prices in seven years.
Some minutes later, US Industrial Production for October followed Retail Sales footsteps, rose by 1.6%, better than the 0.7% expected by economists.
RBA’s Governor Philip Lowe said that recent data would not support a rate hike in 2022
Meanwhile, in the Asian Pacific session, the Reserve Bank of Australia (RBA) revealed its monetary policy minutes. The central bank reinforced its previous posture that the cash rate will stay at its current level until 2024 unless wage growth and inflation targets are met. Further, RBA Governor Philip Lowe said that the last data does not guarantee a rate hike in 2022.
Later on the day, Fedspeakers will cross the wires. Atlanta’s Fed Raphael Bostic and Richmond’s Fed Thomas Barkin will speak at 17:00 GMT. At 20:30 GMT, San Francisco Fed’s Mary Daly would be the last policymaker to hit the wires.
Therefore, AUD/USD traders might expect further downward pressure on the pair. Central bank policy divergence, between the Fed and the RBA, would be the main driver of the price of the pair, but also market sentiment needs to be considered, as a tailwind for the AUD/USD.
- DXY advances further and surpasses 95.80, fresh tops.
- Higher US yields lend extra sustain to the buck on Tuesday.
- US Retail Sales, Industrial Production surprised to the upside.
The US Dollar Index (DXY), which tracks the greenback vs. a bundle of its main rival currencies, advances to fresh tops in levels last seen in late July 2020 in the 95.80/85 band on Tuesday.
US Dollar Index supported by yields, data
The index extends the optimism witnessed at the beginning of the week and motivates the dollar to record fresh tops in the 95.80 region on Tuesday.
Further rebound in US yields across the curve lend oxygen to the buck, while auspicious results from the US calendar were also supportive of the strong buying interest in the dollar.
On the latter, Retail Sales expanded at a monthly 1.7% in October, while Industrial Production expanded 1.6% MoM and Capacity Utilization ticked higher to 76.4% during the same period.
Later in the session, Business Inventories, the NAHB Index and TIC Flows are due along with FOMC’s speakers Daly, Harker, Bostic and Barkin.
US Dollar Index relevant levels
Now, the index is gaining 0.17% at 95.69 and a break above 95.82 (2021 high Nov.16) would open the door to 96 (round level) and then 97.80 (high Jun.30 2020). On the flip side, the next down barrier emerges at 93.87 (weekly low November 9) seconded by 93.69 (55-day SMA) and finally 93.27 (monthly low October 28).
- After a spike higher, gold spikes to the downside and then rebounds to $1865.
- Volatile session for metals as the US dollar strengthens.
- US economic data surpass expectations, stocks and yields rise.
Gold prices dropped almost $20 from the peak during the last sixty minutes as volatility soars. XAU/USD hit a fresh five month high at $1877 and then turned to the downside following US economic data. Recently it bottomed at $1858, before rising to $1865. Silver is also affected by volatility. XAG/USD reversed sharply after reaching $25.41 and fell under $25.00.
USD gains on data, metals sideways
US data surpassed expectations with both reports: retail sales and industrial production. The numbers boosted the greenback and also US yields. The 10-year yields climbed to 1.63% a fresh high, and then pulled back. The DXY printed fresh monthly highs above 95.70 and is gaining 0.20%.
Gold was trading higher for the day, at five-month highs and then dropped sharply. The upside bias weakened during the last hour and price is testing levels below a key short-term uptrend line. A consolidation below $1855 should point to a correction. The next relevant support stands at $1840.
On the upside, if XAU/USD manages to rise back and hold above $1870, it would keep the doors open to more gains, targeting the next resistance zone around $1890.
Technical levels
EUR/USD records fresh 2021 lows and test 1.1330, weighed by spreads and relative fundamentals. Economists at Scotiabank expect the pair to continue its move downward to the 1.1300 level.
Near-term drivers for the euro remain negative
“Widening Bunds-UST differentials remain a firm downward force on the euro. The spread between US and German debt in the 10-yearr space has risen to its largest since April as markets adjust for the Fed’s tapering and eventual hikes.”
“Near-term drivers for the euro remain negative as the continent battles a surge in COVID-19 cases, elevated energy prices, and supply shortages limiting industrial output.”
With a relatively bare domestic calendar and no change in tone expected from scheduled European Central Bank speakers to change the outlook on the EUR/USD, we expect further losses ahead, toward 1.13, in the coming days.”
The British pound is outperforming as strong jobs data refocuses attention on hikes rates from the Bank of England (BoE). Economists at Scotiabank expect the GBP/USD pair to stage a recovery towards the 1.36 level.
BoE set to hike rates in December
“Payroll data for October showed a 160K increase in employment – following the September end of the furlough programme – and vacancies rose to a new record high. It is the jobs picture that prevented the BoE from hiking rates at its November meeting so today’s solid print increases the possibility that the Bank hikes in December – although markets may go into the meeting with more caution.”
“Wednesday’s CPI release will act to pressure the bank into action next month and we think the GBP has a solid path to recovery toward the 1.36 level, at least, in the coming weeks.”
- EUR/USD loses further momentum and tests 1.1330.
- Flash EMU Q3 GDP came at 2.2% QoQ, 3.7% YoY.
- US headline Retail Sales surprised to the upside in October.
EUR/USD remains mired well into the negative territory and records fresh 2021 lows in the boundaries of 1.1330 on Tuesday.
EUR/USD risks further downside
The earlier bullish attempt in EUR/USD ran out of steam past the 1.1380 level, and it was all the way down since then. Indeed, the bid bias in the buck remains well and sound and now pushes the US Dollar Index (DXY) to fresh cycle tops near 95.80 on the back of the continuation of the rebound in US yields.
Sustaining further the momentum surrounding the dollar, US headline Retail Sales surprised to the upside in October after expanded at a monthly 1.7%, while Core sales also rose above estimates 1.7%. Further data for October saw the Industrial Production expanding 1.6% and Capacity Utilization rising 76.4%.
Next on the docket will be the speech by ECB's Lagarde and US Business Inventories, the NAHB Index and TIC Flows.
EUR/USD levels to watch
So far, spot is down 0.31% at 1.1332 and faces the next up barrier at 1.1498 (10-day SMA) followed by 1.1556 (20-day SMA) and finally 1.1609 (weekly high Nov.9). On the other hand, a break below 1.1329 (2021 low Nov.16) would target 1.1185 (monthly low Jul.1 2020) en route to 1.1168 (low Jun.19 2020).
US Industrial Production rose by 1.6% MoM in October, according to data published by the US Federal Reserve on Tuesday. That was above expectations for a 0.7% MoM rise in production and fully unwound the 1.3% drop seen in production levels in September. "About half of the gain in October reflected a recovery from the effects of Hurricane Ida" said the Federal Reserve.
"In October, capacity utilization for the industrial sector increased 1.2 percentage points to 76.4 percent" noted the Fed, before caveating that "it was still 3.2 percentage points below its long-run (1972–2020) average".
Market Reaction
The US dollar has been picking up in recent trade following strong US retail sales data and hawkish remarks from FOMC member and 2022 voter James Bullard. FX markets have broadly ignored the latest Industrial Production figures, though the report does strengthen the case for the dollar to strengthen further on Tuesday. EUR/USD has recently slumped to year-to-date lows in the 1.1330s.
Economists at TD Securities expect the Polish central bank to be hawkish and hence continue to be relative bullish on the zloty. They forecast the EUR/PLN at 4.40 by end-2022.
Ongoing spat with the EU may cause PLN weakness
“We see EUR/PLN moving lower in 2022, reaching 4.40 by year-end, before converging back to the pre-pandemic level of 4.30 in 2023.”
“The ongoing spat with the EU may cause PLN weakness, but over the long-term, we see PLN well-supported by continued strong growth and a more hawkish NBP.”
Speaking to Econostream Media, ECB Governing Council member and head of the National Bank of Belgium Pierre Wunsch said that the global macroeconomic environment had changed significantly over the last three months, thus increasing the uncertainty faced by ECB policymakers. It wouldn't take much in terms of exogenous developments to push Eurozone consumer price inflation to 2.0%, he added. "All of us need to be patient, but we shouldn't exclude that the inflationary forces are quite strong and at some point will require a reaction", he told Econostream Media.
Market Reaction
EUR/USD has been seeing downside in recent trade as a result of recent strong US retail sales data and hawkish Fed commentary, which has pushed US yields higher. The pair has slipped below earlier session lows just above 1.1350 and is now in the 1.1330s. Needless to say, these are fresh year-to-date lows.
The latest remarks from hawkish ECB member Wunsch thus appear to have been roundly ignored. Hawks on the ECB typically make up a minority who are unable to affect the board direction of policy.
Gold has shot to the highest level since June. In the view of economists at TD Securities, XAU/USD is set to extend its breakout north of the $1,870 range.
ETF holdings of gold continue to draw but at a slow clip
“Trend followers could extend gold's breakout north of the $1,870 range.”
“Considering that Shanghai gold traders' aggregate net length remains near multi-year lows, it is possible that this pipeline could bring a significant amount of buying interest back to the yellow metal.”
“ETF holdings of gold continue to draw but at a slow clip, as participants expect that central banks will be forced to raise rates in the face of persistently high inflation.”
“TD Securities' forecast of slowing growth and inflation next year suggests that market pricing remains far too hawkish, but gold prices have managed to breakout nonetheless as global markets scour for inflation-hedges.”
See – Gold Price Forecast: XAU/USD to face initial hurdle at $1,917/22 on its way to August 2020 peak at $2,072 – Commerzbank
- Gold caught fresh bids on Tuesday and shot to the highest level since June.
- Rising price pressures benefitted the metal’s appeal as a hedge against inflation.
- The USD stood tall near 16-month tops on upbeat US data and capped gains.
Gold regained positive traction on Tuesday and shot to the highest level in more than five months, around the $1,877 region during the early North American session. Persistent concerns about rising consumer prices turned out to be a key factor that continued benefitting the metal's appeal as a hedge against inflation. This, along with retreating US Treasury bond yields, pushed the non-yielding yellow metal to the highest level since June 11.
Meanwhile, worries about the continuous surge in inflationary pressures weighed on investors' sentiment. This was evident from the prevalent cautious mood around the equity markets, which further extended some support to the safe-haven XAU/USD. The combination of factors helped offset a strong bullish sentiment surrounding the US dollar, which tends to undermine demand for dollar-denominated commodities, including gold.
The USD stood tall near 16-month tops amid expectations that the Fed would be forced to adopt a more aggressive policy response to contain stubbornly high inflation. In fact, the markets are now pricing in the possibility for an eventual Fed rate hike move by July 2022 and the Fed funds futures indicate a high likelihood of another raise by November. This might hold back bulls from placing fresh bets and cap the upside for gold.
On the economic data front, the US monthly Retail Sales surpassed consensus estimates and recorded a strong growth of 1.7% in October. Excluding autos, core retail sales also climbed by 1.7% in October as against market expectations for a rise of 1%. The data reinforced hawkish Fed expectations and remained supportive of the bid tone surrounding the greenback, which, in turn, led to a slight pullback in gold prices.
Technical outlook
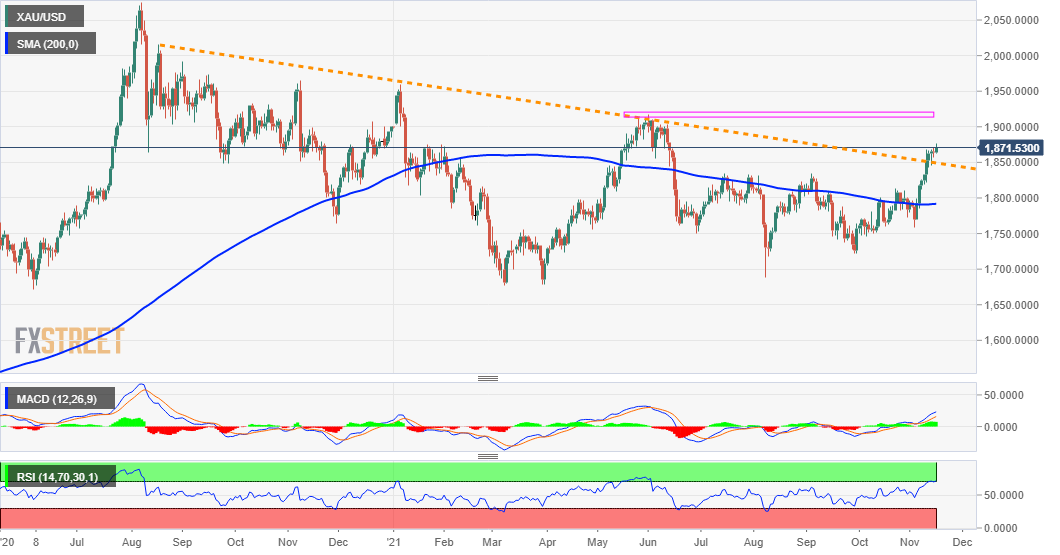
From a technical perspective, the XAU/USD bulls might now be looking to extend the recent upward trajectory further beyond a descending trend-line extending from August 2020. That said, RSI (14) on the daily chart is already flashing slightly overbought conditions and warrants some caution. This makes it prudent to wait for some near-term consolidation or a modest decline before positioning for the next leg up.
Meanwhile, any subsequent positive move should allow gold to reclaim the $1,900 mark for the first time since June. The momentum could further get extended towards the next relevant hurdle near the $1,910-12 supply zone.
On the flip side, the overnight swing lows, around the $1,856 area now seems to protect the immediate downside. This is followed by support near the $1,850 level and the $1,845 region, below which gold could slide back to test the $1,834-32 strong resistance breakpoint. The downfall, however, might still be seen as a buying opportunity and remain limited.
Levels to watch
Speaking in an interview on Bloomberg TV, St Louis Fed President and 2022 voting FOMC member James Bullard said that Core PCE is "quite high" and that the Fed should turn more hawkish over the course of the next few policy meetings. He said that if the bank accelerated the pace of their QE taper to $30B per month, this could open the door to a rate hike in Q1 2022 and that he agreed with USD STIR market pricing for two hikes in 2022.
Bullard continued that turning more hawkish now could be advantageous as it could smooth out the normalisation process and result in the Fed having to do less at a later date. Nonetheless, Bullard conceded that rate increases would ultimately be a committee decision and "it is a big committee".
When pressed for his thoughts on the upcoming Fed Chair nomination, Bullard said that whether US President Joe Biden chooses to renominate current Fed Chair Jerome Powell or to nominate Fed Board of Governors member Lael Brainard, there will be a lot of continuity.
- US October Retail Sales data beats expectations, supporting the US dollar.
- Headline and core sales rise 1.7% MoM versus forecasts for 1.2% and 1.0% growth respectively.
US Retail Sales rose by 1.7% MoM in October, according to data published by the US Census Bureau revealed on Tuesday. That was above market expectations for a MoM rise of 1.2% and above the (upwardly revised from 0.7%) 0.8% MoM gain seen in September.
Strength was also seen in the Core measures of October Retail Sales; MoM, core sales also rose by 1.7% in October, above expectations for a 1.0% rise and higher than September's 0.7% MoM rise (which was revised lower from 0.8%). The Retail Control, which is most highly correlated to the consumer spending component in US GDP data, rose 1.6% MoM, well above expectations for a 0.9% rise and above last month's 0.5% MoM reading, which was downwardly revised from 0.8%.
Market Reaction
The US dollar saw a kneejerk pop higher in wake of the latest strong US Retail Sales report. The Dollar Index (DXY) popped up from the low 95.50s to test session highs above 95.60, though much of this kneejerk reaction has now been reversed. Ahead, FX market participants will be keeping an eye on US October Industrial Production figures at 1415GMT and then a heavy slate of Fed speakers throughout the remainder of the session.
GBP/USD is correcting higher. However, economists at Credit Suisse maintain their core bearish outlook for 1.3277, then 1.3189/35.
Resistance is seen at 1.3556/69
“GBP/USD is recovering, however, the recent break below support from its 1.3411 September low, the fact that the market remains below falling 13-day , 55-day and 200-day moving averages, the existing large top and bearish continuation pattern, as well as the poor momentum, all support our core bearish outlook.”
“Support is seen initially at 1.3402, then 1.3352/50, below which should reassert the downtrend for support next at 1.3277, ahead of what remains our core objective of 1.3189/35.”
“We continue to expect the 1.3189/35 zone to prove a decent floor and we would look for a fresh consolidation phase to emerge here. A direct break though would further reinforce the negative outlook, with support seen next at 1.3106, ahead of 1.3000 and then 1.2855/29.”
“This morning’s test above resistance at 1.3450 suggests we may see a near-term rebound to 1.3510, but with the 21-day exponential average and price resistance at 1.3556/69 now ideally capping.”
- WTI is consolidating above $81.00 ahead of US data and private US inventory numbers.
- The tone of OPEC+ officials is becoming increasingly concerned regarding the oil market’s demand/supply balance in 2022.
Despite a pick up in oil-complex relater newsflow on Tuesday, oil prices have seen broadly consolidative trade since the entrance of European market participants and ahead of the US open. WTI front-month futures contracts rose back above $81.00 per barrel at the start of the Asia Pacific session and have since been consolidating to the north of this level. At present, WTI is trading in the $81.30s with modest on-the-day gains of about 50 cents or just over 0.5%. Broader market sentiment can be described as upbeat (European equities are up across the board after a solid Asia session handover) in wake of the positive tone of Tuesday’s talks between US President Joe Biden and China President Xi Jinping. This is likely helping to keep risk-sensitive crude oil markets underpinned for now.
In terms of the crude oil-specific newflow so far on Tuesday; the International Energy Agency (IEA) released its monthly oil market report and left its estimates for global oil demand growth in 2021 and 2022 unchanged. The agency forecast that Brent would average $79.40 in 2022 (about 4.0% below current levels) as a result of higher prices incentivising countries, such as the US to boost oil output. That said, the report said US oil output wasn’t expected to recover to pre-pandemic levels until the end of 2022. On Monday, London-based energy intelligence provider Rystad Energy said it expected US shale to return to its pre-pandemic output levels of 8.68M barrels per day.
The theme of high prices encouraging higher output is not going unnoticed by OPEC+. The Secretary-General of the cartel, Mohammed Barkindo, said on Tuesday that he expected oil markets to enter a surplus (i.e. global supply higher than global demand) by December. This echoed concerns voiced by the UAE oil minister a day earlier that markets could be in a surplus by Q1 2022. Barkindo said that OPEC+ needs to be “careful” going forward. Whilst the Russian oil minister was on the wires on Tuesday saying it remains too soon to predict the outcome of next month’s OPEC+ meeting, signs are growing that the cartel may be inclined to slow the pace of output hikes. This could remove some downside risk for oil prices that result from increasingly bearish 2022 supply forecasts.
In the meantime, commodity analysts note that demand remains strong and markets remain in a deficit. The CEO of Trafigura said on Tuesday that global oil markets “remain very tight” and “heavily backwardated” as demand continues to recover back to its pre-pandemic levels. News also broke on Tuesday that Russian crude grades were selling in Asia markets at their highest premium versus spot prices in over 22 months, supported, according to traders cited by Reuters, by robust demand and firm refining margins. Looking ahead, focus in oil markets is on US macro data (Retail Sales at 1330GMT and Industrial Production at 1415GMT) and weekly private US inventory data at 2130GMT.
- Silver attracted dip-buying on Tuesday and recovered a major part of the overnight losses.
- The set-up remains tilted in favour of bullish and supports prospects for additional gains.
- Dips below the $25.00 mark could still be seen as a buying opportunity and remain limited.
Silver regained positive traction on Tuesday and reversed a major part of the overnight retracement slide from a more than a three-month peak. The white metal built on its steady intraday ascent and climbed to a fresh daily top, around the $25.25 region heading into the North American session.
Looking at the broader picture, the recent strong recovery from YTD lows, around the $21.40 region touched in September, has been along an upward sloping channel. This points to a well-established short-term bullish trend and supports prospects for an extension of the appreciating move.
Apart from this, last week's sustained breakout through 100-day SMA/38.2% Fibo. confluence barrier, the $24.50 supply zone adds credence to the positive outlook. Moreover, acceptance above the 50% Fibo. level, around the key $25.00 psychological mark reaffirms the constructive set-up for the XAG/USD.
With oscillators on the daily chart holding in the bullish territory and still far from being in the overbought zone, a subsequent move towards the $25.55-60 region, en-route the $26.00 mark, remains a distinct possibility. The latter coincides with the 61.8% Fibo. and should act as a strong barrier.
On the flip side, any meaningful corrective pullback might continue to attract some dip-buying near the $25.00 mark. This, in turn, should help limit the downside near the $24.50 resistance breakpoint. Failure to defend the mentioned support could drag the XAG/USD towards the $24.00 round-figure mark.
Silver daily chart
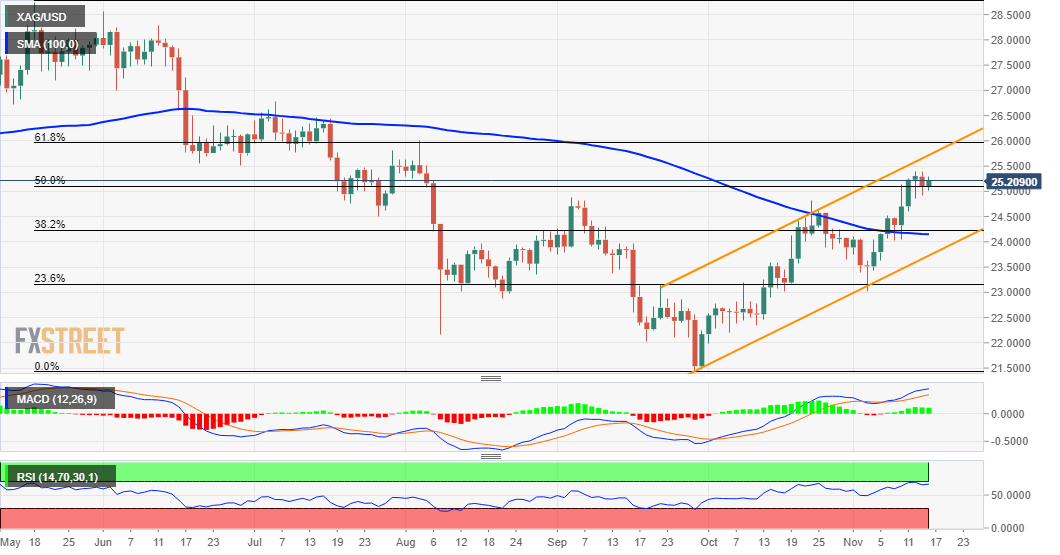
Technical levels to watch
- EUR/USD navigates the area of 2021 lows near 1.1360.
- A drop below 1.1350 opens the door to a deeper pullback.
EUR/USD remains under heavy pressure and keeps navigating the area of the recent YTD low near 1.1350.
The continuation of the downtrend appears favoured in the short-term horizon. That said, the 2008-2021 line emerges as a critical support around 1.1350. A break below this area in a convincing fashion exposes a retracement to, initially, July 2020 low at 1.1185 ahead of 1.11688 (low June 19 2020).
In the meantime, extra losses remain on the cards as long as the pair trades below the immediate resistance line (off September’s high) today near 1.1620. In the longer run, the negative outlook persists while below the 200-day SMA, today at 1.1869.
EUR/USD daily chart
US Monthly Retail Sales Overview
Tuesday's US economic docket highlights the release of monthly retail sales figures for October, scheduled later during the early North American session at 13:30 GMT. The headline sales are forecast to rise 1.2% during the reported month as against 0.7% growth recorded in September. Excluding autos, core retail sales probably climbed by 1% in October.
Meanwhile, analysts at ING sounded more optimistic and offered their view on the upcoming release: “Retail sales will be lifted by 1.5% MoM thanks to the 6% MoM increase in new vehicle units sold – the first increase since April – while gasoline station sales will be boosted by the surge in gasoline prices. Elsewhere, rising household income and wealth should mean decent gains although we continue to expect a rebalancing trend away from the purchase of physical things that show up in retail sales, towards services, which are picked up in broader consumer spending.”
How Could it Affect EUR/USD?
Ahead of the key consumer spending data, the US dollar continued drawing support from the prospects for an early policy tightening by the Fed and dragged the EUR/USD pair to fresh 16-month tops. A stronger print will reaffirm hawkish Fed expectations and further fuel the USD bullish run.
Conversely, a softer reading will validate weaker consumer sentiment and force investors to scale back their bets for an eventual Fed rate hike move by July 2022. This would be enough to prompt some USD profit-taking and trigger an aggressive short-covering around the EUR/USD pair.
Meanwhile, Eren Sengezer, Editor at FXStreet, offered a brief technical outlook for the EUR/USD pair: “On the four-hour chart, the Relative Strength Index (RSI) indicator is holding below 30, showing oversold conditions. However, we have seen EUR/USD struggling to gain traction when the RSI fell below 30 last week and the upcoming technical correction might not be significant enough to attract buyers.”
Eren also provided some important technical levels to trade the major: “On the downside, initial support aligns at 1.1360 (static level). A daily close below that level could open the door for additional losses toward 1.1300 (psychological level). In the meantime, EUR/USD continues to trade in a one-week-old descending regression channel and the upper limit of that channel at 1.1400 forms the first technical resistance ahead of 1.1440 (static level) and 1.1470 (static level).”
Key Notes
• US Retail Sales October Preview: Inflation Is the key, not consumption
• US Retail Sales Preview: Forecasts from six major banks, hot gains for retailers
• EUR/USD Forecast: Euro's recovery attempts to remain short-lived
About US Retail Sales
The Retail Sales released by the US Census Bureau measures the total receipts of retail stores. Monthly per cent changes reflect the rate of changes in such sales. Changes in Retail Sales are widely followed as an indicator of consumer spending. Generally speaking, a high reading is seen as positive (or bullish) for the USD, while a low reading is seen as negative (or bearish).
- DXY adds to Monday’s advance and clinches new tops.
- Next on the upside comes the 95.70 area.
DXY manages to advance further and records new cycle highs past 95.60 on turnaround Tuesday.
If the buying interest picks up extra impulse, then the index is predicted to test the June 2020 low at 95.71. If cleared, then the focus of attention is seen gyrating to 97.80 (high June 30 2020).
Looking at the broader picture, the constructive stance on the index is seen intact above the 200-day SMA at 92.18.
DXY daily chart
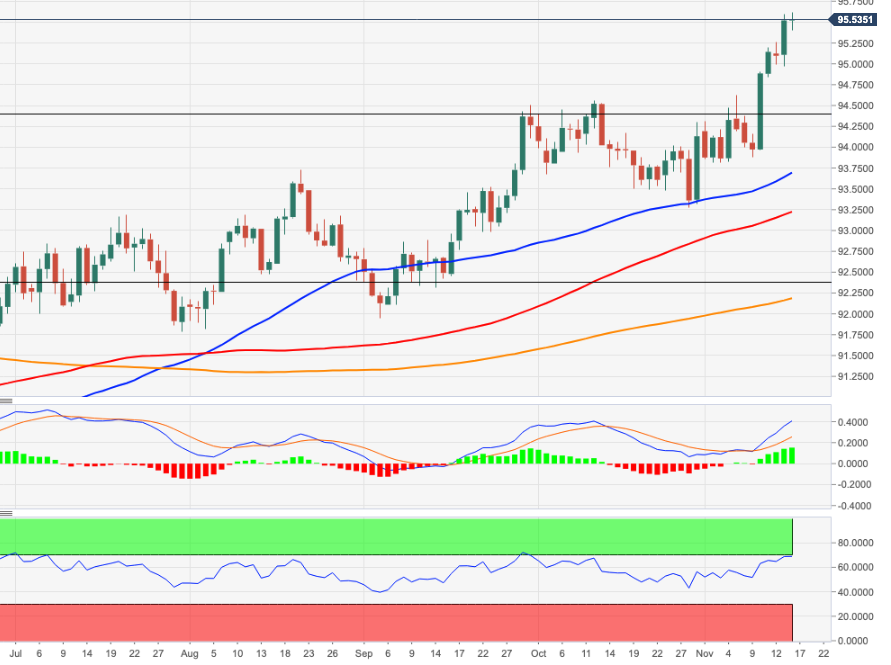
- USD/CAD reversed an early dip to sub-1.2500 levels amid renewed USD buying interest.
- Hawkish Fed expectations, the cautious market mood underpinned the safe-haven USD.
- Bulls largely shrugged off an uptick in crude oil prices, which tend to benefit the loonie.
- The market focus remains on Tuesday’s release of the US monthly Retail Sales figures.
The USD/CAD pair edged higher through the mid-European session and touched an intraday high level of 1.2535 in the last hour.
The pair showed some resilience below the key 1.2500 psychological mark and attracted some dip-buying on Tuesday, snapping two successive days of the losing streak. The uptick was exclusively sponsored by the prevalent strong bullish sentiment surrounding the US dollar, which remained well supported by the prospects for an early policy tightening by the Fed.
The markets have been pricing in the possibility for an eventual rate hike move by July 2022 and the Fed funds futures indicate a high likelihood of another raise by November amid rising inflationary pressures. It is worth recalling that data released last Wednesday showed that the US consumer prices in October rose at the fastest pace since 1990.
Meanwhile, worries about a faster-than-expected rise in inflation continued weighing on investors' sentiment. This was evident from the cautious mood around the equity markets, which further underpinned the greenback's relative safe-haven status. That said, retreating US Treasury bond yields might hold back the USD bulls from placing fresh bets.
Apart from this, an uptick in crude oil prices could lend some support to the commodity-linked loonie and cap any further gains for the USD/CAD pair. Investors also seemed reluctant and preferred to wait on the sidelines ahead of Tuesday's release of the US monthly jobs report, warranting some caution before positioning for any further gains.
The data, along with the US bond yields and speeches by a slew of FOMC members, will influence the USD and provide a fresh impetus during the early North American session. Traders will further take cues from oil price dynamics to grab some short-term opportunities around the USD/CAD pair.
Technical levels to watch
- The march north in USD/TRY appears out of control.
- The lira depreciates to record levels vs. the US dollar.
- The CBRT could cut rates further on Thursday.
Another day, another all-time high in USD/TRY, this time approaching the 10.2500 level on Tuesday.
USD/TRY in record levels, looks to CBRT
The depreciation of the Turkish currency knows no limits so far and lifts USD/TRY to new all-time tops near 10.25 on Tuesday, extending at the same time the positive streak for the sixth session.
The fragile sentiment around the lira keeps weighing on spot, which is also underpinned by the solid performance of the greenback across the board.
On the domestic front, Treasury and Finance Minister L.Elvan said earlier on Tuesday that the country was not “at the level we desire” when it comes to inflation. It is worth recalling that consumer prices rose 19.89% in October vs. the same month of 2020 and that the Turkish central bank (CBRT) raised the year-end inflation to 18.4% (from 14.1%).
The CBRT meets on Thursday and it could once again reduce the One-Week Repo Rate according to markets’ consensus, as it did in the last two monetary policy meetings.
In the Turkish cash markers, yields of the 10y bond gyrate around 18.60% on Tuesday, extending the corrective from recent tops.
USD/TRY key levels
So far, the pair is gaining 1.80% at 10.2381 and a drop below 9.8395 (high Oct.25) would expose 9.6755 (20-day SMA) and finally 9.4722 (monthly low Nov.2). On the other hand, the next up barrier lines up at 10.2505 (all-time high Nov.16) followed by 11.0000 (round level).
Economists at Société Générale expect the EUR/USD to temporarily depreciate towards 1.12 over the next year. However, the world’s most pupular currency pair is set to stage a rebound in the medium-term.
Yields to rise but to remain subdued
“Bund yields should increase, printing in positive territory next year, mostly due the recovery, higher inflation and ECB tapering.”
“The normalisation of US rates will impact European rates too. We target 0.2% for 4Q22, which is still a subdued level.”
“The EUR remains largely undervalued compared with the USD (GDP PPP at 1.41).”
“Medium-term, we expect the EUR/USD to appreciate. But we see it depreciating from 1.15 to 1.12 next year, due to quicker changes from the Fed.”
- EUR/JPY remains under heavy pressure and breaches 130.00.
- Further retracement targets the Fibo level near 129.40.
EUR/JPY’s decline appears to have met some contention near 129.60, or fresh 5-week lows on Tuesday.
A deeper pullback below 129.60 looks likely in the very near term and could force the cross to visit the next Fibo level (of the October rally) at 129.43. Below this level there are no significant stops until October’s low at 128.33 (October 6).
Below the 200-day SMA, today at 130.48, the outlook for EUR/JPY is seen as negative.
EUR/JPY daily chart
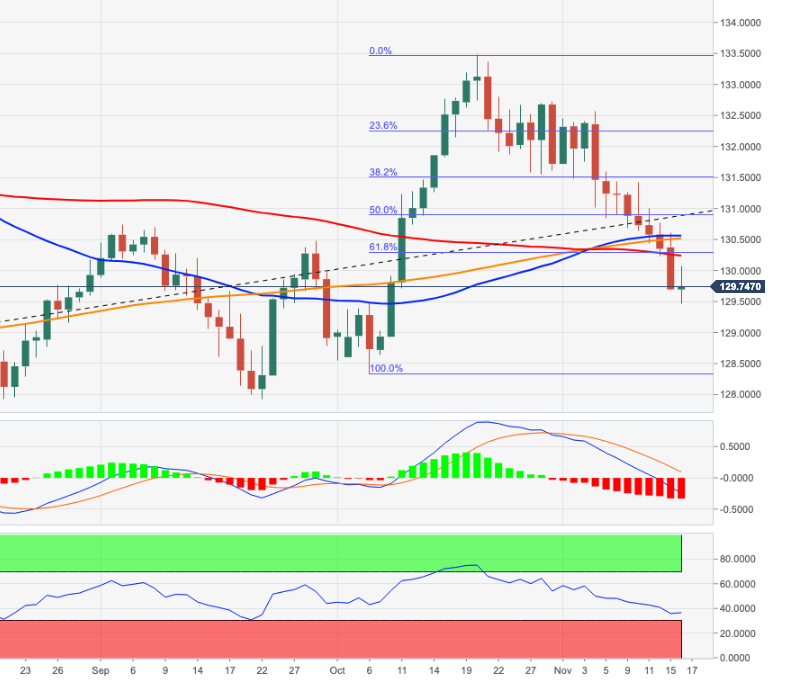
Mexican peso holds a negative bias versus the US dollar. Economists at Société Générale expect the USD/MXN to march forward to the 21.70 level by end-2022.
Long-term bond yields to rise to 8.6% by end-2022
“A big question about Pemex’s debt burden also remains unresolved, which may have a big impact on both the bond and FX markets in the coming quarters.”
“The MXN will likely face weakening pressure somewhat in line with other EM currencies. However, domestic politics and energy sector policies, trade dynamics and the relative policy stance of Banxico (vis-à-vis the Fed) will all have a significant impact on the peso’s near-term trajectory.”
“We expect MXN to weaken to 21.70 against the USD and long-term bond yields to rise to 8.6% by end-2022.”
“Additional pressure on currency and bond yields is likely through 2023.”
- GBP/USD got a strong boost following the release of the UK monthly jobs report.
- The positive momentum stalled near descending trend-line/200-hour SMA hurdle.
- Sustained USD buying interest acted as a headwind for the pair amid Brexit woes.
The GBP/USD pair shot to four-day highs in reaction to upbeat UK employment details, albeit retreated a few pips thereafter. The pair was last seen trading around mid-1.3400s, still up over 0.30% for the day.
The latest UK jobs report supported the case for an immediate 15bps rate hike by the Bank of England in December and provided lifted the British pound. That said, sustained US dollar buying capped gains for the GBP/USD pair amid worries that Britain will trigger Article 16 and suspend parts of the Northern Ireland Protocol.
From a technical perspective, the intraday positive move stalled just ahead of a confluence hurdle, comprising of 200-hour SMA and a downward sloping trend-line. The mentioned barrier, currently around the 1.3775-80 region, should act as a key pivotal point and determine the next leg of a directional move for the GBP/USD pair.
Meanwhile, technical indicators on hourly charts have been gaining strong positive traction but are still holding deep in the bearish territory on the daily chart. This, in turn, warrants some caution and makes it prudent to wait for a sustained break through the confluence resistance before positioning for any further appreciating move.
The GBP/USD pair might then aim to surpass the key 1.3500 psychological mark and accelerate the momentum further towards the next relevant resistance near the 1.3560-65 supply zone. Some follow-through buying should allow bulls to make a fresh attempt to conquer the 1.3600 round-figure mark.
On the flip side, any meaningful pullback might continue to find decent support near the 1.3400 mark, which if broken would expose YTD lows, around the 1.3355-50 region touched last Friday. This would be seen as a fresh trigger for bearish traders and turn the GBP/USD pair vulnerable to resume over two-weeks-old downward trajectory.
GBP/USD 1-hour chart
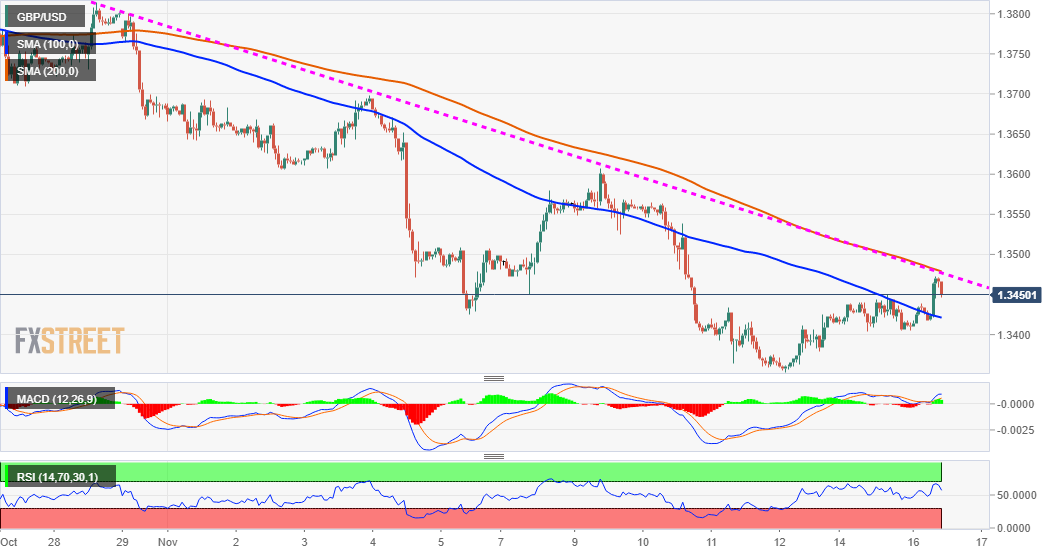
Technical levels to watch
Gold has breached the 2020-2021 downtrend. Karen Jones, Team Head FICC Technical Analysis Research at Commerzbank, expects the yellow metal to challenge the $1,917/22 area.
Dips lower to find initial support at $1,834
“The close above $1,835 has targeted $1,917/22, the May 2021 peak and 61.8% retracement. This will act as the break up point to the $1,965 November 2020 peak and the 78.6% retracement at $1,989. This is the last defence for the August 2020 peak at $2,072.”
“Dips lower should find initial support at $1,834 and is likely to be contained by the 200-day ma at $1,791.”
A complicated fiscal outlook for an election year has put pressure on the real and the Brazilian bond yields despite improvement in fiscal/debt numbers this year. Economists at Société Générale expect the USD/BRL to rise towards 6.40 by end-2022.
Politics/financial conditions to outweigh impact of strong commodity prices
“The pressure on currency and yields is likely to continue with political and global factors (prospect of a tightening by the US Fed) both easily outweighing any possible supportive impact from improved commodity prices.”
“We expect the BRL to depreciate to 6.40 by end-2022 against the USD and expect 10-year yields to rise to 13.5%.”
- GBP/JPY gained traction for the third successive day and shot to over one-week highs.
- Upbeat UK employment details assured a BoE rate hike move and remained supportive.
- The cautious mood underpinned the safe-haven JPY and capped gains amid Brexit woes.
The GBP/JPY cross held on to its strong gains through the first half of the European session, albeit has retreated a few pips from the one-and-half-week top touched earlier this Tuesday.
The cross built on last week's recovery move from over one-month lows and gained some follow-through traction for the third successive day amid a strong pickup in demand for the British pound. The overnight hawkish comments by the Bank of England (BOE) Governor Andrew Bailey was seen as a key factor that acted as a tailwind for the sterling and the GBP/JPY cross.
Speaking before the UK Parliament Treasury Select Committee, Bailey said that he was very uneasy about the inflation outlook and that all future policy meetings are now in play for a rate rise. The intraday buying interest picked up pace after the latest UK jobs report showed that the unemployment rate declined more than expected, to 4.3% in September from 4.5% in August.
The number of payrolled employees rose by 160,000 in September and October, suggesting that the end of the government’s furlough scheme did not lead to a deterioration in the labour market. The data supported the case for an immediate 15bps rate hike in December by the Bank of England, which, in turn, was seen as a key factor that provided a strong lift to the GBP/JPY cross.
Meanwhile, worries about a faster than anticipated rise in inflationary pressures continued weighing on investors' sentiment. This was evident from the prevalent cautious mood around the equity markets, which benefitted the Japanese yens' relative safe-haven status. Apart from this, the impasse over the Northern Ireland Protocol capped gains for the GBP/JPY cross, at least for the time being.
Technical levels to watch
- Euro area GDP grew by 3.7% in the third quarter as expected.
- EUR/USD stays under modest bearish pressure, trades near 2021 lows.
The data published by Eurostat showed on Tuesday that seasonally adjusted Gross Domestic Product increased by 2.2% in the euro area and by 2.1% in the EU on a quarterly basis in the third quarter.
On a yearly basis, the euro area economy expanded by 3.7% in the same period, matching the flash estimate and the market expectation.
Further details of the publication revealed that employment increased by 2.0% in the euro area and by 2.1% in the EU in the third quarter of 2021.
Market reaction
The EUR/USD pair remains on the back foot after this report and was last seen losing 0.06% on the day at 1.1360.
OPEC Secretary General Mohammad Barkindo said on Tuesday that they have an interest to ensure that the global economic recovery continues, as reported by Reuters.
"The oil supply surplus is already beginning in December," Barkindo added and noted that they expect the oil market to be oversupplied next year.
Market reaction
Crude oil prices showed no immediate reaction to these comments. As of writing, the barrel of West Texas Intermediate (WTI) was trading at $81.30, rising more than 0.5% on a daily basis.
- AUD/SUD faced rejection near 100-day SMA for the second straight day on Tuesday.
- Dovish RBA, cautious mood acted as a headwind for the perceived riskier aussie.
- Fed rate hike bets continued underpinning the USD and collaborated to cap gains.
The AUD/USD pair remained on the defensive through the early European session and was last seen hovering near the lower end of its daily trading range, around the 0.7335 region.
The pair gained some positive traction during the early part of the trading action on Tuesday, albeit struggled to capitalize on the move and once again faced rejection near the 100-day SMA barrier. Worries about a faster-than-expected rise in inflationary pressures continued weighing on investors' sentiment. This was evident from the cautious mood around the equity markets, which, in turn, acted as a tailwind for the perceived riskier aussie.
Apart from this, the Reserve Bank of Australia's dovish outlook further collaborated to cap the upside for the AUD/USD pair. In the minutes of its November meeting released today, the RBA reiterated that the cash rate will remain at its current level until 2024 or until wage and inflation criteria are met. Adding to this, the RBA Governor Philip Lowe said that the latest data and forecasts do not warrant an increase in the cash rate in 2022.
On the other hand, the US dollar stood tall near the 16-month peak touched in the previous session amid the prospects for an early policy tightening by the Fed. In fact, the markets have been pricing in the possibility for an eventual Fed rate hike move by July 2022 and the Fed funds futures indicate a high likelihood of another raise by November. That said, retreating US Treasury bond yields held the USD bulls from placing aggressive bets.
Investors also preferred to wait on the sidelines ahead of Tuesday's release of the US monthly Retail Sales figures. The combination of factors, in turn, helped limit any meaningful slide for the AUD/USD pair, at least for the time being. The data, along with the US bond yields and speeches by a slew of FOMC members, will influence the USD and provide a fresh impetus to the AUD/USD pair later during the early North American session.
Technical levels to watch
2021 has been another very good year for US equity indices. What has been different in 2021 is the higher volatility under the surface with greater dispersion of returns between individual stocks. In the view of Mike Wilson, Chief Investment Officer and Chief US Equity Strategist for Morgan Stanley, 2022 is poised to be a year which favors single stock investing over a focus on style and sector.
In 2022, stock picking may lead
“With financial conditions now tightening and earnings growth slowing, the 12-month risk/reward for the broad indices looks unattractive at current prices. More specifically, we expect solid earnings growth again in 2022 offset by lower valuations. However, strong nominal GDP growth should continue to provide plenty of good investment opportunities at the stock level.”
“We will have to deal with the excesses created by the extreme nature of this recession and recovery. That breeds higher uncertainty and dispersion, making stock picking more important than ever in the year ahead.”
“We do have a slight bias for value over growth for the rest of the year as interest rates move higher, but this is more of a trading position rather than an aggressive investment view we had coming out of the recession in 2020. Expect our bias to flip flop in 2022 like this year, as macro uncertainty reigns.”
The International Energy Agency (IEA) said on Tuesday that it left its forecast for oil demand growth largely unchanged at 5.5 million barrels per day (bpd) for 2021 and 3.4 million bpd in 2022, as reported by Reuters.
Additional takeaways
"US oil production will not return to pre-covid rates until the end of 2022."
"Current oil prices provide strong incentive to boost US oil activity even as operators stick to capital discipline."
"US set to account for 60% of 2022 non-OPEC+ oil supply gains, now forecast at 1.9 million bpd."
"Reprieve from oil price rally could be on the horizon due to rising supplies."
"Oil refinery activity picking up after autumn maintenance, demand set to strengthen on eased lockdowns."
"IEA predicts a further global oil production rise of 1.5 mln bpd over November and December."
Market reaction
Crude oil prices largely ignored this report and the barrel of West Texas Intermediate was last seen rising 0.4% on the day at $81.24.
GBP/USD stays on recovery trail. Nevertheless, economists at Société Générale do not see any meaningful upside for the pair as expect the cable to turn back lower towards 1.33.
Bounce limited
“GBP/USD has staged an initial rebound from 1.3350, however, as long as daily Kijun line at 1.3600 is not crossed, the down move could persist.”
“The pair could drift towards projections of 1.3300/1.3250 and 1.3135.”
The pound has strengthened this morning following the release of the latest UK employment report. Strong employment data boosts the case for the Bank of England (BoE) to hike rates in December, however, economists at MUFG Bank expect the GBP to slow its gains as market expectations are too high.
UK labour market gives green light for gradual BoE hikes
“The stronger pound has been encouraged both by hawkish comments from BoE officials yesterday and reassuring evidence this morning that the UK labour market has held up well after the jobs furlough scheme ended in September.”
“The developments support our view that the BoE should have enough further clarity on labour market developments by the December MPC meeting when we expect the first rate hike (15bps) to be delivered. Current plans for only gradual tightening would suggest that market expectations for another follow-up hike as soon as February would likely be too soon though.”
“A more gradual pace of tightening should help to dampen upside risks for the pound which has failed to benefit from rising nominal yields in recent months as real yields have continued to fall.”
- USD/CHF gained some follow-through traction on Tuesday and shot to multi-week highs.
- Hawkish Fed expectations continued underpinning the USD and remained supportive.
- Sliding US bond yields, the cautious mood might cap gains ahead of the US Retail Sales.
The USD/CHF pair reversed an intraday dip to the 0.9235 region and shot to over four-week highs during the early European session, though lacked follow-through.
The pair attracted some dip-buying on Tuesday and is now looking to build on last week's hotter-than-expected US CPI-inspired rally from the 0.9100 round-figure mark. The uptick was exclusively sponsored by the underlying bullish sentiment surrounding the US dollar, bolstered by the prospects for an early policy tightening by the Fed.
The USD stood tall near 16-month tops amid growing market acceptance that the US central bank would be forced to adopt a more aggressive policy response to contain stubbornly high inflation. It is worth recalling that data released last Wednesday showed that the US consumer prices in October rose at the fastest pace since 1990.
In fact, the markets have been pricing in the possibility for an eventual Fed rate hike move by July 2022 and the Fed funds futures indicate a high likelihood of another raise by November. That said, retreating US Treasury bond yields held the USD bulls from placing fresh bets and kept a lid on any further gains for the USD/CHF pair.
Meanwhile, the cautious market mood – as depicted by a generally softer tone around the equity markets – extended some support to the safe-haven Swiss franc. This was seen as another factor that further collaborated to cap the upside for the USD/CHF pair. Investors also preferred to wait on the sidelines ahead of the US Retail Sales figures.
The key US macro data is scheduled for release later during the early North American session. This, along with the US bond yields and speeches by a slew of FOMC members, might influence the USD price dynamics. Traders will further take cues from the broader market risk sentiment to grab some short-term opportunities around the USD/CHF pair.
Technical levels to watch
- EUR/USD bounces off recent lows near 1.350 on Tuesday.
- Flash EMU Q3 GDP next of note in the euro calendar.
- US Retail Sales grabs all the attention later in the NA session.
The single currency attempts a mild rebound vs. its American peer and manages to lift EUR/USD to the 1.1380/85 band on turnaround Tuesday.
EUR/USD looks to data here and there
EUR/USD regains the smile and advances marginally following four consecutive daily pullbacks on Tuesday. Indeed, spot shed far more than 2 cents since the monthly tops around 1.1616 (November 4) to Monday’s new 2021 lows near 1.1350.
The sharp selloff witnessed at the beginning of the week followed the resumption of the strength in the dollar along with dovish comments from ECB’s C.Lagarde, who suggested that tightening the monetary conditions now would no more harm than good.
The move higher in the buck came in tandem with the recovery in US yields as well as tireless concerns surrounding the elevated inflation. In Europe, yields of the key 10y German Bund add to Monday’s advance and approach the -0.22% level.
In the docket, another revision of Q3 GDP figures in the broader euro area is due next ahead of another interview to Chairwoman Lagarde.
Across the pond, October’s Retail Sales will be in the limelight seconded by Industrial Production and speeches from FOMC’s Bostic, Harker, Daly and Barkin.
What to look for around EUR
EUR/USD recorded new lows near 1.1350 on Monday amidst the persistent deterioration in the pair. As usual, the pair’s price action is predicted to mainly track the dynamics around the dollar, while bouts of intermittent strength expected to come from the improvement in the risk complex. On the more macro view, the loss of momentum in the economic recovery in the region - as per some weakness observed in key fundamentals – coupled with rising cases of COVID-19 is also seen pouring cold water over investors’ optimism. Further out, the euro should remain under scrutiny amidst the implicit debate between investors’ speculations of a probable lift-off sooner than anticipated and the ECB’s so far steady hand, all amidst the tenacious elevated inflation in the bloc and increasing conviction that it could last longer than previously anticipated.
Key events in the euro area this week: EMU Flash Q3 GDP, ECB Lagarde (Tuesday) – EMU Final CPI, ECB Lagarde (Wednesday) – ECB Lagarde (Friday).
Eminent issues on the back boiler: Asymmetric economic recovery post-pandemic in the region. Sustainability of the pick-up in inflation figures. Pick-up in the political effervescence around the EU Recovery Fund in light of the rising conflict between the EU, Poland and Hungary on the rule of law. ECB tapering speculations.
EUR/USD levels to watch
So far, spot is up 0.05% at 1.1373 and faces the next up barrier at 1.1558 (20-day SMA) followed by 1.1609 (weekly high November 9) and finally 1.1616 (monthly high Nov.4). On the other hand, a break below 1.1356 (2021 low Nov.15) would target 1.1185 (monthly low Jul.1 2020) en route to 1.1168 (low Jun.19 2020).
USD/CAD advanced strongly last week to reach the 1.26 area before turning lower Friday. Economists at Scotiabank expect the pair to move downward over the next few months to the 1.2100/50 region.
Firm short-term support seen at 1.2475/85
“Trend signals are mixed across various timeframes which rather suggests choppy range trade will persist, albeit with a downward bias from here.”
“We look for support around 1.2500 in the short run while firmer support lies just below this point at 1.2475/85 (minor high/low and the 200-day MA).”
“More broadly, we think the USD’s rebound equates to an effective retest (and failure against) October’s bearish USD breakdown. This keeps the broader technical focus on a push towards 1.2100/50 in the next few months.”
EUR/GBP is easing back again from the 200-day moving average (DMA) at 0.8590. Attention will revert to the 0.8300/0.8720 zone on a break below the 0.8400 level, according to economists at Société Générale.
EUR/GBP return to 0.8400?
“EUR/GBP failed to reclaim its 200-DMA near 0.8590 leading to regain of downward momentum. Next potential supports are located at 0.8450 and recent low of 0.8400 which is also the lower band of a multi-month channel. It would be interesting to see if the pair can carve out a higher trough.”
“Should the pair violate 0.8400, the downtrend could extend towards projections at 0.8340 with possibility to revisit graphical levels since 2016 near 0.8300/0.8270.”
“First resistance is at 0.8515.”
- A combination of factors failed to assist NZD/USD to preserve its early gains.
- The cautious market mood acted as a headwind for the perceived riskier kiwi.
- Rising bets for another RBNZ rate hike could help limit any meaningful decline.
- Investors now look forward to the US monthly Retail Sales for a fresh impetus.
The NZD/USD pair extended its steady intraday descent through the early European session and refreshed daily lows, around the 0.7030-25 region in the last hour.
The pair struggled to capitalize on its early uptick, instead met with some fresh supply near the 0.7070 region and was pressured by a combination of factors. Worries about a faster than expected rise in inflationary pressures continued weighing on investors sentiment. This was evident from the cautious mood around the equity markets, which acted as a headwind for the perceived riskier kiwi.
On the other hand, the US dollar stood tall near 16-month tops touched in the previous day and remained supported by hawkish Fed expectations. Investors seem convinced that the US central bank would be forced to adopt a more aggressive policy response to contain stubbornly high inflation. In fact, the markets have been pricing in the possibility for an eventual Fed rate hike move by July 2022.
That said, retreating US Treasury bond yields held the USD bulls from placing aggressive bets. This, along with rising bets for yet another rate hike by the Reserve Bank of New Zealand (RBNZ) in November, should help limit any deeper losses for the NZD/USD pair. It is worth recalling that the RBNZ had raised interest rates by 0.5% in October to curb the continuous rise in inflation.
Nevertheless, the NZD/USD pair, for now, seems to have snapped two consecutive days of the winning streak and was last seen flirting with 100-day SMA support. Market participants now look forward to the US economic docket, highlighting the release of monthly Retail Sales figures. Traders will further take cues from the broader market risk sentiment for some opportunities around the NZD/USD pair.
Technical levels to watch
The CAD/JPY is trying to recover ground back above 91.20. Looking ahead, economists at Scotiabank expect the pair to advance nicely towards the 95-100 range.
Bullish above 91.75
“The potential bull flag noted last week remains intact and in play (CAD bullish above 91.75).”
“We still rather see limited downside potential for the cross (firm support in the low/mid-90s is being underpinned by the 40-day MA now).”
“Longer-run prospects remain supportive and we continue to feel that gains can extend towards the 95-100 range.”
EUR/USD slumped to its weakest level in more than a year at 1.1366 late Monday. With fears of new covid measures in the “Old Continent”, the euro is set to continue its downfall, in the view of economists at MUFG Bank.
COVID-19 disruption fears return in Europe
“The recent weakness could reflect in part building concerns over the pick-up in COVID-19 cases in Europe heading into the winter period. Our measure of new COVID-19 cases in the eurozone has risen sharply over the past month and reached the highest levels since the start of this year.”
“There is a growing nervousness over the risk of renewed lockdowns. The negative implications for the euro-zone economy will be limited so far with the eurozone economy set to expand robustly this year by around 5.0%. However, the fear that the situation could escalate and result in a more significant tightening of restrictions in the coming months is hurting sentiment towards the common currency.”
“The negative developments are supporting our short EUR/USD trade idea as it moves closer to our target at the 1.1300-level.”
- DXY retreats to the 95.40 area following Monday’s peaks.
- US yields give away part of the recent advance on Tuesday.
- Retail Sales, Industrial Production take centre stage in the NA session.
The greenback, in terms of the US Dollar Index (DXY), backpedals part of the recent advance and revisits the 95.40 on turnaround Tuesday.
US Dollar Index focuses on data
The index gives away some gains after hitting new cycle tops near 95.60 at the beginning of the week helped by the bounce in US yields and above-estimated prints from the NY Empire State Index.
Tuesday’s so far knee-jerk in the greenback comes on the back of some loss of momentum in US yields across the curve ahead of the opening bell in Euroland.
The dollar, in the meantime, remained apathetic on the Biden-Xi virtual meeting, which yielded no significant progress.
Busy day in the US calendar on Tuesday, where Retail Sales for the month of October will take centre stage seconded by Industrial Production, the NAHB Index and Business Inventories.
In addition, Atlanta Fed R.Bostic (voter, centrist), Richmond Fed T.Barkin (voter, centrist), Philly Fed P.Harker (2023 voter, hawkish) and San Francisco Fed M.Daly (voter, centrist) are all due to speak throughout the session.
What to look for around USD
The index managed to hit new cycle highs in levels last seen back in the summer of 2020 near 95.60 on Monday. The intense move higher in the buck remains well underpinned by the “higher-for-longer” narrative around current elevated inflation, which in turn lend wings to US yields and bolster speculations of a sooner-than-estimated move on interest rates by the Federal Reserve, probably at some point in H2 2022. Further support for the dollar comes in the form of the solid recovery in the labour market along with Biden’s infrastructure bill.
Key events in the US this week: Retail Sales, Industrial Production, Business Inventories, NAHB Index, TIC Flows (Tuesday) – Building Permits, Housing Starts (Wednesday) – Initial Claims, Philly Fed Index (Thursday).
Eminent issues on the back boiler: US-China trade conflict under the Biden’s administration. Debt ceiling issue. Geopolitical risks stemming from Afghanistan.
US Dollar Index relevant levels
Now, the index is losing 0.05% at 95.48 and a break above 95.59 (2021 high Nov.15) would open the door to 95.71 (monthly low Jun.10 2020) and then 97.80 (high Jun.30 2020). On the flip side, the next down barrier emerges at 93.87 (weekly low November 9) seconded by 93.68 (55-day SMA) and finally 93.27 (monthly low October 28).
The gold market is finally benefitting from the rising inflation risk, defying recent strength in the US dollar. Strategists at ANZ Bank expect the yellow metal to continue enjoying upward momentum as lower real interest rates are lingering.
Strong risk appetite to fade
“The Fed’s announcement for the start of asset purchases has been dampened by signals of delay in rate hikes. This means that negative interest rates stay longer than expected, it would favour gold investment.”
“We believe the pace of investment in risky assets will slow amid growing ‘stagflation’ risk and consequent central bank policy changes.”
“ETF holdings of gold show net disinvestment, though investors have added some long positions in futures. Demand for physical gold is encouraging, with China imports averaging 25t against less than 10t last year. The premium for physical gold recovered in both in China and India.”
GBP/CAD price action has turned somewhat choppy. Price action hints at a possible rebound towards the 1.7080/85 region on a break above the 1.6910 level, economists at Scotiabank report.
Support at 1.6740 holds the downside
“Trend momentum signals are aligned bearishly for the GBP across the longer run DMI oscillators. This is precluding a significant rally in the GBP at this point. However, support at 1.6740 looks relatively firm and the two rebounds from that level have set up a potential double bottom (bullish above 1.6910 for a retest of the 1.7080/85 area).”
“A clear move through 1.6840/45 trend resistance would serve as a ‘heads up’ that the pound is making a run at 1.6910. We are neutral here for now.”
The US Census Bureau will publish the Retail Sales report for October on Tuesday, November 16, at 13:30 GMT and as we get closer to the release time, here are the forecasts of economists and researchers of six major banks, regarding the upcoming US Retail Sales data. Retail Sales are forecast to rise 0.7% in October, as in September. Sales ex-autos are expected to gain 0.7% and the Control Group is predicted to climb 0.4%.
In the opinion of FXStreet’s Analyst Joseph Trevisani, dollar and Treasury rates will rise regardless of sales results.
ING
“Retail sales will be lifted by 1.5% MoM thanks to the 6% MoM increase in new vehicle units sold – the first increase since April – while gasoline station sales will be boosted by the surge in gasoline prices. Elsewhere, rising household income and wealth should mean decent gains although we continue to expect a rebalancing trend away from the purchase of physical things that show up in retail sales, towards services, which are picked up in broader consumer spending.”
NBF
“Car dealers may have once again contributed negatively to the headline number as the sector continued to suffer from chip shortages. Spending in some high-contact categories (e.g. eating/drinking establishments), on the other hand, may have strengthened on an improvement of the epidemiological situation. Gasoline station receipts, for their part, could have been boosted by higher pump prices. We expect headline sales to have expanded 0.3% MoM. Spending on items other than vehicles might have fared better, rising 0.6% MoM.”
SocGen
“We look for strong monthly gains on retail sales (1.1% MoM) and industrial production, both on the back of the auto sector. New motor vehicle sales for October were reported up to 12.9 M units from 12.2M units in September. While a solid percentage increase, this is still a low pace of sales growth. Gasoline sales are also expected to be up substantially due to price increases more than to sales volumes. For non-autos, we expect retail sales to edge up just 0.3% MoM. Components are likely mixed. We are incorporating new credit card spending evidence into our retail sales predictions. So far, success has been mixed. Either we are not capturing the newly available data correctly or the correlations are just too unstable to be of use in the monthly readings.”
CIBC
“Retail sales likely surged by 1.7% in the US in October as price gains amplified sales of vehicles and gasoline among other categories. Unit sales of autos jumped, and spending at restaurants looks to have picked up, in line with the improvement in OpenTable data on reservations. Even when excluding those categories along with building materials, the control group likely posted a solid 0.9% advance. However, that will largely reflect price increases, as spending on ex. auto goods could have fallen in volume terms at the expense of progress in service sectors, reflected in high-frequency indicators. Our forecast implies spending in the control group would be 23% above pre-pandemic levels, leaving ample room for a pullback ahead when services are able to reopen more fully. We are slightly more optimistic on the control group than the consensus, but likely not be enough to cause a sustained market reaction.”
Citibank
“US Retail Sales – Citi: 2.2%, median: 1.1%, prior: 0.7%; Retail Sales ex Auto – Citi: 1.1%, median: 0.9%, prior: 0.8%; Retail Sales ex Auto, Gas – Citi: 0.7%, median: 0.5%, prior: 0.7%; Retail Sales Control Group – Citi: 0.7%, median: 1.1%, prior: 0.8% - following two months of upside surprises to retail sales, we again expect another strong print in October with upside risks to sales in the retail control group, partly due to rising prices for goods broadly.”
TDS
“Retail Sales likely rose strongly in October – we estimate 1.1% MoM — but note that the data are nominal and goods prices rose 1.5% in the October CPI. (The report mainly covers goods and related inflation-adjusted data are reported with a lag.) Along with higher prices, real goods spending is likely also being restrained by a fading of fiscal stimulus and an ongoing shift back toward services spending.”
See – US Retail Sales Preview: Win-win for the dollar? Three scenarios, only one dollar-negative
GBP/USD is seeing a minor bounce higher. Nonetheless, the pair is set to remain under pressure and turn back lower towards the 1.3162 mark, Karen Jones, Karen Jones, Team Head FICC Technical Analysis Research at Commerzbank, reports.
Negative below the 55-DMA at 1.3666
“GBP/USD is seeing a tiny bounce higher. The market last week sold off into new lows for the year, these were not confirmed by the daily RSI.”
“Beyond a minor bounce, the cable is likely to remain under pressure and on course for the 200-week ma at 1.3162.”
“Interim resistance lies at 1.3607. The market stays offered while capped by the 55-day ma at 1.3666.”
EUR/CAD is holding the recent trading range but technical pressures are building as the cross drifts back towards 1.43. A break below here would clear the way for a substantial drop to 1.37/38 and even beyond, economists at Scotiabank report.
EUR/CAD remains prone to weakness
“We continue to think that a break under the recent range low would signal potentially significant losses for the cross. The 1.4265 low from 2020 lies just below the market but this is the low end of the range in place since 2018 which peaked around 1.60.”
“A clear push under 1.43 would be construed as a bearish ‘flag’ breakdown and imply the risk of a significant (and potentially rapid) drop in the EUR in the next 1-3 months.”
“We think a decline to 1.37/1.38 may ensue but losses could well extend beyond that point in the longer run. We continue to think that modest EUR gains should be faded.”
“Resistance remains 1.4440/50, with ‘safe’ ground still distant at 1.46+.”
The New Zealand dollar has continued to be volatile, initially falling after the return of covid restrictions. However, the underlying economy remains strong. Economists at Westpac expect the NZD to appreciate against the USD due to it being undervalued for some time based on fundamentals.
NZD to continue benefitting from high commodity prices
“We expect the NZD to gain ground against the US dollar over the next year, reaching an average of 0.74 by the end of 2022.”
“Our assessment is that the NZD is undervalued, and indeed has been for some time. Indeed, relatively high-interest rates and record-high commodity prices both argue for a stronger NZD.”
“On balance, we expect the NZD/AUD exchange rate to hold broadly steady over the coming year.”
- EUR/GBP witnessed fresh selling following the release of UK employment details.
- Dovish ECB outlook further contributed to the euro’s relative underperformance.
- Brexit woes might hold back the GBP bulls from placing fresh bets and limit losses.
A sudden pickup in demand for the GBP dragged the EUR/GBP cross to over two-week lows, around mid-0.8400s heading into the European session.
Following a brief consolidation during the early part of the trading action on Wednesday, the EUR/GBP cross met with a fresh supply and turned lower for the third successive day. The latest leg of a sudden drop over the past hour or so followed the release of the UK monthly employment details, which provided a goodish lift to the British pound.
The UK Office for National Statistics reported that the ILO Unemployment Rate declined more than expected, to 4.3% in September from 4.5% in August. Additional details revealed that the Average Earnings Including Bonus rose by 5.8% in September, surpassing the consensus estimate of 5.6%, while Claimant Count fell 14.9K in October.
This comes on the back of the overnight hawkish comments by the Bank of England Governor Andrew Bailey, which, in turn, acted as a tailwind for the sterling. Speaking before the UK Parliament Treasury Select Committee, Bailey said that he was very uneasy about the inflation outlook and that all future policy meetings are now in play for a rate rise.
Conversely, the European Central Bank President Christine Lagarde continued to push back on market bets for tighter policy. This was seen as another factor behind the shared currency's relative underperformance. That said, the impasse over the Northern Ireland Protocol of the Brexit deal might cap gains for the GBP and help limit losses for the EUR/GBP cross.
Market participants now look forward to the release of the flash Eurozone GDP print for the third quarter of 2021 for some impetus. Later during the US session, traders will take cues from the ECB President Christine Lagarde's scheduled speech to grab some short-term opportunities.
Technical levels to watch
EUR/USD has sold off to 1.1366 (previous long-term downtrend). Karen Jones, Team Head FICC Technical Analysis Research at Commerzbank, expects the world’s most popular currency pair to dive as low as 1.10.
Euro sells-off further
“EUR/USD has sold off to 1.1366, previous downtrend (from 2008). We note the 13 count on the daily chart and this would suggest extreme caution. TD support is not found until 1.1248 however.”
“Any bounces will find tough resistance at the 1.1645 five-month downtrend and while capped here the overall bias is negative.”
“Initial resistance is the 1.1513/22 October low and the 5th November low and the 20-day ma at 1.1560.”
“Below 1.1350 would target 1.1290 then 1.10, the 61.8% and 78.6% retracement of the move seen in 2020.”
- GBP/USD regained some positive traction on Tuesday and jumped to mid-1.3400s.
- A combination of factors acted as a tailwind for the sterling and remained supportive.
- Hawkish Fed expectations underpinned the USD and capped gains amid Brexit woes.
The GBP/USD pair refreshed daily tops, around mid-1.3400s in reaction to mostly upbeat UK employment details, albeit lacked any follow-through buying.
Having defended the 1.3400 round figure, the GBP/USD pair attracted fresh buying on Wednesday and was supported by the overnight hawkish comments by the Bank of England (BOE) Governor Andrew Bailey. Speaking before the UK Parliament Treasury Select Committee, Bailey said that he was very uneasy about the inflation outlook and that all future policy meetings are now in play for a rate rise.
The sterling got an additional boost heading into the European session after data released from the UK showed that the jobless rate declined more than expected, to 4.3% during the three months to September. Additional details of the report showed that the number of people claiming unemployment-related benefits dropped by 14.9K in October as against the fall of 51.1K reported in the previous month.
This, along with the risk that Britain will trigger Article 16 and suspend parts of the Northern Ireland Protocol, act as a headwind for the British pound. Apart from this, the underlying bullish sentiment surrounding the US dollar – amid the prospects for an early policy tightening by the Fed – further collaborated to keep a lid on any meaningful upside for the GBP/USD pair.
Hence, the market focus will remain glued to the incoming Brexit-related headlines, which will play a key role in influencing the sentiment surrounding the sterling. Traders on Tuesday will further take cues from the release of US monthly Retail Sales figures, due later during the early North American session. The data could produce some short-term opportunities around the GBP/USD pair.
Technical levels to watch
- ILO Unemployment Rate in UK came in lower than expected for September.
- GBP/USD trades in the positive territory above 1.3430 after the data.
The data published by the UK's Office for National Statistics revealed on Monday that the ILO Unemployment Rate declined to 4.3% in September from 4.5% in August. This reading came in slightly better than the market expectation of 4.4%.
Further details of the report showed that the Claimant Count Rate edged lower to 5.1% in October from 5.2% and the Average Earnings Including Bonus rose by 5.8% in September, surpassing analysts' estimate of 5.6%.
Market reaction
The GBP/USD pair gained traction with the initial reaction and it was last seen rising 0.17% on the day at 1.3440.
Gold continues to trade above $1,860. The yellow metal seems to be attracting investors as a hedge against inflation but FXStreet’s Haresh Menghani warrants caution before placing aggressive bets on XAU/USD.
Inflation fears helped to limit losses
“The markets are pricing in the possibility for an eventual Fed rate hike move by July 2022. Moreover, the Fed funds futures indicate a high likelihood of another raise by November amid rising inflationary pressure.”
“The recent strong move-up stalled just ahead of a resistance marked by a downward sloping trend-line which extends from September 2020 swing highs and should now act as a key pivotal point for short-term traders. It will be prudent to wait for a convincing breakthrough of the trend-line before placing fresh bullish bets. XAU/USD might then accelerate the momentum and aim to reclaim the $1,900 level before eventually darting to June swing highs, around the $1,916-17 region.”
“Any meaningful pullback below the $1,850 level would now be seen as a buying opportunity. This, in turn, should help limit the downside near the $1,834-32 strong horizontal resistance breakpoint. Failure to defend the mentioned support levels might trigger aggressive long-unwinding trade and turn gold prices vulnerable to slide back towards the $1,800 mark.”
See – Gold Price Forecast: XAU/USD to soar back to the $2,075 record high on a break above $1,917 – Credit Suisse
- USD/CAD bulls vigilant, 200-day SMA stays on to stop two-day downtrend.
- The daily 38.2% Fibo remain a downward test for the pair's short-term.
- The loonie remains cautious ahead of US data, Fed rate hike concerns remain mixed.
USD/CAD bulls stand guard eases around 1.2516, up 0.04% in the day. The bear raid lasted two days and the price action is seeing 1.2490 - 1.2523 swings.
The market remains mixed with US Retail Sales data, and several Fed speeches lined up for the day. The indecision could be corrected if the Bank of Canada (BoC) Deputy Governor Lawrence Schembri speech provides enough traction.
As per Fibonacci Retracement (Fibo.) drawn from September 21, the loonie remains above 38.2% Fibo. The spot is sitting uncomfortably between the prior and 50.0% Fibo., if the pair is able to break above 1.2600, its weekly high; it will easily traverse the goodish 61.8% barrier.
The USD/CAD pair's pullback from 50% Fibo. as seen in this chart, around 1.2570, directs the quote towards the 200-day Simple Moving Average (SMA) level, the first line of defence.
As per the daily chart, the loonie pair can test 1.2500 level, then confluence between 50 and 100-day SMA. The next upside resistance is a weekly high of 1.2605 and the last would be 1.2739, the pair's monthly high.
The price can reverse and continue its previous downtrend and find support at 200-day SMA, 1.2471 and then 1.2423. Further ahead, one month low of 1.2288 can hold the downfall.
The Moving Average Convergence Divergence (MACD) shows healthy but cautious movement. The Relative Strength Index (RSI) level is holding above the 50-line horizon, suggesting no downside momentum, but bulls stay vigilant.
USD/CAD daily chart
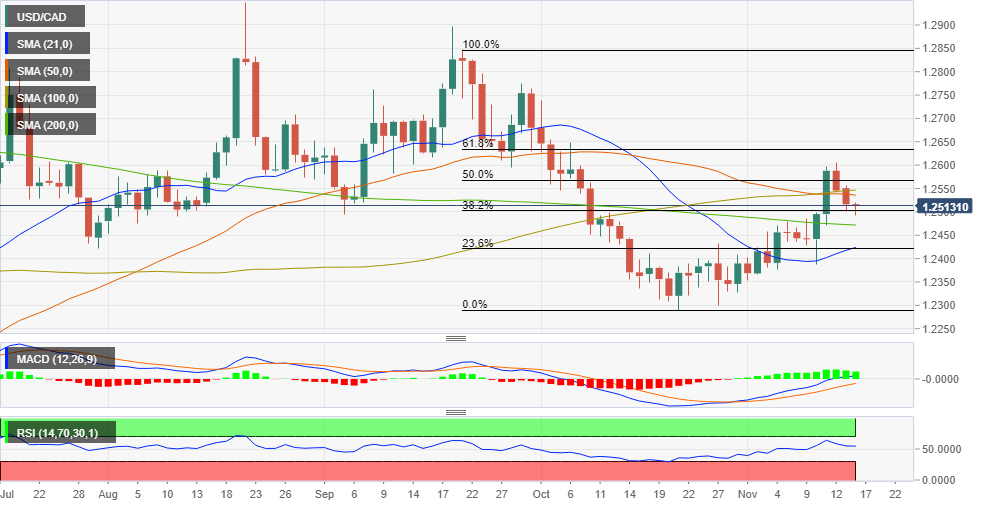
USD/CAD additional levels
- USD/JPY edged higher during the Asian session, albeit lacked any follow-through buying.
- A softer risk tone benefitted the safe-haven JPY and capped amid retreating US bond yields.
- Hawkish Fed expectations acted as a tailwind for the USD and continued lending support.
The USD/JPY pair struggled to capitalize on its Asian session uptick to over two-week highs and was last seen trading in the neutral territory, around the 114.15-20 region.
The pair built on the previous day's positive move from the 113.75 area and gained some follow-through traction during the early part of the trading action on Tuesday. However, a combination of factors held back bullish traders from placing aggressive bets and kept a lid on any meaningful upside for the USD/JPY pair, at least for now.
The prevalent cautious mood – as depicted by a softer tone around the equity markets – benefitted the safe-haven Japanese yen and acted as a headwind for the USD/JPY pair. Apart from this, retreating US Treasury bond yields further collaborate to cap gains, though a strong bullish sentiment surrounding the US dollar extended some support.
The USD stood tall near 16-month highs touched in the previous session amid firming expectations for an early policy tightening by the Fed. In fact, the markets have been pricing in the possibility for an eventual Fed rate hike move by July 2022 and the Fed funds futures indicate a high likelihood of another raise by November next year.
The fundamental backdrop seems tilted in favour of bullish traders. However, the lack of any strong follow-through buying warrants some caution before positioning for any further appreciating move. Market participants now look forward to the US monthly Retail Sales data, due later during the early North American session for a fresh impetus.
This, along with the US bond yields, will influence the USD price dynamics. Apart from this, the broader market risk sentiment might further contribute to producing some short-term trading opportunities around the USD/JPY pair.
Technical levels to watch
Here is what you need to know on Tuesday, November 16:
Following a calm start to the week, the dollar capitalized on rising US Treasury bond yields in the American session and the US Dollar Index climbed to its highest level since July 2020 before going into a consolidation phase. Investors await UK labour market data and third-quarter GDP figures for the euro area. Later in the day, October Retail Sales and Industrial Production will be featured in the US economic docket. Several FOMC policymakers will be delivering speeches as well.
The benchmark 10-year US Treasury bond yield gained traction in the second half of the day on Monday and reached its strongest level in more than two weeks at 1.632%. In the absence of fresh fundamental drivers and high-impact data releases, the sharp upsurge witnessed in yields suggested that investors continue to price the possibility of the US Federal Reserve hiking the policy rate sooner than expected.
Wall Street's main indexes finished the day flat and US stock index futures trade in a tight range early Tuesday. Headlines surrounding US President Joe Biden's meeting with his Chinese counterpart Xi Jinping suggest that talks were focused on strategic and fundamental issues. There was no mention of tariffs and trade relations and this summit doesn't seem to be having a noticeable impact on market sentiment.
EUR/USD slumped to its weakest level in more than a year at 1.1366 late Monday and seems to be having a difficult time staging a decisive rebound. European Central Bank (ECB) President Christine Lagarde, once again, pushed back against market pricing of a rate hike in 2022.
GBP/USD closed flat on Monday as the British pound managed to stay resilient against the greenback on the back of the latest Brexit headlines. European Commission Vice President Maros Šefčovič said that the latest meeting with UK Brexit Minister Lord David Frost was much better than last week. Moreover, British Prime Minister Boris Johnson said that an agreement with the EU was possible and added that they hope to reach a negotiated settlement on the Northern Ireland Protocol.
USD/JPY capitalized on rising US T-bond yields and reclaimed 114.00. As of writing, the pair was fluctuating in a very narrow range around 114.10.
Despite the broad-based dollar strength, gold continues to trade above $1,860. The precious metal seems to be attracting investors as a hedge against inflation.
Cryptocurrencies: Bitcoin lost nearly 3% on Monday and came under strong bearish pressure on Tuesday. BTC/USD is currently testing $60,000 losing more than 4% on a daily basis. Similarly, Ethereum is suffering heavy losses and was last seen trading near $4,300, where it was down 5.3% on the day.
Considering advanced figures from CME Group for natural gas futures markets, open interest dropped for the second straight session at the beginning of the week, this time by around 3.5K contracts. In the same line, volume extended the decline and went down by more than 67K contracts.
Natural Gas still looks supported by $4.70
Natural gas prices started the week on a positive note, closing Monday’s session once again above the $5.00 mark per MMBtu. However, the positive price action in the commodity was on the back of shrinking open interest and volume, removing strength from the continuation of the rebound, at least in the very near term.
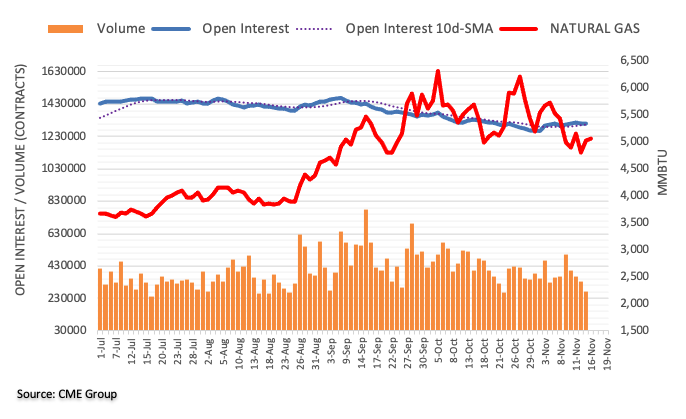
CME Group’s preliminary readings for crude oil futures markets noted open interest shrank for the second session in a row on Monday, this time by around 4.4K contracts. In the same line, volume extended the downtrend and dropped by 125.7K contracts.
WTI risks a drop to $78.28
Monday’s small uptick in prices of the WTI was on the back of diminishing open interest and volume, leaving the door open to further correction in the very near term. Against this, crude oil prices could retest the monthly low at $78.28 (November 4) in the short-term horizon.
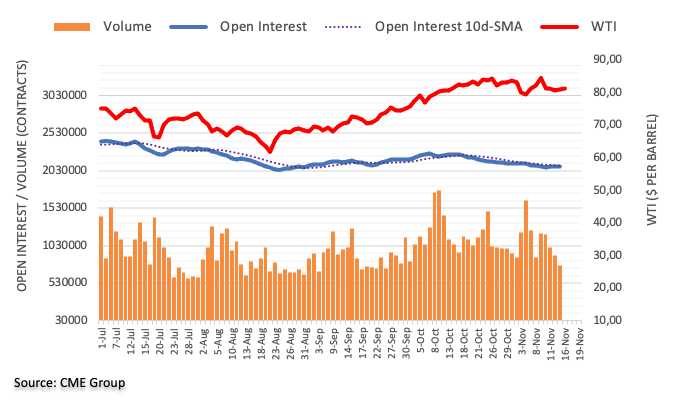
- USD/INR prints three-day uptrend, grinds higher of late.
- India’s daily covid infections drop to February levels, trade numbers improve.
- RBI hopes further economic recovery but Fed rate hike concerns keep pair buyers hopeful.
- US Retail Sales, Xi-Biden talks eyed for fresh impulse.
USD/INR stays firmer around 74.50 during a three-day run-up ahead of Tuesday’s European session. In doing so, the Indian rupee (INR) pair fails to cheer the risk-on mood amid mixed cautious sentiment ahead of the key US data.
Risk appetite improves as the Fed policymakers, namely Richmond Federal Reserve (Fed) Bank President Thomas Barkin and Fed Minneapolis President Neel Kashkari, reject the rate hike calls. On the same line are the initial comments between US President Joe Biden and his Chinese counterpart Xi Jinping. Furthermore, record-high India Exports and a narrowing of the trade deficit in October also hint at the USD/INR pair’s pullback.
It should be noted, however, that India’s lowest daily covid infections since February and optimism over the economic rebound, per the Reserve Bank of India (RBI) weigh on the quote. Additionally, the recent updates from the Xi-Biden talks hint that the world’s top two economies jostle over Taiwan issues and hence challenge risk-on mood.
Furthermore, cautious sentiment ahead of the key US Retail Sales also tests the market optimism and propels the USD/INR advances.
Amid these plays, US 10-year Treasury yields drop 2.2 basis points (bps) to 1.60% while the US stock futures and the Asia-Pacific stocks traded mixed at the latest. That said, the US Dollar Index (DXY) consolidates gains after refreshing the 16-month top the previous day.
Looking forward, USD/INR buyers can tighten the grips should the US Retail Sales figure reveal negative impacts of the 31-year high US inflation.
Read: US Retail Sales October Preview: Inflation Is the key, not Retail Sales
Technical analysis
Sustained trading above 100-DMA, around 74.30 by the press time, helps the USD/INR bulls to pierce a descending resistance line from mid-October. However, a daily closing beyond 74.50 becomes necessary for the pair to aim for the last month’s low of 74.70.
Traders scaled back their open interest positions by just 506 contracts on Monday, reversing at the same time seven consecutive daily builds according to flash data from CME Group. Volume, instead, went up by around 88.2K contracts after two daily pullbacks in a row.
Gold remains capped around $1,870
Gold prices started the week on the defensive. However, the downtick was amidst shrinking open interest, which is indicative that further losses are not favoured in the very near term. That said, the upside in the precious metal remains limited by the $1,870 mark per ounce troy for the time being.
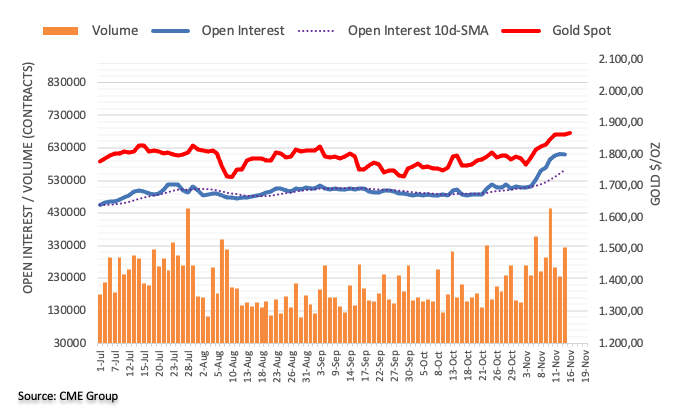
In its communique, the US noted that President Joe Biden told China’s President Xi Jinping that America will stand up for its interests, values together with its allies.
Additional points
US opposes unilateral efforts to change the status quo of Taiwan.
Biden expressed concerns about China's behaviour in Xinjiang and Hong Kong.
US to stay committed to 'One China' policy.
Biden and Xi discussed taking measures to address global energy supplies.
Read: China’s Pres. Xi to US Pres. Biden: Should not play zero-sum games
Market reaction
The market sentiment is seen weakening on the bold remarks from the US leader on the Taiwan issue. The S&P 500 futures is trading almost unchanged on the day while AUD/USD has wiped off gains, trading flat at 0.7344. as of writing.
- Palladium seesaws around monthly peak, keeps key trend line breakout.
- Firmer Momentum line strengthens bullish bias, $2,460-75 becomes the key hurdle.
Palladium (XPD/USD) bulls take a breather around a one-month high, recently sidelined near $2,115 ahead of Tuesday’s European session.
The precious metal refreshed the multi-day top following its sustained run-up beyond the previous resistance lines from August and July. Also backing the XPD/USD bulls is the upbeat Momentum line.
Hence, the commodity buyers can ignore the latest sideways grind while aiming for October’s peak surrounding $2,180.
Though, any further upside will enable the palladium bulls to aim for the late August month’s low near $2,265. Even so, a convergence of the 200-DMA, June’s low and August 25 high, around $2460-75 becomes a tough nut to crack for them afterward.
Meanwhile, pullback moves remain less important until staying beyond a descending trend line from August, near $2,050.
Following that, the $2,000 threshold and a four-month-old support line, previous resistance, will lure the palladium bears to $1,980.
Palladium: Daily chart
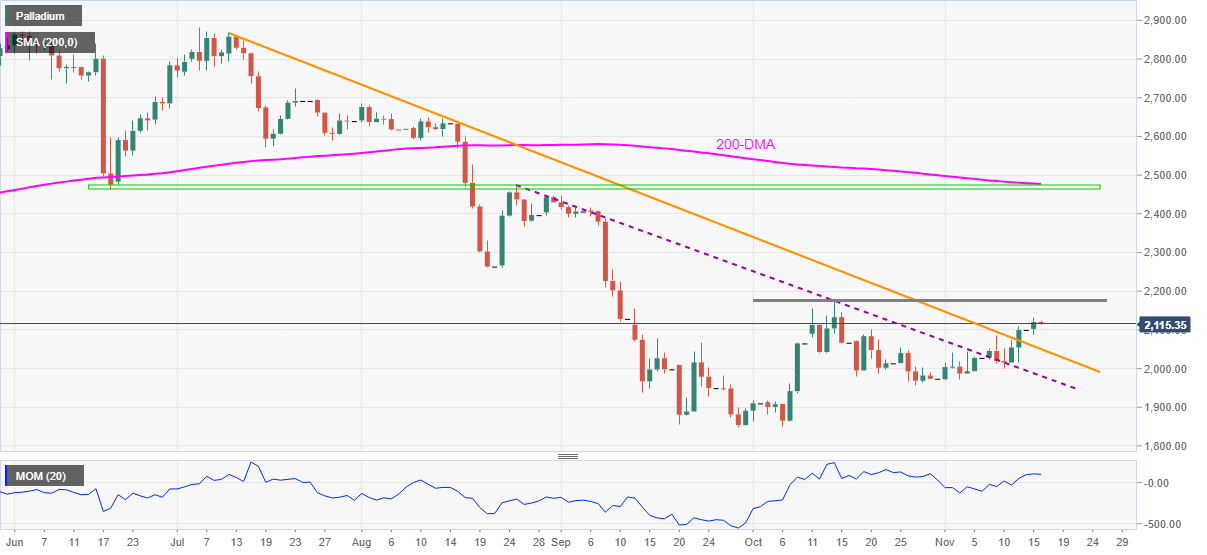
Trend: Further upside expected
China’s President Xi Jinping told US President Joe Biden that earth is big enough for the development of both China and the US, the Chinese state media reports.
Additional headlines
Should not play zero-sum games.
China and the US are like two ships that should not collide.
China will have to take decisive measures if 'Taiwan independence' forces cross the red line.
Hopes Biden can demonstrate 'political leadership' to bring the US policy towards China back to a 'rational and practical' track.
China believes that the Xi-Biden meeting was frank, constructive, substantive, and fruitful.
Should not politicise China-US trade issues.
China has agreed to upgrade 'fast track lane' for the US business figures to come to China.
US should stop abusing concept of national security to oppress Chinese companies.
Should manage differences and sensitive issues in constructive way.
Meanwhile, Biden tells Xi that the US doesn't support Taiwan's independence, per CCTV.
“The US seeks peace and stability on the Taiwan Strait,” Biden added in his call with Xi.
Related reads
-
Xi and Biden spoke about strategic, fundamental issues during talks – China Press
-
USD/CNH Price Analysis: RSI divergence tests bears around $6.3700
- GBP/USD is keeping investors on edge ahead of the release of UK employment data.
- The currency pair remains affected by multiple factors, Brexit plays a crucial role.
- Investors fear another lockdown with the rising new covid cases in the UK.
GBP/USD continues to struggle around the 1.3430 level heading towards the European open, as the investors wait for Britain's jobs data for fresh trading insights. After closing in the negative territory Monday, the pair resumed trading on the second day of the week on a positive note around 1.3432, up 0.2%, at the time of press.
Grey clouds over Brexit talks continue to hover over the currency pair. Having said that, London will continue to maintain its stance on Northern Ireland. The UK Prime Minister Boris Johnson has expressed the country's hopes for a consensual solution with European Union. So far, Britain has been threatening to trigger Article 16, which will suspend parts of the deal that have prevented a hard border on Ireland's island. Any update in the segment is likely to keep the investors engaged.
Meanwhile, after a slight pause in COVID-19 cases, the UK is again witnessing the rise in new cases, pushing regulators to announce the extension of booster shots for people over the age of 40. If the cases continue to rise, it may lead to another lockdown, resulting in adverse effects on the pair.
The US Dollar Index (DXY) refreshes its multi-day top to trade at 95.46. Also, in the US, the chatter of Fed rate hike renews amid a jump in the US inflation expectations.
The cable investor will pay attention to US Retail Sales figure and UK Claimant Count Change, October, Britain's ILO Unemployment Rate and Earnings data to further provide impetus. Traders will also keep a close eye on the Fedspeak scheduled later in the day.
GBP/USD technical levels
- EUR/USD consolidates losses around 16-month low, recently grinding higher.
- Yields soften as ECB, Fed officials push back rate hike concerns ahead of key data releases.
- DXY tracks bond coupons to ease from 16-month top.
- US stimulus, XI-Biden talks improve market sentiment, strengthen corrective pullback.
EUR/USD struggles to extend the rebound from a 16-month low heading into Tuesday’s European session. That said, the quote dropped to the fresh low since July 2020 the previous day before bouncing off 1.1359 during early Asia.
Although pullback in the US Treasury yields seems to have underpinned the EUR/USD rebound, cautious sentiment ahead of important statistics from the Eurozone and the US challenges the recovery moves.
The US 10-year Treasury yields drop two basis points (bps) to 1.60% after rising to a three-week top on Monday. The softer bond coupons weigh on the US Dollar Index (DXY) down 0.10% around 95.43, following the run-up to the highest since late 2020.
While tracing the pullback in the yields, comments from the European Central Bank (ECB) and the US Federal Reserve (Fed) officials could well be linked. That said, ECB President Christine Lagarde not only ruled out rate hikes until 2022 but also cited the negative impacts of monetary policy tightening the previous day. On the other hand, the Richmond Federal Reserve Bank President Thomas Barkin cited the need for a “wait and see” approach to tame the inflation whereas the President of the Federal Reserve Bank of Minneapolis Neel Kashkari said that the FOMC shouldn’t overreact to temporary factors.
Also favoring the EUR/USD buyers is the market’s optimism concerning the Sino-American relations following the An absence of negative comments during the introductory talks between US President Joe Biden and his Chinese counterpart Xi Jinping.
It should, however, be noted that the firmer prints of the US Empire State Manufacturing Index and a 31-year high US inflation keep EUR/USD sellers hopeful. Also, fears that the latest worsening of the covid conditions in the bloc will overturn hopes of economic recovery, even if the Eurozone Q3 GDP rises past 2.2% QoQ forecasts, test the major pair buyers.
Read: US Retail Sales Preview: Win-win for the dollar? Three scenarios, only one dollar-negative
Technical analysis
Unless bounding back beyond June 2020 peak near 1.1425, EUR/USD remains vulnerable to test late 2019 high surrounding 1.1240.
The Chinese state media is out with the headlines following the conclusion of the highly-anticipated virtual meeting held between US President Joe Biden and China’s President Xi Jinping.
“Xi and Biden spoke about strategic, fundamental issues during talks,” the Chinese media outlet reported.
Heading into the meeting, China’s leader Xi said that he stands ready to move US-China relations forward in a 'positive direction'.
Market reaction
The market mood remains upbeat on the Xi-Biden meeting, expecting a thaw in the US-Sino tense relationship.
At the time of writing, AUD/USD is paring back gains to trade around 0.7350, courtesy of the dovish comments from RBA Governor Phillip Lowe.
Meanwhile, the S&P 500 futures are modestly flat around 4,685.
- USD/CNH refreshes 5.5-month low before the latest rebound.
- Bullish RSI divergence inside falling wedge keeps buyers hopeful.
- 10, 20-DMA confluence guards immediate upside, bears can aim for $6.3300.
USD/CNH consolidates intraday losses around the lowest levels since May 31 ahead of Tuesday’s European session. That said, the quote seesaws around $6.3700 by the press time.
In doing so, the offshore Chinese currency (CNH) pair remains inside a 10-week-old falling wedge bullish chart pattern as the RSI conditions diverge with the recent lower-low formation, suggesting a pullback in prices.
It should, however, be noted that a convergence of the 10-DMA and the 20-DMA near $6.3900 can challenge the corrective pullback before fueling the quote towards the stated wedge’s resistance line near $6.40.
In a case where the USD/CNH buyers manage to cross the $6.40 threshold on a daily closing basis, the pair confirms the bullish formation and can aim for the theoretical target surrounding July’s top of $6.5285.
During the run-up, $6.4250 and tops marked in September around $6.4800 will be the key to watch.
If at all the USD/CNH bears refrain from releasing the controls, the yearly bottom close to $6.3525 and lower line of the wedge, near $6.3350, may flash on the chart.
USD/CNH: Daily chart
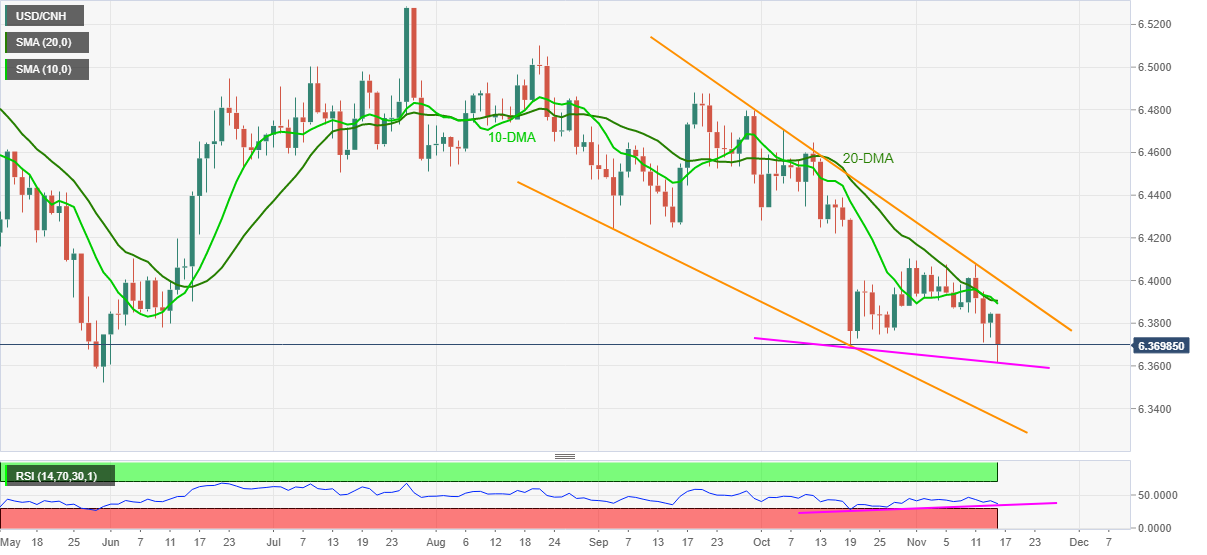
Trend: Corrective pullback expected
- Asian equities grind higher as Treasury yields retreat from multi-day peak.
- Biden-Xi talks start with optimism towards rebuilding relations, Biden signs $1.0 trillion stimulus bill into law.
- RBA Minutes, Governor Lowe rejects rate hike calls.
- Eurozone GDP, US Retail Sales become the key catalysts to watch.
Asia-Pacific shares trade slightly higher during early Tuesday, following a sluggish start to the week amid hopes of US-China ties and further stimulus. However, cautious sentiment ahead of the US Retail Sales data release probes the bulls.
Against this backdrop, MSCI’s index of Asia-Pacific shares outside Japan gains 0.40% whereas Japan’s Nikkei 225 prints mid gains ahead of the European session.
A positive start to the virtual talks between US President Joe Biden and his Chinese counterpart Xi Jinping seems to have underpinned the latest positive mood in the market. US President Biden said that US-China relation is profoundly important to the world. On the same line, China’s Xi mentioned, “Stands ready to move US-China relations forward in a positive direction”.
It’s worth noting that hopes of further stimulus from China and the US add to the risk-on mood. That said, US President Biden signed a $1.0 trillion infrastructures stimulus bill into the law, increasing the odds of a broad aid package to arrive soon.
Amid these plays, property stocks in China led the run-up, which in turn favored markets in Hong Kong, Indonesia and South Korea. However, Australia’s ASX 200 and New Zealand’s NZX 50 bucks the trend as regional unlocks are firmer data challenges easy money policies even as the Reserve Bank of Australia’s (RBA) policymakers reject rate hikes. Investors in India also fear a reduction in the easy money policies amid the lowest covid daily infections since February.
On a broader front, the US stock futures print mild gains whereas the Treasury yields retreat from a three-week high. It’s worth noting that the Richmond Federal Reserve Bank President Thomas Barkin cited the need for a “wait and see” approach to tame the inflation whereas President of the Federal Reserve Bank of Minneapolis Neel Kashkari said that the FOMC shouldn’t overreact to temporary factors.
Moving on, fresh updates over the Biden-Xi talks and the US Retail Sales for October, expected to reprint the 0.7% MoM growth, will be important to watch for fresh impulse.
Read: US Retail Sales Preview: Win-win for the dollar? Three scenarios, only one dollar-negative
- WTI extends bounce off one-week low, refreshes intraday high of late.
- Overbought RSI conditions, key moving averages challenge buyers.
- Bears have a bumpy road to entry, 61.8% Fibonacci retracement tests pullback.
WTI crude oil takes the bids around $80.40, up 0.77% intraday, heading into Tuesday’s European session.
In doing so, the black gold buyers attack a convergence of the 100-HMA and 200-HMA while extending the rebound from one-week low, marked the previous day.
Given the overbought RSI conditions challenging the upside momentum around the key moving averages, around $80.40 at the latest, WTI is likely to witness a pullback towards the 61.8% Fibonacci retracement (Fibo.) level of November 04-09 upside, near $79.90.
Following that, an ascending trend line connecting weekly lows, near $79.75, will precede the horizontal area comprising multiple lows marked since November 04, near $78.30, to challenge the oil bears.
On the flip side, the 50% Fibo. around $80.60 and the $81.00 round figure restrict the short-term advances of WTI prices.
In a case where the commodity bulls remain dominant past $81.00, $82.20 will probe the advances targeting the monthly top near $83.60.
To sum up, WTI bulls seem to have tired nut the overall bullish trend remains intact.
WTI: Hourly chart
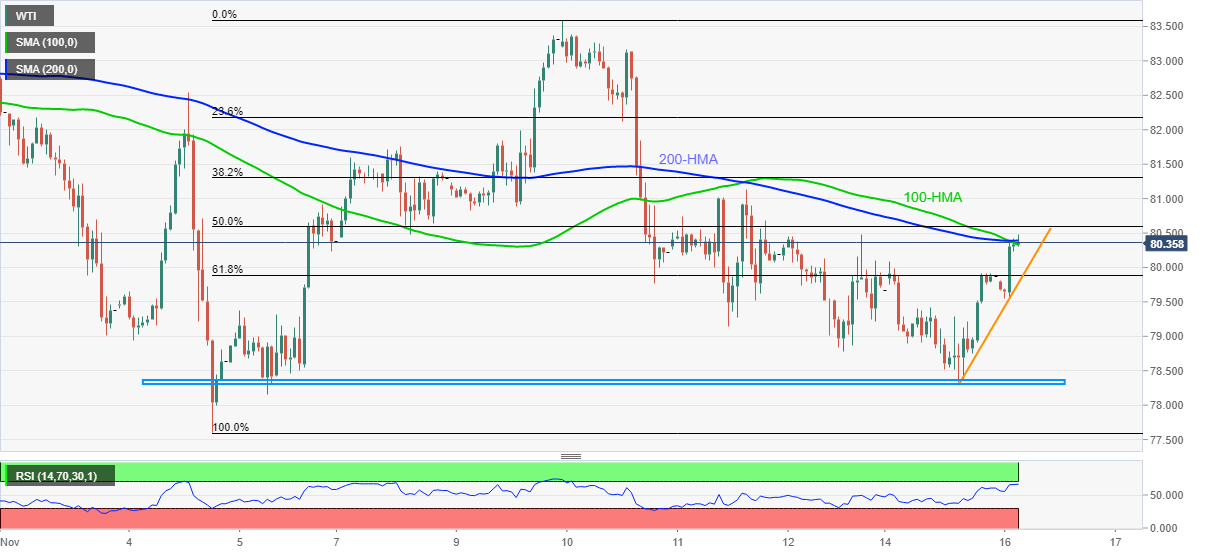
Trend: Pullback expected
Analysts at Goldman Sachs offer their outlook on the US economy while predicting the Fed’s first interest rate hike in July 2022.
Key quotes
“For the Federal Open Market Committee, Goldman Sachs see what they describe as a "seamless" transition from tapering to rate hikes.”
“They expect the first-rate hike 'lift-off' in July 2022.”
“Core PCE inflation to rise further in the US winter, but eventually falling to low 2% levels, as a transitory inflation boost from durable goods becomes a transitory deflationary drag in late 2022 and 2023.”
“Expect the slowing due to the Delta wave has passed, growth is accelerating again, with a ways to go for the service sector.“
“But declining fiscal support will be a major growth headwind through the end of 2022 as near-term boosts from reopening, pent-up savings, and inventory restocking subside, growth should decelerate to potential by late 2022.”
“Looking for the jobless rate to drop to its 3.5% pre-pandemic low in 2022.”
“Participation is likely to remain below its pre-pandemic trend.”
"Strong labor demand and reduced labor supply should keep wage growth just above 4%, stronger than last cycle but compatible with the Fed's inflation goal.”
Following his speech titled "Recent Trends in Inflation", the Reserve Bank of Australia (RBA) Governor Phillip Lowe is responding to the Q&A session.
Key quotes
Will not raise rates to control house prices.
Very low probability of wages picking up fast enough to need rate hike in 2022.
Would be prepared to look through transitory spike in core inflation.
Chance of unwinding the 10 years of slowdown in wages growth is very, very low, close to zero chance.
Hopeful neutral cash rate could be at least as high as 2.5%.
Would welcome release of monthly CPI data in Australia.
Would be prepared to respond to very, very sharp rise in inflationary pressures.
Intend to review policy framework next year.
To review experience with policy measures through pandemic.
more to come ...
Market reaction
AUD/USD is keeping its range around 0.7360 on these comments, off the daily highs of 0.7369. The spot is still up 0.23% on the day.
- EUR/JPY keeps investors on edge ahead of Eurozone GDP data, ECB Lagarde's speech.
- The cross-currency pair draws concern from each side of their territory.
EUR/JPY has moved past its eight-day negative session streak on Tuesday and is trading around 130.00 level.
So far, the pair has been reeling under pressure from the rising US dollar, supported by the inflation figures. In addition to this, the corrective downside in the US treasury yields also contributed to the negative trend in the pair.
On Tuesday, the US dollar is flexing its muscles as it continues to hover around a 16-month high at 95.40. On the other hand, the US Treasury yields retreated amid mixed market sentiment, ahead of US Retail Sales data, scheduled for release later in the day.
The retreat in the Treasury yields is also a result of positive reports emerging from the talks between US president Joe Biden and his Chinese counterpart Xi Jinping. The two leaders held virtual discussions about human rights and security issues.
Other than the US Retail Sales data, the market participants' sentiments will also be affected by the Eurozone's upcoming Gross Domestic Product data release and European Central Bank (ECB) President Christine Lagarde's speech.
In Eurozone news, geopolitical tensions remain high in Europe due to the Belarus border crisis, which deepens along its border with Poland. ECB officials also continue to see inflationary pressures as transitory. Also, the Netherlands started a three-week lockdown at the weekend, Austria is imposing a lockdown on the unvaccinated and infection rates in Germany are at a record high. These all have somehow impacted the euro, causing the pair to perform relatively subdued of late.
Earlier data suggests that Industrial Production in the broader Euroland contracted 0.2% MoM in September and 5.2% over the last twelve months. Japan reported weak Q3 GDP data and Bank of Japan (BOJ) Governor Kuroda hinted that its covid funding program might be scaled back.
In the interim, the greenback continued appreciation. The reason could be a hint of Fed tapering as per the November 2-3 FOMC meeting. It has undermined the safe-haven appeal of JPY. The price action for the pair could get tailwinds from US President Joe Biden's $1.0 trillion, bi-partisan infrastructure bill.
EUR/JPY technical levels
- RBA's Lowe gives markets something to think twice about.
- AUD/USD struggles to find demand following Lowe's dovish commentary.
AUD/USD is being pressured as we progress through the Asian session as traders dial back their rate hike bets following comments from the Reserve Bank of Australi's governor, Phillip Lowe. At the time of writing, AUD/USD is giving back some territory around 0.7360 and 0.7368 the high for the day but remains up around 0.20%.
At the start of the session, AUD/USD was perky in the 0.7340s with the US dollar shedding some of the gains it has picked up in the New York session. Along came the RBA minutes. Despite their dovishness, suggesting rate hikes will not come until wages and jobs have met the RBA's target, likey not until 2024, markets moved in contrary to the rhetoric. The Aussie pairs rallied as if the opposite was said in the minutes and rates remained firmly bid with the 2-year jumping towards the highs of 0.488%.
Nevertheless, Lowe has spoken. He has stated that the economy would have to turn out very differently for the board to consider hiking rates next year. Consequently, Aussie pairs are now meeting headwinds.
Key comments from Lowe
Latest data, forecasts do not warrant a rate rise in 2022.
Still plausible first increase in the cash rate will not be before 2024.
Could be case for hike before 2024 if inflation rises faster than expected.
Underlying inflation at 2.5% mid-point would not warrant a rate rise.
Need to see underlying inflation well within 2–3% range, confident it will stay there.
A sharp rise in underlying inflation would have different policy implications to a slow drift up.
Yet to see a broad-based pickup in wages growth in Australia.
Our business liaison suggests most retain a strong cost control mindset.
Energy prices in Australia trending lower due to wind, solar capacity.
Likely global inflation pressures will moderate over next 18 months as demand/supply adjusts.
AUD/USD technical analysis
However, as always, there are two sides to the coin. On the one hand, we have a bullish outlook as follows:
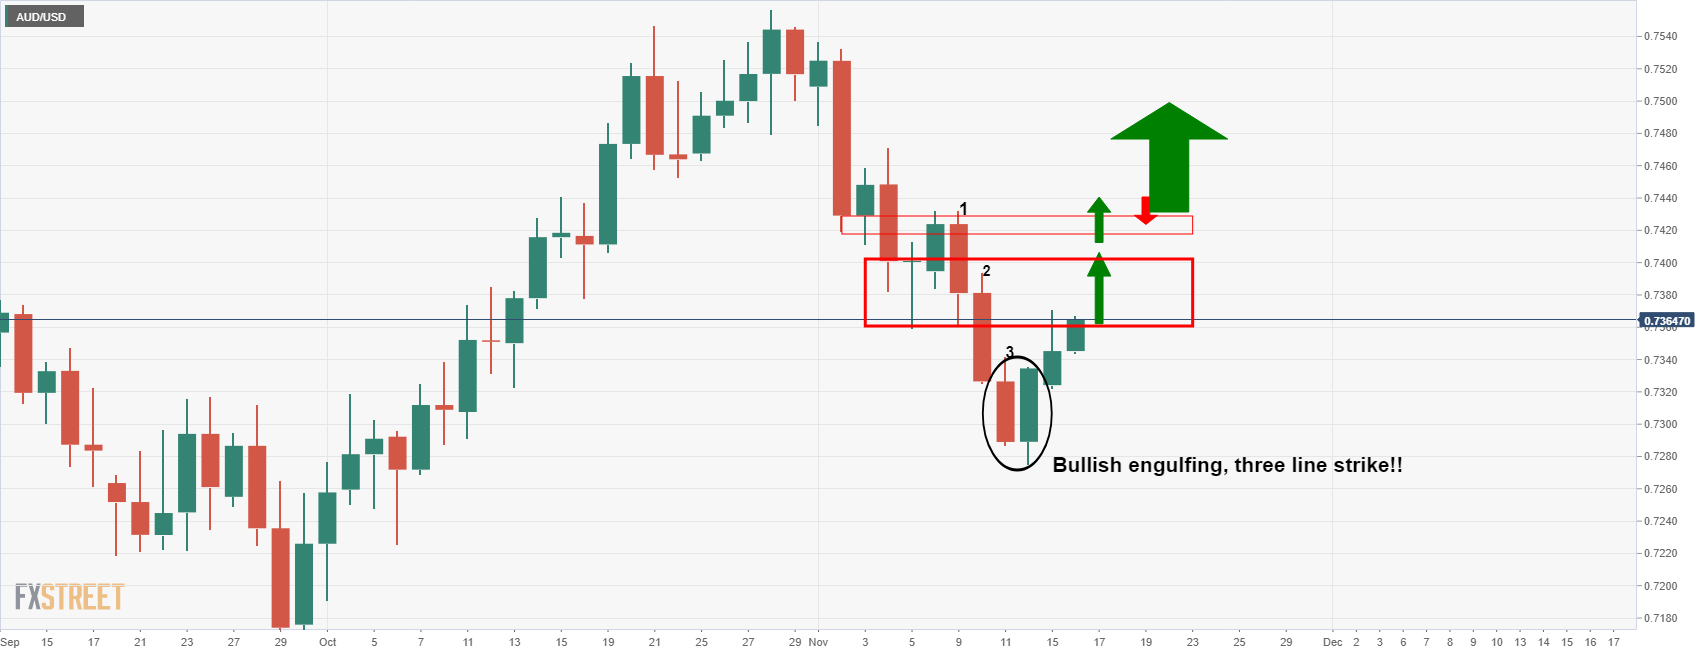
On the other hand, we have the bearish:
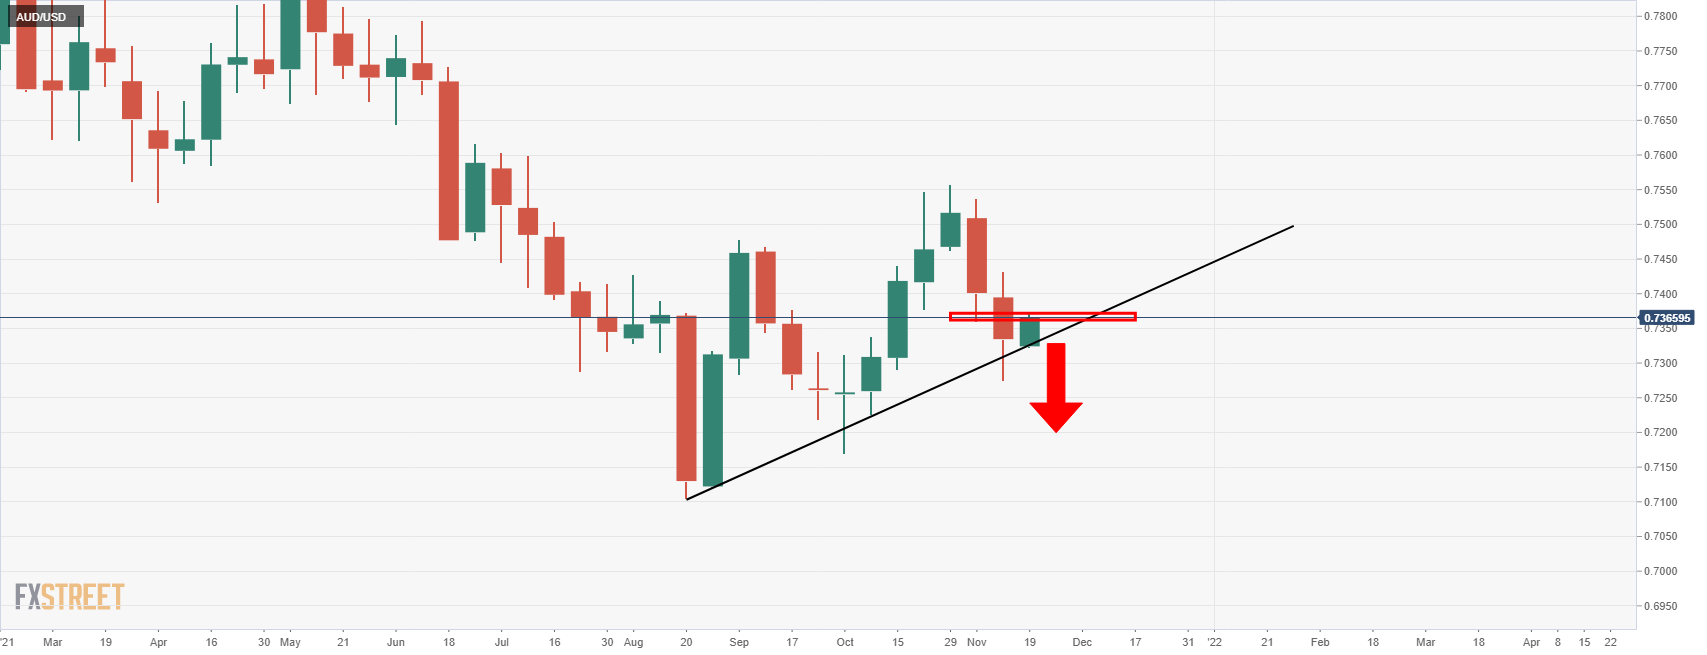
- USD/CHF steps back from monthly peak, refreshes intraday low of late.
- Bearish chart pattern, receding bullish bias of MACD keep sellers hopeful.
- Key HMAs add to the downside filters, bulls have multiple hurdles on the north.
USD/CHF consolidates the previous day’s heavy gains around 0.9240, down 0.14% intraday around early Tuesday.
In doing so, the Swiss currency (CHF) pair steps back from a one-week-old rising wedge bearish chart pattern on the hourly formation amid easing bullish bias of the MACD.
Hence, the quote is likely to challenge the bearish pattern’s support line near 0.9210, a break of which will theoretically trigger the south-run targeting a fresh low of the monthly around 0.9050.
During the fall, 100 and 200-HMA levels, respectively near 0.9195 and 0.9160, will precede the monthly bottom of 0.9088 to offer intermediate halts.
Alternatively, recovery moves need to the wedge’s upper line, near 0.9255 at the latest, to defy the bearish chart pattern.
Following that, the 0.9300 threshold and the mid-October peak close to 0.9315 will be in focus.
USD/CHF: Hourly chart
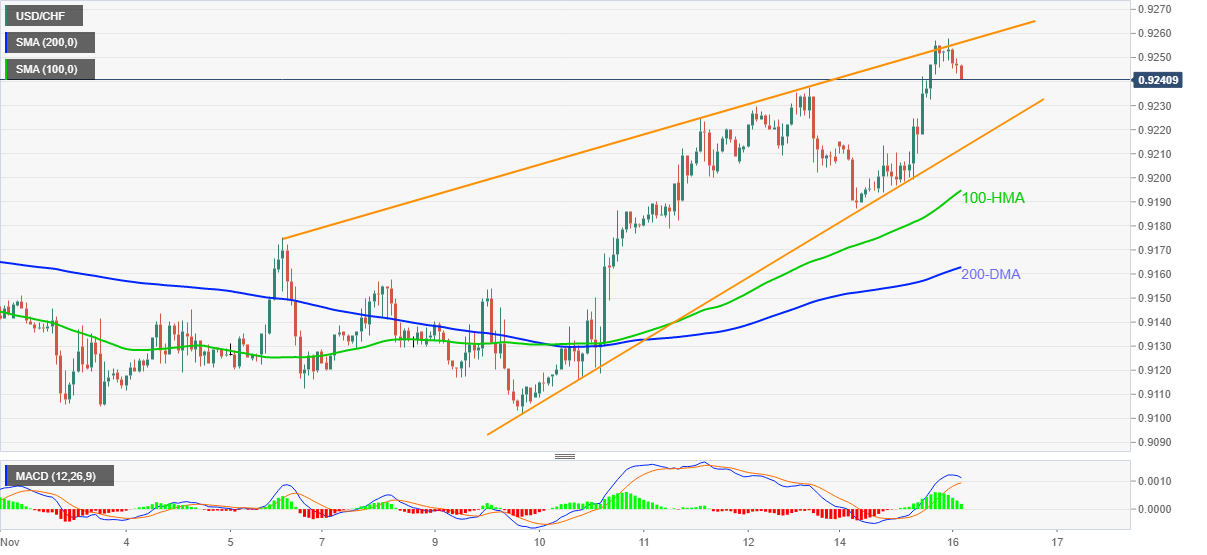
Trend: Further weakness expected
"Economy and inflation would have to turn out very differently for the board to consider a hike next year," the Reserve Bank of Australia (RBA) Governor Phillip Lowe said in a speech titled "Recent Trends in Inflation" at the Australian Business Economists Webinar on Tuesday.
Additional quotes
Latest data, forecasts do not warrant a rate rise in 2022.
Still plausible first increase in the cash rate will not be before 2024.
Could be case for hike before 2024 if inflation rises faster than expected.
Underlying inflation at 2.5% mid-point would not warrant a rate rise.
Need to see underlying inflation well within 2–3% range, confident it will stay there.
A sharp rise in underlying inflation would have different policy implications to a slow drift up.
Yet to see a broad-based pickup in wages growth in Australia.
Our business liaison suggests most retain a strong cost control mindset.
Energy prices in Australia trending lower due to wind, solar capacity.
Likely global inflation pressures will moderate over next 18 months as demand/supply adjusts.
Market reaction
In a knee-jerk reaction to these comments, AUD/USD spiked to daily highs of 0.7369 before retreating to 0.7358.
At the time of writing, the aussie is trading at 0.7365, up 0.31% on the day.
| Raw materials | Closed | Change, % |
|---|---|---|
| Brent | 82.25 | 0.04 |
| Silver | 25.037 | -1 |
| Gold | 1862.497 | -0.22 |
| Palladium | 2142.73 | 1.66 |
- USD/JPY bulls taking charge to test the first layer of resistance.
- Bulls need to commit at this juncture or face headwinds all the way back to 114.06.
As per the prior analysis, USD/JPY: More bullish daily confluences you can shake a candlestick at, the pair is demonstrating bullish vigour as the Tokyo session picks up in terms of volatility.
The following illustrates the prospects of a run all the way to the cycle highs near 114.70 for the sessions ahead:
USD/JPY prior daily chart analysis
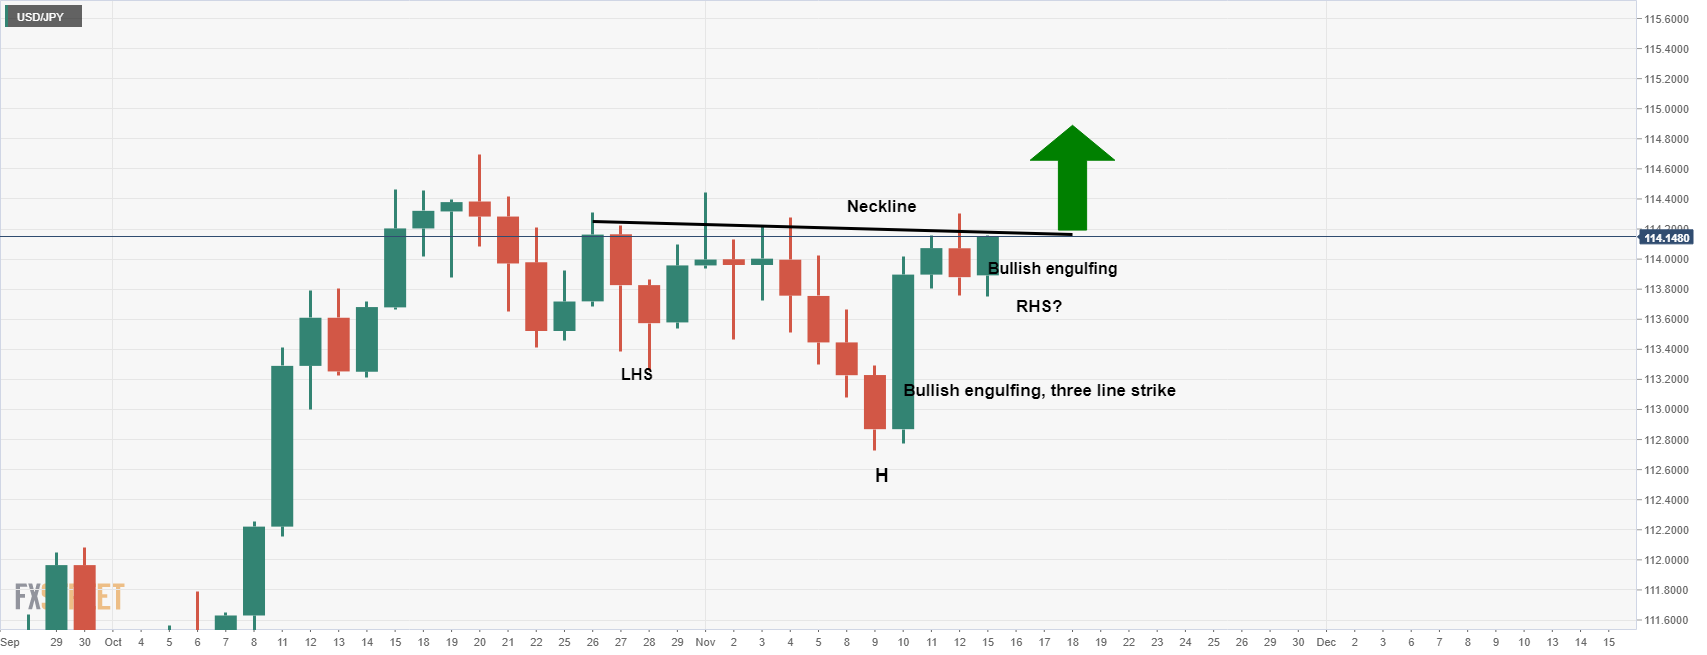
It was stated, in the above analysis, that ''on the daily time frame, we have multiple confluences of bullish signals. 1. Three line strike which is a reversal pattern. This is a bullish engulfing candle that was printed on November 10. 2. Inverse head and shoulders which is a bullish formation as well. 3. And lastly, Monday's bullish engulfing candle, (albeit with 10 mins left to go until the daily close).''
Meanwhile, on the lower time frames, the price is attempting to break out of the daily neckline as follows:
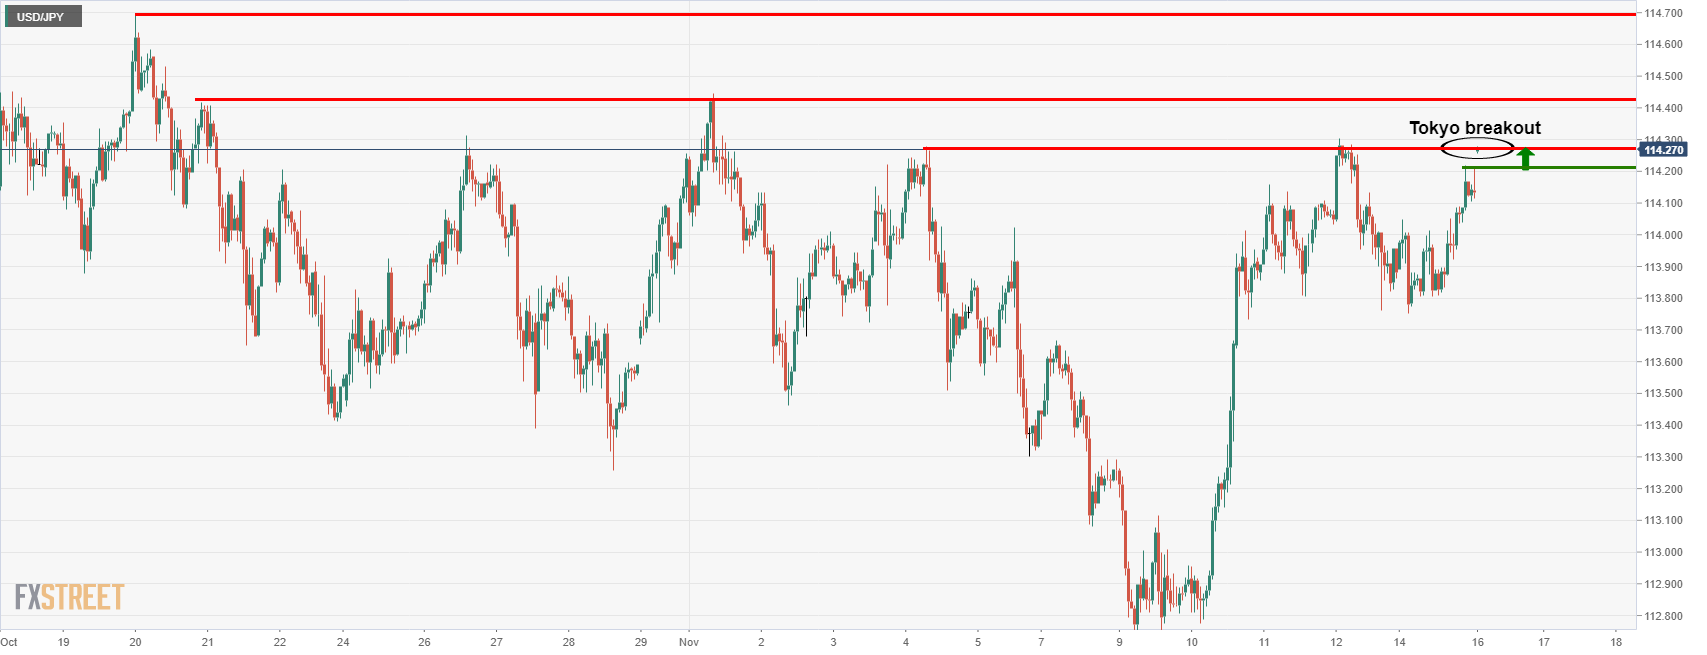
The price has rallied in 16 pips in a flash but has stalled at the first line of resistance in the high of 114.31. A break there will see bulls move in on the early Nov highs at 114.44 which guard a run all the way to the 2021 highs at 114.70. However, if the bulls do not commit at this juncture, then the daily trendline resistance and Friday's opening level at 114.06 could come under pressure again.
Japan Finance Minister Shunichi Suzuki said on Tuesday, he expects the economy to pick up in the October-December quarter.
He said that they need to keep eye on downside risks to the economic outlook.
Market reaction
USD/JPY is trading close to two-week highs of 114.32, benefiting from the recent strength in the US dollar and the Treasury yields. The spot is up 0.12% on the day.
- US Treasury yields ease from three-week top, S&P 500 Futures print mild gains.
- Biden-Xi introductory talks emphasize need for cooperation, US Pres. Biden signals $1.0 trillion infrastructure bill.
- Fed rate hike concerns test bond buyers ahead of the US Retail Sales.
Early Tuesday’s market sentient could best be described as the cautious optimism as the US Treasury yields retreat but the stock futures print only mild gains ahead of the key data.
That being said, the US 10-year Treasury yields drop 1.5 basis points (bps) to 1.606% by the press time, following the jump to refresh a three-week top, whereas the S&P 500 Futures rise 0.11% intraday to 4,684 at the latest.
An absence of negative comments during the introductory talks between US President Joe Biden and his Chinese counterpart Xi Jinping seems to have underpinned the latest positive mood in the market. US President Biden said that US-China relation is profoundly important to the world. On the same line, China’s Xi mentioned, “Stands ready to move US-China relations forward in a positive direction”.
Additionally, US President Biden’s signing of the $1.0 trillion stimulus package and the hopes of overcoming the covid woes also contribute to the mildly positive sentiment.
Alternatively, firmer US Empire State Manufacturing Index for October and the multi-year high US inflation expectations follow the 31-year peak of the Consumer Price Index (CPI) to hint at the extended rush to the risk-safety amid fears of the Fed rate hike. The same highlights today’s US Retail Sales for October, expected to reprint the 0.7% MoM growth, for fresh impulse.
It should be noted that Richmond Federal Reserve Bank President Thomas Barkin recently said, “If ‘need is there’ fed will act to curb inflation, but good to have a few more months ‘to see where reality is,’” Per Reuters.
Given the US Retail Sales convey the impact of the surging prices on the customer spending, the risk appetite will worsen, which in turn will direct the traders towards the US bond selling, effectively fueling the treasury yields and weigh on equities.
- Silver retreats from multi-day high, keeps bullish chart formation.
- Bearish MACD signals, failures to cross channel’s resistance favor pullback moves.
- 200-SMA becomes the key hurdle for sellers, bulls need fresh monthly high to tighten grips.
Silver (XAG/USD) keeps the previous day’s pullback from a three-month peak, around $25.10 during early Tuesday. In doing so, the bright metal steps back from the upper line of an ascending trend channel from late September amid bearish MACD signals.
The commodity’s latest consolidation eyes a two-week-old support line, near $24.80, at the momentum. However, the XAG/USD bears remain cautious until the quote stays inside the bullish chart pattern, staying above $23.70. Adding to the downside filters is the 200-SMA level near $23.65.
Should the bullion prices remain weak past $23.65, the monthly low of $23.02 will be on silver sellers’ radar.
On the flip side, the stated channel’s upper line around $25.50 can probe the silver bulls ahead of directing them to the August month’s high near $26.00.
Overall, XAG/USD bulls seem to have tired of late but the upside momentum isn’t eroded yet.
Silver: Four-hour chart
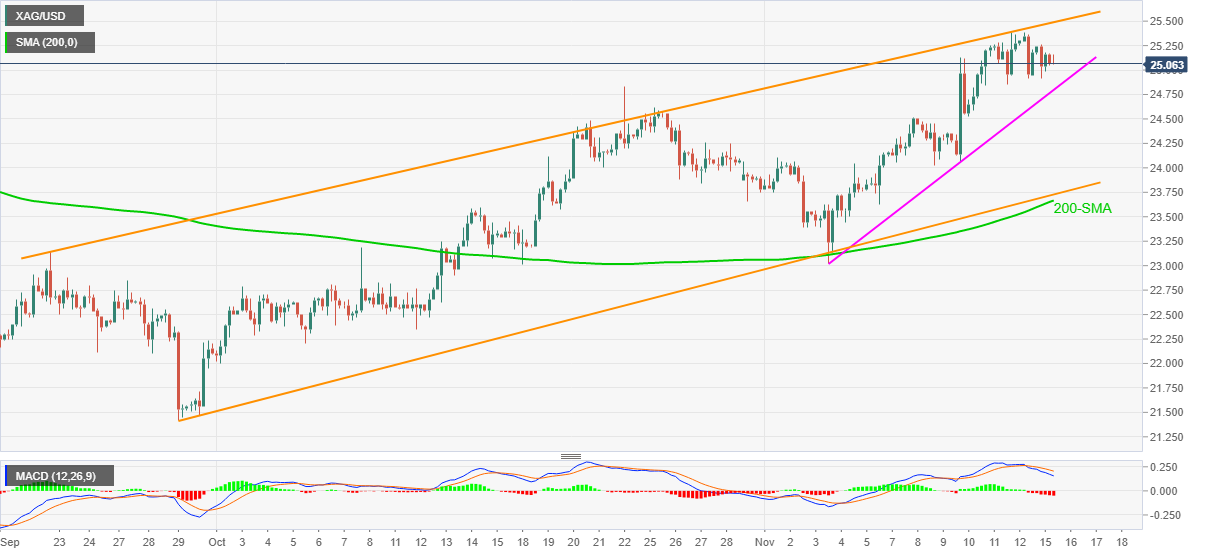
Trend: Pullback expected
| Time | Country | Event | Period | Previous value | Forecast |
|---|---|---|---|---|---|
| 00:30 (GMT) | Australia | RBA Meeting's Minutes | |||
| 02:30 (GMT) | Australia | RBA's Governor Philip Lowe Speaks | |||
| 04:30 (GMT) | Japan | Tertiary Industry Index | September | -1.7% | |
| 07:00 (GMT) | United Kingdom | Average earnings ex bonuses, 3 m/y | September | 6% | 5% |
| 07:00 (GMT) | United Kingdom | Average Earnings, 3m/y | September | 8.3% | 5.6% |
| 07:00 (GMT) | United Kingdom | ILO Unemployment Rate | September | 4.5% | 4.4% |
| 07:00 (GMT) | United Kingdom | Claimant count | October | -51.1 | |
| 07:45 (GMT) | France | CPI, y/y | October | 2.2% | 2.6% |
| 07:45 (GMT) | France | CPI, m/m | October | -0.2% | 0.4% |
| 09:00 (GMT) | France | IEA Oil Market Report | |||
| 10:00 (GMT) | Eurozone | Employment Change | Quarter III | 0.7% | 0.8% |
| 10:00 (GMT) | Eurozone | GDP (QoQ) | Quarter III | 2.1% | 2.2% |
| 10:00 (GMT) | Eurozone | GDP (YoY) | Quarter III | 14.2% | 3.7% |
| 13:15 (GMT) | Canada | Housing Starts | October | 251.2 | 255 |
| 13:30 (GMT) | U.S. | Retail sales | October | 0.7% | 1.2% |
| 13:30 (GMT) | U.S. | Import Price Index | October | 0.4% | 0.9% |
| 13:30 (GMT) | U.S. | Retail Sales YoY | October | 13.9% | |
| 13:30 (GMT) | U.S. | Retail sales excluding auto | October | 0.8% | 1% |
| 14:15 (GMT) | U.S. | Capacity Utilization | October | 75.2% | 75.8% |
| 14:15 (GMT) | U.S. | Industrial Production (MoM) | October | -1.3% | 0.7% |
| 14:15 (GMT) | U.S. | Industrial Production YoY | October | 4.6% | |
| 15:00 (GMT) | U.S. | NAHB Housing Market Index | November | 80 | 80 |
| 15:00 (GMT) | U.S. | Business inventories | September | 0.6% | 0.6% |
| 16:10 (GMT) | Eurozone | ECB President Lagarde Speaks | |||
| 17:00 (GMT) | U.S. | FOMC Member Bostic Speaks | |||
| 17:00 (GMT) | Canada | BOC Deputy Governor Lawrence Schembri Speaks | |||
| 19:55 (GMT) | U.S. | FOMC Member Harker Speaks | |||
| 20:30 (GMT) | U.S. | FOMC Member Daly Speaks | |||
| 21:00 (GMT) | U.S. | Total Net TIC Flows | September | 91 | |
| 21:00 (GMT) | U.S. | Net Long-term TIC Flows | September | 79.3 | |
| 21:45 (GMT) | New Zealand | PPI Input (QoQ) | Quarter III | 3% | |
| 21:45 (GMT) | New Zealand | PPI Output (QoQ) | Quarter III | 2.6% | |
| 23:50 (GMT) | Japan | Core Machinery Orders | September | -2.4% | 1.8% |
| 23:50 (GMT) | Japan | Core Machinery Orders, y/y | September | 17% | 17.4% |
| 23:50 (GMT) | Japan | Trade Balance Total, bln | October | -622.8 | -310 |
In recent trade today, the People’s Bank of China (PBOC) set the yuan (CNY) at 6.3924 vs the last close of 6.3839 and the estimate at 6.3921.
About the fix
China maintains strict control of the yuan’s rate on the mainland.
The onshore yuan (CNY) differs from the offshore one (CNH) in trading restrictions, this last one is not as tightly controlled.
Each morning, the People’s Bank of China (PBOC) sets a so-called daily midpoint fix, based on the yuan’s previous day closing level and quotations taken from the inter-bank dealer.
- The kiwi pair will find impetus from NZ PPI, US Fed comments.
- NZD/USD is riding on the back of upbeat Chinese Retail Sales and Industrial Output data.
- RBA governor Philip Lowe speech could have an impact on the kiwi.
NZD/USD continues to test the 0.7050 level during Asian hours on Tuesday. The kiwi is trading up 0.09% at 0.7041 with a high of 0.7052 and a low of 0.7034 at press time.
The kiwi is trading in the green territory on the back of upbeat Chinese Retail Sales and Industrial Output data. On Monday, Chinese economic data showed that Retail Sales and Industrial Output jumped 4.9% and 3.5% YoY in October. So far, the pair has been dominated by concerns over the Chinese economic slowdown led by the debt crisis in the property sector.
Furthermore, expectations of yet another rate hike for November by the Reserve Bank of New Zealand keeps investors' expectations high. Reports suggest that New Zealand's central bank is widely expected to hike rates by at least 0.25%. In October, the central bank had raised interest rates by 0.5%, aimed to curb the rising inflation.
The US dollar index, which measures its value against a basket of its peers, advances 0.42%, sitting at 95.52 and renewed its yearly high.
The kiwi traders will pay attention to New Zealand's Producer Price Index (PPI) input/output data and US Retail Sales figures. Also, a slew of US Fed speakers that are lined up to speak on Tuesday will provide impetus.
NZD/USD technical levels
- DXY seesaws around 16-month top, eases from multi-day top of late.
- Treasury yields retreats as Biden-Xi talks begin, amid pre-US Retail Sales anxiety.
- US President Biden signs a $1.0 trillion infrastructure bill, Fedspeak keeps struggling to tame inflation fears.
- US data, Sino-American discussion and the rate hike chatters are in focus.
US Dollar Index (DXY) consolidates recent gains around the highest levels since July 2020, flashed the previous day, easing to 95.48 during early Tuesday. The greenback gauge tracks the US Treasury yields to portray the recent pullback amid mixed concerns.
That said, the US 10-year Treasury yields drop 2.4 basis points (bps) to 1.597% by the press time, following the jump to refresh a three-week top.
The retreat of the Treasury yields could be linked to the recent positive headlines from the talks between US President Joe Biden and his Chinese counterpart Xi Jinping. US President Biden said that US-China relation is profoundly important to the world. On the same line, China’s Xi mentioned, “Stands ready to move US-China relations forward in a ‘positive direction’”.
Also positive for the sentiment is US President Biden’s formal signing of the $1.0 trillion infrastructure spending bill.
It should be noted, however, that a jump in the US Empire State Manufacturing Index and inflation expectations keep the DXY bulls hopeful ahead of the US Retail Sales for October, expected to reprint the 0.7% MoM growth.
Read: US Retail Sales Preview: Win-win for the dollar? Three scenarios, only one dollar-negative
Against this backdrop, S&P 500 Futures part ways from a sluggish week-start by the Wall Street benchmarks, with mild gains. Though, fears of the Fed rate hike and 31-year high inflation data from the US will amplify the US Dollar Index run-up should the US data arrive as stronger-than-forecast.
Technical analysis
Overbought RSI conditions challenge US Dollar Index bulls below June 2020 lows surrounding 95.72. Pullback moves, however, remain less important until staying beyond the September 2020 peak of 94.74.
A virtual meeting between Chinese President Xi Jinping and U.S. President Joe Biden has started, according to Chinese state media.
The US President Job Biden has explained that the responsibilities as leaders of China and the US are to ensure ties do not veer into open conflict.
China's premier Xi Jinping has stated that both China and the US face multiple challenges together and that they must increase communication and cooperation. He stands ready to move forward with the US in a positive direction.
What's at stake?
This is the first time the two leaders are meeting face to face via video since Mr Biden took office in January.
Biden will seek to manage competition between the US and China to ensure it does not spiral into conflict.
On the weekend, president Joe Biden explained that "this meeting is about our ongoing efforts to responsibly manage the competition, not agreeing to a specific deliverable or outcome.''
"Setting the terms of the competition will be an ongoing effort and this meeting between the two leaders is one step in that," said a senior US administration official, who spoke on condition of anonymity in a briefing with reporters on Sunday.
In a phone call ahead of the Xi-Biden summit, Chinese Foreign Minister Wang Yi last Saturday warned Secretary of State Antony Blinken not to "send the wrong signals" to pro-independence forces in Taiwan.
''The Chinese will not want a military conflict with the US, and the only possible scenario that could happen would be if it was related to Taiwan'', said Prof Hoo."
''I think Xi would want some form of assurance from Biden himself that the US will still stick to its longstanding one-China policy."
- AUD/USD remains sidelined as RBA Minutes reiterate no rate hike until 2024.
- Convergence of 100, 50-DMA guard immediate upside, bears need validation from 61.8% Fibonacci retracement.
- Bearish MACD signals, descending Momentum line keep sellers hopeful.
AUD/USD picks up bids to refresh intraday top around 0.7355, up 0.13% on a day, following the releases of the RBA Meeting Minutes during Tuesday’s Asian session. That said, traders await RBA Governor Philip Lowe’s speech, around 02:30 AM GMT, for fresh clues.
Read: RBA Minutes: Prepared to be patient until wage and inflation targets are met
Even so, the quote remains below the 100-DMA and 50-DMA confluence near 0.7360-65 with the bearish MACD signals and downward sloping Momentum line teasing the sellers.
The expected pullback moves may initially test the 50% Fibonacci retracement (Fibo.) level of August-October upside, around 0.7330, before challenging the recent swing lows around 61.8% Fibo. level of 0.7277.
While the 0.7300 threshold will offer an intermediate halt during the fall, September’s low surrounding 0.7170 can please the AUD/USD bears past 0.7277.
Meanwhile, a daily closing beyond the 0.7365 hurdle could propel the quote towards a convergence of the October 22 low and 23.6% Fibonacci retracement level near 0.7450.
Following that, September’s high of 0.7478 and the 0.7500 round figure can challenge the AUD/USD bulls before directing them to the previous month’s top of 0.7557.
AUD/USD: Daily chart
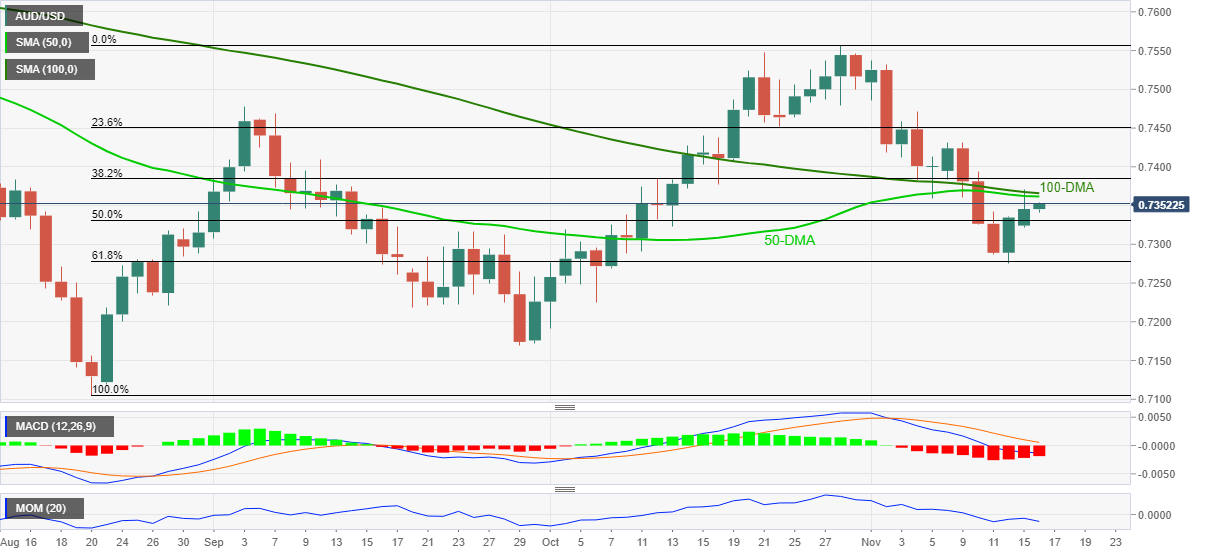
Trend: Further weakness expected
The minutes of the November 2021 Monetary Policy Meeting of the Reserve Bank Board has been released where the central bank is repeating that they are prepared to be patient.
The risks to the inflation forecast had changed.
QE continuation at the current pace seems appropriate and the cash rate to remain at its current level until 2024 or until wage and inflation criteria are met.
AUD/USD stays bid
The Aussie is was slightly offered on the release and then turned bid as investors wait for the head of the RBA, Phillip Lowe, to speak in an hours time.
Markets, however, are not accepting the central bank's dovishness. Instead, rates are barely changed and the Aussie is higher in a sign that traders are bettering against the RBA and are expecting a rate hike as soon as next year.
About the RBA minutes
The minutes of the Reserve Bank of Australia meetings are published two weeks after the interest rate decision. The minutes give a full account of the policy discussion, including differences of view.
They also record the votes of the individual members of the Committee. Generally speaking, if the RBA is hawkish about the inflationary outlook for the economy, then the markets see a higher possibility of a rate increase, and that is positive for the AUD.
- USD/CAD hesitates to extend pullback from six-week top, sidelined of late.
- WTI crude oil fades rebound from one-week low amid sluggish sentiment.
- DXY tracks US Treasury yields around multi-day top.
- Cautious sentiment ahead of US data joins mixed concerns over Fed rate hike, Sino-American talks to test momentum traders.
USD/CAD bears take a breather after a two-day downtrend, taking rounds to 1.2510 during Tuesday’s Asian session. In doing so, the Loonie pair portrays the market’s indecision ahead of the key US Retail Sales amid mixed catalysts.
Among the positives are the chatters over the US stimulus and Fed’s next moves, as well as US-China virtual meeting, whereas WTI crude oil’s rebound joins Bank of Canada (BOC) rate lift talks to weigh on the USD/CAD prices.
WTI crude oil cheered hopes of increasing demand and US President Joe Biden’s formal announcement of the $1.0 trillion infrastructure spending plan. Also favoring the oil bulls, and the USD/CAD bears in turn, was the US policymakers’ struggle to defend the Democratic pressure to tap the Strategic Petroleum Reserve (SPR) to cap elevated gasoline prices.
Elsewhere, US President Joe Biden and his Chinese counterpart Xi Jinping are up for a virtual meeting after multiple months of silence among the world’s top two economies, which favor the sentiment and weigh on the USD/CAD prices. However, the multi-year high US inflation expectations keep the pair buyers hopeful despite the Fed policymakers' rejection of a rate hike concerns. Recently, Richmond Federal Reserve Bank President Thomas Barkin said, “If ‘need is there’ fed will act to curb inflation, but good to have a few more months ‘to see where reality is.’”
Amid these plays, the US 10-year Treasury yields jumped to a fresh three-week high, recently sluggish around 1.61%, while previously underpinning the US Dollar Index rally to renew the yearly top. However, the Wall Street benchmarks traded mixed and restrict the initial moves of the S&P 500 Futures.
Moving on, updates from the first in many months talks between US President Joe Biden and his Chinese counterpart Xi Jinping will offer immediate direction to the USD/CAD traders ahead of the US Retail Sales for October, expected to reprint the 0.7% MoM growth.
Read: US Retail Sales October Preview: Inflation Is the key, not Retail Sales
Technical analysis
USD/CAD pullback from 50% Fibonacci retracement of August-October downtrend, around 1.2620, directs the quote towards the 200-DMA level of 1.2470.
| Pare | Closed | Change, % |
|---|---|---|
| AUDUSD | 0.73461 | 0.26 |
| EURJPY | 129.748 | -0.51 |
| EURUSD | 1.1368 | -0.67 |
| GBPJPY | 153.063 | 0.12 |
| GBPUSD | 1.34108 | -0.03 |
| NZDUSD | 0.70406 | 0.07 |
| USDCAD | 1.25081 | -0.21 |
| USDCHF | 0.9249 | 0.43 |
| USDJPY | 114.123 | 0.16 |
- AUD/NZD bears are being denied the central bank divergence, so far.
- AUD/NZD is taking on critical areas of resistance ahead of key AUD events.
AUD/NZD is defying the fundamentals between the central banks of the two nations, taking on technical resistance on the daily chart and eating into stops through 1.0420.
The Reserve Bank of Australia minutes are going to be an interesting event for AUD in the absence of anything else this week that might move the needle besides a speech by RBA Governor Lowe an hour later in the day. The following illustrates the technical picture heading into the events.
AUD/NZD daily chart
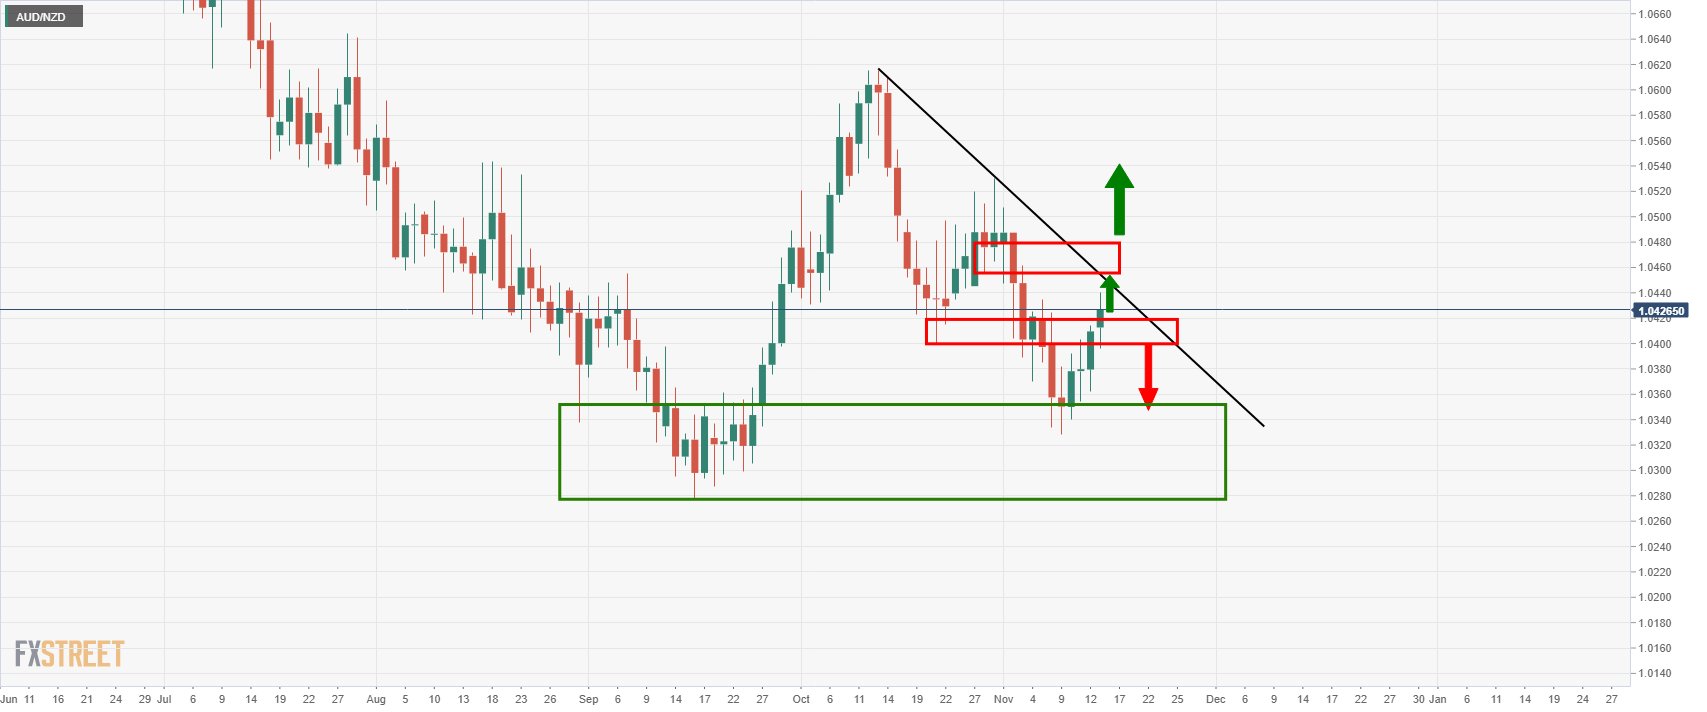
The daily chart shows that the price is moving in on the dynamic trendline resistance which would be expected to hold. This will also safeguard stops above the horizontal resistance near 1.0450.
AUD/NZD H4 chart
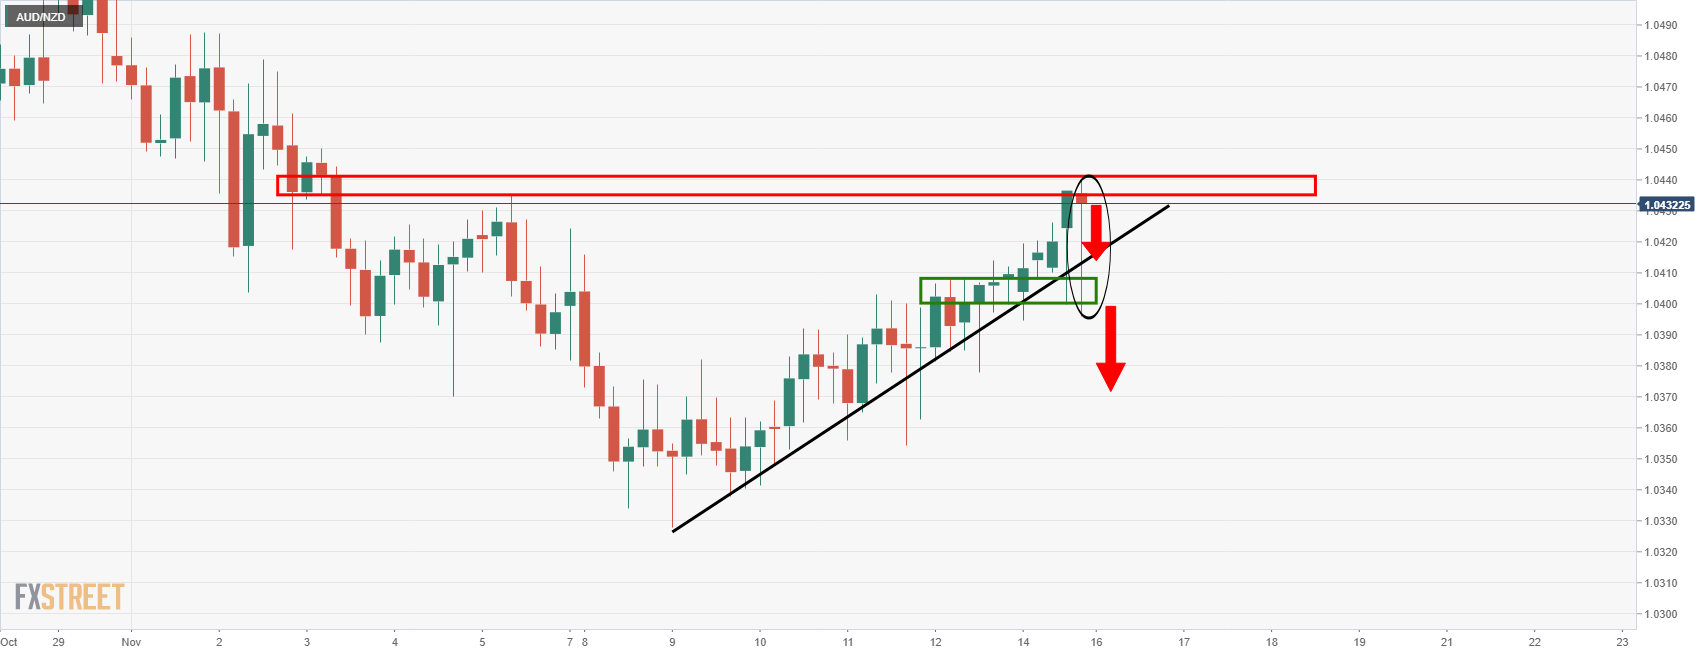
The 4-hour chart is showing signs of weakness, however, as the price leaves a downside wick that would be expected to be filled in. The bears will be in charge in doing so and testing below the dynamic trendline support. On a break of this support, the bears will be in the running for a downside daily extension below 1.0330.
- Gold struggles around five-month high, retreats of late.
- US-China talks, indecision over Fed rate hike and pre-data anxiety portray sluggish markets.
- DXY tracks Treasury yields to the north as 78.6% Fibonacci retracement, yearly resistance line challenge gold buyers.
- Gold Price Forecast: Bulls in charge and still aiming for $1,900
Gold (XAU/USD) takes offers to refresh intraday low, following an uptick to refresh a five-month high. That said, the yellow metal trades near $1,862 by the press time of Tuesday’s Asian session.
The commodity buyers initially cheered upbeat market sentiment to renew the multi-day top during early Monday before the heavy run-up in the US Treasury yields and firmer US Dollar dragged the gold prices. Also challenging the quote is the market’s cautious mood ahead of the key US Retail Sales for October, expected to reprint the 0.7% MoM growth.
Read: US Retail Sales Preview: Win-win for the dollar? Three scenarios, only one dollar-negative
That said, the US 10-year Treasury yields jumped to a fresh three-week high, underpinning the US Dollar Index rally to renew the yearly top. However, the Wall Street benchmarks traded mixed and restrict the initial moves of the S&P 500 Futures.
Although optimism surrounding the US-China talks and US stimulus favor the gold buyers, the Fed rate hike concerns challenge the metal’s upside momentum. US President Joe Biden formally signed his $1.0 trillion bi-partisan infrastructure bill but a 16-year high number of the US inflation expectations keep reflation woes on the top despite the Fed policymakers’ rejections. Recently, Richmond Federal Reserve Bank President Thomas Barkin said, “If ‘need is there’ fed will act to curb inflation, but good to have a few more months ‘to see where reality is.’”
Adding to the risk catalysts is the optimism surrounding the US-China talks. That said, US President Joe Biden and his Chinese counterpart Xi Jinping are up for a virtual meeting after multiple months of silence among the world’s top two economies.
Moving on, the qualitative factors may keep the gold buyers entertained, likely challenged, ahead of the key US data.
Technical analysis
Despite refreshing the multi-day top, gold fails to provide a daily closing beyond a descending trend line from January and 78.6% Fibonacci retracement (Fibo.) of June-August downside.
In addition to the key Fibo. and the yearly resistance line, overbought RSI conditions also challenge gold buyers around the key $1,867-68 level.
Also challenging the gold buyers past $1,868 is the $1,900 threshold and June’s swing high near $1,917, a break of which will test the yearly peak of $1,959.
Alternatively, pullback moves may aim for the 61.8% Fibonacci retracement level around $1,830.
Should gold sellers dominate past $1,830, October’s high near $1,813 will be in focus. It’s worth noting that the tops marked in July and September around $1,834 add to the downside filters.
To sum up, gold remains bullish but a pullback can’t be ruled out.
Gold: Daily chart

Trend: Pullback expected
© 2000-2026. All rights reserved.
This site is managed by Teletrade D.J. LLC 2351 LLC 2022 (Euro House, Richmond Hill Road, Kingstown, VC0100, St. Vincent and the Grenadines).
The information on this website is for informational purposes only and does not constitute any investment advice.
The company does not serve or provide services to customers who are residents of the US, Canada, Iran, The Democratic People's Republic of Korea, Yemen and FATF blacklisted countries.
Making transactions on financial markets with marginal financial instruments opens up wide possibilities and allows investors who are willing to take risks to earn high profits, carrying a potentially high risk of losses at the same time. Therefore you should responsibly approach the issue of choosing the appropriate investment strategy, taking the available resources into account, before starting trading.
Use of the information: full or partial use of materials from this website must always be referenced to TeleTrade as the source of information. Use of the materials on the Internet must be accompanied by a hyperlink to teletrade.org. Automatic import of materials and information from this website is prohibited.
Please contact our PR department if you have any questions or need assistance at pr@teletrade.global.
-637726915066702957.png)
