- Analytics
- News and Tools
- Market News
CFD Markets News and Forecasts — 15-11-2021
- EU GDP data release and ECB Lagarde’s speech, due later in the day, will affect the pair.
- EUR/USD continues to slide as US yields remain strong ahead of US Retail Sales.
EUR/USD continues to trade around yearly low levels of 1.1370 during the early Asian session on Tuesday. Multiple factors and data announcements due for later in the day as well as in the week will determine the pair's outcome. At the time of reporting, the pair is trading at 1.1371, up by 0.1%. The currency pair has not been as low as this since July last year.
The market participants’ sentiments are going to be primarily affected by Federal Reserve speakers, the Eurozone’s upcoming Gross Domestic Product data release and European Central Bank (ECB) President Christine Lagarde’s speech, due for later in the day.
Notably, Lagarde’s previous statement on the rate hike had pushed the pair lower. She hinted that the conditions for a rate hike are unlikely to be met in 2022, providing support to the dovish sentiments in markets.
Along with this, investors are also eyeing the US Retail Sales data. Improved figures could benefit the US dollar on expectations for higher growth, while failure to meet the expectations would trigger a dollar-positive risk-off mood.
In addition, as US President Joe Biden formally signed his $1.0 trillion, bi-partisan infrastructure bill that adds another challenge to the pair’s seller. The US 10-year Treasury yields jumped to a fresh three-week high of 1.61%, supporting the US Dollar Index rally at 95.51 to renew the yearly top.
Meanwhile, as the greenback continued, its strength weakens investor appetite. EUR/USD may pause at its current spot for a while but is just resting up before moving to either side.
EUR/USD technical levels
Early Tuesday morning in Asia, at 00:30 GMT, the Reserve Bank of Australia (RBA) will release minutes of the latest monetary policy meeting held during November.
The RBA’s November month monetary policy meeting surprised markets with no changes to the official cash rate (OCR), leaving it at a record low of 0.10%. The board decided to discontinue the target of 10 basis points (bps) for the April 2024 Australian government bond while also extending the bond purchase at the rate of $4 billion a week until at least mid-February 2022.
Although the RBA’s move was initially considered dovish, followed by a downbeat Aussie jobs report, recent unlocks in Australia and upbeat data from the biggest customer China keep the policy hawks hopeful, which in turn highlight today’s Minutes as the key.
Following the RBA Minutes, RBA Governor Philip Lowe is up for a speech around 02:30 AM GMT and will offer details of the Aussie central bank’s next move.
Westpac is on the same line and said,
At 11:30 AEST, 08:30 Singapore time, the RBA’s minutes for the November policy decision will provide more color around the Board’s central view and the risks. But for a more timely update on the bank’s thinking, there will be more interest in the speech by RBA Governor Lowe at 1:30 pm Sydney time, with the hot topic ‘Recent Trends in Inflation’, followed by Q&A.
How could the minutes affect AUD/USD?
AUD/USD fades the two-day rebound from the monthly low ahead of the RBA minutes, pressured around 0.7350 by the press time. In doing so, the Aussie pair struggles amid mixed clues over the Fed rate hike and US stimulus update. Also challenging the AUD/USD moves are the anxiety over the US Retail Sales data after 31-year high inflation figures.
Considering the increasing odds of the Aussie rate hike and firmer yields, RBA policymakers’ readiness to alter the benchmark rate could help the AUD/USD bulls to tighten their grips. However, any strong rejection of the hawkish policy moves, considering the latest economics, could help the pair to drop towards the monthly low surrounding 0.7275.
Technically, a convergence of 100-DMA and 50-DMA, around 0.7360-65 restricts the AUD/USD pair’s bounce off the 61.8% Fibonacci retracement (Fibo.) level of the August-October uptrend, near 0.7275. Hence, a decisive break of the stated levels becomes necessary for a clear direction. Bearish MACD and steady RSI line suggest the sellers are having an upper hand.
Key Notes
AUD/USD bulls pause around 0.7350 with eyes on RBA Minutes, Governor Lowe
AUD/USD Forecast: Further recoveries depend on the RBA Minutes
About the RBA minutes
The minutes of the Reserve Bank of Australia meetings are published two weeks after the interest rate decision. The minutes give a full account of the policy discussion, including differences of view. They also record the votes of the individual members of the Committee. Generally speaking, if the RBA is hawkish about the inflationary outlook for the economy, then the markets see a higher possibility of a rate increase, and that is positive for the AUD.
- NZD/JPY begins the Asian session on the wrong foot, down 0.01%.
- Worse than expected, Japanese GDP figures, amid risk-on market mood, boosted the NZD.
- NZD/JPY: A bullish-flag chart pattern could open the door for a renewed test of the 2021 year high at 82.50.
After trading for two consecutive days in the green, the NZD/JPY begins the Asian Pacific session, on the wrong foot, down some 0.01%, trading at 80.37 at the time of writing.
On Monday, the cross-currency pair edged higher, extending the New Zealand dollar rally against the Japanese yen, which suffered on dismal than expected Japanese GDP figures. Furthermore, the risk-on mood in the financial markets dented the prospects of safe-haven assets, like the Japanese yen.
NZD/JPY Price Forecast: Technical outlook
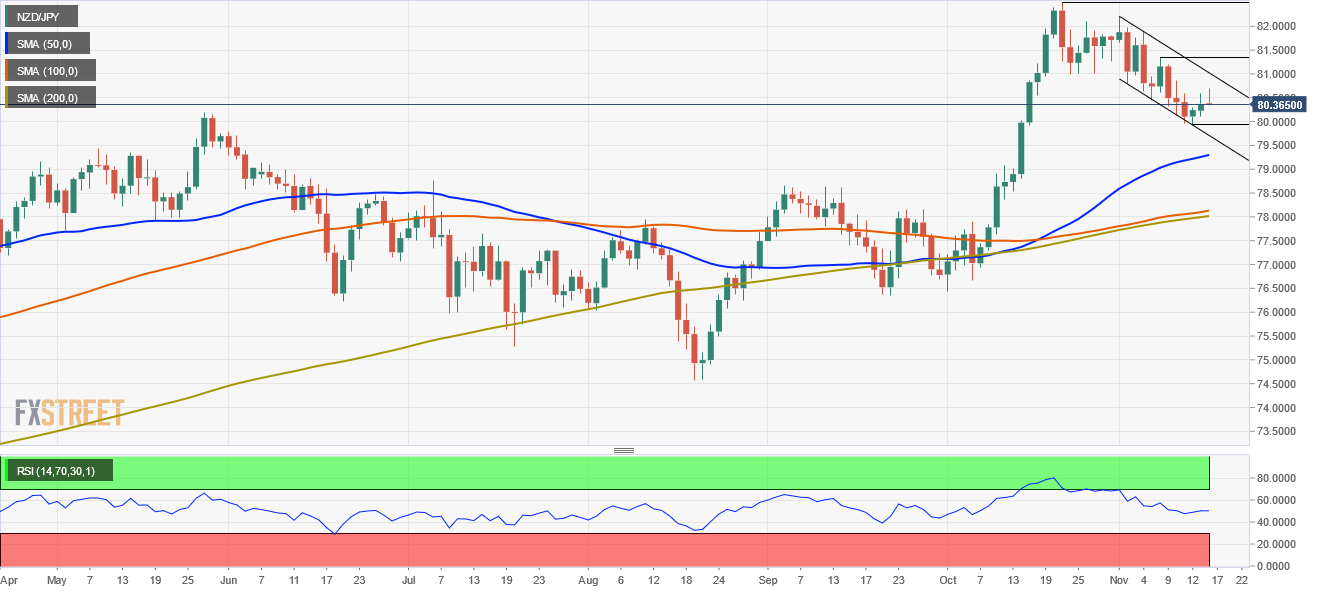
The daily chart depicts the NZD/JPY pair is trading within a descending channel that formed a bullish flag. Further, the daily moving averages (DMA’s) remain below the spot price, adding another upward bias signal. Moreover, the Relative Strength Index (RSI) is at 51, is slightly flat, but above the 50-midline. Also, the pair is approaching the top-trendline of the bullish flag, which in case of being broken, it could open the way for further gains.
In the abovementioned outcome, the first resistance level would be the November 8 high at 81.33. A breach of the latter would expose key essential levels like the November 1 high at 82.20, followed by the year-to-date high at 82.50.
On the flip side, failure to break above the bullish flag top-trendline, the NZD/JPY pair would keep trading within the 80.00-81.00 range.
- GBP/USD fades bounce off yearly low, retreats from one-week high.
- UK PM Johnson shows readiness to trigger Article 16 but says agreement with EU is still possible.
- Worsening covid conditions renew talks over British lockdown.
- Brexit talks, virus developments and UK/US data to entertain traders.
GBP/USD remains pressured towards the 1.3400 threshold, around 1.3415 during early Asian session Tuesday, as pessimism surrounding Brexit and the UK’s coronavirus conditions join the pre-jobs data anxiety. In doing so, the cable pair ignores hawkish comments from Bank of England (BOE) Governor Andrew Bailey.
Having earlier said that their aim remains to reach a consensual solution on to the Northern Ireland protocol, as reported by Reuters, UK Prime Minister Boris Johnson mentioned that the deal with the European Union (EU) is still possible. Intensive Brexit talks are on and the latest chatters surrounded the British readiness to trigger Article 16, the key clause to unilaterally avoid Brexit compliance over the Northern Ireland (NI) borders.
Elsewhere, BOE Governor Bailey also crossed wires, via Reuters, while saying that all future BoE policy meetings are now “in play” for a rate rise. The policymaker refrained to vote for an immediate end to the bank’s QE program during the latest monetary policy meeting and surprised markets. However, the jump in the inflation expectations and rate hike calls, per the CME’s BOEWatch indicator, highlights the hawkish case for the GBP/USD traders.
However, the recently peaking COVID-19 numbers in the UK and Europe raise concerns over the “Old Lady’s” early stop to the easy money and hence challenge the rate hike views. The same highlights today’s UK jobs report for fresh impulse. That being said, the headlines Claimant Count Change for October may have to improve from the previous -51.1K forecast to keep the GBP/USD buyers hopeful. Supporting the optimists is the upbeat market consensus over the ILO Unemployment Rate for three months to September, expected 4.4% versus 4.5% prior. Though, the Average Earnings are likely to be easy and may test the bulls.
On the other hand, the Fed rate hike concerns renew amid a jump in the US inflation expectations. However, the hawks may wait for the US Retail Sales for October, expected to reprint the 0.7% MoM growth.
Read: US Retail Sales October Preview: Inflation Is the key, not Retail Sales
It’s worth mentioning that the market sentiment dwindles and helps the US Dollar Index (DXY) to refresh multi-day top but sluggish equities test the momentum traders on a key day.
Technical analysis
Monthly descending trend line near 1.3465 guards the immediate upside of the GBP/USD prices before a one-month-old horizontal hurdle around 1.3565-70. Alternatively, the 1.3400 and a downward sloping support line from April, around 1.3340, become the key to watch.
US inflation expectations, as measured by the 10-year breakeven inflation rate per the St. Louis Federal Reserve (FRED) data, jumped to the fresh high since March 2005 while hitting the 2.76% level by the end of Monday’s North American session.
In doing so, the inflation gauge posts a one-week uptrend, also fueling the Fed rate hike expectations, ahead of the key US Retail Sales figures for October, expected to keep 0.7% MoM growth.
Also portraying the market’s rate hike fears is the jump in the US 10-year Treasury yields to a three-week high, around 1.618% at the latest.
Although the Fed rate hike chatters weigh on the sentiment and favor the US dollar bulls, US stimulus chatters and the Sino-American talks favor the market’s mood of late.
Read: AUD/USD bulls pause around 0.7350 with eyes on RBA Minutes, Governor Lowe
A stronger print of the US Retail Sales data could trim the market’s bullish bias towards the Fed’s next move and may help the greenback to consolidate the recent gains.
Read: US Retail Sales October Preview: Inflation Is the key, not Retail Sales
- AUD/JPY retreats from upper limit of weekly trading range.
- Upbeat Momentum, sustained trading above 50% Fibonacci retracement favor bulls.
- 61.8% Fibonacci retracement adds to the downside filters.
AUD/JPY grinds higher around the weekly top, sidelined near 83.85 amid the initial Asian session on Tuesday. In doing so, the cross-currency pair remains inside a short-term trading range below the 100-EMA.
However, the upward sloping Momentum line joins the quote’s ability to stay positive past 50% Fibonacci retracement (Fibo.) level of October month up-moves, near 83.05, to keep the pair buyers hopeful.
That said, a clear upside break of the stated EMA, around 84.05 by the press time, becomes necessary for the pair’s run-up towards the October 22 swing low of 84.60. Though, any further advances will be challenged by a three-week-old horizontal area near the 86.00 threshold.
In a case where the AUD/JPY bulls remain dominant past 86.00, the last month’s high near 86.25 will be in focus.
Alternatively, the lower end of the stated range, also surrounding the 50% Fibo., restricts the short-term downside of the AUD/JPY pair near the 83.00 round figure.
Should the pair sellers break 83.00 round-figure, 61.8% Fibonacci retracement of 82.30 and late September’s peak near 81.30 may entertain traders ahead of directing them to the previous month’s low of 79.90.
AUD/JPY: Four-hour chart
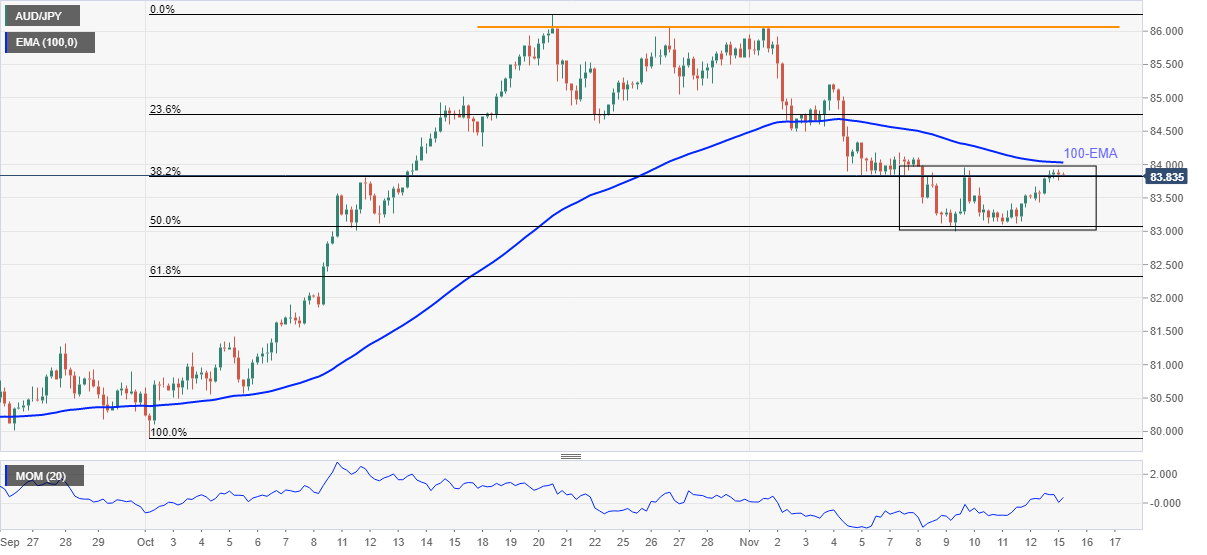
Trend: Further upside expected
- GBP/JPY begins on the right foot the Asian session, up 0.03%.
- The Japanese GDP contracts more than the -0.2% expected.
- GBP/JPY focus turns to UK’s employment figures, to be unveiled on Tuesday.
The British pound extends its two-day gains, up some 0.03% as the Asian session begins, trading at 153.08 at the time of writing. Overall, market sentiment is downbeat. Major US Stock indices finished in the red, losing between 0.01% and 0.64%. Furthermore, the third quarter’s weaker than expected Japanese GDP dragged the Japanese yen lower amid risk-on market mood.
Japan Gross Domestic Product (GDP) for the third quarter, shrank
On Monday, the Japanese economic docket featured the GDP for the Q3, which shrank 0.8%, more than the -0.2% expected by analysts, according to preliminary data released by the Cabinet Office. That curtailed the government’s anticipation of a rebound to a pre-pandemic level by year-end.
Japanese data blamed the resurgence of new COVID-19 cases, which spurred lockdowns across 21 prefectures, out of 47, asking people to stay at home, and restaurants and bars closed early to refrain from serving alcohol. Also, the car industry was affected by the chip shortage, forcing automakers to cut output around the summer.
In the meantime, UK’s prime minister Boris Johnson crossed the wires. He said that he is ready to trigger Article 16, despite continuing negotiations with the EU. Also, he added that an agreement is still possible while he hopes to negotiate a settlement with Northern Ireland.
On Tuesday, a light Japanese economic docket would leave the GBP/JPY pair dynamics in the hands of the British pound. Concerning the UK economic docket, employment figures could offer fresh impetus for traders, as the October report would be the first one without the furlough scheme provided for workers in the UK.
GBP/JPY Price Forecast: Technical outlook
-637726121012313623.png)
The daily chart depicts the GBP/JPY pair rebounded from the 100-day moving average (DMA), keeping its upward bias intact, with the 50-DMA at 153.31 and the 100-DMA at 152.63. Further, the 200-DMA lies well below the spot price. Furthermore, the GBP/JPY reclaimed the bottom of a descending channel broken two days before, leaving the 154.50-60 area as resistance.
However, to resume the upward bias, British pound buyers will need a daily close above the 50-DMA. In that outcome, the first supply area would be the psychological 154.00. A breach of the latter would expose the top-trendline of the descending channel around the 154.50-60 region.
On the flip side, failure at the 50-DMA would expose the confluence of the bottom-trendline of the descending channel and the 200-DMA around the 152.00-50 range.
“US President Joe Biden signed into law a $1 trillion infrastructure bill at a White House ceremony on Monday that drew Democrats and Republicans who pushed the legislation through a deeply divided US Congress,” said Reuters during early Tuesday morning in Asia.
Key quotes
The bill had become a partisan lightning rod, with Republicans complaining that Democrats who control the House of Representatives delayed its passage to ensure party support for Biden's $1.75 trillion social policy and climate change legislation, which Republicans reject.
The New York Times offered details of the bill as follows:
- $73 billion for the electricity grid.
- $66 billion for rail.
- $65 billion for broadband.
- $47 billion for climate resiliency.
- $21 billion for environmental projects.
- $15 billion for removing lead service lines.
- $7.5 billion for electric vehicles.
- $2 billion for underserved rural areas.
Market reaction
Given the already known news, traders paid little heed to the official announcement. However, the same builds recent optimism in the market ahead of the key US Retail Sales data.
Read: US Retail Sales Preview: Win-win for the dollar? Three scenarios, only one dollar-negative
- AUD/USD retreats after two-day run-up from monthly low.
- China data, hopes from Sino-American talks underpin bullish bias despite firmer DXY.
- Yields remain strong ahead of US Retail Sales, ignore Fedspeak to tame rate hike calls.
- RBA Minutes, Governor Lowe’s speech eyed for rate hike clues, US data will be important too.
AUD/USD fades a two-day rebound from a monthly low, pressured around 0.7345 at the start of Tuesday’s Asian session. The Aussie pair overcame firmer US Dollar Index (DXY) and Treasury yields to mark a positive week-start before easing from 0.7371 ahead of the Reserve Bank of Australia’s (RBA) latest monetary policy meeting minutes and a speech from Governor Philip Lowe.
A surprisingly strong China Retail Sales and Industrial Production data for October joined the People’s Bank of China’s (PBOC) liquidity injection to offer a positive start to the AUD/USD prices. China Retail Sales rose past 3.5% market forecast and 4.4% prior to 4.9% YoY whereas Industrial Production (IP) jumped to 3.5% versus 3.0% expected and 3.1% prior release. Further, the People’s Bank of China (PBOC) injected CNY1 trillion via one-year medium-term lending (MLF).
Also positive for the AUD/USD prices was optimism surrounding the US-China talks and US stimulus. US President Joe Biden and his Chinese counterpart Xi Jinping are up for a virtual meeting after multiple months of silence among the world’s top two economies.
It’s worth noting that US President Joe Biden formally signed his $1.0 trillion bi-partisan infrastructure bill and recently challenged the pair sellers. On the same line were the latest Fedspeak that tried to tame the rate hike talks and reflation fears. Recently, Richmond Federal Reserve Bank President Thomas Barkin said, “If ‘need is there’ fed will act to curb inflation, but good to have a few more months ‘to see where reality is.’”
Amid these plays, the US 10-year Treasury yields jumped to a fresh three-week high, underpinning the US Dollar Index rally to renew the yearly top. However, the Wall Street benchmarks traded mixed.
Looking forward, AUD/USD traders will pay close attention to the latest RBA Minute, followed by comments from RBA Governor Lowe, for clear direction after the downbeat Aussie jobs report preceded the recent unlocks. Should the policymakers sound optimistic, the RBA rate hike chatters will renew, which in turn can add to the pair’s latest rebound. Also important will be the US Retail Sales for October, expected to keep 0.7% MoM growth.
Read: US Retail Sales October Preview: Inflation Is the key, not Retail Sales
Technical analysis
A convergence of 100-DMA and 50-DMA, around 0.7360-65 restricts the AUD/USD pair’s bounce off the 61.8% Fibonacci retracement (Fibo.) level of the August-October uptrend, near 0.7275. Hence, a decisive break of the stated levels becomes necessary for a clear direction. Bearish MACD and steady RSI line suggest the sellers are having an upper hand.
Early Tuesday morning in Asia, Reuters quotes Richmond Federal Reserve Bank President Thomas Barkin’s comments, first appeared in Yahoo Finance, to confirm the policymaker’s “wait and see” approach.
Key quotes
Infrastructure bill not a "near term stimulant.”
Anticipate supply chains problems will last "well into next year".
Will watch wages, labor market for signs inflation is becoming more persistent.
Household and market indicators suggest inflation expectations over the medium to long term still in line.
If "need is there" fed will act to curb inflation, but good to have a few more months "to see where reality is."
Market reaction
Given the initial Asian session and the market’s wait for the US Retail Sales for October, traders paid little heed to the news.
Read: Forex Today: Sentiment driving financial markets
Early Tuesday morning n Asia, UK PM Boris Johnson crossed wires while speaking on Brexit and other political matters. While the UK leader shows readiness to trigger Article 16, he also remains hopeful of an agreement with the European Union (EU) as the Brexit talks continue.
Key quotes
The Russian pipeline to Europe poses a threat to stability.
An agreement with the EU is still possible.
Triggering Article 16 will be perfectly legitimate.
I hope to reach a negotiated settlement with northern Ireland.
FX implications
GBP/USD remains pressured around 1.3413, consolidating gains marked during Friday and Monday, irrespective of the positive news.
Read: GBP/USD bulls fail first attempt to break 1.3450 critical round number
- WTI recovered from an earlier dip under $80.00 and now trades flat and closer to $81.00.
- Some commodity strategists argued speculation over the US tapping the SPR was overdone.
Front-month futures for the American benchmark for sweet light crude oil, West Texas Intermediary or WTI, shrugged off earlier selling pressure that threatened to send prices below $80.00 and back towards monthly lows at $78.28 to trade flat near $81.00. Nonetheless, a cloud of worries is building for crude oil markets.
Analysts are concerned about a potential hit to crude oil demand in Europe this coming winter as Covid-19 infection rates rise and countries tighten health-related restrictions. Meanwhile, there was more verbal pressure from the White House at OPEC+ over their sluggish output hikes and jawboning from Democrat lawmakers in favour of releasing US crude oil reserves. Other touted concerns include the strengthening US dollar and global inflationary pressures that might pull forward central bank tightening, stifling economic growth (and the outlook for crude oil demand).
Traders also pointed to comments from the UAE’s Oil Minister about how global oil supply is likely to return to a surplus in Q1 2022 as US shale comes back online. London-based energy research house Rystad Energy said on Monday that US shale would likely return to its pre-pandemic output levels of 8.68M barrels per day in December.
A few commodity strategists argued that speculation about a move by the US to tap the Strategic Petroleum Reserve (SPR) had gone too far, which explained how crude oil prices were able to recover later in the session. But WTI is showing little sign of being at the beginning of posting a recovery all the way back to last week’s highs close to $85.00.
Speaking to Reuters, Louise Dixon, senior markets analyst at Rystad Energy, said “the market now seems to be less concerned about the current supply tightness, expecting it to be short-lived”. “Traders are instead refocusing on the return of two bearish factors – the possibility of more oil supply sources and more COVID-19 cases” she added.
- USD/JPY bulls are on the verge of a fresh cycle high.
- There are multiple bullish candle formations on the daily chart.
USD/JPY rallied again on Monday, showing the bullish intentions for the price following a very strong move last Wednesday which left a three-line bullish strike on the daily charts. The price is on the verge of printing a fresh cycle high after the greenback surged to a 16-month high against a basket of major peers. The dollar index DXY hit 95.50 on Monday, its highest since July 2020.
At the time of writing, USD/JPY is trading 0.24% higher into the close of the North American session. The pair rallied from a low of 113.75 and reached as high as 114.13, some 50 pips below the 20 Oct and 2021 cycle highs. Global growth and inflation concerns are underpinning the greenback, risks that are in their infancy.
All aboard the US dollar train
Gains in the heavily euro-weighted dollar index followed the European Central Bank President Christine Lagarde continuing to push back on market bets for tighter policy. Meanwhile, for the week ahead, investors will look to US Retail Sales data on Tuesday for clues as to where the dollar may be headed next. The data are to come in at 1.1% for last month, according to a Reuters poll.
Another influencer for the DXY will be the UK's economic diary this week where employment, inflation and retail sales numbers are expected to provide clues about whether the Bank of England will raise rates in December. However, as a fresh wave of covid swells of Europe, bets of a rate hike at the BoE are starting to dwindle following last month's hawkish hold. This could also feed into US dollar strength and thus tip the yen over the edge.
USD/JPY technical analysis
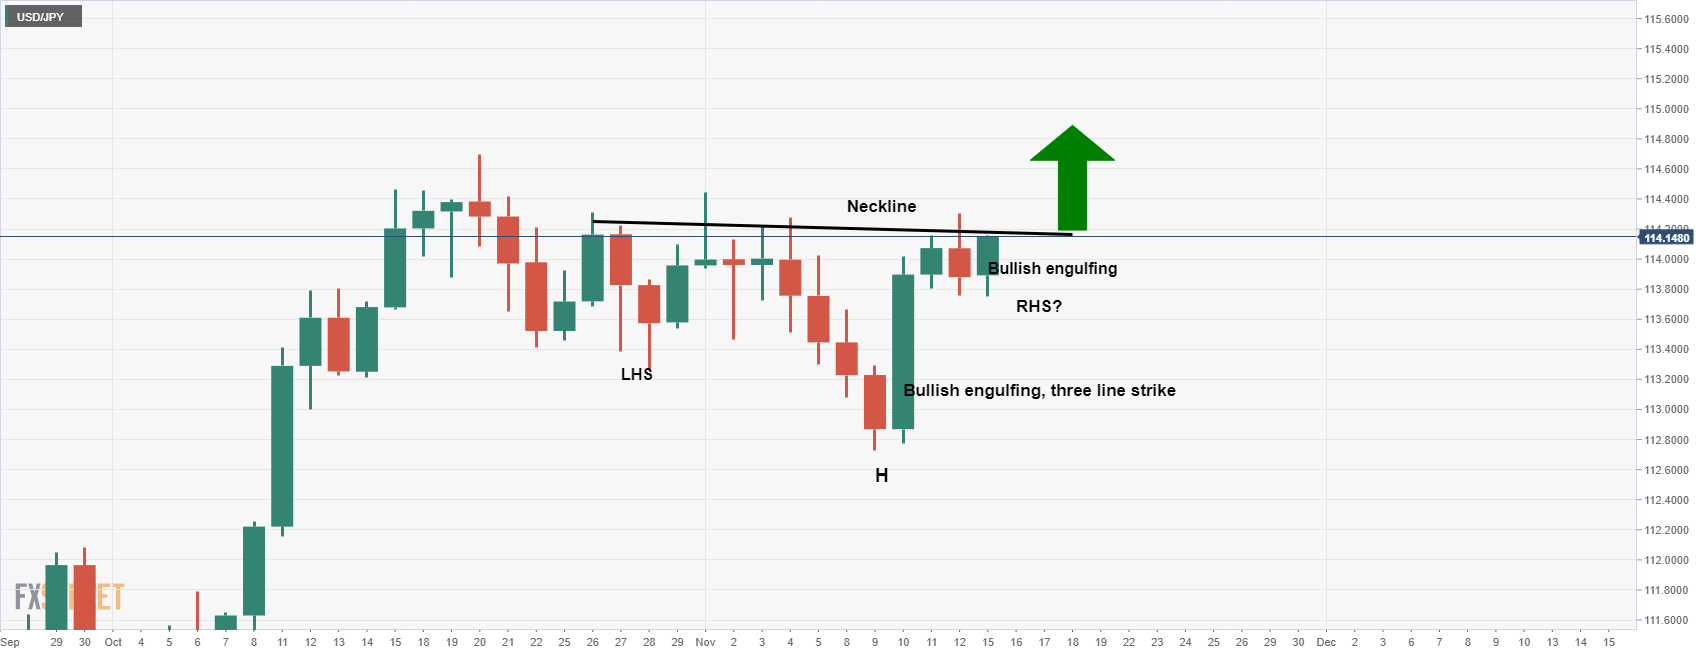
On the daily time frame, we have multiple confluences of bullish signals. 1. Three line strike which is a reversal pattern. This is a bullish engulfing candle that was printed on Nov. 10. 2. Reverse head and shoulders which is a bullish formation as well. 3. And lastly, Monday's bullish engulfing candle, (albeit with 10 mins left to go until the daily close).
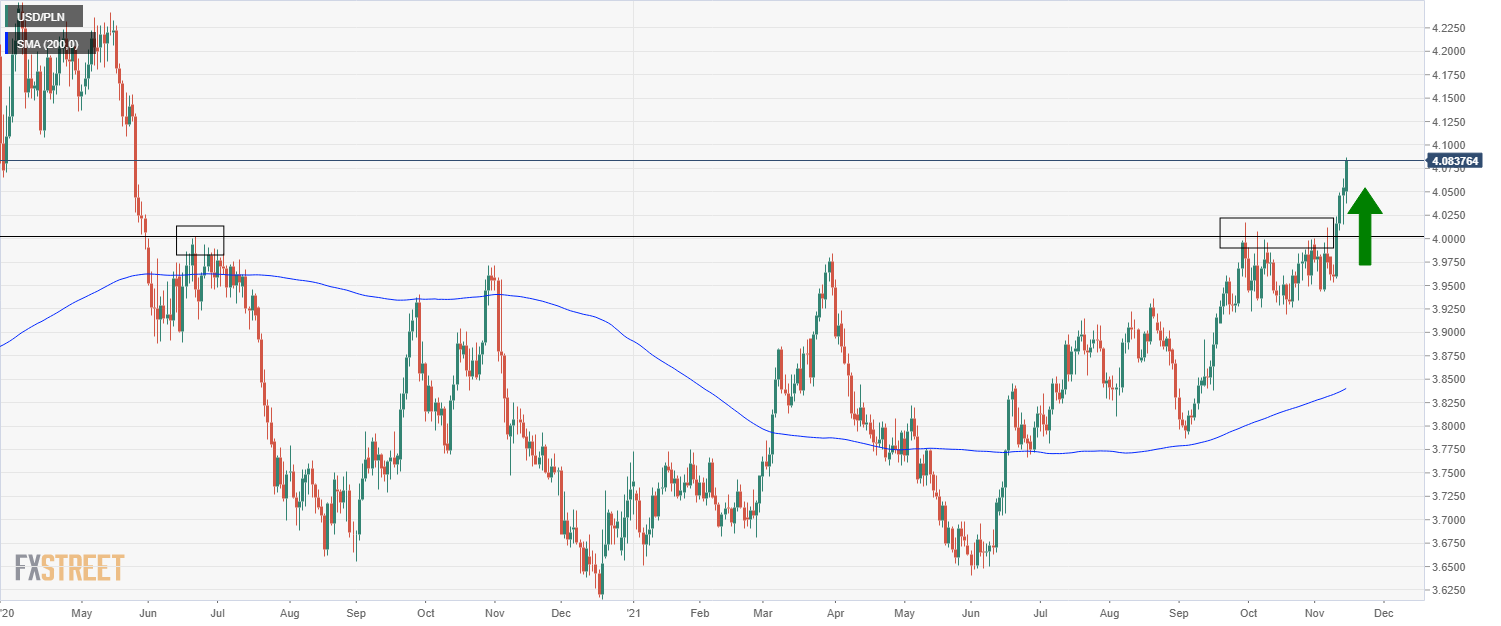
- USD/PLN hit fresh 19-month highs on Monday above 4.0800 and is now up more than 3.0% since last Wednesday.
- A weaker euro, as well as inflation concerns and not as hawkish as hoped for NBP commentary, hurt the Zloty.
USD/PLN continued its recent bull run on Monday to hit fresh 19-month highs at 4.0800, where it trades higher by about 0.75% on the day. Broad euro weakness amid concerns about the state of the pandemic in mainland Europe and amid dovish ECB speak has exerted a heavy drag on the Central European currencies on Monday, though the Polish Zloty is the underperformer.
USD/PLN’s recent bull run was ignited last Wednesday in wake of hotter than expected US inflation numbers, which launched the pair above the psychological 4.00 level. Since then, it has barely looked back and is now up around 3.0% in the last four sessions.
Zloty woes
Unlike for the US dollar, hot Polish inflation has failed to give the Zloty any respite. The final version of Poland’s October Consumer Price Inflation (CPI) report was released on Monday and the YoY rate of CPI was left unchanged from the flash estimate at 6.8% as expected, up from 5.9% in September. That is nearly double the upper limit of the Polish Central Bank’s 3.5% inflation target (the bank targets 2.5% plus or minus 1.0%).
The October inflation figures thus put heavy pressure on the Polish Central Bank to quicken the pace of their hiking cycle. That's because the inflation spike has sent short-term Polish real yields into deeply negative territory - at roughly 2.4%, the Polish Government’s 1-year bond yield has a negative yield of 4.4% to the current YoY rate of inflation. This not only constitutes a drastic, unnecessary easing of financial conditions but also puts pressure on the Zloty.
The Polish Central Bank (called the Narodowy Bank Polski or NBP), hiked rates by 75bps to 1.25% earlier in the month, but the failure of the Zloty strengthen suggests markets think this is far from enough. NBP Governor Adam Glapinski, speaking in the Polish press, said that further rate hikes are more likely than not. But he said that this was “a conditional probability” and “it may change”, or in other words, there is a chance the bank might still hold rates at its next meeting. The Zloty seems to have reacted poorly to this dovishness.
Looking ahead, USD/PLN will continue to track movements in EUR/USD as focus shifts to state-side events, including US Retail Sales, Fed speak and the potential announcement of who is going to be the Fed’s next chair.
- The US Dollar Index begins the week on the right foot, up 0.25%.
- The US 10-year Treasury yield rises almost four basis points, sits at 1.621%.
- DXY Technical outlook: A break above 96.00 exposes June 30, 2020, high at 97.80, followed by a test of 100.00.
The US Dollar Index, also known as DXY, which tracks the greenback’s performance against a basket of its peers, advances 0.34%, sitting at 95.42 during the New York session at the time of writing. Since last Wednesday, the DXY had gained over 1.55% when it traded as low as 94.00, until Monday’s session when it reached a year-to-date high around 95.45.
Earlier in the Asian session, the DXY hovered around the psychological 95.00 price level, undermined by falling US bond yields. Further, on Friday of the last week, the University of Michigan Consumer Sentiment Index dropped to a 10-year low as consumers expressed concerns about elevated prices. This would exert pressure on the Federal Reserve, which in fact, in this week will begin the reduction of its QE pandemic program by $15 billion, which would end by June 2022.
As of writing, US bond yields are rising. The 10-year Treasury yield rises three and a half basis points, sitting at 1.621%, acting as a tailwind for the buck.
US Dollar Index (DXY) Price Forecast: Technical outlook
-637726049313881572.png)
The daily chart depicts the DXY approaching Pitchfork’s indicator’s central line around the 95.50-60 region. The daily moving averages (DMA’s) remain well below the current price action, with an upslope, supporting the upward bias. Also, the Relative Strength Index (RSI) at 68 is above the 50-midline, aims higher, suggesting that DXY has another leg-up before reaching overbought conditions
A break above the mid-line of Pitchfork’s channel would expose 96.00 as its first resistance area. A clear breach of the latter would expose June 30, 2020, high at 97.80, followed by May 25, 2020, high at 99.97.
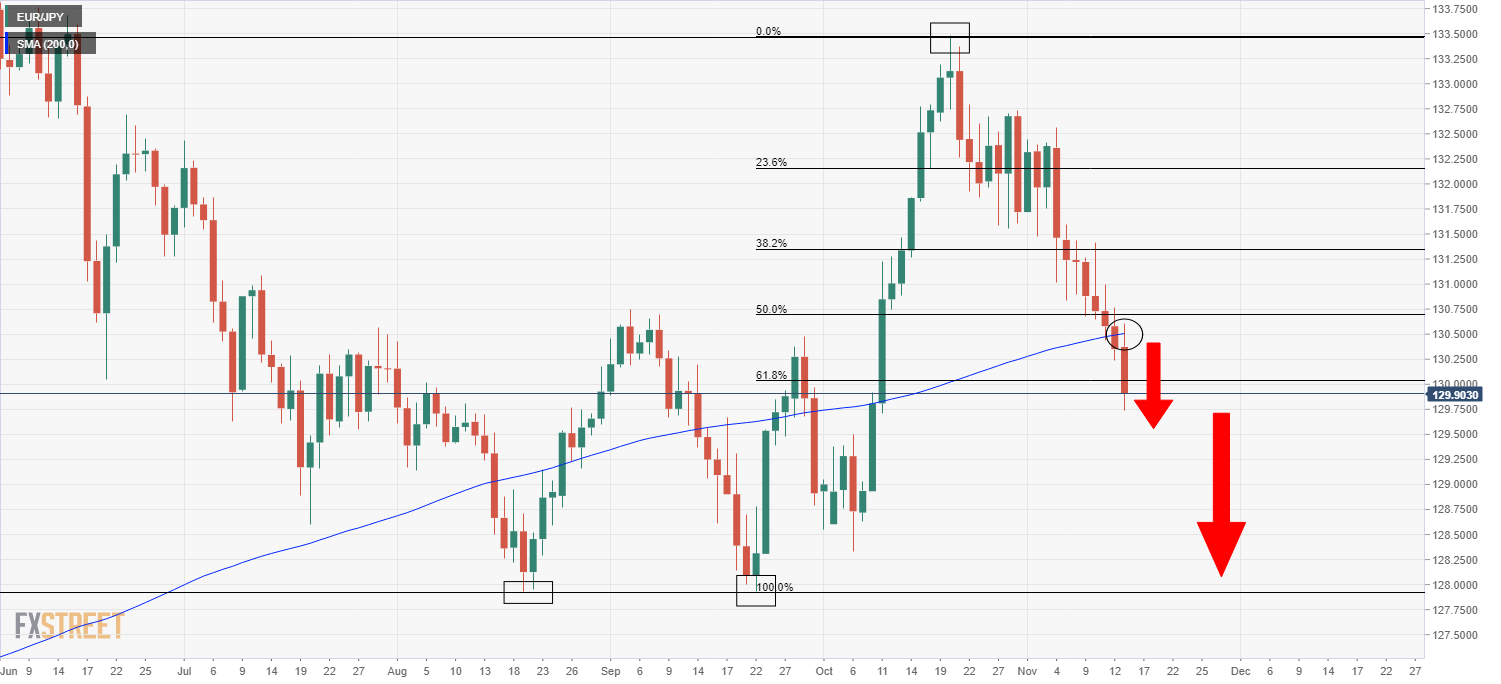
- EUR/JPY has slid under 130.00 and is set for a seventh negative session in the last eight.
- The euro saw broad underperformance on Monday amid dovish ECB vibes, concerns about the state of the EU’s Covid-19 outbreak.
Amid a bout of broad euro weakness, EUR/JPY has seen significant selling pressure on the first trading day of the week, falling from around the 130.40 area and close to its 200DMA to current levels under 130.00. The pair is set to end Monday’s session 0.3% lower, which would mark a fifth consecutive session in the red and seventh negative session in the last eight. Over this time period (the last eight sessions), the pair has dropped around 2.0% from above 132.50 to current levels under 130.00.
EUR/JPY has now convincingly lost grip of its 200DMAat 130.50 and also broke below a key Fibonacci retracement at just above 130.00 (the 61.8% retracement back from the October high at 13350 to the summer lows at 1.2800). Technically speaking then, recent losses have opened the door to an extension of downside towards those summer lows.
Euro underperformance
Market commentators cited dovish ECB speak and concerns about the worsening pandemic situation in the Eurozone as key drivers of Monday’s underperformance in the euro. In terms of the former, ECB officials, including President Christine Lagarde and Vice President de Guindoes, doubled down on the insistence that favourable financing conditions must be maintained in the Eurozone to support the economic recovery. ECB officials also continue to see inflationary pressures as transitory. Meanwhile, the Netherlands started a three-week lockdown at the weekend, Austria is imposing a lockdown on the unvaccinated and infection rates in Germany are at a record high.
Whilst these themes, which have been talking points for a while now, haven't necessarily been driving broad euro underperformance in recent sessions, they likely have been driving the euros underperformance versus the safe-haven yen. Some of the recent underperformance may also reflect some catch-up to a narrowing of Eurozone/Japan rate differentials. Between 1 – 5 November, German 10-year yields dropped nearly 20bps versus a mere 5bps drop in Japan 10-year yields, all while EUR/JPY barely moved.
Either way, as the economic outlook in the Eurozone darkens this winter due to the pandemic and the ECB continues to push back against any hint of early monetary tightening, the euro may well continue to underperform the yen. Monday’s Asia Pacific session saw the release of Japanese Q3 GDP data and whilst this did disappoint on expectations, this likely boosts the outlook for the Japanese economy in Q4 2021/Q1 2022 as it improves the momentum behind Japan PM Kishida’s stimulus plans.
- USD/CAD bulls are seeking a bullish continuation for the days ahead.
- The daily Fibonacci retracements levels are under pressure.
The price of USD/CAD has so far corrected to test the 38.26% Fibonacci and on towards the 50% mean reversion mark near 1.2495. 1.2486 is where the Nov 9 highs are which could be tested as well, in line with the 61.8% Fibo, aka the golden ratio.
USD/CAD daily chart
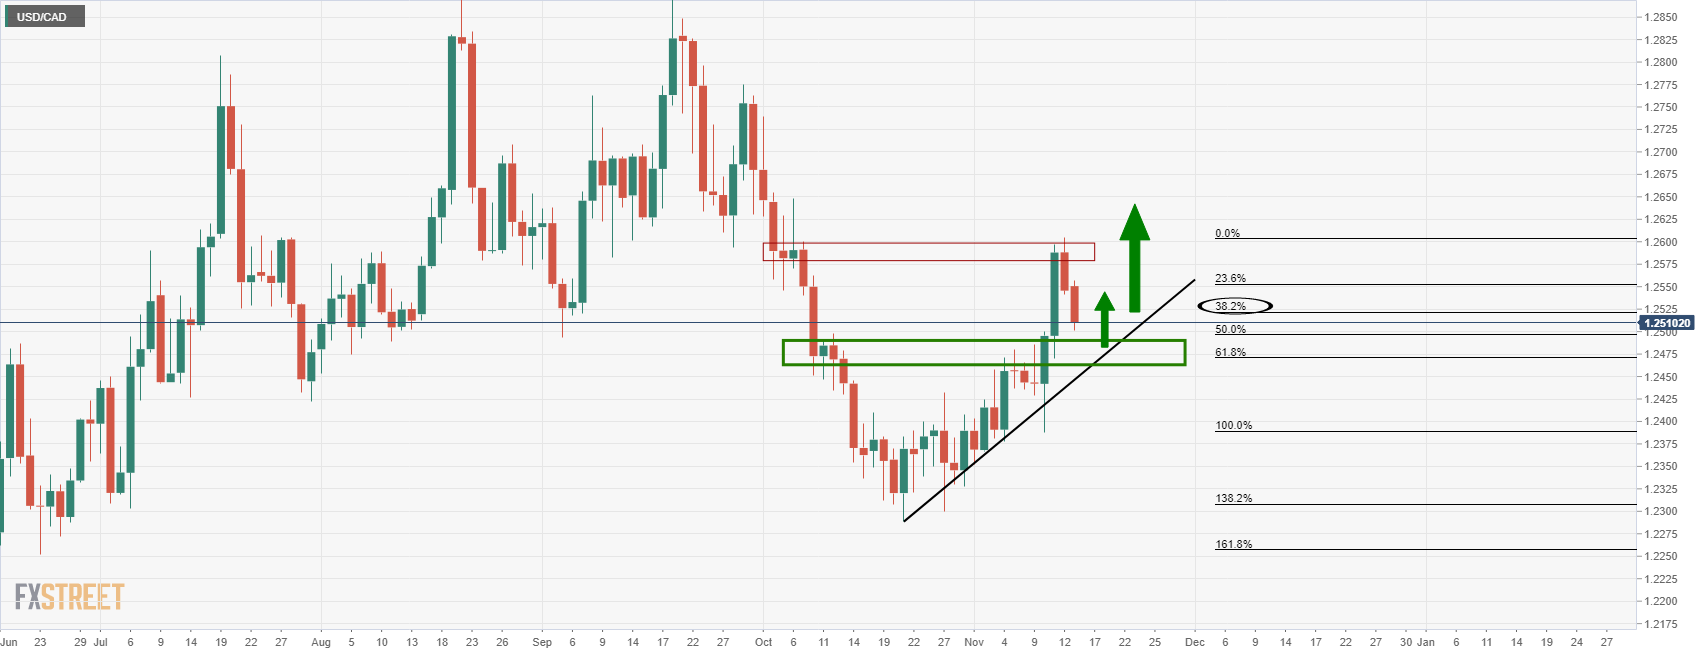
Anywhere between these levels support can be expected to lead to a bullish continuation.
USD/CAD H1 chart
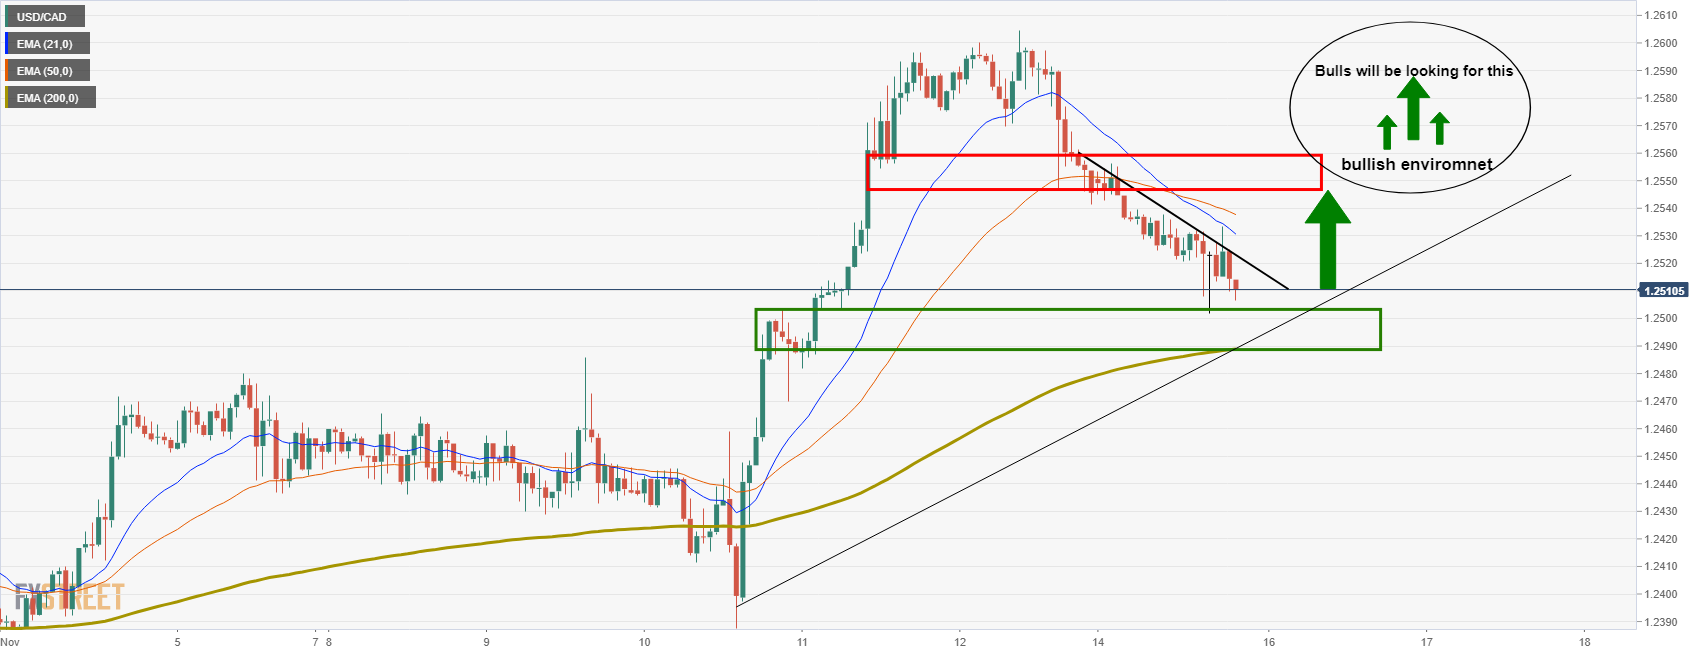
From an hourly perspective, the day has not been favourable to the bullish outlook. The price continued to sink and is now well below the bearish 21 and 50 EMA crossover.
1.2503 is about to come under pressure as being the lastest resistance prior to the rally. This could act as support. On a break, then the 1.2480s will be in focus and be expected to hold initial tests. So long as the 200-EMA remains intact, then the bias will stay with the daily bullish outlook.
What you need to know on Tuesday, November 16:
The EUR was the worst performer, falling against the greenback to a fresh 2021 low of 1.1381. The dollar also appreciated against safe-haven CHF and JPY, but shed ground against the pound and commodity-linked currencies. Overall, the action was limited across the FX board as speculative interest awaits fresh clues.
The market sentiment was positive at the beginning of the day following upbeat Chinese data but faded after Wall Street’s opening. US Treasury yields jumped without a clear catalyst. However, it may be related to the US reporting last Friday that over 4.4 million people in the US quit their jobs in September, overshadowing the upbeat Nonfarm Payrolls report released earlier this month.
Brexit returned to the headlines. UK PM Johnson's spokesman said they aim to reach a consensual solution to the Northern Ireland protocol, adding that they want to reach a consensual solution and continue “intensive talks” with the EU. Meanwhile, UK PM Johnson hit the wires, warning that, to avoid new restrictions, everyone must get vaccinated. The definition of a fully-vaccinated person will change to account for booster shots, he added. The number of coronavirus contagions is reaching worrisome levels in Europe, which suffers its sixth wave.
Gold extended its advance to reach a fresh multi-month high of $1,870.48 a troy ounce. While crude oil prices posted modest intraday losses and finished the day at around $79.80 a troy ounce.
On Tuesday, the RBA will release the Minutes of its latest meeting, while the US will unveil October Retail Sales. Also, the UK will publish its October employment data.
Bitcoin buy-side volume rises as bulls continue uptrend towards $70,000
Like this article? Help us with some feedback by answering this survey:
- NZD/USD retreats from the 200-DMA as the US dollar trims early losses.
- The US Dollar Index advances to new year-to-date highs around 95.44.
- NZD/USD Technical outlook: A break above the 200-DMA would expose the 2021 high at 0.7465.
The NZD/USD retreats from three-day highs around 0.7100 though keeps in the green territory, advances some 0.07%, trading at 0.7051 during the New York session at the time of writing. In the last couple of hours, a rise in US Treasury yields underpinned the greenback with the US Dollar Index
DXY trades at new year-to-date highs around the 95.40s
The US Dollar Index, which measures the buck’s value against a basket of its peers, advances 0.31%, sitting at 95.42, hovering around year-to-date highs at 95.44
During the Asian and European session, the NZD rallied, topping around 0.7080 as the US dollar went under pressure, after a weaker than expected University of Michigan Consumer Sentiment data, which fell to 10-year lows amid higher inflation. Further, on the abovementioned sessions, falling US Treasury yields underpinned the buck’s which fell to three-day lows against the kiwi.
However, as American traders got to their desks, amid a light US economic docket, demand for the greenback increased, thus dragging the NZD/USD pair lower, down to last Friday’s high at 0.7048. In the meantime, the US 10-year benchmark note rose three basis points up to 1.613%.
This week, the Federal Reserve begins its bond taper, while the Reserve Bank of New Zealand (RBNZ) will host its last monetary policy of the year on November 24. Central bank monetary policy divergence between the Fed and the RBNZ would play a crucial role in the NZD/USD pair outlook, in which the NZD has the upper hand.
The market has priced in a 100% chance of a 25 bps hike by the RBNZ in its November meeting, but there is a slight 40% chance of a 50 bps. For 2022, investors are fully priced in for a 25 bps hike in February, with a 70% chance of a 50 bps hike.
NZD/USD Price Forecast: Technical outlook
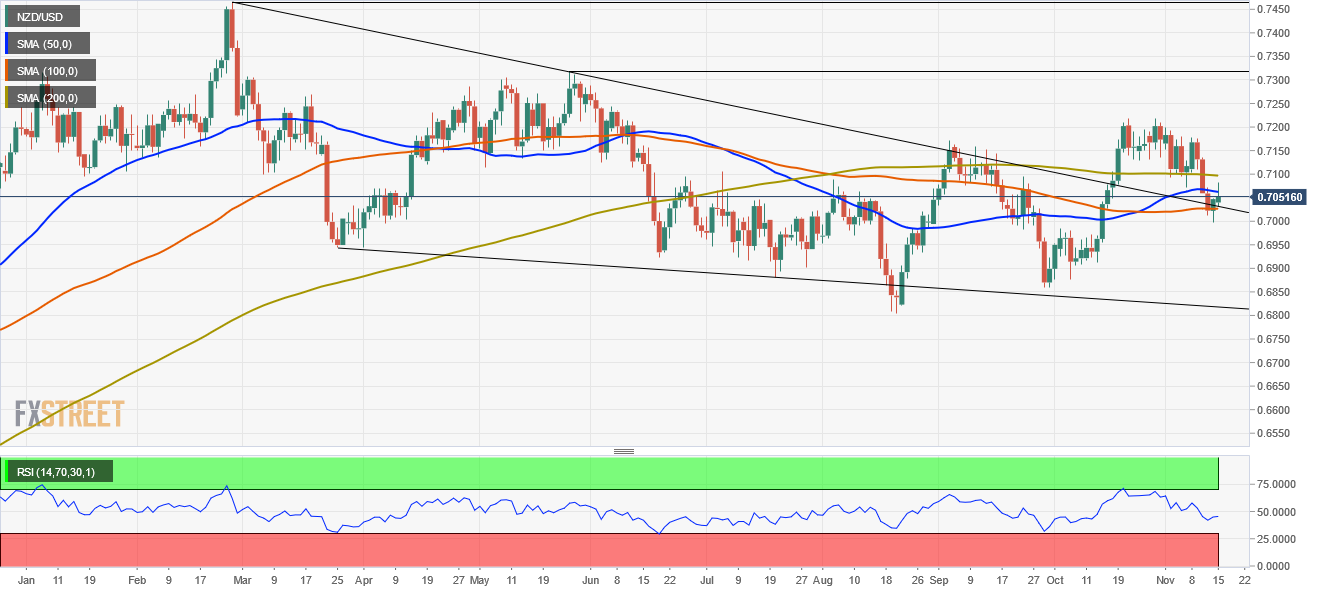
In the daily chart, the NZD/USD retreated from 0.7080s towards Friday’s high around 0.7048, within the 50 and 100-day moving averages (DMA’s). The daily moving averages (DMA’s) remain directionless but provide support/resistance levels in the pair. However, as the 200-DMA remains above the spot price, the pair is tilted to the downside, but it remains almost horizontally, at risk of being broken.
A break above the 200-DMA, which sits around 0.7100, could open the door for further gains. The first resistance would be 0.7200. A breach of the latter would expose crucial supply zones, like the May 26 high at 0.7317, followed by the year-to-date high at 0.7465.
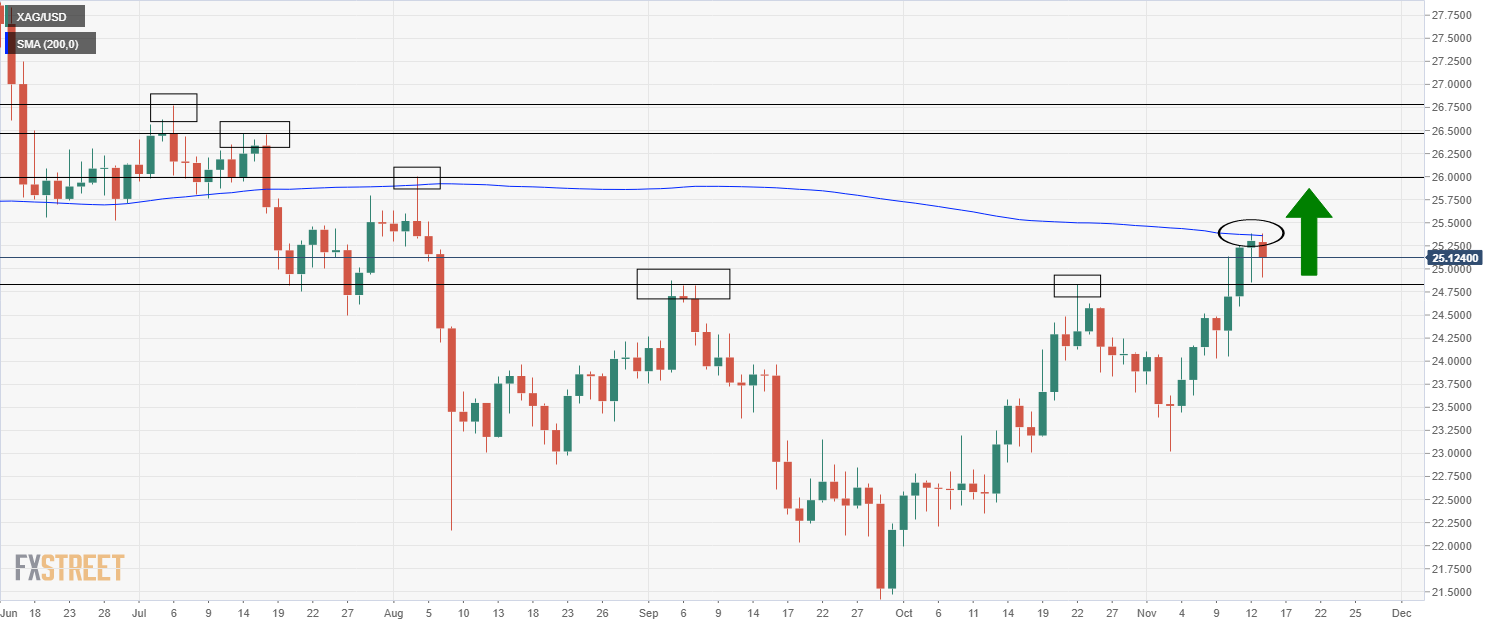
- Spot silver is subdued on Monday, remaining supported above $25.00 but capped by the 200DMA.
- Precious metal markets await key upcoming US data, Fed speak and Biden’s Fed Chair nomination decision.
Spot silver (XAG/USD) prices have spent Monday’s session consolidating within recent ranges, finding support at the $25.00 level, but failing to push towards the 200-day moving average just under $25.40. Consolidative conditions are not too surprising on Monday. The DXY is pushing on to further year-to-date highs and towards 94.50, but this is mainly due to weakness in the euro rather than broad USD strength, thus sparing precious metals. Meanwhile, the bond market picture is mixed, with long-term US yields up due to higher inflation expectations, while short-end nominal yields are flat and 5-year real yields substantially lower.
A much stronger than anticipated NY Fed Manufacturing index for November (coming at 30.9 versus forecasts for a rise to 21.6 from 19.8) is a good omen for US November data. Indeed, the release has been the only notable fundamental catalyst thus far on Monday (it triggered the rise in long-term US yields). For now, precious metals markets would rather bide their time and await the outcome of Tuesday’s October Retail Sales report. Traders also want more information on two key fronts with regards to the Fed; 1) how will Fed policymakers (who speak in droves this week) respond to the recent inflation surprise and 2) who will be nominated as the next Fed Chair? Reportedly US President Biden’s decision on the latter could come as soon as this week.
Chatter amongst analysts, market commentators and Fed watchers is that the bank should pivot towards accelerating the pace of asset purchases in Q1 2022 and signal intent to start hiking by the end of Q2 2022 at a minimum. Political pressures are growing on the Fed to do something about inflation, as President Joe Biden (and his VP Kamala Harris) see their approval ratings tank. If Fed members don’t sound sufficiently hawkish, precious metals could get another boost on rising inflation/fiat debasement fears. That could send spot silver above its 200DMA, which could open the door to extended upside towards $26.00 (the early August high).
- The S&P 500 has swung between gains and losses on the first day of the week within a 4675-4695 range.
- The Nasdaq 100 is an underperformer amid a rise in long-term US yields.
The S&P 500 has seen choppy trade thus far this Monday, swinging within a 20-point 4675-4695 range amid an indecisive start to the week. At present, the index is roughly at the midpoint of this range just under 4685, meaning it trades flat on the day. The Nasdaq started the session in the green, rising as high as 16.25K at one point, but has since dropped back into negative territory, and currently trades around 16.15K, down about 0.3% on the day. So far, the 16.1K level which coincides with last Thursday’s highs has offered decent support.
Weighing on the Nasdaq 100 index has been a rise in long-term US bond yields. That’s because so-called growth stocks, whose valuation is disproportionately dependent upon expectations for future earnings growth rather than on actual reported numbers, make up a heavy weighing in the Nasdaq 100. As long-term interest rates rise, this increases the opportunity cost of betting on earnings growth. Further downside in Tesla’s share price amid a Twitter storm from CEO Elon Musk that saw him lash out against left-wing US politician Bernie Sanders (who called for higher taxes on billionaires) probably hasn’t helped. Musk sarcastically asked Sanders if he should sell more shares (after publically criticising/insulting him). Tesla shares are down another near-5.0% on Monday and back under $1000, having pulled back more than 15% last week as Musk unloaded shares.
The Dow is currently trading roughly flat on the session like the S&P 500. A 5.0% surge in Boeing’s share price amid reports that the Saudi Arabians are in talks with the company over a wide-body jet order has failed to give the index a meaningful lift. In terms of the S&P 500 GICSs sectors, banks are outperforming the index and are up 0.2% as long-term yields rise. Materials are underperforming the index, down 0.5%, as traders cite concerns about metal demand amid further evidence during Monday’s Asia session that growth in the Chinese real estate sector continues to slow.
Aside from the knock-on impact that higher long-term yields had on growth stocks after they rallied in wake of the strong NY Fed survey, the data has been ignored. But it does bode well for upcoming US PMI surveys and hard activity data for November further down the line. Equities will be much more attuned to Tuesday’s US October Retail Sales report. Investors will also keep a keen eye on the “unofficial end” to earnings season as brick-and-mortar retailers, Walmart, Target, Home Depot and Macy’s report this week. Walmart is up first on Tuesday. Investors will be hoping they round off what has thus far been an excellent earnings season.
- AUD/USD bears need to watch out for the trap.
- Bullish reversal pattern spotted on the daily chart.
- Bears await the break of weekly trendline support to target 0.7220.
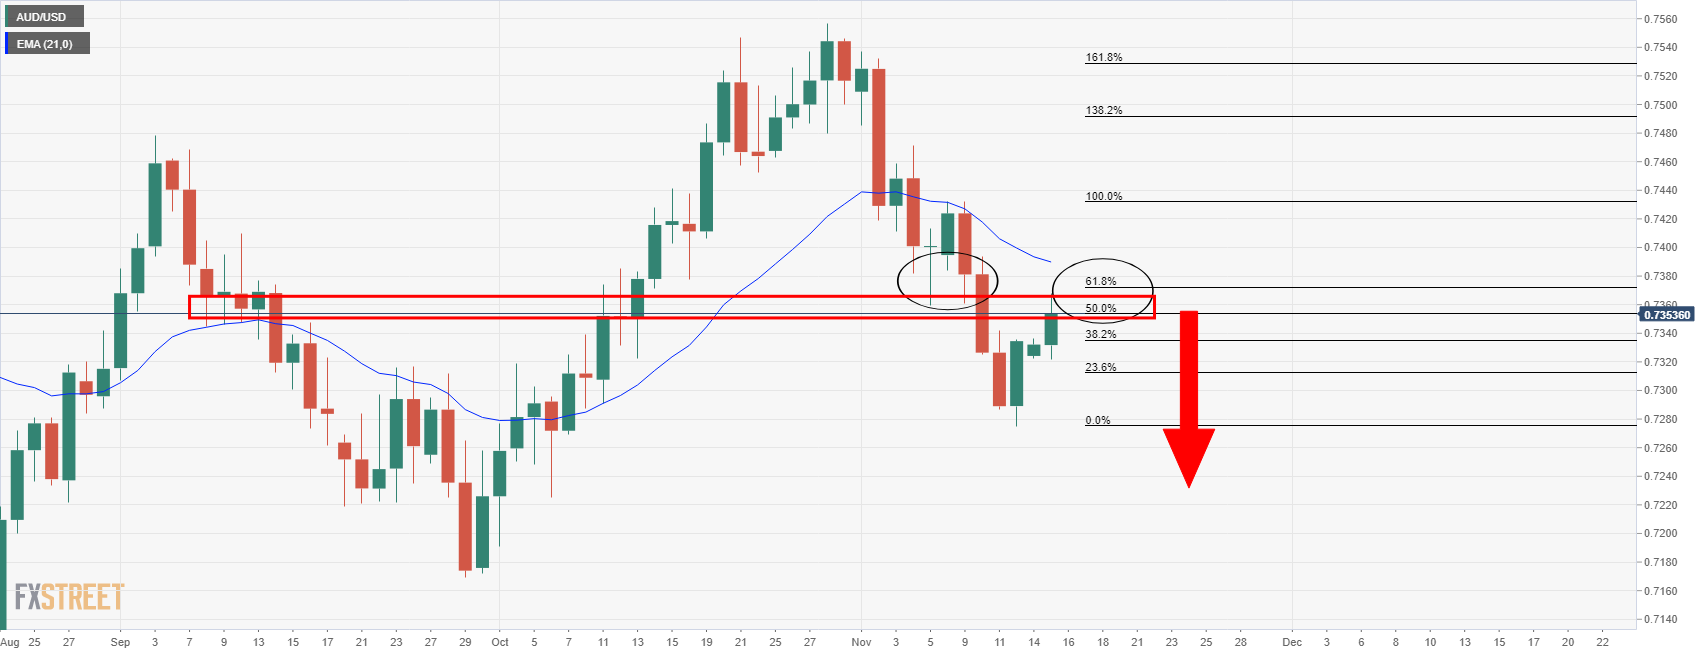
AUD/USD is in the process of an upside correction according to the daily chart and has broken the 38.2% Fibonacci retracement level for the opening day. This was located at 0.7336 and a pip higher than the highs of Friday.
The price has since climbed through the 50% mean reversion and has come close to a test of the golden 61.8% Fibo at 0.7323. This is an area of heavier resistance given the confluence of bearish moving averages. At this juncture, the bears could start looking for an optimal entry in anticipation of a downside continuation.
AUD/USD daily chart
AUD/USD weekly chart
However...
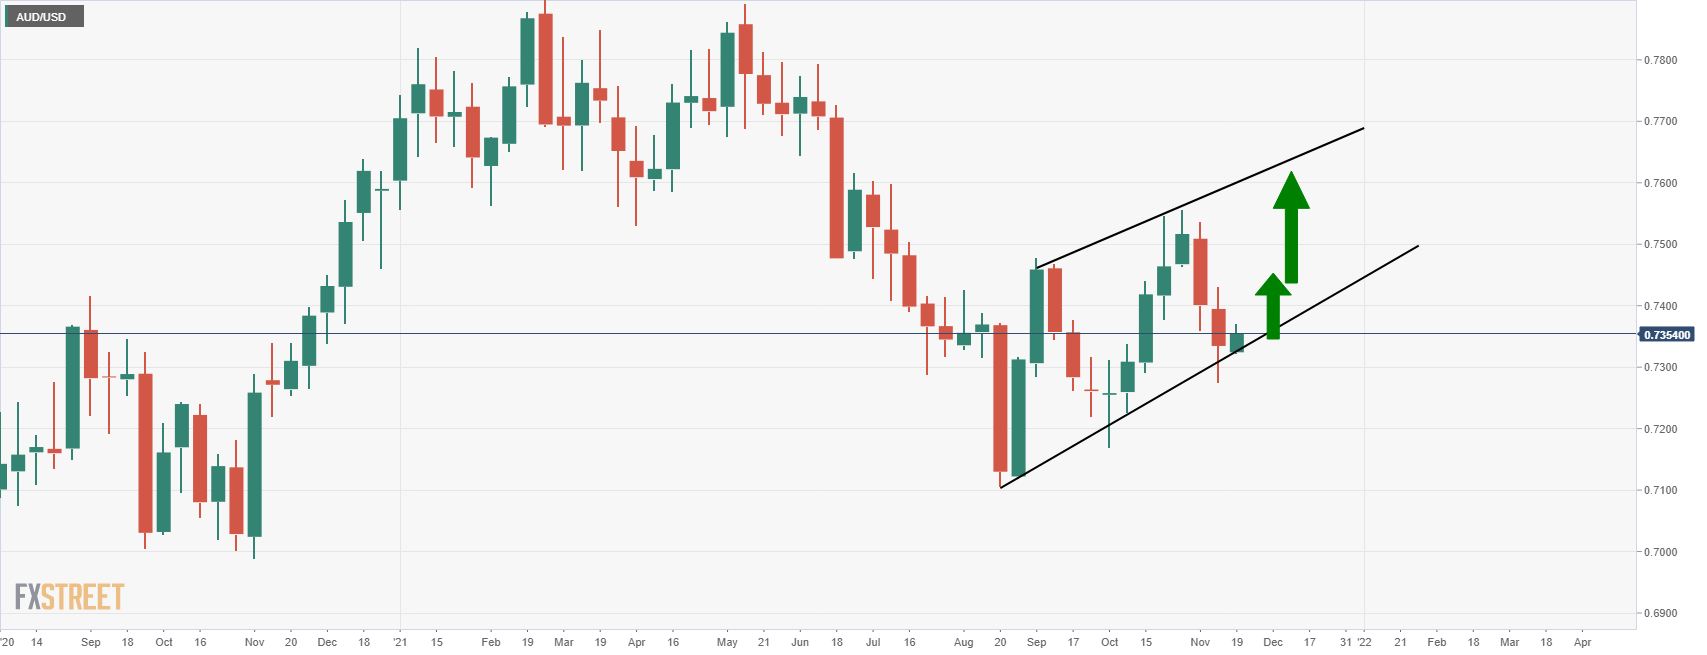
... the weekly time frame is not so bearish while there are prospects of the dynamic support holding and resulting in a higher high for the weeks ahead. In examining the daily chart a little closer as well, the 12 Nov bar was bullish engulfing:
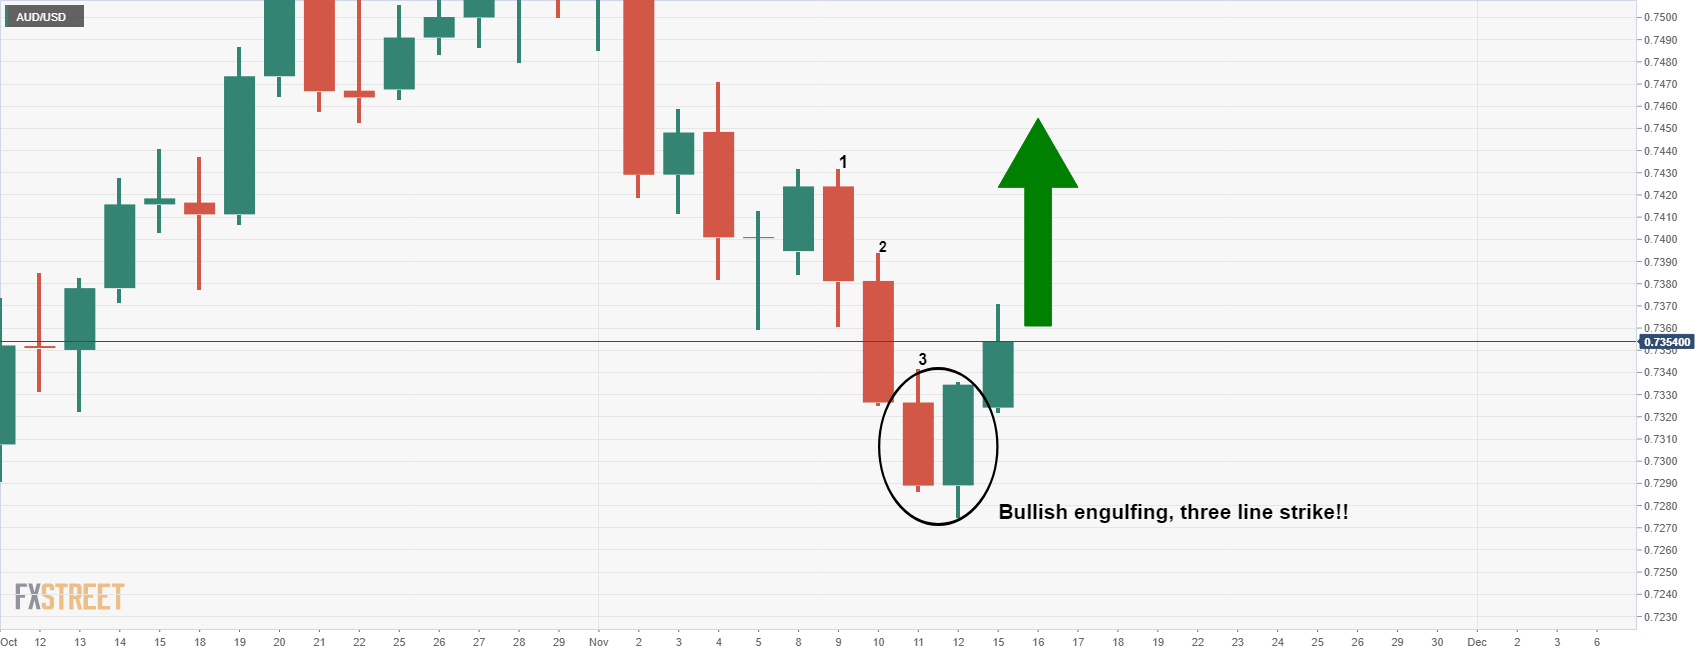
This is actually a three-line strike candlestick formation which is a reversal pattern. Therefore, we could see the weekly outlook playout should the price clear the overhead resistance and breakout above 0.7420:
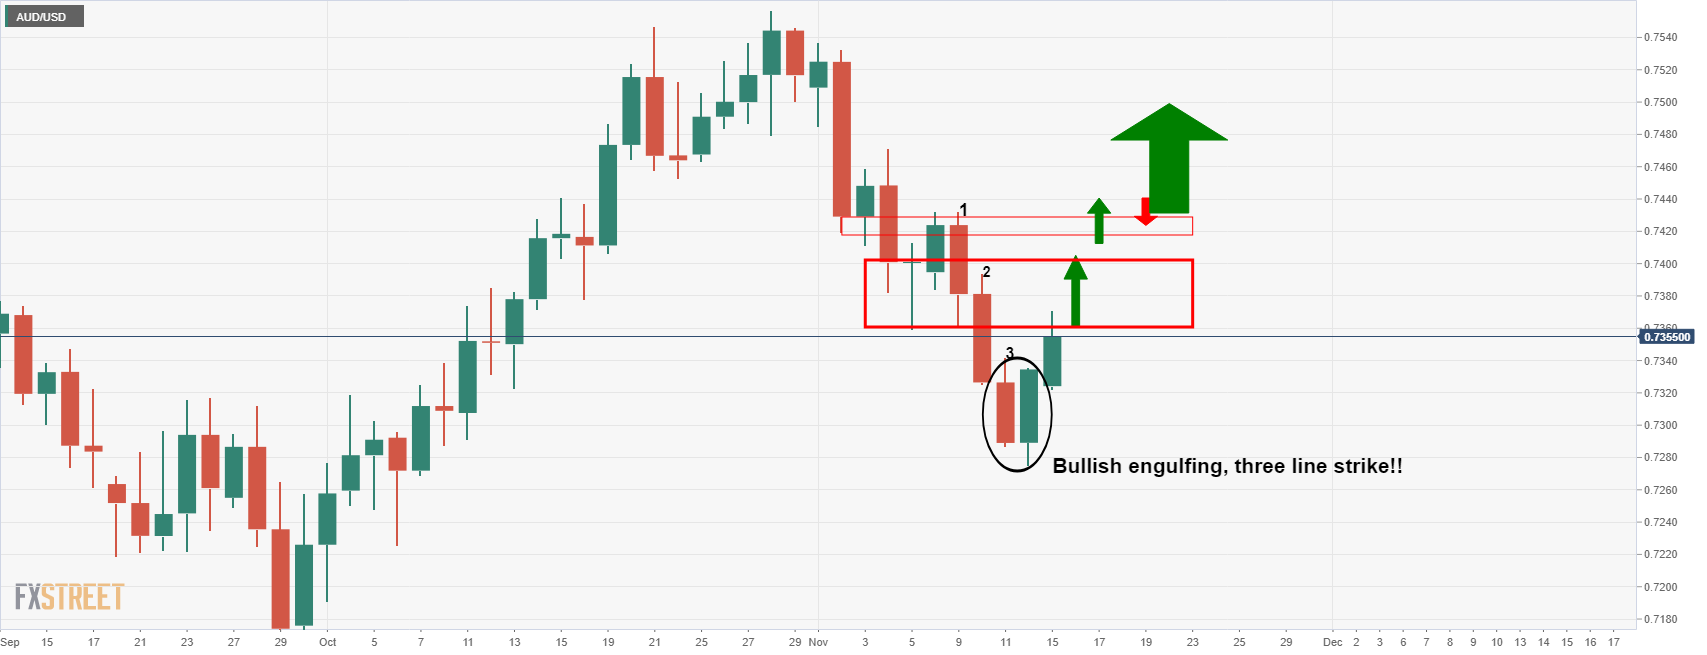
On the other hand, should the weekly dynamic trendline support break and price drop below 0.7320, then the three-line strike will be invalidated as a trade set-up and the bears will be back in control.
Bears can still get prepared for a downside continuation by monitoring for a bearish environment from the 4-hour car as follows:
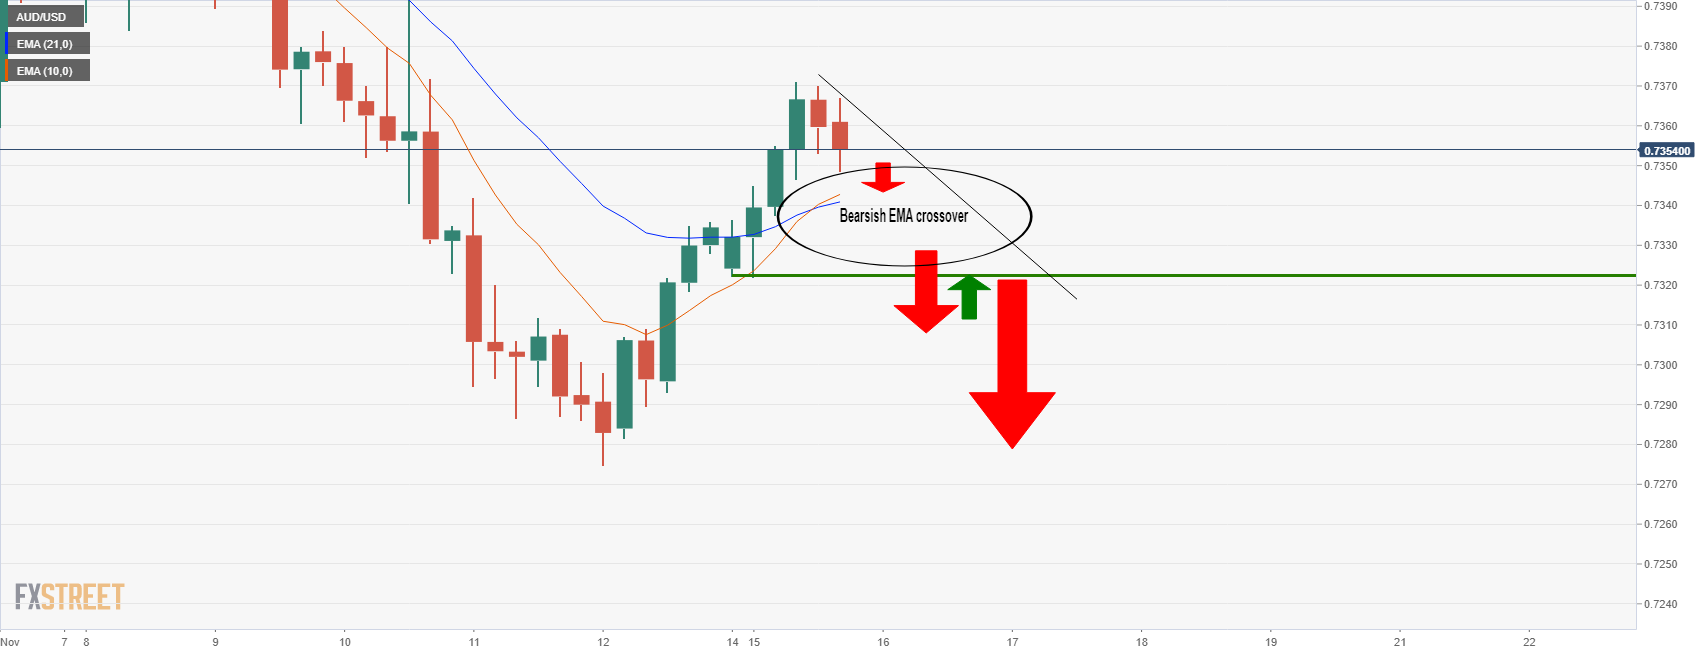
The bears will be looking for the 21 and 10 EMAs to turn south and crossover o signal a bearish environment. A break of the 0.7320s will likely result in a downside continuation for a fresh daily low towards 0.7250 and then 0.7220.
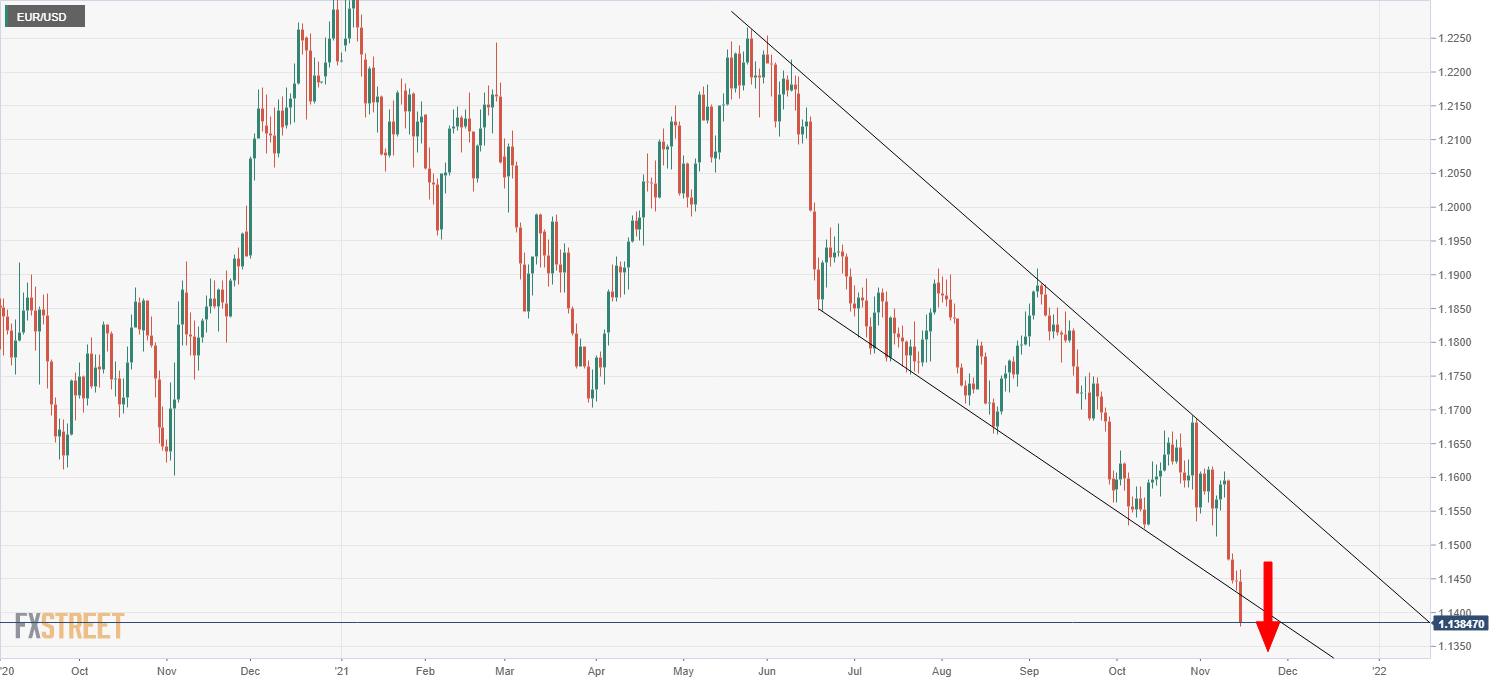
- EUR/USD has slumped under the 1.1400 level for the first time since July 2020 and is now over 0.5% lower.
- The pair has also broken to the south of a long-term downtrend, signaling a near-term acceleration of the bear-run.
EUR/USD has slumped under the 1.1400 level for the first time since July 2020. The pair trades lower by about 0.5% on Monday and has broken below a few key areas of support on its way down, including at around 1.1420 and then the psychologically important 1.1400 level just below it. The bears will now look to push the pair lower towards the next area of support at 1.1350. If that breaks, it’s a clean run lower to the late June/early July 2020 lows under 1.1200. Notably, EUR/USD broke to the downside of a long-term downtrend that had been supporting the price action going all the way back to August, signaling a near-term acceleration of the pair’s bear run.
Market commentators are citing a few fundamental reasons for EUR/USD’s drop. Firstly, US bond yields have reversed early losses and now the yield curve is predominantly higher, as well as steeper. US 30-year yields are up around 6bps on the day and flirting with the 2.0% level again, while German 30-year yields are up a more modest 3bps. Meanwhile, the US 2s10s spread has widened by about 3bps, while the German 2s10s spread has narrowed by just under 1bps. A steepening of the yield curve suggests improved optimism about future economic growth and inflationary outcomes that hasn’t also exacerbated fears about near-term monetary policy tightening.
The steepening of the US curve is a result of a better than expected US regional Fed manufacturing survey released earlier in the session. To recap, the NY Fed Manufacturing survey for November rose to 30.9 from 19.8 in October, well above the expected rise to 21.6. This is a good sign that the solid start the US economy enjoyed to Q4 continued into the second month of the quarter and this will be boosting USD directly, not just indirectly via yields.
Note that as the data points to the US picking up economic momentum, the Eurozone economy is expected to slow in the coming months amid surging Covid-19 infection rates that threaten hurting consumer confidence and the reimposition of restrictions (the Netherlands has already implemented a full lockdown). This is also touted as bearish for EUR/USD.
Finally, dovish remarks from ECB members may also have highlighted fundamentals divergences between the euro and dollar; the general message was to emphasise that the bank still view the current spike in inflation as transitory and that cost-push inflation (higher energy/fuel bills) is hurting the economy, thus the ECB should keep financing conditions accommodative.
Looking ahead to the rest of the week, more ECB speak is also likely to be (mostly) dovish and there is no tier one Eurozone data. Focus will be on stateside events. Fed speakers come out in force and will need to comment on inflation after last week’s surprise and markets await US President Joe Biden’s Fed Chair appointment decision. There is also a decent dose of data for traders to sink their teeth into, starting with the October US Retail Sales report out on Tuesday.
- EUR/CHF bears are running head in with weekly support.
- 1.050 could be a tough nut to crack from a technical perspective.
- SNB is potentially comfortable with a stronger CHF instead of hiking rates.
EUR/CHF is turning heads in the currency markets at the start of the week as the bears take control and target an imminent break of the 1.05 key psychological level. At the time of writing, EUR/CHF is trading down 0.21% after sliding from 1.0546 to a low of 1.0515.
This is a May 2020 low for the euro against the safe-haven Swiss franc. A double whammy of inflation fears and renewed concerns over the COVID-19 pandemic that is sweeping across mainland and eastern Europe in a fresh wave is pressuring the risk-sensitive markets.
Swiss National Bank governing board member Andrea Maechler said modest Swiss inflation, at an annual rate of around 1.2%, was capping the franc's rise. But she reiterated the SNB's commitment to currency market interventions designed to limit if needed, the effect that the Swiss franc's strength has on Switzerland's export-orientated economy.
CHF is a natural hedge against inflation
Deutsche Bank's Robin Winkler argued that the franc is a good stagflation hedge, ''and the SNB are likely to be more tolerant of currency appreciation than in the past, considering it insurance against importing inflation from the Eurozone.''
''The rates market has been trying to price the first hike from the SNB next year, in sympathy with the ECB, but in our view the SNB will use the exchange rate, rather than the policy rate, to tighten policy.''
EUR/CHF technical analysis
While there are prospects of a break of 1.0500, there are prospects for a significant correction to the upside in the near future, from a technical standpoint.
-637725952722087715.png)
The weekly chart shows that the price has fallen for eight consecutive weeks without a correction. This is the longest weekly losing streak since the turn of 2010. While that in itself is not a reason to try and catch a falling knife, it does give rise to the prospect of a correction in the near future.
Profit-taking could emerge around a test of the 1.0500 level and result in consolidation and a phase of accumulation that could well target the July 202 lows that have a confluence with the 23.6% Fibo at 1.0605 and then the Nov 2020 lows that have a confluence with the 38.2% Fibo near 1.0660. On the downside, 1.0470 could be a stronger level of support according to the monthly chart should the bears conquer bullish commitments at 1.0500.
-637725959523182393.png)
- Crude oil falls almost 1%, as Democrats pressure US President to act on high gasoline prices.
- OPEC+ sticks to its 400,000 barrels per day crude oil output, despite the pressures from the US.
- WTI Technical outlook: A death-cross in the 4-hour chart opens the door for further losses for crude oil prices.
During the New York session, the Western Texas Intermediate (WTI) US crude oil benchmark slides as Democrats increased pressure on the White House to tap the Strategic Petroleum Reserve (SPR) to cap elevated gasoline prices. At the time of writing, WTI extends its four-day slump, falling 1.07%, trading at $78.89.
According to sources cited by Bloomberg, Energy Secretary Jennifer Gharnholm told CNN that the US President is evaluating the available tools, including a release from the SPR. Market participants said that a release from the US SPR would help in the near term, but it would not solve the problem.
Earlier in the American session, the black gold dipped as low as $78.33 but bounced off, recovering some $0.50 throughout the day.
Meanwhile, OPEC and its allies will be adding 400,000 barrels a day of crude oil each month in the middle east. The cartel is cautious about demand stability in the coming months. Some countries in central and eastern Europe have reimposed restrictions as COVID-19 cases have increased.
WTI Price Forecast: Technical outlook
-637725944240942654.png)
In the 4-hour chart, WTI is trading within a descending channel, below the simple moving averages (SMA’s), with the 50-SMA just crossing below the 200-SMA, depicting a death-cross. This means that crude oil has a downward bias in the short-term confirmed by the Relative Strength Index (RSI) at 40, aims lower.
The first support level would be November 4 pivot low at $77.61. A breach of the latter would expose the October 7 swing low at $74.74.
- GBP/USD bulls are trying to take charge at 1.3450 despite the risks of a fresh covid wave.
- Brexit headlines will be important for the week ahead also.
- BoE sentiment is for a rate hike in Dec, but will covid disrupt this?
At the time of writing, GBP/USD is attempting to correct a daily bearish impulse and is trading 0.18% higher on the day so far. GBP/USD has travelled from a low of 1.3402 to a high of 1.3449, scoring the high in recent trade as bulls take on daily resistance with 1.3480 eyed.
The pound has been edging higher at the start of the week although post-Brexit trade arrangements for Northern Ireland remain a risk. Relations between the UK and EU have been frayed due to the brinksmanship over the Britians threats to trigger an emergency clause known as Article 16 of the Northern Ireland Protocol. The pound is especially vulnerable as the prospects of a trade war are an outcome that would be expected to leave the Uk worse off by comparison.
European Commission's Maros Sefcovic said the EU will consider all of the tools at its disposal if the UK Government triggers Article 16. ''If the British Government suspends the Northern Ireland Protocol, it will have “serious consequences” for the region and Brussels’ relationship with the UK.
However, on the more positive side, he said, ''Last Friday, I held my fourth weekly meeting with David Frost on the EU package of solutions.''
“I acknowledged and welcomed the change in tone of this discussion compared to previous ones. After weeks of intensified discussions, we need the UK to reciprocate the big move the EU has made. The EU has taken big steps to find solutions and to provide solutions to concrete problems faced by Northern Irish people and businesses on the ground as a consequence of the Brexit chosen by the UK.”
Mr Sefcovic said he would not speculate on whether the UK will trigger Article 16. Britain and the European Union will intensify efforts this week to find a solution.
GBP traders get mixed messages in futures and options
Meanwhile, looking at the options and futures markets, there are mixed messages.
On the one hand, the weekly CFTC positioning data is telling that speculators have increased their longs on the pound versus the dollar. But on the other hand, the one-month risk reversals that are a gauge of the market's expectations of the pound's direction, have hit their lowest since December 2020 on Thursday last week. The gauge is in negative territory which indicates the market expects the pound to fall, probably likely to the following...
GBP to face Covid risks on the horizon
In starkly riskier headlines, Europe's latest covid storm is expected to affect the Uk, the PM Boris Jonson has stated:
- PM Boris Johnson says it is unclear how the "storm clouds" of the new wave of Covid in Europe "will wash up on our shores".
- He urges people to get vaccinated "as soon as...eligible", and says it would be a "tragedy" if double-jabbed people fell ill without their booster.
- Asked if he can rule out Christmas lockdown, PM says current data does not point to the need for a Covid "Plan B".
- England's chief medical officer, Chris Whitty, renews the call for pregnant women to get vaccinated
- The UK's top vaccine advisers, the JCVI, say all over-40s should be offered a third dose of a Covid vaccine.
- The medicines regulator, the MHRA, says it is safe for people aged 16-17 to have second Pfizer/BioNTech vaccine dose.
(Source: BBC)
This leaves the pound vulnerable to risk-off and heavy selling, especially in light of the recent rhetoric from the Bank of England and surprise interest rate hold.
BoE Dec rate hike sentiment in jeopardy
The risks are mounting for the Bank of England to hold again at their next policy meeting in December. The BoE left rates on hold, much to the surprise of the markets following a number of hawkish tilts of the hat leading into the meeting from various MPC members. The BoE signalled that a rate hike will be appropriate in the coming months if data is broadly in line with expectations.
Governor Andrew Bailey linked rate hikes to labour market outcomes. However, should there be risks of a fresh wave of covid in the UK as a result of mainland European contagion, then rate hikes could well be off the menu for the foreseeable future. As it stands, however, markets are pricing in approximately 90bp over a period of between 2022-late 2025.
GBP/USD technical analysis
There are prospects of a deeper correction on the daily chart as per the bullish momentum and market structure on the hourly chart.
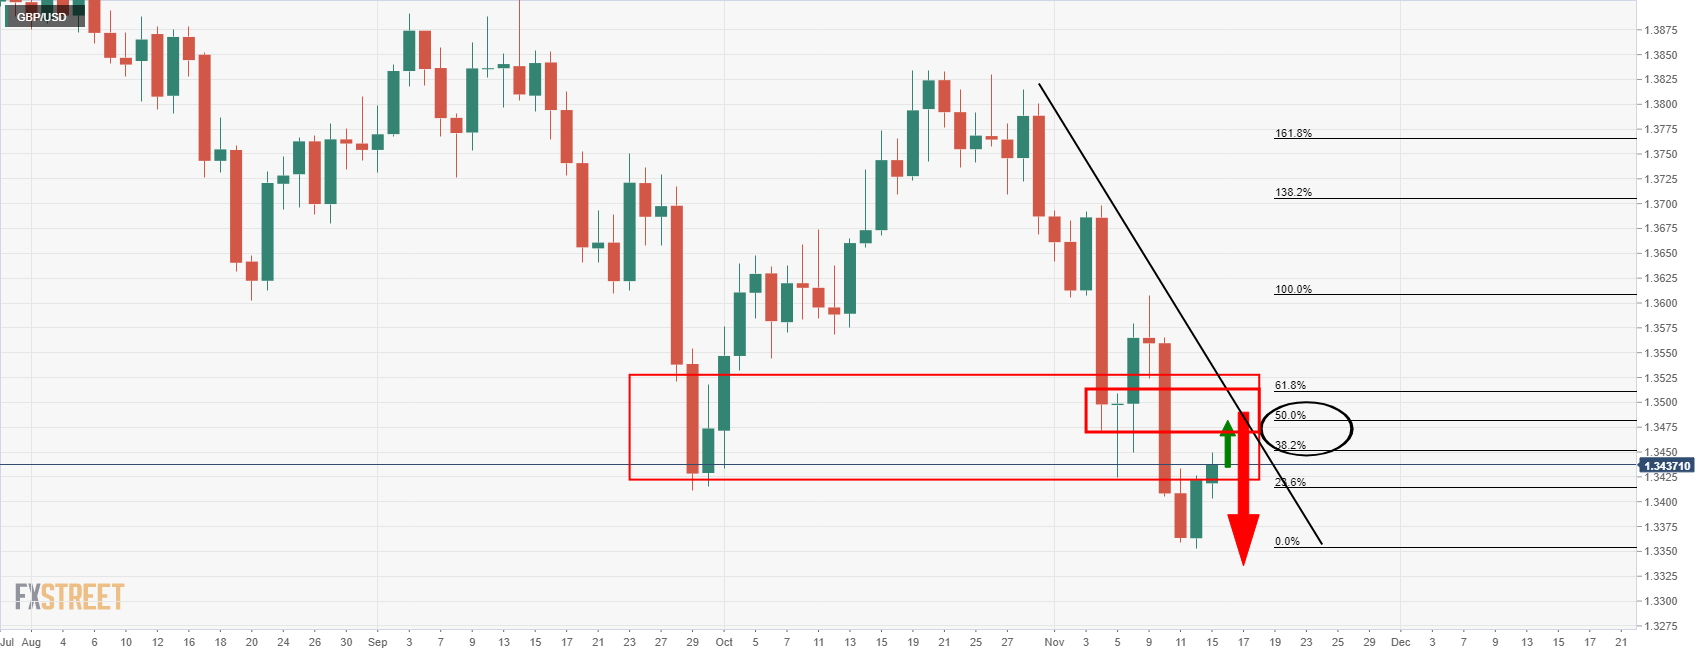
As illustrated, the price is headed into daily resistance and correcting the latest bearish daily impulse, testing the 38.2% Fibonacci retracement level. There is room to go to the 50% mean reversion level though that meets the firmer resistance near the 4 & 8 Nov closing and opening levels respectively near 1.3480.
GBP/USD H1 chart
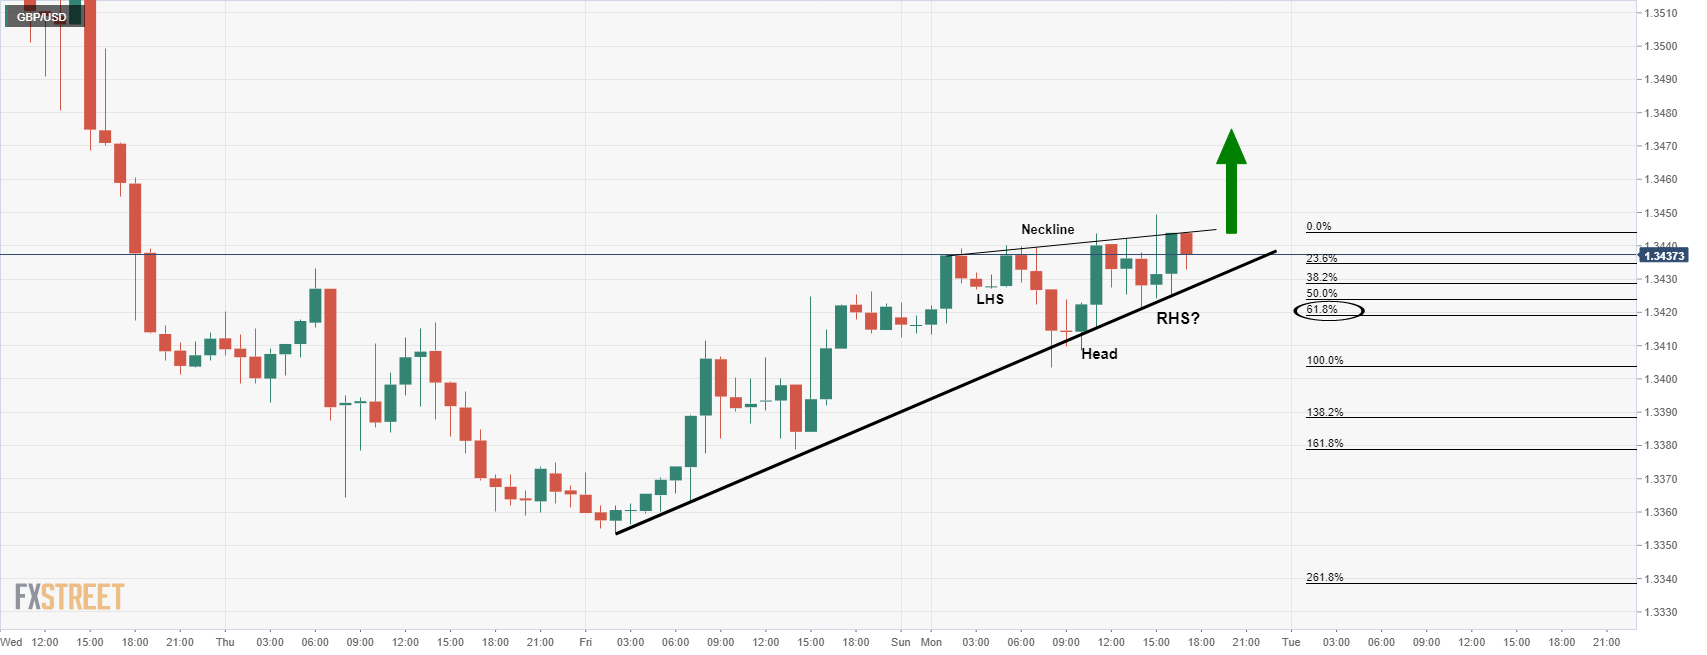
The reverse head and shoulders formation is a bullish pattern. Given that the price is being supported by the hourly dynamic trendline, there are prospects of a bullish continuation towards the 1.3480s.
- XAU/EUR reaches a new year-to-date high at €1,634.04.
- Demand for gold increases as global inflation rises, and investors turn to the yellow metal as a hedge.
- XAU/EUR: RSi in overbought conditions suggests a correction towards €1,604 is on the cards.
Gold spot against the euro (XAU/EUR) is steady around the year-to-date high at €1,634.04, after edging up some 0.15% to trade at €1,632 during the day at the time of writing. As the week began, the precious metal extended its rally to eight days in a row.
During the Asian session, the precious metal edged lower towards the €1,620 lows, however, it found support around the 50-simple moving average (SMA), spiked towards the new 2021 yearly high at €1,634.04 and retreated above the 50-hour simple moving average at press time.
In the meantime, the German 10-year Bund yield has gained one basis point, though remains negative at -0.245%, caping the upside move in XAU/EUR.
According to TD analysts in a note to customers, “gold prices have managed to break out nonetheless as global markets scour for inflation-hedges.” The note further added, that “the breakout in gold has driven the China Smart Money group of funds to add a significant amount of new length in SHFE gold, which highlights a potential avenue for a significant amount of buying interest, considering that Shanghai gold net length remains near multi-year lows.”
XAU/EUR Price Forecast: Technical outlook
Daily chart
-637725908203050999.png)
The non-yielding metal has an upward bias as depicted by daily moving averages (DMA’s) below the spot price. At time of writing it is testing the top trendline of the Andrew Pitchfork’s indicator, however, the Relative Strength Index (RSI) at 76 is in overbought conditions for the last four days, which suggests the possibility of a correction towards the November 13, 2020, high at €1,604.
If that outcome were to come to pass, and once the RSI exited overbought conditions, a test towards the November 9, 2020 high at €1,652 would be on the books, but it would find some hurdles on the way north. Initial resistance would come at €1,634.04. A breach of the latter would expose the top trendline of the Pitchfork’s indicator around €1,640-50.
The Bank of England's governor, Andrew Bailey, says that the recent EU announcement on clearing was a sign we can work constructively together after Brexit
He also added that climate issues are coming right into the monetary policy horizon.
More to come...
Improving growth prospects in Japan do not necessarily correspond to improving Japanese currency prospects, argue analysts at Wells Fargo. They point out that with inflation still absent, the Bank of Japan is set to maintain an accommodative monetary policy for the foreseeable future. They forecast a USD/JPY exchange rate of 120.00 by early 2023.
Key Quotes:
“For the time being, a brief period of yen stability is possible, given some recent declines in global bond yields and existing FX positions. IMM currency futures, for example, show speculative yen short positions near their largest levels since 2019, potentially limiting yen softness for now. However, we do expect global bond yields to show a renewed rise in the months and quarters ahead as inflation pressures persist.”
“U.S. price pressures in particular remain quite robust, with the U.S. October CPI rising 6.2% year-over-year. As U.S. inflation remains quite elevated by historical standards and the Federal Reserve winds down its quantitative easing program by mid-2022 and starts its rate hike cycle before then end of next year, we see U.S. 10-year Treasury yields rising to 2.20% by early 2023.”
“With Japanese yields unlikely to follow U.S. yields perceptibly higher, we expect that will translate into a weaker yen versus the U.S. dollar, and target and USD/JPY exchange rate of JPY120.00 by early 2023.”
- Mexican peso holds a negative bias versus US dollar.
- USD/MXN moving in a new higher range biased to the upside.
- The area around 20.65/70 keeps the upside limited.
The USD/MXN is rising on Monday after a pullback on Friday. The cross is approaching last week high at 20.72. More important, it is testing the 20.65/70 resistance area. A break higher should clear the way to more gain.
The bias points to the upside in USD/MXN. Currently, is it moving in a range between 20.45 and 20.70. A slide below 20.45 should clear the way for an extension toward 20.30. Below the net support stands around 20.13/18 that contains the 100 and 200 moving average.
On the upside, the 20.65/70 area capped the rally so far. A daily close above 20.70 should expose the next key area of 20.85/90, the last defence to 21.00.
USD/MXN daily chart
-637725896872037899.png)
In a reiteration of the ECB's now well-known stance/inflation view, ECB's de Guindos said that the current phase of higher inflation, which in part reflects an increase in energy prices and supply constraints, could last longer than expected only some months ago. Supply-side shortages may dampen activity while pushing up prices, adding to the uncertainty in the outlook for growth and inflation, he said.
De Guindos said that rising energy costs are weighing on growth by limiting the purchasing power of households. To prevent the materialisation of the medium-term risks that we have identified, he added, it is essential to maintain the momentum of the recovery and avoid scenarios that could put our price stability objective in jeopardy. To do this, the bank must continue to ensure favourable financing conditions.
Market Reaction
De Guindos' comments on inflation are nothing new, but his remarks on the need for the maintenance of favourable financing conditions to ensure the economic recovery continues might be interpreted as dovish. EUR/USD has been gradually ebbing lower in recent trade and recently broke out to fresh year-to-date lows around 1.1420. Dovish ECB vibes may be playing a part, though stronger than expected US manufacturing survey data released earlier in the session is likely to also be weighing on the pair.
EUR/NOK has again started to move higher the last month. Economists at Danske Bank continue to expect EUR/NOK to march forward over the coming year and reach the 10.40 level.
More upside in store for EUR/NOK
“We see the NOK potential exhausted on the back of a shift in the global investment environment, weaker growth, tighter global liquidity conditions, less fiscal NOK buying, positioning, year-end headwinds and NOK rates pricing. We thus maintain a negative view on NOK.”
“EUR/NOK has risen over the last month and in that light we lift the short-end of our forecast profile but leave the long-end unchanged forecasting 10.40 in 12 months.”
“The biggest risk to our forecasts lies in global commodity prices. Should oil and gas prices continue higher while global risk appetite remains positive then we would expect EUR/NOK to trade below our forecasts. On the other hand, marked risk-off could trigger a larger-than-projected setback.”
- US 10-year yield rebounds sharply from 1.54%, back to 1.60%.
- Yields across the curve hit fresh daily highs on American hours.
- DXY is back in positive territory for the day, above 95.00.
US yields turned to the upside during the American session and climbed to weekly highs. The 10-year yield rose from under 1.55% to 1.609%, reaching the highest level in two weeks. Treasury yields across the curve reached fresh highs with the 2-year rising to 0.542%, the 5-year at 1.257% and the 30-year at 1.989%.
At the same time, the US 10-year TIPS yield (protected by inflation) remains is flat on Monday, near the record low at -1.162%.
Last week US inflation numbers weighed on Treasuries, triggering a rally in yields that still goes on. If the 10-year manages to consolidate above 1.60%, higher figures are expected.
The moves in the bond market continue to support the greenback. The DXY is back into positive territory after falling toward 95.00 and it stands at 95.16, looking at the recent cycle high of 95.26.
Economic data released on Monday surpassed expectation with the Empire Manufacturing index at 30.9 in November up from 21.6, and significantly above the 21.9 of market consensus. On Tuesday, the retail sales report is due.
Bank of England Governor Andrew Bailey, speaking before the UK Parliament Treasury Select Committee TSC, said that all future BoE policy meetings are now “in play” for a rate rise. He added that, given the very high uncertainty in economy, it would be hazardous to give specific forward guidance about when exactly these hikes might come.
Regarding his decision at the most recent BoE meeting not to vote for an immediate end to the bank’s QE programme, Bailey said he did not want to raise questions over whether BoE would complete future QE programmes.
Fellow MPC member Michael Saunders, also speaking before the TSC, noted that the risk of delaying too long on raising rates is that they might then have to go up a faster and further.
Finally, BoE MPC member Huw Pill said that while medium to long-term inflation expectations remain anchored, if those expectations were to shift, it would be key that “we meet that challenge”.
Market Reaction
GBP/USD has seen very little reaction to the testimony of BoE members before parliament just yet and the pair, for now, remains capped to the south of the 1.3450 mark.
- USD/CAD falls on broad US dollar weakness amid falling US Treasury yields.
- According to BBH, Fed Fund futures sees a 66% chance of Q2 liftoff, while a Q3 hike is fully priced in.
- BoC Tiff Macklem: Economic slack is still not absorbed, but “we are getting closer.”
After reaching four-week highs, the USD/CAD slumps for the second day in a row, down 0.18%, trading at 1.2524 during the day at the time of writing. The fall is mainly driven by US dollar weakness, caused by a weaker than expected University of Michigan consumer sentiment that plummeted to a 10-year low in November amid concerns about the pace of elevated prices. Also, a leg down in US bond yields weighed on demand for the US dollar, which is on defensive mode as the week begins.
Meanwhile, crude oil prices fell as investors wait for the next move of the White House regarding high gasoline prices. Speculations are mounting that US President Joe Biden will release supplies from the Strategic Petroleum Reserve (SPR), which could weigh on the oil-commodity-linked Canadian dollar, that could lift the prospects of the USD/CAD pair.
Fed bond taper week begins
According to Brown Brothers Harriman (BBH), on a note to customers said “the New York Fed last week released an updated purchase schedule that will result in total purchases of $70 bln in USTS and $35 bln of MBS this month, $15 bln less than peak QE. How bonds trade this week will be significant in understanding the potential impact of tapering.” Further added that at that pace, the QE will end by June of 2022.
Moreover, BBH added that “Fed Funds futures still see nearly two-thirds odds of Q2 liftoff, which seems too soon, while Q3 liftoff is fully priced in. Strong data and rising inflation are likely to keep upward pressure on US rates.”
As of writing, Tiff Macklem, BoC Governor, said that economic slack in the Canadian economy is still not absorbed but that “we are getting closer,” thus added that QE is no longer needed. Further added that if the BoC turns to be wrong about long-lasting inflation, they “will adjust.”
That said, the USD/CAD pair might consolidate, as according to investors, the Bank of Canada (BoC) is expected to raise rates sooner than the Federal Reserve, but a change of the pace of the Fed’s QE reduction could reduce the bond spread between the US and Canada, favoring the greenback in the medium-term.
EUR/GBP has been more volatile lately and has moved closer to 0.86 after the Bank of England (BoE) kept monetary policy unchanged. Nevertheless, strategists at Danske Bank remain bullish on the pound as the USD-positive environment is usually also benefitting GBP and keep their EUR/GBP forecast intact at 0.83 in 12 months.
BoE’s rate hikes are looming
“Against market pricing but in line with our call, the BoE kept monetary policy unchanged at its November meeting. The BoE signalled, however, that rate hikes are looming. We still expect the BoE will hike 15bp in February, 25bp in May and 25bp in November (65bp in total).”
“We remain bullish on GBP as the USD-positive environment is usually also benefitting GBP. We thus continue to target EUR/GBP at 0.83 in 12M.”
“A risk to our forecast is a hit to global risk sentiment and/or if Bank of England keeps monetary policy accommodative for longer than currently expected. Stagflation may become more pronounced in the UK compared to the euro area. EU-UK tensions remain a risk.”
EUR/SEK has again moved higher since the beginning of November. However, with global growth outlook deteriorating and too aggressive medium-term pricing on the Riksbank, analysts at Danske bank remain bearish on the Swedish krona forecasting EUR/SEK at 10.50 in 12 months.
Brief visit in single-digits for EUR/SEK
“A perfect storm of equities-related flows, positioning and monetary policy re-pricing recently pushed EUR/SEK below 10.00. However, we expect the visit into single-digit territory to be short-lived and maintain our strategically bearish view on SEK with global growth outlook deteriorating and too aggressive medium-term pricing on the Riksbank.”
“We continue to forecast EUR/SEK to 10.50 in 12 months.”
“A risk to our forecast is if markets continue to push for an early Riksbank hike, leaving the SEK to possibly gain even further. If instead the market re-price in line with our view, SEK depreciation might come faster than expected.”
- USD/TRY advances to new record highs above 10.0000.
- The CBRT meets on Thursday and could reduce rates further.
- Markets’ consensus points to a 100bps rate cut.
The Turkish lira depreciates (much) further and pushes USD/TRY to new all-time highs past the psychological 10.0000 mark on Monday.
USD/TRY: Door open to extra upside near term
USD/TRY adds to Friday’s advance and extends the rally well north of the critical 10.0000 mark, clinching at the same time the fifth consecutive session with gains.
Further losses in the lira are likely in the short-term horizon, as bets on the likeliness that the Turkish central bank (CBRT) could reduce the policy rate by 100 bps at its meeting on Thursday, taking the One-Week Repo Rate to 15%, remain well on the rise.
In the domestic calendar, House Sales rose by 14.9%, or 137.401K units, in the year to October. In the US, the NY Empire State Index improved to 30.9 for the month of November.
USD/TRY key levels
So far, the pair is gaining 0.88% at 10.0545 and a drop below 9.6285 (20-day SMA) would expose 9.4722 (monthly low Nov.2) and finally 9.4128 (weekly low Oct.26). On the other hand, the next up barrier lines up at 10.0566 (all-time high Nov.12) followed by 11.0000 (psychological level).
EUR/USD has reach new lows, falling below 1.15. Economists at Danske Bank continue to see a stronger dollar in the months to come and, therefore, expect the world’s most popular currency pair to dive to the 1.10 level over the next 12 months.
Broader market themes are increasingly turning pro-dollar
“Fed has begun discussions on the timing of rate hikes and tapering of asset purchases: Tapering is starting here in November. This will continue to shift the market’s attention towards USD on a theme of monetary divergence vis-à-vis EU. Such upside risk is amplified by the dollar rebounding from relatively weak levels.”
“As a reflection of broader market themes increasingly turning pro-dollar with global liquidity conditions tightening, PMIs moving lower and central banks facing rising inflation concerns we keep our profile for EUR/USD to 1.10 in 12 months in favour of USD strength.”
“The risks to see EUR/USD above 1.20 include global inflation pressures fading.”
USD/CAD is drifting steadily lower after testing the 1.26 level late last week. The pair’s failure to push on through the 1.26 zone leaves it at risk of sliding below the 1.25 mark, economists at Scotiabank report.
Bullish outlook for the Canadian dollar
“The loonie looked somewhat misaligned with underlying fundamentals last week (even with crude oil drifting lower) from our point of view and investors appear to concur as levels near 1.26 draw out bargain hunters. We remain bullish on the CAD outlook.”
“The turn lower from the 1.26 zone is not particularly powerful on the charts at this point and we think a push under 1.2500 (40-day MA) will give the CAD rebound a little more momentum for a recovery to the mid/upper 1.24s.”
Speaking before the UK Parliament's Treasury Select Committee, Bank of England Governor Andrew Bailey said that he is very uneasy about the inflation situation, according to Reuters. He added that the November decision was a very close call and that we now face much more two-sided risks.
Bailey added that while the labour market looks very tight, the real puzzle is what happens at the end of the government's furlough scheme (which ended at the end of September). Bailey noted that early anecdotes suggest that the end of the furlough scheme has not raised unemployment.
EUR/USD is steady in mid-1.14s with limited domestic drivers as the European Central Bank’s Lagarde and Lane play down the risks to inflation over the forecast horizon. Economists at Scotiabank warn that a break below 1.14 would open up the 1.11/10 area.
Firm bearish pressure remains well in place
“Lagarde pointed to the transitory path of price pressures and repeated her expectation that rates are very unlikely to increase in 2022. Lane called the recent surge in prices ‘really part of the pandemic’ and noted that he expects inflation to be ‘significantly below 2%’ in 2023.”
“With Fed hike bets mounting and the ECB unlikely to move before late-2023, we expect downside pressure on the EUR to persist over the foreseeable future toward the low 1.10s.”
“The 1.14 level stands as psychological support with limited markers to defend the EUR until the 1.10/11 area – though oversold conditions will likely act to stall its losses.”
“EUR/USD faces resistance at 1.15 followed by 1.1515/25 and firmer in the 1.16 area.”
European Commission Vice President Maros Šefčovič said that his most recent meeting with UK Brexit Minister Lord David Frost was much better than last week, according to Reuters. Šefčovič added that an agreement on medicines was very close and that the two sides had agreed to move on to concrete discussions on legal texts.
- AUD/USD has recovered back to its 50DMA in the 0.7360s, aided by stronger Chinese macro data.
- Some analysts warn that weak Chinese real estate investment data suggests further economic weakness lies ahead, a negative for AUD.
AUD/USD has managed to recover all the way back to its 50-day moving average in the 0.7360s on Monday, having been as low as the 0.7270s last week. FX markets didn’t show much of a reaction to the latest NY Fed manufacturing survey released, which pointed to an improvement in business conditions in the US at the start of this month. According to market commentators, Monday’s 30 pip gains from the 0.7330s is as a result of better than expected activity data released out of China, Australia’s most important trade partner, during Monday’s Asia Pacific session. For reference, Chinese Industrial Production rose at a YoY pace of 3.5% in October, above economist forecasts for 3.0%, while Retail Sales rose at a pace of 4.9% YoY, above economist forecasts for 3.7%.
Some analysts raised concerns that the beat on Retail Sales, rather than suggesting the beginnings of a sustained pickup in consumer spending, was a result of higher prices as higher food sales as consumer pre-empt any possible winter lockdowns. Other analysts pointed to the Chinese Real Estate Investment data, which showed investment coming in at 6.1%, a tad under expectations for 6.2%. Societe Generale said that “for our economists, it doesn't change the view that a property-led slowdown (in Chinese growth) will continue over the coming months and more broad-based easing is still warranted”. This is hardly going to be a long-term positive for the Aussie.
Some market participants might thus look at current AUD/USD levels as an attractive short-entry point. According to Westpac, there are “multiple opportunities for the RBA to remind the market this week that they (are dovish)” and “the A$ should be well capped by 0.7350/70… We expect to see further weakness below 0.7300.” Should AUD/USD fail to break above its 50DMA, that might be taken as a bearish sign by some technicians, which could also help to propel the pair lower towards 0.7300 again. Conversely, if recent bullish momentum continues and the 50DMA is broken, the next area of resistance is around 0.7400 and in the 0.7430s.
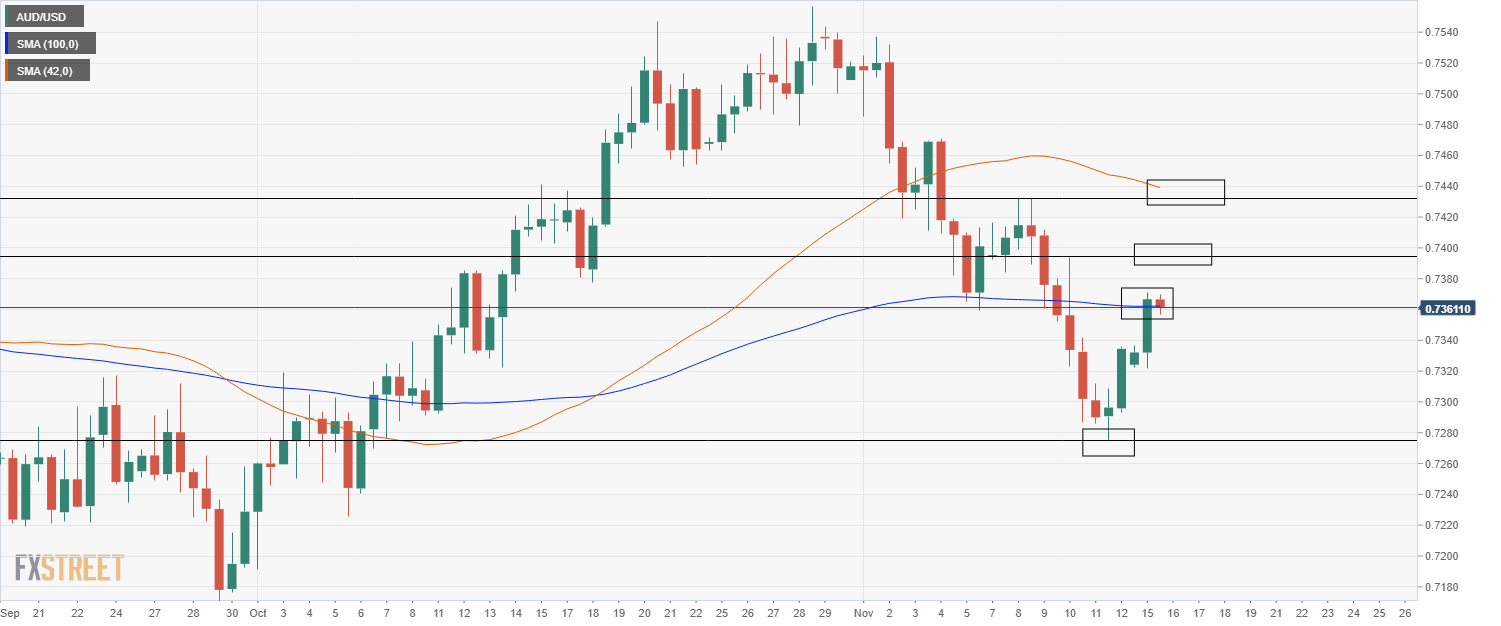
Ahead, Aussie markets will be focused on Australian Wage Price data out on Wednesday, which is likely to come in subdued and justify the RBA's dovish stance. AUD/USD's focus will otherwise be risk appetite and US-related economic events such as retail sales data (on Tuesday) and this week's smattering of Fedspeak.
Gold has refreshed five-month highs at $1,870 after breaking key resistance at $1,834. Strategists at Credit Suisse expect XAU/USD to stage a significant leg higher on a break above the June peak at $1,917.
XAU/USD above rising short, medium and long-term averages
“Gold continues to improve steadily and has now cleared key price resistance from the July and September highs and downtrend from August 2020 at $1,834 to establish a five-month base. With the market also above rising short, medium and long-term averages evidence looks to be building we may be at the beginning of a more sustained move higher.”
“We look for a test of the June high at $1,917, a break above which should add further weight to our view with resistance then seen next at $1,959/77 and eventually back to the $2,075 record high.”
Bank of Canada Governor Tiff Macklem, in an FT oped cited by Reuters, said that economic slack in the Canadian economy is still not absorbed, but that "we are getting closer", thus, adding further stimulus via QE is no longer needed. Macklem caveated that, given he believes that slack does still remain in the economy, considerable monetary stimulus remains necessary.
On supply disruptions, he said they appear longer-lasting than thought and that energy prices were adding to inflationary pressures. If the bank does turn out to be wrong about the persistence of inflationary pressures, they "will adjust", said Macklem, before adding that the BoC's forward guidance has been clear that rates will not rise until economic slack is absorbed.
On Friday, EUR/USD moved to its lowest levels since last July. As the pair looks set to reach the 1.14 level sooner than expected by economists at Rabobank, the common currency faces a bleak outlook ahead.
USD to remain on the front foot in the months ahead
“The uptrend that has been in place since June remains in place and we expect the USD to remain on the front foot going forward into 2022.”
“We expect the cautiousness of the ECB on policy to limit recovery prospects for the EUR vs. USD in the coming months.”
“Our current mid-2022 forecast of EUR/USD 1.14 is looking outdated, with the currency pair looking set to achieve this level sooner than we had expected.”
“This week the USD is likely to be focused on the release of US October retail sales data, production number and various activity indices, in addition to comments from various Fed speakers. We would continue to favour selling EUR/USD into rallies.”
- AUD/USD gained follow-through traction for the second successive day on Monday.
- Mixed technical setup warrants caution before placing aggressive directional bets.
- Investors eye RBA meeting minutes/RBA Governor Lowe’s speech for a fresh impetus.
The AUD/USD pair built on Friday's recovery move from the 0.7275 area, or over one-month lows and gained some follow-through traction on the first day of a new week. The momentum pushed the pair to three-day highs, around the 0.7370 region, though stalled just ahead of 100-hour SMA.
The US dollar reversed a major part of its modest intraday losses following the release of the upbeat Empire State Manufacturing Index, which jumped to 30.9 in November from 19.8 previous. That said, sliding US Treasury bond yields kept a lid on any meaningful gains for the greenback. Apart from this, the risk-on impulse in the markets acted as a tailwind for the perceived riskier aussie.
Meanwhile, RSI on the 1-hour chart is already flashing slightly overbought conditions. Moreover, technical indicators on the daily chart – though have recovered from the bearish territory – are yet to gain any meaningful positive traction. The mixed technical set-up warrants caution for aggressive traders ahead of RBA meeting minutes/RBA Governor Philip Lowe's speech during the Asian session on Tuesday.
From current levels, any subsequent move up might confront stiff resistance around the 0.7380 region, or the 38.2% Fibonacci level of the 0.7557-0.7282 downfall. Some follow-through buying, leading to a subsequent strength beyond the 0.7400 mark will be seen as a fresh trigger for bullish traders. The AUD/USD pair might then aim to test the next relevant hurdle near the 0.7425-30 supply zone.
On the flip side, the 23.6% Fibo. level, around the 0.7340 region, now seems to protect the immediate downside. This is followed by support near the 0.7300 round figure, which if broken decisively will set the stage for an extension of the recent rejection slide from the very important 200-day SMA. The downward trajectory could then drag the AUD/USD pair towards the 0.7240 support zone.
AUD/USD 1-hour chart
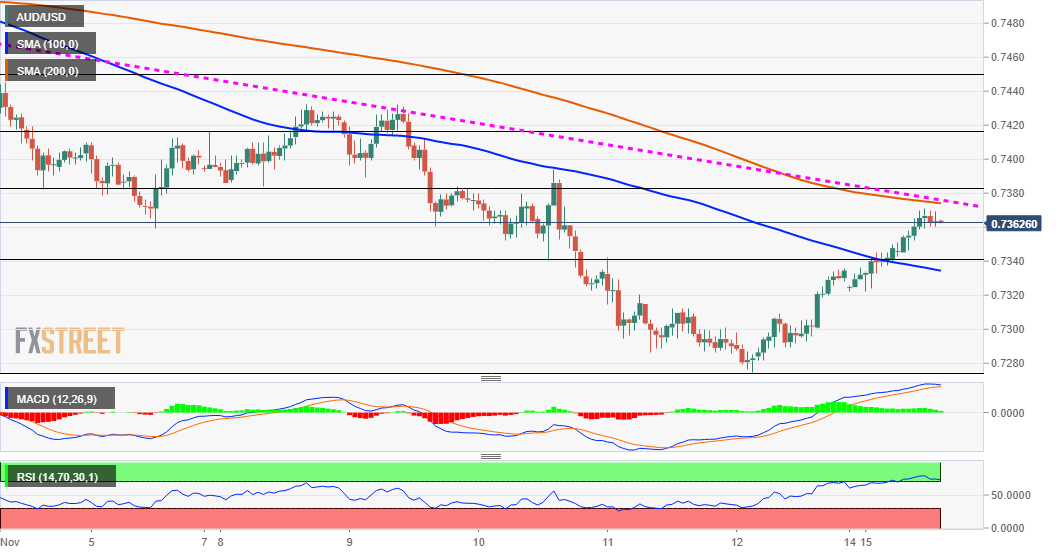
Technical levels to watch
The New York Fed's Manufacturing Index for November rose to 30.9 from 19.8 in October, larger than the expected rise to 21.6. The headline was boosted by a rise in the New Orders subindex to 28.8 from 24.3 (a promising sign for manufacturing activity in the coming months), a jump in the Prices Paid subindex to 83.0 from 78.7 and a jump in the Employment subindex to 26.0 from 17.1 (a record high). The only negative spot was a decline in the six-month business conditions subindex to 36.9 from 52. FX markets did not see any notable reaction to the data.
Additional Takeaways
"Forty-three percent of respondents reported that conditions had improved over the month, while 12 percent reported that conditions had worsened."
"The delivery times index came in at 32.2, indicating significantly longer delivery times."
"The prices paid index edged up four points to 83.0, and the prices received index moved up seven points to a record high of 50.8, signaling ongoing substantial increases in both input prices and selling prices."
- EUR/GBP met with fresh supply on Monday and dropped to over one-week lows.
- The descending channel constitutes the formation of a bullish flag chart pattern.
- A convincing break below the 0.8500 mark will negate the constructive setup.
The EUR/GBP cross struggled to capitalize on its modest uptick, instead met with some fresh supply near the 0.8535-40 region and dropped to seven-day lows on Monday. The cross was last seen trading around the 0.8515 area, down
Looking at the broader picture, the ongoing rejection slide from the very important 200-day SMA has been along a downward sloping channel. Given the recent recovery from the 0.8400 mark, or the lowest level since February 2020, the mentioned channel constitutes the formation of a bullish flag on short-term charts.
The constructive setup is reinforced by the fact that oscillators on the daily chart are holding in the positive territory. Moreover, RSI on the 1-hour chart is flashing oversold conditions and has moved on the verge of breaking below 30 on the 4-hour chart, supporting prospects for the emergence of some dip-buying.
That said, a convincing break below the trend-channel support, currently near the 0.8500 psychological mark, will negate the bullish bias and prompt aggressive technical selling. The EUR/GBP cross might then accelerate the corrective pullback towards the next relevant support near the 0.8465-60 area en-route the 0.8420 region.
On the flip side, the daily swing highs, around the 0.8540 region, now seems to act as an immediate resistance ahead of the 0.8560 level, or the top boundary of the mentioned channel. A sustained breakthrough, leading to a subsequent move beyond 200-DMA, around the 0.8575 zone, will validate the bullish flag breakout.
The momentum could then allow the EUR/GBP cross to surpass the 0.8600 mark aim to test September monthly swing highs, around the 0.8655-60 region. Some follow-through buying should pave the way for an extension of the positive move towards reclaiming the 0.8700 round-figure mark for the first time since May 2021.
EUR/GBP 4-hour chart
-637725798183333446.png)
Technical levels to watch
- Spot gold is currently probing multi-month highs at $1870.
- The precious metal will take its cue mostly from Fed-related developments this week.
Spot gold (XAU/USD) is higher this morning and trading above $1865 as it continues to trade with a bullish bias. The dip under $1860 during Monday’s Asia Pacific trading hours attracted good demand. Spot prices have been flirting with multi-month highs at $1870 printed last week, as gold continues to benefit from bullish bank commentary, with Goldman Sachs the latest to forecast the precious metal moving back to the $2000 level. Technically speaking, the picture for gold looks bullish. If the precious metal can break above resistance at $1870, its next move will likely be towards $1900.
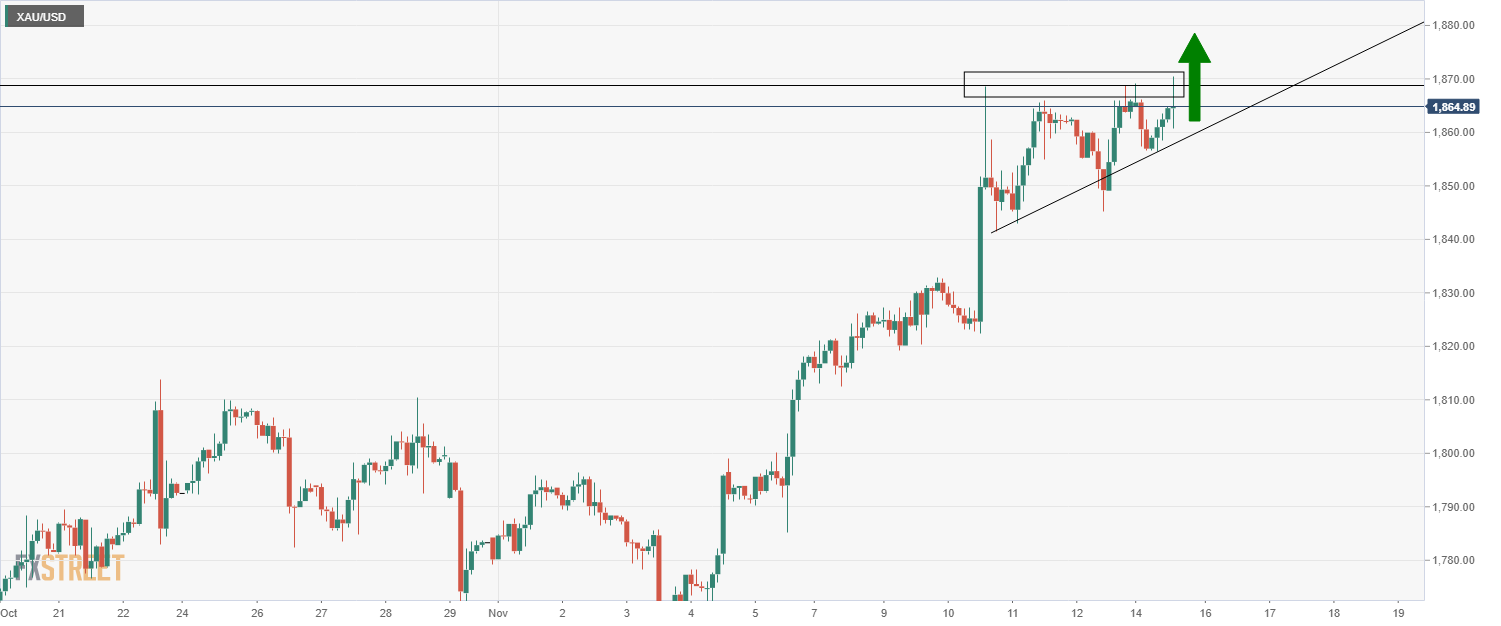
-637725793476088440.png)
Real Yields
Real yields across developed markets remain close to record lows, with the US 10-year TIPS currently around -1.17% and the German inflation-linked 10-year yield currently under -2.0%. The fact that real yields are so low (and financial conditions thus so accommodative) despite the recent acceleration of headline inflation rates across developed markets has resulted in central banks like the Fed and ECB facing criticism for being too dovish. In other words, letting inflation run out of control and keeping interest rates low anyway, thus pushing real yields excessively low. Whether or not central banks are making a dovish policy mistake, gold is a big beneficiary, as lower real yields reduce the opportunity cost of holding gold. US real yields are on Monday trading with a slight downside bias, which helped the spot metal off earlier lows.
Ahead
Ahead, the main themes for precious metals like gold this week are all Fed-related; US President Joe Biden’s decision on who will be nominated as the next Fed Chair may be announced and large number of Fed policymakers will be speaking publically. Markets will be attuned to any change in tone on inflation after last week’s upside Consumer Price Inflation (CPI) surprise. Any hawkish vibes from FOMC members might present a challenge for spot gold prices.
USD/RUB nears the 200-day moving average (DMA) and the 2020-2021 downtrend line at 73.55/91. A break above the 74.95 mark is key to see further gains towards the April peak at 78.04, Axel Rudolph, Senior FICC Technical Analyst at Commerzbank, reports.
Upside bias while above 70.52
“USD/RUB is seen heading up towards the 200-DMA and 2020-2021 downtrend line at 73.55/91. If the next higher August peak at 74.95 were to be exceeded, we would turn bullish and target the July peak at 75.36 in the first instance. The next higher April peak at 78.04 would then also be targeted longer-term.”
“Minor support comes in at the June low at 71.55. While the next lower current November low at 70.52 underpins, overall upside pressure should be maintained. Only if it were to unexpectedly be slipped through, would the October trough at 69.22 be back in the frame. Below the October low at 69.22 sits the 68.04 June 2020 low.”
- USD/JPY witnessed a subdued/range-bound price action on the first day of a new week.
- The risk-on impulse, disappointing GDP undermined the JPY and extended some support.
- Sliding US bond yields weighed on the greenback and kept a lid on any meaningful gains.
The USD/JPY pair seesawed between tepid gains/minor losses and remained confined in a range below the 114.00 mark heading into the North American session.
A combination of diverging forces failed to provide any meaningful impetus to the USD/JPY pair and led to a subdued/range-bound price action on the first day of a new week. The risk-on impulse in the equity markets undermined the safe-haven Japanese yen, which was further weighed down by Monday's disappointing GDP print from Japan.
The Preliminary estimate showed that the economy contracted more than expected, by 0.8% in the three months through September and 3.0% on an annualized basis. This, in turn, was seen as a key factor that extended some support to the USD/JPY pair, though a further US dollar pullback from 16-month tops touched on Friday acted as a headwind.
The University of Michigan survey released on Friday showed that the US consumer sentiment plunged to a 10-year low in November. This, along with a fresh leg down in the US Treasury bond yields, kept the USD bulls on the defensive and capped the upside for the USD/JPY pair. That said, hawkish Fed expectations helped limit the USD losses.
In fact, the markets have been pricing in the possibility for an eventual Fed rate hike move in July 2022. Adding to this, the Fed funds futures indicate a high likelihood of another raise by November amid worries about rising inflationary pressure. This, in turn, supports prospects for the emergence of some dip-buying around the USD/JPY pair.
This, in turn, warrants some caution before confirming that the hotter-than-expected US CPI-inspired rally has run out of steam and placing aggressive bearish bets. Market participants now look forward to the US economic docket, featuring the only release of the Empire State Manufacturing Index, for some impetus around the USD/JPY pair.
Traders will further take cues from the US bond yields, which might influence the USD price dynamics. Apart from this, the broader market risk sentiment will drive demand for the safe-haven JPY and further contribute to producing some meaningful trading opportunities around the USD/JPY pair.
Technical levels to watch
- FX markets are starting the week in subdued fashion, with EUR/USD flat around 1.1450 and well within recent ranges.
- This week’s fundamental drivers are likely to come from the US rather than the EU.
FX markets are starting the week in a contained fashion, with EUR/USD having so far this Monday respected last Friday’s 1.1430-1.1460ish range very well. The pair is currently trading flat and is pretty much bang on the 1.1450 mark. To the upside, key resistance is at 1.1500 and then 1.1520, while to the downside, there is support at 1.1420 and then 1.1350.

This week's drivers
The main drivers of the EUR/USD this week are likely to be US rather than Eurozone related fundamental catalysts; Monday sees the release of the NY Fed’s November Manufacturing survey, ahead of the October Retail Sales and Industrial Production reports on Tuesday and then the Philadelphia Fed’s November Manufacturing survey on Thursday alongside weekly jobless claims. There is also a heavy slate of Fed speak, with the main focus on how Fed policymakers respond to recent inflation developments – chatter is growing amongst market participants that the Fed will need to accelerate the pace of QE tapering in Q1 2022 and bring forward rate hikes. There is also the question of who will be nominated as the next Fed Chair. A WSJ report suggested that US President Joe Biden’s recent interview with current Fed Board of Governors member Lael Brainard went better than expected and that he could make a decision on the Fed chair nomination as soon as this week.
Meanwhile, the euro has largely ignored trade data released on Monday morning, which showed the bloc’s trade surplus coming in at EUR 7.3B in September, a little larger than the EUR 6.5B forecast, as well as inconsequential remarks from ECB President Christine Lagarde, who refused to comment on the appropriateness of rate hikes in 2023. There is very little by way of tier 1 data out of the Eurozone for the rest of the week, while ECB speak is not expected to deliver any surprises.
Capital Economics thinks that Tuesday’s second estimate of Q3 GDP “should confirm that that euro-zone GDP grew by 2.2%”. “But with daily Covid infections now having risen to the highest level since April and showing little sign of slowing” adds the economic consultancy, “there is evidence that consumers are becoming more cautious”. Recent lockdown announcements in various Eurozone nations will not help this and negative revisions for Q4 2021/Q1 2022 European growth forecasts could be forthcoming, creating some downside risks for the euro.
When asked whether the UK will trigger Article 16, British Prime Minister Boris Johnson's spokesman said their aim remains to reach a consensual solution on to the Northern Ireland protocol, as reported by Reuters.
"We are continuing intensive talks with the EU," the spokesman added.
Market reaction
These comments don't seem to be having a significant impact on the British pound's performance against its major rivals. As of writing, the GBP/USD pair was trading at 1.3432, where it was up 0.15% on a daily basis.
- GBP/USD gained positive traction for the second successive day amid weaker USD.
- Brexit woes might hold back bulls from placing aggressive bets around the sterling.
- Hawkish Fed expectations should limit the USD losses and collaborate to cap gains.
The GBP/USD pair shot to fresh three-day highs, closer to mid-1.3400s during the mid-European session, albeit lacked follow-through buying.
The pair attracted some dip-buying near the 1.3400 mark on Monday and turned positive for the second successive day, allowing bulls to build on Friday's recovery move from YTD lows. The uptick was exclusively sponsored by some follow-through US dollar selling, though a combination of factors should hold back bulls from placing aggressive bets.
The University of Michigan survey released on Friday showed that the US consumer sentiment plunged to a 10-year low in November. This, along with sliding US Treasury bond yields and the underlying bullish sentiment in the financial markets, undermined the safe-haven greenback. However, hawkish Fed expectations should help limit the USD losses.
Investors seem convinced that the fed would be forced to adopt a more aggressive policy response to contain stubbornly high inflation, which surged to the highest level since 1990 in October. In fact, the Fed funds futures indicate a 50% probability that the Fed will hike interest rates in July 2022 and a high likelihood of another raise by November.
Apart from this, the risk that Britain will trigger Article 16 and suspend parts of the Northern Ireland Protocol should act as a headwind for the British pound. This, in turn, suggests that any subsequent positive move is more likely to get sold into and runs the risk of fizzling out rather quickly, further warranting caution for bullish traders.
Market participants now look forward to the US economic docket, highlighting the only release of the Empire State Manufacturing Index for some impetus during the early North American session. This, along with the US bond yields and the broader market risk sentiment, could influence the USD price dynamics and produce some trading opportunities around the GBP/USD pair.
Technical levels to watch
- EUR/USD struggles for direction near 2021 lows.
- A breach of 1.1432 exposes a move to 1.1422 near term.
EUR/USD remains under heavy pressure and looks to regain some composure in the 1.1440 zone at the beginning of the week.
The continuation of the downtrend appears favoured in the short-term horizon. Against this, and if the pair clears the YTD low at 1.1432, the focus of attention is expected to quickly gyrate to the June 2020 high at 1.1422 (June 10).
In the meantime, extra losses remain on the cards as long as the pair trades below the immediate resistance line (off September’s high) today near 1.1620. In the longer run, the negative outlook persists while below the 200-day SMA, today at 1.1874.
EUR/USD daily chart
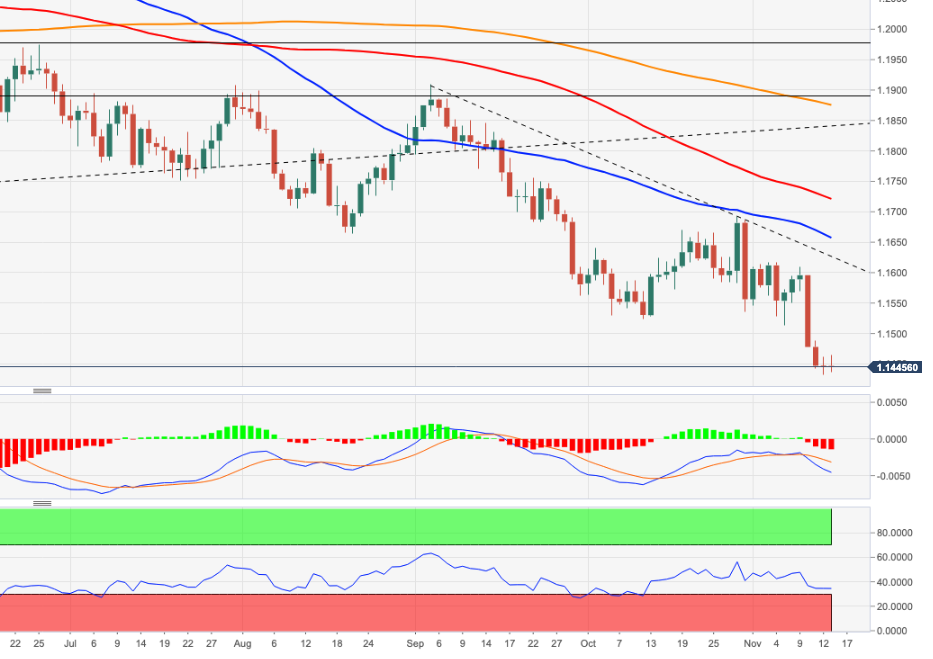
- NZD/USD gained strong positive traction for the second successive day on Monday.
- A combination of factors undermined the USD and remained supportive of the move.
- Hawkish Fed expectations could help limit the USD losses and cap gains for the major.
The NZD/USD pair continued scaling higher through the mid-European session and shot to three-day highs, around the 0.7075-800 region in the last hour.
The pair built on the previous session's bounce from levels just below the key 0.7000 psychological mark and gained some follow-through traction on the first day of a new week. A combination of factors kept the US dollar bulls on the defensive, which, in turn, pushed the NZD/USD pair higher for the second successive day.
The greenback was pressured by Friday's dismal US data, which showed that consumer sentiment plunged to a 10-year low in November amid surging inflation. Apart from this, a fresh leg down in the US Treasury bond yields and the risk-on mood further undermined the greenback and further benefitted the perceived riskier kiwi.
This, along with rising bets for another rate hike by the RBNZ, remained supportive of the NZD/USD pair's ongoing positive move. That said, hawkish Fed expectations might hold back traders from placing aggressive bearish bets around the greenback and keep a lid on any meaningful upside for the major, at least for now.
Investors seem convinced that the US central bank would be forced to adopt a more aggressive policy response to contain stubbornly high inflationary pressures. In fact, the Fed funds futures indicate a 50% probability that the Fed will hike interest rates in July 2022 and a high likelihood of another raise by November next year.
Hence, it will be prudent to wait for a strong follow-through buying before confirming that the recent pullback from multi-month tops has run its course. Market participants now look forward to the US economic docket, featuring the only release of the Empire State Manufacturing Index, for some impetus later during the early North American session.
Technical levels to watch
Commenting on the European Central Bank's (ECB) policy outlook, ECB President Christine Lagarde said on Monday that any tightening measure now would cause more harm than good to the economy, as reported by Reuters.
Lagarde refrained from touching on what the policy strategy would look like in 2023.
Market reaction
These remarks don't seem to be having a noticeable impact on the shared currency's performance against its major rivals. As of writing, the EUR/USD pair was virtually unchanged on a daily basis at 1.1453.
- DXY extends further the rejection from YTD highs.
- The mid-94.00s should offer decent support near term.
DXY drops for the second session in a row and challenges 2-day lows in the 95.00 neighbourhood on Monday.
If the corrective decline intensifies, then the index is expected to meet quite firm contention in the 94.50 region, where October peaks and the 10-day SMA converge.
Looking at the broader picture, the constructive stance on the index is seen intact above the 200-day SMA at 92.15.
DXY daily chart
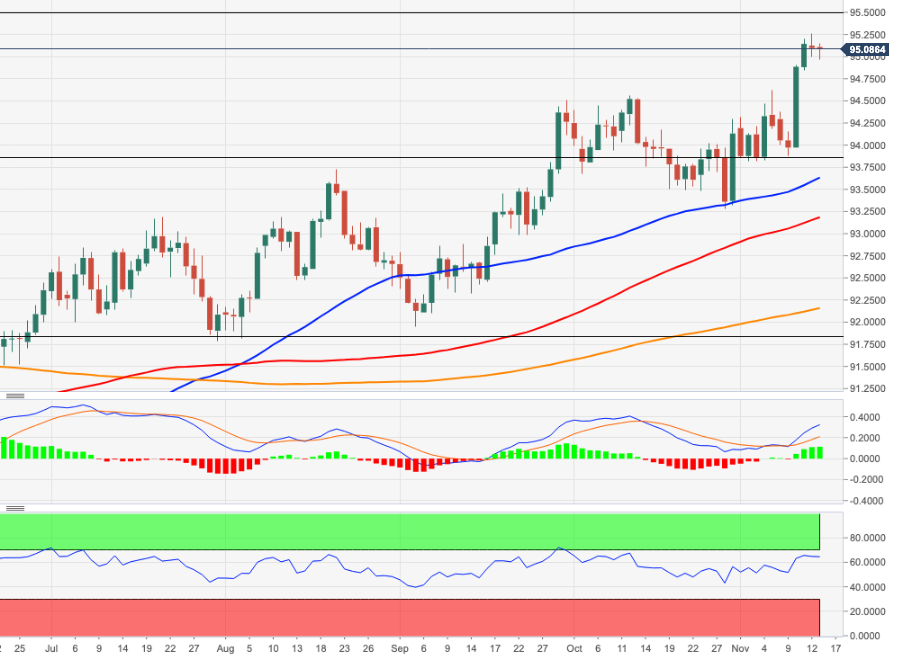
- EUR/JPY reverses four consecutive daily pullbacks near 130.40.
- The 100-day SMA emerges as the next interim support.
EUR/JPY manages to reverse part of the recent intense selloff and meets initial contention near 130.30.
EUR/JPY, in the meantime, flirts with the 100-day SMA near 130.50 at the beginning of the week. A breach of the 100-day, today at 130.22, and the Fibo level (of the October rally) at 130.29 should give sellers further reasons to accelerate the downside in the short-term horizon.
Below the 200-day SMA, the outlook for the cross is predicted to shift to bearish.
EUR/JPY daily chart
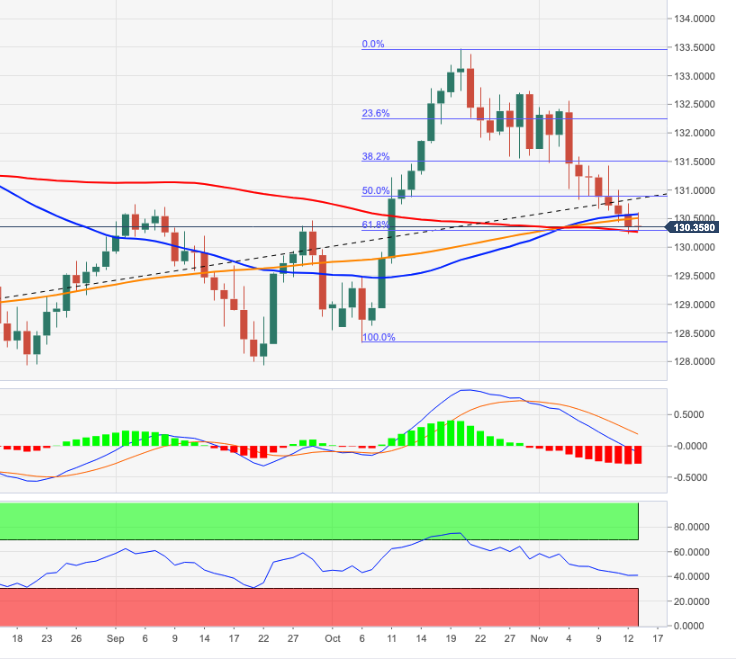
USD/TRY’s advance has taken it to above the October previous all-time high at 9.8610 to its current new all-time high at 10.0603. In the opinion of Axel Rudolph, Senior FICC Technical Analyst at Commerzbank, the pair may reach the 10.6444/11.0400 area.
Upside potential while above early November low at 9.4660
“A 261.8% Fibonacci extension taken from the September low and projected higher from the October trough at 10.6444 represents our new upside target as well as an hourly 0.01 x 3 Point & Figure upside target at 11.0400.”
“Potential slips below the October high at 9.8610 may find minor support at the 9.7685 early November low. Further minor support is found at the 9.6328 late October high.”
“While the next lower early November low at 9.4660 isn’t slipped through, upside pressure should retain the upper hand.”
- Silver attracted some dip-buying on Monday and recovered a part of its intraday losses.
- The technical set-up favours bullish traders and supports prospects for additional gains.
Silver edged lower on the first day of the week, though the downtick showed some resilience below the 50% Fibonacci level of the $28.75-$21.42 downfall. The white metal has now recovered a major part of its intraday losses and was last seen trading around the $25.20 region, just below the highest level since August 5 touched on Friday.
The emergence of some dip-buying at lower levels comes on the back of last week's sustained breakout through 100-day SMA/38.2% Fibo. confluence barrier and the $24.50 supply zone. A subsequent move beyond the 50% Fibo. level, around the key $25.00 psychological mark, favours bullish traders and supports prospects for further gains.
The positive outlook is reinforced by bullish oscillators on the daily chart, which area still far from being in the overbought zone. Hence, some follow-through move towards the $25.55-60 region, en-route the $26.00 mark, remains a distinct possibility. The latter coincides with the 61.8% Fibo. level and should act as a strong barrier for the XAG/USD.
On the flip side, any meaningful corrective pullback might continue to attract some dip-buying and remain limited near the $24.50 resistance breakpoint. Failure to defend the mentioned support could prompt some technical selling and turn the XAG/USD vulnerable to accelerate the corrective pullback towards the $24.00 round-figure mark.
Silver daily chart
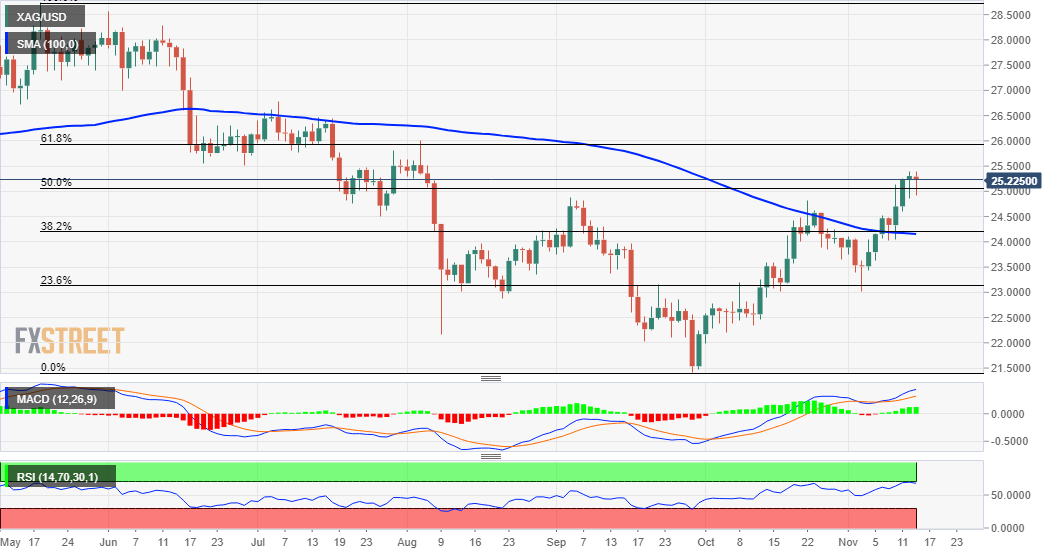
Technical levels to watch
The pound faces potentially choppy 48 hours with the release of employment on Tuesday and CPI on Wednesday. In the view of economists at Société Générale, the GBP has the chance to trim losses this week if the data beats expectations.
Short-term bounce expected on upbeat UK data
“Strong data could offer cable a chance to claw back losses towards 1.35 and EUR/GBP back off the 200-day moving average (0.8580) and attempt a reversal back below 0.8500.”
“GBP/USD – Support 1.3385, resistance 1.3465.”
We still see inflation moderating in the next year, said the European Central Bank (ECB) President, Christine Lagarde, before the Economic and Monetary Affairs Committee of the European Parliament.
Additional quotes:
- It will take longer to decline than originally expected.
- We can expect price pressures on goods and services to normalise as recovery continues and supply bottlenecks unwind.
- There is an indication of a noticeable easing of energy prices in 1H 2022.
- The duration of supply constraints is uncertain though.
- Likely to persist for several months then gradually ease during 2022.
- Growth momentum moderating to some extent, owing to supply bottlenecks and rise in energy prices.
- Undue tightening of financing conditions is not desirable, would represent an unwarranted headwind for the recovery.
- Conditions for a rate hike are very unlikely to be met in 2022.
Market reaction:
The was pretty much the repetition of the view that the recent rise in inflationary pressures is transitory and that the ECB will maintain its accommodative monetary policy stance. The remarks did little to provide any impetus to the shared currency or the EUR/USD pair, which remains at the mercy of the USD price dynamics.
- Gold price eases before resuming the next leg higher towards $1,884
- Gold remains undeterred by the global tightening calls after hot US inflation.
- Gold capitalizes on inflation fears, buyers look to retain control.
Gold price is snapping its week-long winning streak, as bulls take a breather ahead of Tuesday’s critical US Retail Sales release. Underlying surging inflationary risks and a dip in the US consumer confidence have added to the Fed’s dilemma on the timing of a potential rate hike, which renders positive for gold buyers. Meanwhile, upbeat Chinese economic data have lifted the overall market mood at the start of a fresh week, warranting caution for the gold price rally.
Read: Gold Price Forecast: XAU/USD down but not out, a test of $1,900 remains on the cards
Gold Price: Key levels to watch
The Technical Confluences Detector shows that gold price has recaptured a powerful support-turned-resistance at $1,860, which is the convergence of the Fibonacci 38.2% one-day and SMA10 four-hour.
The Fibonacci 23.6% one-day at $1,864 will likely challenge the rebound, with the next upside target envisioned at $1,869, the previous day’s high.
Further up, the pivot point one-day R1 at $1,874 will be on the buyers’ radars. Acceptance above the latter will trigger a fresh advance towards $1,884, the confluence of the pivot point one-month R3 and pivot point one-day R2.
Alternatively, if the sellers find control below daily lows of $1,756, then the Fibonacci 61.8% one-day at $1,853 will be put at risk.
The level to beat for gold bears is at around $1,850, which is the intersection of the pivot point one-month R2, Fibonacci 38.2% one-week and SMA5 one-day.
Here is how it looks on the tool
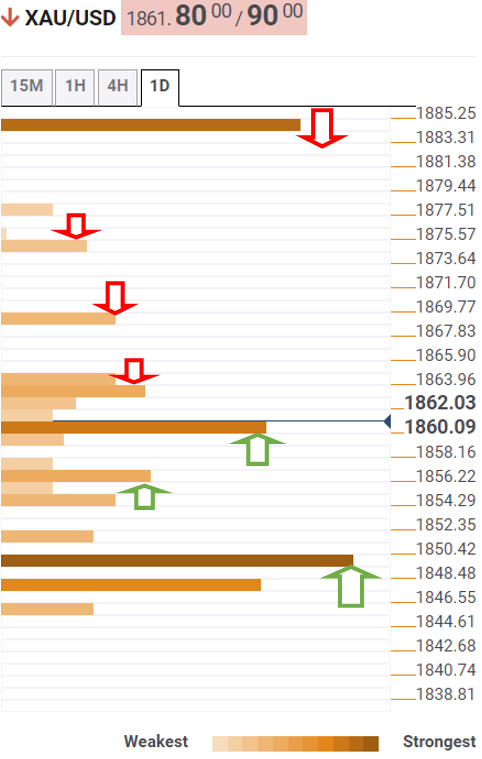
About Technical Confluences Detector
The TCD (Technical Confluences Detector) is a tool to locate and point out those price levels where there is a congestion of indicators, moving averages, Fibonacci levels, Pivot Points, etc. If you are a short-term trader, you will find entry points for counter-trend strategies and hunt a few points at a time. If you are a medium-to-long-term trader, this tool will allow you to know in advance the price levels where a medium-to-long-term trend may stop and rest, where to unwind positions, or where to increase your position size.
USD/MXN has successfully defended its 200-day moving average near 20.20/20.10 resulting in a rebound. Economists at Société Générale expect the pair to lurch higher towards the 21.60/68 region.
Break below 20.10 to signal a deep downfall
“USD/MXN is expected to head higher gradually towards the recent high of 21.00 and projections of 21.60/21.68.”
“Only a break below 20.10 will mean a deeper pullback.”
- GBP/JPY struggled to capitalize on its modest intraday positive move beyond the 153.00 mark.
- Brexit woes acted as a headwind for the British pound and kept a lid on any meaningful gains.
- The cautious market mood benefitted the safe-haven JPY and contributed to cap the upside.
The GBP/JPY cross surrendered modest intraday gains and was last seen hovering near the lower end of its daily trading range, around the 152.80-85 region.
The cross built on the previous session's modest recovery from over one-month lows, around the 152.35-30 area and gained some traction during the first half of the trading action on Monday. However, a combination of factors failed to assist bulls to capitalize on the move or find acceptance above the 153.00 round-figure mark.
The risk that the UK government could trigger Article 16 of the Northern Ireland Protocol acted as a headwind for the British pound. Apart from this, the prevalent cautious market mood underpinned the safe-haven Japanese yen and further collaborate to keep a lid on any meaningful upside for the GBP/JPY cross, at least for now.
Growing market acceptance that a faster rise in inflationary pressures could force major central banks to tighten monetary policy sooner than anticipated continued weighing on investors' sentiment. This helped offset the disappointing release of the GDP print from Japan and benefitted the traditional safe-haven assets, including the JPY.
The Preliminary estimate showed that Japan's economy contracted more than expected, by 0.8% in the three months through September and 3.0% on an annualized basis. This marked the first downturn in two quarters as a COVID-19 state of emergency snapped consumer spending and boosted expectations for Prime Minister Fumio Kishida’s stimulus package.
Nevertheless, the emergence of fresh selling at higher levels suggests that the recent corrective slide from multi-year tops is still far from being over. Sustained weakness back below the 100-day SMA, around the 152.70-65 region, will reaffirm the bearish bias and turn the GBP/JPY cross vulnerable to prolong the downward trajectory in the near term.
Technical levels to watch
USD/RUB has staged a bounce after hitting a low near 69.20 last month. Economists at Société Générale expect the pair to continue marching forwards and tackle the 73.25/65 resistance area.
Supports are located at 71.65, the 38.2% retracement of the bounce and 70.50
“USD/RUB is approaching towards projections of 73.25/73.65 which is also a multi-month descending trend line, the 200-DMA and the high of September. This could be an intermittent resistance.”
“A break above 73.25/73.65 will be essential for affirming an extended rebound. Test of this hurdle can result in an initial pullback.”
“71.65, the 38.2% retracement of the bounce and 70.50 are immediate support levels.”
After forming a low near 9.86, EUR/SEK has rebounded. But economists at Société Générale expect the pair to resume its move downward if the 10.10 is not cleared.
Downward momentum is still prevalent
“Daily MACD still remains within negative territory which denotes downward momentum is prevalent.”
“Ongoing bounce is expected to find resistance near the channel limit of 10.07/10.10.”
“Failure to reclaim the 10.10 mark can result in persistence of the down move towards recent trough at 9.86 and 9.80, the 50% retracement from 2012. “
- WTI keeps falling as inflation woes dent appetite for riskier assets.
- WTI is weighed down by the prospects of the US SPR release.
- The US oil is still eyeing symmetrical triangle breakdown on the 1D chart.
WTI (NYMEX futures) is pressurizing multi-day lows, flirting with the $79 mark, as the persisting inflation concerns continue to sap investors’ confidence in higher-yielding assets such as oil.
The US oil also remains undermined by the increased calls for the US to release oil supplies from its Strategic Petroleum Reserves (SPR) to alienate the pressure off the tightening oil market.
At the time of writing, WTI is posting small losses to trade at $79.30, little affected by the comments from the UAE and Oman Energy Ministers, as investors await the virtual meeting between the US and Chinese Presidents for a fresh take on the market sentiment.
From a short-term technical perspective, WTI continues to challenge the bullish commitments at the rising trendline support on the daily chart at $79.27.
The price briefly dipped below the latter on Friday but managed to recapture in on a weekly closing basis.
If WTI closes below the latter on Monday, then it will confirm a downside breakout from a two-month-long symmetrical triangle formation.
A fresh downswing will kick in, thereafter, opening floors towards ascending 200-Daily Moving Average (DMA) at $68.82.
Before reaching the 200-DMA, WTI bulls will look to find some support at the 50-DMA at $77.50.
The next support at the mildly bullish 100-DMA at $73.62 will appear on a firm break below the 50-DMA.
The 14-day Relative Strength Index (RSI) points south below the 50.00 level, allowing room for more declines.
WTI: Daily chart
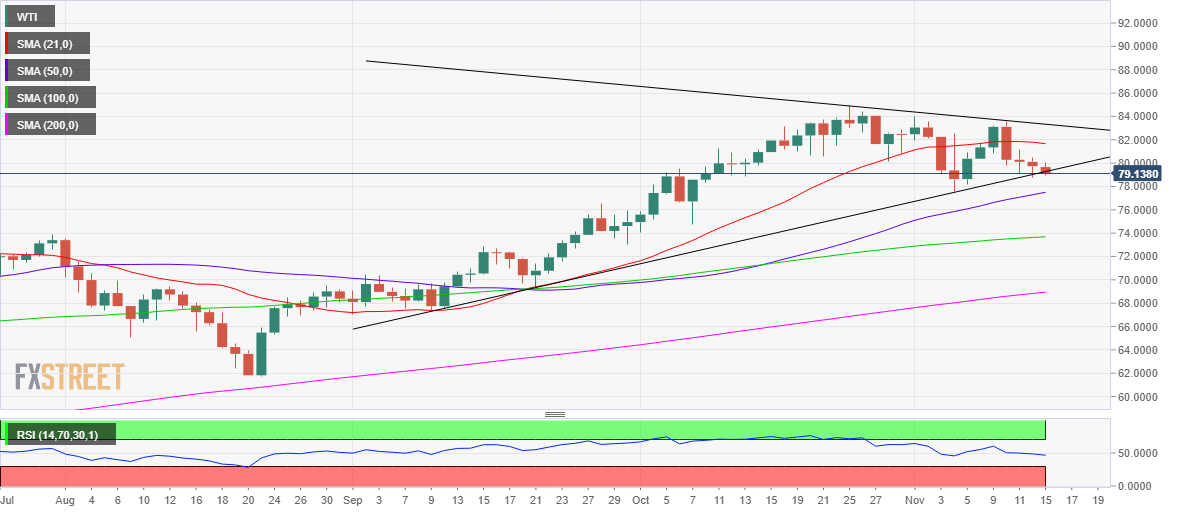
On the flip side, any recovery attempts could meet the initial supply at the $80 round figure, above which the horizontal 21-DMA at $81.65 would be tested.
The falling trendline resistance at $83.39 will act as a tough nut to crack for WTI bulls if the recovery momentum picks up pace.
Acceptance above the latter could yield a triangle breakout, which could reinforce the bullish interests.
WTI: Additional levels to watch
- EUR/USD looks side-lined around the 1.1440 region on Monday.
- German 10y Bund yields add to Friday’s decline near -0.28%.
- EMU Trade Balance figures, ECB Lagarde next in the calendar.
The single currency struggles for direction and motivates EUR/USD to navigate the 1.1440 region at the beginning of the week.
EUR/USD now focuses on Lagarde, dollar
The outlook for EUR/USD remains fragile to say the least, while it keeps trading close to the region of recent 2021 lows near 1.1430 (November 12) on Monday.
The uninterrupted buying interest around the greenback continues to keep the pair under intense pressure, always with the door open to the continuation of the decline for the time being. The neutral/bid stance in the buck comes despite lower yields on both sides of the Atlantic.
In the domestic calendar, September’s trade balance figures in the broader Euroland are due next ahead of the speech by Chairwoman C.Lagarde at the European Parliament. In the NA session, the only publication will be the NY Empire State Index and auctions of 3m and 6m bills.
What to look for around EUR
EUR/USD recorded new lows near 1.1430 on Friday, as the outlook for the pair continues to deteriorate. As usual, the pair’s price action is predicted to mainly track the dynamics around the dollar, while bouts of intermittent strength expected to come from the improvement in the risk complex. On the more macro view, the loss of momentum in the economic recovery in the region - as per some weakness observed in key fundamentals – coupled with rising cases of COVID-19 is also seen pouring cold water over investors’ optimism. Further out, the euro should remain under scrutiny amidst the implicit debate between investors’ speculations of a probable lift-off sooner than anticipated and the ECB’s so far steady hand, all amidst the tenacious elevated inflation in the bloc and inceasing conviction that it could last longer than previously anticipated.
Key events in the euro area this week: EMU Trade Balance, ECB Lagarde (Monday) – EMU Flash Q3 GDP, ECB Lagarde (Tuesday) – EMU Final CPI, ECB Lagarde (Wednesday) – ECB Lagarde (Friday).
EUR/USD levels to watch
So far, spot is up 0.03% at 1.1446 and faces the next up barrier at 1.1575 (20-day SMA) followed by 1.1609 (weekly high November 9) and finally 1.1616 (monthly high Nov.4). On the other hand, a break below 1.1432 (2021 low Nov.12) would target 1.1422 (monthly high Jun.10 2020) en route to 1.1300 (round level).
- A combination of factors assisted AUD/USD to gain traction for the second successive day.
- Friday’s dismal US consumer sentiment, sliding US bond yields undermined the greenback.
- Upbeat Chinese macro data lifted the aussie and remained supportive of the positive move.
The AUD/USD pair maintained its bid tone through the early European session and was last seen hovering near three-day highs, around mid-0.7300s.
The pair built on Friday's recovery move from the 0.7275 region, or over one-month lows and gained some follow-through traction on the first day of a new week. This marked the second successive day of a positive move and was sponsored by a combination of factors.
The University of Michigan survey released on Friday showed that the US consumer sentiment plunged to a 10-year low in November. This, along with sliding US Treasury bond yields, undermined the US dollar on Monday and provided a modest lift to the AUD/USD pair.
Apart from this, mostly upbeat Chinese macro data further acted as a tailwind for the Australian dollar and remained supportive of the move up. That said, the prospects for an early policy tightening by the Fed could cap any further gains for the AUD/USD pair.
Investors seem convinced that the Fed would be forced to adopt a more aggressive policy response to contain stubbornly high inflationary pressures. In fact, the Fed funds futures indicate a 50% probability of a rate hike in July 2022 and a high likelihood of another by November.
Even from a technical perspective, last week's sustained break and acceptance below 100-day SMA favours bearish traders. Hence, it will be prudent to wait for a strong follow-through selling before confirming that the AUD/USD pair has bottomed out and placing aggressive bullish bets.
Market participants now look forward to the US economic docket, featuring the release of the Empire State Manufacturing Index. Traders will also take cues from the US bond yields and the market risk sentiment, which could influence the USD and provide some impetus to the AUD/USD pair.
Technical levels to watch
- Brexit woes failed to assist GBP/USD to capitalize on its early modest uptick to multi-day highs.
- Modest USD weakness helped limit the downside as investors await Brexit-related developments.
The GBP/USD pair witnessed some selling during the early European session, albeit lacked follow-through and so far, has managed to hold above the 1.3400 mark.
The pair built on Friday's recovery move from the 1.3350 area, or YTD low and gained some traction during the early part of the trading activity on the first day of a new week. The uptick was sponsored by a further US dollar pull back from 16-month highs, triggered by data showing that the US consumer sentiment plunged to a 10-year low in November.
The greenback was further pressured by a fresh leg down in the US Treasury bond yields, though a combination of factors helped limit deeper losses. Investors seem convinced that the Fed would adopt a more aggressive policy response to contain stubbornly high inflation. This, along with the cautious mood, acted as a tailwind for the safe-haven USD.
On the other hand, the risk that the UK government could trigger Article 16 of the Northern Ireland Protocol held bulls from placing aggressive bets around the British pound. This was seen as another factor that failed to assist the GBP/USD pair to capitalize on its modest intraday uptick, rather prompted fresh selling around the 1.3440 region.
Meanwhile, the downside remains cushioned as investors await fresh developments surrounding the Brexit saga amid absent relevant macro data from the UK. Later during the early North American session, traders will take cues from the Empire State Manufacturing Index. This, along with the US bond yields, might influence the USD and provide some impetus to the GBP/USD pair.
Technical levels to watch
The United Arab Emirates (UAE) Energy Minister Suhail al-Mazrouei said on Monday that there is no risk of demand destruction with the current prices, per Energy Intelligence.
Market reaction
WTI is recovering some lost ground on the above comments, despite the renewed upside in the US dollar vs. its main peers.
At the time of writing, the US oil is down 0.60% on a daily basis, trading at $79.30.
The EUR has fallen to fresh year-to-date lows against the USD over the past week. Economists at MUFG Bank believe that risks remain skewed to the downside for the EUR in the near-term.
ECB to keep pushing back against earlier rate hike expectations
“The strengthening global recovery and higher inflation pressures are encouraging market participants’ to price in relatively more policy tightening outside of the eurozone. We believe there is scope for yield spreads to continue moving against the EUR.”
“We expect the ECB to maintain a similarly dovish view in December as they continue to push back against expectations for hikes from as early as next year.”
“Investor sentiment towards the EUR has been undermined by a growing list of concerns (the eurozone economy is expected to prove more sensitive both to the negative energy price shock and real estate driven slowdown in China, while COVID-19 cases have risen sharply again recently in a number of eurozone countries) that are also encouraging the build-up of EUR shorts.”
FX option expiries for November 15 NY cut at 10:00 Eastern Time, via DTCC, can be found below.
- EUR/USD: EUR amounts
- 1.1375 553m
- 1.1450 370m
- 1.1580 570m
- 1.1600 510m
- USD/JPY: USD amounts
- 113.95 439m
- 114.75 570m
- AUD/USD: AUD amounts
- 0.7280 317m
GBP/USD has hit the lowest levels in over ten months. Economists at Citibank expect the cable to dive towards the 1.30 level through the next months as the pound has failed to react to expectations of rate hikes from the Bank of England.
There is still a considerable risk that the UK could opt out to trigger Article 16
“We remain bearish cable as it fails to respond to the upside in increased MPC pricing and over the medium-term envisage a much weaker GBP, targeting <1.30 over the next three-six months.”
“The more immediate catalyst for a move in sterling may come from renewed Brexit tensions and the possibility of the UK triggering Article 16 at month-end. This would kick off 28 days of formal talks between the Uk and the EU, meaning any retaliation from the EU would more likely come via channels other than trade though if not resolved, would open up potential for the return of tariffs. This could trigger more volatility in the GBP.”
- USD/CAD edged lower for the second successive day amid modest USD weakness.
- Hawkish Fed expectations could limit the USD losses and lend support to the pair.
- Weaker crude oil prices undermined the loonie and further favours bullish traders.
The USD/CAD pair remained depressed through the early European session and was last seen trading near two-day lows, around the 1.2530-25 region.
The pair extended the previous session's retracement slide from five-week tops – levels just above the 1.2600 mark – and edged lower for the second successive day on Monday. A combination of factors dragged the US dollar further away from the 16-month highs touched on Friday, which, in turn, exerted some pressure on the USD/CAD pair.
The University of Michigan survey released on Friday showed that the US consumer sentiment plunged to a 10-year low in November amid worries about a faster rise in inflationary pressures. This, along with a fresh leg down in the US Treasury bond yields, kept the USD bulls on the defensive through the first half of the trading action on Monday.
However, firming expectations that the Fed would be forced to adopt a more aggressive policy response to contain stubbornly high inflation should help the USD to attract some dip-buying at lower levels. In fact, the Fed funds futures indicate a 50% probability of an interest rate hike in July 2022 and a high likelihood of another by November.
Meanwhile, increasing pressure on US President Joe Biden to release supplies from the Strategic Petroleum Reserve (SPR) weighed on crude oil prices. This could undermine demand for the commodity-linked loonie and further contribute to limiting any meaningful corrective pullback for the USD/CAD pair, at least for the time being.
Market participants now look forward to the US economic docket, featuring the only release of the Empire State Manufacturing Index. This, along with the US bond yields and the broader market risk sentiment, will drive the USD demand. Traders will also take cues from oil price dynamics to grab some short-term opportunities around the USD/CAD pair.
Technical levels to watch
GBP/USD trades in the positive territory above 1.3400 at the start of the week. In the view of FXStreet’s Eren Sengezer, the cable eyes technical rebound to 1.3500 while the EU and the UK are set to intensify Brexit talks.
GBP/USD looks to extend the technical correction
“There is still a considerable risk that the UK could opt out to trigger Article 16 in case sides fail to come to terms. The EU made it clear that they will retaliate in a proportionate way and even threatened to shelve the Brexit deal as a whole. That would be the nightmare scenario for the British pound. On the other hand, a positive outcome could open the door for a more decisive GBP/USD recovery.”
“n case buyers manage to lift the cable above 1.3440 and start using that level as support, the next target on the upside could be seen at 1.3500 (psychological level, 50-period SMA). Above that hurdle, strong static resistance seems to have formed at 1.3570.”
“Supports are located at 1.3400 (psychological level), 1.3360 (static level, 2021 lows) and 1.3300 (psychological level). The bearish pressure is likely to ramp up if investors start pricing the possibility of the UK triggering Article 16.”
- DXY starts the week on the negative footing near 95.00.
- US yields begin Monday’s session on the defensive along the curve.
- NY Empire State Index, short-term note Auctions next on tap.
The greenback corrects lower and revisits the 95.00 neighbourhood when gauged by the US Dollar Index (DXY) on Monday.
US Dollar Index looks to yields, data
The index loses further momentum and flirts with the 95.00 area at the beginning of the week amidst the weaker note in US yields, some profit taking mood and the generalized appetite for riskier assets.
Indeed, US yields add to the recent decline in both the front and the belly of the curve, while the long end reverse three consecutive sessions with losses.
Investors, in the meantime, continue to digest Friday’s disappointing prints from the advanced Consumer Sentiment for the current month tracked by the U-Mich Index and released on Friday, all coupled with some profit taking mood in light of sharp bounce in the buck, particularly in the wake of 3-decade-high inflation figures during October.
In the US data space, the regional manufacturing gauge measured by the NY Empire State Index will be the sole release later in the NA session seconded by a 3m/6m note auctions.
What to look for around USD
The index managed to hit new cycle highs in levels last seen back in the summer of 2020 near 95.30. The intense move higher in the buck remains well underpinned by the “higher-for-longer” narrative around current elevated inflation, which in turn lend wings to US yields and bolster speculations of a sooner-than-estimated move on interest rates by the Federal Reserve, probably at some point in H2 2022. Further support for the dollar comes in the form of the solid recovery in the labour market along with Biden’s infrastructure bill.
Key events in the US this week: NY Empire State Index (Monday) – Retail Sales, Industrial Production, Business Inventories, NAHB Index, TIC Flows (Tuesday) – Building Permits, Housing Starts (Wednesday) – Initial Claims, Philly Fed Index (Thursday).
Eminent issues on the back boiler: US-China trade conflict under the Biden’s administration. Debt ceiling issue. Geopolitical risks stemming from Afghanistan.
US Dollar Index relevant levels
Now, the index is losing 0.08% at 95.04 and a break above 95.26 (2021 high Nov.12) would open the door to 95.71 (monthly low Jun.10 2020) and then 97.80 (high Jun.30 2020). On the flip side, the next down barrier emerges at 93.87 (weekly low November 9) seconded by 93.62 (55-day SMA) and finally 93.27 (monthly low October 28).
XAU/USD is edging lower on Monday but staying afloat above $1,850. In the view of FXStreet’s Dhwani Mehta, a test of $1,900 remains on the cards.
A fresh upswing could be in the making
“Gold price remains on track for the further upside on a sustained break above the June 16 highs of $1,869. The next significant resistance is seen at the June 14 tops of $1,878, followed by the $1,900 psychological level.”
“On the downside, the $1,850 demand area will get tested initially, below which Friday’s low of $1,845 will be the next stop for gold sellers. The previous critical resistance now support at $1,834 will hold the key for gold bulls.”
EUR/USD has reached a four-month support line at 1.1420. The pair seems to have gone into a consolidation phase above 1.1450 on Monday but Karen Jones, Team Head FICC Technical Analysis Research at Commerzbank, expects EUR/USD to resume its fall towards the 1.1366 mark.
Negative bias below the 1.1650 five-month downtrend
“EUR/USD sold off last week and has reached a 4-month support line at 1.1420, it is possible that this will hold the initial test and prompt a tiny bounce higher. This will have no impact on the chart while below the 1.1650 five-month downtrend.”
“There remains scope for the previous downtrend (from 2008) which is now located at 1.1366 and should act as strong support, we look for this to hold the initial test.”
“Below 1.1366 would target 1.1290 then 1.10, the 61.8% and 78.6% retracement of the move seen in 2020.”
Considering preliminary readings from CME Group for natural gas futures markets, open interest reversed three daily builds in a row and went down by around 1.2K contracts on Friday. In the same line, volume dropped for the third consecutive session, this time by around 26.5K contracts.
Natural Gas met support near $4.70
Friday’s decline in prices of natural gas met decent support around $4.70 per MMBtu. The move lower in prices of the commodity was accompanied by shrinking open interest and volume, allowing for a rebound in the very near term.
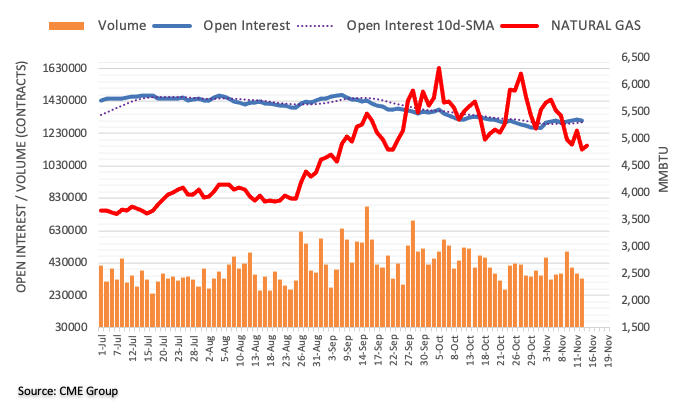
Japanese Industry Minister is back on the wires, via Reuters, noting that economic stimulus package will include a plan to urgently strengthen the chip industry as a national policy.
Additional quotes
"Considering steps to encourage the establishment of the large-scale production site for storage batteries."
"Will formulate a strategy for the storage battery industry, which holds key to green and digital technologies."
Gold rose more than 2% and closed its second straight week higher. In the view of FXStree’s Eren Sengezer, XAU/USD’s bullish outlook should stay intact if gold clears key resistance area at $1,865.
Focus on inflation and what it means for central banks’ policy outlook in the near-term
“On Tuesday, the US Census Bureau will publish the October Retail Sales data. A weaker-than-expected print could revive concerns over inflation impacting consumer activity negatively and provide a boost to gold. On the other hand, an upbeat reading could help risk flows return to markets and limit XAU/USD’s upside.”
“CPI data from the UK and the euro area are due out on Wednesday and Thursday, respectively. Even though the data from Europe don’t usually have a noticeable effect on gold’s market valuation, they could highlight the policy divergence and weigh on XAU/USD by lifting the dollar against other major currencies. In case the CPI figures reveal that price pressures are stronger than expected, gold could stay resilient vs the greenback.”
“On the downside, $1,830 (previous resistance, Fibonacci 38.2% retracement of April-June uptrend) aligns as key support. In case bulls continue to defend this area and don’t allow it to turn into resistance, XAU/USD is likely to regain its traction.”
“Below the level $1,830, $1,800 (psychological level) could be seen as the next support before $1,790 (100-day SMA, 200-day SMA).”
“Above $1,865 (Fibonacci 23.6% retracement), resistances are located at $1,880 (static level) and $1,900 (psychological level).”
- USD/JPY oscillated in a range through the Asian session on the first day of a new week.
- Friday’s dismal US data, sliding US bond yields weighed on the USD and capped gains.
- A combination of factors undermined the JPY and helped limit the downside for the pair.
The USD/JPY pair lacked any firm directional bias and seesawed between tepid gains/minor losses below the 114.00 mark through the Asian session.
A combination of diverging forces failed to provide any meaningful impetus to the USD/JPY pair, instead led to a subdued/range-bound price action on the first day of a new trading week. The US dollar remained on the defensive after data released on Friday showed that US consumer sentiment plunged to a 10-year low in November amid surging inflation. Apart from this, retreating US Treasury bond yields further undermined the greenback.
On the other hand, the cautious mood around the equity markets benefitted the safe-haven Japanese yen and acted as a headwind for the USD/JPY pair. That said, the disappointing GDP print from Japan kept a lid on any meaningful gains for the JPY and extended some support to the major. The Preliminary estimate showed that the economy contracted more than expected, by 0.8% in the three months through September and 3.0% on an annualized basis.
This marked the first downturn in two quarters as a COVID-19 state of emergency snapped consumer spending and boosted expectations for Prime Minister Fumio Kishida’s stimulus package. Apart from this, dovish comments by Bank of Japan (BoJ) Governor Haruhiko Kuroda held back traders from placing aggressive bearish bets around the USD/JPY pair. Kuroda noted that the BoJ won't abandon easy monetary policy even if Japan CPI hits 1% next year.
On the other hand, the markets have been pricing in the prospects for an early policy tightening by the Fed amid a faster-than-expected rise in inflationary pressure. In fact, the Fed funds futures indicate a 50% probability of a rate hike in July 2022 and a high likelihood of another by November. This should help limit the USD losses and also warrants some caution before placing any aggressive bearish bets around the USD/JPY pair.
Market participants now look forward to the US economic docket, featuring the only release of the Empire State Manufacturing Index. This, along with the US bond yields, will influence the USD price dynamics. Traders will further take cues from the broader market risk sentiment for some short-term opportunities around the USD/JPY pair.
Technical levels to watch
CME Group’s flash data for crude oil futures markets noted traders increased their open interest positions for the second consecutive session on Friday, now by 681 contracts. Volume, instead, went down for the third straight day, this time by around 108.6K contracts.
WTI faces the next support at $78.28
Prices of the WTI extended the corrective downside at the end of last week and approached the psychological $80.00 mark per barrel. The downtick was in tandem with rising open interest, which remains supportive of extra losses, at least in the very near term. Against that, the next area of contention emerges at November's low at $78.28 (November 4).
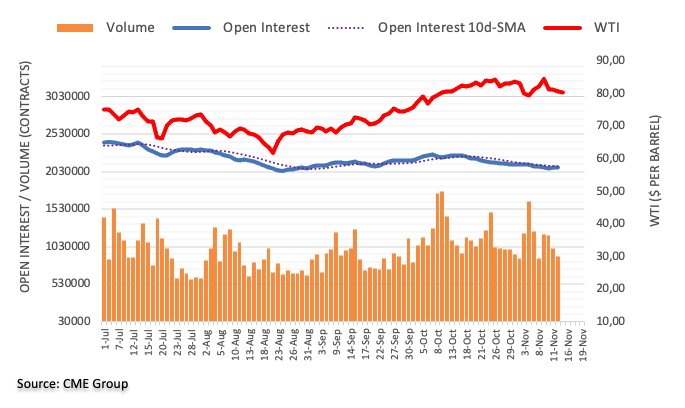
Oman’s Energy Minister Mohammed bin Hamad Al Rumhi said on Monday, OPEC and its allies (OPEC+) are not concerned about a likely release of oil supplies from the US Strategic Petroleum (SPR) release.
more to come ...
Open interest in gold futures markets increased for yet another session on Friday, this time by around 4.5K contracts. On the other hand, volume shrank for the second session in a row, this time by around 28.2K contracts.
Gold keeps targeting $1,900 and above
Prices of the yellow metal charted decent gains on Friday but the upside faltered once again ahead of the $1,870 level per ounce troy. The move was amidst rising open interest, leaving the door open for the continuation of the uptrend while the target remains unchanged at the 2021 peaks past $1,910 (June 1).
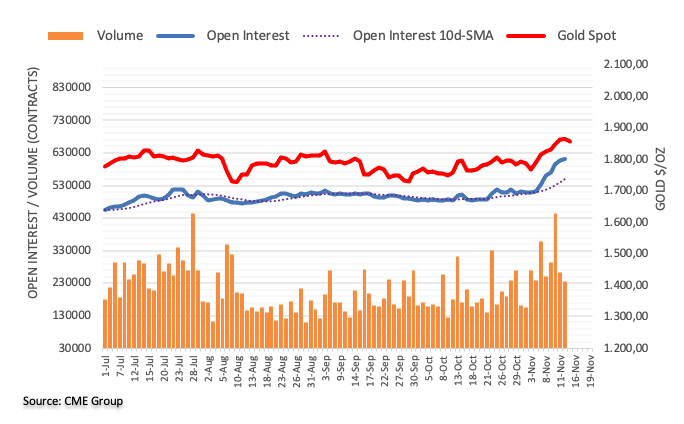
Here is what you need to know on Monday, November 15:
The dollar registered impressive gains against its rivals last week but seems to have opened on the back foot on Monday with the US Dollar Index retreating to 95.00 area. The cautiously optimistic market mood and falling US Treasury bond yields make it difficult for the greenback to find demand. Investors await the euro area Trade Balance report and the Federal Reserve Bank of New York's Empire State Manufacturing Survey.
The data from China revealed on Monday that Retail Sales expanded by 4.9% on a yearly basis in October, surpassing the market expectation of 3.5%. Additionally, Industrial Production grew by 3.5% in the same period, compared to analysts' estimate of 3%. Despite the upbeat data releases, the Shanghai Composite Index is trading flat on the day. The Nikkei 225 is up 0.5% and US stocks futures are posting modest gains in the early European session.
According to Xinhua News Agency, US-China Business Council urged the US to cut tariffs and said tariff costs compounded by inflation was posing a significant burden to the US economy. Later in the day, US President Joe Biden and Chinese President Xi Jinping will have a virtual meeting.
EUR/USD touched its lowest level since July 2020 at 1.1432 on Friday and seems to have gone into a consolidation phase above 1.1450 on Monday. In the absence of high-tier macroeconomic data releases, the pair's action could remain subdued for the remainder of the day.
GBP/USD trades in the positive territory above 1.3400 at the start of the week. The UK and the EU will engage in talks this week to try and resolve the issues surrounding Brexit's Northern Ireland protocol.
USD/JPY fluctuates in a relatively tight range around 114.00. Bank of Japan (BOJ) Governor Haruhiko Kuroda said earlier in the day that they won't wind down or abandon the easy monetary policy even if consumer inflation in Japan climbs to 1%. Meanwhile, the data from Japan showed that the Gross Domestic Product contracted by 0.8% on a quarterly basis in the third quarter.
Gold gained more than 2% last week with the precious metal finding demand as an inflation hedge. XAU/USD is edging lower on Monday but staying afloat above $1,850.
Cryptocurrencies: Bitcoin managed to register modest gains over the weekend and trades around $65,000 on Monday. Ethereum pushed lower in the previous couple of days but seems to have found support around $4,500. As of writing, ETH was up 1.7% on the day at $4,700.
- NZD/USD is trading higher on the back of better-than-expected Chinese economic data.
- Investors are eyeing the RBNZ rate hike, US stimulus chatter grows.
- The Kiwi is getting additional support from the retreat in the US dollar.
NZD/USD has recovered the previous week’s losses to trade around 0.7050 on Monday, as upbeat Chinese economic data surprise investors. At the time of writing, the pair is trading at 0.7050 up 0.04%, seesawing between a low of 0.7032 and a high of 0.7051.
Last week, the pair reversed its initial response to a stronger-than-expected increase in the US Consumer Price Index (CPI). The rising US dollar’s value pushed the Federal Reserve System to opt for higher interest rates sooner than initially expected.
Coming back to the present, the Kiwi is affected by better-than-expected Chinese economic data, which showed retail sales and industrial output rising 4.9% and 3.5% YoY, respectively, in October. In addition to this, a weaker US dollar, which is trading at 95.00, supports the pair.
With a light economic calendar on Monday, the kiwi traders will look for impetus from other places like the Reserve Bank of Australia (RBA) Governor Philip Lowe's speech on Tuesday. The US Import/Export data and Retail Sales MoM, also on Tuesday, remain in the docket to provide near-term direction. However, the Reserve Bank of New Zealand (RBNZ) interest rate decision remains key in the next week.
NZD/USD technical levels
One-month risk reversal (RR) of USD/CHF, a gauge of calls to puts, eases to +0.1000 for the week ended on November 12, per the latest data from Reuters. The daily figures are 0.0000 per source.
It’s worth noting that the weekly RR jumped to the highest since the latest September 2020 during the first week of November, before stepping back of late.
Hence, it appears that the options market bulls are easing controls amid the recently softer US dollar. The reason could be linked to mixed concerns over the Fed rate hikes and inflation, as well as US stimulus.
Also favoring the USD/CHF pullback is the cautious sentiment ahead of the Sino-American talks and Tuesday’s US Retail Sales for October.
Above all, the US Dollar Index (DXY) has already jumped to a 16-month high and the Fed is still in limbo over the rate lift, which in turn hints at further consolidation on the greenback gauge. On the contrary, the risks relating to the Fed’s next move remain elevated and hence underpin the Swiss Franc’s (CHF) safe-haven demand.
- USD/IDR retreats towards monthly low after two-day downtrend.
- Indonesia Trade Balance, Imports and Exports all flashed welcome numbers for October.
- DXY tracks softer US Treasury yields to step back from 16-month high.
USD/IDR reverses intraday gains, dropping back to $14,195 ahead of Monday’s Asian session. The Indonesia Rupiah (IDR) pair recently witnessed downside pressure following the firmer trade numbers from the Asian nation.
That said, Indonesia's Trade Balance jumped past $4.37B to $5.74B in October whereas the Imports and Exports also rose beyond the previous releases of 40.31% and 47.64% to 51.06% and 53.35% respectively.
Also positive for the IDR are the latest chatters over upbeat China data and Sino-American talks.
It’s worth noting that the softer US Treasury yields weigh on the US Dollar Index (DXY) by the press time, down 0.10% around 95.00. The reason could be linked to the mixed concerns over the Fed rate hike and US stimulus.
Looking forward, USD/IDR traders may remain cautious ahead of Thursday’s Bank Indonesia rate decision, expected to announce no change in the benchmark rates. However, Tuesday’s US Retail Sales may test the pair sellers.
Technical analysis
Until rising back beyond 200-DMA, near $14,350 by the press time, USD/IDR bears stay on the way to May’s low around $14,090.
Japanese Industry Minister said on Monday that “Japan and the US have agreed to start discussions to solve the issue over US "section 232" tariffs on steel and aluminium imports.”
“Japan and US agree to form Japan-US commercial and industrial partnership to reinforce industry competitiveness and supply chains,” he added.
A ministry official said: “Japan’s Trade Minister and US Commerce Secretary did not discuss any concrete measures to resolve the issue like that of EU-US agreement.”
Further, the official said that “Japan asked the US again for complete resolution of the issue of additional tariffs in a way that is consistent with WTO rules.”
USD/JPY unfazed
USD/JPY trades little changed at 113.83, as of writing, divided between downbeat Japanese growth numbers and broad US dollar weakness alongside the Treasury yields.
- AUD/USD grinds higher around intraday peak, up for the second day from monthly low.
- Two-week-old resistance line, 200-HMA guard further advances.
- Bears need 0.7300 breakdown to aim for September’s low.
AUD/USD remains sidelined near 0.7345, up 0.13% on a day ahead of Monday’s European session.
Even so, the Aussie pair stays above 100-HMA while keeping the previous day’s rebound from the monthly low.
Given the bullish MACD signals and the HMA break, AUD/USD buyers are hopeful to poke a downward sloping resistance line from November 02 near 0.7360.
Following that, the 200-HMA level of 0.7377 and the 0.7400 threshold will test the pair’s upside momentum before directing it to the November 08-09 peak of 0.7430.
Alternatively, pullback moves remain less worrisome until staying beyond the 0.7300 round figure. However, any further weakness past 0.7300 won’t hesitate to challenge September’s bottom near 0.7170.
During the fall, the latest trough surrounding 0.7275 may act as an intermediate halt.
AUD/USD: Hourly chart
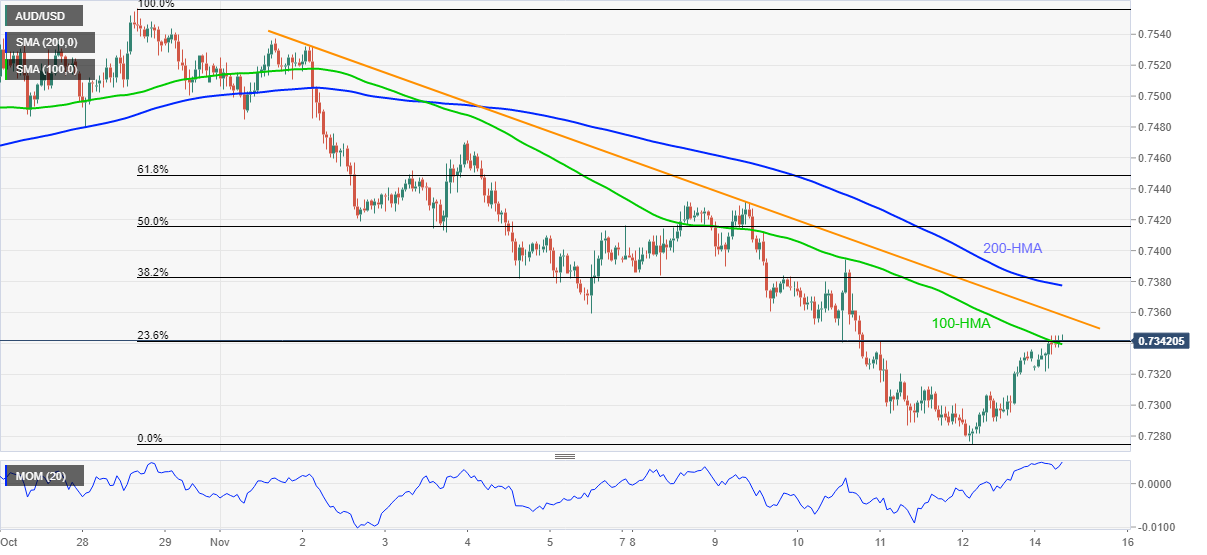
Trend: Further upside expected
- EUR/USD keeps Friday’s rebound from yearly low, retreats of late.
- Mixed chatters over Fed rate hike join hopes over US stimulus, phase 1 deal to favor buyers.
- ECB policymakers stay divided over inflation fears.
- DXY tracks US Treasury yields lower, equity traders seem divided.
EUR/USD grinds higher around 1.1560, up 0.10% intraday heading into Monday’s European session. The major currency pair dropped to a fresh 16-month low on Friday before bouncing off 1.1432. In doing so, the quote formed a Doji candlestick formation, underpinning the latest rebound amid mildly offered US Treasury yields and the US dollar.
The mixed concerns over the US stimulus and inflation, as well as the Fed rate hike following Friday’s surprisingly downbeat Michigan Consumer Sentiment data that slumped to a 10-year low, seem to underpin the cautiously optimistic market mood. On the same line were the latest comments from US Treasury Secretary Janet Yellen and Federal Reserve Bank of Minneapolis President Neel Kashkari, coupled with the hopes of the US-China phase 1 deal.
Even so, the Fed rate hike concerns remain elevated, ignoring the policymakers’ ‘transitory’ outlook for inflation, as inflation expectations and details of the consumer confidence data highlight the reflation fears.
It’s worth noting that the recently mixed comments from the European Central Bank’s (ECB) policymakers also underpin the EUR/USD rebound. On Friday, Governing Council member Gediminas Simkus said inflation will fall below target in 2023, adding that it is not in line with the forward guidance conditions. His fellow Official at the ECB Olli Rehn said on Friday that the relief on supply bottleneck may not arrive until toward the end of 2022, as reported by Reuters.
Amid these plays, the US 10-year Treasury yields drop 2.4 basis points (bps) to 1.56% whereas the S&P 500 Futures struggle for a clear direction amid a sluggish Asian session.
Looking forward, a light calendar and the upcoming US-China talks may keep EUR/USD moves confined ahead of Tuesday’s US Retail Sales, expected to keep 0.7% MoM growth.
Technical analysis
Friday’s Doji joins nearly oversold RSI conditions and multiple supports to the downside to keep EUR/USD buyers hopeful to challenge the support-turned-resistance line from October, near 1.1485. On the upside, the further downside will aim for the previous day’s low of 1.1432, a break of which will direct EUR/USD towards June 2020 top, surrounding 1.1422.
Bank of Japan (BOJ) Governor Haruhiko Kuroda crosses wires, via Reuters, during early Monday. The BOJ Boss promotes softer Japanese yen (JPY) while ruling out negative implications of the same on the economy.
Key quotes
Don't see current weak yen as particularly negative for Japan's economy.
Important for forex to move stably reflecting economic fundamentals.
Yen fall pushes up raw material import costs, but boosts value of exports, profits of Japan firms' overseas subsidiaries.
Must look comprehensively at pros, cons of weak yen on japan's economy.
It's true prices of gasoline, some food goods rising but it's not leading to sharp rise in consumer inflation or severely hurting economy.
No decision made yet on fate of boj's pandemic-relief loan scheme after current march deadline.
Will decide on fate of pandemic-relief loan scheme by scrutinising pandemic developments, corporate funding situation.
Even if japan's consumer inflation reaches 1% next year, that won't lead to the boj winding down or abandoning easy monetary policy.
USD/JPY remains indecisive
Following the comments, USD/JPY struggles for a clear direction, recently easing to 113.85 ahead of Monday’s European session.
Read: BOJ’s Kuroda: Don't see China’s property sector woes to trigger huge global shock
- GBP/USD trades at 1.3429 during Asian hours on Monday, supporting last week's gains.
- Investors are eyeing BoE's Haskel Speech and September's ILO Unemployment Rate.
- An increase in unemployment numbers is a sign of a worsening economic situation, which will push the BoE to loosen its monetary policy.
The GBP/USD pair is trading around 1.3430 level during Asian hours on Monday, supporting last week's gains, as the investors look for signs of a Bank of England (BOE) rate hike.
The currency pair hit its yearly lows at 1.3358 on Thursday before rebounding on the last day of the week.
The pair finds some support from the comments by the European Commission's Maros Sefcovic. He said that there had been a welcome change in British Brexit minister David Frost's tone in talks over post-Brexit trade with Northern Ireland.
In addition to this, concerns over stability in Northern Ireland, with London threatening to implement Article 16—a move that would suspend parts of the deal that have prevented a hard border Ireland's island, could undermine cable's recovery attempts.
The US dollar index, which tracks the greenback against a basket of currency, holds its ground above 95.00. The US Treasury yields are also solidifying after last week's price action at 1.57%. The US Michigan Consumer Index came in at a 10-year low, which is in line with inflation and rate hike expectation. This has bolstered the greenback to its current position, the highest rise in seven weeks.
The cable eyes for Bank of England (BoE) Jonathan Haskel's speech, which is due on Monday. But Tuesday's UK Claimant Count Change, October, Britain's ILO Unemployment Rate and Earnings data will further provide impetus. Trades will also keep a close eye on the Fedspeak in the week ahead.
GBP/USD technical levels
Editor-in-Chief Hu Xijin of Chinese highly influential media outlet, Global Times, said on Saturday, via Twitter, 'if Australian troops come to fight in the Taiwan Straits, it is unimaginable that China won't carry out a heavy attack on them and the Australian military facilities that support them.”
“So Australia (had) better be prepared to sacrifice for Taiwan island and the US,” he added.
This comes in response to the Financial Times (FT) article, citing that Australia is ready to help the US defend Taiwan from Chinese attacks.
Market reaction
AUD/USD is unperturbed by these Chinese threatening messages, keeping its range near-daily highs of 0.7346, up 0.13% on the day.
Meanwhile, the S&P 500 futures trade almost unchanged on the day. All eyes remain on the Biden-Xi virtual meeting due later this Monday.
- Asian equities trade mixed, mostly positive amid upbeat signals from China.
- Phase 1 talks aim to defuse tension between the US and Beijing.
- China Retail Sales, Industrial Production beat forecasts in October.
- BOJ’s Kuroda sounds hopeful over inflation pick-up despite downbeat Japan GDP.
Asian share edge higher amid softer US Treasury yields and hopes of an economic rebound in China during early Monday. Even so, fears of a Fed rate hike and inflation concern test bulls heading into the European session.
That said, MSCI’s index of Asia-Pacific shares outside Japan rises 0.30% whereas Japan’s Nikkei 225 prints 0.35% intraday gains by the press time.
Japan’s preliminary Q3 GDP shrank below -0.2% market forecast and +0.5% to -0.8% QoQ. Even so, Bank of Japan (BOJ) Governor Haruhiko Kuroda remains hopeful. “Bank of Japan Governor Haruhiko Kuroda expects consumer inflation to accelerate to around 1% in the first half of next year as the economy recovers to pre-coronavirus levels, voicing hope for a consumption-driven recovery,” said Reuters.
On a different page, China Retail Sales rose past 3.5% market forecast and 4.4% prior to 4.9% YoY whereas Industrial Production (IP) jumped to 3.5% versus 3.0% expected and 3.1% prior release. Additionally, the People’s Bank of China (PBOC) injected CNY1 trillion via one-year medium-term lending (MLF). Even so, stocks in China and Hong Kong remain mildly offered amid cautious mood ahead of the Sino-American phase 1 talks.
Also challenging the bulls are the mixed concerns over the US inflation and Fed rate hike following Friday’s Michigan Consumer Sentiment Index that dropped to a 10-year low.
It should be noted that the pressure on the unlocks and hopes of no major rate hikes respectively helps the markets in New Zealand and Australia despite sluggish moves in China. On the same line were Indian equities that cheers softer US Treasury yields and mildly bid stock futures.
Elsewhere, stocks in Indonesia couldn’t ignore losses in China, down 0.45% at the latest, whereas South Korea’s KOSPI cheers upbeat prints of Import-Export Price Growth.
Looking forward, chatters surrounding China's growth and Sino-American talks may entertain short-term traders ahead of Tuesday’s US Retail Sales.
- USD/INR fades Friday’s rebound below bullish chart formation on 4H.
- Momentum line tests pair buyers, 200-SMA adds to the upside filters.
- Bears await 74.25 breakdown, H&S confirmation will poke 75.38 hurdle.
USD/INR treads water around 74.35 during early Monday, struggling to extend Friday’s rebound.
Even so, a bullish chart pattern named the inverse head-and-shoulders keeps the Indian rupee (INR) sellers hopeful.
It’s worth noting that the Momentum line tests the pair buyers while a convergence of the 200-SMA and a 50% Fibonacci retracement (Fibo.) of October-November downside, around 74.75, adds to the upside filters above the formation’s neckline of 74.58.
In a case where the USD/INR bulls dominate past 74.75, a horizontal area comprising levels marked since October 11 challenges the advances near 75.35 ahead of the previous month’s top around 75.65.
Meanwhile, a downside break of 74.25 will defy the head-and-shoulders (H&S) chart pattern and could direct the quote towards the 74.00 threshold.
Should the pair drop further below the 74.00 round figure, the monthly low of 73.85 will be in focus.
To sum up, USD/INR bulls are bracing for further upside but there prevails a bumpy road to watch.
USD/INR: Four-hour chart
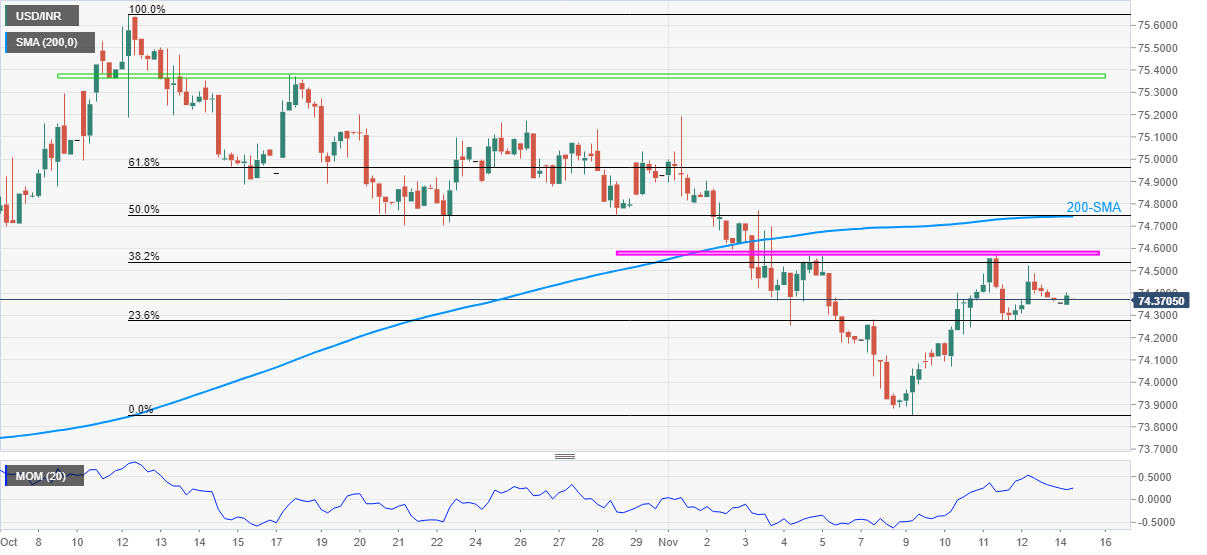
Trend: Further upside expected
- Gold snaps seven-day uptrend while easing from five-month high, pressured around intraday low of late.
- Market sentiment dwindles amid mixed concerns over US inflation, stimulus.
- China data, PBOC moves favor risk-on mood, US Retail Sales, Sino-American talks eyed.
- Gold Weekly Forecast: XAU/USD capitalizes on inflation fears, buyers look to retain control
Gold (XAU/USD) licks wounds near $1,860 during the first negative day in eight amid early Monday. In doing so, the yellow metal eases from the highest levels since June while stepping back from the yearly resistance line. That said, the pullback moves fail to cheer softer US Treasury yields, as well as the US dollar, amid mixed sentiment.
The US Dollar Index (DXY) drops 0.11% intraday while extending Friday’s pullback from the highest levels since July 2020. Helping the greenback bears are the US 10-year Treasury yields that consolidate the previous week’s rebound, down three basis points (bps) to 1.55% at the latest. On the same line is the mildly positive market sentiment that reduces gold’s safe-haven demand.
Behind the market’s moves are the mixed concerns over the US stimulus and inflation, as well as the Fed rate hike following Friday’s surprisingly downbeat Michigan Consumer Sentiment data that slumped to a 10-year low. Additionally, the recent comments from US Treasury Secretary Janet Yellen and Federal Reserve Bank of Minneapolis President Neel Kashkari, coupled with the hopes of the US-China phase 1 deal, also favor the mood.
While US Treasury Secretary Yellen defied chatters that the incoming stimulus will fuel more inflation, Fed’s Kashkari reiterate that the inflation run-up is ‘transitory’. Further, the Financial Times (FT) cited familiar sources to say, “US President Joe Biden and China’s President Xi Jinping will discuss ways to prevent tensions from spiraling into conflict, in the face of rising concern about Taiwan and Beijing’s nuclear arsenal.”
Looking forward, US Retail Sales for October, expected to keep 0.7% MoM growth on Tuesday, will be the key catalysts to watch for near-term direction. Also important will be the US-China talks and the US aid package progress. Should the reflation fears recede, as they are now, gold may witness the much-awaited pullback.
Technical analysis
Gold managed to cross an important descending trend line resistance from August 2020 and a four-month-old horizontal hurdle during the biggest weekly run-up since May. However, overbought RSI conditions probe the bulls around a downward sloping trend line from January near $1,870.
Adding to the upside filters are the tops marked during late January 2021 around $1,875-76, a break of which could propel the quote towards breaking the $1,900 threshold, as well as target June’s high close to $1,917.
Meanwhile, pullback moves may aim for a $1,834 re-test but remain less challenging until marking a daily close below the broad resistance line, now support around $1,827.
If at all the gold bears manage to conquer the $1,827 resistance-turned-support, a confluence of the 100-DMA and 200-DMA, surrounding $1,790, will be in focus.
Gold: Daily chart
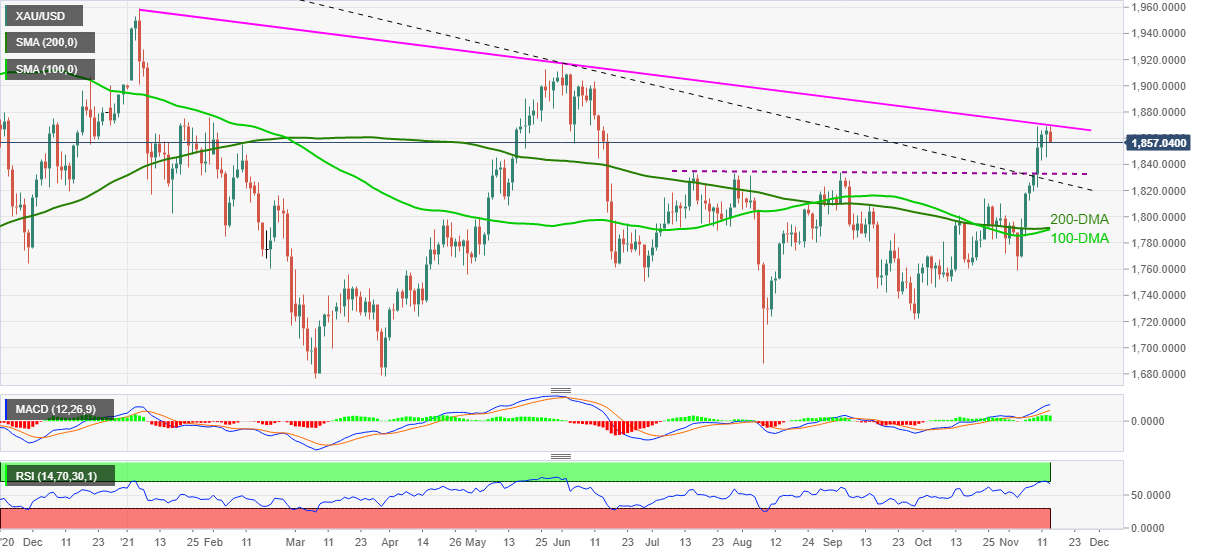
Trend: Further weakness expected
Ahead of Monday’s virtual meeting between US President Joe Biden and China’s leader Xi Jinping, the US-China Business Council, wrote Friday to US Trade Representative Katherine Tai and Treasury Secretary Janet Yellen, urging them to reduce tariffs on Chinese goods to provide relief to Americans amid rising inflation pressures, per Xinhua News Agency.
The US business groups said: "Tariffs put in place over the last several years continue to disproportionately cause economic harm to U.S. businesses, farmers, workers and families.”
Key takeaways from the letter
“American importers have paid over 110 billion US dollars for the so-called "Section 301" tariffs on Chinese goods, of which about 40 billion dollars has been assessed during the Biden Administration.”
"These costs, compounded by other inflationary pressures, impose a significant burden on American businesses, farmers and families trying to recover from the effects of the pandemic.”
Read: US Pres. Biden and China’s Pres. Xi to tackle Taiwan and nuclear build-up – Financial Times
Analysts at Societe Generale offer their technical outlook on gold price, with the upside opening up towards $1,980 if the $1,875 barrier is surpassed.
Key quotes
“Gold price is marching towards a multi-month descending trend line near $1,875.”
“A break above $1,875 would denote an extended rebound towards projections of $1,930 and graphical levels of $1,965/$1,980.”
“Daily MACD has entered positive territory which denotes upside momentum is regaining.”
“Upper band of the base near $1,835 and $1,810 are short-term support levels.”
Economists at Morgan Stanley believe that the US Federal Reserve (Fed) is unlikely to go for an interest rate hike any time before 2023.
Key quotes
“US central bank will end its asset purchases by the middle of next year, but won’t raise its benchmark rate from near zero until early 2023.”
“Expect inflation to moderate and participation in the labor market to show a sustained rise.”
“Expect the world’s largest economy to grow 4.6% next year, led by consumer spending and capital investment.”
Contradicting his economists, Morgan Stanley CEO James Gorman said, “money is a bit too free and available right now,” adding that Fed should “start moving” in the first quarter of 2022.
- The risk barometer trades firmer amid an upbeat market mood.
- AUD/JPY seems to care less as Japan's Q3 GDP surfaces.
- Investors look ahead to gather impetus from RBA Governor Lowe's speech and RBA minutes.
AUD/JPY is trading around 83.50 during the Asian session on Monday, as the gross domestic product (GDP) data of Japan's July-September quarter disappoints. Further, upbeat Chinese Retail Sales and Industrial Production data underpin the sentiment around the aussie.
Last week currency markets were choppy, with the US dollar marginally softer and AUD crosses firming. A stable risk appetite is expected to support the AUD/JPY in the near term.
Japan's Q3 GDP contracted 3.0% annually and the quarterly figure dropped by 0.8%, worse than economists' estimate of a 0.2% contraction. The data added that private consumption, which makes up more than half of the economy, fell 1.1%, versus a 0.5% decline expected by economists.
Putting this aside, Japan's wholesale inflation is at a four-decade high but Bank of Japan (BoJ) policymakers opined that inflationary pressures arising from higher energy prices are moderate. Iterated monetary policy easing should be upheld.
The US market is giving out mixed signals of late; besides China Retail Sales and Industrial Production data Joe Biden and Xi Jinping, virtual summit on Monday will be watched by the pair's investor. The meet is intended to halt or slow down the downward spiral in US-Chinese relations.
Long-end Treasury yields ended marginally higher in a relatively subdued session. For local rates markets, the focus this week will be on Reserve Bank of Australia (RBA) Governor Philip Lowe speech Tuesday and the Q3 wages data later in the week.
Looking ahead, the RBA thinks the cash rate may stay where it is until 2024, while the market is assessing a rate hike move as early as mid-2022. RBA Governor Lowe is expected to iterate the recent trends in inflation and also emphasize how Australia's inflation experience differs from that of other countries. But as per experts, the market is likely to largely ignore what he has to say until the Q3 Wage Price Index comes out on Wednesday.
This week, the risk-sensitive pair will find impetus from multiple factors, starting from Australia's Home Sales MoM, October and RBA Assistant Governor Luci Ellis's speech.
AUD/JPY technical levels
As per the daily chart, AUD/JPY faces resistance at 21-day Simple Moving Average (SMA), 84.67. The next barrier to the upside is 86.26, it's a monthly high. The other resistance up north will be the phycological level 87.00.
The price may reverse to continue downward, where it can meet 200-day SMA, 82.89 for support. The following support 82.63 can be tested, it's a 50-day SMA. Further south, 100-day SMA, 81.89, is the last support.
AUD/JPY additional levels
Ahead of a virtual meeting between US President Joe Biden and China’s President Xi Jinping on Monday, the Financial Times (FT) reported, citing people familiar with the matter, both leaders will discuss ways to prevent tensions from spiralling into conflict, in the face of rising concern about Taiwan and Beijing’s nuclear arsenal.
Key takeaways
“The two leaders have held two calls this year.”
“Both sides were lowering expectations about outcomes from the discussion, which is not being billed as a “summit”.”
“Biden is also expected to raise the issue of nuclear weapons, after the Pentagon warned that China would quadruple its nuclear warhead arsenal this decade.”
Related reads
- China’s Retail Sales unexpectedly rise 4.9% YoY vs. 3.5% expected, AUD/USD tests highs
- USD/CNH stays depressed below $6.38 on firmer China statistics, PBOC moves
- USD/CNH prints three-day downtrend near monthly low, recently off intraday low.
- China Retail Sales, Industrial Production improved, House Price Index eases in October,
- PBOC injects CNY 1.0 trillion via MLF, NBS sounds optimistic on economic recovery.
- Inflation, Evergrande and Fed rate hike are the key catalysts to watch ahead of Tuesday’s US Retail Sales.
USD/CNH remains on the back foot around $6.3770, down for the fourth consecutive day on early Monday. The reason could be linked to upbeat China data and monetary injection from the People’s Bank of China (PBOC).
China Retail Sales rose past 3.5% market forecast and 4.4% prior to 4.9% YoY whereas Industrial Production (IP) jumped to 3.5% versus 3.0% expected and 3.1% prior release. Alternatively, China’s House Price Index for October eased from 3.8% to 3.4% YoY.
Also read: China’s NBS: Economy maintained steady recovery in October
Moving on, the PBOC injected CNY1 trillion via one-year medium-term lending (MLF) as the week starts. The Chinese central bank has been in an active mode ever since the Evergrande saga started. Also pushing the PBOC towards more action is the recent fears of a slowdown in the world’s second-largest economy due to the credit and energy crisis at home.
On the other hand, the US Dollar Index (DXY) extends pullback from a 16-month high amid mildly bid market sentiment and softer Treasury yields. That said, the US 10-year Treasury yields remain depressed around 1.558%, down 2.6 basis points (bps) whereas the S&P 500 Futures print 0.12% intraday gains at the latest.
The softer US Treasury yields and the mildly positive risk appetite could be linked to the receding inflation fears, following Friday’s 10-year low US Michigan Consumer Sentiment as well as talks over US stimulus.
Given the recently positive catalysts from China, as well as risk-on mood, USD/CNH may witness further downside ahead of Tuesday’s US Retail Sales. Should the consumer-centric data renew inflation fears and propel the Fed rate hike concerns, USD/CNH bears will be challenged.
Technical analysis
Failures to cross the $6.4100 hurdle, comprising highs marked during early June and late October, keeps USD/CNH bears hopeful of revisiting the yearly bottom around $6.3525. However, a daily closing below a 5.5-month-old support line, around $6.3710 by the press time, becomes necessary.
| Raw materials | Closed | Change, % |
|---|---|---|
| Brent | 82.31 | -0.54 |
| Silver | 25.257 | 0.14 |
| Gold | 1865.007 | 0.18 |
| Palladium | 2101.36 | 2.12 |
Further comments flowing in from the Bank of Japan (BOJ) Governor Haruhiko Kuroda, as he continues to speak on the economic growth and Chinese property sector woes.
Key quotes
Today's weak GDP likely due to consumption slump in Sept when spike in infections hit eating-out, travel.
Japan's economy likely to gradually recover in Oct-Dec quarter.
Rising commodity prices reflect strong global demand, which is positive for Japan’s economy overall.
Rising commodity prices affecting sectors, companies in varying ways, watching impact on economy carefully.
Corporate fund demand gradually subsiding as economy reopens, but uncertainty remains on pandemic outlook.
Japan financial institutions' exposure to China’s Evergrande is very small.
Don't expect China’s property sector woes to have huge impact on Japan’s economy, banks.
Don't see China’s property sector woes to trigger huge global shock.
China's economy likely won't see growth return to around 7%, requiring Japan firms to revise some of their views on China’s outlook.
- GBP/JPY bulls attempting to beak higher and ride the dynamic support.
- Bears will seek a break o the 152.50s that open risk to 151.00.
The price is attempting to break the resistance near 153.30 and then 153.80 which guards the space to the next layer of resistance near 154.70. A break there opens risk to a full-on break out to the top side.
GBP/JPY daily charts
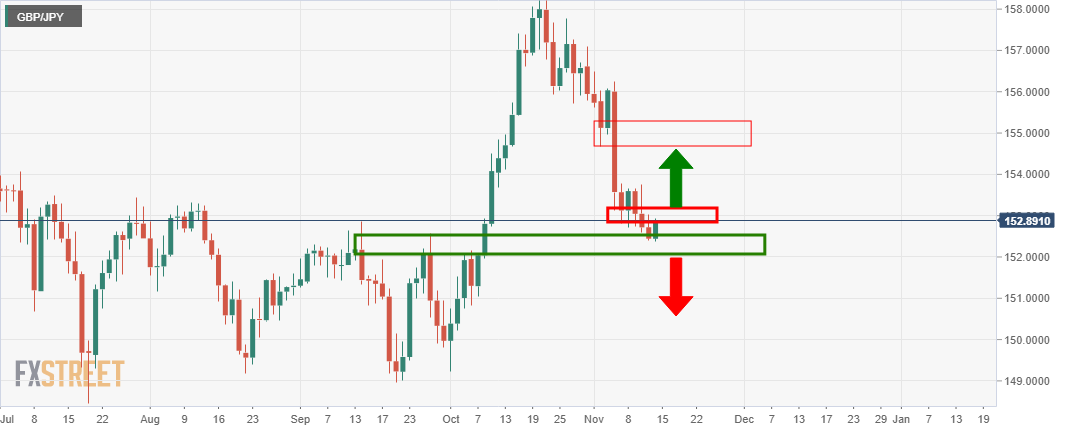
However, for the time being, it should be noted that any failures to break these key resistance in the forthcoming days are going to put pressure on the downside. This will expose dynamic trendline support as follows:
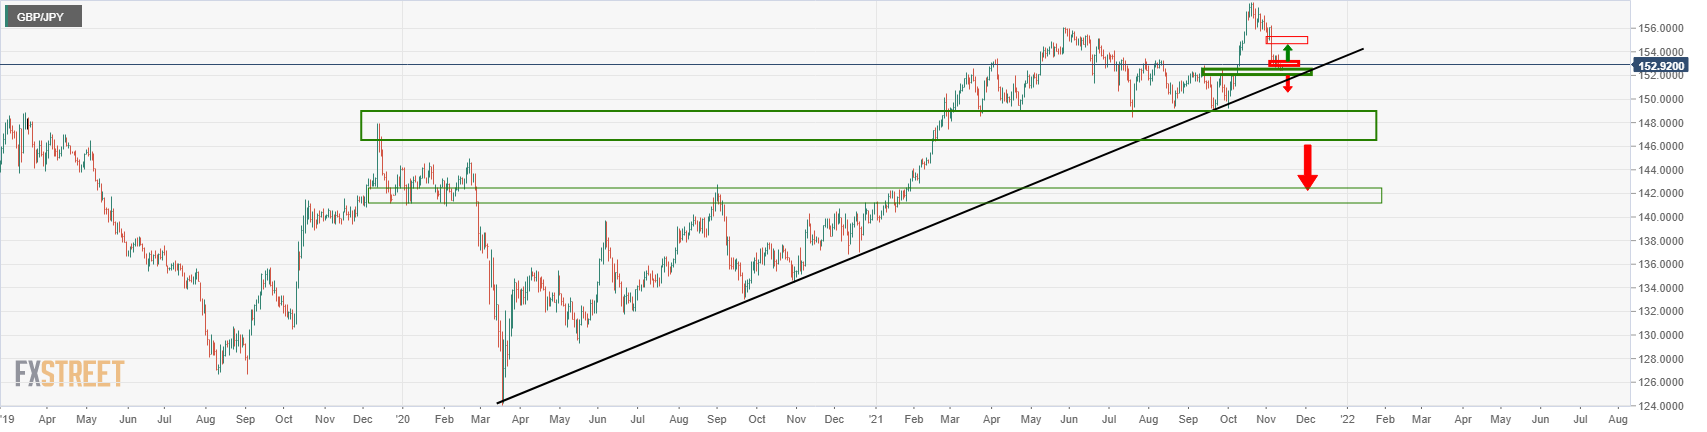
A break of the 152.50s runs the risk of a run to the 151 figures last defence for the 148.00 areas.
Following the release of the October activity numbers, China’s National Bureau of Statistics (NBS) released a statement, via Reuters, expressing their take on the economy.
China's economy maintained steady recovery in October.
Still need to step up efforts to stabilise economic recovery.
- AUD/USD: Bulls keep reins around 0.7350 on upbeat China data
- AUD/USD stretches Friday’s recovery moves from a five-week low.
- China Retail Sales, Industrial Production both crossed market forecast, prior during October.
- Market sentiment remains mildly bid amid stimulus hopes, receding inflation fears.
- Recently mixed Aussie data highlight Tuesday’s RBA as the key event.
AUD/USD takes the bids to refresh intraday top near 0.7345, up 0.12% on a day, following the firmer China data during early Monday. In doing so, the Aussie pair not only cheers firmer data from Australia’s largest customer but also benefits from mildly positive market sentiment.
China Retail Sales rose past 3.5% market forecast and 4.4% prior to 4.9% YoY whereas Industrial Production (IP) jumped to 3.5% versus 3.0% expected and 3.1% prior release. Alternatively, China’s House Price Index for October eased from 3.8% to 3.4% YoY.
Read: China’s Retail Sales unexpectedly rise 4.9% YoY vs. 3.5% expected, AUD/USD tests highs
Earlier in the day, the People’s Bank of China (PBOC) injected CNY1 trillion via one-year medium-term lending (MLF). As China is the largest customer of Australia, any positive from the dragon nation favors AUD/USD prices, which in turn could be witnessed by the pair’s latest moves.
Elsewhere, a 10-year low of the US Michigan Consumer Sentiment Index tested Fed rate hike talks on Friday. On the same line were the recent comments from US Treasury Secretary Janet Yellen and Federal Reserve Bank of Minneapolis President Neel Kashkari. While US Treasury Secretary Yellen defied chatters that the incoming stimulus will fuel more inflation, Fed’s Kashkari reiterate that the inflation run-up is ‘transitory’.
Against this backdrop, the US 10-year Treasury yields remain depressed around 1.558%, down 2.6 basis points (bps) whereas the S&P 500 Futures print 0.12% intraday gains at the latest.
Moving on, the recently improved risk appetite joins mixed data from Australia and China’s efforts to stay firmer to help the AUD/USD buyers. It should, however, be noted that the recent unlocks in Australia can push the Reserve Bank of Australia (RBA) to keep rate hike on the table during Tuesday’s monetary policy meeting, which in turn becomes the key for the pair traders to watch.
Technical analysis
AUD/USD keeps Friday’s bounce off the 61.8% Fibonacci retracement (Fibo.) of August-October uptrend amid an uptick in RSI, suggesting further advances. However, the MACD signals remain favorable to the bears and hence highlight the two-week-old descending trend line, around 0.7355, followed by the 100-DMA level of 0.7367, as crucial upside barriers. On the flip side, AUD/USD sellers will wait for a clear downside break of the stated Fibo. level near 0.7275 for fresh entries while the 0.7300 threshold may entertain short-term bears.
China’s October Retail Sales YoY, arrived at 4.9% vs. 3.5% expected and 4.4% previous while Industrial Output YoY came in at 3.5% and 3.0% exp and 3.1% prior.
Meanwhile, the Fixed Asset Investment YoY stood at 6.1% vs 6.2% expected and 7.3% last.
Additional details
China Jan-Oct private-sector fixed-asset investment +8.5% YoY.
China Jan-Oct infrastructure investment +1.0% YoY.
Market reaction
The Australian dollar cheers the positive surprise on the Chinese data, with the AUD/USD pair testing daily highs of 0.7344, at the time of writing. The spot is up 0.14% on the day.
The People’s Bank of China (PBOC) injected a whopping CNY1 trillion via one-year medium-term lending (MLF) facility on Monday.
The Chinese central bank kept the rate for one-year MLF operation rate unchanged at 2.95%.
Market reaction
USD/CNY is almost unchanged on the latest PBOC operation. The spot trades at 6.3797, consolidating near five-month lows.
Meanwhile, the AUD/USD pair eases to 0.7334, as of writing, having faced rejection at 0.7350.
- WTI remains pressured near one-week low, down for four consecutive day.
- US Senate Majority Leader Schumer urges for fuel sales from SPR.
- Belarus-EU tussles, stimulus hopes fail to entertain buyers amid sluggish markets.
- Risk catalysts, China data dump eyed for fresh impulse.
WTI takes offers to refresh intraday low around $79.20, down 0.65% on a day during early Monday. In doing so, the black gold tests the lowest levels in one week during the four-day downtrend.
Behind the moves could be the fears of the US sale of fuel from the Strategic Petroleum Reserve (SPR) as well as sluggish market sentiment. In doing so, the commodity prices ignore geopolitical tension between Eurozone and Belarus.
During the weekend, US Senate Majority Leader Chuck Schumer urged President Joe Biden administration to approve fuel sales from the nation's SPR. The talks have been loud in the last few days and may recall the sellers if approved. Though, the OPEC+ refrain to entertain easy output should challenge the oil bears.
On the other hand, the European Union’s (EU) border with Belarus recently witnessed some geopolitical tension due to migrants. “Russian President Vladimir Putin said that Russia was ready to help resolve a migrant crisis on the border between Belarus and Poland, RIA news agency reported on Sunday citing an interview on a state TV channel,” per Reuters.
It’s worth noting that uncertainty over the US stimulus and doubts on the Fed’s next move adds to the inflation fears to weigh on the WTI prices off late.
Amid these plays, US 10-year Treasury yields remain depressed around 1.558%, down 2.6 basis points (bps) whereas the S&P 500 Futures print 0.12% intraday gains at the latest.
Moving on, China Retail Sales and Industrial Production for October will join the risk catalysts and inflation fears to direct short-term WTI moves. Overall, the commodity prices may witness further weakness amid challenges to the demand-supply matrix.
Technical analysis
A six-week-old support line near $79.00 restricts short-term WTI moves, a break of which will challenge monthly low near $77.60. Alternatively, the $80.00 threshold and 20-DMA near $81.70 restrict short-term recovery.
| Time | Country | Event | Period | Previous value | Forecast |
|---|---|---|---|---|---|
| 02:00 (GMT) | China | Retail Sales y/y | October | 4.4% | 3.5% |
| 02:00 (GMT) | China | Industrial Production y/y | October | 3.1% | 3% |
| 02:00 (GMT) | China | Fixed Asset Investment | October | 7.3% | 6.2% |
| 04:30 (GMT) | Japan | Industrial Production (YoY) | September | 8.8% | |
| 04:30 (GMT) | Japan | Industrial Production (MoM) | September | -3.6% | -5.4% |
| 10:00 (GMT) | Eurozone | Trade balance unadjusted | September | 4.8 | 6.5 |
| 10:00 (GMT) | Eurozone | ECB President Lagarde Speaks | |||
| 13:30 (GMT) | Canada | Wholesale Sales, m/m | September | 0.3% | 1.1% |
| 13:30 (GMT) | Canada | Manufacturing Shipments (MoM) | September | 0.5% | -3% |
| 13:30 (GMT) | U.S. | NY Fed Empire State manufacturing index | November | 19.8 | 21.6 |
- Silver takes offers to snap three-day uptrend around the highest level since August.
- Bearish candlestick formation, overbought RSI and failures to cross 200-DMA favor sellers.
- Highs marked in September, October can entertain short-term sellers.
Silver (XAG/USD) refreshes intraday low to $25.10, down 0.11% on a day during early Monday.
The white metal renewed a three-month high the previous day but failed to cross the 200-DMA hurdle. In doing so, the quote posted a bearish candlestick formation, namely Hanging Man, amid overbought RSI conditions.
Hence, intraday sellers are in full swing to aim for the $25.00 threshold but tops marked during September and October, around $24.85-80, will challenge the silver bears afterward.
Adding to the downside filters is the 61.8% Fibonacci retracement of July-September fall, near $24.70.
Alternatively, a daily closing beyond the 200-DMA level of $25.36 will aim for August month’s high of $26.00.
Should the XAG/USD bulls keep reins past $26.00, July’s peak around $26.80 will be in focus.
Silver: Daily chart
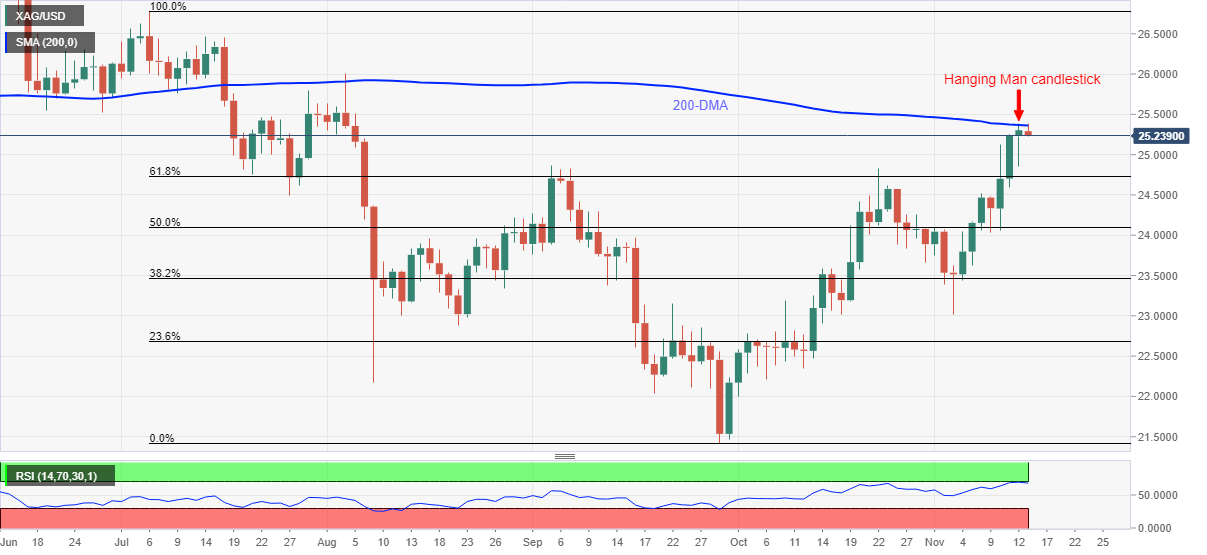
Trend: Further weakness expected
In recent trade today, the People’s Bank of China (PBOC) set the yuan (CNY) at 6.3896 vs. the last close of 6.3785.
About the fix
China maintains strict control of the yuan’s rate on the mainland.
The onshore yuan (CNY) differs from the offshore one (CNH) in trading restrictions, this last one is not as tightly controlled.
Each morning, the People’s Bank of China (PBOC) sets a so-called daily midpoint fix, based on the yuan’s previous day closing level and quotations taken from the inter-bank dealer.
The Bank of Japan's governor, Haruhiko Kuroda has crossed the worse following a series of Japanese data and has stated the following comments:
Japan's economic recovery is delayed somewhat.
Stagnation in Japan's consumption has been prolonged.
Exports, output hovering on a weak note.
Service consumption to remain under pressure from covid, temporary slowdown in exports, output likely to continue.
The mechanism for Japan's economic recovery remains in place.
BoJ will take additional easing steps without hesitation as needed, with an eye on the pandemic's impact on economy.
Japan's economic recovery is likely to become clearer in 1st half of next year.
Japan's economy is likely to recover levels seen in 2019 in 1st half of next year.
Demand for precautionary liquidity has eased substantially.
Corporate funding strain appears to have become limited to sectors still suffering from weak sales, small and medium-sized firms.
BoJ will maintain powerful monetary easing as inflation is projected to miss the 2% target for time being.
Japan's consumer inflation is likely to gradually accelerate to around 1% toward mid-next year.
Inflation expectations of households, firms rebounding, wage growth accelerating mainly among sectors suffering from labour shortages.
There have been no market reactions to the comments that followed data earlier in the day as follows:
Japan's GDP translated into a quarterly drop of 0.8%
About Kuroda
Haruhiko Kuroda, is the 31st and current Governor of the Bank of Japan. He was formerly the President of the Asian Development Bank from 1 February 2005 to 18 March 2013.
- AUD/NZD bears are seeking a break of 4-hour support.
- AUD/NZD running into daily resistance at a snail's pace.
As per the daily chart below, the price is drifting to the upside in comparison to the firmer two day's of bearish closes within the latest bearish impulse from the late October sell-off. While the current trajectory is to the upside, the pace for which it is recovering is unimpressive, so far and could attract a fade on rallies at this rate.
AUD/NZD daily chart
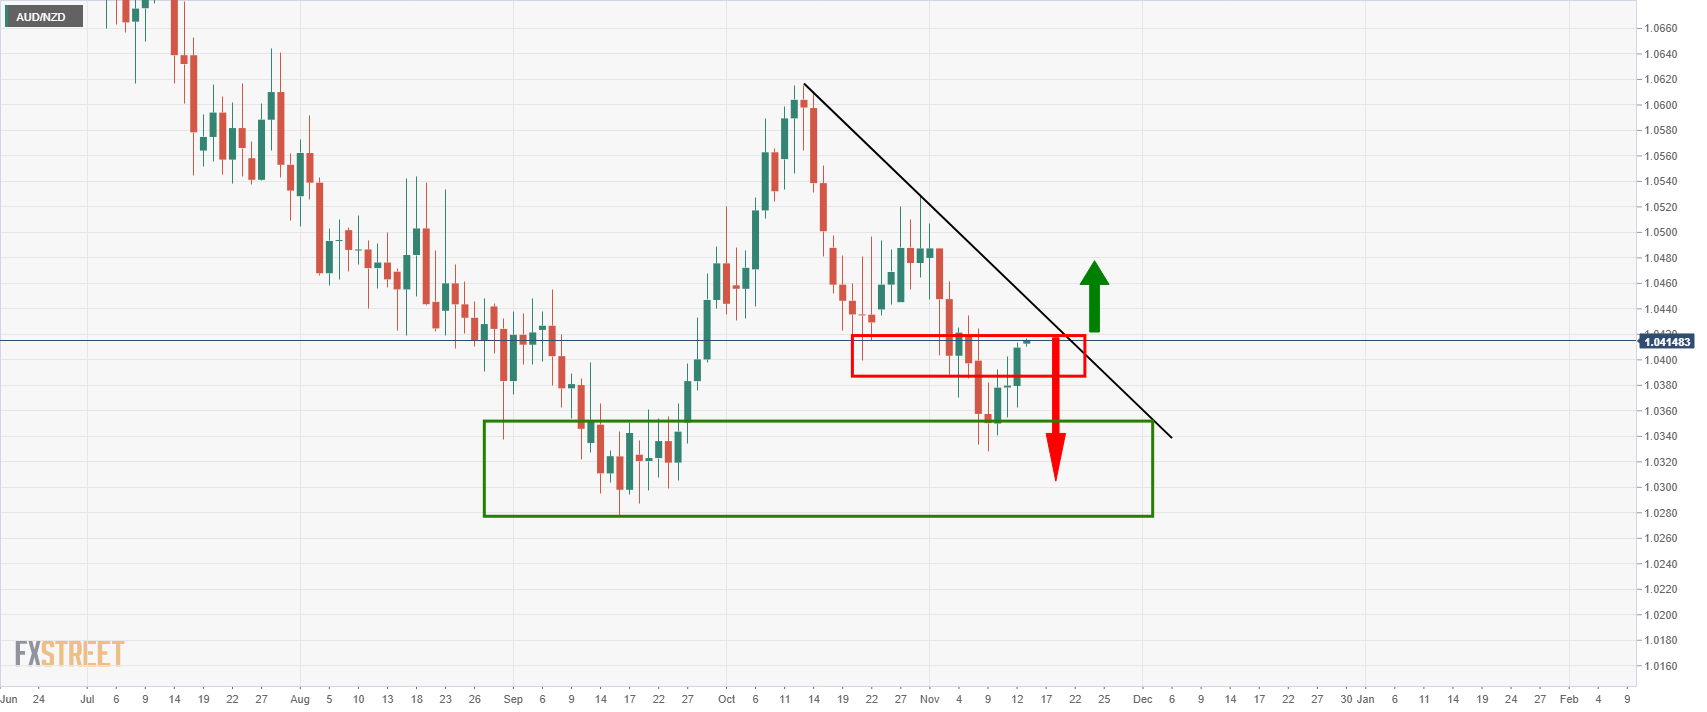
This leads to the conclusion that should this current level of resistance hold, then the 1.03 figure is going to be left vulnerable. If, on the other hand, the resistance breaks, then the price would be expected to reach into the late 1.04 area and possibly break into the 1.05 territories in the forthcoming days.
AUD/NZD 4-hour chart
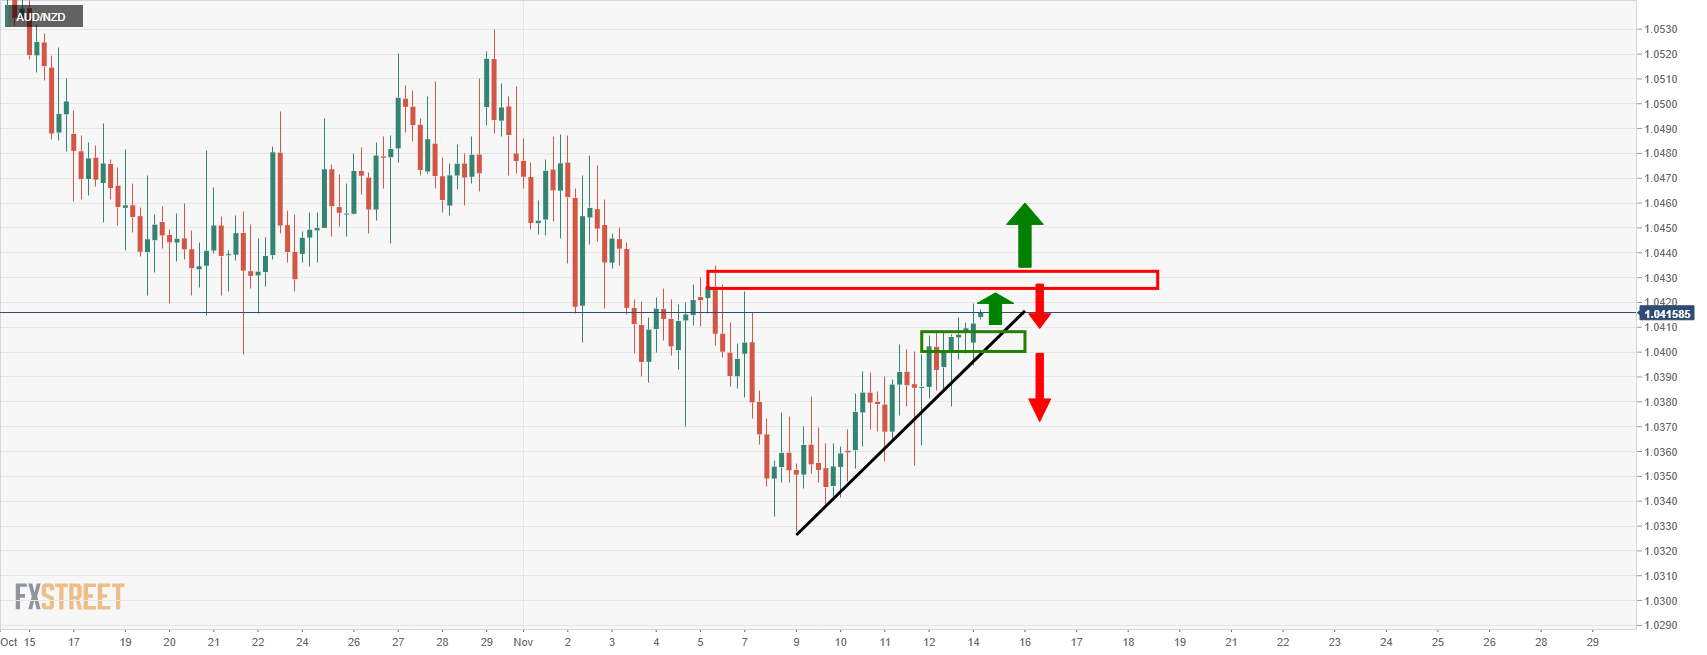
The 4-hour chart is climbing the dynamic support trendline for which would need to give for the downside to open up in the coming days.
- DXY seesaws around 16-month high, following Friday’s pullback.
- Treasury yields remain pressured, consolidate the strongest rebound in two months.
- US Consumer Sentiment, Fedspeak tries to placate reflation fears, Fed rate hike woes.
- US Retail Sales will be the key, risk catalysts can entertain short-term traders.
US Dollar Index (DXY) bulls take a breather after posting the biggest weekly run-up since August. That said, the greenback gauge pulled back from a 16-month high the previous day, taking rounds to 95.10 during Monday’s Asian session.
Softer data poured cold water on the face of Fed rate hike expectations on Friday, taking down the US Treasury yields and the DXY. On the same line were the policymakers’ efforts to reject inflation fears and push for more stimulus.
US Michigan Consumer Sentiment Index dropped to the 10-year low of 66.8 the previous day, considering the flash readings for November. The economic data raised expectations of easy Fed policy moves even as the rising inflation and a lack of policy response to address it were cited as the main reasons for the fall, per the Australia and New Zealand Banking Group (ANZ).
Elsewhere, US Treasury Secretary Janet Yellen and Federal Reserve Bank of Minneapolis President Neel Kashkari tried to tame reflation woes in their latest speeches and favored market sentiment, which in turn weigh on the US bond coupon and the US Dollar Index. While US Treasury Secretary Yellen defied chatters that the incoming stimulus will fuel more inflation, Fed’s Kashkari reiterates that the inflation run-up is ‘transitory’.
On a different page, the US policymakers are moving forward in the stimulus talks but no concrete announcements have been spotted of late. Recently, US Senate Majority Leader Chuck Schumer urged President Joe Biden administration to approve fuel sales from the nation's Strategic Petroleum Reserve (SPR).
Against this backdrop, US 10-year Treasury yields remain depressed around 1.56%, down 1.6 basis points (bps) whereas the S&P 500 Futures print 0.20% intraday gains at the latest.
Looking forward, NY Empire State Manufacturing Index for November, expected 20.2 versus 19.8, may direct intraday moves. However, major attention will be given to Tuesday’s Retail Sales and Fedspeak for a clearer view.
Technical analysis
A sustained upside break of an ascending resistance line from March 31, now support around 94.78, directs the US Dollar Index bulls towards June 2020 lows near 95.70.
Japan economy minister, Daishiro Yamagiwa says in a Gross Domestic Product statement that the economy continues to pick up but the pace is weakening and needs policy support.
He said that he needs to be mindful of downside risks from global but the economy is expected to pick up ahead due to global.
The comments follow today's GDP data:
Japan's GDP translated into a quarterly drop of 0.8%
Reuters reported that Japan's economy contracted at an annualised rate of 3.0% in July-September from the previous quarter, government data showed on Monday, posting the first decline in two quarters as resurgent coronavirus infections hurt consumer spending.
- AUD/USD struggles to keep Friday’s rebound from five-week low.
- Bearish MACD signals challenge buyers aiming monthly resistance line amid steady RSI.
- Sustained bounce off 61.8% Fibonacci retracement level keeps bull hopeful.
- China Retail Sales, Industrial Production for October will offer fresh impulse.
AUD/USD fades Friday’s corrective pullback from the key Fibonacci retracement level, easing to 0.7330 during Monday’s Asian session.
The Aussie pair managed to bounce off the 61.8% Fibonacci retracement (Fibo.) of the August-October uptrend, around 0.7275, during the previous day. The recovery moves gained support from an uptick in RSI, suggesting further advances.
However, the MACD signals remain favorable to the bears and hence highlight the and two-week-old descending trend line, around 0.7355, followed by the 100-DMA level of 0.7367, as crucial upside barriers.
Should the quote manage to cross the 100-DMA hurdle, the late October lows and the September month high, respectively around 0.7455 and 0.7480, will be the key to watch.
On the flip side, AUD/USD sellers will wait for a clear downside break of the stated Fibo. level near 0.7275 for fresh entries while the 0.7300 threshold may entertain short-term sellers.
In a case where China data disappoint Aussie buyers and drag the quote below 0.7275, the pair prices may drop towards 0.7215 and September’s low of 0.7169.
AUD/USD: Daily chart
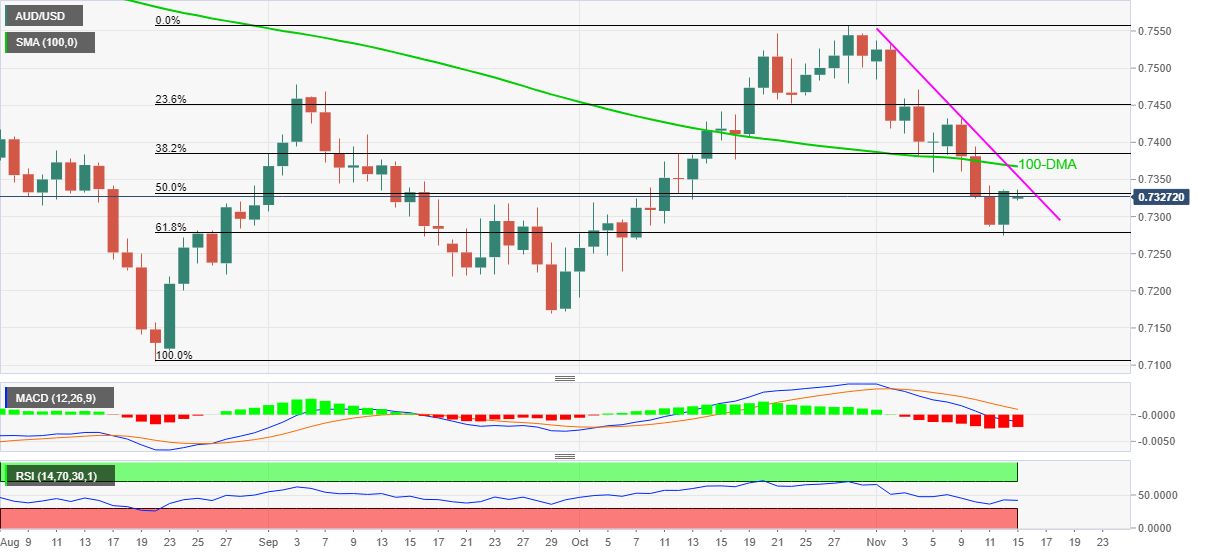
Trend: Pullback expected
| Pare | Closed | Change, % |
|---|---|---|
| AUDUSD | 0.73314 | 0.61 |
| EURJPY | 130.324 | -0.17 |
| EURUSD | 1.14435 | -0.02 |
| GBPJPY | 152.805 | 0.21 |
| GBPUSD | 1.34175 | 0.38 |
| NZDUSD | 0.70431 | 0.36 |
| USDCAD | 1.25452 | -0.19 |
| USDCHF | 0.92072 | 0.03 |
| USDJPY | 113.876 | -0.15 |
Reuters reported that Japan's economy contracted at an annualised rate of 3.0% in July-September from the previous quarter, government data showed on Monday, posting the first decline in two quarters as resurgent coronavirus infections hurt consumer spending.
''The gross domestic product (GDP) figure translated into a quarterly drop of 0.8%, worse than economists' median estimate of a 0.2% contraction, the Cabinet Office data showed.
Private consumption, which makes up more than half of the economy, fell 1.1%, versus a 0.5% decline expected by economists, the data showed.''
In other highlights in Japanese data today, it is worth noting the following:
Japan CAPEX falls in July-Sept at fastest rate since April-June 2020.
Japan exports fall for first time in five quarters.
Japan external demand contribution turns positive for first time in 3 quarters.
Japan GDP deflator falls for third straight quarter YoY.
Japan govt official: falls in auto, household electronics consumption dragged private consumption in q3 GDP
Japan govt official: auto, construction, production contributed to fall in CAPEX.
Refile-japan govt official: auto, construction, production machinery contributed to fall in CAPEX (adds dropped word machinery).
Meanwhile, USD/JPY is stagnant around 114.00 and the data has little to no effect on the pair.
-
Japan's GDP translated into a quarterly drop of 0.8%
About Japan's GDP
The Gross Domestic Product released by the Cabinet Office shows the monetary value of all the goods, services and structures produced in Japan within a given period of time. GDP is a gross measure of market activity because it indicates the pace at which the Japanese economy is growing or decreasing. A high reading or a better than expected number is seen as positive for the JPY, while a low reading is negative
In its latest GBP/USD analysis, Morgan Stanley (MS) sounds cautiously optimistic with its eyes on the yields.
Key quotes
We stay neutral on GBP/USD but see risks now skewed to the upside. Good economic data, which would drive real yields higher, is a necessary condition for turning outright bullish.
The yield curve remains an important driver of GBP/USD and how the yield curve steepens or flattens and where we are in the business cycle will matter for the currency.
FX implications
GBP/USD remains sidelined following a bounce off the yearly low, around 1.3410 during early Monday morning in Asia. Given the Brexit woes and the Fed rate hike chatters, the cable bulls remain weak of late.
Read: GBP/USD struggles to defend 1.3400 on Brexit fears, sluggish markets


© 2000-2026. All rights reserved.
This site is managed by Teletrade D.J. LLC 2351 LLC 2022 (Euro House, Richmond Hill Road, Kingstown, VC0100, St. Vincent and the Grenadines).
The information on this website is for informational purposes only and does not constitute any investment advice.
The company does not serve or provide services to customers who are residents of the US, Canada, Iran, The Democratic People's Republic of Korea, Yemen and FATF blacklisted countries.
Making transactions on financial markets with marginal financial instruments opens up wide possibilities and allows investors who are willing to take risks to earn high profits, carrying a potentially high risk of losses at the same time. Therefore you should responsibly approach the issue of choosing the appropriate investment strategy, taking the available resources into account, before starting trading.
Use of the information: full or partial use of materials from this website must always be referenced to TeleTrade as the source of information. Use of the materials on the Internet must be accompanied by a hyperlink to teletrade.org. Automatic import of materials and information from this website is prohibited.
Please contact our PR department if you have any questions or need assistance at pr@teletrade.global.
transfers