- Analytics
- News and Tools
- Market News
CFD Markets News and Forecasts — 11-11-2021
- Silver remains sidelined around three-month high, pauses two-day uptrend.
- Bullish Momentum, break of short-term horizontal hurdle keep buyers hopeful.
- 100-DMA, rising trend line from September 29 adds to the downside filters.
Silver (XAG/USD) seesaws in a choppy range above $25.00, recently easing to $25.20 amid Friday’s Asian session.
The bright metal jumped to its highest levels since August the previous day while extending the run-up beyond a two-month-old horizontal hurdle surrounding $24.85-80.
However, a failure to cross the 200-DMA level of $25.35 joins cautious sentiment ahead of the US Treasury market open, after a one-day US bank holiday, to challenge the bulls even as upbeat Momentum line hints at the further upside.
Hence, a clear upside break of the $25.35 becomes necessary for the XAG/USD buyers to keep reins. Following that, August month’s high of $26.00 and a descending resistance line from February, near $26.50, will be in focus.
On the contrary, a daily closing below the $24.85-80 resistance-turned-support area will recall the short-term sellers of silver. Even so, the 100-DMA and a two-month-old upward sloping trend line, close to $24.15 and $23.40 in that order, will be tough nuts to crack for the metal bears.
Silver: Daily chart
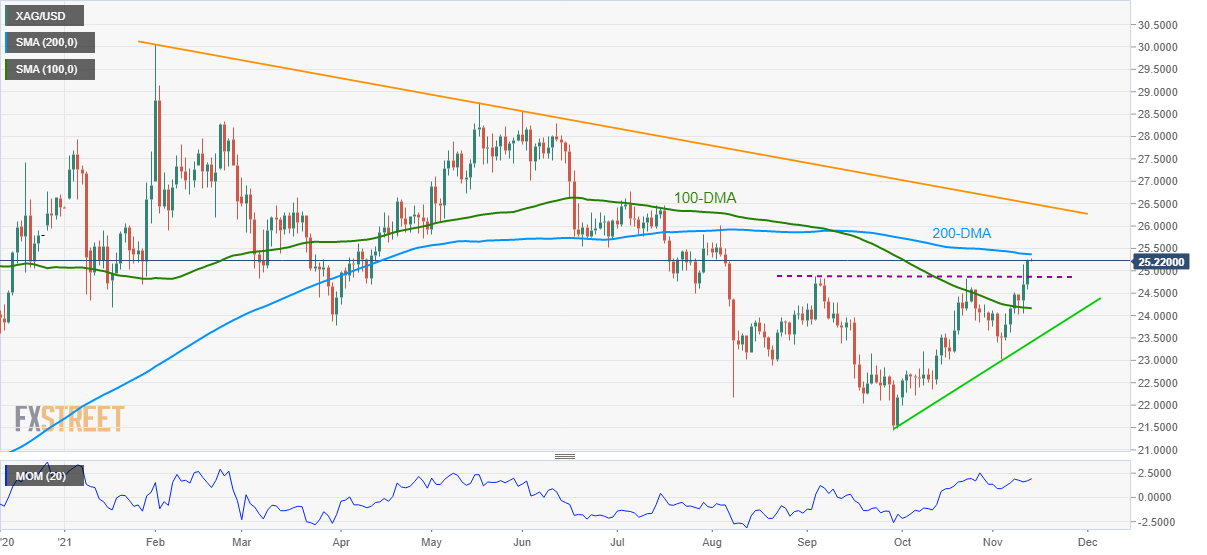
Trend: Bullish
- USD/JPY stays around 114.00, continues its weekly top situation.
- Investors look for fresh impetus amid light calendar events, Evergrande news is in focus.
- USD/JPY looks for direction from upcoming economic aid.
USD/JPY is appending yesterday rally led by US inflation to trade around 114.00 during early Asian hours on Friday. The cross on Thursday spiked on the back of US Treasury yields now turning cautious after annual consumer inflation in the US accelerated to a three-decade high of 6.2% in October. The outcome is raising expectations of earlier interest rate hikes by the Federal Reserve. The monetary policy views boosted the US Treasury yields to the highest rise in seven weeks, which propelled the US Dollar Index (DXY).
Previously, the wholesale inflation in Japan hit a four-decade high in October due to rising commodity prices and supply bottlenecks, as per government data. However, Bank of Japan (BoJ) policymakers iterated, acknowledging inflationary pressures arising from higher energy prices. They believe that it was moderate and that monetary easing should be maintained, according to BOJ October policy meeting minutes.
Meanwhile, besides Japan’s stimulus package news worth more than 30 trillion yen ($265 billion), China’s embattled Evergrande is in the headlines of late. It has once again met a deadline to pay overdue interest on three US dollar bonds before their grace periods ended. The Evergrande shares surged in Hong Kong on Thursday. Amidst undecided Fed Policymakers, coupled with the mild risk-on mood in a comparatively quiet market, USD/JPY seems to have buoyed. USD/JPY may continue to find impetus from a US rate hike hints and developing news from the China property sector.
USD/JPY technical levels
After capturing three-week-old resistance around 114.00, the USD/JPY daily chart now indicates that 114.70 (one-month high) can be re-tested. The following psychological barrier to the upside is at 115.00.
The price can reverse, wherein that the support level of 111.11, 100-day Simple Moving Average (SMA) will be first, followed by 110.82 (one-month low).
- AUD/NZD edges up for the third day in a row amid a dismal than expected Australian jobs report.
- RBNZ rate hike in October could be the prelude to more hikes coming in the short term.
- RBA cemented its dovish stance on a worse than expected Australian employment report.
The AUD/NZD has been moderately edging up in the last three sessions. As the Asian Pacific session begins, the pair is barely up 0.05%, trading at 1.0385 during the day at the time of writing.
On Thursday, the AUD/NZD during the Asian session dipped as low as 1.0355 as the market dissected a dismal Australian report. However, throughout the day, the Australian dollar licked its wounds, bouncing off the lows, reaching a daily high at 1.0400, but in the end, it retreated to its current price.
Australian Employment Change dropped 46.3K, and the unemployment rate jumped above 5%
Further, the Australian economic docket featured the Employment Change for October, which fell 46.3K, sharply lower than the 50K rise expected by analysts, spurring a jump in the Unemployment Rate, from 4.7% to 5.2%. That cemented the Reserver Bank of Australia (RBA) dovishness, as expressed by Governor Lowe at the press conference after unveiling the bank's monetary policy statement.
Central bank monetary policy divergence would be the main driver for the AUD/NZD
On its last monetary policy meeting, the Reserve Bank of New Zealand hiked its Overnight Cash Rate by 25 basis points, up to 0.50%, taking the lead amongst major developed countries. Also, the bank said that it would remove stimulus measures as the New Zealand economy continue its recovery.
According to sources cited by Reuters, said that the "RBNZ won't stop here. October marks the beginning of a new chapter for the cash rate: Onwards and upwards."
Most analysts expect a similar rate hike in November, February, and May.
Moving to the Reserve Bank of Australia (RBA), the RBA unwound its pandemic-stimulus packaging on its last monetary policy when it dropped the Yield Curve Control. Furthermore, it opened the door for an earlier hike rate, removing the 2024 calendar target on its monetary policy statement.
Yet, the RBA Governor Philip Lowe reiterated to market participants that the bank would be patient with its monetary policy and rejected that a hike could come as early as May 2022. Furthermore, keep its bond purchasing program at a pace of A$4 billion a week and emphasizes that inflation is expected to be around the 2.5% RBA target band by the end of 2023.
That said, and driven by recent economic data, the NZD could rise in the near term against the AUD, but the RBNZ will have its last monetary policy of the year by November 24, where the market expects a 50 basis point increase, according to futures market expectations.
Reuters came out with the survey details of 14 economists’ views on the next week’s monetary policy decision of the Central Bank of the Republic of Turkey (CBRT) on late Thursday. The headline findings suggest the 100 basis points (bps) of a rate cut to 15%, following a 200 bps of a rate cut witnessed in the last meeting to the 16% mark.
It’s worth noting that the CBRT is up for conveying monetary policy decisions on November 18.
Additional findings
At least four regular participants in Reuters polls did not make a forecast, citing unusual difficulties guessing the central bank's moves.
In a shift in guidance, the central bank said last month the current account deficit was the country's main problem, and narrowing the shortfall was key to price stability and supporting the lira.
It has said there is limited room for further cuts this year, after unexpectedly reducing its policy rate by 200 basis points last month.
The median estimate of 12 economists for the policy rate at year-end was 15%, with forecasts ranging between 13% and 16%.
Also read: USD/TRY pushes higher and approaches 10.0000
- GBP/USD remains on the back foot, recently sidelined around yearly low.
- Bearish impulse fades but bulls have limited upside room.
- September’s low challenges immediate recovery moves, further downside to aim for early November 2020 tops.
GBP/USD bears seem tiring around the lowest level since December 2020 as the cable pair seesaws near 1.3360-65 amid Friday’s Asian session, after refreshing the multi-day bottom the previous day.
The latest pause in the south-run could be linked to the oversold RSI conditions and the quote’s failures to break the 61.8% Fibonacci Expansion (FE) level of the quote’s moves between late October and November 09.
However, September’s low around 1.3410 stays ready to challenge the anticipated corrective pullback. Also acting as an upside barrier is the early month bottom close to 1.3425.
In a case where the GBP/USD prices remain firmer past 1.3425, a descending resistance line from October 28 and 50-SMA, respectively near 1.3520 and 1.3540, will be in focus.
Alternatively, further weakness needs to provide a decisive closing below 1.3350 immediate FE support ahead of visiting the early November 2020 peak near 1.3310.
Following that, the 100% FE level around the 1.3200 threshold will lure the GBP/USD bears.
GBP/USD: Four-hour chart
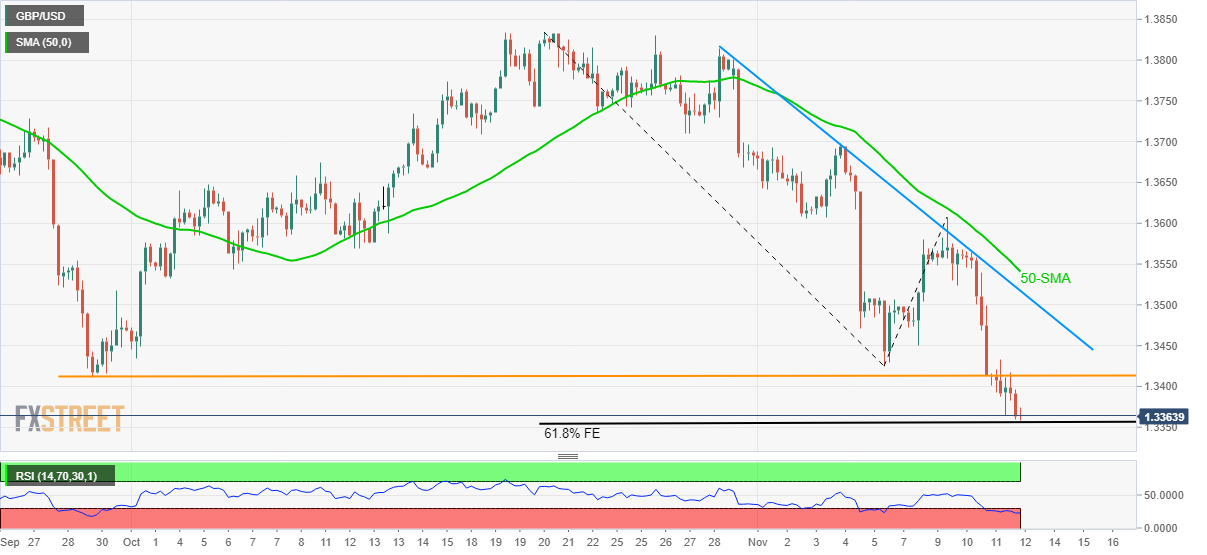
Trend: Corrective pullback expected
- Gold is testing critical resistance territories and a correction could be in store.
- Fundamentally, gold is enjoying the bullish landscape which could attract more buyers.
Gold extended gains following the prior day's US Consumer Price Index which is a weight on real yields for which gold is regarded as the perfect hedge. XAU/USD rose from a low of $1,842 to $1,866 on Thursday, adding around 0.7% points by the close of Wall Street.
Gold climbed despite the advance in the US dollar that rose to a 16-month high a day after the strongest US inflation reading in more than three decades. Amid a holiday-thinned session, US Treasury markets were closed overnight. However, the 10-year Treasury yields implied by futures rose from 1.55% to 1.60%.
Bond yields have remained elevated due to the residual effects of the strong inflation data. The Consumer Price Index is now at new cycle highs and both the yearly and monthly prints show a second straight month of accelerating gains. Consequently, the markets are expecting US interest rate hikes next year which are underpinning the US dollar.
In related markets, equities rebounded on expectations higher consumer prices will help corporate growth. Commodity prices were mostly higher, the Bloomberg Commodity Index up 1.3%, its strongest day since 25 October. '' The spectre of higher and entrenched inflation saw investor demand surge for the precious metal,'' analysts at ANZ Bank said.
''Spot prices broke out of a downward trend that has been in place for the past 15 months. The move suggests the market doesn’t expect the Fed to tackle inflation soon,'' the analysts added. ''For the moment, the buying hasn’t manifested itself in the exchange-traded funds market, with inflows remaining muted.''
Gold's key level is at $1,860/oz
Gold is making its marl around the $1,860 level, an area on the carts where analysts at TD Securities have earmarked as being key. ''Gold prices need only close north of $1860/oz to catalyze further CTA long acquisitions, which should cement a more supportive trend.''
''Hawks are still getting squeezed,'' the analysts said, ''but the breakout in gold has also attracted new buyers.''
'''Importantly,'' the analysts added further, ''the breakout has driven the China Smart Money group of funds to add a significant amount of new length in SHFE gold.''
''After all, our ChartVision framework, which stress-tests 75 technical indicators to identify the critical threshold for a change in trend, suggests that with gold prices north of $1845/oz, an uptrend in gold should form by March 2022.''
Gold technical analysis

While the fundamental backdrop is bullish, the technical outlook points towards an imminent correction. The price is reaching into daily resistance where rejection would be expected to lead to a significant retracement. The 38.2% Fibonacci ratio aligns with the summer and mid-Sep highs as a potential target for the bears in the comings days near $1,830.
- USD/CAD remains sidelined after jumping to five-week tops.
- Bank holidays in US, Canada couldn’t restrict the bulls amid Fed rate hike chatters, softer oil prices.
- US Michigan Consumer Sentiment, risk catalysts eyed for fresh impulse.
USD/CAD seesaws around early October levels near 1.2580-90 during Friday’s Asian session. The Loonie pair refreshed the multiday peak the previous day despite banking holidays in Canada and the US restricted market moves.
The reason could be linked to the US dollar’s sustained run-up on the back of the Fed rate hike chatters and sluggish prices of Canada’s main export item, WTI crude oil. However, traders turn cautious ahead of the Treasury market’s opening after a one-day off and will be waiting for US data, as well as old catalysts for fresh impulse.
US Dollar Index (DXY) refreshed the 16-month high to 95.1961 before closing around 95.1228 by the end of Thursday’s North American session.
Over a three-decade high US inflation number propelled the Fed rate hike concerns and favored the US dollar of late.
On the same line could be the greenback’s safe-haven allure that gains importance amid growing concerns over China’s economic growth, mainly due to credit crisis for real-estate companies and power-cut problems. The same joins the Sino-American tussles over the phase 1 deal, Vietnam and Hong Kong to weigh on oil prices and offer additional fuel to the USD/CAD prices.
It is worth noting that talks of the US releasing Strategic Petroleum Reserve’s (SPR) to battle the energy crisis also recently challenged WTI bulls and favored the USD/CAD upside.
Amid these plays, Wall Street closed mixed with the off in the US Treasury markets. However, the US Michigan Consumer Sentiment for November will be eyed for fresh impulse as the traders return for a holiday.
Technical analysis
A clear break of the 100 and 50-DMA convergence, near 1.2540-45, enables USD/CAD bulls to aim for multiple levels marked since late July around the 1.2600 threshold.
- EUR/USD remains heavy near the lowest levels in 16 months.
- Bearish MACD, sustained trading below October’s trough allow sellers extra time.
- Five-month-old support line joins June 2020 peak to highlight 1.1420-10 as the key area.
- Monthly horizontal line guards immediate upside ahead of 20-DMA.
EUR/USD bears take a breather around the July 2020 levels following a two-day downtrend, taking rounds to 1.1450 during Friday’s early Asian session.
The major currency pair’s slump could be linked to the clear downside break of a horizontal area comprising multiple levels marked since early October. Also favoring sellers are the bearish MACD signals.
However, a convergence of a five-month-long descending trend line and high marked in June 2020 offer a tough nut a crack for the EUR/USD sellers around 1.1420-10 zone. The nearly oversold RSI conditions also highlight the importance of the said support region.
It’s worth noting that the 1.1400 threshold adds to the downside filter and allows counter-trend traders an extra opportunity for taking the risk.
On the other hand, corrective pullback remains less lucrative until the quote stay below one-month-old horizontal resistance, previous support around 1.1530.
Following that, the 20-DMA and a descending resistance line from September, respectively around 1.1585 and 1.1635, will be in focus.
Adding to the upside filters is the downward sloping trend line from May, close to 1.1670 at the latest.
EUR/USD: Daily chart
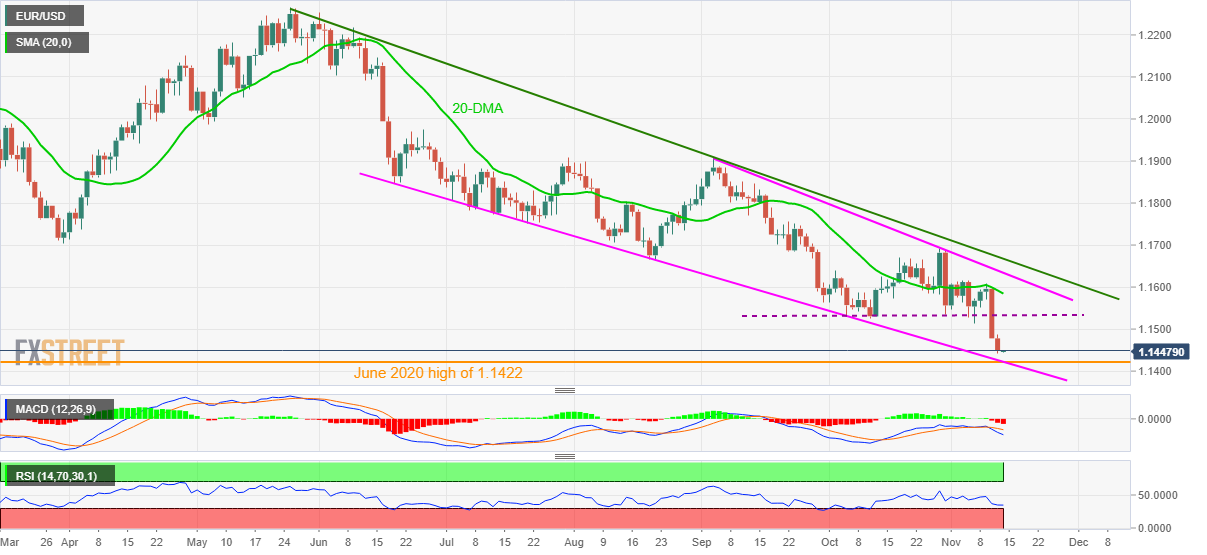
Trend: Further declines limited
- GBP/JPY declines for three days in a row, accumulating losses of almost 1%.
- GBP/JPY is trading sideways but slightly tilted to the downside, as sellers eye the 200-DMA.
GBP/JPY extends its losing streak to three consecutive days, down some 0.01%, trading at 152.44 during the day at the time of writing. On Tuesday, the pair failed to break strong resistance around 153.60, collapsing on Wednesday, in a hotter-than-expected US inflation reading, dipping down to the 100-day moving average (DMA) at 152.57.
On Thursday, during the Asian session, the GBP/JPY cross-currency pair failed to recover the 153.00 level amid mild risk-on market sentiment. Furthermore, weaker than expected UK macroeconomic data, which investors slightly ignored, dented the British pound prospects, favoring Japanese yen bulls.
That said, the GBP/JPY pair would remain trapped within the 152.60-153.00 range as investors wait for a fresh impetus to take action.
GBP/JPY Price Forecast: Technical outlook
Daily chart

As of writing, the pair is trading beneath the Wednesday low (152.57), printing a fresh monthly low. Furthermore, the GBP/JPY pair left behind the shorter time-frames DMA’s, and GBP/JPY sellers turn their attention towards the 200-DMA lying at 151.97. If sellers reclaim the latter, the first demand zone would be the 151.00 psychological level. A breach of that level would expose an upslope support trendline that travels from July 20 low towards the September 21 low near the 150.00 area.
Contrarily, GBP/JPY buyers, if they would like to regain control, will need a daily close above the 50-DMA at 153.17. In that outcome, key supply zones would be exposed. The first supply zone would be the November 5 high at 153.77, followed by the psychological resistance level at 154.00.
- AUD/USD seesaws around early October levels following three-day downtrend.
- Aussie employment allows RBA to defend current rates contrary to inflation-backed rate hike push for Fed.
- Sino-American rivalry, Evergrande act as additional bearish factors.
- No major data/events in Asia highlight risk catalysts, US consumer sentiment figures will be important to watch.
AUD/USD holds onto bearish bias around the recently flashed three-week lows near 0.7285 during early Friday morning in Asia.
The Aussie pair dropped during the last three days as surprise negative Australian employment figures favored the pair’s latest downside amid the US bank holiday. Also pleasing the pair sellers were chatters concerning a likely monetary policy divide between the Reserve Bank of Australia (RBA) and the US Federal Reserve (Fed), as well as the US-China phase 1 deal and Evergrande.
Although AUD/USD bulls have reasons to argue with the October month contraction in Australia Employment change and a six-month high Unemployment Rate, they gain a little momentum as the Aussie jobs report shows a vast gap between market forecasts and actual data. The same enables the RBA to reiterate its rejection of the rate hike, also citing the inflation figures that are still to remain stable between the 2.0% and 3.0% target. On the contrary, the 31-year high US inflation puts the rate hike are on the Fed’s platter. Hence, the US Dollar Index (DXY) has this key reason to aim for a fresh high since July 2020 and extend the last two-day uptrend.
Other than the central bank actions, downbeat forecasts concerning the economic growth of Australia’s largest customer China, mainly due to credit crisis for real-estate companies and power cut problems, also weigh on the AUD/USD pair. Additionally, the US-China difference remains wide open despite the policymaker’s readiness to talk, virtually, over the phase 1 deal in the next week. The reason could be traced from US Trade Representative (USTR) Katherine Tai’s comments that cited weakness in China’s phase 1 performance.
It should be noted that an off in the US Treasury market and mixed performance of the Wall Street benchmarks couldn’t even stop the AUD/USD downside and hence signaling further weakness when the markets turn active.
Even so, a light calendar in the Asian session may allow the pair sellers to take a breather around the multi-day low unless the aforementioned risk catalysts flash any fresh negatives. On the data front, US Michigan Consumer Sentiment for November will be looked for additional signals of reflation and Fed rate hike.
Technical analysis
AUD/USD bears keep reins as a clear downside break of the 100-DMA and 50-DMA, close to 0.7366-72, precedes the latest weakness below multiple tops marked during late September around 0.7315. That being said, 61.8% Fibonacci retracement (Fibo.) of August-October upside, around 0.7275 and a three-month-old ascending support line near 0.7240 gains the market’s attention.
- EUR/JPY edged lower for a fifth time in the last six session on Thursday, dropping below a key 50% fib.
- The pair is now probing its 200DMA just to the south of the 130.50 mark.
Thursday was another down day for EUR/JPY, a fifth in the last six sessions, during which time the pair has dropped from above 132.50 to current levels around 130.50 (a 1.5% decline). On the face of it, Thursday’s 0.1% drop hardly feels significant, but from a technical perspective, things are more interesting, as the pair dropped below a key 50% Fibonacci retracement level between the summer lows just above 128.00 and the October high around 133.50.
EUR/JPY also seems to have cracked below its 50-day moving average (DMA) at 130.60, but faces significant opposition if it wants to continue to depreciate in the form of the 200DMA at 130.46, which also coincides with the late September high. Should the pair break below these next key levels of support, the door will be open for a run lower towards the next key fib level (the 61.8% retracement) at just above 130.00.
In terms of the fundamentals, there hasn’t been much to update on. Real and nominal yields in the Eurozone have seen a significant slide in recent weeks, and the subsequent shift in EZ/Japan rate differential in JPY’s favour explains a large part of the recent move lower. Risk appetite has also been somewhat ropey this week as a result of US inflation fears, benefitting the safe-haven yen. Some more localised Eurozone-related risks are also increasingly showing up on investors’ radars; amid a sharp spike in Covid-19 infections across the bloc, countries are mulling or even already enacting Covid-19-related restrictions. This will weigh on the Eurozone economy in Q4 2021/Q1 2022 and is likely to weigh on EUR/JPY.
- NZD/USD printed a fresh low on Thursday as the US dollar continues to press higher.
- Fresh cycle highs for the greenback has sunk the bird ahead of the RBNZ next week.
NZD/USD ended the day down 0.55% at around 0.7020. The pair touched a low of 0.7012 and fell from a high of 0.7071. The US dollar remained on top as markets continued to buy into the inflation theme following Wednesday's surprise inflation data.
The US dollar printed its highest level since July 2020 at 95.196. The DXY ended the session higher by some 0.32% following the strongest inflation reading in more than three decades. On Wednesday, the Consumer Price Index posted its biggest monthly gain in four months, This took to lift the annual increase in inflation to 6.2%, the strongest year-on-year rise since November 1990.
CPI is now at new cycle highs and both the yearly and monthly prints show a second straight month of accelerating gains. Consequently, traders are anticipating US interest rate hikes next year which is underpinning the US dollar.
All eyes turn to the RBNZ
The kiwi was dragged lower on the surprisingly soft Aussie jobs data from Thursday. However, analysts at ANZ bank said that there are good reasons to look through that data. Some observers will note that the data did not catch the opening up of lockdowns, so this may not reflect the true picture of the health of the jobs market,
Meanwhile, looking ahead, the domestic data calendar is pretty light ahead of the RBNZ MPS. ''Yesterday we noted that the NZD had potential to benefit from the actual delivery of hikes, but as we near the decision, markets don’t seem to be shy of fading NZD strength even knowing that hikes (and thus carry) are coming.,'' the analysts at ANZ Bank said,
''The Kiwi did well after the 2020 lockdown, and has been mixed through 2021 (and has struggled >0.72 of late), but headwinds could be coming in 2022 as the rest of the world normalises policy. Let’s see.''
- AUD/JPY retreated from around 84.00 on weaker Australian employment data.
- AUD/JPY slide on the back of a mixed-market sentiment.
- AUD/JPY Technical outlook: A break below the 200-DMA would open the door for a move towards 82.00.
The AUD/JPY pair falls for the second day in the week, down 0.32%, trading at 83.18 during the New York session at the time of writing. The market sentiment is a mixed bag, as witnessed by US stocks fluctuating between gainers and losers. In the FX market, risk-aversion favored safe-haven currencies, like the Japanese Yen and the US dollar.
During the Asian session, AUD bulls pushed the pair to the upside, but the trend stalled around 83.67, retreating towards the 83.10s region. The move was triggered by a weaker than expected Australian employment report that prompted a spike in the Unemployment rate to 4.7%. Furthermore, it cemented the recent dovishness of the Reserve Bank of Australia (RBA), which is pushing for lower rates until 2024.
Therefore, the market sentiment would be the main driver for the pair. A risk-on mood would be positive for the AUD; otherwise, it would benefit the JPY.
AUD/JPY Price Forecast: Technical outlook
-637722595641694339.png)
The AUD/JPY pair is trading sideways around the double-top chart pattern target at 83.22. On Wednesday, the cross-currency printed a daily high at 84.09 but retreated around the 83.50 area. Despite the daily moving averages (DMA’s) remaining below the spot price, meaning the pair has an upward bias, the AUD/JPY could be headed lower in the near term.
Furthermore, confirmation of the Relative Strenght Index (RSI) below the 50-midline edging lower added another bearish signal in the near term.
For AUD/JPY bears, to reclaim control, they will need a daily close below the 200-DMA at 82.87. A breach of the latter would expose the shorter time-frame moving averages, with the 50-DMA at 82.57, followed by the 100-DMA at 81.90.
On the other hand, for AUD/JPY bulls to resume the uptrend, they will need a daily close above the November 9 high at 84.10. In that outcome, the following resistance level would be the October 22 low at 84.61, followed by the psychological 85.00 level.
On the flip side, a break above 83.71 could pave the way for further gains. The first resistance would be the 84.00 figure, followed by the so-called neckline of the double top, around 84.61, followed by the 100-SMA around the 85.00 area.
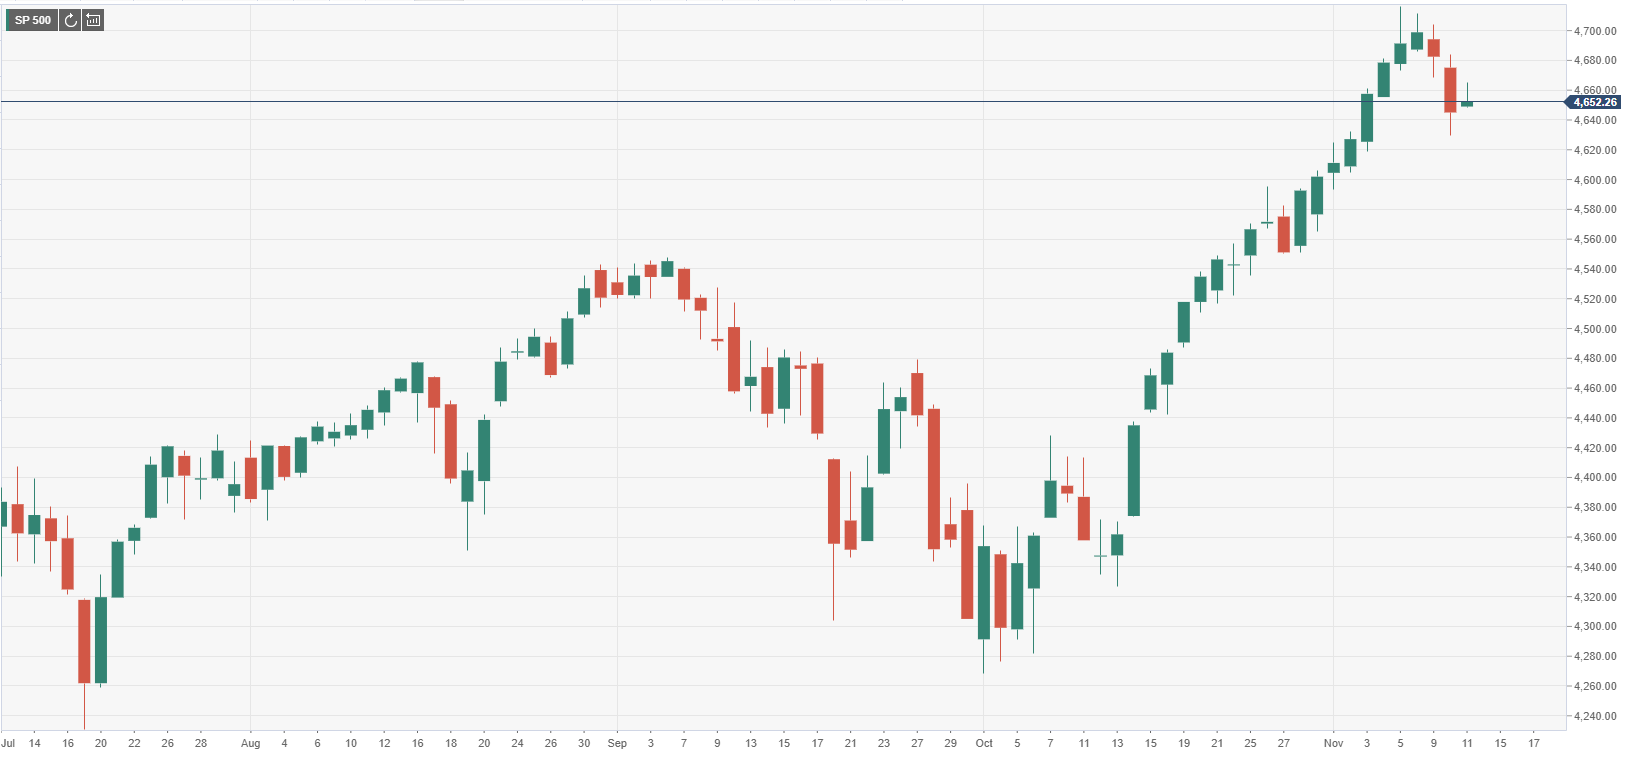
- The S&P 500 is trading around 4650 and nursing modest gains ahead of the close following a subdued session.
- Growth/tech stocks are outperforming amid bond market closures and strength in chipmakers.
- On Friday, equity investors will be watching JOLTs and Consumer Confidence data, as well as a speech from Fed’s Williams.
Trading conditions on Thursday have been contained, with many US market participants away for Veteran’s Day. Bond markets have been closed. The S&P 500 index started the session above 4660 but has gradually ebbed lower to around the 4650 mark, where it trades with one the day gains of about 0.1%. The broad stabilisation comes following the S&P 500’s worst day in over a month on Wednesday when investors took profit in wake of the highest US YoY Consumer Price Inflation reading since 1990.
The Nasdaq 100 is up 0.3%, though has also pulled back from prior session highs above 16,100 to current levels just above the 16K level. The Dow is the underperformer, down 0.4%, dragged lower by a near-7.0% fall in index heavyweight Disney’s share price following a disappointing earnings release. Equity analysts cited disappointing growth in streaming subscriber numbers and in theme park revenues. Also contributing to the Dow’s underperformance was the fact that investors seemed to favour growth stocks (of which the Nasdaq 100 is a proxy) over value stocks (of which the Dow is a proxy).
One reason for growth stock outperformance may well have to do with the fact that US bond markets were shut on Thursday in observance of Veteran’s Day. US bond yields spiked on Wednesday, weighing heavily on duration-sensitive growth names – higher bond yields increase the opportunity cost of holding stocks whose value depends to relatively more upon expectations for future earnings growth rather than on current earnings. Tech stocks (which disproportionately make up the growth stock contingent) also got a boost from a strong performance by semi-conductor names. The Philadelphia SE Semiconductor index was up 1.7% on Thursday, mostly erasing Wednesday’s post-US inflation data losses, led by a near-3.0% rally in Nvidia’s share price after Susquehanna raised the co.’s price target to $360 from $250 (it currently trades just above $300).
US stock market focus now shifts to the release of the September job openings (JOLTs) reports at 1500GMT, which should show that labour demand remains very strong. Also in focus at 1500GMT will be the release of the preliminary November University of Michigan Consumer Sentiment report, which will give a timely insight as to the state of US consumer health heading into the winter holiday shopping season. As ever, the consumer inflation expectation data in the report will be closely scrutinised.
US equity investors will also closely scrutinise a speech from influential FOMC Board of Governors member and NY Fed President John Williams. San Fransisco Fed President and FOMC member Mary Daly has been the only FOMC member to address this week’s shock consumer price inflation report so far. While she expressed concern about high inflation, she reiterated the stance laid out by Fed Chair Jerome Powell at the latest policy meeting that inflation pressures will likely subside next year and the Fed should be patient on rate hikes to allow time for the labour market to recover. Williams’ comments will carry more weight.
What you need to know on Friday, November 12:
The dollar kept advancing in the absence of another catalyst that could diverge investors’ attention from skyrocketing inflation. Poor UK data fueled the ruling dismal mood, as the UK reported quarterly growth of 1.3% in the three months to September, much worse than the previous 5.5% and the expected 1.5%. Industrial Production, Business Investment and the country’s trade balance also missed expectations, hinting at a more conservative BOE and pushing GBP/USD to a fresh 2021 low of 1.3359.
The EUR/USD pair also fell to its lowest for this year, hitting 1.1445 and ending the day a handful of pips above it. In the case of the shared currency, the weight come from central banks imbalances, as while the Fed has already kick-started tightening and may have to accelerate its pace, the ECB maintains a conservative stance.
AUD/USD stands below 0.7300 following the release of dismal Australian data and the poor performance of equities. The USD/CAD pair flirts with the 1.2600 level, trading at a fresh one-month high.
Gold retained its strength, advancing for a sixth consecutive day. Spot trades above $1,860 a troy ounce and has room to extend its rally towards the 1,900 mark. Crude oil prices seesawed between gains and losses, with WTI ending the day little changed at $81.50 a barrel.
The USD is extremely overbought and may correct lower ahead of the weekend, although it would likely retain its strength.
The US celebrated a holiday with bonds markets closed. Wall Street was opened, with the DJIA falling deeply in the rest while other major indexes posted uneven gains.
Shiba Inu must hold key support to avoid total capitulation
Like this article? Help us with some feedback by answering this survey:
- USD/MXN has jumped from prior session lows under 20.50 to around 20.60 in wake of the Banxico policy decision.
- The bank raised interest rates by 25bps to 5.0%, though some expected a 50bps hike and one voter dovishly dissented.
USD/MXN has erased a substantial portion of its earlier losses in recent trade in wake of the Banxico’s decision to hike interest rates by 25bps as expected. The pair has bounced from close to session lows around 20.50 to current levels around 20.60 and currently trades with on the day losses of about 0.2%. USD/MXN saw a substantial rally on Wednesday as a result of broad USD strength in wake of a much hotter than expected US inflation report and currently trades with on-the-week gains of about 1.4%. Mexican Consumer Price Inflation data was also released earlier this week, also rising at a 6.2% YoY rate in October, though this was unable to result in sustained MXN strength, given that the Banxico is already well into a hiking cycle to maintain price stability.
Banxico hikes rates as expected
The Bank of Mexico raised its interest rate by 25bps as expected for a fourth consecutive policy meeting on Thursday, taking benchmark rates to 5.0%. The board voted four to one in favour of the rate hike, citing concerns about above actual inflation and inflation expectations that are above the bank’s 3.0% target. While the bank reiterated that it sees the shocks that have increased inflation recently to be largely transitory, it said that the balance of risks for the trajectory of inflation remained biased to the upside. Moreover, the bank said the horizon over which these shocks may affect inflation are unknown, thus posing a greater risk to the process of price formation and to inflation expectations. The bank adjusted higher its 2021 inflation forecast to 6.8% YoY in Q4, though left the end 2022 forecast unchanged at 3.3% YoY.
The initial reaction of MXN in response to the meeting was to weaken. Some analysts had predicted the bank would hike rates by 50bps, thus the move could reflect an unwind of some hawkish bets. Meanwhile, the fact that one voter dissented against the decision to hike interest rates diminishes the prospect for further rate hikes. The one dissenter was likely motivated by the fact that the Mexican economy likely contracted in Q3 2021, a fact acknowledged by Banxico, though the bank also stated that the economy was expected to resume its recovery in Q4 2021.
Speaking to Reuters on Monday, Latin America analysis director for Moody's Analytics Alfredo Coutino said that the bank should raise the benchmark interest rate to between 5.50% and 6.00% by the end of this year if it hopes to comply with its mandate to pursue stable prices. Thus, dovish descent at the latest rate decision may raise some fears that Banxico may fail to raise interest rates sufficient to tame inflation, a potential dovish mistake.
- West Texas Intermediate crude oil recovers in late trade for the lows of the day.
- Oil prices are under pressure as markets discount the most likely course of action.
West Texas Intermediate crude oil has risen on the day and trades around 0.4% higher into the close on Wall Street. The black gold rallied from a low of $80.23 to a high of $82.29 on the day. The black gold has recovered from the day's lows which were printed after OPEC lowered its 2021 demand forecast on weaker than expected demand from China and India.
OPEC has cut its demand forecast by 0.16-million barrels per day from its October estimate its monthly report showed. OPEC now sees global demand this year reaching 96.4-million bpd, rising to 100.6-million bpd in 2022. Meanwhile, its forecast for supply outside the cartel was unchanged at 63.6-million bpd this year and 66.7-million bpd in 2022.
US inflation worries investors
In other themes, US inflation has concerned investors. US Consumer Price Index came in the strongest increase in some 30 years and energy prices will be a top priority for the White House. On Wednesday reported inflation rose to the highest since 1990, with higher energy costs the largest contributor to the 6.2% annualized rise in prices. Higher inflation is increasing pressure on the Biden Administration to release oil from the country's strategic reserves to bring down the price of oil and gasoline.
''Energy prices are under pressure as markets discount the most likely course of action, which would involve a release of SPR crude,'' analysts at TD Securities explained. ''This follows the EIA's Short Term Energy Outlook, which rather pointed to an oversupplied market in 2022. Yet, a continued recovery in demand is expected as global economies exit the pandemic, which can fuel strong short-term performance as OPEC pursues a rather cautious approach, ignoring calls to hike output at a faster pace.''
- USD/CHF is consolidating around its 50DMA at 0.9220 having rallied 100 pips in the last two days.
- If the pair can break higher, this opens the door to a move towards resistance in the 0.9250 region.
USD/CHF is currently consolidating either side of its 50-day moving average just under the 0.9220 mark, having rallied from Asia Pacific session lows around the 0.9180 mark. The move higher comes amid a continuation of broad USD strength as market participants continue to assess the implications of the latest US Consumer Price Inflation report, which showed the YoY rate of headline US CPI hitting its highest since November 1990 at 6.2% in October.
Thursday’s upside means the pair has now risen by nearly 100 pips from its just above 0.9120 levels prior to the data, a rally of about 1.0%. If USD/CHF can break to the north of its 50DMA at 0.9220, there is a balance area of some mid-October lows and highs around 0.9250 that could offer some resistance. Above that, a more notable area of resistance is just above 0.9300 level, where resides a triple top from early October.
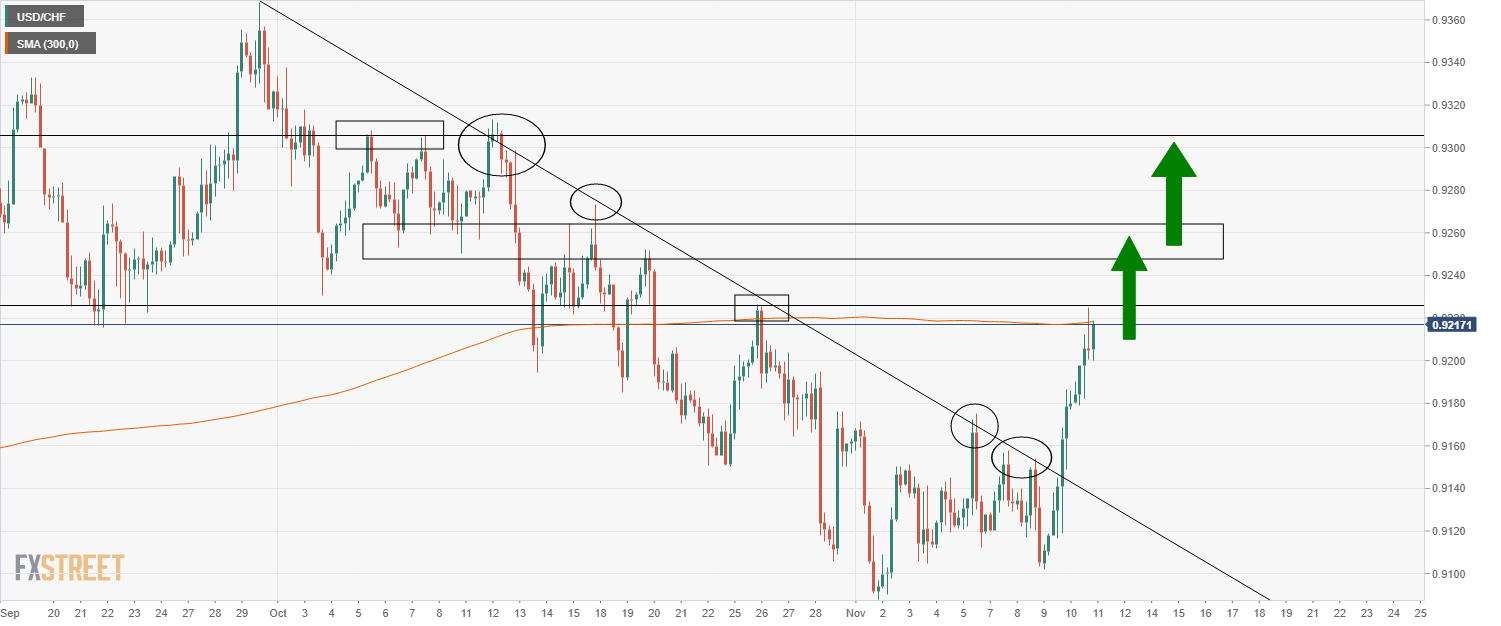
Commentary from Swiss National Bank (SNB) policymakers has not had any noticeable impact on USD/CHF in the last few days. SNB Governing Board member Andrea Maechler has spoken publically on a few occasions over the past few days. She reiterated the bank’s well-known positions that the value of CHF is high and its strength is keeping inflation low in Switzerland and that the bank is thus willing to intervene in currency markets and though there is no set level at which the bank intervenes.
- GBP/USD scores fresh cycle lows but bulls bite back.
- Cable has been under pressure due to Brexit and decelerating growth while US CPI underpins the US dollar.
GBP/USD is printing fresh cycle lows in late North American trade, shaking out some stale longs and making way for further advances to the downside for the sessions ahead. At the time of writing, GBP/USD is trading down some 0.26% after falling from a high of 1.3433 to a low of 1.3359 on the day. However, the bulls have stepped in and cable has snapped back from the lows.
Cable was printing the lowest level of 2021. A combination of domestic data and political turmoil, coupled with the divergence between the Federal reserve theme to that of the Bank of England weighs towards the end of the week.
Bets of a BoE rate hike are dwindling
On the domestic front, the British economy is losing steam. Data released by the Office for National Statistics showed Britain's economy grew by 0.6% in September. However, estimates for previous months were revised lower, leaving the economy still smaller than it was in February 2020.
As for the central bank, during the November policy meeting, the Bank of England surprised markets by leaving its main interest rate unchanged at 0.1%. Leading into the event, however, numerous members of the MPC had been advocating for rate hikes, teeing up the market for disappointment. Nevertheless, markets are now pricing in a high probability of a December rate rise. However, the caveat was economic progress and a resole to the Brexit risks, either of which is going in the right direction.
- Brexit angst is heating-up: GBP traders be warned
Investors are nervous about the negative ramifications that a post-Brexit dispute between Britain and the European Union over trade with Northern Ireland could have for the UK economy. However, in the latest update, Ireland's foreign minister said on Thursday that comments from Britain's Brexit minister suggest there is still some time to find a solution to trading difficulties before Britain seeks to trigger article 16.
US dollar soars to fresh cycle highs
Meanwhile, the greenback has printed the highest level since July 2020 at 95.1410. It is currently up by some by 0.29% in late North American trade and tracks higher following the strongest inflation reading in more than three decades.
On Wednesday, the Consumer Price Index posted its biggest monthly gain in four months to lift the annual increase in inflation to 6.2%, the strongest year-on-year rise since November 1990. CPI is now at new cycle highs and both the yearly and monthly prints show a second straight month of accelerating gains. Consequently, traders are anticipating US interest rate hikes next year which is underpinning the US dollar.
- XAU/USD broke above a 4-month downslope resistance trendline, aiming towards $1,900.
- XAU/USD rallied on higher US consumer inflation above 6%, the highest in 30 years.
- XAU/USD: Trading sideways, within the $1,840-65 range.
Gold (XAU/USD) is steady during the New York session, up some 0.50%, trading at $1,861 at the time of writing. During the Asian session, it seems that gold bulls bought the dip, as witnessed by the 1-hour chart, as XAU/USD consolidated around the $1,840-50 area, before resuming the upward move, which stalled around the $1,860s tops-
The market sentiment is mixed after hotter-than-expected US inflation figures unveiled on Wednesday. In fact, the headline US CPI number on a yearly basis spiked above 6% for the first time in three decades. This spurred appetite for precious metals, which have been an inflation hedge over time, with gold and silver rallying in the last couple of days.
Overall, US dollar strength has not been an excuse for the yellow metal to rise. Furthermore, the US 10-year Treasury yield rose above 1.50%, which could usually exert pressure on gold prices; however, real yields are the main driver for gold. As of November 10, real yields sit at -1.85%; therefore, as long as real yields keep falling, gold would maintain an upward bias.
The US economic docket will be light on Thursday in observance of the Veterans Day holiday. On Friday, the University of Michigan Consumer Sentiment Index for November could offer gold traders a fresh impetus to take action. Also, New York Fed’s President John Williams will speak at a virtual event hosted by the New York Federal Reserve.
XAU/USD Price Forecast: Technical outlook
-637722529294005092.png)
Gold keeps trading above a 4-month downslope resistance trendline, broken on Wednesday, steady around tops $1,860s. The daily moving averages (DMA’s) were left behind the spot price, meandering around the $1,780-95 area, with the 50-DMA aiming higher, while the longer time-frames one directionless.
Further, the Relative Strength Index (RSI) is at 70, inside overbought conditions, confirming that the upward move might ease before resuming to the upside. However, for XAU/USD bulls to accelerate an attack towards $1,900, they will need a daily close above the June 3 low at $1,864.98. In that outcome, the following resistance area would be the psychological $1,900.
On the flip side, the September 3 high at $1,834 would be the first support area, that once breached, would open the door for a further downfall towards $1,800.
Amid a lack of any meaningful fresh fundamental catalysts on Thursday aside from a slightly softer than expected UK GDP report, EUR/GBP has continued to nudge higher whilst also continuing to respect weekly ranges. The pair looks set to post a third consecutive daily gain of about 0.1%, during which time it has edged higher from weekly lows posted back on Tuesday at around 0.8520 to current levels just under 0.8570. That still leaves the pair some way below recent highs from earlier in the week/the end of last week around the 0.8590 mark. The 200-day moving average at 0.8580 seems to be offering some resistance, just as the 50DMA (just above 0.8520) earlier in the week provided the foundations for a rebound.

Brexit Update
UK PM Boris Johnson is set to travel to Paris on Friday to meet with French President Emmanuel Macron, where fishing access for French boats in UK waters will likely be at the top of the agenda. The UK’s broader disagreement with the EU over the implementation of the Northern Ireland protocol will also be an important topic for discussion. Political analysts still think there is a strong likelihood that the UK will trigger Article 16 to unilaterally override parts of the protocol, potentially triggering a broader trade/legal conflict with the EU. But there were reports that the EU was prepared to improve its offer on checks on goods going in and out of Northern Ireland, an offer that might be presented to the UK PM on Friday.
For now, FX markets are shrugging off Brexit risk. ING’s fair value model for EUR/GBP shows the pair to only be trading with about 1.0% “Brexit” risk premium, versus over 5.0% at some points during 2019. “With UK CPI heading to the 5% area into April, keeping BoE tightening prospects on the front-burner, we are happy with an end-year EUR/GBP target near 0.8500, and lower levels as 2022 progresses,” says the bank.
- EUR/USD bears are taking on the bull's commitments at 1.1450.
- US dollar moves in on a fresh weekly high as central bank divergence underpins the mighty dollar.
EUR/USD is trading on the backfoot in a sleepy mid-day North American session with the bond market closed for Veterans Day. The euro is still suffering from the surge in the US dollar following the prior day's US inflation data beat. At the time of writing, EUR/USD is down some 0.20% at the time of writing after falling from a high of 1.1487 to a low of 1.1453.
The US dollar continues to track higher levels, currently printing the highest since July 2020 at 95.1410 and higher by 0.29%. The following through comes on the back of the strongest inflation reading in more than three decades.
Traders are anticipating US interest rate hikes next year The Consumer Price Index posted its biggest monthly gain in four months to lift the annual increase in inflation to 6.2%, the strongest year-on-year rise since November 1990. CPI is now at new cycle highs and both the yearly and monthly prints show a second straight month of accelerating gains.
Time for Fed lift-off?
''The transitory theme remains under fire,'' analysts at Brown Brothers Harriman argued. ''With low base effects from November and December 2020 in place, the YoY rates are very likely to move even higher from these already lofty levels. The Federal Reserve’s preferred measure of inflation (core PCE deflator) won’t be reported until November 24 but it seems very likely to accelerate from the 3.6% YoY pace in September.''
''We still think Q2 seems too soon for lift-off but the market now sees a nearly two-thirds chance. Q3 liftoff is fully priced in, as is another hike in Q4,'' the analysts added.
ECB/ Fed divergence weighs on EUR/USD
Meanwhile, the European Central Bank's dovish theme will most likely hamstring the euro. However, ECB’s Roberts Holzmann said QE could end next fall and tipped an exit strategy for the centralbank. ''We do not think the majority at the ECB shares this hawkish take but we will know more on December 16, when the ECB is set to announce its plans for QE (PEPP and APP) going forward,'' the analysts at BBH argued.
- AUD/USD has gone sideways around 0.7300 in recent trade amid subdued conditions.
- Weak labour market data does not seem to be weighing on the Aussie too badly.
AUD/USD trading conditions have been calm since the start of the European session, with the pair swinging either side of the 0.7300 level over the last few hours. The pair is currently trading with on the day losses of about 0.5%, having slipped from above 0.7320 during Asia Pacific trading hours in a continuation of the downside it has been experiencing since Wednesday. To recap, the pair was sent tumbling from the upper-0.7300s in wake of a much hotter than expected US Consumer Price Inflation report that has pumped expectations for the Fed to start hiking interest rates sooner in 2022, and probably also to accelerate the pace of its QE taper at the start of next year.
Some market commentators cited the downbeat October labour market report released by the Australian Bureau of Statistics during Asia Pacific hours as a negative that weighed on the Aussie. The economy unexpectedly shed nearly 50K jobs on the month versus forecasts for a 50K employment gain and the unemployment rate spiked more than expected to 5.2% from 4.6% in September (versus an expected rise to 4.8%). But the weakness being experienced by AUD/USD is more a function of USD strength rather than localised Aussie weakness, with NZD and CAD experiencing even worse on the day losses versus the buck.
If the AUD/USD can break more convincingly below the 0.7300 level in the coming session, there is very little by way of notable support levels ahead of 0.7200. The most notable downside levels include the 29 September low at 0.7170 and then the August low at just above 0.7100.
Labour market to improve in November
According to MUFG, “the worsening of labour market conditions in October despite the easing of restrictions reflects in part the timing of the survey reference period that ended on 9 October”, prior to significant re-opening in New South Wales after 11 October and the start of re-opening in Victoria from 21 October. “As a result”, continues the bank “the November employment report should show a significant improvement in labour market conditions”. Credit Agricole add to this that “payrolls data suggest strong jobs growth in the second half of October; after lockdowns were eased”. Expectations for a November rebound in the labour market could thus be one reason why AUD is not underperforming its fellow risk/commodity-sensitive G10 peers on Thursday.
However, analysts broadly agreed that the weak labour market data, for now, endorses the RBA’s dovish message of no rates hikes into 2023. Furthermore, Credit Agricole expects that next week’s Australian wage data will likely also reinforce the RBA’s view. In terms of the outlook for the Aussie, MUFG are bearish; they think that 1) AUD STIR market pricing for 75bps of hikes in 2022 is excessive and the Fed will tigthten faster than the RBA, 2) the Aussie is likely to be exposed to the ongoing growth slowdown in China (which property sector woes are likely to worsen), 3) the Aussie is vulnerable to weakness in iron ore prices, which continue to fall back to pre-Covid-19 levels. “We expect AUD/USD to re-test key support at the 0.7200-level in the near-term”, concludes MUFG.
- XAG/USD extends its two-day rally, amid thin liquidity conditions, despite US dollar strength.
- Silver is rising as long as US Real Yields keep falling, sitting at -1.85 as of November 10.
- XAG/USD Technical outlook: If it breaks above the 200-DMA, a move towards $27.00 is on the books.
Silver (XAG/USD) climbs to three-week tops, advances 2%, trading at $25.20 during the New York session at the time of writing. The market mood is mild-risk on, as witnessed by US stocks fluctuating between gainers and losers amid thin liquidity conditions, with the US bond market closed in observance of the Veterans Day holiday.
Despite broad US dollar strength across the board, with the US dollar index rising above 95.00 for the first time since July 2020, the white metal keeps rising. Higher US inflation readings, topping above 6% for the first time in three decades, spurred flows towards precious metals, which have been an inflation hedge over time, so that’s why silver has advanced 4.90% in the last two days.
Furthermore, US T-bond nominal yield has risen as inflation rises, but real yields keep falling, sitting at -1.85 as of November 10. Therefore, as long as real yields fall, silver is tilted to the upside in the near term but has some strong resistance levels to overcome.
XAG/USD Price Forecast: Technical outlook
Daily chart
-637722485677127236.png)
XAG/USD is hovering around the midline of Andrew Pitchfork’s indicator. However, it is approaching a robust resistance area that would be difficult to surpass at the confluence of the 200-day moving average (DMA) at $25.32 and a downslope resistance trendline that passes near the 200-DMA.
If silver bulls break above the abovementioned, a move towards $27.00 is on the cards, but it would find some hurdles on the way north. The first resistance would be $26.00. A breach of that level would expose the July 6 high at $26.75, followed by the psychological $27.00.
On the flip side, failure at the abovementioned would open the door for a lower correction towards the 100-DMA at $24.12.
- NZD/USD extends its losses for the third consecutive day.
- No economic data from NZ and the US keep the pair trending in the dynamics of US dollar demand.
- Philadelphia Fed’s Harker argued that the Fed can raise rates while still tapering if necessary.
The NZD/USD slides for the third day in a row, down 0.36%, trading at 0.7034 during the New York session at the time of writing. Early in the Asian Pacific session, the New Zealand dollar capped its downfall for a couple of hours around the 0.7054-0.7071 range. However, it failed to gain traction amid a light NZ economic calendar before dropping towards 0.7000, driven by US dollar demand.
On Wednesday, US inflation rose to levels last seen in the 1990s. The Consumer Price Index (CPI) for October rose sharply to 6.2%, higher than the 5.3% foreseen. The so-called Core CPI that excludes volatile items like energy and food edged up to 4.6%, higher than the 4% estimated, per the US Labor Department.
“The transitory inflation argument is coming under increasing scrutiny, and the risk of a policy error on inflation has the potential to unsettle risk appetite,” per ANZ analysts In a report for customers. Further, the bank added that it seems inevitable that there would be upward revisions in inflation forecasts and in the dot plot when the Fed releases its Summary of Economic Projections (SEP) in the next meeting.
It is worth noting that Philadelphia Fed’s Harker argued that the Fed can raise rates while still tapering if necessary, adopting a tool that the Bank of England (BoE) would use as it begins to tighten economic conditions in the UK.
US Dollar Index breaks above 95.00 for the first time since July 2020
Meanwhile, the greenback successfully gains traction after the US CPI report, extending its lead against most G8 currencies. The US Dollar Index, which tracks the buck’s performance versus a basket of six rivals, advances 0.15%, breaking above 95 for the first time since July 2020, sitting at 95.03.
Therefore, for the remainder of the week, the NZD/USD price action will lie in the hands of US dollar dynamics and market sentiment. On Friday, the New Zealand economic docket will feature Business NZ PMI for October, with the previous reading at 51.4.
On the US front, the University of Michigan Consumer Sentiment Index for November will be revealed. Also, New York Fed’s President John Williams will speak at a virtual conference hosted by the New York Fed.
NZD/USD Price Forecast: Technical outlook
In the daily chart, the NZD/USD accelerated its downward move, but it was capped by the 0.7000 psychological support and the 100-day moving average (DMA) lying at 0.7023. Nevertheless, in the near-term still tilted to the downside, as the 50 and the 200-DMA stand above the spot price. Also, the Relative Strength Index (RSI) recently broke the 50-midline, sitting at 43, aiming lower, adding another bearish signal to the New Zealand dollar outlook.
However, to accelerate the downtrend, NZD/USD sellers will need a daily close below 0.7000. In that outcome, the next support would be 0.6950, followed by an upslope trendline that travels from August lows towards September lows, lying around the 0.6920-30 area.
- XAU/EUR has continued its run higher and is now above $1620 amid continued inflation fears.
- Bullish technicians will now target a move towards Q4 2020 highs at $1650.
Since breaking above key resistance at $1590 (the prior 2021 high) and then the psychologically important $1600 level on Wednesday in wake of a much hotter than expected US inflation report, XAU/EUR has continued to advance. Euro-denominated spot gold prices now trade to the north of $1620, with further gains of about 0.7% on the day (after rallying nearly 2.00% on Wednesday). Now that XAU/EUR has cleared prior year-to-date highs and the $1600 level, bullish technicians will set their sights on the next key area of resistance, which comes in the form of the Q4 (November) 2020 highs at just above $1650.

Since bouncing from its 50-day moving average on 3 November all the way down at $1520, euro-denominated spot gold prices have surged nearly 7.0%. That coincides with a sharp downturn in Eurozone (and global) real yields; German 10-year inflation-linked bond yields are down more than 20bps from above -1.80% (on 3 November) to current levels below -2.0% and hit fresh record lows earlier in the week at -2.09%. Lower real yields on bonds reduce the opportunity cost of holding non-yielding precious metals.
Inflation anxiety
Record low long-term real yields in the Eurozone (and not far from record lows in the US) also reflect a market view that central banks are going to keep their monetary policy settings highly accommodative over the coming years, despite the sharp uptick in global inflationary pressures in recent months. There are going fears that this might constitute a policy mistake; i.e. that central banks might make a dovish policy mistake and not normalise monetary policy setting quickly enough to tame inflationary pressures.
Such fears were ignited by Wednesday’s US inflation report and prompted a number of high-profile market commentators and investment advisors to call for the Fed to abandon its insistence that inflationary pressures are transitory and to accelerate the timeline of monetary policy normalisation (i.e. the QE taper and then rate hikes). In light of heightened inflation fears, it is not surprising to see investors flock to assets that provide inflation protection, such as precious metals and inflation-linked bonds.
- Technical indicators in GBP/JPY still favors the downside.
- While under 153.00, the pound looks vulnerable to more losses.
The GBP/JPY failed to recover 153.75 and dropped back under key short-term moving averages, and currently, it stands under 153.00, at one-month lows, looking vulnerable.
The pound needs to quickly recover 153.00 in order to alleviate the bearish pressure. The negative tone will continue to prevail, while below 153.75. If the pound manages to rise above the mentioned level, it could have established an interim bottom. Above the next resistance is seen around 155.00.
While below 153.00 (horizontal level, and also the 21-SMA in four hour chart) more losses seems likely. The potential target is the 152.25 zone. If the decline continues, under 152.00 there is a strong support area at 151.60 that should limit the downside. A rebound from 151.50/60 seems likely, favoring a pause in GBP/JPY slide, before another leg lower.
GBP/JPY 4-hour chart
-637722433025534514.png)
On Thrusday, the Bank of Mexico (Banxico) will announce its decision on monetary policy. Market consensus points to a 25bp rate hike while some analysts see a 50bp hike. Analysts at Wells Fargo side with financial markets and expect a 50 bps rate hike; however, should consensus be proved accurate, the Mexican peso could come under pressure in the immediate aftermath of the meeting.
Key Quotes:
“Should consensus economists prove accurate and Banxico lift rates only 25 bps, we would expect the Mexican peso to selloff sharply and USD/MXN to push toward the MXN20.75 level. On the other hand, should the central bank lift rates 50 bps and maintain a similar level of concern over inflation as we expect, the peso reaction could be more muted. Should our base case scenario unfold, we would expect the Mexican peso to settle back to pre-policy rate announcement levels as we believe financial markets are priced for this scenario.”
“In a nod to our fellow international economists, we do feel financial markets are priced for too aggressive tightening between now and the end of this year. Right now, markets are priced for 100 bps of tightening before the end of 2021. In our view, following a 50 bps hike on Thursday, policymakers are likely to slow the pace of tightening and lift the Overnight Rate only 25 bps in December. Our less hawkish view relative to market pricing is key a rationale behind our medium-term view for Mexican peso weakness.”
“As financial markets adjust to a more gradual pace of tightening after the November meeting, we would expect downward pressure on the peso to build and for the currency to weaken into the end of 2021.”
- US dollar holds onto recent gains after US CPI data.
- Holiday in the US, bond market closed.
- USD/JPY recovers critical technical level above 113.40.
The USD/JPY is moving sideways on Thursday in neutral territory near 114.00. Earlier it climbed to 114.17, reaching the highest level in a week, and then pulled back. The pair is holding onto Wednesday’s gains when it climbed from under 113.00 to 114.00.
The rally of the US dollar across the board and higher US yield boosted USD/JPY. The US bond market is closed on Thursday due to a holiday in the US. If the decline in Treasuries continues, the pair could extend gains. The moves were triggered by higher-than-expected inflation readings in the US.
Short-term outlook
The USD/JPY is back into the prior range between 113.40 and 114.40. The recovery above 113.40 eased the bearish pressure. On the upside, the pair faces a strong barrier around 114.20/40. A consolidation above should clear the way to more gains and to a test of the YTD highs near 114.70.
A slide back under 113.30 should weaken again the USD/JPY, favoring a bearish correction. The next support stands at 113.00 followed by the weekly low at 112.70.
Technical levels
- USD/CAD is trading sharply higher on Thursday and eyeing a test of the 1.2600 level after surging above 1.2480 resistance.
- The pair is seeing some belated outperformance in wake of Wednesday’s hot US CPI report.
USD/CAD is seeing some overdue outperformance on Thursday. In wake of a much stronger than expected US Consumer Price Inflation (CPI) report on Wednesday, the US dollar surged against the majority of its G10 counterparts, but the loonie was largely spared at the time. That’s because, as USD/CAD attempted to push higher, it ran into a wall of resistance around the 1.2480 level in the form of recent highs and its 200-day moving average. In the end, USD/CAD ended the session just 0.4% higher (versus much larger moves in the likes of GBP/USD, EUR/USD and USD/JPY).
As trading volumes picked up during Asia Pacific hours, the pair was finally able to break to the north of the key area of resistance and has subsequently shot above the 1.2500 level, the 50DMA at 1.2535, and is currently closing in on the 1.2600 mark. Oil prices dropped sharply on Wednesday amid fears that higher US inflation would prompt the Biden administration to release crude oil reserves to combat high energy costs. Though prices are a little higher on Thursday, they still remain some way off from recovering back to pre-CPI data levels, thus crude oil weakness is one reason the loonie is dropping sharply on Thursday.
Another reason for loonie underperformance is that, in wake of the US CPI data, the Canadian rate advantage over the US has been slightly eroded (as traders up their bets on a more hawkish Fed in 2022). US 5-year government bond yields saw a 14bps surge to 1.22%, while the Canadian 5-year rose 10bps to and was unable to move back above 1.50%. Government bond and short-term interest rate (STIR) markets still price a much more hawkish BoC when compared to the Fed.
But there is a growing throng of economists/analysts who are starting to believe that this view is wrong. According to CIBC, “markets have overpriced Bank of Canada (BoC) action in 2022, and underestimated the Federal reserve post-2022”. “A recalibration”, continues the bank, “will leave the CAD out of favor with investors”, before concluding “we see USD/CAD drifting above the 1.30-mark next year, as it becomes clear that Canada's central bank will not be outgunning the Fed”.
The Norwegian krone has proved the top performing major versus the USD and EUR over the last year. Key to the outperformance has been monetary tightening byt the Norges Bank, which is set to continue supporting NOK, economists at CIBC Capital Markets report.
Oil prices to reverse some of its gains in 2022
“We look for another 25bps tightening to come at the 16 December meeting, in line with the updated Monetary Policy Report.”
“While the macro rebound and uptick in the oil sector are seen to justify policy action, the obvious differential between the Norges Bank and most other major central banks is that the tightening cycle is framed by an inflation profile which is set to remain below target over the forecast horizon.”
“Our global base case has crude oil prices reversing some of its gains in 2022, which could have the central bank pushing back a bit on the degree of tightening ahead.”
“Although we continue to expect NOK gains versus the EUR, they are set to be less aggressive in the next 12 months compared to the last.”
- AUD/USD extends its sharp decline for three days, from 0.7430 to 0.7300.
- Australian Employment Change dropped 46.3K, and the unemployment rate jumped above 5%.
- AUD/USD Technical outlook: A break under 0.7300 exposes the September 30 low at 0.7169.
The Australian dollar slides for the third consecutive day, down 0.25%, trading at 0.7309 in the New York session at the time of writing. The AUD/USD traded within the 0.7314-40 range during the APAC session, but Australian economic data spurred the downfall.
Australian Employment Change dropped 46.3K, and the unemployment rate jumped above 5%
On Thursday, the Australian economic docket featured the Consumer Inflation Expectations for November, which rose 1% higher than in October, up to 4.6%, from 3.6% in October. The market ignored that data, but employment figures collapsed, triggering a sell-off on the pair. The Australian Bureau of Statistics revealed that Employment Change for October fell 46.3K, sharply lower than the 50K rise expected by analysts, spurring a jump in the Unemployment Rate, from 4.7% to 5.2%.
It is worth noting that the jobs survey was taken from September 26 to October 9, when lockdown restrictions in New South Wales were just being eased, while Victoria state was still lockdown.
Meanwhile, the US economic docket reported US inflation figures, which jumped above 6% for the first time in 30-years. It seems that AUD/USD traders priced in the move, as witnessed by price action stabilizing around the 0.7300-40 range. On Thursday, the US economic docket is light due to the observation of the US Veterans Day Holiday.
AUD/USD Price Forecast: Technical outlook
-637722394496178044.png)
The daily chart shows that the pair tests the 0.7300, extending the downward move to three days. On its way down, it broke the 50 and the 100-day moving averages (DMA’s), which in tandem with the 200-DMA, indicates the AUD/USD pair has a downward bias.
On the way down, the first support level to break is 0.7300. A breach of the latter would expose the September 30 low at 0.7169, but an upslope trendline that travels from August 20 low towards the September 30 low, lie around the 0.7230-50 range, and act as support before reaching the September 30 low.
- USD/TRY extends the rally to the vicinity of 10.0000.
- The loses around 25% vs. the greenback so far in 2021.
- The CBRT meets on November 18 and could reduce rates further.
The Turkish lira depreciates to fresh all-time lows vs. the greenback and pushes USD/TRY to the boundaries of the psychological 10.0000 mark on Thursday.
USD/TRY: The 10.00 yardstick is around the corner
USD/TRY advances for the third consecutive session so far on Thursday against the backdrop of the relentless move higher in the US dollar.
In fact, spot picked up further pace as of late following the higher-than-expected US inflation figures during October (published on Wednesday). The 30-year spike in the US CPI rapidly ignited speculations over a sooner rates lift-off by the Fed, exactly the opposite situation to what is happening in Turkey.
Indeed, the Turkish CPI rose to nearly 20% in October vs. the same month of 2020… and the Turkish central bank (CBRT) surprised markets with a shocking 200 bps reduction of the One-Week Repo Rate.
That said, while the next CBRT meeting on November 18 remains a close call (ish), another interest rate cut by the central bank should not surprise anybody and could open the door to USD/TRY to challenge… the moon?.
USD/TRY key levels
So far, the pair is gaining 0.71% at 9.9125 and a drop below 9.5581 (20-day SMA) would expose 9.4722 (monthly low Nov.2) and finally 9.4128 (weekly low Oct.26). On the other hand, the next up barrier lines up at 9.9723 (all-time high Oct.25) followed by 10.0000 (psychological level).
The strong US inflation print has catalyzed a meaningful breakout in gold prices. Strategists at TD Securities believe that the yellow metal is set to extend its advance on a close above the $1,860 level.
The breakout in gold has attracted new buyers
“The breakout has driven the China Smart Money group of funds to add a significant amount of new length in SHFE gold. Considering that Shanghai gold net length remains near multi-year lows, a change in sentiment, potentially driven by the technical breakout, could attract a significant amount of buying interest from this cohort.”
“With US real yields plummeting, the tides could sway the persistent waves of ETF sellers to add length.”
“Gold prices need only close north of $1,860/oz to catalyze further CTA long acquisitions, which should cement a more supportive trend.”
“After all, our ChartVision framework, which stress-tests 75 technical indicators to identify the critical threshold for a change in trend, suggests that with gold prices north of $1,845/oz, an uptrend in gold should form by March 2022.”
- Wall Street's main indexes trade in the positive territory on Thursday.
- Technology shares rebound after suffering heavy losses on Wednesday.
- CBOE Volatility Index is down nearly 6% after the opening bell.
After falling sharply amid heightened inflation fears on Wednesday, major equity indexes in the US managed to open in the positive territory on Thursday. Reflecting the improving market mood, the CBOE Volatility Index, Wall Street's fear gauge, is down nearly 7% on the day.
Bond markets in the US will remain closed due to the Veterans Day holiday and the action in stock markets could remain subdued for the remainder of the day.
As of writing, the S&P 500 Index was up 0.2% at 4,655, the Dow Jones Industrial Average was little changed at 36,015 and the Nasdaq Composite was rising 0.6% at 15,728.
Among the 11 major S&P 500 sectors, the risk-sensitive Technology Index is up 0.5% following Wednesday's slump. On the other hand, the defensive Real Estate Index is losing 0.3%.
S&P 500 chart (daily)
There is growing talk of the EU suspending its trade deal with the UK, should the British government make unilateral wholesale changes to the Northern Ireland protocol. However, fresh Brexit uncertainty may actually not have as big a market impact as perhaps presumed. Economists at ING expect EUR/GBP near 0.8500 at year-end.
The return of Brexit may not be dramatic for sterling
“On paper then, an increased layer of uncertainty and the reintroduction of a negative economic tail risk is bad news for UK markets. But there are a few reasons why the return of Brexit may not be dramatic for sterling.”
“Could another round of Brexit headlines demand the kind of 5% 'no deal' risk premium seen in 2019? We suspect the impact on GBP is more muted this time around.”
“With UK CPI heading to the 5% area into April, keeping BoE tightening prospects on the front-burner, we are happy with an end-year EUR/GBP target near 0.8500, and lower levels as 2022 progresses.”
- WTI is consolidating either side of the $81.00 level, having slipped sharply on Wednesday in wake of hot US CPI.
- The inflation data has triggered worries that the Biden administration might release crude oil reserves to lower prices.
Oil prices are consolidating on Thursday ahead of the US open, with front-month futures contracts of the American benchmark for sweet light crude oil, called West Texas Intermediary or WTI, swinging either side of the $81.00 per barrel mark. Subdued trading conditions are not too surprising given thin liquidity conditions in US markets, which are partially closed on Thursday in observance of the Veteran’s Day holiday (bond markets are closed, but equity and futures markets are open).
Thursday’s consolidation comes after a sharp drop on Wednesday. WTI fell more than $3.00 on the session, pulling back from intra-day peaks at $85.00 per barrel to end the session at $81.28. With crude oil now having failed to break above the $85.00 on multiple occasions over the past few weeks, this level may now form the ceiling of a new range. The bottom of that range might well be last Wednesday’s lows in the $78.00s. As traders await further clarity on US energy policy (how will the Biden admin address high prices) and the state of the demand recovery (lockdown chatter in the EU is a worry and may hit demand over winter), rangebound conditions may prevail.
Biden to release crude reserve amid high inflation?
The sell-off on Wednesday was triggered by a much hotter than expected US Consumer Price Inflation report for October, which showed headline inflation surpass 6.0% on a YoY basis and almost hit 1.0% on a MoM basis.
Rising energy prices made up a significant component of the sharp jump in US consumer prices. Speculation is now swirling that the report has increased the likelihood that the Biden Administration opts to release reserves from the Strategic Petroleum Reserve (SPR) as a way of pushing down energy prices. In response to Wednesday’s inflation report, President Joe Biden said that dealing with inflation was a top priority for his administration and that he had asked the White House National Economic Council to pursue means to reduce energy costs.
Note that high inflation is the main reason why Biden’s approval rating has been dropping in recent months. This is already impacting Democrat election performance ahead of the November 2022 mid-term elections (an underdog Republican candidate for Virginia Governor secured an easy win earlier in the month). That gives Biden a strong incentive to do all he can to lessen inflationary pressures in the US, especially the rise in energy costs.
EUR/RUB is likely to revisit the 80.38/79.03 October low and 200-week moving average provided that 86.60 caps before rising in Q1 2022, Axel Rudolph, Senior FICC Technical Analyst at Commerzbank, reports.
EUR/RUB to slide to the 80.38/79.03 zone
“EUR/RUB’s descent eyes the 80.38/79.03 October low and 200-week moving average while the June-to-August lows and mid-September high at 85.75/86.60 cap.”
“Should the 80.38/79.03 support zone give way, we would have to allow for the 55 month moving average, June 2020 low and 2013-2021 uptrend line at 77.69/75.26 to be hit. The latter we expect to hold throughout the remainder of this year and during 2022, though. From there another uptrend should begin in Q1 2022.”
“For a bullish reversal to occur before 2022 not only the recent minor highs at 83.66/70 would need to be exceeded but also the above mentioned 85.75/86.60 resistance area. Stronger resistance can be found between the 200-day moving average at 87.42 and the July 2021 high at 89.05. This area may well be reached during 2022 when the 2020 uptrend is expected to resume.”
- EUR/JPY loses further momentum and drops to 4-week lows.
- The cross meets support around the key 200-day SMA.
- The rebound in the greenback pushed DXY above 95.00.
The intense upside momentum in the greenback puts the risk complex under further pressure and forces EUR/JPY to extend the losses to the 130.40 region.
EUR/JPY focuses on the 200-day SMA near 130.40
EUR/JPY drops and navigates the area of multi-week lows in the 130.50/40 band on Thursday, all against the backdrop of the persistent move higher in the dollar.
Indeed, and with the US bonds markets closed, the Japanese yen maintains a steady performance so far in the session, while the unabated offered stance in the single currency – and the rest of the risk galaxy – drags the cross lower.
So far, the critical 200-day SMA appears to be holding the downside for the time being, while a breach of this area on a sustainable fashion might prompt investors to shift the outlook to negative in the short-term horizon.
Nothing of note data wise on both sides of the ocean, although the European Commission (EC) updated its Macroeconomic Projections and now sees the euro area expanding 5% this year and 4.3% in 2022; when it comes to inflation, prices are seen rising 2.4% this year and 2.2% in the next one.
EUR/JPY relevant levels
So far, the cross is losing 0.14% at 130.54 and a surpass of 131.51 (38.2% Fibo of the October upside) would expose 131.95 (20-day SMA) and then 132.56 (monthly high Nov.4). On the downside, the next support comes at 130.43 (200-day SMA) followed by 130.25 (100-day SMA) and finally 129.43 (78.6% Fibo of the October upside).
- AMD stock fell heavily in both Tuesday and Wedneday sessions.
- AMD rocketed over 10% on Monday after re-named Facebook said it would use their processors in its data centers.
- Recent upgrades have moved its consensus price target up to $140.51.
Advanced Micro Devices (AMD) saw its stock tank 6.1% on Wednesday to $139.87. It was a bad showing and erased much of Monday's 10% run-up that came from the chip makers' new business relationshiop with Meta Platforms (FB). AMD stock is up 1.8% to $142.38 in Thursday's premarket at the time of writing.
Advanced Micro Devices (AMD) Stock News: new business deal with IBM
IBM's cloud division has chosen AMD's 3rd Gen AMD EPYC processors for its IBM Cloud Bare Metal Servers that it retails in it cloud catalog. The new server offering from IBM features 128 cores, up to 4TB of memory and 10 NVMe drives per server.
“Our customers have a high demand for computing processing power and the new 3rd Gen AMD EPYC processors provide the high levels of performance and scalability we were looking for,” said Suresh Gopalakrishnan, vice president, IBM Cloud.
According to the press release, "The server configuration with AMD's processors are particularly good for compute-intensive workloads, virtualized environments, large-scale databases" and hosting massive multiplayer online games.
AMD key statistics
| Market Cap | $181.3 billion |
| Price/Earnings | 46.2 |
| Price/Sales | 12.4 |
| Price/Book | 25.4 |
| Enterprise Value | $178.3 billion |
| Operating Margin | 20.5% |
| Profit Margin | 26.7% |
| 52-week high | $155.57 |
| 52-week low | $72.50 |
| Short Interest | 5.8% |
| Average Wall Street Rating and Price Target | Hold $140.51 |
Advanced Micro Devices Technical Analysis: chart shows AMD stock back at support
With two plunging daily candles in a row, AMD stock is down near support. The 9-day moving average is now at $137.68, and the 21-day moving average is a bit lower at $126.74. Thursday's premarket higher prices, however, make it appear as if there may be renewed bullish price action today.
From Wednesday: "On the other side of things, if AMD stock breaks above the top trend line of the ascending price channel at $155.28, expect a further run-up to take place. On Monday, AMD's swing high price bounced down from the 361.8% Fibonacci retracement at $153.71. On Tuesday, it opened just above it, which would lead one to believe that level has some significance. AMD stock price needs to surmount this level first before taking on the 423.6% Fibo at $162.96.
FXStreet is sticking with this. Closing above $155.28 is still the target for bulls. Tuesday's all-time high of $155.57 tried its best, but too many traders were using that top trend line as a target to take profit. Note that the Relative Strength Index (RSI) is now down to 69, just out of overbought territory. Additionally, the consensus price target is now $140.51 on Wall Street, which may keep some more conservative investors from buying as much in this price range.

AMD 1-day chart
- Gold gained traction for the sixth successive day and inched back closer to multi-month tops.
- Hawkish Fed expectations, sustained USD buying held back bulls from placing aggressive bets.
- The technical set-up supports prospects for an extension of the recent strong upward trajectory.
- Gold Price Forecast: XAU/USD has more room to rise after US inflation-led explosion
Gold attracted fresh buying on Thursday and climbed to the $1,865 region during the mid-European session, albeit lacked any follow-through. The intraday uptick stalled just ahead of five-month tops touched in reaction to hotter-than-expected US consumer inflation figures on Wednesday. In fact, the headline US CPI rose at the fastest annual pace since 1990 and fueled buying interest in precious metals, which is a proven long-term hedge against rising prices.
However, rising bets for a more aggressive Fed policy response to contain stubbornly high inflation might cap gains for the non-yielding yellow metal. In fact, the Fed funds futures market indicate that the first-rate hike could come as soon as July 2022. This was reinforced by the overnight massive rally in the US Treasury bond yields. This, along with a stronger US dollar, acted as a headwind for dollar-denominated commodities, including gold.
Meanwhile, the downside remains cushioned amid the prevalent cautious mood around the equity markets, which tends to benefit the safe-haven gold. Nevertheless, the precious metal, so far, has managed to hold in the positive territory for the sixth successive day. That said, bulls might refrain from placing aggressive bets, rather prefer to wait for a fresh catalyst amid relatively thin liquidity on the back of a bank holiday in the US.
Even from a technical perspective, RSI (14) on the daily chart has just moved above the 70 mark, indicating a slightly overbought condition. This further warrants some caution before positioning for any further appreciating move for gold prices, at least for the time being.
Technical outlook
From a technical perspective, the emergence of fresh buying on Thursday and acceptance above the $1,850 level favours bullish traders. This comes on the back of the previous day's decisive break through the $1832-34 supply zone and supports prospects for additional gains. Hence, some follow-through strength towards testing an intermediate hurdle near the $1,886-87 region, en-route the $1,900 mark, remains a distinct possibility.
On the flip side, the daily swing lows, around the $1,843-42 area, now seems to protect the immediate downside. Any subsequent decline could attract some dip-buying near the $1,834-32 strong resistance breakpoint, which should now act as a strong base for gold. Failure to defend the mentioned levels might trigger some long-unwinding and drag spot prices towards the next relevant support near the $1,815 horizontal zone.
Technical levels to watch
- GBP/USD is consolidating around 1.3400, just above year-to-date lows printed earlier in the session.
- Worse than expected UK GDP data did little to impact GBP amid subdued Thursday trading conditions due to Veteran’s Day.
Having briefly dipped to fresh year-to-date lows in the 1.3360s earlier in the session, GBP/USD is currently consolidating either side of the 1.3400 level. Trading conditions will likely be subdued on Thursday given the fact that US markets are partially closed in observance of Veteran’s Day (bond markets are closed, but future and equity markets are open).
That will give traders some respite after a hectic session on Thursday that saw the USD push higher across the board following a much hotter than expected Consumer Price Inflation report for the month of October. That report, and the subsequent surge in US bond yields/hawkish repricing of USD short-term interest rate markets, sent GBP/USD cratering from above 1.3500 to current levels more than 100 pips lower.
UK economic data out on Thursday morning did little to help GBP’s cause. The preliminary estimate of Q3 GDP growth was a tad weaker than expected at 1.3% QoQ, a sharp slowdown from the 5.5% QoQ growth rate in Q2. September Manufacturing and Industrial Production data was also soft.
Now that GBP/USD has broken to the south of key support in the form of the prior year-to-date lows in the 1.3415-25 region, bearish technicians will be marking out their next target levels. One such level could be the 38.2% Fibonacci retracement back from the 2021 highs (at around 1.4250) to the 2020 lows (at around 1.1420), which resides close to 1.3170.

Brexit
There has been more Brexit newsflow on Thursday, as talks between UK, EU and French officials over the issues of Northern Ireland and fishing access rumble on. UK PM Boris Johnson is set to meet French President Emmanuel Macron on Friday, reported UK press on Thursday, likely to discuss the latter issue. Meanwhile, UK press also reported on Thursday that the EU is willing to make an improved offer to the UK regarding border checks on goods moving across the Northern Ireland border. Whether this will be enough to prevent the UK from triggering Article 16 and escalating trade tensions with the EU remains to be seen.
CIBC thinks that a “slowing macro environment and relatively contained inflation expectations point towards a less aggressive rate cycle” from the BoE. The bank adds that “the risk of advancing UK/EU trade frictions also points towards increasing GBP headwinds into early 2022”, before concluding that “as a consequence, we have revised down our sterling outlook and forecast GBP/USD at 1.33 by year-end”.
GBP/USD is breaking below its 1.3424/11 lows. This reinforces the core bearish view of the Credit Suisse analyst team, with next support at 1.3277, then 1.3189/35.
Resistance moves to 1.3607
“With the market breaking lower, remaining well below (falling) key moving averages and with weekly MACD momentum still picking up pace, our core bias stays bearish for a deeper move lower.”
“We look for a move to 1.3277 next, before an eventual fall to 1.3189/35, which is the major cluster of supports including the 200-week average and 38.2% retracement of the 2020/21 rise. We would expect this zone to be a tough barrier, however, we note that the next support is seen at 1.3106.”
“The pair should now ideally remain capped below the 1.3411/3433 lows into the daily close to maintain this latest breakdown. Next resistance thereafter is seen at 1.3565/3607.”
Markets have overpriced Bank of Canada (BoC) action in 2022, and underestimated the Federal reserve post-2022. A recalibration will leave the CAD out of favor with investors, economists at CIBC Capital Markets report.
Tempering of market BoC optimism to unravel CAD gains
“With the BoC redefining the output gap to exclude capacity temporary offline due to supply chain and other disruptions, we pulled forward our forecast for BoC tightening, and we now see the Bank raising rates starting in Q3 2022, with an additional 25bps hike in Q4, and 75bps of hikes in 2023. But that remains well below what the market has priced in.”
“With the US seeing more wage and price inflation, and ahead of Canada in its GDP recovery, we have the Fed hiking a bit more than the BoC (150bps in total) over 2022-23.”
“We see USD/CAD drifting above the 1.30 mark next year, as it becomes clear that Canada's central bank will not be outgunning the Fed, and as oil prices retreat from recent highs.”
“Softer crude prices and a return to Canada's usual travel deficit as tourism restarts will weigh on the country's trade balance, which has been supportive for the loonie in recent quarters.”
In its monthly report published on Thursday, the Organization of the Petroleum Exporting Countries (OPEC) announced that it lowered the 2021 world oil demand growth forecast by 160,000 barrels per day (bpd) to 5.65 million bpd. OPEC cites slowing demand growth in China and India as the primary reason behind that decision, per Reuters.
Additional takeaways
"OPEC lowers Q4 2021 world oil demand forecast by 330,000 bpd to 99.49 mln bpd, citing the impact of ‘elevated’ energy prices."
"OPEC keeps 2022 world oil demand growth forecast unchanged."
"OPEC raises forecast for 2022 US tight oil output growth to 610,000 bpd (prev. forecast 410,000 bpd); leaves total 2022 non-OPEC supply growth unchanged."
"OPEC says its oil output rose by 220,000 bpd in October to 27.45 million bpd."
"OPEC lowers 2022 forecast for global demand for its crude by 100,000 bpd to 28.70 million bpd."
Market reaction
Crude oil prices showed no immediate reaction to this report and the barrel of West Texas Intermediate was last seen losing 0.8% on the day at $80.64.
EUR/USD saw a dramatic fall on Wednesday, breaking below the key support zone at 1.1495/93 – the March 2020 high and 50% retracement of the 2020/2021 bull trend. This should trigger a resumption of the core downtrend, with next short-term support at 1.1370, with scope for 1.1290 over the medium-term, in the view of economists at Credit Suisse.
Resistance moves lower to 1.1513/24
“EUR/USD has finally broken decisively below major support at 1.1495/93, which significantly reinforces our core bearish view. This breakdown itself came on the back of a rejection from key resistance from its falling 55-day average (and downtrend from June) at 1.1670/95, with a major top also remaining in place, which is still the key technical feature. Furthermore, short-term momentum is re-accelerating.”
“We look for a resumption of the core downtrend, with the next minor support seen at 1.1377/70, before the 61.8% retracement at 1.1300/1.1290, where we would expect to see another pause.”
“Near-term resistance moves to 1.1513/24, which ideally caps to keep the market biased directly lower. Next resistances are seen at 1.1609/18, then more importantly at 1.1670/95.”
- USD/CHF gained strong follow-through traction for the second successive day.
- Hawkish Fed expectations underpinned the greenback and remained supportive.
- The stage now seems set for a move towards reclaiming the 0.9300 round figure.
The USD/CHF pair built on its steady intraday ascent and climbed back above the 0.9200 mark, or over two-week tops heading into the North American session.
The pair built on the previous day's bullish breakout momentum through a one-week-old trading range and gained strong follow-through traction for the second successive day on Thursday. The momentum was sponsored by sustained buying interest surrounding the US dollar, which shot to the highest level since July 2020 amid prospects for an early policy tightening by the Fed.
The US CPI report released on Wednesday showed that consumer prices in October rose at the fastest annual pace since 1990. This, in turn, encouraged bets that the Fed would be forced to adopt a more aggressive policy response to contain stubbornly high inflation. In fact, the Fed funds futures market indicate that the first-rate hike could come as soon as July 2022.
Meanwhile, the repricing of the likely timing over the Fed's next policy move triggered a massive rally in the US Treasury bond yields. This was seen as another factor that continued acting as a tailwind for the greenback and pushed the USD/CHF pair higher. The momentum took along some trading stops near the 0.9200 mark and might have set the stage for additional gains.
That said, relatively thin liquidity conditions, on the back of a bank holiday in the US and Canada, warrant some caution for aggressive bullish traders. Nevertheless, the fundamental backdrop supports prospects for a further near-term appreciating move towards testing the next relevant hurdle near the 0.9235-40 region. Bulls might eventually aim to reclaim the 0.9300 mark.
Technical levels to watch
Ireland’s Foreign Minister Simon Coveney said on Thursday that there is still some time to make sure that negotiations on the Northern Ireland protocol will work, as reported by Reuters.
Meanwhile, the Telegraph reported earlier in the day that the European Union was ready to improve the offer to reduce customs checks at the Northern Ireland border.
Market reaction
This headline doesn't seem to be helping the British pound find demand. As of writing, the GBP/USD pair was virtually unchanged on a daily basis at 1.3402.
On a trade-weighted basis, the USD has been consolidating over the past month. With the Fed's QE tapering expected to end in mid-2022, rate hikes will quickly commence, and markets should start to price in more from the Federal Reserve post-2022, helping the dollar to maintain its dominance, according to economists at CIBC Capital Markets.
Green light for the greenback as Fed enters steep tapering cycle
“We are still circumspect with the degree to which the smaller DM central banks are being priced for next year, and would expect that corrective moves there should buttress the USD even more in the quarters ahead.”
“The Fed has begun to taper its monthly asset purchases. We are still of the view that the additional supply for the market will lead to higher nominal yields in the long-end and further support the USD.”
“Extant positioning in the FX market still implies that the USD is already the favoured long. This represents a risk to our view in the near-term. Nonetheless, positioning in the FX market is generally a tactical theme and we would still view any USD weakness as an opportunity to layer into opportunistic hedges, especially for those that are adversely impacted by a stronger USD over the long-term.”
Coffee prices have traded to the highest levels since 2014. A tight coffee market should continue to support prices. Meanwhile, large cocoa stocks suggest upside for cocoa prices is limited despite a deficit in 2021/22, strategists at ING report.
Diverging trends for coffee and cocoa
“For the 2021/22 coffee year, demand is expected to outstrip supply. This will be driven by a combination of further growth in demand, along with a Brazilian crop weighed down by frost and possibly drought. However, much will depend on precipitation in the coming months. The expectation of a deficit in 2021/22, uncertainty on how big this deficit may be and continued logistical issues globally suggest that prices should remain well supported.”
“Inventories and 2021/22 output should ensure that demand this season is easily met, without putting significant upside pressure on cocoa prices. While prices are likely to be supported due to the market drawing inventories over 2021/22, the level of stock suggests upside will be limited over the course of next year.”
- EUR/USD is consolidating around 1.1475 after hot US CPI sent it crashing under 1.1500 on Wednesday.
- USD STIR markets have seen hawkish re-pricing as traders bet on more rate hikes in 2022 from the Fed.
Ahead of the start of what is expected to be a very quiet US session, given that markets there are partially closed in observance of Veteran’s Day, EUR/USD is consolidating around the neutral mark on the day around 1.1475. The pair crashed to fresh year-to-date lows under the 1.1500 level on Wednesday in wake of a much hotter than expected US Consumer Price Inflation report that sent US bond yields and inflation expectations surging and forced USD short-term interest rate (STIR) markets to up their hawkish bets. In doing so, EUR/USD broke below a key level of support in the form of the March 2020 high at just under 1.1495.
Wednesday’s 1.0% decline was actually the second time the pair had dropped by that much in the last two weeks (EUR/USD also saw a 1.0% drop on 29 October). Nonetheless, that made it the joint largest drop since June. To the downside, the next key area of support is the 10 June 2020 high at around 1.1420.
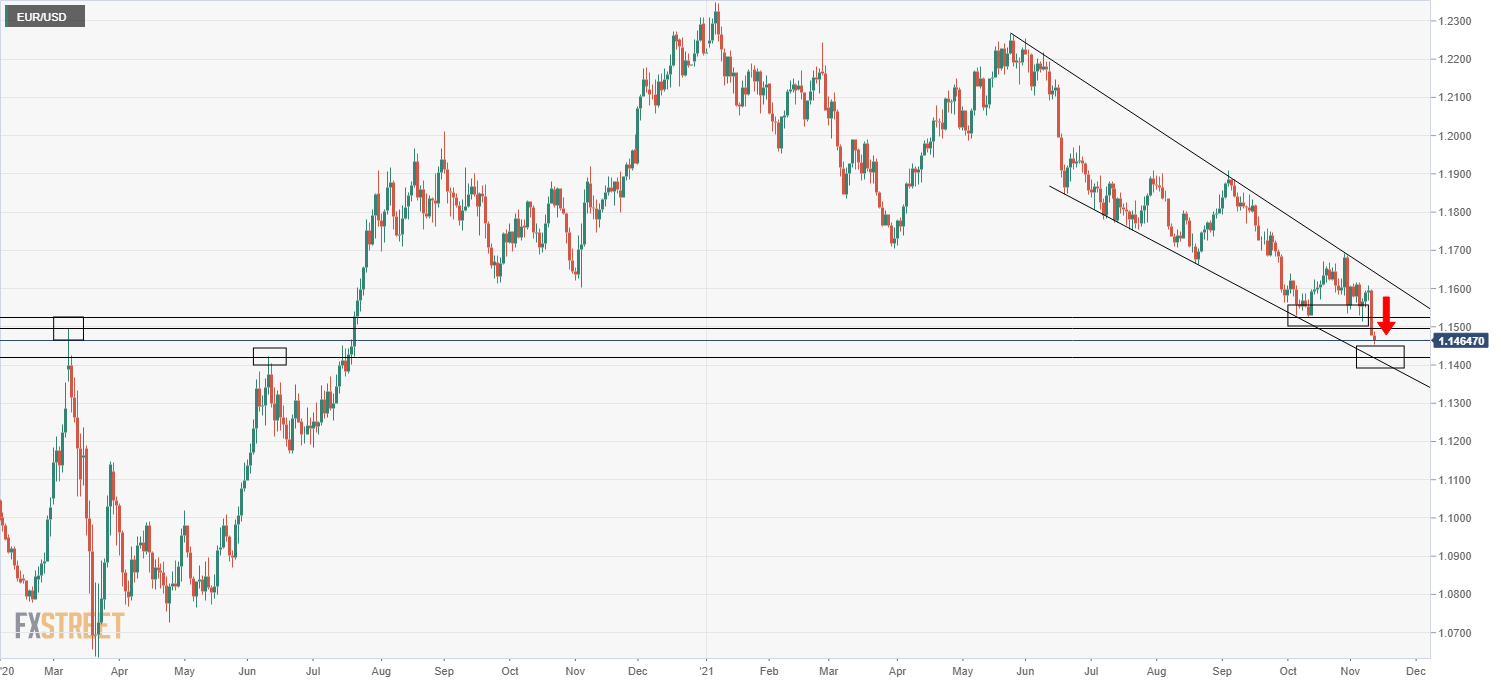
Markets bet on Fed rate hikes
Wednesday’s inflation data triggered a significant hawkish repricing in USD STIR markets. The December 2022 eurodollar future (a proxy for where markets expect the Federal Funds rate to be next December) dropped to fresh lows for the year at one point on Thursday morning of under 99.05 (implying a Federal Funds rate at 0.95% by the year’s end), down from above 99.20 at the start of the week. Euro STIR markets have also seen a modest hawkish repricing, but nothing as large as in US markets. December 2022 Euribor futures (a proxy for where markets expect the ECB’s deposit rate to be next December) has dropped to around 100.25 from under 100.35 earlier in the week.
EZ/US rate differentials have thus moved substantially in the dollar’s favour since the inflation report, as also seen by a 5bps widening of the US/Germany 2-year yield differentials during Wednesday’s session. Hence, it is no surprise to see the dollar support right now.
CIBC, who think the ECB are likely to leave interest rates on hold well into 2023, comments that this “policy gap (between the ECB and Fed) underscores why we continue to favour EUR underperformance versus the USD, and look for EUR/USD retreating towards 1.10 in 2022”.
- EUR/USD plummets well below the 1.1500 mark on Thursday.
- Further selling could see the 1.1422 level revisited near term.
EUR/USD drops further and clinches new YTD lows in the 1.1450 region in the second half of the week.
The continuation of the downtrend appears favoured in the short-term horizon. Against this, and if the pair clears the YTD low at 1.1453, the focus of attention is expected to gyrate to the June 2020 high at 1.1422 (June 10).
In the meantime, extra losses remain in the pipeline as long as the immediate short-term line near 1.1630 caps the upside.
EUR/USD daily chart
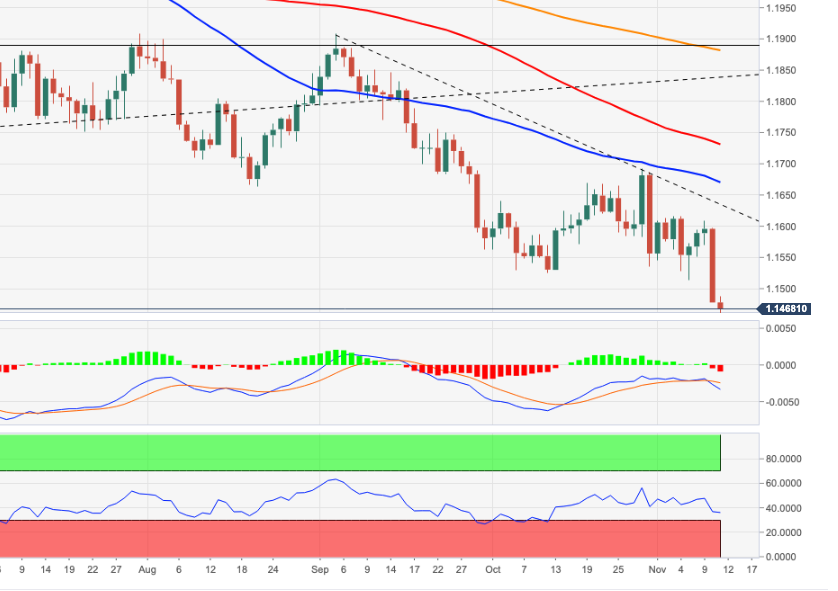
- A combination of factors pushed USD/CAD higher for the second successive day on Thursday.
- Move beyond the 200-DMA, the 1.2500 mark and ascending channel resistance favours bulls.
- Overbought RSI on hourly charts seemed to be the only factor that capped gains for the major.
The USD/CAD pair built on the previous day's US CPI-inspired rally of over 115 pips from sub-1.2400 levels and gained strong follow-through traction on Thursday. This marked the second successive day of a strong positive move and pushed the pair to five-week tops, around the 1.2570-75 region during the mid-European session.
The US consumer prices in October rose at the fastest annual pace since 1990 and raised bets that the Fed would adopt a more aggressive policy response to contain rising inflationary pressures. This, in turn, pushed the US Dollar Index to the highest level since July 2020 and acted as a tailwind for the USD/CAD pair.
On the other hand, sliding crude oil prices undermined the commodity-linked loonie and provided an additional boost to the major. Apart from this, technical buying on a sustained strength beyond the very important 200-day SMA and the key 1.2500 psychological mark further contributed to the ongoing positive momentum.
Meanwhile, the latest leg up confirmed a near-term bullish breakout through a three-week-old ascending channel and might have already set the stage for additional gains. That said, RSI on hourly charts are flashing overbought conditions and warrants some caution before placing fresh bullish bets around the USD/CAD pair.
Investors might also refrain from placing aggressive bets amid relatively thin liquidity conditions on the back of a bank holiday in the US and Canada. That said, oscillators on the daily chart have just started gaining positive traction and are still far from being in the overstretched territory, adding credence to the positive bias.
Nevertheless, the USD/CAD pair seems poised to reclaim the 1.2600 round-figure mark. The mentioned handle coincides with the 50% Fibonacci level of the 1.2896-1.2288 recent leg down, which should now act as a key pivotal point for traders. Some follow-through buying should pave the way for a further near-term appreciating move.
The upward trajectory could further get extended towards the 61.8% Fibo. level, around the 1.2665-70 region, above which bulls are likely to aim to reclaim the 1.2700 round-figure mark.
On the flip side, the ascending channel breakpoint, which coincides with the 38.2% Fibo. level, around the 1.2525 region, now seems to protect the immediate downside. Any further slide could be seen as a buying opportunity near the 1.2500 mark, which should help limit the pullback near 200-DMA support, currently near the 1.2480-5 region.
USD/CAD daily chart
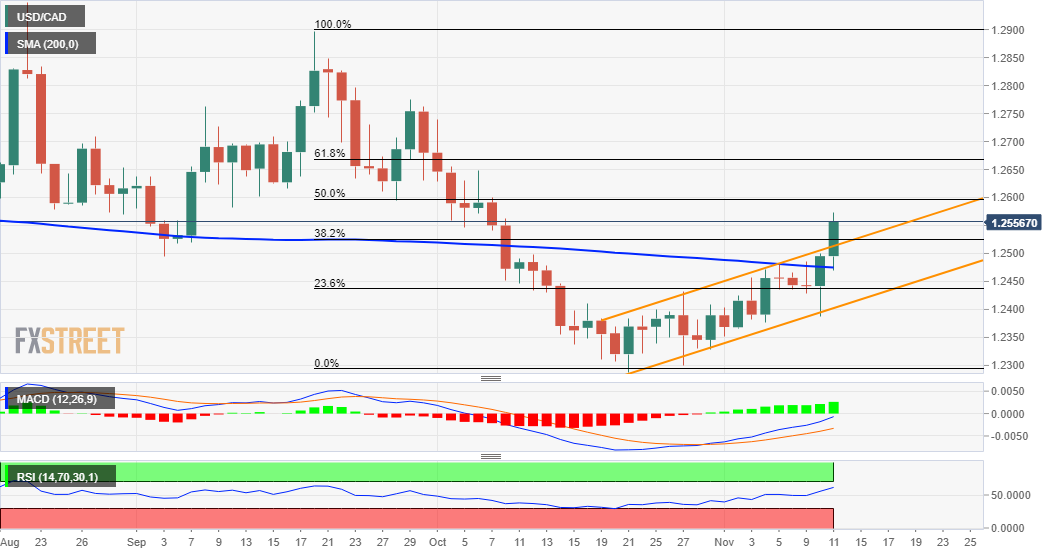
Technical levels to watch
Softer consumption backdrop amid the April tax hike is set to weigh on sterling, compounded by trade friction risks with the EU. Consequently, economists at CIBC Capital Markets expect the GBP/USD pair to drop towards 1.33 by year-end.
Advancing UK/EU trade frictions points towards increasing GBP headwinds into early 2022
“The Bank of England failed to pull the rate trigger in November. We expect rates to be hiked by 15bps in February, reversing the March 2020 emergency cut. However, we expect the BoE to be more circumspect in 2022 than what is still assumed by the market, which is pricing in 95bps of hikes in the next 12 months.”
“A slowing macro environment and relatively contained inflation expectations point towards a less aggressive rate cycle. Rising prices risk disposable incomes being compromised prior to an already announced tax hike. That combination points to consumption headwinds which will compromise the real economy.”
“The risk of advancing UK/EU trade frictions also points towards increasing GBP headwinds into early 2022. As a consequence, we have revised down our sterling outlook and forecast GBP/USD at 1.33 by year-end.”
The US dollar continues strengthening following the release of the much stronger than expected US CPI report on Wednesday. As the Federal Reserve will come under more pressure to tighten policy to dampen upside risks from inflation, USD’s upward momentum should persist, in the opinion of economists at MUFG Bank.
Another upside inflation surprise raises the risk of more active Fed tightening
“The main trigger for the outsized US dollar move was, of course, the US CPI report for October that revealed headline inflation jumped by 0.9% MoM and lifted the annual rate of 6.2%. The report challenges the Fed’s view that it can take its time to only gradually tighten policy built on the assumption that inflation will fall back to target in the coming years.”
“The hawkish repricing of Fed policy expectations has reinforced the US dollar’s upward momentum from the previous week. It supports our forecast for further US dollar strength heading into year-end and takes the dollar index closer to our near-term target at the 96.000-level.”
“The main potential banana skin remains a potential dovish surprise decision from President Biden to nominate Fed Governor Lael Brainard to be Fed Chair although market participants may still believe that it will be difficult for the Fed even under her leadership to maintain loose policy conditions in light of much higher inflation.”
Iraqi Oil Minister Ihsan Abdul-Jabbar Ismail said on Thursday that the OPEC+ group is expected to keep its policy of gradual oil output raise of 400,000 barrels per day unchanged at the December meeting, as reported by Reuters.
Additional takeaways
"Iraq December oil exports to reach 3.2 million bpd."
"Iraq targets to increase oil exports to 3.4 million bpd in Q1 2022."
"OPEC+ to review its output curtail policy in Q1 2022 to consider keeping current gradual raise at the same levels of 400,000 bpd each month."
"Iraq will stick to OPEC+ policy in cutting production, not considering seeking an exemption now or next year."
"OPEC+ gradual increasing of production not targeting high oil prices, but keeping global oil supplies stable."
Market reaction
Crude oil prices showed no immediate reaction to these remarks and the barrel of West Texas Intermediate was last seen trading at $80.65, losing 0.7% on a daily basis.
- DXY pushes higher and clocks new highs past 95.00.
- The index remains poised to extend the upside above 94.50.
DXY adds to Wednesday’s stabbing advance and manages to break above the key 95.00 yardstick to record new cycle highs.
Both the macro and the technical outlooks favour extra gains in the dollar for the time being. That said, while above former tops in the mid-94.00s (October 12) the index is expected to edge higher to, initially, the round level at 96.00.
Looking at the broader picture, the constructive stance on the index is seen intact above the 200-day SMA at 92.11.
DXY daily chart
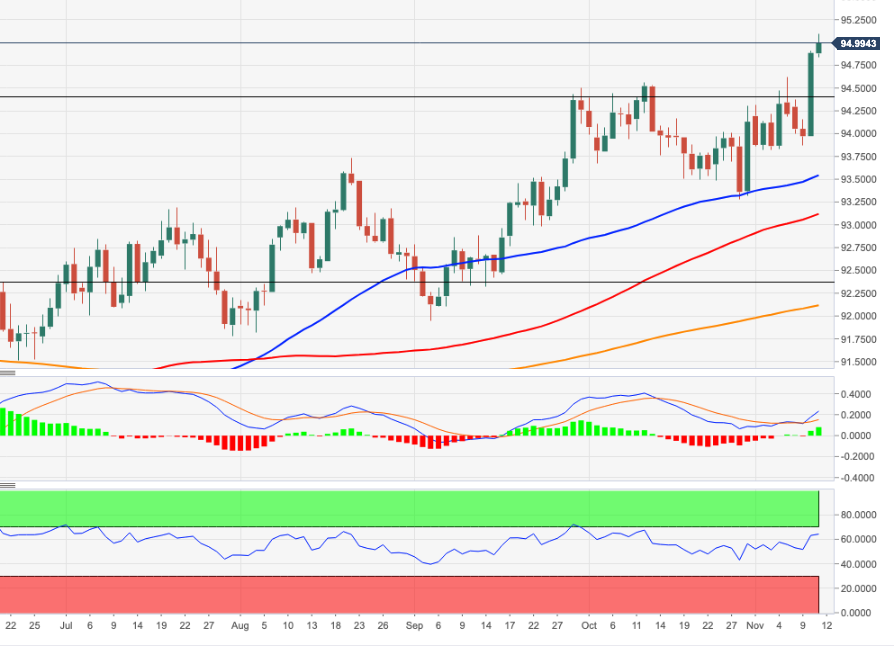
- EUR/JPY adds to the weekly downside and tests 130.50.
- The 200-day SMA comes next in the 130.40 region.
EUR/JPY loses ground for yet another session and already trades at shouting distance from the key 200-day SMA.
EUR/JPY flirts with the 55-day SMA in the mid-130.00s so far on Thursday. The loss of this area is expected to soon visit to the more significant contention zone around 130.40, where the 200-day SMA sits. This area of support remains propped up by the proximity of a Fibo retracement (of the October’s rally) near 130.30.
Below the 200-day SMA, the outlook for the cross is seen shifting to bearish.
EUR/JPY daily chart

Australia’s monthly labour market data has been a big miss. Subsequently, the employment report has failed to dampen Reserve Bank of Australia (RBA) hike expectations, supporting the view of economists at MUFG Bank to expect aussie’s depreciation.
AUD/USD to move downward following the disappointing jobs report
“The softer than expected employment report for October supports the RBA’s latest guidance that it is still not planning to begin rate hikes until at least 2023 at the earliest.”
“We still believe that risks remain skewed to the downside for the Australian dollar. We expect the Fed to be more active in tightening policy than the RBA next year, and the Australian dollar will prove more sensitive to the ongoing slowdown in China’s economy.”
“We remain wary of the risk of a sharper slowdown in China’s economy resulting from weakness in the real estate sector. The price of iron ore is continuing to fall back to pre-COVID levels providing one potential warning sign.”
“We expect AUD/USD to re-test key support at the 0.7200-level in the near-term.”
The Federal Reserve (Fed) confirms tapering will start in mid-November, putting asset purchases on a path to conclude in mid-June 2022. Economists at HSBC believe the USD will have room to strengthen, due to the Fed’s path towards normalisation and slowing global growth.
USD has room to strengthen
“Beginning in mid-November, purchases of US Treasuries will be reduced by USD10 B each month and purchases of mortgage-backed securities (MBS) reduced by USD5 B. Another reduction in purchases will occur in mid-December. If tapering stays on this timeline, net asset purchases would reach zero in the middle of June 2022.”
“We believe that the FOMC is prepared to take a wait-and-see approach with respect to using rate hikes to address inflation risks. Our baseline inflation projections suggest that rate hikes will commence only in 2023.”
“The FOMC may not be moving any more swiftly than expected to the exit from emergency levels of policy accommodation, but it is still exiting. This should be enough to support the USD against a number of currencies where central bank guidance is more overtly dovish, or where yields are lower than those in the US.”
“The continued moderation in global activity is likely to support the USD given its counter-cyclical personality. The November FOMC meeting was not a game-changer, but it also should allow the USD to continue accumulating wins in the year ahead.”
A surprisingly more dovish path for policy from the Bank of England (BoE), severe re-pricing of potential rate moves and strained relations with the EU have all weighed on a still vulnerable GBP/USD. Economists at Westpac do not rule out a test of the 1.30 level.
GBP/USD needs to surpass 1.36 to alleviate downside pressure
“The BoE’s 7-2 vote to leave rates unchanged reflected more benign projections for inflation. Growth is now projected to wane into the end of the forecast period. Markets rapidly unwound their pricing of rate cuts and reversed the recent narrowing of spreads to US rates.”
“Heightened tensions with the EU over the N. Ireland protocol and fishing rights have added headwinds for GBP/USD. Consequently, GBP is at risk of sliding towards retracement support in the 1.3150-75 area or even a flush to threaten 1.30.”
“GBP/USD would need to regain levels above 1.3600 to unwind the current more negative outlook for GBP into the 16th Dec BoE MPC meeting.”
Economists at CIBC Capital markets expect the euro to depreciate as the Federal Reserve outguns the European Central Bank (ECB) on both tapering bond purchases and raising rates.
ECB to maintain bond purchases into 2023
“The 16 December ECB meeting is likely to prove pivotal to the EUR’s 2022 trajectory. The meeting is accompanied by updated forecasts, including inflation (HICP), out to 2024 for the first time. The view that core prices will be relatively well behaved will help maintain medium run ECB policy inertia.”
“While hawks and doves will debate the medium term assumptions, we expect them to maintain bond purchases well beyond the end of next year.”
“In view of the ECB sequencing assumptions, that would leave rates on hold well into 2023, in contrast to the US. That policy gap underscores why we continue to favour EUR underperformance versus the USD, and look for EUR/USD retreating towards 1.10 in 2022.”
The US Dollar Index (DXY) is shifting into higher gears in the wake of the October CPI blowout. Ongoing repricing in Fed expectations for earlier hikes (2022) should leave USD on the front foot, in the opinion of economists at Westpac.
Further upside seem very likely near-term
“A sixth consecutive annual CPI reading above 5% has given the USD fresh gears to finally push past resistance in the mid-94s. From here the topside is wide open, with no meaningful resistance until around 96.0.”
“2022 and 2023 Fed hike expectations have leapfrogged the FOMC dots, though the Dec FOMC dots likely see a further hawkish shift.”
“DXY a strong buy on pullbacks into the low 94s.”
- EUR/GBP was seen oscillating in a range below 200-day SMA through the mid-European session.
- Brexit jitters, dovish BoE, disappointing UK macro data weighed on the GBP and extended support.
- Fresh ECB rate hike bets underpinned the euro and support prospects for a fresh bullish breakout.
The EUR/GBP cross seesawed between tepid gains/minor losses through the first half of the European session and was last seen hovering in the neutral territory, around the 0.8560 region.
The cross struggled to capitalize on its gains recorded over the past two trading sessions and remained capped below the very important 200-day SMA, though the downside seems cushioned. Worries that the UK government will trigger Article 16 of the Northern Ireland Protocol, along with the Bank of England's dovish decision last week might act as a headwind for the sterling.
The British pound was further undermined by a softer UK GDP print, showing that the economy expanded by 1.3% during the July-September period. This marked a sharp deceleration from the 5.5% growth reported in the previous quarter and was worse than 1.5% anticipated. Adding to this, the UK Manufacturing and Industrial production figures also fell short of consensus estimates.
On the other hand, the shared currency found some support after the European Central Bank (ECB) – in its latest economic bulletin – noted that inflation is lasting longer than originally expected. Adding the European Commission said that it expects inflation in the eurozone to be 2.4% in 2021, 2.2% in 2022 and 1.4% in 2023, bringing the ECB rate hike expectations back on the table.
The fundamental backdrop favours bullish traders, though a sustained break through the 200-DMA barrier, around the 0.8575-80 region, is needed to confirm the positive bias. Moreover, relatively thin liquidity conditions, on the back of a bank holiday in the US and Canada, further warrants some caution before positioning for any further appreciating move.
Technical levels to watch
- Silver regained positive traction on Thursday and was seen flirting with multi-month tops.
- The bias seems tilted in favour of bullish traders and supports prospects for further gains.
- Any corrective pullback would now be seen as a buying opportunity near mid-$24.00s.
Silver inched back closer to over three-month tops set on Wednesday, with bulls making a fresh attempt to build on the momentum beyond the key $25.00 psychological mark. The mentioned handle coincides with the 50% Fibonacci level of the $28.75-$21.42 downfall, which if cleared decisively will set the stage for additional gains.
Given this week's bullish breakout through the 100-day SMA/38.2% Fibo. confluence hurdle, the overnight sustained strength beyond mid-$24.00s favours bullish traders. The near-term positive outlook is reinforced by bullish technical indicators on the daily chart, which are still far from being in the overbought territory.
That said, bulls might still wait for a sustained strength beyond the 50% Fibo. level before positioning for any further appreciating move. The XAG/USD might then accelerate the momentum towards the next relevant hurdle near the $25.55-60 region before aiming to test the 61.8% Fibo. level, around the $26.00 round-figure mark.
On the flip side, any meaningful corrective pullback now seems to attract some dip-buying near the $24.50 resistance breakpoint. This, in turn, should help limit the downside near the $24.00 confluence area, which should now act as a strong base for the XAG/USD and a key pivotal point for short-term traders.
Some follow-through selling below the $23.70 area could shift the bias in favour of bearish traders and turn the XAG/USD vulnerable to extend the fall towards the $23.00 mark. The next relevant support is pegged near mid-$22.00s, which if broken could drag the metal back towards YTD lows, around the $21.40 area touched in September.
Silver daily chart

Technical levels to watch
- Gold price consolidates the upside before the next push higher.
- Gold remains undeterred by the global tightening calls after hot US inflation.
- Gold price turns bullish on falling bond yields, technical breakout.
Despite hot US inflation bringing back rate hike expectations on the table from the Fed and the ECB, gold price continues to benefit from its increased demand as an inflation hedge. Holiday-thinned market conditions are also boding well for the bright metal, as attention shifts towards Friday’s US Michigan Consumer Sentiment data. In meantime, the global tightening expectations will continue to influence gold price.
Read: Gold Price Forecast: Will US inflation trigger a sustained move above $1,834 in XAU/USD?
Gold Price: Key levels to watch
The Technical Confluences Detector shows that gold price needs acceptance above the previous day’s high of $1,869 to extend the bullish momentum towards pivot point one-day R1, which is placed at $1,873.
A firm break above the latter will open doors towards $1,884, where the pivot point one-month R3 aligns.
Alternatively, if the sellers manage to find a strong foothold below the confluence of the Fibonacci 23.6% one-day and pivot point one-week R2 at $1,859, then the corrective pullback could gain traction.
The next downside target is seen at the previous low one-hour at $1,855, below which fierce support around $1,850 will come into play.
That area is the intersection of the pivot point one-month R2, Fibonacci 38.2% one-day and SMA5 four-hour.
Here is how it looks on the tool
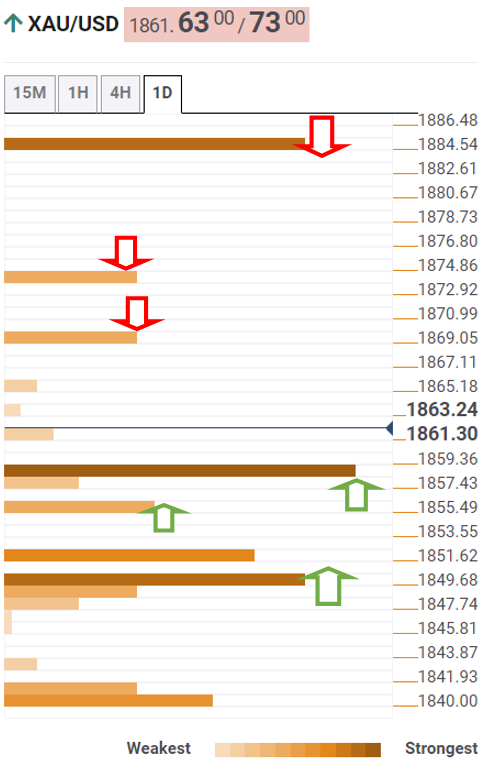
About Technical Confluences Detector
The TCD (Technical Confluences Detector) is a tool to locate and point out those price levels where there is a congestion of indicators, moving averages, Fibonacci levels, Pivot Points, etc. If you are a short-term trader, you will find entry points for counter-trend strategies and hunt a few points at a time. If you are a medium-to-long-term trader, this tool will allow you to know in advance the price levels where a medium-to-long-term trend may stop and rest, where to unwind positions, or where to increase your position size.
In its latest forecasts published on Thursday, the European Commission said that it expects inflation in the eurozone to be 2.4% in 2021, 2.2% in 2022 and 1.4% in 2023, as reported by Reuters.
Additional takeaways
"EU Commission raises eurozone GDP growth forecast for 2021 to 5.0% from 4.3%, expects 4.3% growth in 2022, 2.4% in 2023."
"EU Commission forecasts eurozone aggregate budget deficit at 7.1% of GDP in 2021, 3.9% in 2022, 2.4% in 2023."
"EU Commission forecasts eurozone aggregate public debt at 100% of GDP in 2021, 97.9% in 2022, 97.0% in 2023."
Market reaction
The EUR/USD pair showed no immediate reaction to this report and was last seen losing 0.1% on a daily basis at 1.1468.
AUD/USD lost more than 50 pips on Wednesday and extended its slide early Thursday. The aussie is set to test the base of the channel at 0.7248, Karen Jones, Team Head FICC Technical Analysis Research at Commerzbank, reports.
Aiming for the base of the channel
“AUD/USD has eroded the 55-day ma and remains under pressure. The pair targets the base of the channel at 0.7248 and the 29th September low at 0.7171.”
“Intraday Elliott wave counts are implying that 0.7430 was an interim high.”
The USD/JPY pair is now back trading above 114.00. With no end in sight to easy Bank of Japan (BoJ) monetary policy, and yield curve control extended, economists at CIBC Capital Markets look for yen weakness ahead.
Medium-term outlook for a weaker yen into 2022
“The perpetuation of an ultra-easy BoJ policy stance is set to leave Japan alongside the eurozone and Switzerland as extending long term policy inertia, a scenario which should continue to leave the JPY on the defensive.”
“Post the re-election of the LDP, we can expect another round of fiscal stimulus. While we expect Q3 weakness to give way to a solid rebound in Q4 GDP as the economy re-opens, the extension of yield curve control will see a sizeable widening in USTJGB 10 year spreads, providing the rationale for ongoing outflows of capital looking for higher returns overseas.”
“One risk to our weaker yen scenario that bears watching is the sheer scale of existing JPY shorts. The scale of the position skew risks a JPY corrective rally should risk sentiment prove to become materially compromised into year-end, but we would still maintain our medium-term outlook for a weaker yen into 2022.”
EUR/USD has cracked 1.1495. Next support is located at 1.1450 but pair could extend its decline as low as 1.1380, according to economists at Société Générale.
Downward momentum regaining
“EUR/USD decline looks set to extend as the pair has violated the lower band of recent consolidation. Next potential support levels are located at 1.1450 representing the monthly Ichimoku cloud and 1.1380.”
“Short-term upside could remain contained at 1.1700.”
- USD/JPY gained traction for the second successive day amid sustained USD buying.
- The cautious market mood underpinned the safe-haven JPY and capped the upside.
The USD caught some fresh bids during the early part of the European session and pushed the USD/JPY pair back closer to the 114.10-15 area, or one-week tops touched earlier this Thursday.
The pair built on the previous day's hotter-than-expected US CPI-inspired strong rally of around 125 pips from one-month lows and edged higher for the second successive day. The momentum was exclusively sponsored by the prevalent strong bullish sentiment surrounding the US dollar, which remained well supported by prospects for an early policy tightening by the Fed.
The US consumer prices in October rose at the fastest annual pace since 1990 and fueled speculations that the Fed would adopt a more aggressive policy response to contain rising inflationary pressures. In fact, the Fed funds futures market indicate that the first-rate hike could come as soon as July 2022, which continued acting as a tailwind for the greenback.
Meanwhile, the repricing of the likely timing for an eventual Fed rate hike move triggered a massive rally in the US Treasury bond yields on Wednesday. This was seen as another factor that provided an additional boost to the USD/JPY pair. That said, the cautious market mood underpinned the safe-haven Japanese yen and kept a lid on any further gains, at last for now.
Moreover, relatively thin liquidity conditions, on the back of a bank holiday in the US, further held traders from placing aggressive bets. Hence, it will be prudent to wait for a strong follow-through buying beyond the 114.40-50 region before positioning for any further appreciating move amid slightly overbought RSI on intraday charts.
Technical levels to watch
The Reserve Bank of Australia (RBA) and the Bank of England (BoE) are both less hawkish than markets priced. Near-term risks of a test of AUD/GBP 0.5380/0.5400 but Westpac’s year-end baseline is 0.54, then 0.55 in Q1 2022.
AUD/GBP may be in for a period of consolidation
“The aussie made steep gains against sterling in October, but with both the RBA and BoE starting November with more dovish than expected decisions, AUD/GBP may be in for a period of consolidation.”
“We see near-term risks of a test of AUD/GBP 0.5380/0.5400 but our year-end baseline is 0.54, then 0.55 in Q1 2022.”
The low of October at 20.20/20.10 which is also the 200-day moving average has cushioned the recent USD/MXN dip. The spotlight today is on Banxico, which is expected to hike rates by 25bps. Economists at Société Générale expect the USD/MXN pair to grind higher towards the 21.00 level.
Only a break below 20.20/20.10 would denote a deeper decline
“Inflation in Mexico accelerated to 6.24% in October, moving further away from the 4% upper bound target. However, a surprise contraction in 3Q GDP of 0.2% QoQ tilts the balance towards a 25bp increase, not 50bp.”
“The risks of policy mistakes (power sector reform) and rise in US yields explain our bearish view on the peso.”
“The pair is expected to head gradually towards 21.00 and perhaps even towards the March high of 21.60/21.68 which is also a projection for the bounce.”
“Only a break below 20.20/20.10 would denote a deeper decline.”
In the latest economic bulletin, the European Central Bank (ECB) noted that inflation is lasting longer than originally expected but is set to decline next year.
Key takeaways
“At the global level, economic activity continued to expand, albeit at a measurably moderating pace, amid a combination of factors, most prominently persistent supply bottlenecks.”
“Price pressures remain elevated on account of increasing food and energy inflation, reflecting the rebound from the low-price levels recorded immediately after the onset of the coronavirus (COVID-19) pandemic. Most of the price pressures are judged to be of a temporary nature.”
“The upswing in inflation largely reflects a combination of three factors. First, energy prices – especially for oil, gas and electricity – have risen sharply. Second, prices are also going up because recovering demand related to the reopening of the economy is outpacing supply. And finally, base effects related to the end of the VAT cut in Germany are still contributing to higher inflation.”
Meanwhile, the ECB rate hike expectations are back on the table, with the Eurozone Money Markets now pricing in a 10 Bps hike by September 2022 vs. by December earlier this week, per the ECBWatch.
In contrast, US money markets now price a first Fed interest rate increase by July.
Market reaction
The euro is little impressed by the above headlines, as EUR/USD trades at fresh yearly lows of 1.1453, down 0.16% on the day.
Kiwi’s corrective decline should slow by 0.7000, and give way to a multi-month rally past 0.7465, in the opinion of economists at westpac. Furthermore, NZ yield spreads and commodities will remain supportive.
NZD/USD appears well on track to reach the 0.7465 high by year-end
“There’s potential for NZD/USD to correct even lower during the next few days, to 0.7000 (which would be a 62% retracement of the October rally). At that level we’d be tempted to go long, with a multi-month horizon. We expect it to be above 0.7465 by year end.”
“The US dollar has recently been boosted by strong inflation data, pushing US interest rates higher. • But the RBNZ is likely to easily outpace Fed tightening during the next couple of years, so that yield spreads are likely to remain a source of support for NZD/USD for some time.”
“Apart from yields spreads, NZ commodities should also be supportive. And perceptions of NZ economic strength will also be favourable for some time.”
- EUR/USD drops to new cycle lows near 1.1450.
- The firm note in the dollar keeps the pair under pressure.
- ECB-speak, ECB Macroeconomic Projections next on tap.
The selling pressure the European currency is undergoing remains well and sound and has forced EUR/USD to record new 2021 lows in the mid-1.1400s on Thursday.
EUR/USD looks to USD, ECB
EUR/USD is sheding ground for the second session in a row following the nearly 1% decline witnessed on Wednesday, in response to the abrupt rebound in the dollar after US inflation figures rose to 30-year high at 6.2% in the year to October.
The spot price collapsed pari passu with the move higher in the buck, which was also underpinned by rising US yields along the curve and speculations of a sooner-than-expected lift-off in rates by the Fed. On the latter front, market participants seem to be pencilling in three hikes during 2022.
Nothing is scheduled on the euro docket on Thursday, while attention will be focused on the publication of the ECB’s Macroeconomic Projections and speeches by Board members P.Lane and I.Schnabel.
What to look for around EUR
The outlook for EUR/USD has deteriorated further following Wednesday’s slump to sub-1.1500 levels. As usual, the pair’s price action is predicted to mainly track the dynamics around the dollar, while bouts of occasional strength are seen coming from broad risk appetite trends. On the more macro view, the loss of momentum in the economic recovery in the region - as per some weakness observed in key fundamentals – coupled with rising cases of COVID-19 is also seen pouring cold water on investors’ optimism and tempering bullish attempts in the shared currency. Further out, the euro should remain under scrutiny amidst the implicit debate between investors’ expectations of a probable lift-off sooner than anticipated and the ECB’s so far steady hand, all amidst the persevering elevated inflation in the bloc and rising convinction that it could extend further than previously estimated.
Key events in the euro area this week: EMU Industrial Production (Friday).
Eminent issues on the back boiler: Asymmetric economic recovery post-pandemic in the region. Sustainability of the pick-up in inflation figures. Pick-up in the political effervescence around the EU Recovery Fund in light of the rising conflict between the EU, Poland and Hungary on the rule of law. ECB tapering speculations.
EUR/USD levels to watch
So far, spot is down 0.12% at 1.1464 and faces the next up barrier at 1.1609 (weekly high November 9) seconded by 1.1616 (monthly high Nov.4) and finally 1.1668 (55-day SMA). On the other hand, a break below 1.1453 (2021 low Nov.11) would target 1.1422 (monthly high Jun.10 2020) en route to 1.1300 (round level).
- AUD/USD challenges key support as the King dollar dominates.
- Hot US CPI boosts Fed rate hike expectations, poor Aussie slashes RBA’s.
- RSI remains heavily bearish; more losses remain in the offing.
AUD/USD is bouncing back towards 0.7300, having found strong demand around the 0.7285 region. The spot hit fresh weekly lows at 0.7287 in the last hour, as the buying interest around the US dollar remains unabated after a big jump in the country’s Consumer Price Index (CPI).
The US inflation jumped to the level not seen since 1990 on Wednesday and ramped up the Fed’s rate hike expectations. Meanwhile, the Australian employment data disappointed markets, watering down the Reserve Bank of Australia’s (RBA) rate hike calls.
The divergent monetary policy outlooks between the Fed and the RBA will continue to weigh down on the aussie.
Markets also keep a close eye on the Chinese property sector news and the price action in the commodities space for fresh trading incentives on the pair, as the US celebrates Veterans Day.
Looking at AUD/USD’s daily chart, the pair challenged the bullish commitments at the critical demand zone around 0.7290-0.7285, which is the confluence of the October 11 and October 8 lows.
Note that the downside opened up for the major after it convincingly breached the critical 50-Daily Moving Average (DMA) at 0.7369 a day before.
The 14-Day Relative Strength Index (RSI) has eased off lows but remains well below the midline, backing the latest rebound in the spot.
Although the downside risks persist on selling resurgence, with the abovementioned key support to give way for a fresh downswing towards the horizontal trendline support at 0.7250.
AUD/USD: Daily chart
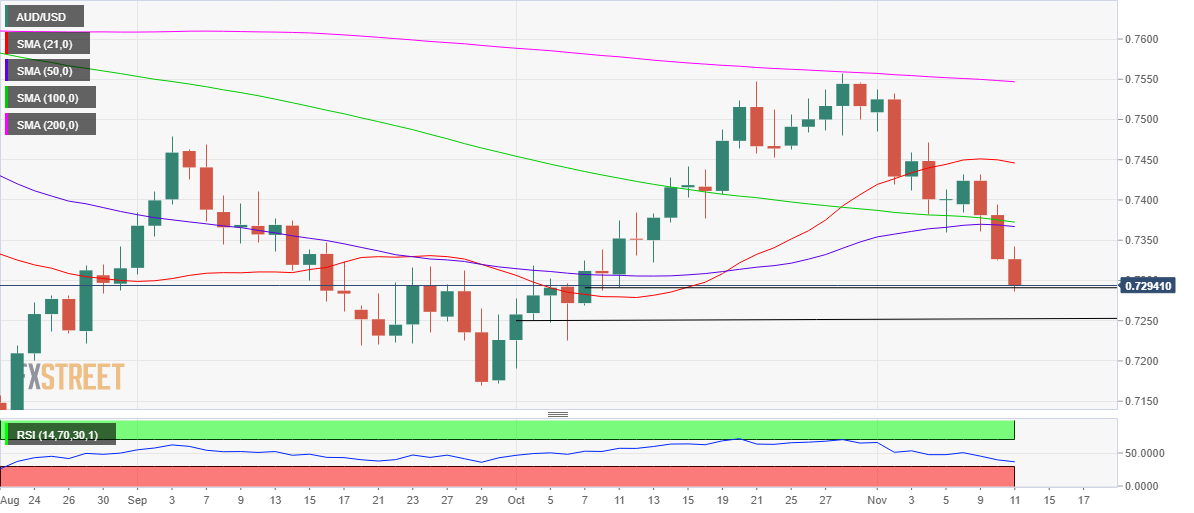
On the flip side, the aussie will need to recapture the daily highs of 0.7342 to initiate any meaningful recovery towards the 50-DMA support-turned-resistance. At that level, the 100-DMA emerges, making it a powerful upside barrier.
The aussie will next target a move above 0.7400, which will negate the near-term bearish momentum.
AUD/USD: Additional levels to consider
- GBP/USD witnessed some selling on Thursday and dropped to fresh YTD lows.
- Disappointing UK macro data, Brexit jitters acted as a headwind for the GBP.
- Sustained USD selling further collaborated to the slide below the 1.3400 mark.
The GBP/USD pair dropped to the lowest level since December 2020 during the early part of the European session, albeit quickly recovered a few pips thereafter. The pair was last seen trading with only modest intraday losses, just below the 1.3400 mark.
The pair struggled to capitalize on its attempted recovery move on Thursday, instead met with some fresh supply near the 1.3430-35 region in reaction to disappointing UK macro data. The Preliminary UK GDP report or the first estimate showed that the economy expanded by 1.3% during the July-September period. This marked a sharp deceleration from the 5.5% growth reported in the previous quarter and was worse than 1.5% anticipated.
Adding to this, the UK Manufacturing and Industrial production figures also fell short of consensus estimates. This comes on the back of Worries that the UK government will trigger Article 16 of the Northern Ireland Protocol and the Bank of England's dovish decision last week. The combination of factors acted as a headwind for the British pound, which along with sustained US dollar buying dragged the GBP/USD pair lower.
The US CPI report released on Wednesday showed that consumer prices in October rose at the fastest annual pace since 1990. This, in turn, reinforced expectations about an early policy tightening by the Fed and continued acting as a tailwind for the greenback. In fact, the key USD Index shot to fresh YTD tops and was further supported by the overnight massive rally in the US Treasury bond yields.
Meanwhile, the latest leg of a sudden fall over the past hour or so could further be attributed to some technical selling below the 1.3400 round-figure mark, confirming a fresh bearish breakdown. That said, oversold RSI on intraday charts assisted the GBP/USD pair to quickly recover around 25-30 pips from daily swing lows. That said, the bias remains tilted in favour of bearish traders and any move up would be seen as a selling opportunity.
Technical levels to watch
FX option expiries for November 11 NY cut at 10:00 Eastern Time, via DTCC, can be found below.
- EUR/USD: EUR amounts
- 1.1490 534m
- 1.1550-60 1.4b
- 1.1580 566m
- 1.1595 902m
- USD/JPY: USD amounts
- 113.00 969m
- 113.40 860m
- 113.60 1b
- 113.70 1.6b
- AUD/USD: AUD amounts
- 0.7335 597m
- 0.7385 504m
Expressing his take on the UK third-quarter growth numbers, the country’s Finance Minister Rishi Sunak said, “there are challenges ahead of the British economy.”
Additional quotes
“GDP data shows we are on the right path.”
“We need to do better than we did last week on parliamentary standards.”
“Supply chain and labor challenges are being experienced by other countries.”
Market reaction
GBP/USD is trading close to fresh yearly lows of 1.3365, down 0.16% on the day. Brexit concerns and hot US CPI-led dollar strength continue to hurt the cable.
- USD/CAD gained strong follow-through traction for the second successive day.
- The USD built on the post-CPI gains and remained supportive of the momentum.
- The fundamental/technical set-up seems tilted firmly in favour of bullish traders.
The USD/CAD pair continued scaling higher through the early European session and shot to fresh five-week tops, around the 1.2525-30 region in the last hour.
The pair attracted some dip-buying near the 1.2460-55 region on Thursday and built on the previous day's US CPI-inspired rally of over 115 pips from sub-1.2400 levels. The US consumer prices in October rose at the fastest annual pace since 1990 and reinforced expectations about an early policy tightening by the Fed. This, in turn, continued acting as a tailwind for the US dollar, which climbed to fresh YTD tops and assisted the USD/CAD pair to gain traction for the second successive day.
On the other hand, a softer tone around crude oil prices undermined the commodity-linked loonie and provided an additional boost to the USD/CAD pair. Apart from this, the uptick could further be attributed to some technical buying on a sustained move beyond the very important 200-day SMA. That said, relatively thin liquidity conditions, on the back of a bank holiday in the US and Canada, might hold back bullish traders from placing aggressive bets and keep a lid on any further gains.
Nevertheless, the fundamental backdrop seems tilted firmly in favour of bullish traders and supports prospects for an extension of the ongoing positive move. Even from a technical perspective, the USD/CAD pair was last seen flirting with a resistance marked by the top boundary of a three-week-old ascending channel. A sustained strength beyond will reaffirm the positive outlook and pave the way for additional gains towards reclaiming the 126.00 round-figure mark.
Technical levels to watch
- GBP/JPY staged a modest bounce from 100-DMA, though lacked follow-through buying.
- Disappointing UK macro data, Brexit jitters, dovish BoE acted as a headwind for the GBP.
- The cautious market mood benefitted the safe-haven JPY and collaborated to cap gains.
The GBP/JPY cross retreated a few pips from daily tops in reaction to disappointing UK macro data and was last seen hovering near daily lows, around the 152.70-65 region.
The cross once again managed to defend and attract some dip-buying around 100-day SMA support, though a combination of factors capped the upside near the 153.00 round-figure mark. Worries that the UK government will trigger Article 16 of the Northern Ireland Protocol and the Bank of England's dovish decision last week acted as a headwind for the British pound.
The sterling was further pressured by the Preliminary UK GDP report, which showed that the economic growth decelerated sharply to 1.3% during the third quarter of 2021. This was also short of market estimates pointing to a reading of 1.5% and was accompanied by weaker-than-expected UK Manufacturing/Industrial production data for the month of September.
Meanwhile, worries about the continuous surge in inflationary pressure tempered investors' appetite for perceived riskier assets. This, in turn, benefitted the Japanese yen's relative safe-haven status and further collaborated to keep a lid on any further gains for the GBP/JPY cross, rather prompted fresh selling at higher levels.
The fundamental backdrop favours bearish traders and supports prospects for an extension of the recent sharp pullback from multi-year tops touched in October. That said, it will still be prudent to wait for a sustained break below 100-DMA support, currently around the 152.55 region, before confirming a fresh breakdown and placing aggressive bets.
Technical levels to watch
USD/CHF has pierced its near-term downtrend at 0.9164. This signals a potential rise as high as the recent high of 0.9369, in the view of Karen Jones, Team Head FICC Technical Analysis Research at Commerzbank.
Bid above the uptrend at 0.9095
“USD/CHF has eroded the 0.9164 downtrend, and this implies near-term gains to 0.9229 and potentially 0.9300/13, where we suspect the move will struggle.”
“The pair stays bid while above the 2020-2021 uptrend at 0.9095.”
“Above the 0.9313 mid-October high lies 0.9357/69 (the recent high).”
- DXY adds small gains and records new YTD peaks.
- US multi-decade high inflation remains in centre stage.
- US bonds market will be closed on Thursday.
The greenback, when gauged by the US Dollar Index (DXY), extends the recent sharp advance and clinches new cycle highs around 95.00 on Thursday.
US Dollar Index boosted by higher CPI
The index continues to digest Wednesday’s sharp advance and moves to fresh tops around the 95.00 area, where some initial resistance seems to have turned up for the time being.
The post-CPI jump in the dollar was sustained by the rebound in US yields along the curve and the moderate corrective upside in TIPS break-evens. It is worth recalling that US headline CPI rose to a 30-year high at 6.2% in October vs. the same month of 2020, while consumer prices excluding food and energy costs (Core CPI) advanced at an annualized 4.6%.
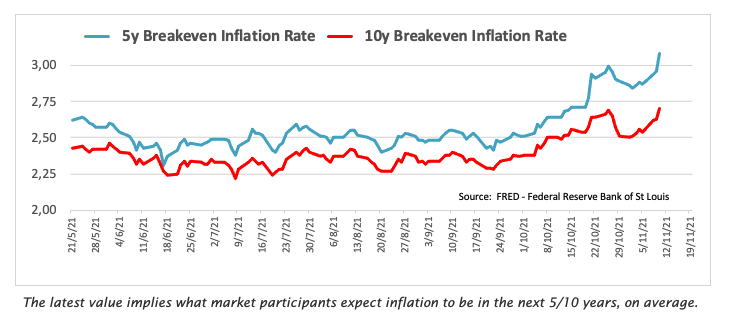
Of course, speculations of a potential move by the Federal Reserve on the Fed Funds Rates earlier than anticipated have already kicked in and emerge as another driver sustaining the upside momentum in the buck.
There are no data releases in the US data space, while the US debt market will also be closed due to the Veterans Day holiday.
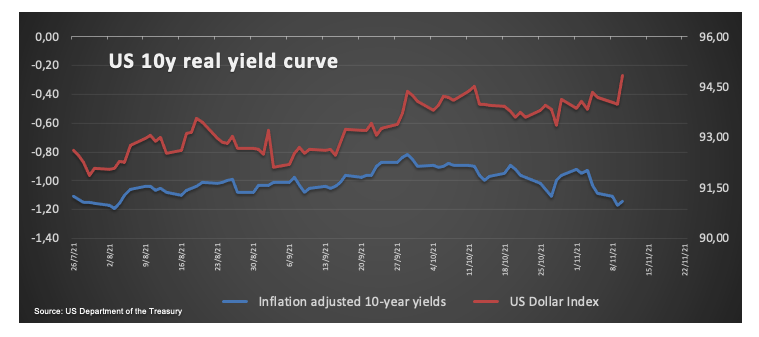
What to look for around USD
The index jumped to new cycle highs around the 95.00 level, area last visited in the summer of the coronavirus pandemic. The sudden change of heart in the dollar remains underpinned by rising yields and the firmer perception that the elevated inflation will be among us longer than anticipated, all this morphing into already rising speculations of probable interest rate hikes as soon as in 2022.
Key events in the US this week: Flash November Consumer Sentiment (Friday).
Eminent issues on the back boiler: US-China trade conflict under the Biden’s administration. Tapering speculation vs. economic recovery. Debt ceiling debate. Geopolitical risks stemming from Afghanistan.
US Dollar Index relevant levels
Now, the index is gaining 0.12% at 94.98 and a break above 95.00 (2021 high Nov.11) would open the door to 95.71 (monthly low Jun.10 2020) and then 97.80 (high Jun.30 2020). On the flip side, the next down barrier emerges at 93.87 (weekly low November 9) seconded by 93.53 (55-day SMA) and finally 93.27 (monthly low October 28).
Ahead of the European Central Bank (ECB) meeting on Thursday, December 16, key ECB officials are likely to stress patience given the spate of activity data misses. This leaves the euro at risk of further declines to the 1.1300/1.1275 area, according to economists at Westpac.
Are expectations starting to stabilise? Could this provide EUR support?
“Although comments from more hawkish ECB members have stressed the need to react with policy tightening should there be any signs of demand-driven or second-round inflation drivers, core ECB messages have been that there is unlikely to be any move in ECB’s benchmark rates in 2022.”
“Concerns over the lack of persistence in inflation lifts have been reinforced with the series of missed data releases for industrial production, factory orders and retail sales. These misses have reflected the turn in ZEW expectations since their peak in June. The latest release, however, shows potential for some stabilisation. If this were to develop and be met by more favourable hard data it should provide support for EUR.”
“Near-term pressures on EUR/USD remain to the downside ahead of the next ECB meeting. The break of 1.15 risks a further slide to 1.1275-1.1300.”
GBP/USD in new lows for the year. The pair is hovering around the 1.34 level and could plummet as low as the 200-week moving average at 1.3165, Karen Jones, Team Head FICC Technical Analysis Research at Commerzbank, reports.
Scope for the 200-week ma at 1.3165
“GBP/USD is in new lows for the year. It will find some support at 1.3382 the March 2019 high but is now on course for the 200-week ma at 1.3165.”
“Interim resistance lies at 1.3607.”
“The market stays offered while capped by the 55-day ma at 1.3685.”
Dovish guidance from the Reserve Bank of Australia (RBA) lingers and commodities are wobbling. A solid USD suggests scope for 0.7250, but that would be attractive on the multi-week/month AUD/USD outlook, in the view of economists at Westpac.
AUD/USD under pressure near-term
“The impact of the RBA’s dovish cash rate view lingers, even if markets are still content to price in a considerable tightening in H2 2022.”
“The aussie’s commodity price support remains under pressure as slumping Chinese steel production seems likely to persist, perhaps through to the Feb Beijing Winter Olympics. Equity wobbles add to the prospect of further AUD/USD decline in the coming days, perhaps to around 0.7250.”
“Still, we retain our 0.75 year-end target, with Australia on track for one of the highest vaccination rates in the world, likely to help build momentum into 2022. Current account surpluses also provide insulation.”
The USD firmed in the wake of stronger than expected CPI data, sending the kiwi lower. Economists at ANZ doubt the New Zealand dollar can take advantage of RBNZ rate hikes due to high mortgage rates and expected hikes from the Federal Reserve.
Dollar capitalizes on hot inflation report
“The NZD was the second best performer (behind the AUD), but they are both still weaker, with stronger than expected US CPI data casting doubt on the idea that the Fed can remain patient.The NZD’s resilience is pretty understandable given that markets have already come to grips with high NZ CPI and hefty rate hikes are already priced in.”
“The NZD has the potential to respond very positively to the next couple of RBNZ OCR hikes (especially if one of them is 50bps), but as we head into 2022, with mortgage rates already well higher and the Fed then likely eyeing hikes, that timing mismatch could be a real challenge for the NZD. So maybe this isn’t as good as it gets, but it may not be too far off it. Let’s see.”
“Support 0.6860/0.6900 – Resistance 0.7215/0.7310”
EUR/USD is in new lows for the year after tanking to its lowest level since July 2020 at 1.1465. Karen Jones, Team Head FICC Technical Analysis Research at Commerzbank, notes that the pair could sink as low as 1.10.
Offered below the 1.1660 five-month downtrend
“EUR/USD has broken into new lows for the year and will stay directly offered below the 1.1660 five-month downtrend.”
“For now, attention is on the previous downtrend (from 2008) which is now located at 1.1366 and should act as support, we look for this to hold.”
“Below 1.1366 would target 1.1290 then 1.10, the 61.8% and 78.6% retracement of the move seen in 2020.”
Here is what you need to know on Thursday, November 11:
The greenback capitalized on surging US Treasury bond yields and risk-aversion on Wednesday after the data from the US showed that consumer inflation jumped to its strongest level in more than 30 years. The US Dollar Index is consolidating Wednesday’s gains below 95.00 and the benchmark 10-year bond yield settled above 1.5%. Bond markets in the US will be closed due to the Veterans Day holiday on Thursday but Wall Street will open at the usual time. Following Wednesday’s crazy action, markets could remain relatively quiet amid thin trading conditions.
Macro events: The US Bureau of Labor Statistics reported on Wednesday that the Consumer Price Index (CPI) jumped to 6.2% on a yearly basis in October from 5.4% in September, marking the highest print since 1990. Moreover, the Core CPI climbed to 4.6% from 4%. The benchmark 10-year US Treasury bond yield rose nearly 8% and provided a boost to the dollar. The CME Group’s FedWatch Tool now shows that markets are currently pricing a more-than-70% probability of a Fed rate hike by June 2022.
During the Asian session on Thursday, the data published by the Australian Bureau of Statistics revealed that the Unemployment Rate rose to 5.2% in October from 4.6% in September. More worryingly, the Employment Change arrived at -46.3K in the same period, missing the market expectation for an increase of 50K by a wide margin.
The UK’s Office for National Statistics announced that the Gross Domestic Product (GDP) expanded by 1.3% on a quarterly basis in the third quarter, missing the market expectation of 1.5%.
Market mood: Inflation fears weighed heavily on stock markets on Wednesday. The Nasdaq Composite fell more than 1.5%, the S&P 500 lost 0.8% and the Dow Jones Industrial Average was down 0.66% by the closing bell. In the early European session, US stock index futures are posting small gains. On a positive note, Chinese real-estate giant Evergrande has reportedly made the payment on its bond coupons to the tune of $148 million and avoided a formal default. China’s Shanghai Composite Index rose more than 1% and the Nikkei 225 added 0.6%.
EUR/USD broke below 1.1500 and touched its lowest level since July 2020 at 1.1465. Currently, the pair is moving in a very narrow band below 1.1500.
GBP/USD's reaction to the UK GDP was relatively muted and the pair is posting small recovery gains above 1.3400. Meanwhile, European Commission Vice-President Maros Sefcovic reportedly told EU ambassadors that the engagement with Britain on Brexit was not going well.
USD/JPY shot higher on the back of rising US T-bond yields and snapped a five-day losing streak. The pair is now looking to test 114.00.
Gold found demand as an inflation hedge after the US CPI data and reached its highest level since June near $1,870 before going into a consolidation phase. The bullish momentum seems to have gathered strength after XAU/USD broke above the stiff $1,835 resistance area as well.
AUD/USD lost more than 50 pips on Wednesday and extended its slide early Thursday following the disappointing jobs report. The pair is currently trading at a fresh monthly low near 0.7300.
Cryptocurrencies: Bitcoin notched a new all-time high at $69,000 but ended up closing the day deep in the negative territory around $65,000 on Wednesday. At the time of press, BTC/USD was virtually unchanged on the day. Ethereum lost its bullish momentum before testing $5,000 and stays calm around $4,700 on Thursday.
- GBP/USD staged a modest intraday bounce from YTD lows, albeit lacked follow-through.
- Disappointing UK GDP print capped the upside for the GBP amid Brexit woes, dovish BoE.
The GBP/USD pair held on to its modest intraday gains heading into the European session, albeit retreated a few pips from daily tops following the release of UK macro data.
Having shown some resilience below the 1.3400 mark, the GBP/USD pair staged a modest bounce from the lowest level since December 2020 touched earlier this Thursday. The uptick, however, lacked bullish conviction or a strong follow-through buying, instead lost some steam in reaction to the disappointing release of the Prelim UK GDP report.
The first estimate showed that the UK economy expanded by 1.3% during the July-September period as against 1.5% expected, marking a sharp deceleration from 5.5% growth reported in the previous quarter. Adding to this, the UK Manufacturing and Industrial production figures also fell short of consensus estimates and weighed on the sterling.
This comes on the back of growing market concerns that the UK government will trigger Article 16 of the Northern Ireland Protocol. Apart from this, the Bank of England's dovish decision to hold interest rates steady last week favours bearish traders and supports prospects for an extension of over a three-week-old downward trajectory.
The negative outlook is reinforced by the prevalent strong bullish sentiment surrounding the US dollar, bolstered by expectations for an early policy tightening by the Fed. That said, relatively thin liquidity conditions, on the back of the US bank holiday in observance of Veterans Day, might hold back bearish traders from placing fresh bets.
Technical levels to watch
Britain’s industrial sector recovery lost momentum in September, the latest UK industrial and manufacturing production data published by Office for National Statistics (ONS) showed on Thursday.
Manufacturing output arrived at 0.1% MoM in September versus 0.2% expectations and 0.5% booked in August while total industrial output came in at -0.4% vs. 0.2% expected and 0.8% last.
On an annualized basis, the UK manufacturing production figures came in at 2.8% in September, missing expectations of 3.1%. Total industrial output rose by 2.9% in the ninth month of the year against a 3.8% reading expected and the previous 3.7% print.
Separately, the UK goods trade balance numbers were published, which arrived at GBP-14.736 billion in September versus GBP-14.3 billion expectations and GBP-14.927 billion last. Total trade balance (non-EU) came in at GBP-9.10 billion in September versus GBP-8.395 billion previous.
Related reads
- Breaking: UK Preliminary GDP misses estimates with 1.3% QoQ in Q3, GBP/USD unfazed
-
GBP/USD eases from daily tops on softer UK GDP, up little around 1.3415
- Quarterly GDP for the UK grew by 1.3% in Q3 vs. 1.5% expected.
- UK GDP arrived at 0.6% MoM in September vs. 0.4% previous.
- GBP/USD is little changed around 1.3425 on mixed UK GDP.
The British economy expanded 1.3% QoQ in the third quarter of 2021 when compared to a 5.5% growth seen in Q2 and 1.5% expectations. On an annualized basis, the Kingdom’s GDP arrived at 6.6% in Q3 vs. 6.8% expected and 23.6% prior.
The UK GDP monthly release showed that the economy quickened its pace of expansion in September, coming in at 0.6% vs. 0.4% previous.
Meanwhile, the Index of services (September) arrived at 1.6% 3M/3M vs. 3.1% expected and 3.7% prior.
Market reaction
The cable keeps its range around 1.3425 after the mixed UK growth numbers. The spot is adding 0.18% on the day.
About UK GDP
The Gross Domestic Product released by the National Statistics is a measure of the total value of all goods and services produced by the UK. The GDP is considered as a broad measure of the UK economic activity. Generally speaking, a rising trend has a positive effect on the GBP, while a falling trend is seen as negative (or bearish).
On Thursday, November 11 at 19:00 GMT the Bank of Mexico will have its monetary policy meeting. In the view of economists at TDS, Banxico will hike rates by 25bps to 5%, which should support the peso.
Volatile short-term US yields remain a challenge for the peso
“We expect Banxico to hike rates by 25bps, though inflation trends continue to suggest the risk of a more aggressive rate move.”
“MXN's sensitivity to US yields is adding a challenge to the peso, as US short-term yields remain volatile and face upside pressure.”
“We expect that the market would be substantially helped by a larger than 25bp rate hike, or at the least a unanimous decision on the rate hike.”
Gold price surged to the highest levels since June 16 at $1,869 before pulling back sharply to settle at $1,853 after US inflation-led explosion. Although the yellow metal is off highs, XAU/USD remains on track for the additional upside, according to FXStreet’s Dhwani Mehta.
XAU/USD has more room to rise
“XAU/USD is correcting slightly after the recent upsurge, with the US Treasury yields holding onto their recent recovery gains. However, the pause in the US dollar’s rally across the board is limiting the pullback in gold price.”
“The bright metal remains on track for additional upside if it takes out the June 16 highs of $1,869, above which the immediate hurdle is seen at the June 14 tops of $1,878. Further up, the $1,800 psychological level will be back in play.”
“A minor pullback cannot be ruled out towards $1,840 after Wednesday’s blistering rally. The previous critical resistance now support at $1,834 will challenge the bullish commitment, if the downside extends. The next stop for the sellers is seen at Wednesday’s low of $1,822.”
See – Gold Price Forecast: XAU/USD to see further gains towards the $1917 May high once above $1835 – Commerzbank
- EUR/GBP bulls stay cautious, UK GDP data eyed.
- Risk-averse sentiment prevalent, US CPI, mighty US dollar hogs limelight.
- EUR/GBP in a mild trading session, forex eyes broader macros.
EUR/GBP is trading around 0.8560 during the early European session on Thursday ahead of the multiple UK and Eurozone data releases due later in the day as well as on Friday.
The British economic calendar has put traders on edge, with preliminary Gross Domestic Product (GDP) numbers for the third quarter of 2021 to be presented in the next hour. The easing of virus restrictions helped the country to emerge from a pandemic-led slowdown and resulted in an improved second quarter.
However, things have taken a rebound in the third quarter. The cross-currency pair is reeling due to the slow growth in UK Q3, driven by less robust demand and self-isolation restrictions due to rising new cases of COVID-19. In addition to this, the upcoming data release for Manufacturing Production and Industrial Production is adding stress to the pair. Additionally, the grey clouds of the Brexit brawl over Article 16, keeping the currency under duress.
On the other hand, the European Commission is scheduled to present its Autumn 2021 Economic Forecast later in the day. Also, the EcoFin meeting paired with the Industrial production data will offer some trading incentives to the cross. Eurozone economic releases are due for Friday, which could likely mpact the pair's value.
EUR/GBP Technical Levels
After the November 4 rally, the EUR/GBP daily chart looks promising. However, the daily chart shows a stronger resistance at 0.8581, 200-day Simple Moving Average (SMA). If that cracks, the higher target will be seen 0.8595 (one-week high) and 0.8624 (one-month high).
The price may reverse and continue a negative momentum to 100, 50, 21-day SMA; the support levels will be 0.8536, 0.8521 and 0.8483.
Following the Moving Average Convergence Divergence (MACD), the movement shows overly zealous bulls. The Relative Strength Index (RSI) looks cheerful and manages to stay well above the 50-line horizon.
Daily Chart
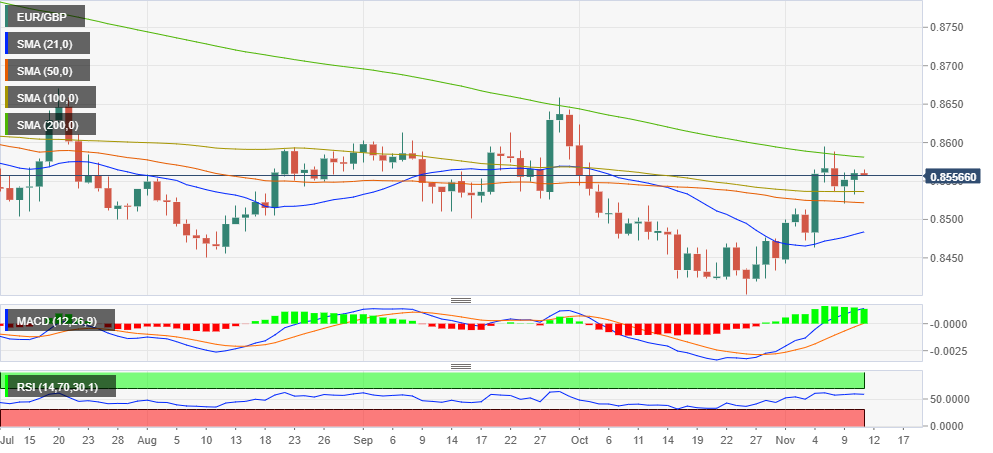
Additional Technical Levels
CME Group’s advanced prints for natural gas futures markets showed open interest rose for the second session in a row on Wednesday, now by around 1.6K contracts. On the other hand, volume partially reversed the previous build and dropped by around 100.7K contracts.
Natural Gas now faces the next support near $4.20
Prices of natural gas continued to correct lower on Wednesday. That, coupled with diminishing open interest leaves the scenario ripe for further pullbacks. Against this, the next support of note comes at the $4.20 region per MMBtu, where the later July/early August peaks are located.
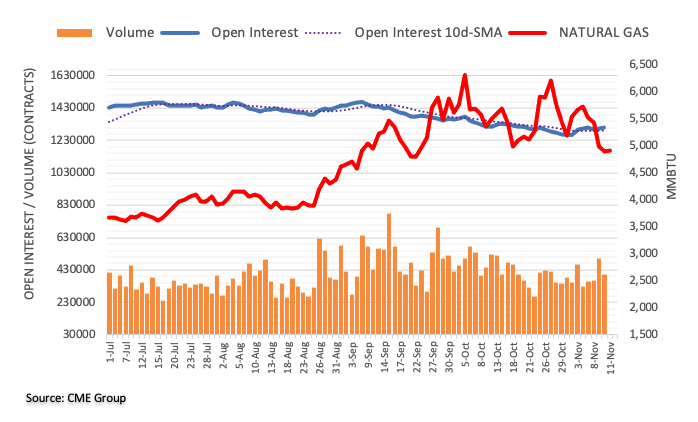
According to preliminary readings from CME Group for crude oil futures markets, traders trimmed their open interest positions for the fourth consecutive session on Wednesday, this time by around 4.6K contracts. In the same line, volume resumed the downside and shrank by around 14.3K contracts.
WTI remains capped by $85.00
Wednesday’s strong drop in prices of the WTI was amidst shrinking open interest and volume. That said, further losses appear not favoured for the time, while bullish attempts keep targeting the area around the $85.00 mark per barrel.

- Asian equities trade mixed as US banking holiday restricts post-inflation reaction.
- China’s Evergrande misses default for the third time.
- Australia jobs report surprises with downbeat figures, commodities consolidate recent moves.
Asian shares fail to portray market direction as China’s Evergrande saves the bulls even as the US inflation figures roiled market sentiment the previous day. Also troubling the investors is the thin liquidity in the bond markets due to the US banking holiday.
That being said, the MSCI’s index of Asia-Pacific shares outside Japan drops 0.45% whereas Japan’s Nikkei marks half a percent of intraday gains while heading into Thursday’s European session.
Shares in Australia and New Zealand remain on the back foot, ASX 200 and NZX 50 are down 0.60% and 1.2% respectively, as markets remain cautious amid 31-year high US inflation figures that propel Fed rate hike expectations. In doing so, the Aussie traders ignore downbeat employment data for October. Indian markets also print losses amid the inflation woes and recent jump in the COVID-19 cases to the monthly high.
It should be noted, however, that not-so-positive comments from US Trade Representative (USTR) Katherine Tai citing weakness in China’s phase 1 performance test the optimists ahead of next week’s virtual summit of US President Joe Biden and his Chinese counterpart Xi Jinping.
Elsewhere, markets in China and Hong Kong are up after Evergrande surprised traders with the third coupon payment. The real-estate shares are mainly behind the mild run-up in Asia.
On a broader front, S&P 500 Futures print mild gains while the US 10-year Treasury yields cling to 1.57% after rising the most in seven weeks the previous day.
Looking forward, headlines concerning China and Evergrande may entertain traders amid a partial off in the US and Canada.
- USD/TRY renews record top before trading sideways during three-day uptrend.
- RSI conditions hint at pullback inside a three-month-old rising channel, bullish chart pattern keeps buyers hopeful.
- 10-DMA, pennant’s support restrict short-term declines ahead of the channel’s support.
USD/TRY seesaws around $9.8760 after renewing the record top to $9.8810 during the pre-European session on Thursday.
In doing so, the Turkish Lira (TRY) pair justifies the confirmation of a bullish pennant chart pattern inside a short-term rising. However, overbought RSI conditions test the buyers of late.
Even so, the pullback moves remain less important until staying beyond the wedge’s resistance line, now support around $9.7180.
Following that, the 10-DMA and wedge’s lower line, respectively near $9.6925 and $9.5400, could test the USD/TRY bears before dragging them to the stated channel’s support around $9.4970.
Meanwhile, the $9.9000 round figure will precede the $10.00 psychological magnet and the channel’s upper line near $10.1480 to lure the USD/TRY bulls.
USD/TRY: Daily chart

Trend: Further upside expected
Open interest in gold futures markets rose by nearly 24.5K contracts on Wednesday and clinched the fifth consecutive daily build considering flash data from CME Group. In the same line, volume went up by around 150.3K contracts to 443464 contracts, the largest level since May 25.
Gold now looks to 2021 highs past $1,900
Prices of the ounce troy of gold rose to levels last seen in June near $1,870 on Wednesday. The sharp move was on the back of rising open interest and volume, opening the door to the continuation of the uptrend in the very near term. That said, the next level of note now emerges at the YTD high around $1,913 recorded on June 1.

- WTI circumvents around $81.00 as US inflation woes push investors to offload riskier assets.
- The fuel prices stay below 21-day SMA, Biden’s emergency oil inventory release in the pipeline.
- Black gold struggles to keep the rebound, US inflation not greasy enough to provide the push.
West Texas Intermediate (WTI) eases towards $81.00 per barrel, on Thursday, affected by the rise in US dollar prices after the US president Joe Biden said that he has asked National Economic Council to reduce energy costs amid increased inflation. At the time of writing, the WTI is trading 0.1% up at $80.35, after opening at $80.28.
The oil prices were struggling to rise because investors are offloading their riskier assets, including stocks and commodities, in fear that the banks may take steps to curb the rising inflation.
The consumer price index data has jumped 6.2% in October from a year earlier. The numbers may affect the White House and the US Federal Reserve, forcing them to take immediate action.
Earlier, the Energy Information Agency (EIA) said Wednesday that US crude stocks increased by 1 million barrels last week, partly due to a 3.1-million-barrel release from the US Strategic Petroleum Reserve to commercial markets.
President Joe Biden further asked the National Economic Council to help reduce energy costs and the Federal Trade Commission to push back on market manipulation in the energy sector in a bid to slow accelerating inflation. There is also speculation that the US might coordinate with other nations such as Japan in releasing emergency oil inventory.
The US dollar index is up toward 95.00 while the Treasury bond yields gain ground from earlier sessions, trading at 1.57%. A stronger US dollar makes black gold more expensive to foreign currency holders. Analysts believe US oil reserves will address high energy costs and have less impact on the oil market in the short term.
WTI Technical levels
The daily chart indicates that $81.86, the 21-day Simple Moving Average (SMA), remains to be conquered before moving the next barrier to the upside, which is $83.97 and $84.98, the black gold's one week and one month high.
The next upside is noted with 50, 100 and 200-day SMAs, $77.08, $73.56 and $68.71, respectively.
Daily Chart

WTI Additional Levels
The UK Economic Data Overview
The British economic calendar is all set to entertain the cable traders during the dull hours of early Thursday, at 07:00 GMT with the preliminary GDP figures for the Q3 2021. Also increasing the importance of that time are monthly GDP figures for September, Trade Balance, Manufacturing Production and Industrial Production details for the stated period.
Having witnessed a 5.5% jump in economic activities during the previous quarter, market players will be interested in the first estimation of the Q3 GDP figures, expected +1.5% QoQ, to confirm the economic transition amid the covid resurgence fears. Market expectations back +6.8% YoY figures versus +23.6% previous readouts. On the other hand, the GBP/USD traders also eye the Index of Services (3M/3M) for the same period, +3.7% prior, for further insight.
Meanwhile, Manufacturing Production, which makes up around 80% of total industrial production, is expected to ease from +0.5% to +0.2% MoM in September. Further, the total Industrial Production is expected to ease from 0.8% to 0.2% MoM during the stated month.
Considering the yearly figures, the Industrial Production for September is expected to have eased to +3.1% versus +3.7% previous while the Manufacturing Production is also anticipated to have softened to 3.1% in the reported month versus 4.1% last.
Separately, the UK Goods Trade Balance will be reported at the same time and is expected to show a deficit of £14.30 billion versus a £14.92 billion deficit reported in the last month.
Deviation impact on GBP/USD
Readers can find FX Street's proprietary deviation impact map of the event below. As observed the reaction is likely to remain confined around 10-pips in deviations up to + or -2, although in some cases, if notable enough, a deviation can fuel movements over 60-70 pips.
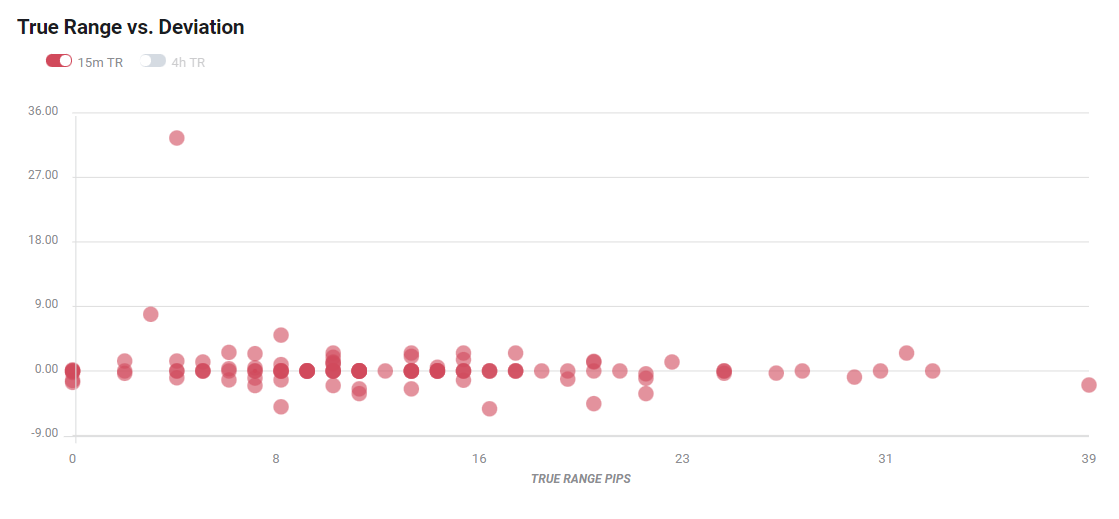
How could affect GBP/USD?
GBP/USD picks up bids to poke intraday high around 1.3815, up 0.05% on a day while heading into Thursday’s London open. In doing so, the cable pair reacts to the US dollar pullback amid a lackluster day and mildly positive market sentiment.
Given the latest covid resurgence and variant fears in the UK, today’s British data dump will be the key to gauge the economic recovery. Also highlighting the importance of the data is the latest shift in the Bank of England (BOE) policymakers’ bullish bias from strong to moderate. Hence, the UK data will offer additional clues to the tapering chatters but are less likely to move the GBP/USD prices unless portraying a notable move from the previous quarter.
Ahead of the release, TD Securities said,
We look for a flat month for September GDP (market forecast: 0.5% m/m) as staycations ended and the petrol crisis weighed on activity. Manufacturing likely fell relatively sharply (-1.5%, expectations: 0.2%) on supply constraints, while the service sector was likely flat in the month (market consensus: 0.6%) as activity returned to normal after the summer holidays. This would leave Q3 GDP growth tracking 1.3% q/q, just a couple of ticks below the BoE's recent forecast and the market consensus of 1.5% q/q.
Technically, the cable pair’s corrective pullback may aim for 50% Fibonacci retracement (Fibo.) of a run-up from September 2020 to June 2021, around 1.3460. However, the rebound remains doubtful until staying below July’s bottom near 1.3575, a break of which will direct the quote towards the 50-DMA level of 1.3677.
Key notes
UK flash Q3 GDP growth may not be a game changer for pound
GBP/USD: Five scenarios for trading UK Q3 growth figures + technical levels
About the UK Economic Data
The Gross Domestic Product released by the Office for National Statistics (ONS) is a measure of the total value of all goods and services produced by the UK. The GDP is considered as a broad measure of the UK economic activity. Generally speaking, a rising trend has a positive effect on the GBP, while a falling trend is seen as negative (or bearish).
The Manufacturing Production released by the Office for National Statistics (ONS) measures the manufacturing output. Manufacturing Production is significant as a short-term indicator of the strength of UK manufacturing activity that dominates a large part of total GDP. A high reading is seen as positive (or bullish) for the GBP, while a low reading is seen as negative (or bearish).
The trade balance released by the Office for National Statistics (ONS) is a balance between exports and imports of goods. A positive value shows trade surplus, while a negative value shows trade deficit. It is an event that generates some volatility for the GBP.
- EUR/USD remains pressured around 16-month low, grinds lower of late.
- US bank holiday, light calendar allows bears to take a breather, Evergrande updates are important too.
- US CPI jumped to 31-year high, German inflation matches initial forecasts.
- Fed v/s ECB rate-hike race keeps bears hopeful, China news, light calendar can probe intraday sellers.
EUR/USD treads water around 1.1475, after refreshing the multi-day-old trough heading into Thursday’s European session.
The major currency pair witnessed a heavy blow due to the 31-year high US inflation but bank holiday in America restricts the pair’s moves of late. On the same line could be the headlines concerning China’s struggling real-estate player Evergrande and the Fed policymakers’ attempt to defend the easy-money settings.
The US Consumer Price Index (CPI) jumped to a three-decade high of 6.2% YoY and bolstered Fed rate hike expectations the previous day. The monetary policy views propelled the US Treasury yields to mark the heaviest rise in seven weeks, as well as fuelled the US Dollar Index (DXY).
Following the US CPI release, Patrick Timothy Harker and Mary C Daly, respective Presidents of the Federal Reserve Bank of Philadelphia and San Fransisco, tried to defend the Fed doves. Mr. Harker highlighted the possibilities of a rate hike even while tapering is on whereas Fed’s Daly said, per Reuters, that it would be premature to change the calculation on raising rates.
Elsewhere, news that China’s Evergrande made interest payment to the tune of $148 million on Wednesday, avoiding a default third time in the line, seems to have underpinned the mild risk-on mood amid the quiet markets and probed the EUR/USD bears.
It’s worth noting that Germany’s Harmonized Index of Consumer Price (HICP), the headline inflation figure, matched 0.5% MoM and 4.6% YoY initial estimations for October.
Even so, not-so-positive comments from US Trade Representative (USTR) Katherine Tai citing weakness in China’s phase 1 performance test the optimists ahead of next week’s virtual summit of US President Joe Biden and his Chinese counterpart Xi Jinping. The same keeps the pair sellers hopeful amid brighter chances of the Fed to precede the ECB in the rate lift-off.
Amid these plays, stock futures struggle for clear direction and the Asia-Pacific indices trade mixed by the press time.
Given the off in the US banks, EUR/USD traders may witness a lackluster day as the European calendar also remains dull. However, risk catalysts like Evergrande, China and a race between the Fed and the European Central Bank (ECB) to rate hike may entertain the pair watchers.
Technical analysis
A five-month-old descending trend line joins June 2020 peak to highlight the 1.1425-20 level as a tough nut to crack for the EUR/USD bears amid oversold RSI conditions. However, the corrective pullback will be challenged by October’s low and 20-DMA, respectively near 1.1525 and 1.1595.
- USD/INR eases from weekly top after two-day uptrend.
- US inflation jumps to a 31-year high in October, fuels Fed rate hike concerns.
- News from China’s Evergrande tests pair buyers amid a sluggish session.
USD/INR retreats from one week high to 74.40 heading into Thursday’s European session. In doing so, the Indian rupee (INR) pair tests the buyers after a two-day uptrend while also challenging the previous day’s gains, due to the strong US Consumer Price Index (CPI) data. The reason could be linked to the recent consolidation in the market sentiment.
Risk appetite improves after the US inflation data blew optimists the previous day, underpinned the US Treasury yields and the US dollar. That said, the headlines CPI jumped to a three-decade high of 6.2% YoY and bolstered Fed rate hike expectations.
Following that, mixed comments from the Fed policymakers seemed to have placated the bears. Patrick Timothy Harker and Mary C Daly, respective Presidents of the Federal Reserve Bank of Philadelphia and San Fransisco, tried to defend the Fed doves. Mr. Harker highlighted the possibilities of a rate hike even while tapering is on whereas Fed’s Daly said, per Reuters, that it would be premature to change the calculation on raising rates.
Elsewhere, news that China’s Evergrande made interest payment to the tune of $148 million on Wednesday, avoiding a default third time in the line, also favored the mild risk-on mood amid the quiet markets.
Alternatively, not-so-positive comments from US Trade Representative (USTR) Katherine Tai citing weakness in China’s phase 1 performance test the optimists ahead of next week’s virtual summit of US President Joe Biden and his Chinese counterpart Xi Jinping. On the same line were India’s latest covid updates citing the biggest daily jump in infections since October 30, 13,091 versus 11,466 reported the previous day.
It’s worth noting that the US banking holiday restricts bond market moves and hence backs the latest consolidation in the markets, allowing stock futures and Asian equities to lick their wounds.
However, the Fed rate hike risk remains on the table while the Reserve Bank of India (RBI) hasn’t yet shown any sign of monetary policy tightening, which in turn keeps the USD/INR buyers hopeful.
Technical analysis
A bullish crossover of the 50-DMA to the 100-DMA joins a steady RSI line to direct USD/INR buyers towards a monthly resistance line near 74.95. Alternatively, the stated DMAs restrict immediate downside around 74.35-30.
- USD/CAD renews monthly high, steady around multi-day top of late.
- Convergence of 100, 50-DMA challenges further upside moves.
- Two-week-old support line tests pullback moves amid firmer Momentum line.
USD/CAD bulls take a breather after refreshing the monthly peak with 1.2511 during early Thursday.
Sustained trading beyond a fortnight-long support line joins firmer Momentum line to keep buyers hopeful. However, a convergence of the 100-DMA and 50-DMA near 1.2535-40 becomes a tough nut to crack for the bulls.
Should the quote rises past 1.2540, 38.2% Fibonacci retracement (Fibo.) of June-August upside, around 1.2590 will precede the 1.2600 threshold to add to the upside filters.
Meanwhile, pullback moves remain less problematic until staying beyond the stated support line around 1.2440.
Following that, the 61.8% Fibo. and an upward sloping trend line from June, respectively around 1.2365 and 1.2330, gains the market’s attention before confirming the bearish trend.
USD/CAD: Daily chart
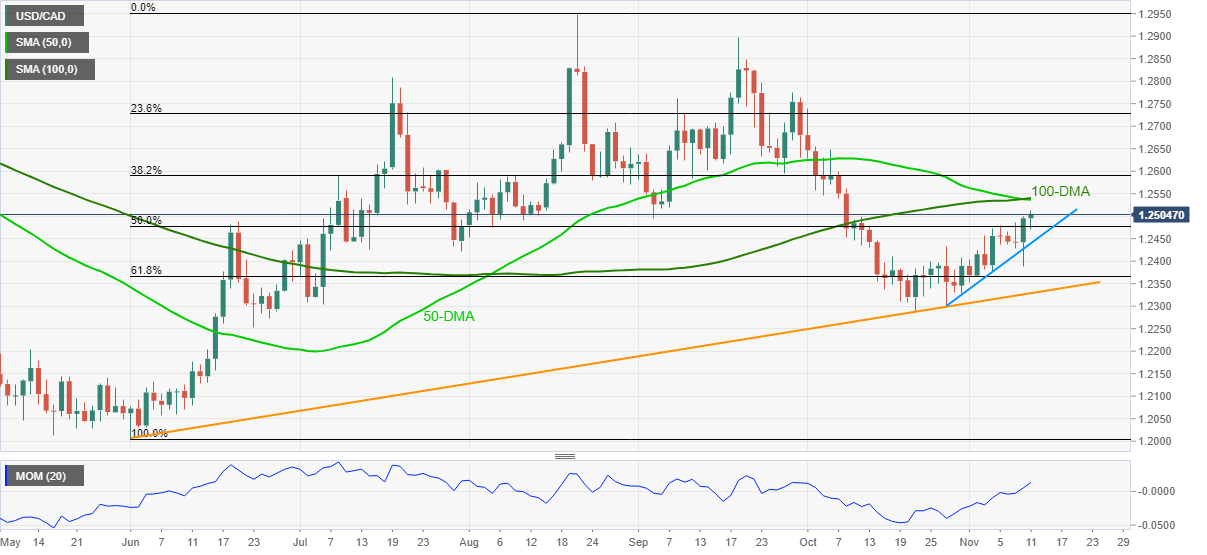
Trend: Further upside expected
Heading towards 2022, Goldman Sachs strategists laid out the key themes and top trades to look forward to, in the face of a “lower-octane” phase of the worldwide recovery, per Bloomberg.
Key quotes
“Divergence in the outlook for monetary policies and risks to China’s expansion are among other key themes.”
“Among the top trade ideas are shorting the Australian dollar versus Canada’s currency. That’s partly on a bullish view on oil and Australia’s exposure to metals prices and downside risks to China’s economy. Australia is also expected to raise interest rates more slowly than Canada.”
“Advise buying US dollar five-year breakevens on a bet inflation will accelerate.”
“Recommend going long on copper and Brent oil contracts for the end of 2023, as those markets are cyclically tight, with the forwards “nowhere near the necessary incentive level for higher activity.”
Must read: Top commodities to trade amid global reflation: Silver and copper to outshine gold price
- USD/JPY refreshes weekly top during two-day rebound, grinds higher of late.
- Evergrande avoids another default, US bank holidays limit moves of Treasury yields.
- Fed rate hike, phase 1 fears remain on the table.
- Fewer data/events keep risk catalysts on the driver’s seat.
USD/JPY extend US inflation-led gains towards renewing the one-week top around 114.10 during early Thursday.
The risk barometer previously cheered a jump in the US Treasury yields to portray the biggest daily jump in a month. However, an off in the US banks limit the market moves afterward. Even so, sentiment-positive headlines from China allowed the quote to stay firmer.
The US Consumer Price Index (CPI) jumped to a three-decade high of 6.2% YoY and bolstered Fed rate hike expectations the previous day. The monetary policy views propelled the US Treasury yields to mark the heaviest rise in seven weeks, as well as fuelled the US Dollar Index (DXY).
Recently, news that China’s Evergrande made interest payment to the tune of $148 million on Wednesday, avoiding a default third time in the line, seems to have underpinned the mild risk-on mood amid the quiet markets. Mixed comments from the Fed policymakers could also be held responsible for the latest USD/JPY moves.
Patrick Timothy Harker and Mary C Daly, respective Presidents of the Federal Reserve Bank of Philadelphia and San Fransisco, tried to defend the Fed doves. Mr. Harker highlighted the possibilities of a rate hike even while tapering is on whereas Fed’s Daly said, per Reuters, that it would be premature to change the calculation on raising rates.
It should be noted, however, that not-so-positive comments from US Trade Representative (USTR) Katherine Tai citing weakness in China’s phase 1 performance test the optimists ahead of next week’s virtual summit of US President Joe Biden and his Chinese counterpart Xi Jinping.
Against this backdrop, S&P 500 Futures print mild gains and the Asian stocks are mixed as well. However, the inactivity in the bond markets disappoints momentum traders.
Moving on, the US bank holiday will join the off in Canada to restrict USD/JPY moves but news concerning Evergrande, China and rate hike may entertain the traders.
Technical analysis
A three-week-old resistance near 114.20 restricts short-term upside moves but a clear break of the 20-DMA, around 113.85 at the latest, keeps buyers hopeful.
- AUD/USD bears stay in control with eyes on 0.73 the figure.
- A break of 0.7300 opens risk to the 0.7280s for the sessions ahead.
AUD/USD fell on Wednesday and extended losses in Thursday's Asian session following a surprisingly strong US Consumer Price Index report and a shockingly poor Aussie jobs event. AUD/USD has fallen from 0.7393 to a low of 0.7315 since the start of yesterday's trade.
The momentum indicators are pointing towards further declines ahead which leave 0.7300 the figure vulnerable. A break of the level will then expose the start of October's territories to around 0.7280 for which is illustrated in the following daily chart analysis:
AUD/USD daily charts
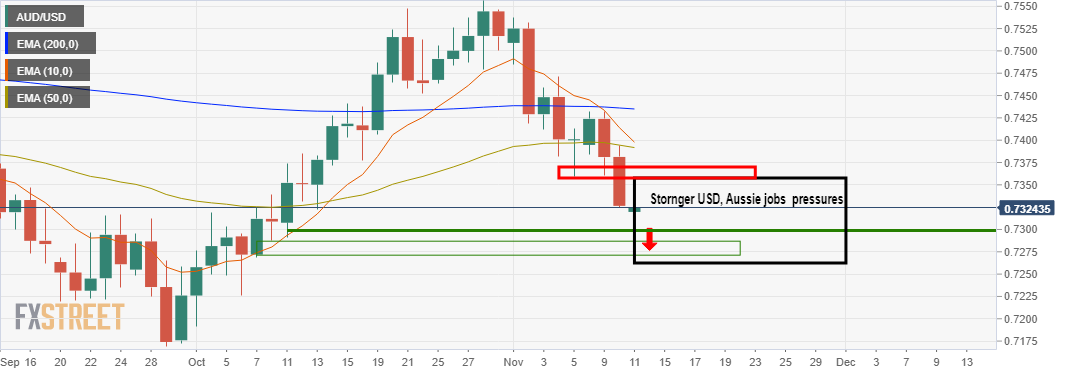
The price is now below the 50-EMA on the daily time frame as pressures mounted below the 200-EMA at the start of the month. However, there are also the probabilities of an upside correction first:

The imbalance left with prices shooting lower as far as they have ad beyond the daily ATR would be expected to be followed by a correction in due course. However, the momentum is with the bears at the moment.
- GBP/JPY stays around a multi-week low 153.00 amid risk-averse sentiment.
- Japan’s PPI rose to 0.3%, rising past market expectations.
- The pairs look for impetus from UK GDP data for momentum.
GBP/JPY snaps its downtrend, trading around 153.00 during the Asian session on Thursday. The cross takes a cue from US inflation data over the domestic issues in the UK and Japan.
The pair managed to stop its erosion from November 4 highs, attempting a tepid bounce amid a cautious market mood, The preliminary estimate of Q3 UK GDP data due later this Wednesday can provide the impetus to the pair.
Meanwhile, the Brexit drama and the subsequent trade war still brew, with the UK on the cusp of escalating tensions with the EU and even putting the post-Brexit trade deal at risk if it opts to trigger Article 16 of the Northern Ireland Protocol (which allows either side to unilaterally suspend parts of the agreement if it is causing significant societal damage).
Traders digest Japan’s Producer Price Index (PPI) for October, which rose past 0.3% market forecast to arrive 1.2% on MoM in the reported month. The US inflation worked in favor of the US dollar, which has put pressure on the yen.
GBP/JPY Technical Levels
The GBP/JPY daily chart indicates that it is facing an upside barrier from 50-day Simple Moving Average (SMA) and 21-day SMA 153.28 and 155.57. The next resistance in the bulls way that can be tested is 158.22, it's one month high.
The price may reverse and breach its first support 152.06 (100-day SMA) and continue the downtrend towards the support level 152.64, 200-day SMAs. If it continues further south, its one-month low can be tested at 149.23.
Daily Chart
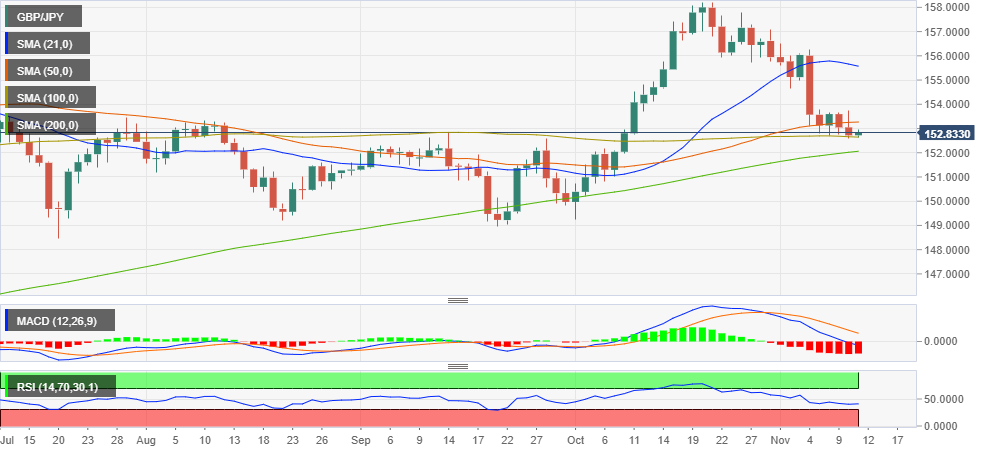
GBP/JPY Additional levels
| Raw materials | Closed | Change, % |
|---|---|---|
| Brent | 82.81 | -3.27 |
| Silver | 24.603 | 1.31 |
| Gold | 1848.737 | 0.94 |
| Palladium | 2016.98 | 0.04 |
China Evergrande, the country’s indebted real estate giant avoided a formal default yet again after a bondholder said that the company made interest payment to the tune of $148 million on Wednesday, meeting the payment deadline.
Key takeaways (via NY Times)
“Evergrande owed investors interest payments totaling nearly $150 million on three bonds, with the grace periods for those payments set to expire on Wednesday.”
“On Wednesday, the company met its interest payment deadline for bonds that mature in 2022 and 2023.”
“The company has managed to leap from one deadline to the next, meeting its obligations at the last minute — but often without explaining how or even publicly disclosing that it had done so. “
Despite the upbeat news, S&P Global Ratings warned over rising contagion risks emanating from China’s residential property market.
“Huarong and Evergrande impact have been largely contained within China speculative-grade bonds, but headlines hit home buyer sentiment and is spreading contagion in the residential market,” S&P Ratings said on Thursday.
- NZD/USD remains depressed around monthly low, 50% Fibonacci retracement of May-August fall.
- Bearish MACD, failures to cross 50-day EMA keep sellers hopeful.
NZD/USD takes offers around 0.7060, after testing the lowest levels since October 18 during early Thursday. The kiwi pair dropped the most in a week to decline to the three-week low the previous day.
The US inflation data-led downside also gains support from the sustained trading below 50-day EMA and the bearish MACD signals.
Hence, the 200-day EMA level of 0.7035 remains on the table while the 0.7000 threshold may challenge the NZD/USD bears afterward. It’s worth noting that the early October peak close to 0.6985 adds to the downside filters.
On the flip side, buyers need a daily closing past 50-day EMA level of 0.7075 to aim for the 61.8% Fibonacci retracement (Fibo.) level of 0.7120.
It’s worth noting that the NZD/USD upside beyond 0.7120 will be challenged by the tops marked in September and October, respectively near 0.7170 and 0.7220.
Overall, NZD/USD remains on the bearish consolidation mode before visiting multiple supports around 0.6930.
NZD/USD: Daily chart

Trend: Further downside expected
- GBP/USD bears are stepping up in droves as Brexit woes dig in.
- US CPI sent the greenback on a tear and the divergence between BoE and the Fed is taking its toll on GBP.
Sterling is still reeling from the affects of the the Bank of England's decision on 4 Nov to hold the bank rate at 0.1%. However, data in the US on Wednesday turned the screw and sank cable even lower at the same time that Brexit woes ave reared their ugly head.
At the time of writing, GBP/USD is sitting at 1.3407, up from the lows of the day so far, printed at 1.3398 in te last hour and down from 1.3419 the highs. Cable extended the overnight drop in a follow through from negative sentiment surrounding Britain's and the European Union tustle over the post-Brexit agreement on Northern Ireland.
GBP/USD bearish fundamentals in play
"Downside risk may emerge for the pound in the coming days as it looks increasingly likely that the UK will unilaterally suspend parts of the Northern Ireland Protocol," analysts at ING reported overnight in a note.
Sterling went on to break the five-week low touched after BoE surprised investors last week by leaving its main interest rate unchanged at 0.1%. It was helped along by best that the Federal Reserve will need to hike rates sooner than expected following a surprisingly strong US Consumer Price Index print. It was a result that had markets wrong footed.
The dollar DXY soard against a basket of currencies after data showed that CPI had surged at their highest rate since 1990. The outcome boosted speculation the Federal Reserve could change its view that inflation is transitory and raise interest rates.
Meanwhile, markets are now pricing in a December interest rate hike by the BoE. However, other findamematls are playing their roln in the pound's downfall and uncertainty around the BoE still remains high. "Despite the prospect that the Bank may still choose to raise rates next month, its recent downward revision to the UK growth outlook and its expectation that unemployment will be trending higher by 2024 is suggestive of a cautious policy outlook," argued Jane Foley, head of FX Strategy at Rabobank.
- Gold snaps five-day uptrend to step back from the highest levels since June.
- Market sentiment dwindles as US banking holiday restricts bond moves.
- Evergrande, Fed rate hike and Sino-American phase 1 deal in focus.
- Gold Price Forecast: XAU/USD jumps with US inflation, more gains in the docket
Gold (XAU/USD) bulls step back from multi-month high, down 0.26% intraday around $1,848 during a quiet Asian session on Thursday.
The metal jumped to the highest in five months, also crossed the key upside hurdles near $1,832-34, after the US Consumer Price Index (CPI) jumped to the 30-year high of 6.2% YoY and bolstered Fed rate hike expectations. However, an off in the US bond markets recently limit the market’s reaction.
Even so, talks that China’s struggling real-estate major Evergrande has officially defaulted join the Sino-American tussles over the Phase 1 deal ahead of the next week's summit between US President Joe Biden and his Chinese counterpart Xi Jinping challenge market sentiment. The same highlights gold’s safe-haven demand and put a floor beneath the latest weakness.
That said, a German market screening agency DMSA (Deutsche Marktscreening Agentur) is up for official notification of Evergrande’s bankruptcy after the Chinese firm missed the latest coupon payment. On the other hand, US Trade Representative (USTR) Katherine Tai cited weakness in China’s phase 1 performance.
Amid these plays, the S&P 500 Futures print mild gains while the stocks in Asia-Pacific remain sidelined. It’s worth noting that the US 10-year Treasury yields posted the biggest daily jump in seven weeks, around 1.57%, the previous day.
Moving on, headlines concerning China and Evergrande may entertain gold traders amid a light calendar and US banking holiday. However, a successful break of the key upside barrier and the Fed rate hike chatters can favor buyers.
Technical analysis
Gold buyers finally managed to cross the $1,832-34 key resistance comprising a 15-month-old descending trend line and a horizontal region comprising highs marked in July and September.
This, in turn, allows them to probe 50% Fibonacci retracement (Fibo.) of a downturn from August 2020 to March 2021, near $1,875. Though, a daily closing beyond the immediate resistance around $1,850, including lows marked in September and November 2020, becomes necessary for the bulls to keep marching higher.
It should be noted, however, that the RSI conditions are close to the overbought limits and hence further advances may require a pullback. The same highlights the early June’s low near $1,856 as an additional filter to the north.
Meanwhile, gold sellers may not risk entries, not even for the short-term, until the quote stays beyond $1,832, a break of which will need validation from the 38.2% Fibo. level close to $1,828.
Even if the gold prices drop below $1,828, October’s high surrounding $1,813 and the $1,800 threshold will be key challenges for the bears before targeting the 200-DMA level around $1,790.
Gold: Daily chart
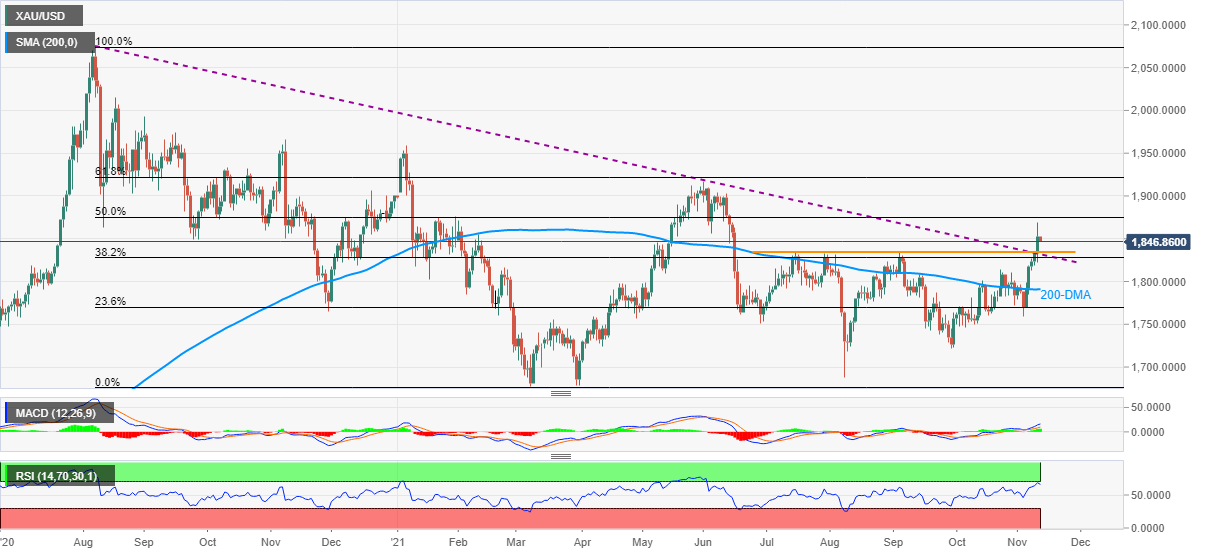
Trend: Further upside expected
The newly appointed Japanese Foreign Minister Yoshimasa Hayashi said on Thursday, said that it is important to build constructive and stable ties with China.
He added that it is important to deepen the Japan-US alliance.
Market reaction
USD/JPY was last seen trading at 114.06, up 0.14% on the day.
- USD/JPY soars to test 114 with more to go, 114.50 eyed for days ahead
In an update to the progress being made on the Uk's Free Trade Agreement (FTA), an agreement in principle has been reached.
Analysts at ANZ bank explained that negotiators now have to agree on the final text, the agreement needs to be signed, and finally ratified before coming into force.
''The FTA is expected to have greater economic benefits for New Zealand than for the UK, but the agreement does provide a path for the UK to gain better access to Asian markets,'' the analysts said.
''The in-principle agreements reached by New Zealand and Australia for their respective FTAs with the UK are very similar.''
Market implications
Prime Minister Boris Johnson said the deal will cut costs for exporters and open up New Zealand's job market to UK professionals.
However, the New Zealand deal itself is unlikely to boost UK growth, according to the government's own estimates and only a very small proportion of UK trade is actually done with New Zealand, (less than 0.2%). Therefore, this is unlikely to move the needle when it comes to the pound.
However, it could be more favourable to New Zealand. Analysts at ANZ Bank said ''initial modelling by the UK suggests the agreement could result in a 40% increase in NZ exports to the UK and a 7.3% increase in UK exports to NZ.
Overall, it's positive news for both sides, especially given the UK's recent breakup with the EU. This deal also ''provides a pathway to improving economic ties between the UK and Asia as this agreement is seen as a step towards accession to the Comprehensive and Progressive Agreement for Trans-Pacific Partnership (CPTPP),'' the analysts at ANZ noted.
US Senator Joe Manchin is seen holding back President Joe Biden’s Build Back Better agenda until next year, in the face of growing inflation worries, Axios reports, citing people familiar with the matter.
With inflation concerns mounting, it could potentially kill a quick deal on the $1.75 trillion package, the sources added.
Immediately after the US Consumer Price Index (CPI) data released on Wednesday, Manchin tweeted out, “by all accounts, the threat posed by record inflation to the American people is not "transitory" and is instead getting worse. From the grocery store to the gas pump, Americans know the inflation tax is real and DC can no longer ignore the economic pain Americans feel every day.”
Market reaction
The US dollar is undeterred by these headlines, as it makes fresh yearly highs against its main rivals at 94.94.
As of writing, the index is modestly flat on the day, trading at 94.90.
| Time | Country | Event | Period | Previous value | Forecast |
|---|---|---|---|---|---|
| 00:30 (GMT) | Australia | Changing the number of employed | October | -141.1 | 50 |
| 00:30 (GMT) | Australia | Unemployment rate | October | 4.6% | 4.8% |
| 07:00 (GMT) | United Kingdom | Manufacturing Production (MoM) | September | 0.5% | 0.2% |
| 07:00 (GMT) | United Kingdom | Industrial Production (MoM) | September | 0.8% | 0.2% |
| 07:00 (GMT) | United Kingdom | Manufacturing Production (YoY) | September | 4.1% | 3.1% |
| 07:00 (GMT) | United Kingdom | Business Investment, y/y | Quarter III | 12.9% | |
| 07:00 (GMT) | United Kingdom | Business Investment, q/q | Quarter III | 4.5% | 2.6% |
| 07:00 (GMT) | United Kingdom | Industrial Production (YoY) | September | 3.7% | 3.1% |
| 07:00 (GMT) | United Kingdom | Total Trade Balance | September | -3.7 | |
| 07:00 (GMT) | United Kingdom | GDP m/m | September | 0.4% | 0.4% |
| 07:00 (GMT) | United Kingdom | GDP, y/y | Quarter III | 23.6% | 6.8% |
| 07:00 (GMT) | United Kingdom | GDP, q/q | Quarter III | 5.5% | 1.5% |
| 07:00 (GMT) | United Kingdom | GDP, y/y | September | 6.9% | 5.4% |
| 09:00 (GMT) | Eurozone | ECB Economic Bulletin | |||
| 14:00 (GMT) | United Kingdom | NIESR GDP Estimate | October | 1.5% | |
| 21:30 (GMT) | New Zealand | Business NZ PMI | October | 51.4 |
- AUD/NZD portrays bearish chart formation to keep sellers hopeful, MACD signals are in line too.
- 200-HMA adds to the upside filters, bears aim for yearly low.
AUD/NZD consolidates the previous day’s losses around 1.0375, down 0.05% intraday following the downbeat Aussie jobs report publication during early Thursday.
Read: Breaking: Australian jobs report is not looking good for AUD bulls
The cross-currency pair remains inside a bearish chart pattern called rising wedge on the hourly (H1) play amid the bearish MACD signals.
The same favor sellers to aim for the yearly bottom of 1.0278 on the break of the wedge’s support of 1.0350. However, any further weakness will be challenged by the August 2019 low near 1.0260.
Meanwhile, the corrective pullback may aim for the wedge’s resistance line around 1.0400, a break of which will be challenged by the 200-HMA level of 1.0410 and Friday’s top of 1.0435.
Even if the quote rises past 1.0435, the monthly peak around 1.0490 and the 1.0500 threshold will challenge the bulls.
AUD/NZD: Hourly chart

Trend: Further weakness expected
In recent trade today, the People’s Bank of China (PBOC) set the yuan (CNY) at 6.4145 vs the previous fix of 6.3948 and the prior close of 6.3897. The estimate was at 6.4110.
About the fix
China maintains strict control of the yuan’s rate on the mainland.
The onshore yuan (CNY) differs from the offshore one (CNH) in trading restrictions, this last one is not as tightly controlled.
Each morning, the People’s Bank of China (PBOC) sets a so-called daily midpoint fix, based on the yuan’s previous day closing level and quotations taken from the inter-bank dealer.
- AUD/JPY prints downtick as Australia employment data surprises markets.
- Australia Employment Change remained in contraction zone, Unemployment Rate jumped to six-month high.
- Risk appetite adds to the downside pressure but US bank holiday limits intraday moves.
AUD/JPY remains pressured around 83.45 after marking a downtick to refresh the daily low following the Aussie Employment report on early Thursday.
Australia Employment Change dropped below a +50.0K forecast to -46.3K figures, versus -138K prior, whereas the Unemployment Rate jumped past 4.6% previous readouts and 4.7% market consensus to 5.2% in October. It’s worth noting that the Aussie Consumer Inflation Expectations for November jumped past 3.6% prior to 4.6%.
Read: Breaking: Australian jobs report is not looking good for AUD bulls
On the other hand, Japan’s Producer Price Index (PPI) for October rose past 0.3% market forecast to 1.2% on MoM.
In addition to the downbeat Aussie data, the market’s fears of no more easy money from the global central banks, led by the US Federal Reserve (Fed) weigh on the sentiment and the AUD/JPY prices. The rake hike fears elevated after the US reported a 30-year high in the headlines inflation figures.
Also challenging the market’s mood were the concerns over China’s Evergrande reporting the default and the comments from US Trade Representative (USTR) Katherine Tai citing weakness in China’s phase 1 performance.
Although the downbeat Aussie jobs report defies the RBA rate hike concerns and joins the risk-off mood to keep sellers hopeful, an absence of US bond trading restricts the AUD/JPY pair’s recent performance. A light calendar could also be held responsible for the pair’s latest inaction. However, headlines concerning China’s Evergrande and the Sino-American phase 1 deal may entertain the intraday traders.
Technical analysis
Although the cross-currency pair’s early Wednesday gains saved it from a negative daily closing, bearish MACD signals and a sustained following up of the descending resistance line from November 02 keep the sellers hopeful. However, the 200-DMA level near 82.85 becomes a tough nut to crack for the bears before taking entries. Alternatively, a clear upside break of the immediate resistance line, close to 83.65 by the press time, isn’t a green pass to the pair bulls as lows marked during the late October, surrounding 84.60, adds to the upside filters.
- AUD/USD takes offers to refresh monthly low following the downbeat Aussie jobs report.
- Australia Employment Change marked slower improvement than forecast, Unemployment Rate jumped past expectations in October.
- Market sentiment remains sour as reflation fears join US-China trade tussles and Evergrande woes, US bank holiday restricts momentum.
- Risk catalysts keep the driver’s seat amid light calendar.
AUD/USD marks a 20-pip downtick to refresh the one-month low around 0.7315, down for the third consecutive day, following the Aussie jobs figures published during early Thursday. Following the US inflation-led blow, weaker-than-expected employment data from Australia exert additional downside pressure on the quote. However, the US bank holidays restrict the market moves of late.
That said, the Australian Employment Change defied a +50.0K forecast with -46.3K figures, versus -138K prior, whereas the Unemployment Rate rose past 4.6% previous readouts and 4.7% market consensus to 5.2% in October. It’s worth noting that the Aussie Consumer Inflation Expectations for November jumped past 3.6% prior to 4.6%.
Read: Breaking: Australian jobs report is not looking good for AUD bulls
Given the Aussie jobs report allow the Reserve Bank of Australia (RBA) doves to reiterate the conditions for announcing a rate hike, even as the inflation does pick up, the AUD/USD bears seem to have a further downside to track. Also challenging the quote are the sentiment-negative headlines concerning China’s Evergrande and the Sino-American trade deal, due to the pair’s risk barometer status.
Talks that China’s struggling real-estate major Evergrande has officially defaulted as the DMSA - Deutsche Marktscreening Agentur (German Market Screening Agency), is up for preparing for the firm’s bankruptcy filing, per the Daily Express, weigh on the risk appetite. On the same line were comments from US Trade Representative (USTR) Katherine Tai citing weakness in China’s phase 1 performance. It’s worth noting that US President Joe Biden and his Chinese counterpart Xi Jinping are up for a virtual meeting in the next week.
It’s worth noting that a 30-year high US Consumer Price Index (CPI) of 6.2% YoY bolstered Fed rate hike expectations and propelled the US Treasury yields, as well as the US Dollar Index (DXY), the previous day. Though, a bank holiday in America restricts the market’s recent moves.
Even so, headlines concerning China and Evergrande may keep entertaining the AUD/USD traders.
Technical analysis
Given the AUD/USD pair’s downside break of the 61.8% Fibonacci retracement (Fibo.) of September-October upside, around 0.7320, sellers are likely set to aim for 11-week-old horizontal support near 0.7220. It’s worth noting that a convergence of the 50-DMA and the 100-DMA near 0.7370-75 acts as the key upside barrier.
Australia’s monthly labour market data has been released as follows and it is not going to be favourable to AUD:
Australian Employment Change Oct: -46.3K (exp 50.0K; prev -138.0K).
Unemployment Rate Oct: 5.2% (exp 4.8%; prev 4.6%).
Participation Rate Oct: 64.7% (exp 64.8%; prev 64.5%)
AUD/USD is moving lower on the release, losing some 0.13% at the time of writing:

More to come...
- DXY bulls take a breather after refreshing multi-day top.
- Sustained break of 200-week SMA, seven-month-old resistance line direct bulls to June 2020 trough.
- 38.2% Fibonacci retracement offers immediate support before August month’s peak.
US Dollar Index (DXY) pares recent gains below the 95.00 threshold during an inactive Asian session on Thursday. The greenback gauge jumped to the highest levels since July 2020 the previous day while also crossing an ascending resistance line from April and 200-week SMA.
In addition to clearing the key upside hurdles, namely the stated SMA and trend line, bullish MACD signals also keep the DXY buyers hopeful.
Hence, the upside momentum is likely on the way to the June 2020 low near 95.70 before challenging the 50% Fibonacci retracement (Fibo.) of March 2020 to January 2021 downside, near 96.10.
However, 61.8% Fibo. level surrounding 97.75 offers a tough nut to crack for the US Dollar bulls afterward.
Alternatively, a daily closing below the resistance-turned-support line near 94.75 will aim for the 38.2% Fibonacci retracement, around 94.50.
In a case where the DXY remains weak past 94.50, August month’s high and October’s low, respectively around 93.70 and 93.25, will be in focus.
DXY: Weekly chart
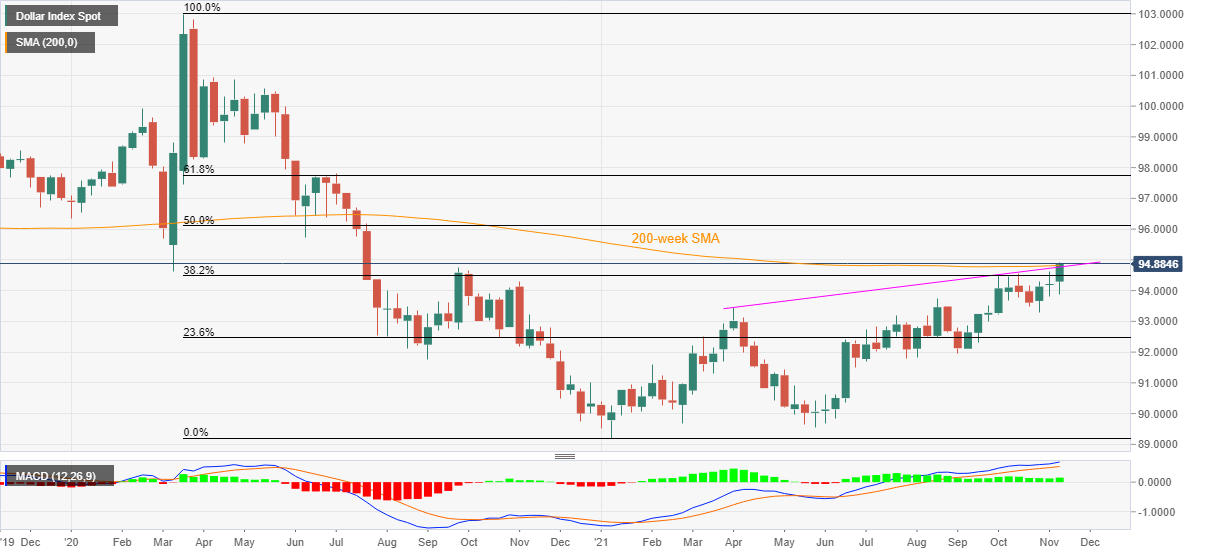
Trend: Further upside expected
| Pare | Closed | Change, % |
|---|---|---|
| AUDUSD | 0.73251 | -0.73 |
| EURJPY | 130.712 | -0.04 |
| EURUSD | 1.14759 | -0.99 |
| GBPJPY | 152.646 | -0.2 |
| GBPUSD | 1.34012 | -1.1 |
| NZDUSD | 0.70568 | -0.99 |
| USDCAD | 1.24957 | 0.51 |
| USDCHF | 0.91811 | 0.78 |
| USDJPY | 113.893 | 0.94 |
- USD/CAD bulls on recess amid soaring US CPI, highest since 1990.
- WTI weakness, stronger US dollar frown upon the pair’s health.
- The loonie scours for impetus from external factors amid light economic activity.
USD/CAD weakened to trade around 1.2540, near to levels not seen since October 11 amid a stronger US dollar and lower oil prices. DXY, an index that measures the greenback vs a basket of major rivals, gained ground towards a one-year high after data on US consumer inflation showed that prices soared 6.2% in October. The US Consumer Price Index came in above market expectations and was the highest annual increase since 1990. The outcome has reinforced market bets that a rate hike in the US might come earlier.
US CPI spiked, Inflation concern broadened
Consumer prices in the US rose 0.9% MoM in October, up 6.2% YoY, ahead of consensus expectations of a 0.6% MoM (5.9% YoY) lift. Core inflation (which excludes food and energy) was up 0.6% m/m, or 4.6% YoY. ''There is evidence of upward pressure in underlying inflation as price rises spread beyond factors related to the lifting of COVID restrictions,'' analysts at ANZ Bank explained.
''The ‘transitory’ inflation argument is coming under increasing scrutiny, and the risk of a policy error on inflation has the potential to unsettle risk appetite. Since last week’s FOMC meeting, Fed speakers have argued that the risks to inflation lie to the topside,'' the analysts at ANZ Bank added.
WTI and Canadian jobs market in focus
Meanwhile, one of Canada’s major exports, WTI crude, snapped a three-day rally to trade down below $81.50 a barrel dragged by loosening inventory levels and a stronger US dollar.
The US also increased pressure on oil markets, analysts at ANZ Bank noted, with President Biden asking his economic advisors to explore ways to lower energy prices. ''There is growing speculation that the US might coordinate releases of inventory with other nations, such as Japan. Signs of weaker demand also weighed on sentiment.''
Besides, traders will keep in mind that last week's key domestic data showed that Canada added 312K jobs in October. This was less than 50K expected. However, it marked the fifth consecutive month with job creation as gains in the private sector continued to offset the poor self-employment performance.
USD/CAD technical levels
According to the daily chart, the loonie is struggling on the upside with resistance at 1.2540 level, where lie both its 100 and 50-day Simple Moving Averages (SMAs). The second barrier to the upside is 1.2739, it’s one month high. If it breaks, the next obstacle that can be tested is 1.2600.
The support level for the pair is at 200-day SMA or 1.2475. The following support for the pair is 21-day SMA 1.2397. The final support is seen at 1.2288 (one month low).
USD/CAD daily chart
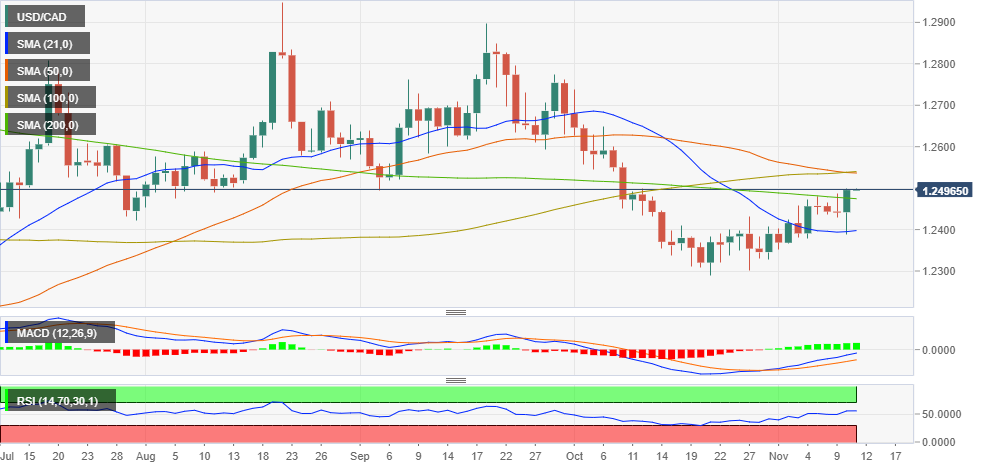
October month employment statistics from the Australian Bureau of Statistics, up for publishing at 00:30 GMT on Thursday, will be the immediate catalyst for the AUD/USD pair traders. The jobs figures become more important after the Reserve Bank of Australia (RBA) Governor Philip Lowe and the RBA Statement on Monetary Policy (SoMP) highlights the need for higher wage growth for the cash rate hike.
Market consensus favors Employment Change to jump from -138K previous readouts to +50K on a seasonally adjusted basis whereas the Unemployment Rate is likely to rise from 4.6% to 4.7%. Further, the Participation Rate may also rise from 64.5% to 64.8%.
TD Securities expect mixed data while saying,
Given that NSW and VIC have significantly eased restrictions in Oct, the RBA will be keenly watching the Oct job numbers to gauge the strength of the rebound in the labor market. The Bank is upbeat and expects jobs to fully recover to pre-Delta levels (Aug) by year-end (as stated in its Nov SoMP). We expect headline employment to rise by 90k (market forecast: 50k, Sep: -138k). We are more bullish than consensus given the better weekly payroll data and robust job vacancies levels. The Participation rate is expected to pick up to 65% in tandem with the reopening, lifting the u/e rate to 4.7% from 4.6%.
Additionally, analysts at Westpac said,
Balancing the start of NSW’s recovery against the last stage of Vic’s lockdown, Westpac anticipates employment to fall by -50k in October (market median is +50k), with risks to the upside. A further decline in participation should limit the rise in the unemployment rate to just 0.1ppt (Westpac f/c: 4.7%).
How could the data affect AUD/USD?
AUD/USD licks its wounds around a monthly low near 0.7330 ahead of the key Aussie data amid a lack of catalysts and the US bank holiday. Even so, fears emanating from China’s Evergrande and updates concerning the Sino-American trade deal weigh on the quote of late.
The recent unlocks in New South Wales (NSW) and Australian Capital Territory (ACT) has already signaled firmer employment data from Australia. However, the RBA has an additional filter namely sustained inflation between 2.0% and 3.0%, other than the tighter labor market and higher wages growth, to unveil confidence over the rate hike. Also, challenging the RBA rate hike is the Fed’s refrain from a rate lift. Hence, the AUD/USD bears may reap the benefit of the doubt and can keep the reins even as employment data matches upbeat forecasts. It should be noted, though, that an extremely strong jobs report may not hesitate to push back the short-term sellers.
Technically, AUD/USD remains below a convergence of the 100-DMA and the 50-DMA, around 0.7370 by the press time, amid bearish MACD. The same hints at the quote’s further weakness towards the 61.8% Fibonacci retracement (Fibo.) level of September-October upside near 0.7320.
Should the data offers positive surprise and recall the AUD/USD buyers, 38.2% Fibo. and the monthly resistance line will check the short-term recovery moves close to 0.7410.
Key Notes
AUD/USD Forecast: Australian employment and inflation to be a make it or break it for the pair
AUD/USD flirts with monthly low under 0.7350, Aussie employment report eyed
Australian Employment Preview: A positive surprise or too much optimism?
About the Employment Change
The Employment Change released by the Australian Bureau of Statistics is a measure of the change in the number of employed people in Australia. Generally speaking, a rise in this indicator has positive implications for consumer spending which stimulates economic growth. Therefore, a high reading is seen as positive (or bullish) for the AUD, while a low reading is seen as negative (or bearish).
About the Unemployment Rate
The Unemployment Rate released by the Australian Bureau of Statistics is the number of unemployed workers divided by the total civilian labor force. If the rate hikes, indicates a lack of expansion within the Australian labor market. As a result, a rise leads to weaken the Australian economy. A decrease of the figure is seen as positive (or bullish) for the AUD, while an increase is seen as negative (or bearish).
- Silver retreats from multi-month high, mildly offered of late.
- Reflation fears join Evergrande woes to weigh on sentiment.
- US bank holiday may keep the latest consolidation on the table.
Silver (XAG/USD) remains sidelined above $24.00, down 0.26% intraday following the jump to the highest levels last seen in August. In doing so, the bright metal buyers take a breather amid a quiet Asian session on Thursday after the US inflation figures fuelled market volatility the previous day.
While the market’s inactivity could be linked to the off in the US bond markets, fears emanating from Evergrande, as well as concerning the US-China trade relations, could entertain the momentum traders going forward.
That said, US President Joe Biden showed readiness to battle the price pressure after the headline inflation figure, namely the Consumer Price Index (CPI) jumped to the 30-year high of 6.2% YoY. The national leader marks reversing the increase in inflation as the top priority, per Reuters.
Not only the US CPI but the inflation expectations, as measured by the 10-year breakeven inflation rate per the St. Louis Federal Reserve (FRED) data, also rallied and refreshed the highest levels since May 2006 on Wednesday.
While the reflation fears underpin the Fed rate hike concerns and weigh on the sentiment, comments from Patrick Timothy Harker and Mary C Daly, respective Presidents of the Federal Reserve Bank of Philadelphia and San Fransisco, tried to defend the Fed doves. Mr. Harker highlighted the possibilities of a rate hike even while tapering is on whereas Fed’s Daly said, per Reuters, that it would be premature to change the calculation on raising rates.
Talking about the Sino-American trade deal, not to positive comments from US Trade Representative (USTR) Katherine Tai ahead of the next week’s virtual summit of US President Biden and his Chinese counterpart Xi Jinping add to the risk-off mood. Furthermore, talks that China’s struggling real-estate major Evergrande has officially defaulted as the DMSA - Deutsche Marktscreening Agentur (German Market Screening Agency), is up for preparing for the firm’s bankruptcy filing, per the Daily Express, weigh on the risk appetite.
Amid these plays, the US 10-year Treasury yields remain indecisive around 1.57%, after jumping the most in seven weeks, while the S&P 500 Futures print mild losses and the US Dollar Index (DXY) stays indecisive at the highest levels since July 2020.
Moving on, risk catalysts will be the key for near-term trade direction amid a light calendar and a bank holiday in the US.
Technical analysis
Failures to provide a daily closing beyond September 2021 peak near $24.85 can drag the quote to the 100-DMA retest, around $24.15 by the press time. However, the silver bulls remain hopeful until witnessing a clear break of a six-week-old support line, around $23.35 at the latest. It’s worth noting that the 200-DMA level of $25.37 adds to the upside filters.


© 2000-2026. All rights reserved.
This site is managed by Teletrade D.J. LLC 2351 LLC 2022 (Euro House, Richmond Hill Road, Kingstown, VC0100, St. Vincent and the Grenadines).
The information on this website is for informational purposes only and does not constitute any investment advice.
The company does not serve or provide services to customers who are residents of the US, Canada, Iran, The Democratic People's Republic of Korea, Yemen and FATF blacklisted countries.
Making transactions on financial markets with marginal financial instruments opens up wide possibilities and allows investors who are willing to take risks to earn high profits, carrying a potentially high risk of losses at the same time. Therefore you should responsibly approach the issue of choosing the appropriate investment strategy, taking the available resources into account, before starting trading.
Use of the information: full or partial use of materials from this website must always be referenced to TeleTrade as the source of information. Use of the materials on the Internet must be accompanied by a hyperlink to teletrade.org. Automatic import of materials and information from this website is prohibited.
Please contact our PR department if you have any questions or need assistance at pr@teletrade.global.
transfers