- Analytics
- News and Tools
- Market News
CFD Markets News and Forecasts — 09-11-2021
One-month risk reversal (RR) of GBP/USD, a gauge of calls to puts, snaps a two-day downtrend by the end of Tuesday’s North American session. In doing so, the RR prints 0.0000 level, following the -0.042 and -0.050 numbers.
Although the options market data suggests that the GBP/USD sellers have stepped back, concerns over Brexit, recently fueled by comments from an Irish Foreign Minister Simon Coveney, challenge the pair buyers.
Also questioning the pair buyers is the market’s anxiety over the Fed’s next action and inflation concerns ahead of the US Consumer Price Index. Hence, the resulting figure of 0.0000 seems to be justified.
Adding to the watcher’s list is Thursday’s UK GDP, as well as the British covid conditions, which pose a challenge to the GBP/USD bulls.
That said, the quote seesaws around 1.3560 after the previous day’s pullback from the weekly top.
Read: GBP/USD set to end the session flat in mid-1.3500s ahead key US, UK data looms
- AUD/USD remains on the back foot for second consecutive day, refreshes intraday low of late.
- Sustained trading below the key SMAs, join downbeat RSI and MACD signals to keep sellers hopeful.
- The previous support line from late September holds the key to bull’s entry.
AUD/USD takes offers to refresh intraday low around 0.7370, down 0.13% on a day, while extending Tuesday’s downbeat performance during Wednesday’s Asian session.
In doing so, the Aussie pair justifies the downside break of the 200-SMA and descending RSI line, not to forget mentioning that recently bearish MACD signals.
However, the double bottoms marked around 0.7360 restricts the quote’s immediate downside before directing it to the 61.8% Fibonacci retracement (Fibo.) of the September-October uptrend, near 0.7315.
Alternatively, a clear upside break of the 200-SMA hurdle around 0.7385 needs validation from the 0.7400 round figure to aim for a convergence of the 100-SMA and 23.6% Fibo. close to 0.7470.
In a case where the AUD/USD bulls cross the 0.7470 resistance, they can head towards the 0.7500 threshold and then to the monthly peak close to 0.7555. During the rise, the previous support line from late September, around 0.7520, will act as an extra filter to the north.
AUD/USD: Four-hour chart
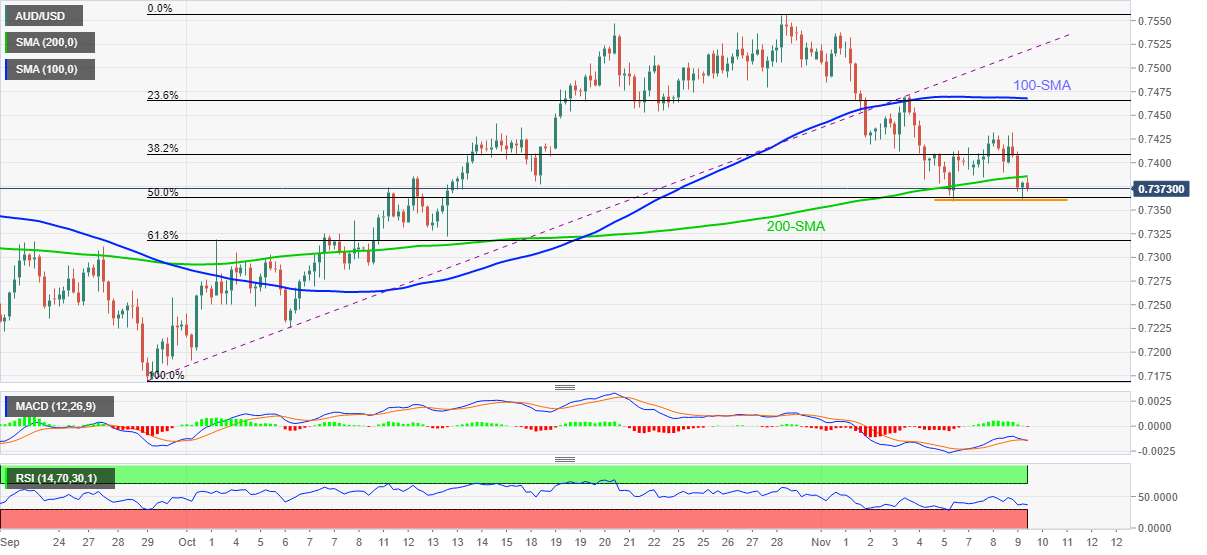
Trend: Further downside expected
- USD/CAD remains pressured for the consecutive fourth day, nears intraday low of late.
- WTI jumps to fresh one-week high amid softer USD post API draw.
- BOC’s Mecklem refrained from monetary policy clues after previously citing inflation fears.
- US inflation, WTI EIA stockpiles and Canada Leading Indicators eyed for fresh impulse.
USD/CAD stays depressed around 1.2430, recently sidelined during the four-day downtrend on early Wednesday. In doing so, the Loonie pair cheers the upbeat performance of Canada’s key export item, i.e. WTI crude oil, while paying a little heed from the latest comments of Bank of Canada (BOC) Governor Tiff Mecklem.
WTI crude oil prices take bids around $83.50, the highest level in a week. The black gold recently cheered upbeat oil stocks change figures from the American Petroleum Institute (API). Also favoring the bulls were comments from the White House and softer US dollar.
Read: WTI refreshes weekly high past $83.00 on API oil inventory draw, EIA data in focus
That said, the US Dollar Index (DXY) dropped for three consecutive days in the last, indecisive around 93.95 of late. The greenback gauge tracked the US 10-year Treasury yields amid the market’s rush to risk safety and indecision over the Fed’s next moves.
Elsewhere, the BOC Governor Mecklem highlights the importance of direct communication channels, better listeners and improved understanding of policy during the closing remarks at an online conference on diversity and inclusion in economics and central banking. The policymakers earlier termed the inflation fears as ‘transitory’ but eyed a longer phase of higher price pressure, indirectly signaling tighter monetary policy going forward.
Amid these plays, S&P 500 Futures track Wall Street losses while the US Treasury yields and the DXY remain on the back foot by the press time.
Looking forward, Canada Leading Indicators for November will precede the weekly official oil inventory data from the US Energy Information Administration (EIA) to direct short-term USD/CAD moves. However, major attention will be on the monthly inflation figure from the US.
Read: US October CPI preview: Inflation data unlikely to discourage gold bulls
Technical analysis
While 200-DMA restricts immediate USD/CAD moves around 1.2475, two-week-old support challenges immediate downside near 1.2430. It should be noted, however, that bullish MACD signals and a steady RSI line keep buyers hopeful.
- EUR/USD at stone's throw from 1.1600, US inflation number may provide momentum.
- Multiple factors like ECB's dovish stance, new COVID-19 cases push the euro southwards.
- The single currency awaits Germany inflation figure, ECB's Elderson speech to provide fresh impetus.
The EUR/USD eases below 1.1600 level during the early Asian session on Wednesday. At the time of reporting, the single currency was trading at 1.1592, up by 0.01% for the day so far. The spot ranged from a low of 1.1569 to a high of 1.1609 overnight, ending slightly higher on the day. The euro may continue a similar trend today or decline further in the coming days on multiple factors. Major central banks could push against the market expectations for tighter monetary policies and fears of economic slowdown would be expected to hamper the euro's progress.
Earlier this month, the European Central Bank president, Christine Lagarde, renewed her dovish stance. Therefore, the markets are betting for an interest rate hike in the second half of the following year. However, the absence of any words on rate hikes have pushed the euro southwards, and this condition may subside.
In addition to this, on Monday, ECB chief economist Philip Lane said that tightening monetary policy to temper the current bout of inflation in the eurozone would be counterproductive. However, top ECB supervisor Andrea Enria said on Tuesday that low ECB interest rates were now hurting bank margins. Also, the rising number of new COVID-19 cases in the European region has pushed investors on edge, resulting in the decreasing EUR/USD.
For the day ahead, investors wait for Fedspeak and US stimulus to derive impetus. Also, ECB's Frank Elderson's speech, inflation figures for Germany and Bundesbank Weidmann can affect the pair near term moves. US Consumer data will be the main event.
''October’s CPI result is expected to be driven by a lift in core prices (Westpac f/c: 0.5%mth, market median 0.6%). A 0.6% rise in overall CPI would take the annual inflation rate to 5.9%, which would be the highest inflation rate since 1990,'' analysts at Westpac explained.
Meanwhile, the US dollar is trading at 93.96 and it may rebound to hit the 94 and above level on the back of a weaker US Treasury yield at 1.43%
EUR/USD technical support/resistance levels
The daily chart shows the initial resistance to the upside resistance remains at the 21-day Simple Moving Averages (SMA). The next barriers to the upside are at the 50, the 100 and the 200-day SMA, i.e., 1.1670, 1.1740 and 1.1887, respectively.
The support level of October 13, 1.1527 can be tested. If it breaks, the psychological levels 1.1500 and 1.1400 lie below.
The pair's Relative Strength Index (RSI) level recovers but stays below the 50-line barrier and holds ground in the short term. The Moving Average Convergence Divergence (MACD) has a bullish vibe while the euro has an unimpressive print.
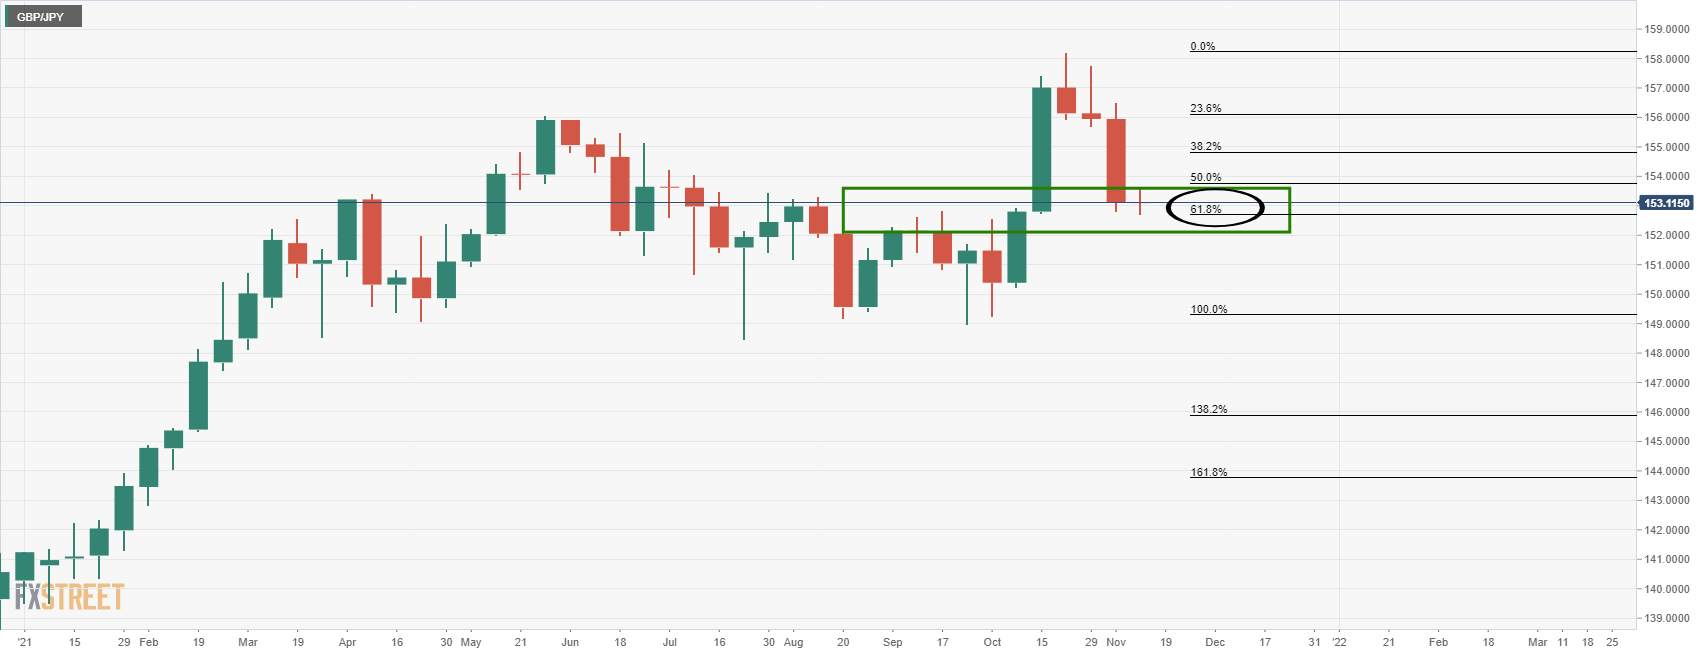
- GBP/JPY wavers inside short-term trading range, recently bounced off range support.
- 100-day, 50-day EMAs restrict immediate moves amid descending RSI line, not oversold.
- Key Fibonacci retracement levels also challenge the bears of late.
GBP/JPY consolidates the previous day’s losses around 153.07 during Wednesday’s Asian session.
In doing so, the cross-currency pair bounces off the 100-day EMA while staying inside the weekly trading range below 50-day EMA. Also acing as trade filters are the key Fibonacci retracement (Fibo.) levels of the late September-October upside.
Even so, descending RSI line, not oversold, keeps GBP/JPY sellers hopeful of breaking the immediate 100-day EMA support of 152.90 and battle with the 61.8% Fibo. level surrounding 152.50 for further downside.
In a case where the quote remains weak past 152.50, the mid-September lows near 150.80 and the 150.00 psychological magnet will lure the GBP/JPY bears before the yearly bottom of 148.45 marked in July.
On the contrary, recovery moves may initially poke the 50% Fibonacci retracement level of 153.60 before challenging the 50-day EMA, around 153.80 at the latest.
Even if the GBP/JPY buyers manage to cross the 153.80 hurdle, 38.2% Fibo. and a descending trend line resistance from October 21, respectively around 154.45 and 155.50, will question the quote’s further advances.
GBP/JPY: Daily chart
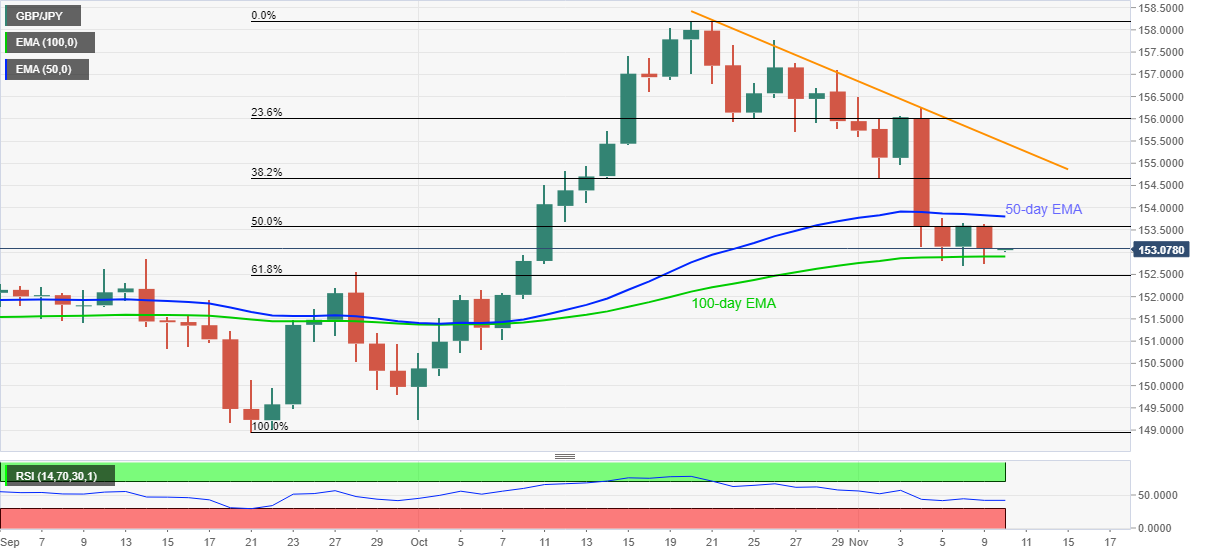
Trend: Further weakness expected
- EUR/CAD begins the Asian session up, 0.03% amid CAD weakness across the board.
- EUR/CAD Technical outlook: The pair is trapped within the 1.4292-1.4441 range, but it is closing to the top of the range.
- EUR/CAD: It has a downward bias in the mid-term, but support around the 1.4290’s could cap any downward move.
The EUR/CAD pair begins the Asian Pacific session on the right foot, advances 0.03%, trading at 1.4425 at the time of writing. On Tuesday, the market mood was in risk-off mode as portrayed by major US equity indices finishing in the red, losing between 0.31% and 0.71%. Also, in the FX market, risk-averse conditions boosted safe-haven currencies, like the Japanese yen and the Swiss franc.
On Tuesday, the Canadian dollar benefitted throughout the Asian and the European session, as witnessed by the EUR/CAD sliding towards 1.4391. But, once American traders got to their desks, the shared currency edged higher, propelled by gains in the EUR/USD pair. Contrarily, the Loonie depreciated against the greenback, which ultimately weighed on the EUR/CAD pair.
EUR/CAD Price Forecast: Technical outlook
-637720943288232555.png)
The daily chart depicts that the pair as of yesterday is trapped on the October 27 price action within the 1.4292-1.4441 range. The daily moving averages (DMA’s) above the spot price indicate the pair has a downward bias. Furthermore, the Relative Strength Index (RSI), at 46, confirms the mid-term bias, so EUR/CAD sellers could be found around the 1.4400 area, as It was tested three times before.
Nevertheless, the EUR/CAD pair has been trading near the top of the October 27 high in the last four days, so the near-term trend appears to be tilted to the upside. In the outcome of an upward break, above the latter, the first resistance level would be the May 12 low at 1.4581. A breach of that level could expose the 50-DMA at 1.4617.
On the flip side, to resume the downward bias, EUR/CAD sellers would need to reclaim the 1.4300 figure. In that outcome, the following demand zone would be February 16, 2020, low at 1.4263.
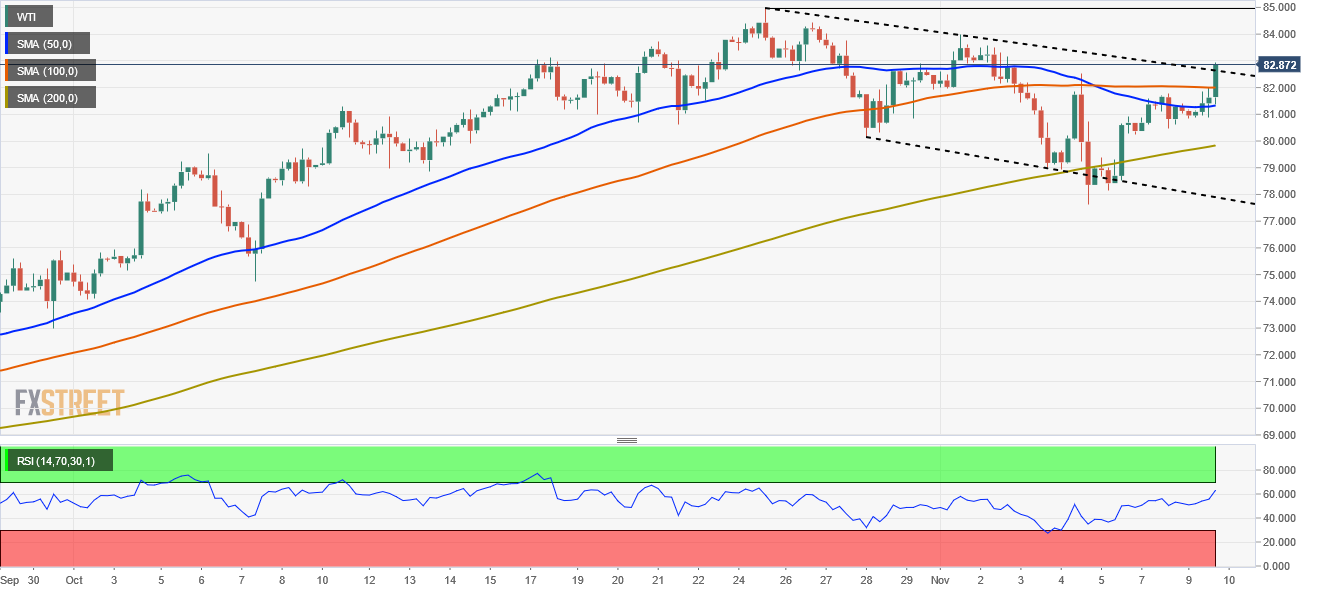
- WTI prints four-day uptrend, pokes monthly high after industry stockpile data.
- Weekly API Crude Oil Stocks Change drops 2.485 million barrels.
- Softer US dollar battles downbeat EIA oil demand forecasts, US SPR concerns.
- EIA inventories, US CPI will be in focus for near-term direction.
WTI bulls keep reins around $83.30, posting a fresh one-week high during Wednesday’s Asian session. The oil benchmark recently cheered industry data showing a draw in the weekly stockpiles as well as the White House comments rejecting announcement on Strategic Petroleum Reserve (SPR) for today. Also positive for the black gold is the softer US dollar. However, reflation fears question the up-moves ahead of the weekly official oil inventory data from the US Energy Information Administration (EIA).
That said, the private oil stocks change figures from the American Petroleum Institute (API) dropped below +3.594 Million Barrels (MB) to -2.485 MB for the week ended in November. Further, Bloomberg’s Javier Blas quotes the White House in his latest tweets while saying, “White House says it won't be announcing SPR oil release today.” His tweets also mention the White House as seeing oil prices as top issue, will act as needed. “White House says it continues to engage with OPEC+ on raising supply,” per Bloomberg’s Blas.
On Tuesday, the commodity prices cheered downbeat US dollar, tracking softer US Treasury yields on inflation fears. In doing so, the quote ignores Bloomberg’s Short Term Energy Outlook (STEO) forecasts predicting that the market would have an excess supply early in the following year and reported that prices would fall in December from current levels.
Elsewhere, concerns surrounding China’s debt markets and inflation fears ahead of the Consumer Price Index (CPI) data from Beijing as well as the US probe the oil buyers even as hopes of economic recovery and supply outage underpin the commodity prices.
Looking forward, the US inflation data for October will be important for the short-term USD moves and hence important for the oil traders to watch. Also, the weekly release of the EIA Crude Oil Stocks Change for the period ended on November 05, expected +1.91M versus +3.291M prior, will offer additional details to direct the WTI moves.
Read: US October CPI preview: Inflation data unlikely to discourage gold bulls
Technical analysis
A clear upside break of a 12-day-old resistance line, now support around $82.60, directs WTI bulls towards the multi-month high flashed in October around $85.00.
- Silver reverses pullback from short-term resistance, sidelined of late.
- Firmer RSI, sustained trading beyond 200-SMA keeps buyers hopeful.
- September’s top add to the upside filters, Fibonacci retracement levels eyed for immediate support.
Silver (XAG/USD) keeps the bounce off $24.00 during the initial Asian session on Wednesday, remains indecisive around $24.30 at the latest. In doing so, the bright metal reverses the pullback from a downward sloping trend line from early September while keeping the last week’s rebound from the 200-SMA.
Given the firmer RSI conditions backing the price strength, the commodity is likely to overcome the immediate trend line hurdle surrounding $24.50. However, September’s peak near $24.85 and the $25.00 threshold can challenge the XAG/USD bulls afterward.
Should the quote stay firmer past $25.00, June’s low around $25.50 and August month’s peak near $26.00 will be in focus.
Alternatively, pullback moves remain less important until staying beyond 61.8% Fibonacci retracement (Fibo.) of September month’s downside, around $23.55.
Following that, the 200-SMA level around $23.30, 50% Fibo. close to $23.15 and the $23.00 round figure should lure the silver bears.
Silver: Four-hour chart
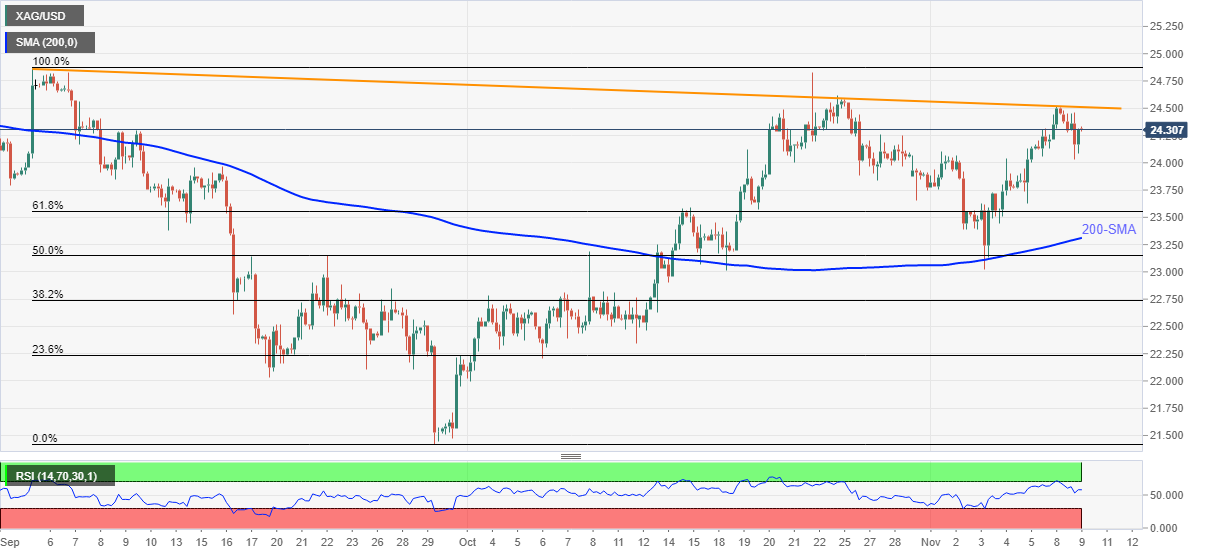
Trend: Further upside expected
- AUD/USD struggles to overcome monthly low, consolidates weekly losses of late.
- Market sentiment worsens of reflation fears, doubts over Fed reshuffle.
- US Treasury yields drop six-week low, equities weakness as well.
- Aussie Westpac Consumer Sentiment, China CPI can entertain traders ahead of US inflation figures.
AUD/USD remains depressed around weekly low, fades bounce off 0.7360 near 0.7380 as Asia-Pacific traders begin Wednesday’s work.
Although the upbeat Aussie data and softer US dollar pleased the pair buyers during early Tuesday, concerns relating to inflation, Fed and China weigh on the quote afterward. However, today’s inflation numbers from Australia’s key customer China, followed by the US Consumer Price Index (CPI) figures, will be the key to watch for fresh impulse.
National Australia Bank’s (NAB) strong sentiment numbers for November failed to extend the week-start positive performance even as the US Dollar Index (DXY) stays weak. The reason could be linked to the market’s rush for risk-safety, which in turn underpinned the US Treasuries and gold prices while weighing down the equities.
The risk aversion takes clues from uncertainty over the US Federal Reserve’s (Fed) next step amid chatters over reshuffle and policy bears being interviewed by President Joe Biden. Also, the US Producer Price Index (PPI) matched the upbeat forecast for October and kept reflation fears on the table ahead of today’s key price pressure data. Additionally challenging the sentiment were fears over China’s debt concerns and Evergrande, not to forget chatters of further heating inflation and supply outage.
Alternatively, Fed Chair Jerome Powell tried to downplay the inflation fears and strong jobs report but failed to revive market optimism.
Moving on, the Westpac Consumer Confidence for November, prior -1.5%, will precede China’s CPI and PPI data for October to direct short-term AUD/USD moves. Following that, the US inflation numbers will be crucial to watch. Above all, Fedspeak and US stimulus are the key to follow.
Given the chatters over 26-year high factory-gate inflation from China, AUD/USD may remain pressured on firmer inflation data as Beijing struggles to handle multiple issues. The downside momentum may escalate should the US CPI remain firmer.
Read: US October CPI preview: Inflation data unlikely to discourage gold bulls
Technical analysis
Failures to cross the 200-day EMA resistance, around 0.7435 by the press time, redirects AUD/USD bears towards the 0.7360 support comprising 50% Fibonacci retracement (Fibo.) of September-October upside. A clear break of the key Fibo. becomes necessary for the bears to keep reins.
New Zealand (NZ) Trade Minister Damien O'Connor crossed wires via Reuters during early Wednesday morning in Asia, speaking over the matters relating to the Asia-Pacific Economic Cooperation (APEC) and Comprehensive and Progressive Agreement for Trans-Pacific Partnership (CPTPP).
Also joining the NZ Trade Minister O'Connor was New Zealand Foreign Minister Nanaia Mahuta who said, per Reuters, "No consensus yet on US offer to host apec 2023."
Key quotes
APEC Ministers reiterated strong stance against vaccine nationalism.
APEC members reject protectionism.
Welcome all applicants (On Taiwan's application to CPTPP).
FX reaction
NZD/USD pays a little heed to the news, staying pressured around 0.7130 by the press time.
Read: NZD/USD bears waiting to pounce, 0.7080 eyed
- AUD/JPY slides during the day. Almost 1% on risk-aversion through all the financial markets.
- AUD/JPY Technical Outlook: The double-top chart pattern target was reached, but downward pressure remains.
The AUD/JPY slides sharply during the day, down 0.9%, is trading at 83.30 at the time of writing. Risk-off market mood spurred a flight to safe-haven currencies, with the Japanese yen and the Swiss franc prospects rising, whereas the risk-sensitive currencies like the AUD and the NZD slump during the day.
Furthermore, major US equity indices slide between 0.44% and 0.80% during the New York session, as market participants await US consumer inflation figures on Wednesday.
AUD/JPY Price Forecast: Technical outlook
Daily chart: Double-top 83.10 target reached
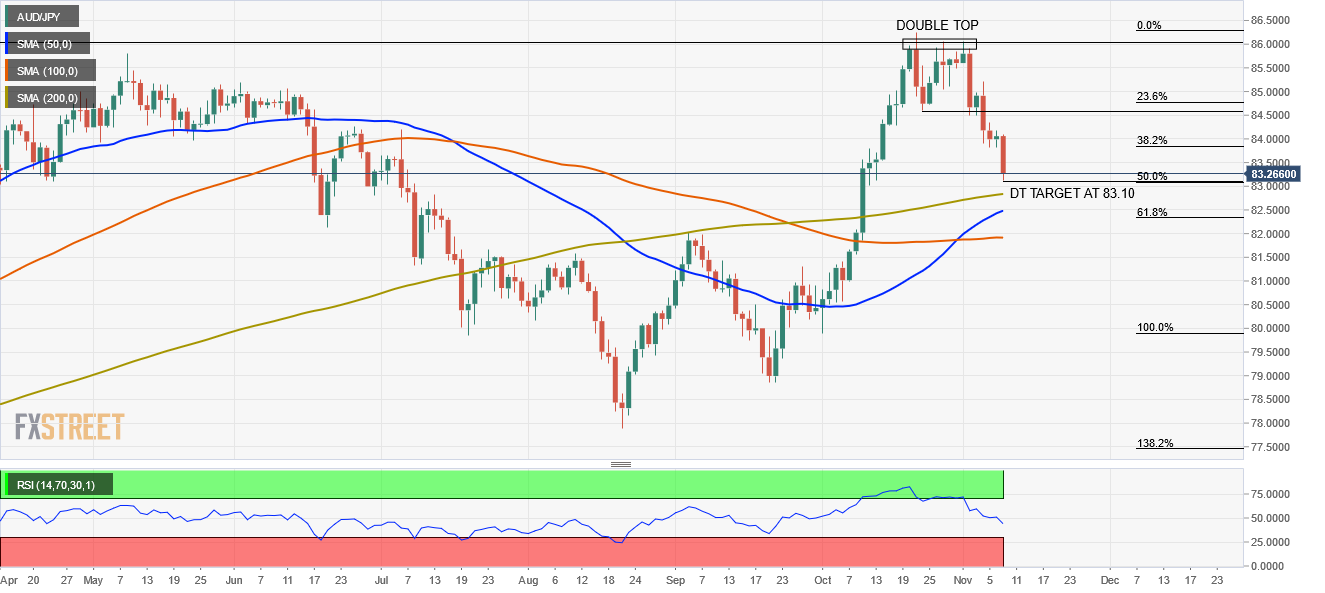
The AUD/JPY daily chart depicts the pair reached the double-top pattern target at 83.10, that confluences with the 50% Fibonacci retracement around that area. The AUD/JPY bounced off that area towards the 83.20s area, where it currently resides, as the AUD/JPY traders wait for fresh impetus to resume the upward bias, as depicted by the daily moving averages (DMA’s) below the spot price.
4-hour chart
-637720894044718557.png)
Zooming into the 4-hour chart, it depicts that, albeit reaching the double top’s target, the pair has some selling pressure left, as witnessed by the simple moving averages (SMA’s) residing well above the spot price. Further, the Relative Strength Index (RSI) at 31 just exited oversold levels, meaning that AUD/JPY sellers could still aim for a correction beyond the 83.00 figure.
A break beneath the latter would expose the 82.00 psychological support that, once breached, would expose the October 6 high at 81.41.
On the flip side, a break above 83.71 could pave the way for further gains. The first resistance would be the 84.00 figure, followed by the so-called neckline of the double top, around 84.61, followed by the 100-SMA around the 85.00 area.
- NZD/USD is under pressure as traders in Asia take over the baton.
- Bears will be looking for a break of the hourly dynamic trendline support.
NZD/USD is starting out the Asian session at a precarious position on the charts. The pair ended on Wall Street down some 0.4% on the day after falling from a high of 0.7174 and meeting a low of 0.7109 in the mid-New York session. The pair has since corrected a significant portion of the slide, but bears are lurking at hourly resistance, as illustrated below.
At the time of writing, NZD/USD sit s at 0.7132 after another night of haphazard trading. ''The USD DXY index was actually little changed, but AUD and NZD are both lower, with newswires blaming everything from a souring in risk appetite to softer copper prices,'' analysts at ANZ Bank explained. ''It is difficult to be definitive, but having done well on most crosses, the NZD is under renewed pressure this morning, and holding above 0.72 has been a struggle of late.''
Key events in focus
Meanwhile, the key events for the week are minimal on the domestic front, but Aussie jobs data and US inflation numbers could move the needle on the bird. US Consumer Price Index data is what markets are in anticipation of the most. Economists polled by Reuters see monthly CPI accelerating to 0.4% from the previous month's 0.2% rise, with the closely watched year-on-year core measure gaining 0.3 percentage points to 4.3%, well above the Fed's average annual 2% inflation target.
As for Aussie jobs, what goes down in Australia is expected, usually, to impact the kiwi. However, there has been a divergence of themes between the two central banks playing out of late. The kiwi has been drawing support from the possibility that the Reserve Bank of New Zealand could raise rates by as much as 50 basis points later this month.
NZD/USD technical analysis

Should the bears take out the trendline support, then the horizontal 0.7120s will be pressured and a break thereof could give rise to a fall into the bear's target zone between 0.7105 and 0.7070 in the coming sessions.
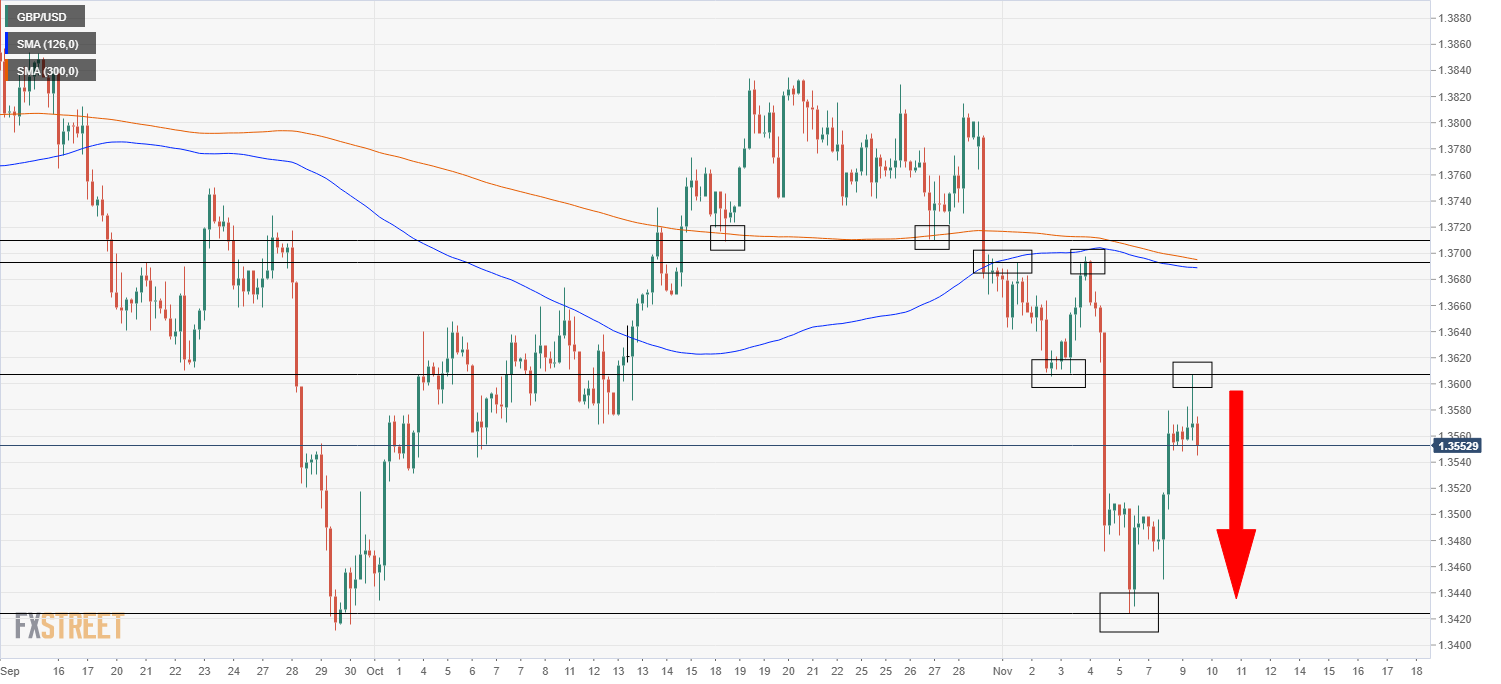
- GBP/USD trades flat in the 1.3560 area, having failed an earlier attempt to push above 1.3600.
- Cable traders are in wait-and-see mode ahead of key US inflation data on Wednesday and UK GDP data on Tuesday.
It’s been a subdued session for GBP/USD, with the pair set to end the session flat in the 1.3560s, having swung between highs above 1.3600 to lows in the 1.3520s. The seemed to attract selling interest at the 1.3600 level, given that it also coincides nicely with last Tuesday’s low. But the selling momentum quickly waned, with FX market participants likely to keep their toes out of the water ahead of the two most important data releases of the week for cable; the US October Consumer Price Inflation report, set for release at 1330GMT on Wednesday, and the preliminary estimate of Q3 UK GDP growth, set for release at 0700GMT on Thursday.
Fed and BoE speakers have been on the wires today, but none added anything new to the policy debate and thus did not shift the dial for FX markets. There has been quite a lot of attention on a sharp drop in US yields, a move that has not been reciprocated in UK bond markets, though the move of US/UK rate differentials in GBP’s favour on Tuesday has not seemed to help GBP/USD. That could be because Brexit remained in the headlines on Tuesday. Essentially the EU is threatening countermeasures if the UK opts to trigger Article 16, which allows it to unilaterally suspend parts of the Northern Ireland Protocol. No-deal Brexit risk is back on the table.
Should Brexit risks materialise (i.e. the EU suspends large parts of the existing UK/EU trade deal in retaliation to the UK triggering article 16), GBP is likely to come under more severe pressure. In this case, a move lower towards annual lows in the low 1.3400s is on the cards. Indeed, technical momentum seems to point in this direction; Tuesday’s price action saw GBP/USD test and respect a downtrend that has been in play since the end of October, signaling continued downside in the pair is likely.
-637720879679650191.png)
- The S&P 500 looks set to snap an eight-session run of record closes.
- Traders cited profit-taking as Q3 earnings seasons draws to a close and inflation worries as weighing on stock prices.
- Tesla shares continue to drop with CEO Musk expected to sell 10% of his holdings.
The S&P 500 looks likely to snap a historic run higher on Tuesday. On Monday, the index posted a record closing high for an eighth consecutive session above 4700, but ahead of the Tuesday close the index is trading around 0.4% lower, having fallen back to the 4670s. Similarly, the Nasdaq 100 index is 0.7% lower and the Dow is 0.5% lower.
The Q3 earnings season, which has been one of the main drivers of the impressive rally across US equity markets from the September lows, is now drawing to a close. According to Refinitiv data cited by Reuters, 81% of the 445 S&P 500 to have reported earnings so far have beaten analyst expectations. As a result, traders said some profit-taking was inevitable, with one saying that “it's not a run for the exit, but I just don’t see a reason to add exposure now”.
Some analysts cited the October Producer Price Inflation (PPI) report, released prior to the US market open, as another reason for the cautious tone to trade. The YoY rate of PPI remained elevated at 8.6% in October, in line with expectations. That suggests the US October Consumer Price Inflation report, set for release at 1330GMT on Wednesday, is likely to also show persistently elevated price pressures. One risk to equity markets is that US price pressures remain elevated for longer than the Fed expects, or indeed worsen in the month ahead, which may force the Fed into raising interest rates earlier than currently expected. If the Fed is forced to raise interest rates before the labour market has fully recovered to pre-pandemic health, this could weigh on economic growth.
Tesla shares were down a further 10% on Tuesday, exerting a further drag on the S&P 500 and Nasdaq 100 indices, following Monday’s 4.8% decline. Over the weekend, Tesla CEO Elon Musk proposed selling 10% of his TSLA holdings in a Twitter poll, with the end result of the poll showing 57.9% in favour of the sale. Equity analysts said the underlying fundamentals that had underpinned the staggering rally in TSLA shares in recent years remain and that any downside as a result of the stock sale would be relatively short-lived amid strong investor demand to scoop up the available shares.
- WTI rallies during the New York session bounced off the lows at $80.900, gains $1.50.
- EIA cut the forecast for oil demand for 2022.
- WTI Technical outlook: Bullish flag in the 4-hour chart, targets $86.00
Western Texas Intermediate, also known as WTI, advances in the New York session, up almost 2%, trading at $82.93 per barrel at the time of writing. During the day, the black gold retreated under the $81.00 psychological figure, finding support at the 1-hour 50-simple moving average at $80.99, which capped the downward pressure on the US crude oil benchmark. Furthermore, recovered some early losses on positive news of the EIA cutting the forecast for oil demand for 2022.
According to Bloomberg, the Short Term Energy Outlook (STEO) predicted that the market would have an excess supply early in the following year and reported that prices would fall in December from current levels. Market participants were impatiently waiting for the report, as sources said the Biden administration was considering tapering the US Specific Petroleum Reserves (SPR).
Crude oil prices have risen as vaccination rates increased and COVID-19 cases dropped across the globe. That easied lockdowns, in turn, increased mobility of people, consequently spurring a higher oil demand. According to sources cited by Bloomberg, demand “is going to be reasonably tight” for the next 12 months, and a price spike to $100 a barrel is on the cards.
The White House has exerted pressure on OPEC and its allies to increase the crude oil output, but the cartel stayed put, sticking to its 400K crude oil barrel target per day.
At 21:30 GMT, the American Petroleum Institute (API) will reveal its Weekly Crude Oul Stock for the week ending on November 8. The previous reading was 3.594M. A report higher than the abovementioned could be bearish for WTI, otherwise could boost the WTI prospect for higher prices.
WTI Price Forecast: Bullish flag in the 4-hour chart, targets $86.00
The 4-hour chart depicts that WTI is breaking the top of a bullish flag, that according to technical analysis measures, could propel WTI’s towards $86.00 per barrel, but it needs to close above it. In that outcome, the first resistance would be the November 1 high at $83.97. A breach of the latter would expose the 2021 year-to-date high at $85.00 and then the bullish-flag target.
The start of the week came with renewed fears of a Brexit showdown as the Uk threatened to trigger emergency unilateral provisions in the Brexit divorce deal known as Article 16.
Article 16 is a clause in the Protocol on Ireland/Northern Ireland, a key part of the Withdrawal Agreement - the deal under which Britain left the European Union. The Article was sought to avoid a hard border between British-ruled Northern Ireland and EU member Ireland by introducing some checks on the movement of goods to Northern Ireland from mainland Britain.
The Article is essentially an emergency brake that will give permissions to either the UK or the EU to take action if the Protocol leads to persistent "serious economic, societal or environmental difficulties". The UK says this threshold has already been reached as a result of the trade frictions caused by the protocol, which requires all goods travelling from Great Britain into Northern Ireland to conform to EU rules.
''The UK government now says it has caused far greater disruption than anticipated at the time and needs to be fundamentally rewritten,'' the Financial Times recently reported. ''UK ministers also argue that the unionist community has lost confidence in the protocol and its continued application could destabilise the already fragile politics of the region.''
The FT explained that ''Brussels argues that without full legal controls on animal and plant products, Ireland’s place in the EU single market is undermined because its goods can no longer be trusted, so may require checks as they enter the EU. The UK would therefore be threatening Ireland’s economic rights as an EU member. This may be seen as intolerable by the 26 other EU member states. For its part, the UK says this concern is overstated.''
However, any UK decision to unravel the NI protocol would create another ‘no deal’ cliff-edge as the Irish foreign minister, Simon Coveney, has warned that the EU could shelve a Brexit trade deal if the UK triggers Article 16. Talks on possible reforms are seemingly deadlocked.
On Tuesday, the latest comments from the Irish Foreign Minister are a stark warning to the UK and should be noted by forex traders seeking investment in currencies vis sterling. He said in recent trade that if the UK sets aside parts of northern Ireland protocol, there will be a 'very robust response' from the EU. He says if the UK continues its current approach to talks, this is a negotiation that is going to run out of road.
GBP/USD daily chart
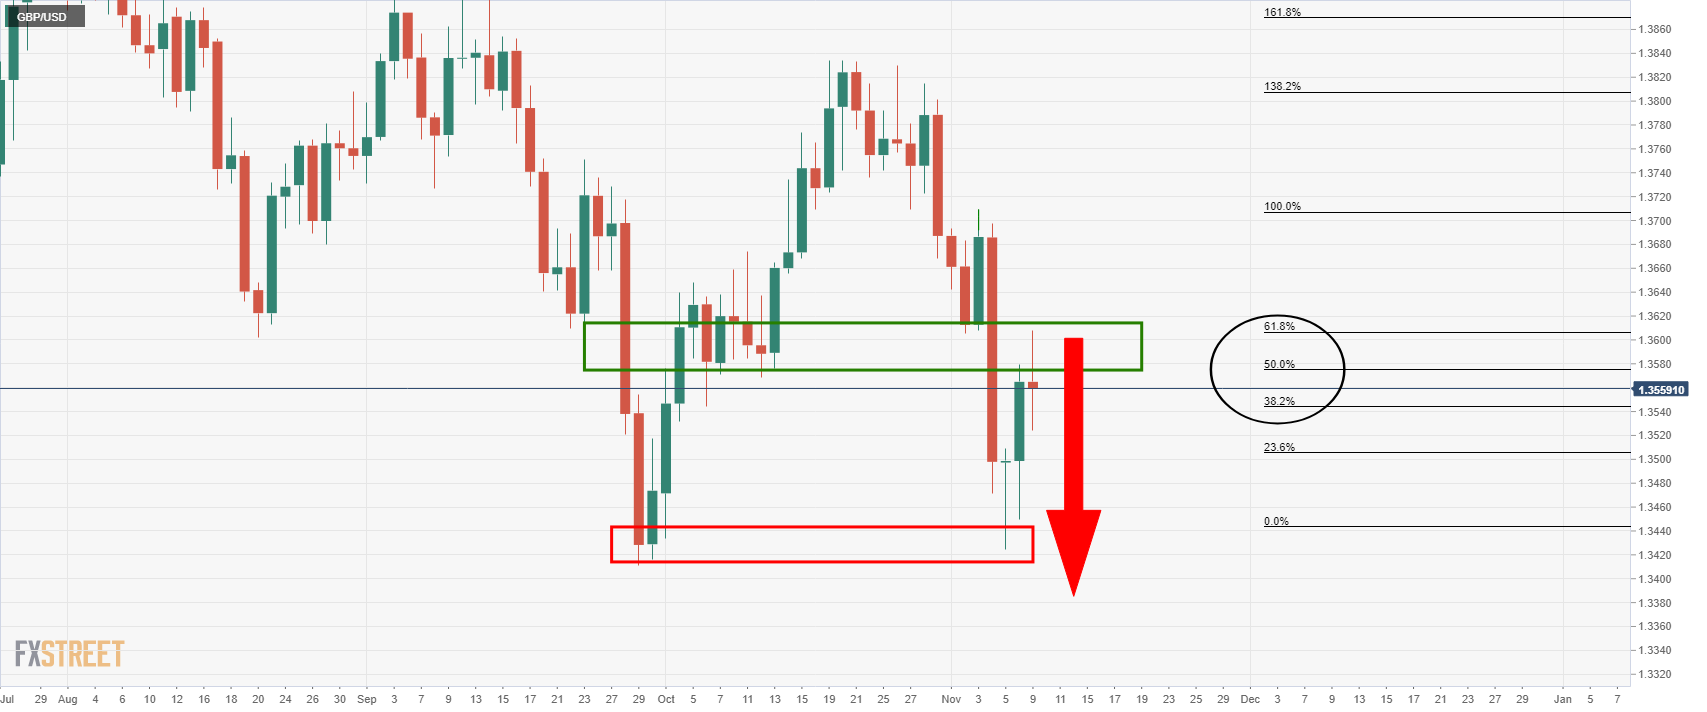
The daily chart shows that the price has been rejected at a 61.8% ratio already. Should the Brexit angst gain traction, then a break of the recent double bottom lows would be expected to put 1.3380 under pressure ahead of a deeper run towards the weekly 1.3180s (21 Dec lows).
What you need to know on Wednesday, November 10:
The greenback maintained its tepid tone during the Asian session but became more attractive during US trading hours. The catalyst for the dollar’s demand was another sign of inflationary pressures spurring risk-off. Wall Street edged lower after its overseas counterparts posted intraday gains, following the release of the US Producer Price Index, confirmed at 8.6% YoY in October.
The EUR/USD pair tried to advance past 1.1600 a couple of times but was rejected by persistently strong selling interest. European Central Bank policymakers commented on the future of the monetary policy. Klaas Knot said that conditions for a rate hike are very unlikely to be met in 2022, while top supervisor Andrea Enria said low ECB interest rates are now hurting bank margins more than they are boosting lending volumes. The European Central Bank maintains a wait-and-see stance, considering higher prices will be temporary.
The GBP/USD pair hovers around 1.3550 after a failed attempt to recover above 1.3600. Irish foreign minister Simon Coveney said that if the UK triggers Article 16 over Northern Ireland would prompt retaliatory action on Sunday, adding on Tuesday that it would trigger a “very robust response” from the EU.
Commodity-linked currencies fell alongside Wall Street. AUD/USD trades in the 0.7370 price zone, although the USD/CAD pair eased from its intraday high amid rallying oil prices.
The EIA cut its 2022 forecast of world oil demand by 130,000 barrels per day, raising this year forecast for oil demand by 60,000 barrels per day.
Gold trades at fresh one-month highs around $1,830 a troy ounce amid the dismal market’s mood. Government bond yields, however, edged lower with that on the 10-year US Treasury yield currently at 1.44%.
The US will publish the October Price Index on Wednesday, foreseen at 5.3% YoY.
Top 3 Bitcoin, Ethereum, XRP: Cryptos make all-time highs while investors realize profits
Like this article? Help us with some feedback by answering this survey:
- USD/CAD has reversed sharply back from earlier highs at its 200DMA and is back below 1.2450 again.
- A surge in crude oil prices has weighed on the pair in recent trade.
USD/CAD hit fresh four-week highs earlier in the session to the north of the 1.2480 level but has since pulled back below the 1.2450 level again amid ongoing strength in crude oil prices. Crude oil prices have been rallying in recent trade, which has been a tailwind for the energy-export-dependent loonie, with WTI prices now advancing in recent trade towards the $84.00 level from earlier session lows under $82.00.
Technical selling in USD/CAD is also playing an important role. The pair again tested its 200-day moving average at the 1.2480 area and the level was again rejected. But the selling pressure has eased with USD/CAD running into support in the form of an uptrend that has been in play since the end of October. Should prices break this uptrend to the downside and crude oil prices continue to advance, that would open the door to a move towards 1.2400, which also coincides with USD/CAD’s 50DMA.
So a move may have to wait for the latter half of the week, however, with FX market participants likely to remain reticent to place any big bets ahead of Wednesday’s all-important US Consumer Price Inflation report, which could cause choppiness for the US dollar. In terms of Canadian economic events, aside from a speech from BoC Governor Tiff Macklem on diversity at 2245GMT on Tuesday, there is nothing of note in the calendar for this week, which should ensure the pair trades as a function of USD and oil market dynamics.
Crude oil rallies
Crude oil prices have been rallying since the release of the latest US EIA monthly energy outlook report, which saw the agency increase its gas price forecasts when compared to the October report. The EIA now sees regular gas prices in the US averaging $3.0 per gallon in 2021 and $2.91 in 2022, up from $2.97 and $2.91 forecasts in the prior report.
The Biden administration, eager to do anything it can to lower energy prices, was said to be keen to scrutinise the report before making any final decisions on what measures it might take to reduce gas prices. A release of crude oil reserves from the Strategic Petroleum Reserve is on the table, but commodity analysts said they thought this would only temporarily weigh on prices, as it does nothing to fix the supply/demand imbalance that has lifted oil prices already by so much this year.
Minneapolis Federal Reserve Bank President Neel Kashkari is speaking at an Eau Claire Area Chamber of Commerce event and has said he believes the forces that are currently keeping people out of the labour market and pushing up prices will prove to be temporary.
He said the pressures will fade as COVID-19 turns from being pandemic to being endemic.
"We are getting mixed signals out of the economy," Kashkari said
"I'm optimistic, in the next three, six, nine months we will get a lot more information," and clarity about the outlook for both inflation and the labour market, he said.
Key comments
The next 3, 6, 9 months will be very important in getting more clarity on the economic outlook.
Right now there's a lot of uncertainty.
Whether it's a demand shock or a supply shock, either way, the story should be temporary.
Should reach equilibrium in the next few quarters.
The future outlook for inflation depends in part on what will happen with the labour supply.
Fed's Kashkari says he is ‘keeping an open mind’ on the monetary policy stance and has said that once the taper ends, the Fed would consider appropriate timing for rate hikes.
Market implications
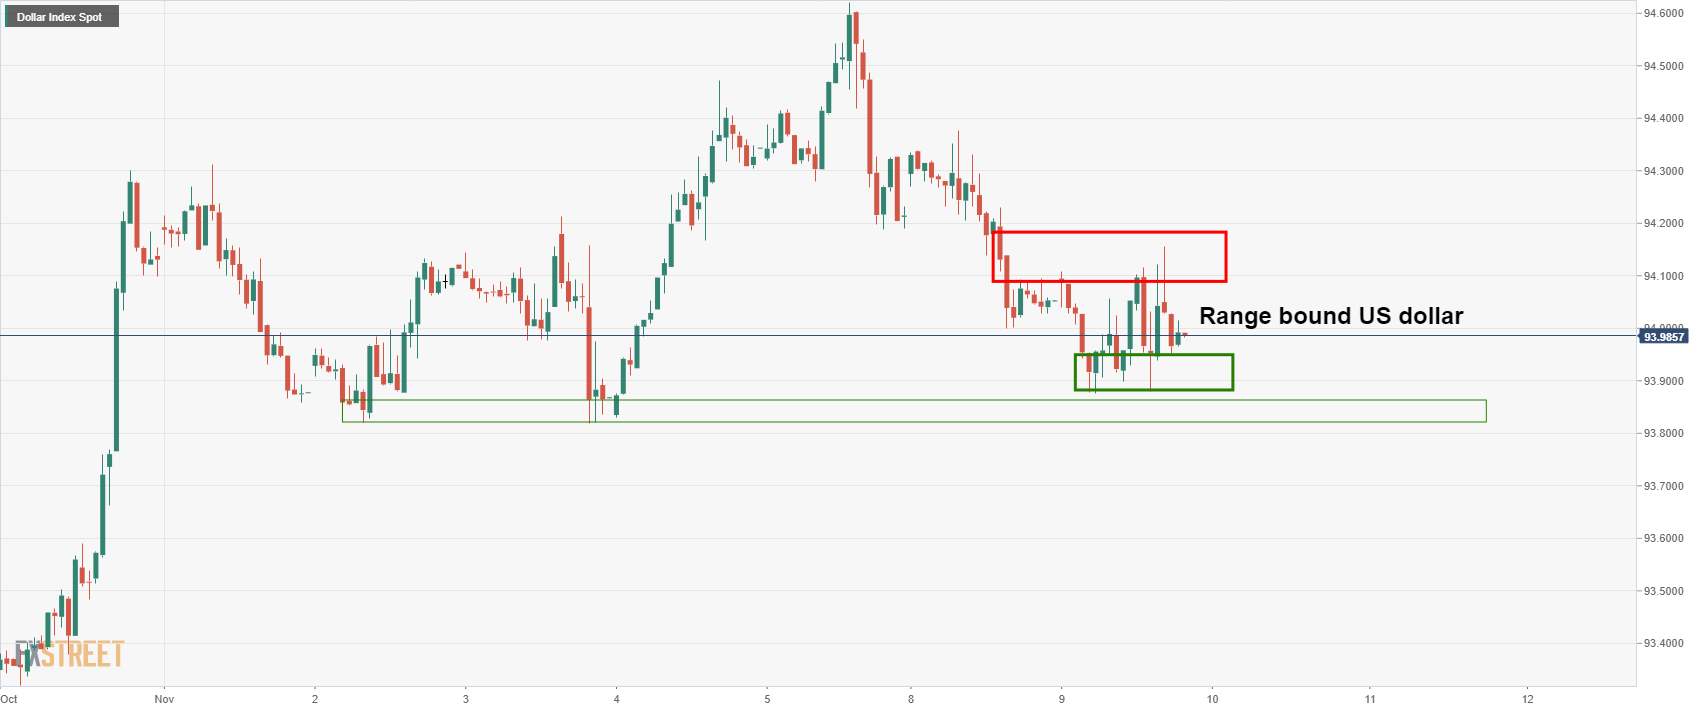
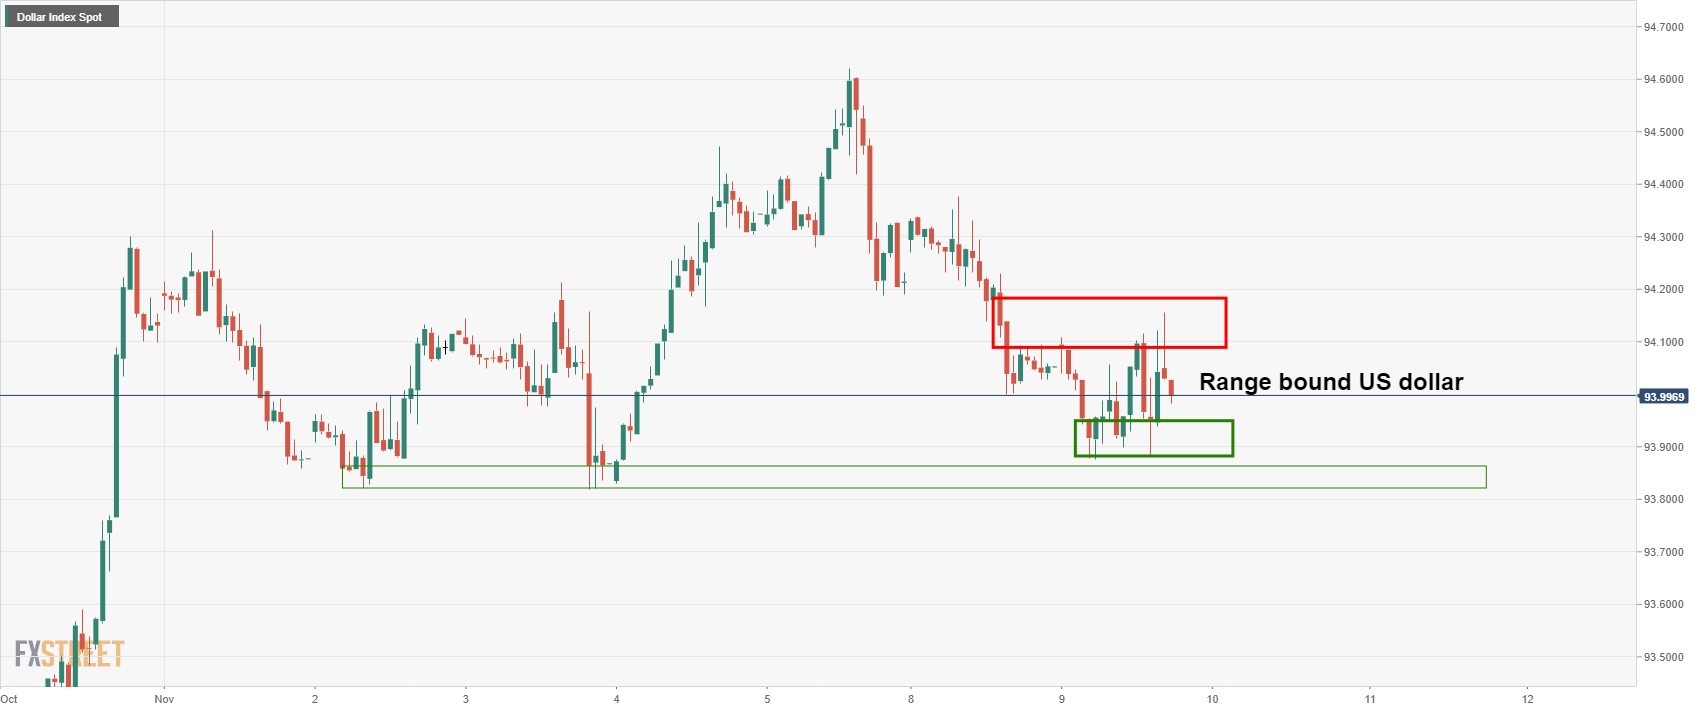
Forex markets are waiting for the US Consumer Price Index and hence the US dollar is consolidating, rather than reacting to each comment from central bankers on Tuesday.
The US dollar has been moving in a tight range between 93.90 and 94.10 since data earlier the day showed that US Producer Prices had increased solidly in October.
Traders noted that while high inflation could persist for a while amid tight supply chains related to the pandemic, tomorrow's key event in CPI will be more key in this regard.
US dollar hourly chart
- USD/JPY bulls are testing the commitments of the bears from key hourly support.
- Bears need to break the double bottom lows for a run to the 112.08 daily target.
USD/JPY bears are in control from a daily basis while below 113.20 but are stalling in what could be hourly accumulation. The following illustrates the market structure and prospects of either a downside continuation towards daily targets 112.08/111.77 or a retest of 113.20 for the near term.
USD/JPY daily chart
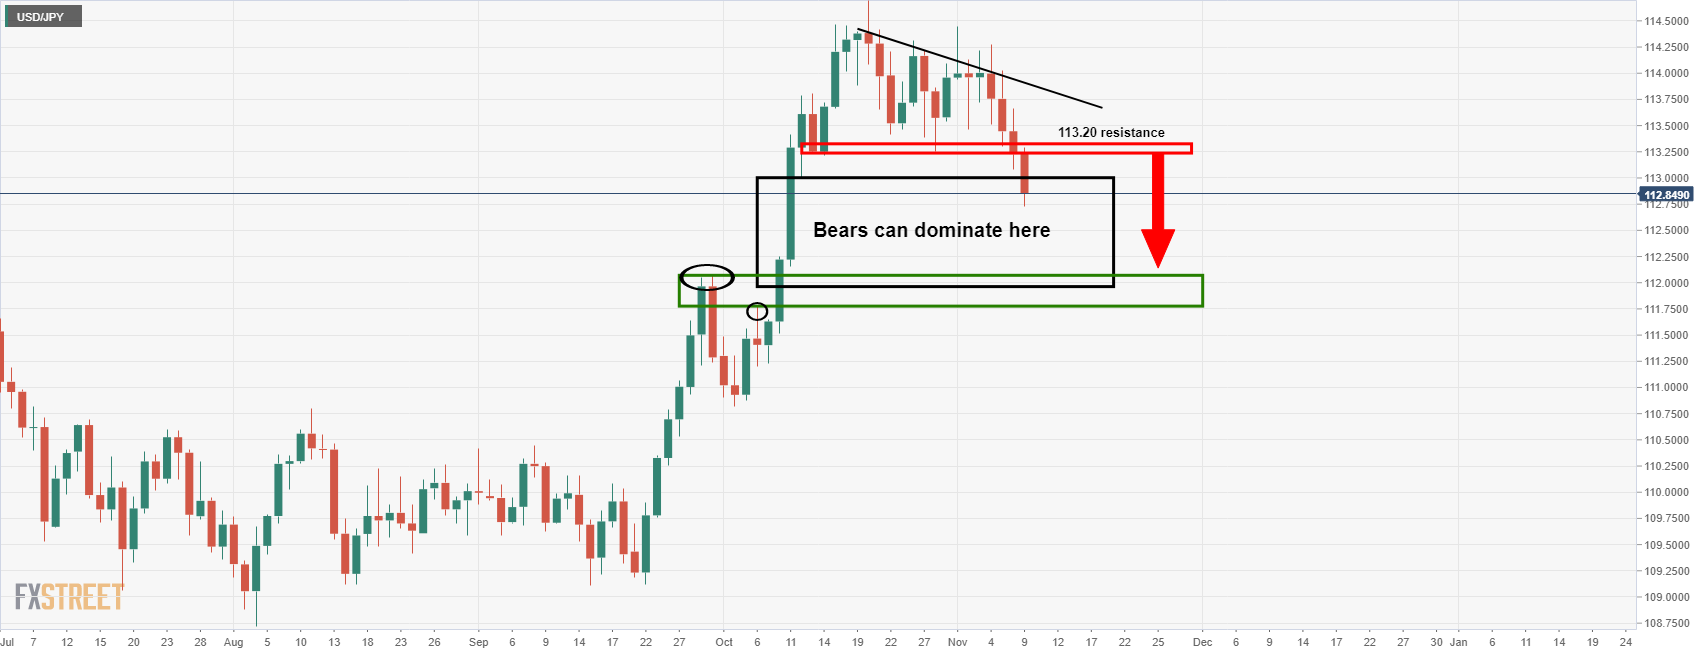
As illustrated, the price is on the verge of a run towards the old higher of 112.08 and 111.77 below there.
USD/JPY H1 chart
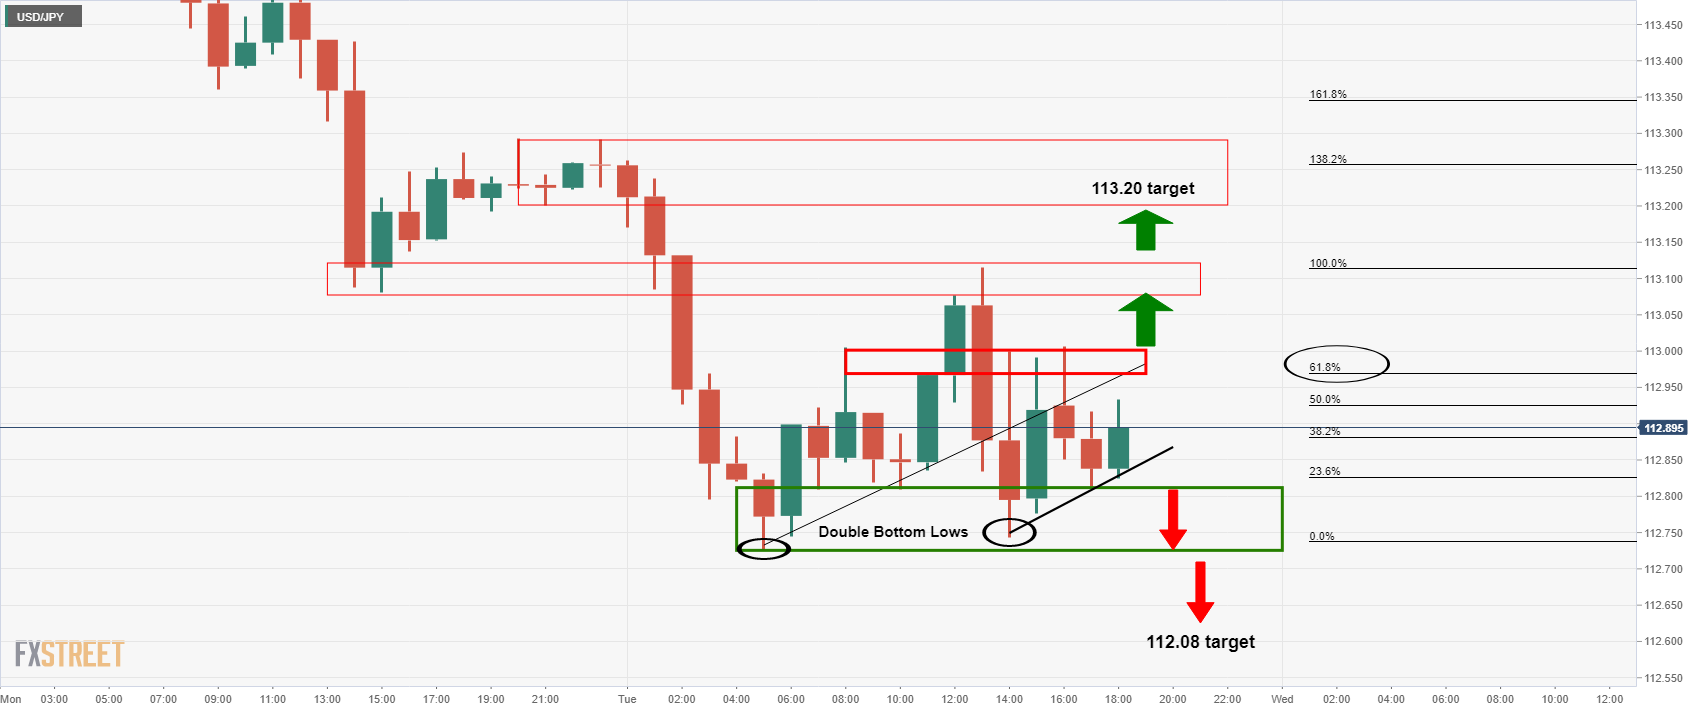
USD/JPY is consolidating on the hourly time frame and is quite a mess. However, there is structure when breaking it down. The current trendline support will need to give out to the bears to expose the daily targets of 111.77/112.08.
However, given the double bottom lows, this is looking less likely as the price move into accumulation. With that being said, the old trendline support is now expected to act as a counter trendline resistance for which price closed below it on two occasions following a test of the 61.8% ratio. Until that trendline is broken, bears remain in the game and eye 112.08/111.77. If the price breaks 113 the figure and closes above on an hourly basis, then 113.20 will be vulnerable as the next area of interest.
- Spot palladium has pulled back sharply from earlier session highs above $2100 and now trades in the $2020s.
- Industrial metal prices are down and this could be pulling palladium lower, despite falling real yields boosting other precious metals.
Spot palladium has undergone a sharp drop in recent trade, pulling back aggressively from monthly highs just to the north of the $2100/oz level to the $2020s. Spot prices are currently about 2.5% lower on the day. The drop puts XPD/USD prices back below both its 50-day moving average (DMA) at $2064 and its 21DMA at $2044. For now, prices have found support at an uptrend that has been in play since the end of October, but should prices break below this uptrend (and the psychologically important $2000 level), that would open the door to a move towards October lows in the $1940s (more than 4% down from current levels).
The sudden pullback from highs comes despite a steady US dollar (the DXY is flat close to 94.00) and a sharp drop in US real yields (10-year TIPS yields are down over 9bps on the day and hoving just above record lows in just above -1.20%). Declining real yields reduces the opportunity cost of holding precious metals and thus is typically associated with stronger precious metal prices.
The reason for palladium’s underperformance on Tuesday may have something to do with the fact that, while the metal is classed as a precious metal, the majority of its demand (some 80%) is linked to auto-production. Automakers use palladium in exhaust systems to neutralise the harmful elements in emissions. Most industrial metal prices fell on Tuesday, with the Bloomberg Industrial Metal Subindex dropping 0.9%.
Palladium prices have pulled back by roughly 33% from record highs levels set back in May primarily as a result of the impact of the chip shortage on auto production. As the chip shortage eases, this should boost demand for the precious metal. A poll conducted by Reuters at the end of November showed XPD/USD is expected to average $2050/oz in Q4 and $2150/oz in 2022. Analysts are not bullish on palladium’s longer-term prospects given the expected phasing out of combustion engine production.
- The shared currency recovers from early daily losses close to 1.1600.
- US PPI index rose a tick more than expected, but investors are focused on Wednesday CPI readings.
- EUR/USD: A double-bottom coupled with a positive divergence in the daily chart could propel the pair towards higher prices.
The EUR/USD is steady during the day, failing to extend its two-day rally, is trading around 1.1590 in the last hour.
The shared currency bounced off daily lows around 1.1570 during the day as US bond yields fell sharply during the New York session, acting as a headwind for the greenback. Nevertheless, gains could be capped as the US Dollar Index is recovering, closing to the 94 figure, losing 0.08% at 93.98 at press time.
US PPI steady around 8.6% on an annual basis
On Tuesday, the US economic docket inveiled the Producer Price Index (PPI) for October, which in its headline expanded by 0.6%, higher than the 0.5% estimated by economists. On a year-over-year figure, the PPI increased 8.6%, in line with the forecast. Further, the Core PPI for the same period on a monthly basis rose by 0.4%, a tad higher than expected, whereas the annual basis number came in line with estimations at 6.8%.
The report released by the Bureau of Labor Statistics (BLS) noted that higher energy costs drove the gain on wholesale prices. Furthermore, it mentioned how recent months, transportation bottlenecks, material shortages, and increasing labor costs sent prices surging across the economy.
The EUR/USD pair reaction was muted, albeit being a US inflation report, investors' focus is on the consumer inflation readings.
On Wednesday, the US economic docket will feature the Consumer Price Index (CPI) for October, in which market participants are focused on, as the Federal Reserve dovish tone spurred a sell-off in the bond market, while US Treasury yields fall. Also, the Initial Jobless Claims for the week ending on November 6 will be revealed.
The Eurozone economic docket will unveil inflation figures for Germany, and Bundesbank Weidmann will cross the wires. Further, the ECB will host a Non-monetary policy meeting.
EUR/USD Price Forecast: Technical outlook
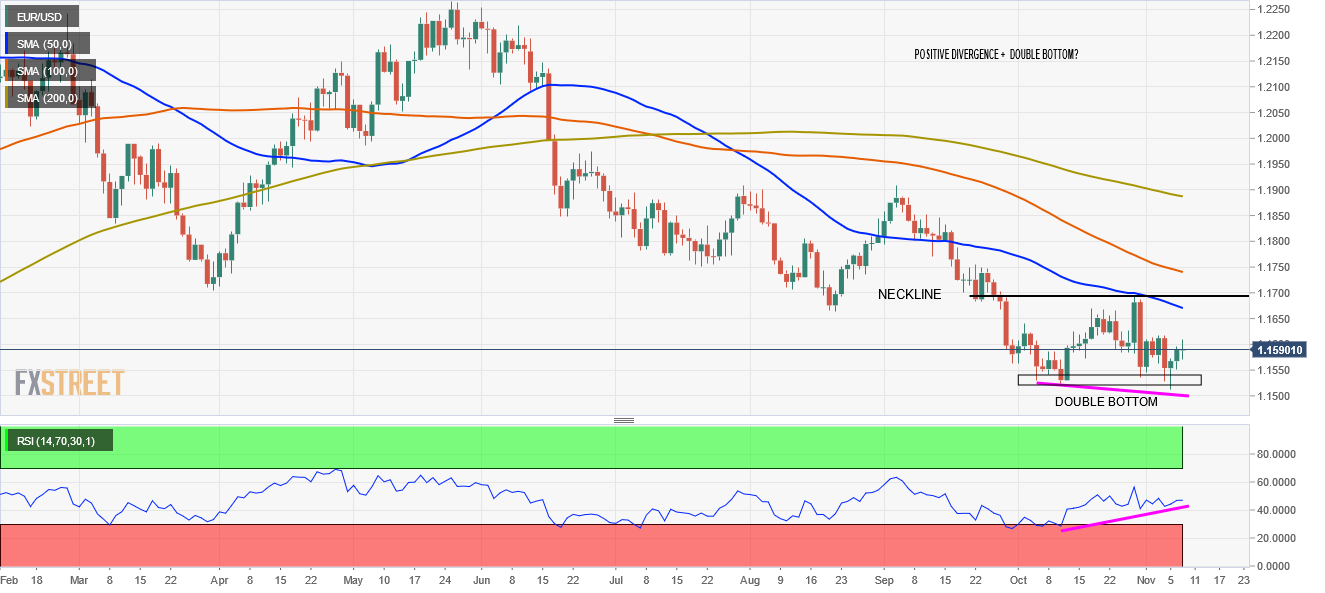
The daily chart depicts that a double-bottom pattern could be forming in the shared currency. The 1.1524 price level unsuccessfully tested six times acts as a floor for the EUR/USD pair, but on the upside, the 1.1616 is the barrier to overcome, on its way towards the "neckline" of the double-bottom at the October 28 high at 1.1691.
The Relative Strength Index (RSI) is at 47, slightly up, but remains below the 50-midline indicating that selling pressure remains. However, there is a subtle positive divergence, with the RSI showing higher lows, while the EUR/USD price action prints lower lows, meaning that the RSI acts as a leading indicator to the pair. Nevertheless, to resume the near-term upward bias, the RSI needs to break above the 50-central line to accelerate the uptrend.
- GBP/JPY bears are lurking below a key hourly counter trendline.
- From a longer-term perspective, a correction to the upside could be in the making.
GBP/JPY suffered a heavy blow last week, dropping to almost a 61.8% Fibonacci retracement of the prior bullish impulse. At this juncture, the price is meeting the neckline of the W-formation and is starting to consolidate. This makes for tricky grounds for bears seeking a lower low on the shorter time frames, for an upside correction could be imminent. The following illustrates this from a weekly perspective:
GBP/JPY weekly chart
GBP/JPY daily chart
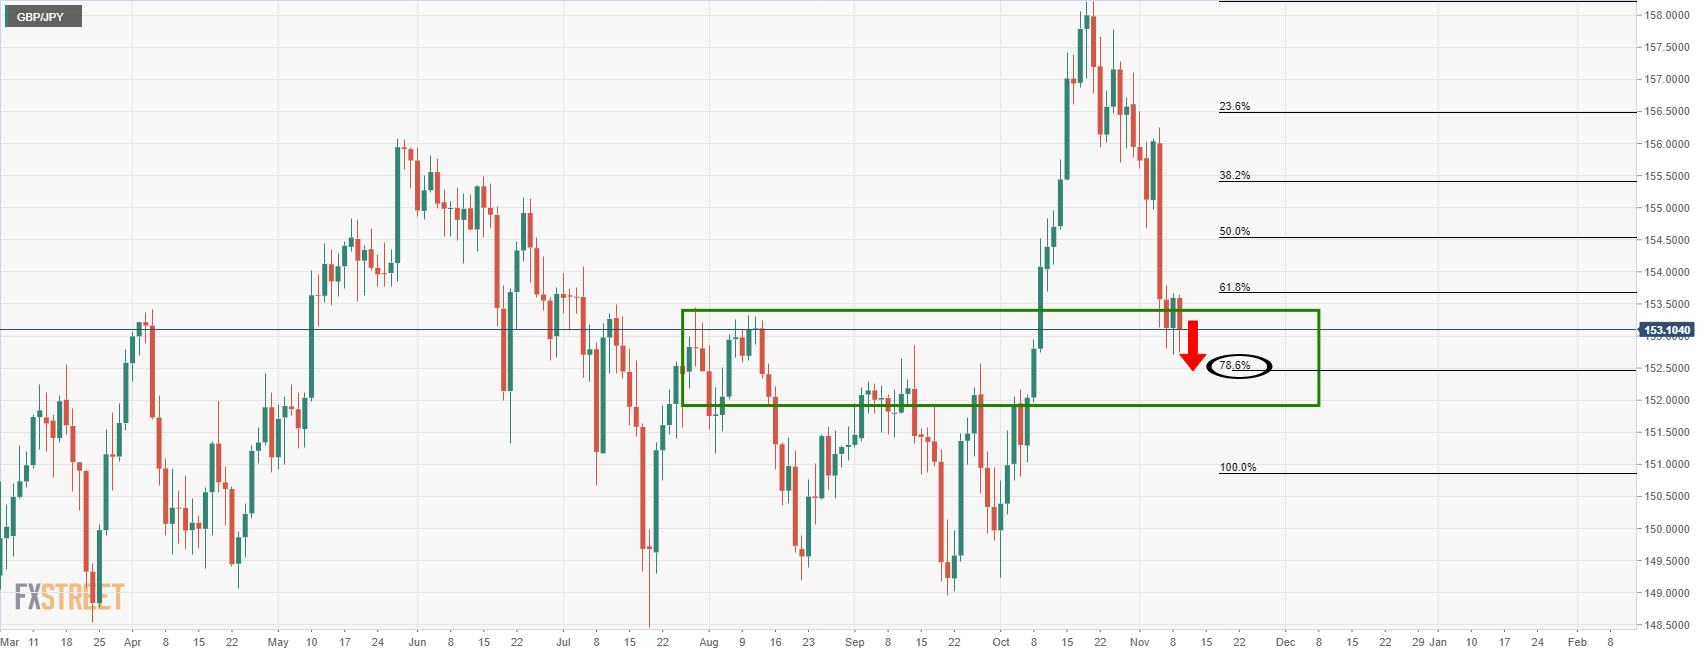
From a daily perspective, as illustrated in the chart above, the price is attempting to move lower and for a deeper test of the weekly supporting territory, but so far to no avail. However, given that it has already broken the 61.8% Fibo of the prior daily rally's range, the 78.6% Fibo located at 152.40 is in range.
GBP/JPY H1 chart
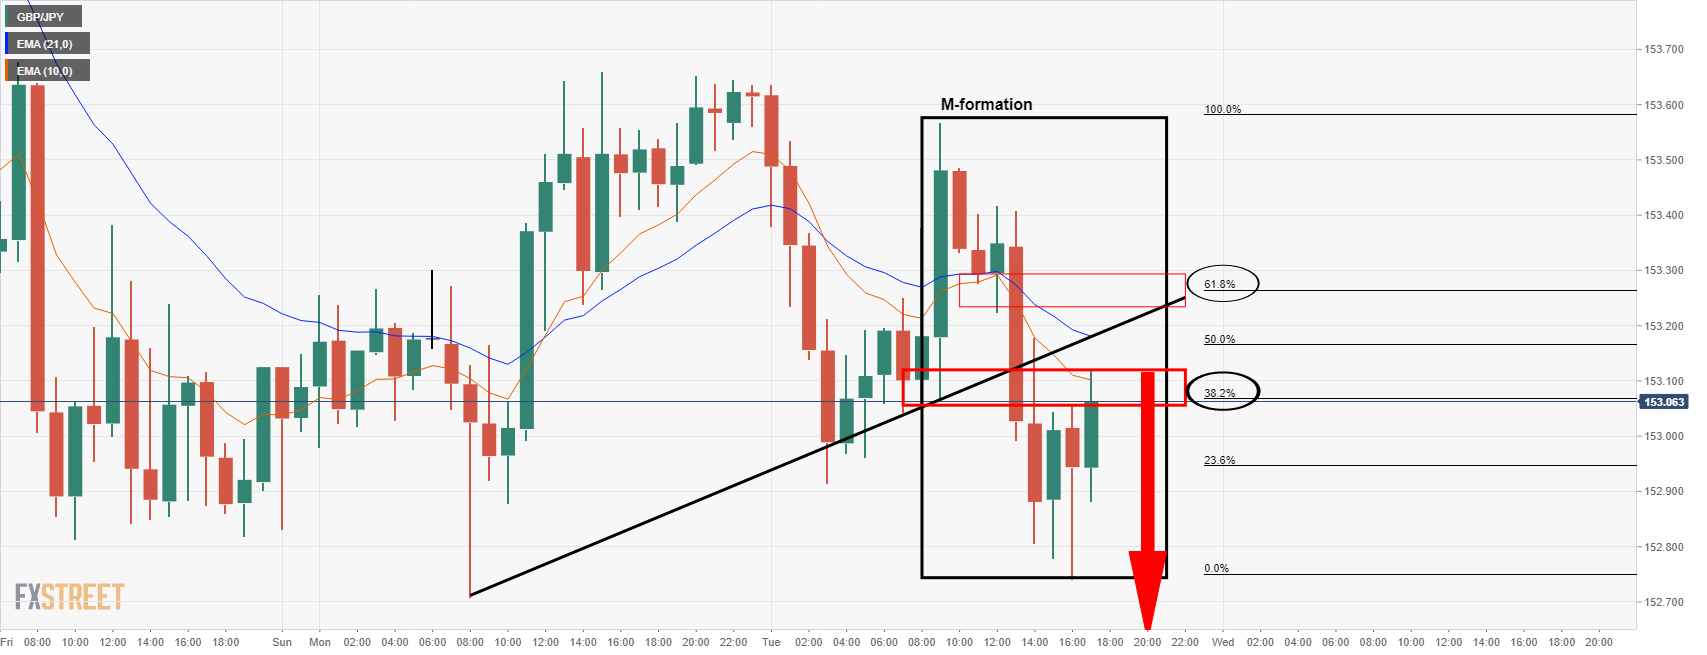
From an hourly perspective, the resistance structure is compelling around the 10-EMA and the confluence of the 38.2% Fibonacci retracement of the latest bearish impulse near 153 the figure. However, the M-formation's neckline could come under pressure should counter-trendline give-out to the correction which has a confluence of the 61.8% Fibo near 153.25. If the counter-trendline holds and bears move in, then 152.50 could be an attractive target for the downside which is a -61.8% Fibo of the current range of the latest hourly correction.
San Francisco Federal Reserve Bank President Mary Daly was speaking at the National Association of Business Economists virtual meeting.
She said it is too early to know how far the US economy is from full employment, adding that there won’t be better clarity until the middle of next year.
“It’s going to take time to know,” Daly explained. With the great amount of uncertainty around the state of the labour market, the best thing to do for now is to stay “steady in the boat” and vigilant, she said.
Key comments
My modal outlook is that prices will moderate as we get through the pandemic.
I also have to worry about the non-modal outlook; watching carefully to see if inflation expectations rise.
Market implications
traders are waiting for the US Consumer Price Index and hence the US dollar is consolidating, rather than reacting to each comment from central bankers on Tuesday.
The dollar was oscillating between 93.90 and 94.10 in the morning trade of New York after data showed US producer prices increased solidly in October. While this was indicating that high inflation could persist for a while amid tight supply chains related to the pandemic, there were no great shakes ahead of tomorrow's key event in CPI.
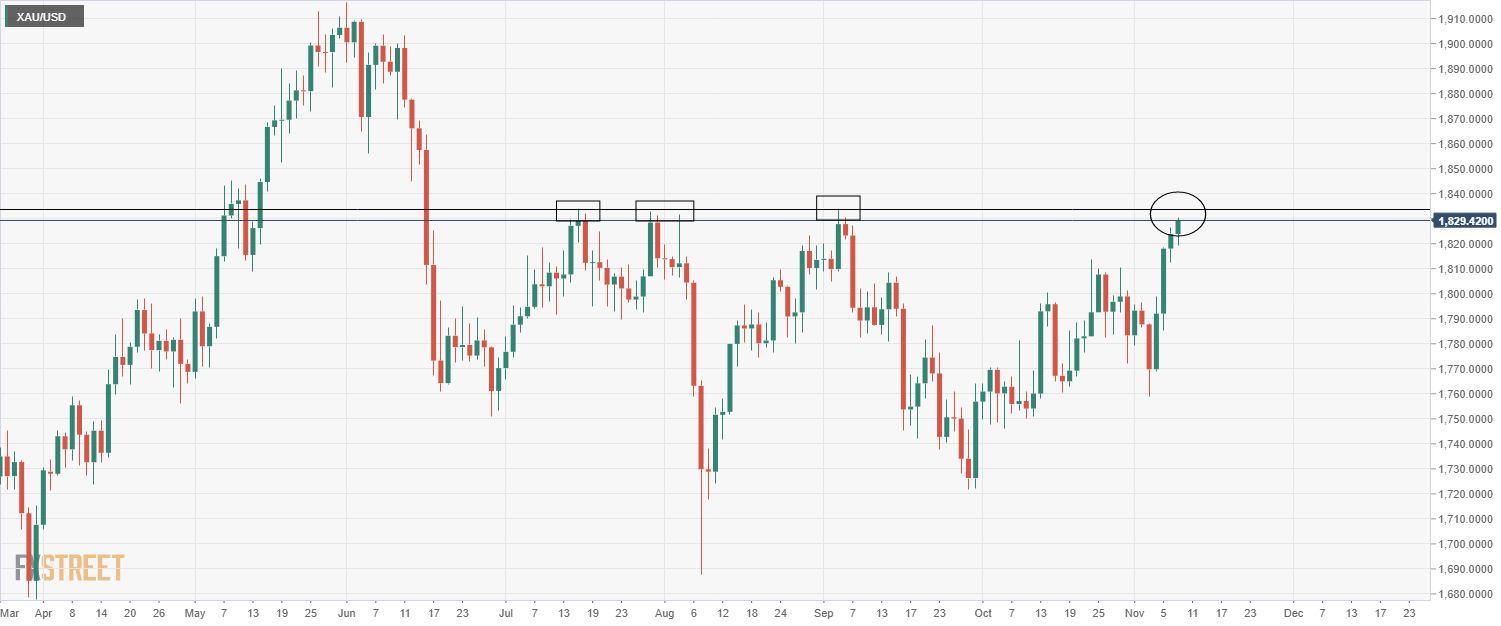
- Spot gold is trying to push above $1830 but hasn’t had success just yet.
- XAU/USD has been supported by a sharp decline in US real and nominal yields on Tuesday.
Spot gold (XAU/USD) continues to trade with an upside bias, though recent trade has been choppy, with prices briefly surpassing the $1830 level, but ultimately failing to hold above it. At the moment, XAU/USD is up by slightly more than 0.1% on the day and in the upper part of Tuesday’s $1820-$1830 range.
Falling nominal and real yields across developed markets have provided a tailwind for precious metals markets; US 10-year TIPS yields have dropped 9bps so far on the session to the -1.20% mark, leaving them only slightly above record lows at -1.216% printed during the summer. That has dragged nominal 10-year yields over 7bps lower to around 1.42%, its lowest since late September.
The reason for the sharp decline in US yields is not quite clear. Commentary this week from Fed policymakers Richard Clarida (the Vice Chairman of the Fed) and Charles Evans on when the bank might hike was dovish, with the former saying he sees the conditions for a rate hike being met at the end of 2022 and the latter in 2023. That compares to USD STIR market pricing which points to a strong probability of rate hikes starting in mid-2022. Perhaps the downside is as a result of market participants revising higher their perceived probability that more dovish-leaning Fed Governor Lael Brainard getting the nod to be the next Fed Chair following reports that she recently interviewed for the position.
XAU/USD’s gains are being capped by now by selling interest ahead of a key area of resistance in the $1830s. Prices on four occasions tried and failed to break to the north of this level during the summer months. A clean break back to the north of this level is likely going to require more than just a sharp drop in US real yields. The US dollar is also going to have to start slipping, with such a move unlikely in FX markets ahead of Wednesday’s US October Consumer Price Inflation report.
- The S&P 500 slumps for the first time in nine-session, down 0.31%, at 4,687.74.
- The Dow Jones slides 0.45%, currently at 36,266.80.
- The heavy-tech Nasdaq Composite shed 0.38%, at 15,921.68.
The S&P 500 edges lower during the New York session, down 0.31%, currently at 4,687.74 at the time of writing. The market mood is downbeat, as US equity indices drop between 0.31% and 0.60%, while in the FX market, investors flew to safe-haven currencies, boosting the Japanese Yen, the Swiss franc, and the greenback.
Tesla shares dropped 7% after Elon Musk held a poll over the weekend on Twitter asking his followers if it was a good decision to sell 10% of his Tesla shares, prompting a sell-off of the equity since Monday. Also, Paypal losses hurt the financial stocks after the company missed revenue expectations.
Sector-wise, real-estate, and utilities are the gainers, rising 0.26% and 0.14%, respectively. On the other hand, the main losers are consumer discretionary and financials down 0.89% and 0.79% each.
S&P 500 Price Forecast: Technical outlook
The daily chart depicts the S&P 500 has an upward bias, confirmed by the daily moving averages (DMA’s) well located below the index value, with an upward slope. Nevertheless, the Relative Strength Index (RSI) is at 71, well within overbought conditions, suggesting that a lower correction could happen. Furthermore, is testing the November 4 high at 4,683, which in case of a daily close beneath the latter, would expose the October 26 high at 4,598.53 that confluences with the 78.6% Fibonacci retracement as the first support level. In the outcome of a deeper correction, the October 27 low at 4,553.53.
- Crude oil markets are trading with a positive bias with WTI in the upper $82.00s.
- Ahead, the EIA’s monthly oil market report and private inventory data are in focus.
- The former could allegedly help the Biden administration decide on a policy response to high energy prices.
It’s been a subdued session thus far for crude oil markets, though by and large the complex has managed to shrug off modest selling pressure in equity markets to trade with a positive bias for most of the session. At present, front-month future contracts for the American benchmark for sweet light crude oil, West Texas Intermediary or WTI, trade higher by about 75 cents on the session in the upper-$82.00s. Some commodity strategists said that the recent easing of US travel restrictions (fully vaccinated passengers are now free to enter the US without having to quarantine) ought to give jet fuel demand a boost and help global oil demand recover back to pre-pandemic levels above 100M barrels per day.
Since the start of the week, crude prices have stayed within about 75 cents either side of the 21-day moving average, which currently resides at $82.32. The much more subdued trading conditions this week stand in stark contrast to the volatility seen last week. WTI prices dropped from weekly highs just under $85.00 last Monday to under $78.50 by Thursday, before surging back to the mid-$81.00s by the Friday close.
Coming up
Key themes that could trigger a return of volatile trading conditions include the much-anticipated announcement from the Biden administration on what its response to high crude oil and gas prices will be. Some think the administration may choose to release reserves from the Strategic Petroleum Reserve, though an energy export ban has also been touted.
Some analysts have suggested that the Biden administration will want to see the latest US Energy Information Agency monthly oil market report (called the Short-term Energy Outlook or STEO) before making any final decisions. The report, due for release at 1700GMT on Tuesday, may thus garner more attention than usual. Various news reports have suggested that a final decision on the Biden administration’s response to high energy costs will be announced before the end of the week. Elsewhere, crude oil traders will be watching out for the release of weekly private API crude oil inventory data at 2130GMT ahead of official US inventory data out at 1530GMT on Wednesday.
- USD/MXN keeps falling, now testing levels below the key support at 20.30.
- Mexican peso remains strong, Banxico seen raising rates on Thursday.
The USD/MXN is falling for the third consecutive day on Tuesday and it dropped below 20.30. If the Mexican peso holds firm under the mentioned area, the negative tone will remain intact, with doors open to more losses, targeting 20.15.
The next critical support stands around 20.13/18 that contains the 100 and 200 moving average. A slide below would expose 20.00.
The Mexican peso is looking strong ahead of the Banxico meeting on Thursday. The central bank is seen raising the key rate from 4.75% to 5%, particularly after CPI data showed an increase above 6% in the annual rate.
On the upside, USD/MXN could face resistance at 20.45. If the dollar manages to rise and hold above, the short-term outlook should favor the upside. The next resistance levels are located at 20.65 and 20.80.
USD/MXN daily chart
-637720704810422161.png)
- US dollar strengthens during the American session as stocks slide, despite lower yields.
- EUR/USD finds resistance at the 20-day simple moving average.
The EUR/USD pair is moving sideways on Tuesday, unable to hold above 1.1600. Recently it printed a fresh three day high at 1.1608 but it quickly pulled back toward daily lows. It is hovering under 1.1580 wihtouy a clear direction.
The greenback gained momentum during the America session across the board, even as US yields remained near recent lows. The DXT is up 0.05%, ending a two-day negative streak.
US economic data showed the PPI rose mostly in line with expectations, having no significant impact on markets. On Wednesday, CPI data is due. Those numbers will be important for considerations about the next steps of the Federal Reserve. Also, market participants await President Biden’s decision regarding Fed’s Chair. The specialized media mentioned Brainard (a dovish) as a potential replacement for Powell.
EUR/USD upside capped by a strong area
The rally from YTD lows found resistance around 1.1600/10, area that contains the 20-day moving average. Slightly above at 1.1620 there is another relevant horizontal resistance. A daily close above 1.1620 would open the doors the more gains.
While under 1.1600, the upside seems limited. Support levels might be located at 1.1565 and 1.1545. If the price rmeais under 1.1550, the 1.1520 critical support are will liekyl be challenged.
Technical levels
- US 10-year Treasury yields hit fresh multi-week lows under 1.45% on Tuesday.
- Recent Fed news/commentary has had dovish implications and could be weighing on yields.
US 10-year Treasury yields hit fresh multi-week lows on Tuesday after sliding under the 200-day moving average (DMA) at 1.449% and last week’s low at 1.436%. Yields have risen a touch from session lows at 1.431%, which was their lowest since late September, and are now back in the 1.45% region. As things stand, 10-year yields are down by just under 5bps on the day, having started the session close to 1.50%.
The drop in US 10-year yields comes amid a broader bull-flattening move being seen across the US yield curve; 2-year yields are down around 3bps to around 0.42% and 30-year yields are down nearly 6bps to just above 1.85%. The drop in yields is driven by a further decline in US real yields, rather than a move in inflation expectations. For reference, 10-year TIPs yields are down over 5bps on the day to just under -1.15%, leaving them only a few bps above the record lows close to -1.20%, while 30-year TIPs yields are down by a similar margin to under -0.55%. Meanwhile, 10 and 30-year breakeven inflation expectations (the nominal minus the real yield) are flat in the respective 2.60% and 2.40% regions.
Dovish vibes drive yields down
US yields saw a sharp drop towards the end of last week in tandem with global peers in wake of the dovish tilt to the Fed and BoE rate decisions, as well as dovish commentary from key ECB policymakers and the RBA. In wake of last week’s central bank action, STIR markets have broadly been paring back on recent hawkish bets, which has weighed on short-end yields and longer-term real yields (given inflation expectations were pushed higher in anticipation of more dovish central banks). Tuesday’s price action suggests this recent trend of dovish repricing has room yet to run.
Recent Fed commentary/news has had dovish implications; Fed Vice Chair Richard Clardia said on Monday that he saw the conditions for a rate hike being met at the end of 2022 (versus STIR market pricing for hikes starting in September). Moreover, it looks like dovish-leaning Fed Governor Lael Brainard is in with a good shot of becoming the next Fed Chair. Market pricing for rate hikes as soon as September 2022 looks vulnerable to be pared back even further, though Wednesday’s US Consumer Price Inflation report could throw a spanner in the works if it shows inflationary pressures continuing to build.
- USD/CAD trims some Monday losses, advances 0.24% during the day.
- US Producer Price Index came in line with expectations, and the market reaction was muted.
- Market participants await Wednesday's CPI numbers, which expect inflation to rise by 5.8% YoY.
The USD/CAD edges higher during the New York session, up 0.12%, trading at 1.2465 at the time of writing. The market sentiment is a mixed bag, as major US equity indices futures fluctuate between gainers and losers. Further, the FX market is in risk-aversion, as traders fly towards the safe-haven currencies, like the Japanese yen and some to the greenback, as confusion meanders in market participants.
Falling US T-bond yields undermine the greenback
Furthermore, the yield curve in the US flattens as the 20s are two basis points above the 30s, while the 10-year losses five basis points sit at 1.444%. Meanwhile, the US Dollar Index, which tracks the greenback's performance against a basket of its peers, falls 0.15%, currently at 93.90.
However, the USD/CAD is seesawing around the 1.2430-60 area with no apparent bias, awaiting US inflation figures.
On Tuesday, the US economic docket featured the Producer Price Index (PPI) for October, which in its headline, rose 0.6%, a tick higher than the 0.5% expected by analysts. Nevertheless, on a year-over-year figure increased 8.6%, unchanged according to the forecast. Moreover, the Core PPI for the same period on a monthly basis rose by 0.4%, higher than expected, whereas the annual basis number came in line with estimations at 6.8%.
According to the report released by the Bureau of Labor Statistics (BLS), higher energy costs drove the gain. Furthermore, it mentioned how recent months, transportation bottlenecks, material shortages, and increasing labor costs sent prices surging across the economy.
The USD/CAD trader's reaction to the news was muted as investors waited for a speech of Bank of Canada Governor Macklem at 22:45 GMT, alongside Wednesday's US inflation figures.
On Wednesday, the US economic docket will unveil the Consumer Price Index (CPI) for October, and the Initial Jobless Claims for the week ending on November 6.
Expectations for CPI on a yearly basis are at 5.8%, while excluding food and energy, analysts expect an increase of 4.3%. Concerning US Initial Jobless Claims are expected to rise by 265K, a tad lower than the previous week at 269K.
- NZD/USD is ebbing lower and is now under 0.7150.
- The pair failed to derive support from evidence that NZ consumer spending is rebounding in Q4.
NZD/USD continues to trade with a negative bias and is currently down about 0.3% on the day and trading to the south of the 0.7150 level, having briefly challenged Monday’s highs in the 0.7170s during Tuesday Asia Pacific trade. Kiwi weakness comes despite data showing a solid rebound in consumer spending in New Zealand in October.
Whether the modest pullback from weekly highs seen on Tuesday will translate into a more meaningful turnaround following the recent recovery from the 200-day moving average at 0.7100 remains to be seen. FX markets are for now mostly happy to trade within recent ranges and in subdued fashion as market participants await fresh macro catalysts, of which Wednesday’s US Consumer Price Inflation (CPI) report of October could be one.
Ahead of Wednesday’s US CPI report, the October Producer Price Inflation (PPI) report was recently released. The headline and core YoY and MoM metrics were broadly in line with expectations thus there hasn’t been any notable market reaction, but all remained at historically elevated levels, which suggests that Wednesday's CPI report will show the same. US markets seem more focused on who US President Joe Biden will choose as next Fed Chair right now, however. US real and nominal yields have tumbled on Tuesday with some attributing the drop to reports that Fed Governor Lael Brainard (seen as more dovish than current Chair Jerome Powell) was interviewed for the position and is seen as a contender. Her nomination would weigh on the US dollar.
NZ consumer spending recovers as lockdowns eased
Economic data released overnight showed the impact of the Q3 New Zealand lockdowns waning at the start of Q4; October Electronic Card Retail Sales were up 10.1% MoM. That means retail sales have now recovered about half of the near 20% MoM drop seen in August when lockdowns first came into force across the country. With Auckland set to exit lockdown at the end of the month as vaccination rates hit key thresholds, retail sales are expected to continue to rebound for the remainder of Q4.
USD/JPY struggles below the 113.00 mark. Economists at TD Securities think the 112.00 level offers major support and should be a buying point for USD/JPY.
A dip into 112.00 is likely
“With Treasury markets settling, we think the path to 112.00 remains, but we see no appeal in chasing it.”
“On a cross-asset valuation basis, USD/JPY is fair.”
“We think USD/JPY is essentially at the mercy of technicals and Fed pricing. The latter looks to have mostly quieted down while the former should reinforce cloud support at 112.00.”
Cable’s steadily higher price action since yesterday’s test of 1.3450 saw it test the 1.36 mark earlier today before selling pressure emerged. However, economists at Scotiabank expect GBP/USD to tackle the 1.3600/10 resistance area.
Support is seen at 1.3550
“Technical signals point to a re-test of the level (1.3600/10) to be followed by intermediate resistance in the mid-figure area and then firmer around 1.37 (50-day MA at 1.3693).”
“A reversal of its losses above 1.36 may see the GBP/USD pair resettle into a 1.36-138 range but within a minor downtrend as it reached lower highs in its past three periods of strength.”
“Support is 1.3550 followed by the figure area.”
EUR/USD is unchanged after test of 1.16. In the opinion of economists at Scotiabank, the pair needs to surpass the 1.1600/15 region to alleavite downside pressure.
1.1575/85 zone provides support
“Downside action was limited to the 1.1575/85 area that will act as support followed by the 1.1550 zone.”
“Going forward, EUR/USD will have to firmly break past the figure (1.1600/15) and the mid-1.16s to negate the firm downtrend that has held it since mid-year (and remains geared towards a break under 1.15).”
With central banks having already said their piece, seasonal, valuation and positioning still looks favorable for the USD. On these measures, the CHF looks vulnerable to a reversal, in the view of economists at TD Securities.
CHF could be a major laggard in the coming weeks
“The CHF is the most overloved currency on our positioning dashboard. It also tracks modestly rich to the USD.”
“We note that the SNB has increased sight deposit activity since mid-October, which signals their discomfort of letting the CHF appreciate further.”
“With the major central banks from the Fed, to the ECB and to some extent the BoE largely having said their piece, the CHF could be a major laggard in the coming weeks as the circuit takes a backseat.”
- GBP/USD fails to hold above 1.3600, slips back to mid-1.3500s.
- Upcoming BoE and Fed speakers will be watched.
GBP/USD has pulled back from earlier session highs slightly to the north of the 1.3600 level and now trades slightly to the north of the 1.3550 mark, roughly flat on the day, though still up by about 0.5% on the week. The pair’s strong rejection of the 1.3600 level, which also coincides with resistance in the form of last Tuesday’s lows just above it, suggests that this week’s technical correction may have run its course. Recall that GBP/USD underwent a sharp drop last week after the BoE shocked markets by choosing not to go with a widely expected 15bps rate hike.
BoE, Fed Updates
BoE Governor Andrew Bailey spoke publically on policy on Monday, reiterating his stance laid out at the last meeting that rate hikes might be appropriate in the coming months if the economy, most notably the labour market, evolves as expected. He is scheduled to speak again on Tuesday at 1600GMT, though his comments might not address BoE policy given that the topic of the panel discussion is inequality. However, BoE Monetary Policy Committee member Ben Broadbent is slated to speak at 1530GMT and his comments might be more pertinent given he is talking about labour shortages before the UK parliament.
GBP/USD traders will also need to keep an eye on Fed speak/developments on Tuesday. News recently broke that Fed Governor Lael Brainard was recently interviewed for the position of Fed Chair and is considered a “contender” for the position. This follows Braindard and current Fed Chair Jerome Powell both being seen at the White House last week. Betting markets see the situation as a two horse race, with Powell still the favourite to be picked as the next Fed chair, though his percieved “lead” has dwindled in recent days. Brainard is considered more dovish than Powell and her nomination as Fed Chair would weigh on the US dollar.
Dovish comments from Fed Vice Chair Richard Clarida and FOMC member Charles Evans on Monday was cited as a reason why the US dollar weakened at the time (and GBP/USD was able to recover back above 1.3500). Neither saw the conditions for rate hikes being met by mid-2022 as USD STIR markets are pricing. FX markets will be watching remarks from FOMC members Daly and Kashkari speak at 1635GMT and 1830GMT respectively in wake of the just released October PPI report (annual rates of PPI remain highly elevated).
Jerome Powell, Chairman of the Federal Reserve System, said on Tuesday that they look at a wide range of indicators when assessing maximum employment, as reported by Reuters.
Additional takeaways
"Fed is attentive to labour market disparities rather than just headline numbers."
"An economy is healthier and stronger when as many people as possible are able to work."
"Those who have historically been left behind stand the best chance of prospering in a strong economy."
Market reaction
The market reaction to these comments was muted and the US Dollar Index was last seen posting small daily losses at 93.95.
- Headline US PPI came in at 8.6% YoY in October.
- The US Dollar Index hardly saw any reaction and continues to trade close to 94.00.
The YoY rate of Producer Price Inflation came in at 8.6% in October, unchanged from the month prior and slightly below expectations for 8.7%, according to a report by the US Bureau of Labour Statistics.
But the MoM rate of PPI rose to 0.6% in October, versus expectations for 0.5% and higher than September's 0.5% reading. Elsewhere, the YoY rate of Core PPI was stable at 6.8%, while the MoM pace of Core PPI in October came in at 0.4%, below expectations for 0.5%.
Market Reaction
The US Dollar Index (DXY) hardly saw any reaction to the data and has continued to trade close to 94.00.
- AUD/USD has slipped back to the 0.7400 level from earlier highs in the 0.7430 region.
- The pair failed to derive lasting impetus from a strong NAB business sentiment report.
- Focus is now on US inflation, Fed speak and more Australian survey data.
AUD/USD has waned from earlier session highs in the 0.7430s and is now again flirting with the 0.7400 level, down just under 0.3% on the day despite the release of an upbeat Australia business confidence survey during Tuesday Asia Pacific trading hours. If bearish momentum does build and AUD/USD breaks below the 0.7400 level and Monday’s lows around 0.7390, then technicians would likely target a move towards last week’s lows at 0.7360, which sits just below the 50-day moving average at 0.7369.
-637720605300549743.png)
Aussie data points to positive 2022 outlook
Australian bank NAB’s Business Confidence index rose to 21 in October from 13 in September, while the bank’s Business Conditions index rose to 11 in October from 5 the month prior. The improvement in business confidence was primarily driven by an easing of lockdown restrictions, local economists said, after the country’s most populous state New South Wales came out of lockdown on 11 October (the data for the survey was collected between 19-29 October). Sentiment also improved in Victoria, where the end of lockdown is in sight, and in Queensland, which should see its state borders reopened before the end of the year. According to local bank Westpac, “the reopening facilitated by high vaccination rates points to a positive outlook for 2022”.
Day Ahead
Looking ahead, AUD/USD traders will focus their attention back to stateside events for the remainder of the US session, with US inflation data and a few Fed speakers in focus. The US Bureau of Labour Statistics will release the October Producer Price Inflation report at 1330GMT ahead of comments from Fed Chair Jerome Powell on diversity at 1400GMT. Thereafter, FOMC members Daly and Kashkari speak at 1635GMT and 1830GMT respectively. Aussie traders returning for the Wednesday Asia Pacific session should keep an eye on the release of Westpac’s November Consumer Confidence survey at 2330GMT.
European Central Bank (ECB) policymaker Klaas Knot said on Tuesday that conditions for a rate hike are very unlikely to be met in 2022, as reported by Reuters.
Additional takeaways
"Inflation to fall below 2% towards the end of 2022 but must prepare for upside scenarios."
"APP is the appropriate tool for marginal policy adjustment beyond PEPP, should keep optionality to adjust APP both up and down."
"ECB should not make long-lasting unconditional commitments once PEPP ends; must maintain optionality."
"Inflationary pressures from higher energy prices, supply bottlenecks last longer than initially thought."
"Higher wage increases will become more likely if inflationary pressures were to persist longer."
Market reaction
The shared currency stays on the back foot following these comments and the EUR/USD pair was last seen losing 0.1% on the day at 1.1572.
- EUR/GBP continues to nudge lower, but recently bounced at its 50DMA around 0.8520.
- Amid a lack of key fundamental updates, focus turns to more BoE and ECB speak on Tuesday.
EUR/GBP continues to nudge lower in wake of Monday’s decline, though has in recent trade seen a modest bounce from the 50-day moving average at 0.8522. The pair currently trades in the 0.8530s, with modest on the day losses of about 0.1% and is now down about 0.6% from earlier weekly highs at the 200DMA around 0.8590. Trading conditions right now are subdued across G10 FX markets, meaning it may be a struggle for EUR/GBP to break below support, both in the form of the 50DMA and the 12 October/early November highs at around 0.8515 just below it.
In terms of fundamental updates, Brexit has been in the headlines, there has been some economic commentary and a few data releases, but nothing to significantly shift the dial for GBP. Starting with the former; reports suggested early on Tuesday that the EU was preparing a package of retaliatory measures against the UK if its triggers Article 16, measures which were allegedly going to be presented to the UK Brexit Minister Lord David Frost at the end of the week as a deterrent. But more recently, European Commission officials were on the wires denying that such a package of measures was being prepared. Simultaneously, talks between the UK and France on fishing rights continued, with the French Secretary of State for European Affairs Beaune reiterating this morning the need for a quick solution.
In terms of data; German and French trade numbers for September were out on Tuesday morning, the former posting a slightly smaller than expected, but still healthy trade surplus on the month of EUR 13.2B, the latter posting a slightly smaller than expected trade deficit of EUR 6.778B. The German ZEW survey for October was also released, with the forward-looking Economic Sentiment index posting a surprise rise to 31.7 from 22.3, but the Current Conditions index falling more than expected to 12.5 from 21.6.
Day Ahead
Looking ahead, attention turns to Tuesday’s BoE and ECB speakers; ECB hawk Klass Know it speaking at 1400GMT, BoE MPC member Ben Broadbent is speaking to the UK Parliament at 1530GMT on labour shortages and BoE Governor Andrew Bailey and ECB’s Isabel Schnabel are speaking on a panel on inequality at 1600GMT. Further “evidence that the (BoE) MPC is in no particular hurry to tighten policy from here could continue to keep the GBP on the defensive vs the USD and the EUR” says Credit Agricole, adding that they “remain long EUR/GBP”.
- EUR/USD struggled to preserve its modest intraday gains to levels just above the 1.1600 mark.
- A combination of factors helped revive the USD demand, which, in turn, exerted some pressure.
- Investors look forward to the US PPI report and Fed Chair Powell’s remarks for a fresh impetus.
The EUR/USD pair edged lower heading into the North American session and dropped to fresh daily lows, around the 1.1575 region in the last hour.
The pair struggled to find acceptance above the 1.1600 round-figure mark and witnessed a modest intraday pullback from three-day tops touched earlier this Tuesday. The EUR/USD pair has now drifted into the negative territory, snapping two days of the winning streak, and was pressured by the emergence of some buying around the US dollar.
Despite the Fed's dovish outlook, expectations that the US central bank would be forced to adopt a more aggressive policy response to contain stubbornly high inflation acted as a tailwind for the USD. The speculations were further fueled by the overnight hawkish comments by several FOMC officials, signalling that the Fed could raise rates by the end of 2022.
Apart from this, the cautious mood around the equity markets further underpinned the greenback's relative safe-haven status against its European counterpart. That said, a fresh leg down in the US Treasury bond yields held the USD bulls from placing aggressive bets and should help limit any deeper losses for the EUR/USD pair, at least for now.
Next on tap is a scheduled speech by the European Central Bank President Christine Lagarde and the release of the US Producer Price Index. This, along with Fed Chair Jerome Powell's remarks at an online conference, might provide some impetus to the EUR/USD pair. The key focus, however, will be on Wednesday's release of the latest US consumer inflation figures.
Technical levels to watch
- Silver attracted some dip-buying on Tuesday, though remained below two-week tops.
- The bias favours bulls and supports prospects for a move towards the $24.80-85 area.
Silver reversed modest intraday losses and was last seen hovering near daily tops, just below mid-$24.00s, or two-week tops touched in the previous day.
Given the overnight sustained move beyond the $24.20-15 confluence barrier, the emergence of some dip-buying on Tuesday favours bullish traders. The outlook is reinforced by the fact that technical indicators on the hourly/daily charts are holding comfortably in the bullish territory and are still far from being in the overbought zone.
Hence, a subsequent move towards testing October monthly swing highs, around the $24.80-85 region, remains a distinct possibility. This is followed by the key $25.00 psychological mark. The latter coincides with the 50% Fibonacci level of the $28.75-$21.42 downfall, which if cleared decisively will set the stage for additional near-term gains.
The XAG/USD might then accelerate the momentum towards the next relevant hurdle near the $25.55-60 region before eventually aiming to test the 61.8% Fibo. level, around the $26.00 round-figure mark.
On the flip side, the $24.20-15 resistance breakpoint – comprising 100-day SMA and the 38.2% Fibo. levels – now seem to protect the immediate downside ahead of the $24.00 mark. Any subsequent fall might still be seen as a buying opportunity near the $23.70 area, which should help limit the downside near the $23.50 support zone.
Failure to defend the mentioned support levels would turn the XAG/USD vulnerable to retest strong support around the $23.00 mark. Some follow-through selling could shift the bias in favour of bearish traders and expose the next relevant support near mid-$22.00s. The downward trajectory could get extended towards YTD lows, around the $21.40 area touched in September.
Silver daily chart
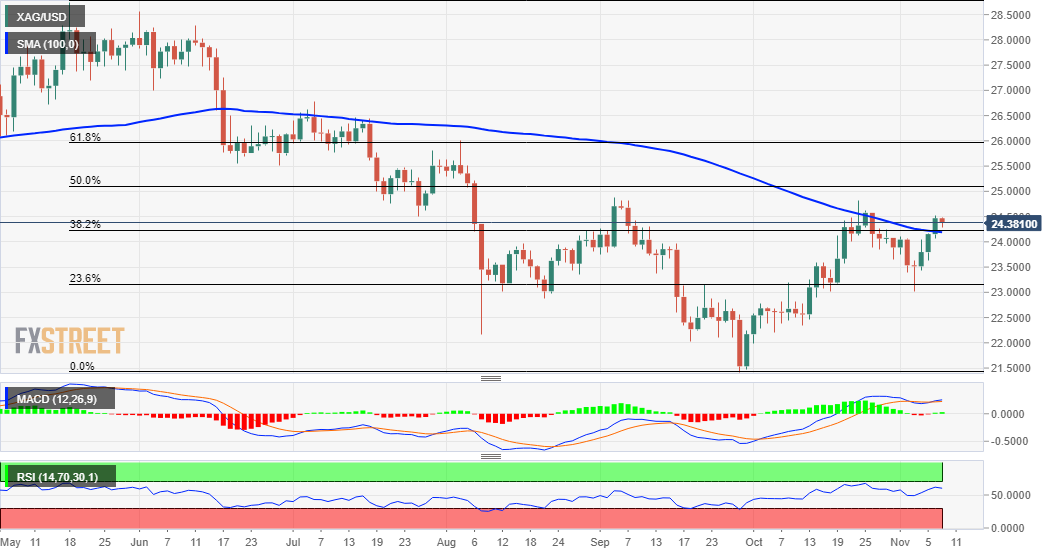
Technical levels to watch
The UK's National Institute of Economic and Social Research (NIESR) noted on Tuesday that they expect the Bank of England (BoE) to raise the policy rate to 0.5% by the second quarter of 2022, as reported by Reuters.
Additional takeaways
"BoE will pause once inflation is past its peak."
"UK GDP to grow 6.9% in 2021."
"UK GDP to grow 4.7% in 2022."
"UK CPI to peak at around 5% in Q2 2022."
Market reaction
This report doesn't seem to be having a significant impact on the British pound's performance against its rivals. As of writing, the GBP/USD pair was up 0.15% on the day at 1.3583.
- USD/JPY witnessed selling for the fourth successive day on Tuesday amid sustained USD selling.
- The cautious market mood underpinned the safe-haven JPY and also contributed to the decline.
- Acceptance below the 113.00 round figure might have already set the stage for additional losses.
The USD/JPY pair maintained its offered tone through the mid-European session and was seen trading around the 112.90-85 region, just a few pips above four-week lows touched earlier this Tuesday.
A combination of factors dragged the USD/JPY pair lower for the fourth successive day and reaffirmed the overnight bearish break below the 113.30-25 strong horizontal support. The cautious market mood underpinned the safe-haven Japanese yen and exerted some pressure on the major amid the prevalent US dollar selling bias.
In fact, the greenback prolonged its recent pullback from YTD tops touched in reaction to the upbeat NFP report on Friday and was pressured by the Fed's dovish outlook. It is worth recalling that the US central bank stuck to its transitory inflation narrative and indicated that it was in no rush to raise borrowing costs.
Apart from this, a fresh leg down in the US Treasury bond yields further weighed on the greenback and contributed to the USD/JPY pair's decline to the lowest level since October 11. The downfall could also be attributed to technical selling below the 113.00 mark, which might have already set the stage for further losses.
That said, slightly oversold RSI on hourly charts held back traders from placing fresh bearish bets and helped limit losses. Traders now look forward to the release of the US Producer Price Index (PPI). This, along with Fed Chair Jerome Powell's remarks will influence the USD and provide some impetus to the USD/JPY pair.
Technical levels to watch
US inflation will likely take another sharp leg higher. Here are five reasons why the broadening of inflation will also continue into 2022 in the view of economists at Nordea.
Broad wage growth leads to higher median prices
“Broad wage growth usually spills-over to a higher median CPI with a time-lag of 6-9 months, which will likely lead median prices higher through 2022. This is exactly the kind of inflation that the Fed fears the most.”
Prices on used cars are surging again
“The prices on used cars have started surging again and we need to pencil in material new spikes in the yearly pace of prices according to our model which also takes the Mainheim indicator intp consideration. We project that the used vehicle component will contribute with >1.5% by year-end, with risk to the upside.”
Rent of shelter inflation is picking up the pace
“ Our model predicts YoY price growth just below 6% in the owners equivalent rent of resident (OER) component over the coming two quarters. Given our model predictions, the yearly contribution to core inflation from the OER component could be as large as 1.7%.”
The energy to food price feedback loop
“There is a negative feedback loop ongoing in food prices as higher energy prices lead to higher prices on fertilizers and ultimately higher prices on crops and food in general. The energy crisis is far from being over as Russia is still not delivering any gas via the Mallnow station at the Polish/German border. This is the exact week Putin promised to start filling the German underground storages from. Can we take him at face value? We doubt it.”
Vaccine mandate and restrictions to prolong supply issues
“Vaccine mandates likely continue to distort the Nonfarm reports in the US as well. This is wage inflationary, while continued restrictions in Europe and the US will keep consumption of goods elevated versus services, which is a key reason behind distressed supply chains.”
- GBP/USD added to the previous day’s strong gains and scaled higher for the second straight day.
- The Fed’s dovish outlook, sliding US bond yields undermined the USD and remained supportive.
- Brexit jitters might hold bulls from placing aggressive bets and cap any further gains for the pair.
The GBP/USD pair shot to three-day tops during the mid-European session, with bulls now looking to build on the momentum beyond the 1.3600 mark.
The pair built on the overnight strong intraday rally of around 130 pips and gained follow-through traction for the second successive day on Tuesday. The momentum pushed the GBP/USD pair further away from Friday's five-week lows and was exclusively sponsored by the prevalent selling bias surrounding the US dollar.
The greenback was weighed down by the fact that the Fed stuck to its transitory inflation narrative and indicated that policymakers were in no rush to raise borrowing costs. This, along with a fresh leg down in the US Treasury bond yields, further undermined the greenback and provided a goodish lift to the GBP/USD pair.
That said, a cautious market mood could lend some support to the greenback's relative safe-haven status. Apart from this, worries that the UK government will trigger Article 16 of the Northern Ireland Protocol might hold bullish traders from placing aggressive bets and cap the upside for the GBP/USD pair.
This, along with last week's dovish Bank of England decision, suggests that the ongoing positive move runs the risk of fizzling out rather quickly. Market participants now look forward to the US economic docket, featuring the release of the Producer Price Index (PPI) for October later during the early North American session.
Apart from this, the Fed Chair Jerome Powell's remarks at an online conference, the US bond yields and the broader market risk sentiment will influence the USD price dynamics. Traders might further take cues from the BoE Governor Andrew Bailey's scheduled speech for some trading opportunities around the GBP/USD pair.
Technical levels to watch
The US Dollar Index (DXY) has tested and continues to remain capped by resistance is 94.47/80. Meanwhile, it is underpinned by the 93.62 2021 uptrend. Strategists at Commerzbank await the break from this range to determine direction.
DXY to advance towards 96.10, then 97.73 on a break above 94.80
“The Elliott wave count continues to imply failure at key resistance namely the 38.2% retracement of the move down from 2020, September 2020 high, the 55-month ma and the 200-week ma at 94.47/80. Above here would target the 96.10 then 97.73 Fibo resistance.”
“Only if DXY closes below the uptrend at 93.45, would this be enough to trigger another leg lower initially to the 55-week ma at 91.88 and the end of July low at 91.78.”
- EUR/USD gained traction for the third successive day amid sustained USD selling bias.
- The risk-off impulse helped limit the USD losses and capped the upside for the major.
- Investors await speeches by ECB’s Lagarde and Fed’s Powell for some trading impetus.
The EUR/USD pair held on to its modest intraday gains through the first half of the European session, albeit seemed struggling to capitalize on the move beyond the 1.1600 mark.
The pair edged higher for the third successive day on Tuesday and built on its modest rebound from the lowest level since July 2020, touched in reaction to the upbeat US NFP report on Friday. The US dollar remained on the defensive in the wake of the Fed's dovish outlook and was further pressured by a fresh leg down in the US Treasury bond yields. This, in turn, was seen as a key factor that acted as a tailwind for the EUR/USD pair, though a combination of factors capped any further gains.
The Fed last week indicated that policymakers were in no rush to raise borrowing costs. Investors, however, seem convinced that the US central bank would be forced to adopt a more aggressive policy response to contain stubbornly high inflation. The speculations were further fueled by the overnight hawkish comments by a slew of FOMC members, signalling that the central bank could raise rates by the end of 2022. This, along with a softer risk tone, helped limit losses for the safe-haven USD.
On the economic data front, the German ZEW Economic Sentiment Index surpassed even the most optimistic estimates and jumped to 31.7 for the current month from 22.3 in October. Additional details revealed that the Current Situation Index fell to 12.5 in November as against consensus estimates for a reading of 18 and 21.6 previous. The data did little to impress bullish traders or provide any meaningful impetus to the EUR/USD pair, which remains at the mercy of the USD price dynamics.
Market participants now look forward to the European Central Bank President Christine Lagarde's scheduled speech for some impetus. Later during the early North American session, traders will take cues from the release of the US Producer Price Index and Fed Chair Jerome Powell's remarks at an online conference. This, along with the US bond yields and the broader market risk sentiment, will influence the USD and produce some meaningful trading opportunities around the EUR/USD pair.
Technical levels to watch
- German ZEW Economic Sentiment arrived at 31.7 in November, down from 22.3 previous.
- The ZEW Current Situation for Germany came in at 12.5 in November vs. 21.6 in October.
- EUR/USD extends bounce to retest 1.1600 despite mixed ZEW data.
The German ZEW headline numbers for November showed that the Economic Sentiment Index unexpectedly improved to 31.7 from 22.3 previous while beating estimates of 19.0.
Meanwhile, the Current Conditions sub-index dropped to 12.5 in November as against 21.6 recorded in the previous month and 18.0 expectations.
The Eurozone ZEW Economic Sentiment for November rose to 25.9 for the current month as compared to the 21.0 previous.
Key takeaways
“Financial market experts are more optimistic about the coming six months. “
“For Q1 2022, experts expect growth to pick up again and inflation to fall both in Germany and the Eurozone.”
FX market reaction
The euro extended its bounce from session lows of 1.1580 despite the mixed ZEW Surveys, as EUR/USD now looks to recapture 1.1600.
The spot was last seen trading at 1.1597, up 0.09% on the day.
EUR/HUF has pulled back after achieving a peak of 366.90 late last month. However, economists at Société Générale expect the pair to move back higher towards the 369.20/50 region.
Downside limited
“A large downside is not envisaged; daily Ichimoku cloud near 356.00 should provide support.”
“The pair could gradually inch higher towards the upper band of recent consolidation zone at 369.20/369.50.”
The US Dollar Index (DXY) has failed to reclaim the intermittent resistance near 94.50/94.75 representing the graphical levels consisting of peak of October, low of March 2020 and the weekly Ichimoku cloud. Therefore, econimists at Société Générale expect DXY to tackle the crucial 93.20/10 support area.
DXY to see another leg higher above 94.50/75
“The 94.50/94.75 hurdle must be overcome for next leg of uptrend.”
“The DXY is staging a pullback and could retest the multi month channel at 93.50 and recent trough at 93.20/93.10. This would be a crucial support.”
USD/MXN is in proximity to the 200-day moving average (DMA) at 20.00. While above here, the pair can march forward to the 21.00 level, then 21.60/68, economists at Société Générale report.
20.00 is first support
“So long as the 200-DMA at 20.00 is not violated, a deeper pullback may not materialize.”
“Holding above 20.00, USD/MXN could attempt a rebound towards 21.00 and perhaps even towards projections at 21.60/21.68.”
- NZD/USD witnessed a subdued/range-bound price action on Tuesday.
- The risk-off impulse acted as a headwind for the perceived riskier kiwi.
- Rising bets for another RBNZ rate hike helped limit losses for the pair.
The NZD/USD pair seesawed between tepid gains/minor losses through the early part of the European session and was last seen trading in the neutral territory, just above mid-0.7100s.
The pair struggled to capitalize on its gains recorded over the past two trading sessions and witnessed some selling near the 0.7175 resistance zone on Tuesday. A softer risk tone turned out to be a key factor that weighed on the perceived riskier kiwi, though the downside remains cushioned.
Investors turned cautious amid growing acceptance that rising inflationary pressures could force major central banks to hike interest rates earlier than anticipated. The nervousness prompted some profit-taking in the equity markets following the recent strong runup to record high levels.
Meanwhile, the risk-off impulse, along with the Fed's dovish outlook triggered a fresh leg down in the US Treasury bond yields. This, in turn, forced the US dollar to prolong its retracement slide from YTD tops touched on Friday and helped limit deeper losses for the NZD/USD pair.
Apart from this, rising bets for another rate hike by the RBNZ should act as a tailwind for the major and attract some dip-buying at lower levels. That said, traders might refrain from placing fresh bullish bets ahead of Wednesday's release of the US consumer inflation figures.
The markets have been pricing in the possibility of an interest rate hike move by the Fed in 2022 amid worries about a faster rise in inflation. The speculations were reaffirmed by the overnight hawkish comments by a slew of FOMC members, signalling that the central bank could raise rates.
The US CPI report for October will influence Fed rate hike expectations and influence the USD price dynamics, which, in turn, should provide a fresh directional impetus to the NZD/USD pair. In the meantime, traders might take cues from Tuesday's release of the US Producer Price Index (PPI) and Fed Chair Jerome Powell's remarks later during the early North American session.
Technical levels to watch
- Gold price retreats from two-month highs, awaits US inflation figures.
- USD rebounds with Treasury yields, restricts gold’s bullish momentum.
- Gold price turns bullish on falling bond yields, technical breakout.
Gold price is off the two-month highs but maintains its bullish momentum, as September highs of $1834 remains in sight. Gold price continues to remain underpinned by the market uncertainty over the next policy move by the Fed after Chair Jerome Powell said they are patient on rate hikes a week ago. The bright metal remains at the mercy of the dynamics in the US dollar and the Treasury yields, as investors await the US inflation data for the next direction in gold price.
Read: Gold Price Forecast: XAU/USD seems poised to challenge $1,832-34 supply zone
Gold Price: Key levels to watch
The Technical Confluences Detector shows that the latest leg down in gold price is seen testing strong bids at $1822, which is the convergence of the Bollinger Band one-day Upper and Fibonacci 38.2% one-day.
The immediate downside is guarded by the confluence of the previous week’s high and Fibonacci 61.8% one-day at $1818.
If the selling momentum intensifies, then powerful support around $1815 will be put to test. That level is the intersection of the previous month’s high, pivot point one-month R1 and pivot point one-day S1.
Further south, the Fibonacci 23.6% one-week at $1805 will come into play.
On the flip side, buying resurgence could see a fresh rally back towards the two-month tops of $1827, above which the pivot point one-day R1 at $1830 will get probed.
The next bullish target is envisioned at $1834, September highs. The pivot point one-week R1 at $1839 will offer fierce resistance to gold optimists.
Here is how it looks on the tool
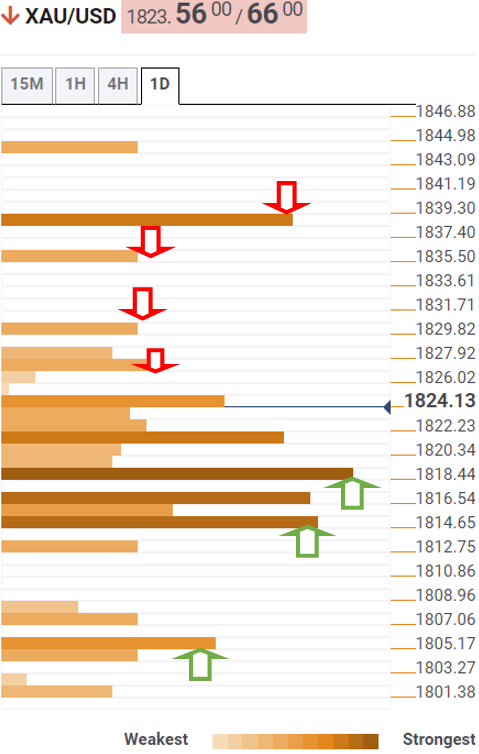
About Technical Confluences Detector
The TCD (Technical Confluences Detector) is a tool to locate and point out those price levels where there is a congestion of indicators, moving averages, Fibonacci levels, Pivot Points, etc. If you are a short-term trader, you will find entry points for counter-trend strategies and hunt a few points at a time. If you are a medium-to-long-term trader, this tool will allow you to know in advance the price levels where a medium-to-long-term trend may stop and rest, where to unwind positions, or where to increase your position size.
EUR/USD closed October trading in the upper-1.15 range. In November, the euro will move bearishly on political risk, an economic slowdown, and the divergent monetary policies of the US and Europe, according to economists at Mizuho Bank.
Euro to move bearishly as investors focus on political risk
“ECB president Christine Lagarde adopted a dovish stance but the press conference was still read as more hawkish than expected, so market participants are continuing to price in a rate hike in the latter half of 2022. However, no members have voiced support for rate hikes, so the euro could move bearishly if premature expectations for such a move wane. On the other hand, the greenback looks set to continue trending upwards on expectations for rate hikes next year.”
“COVID-19 cases are growing again in the UK, Russia and other states close to the eurozone, so there is a growing risk that Europe might see a surge in cases going forward. The eurozone released a series of worse-than-expected indicators in October and the European economic recovery could slow further from here on.”
“As for coalition talks in Germany, the Social Democrats (SPD) have reached a basic agreement with the Greens and the Free Democrat Party (FDP), with formal negotiations set to take place next. Political risk could rise again if these talks make no progress. With a presidential election also looming in France next year, the euro will probably move bearishly as investors focus on political risk.”
- GBP/JPY met with fresh supply on Tuesday and eroded a major part of the overnight gains.
- The risk-off impulse underpinned the safe-haven JPY and exerted some downward pressure.
- Weaker USD benefitted the British pound and helped limit any further losses, at least for now.
The GBP/JPY cross traded with a negative bias through the early European session, albeit has retreated a few pips from daily lows. The pair was last seen hovering around the 153.25-20 region, down over 0.25% for the day.
The cross struggled to capitalize on the previous day's attempted recovery move from the 152.70 area, or four-week lows, instead met with fresh supply on Tuesday. This marked the third day of a negative move in the previous four and was sponsored by a strong revival in demand for the safe-haven Japanese yen.
Investors turned cautious amid speculations that the rising inflationary pressures could force central banks to hike rates earlier than expected. Against the backdrop of the recent runup to record highs, the nervousness prompted some profit-taking in the equity markets and benefitted traditional safe-haven assets.
Bearish traders further took cues from the ongoing decline in the government bond yields. However, the prevalent US dollar selling bias extended some support to the British pound and helped limit any deeper losses for the GBP/JPY cross. That said, the near-term bias seems tilted in favour of bearish traders.
Last week, the Bank of England surprised investors and took a dovish turn to hold interest rates steady. This comes on the back of worries that the UK government will trigger Article 16 of the Northern Ireland Protocol, which should act as a headwind for the British pound and cap the GBP/JPY cross.
In the absence of any major market-moving economic releases on Tuesday, the fundamental backdrop warrants some caution before positioning for any meaningful recovery. That said, it will still be prudent to wait for sustained weakness below the 153.00 mark to confirm the bearish outlook for the GBP/JPY cross.
Technical levels to watch
The European Central Bank (ECB) top supervisor Andrea Enria said on Tuesday, low ECB interest rates are now hurting bank margins more than they are boosting lending volumes.
Additional quotes
"The margin effect has been prevailing so there is a negative effect on bank margins but this is likely to persist for a while.”
“The low-rates environment had been a net positive for banks until mid-2020.”
EUR/USD reaction
These comments had little to no impact on the euro, as EUR/USD remains at the mercy of the US dollar price action.
The spot was last seen trading at 1.1584, modestly flat on the day.
The Bank of England (BoE) held a monetary policy meeting on the 4th of November and decided to stay put on its policy rate against market expectations. That said, a potential rate hike could be coming in the next few months and analysts at the National Bank of Canada still see some upside for cable.
Pullback for both the pound and short-term rates
“The BoE decided to stay put. This surprise accordingly moved the short rates lower while the pound depreciated on the news. Moreover, there was also no change made to the QE program. BoE Governor Bailey signalled that a rate hike in the next few months was possible if labour market conditions and data lined up with their objectives.”
“We believe there is some upside for the pound in the coming quarters as the central bank remains more hawkish on a comparative basis, but we remain cautious given that the same factors affecting the eurozone (such as energy, inflation, supply chains) are risks which could work against the recovery for the British economy.”
In October, the Indonesian rupiah remained strong against the US dollar toward the middle of the month. However, the appreciation of the Indonesian rupiah slowed down toward the end of the month. In November, the Indonesian rupiah is forecast to remain robust against the greenback.
US interest rates to remain an important factor in the Indonesian rupiah market
“At the moment, Indonesia’s trade surplus is high enough to offset the current account deficit, keeping the Indonesian rupiah extremely stable. With regard to commodities prices, it is unlikely for prices to rise further, as there are some sources of concern, such as possible intervention by China in the coal market. However, it would take some time for the supply and demand balance to develop, and thus commodities prices could remain high for a while. The high commodities prices are likely to support the Indonesian rupiah in the times ahead.”
“As time goes by, US interest rates are only expected to rise and are not likely to fall, except for some temporary phrases of adjustment. Under such circumstances, it is difficult for the Indonesian rupiah to continue one-sidedly appreciating, even with high trade surplus. On the other hand, from the medium to long-term perspective, if the trade surplus remains high, the Indonesian rupiah is not likely to depreciate. Therefore, it is unlikely for the Indonesian rupiah to depreciate sharply as was seen in 2018 at the time of previous US interest rate hikes.”
“The situation in Indonesia related to the COVID-19 pandemic has been under control, allowing economic activities to resume properly, which is another positive factor for the Indonesian rupiah. Therefore, the Indonesian rupiah is forecast to remain robust in November.”
In November, the AUD/USD pair is expected to target 0.76, in the view of economists at Mizuho Bank. Regarding the AUD/JPY, this pair could hit its 2021 high of 86.225.
AUD/USD to move firmly
“The charts show the pair being held down at around 0.7560 (its Fibonacci halfway point and 200-day moving average), so investors will try pushing it through this level. The next target would be the July 6 high of 0.7599, with the 0.76 range in sight. If rising commodity prices also lend a hand, the pair could well hit the 0.76 range.”
“The AUD/JPY pair will probably renew its 2021 high of 86.255, a target last reached on October 21.”
While the loonie has strengthened slightly against the USD since the start of the fourth quarter, the appreciation has been very muted. Economists at the National Bank of Canada remain comfortable with their current forecast calling for a rate of USD/CAD 1.20 in 2022.
Stronger loonie but still too weak
“The change in expectations for Bank of Canada rates hikes combined with high prices of commodities suggest more than 12 cents of underverluation versus the US dollar.”
“While we have moved up the date of BoC’s first rate hike from July 2022 to April 2022, our assumption is weaker than what the markets are expcting for the BoC, with a significant narrowing of spreads between Canada and the US on two-year Treasury yields.”
“While the economy appears to be doing well at the present, we believe the central bank is sensitive to household debt and wants to avoid a ‘hard landing’ in the housing market. We concede that there is a high degree of uncertainty, but the apparent downside risks to the Bank’s new growth and inflation forecasts could buy its time.”
“We remain comfortable with our current forecast calling for a rate of USD/CAD 1.20 in 2022.”
FX option expiries for November 9 NY cut at 10:00 Eastern Time, via DTCC, can be found below.
- EUR/USD: EUR amounts
- 1.1550 1.8b
- 1.1650 540m
- USD/JPY: USD amounts
- 113.70 2.0b
- AUD/USD: AUD amounts
- 0.7450 370m
- 0.7485 325m
- USD/CAD: USD amounts
- 1.2400 550m
- 1.2460 1.2b
- EUR/GBP: EUR amounts
- 0.8500 993m
- The USD lost some additional ground for the third successive session on Tuesday.
- The Fed’s dovish outlook, sliding US bond yields acted as a headwind for the USD.
- The risk-off impulse in the markets helped limit losses for the safe-haven greenback.
The US dollar witnessed some selling for the third successive day and retreated further from YTD tops, touched in reaction to the upbeat US NFP report on Friday. The downward momentum dragged the USD Index to three-day lows, around the 93.85 region during the early European session, though lacked follow-through.
The Fed's dovish outlook, indicating that policymakers were in no rush to hike rates, continued acting as a headwind for the greenback. Apart from this, a fresh leg down in the US Treasury bond yields further undermined the USD. However, the risk-off impulse in the markets – as depicted by a generally softer tone around the equity markets – helped limit losses for the safe-haven buck.
Apart from this, speculations that the Fed would be forced to adopt a more aggressive policy response to contain stubbornly high inflation further held back traders from placing fresh USD bearish bets. Hence, the market focus will remain glued to Wednesday's US consumer inflation figures for October, which will influence Fed rate hike expectations and provide a fresh directional impetus.
In the meantime, traders on Tuesday will take cues from the release of the US Producer Price Index (PPI) and Fed Chair Jerome Powell's remarks at an online conference later during the early North American session. Apart from this, the US bond yields and the broader market risk sentiment should influence the USD price dynamics and produce some meaningful trading opportunities in the FX markets.
Technical levels to watch
The euro had difficulty finding takers in the last month, essentially lingering around the 1.16 level. The central bank remains dovish while inflation is surging. Energy prices have tapered slightly but are persisting as a challenge. Supply chain issues and the potential for a COVID-19 wave are keeping economists at the National Bank of Canada cautious for the single currency area.
Epidemiological situation, elevated energy prices and supply shortages to weigh on growth
“We remain timid on the eurozone and its currency.”
“The growth outlook is under pressure from several factors such as supply chain issues, rising COVID-19 cases, and energy prices/inflation.”
“The central bank remains on the sidelines and will likely move at a slower pace than its international peers.”
The AUD/USD pair was last seen hovering around the 0.7420 region. Economists at Westpac notes that a break above 0.7435/50 would question their bearish outlook, however, the aussie should drop towards the 0.7350/00 area.
Recent commodity weakness is negative for the AUD
“Positive risk sentiment has lifted the AUD/USD towards key moving averages at 0.7435/50 and a break of those levels would tend to question our near-term bearish outlook.”
“While commodities have bounced a little too, we still see the recent weakness (aluminium down 20% from the highs 3 weeks ago and the 62% Mysteel index down 12.7% last week as port stockpiles surged, imports fell, and steel prices slumped) as a negative.”
“Yield support should continue to wane too suggesting we could still see a dip towards the 0.7300/50 region.”
GBP/USD staged a decisive recovery at the start of the week. Karen Jones, Team Head FICC Technical Analysis Research at Commerzbamk, allows for the bounce to extend towards the 1.3610/65 region.
Corrective rebound being seen
“GBP/USD has bounced just ahead of the 1.3411 recent low. This is viewed as corrective, however, currently, we will have to allow for a rebound into the 1.3610/65 band (Elliott wave count).”
“They will find initial resistance at the 55-day ma at 1.3697.”
“Below 1.3411 we have little until the 200-week ma at 1.3165.”
The kiwi gained as the US dollar lost ground, even as Fed speakers echoed a more upbeat tone and US bond yields rose. Economists at ANZ expect the NZD to enjoy the tailwind of rate hikes expected from the Reserve Bank of New Zeland (RBNZ).
Treasury yields rose across the curve following hawkish commentary from a range of Fed speakers
“The softer USD saw the Kiwi strengthen overnight, leaving it hovering just below 0.7170. That was despite a generally more upbeat tone from Fed speakers, which would ordinarily be a positive for the US dollar. It also coincided with (an albeit small) rise in US bond yields, and continues what has been several days of haphazard and arguably illogical trading in markets in the wake of last week’s Fed statement.”
“Short end interest rate markets here remain buoyant, with 66bps of hikes priced in over the next two meetings. That’s helping the NZD. If the RBNZ is of a mind to hike by 50bps, now’s the time, but that still seems incongruous with the uncertain global backdrop and cautious tone of other central banks. Still, until we know the outcome, markets will price in the risk.”
“Support 0.6860/0.6900 – Resistance 0.7215/0.7310”
- USD/CAD extended its sideways consolidative price move for the third successive day.
- The ongoing USD retracement slide acted as a headwind and capped gains for the pair.
- The risk-off impulse helped limit USD losses and extended some support to the major.
The USD/CAD pair lacked any firm directional bias and seesawed between tepid gains/minor losses, around mid-1.2400s through the early European session.
A combination of diverging forces failed to provide any meaningful impetus to the USD/CAD pair and led to a subdued/range-bound price for the third successive day on Tuesday. The US dollar extended its retracement slide from the post-NFP swing highs and acted as a headwind for the major. The downside, however, remains cushioned amid a softer tone around crude oil prices, which tend to drive demand for the commodity-linked loonie.
The greenback was pressured by the Fed's dovish outlook and a fresh leg down in the US Treasury bond yields. It is worth recalling that the US central bank stuck to its transitory inflation narrative and indicated that policymakers were in no rush to hike interest rates. That said, speculations that the Fed would be forced to adopt a more aggressive policy response to contain stubbornly high inflation should help limit USD losses.
Apart from this, the risk-off impulse extended some support to the safe-haven greenback. This, in turn, held back traders from placing aggressive bearish bets around the USD/CAD pair, which so far has managed to defend 100-hour SMA support. This makes it prudent to wait for a strong follow-through selling before positioning for an extension of last week's rejection slide from the very important 200-day SMA resistance.
Market participants now look forward to the US economic docket, featuring the release of the Producer Price Index later during the early North American session. This, along with Fed Chair Jerome Powell's remarks at an online conference, the US bond yields and the broader market risk sentiment, will influence the USD. Traders will further take cues from oil price dynamics to grab some short-term opportunities around the USD/CAD pair.
Technical levels to watch
Real long-term interest rates are very low in OECD countries at present. In the opinion of economists at Natixis, there are two reasons why real long-term interest rates cannot rise.
The equilibrium between money supply and demand
The first deep reason is the need to balance money supply and demand, while the expansionary monetary policies conducted have led to a very sharp increase in the money supply, both central bank money and money for non-bank economic agents. To avoid a drastic financial crisis, demand for money must be equal to the money supply. For this to happen, holding money must not be penalised compared to holding bonds, so nominal long-term interest rates must remain very low.”
Financing the energy transition
“The energy transition requires a sharp increase in the investment rate (for renewable energy production, networks, thermal renovation of buildings, decarbonisation of CO2-emitting industries, etc.) that is estimated at between 2 and 3% of GDP for several decades. For these investments, which are mainly long-term investments with relatively low returns, to take place, real long-term interest rates will have to remain low, otherwise, these investments will not be undertaken or financed.”
USD/JPY fell below 113.00 and touched its lowest level in nearly a month. Karen Jones, Team Head FICC Technical Analysis Research at Commerzbank, expects the pair to continue its fall towards the 111.66 July high.
USD/JPY has topped near-term
“USD/JPY has broken below 113.26, and in going so has topped near-term. It is likely to see a deeper retracement to 112.56 then 111.90, the 38.2% and 50% retracements. The 111.66 July high is found in this vicinity and we will ideally see the market recover from here.”
“Rallies are likely to find the 20-day ma at 113.81 ahead of 114.55/69, the November 2017 high and recent high.”
“Loss of 110.80 is needed to destabilise the chart and allow for a deeper sell-off to key near term supports at 109.07/10 and 108.73 (July and August low).”
- Sustained USD selling bias assisted AUD/USD to reverse an early dip to sub-0.7400 levels.
- The risk-off impulse kept a lid on any meaningful upside for the perceived riskier aussie.
- Investors look forward to the US PPI and Fed Chair Powell’s comments for some impetus.
The AUD/USD pair reversed an intraday dip to sub-0.7400 levels and refreshed daily tops in the last hour, albeit lacked any follow-through. The pair was last seen hovering around the 0.7420 region, nearly unchanged for the day.
A generally weaker trading sentiment around the Asian equity markets exerted some pressure on the perceived riskier aussie during the early part of the trading action on Tuesday. That said, the ongoing US dollar retracement slide assisted the AUD/USD pair to rebound around 30-35 from the Asian session lows, near the 0.7390 region.
The greenback extended its retracement slide from the post-NFP swing highs and was pressured by the Fed's dovish outlook, indicating that policymakers were in no rush to hike borrowing costs. This, along with the risk-off impulse in the markets, triggered a fresh leg down in the US Treasury bond yields and further undermined the greenback.
That said, investors still seem convinced that the Fed would be forced to adopt a more aggressive policy response to contain stubbornly high inflation. The speculations were further fueled by the overnight hawkish comments by a slew of FOMC members, signalling that the central bank could raise rates by the end of 2022.
Hence, the market focus remains glued to Wednesday's release of the latest US consumer inflation figures. The data will influence Fed rate hike expectations and determine the near-term trajectory for the USD. This seemed to be the only factor that might hold back traders from placing aggressive bullish bets around the AUD/USD pair.
In the meantime, traders on Tuesday will take cues from the release of the US Producer Price Index (PPI) and Fed Chair Jerome Powell's remarks at an online conference later during the early North American session. Apart from this, the US bond yields and the broader market risk sentiment might provide some impetus to the AUD/USD pair.
Technical levels to watch
Here is what you need to know on Tuesday, November 9:
The greenback stayed under modest bearish pressure on Monday and weakened against its rivals with the risk-positive market environment making it difficult for the currency to find demand. The US Dollar Index continues to push lower early Tuesday and trades below 94.00 for the first time since the Fed's policy announcements last week. The ZEW sentiment survey for the euro area and Germany will be watched closely by market participants ahead of the Producer Price Index (PPI) data from the US. Meanwhile, several central bankers, including ECB President Lagarde, BoE President Bailey and Fed Chairman Powell, will be delivering speeches later in the day.
Macro events: On Monday, the data from the euro area showed that the Sentix Investor Confidence improved to 18.3 in November from 16.9 in October. The ZEW Survey Economic Sentiment Index is expected to edge lower both in the euro area and in Germany in November.
European Central Bank (ECB) chief economist Philip Lane reiterated on Monday that inflation dynamics in the medium term are still weak in the euro area. On the other hand, St. Louis Federal Reserve President James Bullard told Fox Business Network that he is expecting the Fed to hike its policy rate twice in 2022. Meanwhile, Bloomberg reported that US President Biden has interviewed Lael Brainard for the next Fed Chair. Commenting on that matter, "I expect a lot of continuity in Fed policy no matter how the Fed Chair appointment process works out," Bullard said.
Wall Street’s main indexes finished the first day of the week modestly higher and US stock index futures are down between 0.3% and 0.2% in the early European session on Tuesday. The benchmark 10-year US Treasury bond yield edged higher on Monday but lost its traction after failing to reclaim 1.5%.
EUR/USD closed in the positive territory on Monday and is closing in on the static resistance area that seems to have formed around 1.1620.
GBP/USD staged a decisive recovery at the start of the week and stays relatively quiet above 1.3550 area on Tuesday. Unresolved issues surrounding Brexit's Northern Ireland protocol could limit the pair's upside.
USD/JPY fell below 113.00 amid falling US Treasury bond yields and touched its lowest level in nearly a month. The cautious market mood seems to be helping the JPY outperform its rivals.
Gold built on the strong gains it posted in the second half of the previous week and reached its highest level since early September at $1,826. Currently, XAU/USD fluctuates in a tight range above $1,820, awaiting the next catalyst.
Cryptocurrencies: Bitcoin preserved its bullish momentum and hit another record high on Tuesday. Currently, BTC is trading within a touching distance of $70,000. Ethereum is approaching $5,000.
Gold finally settled near the top end of its daily trading range and touched a fresh two-month high around $1,825 during the Asian session on Tuesday. In the view of FXStreet’s Haresh Menghini, the yellow metal seems poised to challenge the $1,832-34 supply zone.
US dollar drops despite downbeat Treasury yields, Fed Chair Powell’s speech eyed
“The risk-off impulse in the equity markets extended some support to the safe-haven XAU/USD amid a fresh leg down in the US Treasury bond yields. This, along with sustained USD selling bias, support prospects for additional gains, though traders preferred to wait for a fresh catalyst from the latest US consumer inflation figures.”
“Later during the early North American session, traders will take cues from the US economic docket – featuring the release of the Producer Price Index (PPI). Apart from this, Fed Chair Jerome Powell's remarks at an online conference will be looked upon for some short-term trading opportunities around gold.”
“Some follow-through move towards testing a strong barrier, around the $1,832-34 heavy supply zone, remains a distinct possibility.”
“Any meaningful pullback now seems to find decent support near the $1,808-07 region. A subsequent slide might still be seen as a buying opportunity near the $1,800 round-figure mark. This should help limit the corrective fall near the $1,790-86 region.”
See – Gold Price Forecast: XAU/USD set to dare the multi-month downtrend from all-time highs – TDS
- EUR/USD extends a three-day uptrend from yearly troughs.
- The pair regains 21-DMA barrier on its road to recovery.
- Daily RSI stays bearish, a cause for concern for the EUR bulls.
EUR/USD is stretching its recovery momentum above 1.1600, as the bulls flex their muscles into the third consecutive day this Tuesday.
In doing so, the currency pair has recaptured the critical short-term 21-Daily Moving Average (DMA) at 1.1602, although it remains to be seen if the price manages to yield a daily closing above the latter.
The 14-day Relative Strength Index (RSI) is pointing north but still sits beneath the midline, keeping the EUR sellers hopeful.
In case bears regain control, then the major could retest the daily lows at 1.1577, below which a fresh downswing towards the 1.1550 barrier cannot be ruled out.
Further down, the falling trendline support at 1.1511 could come into play.
EUR/USD: Daily chart
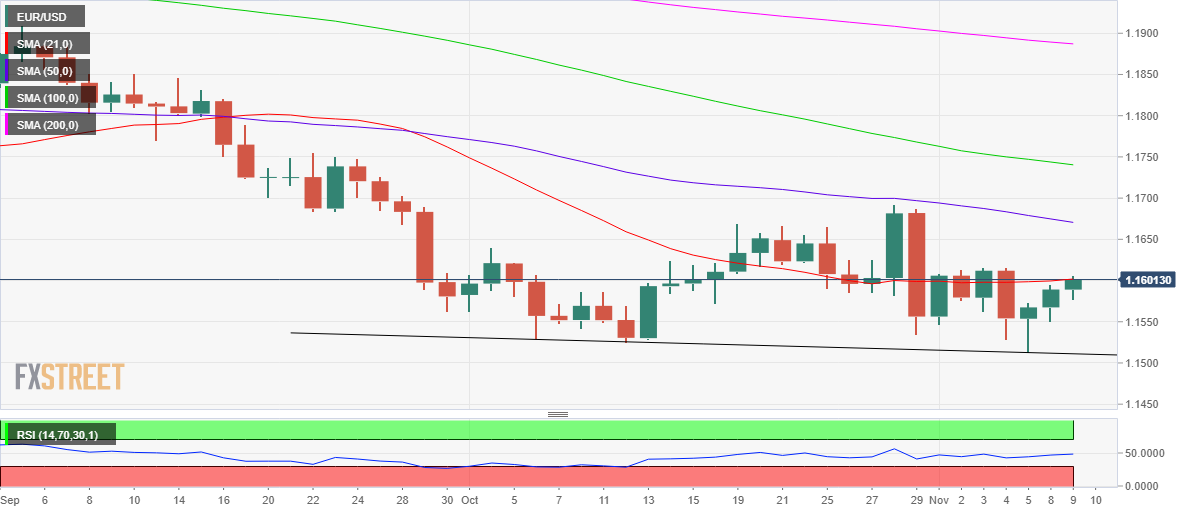
On the flip side, acceptance above the 21-DMA on a daily closing basis will likely extend the upside towards the bearish 50-DMA at 1.1670.
The 1.1700 psychological magnate will then test the bearish commitments.
EUR/USD: Additional levels to consider
- Gold consolidates three-day uptrend around two-month low, sidelined of late.
- Market sentiment dwindles amid indecision over Fed’s next moves despite reflation fears.
- US dollar drops despite downbeat Treasury yields, Fed Chair Powell’s speech eyed.
- Gold Price Forecast: Eyeing a test of September high at 1,833.95
Gold (XAU/USD) benefits from the downbeat US dollar to refresh a two-month high of around $1,825, picking up bids heading into Tuesday’s European session.
The indecision over the US Federal Reserve’s (Fed) next moves, amid reflation fears and Fed reshuffle talks, weighs on the risk appetite. However, Japan's stimulus news and hopes of an economic aid package from the US keep buyers hopeful.
“Japan's ruling Liberal Democratic Party (LDP) and coalition partner Komeito agreed to offer 50,000 yen ($441) worth of vouchers to children aged 18 or younger as part of the government's stimulus package, Jiji news agency reported on Tuesday,” per Reuters.
It’s worth noting that inflation fears remain on the table and keep the US dollar buyers hopeful following the strong US jobs report for October, published Friday. Even so, there’s a wide divide among policymakers relating to the rate hike and hence the greenback bears track the US Treasury yields amid market consolidation.
Against this backdrop, US stock futures whereas the US 10-year Treasury yields drop three basis points (bps) to 1.46%.
For further direction, speeches from the key central bankers from the US, Eurozone and the UK will be important.
Technical analysis
Gold seesaws around an upper end of the 13-day-old rising channel amid bullish MACD signals.
In addition to the stated channel’s resistance line, the 61.8% Fibonacci retracement (Fibo.) level of the February-June downtrend also highlights $1,830 as important resistance.
Also crucial for gold buyers is the double-top formation around $1,834-35, marked in July and September.
Given the bullish MACD signals and the downbeat US dollar, gold prices are likely to remain firmer. However, further upside hinges on a clear run-up past $1,835.
Alternatively, pullback moves may aim to retest the horizontal area comprising multiple levels marked since late August around $1,810-09.
Following that, the $1,800 threshold and lower line of the channel around $1,764 will be crucial to watch.
Gold: Daily chart
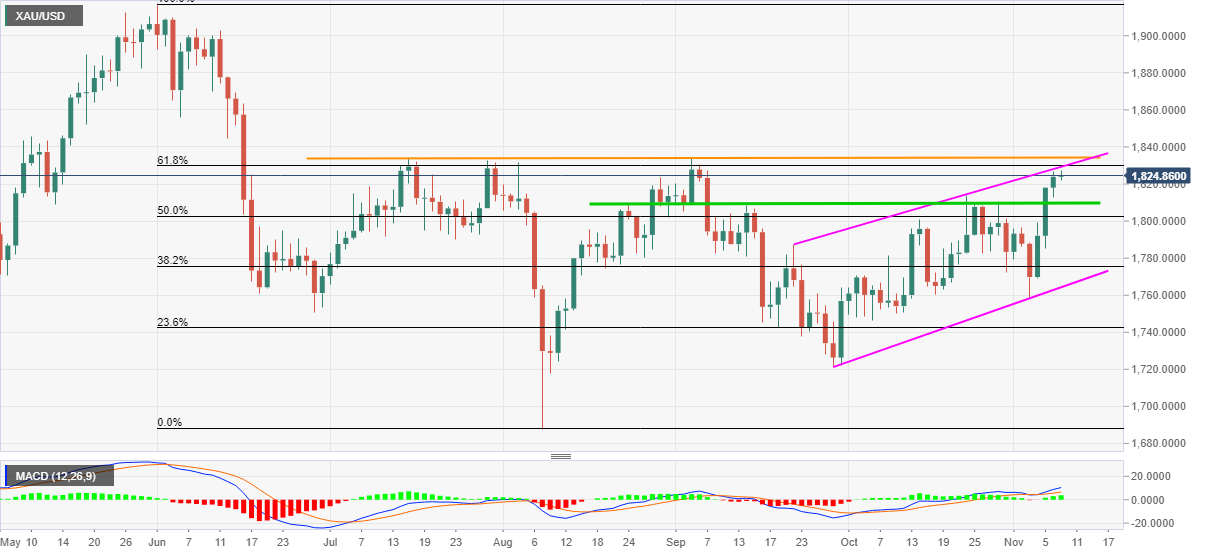
Trend: Pullback expected
- USD/JPY extends Monday’s sell-off below 113.00, monthly lows.
- The US dollar loses further ground in sync with Treasury yields.
- All eyes on Fed Chair Powell’s speech and US PPI figures for fresh impetus.
USD/JPY is pressuring monthly lows below the 113.00 levels, as bears remain in control amid the risk-off mood and renewed downswing in the US Treasury yields.
The rates on the market resume the recent downtrend following a temporary rebound on Monday, as the Fed’s patience on interest rates hike has led to the market’s repricing of the tightening expectations.
The benchmark 10-year US yields are down 1.30% on the day, currently trading at 1.478%. Meanwhile, resurfacing fears over the indebted Chinese property sector dent the appetite for riskier assets while boding well for the US Treasuries, in turn, knocking down the yields.
On the yen-side of the story, the news that the Japanese Prime Minister (PM) Fumio Kishida is looking to compile an economic stimulus package on November 19 helps the sentiment around the local currency,
Attention now turns towards the US Producer Price Index (PPI) data release and Fed Chair Jerome Powell’s speech for fresh trading opportunities.
At the time of writing, the pair is trading at 112.75, down 0.40% on the day.
USD/JPY technical levels to consider
Analysts at Citi Group believe that the US inflation is transitory and is likely to peak in February.
Key quotes
“The bank’s estimates show that the Federal Reserve reducing bond purchases, coupled with a gradual easing of supply-chain bottlenecks, likely means that core inflation for this cycle will peak in February.”
“Investors should consider reallocating into sectors like consumer and health-care stocks that carry a negative correlation to changes in consumer prices.”
“Supply-chain bottlenecks should ease in coming months.”
- Asian equities seesaw amid downbeat stock futures, US Treasury yields.
- Japan government agrees over $441 voucher to battle the pandemic-led economic woes.
- China’s NDRC held meeting with property developers and banks in Shenzhen amid debt woes.
- Tapering, rate hike concerns join Fed reshuffle chatters to weigh on the mood.
Asian shares struggle for a clear direction, mostly pressured ahead of Tuesday’s European session, despite Japan announcing a broad stimulus measure to combat the virus-led economic hardship. The reason could be linked to the Fed-linked fears over tapering and rate hikes, as well as the indecision over the US central bank’s future move as various key members are set to leave the Fed.
“Japan's ruling Liberal Democratic Party (LDP) and coalition partner Komeito agreed to offer 50,000 yen ($441) worth of vouchers to children aged 18 or younger as part of the government's stimulus package, Jiji news agency reported on Tuesday,” per Reuters. On the other hand, multiple Fed policymakers are likely to leave from their positions, including Fed Chair Jerome Powell and the same triggers chatters over future monetary policy tightening as inflation pressure mounts.
Elsewhere, China’s National Development and Reform Commission (NDRC) has held a meeting with property developers and banks in Shenzhen amid fears of mounting debt concerns, per Reuters, which in turn weighs on the sentiment. Also negative were clues hinting that China’s factory-gate inflation is likely running towards a 26-year high, per Bloomberg.
Amid these plays, MSCI’s index of Asia-Pacific shares outside Japan rises 0.29% whereas Japan’s Nikkei 225 drops 0.70% at the latest. Stocks in Australia, Hong Kong and China remain downbeat whereas equities in New Zealand and Indonesia print mild gains by the press time.
Moving on, India’s BSE Sensex tracks mildly offered US stock futures whereas the US 10-year Treasury yields drop three basis points (bps) to 1.46%.
Looking forward, speeches from the key central bankers from the US, Eurozone and the UK will be important for near-term direction.
Read: S&P 500 Futures snap five-day uptrend on mixed concerns, Fed’s Powell eyed
- GBP/USD rebounds firmly from two-month lows, recaptures 1.3550.
- Brexit woes amid looming Article 16 trigger pose risks to the cable’s recovery.
- Bearish daily RSI keeps the sellers hopeful, as 1.3570 offers stiff resistance.
GBP/USD is consolidating the recent recovery rally from two-month lows of 1.3424, as buyers continue to challenge sellers’ commitments amid persistent Brexit concerns.
A lack of progress on the Brexit front combined with the impending threat of the UK triggering Article 16 keeps the pound bulls at bay.
However, a broadly weaker US dollar, despite a cautious market mood, could likely offset the Brexit risks, boding well for the cable. The focus now shifts towards the speeches from Fed Chair Jerome Powell and BOE Governor Andrew Bailey for fresh hints on the monetary policy.
Looking at GBP/USD’s daily chart, the bears are fighting for control, as bulls appear to find stiff resistance at the horizontal trendline hurdle around the 1.3568-1.3570 region.
If the buyers manage to gain the upper hand, then the spot could head higher to test November 2 lows of 1.3605.
Further up, the 1.3650 psychological level will be next on the bulls’ minds.
GBP/USD: Daily chart
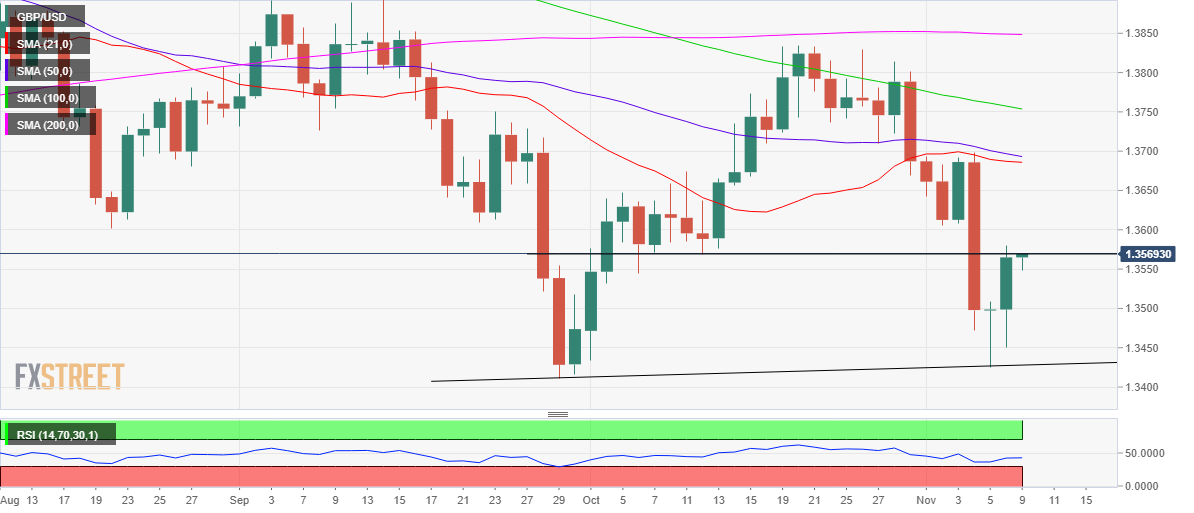
The 14-day Relative Strength Index (RSI), however, continues to trade below the midline, questioning the recovery momentum in the cable.
Selling resurgence could call for a test of the 1.3500 level, below which Monday’s low of 1.3450 could be challenged.
The last line of defense for GBP bulls is 1.3428, which appears at the rising trendline support.
GBP/USD: Additional levels to consider
- XPD/USD reverses from two-week high, grinds lower around intraday low.
- Sustained break of two-month-old trend line, 21-day EMA favor bulls.
- 50-day EMA challenges short-term advances, one-month-old rising trend line adds to the downside filters.
Palladium (XPD/USD) retreats from a fortnight high, down 0.51% intraday around $2,035 heading into Tuesday’s European session.
In doing so, the bullion fails to justify the previous day’s upbeat break of a two-month-old resistance line, now support around $2,015.
Even so, a steady Momentum line and 21-day EMA challenges the XPD/USD bears’ return of around $2,015 support convergence.
Also acting as the downside filter is the $2,000 threshold and an ascending support line from October 06, close to $1,995.
On the contrary, the 50-day EMA level around $2,067-68 precedes the last month’s peak of $2,178 to challenge short-term Palladium buyers.
In a case where the commodity bulls keep reins past $2,178, late August month’s swing low near $2,265 will be in focus.
Palladium: Daily chart
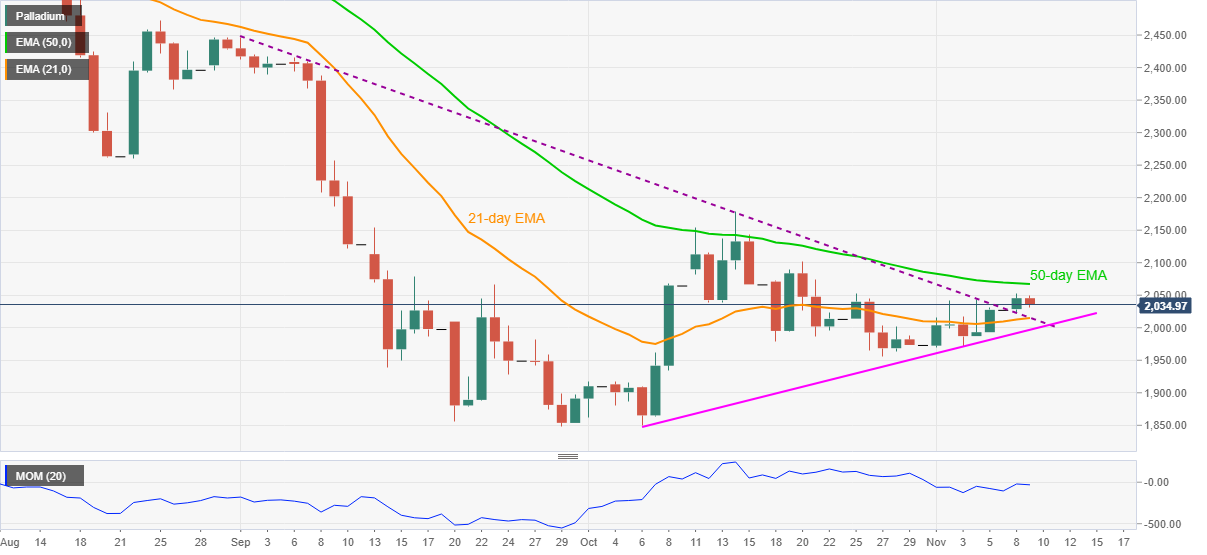
Trend: Further upside expected
- EUR/USD prints three-day rebound from yearly low, refreshes daily high.
- US Dollar tracks downbeat Treasury yields, ignores mildly offered stock futures.
- Fed tapering tantrums in focus, ECB may have less audience despite reflation fears.
- US PPI, ZEW sentiment figures are also important for fresh impulse.
EUR/USD takes the bids near 1.1600 to portray a three-day advance from the year’s low ahead of Tuesday’s European session.
The major currency pair takes clues from the downbeat US Treasury yields and cautious optimism in the market to consolidate the recent losses. However, speeches from the Chiefs of the European Central Bank (ECB) and the US Federal Reserve (Fed) will be important to forecast near-term moves.
Indecision over tapering and rate-hike concerns join the anxiety over the Fed reshuffle to portray the latest sluggish mood in the market. Also acting as an important factor is the recently announced stimulus from Japan. “Japan's ruling Liberal Democratic Party (LDP) and coalition partner Komeito agreed to offer 50,000 yen ($441) worth of vouchers to children aged 18 or younger as part of the government's stimulus package, Jiji news agency reported on Tuesday,” per Reuters.
It’s worth noting that inflation fears remain on the table and keep the US dollar buyers hopeful following the strong US jobs report for October, published Friday. The same could be sensed in the latest Fedspeak and comments from the ECB policymakers. However, there is a wide divide among the policymakers on how long the reflation fears can last and the need to address them with the rate hikes, which in turn troubles the EUR/USD traders of late despite the recent run-up.
Against this backdrop, stock futures in the US and Eurozone print mild losses while the US 10-year Treasury yields drop three basis points (bps) to 1.467% at the latest.
In addition to the monetary policy signals from Fed’s Powell and ECB’s Lagarde, ZEW sentiment numbers for Eurozone and Germany for November will precede the US Producer Price Index (PPI) for October to entertain the EUR/USD traders. Should the scheduled data keep pointing at the heating price pressure in Eurozone, the odds of the EUR/USD pair’s further upside can’t be ruled out.
Technical analysis
EUR/USD keeps the previous day’s upbeat break of a downward sloping trend line from October 28 amid price-positive signals from the RSI and Momentum indicators. It should be noted, however, that the pair buyers remain worried below the descending resistance line from early September, near 1.1650.
- NZD/USD bounces off intraday low, snaps two-day rebound from monthly low.
- Multiple technical support indicators test bearish candlestick formation.
- Steady RSI, sustained trading beyond 200-SMA keeps buyers hopeful.
NZD/USD consolidates intraday losses around 0.7150, down 0.20% on a day heading into Tuesday’s European session.
In doing so, the Kiwi pair justifies the previous day’s Doji candlestick formation while battling a convergence of the weekly support line, previous resistance line from October 28 and 23.6% Fibonacci retracement (Fibo.) of October 13-21 upside.
Given the steady RSI and the bearish candle on the four-hour (4H) chart, the NZD/USD prices may witness further downside, below the immediate support near 0.7150-45.
During the fall, the latest swing low and 50% Fibo., respectively near 0.7070 and 0.7065, may offer intermediate halts before directing the quote towards the 200-SMA level of 0.7055.
Meanwhile, recovery moves remain less important until staying below the monthly peak of 0.7199.
Following that, the double tops marked during late October around 0.7220 become the key for the NZD/USD bulls.
NZD/USD: Four-hour chart

Trend: Further weakness expected
- GBP/JPY reverses the previous day’s rebound from one-month low.
- Fears of Article 16 activation looms amid ‘limited’ progress on Brexit talks.
- Japan may need fresh debt issue to back the stimulus need.
- Fed tapering tantrums, BOE-led disappointment looms ahead of BOE’s Governor Baily, Fed’s Chair Powell’s speech.
GBP/JPY stands on slippery ground near 153.00, down 0.40% intraday heading into Tuesday’s London open.
The cross-currency pair bounced off 100-DMA to snap a two-day downtrend the previous day amid consolidation in the US Treasury yields. Though, the return of the risk-off mood, as well as negative headlines concerning Brexit, weighs on the quote of late.
Among them, fears concerning the US Federal Reserve’s (Fed) tapering and anxiety over the Fed reshuffle seem to exert a great deal of pressure on the market sentiment recently. Also weighing on the mood, and the pair, is the uncertainty over US stimulus and fears of the UK’s threats to trigger Article 16.
UK Brexit Minister David Frost cited limited progress on the key talks during Friday and the Irish leaders have been talking about the Article 16 activation since then. “There is growing speculation the PM could soon trigger Article 16 as ongoing talks between the EU and UK continue to fail to resolve problems such as the ‘sausage war’. But Boris Johnson is being given fresh warnings about the impact of such action,” said Sky News.
On a different page, the Bank of England (BOE) disappointed markets by delaying the rate hike towards the 2021-end. The same highlights today’s speech from BOE Governor Andrew Bailey as the key catalyst.
Alternatively, chatters that Japan’s stimulus need call for more issue of debt and the first negative prints of the real wages in three months seem to weigh on the quote. “Japan's real wages declined in September for the first time in three months as inflation picked up faster than growth in nominal pay, the government said, a sign of global cost-push inflation starting to affect Japanese households,” said Reuters. On the other hand, Kyodo News mentioned, “Japan is considering an economic stimulus package worth more than 30 trillion yen ($265 billion) aimed at easing the pain from the COVID-19 pandemic, a plan that would require issuing new debt.”
Amid these plays, US 10-year Treasury yields drop 3.7 basis points (bps) to 1.46% whereas the US stock futures and FTSE Futures print mild gains at the latest.
Moving on, updates concerning Brexit and Fed tapering will act as additional catalysts to determine short-term GBP/JPY moves, other than the speech from BOE’s Bailey.
Technical analysis
100-DMA restricts short-term downside around 152.65 ahead of 200-DMA level surrounding 152.00. However, bulls are likely to remain cautious before witnessing a clear break of the 155.75 resistance confluence, including 21-DMA and a 13-day-old descending trend line.
- AUD/USD refreshes intraday low, reverses the previous day’s up-moves.
- Late October low, September’s peak guard immediate upside.
- Friday’s Doji keeps buyers hopeful despite bearish MACD signals.
AUD/USD takes offers to renew intraday low near 0.7390, consolidating the week-start gains during early Tuesday.
Although bearish MACD signals hint at the Aussie pair’s further weakness, the 100-DMA and Friday’s Doji challenges the bears.
If the quote breaks the stated DMA support and Friday’s low, respectively near 0.7375 and 0.7360, the bullish candlestick formation gets negated. The same will direct AUD/USD bears towards three-month-old horizontal support near 0.7315-10.
However, any extra downside will be challenged by an ascending support line from August 20, around 0.7235 by the press time.
Meanwhile, recovery moves need validation from October 22 low and September’s peak, near 0.7450 and 0.7480 in that order, to recall the AUD/USD buyers.
Following that, 200-DMA and the monthly peak can challenge the pair bulls around 0.7550-60.
AUD/USD: Daily chart
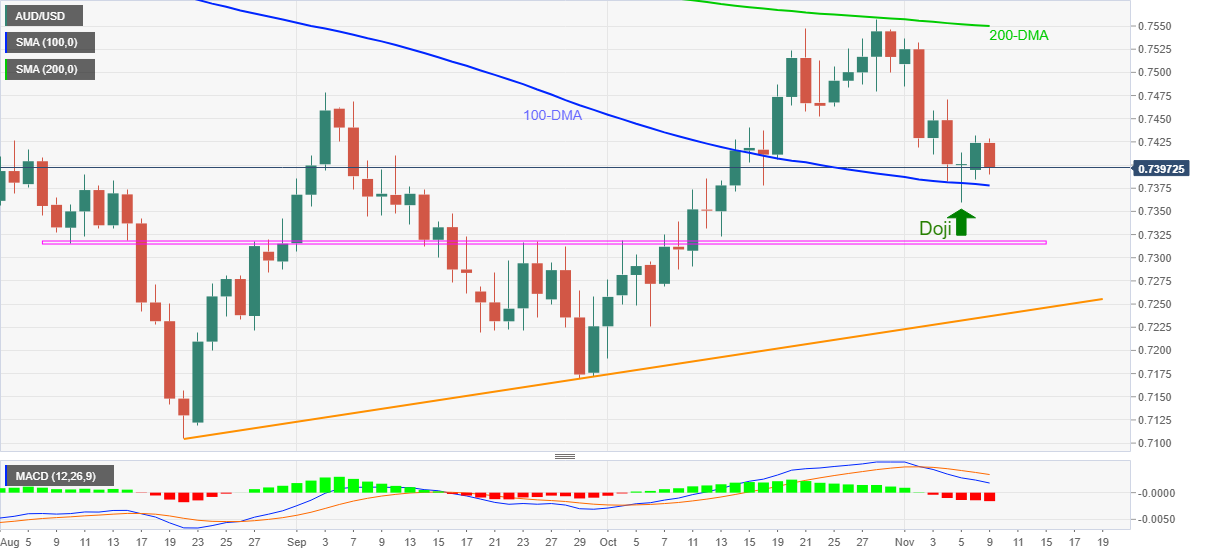
Trend: Further weakness expected
Indonesia's Retail Sales declined 2.2% on the year in September vs. a 2.1% drop seen in August, the latest survey conducted by Bank Indonesia (BI), the country’s central bank, showed on Tuesday.
FX implications
USD/IDR keeps its range near six-day lows of 14,220 on weak Indonesian data.
At the press time, USD/IDR trades at 14,232.50, down 0.16% on a daily basis, extending its losing momentum into the third straight day. The spot tracks the sell-off in the US dollar across the board.
In the view of the analysts at Scotiabank, EUR/USD could plunge to 1.1100 should the 1.1400 demand area give way.
Key quotes
“Steep swings over the past two weeks have left it a clear risk of a test & cross of 1.15 amid continued downward pressure since late-May.”
“A cross under the figure sees limited support until 1.1422 and the 1.14 area and then losses could quickly extend into the 1.11s.”
“1.16 zone is resistance, followed by the mid-figure area that stands as downtrend resistance.”
| Raw materials | Closed | Change, % |
|---|---|---|
| Brent | 83.93 | 0.2 |
| Silver | 24.436 | 1.3 |
| Gold | 1823.847 | 0.46 |
| Palladium | 2069.35 | 2.18 |
Japan’s Prime Minister Fumio Kishida said on Tuesday, he wants to compile an economic stimulus package on November 19.
Kishida added that he wants to compile an extra budget to fund the spending by the end of this month.
This comes as Kishida's ruling Liberal Democratic Party is in negotiation with its coalition partner Komeito the details of the package.
Market reaction
USD/JPY is little affected by these comments, testing bids at 113.00 amid falling yields and the US dollar. The spot is down 0.15% on the day.
- USD/TRY seesaws inside three-week-old symmetrical triangle, probes two-day downtrend.
- Steady RSI, sustained trading above 50-SMA keeps buyers hopeful.
USD/TRY prints mild gains around $9.6955 during early Tuesday, mostly steady after declining in the last two days.
Even so, the Turkish Lira (TRY) pair remains inside a short-term symmetrical triangle formation amid a steady RSI line, which in turn suggests further grinding of the prices.
It should be noted, though, that the pair’s successful trading beyond 50-SMA favor buyers to overcome the immediate hurdle, namely the resistance line of the triangle’s resistance near $9.7400.
Following that, the monthly high near $9.7850 will be in focus before fueling the quote towards the record top of $9.8505 flashed in October.
Alternatively, 50-SMA and the stated triangle’s support, respectively around $9.6280 and $9.6160, restrict short-term pullback of the USD/TRY prices.
Should the quote drop past $9.6160, the monthly low of $9.4670 and $9.4100 should lure the bulls.
To sum up, USD/TRY grinds higher around the record top, seeking a trigger for the fresh run-up.
USD/TRY: Four-hour chart
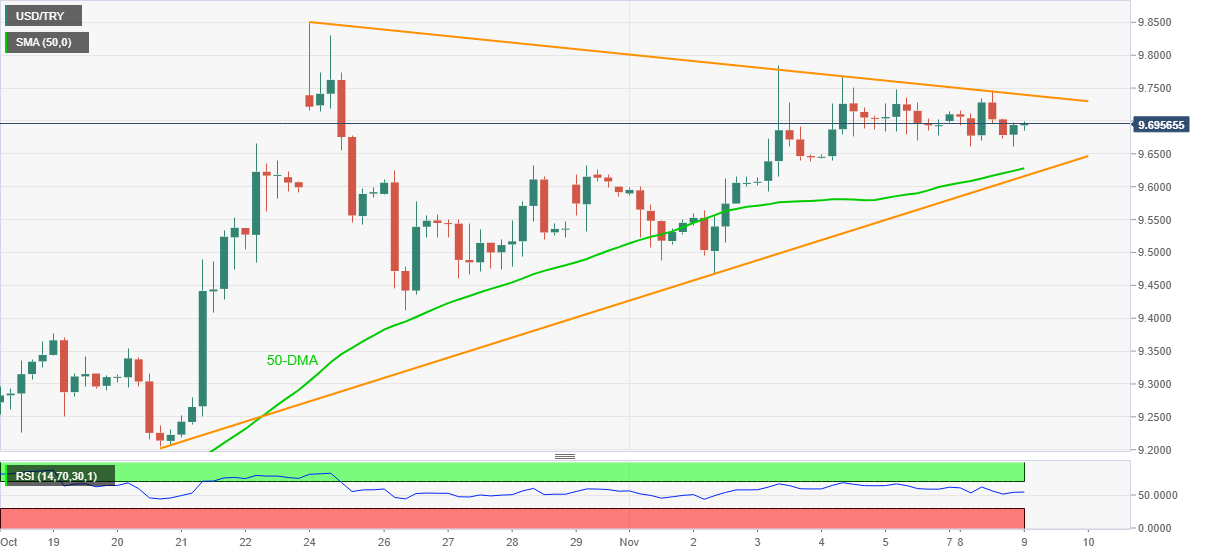
Trend: Further upside expected
China’s National Development and Reform Commission (NDRC), the country’s state planner, held meetings with banks and property developers in Shenzen on Monday, Reuters reports, citing an unnamed source.
China Vanke, Kaisa Group, Ping An Bank, China Citic Bank, China Construction Bank and CR Trust met with the NDRC on Monday.
In other news, Reuters reported that the Chinese property developer Kaisa said it needed external help to pay investors, workers and suppliers.
Meanwhile, Bloomberg is reporting that Goldman Sachs Asset Management “has been adding a “modest amount of risk” through high-yield bonds issued by China property developers and denominated in US dollars.”
Market reaction
It’s worth noting that China's investment-grade dollar notes weakened further on Monday as investors eyed possible contagion from the property industry.
The futures tied to the S&P 500 index drop 0.21% on the day while AUD/USD is down 0.18% on a daily basis, currently trading at 0.7407.
- USD/INR bears are taking control and are moving into daily support.
- USD/INR could be in for a bullish correction to test the 61.8% Fibo.
The price of USD/INR has been in the hands of the bears and broke a key level of support this week. The following illustrates the next level of support for which the pair is targeting and the prospects for a potential move back to restest the old support.
USD/INR daily chart
-637720190898754269.png)
As illustrated, the price is testing the 73.80s following a strong move to the downside at the end of last week following the Nonfarm Payrolls. Despite a solid outcome for the US jobs sector, investors instead have taken the view that the central banks are far from hiking rates. This leaves a bearish technical outlook for USD crosses as US yields fall in unison with the less hawkish sentiment in the money markets, exposing USD/INR's downside.
With that being said, the price could still find this area on the chats a tough nut to crack considering how much structure there is between here and the mid lows near 73.40. Nevertheless, on a restest of the 74.30s, near the 61.8% ratio, the bears could be inclined to move in at a discount with an aim to fully break the aforementioned support in the coming week.
The options market turns most bullish on the USD/CHF in over a week, per the latest data from Reuters.
One-month risk reversal (RR) of USD/CHF, a gauge of calls to puts, snaps a three-day downtrend to rise the most since November 01, per Reuters. That said, the latest USD/CHF RR is +0.150 versus the -0.050 figure marked on Friday.
Although the RR suggests the market’s bullish bias, the USD/CHF prices remain sluggish, around 0.9130 at the latest.
This could be linked to the market’s anxiety over the Fed reshuffle, US stimulus and tapering tantrums.
Read: S&P 500 Futures snap five-day uptrend on mixed concerns, Fed’s Powell eyed
However, today’s speech from Fed Chairman Jerome Powell can provide short-term clarity over the market moves. In his latest speech, the Fed Boss dumped ‘transitory’ concern over inflation and renewed market fears.
- Silver refreshes intraday low, snaps three-day uptrend around two-week high.
- Firmer Momentum line, sustained break of 100-day EMA favor buyers.
- Sellers have multiple barriers before retaking controls, two-month-old horizontal hurdle becomes the key resistance.
Silver (XAG/USD) takes offers to refresh the daily low around $24.40, down for the first time in the last five days during early Tuesday. In doing so, the bright metal portrays a pullback from the 200-day EMA, the fourth one since June.
However, a firmer Momentum line and successful trading beyond the 100-day EMA level keep buyers hopeful of overcoming the $24.50 immediate hurdle.
Even so, 61.8% Fibonacci retracement (Fibo.) level of July-September declines and a horizontal area comprising tops marked in the last two months, respectively around $24.75 and $24.85-90, become crucial resistance to challenge silver’s further upside.
In a case where the XAG/USD bulls cross $24.90 resistance, the $25.00 and August month’s peak of $26.00 will be in focus.
On the flip side, a daily closing below the 100-day EMA level of $24.17 may aim for the $24.00 round figure and $23.60 supports before the monthly low challenge further downside near $23.00.
Additionally, 23.6% Fibo. level surrounding $22.70, followed by the $22.00 threshold, acts as extra filters to the south.
Silver: Daily chart
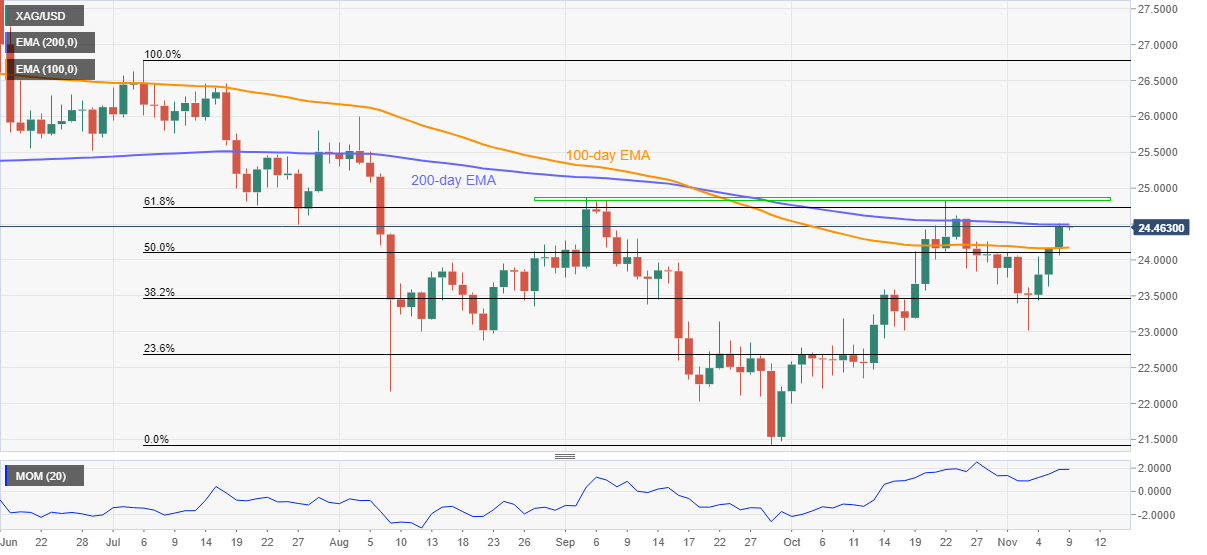
Trend: Further upside expected
In recent trade today, the People’s Bank of China (PBOC) set the yuan (CNY) at 6.3903 vs the previous fix of 6.3959 and the prior close of 6.3930
About the fix
China maintains strict control of the yuan’s rate on the mainland.
The onshore yuan (CNY) differs from the offshore one (CNH) in trading restrictions, this last one is not as tightly controlled.
Each morning, the People’s Bank of China (PBOC) sets a so-called daily midpoint fix, based on the yuan’s previous day closing level and quotations taken from the inter-bank dealer.
- AUD/JPY is making a move to the downside in a break of sideways consolidation.
- AUD/JPY bears have their eyes set on a sustained follow-through below 84 the figure.
In recent trade, AUD/JPY has taken a turn for the worse and is trading down over 0.3% at the time of writing. The bears are firming their grip below 84 the figure and have eyes on 83.50 support territory for the forthcoming sessions. The following illustrates the bearish bias from a daily and hourly perspective.
AUD/JPY daily chart
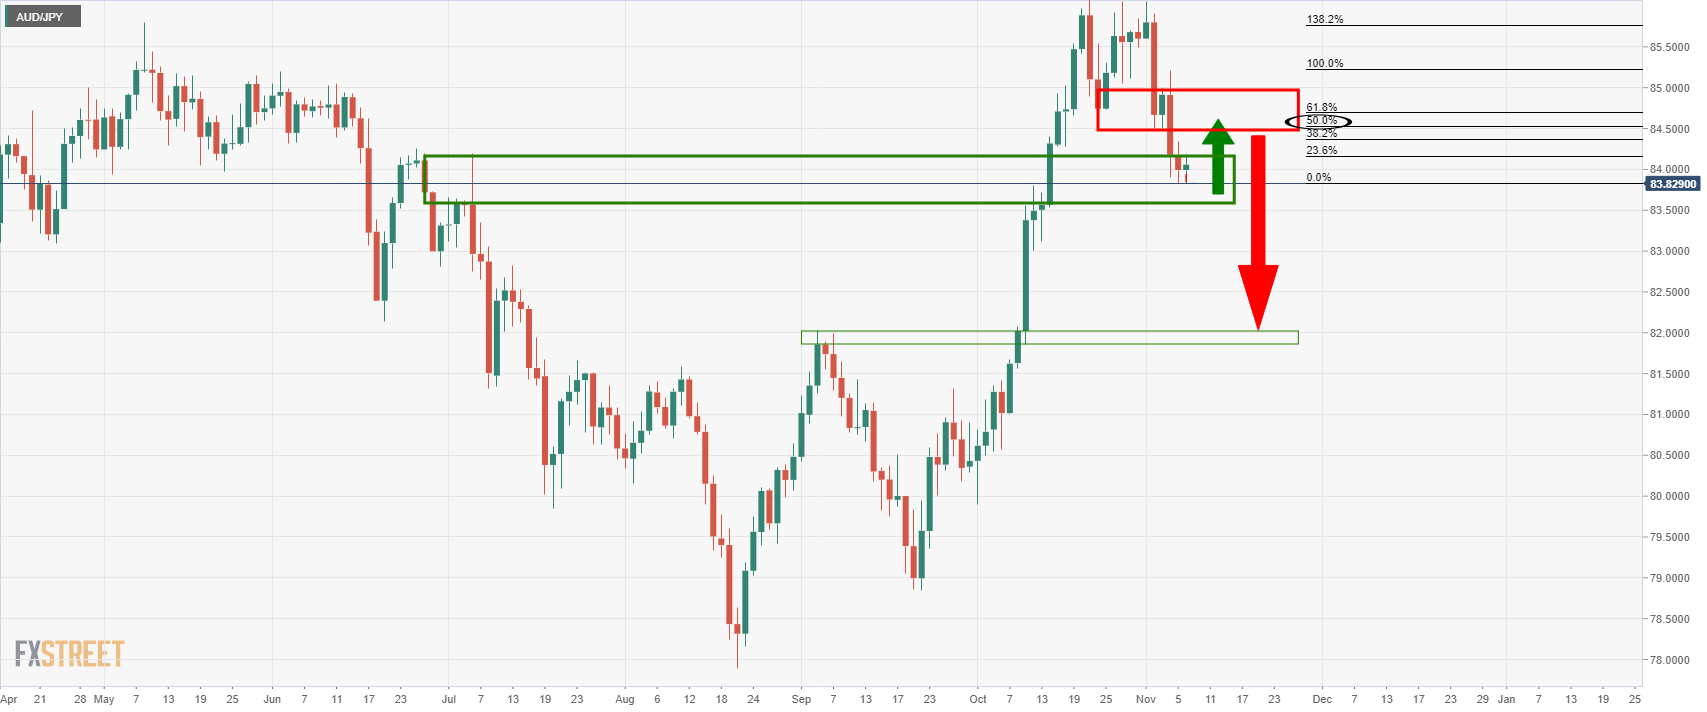
While the bias is to the downside following a failed attempt to 85.00 in recent days, there are still prospects of a restest of the old support near 84.50 prior to a downside continuation. This falls in line with the 50% mean reversion level of the current bearish impulse.
AUD/JPY hourly chart
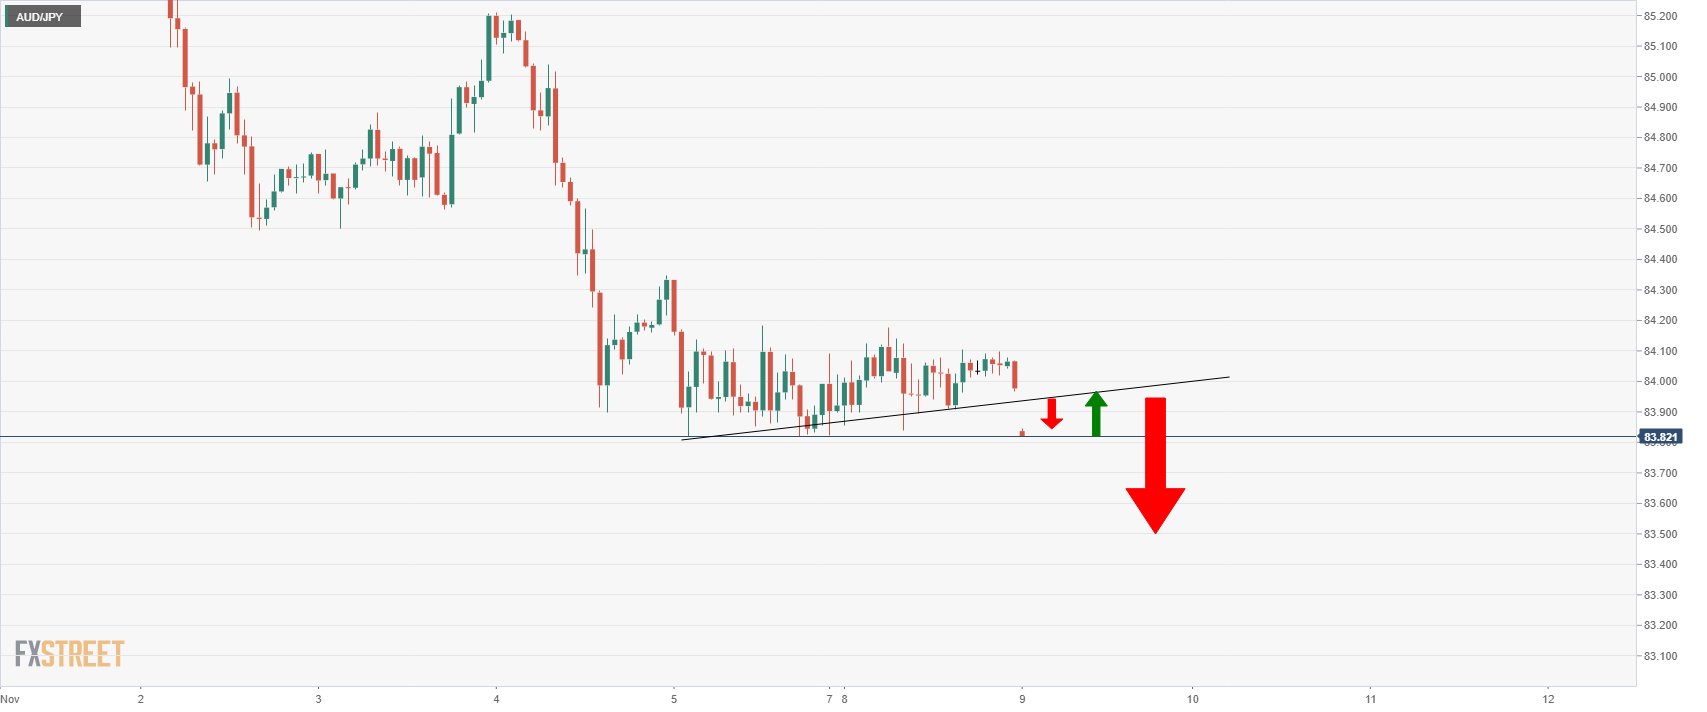
With that being said, the hourly chart has seen a breakout of consolidation and the bias is therefore to the downside while below 83.80.
- S&P 500 Futures refresh intraday low, stays near record top.
- US Treasury yields remain sluggish amid Fed tapering tantrums, rate hike woes.
- Fed reshuffle, China-linked headlines add to the sour sentiment amid light calendar.
S&P 500 Futures take offers around 4,680 to portray mild risk-off mood during early Tuesday. Even so, the risk barometer remains near the all-time high reported last week.
The US Federal Reserve (Fed) officials reiterate their bullish bias during the latest Fedspeak, underpinning the rate hike concerns and challenging the equity bulls. However, a few of the Fed board members are likely to leave the US central bank the next year and the list may include Chairman Jerome Powell if he isn’t re-elected.
Fed policymakers ranging from Vice-Chairman Vice-Chair Richard Clarida to Charles L. Evans, the Chief Executive Officer of the Federal Reserve Bank of Chicago, recently tried to convince the markets that the inflation fears are transitory. However, Fed’s Powell removed that mention during his last week’s speech and Fed’s Evans also highlighted the recent jump in the US inflation expectations to unveil hopes for a rate hike in 2022.
That said, US inflation expectations, as measured by the 10-year breakeven inflation rate per the St. Louis Federal Reserve (FRED) data, jump to the fresh high since October 27 by the end of Monday’s North American trading. In doing so, the gauge extends the previous week’s rebound from the lowest levels since October 12 to flash 2.62%, per the official website data.
It should be noted that the chatters that China’s National Development and Reform Commission (NDRC) has held a meeting with property developers and banks in Shenzhen, per Reuters, also weigh on the sentiment. Furthermore, the market’s wait for US President Joe Biden’s $1.75 trillion stimulus also challenges the optimists amid a sluggish start to the week.
Moving on, Fedspeak and US stimulus headlines can keep directing short-term moves while today’s speech from Fed Chairman Powell will be the key for fresh impulse. Should the Fed Boss refrain from terming inflation as ‘transitory’, as he did the last time, risk appetite may witness further weakness.
Read: S&P 500 secures eighth straight record close, Tesla slumps ahead of expected Musk share dump
- DXY grinds lower around one-week low after two-day fall.
- Bearish MACD signals, trend line breakdown keep sellers hopeful.
- Monthly bottom adds to the downside filters, bulls need validation from 94.40.
US Dollar Index (DXY) bears take a breather around 94.00 following the last two days’ downtrend. In doing so, the greenback gauge keeps the previous day’s downside break of a short-term support line but struggles to break the 200-HMA support.
Given the bearish MACD signals supporting the trend line breakdown, the quote is likely to break the immediate HMA support near 94.00.
However, the monthly low of around 93.80 will validate the DXY bear’s dominance, which in turn will direct the quote towards the late September’s low near 92.30.
Meanwhile, the support-turned-resistance near 94.25 guards short-term recovery moves of the US Dollar Index ahead of a short-term horizontal area near 94.40.
In a case where the DXY bulls cross the 94.40 hurdle, the yearly high near 94.65 and the September 2020 peak close to 94.75 will be in focus.
Overall, the US Dollar Index (DXY) is likely to witness further weakness but bears need to remain cautious before witnessing the fresh low of the month.
DXY: Hourly chart
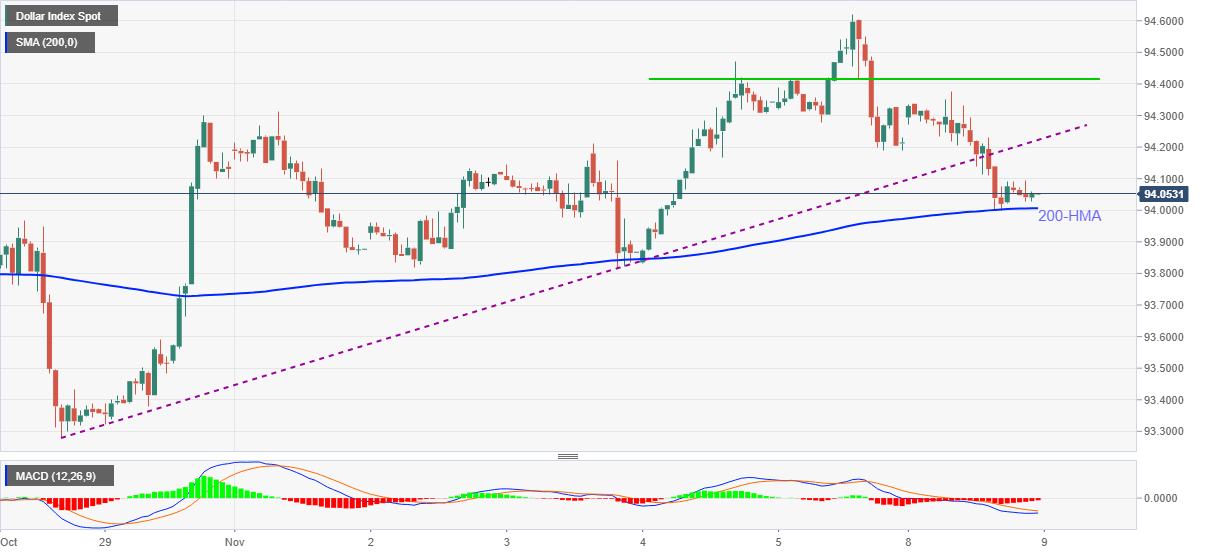
Trend: Further weakness expected
- AUD/USD bears are trying to take control to test 0.7400 commitments.
- Key data this week will be critical for AUD/USD traders.
AUD/USD is flat on the day as pressures mount below the overnight highs near 0.7430. The price has fallen some 0.22% in Asia on Tuesday as the higher yielders give way to less hawkish central bank sentiment. At the time of writing, AUD/USD is trading at 0.7410 and has fallen from a high of 0.7423 to a low of 0.7404.
''Australian bonds took trend from global price action as domestic markets continue to adjust to a dovish RBA after the SoMP showed that the RBA still believes there’s a long way to go before rate hike conditions are met,'' analysts at Westpac explained. ''3yr government bond yields (futures) rose from 1.05% to 1.07%, and 10yr government bond yields (futures) rose from 1.77% to 1.81%.''
Fed officials in focus
Meanwhile, staying with the theme of rates and central banks, markets were taking in comments from Federal Reserve officials overnight. Fed speakers included Vice-Chair Richard Clarida, who saw rate-hike conditions being met by the end of 2022. In other speakers, St. Louis’s Bullard acknowledged his own dot plot was for two hikes in 2022. Philadelphia’s Harker was prepared to take action if necessary while Chicago’s Evans said he expects no rate hike before 2023.
Meanwhile, Australia’s data calendar was empty to start the week, but traders will be looking ahead to two key data events, one of which is the Australian jobs data on Thursday and the other, before that, is the US Consumer Price Index.
- USD/JPY struggles for a clear direction around monthly low.
- US Treasury yields consolidate recent gains, S&P 500 Futures print mild losses.
- Japan’s stimulus need pushes for new debt issuance, real wages snap two-month rebound.
- Fed’s Powell, risk catalysts remain on the driving seat, tapering tantrums eyed as well.
USD/JPY refreshes intraday low to 113.20, down 0.03% on a day following a three-day downtrend as Tokyo opens for Tuesday’s trading. The risk barometer pair portrays a cautious mood in the market amid a sluggish morning in Asia with fewer catalysts.
Even so, chatters that Japan’s likely stimulus needs more issuance of debt and the first negative prints of the real wages in three months to seem to weigh on the quote. “Japan's real wages declined in September for the first time in three months as inflation picked up faster than growth in nominal pay, the government said, a sign of global cost-push inflation starting to affect Japanese households,” said Reuters. On the other hand, Kyodo News mentioned, “Japan is considering an economic stimulus package worth more than 30 trillion yen ($265 billion) aimed at easing the pain from the COVID-19 pandemic, a plan that would require issuing new debt.”
It’s worth noting that Fed tapering tantrums escalate following Friday’s upbeat US jobs report and weigh on the market sentiment, also the USD/JPY prices of late. Additionally challenging the risk appetite is the anxiety over the Fed reshuffle and firmer US inflation expectations.
Further, Japan’s Current Account balance shrank below ¥1060B forecast to ¥1033.7B in September and weighed on the USD/JPY prices as well.
That said, S&P 500 Futures drop 0.15% by the press time despite Wall Street’s mildly positive closing. Further, the US 10-year Treasury yields fade the previous day’s rebound while declining back to 1.49% at the latest.
Looking forward, USD/JPY traders will pay close attention to the Fed tapering tantrums and US stimulus headlines for intermediate clues ahead of Fed Chair Jerome Powell’s speech. Should the Fed Boss repeat his cautiously hawkish speech, the USD/JPY may drop further.
Technical analysis
The previous resistance line from early August challenges the latest pullback moves around 113.00. On the contrary, recovery moves remain doubtful until staying below 114.00.
| Time | Country | Event | Period | Previous value | Forecast |
|---|---|---|---|---|---|
| 00:30 (GMT) | Australia | National Australia Bank's Business Confidence | October | 13 | |
| 05:00 (GMT) | Japan | Eco Watchers Survey: Current | October | 42.1 | |
| 05:00 (GMT) | Japan | Eco Watchers Survey: Outlook | October | 56.6 | |
| 07:00 (GMT) | Germany | Current Account | September | 11.8 | |
| 07:00 (GMT) | Germany | Trade Balance (non s.a.), bln | September | 10.7 | |
| 07:45 (GMT) | France | Trade Balance, bln | September | -6.67 | |
| 10:00 (GMT) | Eurozone | ZEW Economic Sentiment | November | 21 | |
| 10:00 (GMT) | Germany | ZEW Survey - Economic Sentiment | November | 22.3 | 20 |
| 12:50 (GMT) | U.S. | FOMC Member James Bullard Speaks | |||
| 13:00 (GMT) | Eurozone | ECB President Lagarde Speaks | |||
| 13:30 (GMT) | U.S. | PPI excluding food and energy, Y/Y | October | 6.8% | 6.8% |
| 13:30 (GMT) | U.S. | PPI excluding food and energy, m/m | October | 0.2% | 0.5% |
| 13:30 (GMT) | U.S. | PPI, y/y | October | 8.6% | 8.6% |
| 13:30 (GMT) | U.S. | PPI, m/m | October | 0.5% | 0.6% |
| 14:00 (GMT) | U.S. | Fed Chair Powell Speaks | |||
| 16:00 (GMT) | United Kingdom | BOE Gov Bailey Speaks | |||
| 16:35 (GMT) | U.S. | FOMC Member Daly Speaks | |||
| 18:30 (GMT) | U.S. | FOMC Member Kashkari Speaks | |||
| 22:45 (GMT) | Canada | BOC Gov Tiff Macklem Speaks | |||
| 23:30 (GMT) | Australia | Westpac Consumer Confidence | November | 104.6 |
| Pare | Closed | Change, % |
|---|---|---|
| AUDUSD | 0.74234 | 0.43 |
| EURJPY | 131.179 | 0.17 |
| EURUSD | 1.15865 | 0.23 |
| GBPJPY | 153.574 | 0.47 |
| GBPUSD | 1.35644 | 0.61 |
| NZDUSD | 0.71657 | 0.9 |
| USDCAD | 1.24394 | -0.03 |
| USDCHF | 0.91342 | 0.09 |
| USDJPY | 113.207 | -0.12 |
- USD/CAD pokes intraday high, rejects extending the previous day’s pullback.
- Market sentiment wobbles as Fedspeak emphasize tapering.
- Oil prices struggle on US SPR concerns, mild risk-off mood.
- Comments from Fed Chair Powell, BOC Governor Macklem will be the key.
USD/CAD picks up bids to 1.2445, following the previous day’s mild losses, amid Tuesday’s Asian session. In doing so, the Loonie pair justifies the pullback in oil prices and small intraday losses of the S&P 500 Futures that underpin the US dollar rebound of late.
WTI crude oil prices fade two-day recovery, recently sluggish around $82.00. The black gold eased after US Energy Secretary Jennifer Granholm said on CNN’s “State of the Union” on Sunday that President Joe Biden is looking at the Strategic Petroleum Reserve (SPR) release, in order to reduce gas prices.
The oil benchmark also struggles amid mildly offered S&P 500 Futures, down 0.10% by the press time. Market sentiment sours amid the Fed tapering tantrums, recently propelled by the Fedspeak and firmer US inflation expectations.
That being said, various Fed policymakers ranging from Vice-Chairman Vice-Chair Richard Clarida to Charles L. Evans, the Chief Executive Officer of the Federal Reserve Bank of Chicago, conveyed hopes of tapering and positive catalysts for the rate hike during their latest appearance.
It’s worth noting that anxiety over the Fed reshuffle and uncertainty over US President Biden’s $1.75 trillion stimulus also challenge the market’s mood, helping the US Dollar Index (DXY) to consolidate recent losses.
Moving on, speeches from Fed Chairman Jerome Powell and Bank of Canada (BOC) Governor Tiff Macklem will be crucial to forecast short-term USD/CAD moves. Also important will be the weekly oil inventory data from the industry source, namely the American Petroleum Institute (API).
While the Fed tapering is already a much-debated subject, rate hike concerns are in focus to back the US dollar. On the other hand, BOC’s Mecklem needs to reiterate the bullish bias if he is to safeguard the USD/CAD bears.
Technical analysis
Although sustained trading above the four-month-old horizontal support, near 1.2420-25, keeps USD/CAD buyers hopeful, the 200-DMA level of 1.2475 guards the quote’s immediate upside.


© 2000-2026. All rights reserved.
This site is managed by Teletrade D.J. LLC 2351 LLC 2022 (Euro House, Richmond Hill Road, Kingstown, VC0100, St. Vincent and the Grenadines).
The information on this website is for informational purposes only and does not constitute any investment advice.
The company does not serve or provide services to customers who are residents of the US, Canada, Iran, The Democratic People's Republic of Korea, Yemen and FATF blacklisted countries.
Making transactions on financial markets with marginal financial instruments opens up wide possibilities and allows investors who are willing to take risks to earn high profits, carrying a potentially high risk of losses at the same time. Therefore you should responsibly approach the issue of choosing the appropriate investment strategy, taking the available resources into account, before starting trading.
Use of the information: full or partial use of materials from this website must always be referenced to TeleTrade as the source of information. Use of the materials on the Internet must be accompanied by a hyperlink to teletrade.org. Automatic import of materials and information from this website is prohibited.
Please contact our PR department if you have any questions or need assistance at pr@teletrade.global.
transfers