- Analytics
- News and Tools
- Market News
CFD Markets News and Forecasts — 10-11-2021
- GBP/CAD seesaws around the lowest levels since March 2020, sidelined of late.
- Sustained break of a multi-month-old support line directs bears to 61.8% Fibonacci retracement level.
- 200-week SMA adds to the upside filters amid the sluggish Momentum line.
GBP/CAD defends the 1.6700 threshold during an inactive Thursday morning in Asia, seesaws around 1.6750 following the slump to the 20-month low.
Although oscillators do suggest a corrective pullback on the shorter timeframe, the weekly chart has further downside room for the GBP/CAD prices.
That being said, the 61.8% Fibonacci retracement (Fibo.) of August 2019 to March 2020 upside, around 1.6645 can offer immediate support to the quote ahead of the last yearly trough near 1.6535.
Following that, the late July 2019’s high near 1.6450 will be in the focus of the GBP/CAD sellers.
Meanwhile, a corrective pullback may aim for the 1.6800 round figure ahead of targeting the May 2021 low near 1.6855 and 50% Fibo. level close to 1.6920.
It should be noted, however, that the GBP/CAD bulls remain unconvinced till the quote remains below the 200-week SMA level of 1.7160.
Also challenging the upside momentum is the support-turned-resistance line from March 2020, near 1.7000 by the press time.
GBP/CAD: Weekly chart
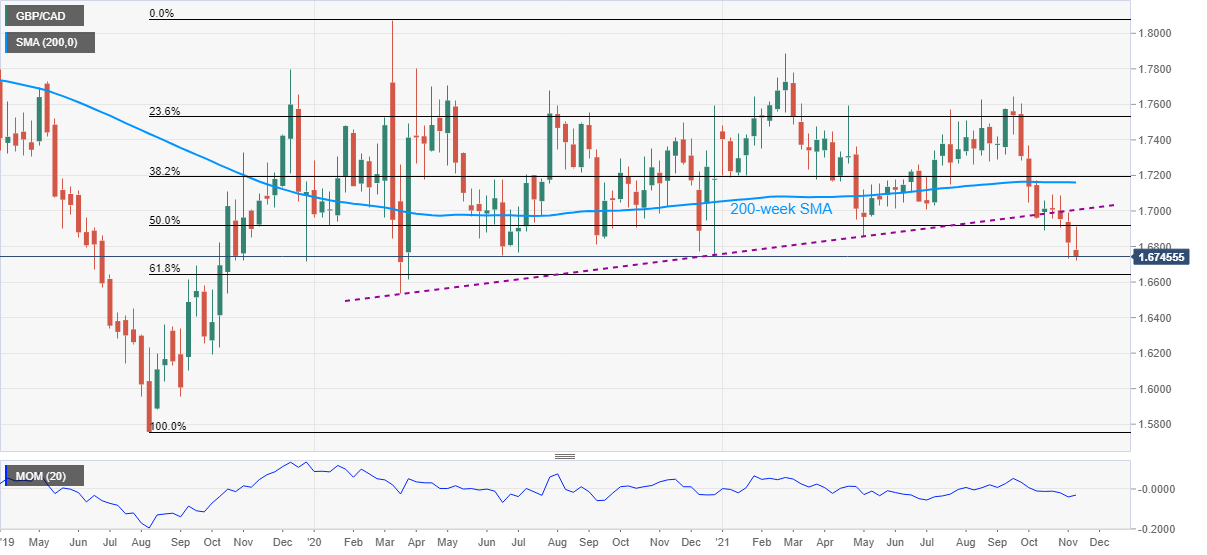
Trend: Further weakness expected
- XAU/USD broke above a 4-month downslope resistance trendline, aiming towards $1,900.
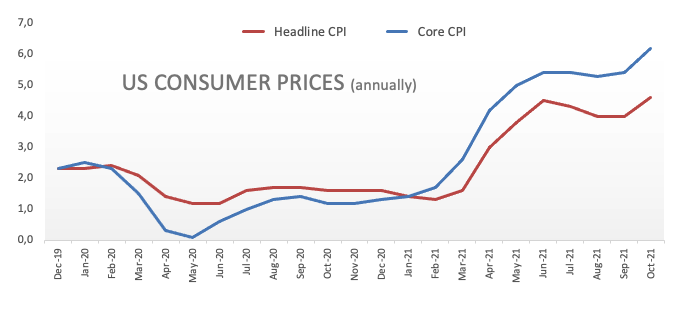
- XAU/USD rallied on higher US consumer inflation above 6%, the highest in 30 years.
- Gold, US bond yields, and the US Dollar rallied after the US inflation report.
Gold (XAU/USD) edges lower as the Asian session begins, down some 0.18%, trading at $1,849.30 during the day at the time of writing. On Wednesday, the yellow-metal spiked as high US inflation figures crossed the wires, reaching a daily high at $1,868.61, easing the upward move later, ending the New York session at $1,852.67.
It is worth notice, that US T-bond yields and the US Dollar followed the XAU/USD spot footsteps, finishing in the green. The 10-year benchmark note rose twelve basis points, sitting at 1.57%, recovering this week's losses. Meanwhile, the US Dollar Index, a measurement of the greenback's value against a basket of six peers, advanced 0.98%, closed at 94.87.
US consumer inflation tops 6.2%, the highest level since 1990
During the New York session, the US Bureau of Labor Statistics (BLS) featured the Consumer Price Index (CPI) for October, which surged 6.2% on a yearly basis, up from 5.4% in September, leaving behind the 5.3% estimations by economists. Further, the Core CPI reading, which excludes volatile items like energy and food, expanded by 4.6% in the same period, higher than the 4.8% foreseen by the market.
That said, the US Dollar rallied, US T-bond yields spiked, and gold shot through the roof, as expectations that the US central bank would need to accelerate the bond taper process amid long-lasting inflation. Also, the US 2-year yield sits at 0.519%, implying that market participants are pricing in a Fed rate hike by June of 2022.
The US economic docket will be light on Thursday. However, on Friday, the University of Michigan Consumer Sentiment Index for November could offer gold traders a fresh catalyst to take action at. Further, the US JOLTS Job Openings will be unveiled. Later, New York Fed's President John Williams will speak.
XAU/USD Price Forecast: Technical outlook
Daily chart
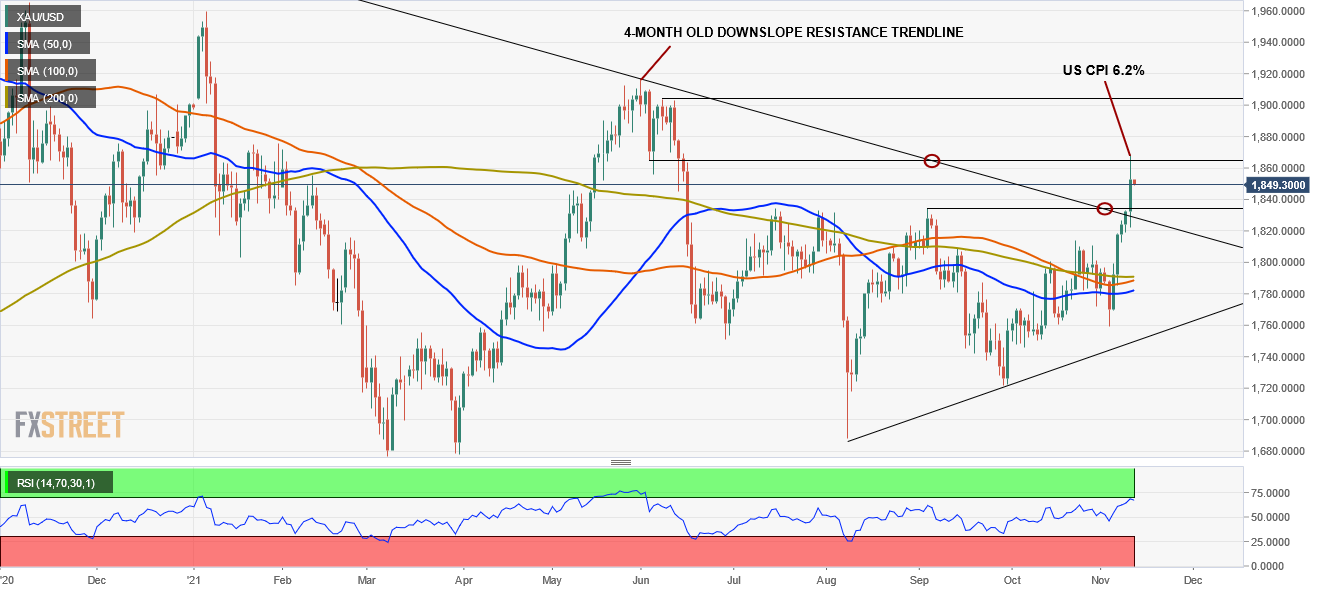
The non-yielding metal broke above a 4-month downslope resistance trendline, reaching a new daily high at $1,868.61, but retreated the move, sitting on the top of the abovementioned. The daily moving averages (DMA's) are long left behind the spot price, sitting around the $1,780-95 area, with the 50-DMA aiming higher, while the longer time-frames one, directionless.
Further, the Relative Strength Index (RSI) is at 67, beneath overbought levels, confirming the upward bias. However, for XAU/USD bulls to accelerate an attack towards $1,900, they will need a daily close above the June 3 low at $1,864.98. In that outcome, the following resistance area would be the psychological $1,900.
Having witnessed a 30-year high Consumer Price Index (CPI) print, 6.2% YoY, the US inflation expectations, as measured by the 10-year breakeven inflation rate per the St. Louis Federal Reserve (FRED) data, jumped to the fresh high since May 2006.
That said, the risk barometer jumped to 2.70% by the end of Wednesday’s North American trading. In doing so, the risk barometer extends the previous week’s rebound from the lowest levels since October 12, per the official website data.
The same propelled the US Fed rate hike concerns and underpinned the US 10-year Treasury yields to post the biggest daily jump in seven weeks, around 1.57% by the press time. Not only the firmer yields but equities also portray the market’s risk-off mood.
Even so, comments from Patrick Timothy Harker and Mary C Daly, respective Presidents of the Federal Reserve Bank of Philadelphia and San Fransisco, tried to defend the Fed doves. While Harker highlighted the possibilities of a rate hike even while tapering is on, Fed’s Daly said, per Reuters, that it would be premature to change the calculation on raising rates.
It should be noted, however, that the sour sentiment may weigh on the risk barometers like the AUD/USD and gold prices even if the US witnesses a baking holiday.
Read: AUD/USD flirts with monthly low under 0.7350, Aussie employment report eyed
- GBP/USD sellers take a breather, indecisive after refreshing the yearly low.
- Sustained trading below September’s low of 1.3411, break of 1.3400 become necessary to keep bears on the table.
- Corrective pullback remains doubtful until crossing July’s trough.
GBP/USD defends the 1.3400 threshold amid Thursday’s initial Asian session, following the slump to refresh the yearly low.
The lackluster moves could be linked to the cable pair’s inability to extend the downside break of September month’s low near 1.3410, as well as the nearly oversold RSI conditions.
That said, the corrective pullback may aim for 50% Fibonacci retracement (Fibo.) of the pair’s run-up from September 2020 to June 2021, around 1.3460.
However, the rebound remains doubtful until staying below July’s bottom near 1.3575, a break of which will direct the quote towards the 50-DMA level of 1.3677.
Meanwhile, a clear downside break of the 1.3400 mark will direct the GBP/USD prices towards December 2020 low near 1.3130, with the 61.8% Fibo. likely offering an intermediate halt around 1.3270.
GBP/USD: Daily chart
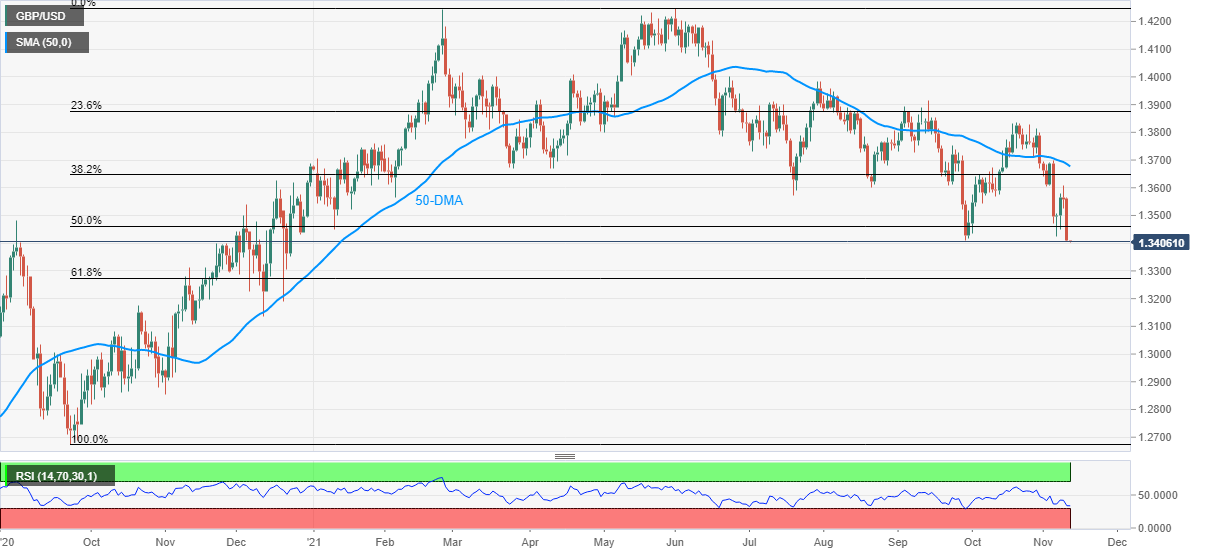
Trend: Corrective pullback expected
- EUR/USD holds in negative territory following US CPI induced side below 1.1500.
- US CPI was the biggest year-on-year rise since November 1990.
The dollar jumped on the CPI data, with the euro hitting a 16-month low against the greenback. The dollar index, DXY, which measures the US dollar versus a basket of six currencies, rose 0.914% to 94.886. Consequently, the euro fell 0.97% vs the greenback at $1.1476. At the time of writing, EUR/USD is trading at 1.1478 and steady in a slow start to the new trading day.
US CPI way above Fed's target
US CPI rose 0.9% on a monthly basis after rising 0.4% in September as the largest gain in four months boosted the annual increase to 6.2%. It was the biggest year-on-year rise since November 1990 and followed a 5.4% leap in September. Economists polled by Reuters had forecast the overall CPI to rise 0.6%.
''The rise in cyclical components of inflation, like rents, will extend further in coming months, so core inflation can be expected to rise further,'' analysts at ANZ Bank argued. ''The October CPI data implies that if US inflation miraculously falls back to 0.2% MoM from November and maintains that rate of increase for 12 months, CPI inflation will still average 3.2% YoY in Q3 next year – way above the Fed’s target.''
For the day ahead, Australia’s October labour force survey is due but US bond markets will be closed for Veterans Day. Equities, however, will be open.
-
Breaking: EUR/USD breaks 1.1500 like a knife through butter
- AUD/USD holds lower ground following the biggest daily loss in over a week.
- 30-year high CPI, US President Biden’s push to battle inflation pressure propel Fed rate hike concerns.
- USTR comments ahead of Sino-American virtual summit, Evergrande woes exert additional downside pressure.
- Australia jobs data may probe pair bears amid recent unlocks but RBA rate hike needs more push.
AUD/USD keeps the US inflation-led bearish bias even as the bears take a breather around monthly bottom close to 0.7320 amid early Thursday morning in Asia. In doing so, the Aussie pair justifies the market’s risk-off mood amid rate hike concerns and updates over the US-China trade relations, as well as Evergrande.
Having witnessed a multi-year high US inflation, President Joe Biden showed readiness to battle the price pressure, which in turn exerts additional downside pressure on the Fed to increase the benchmark rate.
Chatters over the US Federal Reserve’s (Fed) rate hike swirled after the headline Consumer Price Index (CPI) jumped to the highest levels in three decades, 6.2% YoY, pushing the AUD/USD prices lower. “The October CPI data implies that if US inflation miraculously falls back to 0.2% m/m from November and maintains that rate of increase for 12 months, CPI inflation will still average 3.2% y/y in Q3 next year – way above the Fed’s target,” the ANZ report recently said.
However, comments from Patrick Timothy Harker and Mary C Daly, respective Presidents of the Federal Reserve Bank of Philadelphia and San Fransisco, tried to defend the Fed doves. While Harker highlighted the possibilities of a rate hike even while tapering is on, Fed’s Daly said, per Reuters, that it would be premature to change the calculation on raising rates.
Further, the growing rift between the US and China ahead of next week’s virtual summit of US President Biden and his Chinese counterpart Xi Jinping also weighs on the AUD/USD prices. Recent comments from US Trade Representative (USTR) Katherine Tai weren’t signaling any optimism ahead of the key meeting.
Additionally, China’s struggling real-estate major Evergrande is said to have officially defaulted as the DMSA - Deutsche Marktscreening Agentur (German Market Screening Agency), is up for preparing for the firm’s bankruptcy filing, per the Daily Express.
Hence, multiple challenges to the market sentiment join the Fed rate hike concerns to weigh on the risk-barometer AUD/USD prices.
Amid these plays, Wall Street closed lower and the US 10-year Treasury yields jumped the most in seven weeks.
Moving on, the updates over China and Evergrande may entertain the AUD/USD traders ahead of the Aussie jobs report for October. Although the data is likely to allow bears to take a breather, the Reserve Bank of Australia (RBA) has already set high bars for the rate hike and hence the trend reversal of the Aussie pair isn’t on the table even if the figures arrive as too positive.
Read: Australian Employment Preview: A positive surprise or too much optimism?
Technical analysis
AUD/USD marked a daily closing below the 50-DMA, as well as the 100-DMA, around 0.7375-70 to keep sellers hopeful of visiting the 61.8% Fibonacci retracement (Fibo.) of September-October upside, around 0.7320. Alternatively, a monthly resistance line and the 38.2% Fibo. level, respectively around 0.7390 and 0.7410, gains the market’s attention during the recovery moves.
- AUD/JPY stays pressured around monthly low despite avoiding daily losses the previous day.
- Bearish MACD signals, immediate descending trend line favor sellers.
- Late October lows add to the upside filters.
AUD/JPY remains on the back foot around a one-month low, close to 83.45 amid the initial Asian session on the key Thursday comprising the Aussie jobs report for October.
Read: Australian Employment Preview: A positive surprise or too much optimism?
Although the cross-currency pair’s early Wednesday gains saved it from a negative daily closing, bearish MACD signals and a sustained following up of the descending resistance line from November 02 keep the sellers hopeful.
However, the 200-DMA level near 82.85 becomes a tough nut to crack for the bears before taking entries.
Following that, 50% Fibonacci retracement (Fibo.) of August-October upside joins October’s peak around the 82.00 threshold to challenge the AUD/JPY downturn.
Alternatively, a clear upside break of the immediate resistance line, close to 83.65 by the press time, isn’t a green pass to the pair bulls as lows marked during the late October, surrounding 84.60, adds to the upside filters.
Even if the quote manages to remain firm past 84.60, the 85.00 round figure and multiple tops near 86.00 will be challenging the AUD/JPY bulls before driving them to the last month’s peak of 86.25.
AUD/JPY: Daily chart
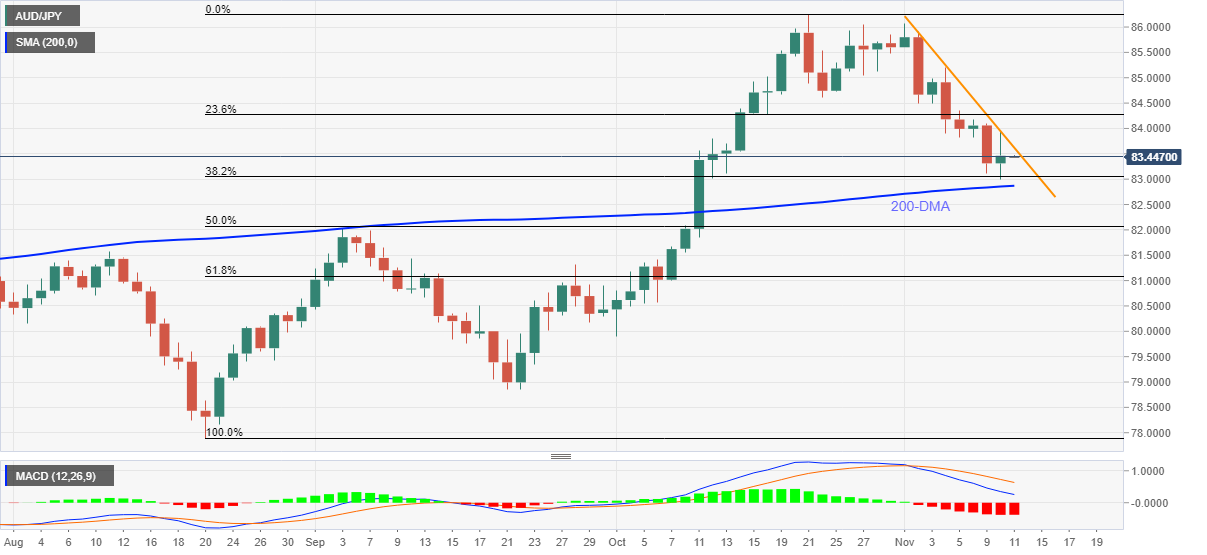
Trend: Further weakness expected
Having earlier showed readiness to combat the inflation, US President Joe Biden reiterate that the consumer prices remain too high during early Thursday morning in Asia.
More to come
“Exploring all weaknesses in china's phase 1 performance, including lack of commercial aircraft purchases,” US Trade Representative (USTR) Katherine Tai said, per Reuters, during early Thursday morning in Asia.
Additional comments
Optimistic engagement with China on the Phase 1 trade deal will lead to better outcomes but cannot predict results.
Biden administration is 'getting traction' with Chinese counterparts in trade discussions.
Discussions with China aim to hold Beijing accountable to Trump-era 'phase 1' trade agreement.
The US is exploring all weaknesses in China's phase 1 performance, including lack of commercial aircraft purchases.
Biden, Xi familiarity with each other will help manage complex relationship during difficult period.
Not in her interest for talks on the China phase 1 deal to take a 'very, very long time'.
USTR focused on 'big picture' and US competitiveness (when asked whether easing tariffs on Chinese goods could help tame inflation).
FX implications
With Politico news saying the virtual summit between US President Joe Biden and his Chinese counterpart Xi Jinping tentatively set for Monday, such comments from USTR Tai escalate market’s tension considering not so good US-China trade relations. It should be noted, however, be noted that there was little reaction to the catalyst amid the Asian market’s wait for Australian employment data after witnessing a volatile Wednesday, due to the US inflation figures.
Read: Forex Today: Dollar wins as inflation fears return
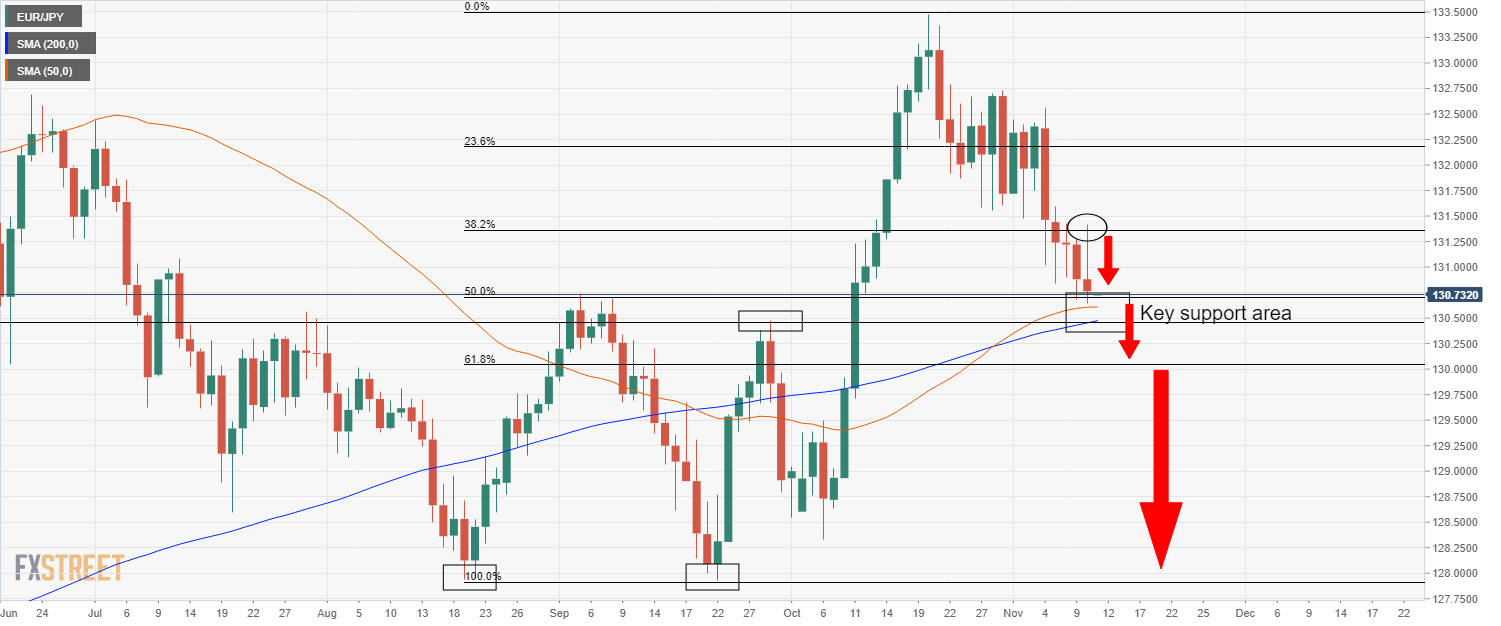
- EUR/JPY has reversed an attempt earlier in the session to hit 131.50 and is back below 131.00.
- The pair is finding solid support, however, though if risk appetite continues to deteriorate, it could drop towards 130.00.
It’s been a choppy session today for EUR/JPY though, ultimately, the pair is set to end the day flat after moves elsewhere in FX markets stole the limelight (the dollar surged to fresh annual highs). At the start of US trading hours, EUR/JPY swung as high as the 131.40s to hit a key Fibonacci retracement level (the 38.2% retracement back from the October highs to the summer lows), before paring all of these gains to fall back to the 130.75 region. That means the pair is back to probing near-one-month lows. However, EUR/JPY is receiving support from a number of key levels including the 50% retracement from the October high back to the summer lows, the 50-day moving average (DMA) at 130.60, the 29 September high at 130.47 and the 200DMA just below it at 130.45.
With inflation concerns in the US triggering downside in US equities, not least given concerns that the Fed will be forced to remove monetary stimulus sooner to address elevated price pressures, risk appetite looks at risk of seeing further deterioration in the sessions ahead. That should favour the safe-haven Japanese yen over the euro.
If a further downturn in stocks and broader risk appetite does favour the safe-haven yen and push EUR/JPY below the next notable area of support, this would open the door to a run at the psychologically important 130.00 level. This level coincides with the 61.8% Fibonacci retracement between EUR/JPY’s summer lows at around 1.2800 and the October highs at 133.50. A break below here could signal an eventual move all the way back to these summer lows.
- NZD/USD is weaker on the back of a firmer US dollar and higher US inflation data.
- Markets now will turn their focus to the RBNZ for guidance.
NZD/USD is ending the North American session down by some 0.9% after falling from a high of 0.7132 to a low of 0.7062 on the day. A stronger than expected US Consumer Price Index data overnight saw the USD rally against all G10 currencies.
The US Consumer Price Index rose 0.9% last month after gaining 0.4% in September and in the 12 months through October, the consumer price index accelerated 6.2%. the US Labor Department said on Wednesday, while analysts expected on average the rise to be limited to 5.8%.
The markets have responded in kind following the Federal Reserve last week restating that the current inflation surge will be transitory. However, today's data comes in stark contrast to such a belief. meanwhile, the NZD was the second-best performer although remains pressured due to the US data casting doubt on the idea that the Fed can remain patient. ''The NZD’s resilience is pretty understandable given that markets have already come to grips with high NZ CPI and hefty rate hikes are already priced in,'' analysts at ANZ Bank argued.
RBNZ in focus
''The NZD has the potential to respond very positively to the next couple of Reserve Bank of New Zealand OCR hikes (especially if one of them is 50bps), but as we head into 2022, with mortgage rates already well higher and the Fed then likely eyeing hikes, that timing mismatch could be a real challenge for the NZD. So maybe this isn’t as good as it gets, but it may not be too far off it.''
- After the US CPI report, the AUD/USD seesawed around the 0.7320-0.7392 range during the day.
- US CPI increased the most since 1990, topping 6.2%.
- AUD/USD Technical outlook: DMA’s above the spot price and the RSI indicate a downward bias in the near term.
The Australian dollar slides during the New York session, down 0.64%, trading at 0.7334 at the time of writing. Earlier in the Asian Pacific session, the pair edged slightly lower, around the 0.7350 area, in choppy trading conditions, sideways. When US inflation figures crossed the wires, the AUD/USD fluctuated around the 0.7339-92 range.
US CPI increased the most since 1990, topping 6.2%
The Labour Department reported on Wednesday that the US Consumer Price Index (CPI) for October increased by 6.2%, on annual base numbers, higher than the 5.3% foreseen by analysts. Additionally, unveiled that the Core CPI that excludes energy and food volatile items increased by 4.6% for the same period, more than the 4.3% estimated by economists.
According to the report, prices in energy, shelter, food, and vehicles triggered the spike in the CPI. Also, inflation is broadening beyond areas associated with a reopening.
AUD/USD Price Forecast: Technical outlook
Daily chart
At press time, after the flurry of US CPI, the AUD/USD settled around the 0.7330 area. The daily moving averages (DMA’s) reside above the spot price, confirming in the near-term a downward bias, acting as resistance levels.
Also, the Relative Strength Index (RSI) at 39, below the 50-central line and with enough room before reaching oversold levels, adds another signal to the bearish bias.
To accelerate the downtrend, AUD/USD sellers will need a break below the September 24 high at 0.7316. In that outcome, the pair could travel south towards the October 6 low at 0.7225.
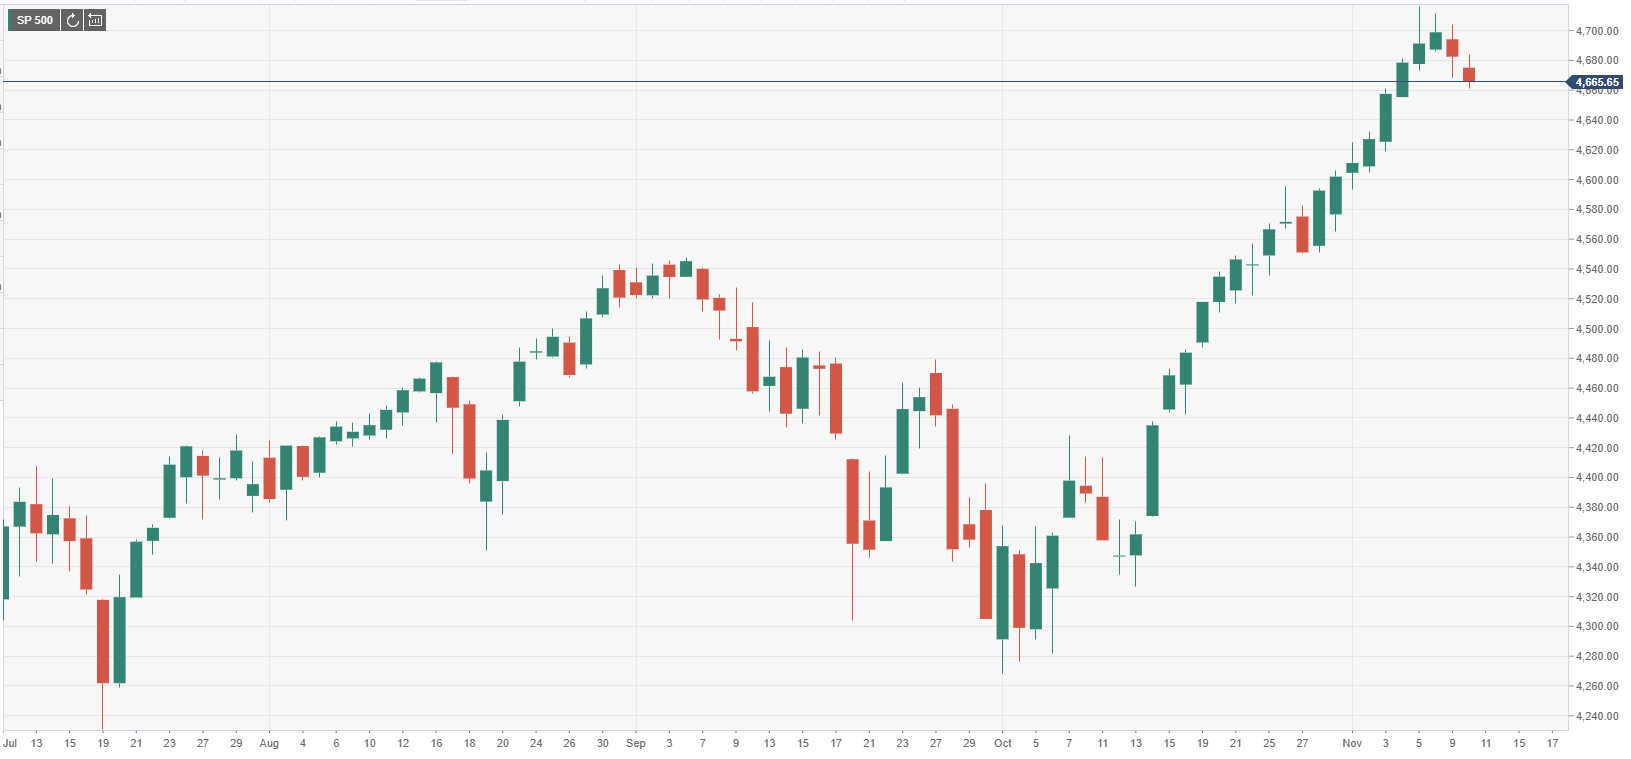
- The S&P 500 has continued to push lower in recent trade and currently trades in the 4630s.
- That puts it one course for a near 1.0% drop, it's worst day since the start of October.
- US equities have come under pressure amid heightened inflation fears in wake of a hotter than expected US CPI report.
US equity markets have continued to head lower in recent trade, having been on the back foot since the market open at 1430GMT. Inflation fears are being touted as the major reason for the selling in wake of a much hotter than expected US October Consumer Price Inflation report. For reference, headline CPI came in at 6.2% YoY/0.9% MoM, both metrics well above expectations, while core CPI came in at 4.6% YoY/0.6% MoM, also well above expectations. The YoY rate of headline CPI was its highest since 1990, while the YoY rate of core CPI was at its highest since the early 90s.
The S&P 500 recently dropped below the 4640 level and is currently trading with on the day losses of just shy of 1.0%, putting the index on course for its worst day since 4 October, more than one month ago. Amid the sharpest jump in long-term US government borrowing costs in months, which has seen the 2-year yields rise nearly 10bps, 5-year yields spike nearly 15bps and 10-year yields rally nearly 11bps, the duration-sensitive Nasdaq 100 index is an underperformer. The Dow Jones Industrial Average is nursing losses of about 0.7%, having recently slipped back under the 36K level.
The CBOE S&P 500 Volatility Index also jumped on Wednesday to its highest level in nearly one month, just missing out on hitting the 20.00 mark. On the day, the index is up just under 1.5 vols at the time of writing, the largest one-day jump since the end of September, a day when the S&P 500 dropped 2.0% to close more than 6.0% below the index’s current level.
Inflation fears
Analysts broadly framed the latest CPI report as indicative that inflation pressures in the US are set to both longer-lasting and broader than previously expected. As a result, the Fed’s base case assumption upon which their policy guidance is pinned, that inflationary pressures will fade in mid-2022, is coming under pressure. 5-year breakeven inflation expectations surged to fresh record levels (they can only be calculated back to 2004) above 3.15%, well above the Fed’s 2.0% inflation target, making it harder for Fed members to argue that inflation expectations remain well-anchored. ING said they cannot rule out headline CPI surpassing 7.0% YoY in the months ahead. They expect this to ultimately force the Fed’s hand and expect the QE taper to be accelerated in Q1, followed by a minimum of two rate hikes in 2022.
What you need to know on Thursday, November 11:
Risk-aversion took over financial markets and the dollar made the most out of it. The catalyst was US inflation, as the US annual Consumer Price Index soared to its highest in three decades, hitting 6.3% YoY in October. Stocks took a turn for the worse as yields soared, reflecting mounting concerns of further tightening in the US.
Also, Federal Reserve Bank of San Francisco President Mary Daly said noted that even though it’s temporary, high inflation hurts. She added that it would be premature to change the pace of monetary policy tightening.
The dismal mood was exacerbated by news indicating that the Chinese giant Evergrande stands on the verge of default. Some bondholders have not received coupon payments by the end of the 30-day grace period on coupon payments of more than $148 million on its April 2022, 2023 and 2024 bonds at the close of Asia business, and market talks hint at DMSA preparing bankruptcy proceedings against the Evergrande Group. With that in mind, it's possible that Asian shares follow their overseas counterparts on their way down.
The EUR/USD pair settled below 1.1500, its lowest since July 2020. GBP/USD nears 1.3400 as investors await news on the Brexit front.
The AUD/USD pair is down to the 0.7330 region, with losses partially offset by soaring gold prices, as the bright metal trades around $1,840 a troy ounce after reaching a multi-month high of 1,868.54. USD/CAD flirts with 1.2500 as crude oil prices gave up to the ruling dismal mood, with WTI ending the day at $81.10 a barrel.
Bitcoin smashes through $69,000 as US inflation hits its highest point in 30 years
Like this article? Help us with some feedback by answering this survey:
- The US dollar is on fire following the US CPI surprise beat.
- USD/JPY has rallied 1% in the day and bulls seek space on the 114 round number.
The US Consumer Price Index rose 0.9% last month after gaining 0.4% in September and has sent the greenback higher across the board. USD/JPY has rallied around 1% on the day as a consequence, penetrating critical resistance on the charts. At the time of writing, USD/JPY is trading around the highs of the day near 114 the figure after rallying from a low of 112.77 to a high of 114.01 so far.
In the 12 months through October, the consumer price index accelerated 6.2% the US Labor Department said on Wednesday, while analysts expected on average the rise to be limited to 5.8%. The Consumer Price Index rose 0.9% last month after gaining 0.4% in September and in the 12 months through October.
DXY rallied into 94.80s, stocks on a knife-edge
The Federal Reserve last week restated its belief that the current inflation surge is transitory, but this data comes in stark contrast to that assumption and has sent the US dollar on a tear. The US dollar index, DXY, which measures the greenback against six major currencies, was up 0.86% at 94.80 and has accelerated its gain after reaching a high of 94.440 immediately after the data was released.
Many investors had feared that underestimating price increases could prove to be a costly policy mistake and markets are responding in kind. US stocks have plummeted with the S&P 500 no won course for a significant correction towards the Oct 4,600s, supporting the risk-sensitive JPY. Additionally, the Evergrande default news is denting risk-sensitive assets.
Evergrande and US inflation fears sink US stocks
-637721701646922144.png)
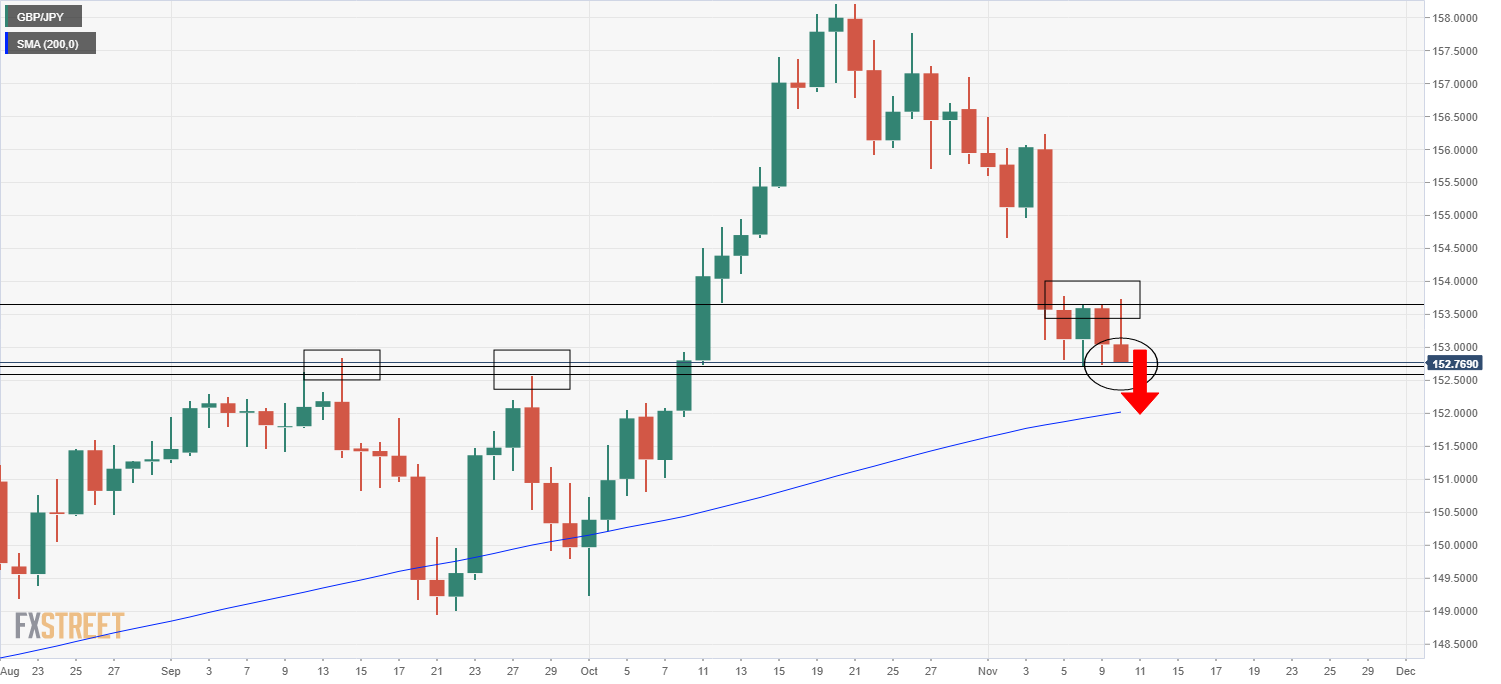
- GBP/JPY is probing multi-week lows under 153.00 ahead of UK GDP data out on Thursday.
- If the pair does break to the downside, technicians may target a move towards the 200DMA at 152.00.
It’s been a choppy and ultimately indecisive day for GBP/JPY, with the pair ultimately respecting recent ranges FX markets focussed more on macro themes (such as US inflation) rather than UK/Japan domestic issues. The pair managed to hit its highest level since last Thursday in the 153.70s at the start of the US trading session, but has since reversed these gains to trade ever so slightly in the red on the day back to the south of the 153.00 handle.
Indeed, given that it is back below 153.00, the pair is hovering just above the multi-week lows set at the start of this week at around 152.70. For now, support in the form of the 14 and 28 September highs in the 152.50-80 region is holding up. The preliminary estimate of Q3 UK GDP is released at 0700GMT on Thursday and could provide the momentum to either break below support (in the case of poor GDP numbers) or move back to test weekly highs (in the case of good numbers).
Brexit newsflow is also going to be worth monitoring over the coming days and weeks with the UK on the cusp of escalating tensions with the EU and even putting the post-Brexit trade deal at risk if it opts to trigger Article 16 of the Northern Ireland Protocol (which allows either side to unilaterally suspend parts of the agreement if it is causing significant societal damage).
In the case of a downside break, the next key area of support is the 200-day moving average which sits almost band on the 152.00 level. In the case of an upside breakout, the next key area of resistance is the 2 November low at just above 154.50.
Update: Evergrande officially defaults despite reports of meeting some of its debt repayment liabilities.
Following a hotter-than-expected US Consumer Price Index for October and news that Evergrande has missed a 30-day grace period to pay its debts have sunk US stocks on Wall Street. The S&P 500 index is down 0.7% at the time of writing, but the move might have just got started according to the technical analysis below.
Firstly, CPI has jumped 0.9% after climbing 0.4% in September, the Labor Department said. This was the largest gain in four months boosted the index's annual increase to 6.2%. It was also the biggest year-on-year rise since November 1990 and followed a 5.4% leap in September.
Therefore, markets are noting that inflation and the persistence of elevated inflation are much more than what policymakers had expected and are posting accordingly. This is hurting US stocks and sending the US dollar on a tear on Wednesday.
To top it off, risk-off is accelerating on the news that the cash-strapped China Evergrande Group has missed coupon payments by the end of a 30-day grace period, pushing the developer again to the edge of default.
Update: In more recent trade, the headlines are now stating that the company has met at least one of its deadlines for repayments, but there are reports that bankruptcy proceedings are still underway.
Market implications
This is spelling contagion risks for investors because the failure to pay will inevitably result in a formal default by the company, thus triggering cross-default provisions for other Evergrande dollar bonds, exacerbating a debt crisis looming over the world's second-largest economy. Evergrande, the world's most indebted developer has been grappling with more than $300 billion in liabilities, $19 billion of which are international market bonds.
Consequently, US stocks are reeling in the fear of contagion risks:
-637721677188280145.png)
The S&P 500 chart shows that the daily price action has hit a 38.2% Fibonacci retracement of the latest bullish rally. A break below there opens risk all the way back to the Oct highs and beyond.
- The British pound collapses, down 160 pips during the day on high US inflation.
- US CPI increased the most in 30 years, topping 6.2%.
- Brexit: UK and EU look far from reaching a post-Brexit deal on Northern Ireland.
The British pound reverses this week’s gains and some more, plummeting 160 pips during the day, down almost 1%, trading at 1.3426 at the time of writing. Since the beginning of the week, the GBP/USD pair trimmed last Friday’s losses, bouncing from 1.3400 to this week’s high (November 9) at 1.3606, amid the lack of a catalyst, mainly driven by US dollar weakness. Also, lower US bond yields dragged the greenback lower, ahead of the critical US CPI release.
US CPI increased the most in 30 years, topping 6.2%
On Wednesday, the Labour Department reported that the US Consumer Price Index for October rose by 6.2%, on a yearly basis, higher than the 5.3% expected by analysts. Further, the Core CPI that excludes energy and food volatile items increased by 4.6% for the same period, more than the 4.3% foreseen by market participants.
According to the report, prices in energy, shelter, food, and vehicles triggered the spike in the CPI. Also, inflation is broadening beyond areas associated with a reopening.
That said, USD bulls gained traction, spurring a 160 pip drop in the GBP/USD pair, overcoming intraday support levels like the November 9 low at 1.3523, followed by the November 8 low at 1.3490, and then the S3 pivot level at 1.3433.
Additionally, in the last hour or so, Brexit woes hit the wires, as the UK and the EU look far from reaching a post-Brexit agreement over Northern Ireland.
“EU governments agreed on the need for “robust” action against Britain if London follows through on its threat to invoke emergency unilateral provisions,” per Reuters.
According to sources cited by Reuters, “Downside risk may emerge for the pound in the coming days as it looks increasingly likely that the UK will unilaterally suspend parts of the Northern Ireland Protocol.”
That said, GBP/USD traders should note that if the UK triggers Article 16, the British pound could potentially sell-off because the Euro Zone would not stand still instead would retaliate against the UK.
EUR/USD has just broken the 1.1500 level and has made the lowest low since July 2020 as follows:
EUR/USD daily chart
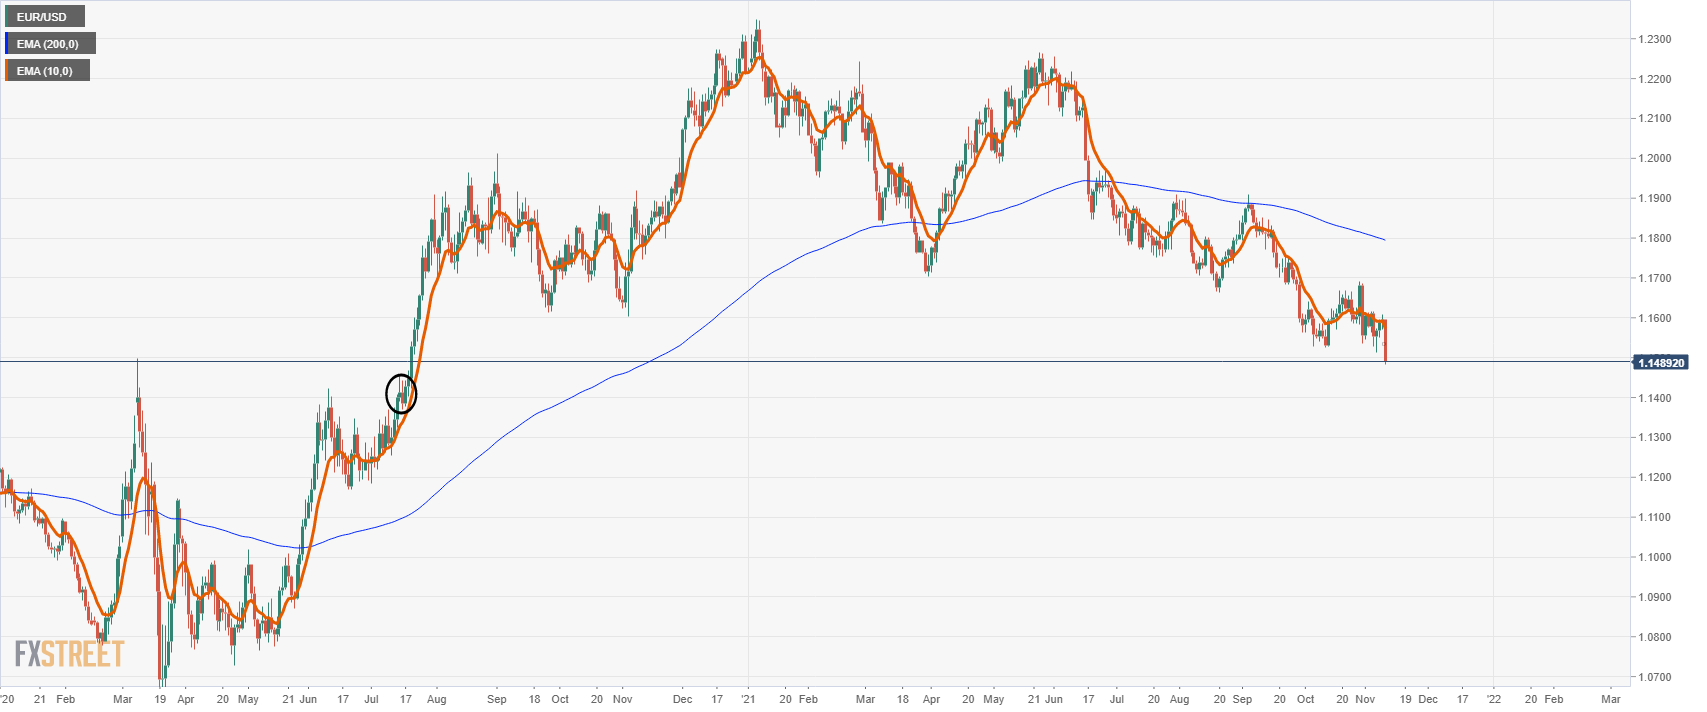
The price has room to go until the 1.1450s at this rate as per the order block highlighted in the summer of the 2020s above.
EUR/USD H1 chart
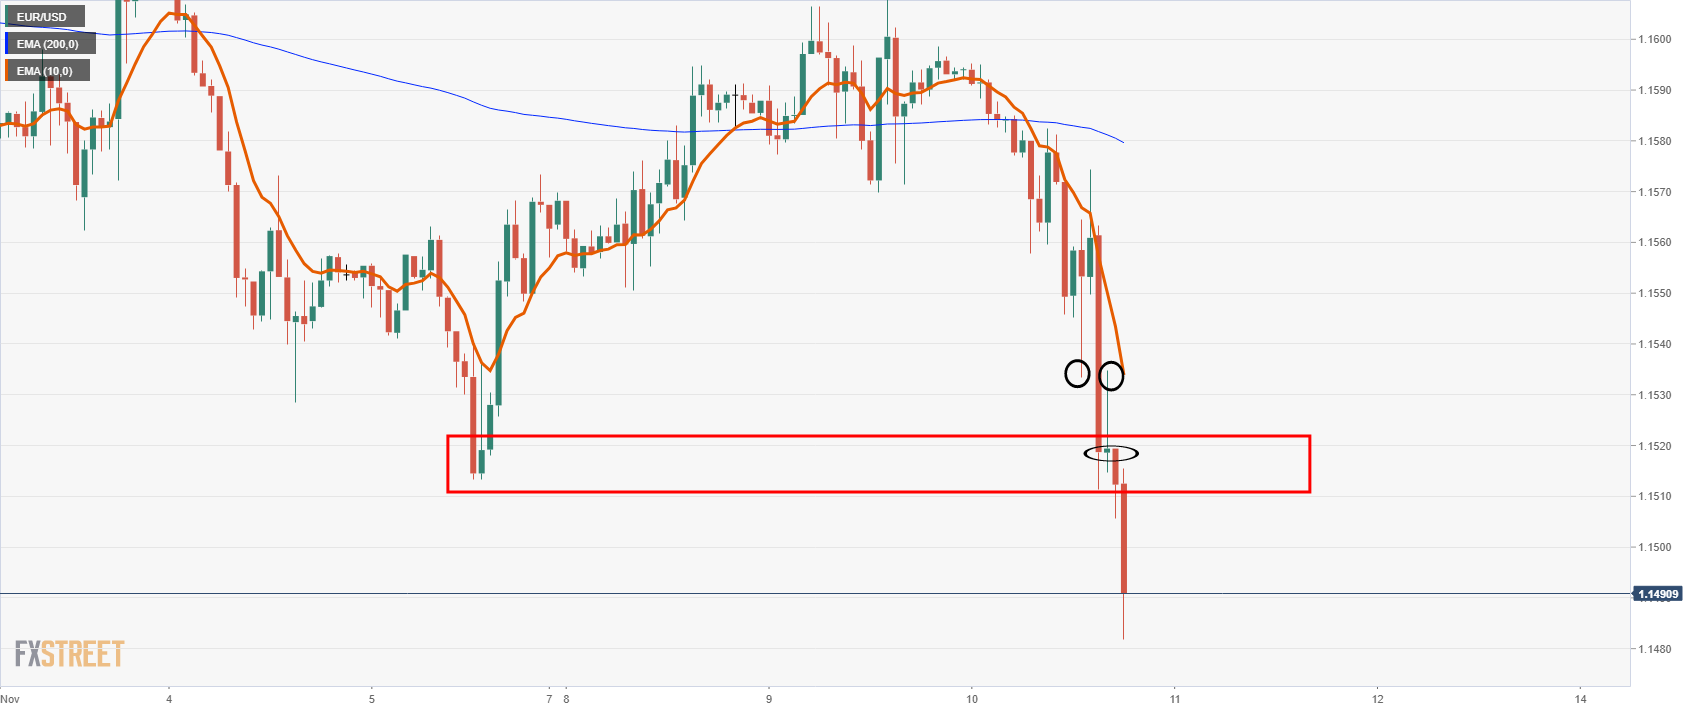
On the hourly chart, we can see that the price has retested the prior lows and sank from there on the impulse. Any correction would be expected to be resisted at around 1.1520 and be a fade on rallies.
The moves today come on the back of the US Consumer Prices surging to their highest rate since 1990 and against market predictions. This has been fueling speculation mid-week that the Federal Reserve may raise interest rates sooner than expected.
The Consumer Price Index jumped 0.9% last month after gaining 0.4% in September and in the 12 months through October, CPI accelerated 6.2%. Analysts had expected on average the rise to be limited to 5.8%.
While the Fed last week restated its belief that the current inflation surge would be short-lived, many investors worry that underestimating price increases could prove to be a costly policy mistake.
More to come...
Rivian Automotive listed on the Nasdaq today in one of the hottest IPO's of the year. Rivian is listed under the ticker symbol RIVN. RIVN opened at $106.75 from the IPO price of $78.
Rivian is an electric vehicle manufacturer backed by Amazon and Ford. Demand was exceptionally high for this one. The initial price range for the IPO was $57 to $62 but this was increased sharply to $72 to $74 on Monday after a strong investor roadshow. Finally, the IPO price was set late Tuesday at $78 meaning Rivian (RIVN) raised nearly $12 billion dollars in what is one of the top 10 biggest US IPO's ever.
Rivian opened for trading on the Nasdaq at $106.75 giving it a market cap of over $100 billion. This makes it bigger than Ford (F), BMW, General Motors (GM), Honda, and others. Volkswagen which owns VW, Audi, Porsche, Skoda, SEAT, Lamborghini has a market cap of $122 billion.
- US 10-year yields shot nearly 10bps higher to the mid-1.50s% following hot US inflation data.
- The data puts pressure on the Fed to abandon its ultra-dovish monetary policy stance.
The latest US Consumer Price Inflation report (for the month of October) has triggered a significant move higher in the US 10-year yield. On the day, 10-year yields are up just shy of 10bps, having rallied from around 1.44% to close to the 1.55% mark. That marks the biggest one-day rise since 23 September, when the Fed caught the market off guard with a more hawkish than expected dot-plot.
The move higher in 10-year yields comes amid a broader move higher of yields across the US curve. 2s are up 9bps to above 0.50% again, 5s are up more than 12bps to close to 1.20%, 7s are up nearly 11bps to above 1.40% and 30s are up over 6bps to just shy of the 1.90% mark. The larger move higher of yields in the short-end/belly of the curve means that the US yield curve has also flattened. The 5s/30s spread hit its lowest since Q2 2020 on Wednesday at just above 40bps.
Higher bond yields mean bond prices have fallen. Higher inflation eats away at the value of a bond by reducing the future value of the bond’s cash flow (coupon and principal payments). It was not surprising to see investors dump US bonds in wake of a much hotter than anticipated US inflation report on Wednesday. To recap the details quickly, headline CPI came in at 6.2% YoY/0.9% MoM, both metrics well above expectations, while core CPI came in at 4.6% YoY/0.6% MoM, also well above expectations. The YoY rate of headline CPI hit a fresh highs since 1990.
If market participants still believed the Fed’s argument that the current spike in inflation is set to be transitory and that inflation will on its own come back towards their 2.0% target by the end of 2022 and in 2023, then bonds likely would not have been sold so heavily. But there is increasing evidence that the transitory argument is incorrect, as the latest report revealed inflationary pressures becoming more broad-based. Housing rose 0.7% MoM, food 0.8% MoM and medical care 0.5% MoM. House costs have been getting particular focus as of late given the tendency of the housing cost component in the CPI calculation to follow house price trends over time.
The Federal Housing Finance Agency's House Price Index was up 18.5% YoY in September and some economists are forecasting that the inflation rate of the housing cost component in CPI (which makes up 25% of the headline index and 40% of the core) will reach 4.0% next year, double the Fed’s target. Add to all of the above the growing evidence over the last few months that the US labour market is very tight owing to the labour shortage and that, as a result, wage growth is picking up, and the transitory argument is on shaky legs.
Notably, the demand for medium-term inflation protection was strong. Despite 5-year yields surging more than 12bps, the 5-year TIPS yield (i.e. on the 5-year inflation-protected bond) dropped 5bps. That meant that 5-year inflation expectations rocketed more than 17bps higher on the day. In that context, its not surprising to see gold (widely seen as an inflation hedge) rocket to multi-month highs.
The CPI data and the sharp move higher in medium-term inflation expectations (5-year breakevens suggest inflation will average 3.14% over the next five years) will put heavy pressure on the Fed to abandon their ultra-dovish stance that at the moment leaves than on course continue buying bonds into mid-2022 and then likely not hiking rates until sometime after.
- NZD/USD falls sharply, as US inflation numbers hit the highest level since 1990.
- A downbeat market sentiment boosts the safe-haven currencies, like the US dollar, weighed on the risk-sensitive NZD.
- NZD/USD: A daily close below the 200-DMA opens the path towards 0.7000 and beyond.
The NZD/USD extends its daily losses to two consecutive days, slides 0.70%, trading at 0.7081 during the New York session at the time of writing. The market sentiment is downbeat, portrayed by falling US stock indices printing losses between 0.11% and 0.18%, as US inflation figures rose above 6%, the highest reading since 1990.
Since the Asian session, the New Zealand dollar lost traction against the greenback on the expectations that higher US inflation numbers could spur a faster reaction of the Federal Reserve. Money markets increased the odds of a 25 basis points Fed rate hike by June of 2022.
US inflation reading post the most significant jump In 30 years
In the US economic docket, the Consumer Price Index for October increased by 6.2%, on an annual basis, higher than the 5.4% number in September, above the 5.3% expectations by analysts. The Core CPI, which excludes food and energy items, rose by 4.6% for the same period, also above the 4.3% foreseen by the market. Prices in energy, shelter, food, and vehicles spurred the spike in the CPI. Also, inflation is broadening beyond areas associated with a reopening.
Meanwhile, the US bond yields rise, with the 10-year benchmark note advancing seven and a half basis points, up to 1.524%, while the US Dollar following the 10-year footsteps, rising 0.62%, currently at 94.59.
NZD/USD Price forecast: Technical outlook
The NZD/USD moved to the downside since the Asian Pacific session began, retreating from the daily top at 0.7130 towards 0.7100, breaking below the 200-day moving average (DMA), usually viewed as a bearish signal. However, a daily close below the 200-DMA could open the door for further losses. The first demand area would be the 50-DMA at 0.7063, followed by the 100-DMA at 0.7023.
On the other hand, if NZD/USD buyers reclaim the 0.7100 figure, it would open the door towards a renewed test of the 0.7130 resistance level, followed by the November 4 high at 0.7178.
- EUR/GBP trades flat and rangebound just under 0.8550, as broader macro themes steal the FX market’s focus.
- UK GDP data out on Thursday could reinfuse some volatility.
It’s been a tame session thus far for EUR/GBP, with today’s FX market focus largely on broader macro themes (like higher-than-expected US inflation) which have had little impact on the relative strength of the euro and pound sterling versus each other. Thus, trading conditions have been rangebound, with the pair going sideways within 0.8530-0.8560ish parameters. At present, the exchange rate is changing hands just to the south of the 0.8550 level and is flat on the day.
Things might pick up a little on Thursday with the release of the preliminary estimate of UK Q3 GDP at 0700GMT. Traders await the data to see if EUR/GBP’s recent pullback since rejecting its 200-day moving average in the 0.8580 region has any further legs. The 0.8560 level also seems to have formed a bit of a ceiling over the past two sessions and EUR/GBP might find current levels attractive to ride the pair back down to the weekly lows at the 21DMA around 0.8520.
- WTI prices have slipped in wake of a less bullish than hoped for US crude oil inventory report.
- WTI have slipped back to their 21DMA at $82.50.
Crude oil prices have turned lower in wake of the latest official weekly US crude oil inventory report. Front-month future prices of the American benchmark for sweet light crude oil, West Texas Intermediary or WTI, has fallen more than $1.0 since the report from above $83.50 to around $82.50, meaning losses on the day currently stand just above 1.0%. For now, WTI seems to be finding some support at its 21-day moving average at $82.50.
The latest crude oil inventory report from the US Department of Energy showed that headline crude oil stocks had risen by just over 1M barrels last week. Some market participants likely expected a draw after Tuesday’s private weekly API inventory data showed US crude oil stocks drawing over 2M barrels. Gasoline and Distillate stocks both saw larger than expected draws of 1.555M and 2.613M barrels respectively.
One factor that might also be weighing on oil prices is a pick-up in the US dollar following a much hotter than expected US Consumer Price Inflation report for October. US yields, particularly in the short-end, are up sharply as market participants upgrade near-term inflation and central bank interest rate forecasts and this is supporting the dollar versus (most of) its G10 peers. A stronger US dollar makes US crude oil (WTI) more expensive to the holders of foreign currencies.
But analysts/key crude oil market participants for the most part remain bullish on crude oil’s near-term prospects. According to Reuters, trading giant, Vitol Group's CEO Russell Hardy said on Tuesday that oil demand had returned to pre-pandemic levels and demand in the Q1 2022 could exceed 2019 levels. Hardy also said that any release of crude oil reserves by the Biden administration to address high energy costs would likely only have a short-term impact on the oil market.
Data released on Wednesday showed the annual inflation rate in the US in October reached the highest level since 1990. The breadth of price hikes continues to widen well beyond the industries most affected by the pandemic, according to analysts at Wells Fargo. They expect inflation to push even higher over the next few months, before starting to subside around the second quarter of next year.
Key Quotes:
“The onslaught of inflation continued in October, with the Consumer Price Index rising a hotter-than-expected 0.9%.Over the past year, inflation has risen 6.2%, which surpasses the 2008 peak and is the strongest one-year increase in prices since 1990. The breadth of price increases cannot be ignored and suggests any softening in the overall pace of inflation remains a ways off.”
“Goods inflation has been the primary contributor to the historically high inflation experienced this year. Goods inflation showed no signs of easing in October, with prices for goods excluding food and energy rising 1.0% in the month.”
“We expect to see the run of strong monthly prints to continue over the near term. More businesses than ever plan to raise prices, according to records dating back to 1973.”
“A return to levels consistent with the Fed's goal is unlikely be a story for 2022. Along with fairly resilient consumer demand and a tight labor market that looks set to keep the heat turned up on wages, inflation seems here to stay for quite a while.”
According to Reuters citing comments made by San Fransisco Fed President Mary Daly on Bloomberg Television, Daly pushed back against the notion that the Fed should act immediately to address inflation pressures, saying that it would be premature for the Fed to change its calculation on raising interest rates. Her comments come in wake of the latest US Consumer Price Inflation report for October, which showed the headline YoY rate surpassing 6.0% for the first time since 1990.
Further Comments
"Inflation is high, we have a challenge right now."
"This is a transitory period."
"High inflation is not expected to persist at these rates once Covid is behind us."
"Even though it's temporary, high inflation hurts."
"Higher inflation readings have my attention."
"The number of missing jobs also has my attention."
"We need an economy that's self-sustaining once we get through Covid."
"Historically we have been too bearish, and wrong, about labor force participation."
"Americans want to work, but they are constrained by covid-related issues."
"If we raise rates now, that could be quite premature."
"It could leave the economy short on both price stability and employment."
"Uncertainty requires us to wait and watch with vigilance."
"I expect inflation to moderate."
"Continuity of Fed policy does not depend on who is in Fed chair."
"It would be premature to start asking if we should quicken the taper."
"As (the) delta variant wears off, (I) expect economy to regain momentum."
"I'm optimistic but would not surprise me if growth ahead is more moderate than what we saw earlier in year."
"Fed would not be constrained by what other central banks are doing."
"Infrastructure spending might boost inflation in short term but lower it, and boost productivity, in long term."
- XAG/USD rallies as US inflation shoots through the roof, its most significant jump in 30 years.
- XAG/USD spiked $0.80 as news headlines crossed the wires.
- US 5-year real yields measurement falls from -1.85% to -1.941%, weighing on the US dollar.
Silver (XAG/USD) price spiked higher as the Bureau of Labor Statistics (BLS) revealed that the Consumer Price Index for October, a US measurement of prices paid by consumers, expanded by 6.2% – higher than the September 5.4% jump in inflation, and the largest since 1990. That said, the non-yielding metal has advanced almost 3%, trading at $25.01 at the time of writing.
XAG/USD reacted with a price jump of $0.80, from $24.20 to $25.00, once the news crossed the wires. The bounce in prices left behind September and October highs at $24.87 and $24.82, respectively, which could now act as support areas going forward.
US Consumer Price Index rose by 6.2%, the most significant reading since 1990
In the US economic docket, the Bureau of Labor Statistics (BLS) revealed that the Consumer Price Index (CPI) surged 6.2% on a year-over-year basis, up from 5.4% in September, leaving behind estimations of 5.3% by economists. Further, the Core CPI reading, which excludes volatile items like energy and food, expanded by 4.6% in the same period, higher than the 4.8% foreseen by the market.
Meanwhile, the 10-year US T-bond benchmark note rose almost seven basis points, recovering some of its weekly losses, sitting at 1.517%, underpinning demand for the greenback. The US Dollar Index, a measure of the buck’s value against its peers, advanced 0.67%, to currently trade at 94.59.
But why do silver prices keep getting higher? The answer is that real yields, the difference of interest rates minus inflation, are dropping. The US 5-year TIPS, real yields measurement, has fallen from -1.85% to -1.941%, the second-lowest reading since July 2021, per Reuters.
XAG/USD Price Forecast: Technical outlook
Daily chart
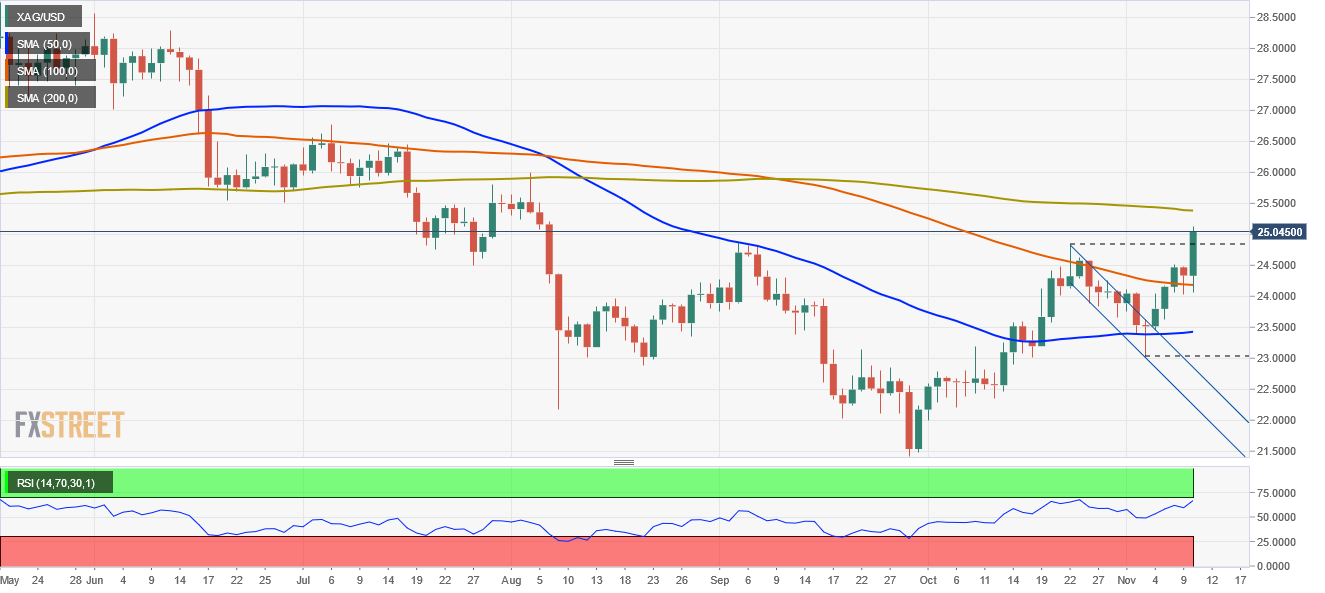
The white metal has a near-term upward bias, as witnessed by the shorter time-frame daily moving averages (DMA’s) below the spot price, but the 200-DMA sits at $25.38, which would be strong resistance for silver bulls to overcome. Despite the abovementioned, the Relative Strength Index (RSI) at 67 still has enough room left before reaching overbought conditions, indicating that XAG/USD could print another leg-up.
As mentioned in the previous paragraph, the 200-DMA at $25.38 would be the first resistance level in the outcome of another push higher. A breach above that level could open the door for the bulls to attack the $26.00 area, which would then expose the $27.00 figure to being broken.
On Thursday, the Bank of Mexico will have its monetary policy meeting. According to the Research Department at BBVA, Banxico will hike rates by 25bps to 5%. They consider it would be important for the central bank not to signal the possibility of a faster pace of tightening.
Key Quotes:
“A strong core inflation print and a further rise in 12-months ahead core inflation expectations will keep Banxico in a tightening mode.”
“We expect Banxico to revise upwards its headline inflation forecasts for 4Q21 and 1Q22 and we would not be surprised if one of the hawk members of the Board votes for a larger 50bp hike.”
“We think the majority of the Board will not vote for a larger hike. We think that a faster pace of tightening is not warranted and would risk and unwanted excessive policy tightening in 2022.”
“If Banxico hikes the policy rate by 25bp two more times by year end, it will take the rate close to the neutral estimated level with the Federal Reserve about to start the liftoff in late 2022. We think that it is a better strategy to avoid increasing rates faster.”
The Israeli shekel (ILS) has fought back against an aggressive Bank of Israel (BOI) foreign exchange intervention program and is currently stronger than pre-intervention levels, explained analyts at Wells Fargo. However, they see the shekel is due for a correction as renewed dollar strength and a new intervention program are likely, and should push the currency weaker over the coming months.
Key Quotes:
“Most of our currency-related models and frameworks identify the Israeli shekel as one of the least vulnerable and low volatility emerging market currencies. Our currency tools identify Israel as having strong underlying economic fundamentals and stable local politics, making the shekel somewhat insulated from any unforeseen shocks to global financial markets.”
“In our view, the shekel has overshot to upside and the currency is likely to experience a correction in the near future. We base this view on two factors: 1) broad U.S. dollar strength and 2) BOI policymakers initiating another FX intervention program.”
“We also believe the central bank will become increasingly worried about the overall strength of the shekel and will look to get more active in foreign exchange markets after the current intervention program officially ends.”
“Using prior levels as a guidepost, a USD/ILS exchange rate at ILS3.11 could be where BOI policymakers once again look to resist against the shekel getting much stronger.”
“The combination of renewed dollar strength and another BOI intervention should push the USD/ILS exchange rate weaker over the coming months. To that point, we expect the shekel to weaken back toward ILS3.20 by the beginning of Q2-2022.”
“Over time, we expect the shekel to once again gradually strengthen as markets focus on Israel's persistent current account surplus, stable politics and strong institutional framework.”
- USD/JPY has rallied sharply from Asia session lows under 113.00 and is testing its 21DMA at 113.80.
- A spike in US yields post-inflation data is widening US/Japan rate differentials and pushing the pair higher.
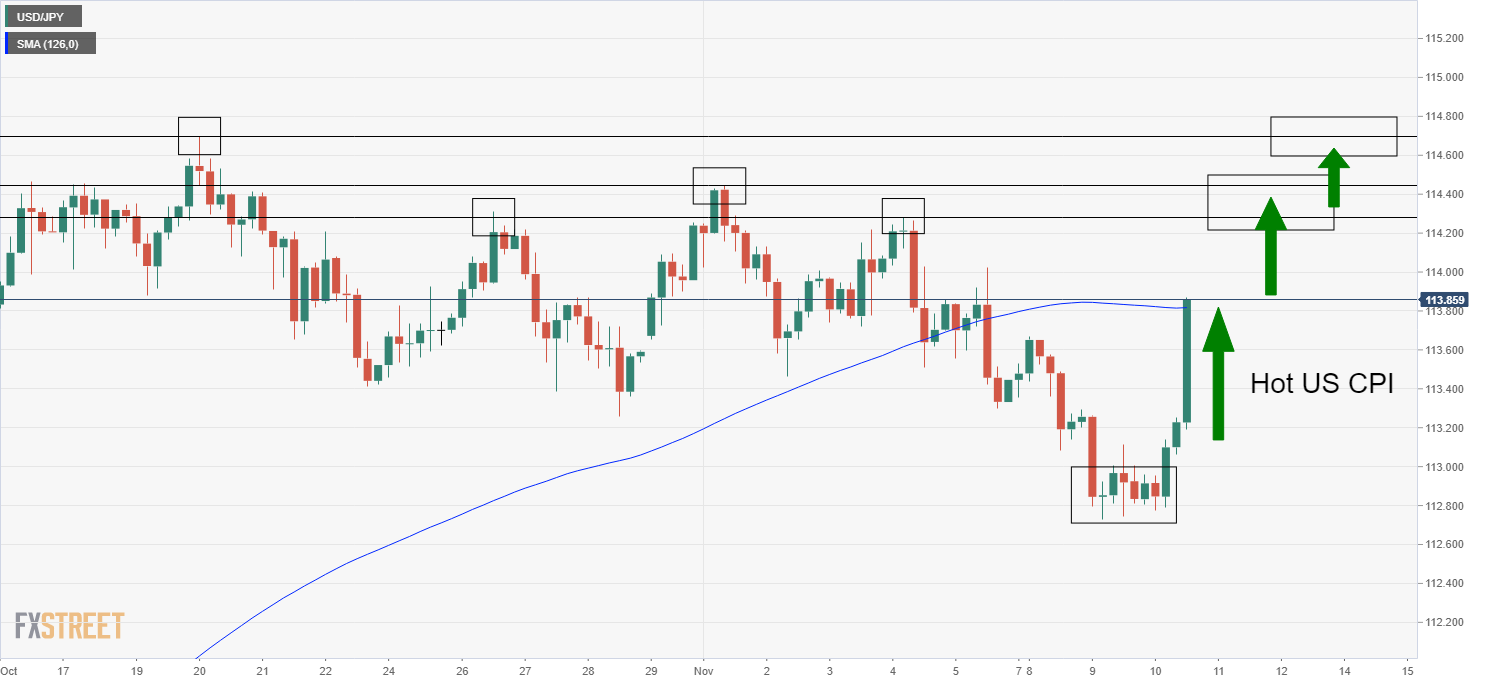
USD/JPY continues to recover from its earlier weekly lows under the 113.00 level and is now, in wake of a much hotter than expected US Consumer Price Inflation report, testing its 21-day moving average at 113.80. That means the pair is now trading about 0.8% higher on the day, its best one-day performance in a month.
The move is primarily being driven by a sharp rally in (nominal) US bond yields as traders up their bets that the Fed is more aggressive with rate hikes to combat inflation and as investors flee assets whose value is eroded by inflation (such as nominal bonds). 2-year yields are up 9bps to 0.50% and 5-year yields are up more than 10bps on the day to above 1.17%. That compares to a rally of just over 1bps in the 30-year yield. US yield curve flattening traders are betting on a combination of higher inflation/a more hawkish Fed response in the medium term (i.e. over the next up to five years), but are not significantly upgrading their long-term growth or inflation expectations.
Either way, higher yields and expectations for a more forceful Fed response to inflation has given US/Japan rate differentials a sizeable boost. USD/JPY is highly sensitive for rate differentials and is thus rallying as a result. As pressure builds on the Fed to drop its current stance that the spike in inflation is transitory, and thus doesn’t warrant a policy response, builds, traders should lookout for any signs that the bank might shift policy in a hawkish direction. Any hints of this would send short-end US yields even higher, put further upwards pressure on US/Japan rate differentials, and likely push USD/JPY back to annual highs.
If USD/JPY is able to break to the north of its 21DMA, this will open the door to a run at the 114.00 level and the recent highs just above it in the 114.20-114.40 region. Bullish technicians may be targetting an eventual move back to annual highs just above 114.60.
- US dollar mixed despite US data, DXY holds at daily highs
- Canadian dollar among top performers of the day.
The USD/CAD is falling modestly on Wednesday, with the Loonie among the few currencies to rise against the greenback. The pair bottomed at 1.2386 after the beginning of the American session, and during the last hour, it rebounded back above 1.2400.
The rebound of the pair took place as the US dollar recovered strength across the board. It is trading near 1.2420, still negative for the day but off lows. The greenback is resuming the upside supported by higher US yields.
Economic data from the US surprised with the CPI inflation rate reached the highest level since 1990. A different report showed initial jobless claims dropped to fresh pandemic lows.
Short-term outlook
The bias in USD/CAD still points to the downside. A recovery above 1.2450 would remove the bias, favoring a test of the weekly high at 1.2485. A consolidation below 1.2400 should strengthen the negative tone. The next support stands at 1.2365.
On the contrary, the daily chart shows USD/CAD rebounding from the 20-day moving average and holding a bullish perspective. The 200-day simple moving average at 1.2475 continues to curb the upside.
Technical levels
Developing story...
- US Inflation figures rose at the fastest annual pace since 1990.
- XAU/EUR: Broke the €1,600, once the headline crossed the wires, as investors flew to gold as an inflation hedge, as real-yields extend its losses.
- XAU/EUR: Two resistance levels lie on the way towards €1,700.
Gold spot against the Euro, rallies 1.42%, trading around €1,605 during the New York session at the time of writing. Factors like US inflation figures rising towards the highest readings since 1990 and a dovish European Central Bank (ECB) spurred a €20 jump on Wednesday’s price action. Furthermore, the market sentiment is in a risk-off mood, which gained follow-through once US Inflation figures were known.
US Consumer Price Index increased by 6.2%, the largest reading since 1990
In the US economic docket, the awaited inflation figures were unveiled. The Bureau of Labor Statistics (BLS) revealed that the Consumer Price Index (CPI) surged 6.2% on a year-over-year basis, up from 5.4% in September, leaving behind the 5.3% estimations by economists. Further, the Core CPI reading, which excludes volatile items like energy and food, expanded by 4.6% in the same period, higher than the 4.8% foreseen by the market.
The US real yields plummeted once the figure crossed the wire, with the US 5-year TIPS, real yields measurement dropping from -1.85% to -1.941%, the second-lowest reading since July 2021, per Reuters.
XAU/EUR Price Forecast: Technical outlook
Daily chart
-637721528120124142.png)
The yellow-metal rose sharply through the €1,600 roof when the headline crossed the wires, leaving the January 5 high at €1,591 previous resistance level behind, which will act as support. Additionally, the Relative Strength Index is at 72, aims higher, while the daily moving averages (DMA’s) remain well below the spot price, supporting the upward bias.
The first resistance level would be November 9, 2020, high at €1,652. A breach of the former would expose the August 8, 2020, high at €1,689, and then the psychological €1,700 figure.
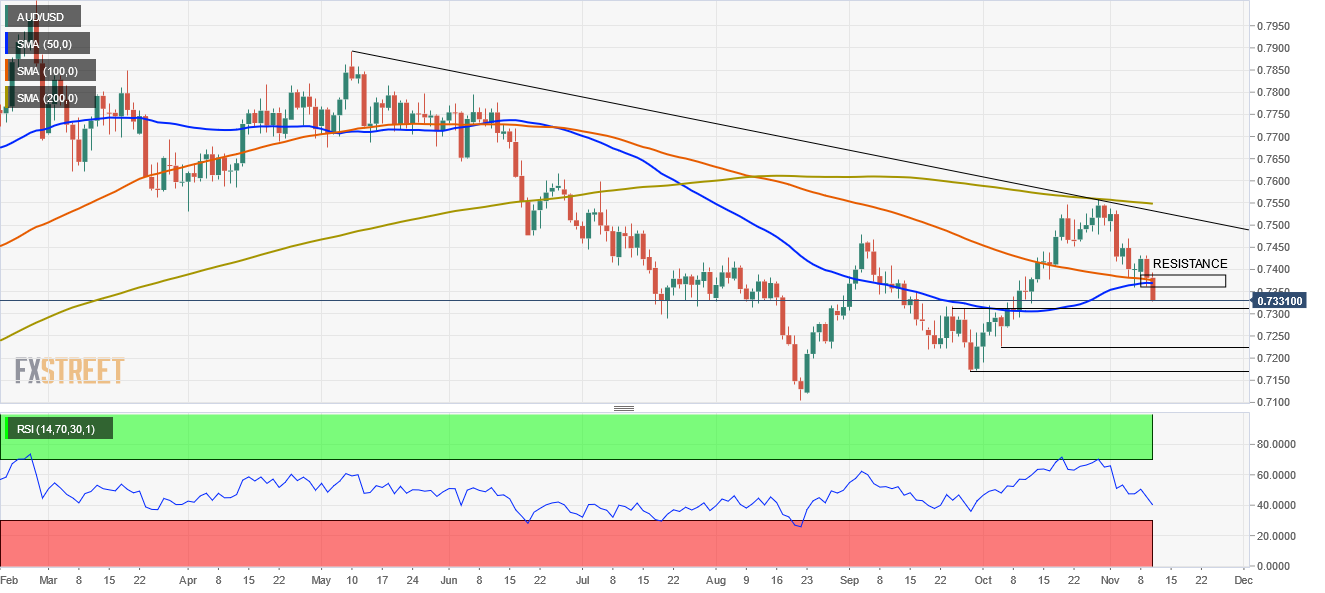
AUD/USD has trended lower since the start of the month having failed to break above the 200-day moving average (DMA) now at 0.7549. Today, the aussie is testing the 100-DMA at 0.7386 and economists at Rabobank expect the pair to fall to the 0.73 level.
Declining iron ore prices weighs on the aussie
“A close below the 100-DMA at 0.7386would strengthen the case for a move towards 0.73.”
“AUD/USD has extended the losses made in the wake of the November 2 RBA policy meeting with further falls in the prices of iron ore and weak technical indicators undermining confidence in the AUD.”
“We retain our three-month AUD/USD target of 0.73.”
Economists at Deutsche Bank believe that the US dollar is set to enjoy a more favourable environment by the end of 2021. Therefore, they have lowered EUR/USD year-end forecast to 1.16.
European basic balance very weak
“We modestly upgraded our dollar forecasts for year-end: persistently stagflationary dynamics – lower growth but higher inflation expectations and a hawkish Fed bias – leave little room for a dollar downtrend.”
“In Europe, there has been a huge decline in real yields on the back of persistent ECB dovishness. The European inflow story has also proven a disappointment. Hence, we have a lower year-end EUR/USD forecast of 1.16 with downside risks.”
GBP/USD drops on renewed Brexit-related concerns. Economists at Scotiabank expect the cable to test the low-1.34s after initial support around the 1.3485 mark.
Tensions with the EU over Northern Ireland cloud the near-term outlook for the GBP
“With the UK planning to abandon parts of the accord that regulate the free movement of goods between Northern Ireland and Great Britain, the EU is considering retaliatory measures that could eventually include ripping up the free-trade agreement signed in late-2020. For now, we think that is a minimal risk but the probability of this scenario and continued tensions with the EU over the next few months will act as a weight on the GBP.”
“Sterling is testing the 1.35 support area as it extends its losses from yesterday’s test of 1.36. The figure area should halt the steep slide in the GBP, but technical factors are aligned for a re-test of the low 1.34s – after intermediate support at ~1.3485 and the mid-figure zone.”
“Firm resistance is 1.3600/10 followed by the mid-figure area, but the GBP will have to push through 1.37 (50-day MA at 1.3688) to meaningfully negate downward momentum.”
- Major equity indexes in the US push lower on Wednesday.
- Defensive sectors edge higher after US inflation data.
- Technology shares suffer heavy losses after the opening bell.
Wall Street's main indexes opened in the negative territory on Wednesday with the October inflation data weighing on risk sentiment. As of writing, the S&P 500 Index was down 0.46% on the day at 4,663, the Dow Jones Industrial Average was losing 0.1% at 36,295 and the Nasdaq Composite was falling 1.05% at 15,711.
Reflecting the souring market mood, the CBOE Volatility Index, Wall Street's fear gauge, is up more than 3%.
The US Bureau of Labor Statistics reported on Wednesday that the Consumer Price Index (CPI) jumped to its strongest level since 1990 at 6.2% in October from 5.4% in September.
Among the 11 major S&P 500 sectors, the risk-sensitive Technology Index is down 1%. On the other hand, the defensive Real Estate and Utilities indexes push higher after the opening bell.
S&P 500 chart (daily)
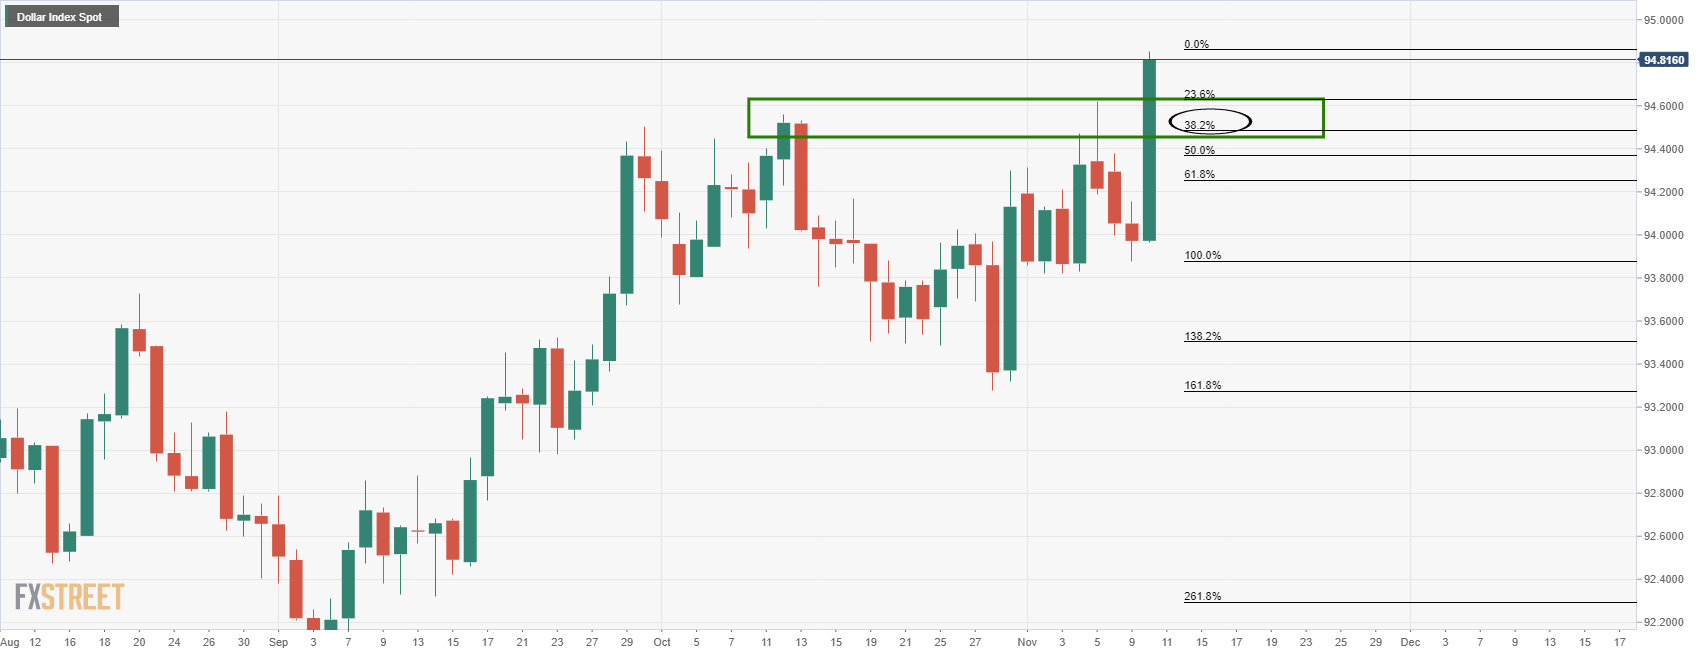
- DXY edges higher to 3-day highs near 94.45 on Wednesday.
- US CPI surprised to the upside in October at 6.2% YoY.
- Weekly Claims came just below expectations at 267K.
The US Dollar Index (DXY), which gauges the greenback vs. a bundle of its main rival currencies, keeps the bid tone unchanged above the 94.00 mark on Wednesday.
US Dollar Index up on yields, CPI
The resurgence of the buying interest in the greenback pushed the index further north of the 94.00 hurdle with some conviction midweek, helped at the same time by the rebound in US yields along the curve and higher-than-expected inflation figures.
In fact, the headline CPI rose 6.2% in the year to October, while the Core CPI gained 4.6% vs. the same month of 2020. Further results in the docket showed Initial Claims rising by 267K in the week to November 6.
From the US cash markets, yields of the 2y note extend the correction to the 0.50% area, while yields of the 10y benchmark note gradually approach the key 1.50% yardstick.
US Dollar Index relevant levels
Now, the index is gaining 0.16% at 94.14 and a break above 94.62 (2021 high Nov.5) would open the door to 94.74 (monthly high Sep.24 2020) and then 95.00 (round level). On the flip side, the next down barrier emerges at 93.87 (weekly low November 9) seconded by 93.48 (55-day SMA) and finally 93.27 (monthly low October 28).
- AUD/USD has reversed kneejerk losses in wake of US inflation data and is now in the green above 0.7380.
- US medium-term inflation expectations have shot higher, calling the Fed’s dovish stance into question.
AUD/USD saw a kneejerk move lower in wake of the latest US Consumer Price Inflation (CPI) report, which showed price pressures were much higher than expected in the US in October. The pair initially dropped from the 0.7360s to as lows as 0.7340. However, in the subsequent minutes, the pair has seen a more than 40-pip recovery to fresh session highs in the 0.7380s, where it currently trades higher on the day by about 0.15%.
That could is likely because in response to the latest US inflation numbers, which seem to have triggered fears that the Fed is going to let inflation get out of control, the demand for inflation protection in US markets has surged. The US 5-year TIPS yield (a bond which offers inflation protection) has tanked 10bps on the day to its lowest levels since early August under -1.9%. Thus, the decline in US real yields is seemingly helping AUD/USD as it pushes real rate differentials in favour of AUD.
US inflation expectations becoming de-anchored
Nominal (as in, not inflation-protected) US 5-year bond yields have surged 8bps to above 1.15%. That implies a roughly 18bps rise in US 5-year break-even inflation expectations on the day to, as calculated by subtracting the 5-year TIPS (real) yield from the 5-year nominal yield. Indeed, according to Reuters market data, 5-year US breakevens are currently at 3.14%, their highest since the 5-year TIPS began trading (and the breakeven could start to be calculated) in 2004.
Surging medium-term US inflation expectations to levels well beyond the Fed’s 2.0% inflation seriously undermine the Fed’s current stance that inflationary pressures are “transitory” and set to fade in Q2/3 2022 and that, therefore, the bank patiently hold interest rates at close to zero as it waits for a full labour market recovery. In response to the data, USD STIR markets have been aggressively upping bets for Fed rate hikes in 2022; December 2022 eurodollar futures have dropped 12bps on the day from 99.25 (less than 60bps of implied policy tightening by the end of 2022) to 99.12 (more than 70bps of implied tightening by the end of 2022).
The fact that the US dollar is not strengthening on these hawkish Fed bets may reflect expectations that the Fed will respond to inflation too late and thus not be able to bring inflation back to the bank’s 2.0% target in the medium term. That erodes the real value of USDs versus other currencies where inflation isn’t as high and also keep’s US real yields suppressed.
EUR/USD slides on warning over German government finances. Accordingly, economists at Sotiabank expect the eurozone economy to lag behind its peers, weakening the common currency.
Germany's government finances are in a critical state
“The German audit office found that the government’s finances are in a ‘critical state.’ The auditor’s report means that the incoming SPD-led government may face resistance to turning on the spending taps over 2022 – thus delaying the country’s, and the Eurozone’s, economic recovery.”
“We think the Eurozone’s economic underperformance will be a key driver of EUR losses against the USD over the coming year to decline into the low 1.10s (our end-2022 forecast is 1.12).”
“We do not foresee an ECB hike until late-2023 at the earliest if everything goes as planned – including continuing fiscal stimulus.”
Australia will report its October employment data on Thursday, November 11 at 00:30 GMT and as we get closer to the release time, here are the forecasts by the economists and researchers of five major banks. The country is expected to have added 50K new jobs after losing 138K positions in September. The Unemployment Rate is expected to have ticked higher, from 4.6% to 4.7%, although the Participation Rate is seen improving from 64.5% to 64.8%.
ANZ
“We expect employment to rise 50K ahead of the reopening but the unemployment rate to increase to 4.8%.”
Westpac
“Our -50K forecast is balancing the start of a recovery in NSW vs ongoing lockdown drags in Vic. Risks are to the upside. We expect to see 0.2ppt drop in participation to 64.3% which will result in a 40K drop in the labour force, enough to limit the rise in unemployment to just 0.1ppt (rounded) to 4.7%.”
BBH
“A gain of 50K is expected vs. -138K in September, as the economy begins to reopen. The unemployment rate is expected to rise two ticks to 4.8%, suggesting little risk of accelerating wage pressures right now. No wonder the RBA’s Statement of Monetary Policy underscored the likelihood that lift-off won’t be seen until 2024. Next policy meeting is December 7 and no change in policy is expected then.”
SocGen
“We expect a significant rebound in employment numbers for the month of October (+80K), as the economy reopened in the two major cities of Sydney and Melbourne. However, the unemployment rate is likely to rise a bit (4.8%) despite the recovery in employment, as the participation rate will probably show a sizeable increase (65%). In other words, the number of job seekers will rise faster than the number of jobs. Strong job market recovery from the Delta outbreak-driven damage is likely to continue into 2022.”
Citibank
“Employment (Citi: +48.1K, previous: -138K); Unemployment Rate (Citi: 4.7%, previous: 4.6%); Participation Rate (Citi: 64.8%, previous: 64.5%). Volatility in the labour force survey is expected to persist in October, as NSW began reopening at the start of the month, VIC following towards month’s end. We expect employment to rise in October. The pickup in the participation rate is expected to offset the increase in job gains. While uncertainty persists around the headline labour force statistics, We are more certain of the fact the number of hours worked has troughed, and may likely improve further in October with both locked down states reopening.”
See – Australian Employment Preview: A positive surprise or too much optimism?
The S&P 500 has entered a short-term breather after rising sharply again last week. But as the the 4750 level is now within reach, analysts at Credit Suisse believe that an overshoot to 4875 is increasingly likely.
Support remains seen at 4663/51 initially
“S&P 500 remains only slightly below our 4741/50 core Q4 objective, as well as confirmed trend resistance from April 2021. We expect this pause to persist over the next couple of sessions given the importance of this resistance, however post this phase, we believe that the top of our typical extreme zone, which is now seen at 4875, is increasingly likely to be achieved before year-end, due to the strong momentum observed within US equities.”
“Both short-term RSI and MACD momentum are at very strong levels, whilst medium term momentum is accelerating, which reinforces the case for a further ‘melt-up’ into year-end.”
“Support remains seen at 4663/51 initially, before 4627/20 and then 4589/82, which ideally holds to keep the immediate upside bias. A break can see a deeper corrective pullback, however this is certainly not our base case.”
- AUD/USD dropped to near one-month lows in reaction to stronger US CPI print.
- The downtick was bought into amid some repositioning ahead of Aussie jobs data.
- The risk-off impulse, hawkish Fed expectations should cap the upside for the pair.
The AUD/USD pair quickly reversed the US CPI-led fall to near one-month lows and was last seen trading with only modest intraday losses, around the 0.7365-70 region.
The pair added to the previous day's heavy losses and witnessed follow-through selling for the second successive day amid resurgent US dollar demand on Wednesday. The downward trajectory extended through the early North American session following the release of hotter-than-expected US consumer inflation figures.
In fact, the headline CPI rose 0.9% MoM in October – marking the largest advance in four months – and the yearly rate accelerated to 6.2% or the most since 1990. Adding to this, the annual Core CPI (excluding volatile food and energy prices) increased 4.6% as against the expectation for a steady reading of 4%.
The data added to concerns about persistent inflationary pressures and reinforced speculations about an early policy tightening by the Fed. This, in turn, acted as a tailwind for the US Treasury bond yields. Apart from this, a softer risk tone benefitted the safe-haven USD and weighed on the perceived riskier aussie.
The AUD/USD pair to an intraday low level of 0.7340, though the slide was quickly bought into as the markets have been pricing in the possibility of a Fed rate hike move in 2022. Investors also prefer to wait for a fresh catalyst from Thursday's release of the Australian jobs report before placing fresh directional bets.
Nevertheless, a sustained break/acceptance below 100-day SMA favours bearish traders and supports prospects for an extension of the recent downward trajectory. Hence, the attempted recovery might still be seen as a selling opportunity and runs the risk of fizzling out rather quickly near the 0.7400 round-figure mark.
Technical levels to watch
More and more stories are emerging on the “French Trump”, Éric Zemmour. How will markets react if Eric Zemmour starts gaining even further momentum in polls? Economists at Nordea believe that markets will position for “doomsday” in French assets into the election, which will be reversed quickly after the actual election.
The French election matters for positioning
“French bonds sold-off markedly versus peers into the election in 2017 when Marine Le Pen carried momentum into the election. This goes to show that ‘fearmongering’ in the media actually works to scare of positioning, why we would envisage a similar or even larger positioning effect should the media truly start to believe that there is a risk of Eric Zemmour winning the presidential outing.”
“The EUR will likely suffer versus peers from such a positioning flow (due to Japanese and US investors closing down French positions), while French-German spreads will widen and moreover we could see a further tendency towards intra-European haven seeking with EUR/CHF, EUR/DKK and EUR/SEK under downside pressure should Zemmour’s current polling trends intensify. Ultimately, these positioning trends will likely reverse immediately after the second election round, even if Zemmours wins, but we will not get there without substantial fearmongering ahead of it.”
“We are yet to see any France negative flows, why the story is most likely still non-consensus.”
- Spot gold has surged to fresh multi-month highs in the $1840s after much higher-than-expected US inflation figures.
- The YoY rate of headline inflation rose to 6.2%.
Spot gold (XAU/USD) prices have spiked higher in response to the latest US Consumer Price Inflation (CPI) report. Prior to the data release, XAU/USD was just under $1828, but it now trades close to the $1850 mark, a level likely being targetted by short-term bullish speculators and with on-the-day gains of about 0.9%. Spot prices are up around 1.2% from earlier session lows around $1823.
Crucially, the recent surge higher in spot gold prices has taken the precious metal above a key area of resistance and to its highest levels since June. Over the summer months, spot prices had been unable to break beyond the $1835 level, but it seems this level has now been busted. Any retracement back towards the mid-$1830s may be used as a buying opportunity for gold bulls.
Hot US Inflation
The YoY rate of headline CPI rose to 6.2% in October (expected was 5.8%) from 5.4% in September, amid a much faster than expected MoM increase of 0.9% (expected was 0.6%). Core measures of inflation also came in higher than expectations, with the YoY rate rising to 4.6% from 4.0% in September, and the MoM rate accelerating to 0.6% from 0.2% in September.
The data has put significant upwards pressure on US yields, particularly at the front end, with the 2-year yield current up nearly 8bps on the day above 0.48% and the 5-year yield up about 7bps to above 1.14%. The rise in yields is being driven by a sharp surge in inflation expectations. This explains the sharp rise in gold – demand for inflation hedges, which could also explain why Bitcoin is now up 1.5% on the day.
- EUR/USD recedes further and retests 1.1530 on Wednesday.
- US October CPI rose 6.2% YoY, Core CPI gained 4.6% YoY.
- US Initial Claims rose by 267K from a week earlier.
Further upside in the greenback forced EUR/USD to drop and clinch new weekly lows near 1.1530 midweek.
EUR/USD offered on US data
EUR/USD extends the daily pullback in response to the solid performance by the greenback, in turn underpinned by the rebound in US yields and higher-than-expected inflation.
On the latter, US inflation tracked by the CPI rose at an annualized 6.2% in October and 0.9% inter-month. Core consumer prices also rose above expectations at 4.6% from a year earlier and 0.6% vs. the previous month. Additional US data saw weekly Claims rising by 267K, just a tad below estimates.
The persistent move lower in spot exclusively follows the rebound in the buck amidst the recovery in US yields along the curve.
EUR/USD levels to watch
So far, spot is down 0.44% at 1.1541 and next up faces the barrier at 1.1616 (monthly high Nov.4) followed by 1.1675 (55-day SMA) and finally 1.1692 (monthly high Oct.28). On the other hand, a break below 1.1513 (2021 low Nov.5) would target 1.1495 (monthly high Mar.9 2020) en route to 1.1422 (monthly high Jun.10 2020).
- Resurgent USD demand prompted fresh selling around GBP/USD on Wednesday.
- Hotter-than-expected US CPI, the risk-off impulse further underpinned the USD.
- Brexit woes, dovish BoE weighed on the GBP and support prospects for further losses.
The GBP/USD pair added to its intraday losses and weakened further below the key 1.3500 psychological mark in reaction to hotter-than-expected US consumer inflation figures.
Following a brief consolidation earlier this Wednesday, the GBP/USD pair met with fresh supply and extended the previous day's retracement slide from levels beyond the 1.3600 round-figure mark. The downfall was exclusively sponsored by a strong pickup in demand for the US dollar, which drew support from rebounding US bond yields and a softer risk tone.
Intraday, USD buying picked up pace following the release of the latest US inflation figures, which showed that the headline CPI rose 0.9% MoM in October as against an uptick to 0.5% anticipated. Adding to this, the yearly rate jumped to 6.2%, while the core CPI which excludes food and energy prices also surpassed market expectations by a big margin.
The data further fueled speculations that the Fed would be forced to adopt a more aggressive policy response to contain the continuous rise in inflationary pressures. This, in turn, acted as a tailwind for US Treasury bond yields, which continued underpinning the greenback and dragged the GBP/USD pair lower.
Meanwhile, worries that the UK government will trigger Article 16 of the Northern Ireland Protocol, along with the Bank of England's dovish decision last week acted as a headwind for the British pound. This was seen as another factor that contributed to the GBP/USD pair's decline below the 1.3500 mark, setting the stage for additional losses.
Technical levels to watch
According to the latest report from the US Department of Labor (DoL), there were 267,000 initial claims for US unemployment benefits in the week ending on the 6th of November. That was 2,000 more than expected, but down 4,000 from the week prior and, according to the DoL, "is the lowest level for initial claims since March 14, 2020 when it was 256,000". Last week's initial jobless claims number was revised higher to 271,000 from 269,000.
Continuing Jobless Claims unexpectedly rose to 2.16M from 2.105M in the week ending on 30 October, versus expectations for a fall to 2.095M. The four-week average initial jobless claims number fell to 278,000 from 285,250 the week prior. The insured unemployment rate remained unchanged at 1.6% as of the week ending on 30 October.
Market Reaction
The US dollar saw some kneejerk strength, though this likely had more to do with the latest US Consumer Price Inflation report, which showed inflation in October much higher than expected.
Inflation in the US, as measured by the Consumer Price Index (CPI), surged to 6.2% on a yearly basis in October from 5.4% in September, the US Bureau of Labor Statistics reported on Wednesday. This print surpassed the market expectation of 5.3% by a wide margin.
Further details of the publication revealed that the annual Core CPI, which excludes volatile food and energy prices, rose to 4.6% in the same period, compared to the market expectation of 4%.
On a monthly basis, the CPI and the Core CPI arrived at 0.9% and 0.6%, respectively.
Market reaction
With the initial reaction, the US Dollar Index shot higher and was last seen rising 0.43% on the day at 94.38.
- WTI has slipped back from two-week highs, after nearly hitting $85.00.
- Bullish inventory data and an easing of fears that the US will release crude oil reserves has supported prices recently.
Front-month futures of the American benchmark for sweet light crude oil, West Texas Intermediary or WTI, nearly managed to hit the $85.00 level during Wednesday Asia Pacific trading hours. In doing so, prices posted a two-week high, though fell about 50 cents short of hitting annual highs set back on 25 October. Since the end of the Asia session and ahead of the start of US trade, oil prices have pulled back a bit, with WTI currently consolidating in the mid-$83.00s, down about 50 cents or 0.6% on the day.
Prices were supported heading into the Wednesday Asia Pacific session by two main factors. Firstly, the latest weekly private inventory report showed a surprise draw of 2.5M barrels in US crude oil stocks. Oil traders look to the release of official US weekly inventory numbers at 1530GMT on Wednesday for confirmation.
Secondly, the monthly oil market report from the US Energy Information Agency (EIA) on Tuesday was seen as lessening the likelihood that the Biden administration will release crude oil reserves from the Strategic Petroleum Reserve in order to address the recent run higher in energy costs. The EIA report forecast a modest pullback in gasoline prices in 2022 to below (on average) $3.0 per gallon, thus easing concerns in the administration about further energy inflation.
Despite the pullback in prices on Wednesday, which comes amid a broader deterioration in risk appetite (US index futures are a little lower in pre-market trade ahead of the release of US inflation numbers), analysts remain bullish on the oil complex. Oil trading giant Vitol Group's CEO Russell Hardy on Tuesday said that demand could exceed 2019 levels in Q1 2022 and that “the possibility of a spike to $100 per barrel is clearly there”.
EUR/USD remains in a range for now above 1.1495/93 – the March 2020 high and 50% retracement of the 2020/2021 bull trend. Nevertheless, a major top remains in place and analysts at Credit Suisse still look for a resumption of the core downtrend, with scope for 1.1290 over the medium-term.
EUR/USD remains in a range above key support at 1.1495/93, with a break increasingly close
“EUR/USD remains in a short-term range for now after the pair has repeatedly been floored above major support at 1.1495/93. Nevertheless, our bias stays lower and we believe a breakdown is increasingly imminent ahead of US CPI today, with the recent decisive rejection of key resistance from its falling 55-day average (and downtrend from June) at 1.1666/95 still the key technical feature.”
“A major top also remains in place, reinforcing the case for a resumption of the core downtrend and a clear break below the 1.1524/13 October lows. Below here and 1.1495/93 would trigger a move to support then seen next at 1.1377/70, before the 61.8% retracement at 1.1300/1.1290, where we would expect to see another pause.”
“Mid-range resistance stays at 1.1609/18, which ideally caps over CPI today. We shall maintain an immediate tactical bearish bias though whilst below 1.1693/95.”
Gold needs to go back on the radar as it is probing its downtrend at $1834/35. A break above here would clear the way for a deeper recovery to the $1917 May 2021 peak, Karen Jones, Team Head FICC Technical Analysis Research at Commerzbank, reports.
XAU/USD is probing the 2020-2021 downtrend at $1835
“Gold is probing key resistance at $1834/35, which represents the highs since July and the 2020-2021 downtrend. While this may prompt a small pullback, this is indicated to remain shallow and should ideally remain contained by the $1790/83 band of moving averages.”
“A close above $1835 should be enough to regenerate upside interest for a further recovery to $1856/57 4th June low and the $1917 May 2021 peak.”
“We have minor support at $1759 ahead of the $1721 September low. Below $1721, support is found at $1679/$1677, and is reinforced by the $1670 June 2020 low.”
See – Gold Price Forecast: XAU/USD to enjoy a deeper recovery to $1917 on a breach of $1834/36 – Credit Suisse
- EUR/USD navigates fresh 3-day lows near 1.1550.
- A drop to the YTD low at 1.1513 remains on the cards.
EUR/USD fades three consecutive daily advances and recedes to the mid-1.1500s on Wednesday.
The inability of spot to break above recent peaks just above 1.1600 the figure has prompted sellers to return to the markets. Against that, a deeper decline could put another test of the YTD low at 1.1513 back on the radar in the short-term horizon ahead of the March 2020 high at 1.1495.
In the meantime, the near-term outlook for EUR/USD is seen on the negative side below the key 200-day SMA, today at 1.1882.
EUR/USD daily chart
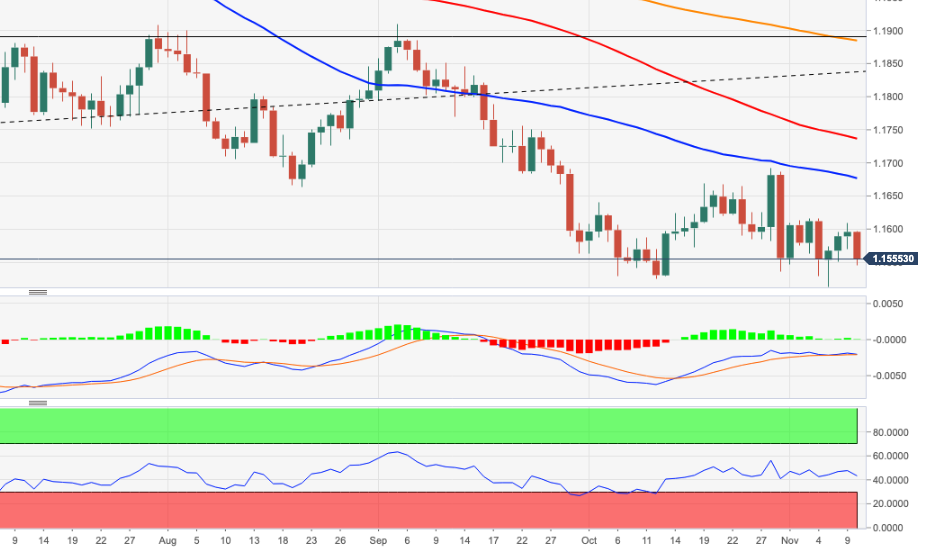
- DXY reverses the recent weakness and breaks above 94.00.
- Further north comes the 2021 peaks beyond 94.60.
DXY manages to regain some buying pressure and advances past the 94.00 yardstick on Wednesday.
If the upside impulse gathers extra steam, then there are no hurdles of note until the 2021 high at 94.62 recorded on November 5. A move above this level is expected to target the September 2020 high at 94.74 ahead of the round level at 95.00.
Looking at the broader picture, the constructive stance on the index is seen unchanged above the 200-day SMA at 92.09.
DXY daily chart
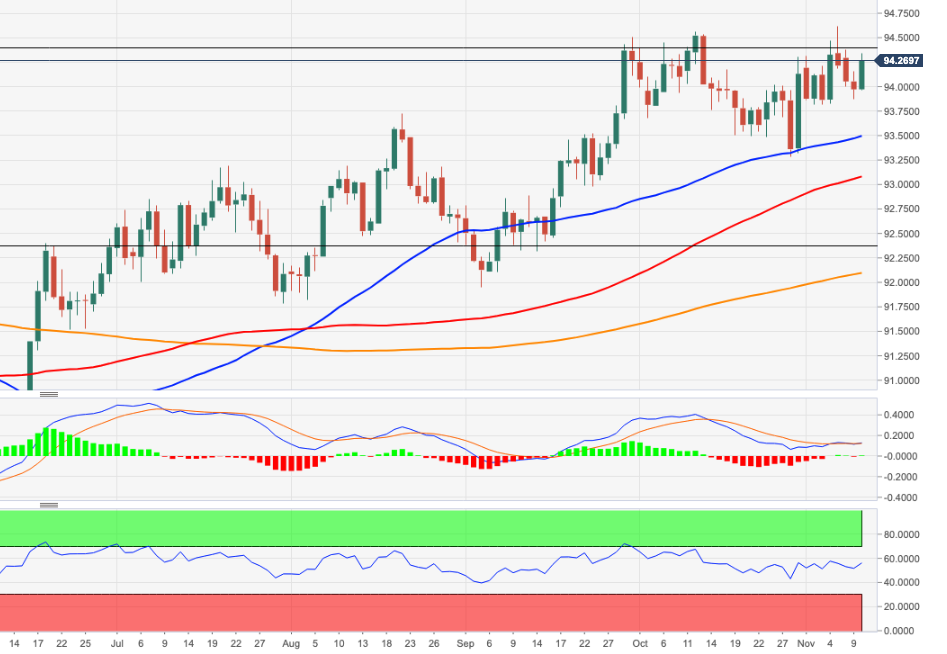
- EUR/USD has slipped back under 1.1600 as US inflation data looms.
- The pair already failed on three attempts to break above the 1.1600 level this month, which may be a bearish sign.
EUR/USD has been under selling pressure in recent trade and recently broke to the south of the 1.1550 level. The pair is currently down about 0.4% on the day and is over 0.5% lower than the highs printed earlier in the week of above the 1.1600 level. EUR/USD has now failed on three distinct occasions for far to sustainably break above the 1.1600 level of the 21-day moving average, which on Wednesday resides at pretty much bang on 1.1600. This seems to have been taken as a bearish signal.
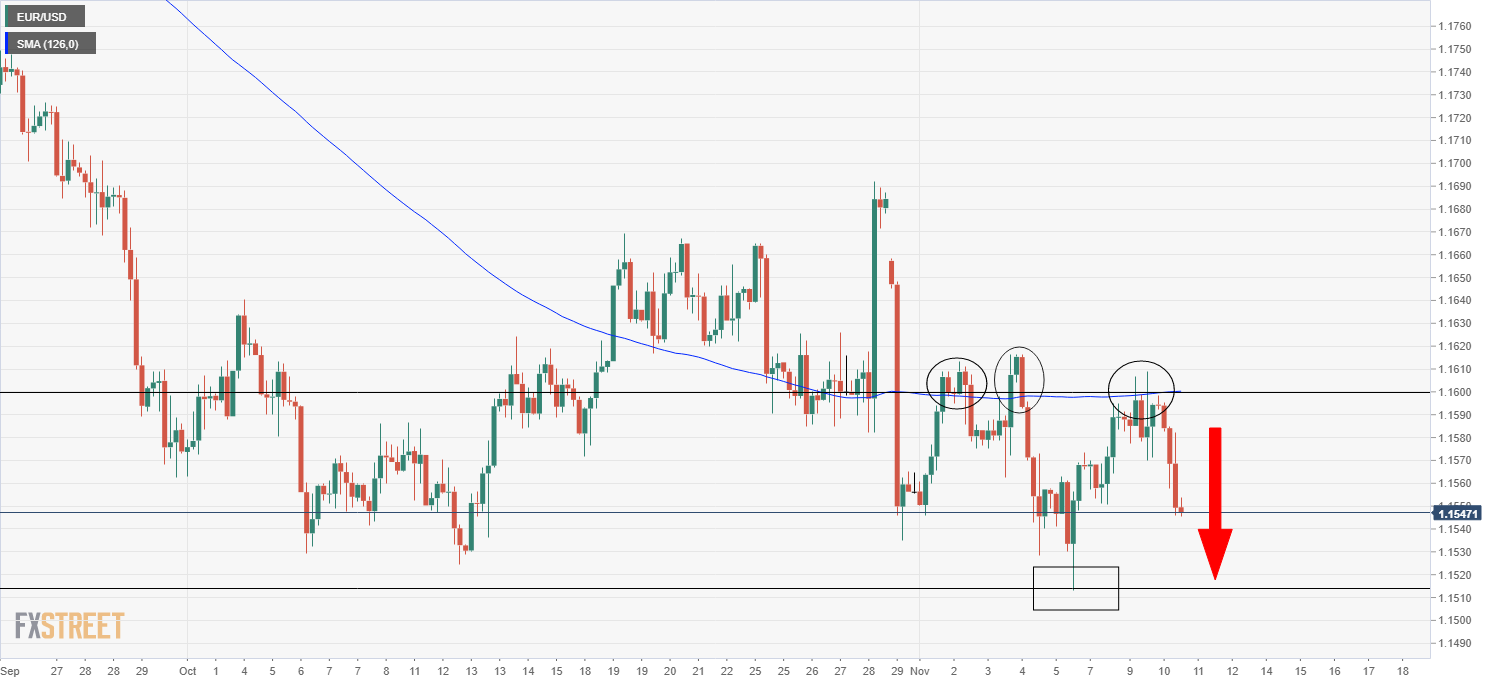
Weakness in the EUR/USD comes amid a broad recovery in the US dollar (the DXY is looking to snap a three-day losing streak), which is benefitting from a somewhat risk-off/cautious tone to macro trading conditions. Sentiment during Asia trade was weighed by concerns about inflation after Chinese PPI hit its highest levels in 26 years and amid concerns about the Chinese property sector with developer Evergrande potentially set to miss a $148.5M bond payment due on Wednesday. Sharp downside was also seen in the shares of other developers (Fantasia shares opened for the first time in six weeks and dropped 50% with the company saying it may not be able to honour all debt obligations).
A pick-up in US yields (2Y yield +4.5bps to back above 0.40% and 10Y yield +3bps to around 1.475%) ahead of the release of the October US Consumer Price Inflation report at 1330GMT is also helping the dollar. European yields are more subdued, thus, EUR/USD rate differentials have on Tuesday moved in the dollar’s favour. Meanwhile, the pair has broadly ignored the release of the final German CPI report for October earlier in the session, which came in as expected (headline inflation is running at 4.5% YoY).
EUR/USD bears will be eyeing a test of the recent sub-1.1520 year-to-date lows in case that Wednesday’s US inflation numbers come in hotter than expected. The headline rate of CPI is set to rise to 5.8% in October from 5.4% the month before amid higher energy and used car prices. Traders should look out for any evidence of a broadening of inflationary pressures, such as in the cost of shelter, which accounts for about 40% of the core CPI index. A move above 6.0% YoY would undermine the Fed’s hands-off approach to inflation and could see USD STIR markets bring forward bets on when the Fed will hike rates.
US CPI Overview
Wednesday's US economic docket highlights the release of the critical US consumer inflation figures for October, scheduled later during the early North American session at 13:30 GMT. The headline CPI is expected to edge higher to 0.5% during the reported month from the 0.4% rise recorded in September. The yearly rate is anticipated to ease a bit to 5.3% in October from 5.4% previous, matching the biggest monthly gains since August 2008. The core CPI, which excludes food and energy prices, is projected to hold steady at 4.0% in October from a year ago, still well above the Fed's average annual 2% target.
According to analysts at ING: “This week’s CPI data is likely to show a re-acceleration in annual inflation to 5.8% for the headline rate (the highest since December 1990) and to 4.4% for core (ex-food and energy). Surging housing costs, labour costs, energy costs and second-hand car prices are likely to mean headline inflation then pushes above 6% in December, with core inflation moving above 5%.”
How Could it Affect EUR/USD?
A stronger print will reinforce market expectations that the Fed would adopt a more aggressive policy response to contain the faster than anticipated rise in inflationary pressures. This should result in higher US Treasury bond yields and a stronger US dollar. Conversely, a softer print – though seems unlikely – might prompt some selling around the greenback, though the risk-off impulse in the markets should help limit deeper losses. This, in turn, suggests that the path of least resistance for the EUR/USD pair is to the downside.
Meanwhile, Eren Sengezer, Editor at FXStreet, offered a brief technical outlook for the EUR/USD pair: “The Relative Strength Index (RSI) indicator on the four-hour chart fell below 50 in the early European session on Wednesday, suggesting that sellers are trying to dominate the pair's action.”
Eren also outlined important technical levels to trade the major: “As of writing, the pair was testing the 1.1580/70 (50-period SMA, static level) support area and additional losses could be witnessed if this area turns into resistance. The next target on the downside is located at 1.1530 (static level) ahead of 1.1500 (psychological level).”
“On the flip side, the first hurdle aligns at 1.1600, where the 100-period and 200-period SMAs collide. This level proved to be a stiff resistance since the start of the week and bulls are unlikely to commit to a decisive rebound unless the pair manages to make a daily close above it. 1.1620 (static level) and 1.1650 (static level) could limit the pair's upside in the short term,” Eren added further.
Key Notes
• US CPI Preview: Forecasts from 10 major banks, reacceleration in the monthly prints
• EUR/USD Forecast: Will euro break out of range on US CPI data?
• EUR/USD: Minor rebound viewed as corrective, 1.1495 level to watch – Commerzbank
About the US CPI
The Consumer Price Index released by the US Bureau of Labor Statistics is a measure of price movements by the comparison between the retail prices of a representative shopping basket of goods and services. The purchasing power of USD is dragged down by inflation. The CPI is a key indicator to measure inflation and changes in purchasing trends. Generally speaking, a high reading is seen as positive (or bullish) for the USD, while a low reading is seen as negative (or Bearish).
- EUR/JPY extends the downside and clinches 4-week lows.
- The 200-day SMA comes next in the 130.40 region.
EUR/JPY adds to the ongoing bearish move and breaks below the 131.00 support with some conviction.
The continuation of the downtrend is predicted to meet the next interim support at the 55-day SMA at 130.48 ahead of the more significant level at the 200-day SMA near 130.40. This area of contention stays reinforced by the proximity of a Fibo retracement (of the October’s rally) near 130.30.
Below the 200-day SMA, the outlook for the cross is seen shifting to negative.
EUR/JPY daily chart
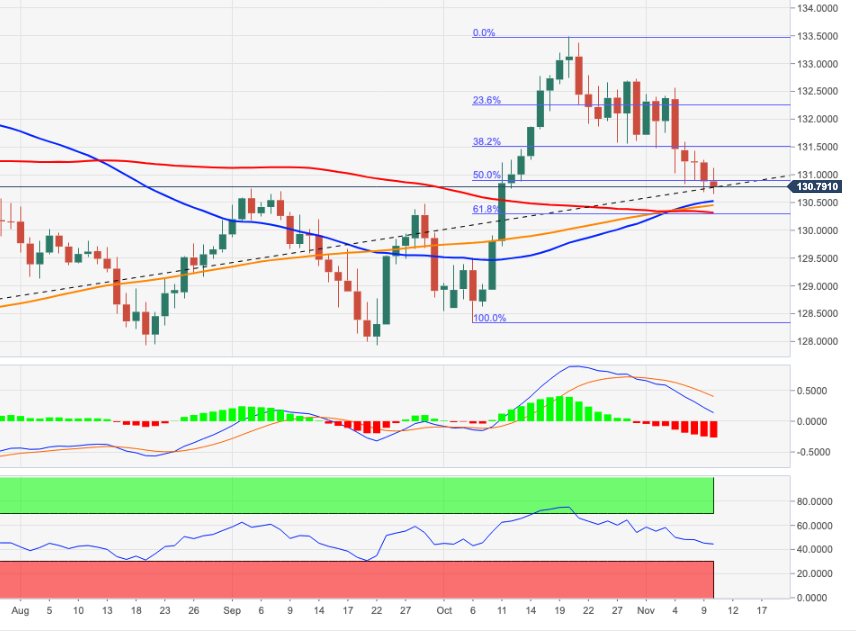
Japanese Prime Minister Fumio Kishida said on Wednesday that they will offer 100,000 JPY to households suffering from the impact of the coronavirus pandemic, as reported by Reuters.
Additional takeaways
"Will compile economic stimulus package worth several tens of trillions of yen by the end of next week."
"Will show the full picture of the coronavirus response by the end of the week."
Will start COVID-19 booster shots in December."
"Booster shots will target those aged 18 or older."
Market reaction
These comments don't seem to be having a significant impact on the JPY's performance against its rivals. As of writing, the USD/JPY pair was up 0.3% on the day at 113.20.
- USD/JPY staged a solid recovery from near one-month lows touched on Tuesday.
- Rebounding US bond yields helped revive the USD demand and remained supportive.
- The market focus remains glued to the release of the US consumer inflation figures.
The USD/JPY pair maintained its bid tone through the mid-European session and was last seen hovering near daily tops, around the 113.20-25 region.
The pair attracted fresh buying on Wednesday, snapping four days of the losing streak and reversing the previous day's losses to near one-month lows. The US dollar made a solid comeback amid a strong rebound in the US Treasury bond yields. This, in turn, prompted some short-covering around the USD/JPY pair.
Despite the Fed's dovish outlook, the markets have been pricing in the possibility of an interest rate hike in 2022 amid worries about a faster-than-expected rise in inflationary pressures. This was seen as a key factor that triggered a fresh leg up in the US bond yields and helped revive demand for the greenback.
Investors also seemed inclined to unwind their USD bearish bets ahead of Wednesday's release of the latest US consumer inflation figures, which will influence Fed rate hike expectations. Hence, the positive move could further be attributed to some repositioning trade, warranting some caution for aggressive bulls.
The official report is expected to show that the headline CPI remained elevated near multi-decade highs, above the 5.0% YoY rate. A stronger print will reaffirm expectations that the Fed would adopt a more aggressive policy stance to contain stubbornly high inflation and provide a strong boost to the greenback.
This, in turn, will play a key role in determining the next leg of a directional move for the USD/JPY pair. In the meantime, the risk-off impulse in the markets could underpin the safe-haven Japanese yen and keep a lid on any further gains for the major. Hence, any subsequent positive move might confront some resistance near 100-hour SMA, around the 113.35 region.
Technical levels to watch
- China's Evergrande is due to make an offshore bond coupon payment.
- A failure to pay the overdue $148 million bond coupon will result in a formal default.
- Heightened concerns over a spillover to other sectors could weigh on sentiment.
China's Evergrande Group has to pay another overdue bond coupon payment, this time worth $148 million, to avoid a formal default on Wednesday. Heightened fears over the liquidity crisis in the Chinese real-estate sector spilling over to other sectors could trigger a flight to safety if Evergrande defaults.
Back in October, the People's Bank of China (PBOC) noted that the impact of Evergrande's debt problems on the banking system was controllable and reassured that it would protect the rights and interests of home buyers. However, there was no word from the company regarding its upcoming overdue payment and investors grow concerned about its ability to avoid a default.
Citing two sources with the knowledge of the matter, Reuters reported that some bond holders had not received coupon payments at the end of the Asian session on Wednesday.
Last week, Chinese property developer Kaisa Group Holdings Ltd announced that it missed a payment on a wealth management product, reminding investors of the dreadful condition the sector is in.
On a positive note, Evergrande reportedly sold 530 million shares of its stake in Hong Kong-based tech company HengTen in a series of sales since November 4, raising more than $140 million in the process.
The data from China revealed that the Producer Price Index (PPI) jumped to 13.5% on a yearly basis in October, the highest reading in 26 years, from 10.7% in September. This print revived worries over the world's second-biggest economy going into stagflation by suggesting that inflation could continue to push higher with producers passing the price increases to consumers.
Market implications
The Shanghai Composite Index (SSEC), which was down more than 1% at one point, lost 0.4% to close at 3,492 points.
According to a report published by the Securities Times on Wednesday, several real estate companies unveiled plans to China's inter-bank bond market regulator to issue debt in the inter-bank market. This development triggered a rebound and the Real Estate Index registered its largest one-day increase since October by rising 5%.
Meanwhile, American investors seem to have adopted a cautious stance with the S&P futures falling 0.15% ahead of the opening bell.
In case risk-off flows start to dominate the financial markets with Evergrande missing its payment, Wall Street's main indexes could suffer heavy losses and the flight-to-safety could provide a boost to the greenback. Risk-sensitive currencies, such as the AUD and the NZD, are likely to face heavy selling pressure if the mood sours.
- EUR/NOK adds to Tuesday’s gains around 9.8800.
- The 9.9000 region continues to cap the upside so far.
- Norway’s inflation figures surprised to the downside in October.
The Norwegian krone gives away further ground and pushes EUR/NOK to new 2-day highs in the vicinity of 9.9000 midweek.
EUR/NOK picks up pace after CPI, Brent
EUR/NOK gathers extra steam and adds to the recent advance, although the upside momentum seems to remain limited around the 9.9000 region for the time being.
The krone faces some selling pressure after inflation figures in the Scandinavian economy came below expectations in October. In fact, the headline CPI contracted at a monthly 0.3% and rose 3.5% from a year earlier. When measured by the CPI-ATE (CPI adjusted for tax changes and excluding energy products), the Norges Bank’s preferred gauge for inflation, prices rose 0.9% vs. October 2020. Still on inflation, Producer Prices rose 60.8% YoY.
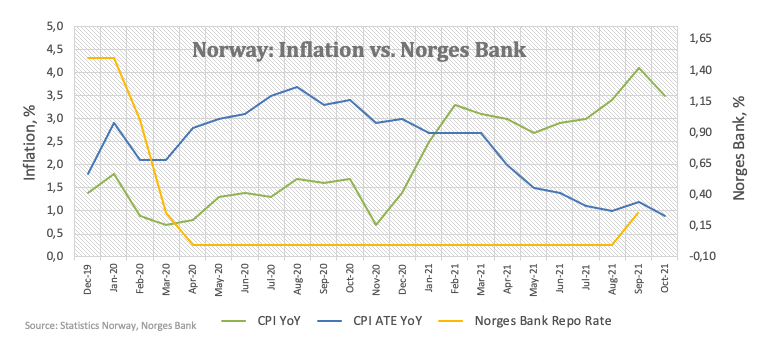
Also weighing on NOK appears the downtick in prices of the European reference Brent crude, which drop to sub-$85.00 levels after three consecutive daily advances.
EUR/NOK significant levels
As of writing the cross is gaining 0.06% at 9.8704 and faces the next resistance at 9.9128 (monthly high Nov.5) followed by 10.0000 (round level) and then 10.0051 (55-day SMA). On the other hand, a breach of 9.7864 (20-day SMA) would open the door to 9.7197 (monthly low Nov.1) and finally 9.6624 (2021 low Oct.21).
- USD/CAD dropped to four-day lows during the first half of the European session.
- The set-up favours bearish traders and supports prospects for additional losses.
- Investors await the release of the US consumer inflation figures for a fresh impetus.
The USD/CAD pair extended the previous day's retracement slide from four-week tops and witnessed some selling through the first half of the European session on Wednesday. The downward trajectory dragged the pair to four-day lows, around the 1.2415-10 region in the last hour.
The intraday downtick seemed rather unaffected by a pickup in demand for the US dollar, which drew some support from rebounding US Treasury bond yields and a softer risk tone. Bulls even shrugged off a downtick in oil prices, which tend to undermine the commodity-linked loonie.
From a technical perspective, the USD/CAD pair was last seen flirting with confluence support comprising 200-hour SMA and the lower boundary of a three-week-old ascending channel. This should now act as a key pivotal point and help determine the near-term trajectory.
Meanwhile, technical indicators on the daily chart maintained their bearish bias and have been gaining negative traction on hourly charts. This, in turn, supports prospects for an eventual breakdown, though traders might be reluctant ahead of the US consumer inflation figures.
That said, a sustained break below might prompt aggressive technical selling and turn the USD/CAD pair vulnerable. The next relevant support is pegged near the 1.2345 region, below which the downward trajectory could further get extended back towards the 1.2300 round-figure mark.
On the flip side, any meaningful move up now seems to confront immediate resistance near the 1.2455-60 region. Some follow-through buying should allow the USD/CAD pair to surpass the 200-day SMA barrier, near the 1.2475 region, and aim to reclaim the key 1.2500 psychological mark.
USD/CAD 1-hour chart
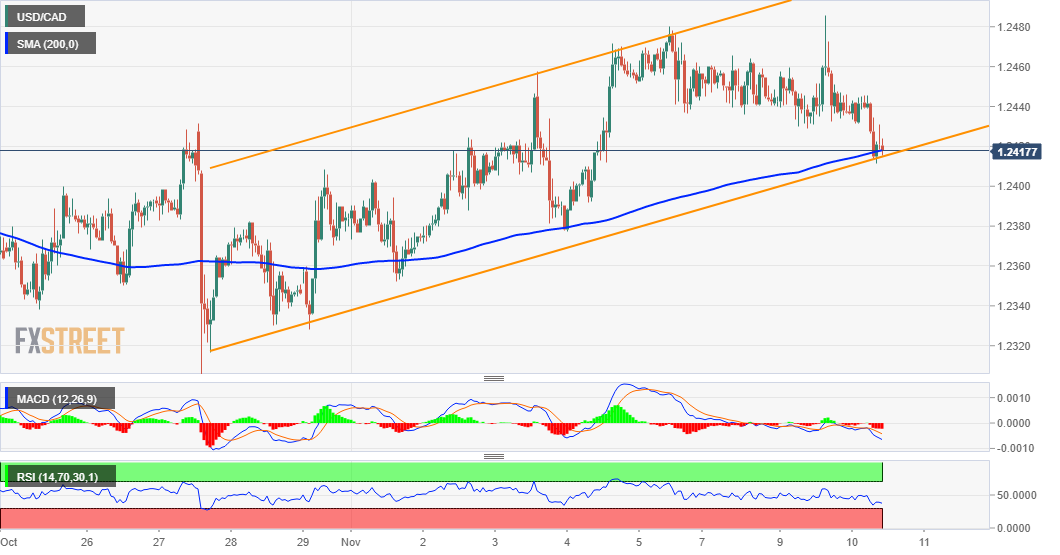
Technical levels to watch
EUR/CZK has regained downward momentum. The pair is set to challenge the 25.12/00 support zone and a break below here would open up 24.75, economists at Société Générale report.
Critical support is seen at 25.12/25.00
“EUR/CZK is drifting towards potential support of 25.12/25.00 representing the lower limit of a descending channel drawn since last year. This could act as an interim trough, however, signals of a meaningful rebound are still not visible.”
“A break above recent peak at 25.75 will be essential for affirming an extended up-move.”
“Below 25.00, next significant level could be at low of 2020 near 24.75.”
See: EUR/CZK looks for further downside to the 24.80 mark – Credit Suisse
Silver was last seen trading around $24.30. Karen Jones, Team Head FICC Technical Analysis Research at Commerzbank, expects the precious metal to lurch higher towards the $24.95/$25.42 region.
The $21.87/17 major support continues to act as a floor for the market
“Silver has eased back to and recovered from $22.99, we look for a challenge of the $24.95 September high and the 200-day ma at $25.42.”
“Resistance extends up to tougher resistance offered by the $26.07, the August high. The market will need to regain this area we suspect to regenerate bullish impetus. Please note that the 55-week ma also lies at $25.29. We favour the topside but it may take several attempts to clear this band.”
“Below $22.99 lies $22.85, the 20th August low but the market is underpinned by its long term pivotal support at $21.87/17. These are considered to be a major band of support and we expect them to act as a floor for the market.”
See – Silver Price Analysis: XAG/USD to seed a bull setup towards 200-DMA at $25.38 – DBS Bank
- USD/TRY extends the advance and challenges all-time highs.
- The stronger dollar helps the pair to regain upside traction.
- Markets’ attention now looks to the CBRT meeting next week.
The Turkish lira accelerates losses and lifts USD/TRY to the area of all-time highs around 9.8400 on Wednesday.
USD/TRY closer to 10.0000
USD/TRY advances for the second session in a row on Wednesday on the back of the better note surrounding the US dollar and the persistent depreciation hitting the Turkish currency.
Indeed, the lira remains under heavy pressure and the selling pressure has intensified as of late following rumours that the Treasury and Finance Minister L.Elvan had offered his resignation in past days.
Despite these rumours were later denied, the sentiment surrounding the lira looks increasingly fragile to say the least and could deteriorate further ahead of the next monetary policy meeting by the Turkish central bank (CBRT) due on November 18.
in the domestic docket, the Unemployment Rate in Turkey eased to 11.5% in September (from 12.1%).
On the latter, it is worth recalling that the CBRT reduced the One-Week Repo Rate by 300 bps since September in a context of surging inflation and a firm outlook when it comes to the economic recovery.
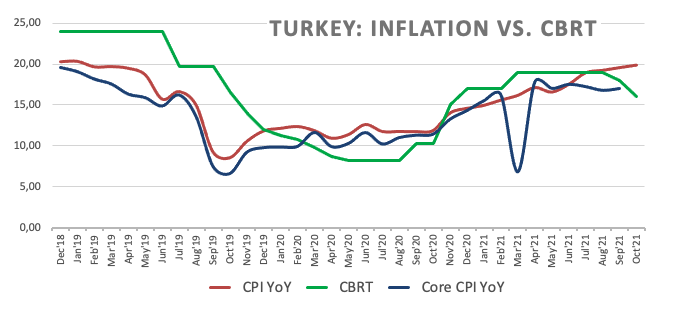
USD/TRY key levels
So far, the pair is gaining 0.89% at 9.8138 and a drop below 9.5146 (20-day SMA) would expose 9.4722 (monthly low Nov.2) and finally 9.4128 (weekly low Oct.26). On the other hand, the next up barrier lines up at 9.8395 (all-time high Oct.25) followed by 10.0000 (psychological level).
EUR/CHF is drifting towards 2020 low of 1.0500, If the pair holds above here, we could see a rebound towards 1.0700, according to economists at Société Générale.
1.0500 to offer a solid support
“EUR/CHF is gradually drifting towards the low of 2020 near 1.0500. This could be a significant support.”
“Defending it can result in a rebound, August low of 1.0700 would be first layer of resistance.”
- GBP/USD witnessed some selling on Wednesday amid resurgent USD demand.
- Rebounding US bond yields, a softer risk tone underpinned the safe-haven USD.
- Brexit jitters, dovish BoE weighed on the GBP and contributed to the selling bias.
- Investors now await US consumer inflation figures for a fresh directional impetus.
The GBP/USD pair broke down of its intraday consolidative trading range and dropped to two-day lows, around the 1.3520-15 region in the last hour.
Following the previous day's good two-way price swings, the GBP/USD pair witnessed fresh selling on Wednesday and was pressured by a combination of factors. The US dollar made a solid comeback amid a goodish pickup in the US Treasury bond yields and a generally softer risk tone.
The markets seem convinced that the Fed would be forced to adopt a more aggressive policy response to contain the faster-than-expected rise in inflationary pressures. This, in turn, was seen as a key factor that acted as a tailwind for the US bond yields and underpinned the greenback.
On the other hand, the British pound was weighed down by the BoE's dovish decision to hold interest rates steady last week. This, along with worries that the UK government will trigger Article 16 of the Northern Ireland Protocol, supports prospects for further losses for the GBP/USD pair.
Apart from this, a weaker trading sentiment around the equity markets should benefit the USD's relative safe-have status and add credence to the negative outlook. That said, investors might refrain from placing aggressive bets ahead of the release of the US consumer inflation figures.
The US CPI report, scheduled later during the early North American session, could influence market expectations about the Fed's next policy move. This, in turn, will play a key role in driving the USD demand in the near term and provide a fresh directional impetus to the GBP/USD pair.
Technical levels to watch
In their latest projections, the German government economic advisers cut the 2021 growth forecast to 2.7% from the March forecast of 3.1%.
Additional takeaways
“German government advisers raise 2022 growth forecast to 4.6%, up from March forecast of 4%.”
“German government advisers see inflation at 3.1% this year, 2.6% next year.”
“German government advisers see Eurozone growing 5.2% this year, 4.3% in 2022.”
Market reaction
EUR/USD was last seen trading at 1.1575, down 0.13% so far, mainly undermined by broad-based US dollar rebound ahead of the American inflation data.
Some Chinese state-owned firms told regulators to consider adjusting 'three red lines' lending restrictions to property developers for Mergers & Acquisitions, the local media outlet Cailianshe reported, citing sources familiar with the matter.
No further details are available on the same, thus far.
This comes ahead of the Chinese troubled Evergrande property development giant’s $148 million in coupons payment due later on Wednesday.
Separately, another China’s property developer Fantasia said that some lenders are requesting early repayments after it reopened for trading earlier this morning.
Market reaction
The risk sentiment is seeing a bit of a recovery on the above headlines, with the S&P 500 futures now losing only 0.20% vs. -0.40% seen previously. Meanwhile, AUD/USD has bounced off just above the 0.7350 level, currently trading at 0.7366.
- AUD/USD trimmed a part of its intraday losses to four-week lows.
- The risk-off mood, stronger USD kept a lid on any meaningful gains.
- The focus remains glued to Wednesday’s release of the US CPI report.
The AUD/USD pair managed to recover a major part of its early lost ground to four-week lows and was last seen hovering with modest losses, around the 0.7370-65 region.
The pair added to the previous day's losses and witnessed some follow-through selling during the early part of the trading action on Wednesday. A combination of factors helped revive the US dollar demand and exerted some downward pressure on the AUD/USD pair, though the intraday slide stalled just ahead of mid-0.7300s.
The greenback drew some support from a goodish pickup in the US Treasury bond yields amid prospects for an early policy tightening by the Fed. Expectations that the US central bank would be forced to adopt a more aggressive policy response to contain stubbornly high inflation acted as a tailwind for the US bond yields.
Meanwhile, worries about a faster-than-anticipated rise in inflationary pressure led to some profit-taking in the global equity markets. This was seen as another factor that benefitted the greenback's relative safe-haven status and further collaborated to drive flows away from the perceived riskier Australian dollar.
The downside, however, remains cushioned as investors seemed reluctant to place aggressive bets ahead of Wednesday's release of the US consumer inflation figures. The data will play a key role in influencing market expectations about the Fed's next policy move and drive the greenback demand in the near term.
Apart from this, traders will take cues from the Australian monthly employment figures, scheduled for release during the Asian session on Thursday, to determine the next leg of a directional move. In the meantime, the 100-day SMA support breakpoint, around the 0.7375 region, should cap the upside for the AUD/USD pair.
Technical levels to watch
- Gold price bides time before kick-starting the next move north.
- US inflation to trigger a fresh direction in gold price, $1840 in sight.
- Gold price turns bullish on falling bond yields, technical breakout.
Gold price has entered a phase of upside consolidation after hitting a wall of resistance at the critical $1,834 level. The dynamics in the Treasury yields and the US dollar continue to play out, with both rebounding ahead of the all-important US inflation data. Although, the Fed’s rate hike outlook likely hinges on the strength of the US labor market, the inflation figures could play a part in gauging the timing of the Fed rate increase.
Read: Gold Price Forecast: Will US inflation trigger a sustained move above $1,834 in XAU/USD?
Gold Price: Key levels to watch
The Technical Confluences Detector shows that the retreat in gold price is likely to meet strong demand around $1,819, which is the intersection of the previous day’s low and the previous week’s high.
The next downside target is envisioned at the pivot point one-month R1 at $1,816. Further south, the previous month’s high of $1,814 will come to the rescue of gold’s bullish traders.
The confluence of the Fibonacci 161.8% one-day and pivot point one-day S3 at $1,809 will be the line in the sand for gold optimists.
Alternatively, a revival in the buying interest could see a retest of powerful resistance around $1,828, where the Fibonacci 38.2% one-day, Bollinger Band one-day Upper and SMA5 four-hour coincide.
Up next, the previous day’s high at $1,833 could be put to test once again, above which doors will open up towards $1838.
At that point, the pivot point one-week R1 converges with the pivot point one-day R1.
Here is how it looks on the tool
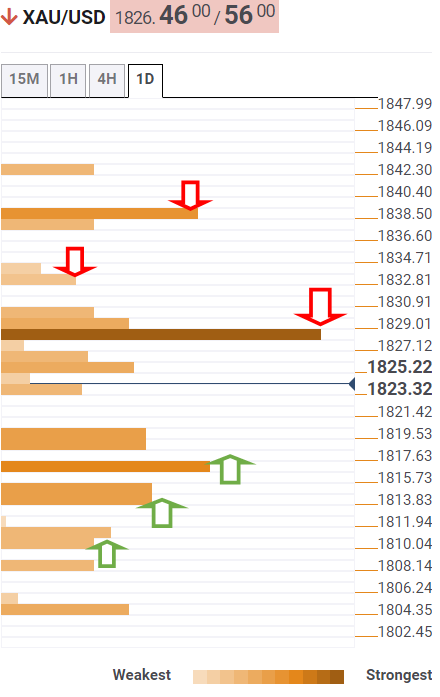
About Technical Confluences Detector
The TCD (Technical Confluences Detector) is a tool to locate and point out those price levels where there is a congestion of indicators, moving averages, Fibonacci levels, Pivot Points, etc. If you are a short-term trader, you will find entry points for counter-trend strategies and hunt a few points at a time. If you are a medium-to-long-term trader, this tool will allow you to know in advance the price levels where a medium-to-long-term trend may stop and rest, where to unwind positions, or where to increase your position size.
FTSE 100 maintains its breakout and keeps rising, in line with the medium-term bullish outlook of the Credit Suisse analyst team. The index is set to target the 7463 mark.
Near-term support at the 7148 63-day average to hold
“FTSE 100 remains above the top of its four-month range at 7218/24 and keeps steadily rising, hence confirming the previous bullish continuation pattern breakout, in line with the still bullish trend-following setup, with resistance seen next at the ‘measured objective’ to the bull ‘triangle’ from earlier this year at 7360. The next levels above here are seen at 7463, which is the downtrend from the 2018 high.”
“Near-term support remains seen at the 63-day average at 7138, which now ideally holds to support our base case that the market is now back in a fresh trending phase higher. More important supports remain at the broader range lows and the 200-day average at 6977/46, which we expect to hold if we see an unexpected turn lower.”
Gold remains slightly below $1834/36 but has improved in the short-term as Real Yields fall. Still, the yellow metal needs to surpass this region to sustain a deeper recovery, according to strategists at Credit Suisse.
Near-term support moves higher to $1759
“Gold remains slightly beneath the July and August highs and downtrend from August 2020 at $1834/36 but has improved further in the short-term, especially helped by the sharp fall in Real Yields. However, only a break above $1834/36 would be seen to complete an in-range base and lessen the topping threat significantly, instead of clearing the way for a deeper recovery to $1917.”
“Near-term support moves higher to $1759, below which would ease the pressure off $1834/36.”
“Only below the now more distant $1691/77 level XAU/USD would mark a major top for an important change of trend lower, with support then seen at $1620/15 initially, before $1565/60.”
USD/CAD remains stuck in a range below mid-1.2400s. But given the Bank of Canada’s policy stance, economists at the Bank of Montreal expect the pair to edge lower towards 1.20 by late 2022.
Moderation in energy prices to cap CAD upside potential
“The central bank's hawkish pivot and rising energy prices have put some wind under the Canadian dollar's wings.”
“We see the loonie cruising moderately higher to 1.20 by late 2022 as the Bank hikes rates ahead of the Fed, though an expected moderation in energy prices will cap its altitude.”
Calm has finally returned to the silver market as it recovers from the $21.43 low that was posted in late August. Benjamin Wong, notes that notes that there is a minor bullish inverse-head-and-shoulders pattern awaiting a breach of its neckline around $24.82, which would open up the 200-day moving average (DMA) at $25.38, then $26.38.
Silver is recovering from the $21.43 low posted in late August
“Calm is returning to the silver market as the third attempt to breach the mid-21’s level steadfastly held. This gives credence to the key support provided by a key Fibonacci marker at $21.51.”
“Silver located an ending diagonal low at $21.43 and is attempting to break the neckline of a bullish inverse head-and-shoulders pattern around $24.82. An affirmation of the latter would lead to test of higher grounds via passage of the 200-DMA at $25.38 before XAG/USD approaches the dropped down resistance trailing from $30.10 highs (around $26.38).”
EUR/CZK clocked up a sizable decline last week moving to a fresh covid-era low of 25.18. Subsequently, Economists at Credit Suisse lower their EUR/CZK target to 24.80 following the sizable boost to carry.
CZK-carry has become extremely attractive after last week’s 125bps policy rate hike
“We lower our EUR/CZK target to 24.80 from a previous medium-term projection of 25.20.”
“A sizable boost to carry, following last week’s 125bps policy rate hike, and the central bank’s implicit green light for further koruna appreciation suggest further downside for EUR/CZK.”
- GBP/JPY gained some positive traction on Wednesday amid a weaker JPY.
- Brexit jitters, dovish BoE might cap gains amid a cautious market mood.
The GBP/JPY cross edged higher through the early European session and climbed to fresh daily tops, around the 153.35 region in the last hour.
Having defended the 100-day SMA support, the GBP/JPY cross attracted some dip-buying on Wednesday and reversed a part of the previous day's losses. The uptick was exclusively sponsored by the emergence of some selling around the Japanese yen, though a combination of factors kept a lid on any meaningful upside for the cross.
A generally softer tone around the equity markets might benefit the JPY's relative safe-haven status against its British counterpart. This, along with worries that the UK government will trigger Article 16 of the Northern Ireland Protocol, should act as a headwind for the sterling and further collaborate to cap gains for the GBP/JPY cross.
Apart from this, last week's dovish Bank of England decision to hold interest rates steady favours bearish traders and supports prospects for further losses. That said, it will still be prudent to wait for a sustained break below 100-DMA support, around the 152.60 region, before positioning for an extension of a four-week-old downtrend.
There isn't any major market-moving UK economic data due for release on Wednesday, leaving the GBP/JPY cross at the mercy of any fresh Brexit-related developments. Apart from this, the broader market risk sentiment will influence demand for the safe-haven JPY and allow traders to grab some short-term opportunities around the cross.
Technical levels to watch
Inflationary pressures are piling up, therefore, economists at Nordea expect the Fed to hike three times in 2022 and 2023, respectively, and the ECB once in 2023. Accordingly, the USD is likely to outperform its peers.
EUR/USD targets 1.08 in a year from now
“Our new calls for six 25bp rate hikes for the Fed and one 25bp rate hike for the ECB by the end of 2023 obviously have consequences throughout the bond curve.”
“Given our views on the ECB and the Fed, we also stick to our long-held view that the relative discrepancy policy-wise should lead to a stronger USD versus EUR. We target a EUR/USD exchange rate at 1.08 at the end of 2022.”
“It seems as if the debt ceiling debate is getting close to a conclusion, which will enable the Treasury to rebuild its crisis account (TGA) at the Fed, removing more than 750 B of dollar liquidity over a couple of months alongside the aggressive tapering process that we envisage. Furthermore, the USD often tends to perform when growth slows as USD liquidity via global trade flows is lessened from a momentum perspective – Fed tapering also pulls in the same direction.”
Strategists at UOB Group’s Quarterly Global Outlook seen the BSP leaving its policy rate unchanged at 2.00% at its meeting on Thursday.
Key Quotes
“Given that a full recovery remains distant, the near-term growth outlook is still subjected to uncertainties, and with inflation staying high, we expect BSP to keep its policy rate unchanged until mid-2022.”
“Health and fiscal policy interventions are key tools for upholding growth momentum.”
- EUR/USD loses momentum and recedes to the 1.1560 region.
- German October final CPI came at 0.5% MoM, 4.5% YoY.
- US inflation figures take centre stage later in the NA session.
The single currency leaves behind the recent upside and prompts EUR/USD to drop to 2-day lows near 1.1560 on Wednesday.
EUR/USD now looks to the US docket
EUR/USD trades on the defensive for the first time after three consecutive daily advances, faltering once again in the 1.1600 neighbourhood as bullish attempts lack conviction for the time being.
The greenback, in the meantime, manages to regain some upside traction on the back of the improvement in US yield across the curve, partially reversing at the same time the recent moderate decline.
In the data space, earlier results showed the final October inflation figures in Germany, where the CPI rose 0.5% MoM and 4.5% vs. October 2020.
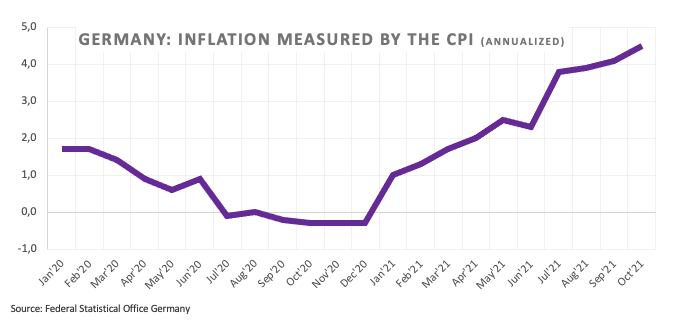
Still around inflation, market participants are expected to closely follow the release of US inflation figures measured by the CPI and the Core CPI for the month of October and due later in the NA session. In addition, the usual weekly Claims are due as well as Wholesale Inventories figures.
What to look for around EUR
Gains in EUR/USD remains so far limited by levels just past 1.1600 the figure. In the meantime, spot continues to look to the risk appetite trends for direction as well as dollar dynamics, while the loss of momentum in the economic recovery in the region - as per some weakness observed in key fundamentals - is also seen pouring cold water over investors’ optimism and tempering bullish attempts in the European currency. Further out, the single currency should remain under scrutiny amidst the implicit debate between investors’ expectations of a probable lift-off sooner than anticipated and the ECB’s so far steady hand, all amidst the persevering elevated inflation in the region and prospects that it could extend further than previously estimated.
Key events in the euro area this week: German final CPI (Wednesday) - EMU Industrial Production (Friday).
Eminent issues on the back boiler: Asymmetric economic recovery post-pandemic in the region. Sustainability of the pick-up in inflation figures. Pick-up in the political effervescence around the EU Recovery Fund in light of the rising conflict between the EU, Poland and Hungary on the rule of law. ECB tapering speculations.
EUR/USD levels to watch
So far, spot is down 0.21% at 1.1568 and faces the next up barrier at 1.1616 (monthly high Nov.4) followed by 1.1675 (55-day SMA) and finally 1.1692 (monthly high Oct.28). On the other hand, a break below 1.1513 (2021 low Nov.5) would target 1.1495 (monthly high Mar.9 2020) en route to 1.1422 (monthly high Jun.10 2020).
The US Bureau of Labor Statistics will release the Consumer Price Index (CPI) data on Wednesday, November 10 at 13:30 GMT and as we get closer to the release time, here are the forecasts by the economists and researchers of 10 major banks regarding the upcoming US inflation data. Investors expect the CPI to edge lower to 5.3% on a yearly basis from 5.4% in September and see the Core CPI staying unchanged at 4%.
TDS
“We expect inflation to slow significantly in 2022 as fiscal stimulus fades and supply constraints ease, but we don't expect the data to be validated in the very near-term. We forecast a strong 0.7% MoM rise overall (6.0% YoY), with the core index up 0.4% (4.4% YoY). We expect strong gains in the energy, used vehicles and health insurance components.”
ING
“This week’s CPI data is likely to show a re-acceleration in annual inflation to 5.8% for the headline rate (the highest since December 1990) and to 4.4% for core (ex-food and energy). Surging housing costs, labour costs, energy costs and second-hand car prices are likely to mean headline inflation then pushes above 6% in December, with core inflation moving above 5%.”
NBF
“The improvement of the sanitary situation, coupled with acute supply chain constraints and dearer rents/airfares should have all exerted upward pressure on prices during the month. The core index could therefore have increased 0.5% MoM, pushing the 12-month rate up by three tenths to 4.3%. Headline prices could have increased at an even faster pace (+0.6% MoM, +5.9% YoY), helped by another sharp increase in seasonally-adjusted gasoline prices.”
CIBC
“With no evidence of supply constraints abating in October, price pressures likely heated up. Total inflation will have received a lift from energy prices, causing it to accelerate to 5.8%. Stripping out food and energy, core price categories also likely showed strong momentum as supply chain bottlenecks and higher input costs continued to put upwards pressure on core goods prices, while Delta-impacted core service prices could have stopped falling as activity indicators improved towards the end of the month. Strong wage gains lately could have also been a contributor, causing core inflation to accelerate to 4.3%. We are slightly below the consensus, but not by enough to have markets give any sigh of relief over the inflation threat to interest rates.”
RBC Economics
“We expect US Inflation remained elevated, growing by 0.5% in October from September, and up 5.8% year-over-year. Distortions to supply-side factors such as port congestion, input and labour shortages will continue to put on floor on price growth. Looking beyond the pandemic base effects, the more important focus will be on the evolution of monthly price gains.”
ANZ
“We expect a heady rise in the US core (0.4% MoM) and headline (0.6% MoM) CPI in October, as Supply-demand imbalances across product and labour markets continue to keep pressure on underlying inflation.”
SocGen
“We expect headline increase of 0.5% MoM due to energy and food.”
Deutsche Bank
“Our US economists are at +0.47% (consensus +0.6%), which would be the strongest monthly reading since July. They think core will print at +0.37% MoM (consensus +0.4%).”
Citibank
“US Oct CPI MoM (Citi: 0.7%, median: 0.5%, prior: 0.4%); CPI YoY (Citi: 6.0%, median: 5.8%, prior: 5.4%); CPI ex Food, Energy MoM (Citi: 0.5%, median: 0.4%, prior: 0.2%); CPI ex Food, Energy YoY (Citi: 4.5%, median: 4.3%, prior: 4.0%). Amidst growing market conviction over the persistence of stronger inflation, we expect a strong 0.459% MoM increase in core CPI in October, the strongest increase since June, when elevated inflation prints were deemed transitory. We also see the risks as tilted towards the upside in October and in the following few months due to a combination of some normalizing prices but also a potential broadening of stronger prices across services.”
Wells Fargo
“Consumer Price Index report for the month of October is unlikely to offer much of a reprieve on the inflation front. Our forecast is for a 0.6% month-over-month increase on the headline index and a monthly increase of 0.4% on the core index. If realized, this would put headline CPI inflation at 5.9% YoY and core CPI inflation a bit lower at 4.4% YoY”
See: How to trade US inflation with EUR/USD, scenarios and levels to watch
USD/ILS continued to fall to a new low of 3.083 on Monday before bouncing back to the 3.10 area. In the near-term, economists at Credit Suisse expect USD/ILS to trade in a tight range of 3.07-3.14
A case for USD/ILS to fall to the 3.00-3.05 in coming months
“We expect USD/ILS to trade in a tight range of 3.07-3.14 in the short run as the Bank of Israel’s FX intervention limits the room for additional USD/ILS downside after a sizable decline in the recent two weeks.”
“We see scope for a break to the 3.00-3.05 area in coming months if inflation remains above target and US equities continue to gain.”
USD/JPY closed the last four trading days in the red and seems to have gone into a consolidation phase around 113.00. Karen Jones, Team Head FICC Technical Analysis Research at Commerzbank, expects the pair to extend its fall to the 111.66 July high and recover from here.
Viewed as minor top
“We are viewing USD/JPY as having topped near term.”
“The pair is likely to see a deeper retracement to 112.56 then 111.90, the 38.2% and 50% retracements. The 111.66 July high is also found in this vicinity and we will ideally see the market recover from here.”
“Rallies are likely to find the 20-day ma at 113.80 ahead of 114.55/69, the November 2017 high and recent high.”
“Loss of 110.80 is needed to destabilise the chart and allow for a deeper sell-off to key near-term supports at 109.07/10 and 108.73 (July and August low).”
See: USD/JPY to turn back higher from the 111.84/66 support zone – Credit Suisse
Copper (LME) keeps losing momentum but remains slightly above the crucial 200-day moving average (DMA) support of $9356. Strategists at Credit Suisse expect the metal to stage a rebound from this level.
Break below 200-DMA to open up $8878/77, then $8810/740
“Although a further consolidation around the crucial 200-DMA support, currently at the $9356 level should be allowed for, our bias is for a turn back higher from here and an eventual sustained closing break in due course above the previous record high at $10748, with resistance then seen next at the psychological $11000 level.”
“Support moves higher toward the crucial 200-DMA at $9356, which we would expect to floor the market. Below, we would then identify supports at $8878/77 next, before more important $8810/740.”
Economists at Credit Suisse now see scope for the Brazilian real to strengthen as far as 5.35 against the US dollar in the near-term, but see turning structurally bullish as premature.
Medium-term, a return to Q1 highs in USD/BRL remains unlikely
“The political risk picture has improved in Brazil, and inflation breakevens have stabilized: we see this as tactically helpful for BRL, consistent with USD/BRL trading as low as 5.35 in the near-term.”
“We however see turning structurally constructive on BRL as premature, as the political picture is likely to heat up again in two weeks and the turn in inflation is still tentative.”
“Medium-term, we maintain 5.80 as the top end of the target range, but the evidence of a large amount of risk premium priced into local assets that emerged from recent price action overall reinforces the idea that the bar for a return to Q1 highs, even under adverse political outcomes, is very high.”
- USD/JPY gained positive traction on Wednesday and recovered a part of the overnight losses.
- Rebounding US bond yields revived the USD demand and remained supportive of the move.
- The risk-off impulse could underpin the safe-haven JPY and cap gains ahead of the US CPI.
The USD/JPY pair climbed to fresh daily tops heading into the European session, with bulls now looking to build on the momentum beyond the 113.00 mark.
The pair attracted some buying during the early part of the trading action on Wednesday and recovered a part of the previous day's slide to near one-month lows. This marked the first day of a positive move in the previous five sessions and was sponsored by a pickup in the US Treasury bond yields.
Despite the Fed's dovish outlook, the markets have been pricing in the possibility of an interest rate hike in 2022 amid worries about a faster-than-expected rise in inflationary pressure. This, in turn, acted as a tailwind for the US bond yields and assisted the USD/JPY pair to gain some traction.
Meanwhile, rebounding US bond yields helped revive the US dollar demand, which was seen as another factor that contributed to the USD/JPY pair's modest intraday positive move. That said, the risk-off impulse might underpin the safe-haven Japanese yen and keep a lid on any further gains.
Investors might also refrain from placing aggressive bets ahead of Wednesday's release of the latest US consumer inflation figures, due later during the early North American session. The data will influence Fed rate hike expectations and provide a fresh directional impetus to the USD/JPY pair.
This makes it prudent to wait for a strong follow-through buying before confirming that the recent corrective pullback from multi-year tops has run its course. Hence, any subsequent move up is more likely to confront stiff resistance and meet with a fresh supply near the 113.60 region.
Technical levels to watch
EUR/USD edged higher in the early American session on Tuesday but failed to hold above 1.1600. The small rebound is viewed as corrective by analysts at Commerzbank who expect the pair to target the 1.1495 mark.
Key support is seen at 1.1366
“EUR/USD is seeing a small bounce higher, this is so far viewed as corrective only and the market will stay directly offered below the 1.1665 five-month downtrend.”
“For now, attention is on the 50% retracement of the move from 2020 and the March 2020 high at 1.1492/95.”
“Key support is the previous downtrend (from 2008) which is now located at 1.1366.”
USD/JPY has broken below its range lows at 113.30/21. Nevertheless, economists at Credit Suisse expect key supports at 112.42/40 and particularly 111.84/66 to hold ahead of a renewed turn back higher.
Strongly bullish outlook
“USD/JPY has extended its pullback further this week but with a major base in place above 112.40, we maintain our view this is a temporary and healthy setback only.”
“We look for a move above 114.92 in due course for a test of the long-term downtrend from April 1990, currently at 117.00/02. It’s worth reiterating though the “measured base objective” is significantly above here at 122.90/123.00, however, this is very much a longer-term objective.”
“We see supports for the current pullback at 112.42/40, then 111.84/66, which includes the ‘neckline’, 55-day average and cluster of retracement supports, which we have a high degree of confidence will hold.”
AUD/USD is eroding its 55-day moving average (DMA) at 0.7364 and is back under pressure. Karen Jones, Team Head FICC Technical Analysis Research at Commerzbank, expects the aussie to extend its slide to the 0.7171 mark.
AUD/USD under pressure, 55-DMA being eroded
“AUD/USD is eroding the 55-DMA at 0.7364 and is under pressure. The pair has recently failed at the 200-DMA at 0.7549 and the move below the 55-DMA targets the base of the channel at 0.7243 and the 29th September low at 0.7171.”
“Intraday Elliott wave counts are implying rallies to 0.7430 was an interim high.”
Gold climbed to its strongest level in more than two months at $1,833 on Tuesday before going into a consolidation phase below $1,830 on Wednesday. Will US inflation trigger a sustained move above $1,834 in XAU/USD? Although the yellow metal is off highs, its bullish potential remains intact, in the view of FXStreet’s Dhwani Mehta.
US inflation eyed for hints on the timing of the Fed rate hike
“US inflation showdown is eagerly awaited by the markets for any hints on the Fed’s rate hike timing, as well as, its pace of tapering in the coming months. The US CPI is expected to arrive at 5.3% YoY in October vs. 5.4% previous while the core figure is seen steady at 4% in the reported period.”
“Gold bulls need a daily closing above the $1,834 barrier to unleash the further upside. The next stop for gold buyers is seen at the $1,840 round number, above which the June 16 high of $1,853 could likely be tested.”
“Should the bears manage to defend the September tops, the further retracement towards Tuesday’s low of $1819 could be in the offing. Further south, symmetrical triangle resistance-turned-support at $1,806 will emerge as a powerful support.”
- USD/CAD extended its sideways consolidative price move for the fourth straight day.
- Bullish crude oil prices underpinned the loonie and acted as a headwind for the pair.
- Investors, however, seemed reluctant to place aggressive bets ahead of the US CPI.
The USD/CAD pair lacked any firm directional bias and remained confined in a range, below mid-1.2400s heading into the European session.
The pair, so far, has struggled to gain any meaningful traction and has been oscillating in a narrow trading band since last Friday. The overnight spike to near one-month tops faded ahead of the key 1.2500 psychological mark amid bullish crude oil prices, which tend to underpin the commodity-linked loonie.
Apart from this, sustained US dollar selling also collaborated to cap the upside for the USD/CAD pair. That said, a pickup in the US Treasury bond yields, along with the risk-off impulse helped revive demand for the safe-haven USD and extended some support, warranting some caution for aggressive traders.
Investors also preferred to wait on the sidelines ahead of Wednesday's release of the US consumer inflation figures. The Fed last week indicated that policymakers were in no rush to raise borrowing costs. Investors, however, seem convinced that the US central bank would be forced to adopt a more aggressive policy response to contain stubbornly high inflation.
The US CPI report, due for release later during the early North American session, will influence Fed rate hike expectations and drive the USD demand. This, in turn, should provide a fresh directional impetus to the USD/CAD pair. In the meantime, the pair is more likely to extended its subdued/range-bound price action.
Technical levels to watch
- GBP/USD is trading at 1.3560, Brexit jitters, COVID-19 situation persist.
- The cable took the hit as the US dollar rebounds, the pair may stay flat ahead of US data.
- The cable dealers look for fresh impetus from US inflation, UK GDP data.
GBP/USD is going through mild losses at 1.3560 during early European trading hours on Wednesday, with the focus on the key US consumer Price Index (CPI) data.
The cable pair is weighed down by a rebound in the US dollar, as the US Treasury yields attempt a recovery amid looming inflation fears.
In addition to the anxieties rising due to the CPI data, concerns over Brexit and the coronavirus situation in the UK are weighing down the pair. Recently, the currency pair suffered a blow after Irish Foreign Minister Simon Coveney warned about a potential trade war if Article 16 were to be triggered by the UK.
The cable remains subdued in the second week of November from a five-week low, as investors bet on a rate hike in December after the Bank of England (BoE) surprised the market by leaving policy unchanged this month. However, the UK raised investors’ expectations of a hike but signaled further could come in the coming months. These changes factor in the pair’s trajectory.
The US dollar has been gaining traction after Tuesday's session and outshined several in a broad basket of currency, with the greenback trading at 94.06, up 0.12% on the day. The US 10-year treasury bond yields have recovered to 1.46%.
Traders look for impetus from upcoming US CPI data and BOE Silvana Tenreyro's speech scheduled for Wednesday. The focus also remains on the UK preliminary estimate of third-quarter GDP growth on Thursday, which is expected to show GDP growth slowing to 1.5% from the previous quarter amid an unprecedented energy crisis and ongoing supply chain issues.
Technical Levels
As per the daily chart, GBP/USD has found flooring located around 1.3400, which is supported by the September 30th and October 5th price action. But before testing the said level, the cable pair will first have to break the 1.3449 September 8th low.
The upside challenge has 21-day Simple Moving Averages (SMA), 50-day SMA, both huddling at 1.3680 level. The next thorn is at 100-day SMA 1.3749. Furthest to the north lies the next barrier to the upside at a 200-day SMA of 1.3847.
Additional levels to watch
- DXY retakes some upside traction and moves above 94.00.
- US yields recover some ground across the curve.
- US CPI, weekly Claims next of note in the calendar.
The greenback, in terms of the US Dollar Index (DXY), seems to leave behind the recent weakness and retakes the area above the 94.00 barrier midweek.
US Dollar Index now looks to data
After three consecutive daily retracements, including the rejection from new 2021 highs past 94.60 (November 5), the index manages to meet some dip buyers and advance past the 94.00 hurdle ahead of the opening bell in Euroland.
The rebound in the dollar appears so far in tandem with the bounce in US yields across the curve after the front end met support near 0.40%, the belly met contention ahead of 1.40% and the decline in the key 30y bond loos contained around 1.80% for the time being.
In the meantime, global markets appear side-lined on Wednesday amidst the prevailing cautiousness ahead of the release of key inflation figures in the US economy due later in the NA session. The publication of the CPI gained relevance as of late amidst the shift in the narrative towards a more lasting elevated inflation, although consensus (among Fed-speakers) expects consumer prices to decline in 2022.
Further data includes the usual Initial Claims and Wholesale Inventories and the report on crude oil supplies by the DoE.
What to look for around USD
The leg lower in the index seems to have met some contention in the 93.90 region (November 9) following YTD tops above 94.60 (November 5). The greenback, in the meantime, continues to closely track the performance of US yields and the progress of the current elevated inflation as well as views from Fed’s rate-setters regarding the probability that high prices could linger for longer, all along the performance of the economic recovery against the backdrop of unabated supply disruptions and the equally incessant raise in coronavirus cases.
Key events in the US this week: October CPI, Initial Claims (Wednesday) – Flash November Consumer Sentiment (Friday).
Eminent issues on the back boiler: US-China trade conflict under the Biden’s administration. Tapering speculation vs. economic recovery. Debt ceiling debate. Geopolitical risks stemming from Afghanistan.
US Dollar Index relevant levels
Now, the index is gaining 0.09% at 94.07 and a break above 94.62 (2021 high Nov.5) would open the door to 94.74 (monthly high Sep.24 2020) and then 95.00 (round level). On the flip side, the next down barrier emerges at 93.87 (weekly low November 9) seconded by 93.48 (55-day SMA) and finally 93.27 (monthly low October 28).
Maroš Šefčovič, Vice-President of the European Commission in charge of Interinstitutional Relations and Foresight, said that he will brief diplomats on Northern Ireland protocol negotiations, per Politico.
Three diplomats told Playbook that Šefčovič will sound out EU countries on how they think they should react if Johnson triggers Article 16.
“There is a consensus that London has gone too far,” one diplomat said.
“But we are not yet talking about a sanctions package” at today’s meeting, he added.
This comes as officials in Brussels are increasingly convinced the UK will trigger Article 16 of the Brexit deal as soon as next week.
Market reaction
GBP/USD is little affected by the renewed Brexit headlines, keeping its range around 1.3550, almost unchanged on the day.
Here is what you need to know on Wednesday, November 10:
Major currency pairs continue to fluctuate in relatively tight ranges after Tuesday's macroeconomic data releases and central bank speakers offered no surprises. As focus shifts to the US Consumer Price Index (CPI) inflation report and the weekly jobless claims figures, the cautious market mood allows the greenback to stay resilient against its rivals. Investors will keep a close eye on developments surrounding the negotiations over Brexit's Northern Ireland protocol as well.
Wall Street's main indexes closed in the negative territory on Tuesday with the overdue correction following the record-setting rally finally taking place. Currently, US stock index futures are down around 0.3%, the Shanghai Composite is losing nearly 1% and the Nikkei 225 is losing 0.6%. Meanwhile, the benchmark 10-yer US Treasury bond yield is up more than 1% but stays below 1.5%.
EUR/USD edged higher in the early American session on Tuesday but failed to hold above 1.1600. European Central Bank (ECB) policymaker Klass Knot reiterated that conditions for a rate hike were very unlikely to be met in 2022. German CPI data will be featured in the European economic docket but it will be a revision of the flash estimate and is unlikely to trigger a market reaction.
How to trade US inflation with EUR/USD, scenarios and levels to watch.
GBP/USD extended its rebound on Tuesday but reversed its direction after advancing beyond 1.3600. The pair stays quiet on Wednesday but heightened concerns over the UK triggering Article 16 could start weighing on the British pound.
USD/JPY closed the last four trading days in the red and seems to have gone into a consolidation phase around 113.00. Although the risk-averse market environment is helping the safe-haven JPY find demand, rising US T-bond yields are limiting USD/JPY's downside.
AUD/USD extended its slide after breaking below and trades at its lowest level in nearly a month around mid-0.7300s on Wednesday. In the early trading hours of the Asian session on Thursday, the October jobs report from Australia will be looked upon for fresh impetus.
Gold climbed to its strongest level in more than two months at $1,833 on Wednesday before going into a consolidation phase below $1,830 on Wednesday. XAU/USD continues to react to fluctuations in the US T-bond yields.
US October CPI preview: Inflation data unlikely to discourage gold bulls.
Cryptocurrencies: Bitcoin retreated modestly after touching a new all-time high above $68,000. Ethereum trades with modest losses around $4,700 early Wednesday. Ripple is losing more than 2% after rising to a fresh two-month near $1.3 on the back of a 5% increase on Monday.
- AUD/USD drops further as the US dollar rebounds amid risk-aversion.
- The aussie breaches the last line of defense for the bulls at 50-DMA.
- Bearish RSI targets 0.7300, with all eyes on US inflation, Australian jobs.
AUD/USD is accelerating its decline in early European hours, reaching fresh four-week lows near 0.7350, as the US dollar rebound gathers steam amid risk-off trades and firmer Treasury yields.
The market sentiment remains sour amid persistent worries over rising inflationary pressures and the global central banks’ reluctance to act, providing fresh bids to the safe-haven US dollar. China’s rising price pressures exacerbated the pain in the aussie.
Meanwhile, the rebound in the Treasury yields ahead of the US inflation data also dent the sentiment around the alternative higher-yielding investment asset in the aussie dollar.
Looking at AUD/USD’s daily chart, the pair has finally yielded a sustained break below the critical 50-Daily Moving Average (DMA) at 0.7369, which was the last line of defense for the bullish traders.
A fresh downswing towards 0.7300 cannot be ruled if the October 13 low of 0.7322 caves in.
The 14-Day Relative Strength Index (RSI) is pointing sharply lower below the midline, suggesting that there is more room for the extension of the two-day downtrend.
AUD/USD: Daily chart
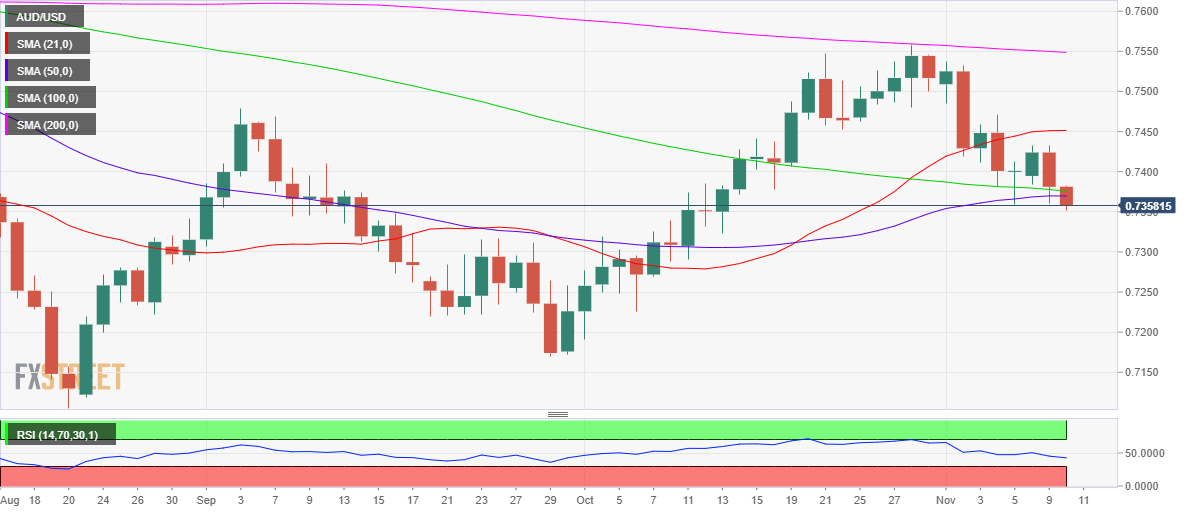
On the flip side, the aussie bulls will challenge the 50-DMA support-turned-resistance on any recovery attempts.
Above that level, the 100-DMA at 0.7376 will immediately cap the further upside.
The aussie buyers will need a firm break above 0.7400 to extend its recovery momentum towards the previous week’s high of 0.7432.
AUD/USD: Additional levels to consider
According to advanced prints for natural gas futures markets, open interest resumed the upside on Tuesday and rose by around 7.7K contracts, partially reversing the previous daily pullback. In the same direction, volume rose for the third straight session, now by around 134.4K contracts, the largest single-day build since October 25.
Natural Gas faces contention near $4.80/MMBtu
Prices of natural gas dropped for yet another session on Tuesday, breaking below the $5.00 mark per MMBtu with some conviction. The move lower was accompanied by increasing open interest and volume, leaving the door open to the continuation of the downtrend in prices and with the next target at the $4.80 mark per MMBtu.
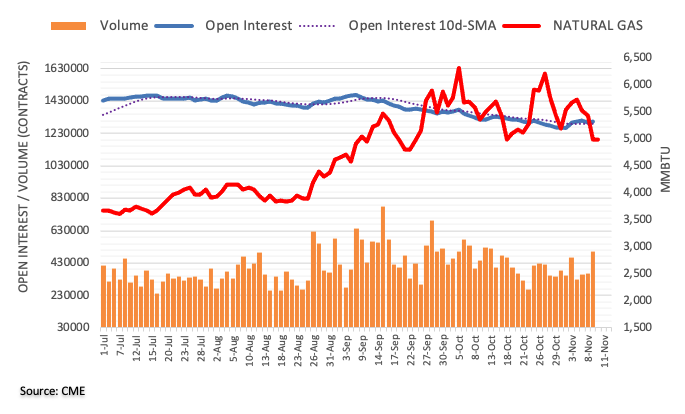
- NZD/USD takes offers to refresh weekly bottom, extends the previous day’s losses.
- Bearish MACD, descending RSI line hints at further weakness.
- 200-SMA could challenge bears, bulls need to cross fortnight-old resistance line for conviction.
NZD/USD remains on the back foot, refreshing weekly low near the 0.7100 threshold as European traders brace for Wednesday’s bell.
The kiwi pair drops for the second consecutive day as sellers jostle with an ascending support line from October 13.
Given the bearish MACD signals and downward sloping RSI line, not oversold, the NZD/USD weakness is likely to extend towards the 200-SMA level of 0.7057, should the quote stay below 0.7100.
Meanwhile, the corrective pullback may aim for the 23.6% Fibonacci retracement of September-October upside, around 0.7135, before challenging the two-week-long resistance line near 0.7170.
Should the NZD/USD buyers manage to cross the 0.7170 hurdle, the monthly peak of 0.7200 and October’s high around 0.7220 will be in focus.
NZD/USD: Four-hour chart
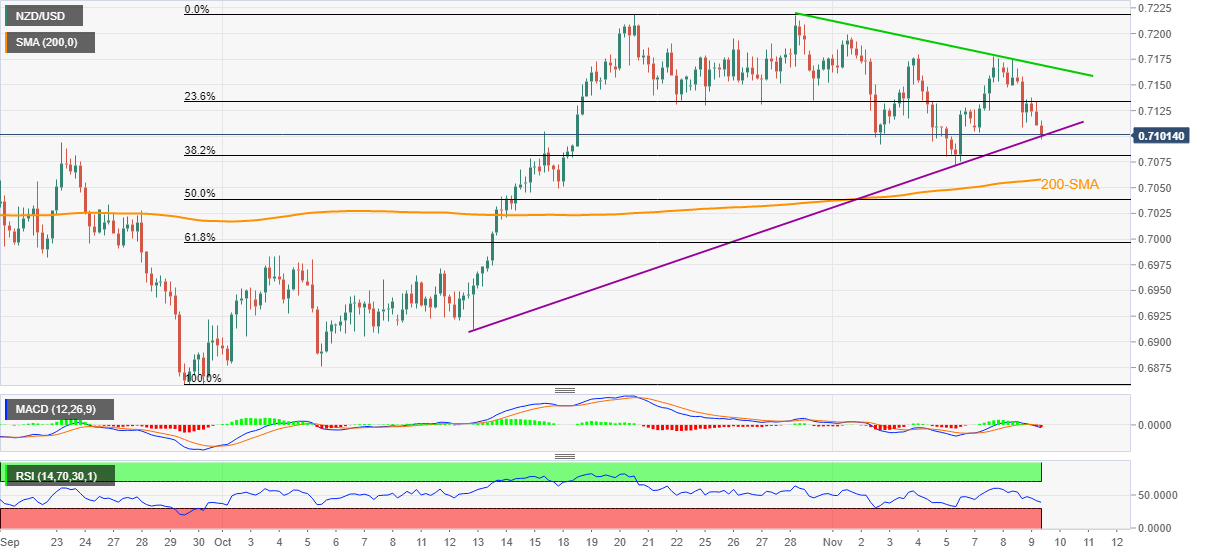
Trend: Further weakness expected
CME Group’s flash data for crude oil futures markets noted traders scaled back their open interest positions for the third consecutive session on Tuesday, now by around 9.2K contracts. On the flip side, volume reversed two daily drops in a row and went up by around 330.5K contracts.
WTI remains capped near $85.00
Prices of the WTI faltered just ahead of the $85.00 mark per barrel on Tuesday. The 3-day positive streak was amidst shrinking open interest, which notes the presence of short covering behind the move higher. That said, a potential corrective move could be in the offing once the short covering finishes.
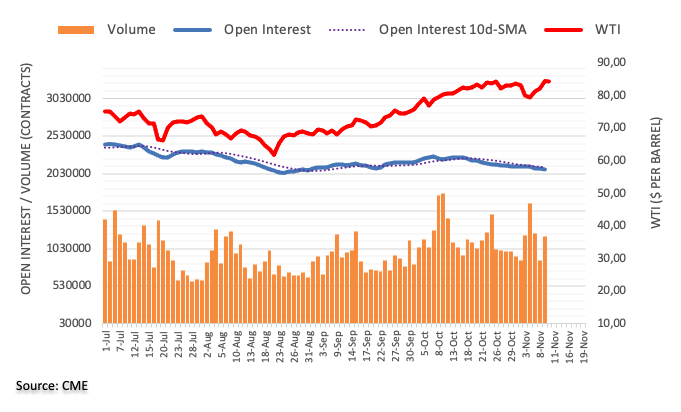
- Gold snaps four-day uptrend, reverses from two-month high.
- Market sentiment worsens as reflation fears escalate ahead of US CPI.
- China, stimulus headlines add to the risk-off mood.
- Gold Price Forecast: Looking to extend its rally beyond September high
Gold (XAU/USD) takes offers to refresh intraday low near $1,825, flashing the first daily loss in a week heading into Wednesday’s European session. In doing so, the yellow metal steps back from a two-month high while failing to successfully cross the multi-month-old resistance line ahead of the key inflation data from the US.
Fears concerning inflation, worries emanating from China and doubts over the US stimulus underpin the rush to the risk-safety, which in turn helps the greenback and weigh on the gold prices.
Fed Chair Jerome Powell’s failure to placate rate hike bets, backed by the strong US inflation expectations, precede hawkish comments from St. Louis Federal Reserve (Fed) President James Bullard to highlight the latest relation fears. Fed’s Bullard spoke to CNBC early in Asia to convey expectations of expecting the US central bank to hike its benchmark rate twice in 2022, after it’s finished with winding down its bond-buying program.
On a different page, a 50% slump in share prices of China’s real estate player Fantasia Group after a month-long trading halt and Evergrande’s coupon payment date joins strong inflation numbers from Beijing to weigh on the risk appetite.
Against this backdrop, S&P 500 Futures decline 0.40% whereas the US 10-year Treasury yields consolidate the previous day’s losses around the six-week low near 1.46%.
Looking forward, inflation numbers from the US will be the key catalyst for short-term gold moves. Should the price pressure remain escalated, the USD strength could keep the quote directed towards the south.
Read: US October CPI preview: Inflation data unlikely to discourage gold bulls
Technical analysis
Gold keeps the upside break of a two-month-old horizontal hurdle, now support, while easing from a descending resistance line from August 2020.
Although MACD signals do favor buyers, the RSI line needs more fuel as the metal inches closer to a 15-month-old resistance line near $1,832, not to forget the key $1,834-35 resistance line that defeated bulls twice since July.
Hence, a weekly closing beyond $1,835 becomes necessary for the gold prices to rise further towards early June’s low near $1,857-58 and then to the $1,900 threshold.
Failing to which could trigger a pullback targeting the resistance-turned-support from mid-September, near $1,808-10.
It should be noted, however, that an ascending trend line from August near $1,750, will challenge the gold bears afterward.
Gold: Weekly chart
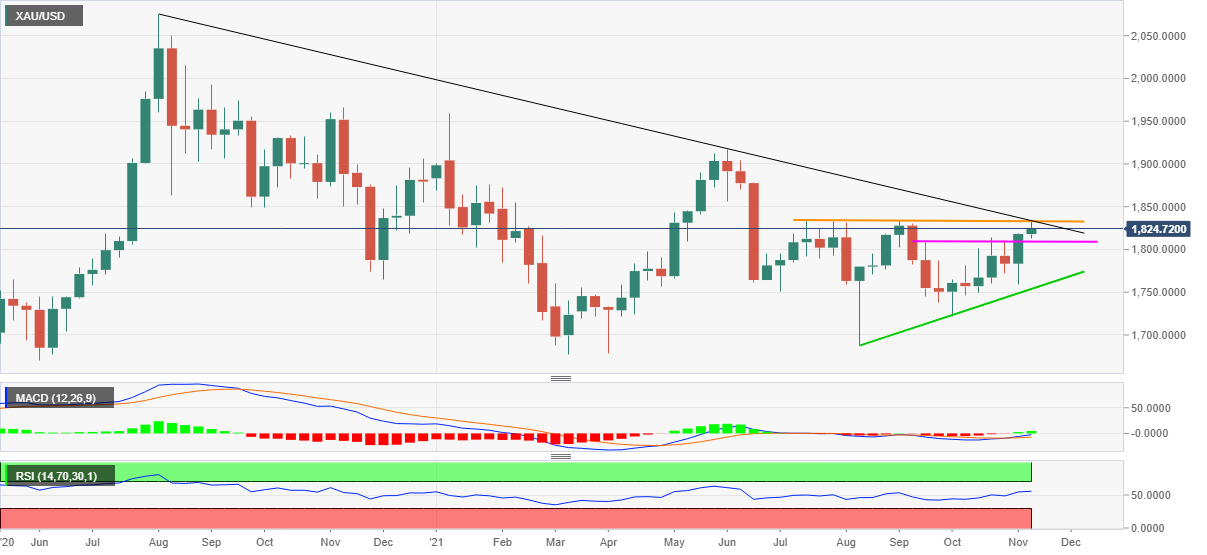
Trend: Pullback expected
Open interest in gold futures markets increased for the fourth consecutive session on Tuesday, this time by around 11.2K contracts considering preliminary readings from CME Group. In the same line, volume went up by around 43.7K contracts, extending the erratic performance recorded as of late.
Gold looks to surpass $1,830
Gold prices met the key resistance hurdle in the $1,830 region per ounce troy on Tuesday. The recovery in the precious metal was once again in tandem with rising open interest, which remains supportive of further gains in the very near term.
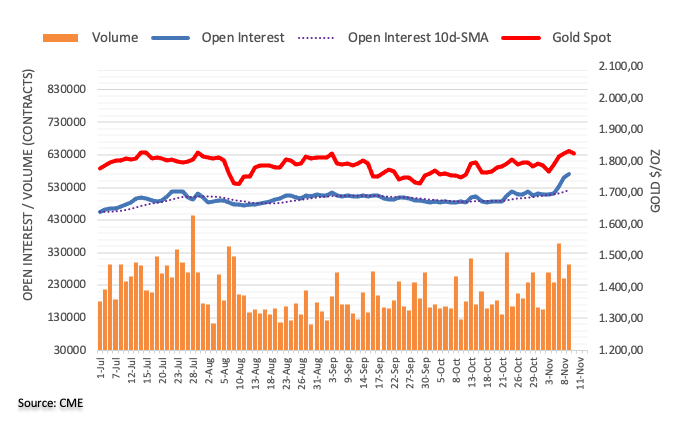
“The Asian giant is ready to work to enhance exchanges and cooperation across the board,” per China President Xi Jinping, said Reuters quoting a letter read by Qin Gang, Chinese ambassador to the US.
“China stands ready to work with the United States to properly manage differences,” adds China’s Xi per Reuters.
FX implications
Early in Asia news over the next week’s virtual meeting between the leaders of the US and China crossed wires. However, the reflation fears join sentiment-negative headlines concerning Beijing-based real-estate firmer to weigh on the mood of late.
That said, S&P 500 Futures decline 0.40% whereas the US 10-year Treasury yields consolidate the previous day’s losses around the six-week low near 1.46%.
Read: US Treasury yields rebound from six-week low but no mercy for S&P 500 Futures
- EUR/USD snaps three-day rebound from yearly bottom, pressured around intraday low of late.
- Risk-off mood joins rebound of Treasury yields to underpin US dollar strength.
- Inflation, stimulus and China headlines weigh on sentiment.
- US CPI, Fed/ECB chatters eyed for fresh impulse.
EUR/USD prints mild losses around 1.1580, posting first intraday losses in four days heading into European session on Wednesday. The currency major portrays the US dollar rebound, tracking the US Treasury yields amid sour sentiment ahead of the US Consumer Price Index (CPI) data.
In addition to the fresh fears concerning inflation, worries emanating from China also underpin the rush to the risk-safety, which in turn helps the greenback of late.
Policymakers at the US Federal Reserve (Fed) and the European Central Bank (ECB) have been trying to reject rate hike concerns of late. Key among them was Fed Chair Jerome Powell, ECB policymaker Klaas Knot and top supervisor Andrea Enria. However, firmer inflation expectations in the US and Eurozone hint at the need for rolling back the easy money policies.
Recently, St. Louis Federal Reserve (Fed) President James Bullard said during the CNBC interview that he is expecting the US central bank to hike its benchmark rate twice in 2022, after it’s finished with winding down its bond-buying program.
Elsewhere, China’s factory-gate inflation jumped to a 26-year high in October whereas the headlines CPI also rose past market consensus and previous readouts, beefing the up reflation woes.
It should be noted that a 50% slump in share prices of China’s real estate player Fantasia Group after a month-long trading halt also backs the recent concerns over property players’ troubles in Beijing and weighs on the mood. The same could be witnessed in red prints of Chinese equities.
Against this backdrop, S&P 500 Futures decline 0.40% whereas the US 10-year Treasury yields consolidate the previous day’s losses around the six-week low near 1.46%.
Looking forward, inflation numbers from Germany may offer immediate direction to the EUR/USD prices ahead of the US CPI figures. Should the price pressure remain escalated, the USD strength could keep the quote directed towards the south.
Read: US October CPI preview: Inflation data unlikely to discourage gold bulls
Technical analysis
The pullback from 21-day EMA directs EUR/USD bears towards October lows near 1.1525. However, any further weakness will be challenged by the yearly low near 1.1515 and the 1.1500 threshold.
- USD/INR fades bounce off six-week low amid bearish MACD signals.
- Key DMA confluence restricts short-term advances before monthly resistance line.
- 61.8% Fibonacci retracement adds to the downside filters.
USD/INR consolidates the biggest daily gains in a month around 74.10 during early Wednesday.
The Indian rupee (INR) pair bounced off 200-DMA the previous day but fades recovery below a convergence of the 100-DMA and 50-DMA of late.
Given the bearish MACD signals and the pair’s inability to keep the rebound above the key DMA, USD/INR prices are likely to remain pressured.
Hence, the 74.00 threshold seems immediate support to watch before the 61.8% Fibonacci retracement (Fibo.) of August-October upside, around 73.95.
Should the quote drops below 73.95, the 200-DMA level of 73.83 will regain the market’s attention ahead of the mid-September lows close to 73.35.
Meanwhile, 50% Fibo. near 74.25 guards the quote’s immediate upside ahead of the stated DMA confluence around 74.30.
In a case where USD/INR bulls cross the 74.30 key hurdle, 74.70 and a one-month-old resistance line near the 75.00 round figure may flash on their radar.
USD/INR: Daily chart
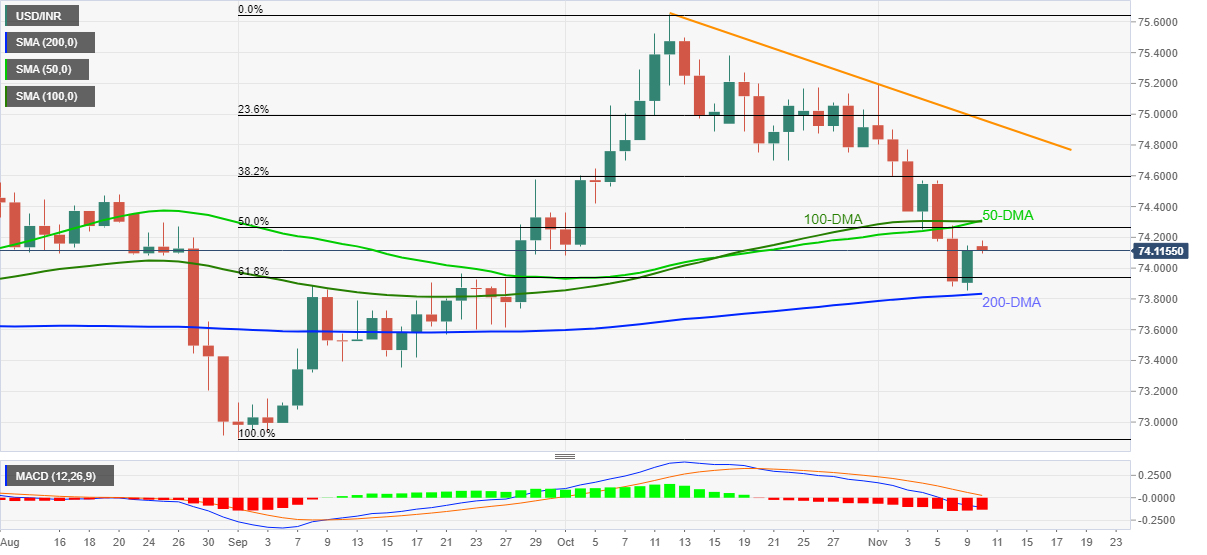
Trend: Further weakness expected
- Asian equities remain bearish as fears over inflation, Beijing based real-estate firms escalate.
- China factory-gate inflation refreshes 26-year high, CPI shoots as well.
- US CPI, PPI eyed amid Fed rate hike chatters, US stimulus in focus as well.
Asian shares track Wall Street losses during early Wednesday as reflation woes join sentiment-negative headlines from China.
While portraying the mood, the MSCI’s index of Asia-Pacific shares outside Japan drops 0.60% on a day whereas Japan’s Nikkei 225 prints 0.55% daily fall ahead of the European session.
Although Fed Chair Jerome Powell tried to placate rate hike speculations and was joined by that talks that a dove may preside on the Fed’s throne. However, St. Louis Federal Reserve (Fed) President James Bullard said during the latest CNBC interview that he is expecting the US central bank to hike its benchmark rate twice in 2022, after it’s finished with winding down its bond-buying program.
The inflation woes also preside in Asia as China Consumer Price Index (CPI) and Producer Price Index (PPI) cross the market consensus and previous readouts in October. That said, the PPI jumped to the fresh high in 26 years. It’s worth noting that a 50% slump in share prices of China’s real estate player Fantasia Group after a month-long trading halt also backs the recent concerns over property players’ troubles in Beijing and weighs on the mood. The same could be witnessed in red prints of Chinese equities.
Fears emanating from the world’s largest commodity user weigh on the Antipodeans and share prices in Australia as well as New Zealand, despite upbeat individual catalysts. Australia’s Westpac Consumer Confidence came in better for November whereas New Zealand eases lockdown in the biggest city Auckland.
Elsewhere, talks concerning US stimulus tried to tame the bears but the losses remain on the table. That said, South Korea’s KOSPI and Hong Kong’s Hang Seng drop around 1.0% whereas Indonesia’s IDX Composite prints 0.14% intraday loss by the press time.
Markets in India also track the Asia-Pacific counterparts while declining 0.50% at the latest.
On a broader front, S&P 500 Futures decline 0.40% whereas the US 10-year Treasury yields consolidate the previous day’s losses around the six-week low near 1.46%.
Moving forward, the risk-off mood is likely to prevail unless the inflation fears recede, which in turn highlights today US CPI and PPI data for October for fresh impulse.
Read: US October CPI preview: Inflation data unlikely to discourage gold bulls
- USD/TRY grinds higher around weekly top inside bullish chart pattern.
- Overbought RSI questions sustained trading beyond monthly support line to probe buyers.
- Convergence of 20-DMA, pennant’s support restricts short-term downside.
USD/TRY remains on the front foot around $9.7420, extending the previous day’s rebound from the monthly support during early Wednesday.
In doing so, the Turkish Lira (TRY) pair pokes the resistance line of a short-term bullish pennant. However, overbought RSI conditions test the pair buyers.
Hence, a pullback towards the October-end peak surrounding $9.6300 can be expected on the break of the immediate support line near $9.7220.
Though, a confluence of 20-DMA and the stated pennant’s support line will restrict the quote’s further weakness around $9.5270. In a case where USD/TRY drops below $9.5270, the October 19 peak of $9.3765 will be in focus.
Alternatively, a clear upside break of the $9.7450 immediate hurdle will confirm the bullish formation, directing the quote towards refreshing the record top of $9.8505. During the run-up, the $9.9000 psychological magnet may act as an intermediate halt.
USD/TRY: Daily chart

Trend: Further upside expected
- AUD/JPY defends 83.00, bears refuse to leave town.
- The yen remains underpinned as risk appetite wanes.
- The currency weighed heavy on multiple factors; AUD employment data eyed.
The AUD/JPY is trading just above the 83.00 level, lacking any traction to the upside. The cross continues its ongoing bearish momentum, which began on November 02 onwards. The pair is trading at 83.09, down 0.15% on the day.
The yen pushed higher alongside commodity currency as risk appetite waned overnight. US Treasury yields also fell across the curve, as markets digested news that dovish Fed Governor Lael Brainard has been interviewed for the Fed’s chair position. The pair’s currency ranges in the near term and looks to extend the hefty losses previously incurred.
To recap last week’s price action, the Reserve Bank of Australia’s (RBA) exit from yield curve control crashed markets through its cap on three-year bond yields. This illustrates the growing pressure on central banks to tighten monetary policy as the world economy recovers from the pandemic. But it has also exposed a serious problem causing stress to AUD/JPY with the whole yield curve control policy: unlike asset purchases, which can quickly be tapered when the economy improves, making a smooth exit from a cap on bond yields is challenging. That means the episode has important lessons for other central banks, such as the Bank of Japan (BoJ), which either use yield curve control or have considered the policy.
“Putting all the experience together it’s quite unlikely that we will have a yield target again,” said RBA governor Philip Lowe. “And it is not just because of the experience of last week,” he adds.
Looking ahead, the US CPI will be eyed, with the next relevant event in the Australian Employment data eagerly awaited on Thursday.
Technical Levels
The AUD/JPY daily chart indicates a major resistance at 84.77, 21-day Simple Moving Average (SMA). More towards the north 86.08, November 1st high can be tested. If it breaks the one-month high of 86.08 is the last barrier to the upside is seen at 87.00.
As for the support, the 200, 50 and 100-day SMA, with corresponding values at 82.85, 82.52 and 81.90 are the lines of defence for the pair.
The Moving Average Convergence Divergence (MACD) has a gradual bearish bias and the Relative Strength Index (RSI) has lit the sell-out signal.
Additional levels to watch
Analysts at Morgan Stanley expressed their bullish take on the Canadian dollar, recommending short positions in the EUR/CAD cross.
Key quotes
"We recommend investors position for continued CAD gains on crosses. October labor market data affirmed a positive trajectory in Canadian payrolls; we estimate that only 120k jobs remain to be filled to achieve the full labor market recovery the BoC is looking for to gauge progress toward sustainable closure of the output gap."
"CAD trades well below levels implied by the recent rise in oil prices and yield differentials, a relationship we expect to recouple as the COVID-19 crisis fades and USD's strong negative correlation to risk appetite continues to decline. We recommend short EUR/CAD positions, targeting 1.35."
- EUR/CAD Price Analysis: Hovers around 1.4425 failing to break resistance at 1.4460
| Raw materials | Closed | Change, % |
|---|---|---|
| Brent | 85.48 | 1.96 |
| Silver | 24.283 | -0.57 |
| Gold | 1831.487 | 0.4 |
| Palladium | 2019.6 | -2.56 |
- US 10-year Treasury yields consolidate weekly losses around lowest levels since late September.
- S&P 500 Futures remain pressured for the second consecutive day.
- China, inflation and US stimulus headlines weigh on sentiment ahead of US inflation.
Market’s mood remains downbeat during early Wednesday, even as the US Treasuries step back amid stimulus hopes. The reason could be linked to the ongoing inflation fears ahead of the US Consumer Price Index (CPI) and Producer Price Index (PPI) data.
That said, the US 10-year Treasury yields rise two basis points (bps) to 1.47%, bouncing off the lowest levels since September 20. However, the S&P 500 Futures remain on the back foot around 4,670, down 0.20% intraday at the latest.
Reflation fears are in full swing even as Fed Chairman Jerome Powell tried to cool it down the previous day. Recently, St. Louis Federal Reserve (Fed) President James Bullard said during the CNBC interview that he is expecting the US central bank to hike its benchmark rate twice in 2022, after it’s finished with winding down its bond-buying program. Following the last week’s firmer US jobs report for October, chatters over faster Fed rate hikes are on the table even as Fed’s Powell pushed for details in his latest speech.
Elsewhere, deadlock over the US stimulus challenges the risk appetite. US Treasury Secretary Janet Yellen crossed wires via NPR Marketplace interview and warned of a recession if the debt limit is not raised. The policymaker also said, “The Federal Reserve will not allow 1970s-style inflation to return.” On the same line were comments from White House Economic Advisor Brian Deese who expects a vote in the House next week on the larger social infrastructure package, per tweets from Fox Business reporter Edward Lawrence. “He says some House members will receive more information about how the bill will not add to the debt by the end of this week,” adds Fox’s Lawrence.
On a different page, a 50% slump in share prices of China’s real estate player Fantasia Group after a month-long trading halt also back the recent concerns over property players’ troubles in Beijing.
It’s worth noting that the US-China virtual meet, scheduled for next week joins US President Joe Biden’s optimism for stimulus to test the market bears of late.
Amid these plays, the US Dollar Index (DXY) snaps a three-day downtrend to regain the 94.00 threshold, up 0.05% intraday by the press time.
That being said, market sentiment is likely to remain sluggish as investors await the key inflation data from the US as policymakers jostle over the Fed’s next move and reshuffle talks.
Read: US October CPI preview: Inflation data unlikely to discourage gold bulls
When asked about debt, inflation, infrastructure and the economy, US Treasury Secretary Janet Yellen warned of a likely recession if the debt ceiling is not raised, in an interview with NPR Marketplace early Wednesday.
Additional quotes
“Both the Republican Party and the Democrats should raise the debt ceiling.”
“Congress will enact a debt-limit bill.”
“The Build Back Better program is anti-inflationary in the medium term.”
“The Federal Reserve will not allow 1970s-style inflation to return.”
“Inflation will be closely monitored; the Federal Reserve is already doing so.”
Related reads
- US Pres. Biden-China’s Pres. Xi virtual meeting planned for as soon as next week – Reuters
- US Dollar Index Price Analysis: DXY bounces off 200-SMA to poke 94.00
US President Joe Biden and his Chinese counterpart Xi Jinping are likely to hold their first virtual meeting as soon as next week, Reuters reported, citing a person with knowledge of the matter.
Key takeaways
“Stakes for the meeting are high – Washington and Beijing have been sparring on issues from the origins of the pandemic to China's expanding nuclear arsenal – but Biden's team has so far set low expectations for specific outcomes.”
“Experts believe the two sides may work toward an agreement to relax curbs on visas for each other's journalists and have also said a deal to reopen consulates in Chengdu and Houston shuttered in a diplomatic dispute in 2020 could help improve the mood.”
Market reaction
AUD/USD is holding the lower ground near 0.7370, unimpressed by the above piece of news while the S&P 500 futures drop 0.22% on the day, in anticipation of the US inflation data.
- USD/CNH takes the bids to refresh intraday high following China’s key inflation data for October.
- Bearish MACD signals, sustained trading below weekly resistance line and 200-HMA favor sellers.
USD/CNH rises to $6.3920 following an upbeat China inflation release on early Wednesday. In doing so, the offshore Chinese currency (CNH) pair rebounds from the 61.8% Fibonacci retracement (Fibo.) of October 25-29 upside.
However, the cross-currency pair remains below the weekly resistance line and 200-HMA amid bearish MACD signals, which in turn suggests brighter hopes for the sellers.
That being said, the quote’s pullback may need validation from the stated key Fibo. level of $6.3885 before attacking the latest swing lows near $6.3865.
Following that, the $6.3800 threshold and the yearly low surrounding $6.3685 should lure the USD/CNH sellers.
Meanwhile, an upside clearance of the stated trend line hurdle and the 200-HMA, respectively around $6.3935 and $6.3965, should recall the pair buyers.
Even so, the $6.4000 round figure and $6.4060 may test the USD/CNH bulls before directing them to the monthly peak of $6.4094.
USD/CNH: Hourly chart
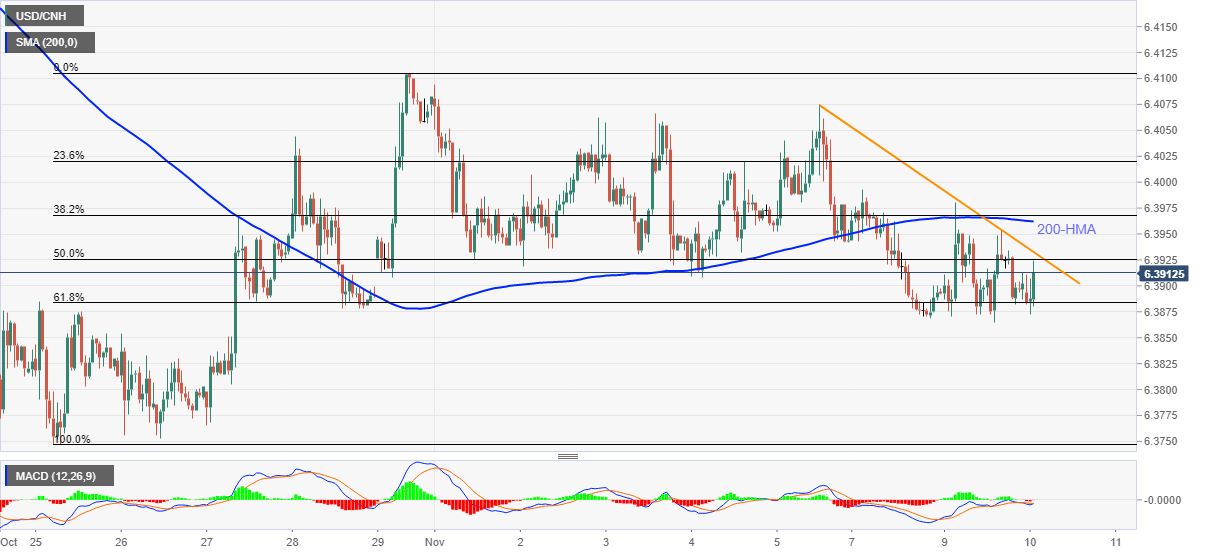
Trend: Bearish
In the view of the analysts at Goldman Sachs, China's energy shortages and zero-COVID policy pose a risk to the optimism over easing supply bottlenecks.
Key quotes
“China’s energy shortages, zero-COVID policy create considerable uncertainty.”
“China is home to 30% of the global manufacturing capacity.”
“Current low levels of natural immunity suggest that a rise in virus spread during the winter could lead to renewed lockdowns.“
“The danger of these is that they extend supply chain disruptions and delay the normalization of input cost pressures.”
“We see reasons for optimism regarding the resolution of supply chain bottlenecks and easing cost pressures, but risks remain.”
“Shipping rates have generally declined from September's peak, and a number of companies have recently indicated optimism that supply chains are inflecting for the better. including a number of Automakers.
“According to GXO Logistics, "we're through the worst of it" and "things will look a bit smoother as we move forward." However, the latest ISM Manufacturing report showed worsening survey responses regarding supplier delivery times.”
- AUD/USD remains on the back foot for second consecutive day after China CPI, PPI.
- China CPI, PPI both crossed market forecasts and prior readings in October.
- Risk-off mood, firmer Treasury yields exert additional downside pressure.
- US inflation, stimulus headlines and risks from China property market in focus.
AUD/USD refrains from cheering strong inflation numbers from China during early Wednesday, down 0.18% intraday near the daily low of 0.7366.
China’s headline Consumer Price Index (CPI) rose past 1.4% market consensus and 0.7% previous readings to 1.5% YoY. On the same line, the Producer Price Index (PPI) refreshed a multi-month high with the 13.5% yearly figure compared to 12.4% expected and 10.7% prior.
Read: Higher Oct Chinese CPI fails to move the needle on AUD/USD
Although upbeat inflation data from the key customer helped AUD/USD bears to take a breather, sour sentiment weighs on the quote due to its risk barometer status.
The market’s mood worsens of late inflation concerns mount, pushing the US Federal Reserve (Fed) towards a faster run to the rate hike cycle, as recently cheered by the St. Louis Federal Reserve President James Bullard. The Fed member appeared during the CNBC interview while expecting the US central bank to hike its benchmark rate twice in 2022, after it’s finished with winding down its bond-buying program.
Further, US Treasury Secretary Janet Yellen crossed wires via NPR Marketplace interview and warned of a recession if the debt limit is not raised. The policymaker also said, “The Federal Reserve will not allow 1970s-style inflation to return.”
Elsewhere, a 50% slump in share prices of China’s real estate player Fantasia Group after a month-long trading halt also back the recent concerns over property players’ troubles in Beijing.
Alternatively, White House Economic Advisor Brian Deese expects a vote in the House next week on the larger social infrastructure package, per tweets from Fox Business reporter Edward Lawrence. “He says some House members will receive more information about how the bill will not add to the debt by the end of this week,” adds Fox’s Lawrence.
Amid these plays, the US 10-year Treasury yields rise 1.2 basis points (bps) to 1.46% while the S&P 500 Futures drop 0.20% intraday by the press time.
Having witnessed the initial market reaction to China's inflation numbers, the AUD/USD traders will wait for the US CPI and PPI data for fresh impulse. Also important will be the updates on the US stimulus and China real-estate major Evergrande as a coupon payment is due for the struggling firm on Wednesday.
Read: US October CPI preview: Inflation data unlikely to discourage gold bulls
Technical analysis
AUD/USD justifies the downside break of the 200-SMA and descending RSI line on the four-hour (4H) chart, not to forget mentioning that recently bearish MACD signals. Though, the double bottoms marked around 0.7360 restricts the quote’s immediate downside before directing it to the 61.8% Fibonacci retracement (Fibo.) of the September-October uptrend, near 0.7315. Meanwhile, a clear upside break of the 200-SMA hurdle around 0.7385 needs validation from the 0.7400 round figure to aim for a convergence of the 100-SMA and 23.6% Fibo. close to 0.7470.
In recent trade today, the People’s Bank of China (PBOC) set the yuan (CNY) at 6.3948 vs. the estimated 6.3952.
About the fix
China maintains strict control of the yuan’s rate on the mainland.
The onshore yuan (CNY) differs from the offshore one (CNH) in trading restrictions, this last one is not as tightly controlled.
Each morning, the People’s Bank of China (PBOC) sets a so-called daily midpoint fix, based on the yuan’s previous day closing level and quotations taken from the inter-bank dealer.
The October Consumer Price Index has been released alongside the Produce Price Index. Persistent weakness in consumer inflation was expected despite robust upstream price pressures. However, both came with an upside surprise as follows:
October CPI +1.5 pct from a year ago vs the 0.7% prior. (Reuters poll +1.4 pct).
October CPI +0.7 pct from previous month (Reuters poll +0.7 pct).
China says October food CPI -2.4 pct from a year ago; non-food CPI +2.4 pct.
Chinese PPI (YoY) Oct: 13.5% vs 10.7 prior. (Exp 12.3%; prev 10.7%).
AUD/USD update
Nevertheless, AUD/USD remains steady around 0.7370 on the release as traders await the more highly anticipated US inflation data later today.
October’s US CPI result is expected to be driven by a lift in core prices. ''A 0.6% rise in overall CPI would take the annual inflation rate to 5.9%, which would be the highest inflation rate since 1990,'' analysts at Westpac explained.
In other data that will be key for AUD traders will be the Aussie jobs report on Thursday.
''The RBA is upbeat on the labour market and expects jobs to fully recover to pre-Delta levels (Aug) by year-end (as stated in its Nov SoMP),'' analysts at TD Securities explained.
''There is still a shortfall of 284k jobs and jobs could return quickly given the easing in restrictions in NSW and VIC. Participation rate is expected to pick up to 65% in tandem with the reopening, bringing the u/e rate to 4.7% from 4.6%.''
About Chinese CPI
The Consumer Price Index is released by the National Bureau of Statistics of China. It is a measure of retail price variations within a representative basket of goods and services. The result is a comprehensive summary of the results extracted from the urban consumer price index and rural consumer price index. The purchase power of the CNY is dragged down by inflation.
The CPI is a key indicator to measure inflation and changes in purchasing trends. A substantial consumer price index increase would indicate that inflation has become a destabilizing factor in the economy, potentially prompting The People’s Bank of China to tighten monetary policy and fiscal policy risk. Generally speaking, a high reading is seen as positive (or bullish) for the CNY, while a low reading is seen as negative (or Bearish) for the CNY.
| Time | Country | Event | Period | Previous value | Forecast |
|---|---|---|---|---|---|
| 01:30 (GMT) | China | PPI y/y | October | 10.7% | 12.4% |
| 01:30 (GMT) | China | CPI y/y | October | 0.7% | 1.4% |
| 06:00 (GMT) | Japan | Prelim Machine Tool Orders, y/y | October | 71.9% | |
| 07:00 (GMT) | Germany | CPI, m/m | October | 0% | 0.5% |
| 07:00 (GMT) | Germany | CPI, y/y | October | 4.1% | 4.5% |
| 13:30 (GMT) | U.S. | Continuing Jobless Claims | October | 2105 | 2095 |
| 13:30 (GMT) | U.S. | Initial Jobless Claims | November | 269 | 265 |
| 13:30 (GMT) | U.S. | CPI, m/m | October | 0.4% | 0.6% |
| 13:30 (GMT) | U.S. | CPI excluding food and energy, m/m | October | 0.2% | 0.3% |
| 13:30 (GMT) | U.S. | CPI, Y/Y | October | 5.4% | 5.8% |
| 13:30 (GMT) | U.S. | CPI excluding food and energy, Y/Y | October | 4% | 4.3% |
| 15:00 (GMT) | U.S. | Wholesale Inventories | September | 1.2% | 1.1% |
| 15:30 (GMT) | U.S. | Crude Oil Inventories | November | 3.291 | 2.125 |
| 19:00 (GMT) | U.S. | Federal budget | October | -62 | -179 |
| 21:45 (GMT) | New Zealand | Food Prices Index, y/y | October | 4% |
- DXY snaps three-day downtrend near weekly low, picks up bids of late.
- 50% Fibonacci retracement adds strength to the immediate support.
- Momentum line also favors corrective pullback towards thee-week-old resistance area.
US Dollar Index (DXY) consolidates recent losses around 94.00 during early Wednesday. In doing so, the greenback gauge licks its wounds near the weekly low following a three-day fall.
The rebound takes place from a convergence of the 200-SMA and 50% Fibonacci retracement (Fibo.) of October 28 to November 05 upside, around 93.95. Also favoring the corrective pullback is the Momentum line that recently bounced off the monthly bottom.
That being said, the US Dollar Index recovery moves look to a horizontal area comprising multiple levels marked since October 18 near 94.20. However, 23.6% Fibo. and October’s peak, respectively near 94.30 and 94.55, will challenge the bulls afterward.
Should the quote rises past 94.55, the multi-month high marked the last week around 94.65 and the 95.00 threshold will be in focus.
Meanwhile, further weakness past 93.95 support confluence will direct DXY bears to the 61.8% Fibonacci retracement level of 93.80.
In a case where the greenback remains weak past 93.80, bottoms marked during late October near 93.50 and the last month’s low of 93.27 should gain the market’s attention.
DXY: Four-hour chart
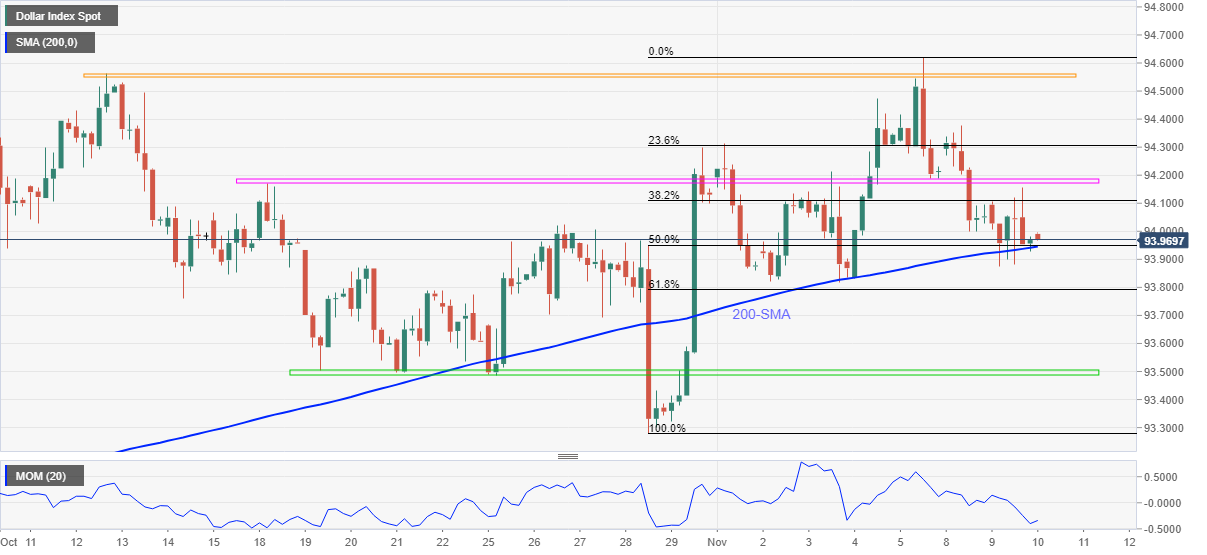
Trend: Further recovery expected
- The risk-off sentiment undervalued JPY's safe-haven appeal.
- USD/JPY weighed heavily on the back of Japan's real wages decline, report.
- The pair look for impetus from US CPI amid a light economic calendar.
USD/JPY is trading under the 113.00 mark during early Asian session hours on Wednesday. The pair pushed lower alongside commodity currencies as risk appetite reversed overnight. As of now, a tight currency range is expected in the near term as markets look ahead to US CPI.
After falling from the 114.00 level, Japan's Current Account balance shrank below the ¥1060B forecast to ¥1033.7B in September, which weighed on the USD/JPY prices.
Also, in the news, Japan being the world's third-largest economy hit hard by the coronavirus pandemic, Prime Minister Fumio Kishida is set to map out and secure funding for a stimulus package worth more than 30 trillion yen ($265 billion) within the year.
It is to be noted that Reuters reported that "Japan's real wages declined in September for the first time in three months as inflation picked up faster than growth in nominal pay, the government said''. The news agency said that this is a sign of global cost-push inflation starting to affect Japanese households. This information has weighed heavy on the quote's price action.
Meanwhile, the US dollar index is moving below 94.00, down by 0.09% on the day. Treasury yields fell across the curve as markets digested news that dovish Fed Governor Lael Brainard has been interviewed for the Fed's chair position. This should see local rates markets open to a bid tone.
Amid a light economic docket in Japan, the pair will find impetus from the critical US inflation figures.
Technical levels
The USD/JPY daily chart indicates 113.76, 21-day Simple Moving Average (SMA), as immediate resistance to the upside. If it's breached, the pair's one-week high of 114.44 will be the next topside barrier. The next resistance would be one month's high at 114.70.
The price may reverse and continue the downtrend towards the support levels of 111.96, 110.03 and 109.78, which are the pair's 50, 100 and 200-day SMAs respectively. Following the Moving Average Convergence Divergence (MACD), the movement shows a cautious dive. The Relative Strength Index (RSI) looks cheerful but manages to stay below the 50-line horizon.
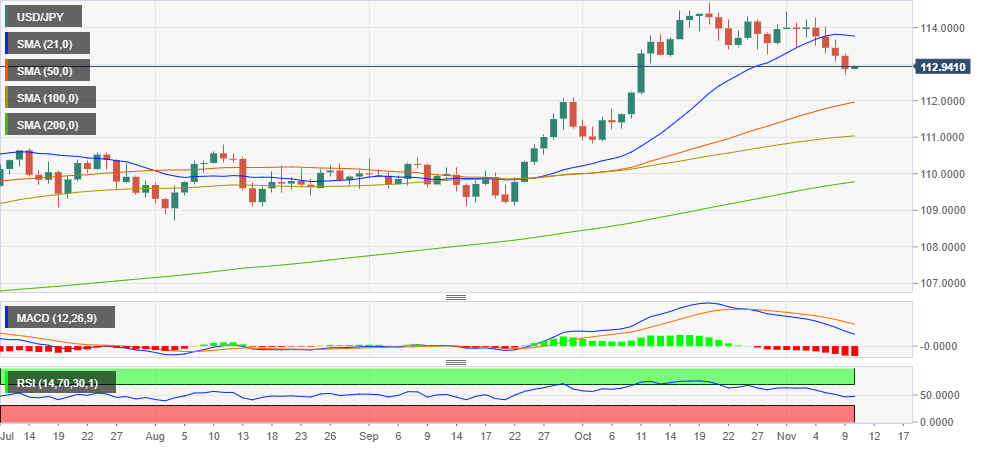
We heard from the more hawks of Federal Reserve officials, James Bullard, on Tuesday. He is being quoted again around the wires in Asia. CNBC is reporting that he told the news agency that he’s currently expecting the US central bank to hike its benchmark rate twice in 2022 after it’s finished winding down its bond-buying program.
''Bullard added the caveat that his viewpoint was based on current economic data and that his prediction could change as time progresses.''
“What we can do is assess the situation next spring and see where we’re at, and at that point, we can make a decision about raising the policy rate,” Bullard told CNBC’s Julianna Tatelbaum in an interview recorded Tuesday at the UBS European Conference.
In the New York session, Bullard had repeated that the Fed may have to move faster if inflation pressures persist. He has forecasted an Unemployment Rate near 3%, noting the labour market is very tight and will remain so, with Gross Domestic Product growth over 4% next year.
“Based on where I think we are today I actually have two rate increases pencilled in for 2022 ... that could change by the time we get into the first half of next year in either direction really.”
Market implications
While Bullard is not a voting member on the Fed’s policymaking committee in 2021, he will be in 2022 and his opinions are known to move the needle in forex. However, markets are holding tight in anticipation of the US Consumer Price Index today, so there has been no reaction to the headlines thus far.
- USD/CHF bears take a pause following the biggest daily fall in a week.
- Risk appetite weakens amid reflation fears, US stimulus headlines.
- US Treasury yields seesaw around six-week low, DXY stays pressured.
- US CPI becomes the key concern as Fedspeak rejects ‘transitory’ concerns.
USD/CHF picks up bids to refresh intraday high near 0.9115, consolidating the previous day’s losses during early Wednesday. The Swiss currency (CHF) pair seems to track the consolidation in the US Treasury yields to lick Tuesday’s wounds ahead of the key US inflation numbers for October.
On Tuesday, the risk-off mood weighed on the US Treasury yields and the US Dollar Index (DXY) but the bulls have recently been cautious amid slightly positive headlines over US stimulus, as well as expectations of two Fed rate hikes in 2022. That said, the DXY dropped for three consecutive days in the last before recently taking rounds to 93.95.
White House Economic Advisor Brian Deese expects a vote in the House next week on the larger social infrastructure package, per tweets from Fox Business reporter Edward Lawrence. “He says some House members will receive more information about how the bill will not add to the debt by the end of this week,” adds Fox’s Lawrence.
On a different page, US Treasury Secretary Janet Yellen crossed wires via NPR Marketplace interview while warning of a recession if the debt limit is not raised. The policymaker also said, “The Federal Reserve will not allow 1970s-style inflation to return.”
It’s worth noting that St. Louis Federal Reserve President James Bullard told, per the CNBC, “Currently expecting the US central bank to hike its benchmark rate twice in 2022, after it’s finished with winding down its bond-buying program.”
It should be noted that Fed Chairman Jerome Powell’s comments, published the previous day, tried to tame the inflation fears but couldn’t. Also challenging the market sentiment is the anxiety over Fed reshuffle and indecision concerning the US stimulus, as well as Sino-American leaders’ virtual meeting next week.
Against this backdrop, US 10-year Treasury yields rise 1.2 basis points (bps) to 1.46% while the S&P 500 Futures drop 0.17% intraday by the press time.
Looking forward, US inflation figures become the key catalyst for the USD/CHF traders as firmer price pressure leads to faster rolling back of the Fed’s easy money, which in turn can help the quote to pare recent losses.
Read: US October CPI preview: Inflation data unlikely to discourage gold bulls
Technical analysis
The monthly resistance line precedes the 200-DMA, respectively around 0.9130 and 0.9160, to restrict short-term up-moves of the USD/CHF prices. With the bearish MACD signals and the pair’s sustained trading below the stated resistances, the quote is likely declining towards the monthly low near 0.9090.
- Gold is on the verge of a major breakout, analysts predict.
- The yellow metal sits in bullish territory as real yields stay firmly in the red.
- US CPI and Chines inflation data are the ones to watch for the day ahead while dovish sentiment circles the Fed.
In a quiet start to the day on Wednesday, the price of gold is sitting perched in a bullish territory around $1,830 and flat so far. The recent rally in gold paused on Tuesday as the market looks to key US inflation data from both the US and China.
A sharp drop in real yields has supported the yellow metal this week as inflation expectations have risen notably. However, the central; bank's transitory mantra has also dialled back rate hike expectations which have weighed don the greenback and higher-yielding currencies, giving gold an edge.
On Tuesday, risk sentiment weakened, the S&P 500 snapping an 8-day winning streak. Risk-sensitive currencies and bond yields fell, albeit without an obvious catalyst. The moves in the New York session came relatively late in the morning trade and some time after the PPI data hit the screens. The dollar oscillated in a tight range after data showed US Producer Prices increased solidly in October, indicating that high inflation could persist for a while amid tight supply chains related to the pandemic.
However, traders were cautious to move into dollars ahead of today's highly anticipated event in the Consumer Price Index (CPI) data considering how hot of topic inflation is for markets. Importantly for gold prices, fixed income markets remained strong.
Bond prices were supported by speculation over forthcoming dovish leadership as markets digested news that dovish Fed Governor Lael Brainard has been interviewed for the Fed’s chair position. This is fanning expectations that the Fed will turn dovish. Biden has four Fed board nominations to make this month, including the Chair and Vice-Chair.
US bonds rallied and the curve bull flattened following a global bond rally in a risk-off shift in global sentiment. The 2-year government bond yields fell from 0.43% to 0.41%. The 10-year government bond yields fell from 1.49% to 1.41%.
Key events from Tuesday for gold
US PPI inflation data in October matched expectations at 0.6% MoM and 8.6% YoY, with the ex-food and energy measure steady at 6.8% YoY which is a record high. ''Large energy price gains in November, alongside worsening supply chain bottlenecks, suggest that the YoY gains will continue to rise into year-end, even as base effects dissipate,'' analysts at Westpac explained.
As for Fed speakers, St. Louis Fed president James Bullard repeated that the Fed may have to move faster if inflation pressures persist. San Francisco Fed president Mary Daly expressed a more dovish stance, saying that given the high degree of uncertainty in the labour market and on inflation, the best approach is to hold steady. Fed's Neel Kashkari said supply and demand shocks are expected to be temporary.
Key events for the day, US CPI
The key events for the day are with China's Oct CPI and PPI and then in the New York sessions, US Oct CPI which should show the fastest inflation since 1990. ''October’s CPI result is expected to be driven by a lift in core prices,'' analysts at Westpac explained. ''A 0.6% rise in overall CPI would take the annual inflation rate to 5.9%, which would be the highest inflation rate since 1990.''
What bank analysts are saying about gold
Meanwhile, gold prices are on the cusp of a breakout, analysts at TD Securities argued. Key quotes:
''In fact, measured against other currencies, gold has broken out of the multi-month downtrend which formed from all-time highs. Considering the extremely poor sentiment in precious metals across the last few months, the bar is low for prices to slice through trendline resistance.''
''Yet, a recent CTA buying program has run out of steam, which leaves the potential breakout in discretionary traders' hands. From this perspective, we highlight that both traders long and short are holding outsized position sizes, but the hawks are more vulnerable to a squeeze.''
''After all, pricing for central bank hikes is in flux, particularly after having been distorted by the terrible liquidity in Treasuries following the recent positioning washout. US real yields are plummeting, in support of gold prices. Further, the market's microstructure still features little market depth, which suggests that a positioning squeeze could have an outsized impact on prices.''
''A breakout north of the multi-month downtrend could also help the trend of ETF outflows reverse, powering gold prices even higher. As for CTA trend followers, a break north of $1860/oz would be required for this cohort of funds to target a positive net length.''
- EUR/GBP remains sidelined following the rebound from weekly low.
- Bullish MACD keeps buyers hopeful but 200-DMA, multi-day-old resistance challenge upside.
- Seven-month-old horizontal support adds to the downside filters.
EUR/GBP struggles for clear direction around 0.8550, fading the previous day’s bounce off 50-DMA during early Wednesday. Earlier in the week, the quote failed to cross a convergence of the 200-SMA and a descending trend line from December 2020.
Even so, the bullish MACD signals and the pair’s ability to stay beyond the stated DMA keep buyers hopeful to again battle with the 0.8580 resistance confluence.
Should the cross-currency pair manages to overcome the 0.8580 hurdle, the monthly high of 0.8595 and September’s peak near 0.8660 will be in focus.
Alternatively, a daily closing below the 100-DMA level of 0.8522 will direct EUR/GBP sellers towards a horizontal area including April’s low near 0.8470.
However, August month’s low of 0.8450 and the yearly bottom surrounding the 0.8400 psychological magnet will restrict the quote’s downside past 0.8470.
To sum up, EUR/GBP remains in the bearish trajectory but gathers momentum to challenge the key resistance of late.
EUR/GBP: Daily chart
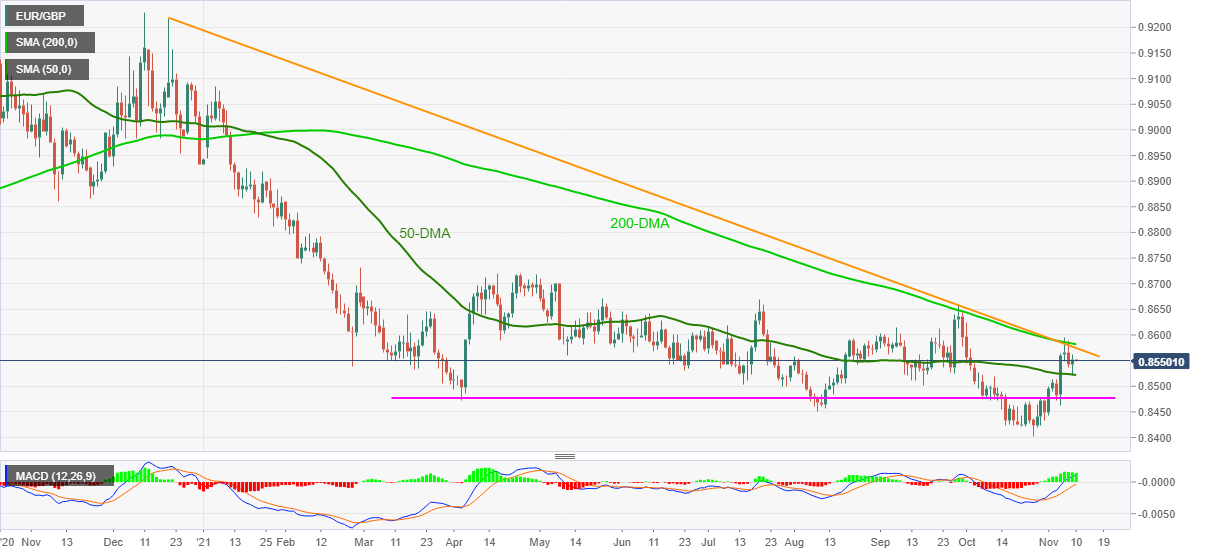
Trend: Further upside expected
| Pare | Closed | Change, % |
|---|---|---|
| AUDUSD | 0.73784 | -0.58 |
| EURJPY | 130.867 | -0.19 |
| EURUSD | 1.15937 | 0.09 |
| GBPJPY | 153.038 | -0.31 |
| GBPUSD | 1.35578 | 0 |
| NZDUSD | 0.713 | -0.47 |
| USDCAD | 1.24356 | -0.03 |
| USDCHF | 0.91097 | -0.19 |
| USDJPY | 112.868 | -0.3 |


© 2000-2026. All rights reserved.
This site is managed by Teletrade D.J. LLC 2351 LLC 2022 (Euro House, Richmond Hill Road, Kingstown, VC0100, St. Vincent and the Grenadines).
The information on this website is for informational purposes only and does not constitute any investment advice.
The company does not serve or provide services to customers who are residents of the US, Canada, Iran, The Democratic People's Republic of Korea, Yemen and FATF blacklisted countries.
Making transactions on financial markets with marginal financial instruments opens up wide possibilities and allows investors who are willing to take risks to earn high profits, carrying a potentially high risk of losses at the same time. Therefore you should responsibly approach the issue of choosing the appropriate investment strategy, taking the available resources into account, before starting trading.
Use of the information: full or partial use of materials from this website must always be referenced to TeleTrade as the source of information. Use of the materials on the Internet must be accompanied by a hyperlink to teletrade.org. Automatic import of materials and information from this website is prohibited.
Please contact our PR department if you have any questions or need assistance at pr@teletrade.global.
transfers