- Analytics
- News and Tools
- Market News
CFD Markets News and Forecasts — 22-05-2023
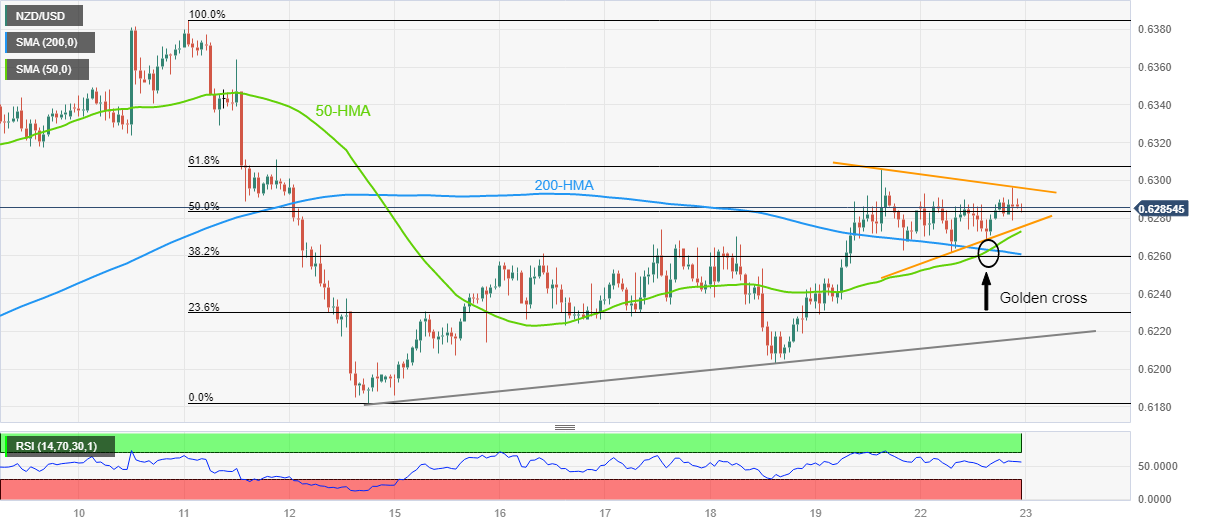
- NZD/USD remains depressed inside immediate triangle formation.
- Golden cross, steady RSI keeps Kiwi pair buyers hopeful.
- Bulls need validation from 0.6310 to retake control.
NZD/USD remains mostly steady around 0.6285-80 as it makes rounds inside a symmetrical triangle formation established since the last Friday.
Even so, the Kiwi pair buyers remain hopeful amid the “golden cross” on the hourly chart. That said, the golden cross is a moving average crossover suggesting further upside of the underlying by the 50-SMA’s piercing of the 200-SMA from below.
Apart from the “golden cross”, a steady RSI (14) line also underpins the continuation of a slower grind toward the north.
However, the NZD/USD buyers need to cross the stated triangle’s upper line, around 0.6300 by the press time, for confirmation.
It’s worth noting that the 61.8% Fibonacci retracement level of its May 11-12 downturn, near 0.6310, may act as the final defense of the Kiwi pair sellers before directing the quote towards the monthly high surrounding 0.6385.
On the contrary, a downside break of the stated triangle’s bottom line, close to 0.6275 at the latest, isn’t an open invitation to the NZD/USD bears as 50-SMA and 200-SMA, respectively near 0.6270 and 0.6260, can prod the downside moves.
Following that, the one-week-old ascending support line, close to 0.6215 at the latest, appears the key to watch for the pair sellers to break before taking control.
NZD/USD: Hourly chart
Trend: Further recovery expected
- EUR/GBP is looking to recapture the 0.8700 resistance as the focus shifts to UK inflation.
- The street is concerned over UK’s growth potential due to labor market shortages and ongoing low investment and productivity growth.
- A decline in the pace of interest rate hike to 25 bps would allow the ECB to sustainably keep pressure on inflation.
The EUR/GBP pair has rebounded sharply to 0.8695 after a wild gyration move in the early Tokyo session. The cross is looking to recapture the round-level resistance of 0.8700 ahead of the United Kingdom Inflation data, which is scheduled for Wednesday.
As per the preliminary report, the headline UK Consumer Price Index is seen at 8.3%, significantly lower than the prior release of 10.1% annually. Monthly headline CPI has shown a steady growth at 0.8%. Core CPI that excludes the impact of oil and food prices is expected to remain stable at 6.2%.
A decline in monthly UK inflation could be the outcome of lower energy prices. The UK economy has been facing the heat of labor shortages and high food inflation. A steep deceleration in UK inflation might allow the Bank of England (BoE) to pause its policy-tightening spell ahead. Investors should note that BoE Governor Andrew Bailey has already raised interest rates to 4.5%.
Analysts at Rabobank are anticipating decent gains in the EUR/GBP pair in a 9-12 month view. They believe that in that time frame, the market is likely to be focused on the prospect of looser monetary conditions from both the European Central Bank (ECB) and the BoE. Our expectation of GBP underperformance over the medium term is drawn from concerns over UK growth potential related to labor market shortages and ongoing low investment and productivity growth in the UK.”
Meanwhile, Eurozone investors are confident that more interest rate hikes will be welcomed by ECB President Christine Lagarde to tame stubborn inflation. Also, a decline in the pace of interest rate hikes from 50 basis points (bps) to 25bps might allow the ECB to sustainably keep pressure on Eurozone inflation.
“Meeting with US President Joe Biden was ‘productive’ but no agreement had yet been reached on the debt ceiling,” said US House Speaker Kevin McCarthy late Monday per Reuters. The US policymaker spoke after his much-anticipated meeting with US President Biden.
It’s worth noting that a US Republican Patrick Mchenry also crossed wires, via Reuters while saying, “We have a little more of the details we need to get to a package that can pass Congress.”
Additional comments
The meeting was productive in areas where we have differences of opinion.
Tone of discussion was improved from previous times.
Not willing to talk about raising revenue, problem is spending not revenue.
Staff level talks will continue.
Not willing to talk about raising revenue.
Staff will continue to get back together.
Both agreed we want to come to an agreement.
Confident that Biden wants to make a deal.
Instructed negotiators to come back together and find common ground.
Not going to waive the 72-hour rule.
Defense cuts are not on the table.
I believe we can get a deal done.
Nothing is agreed to, everything is being talked about.
Biden and I will talk everyday until we get this done.
Don't think a short-term extension benefits anybody.
Market reaction
The news allowed the US Dollar to pick up bids to 103.25, after an upbeat start of the week.
Also read: Forex Today: Quiet markets ahead of PMIs, awaiting a debt-limit deal
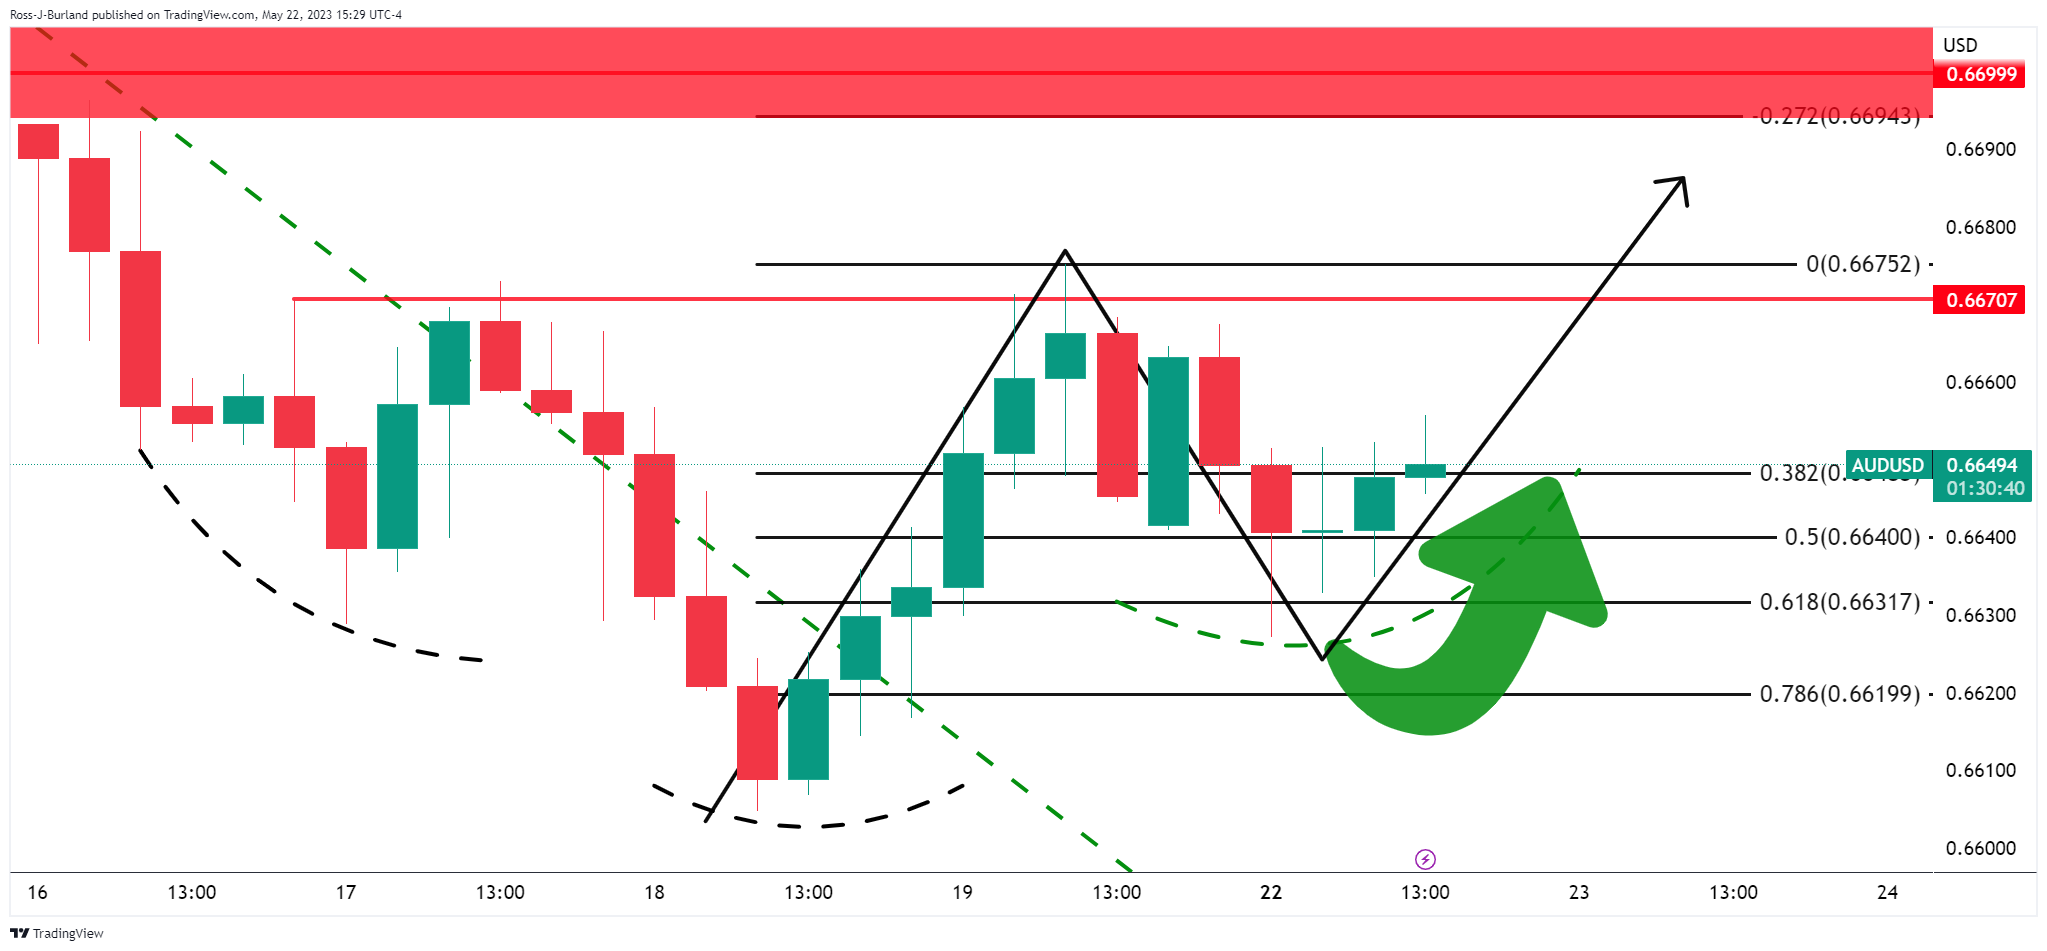
- AUD/USD reverses from intraday high to tease sellers after an inactive Monday.
- Australia’s preliminary S&P Global PMIs for May came in mixed.
- Market sentiment dwindles amid ongoing US debt ceiling negotiations, hawkish Fed concerns and China-linked news.
- US PMIs, risk catalysts will be the key to watch for clear directions.
AUD/USD fades bounce the previous day’s bounce off 0.6630 as it bears the burden of sluggish Australia activity data on early Tuesday. That said, the risk barometer pair marked an unimpressive performance on Monday amid mixed clues and sluggish markets. However, the quote is likely to witness further volatility as the economic calendar becomes active.
Australia’s first readings of the S&P Global Manufacturing PMI for May reprints 48.0 figures versus 47.3 expected whereas the Services PMI eased to 51.8 from 53.7 previous readings and 48.9 market forecasts. With this, the Composite PMI came in at 51.2 compared to 53.0 marked in April.
Elsewhere, the markets remain jittery as the US policymakers’ negotiations to seal the debt ceiling deal appear less impressive even as US President Joe Biden said that he believed they will make some progress on the debt ceiling talks. It should be noted that House Speaker Kevin McCarthy said, “We both believe we need to change the trajectory.”
“The Democratic president and the top congressional Republican have struggled to make progress on a deal, as McCarthy pressures the White House to agree to spend cuts in the federal budget that Biden considers ‘extreme,’ and the president pushes new taxes on the wealthy that Republicans reject,” reported Reuters.
On a different page, the Fed policymakers convey hawkish messages and allow the US Dollar, as well as the yields, to remain firmer, which in turn exerts downside pressure on the AUD/USD prices. That said, Minneapolis Federal Reserve President Neel Kashkari favored the rate hike trajectory while citing the fears of the US default and banking crisis, which in turn allowed the US Dollar to remain firmer. On the same line, St. Louis Federal Reserve President James Bullard ruled out the recession concerns on Monday while saying that He sees two more rate hikes this year before reaching the base rate. Furthermore, Atlanta Fed President Raphael Bostic, Richmond Fed President Thomas Barkin and San Francisco President Mary C Daly recently backed the calls for higher rates.
It’s worth observing that jitters surrounding China, Australia’s biggest customer also challenge the AUD/USD pair buyers, even if the latest headlines have been slightly positive. US Official recently mentioned that they’re working directly with China on the Micron issue. Beijing banned chips from US manufacturer Micron, after terming them a security threat, which in turn gave rise to a situation where Washington and Beijing exchanged harsh words. Additionally, the China Securities Journal (CSJ) cited the dragon nation’s sturdy economic transition while the People’s Bank of China (PBoC) defends its status quo, which in turn favors commodity prices, including WTI, due to China’s dominance as the world’s biggest industrial player.
Against this backdrop, Wall Street ended the day mixed but the US Treasury bond yields remained firmer. That said, the US 10-year and two-year Treasury bond yields remain indecisive around the highest levels in 10 weeks after rising for the last seven consecutive days, around 3.72% and 4.32% at the latest.
Having witnessed the initial reaction to the Aussie PMIs, the AUD/USD pair traders should keep their eyes on the US S&P Global PMIs for May and the aforementioned risk catalysts for clear directions.
Also read: US S&P Global PMIs Preview: Dollar set to rise on a slip in the services sector
Technical analysis
Monday’s Doji candlestick joins the AUD/USD pair’s sustained trading below the 21-DMA, close to 0.6675 by the press time, to keep the bears hopeful.
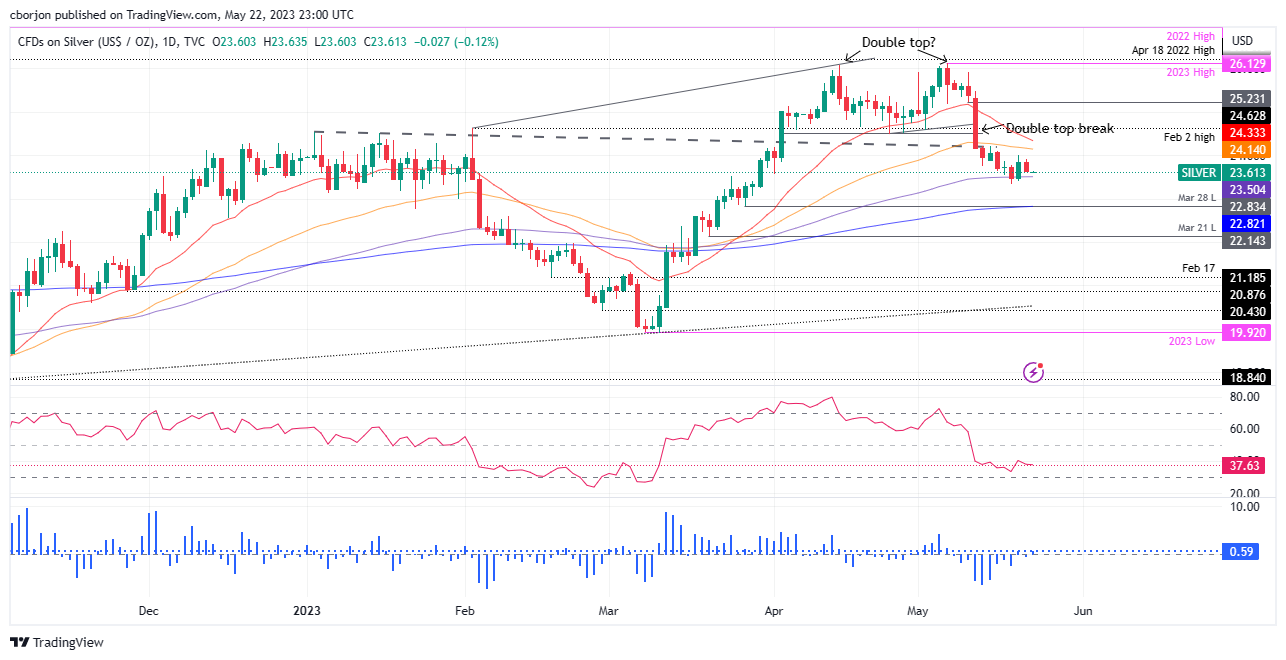
- Silver prices edge toward $23.60 following a dip below $24.00 last week, as US Treasury bond yields surge to 3.721%, curbing safe-haven appetite and softening the USD’s fall.
- XAG/USD holds its double-top chart pattern below the neckline. Although a failure to cross the 100-day EMA at $23.50 hints at the bullish sentiment, a bearish RSI suggests possible retesting.
- If XAG/USD breaks below the 100-day EMA, it eyes $23.00 and then the pivotal 200-day EMA at $22.82.
Silver price retraces toward the $23.60 area after falling below the $24.00 figure in the last week, courtesy of higher US Treasury bond yields, with the 10-year benchmark note rate at 3.721%, climbing more than four basis points. That dented the appetite for safe-haven assets, namely Gold and Silver prices, and cushioned the fall of the US Dollar. At the time of writing, the XAG/USD is trading at $23.62, almost flat as the Asian session begins.
XAG/USD Price Analysis: Technical outlook
The XAG/USD continues to validate a double-top chart pattern, with the XAG/USD’s spot price remaining below the double-top neckline. Failure to break below the 100-day Exponential Moving Average (EMA) at $23.50 keeps Silver buyers hopeful for higher prices. Nevertheless, the Relative Strength Index (RSI) indicator remains bearish, suggesting that the 100-day EMA could be retested soon.
If XAG/USD breaks below the latter, the next support would be the $23.00 figure before testing the “trendsetter” 200-day EMA at $22.82. Once broken, XAG/USD will turn bearish and be exposed to test lower prices. Firstly, the March 28 daily low at $22.83, followed by the March 21 swing low of $22.14.
On the other hand, for XAG/USD’s bullish continuation, Silver must reclaim the $24.00 mark, a troy ounce, followed by the 50-day EMA at $24.14. Once cleared, XAG/USD’s next resistance would be the 20-day EMA at $24.33, ahead of double-top neckline cracking.
XAG/USD Price Action – Daily chart
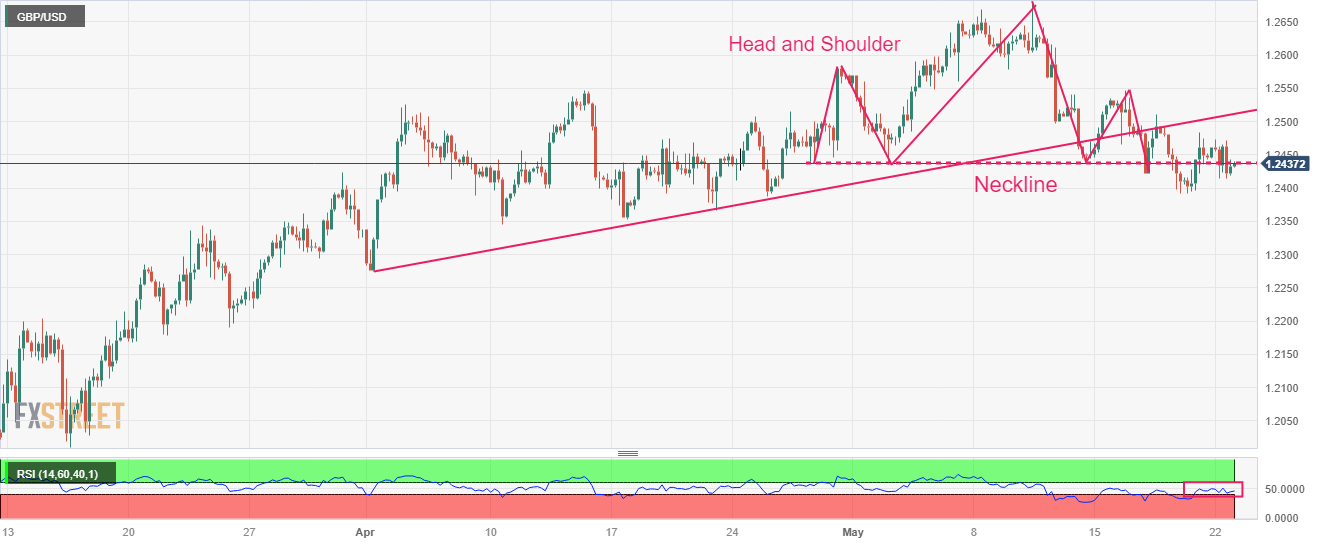
- GBP/USD has come back inside the woods as investors have sidelined ahead of US borrowing cap issues.
- US Biden believes that a deep dive into tax loopholes is necessary to ensure that the wealthy class should pay a fair amount of tax.
- The Cable formed a Head and Shoulder pattern, which indicates a bearish reversal after a breakdown of the neckline placed from 1.2440.
The GBP/USD pair is displaying a sideways auction in a range of 1.2420-1.2470 from Monday. The Cable is inside the woods as the investors are awaiting more developments over US debt-ceiling issues as each day passing is pushing the United States economy to a default situation.
S&P500 remained directionless on Monday as investors are expected to take decisive action after the face-to-face meeting between US President Joe Biden and House of Representatives Kevin McCarthy.
The US Dollar Index (DXY) has defended its immediate support of 103.20. Meanwhile, US Biden has cited that he believes Democrats will make progress on the debt-ceiling but a reduction in spending initiatives is needed. Also, a deep dive into tax loopholes is necessary to ensure that the wealthy class should pay a fair amount of tax.
GBP/USD witnessed a steep fall after a breakdown of the upward-sloping trendline plotted from April 03 low at 1.2275 on a four-hour scale. The Cable formed a Head and Shoulder pattern, which indicates a bearish reversal after a downside break below the neckline placed from April 27 low at 1.2440.
The Relative Strength Index (RSI) (14) is oscillating in the 40.00-60.00 range, indicating a lackluster performance ahead of the US borrowing cap issues.
Should the asset decline below May 19 low at 1.2390, US Dollar bulls will get strengthened further and will drag the Cable toward April 10 low at 1.2344 followed by April 03 low at 1.2275.
On the flip side, a recovery move above May 09 high at 1.2640 will drive the major toward the round-level resistance at 1.2700 and 26 April 2022 high at 1.2772.
GBP/USD four-hour chart
- USD/CAD treads water after sluggish start of the week.
- Canada holiday, mixed feeling in the markets and Oil’s rebound together portrayed Loonie pair’s inaction.
- US President Biden, House Speaker McCarthy appear optimistic on debt ceiling talks.
- Preliminary US S&P Global PMIs for May, second-tier Canada data and return of full markets to offer active trading day.
USD/CAD remains sidelined around 1.3500, after two consecutive days of inaction, as traders brace for a busy Tuesday amid early hours of Asian session. In doing so, the Loonie pair fails to justify the recently firmer prices of WTI crude oil, Canada’s key export, as firmer US Dollar and yields play their roles. If we trace the reason behind the pair’s dull performance on Monday, the Canadian Bank Holiday could be held responsible.
That said, the hopes of no United States default and hawkish Federal Reserve (Fed) expectations seemed to have recently underpinned the US Dollar. However, the Oil price appears to cheer China’s readiness for more investment and likely supply-crunch due to the geopolitical tension surrounding the US, Russia and China.
Recently, US President Joe Biden said that he believed they will make some progress on the debt ceiling talks while House Speaker Kevin McCarthy said, “We both believe we need to change the trajectory.”
On the other hand, Minneapolis Federal Reserve President Neel Kashkari favored the rate hike trajectory while citing the fears of the US default and banking crisis, which in turn allowed the US Dollar to remain firmer. On the same line, St. Louis Federal Reserve President James Bullard ruled out the recession concerns on Monday while saying that He sees two more rate hikes this year before reaching the base rate. Furthermore, Atlanta Fed President Raphael Bostic, Richmond Fed President Thomas Barkin and San Francisco President Mary C Daly recently backed the calls for higher rates.
Elsewhere, US Official recently mentioned that they’re working directly with China on the Micron issue. Beijing banned chips from US manufacturer Micron, after terming them a security threat, which in turn gave rise to a situation where Washington and Beijing exchanged harsh words. Additionally, the China Securities Journal (CSJ) cited the dragon nation’s sturdy economic transition while the People’s Bank of China (PBoC) defends its status quo, which in turn favors commodity prices, including WTI, due to China’s dominance as the world’s biggest industrial player.
With this, the US Dollar Index (DXY) regained upside momentum on Monday after a downbeat close at the end of the two-week winning streak by Friday, inactive of late. With this, the greenback’s gauge versus the six major currencies ended the day around 103.23, making rounds to the same level by the press time.
It should be noted that WTI Crude Oil began the week on a negative note before bouncing off $70.65 to end the day on a positive side around $72.15.
Amid these plays, Wall Street ended the day mixed but the US Treasury bond yields remained firmer. That said, the US 10-year and two-year Treasury bond yields remain indecisive around the highest levels in 10 weeks after rising for the last seven consecutive days, around 3.72% and 4.32% at the latest.
Looking ahead, the US S&P Global PMIs for May and Canadian Industrial Production for April may entertain the USD/CAD traders as the full markets return.
Technical analysis
USD/CAD portrayed back-to-back Doji candlesticks in the last two days while staying within a one-month-old symmetrical triangle, currently between 1.3515 and 1.3475.
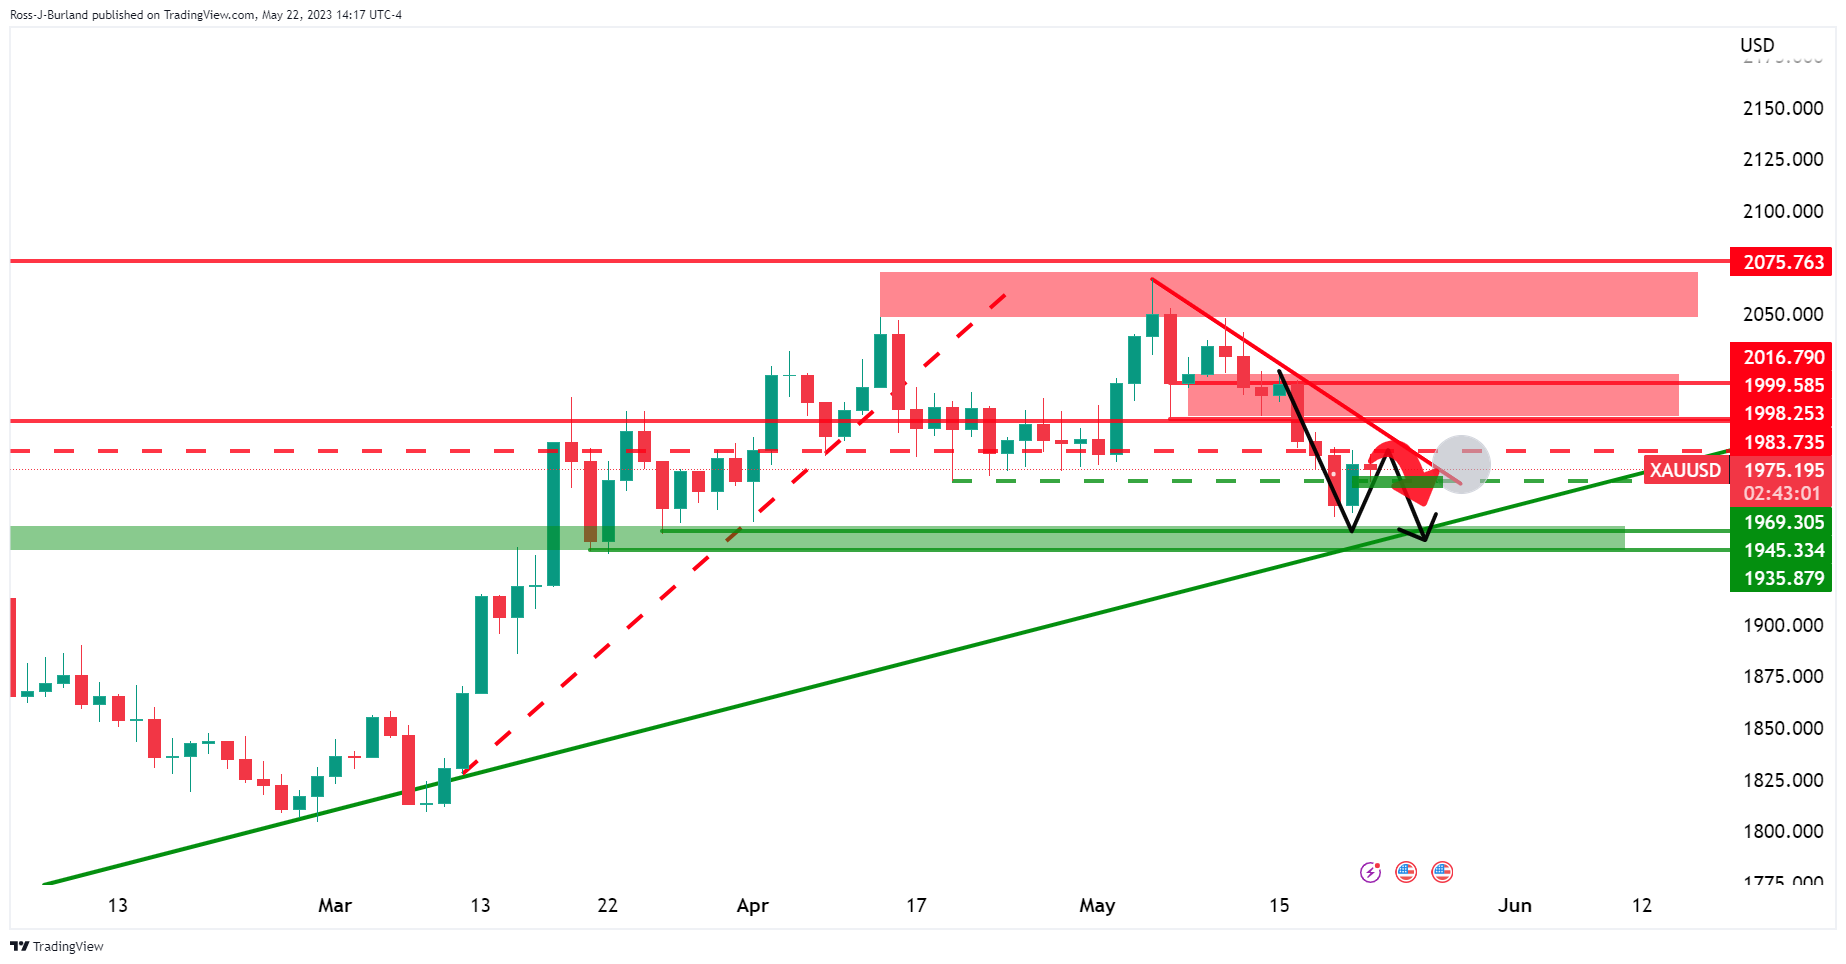
- Gold price seesaws after a downbeat week-start amid firmer United States Dollar, Treasury yields.
- Hawkish Federal Reserve talks, cautious optimism about negotiations over US debt ceiling underpin USD, yields and weigh on XAU/USD.
- Preliminary Purchasing Managers Index for May from US, UK and Eurozone will direct the Gold price.
- Risk catalysts will be more important for clear guide of the XAU/USD.
Gold price (XAU/USD) treads water around $1,970 as markets turn cautious ahead of an active calendar, mostly comprising the Purchasing Managers Indexes from the key global economies, amid early Tuesday morning. That said, the Gold price began the week on a negative footing as the US Dollar regained upside momentum while the Treasury bond yields stayed firmer, backed by hopes of no United States default and hawkish Federal Reserve (Fed) expectations. It’s worth noting that the XAU/USD dropped in the last two weeks even as Friday allowed the XAU/USD bears to take a breather after Fed Chair Powell’s cited downbeat credit conditions reducing the need for higher rates.
Gold price remains pressured on firmer US Dollar, yields
Gold price bears the burden of the upbeat US Dollar and United States Treasury bond yields. That said, the US Dollar Index (DXY) regained upside momentum on Monday after a downbeat close at the end of the two-week winning streak by Friday, inactive of late. With this, the greenback’s gauge versus the six major currencies ended the day around 103.23, making rounds to the same level by the press time.
On the same line, the US 10-year and two-year Treasury bond yields remain indecisive around the highest levels in 10 weeks after rising for the last seven consecutive days, around 3.72% and 4.32% at the latest.
Underpinning the US dollar and yields are the fresh hawkish concerns about the Federal Reserve (Fed) and optimism for a deal over the debt ceiling, which in turn weighs on the Gold price.
Recently, US President Joe Biden said that he believed they will make some progress on the debt ceiling talks while House Speaker Kevin McCarthy said, “We both believe we need to change the trajectory.”
On Monday, US President Joe Biden conveyed positive developments while talking to US House Speaker and Republican Kevin McCarthy as he left Japan after the Group of Seven (G7) Nations meeting in Hiroshima. The policymaker also suggested the talks will resume tomorrow. However, US House Speaker McCarthy showed rejection to mark progress over a deal over the debt ceiling until US President Biden stays abroad. Given the cautious optimism about the US policymakers’ ability to avoid the US debt payment default, the Gold price remains less lucrative, especially amid firmer USD and yields.
Additionally, during an interview with CNBC on Monday, Minneapolis Federal Reserve President Neel Kashkari cited the even odds favoring the increase in the policy rate one more time in June or pausing. It should be noted that Fed’s Kashkari spread fears of the US default and resulting economic pain while saying that the Fed cannot protect the US economy from a debt default. With this, the XAU/USD traders fear higher rates and recall the sellers after a corrective bounce on Friday.
On the same line, St. Louis Federal Reserve President James Bullard ruled out the recession concerns on Monday while saying that He sees two more rate hikes this year before reaching the base rate.
Furthermore, Atlanta Fed President Raphel Bostic, Richmond Fed President Thomas Barkin and San Francisco President Mary C Daly recently backed the calls for higher rates.
While quoting the market’s concerns about the Fed’s next move, the CME Group’s FedWatch Tool shows that markets are again indecisive after the latest Fed talks, especially driven by Fed Chair Powell’s concern for the credit crisis and resulting less pressure for rate hikes. The same signals the market’s pricing in of a rate hike in June, as well as pushing back the rate cuts until late 2023. Additionally, the National Association for Business Economics (NABE) survey showed that economists have deferred their expectations of a US Federal Reserve (Fed) rate cut to the first quarter of next year.
Hence, the Gold price remains on the back foot amid optimism about the US debt ceiling and hawkish Fed concerns.
China fears also weigh on XAU/USD
Apart from the US debt ceiling woes and hawkish Fed, fears surrounding one of the world’s biggest Gold consumers, China also weighs on the XAU/USD. That said, China faced the heat of the Group of Seven Nations (G7) summit in Hiroshima as the global leaders discussed de-risking, or weaning themselves off an over-reliance on Chinese imports at the summit.
Even so, the dragon nation banned imported chips from US manufacturer Micron, after terming them a security threat, which in turn gave rise to a situation where Washington and Beijing exchanged harsh words.
However, US President Joe Biden said that the US-Sino relations to improve ‘very shortly’ whereas China's Commerce Minister Wang Wentao mentioned during a seminar for US firms investing in China that they Will continue to welcome US firms to develop in China.
Gold price to have an active day ahead
Gold Price may witness a busy day filled with multiple Purchasing Managers Indexes for May, from the UK, Euro, Japan, Australia and the US. Should the first readings of the activity data for May remain impressive, especially from the US, the XAU/USD may witness further downside.
Also read: US S&P Global PMIs Preview: Dollar set to rise on a slip in the services sector
Gold price technical analysis
A clear downside break of the 50-DMA and a sustained observance of the 13-day-old descending resistance line, around $1,990 and $1,985 by the press time, keep the Gold price sellers hopeful.
Adding strength to the bearish bias surrounding the XAU/USD are the bearish signals from the Moving Average Convergence and Divergence (MACD) indicator and steady Relative Strength Index (RSI) line, placed at 14.
As a result, the Gold price is likely to decline further, which in turn highlights the latest swing low of around $1,952 ahead of directing the XAU/USD sellers toward the 100-DMA support of near $1,930.
Meanwhile, an upside break of the aforementioned resistance line and the 50-DMA, near $1,984 and $1,990 in that order, becomes necessary for the Gold buyers to take the risk.
Following that, the $2,000 round figure and April’s high of around $2,049 can challenge the XAU/USD bulls.
Overall, the Gold price is likely to remain bearish but the downside appears unimpressive beyond the 100-DMA support of near $1,930.
Gold price: Daily chart
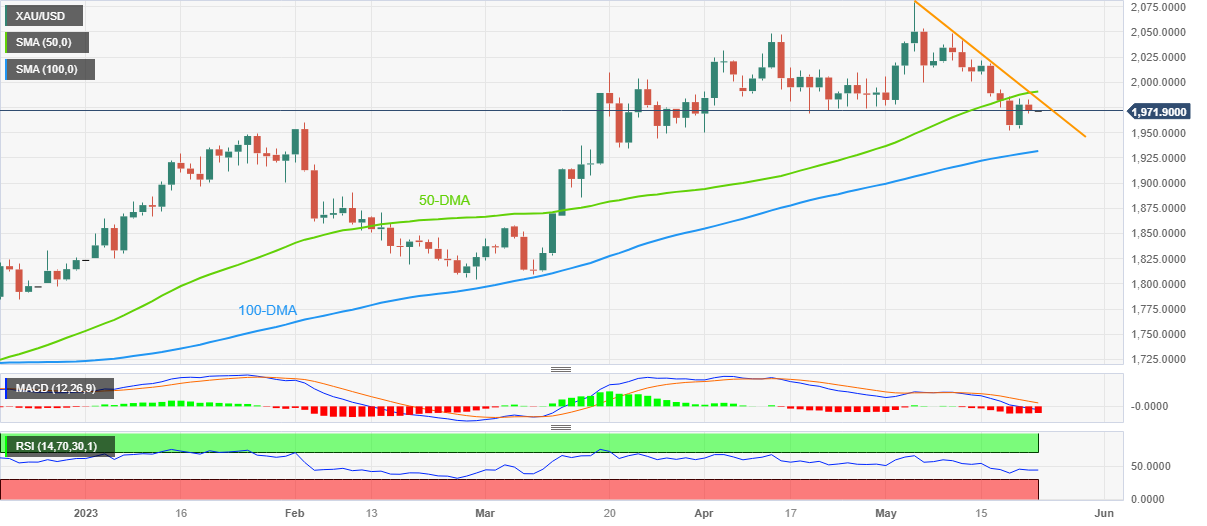
Trend: Further downside expected
- EUR/USD is showing a sideways performance above 1.0800 as the focus is on US debt-ceiling negotiations.
- S&P500 settled marginally positive on Monday after a choppy session, portraying a quiet market mood.
- Republican McCarthy said that talks over raising the U.S. borrowing cap were "on the right path” ahead of discussions with US Biden.
The EUR/USD pair is displaying a topsy-turvy action above the round-level support of 1.0800 in the early Tokyo session. The major currency pair didn’t show a decisive action despite mixed responses from Federal Reserve (Fed) policymakers over the interest rate guidance. Investors are awaiting face-to-face negotiations between US President Joe Biden and House o Representatives Speaker Kevin McCarthy for a major action.
S&P500 settled marginally positive on Monday after a choppy session, portraying a quiet market mood. US equities remained sideways waiting for more development over US debt-ceiling issues.
The US Dollar Index (DXY) has rebounded after a corrective move to near 103.17. Meanwhile, Speaker Kevin McCarthy is optimistic about the approval of the US debt-ceiling. A few hours ahead of a face-to-face meeting with US President Joe Biden, Republican McCarthy said on Monday afternoon that talks over raising the U.S. federal government's $31.4 trillion debt ceiling were "on the right path", as reported by Reuters.
A mixed majority in the House of Representatives and Senate has given importance to a bipartisan deal, which has made US Treasury Secretary Janet Yellen nervous that the economy could announce a default in making obligated payments.
Minneapolis Fed Bank President Neel Kashkari cautioned that while it may appear like the worst period of the banking turmoil is over, history showed more trouble can't be ruled out, as reported by Reuters. On the weekend, Fed policymaker cited that he would support the Fed for holding interest rates in June.
On the Eurozone front, European Central Bank (ECB) policymaker Francois Villeroy de Galhau said "I expect today that we will be at the terminal rate not later than by summer," He further added, "Deceleration in rate increases from 50 bp to 25 bp was wise and cautious." This has allowed the ECB to push its interest rate cycle longer and has safeguarded the economy from any interest rate shocks.
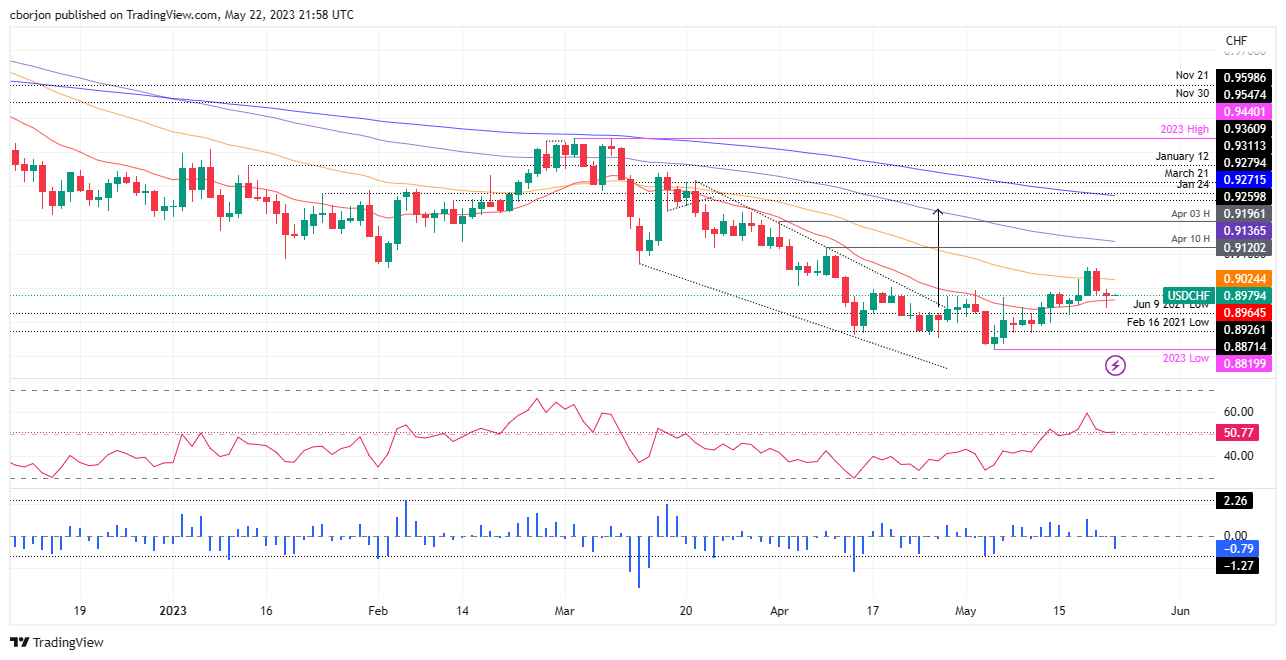
- USD/CHF halts its downtrend and bounces off a daily low of 0.8940, charting its course near the crucial 20-day EMA at 0.8964.
- Market mood tilts as the pair’s technical outlook transitions from a neutral-to-downward bias to neutral, possibly tilting neutral-upward once it reclaims the April 10 daily high of 0.9120.
- For bearish persistence, USD/CHF must pierce the 20-day EMA, potentially exposing the May 22 low of 0.8940 and setting the stage for a potential plunge towards 0.8926.
USD/CHF stalled its downtrend after piercing the 20-day Exponential Moving Average (EMA) at 0.8964 and reached a daily low of 0.8940, but bounced off and closed Monday’s session nearby last Friday’s low at 0.8993. At the time of writing, USD/CHF is trading at 0.8980, almost flat, as Tuesday’s Asian session begins.
USD/CHF Price Analysis: Technical outlook
From a daily chart perspective, the USD/CHF shifted from neutral-to-downward biased to neutral. In early May, the USD/CHF pair reached a new year-to-date (YTD) low of 0.8820; since then, USD/CHF climbed 1.80%, registering on its way up, successive series of new highs-lows, but shy of turning the pair neutral-to-upward biased.
If USD/CHF reclaims the April 10 daily high of 0.9120, that could shift the bias to neutral-upwards, and it might open the door for a rally above the 100-day EMA At 0.9136 before reaching the April 3 high at 0.9196. Upside risks for the USD/CHF lie above 0.9200, with the 200-day EMA at 0.9271 as the only resistance to changing the pair’s bias upwards.
The USD/CHF must fall below the 20-day EMA at 0.8964 for a bearish continuation. A breach of the latter will expose the May 22 low of 0.8940 before clearing the path for the pair towards June 9, 2021, a low of 0.8926, ahead of the 0.8900 figure.
USD/CHF Price Action – Daily chart
- WTI bulls are engaged at a key area of support.
- The ficus is on an upside correction medium term.
WTI is trading a touch higher by some 0.36% at the time of writing and has climbed from a low of $70.72 to score a high of $72.49 so far. The following is a technical analysis that derives a bullish outlook for the commodity.
WTI daily chart
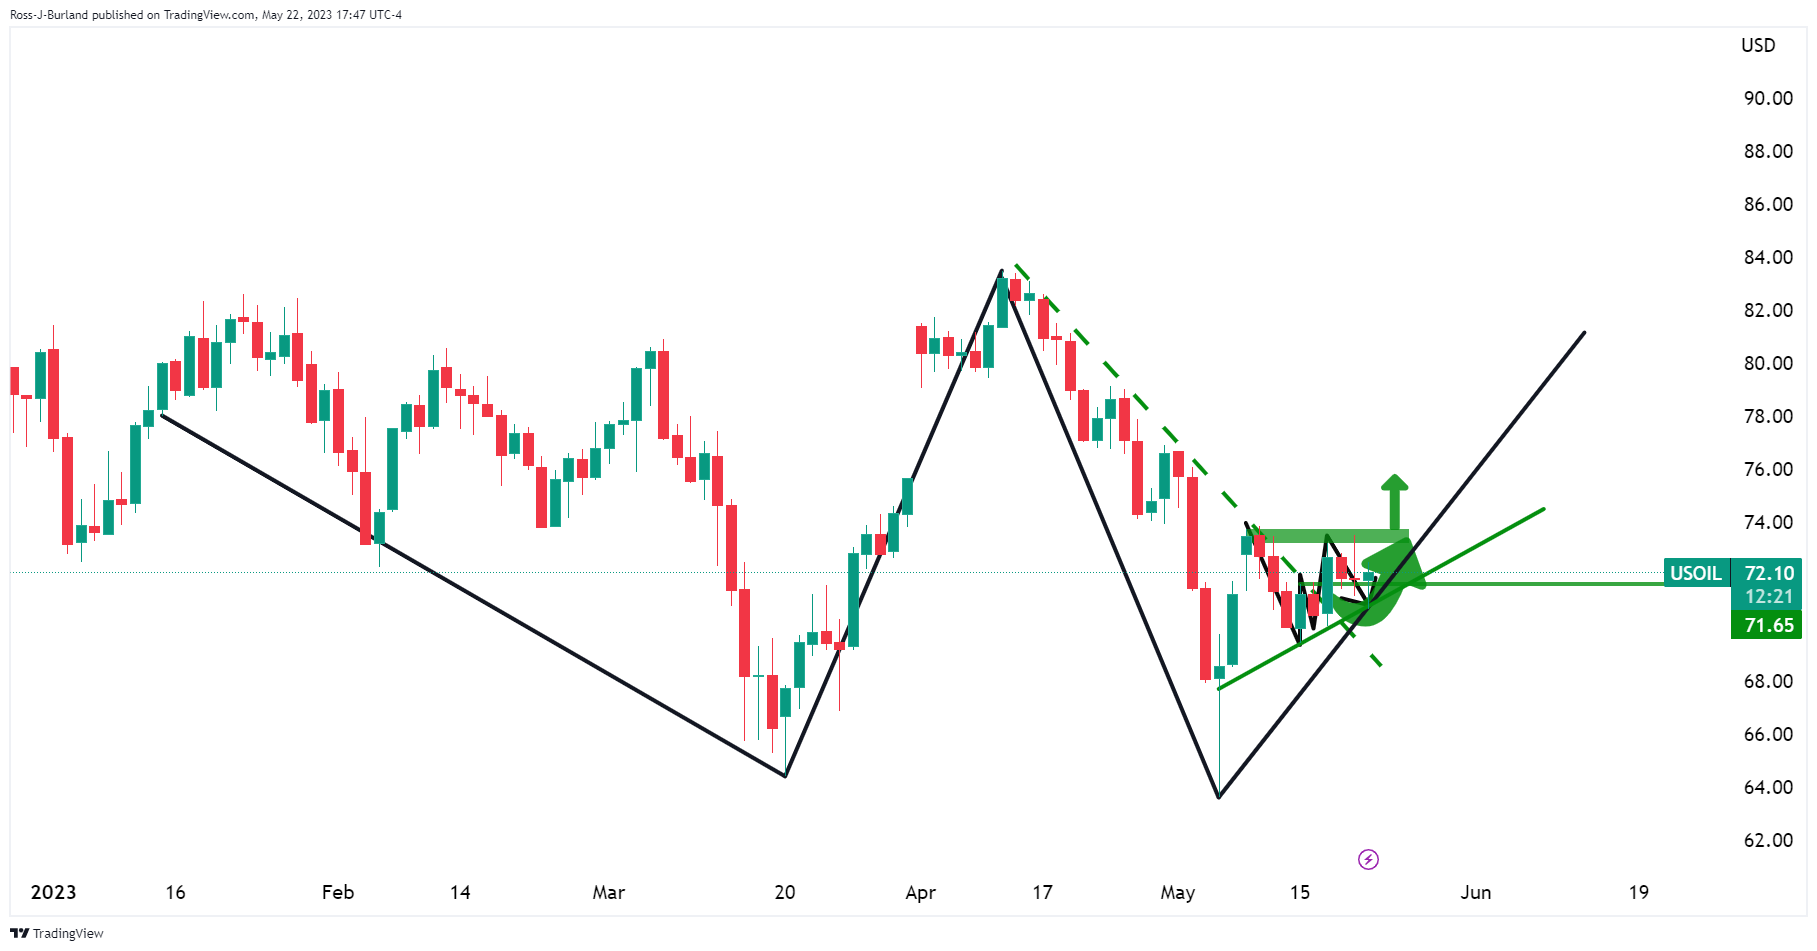
We have a major double bottom on the longer-term outlook.
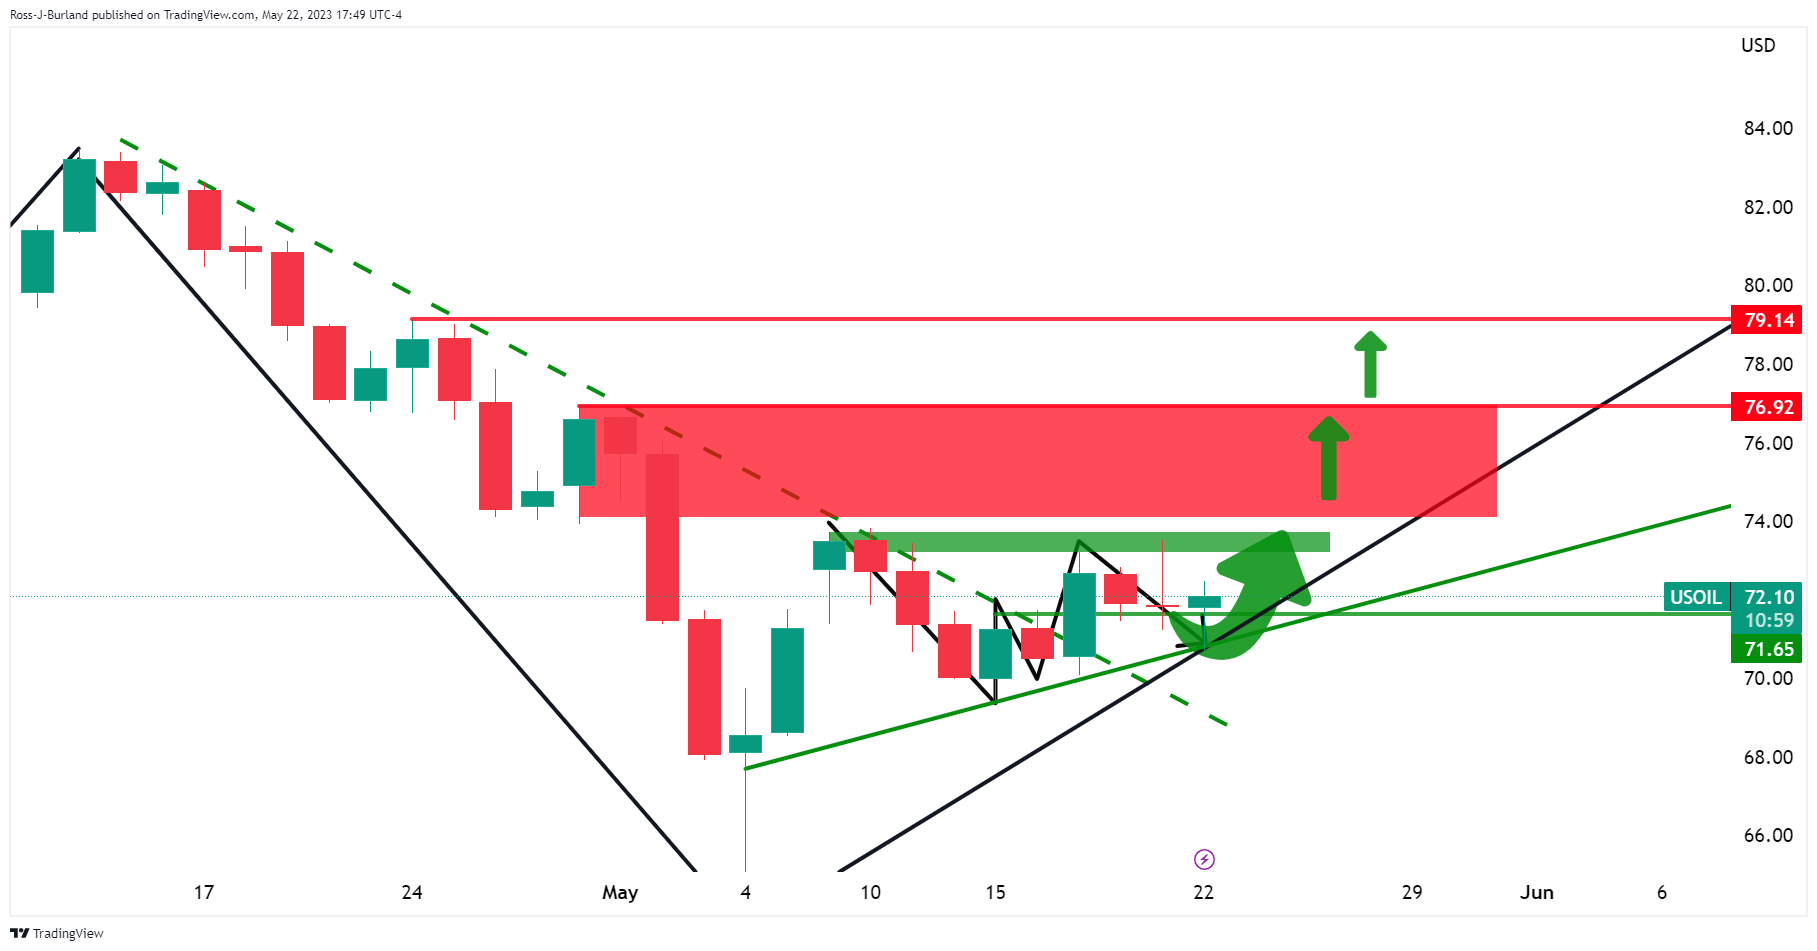
Zooming in, we can see that the market has broken out of the bearish trend and is now riding a dynamic support line.
We have a W-formation neckline area that is being respected also.
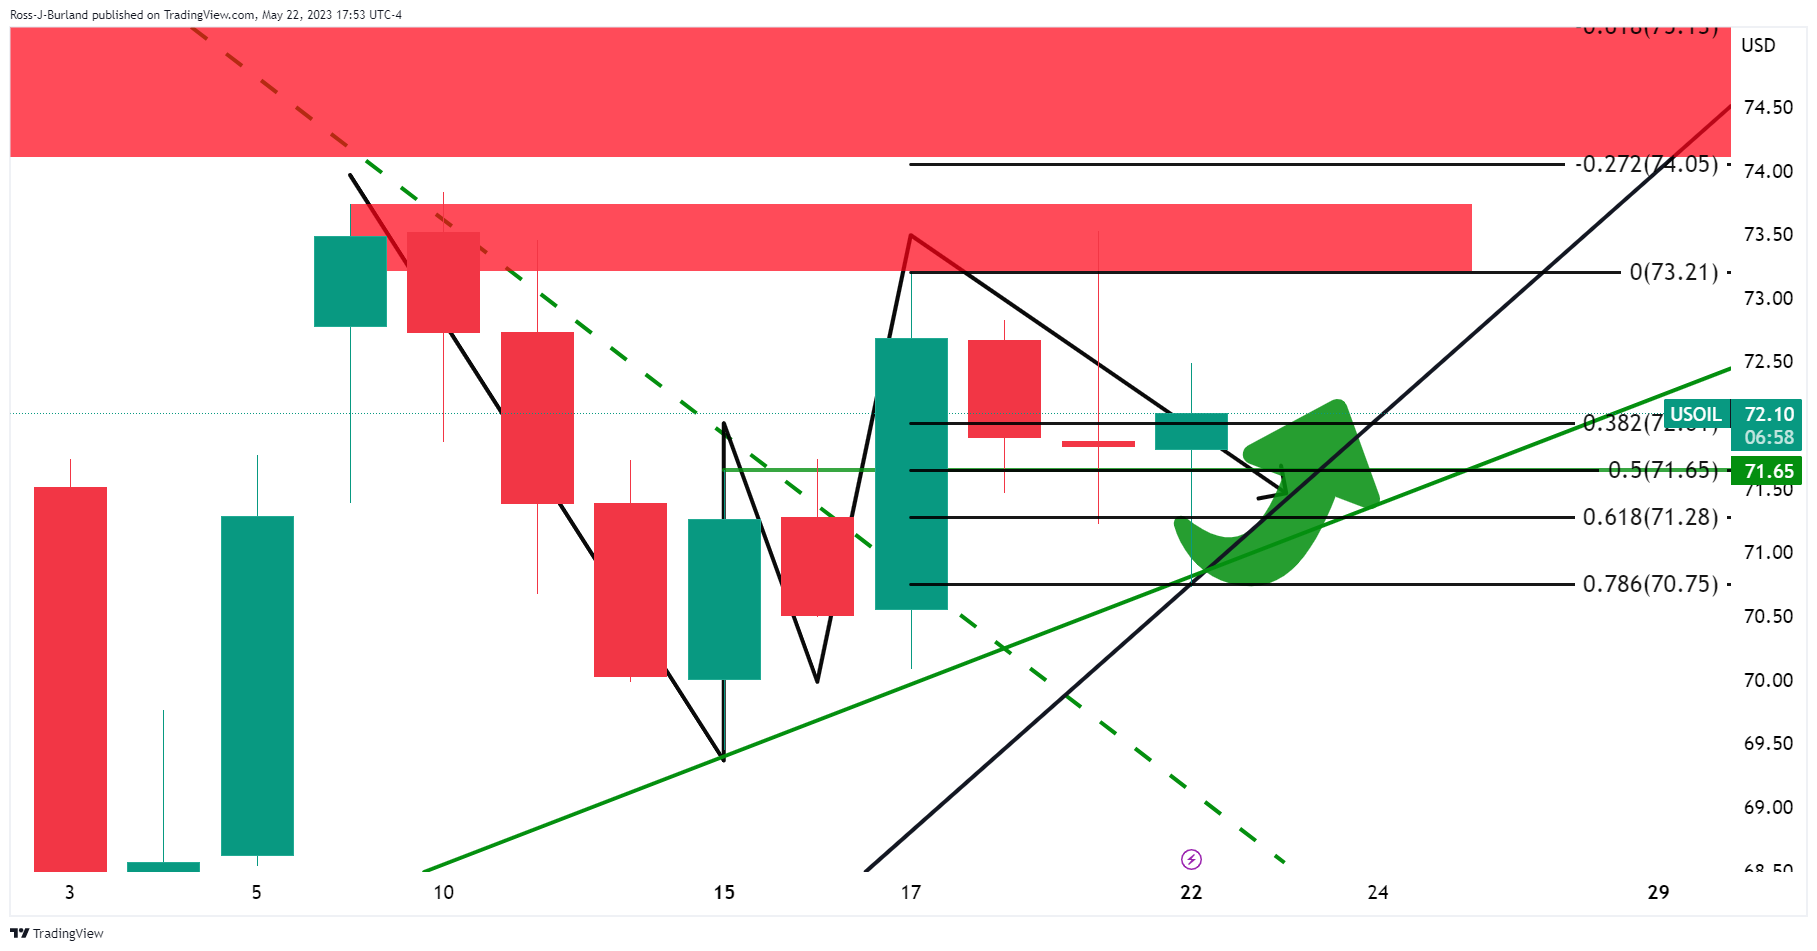
The Fibonacci retracement tool measured across the bullish impulse sees the 78.6% Fibo meeting the support kline and lows of the correction.
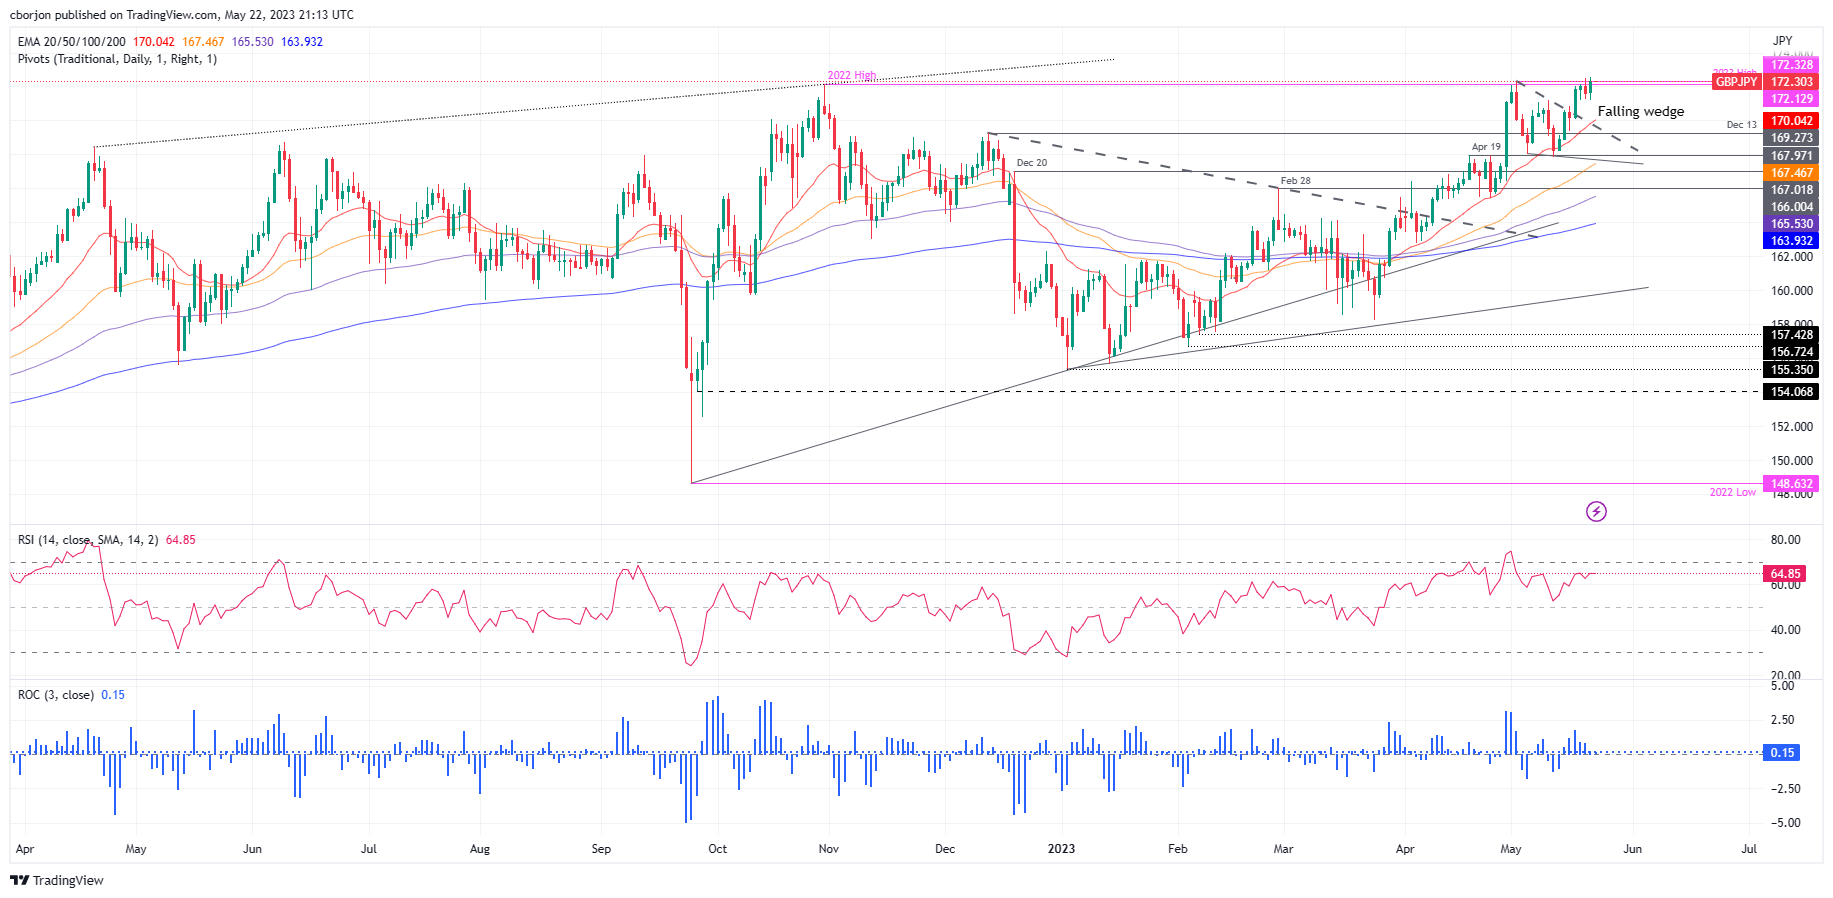
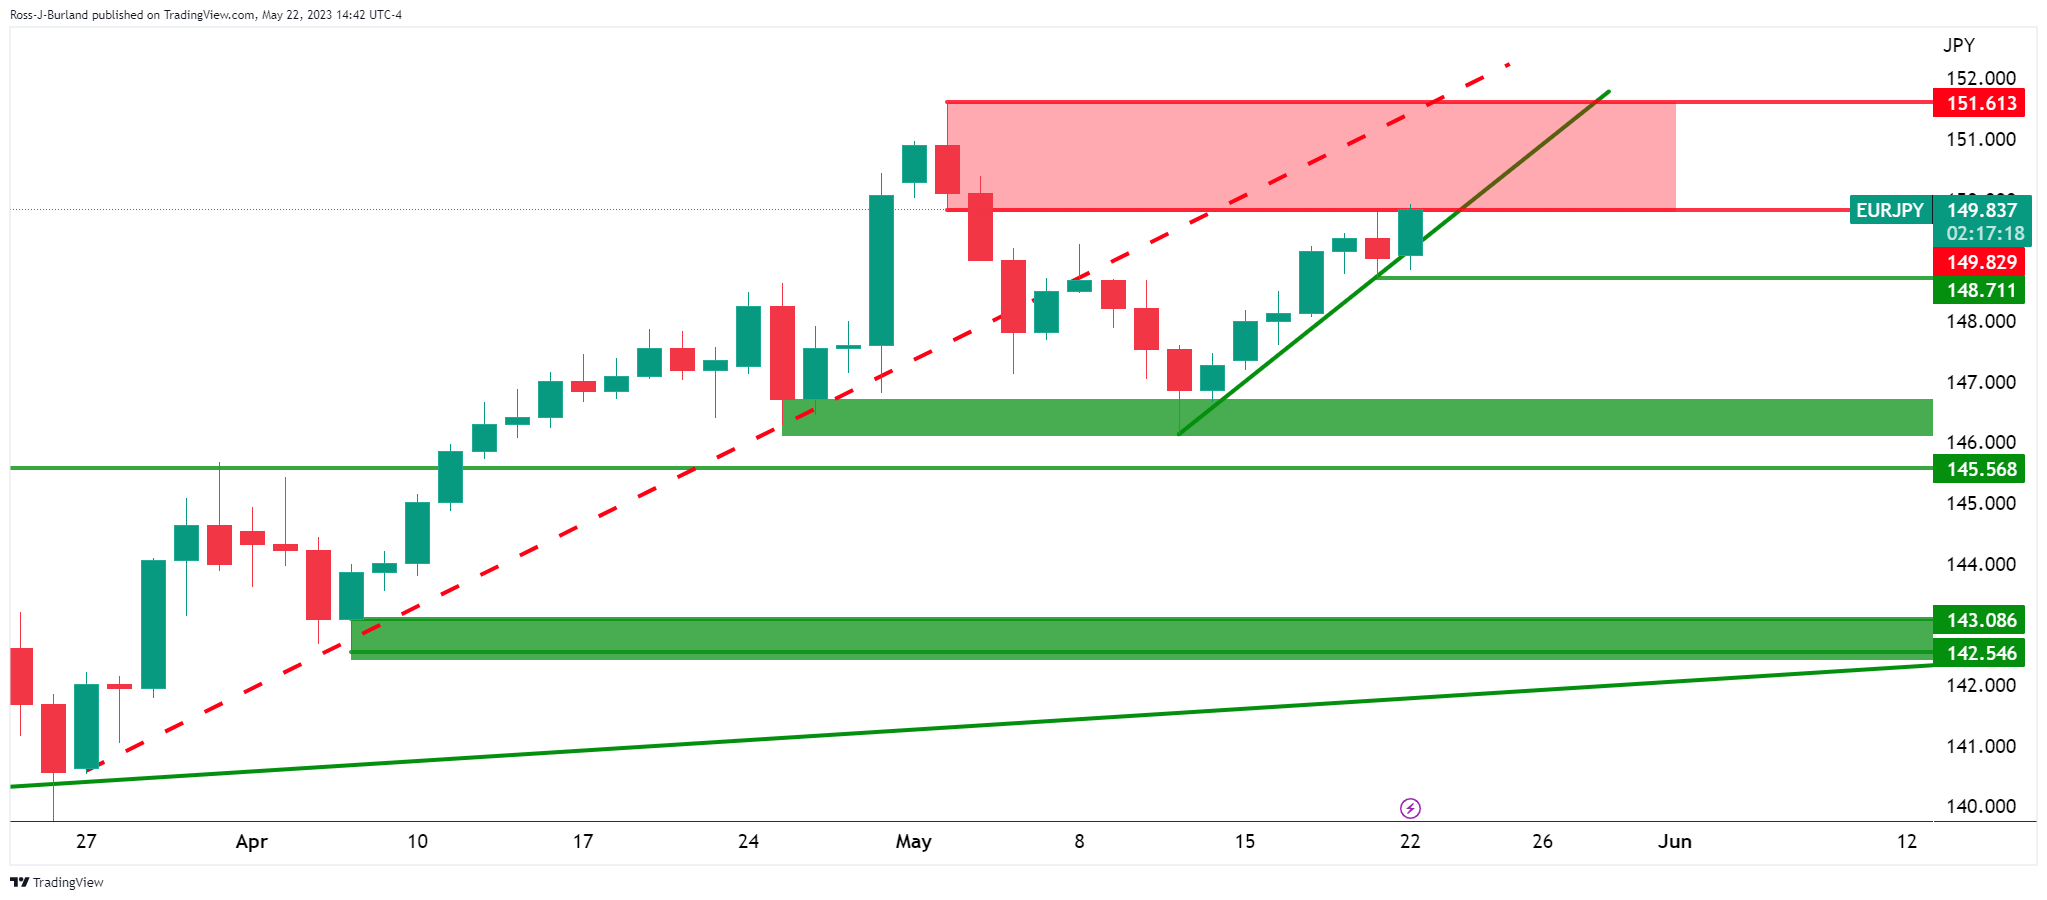
- GBP/JPY reaches a new YTD high of 172.57, driven mainly by risk-on sentiment and a weaker JPY.
- A negative divergence between GBP/JPY’s price action and the Relative Strength Index (RSI) indicates the potential for a pullback.
- A continued GBP/JPY uptrend could see the pair rally toward 173.00 and potentially reach the 174.00 handle.
GBP/JPY reached a new year-to-date (YTD) high of 172.57 in the European session due to a risk-on impulse and a weaker Japanese Yen (JPY), ahead of a crucial week for the Pound Sterling (GBP). The release of PMIs in the United Kingdom (UK), alongside Wednesday’s update on the Consumer Price Index (CPI) for April, could dictate the GBP/JPY pair direction. At the time of writing, the GBP/JPY is trading at 172.34 after hitting a low of 171.19.
GBP/JPY Price Analysis: Technical outlook
During the last week, a break of a falling wedge opened the door for the GBP/JPY to test the YTD high. As the GBP/JPY price action gathers momentum and records higher highs, the Relative Strength Index (RSI) does not. Hence, a negative divergence between price action-RSI could open the door for a test of the falling-wedge top-trendline before posing a threat to higher prices.
Therefore, the GBP/JPY is set for a pullback. The first support would be at the 172.00 figure, followed by the low of May 22 at 171.19. The break below will expose the 171.00 mark, followed by the 20-day Exponential Moving Average (EMA) at 170.04, closely followed by the falling-wedge trendline.
On the other hand, if GBP/JPY resumes its uptrend, it would need to crack the YTD high of 172.57. Once done, the pair could rally toward 173.00 before reaching the 174.00 handle.
GBP/JPY Price Action – Daily chart
- NZD/USD bulls have been in charge and eye 0.6300.
- The RBNZ is going to be one of the key events for the pair this week.
NZD/USD is up by some 0.2% and has risen from a low of 0.6261 to reach a high of 0.6292 so far. However, we have the Reserve Bank of New Zealand tomorrow which is likely to see the Kiwi tread water ahead of the event.
Markets are split on whether we’ll see a 25 or 50bp hike. ´´After the surprise 50bps hike in Apr, we don't expect another 50bps shocker after the softer Q1 CPI print,´´ analysts at TD Securities said.
´´However, we do acknowledge the risk of one as the budget update shows more fiscal impulse working through the economy from the cyclone rebuild. Focus turns to the new OCR track and an increase in the terminal rate will lead markets to price in further hikes,´´ the analysts added.
Meanwhile, there has been no progress seen in US debt ceiling negotiations and Fedspeak overnight was mixed and did little to shift the USD, as analysts at ANZ Bank noted,.
´´But let’s see what the Fed minutes and US core PCE deflator look like.´´
´´For the Kiwi per se, as we noted yesterday, it seems to be mostly about carry now that some short-end rates are around 6%, which is world-beating. With genuinely expansionary forces (migration/fiscal) behind the reasons most are calling for a higher OCR, higher rates should be NZD-beneficial, twin deficits (fiscal/trade) cast a dark shadow over the background,´´ the analysts added.
NZD/USD technical analysis
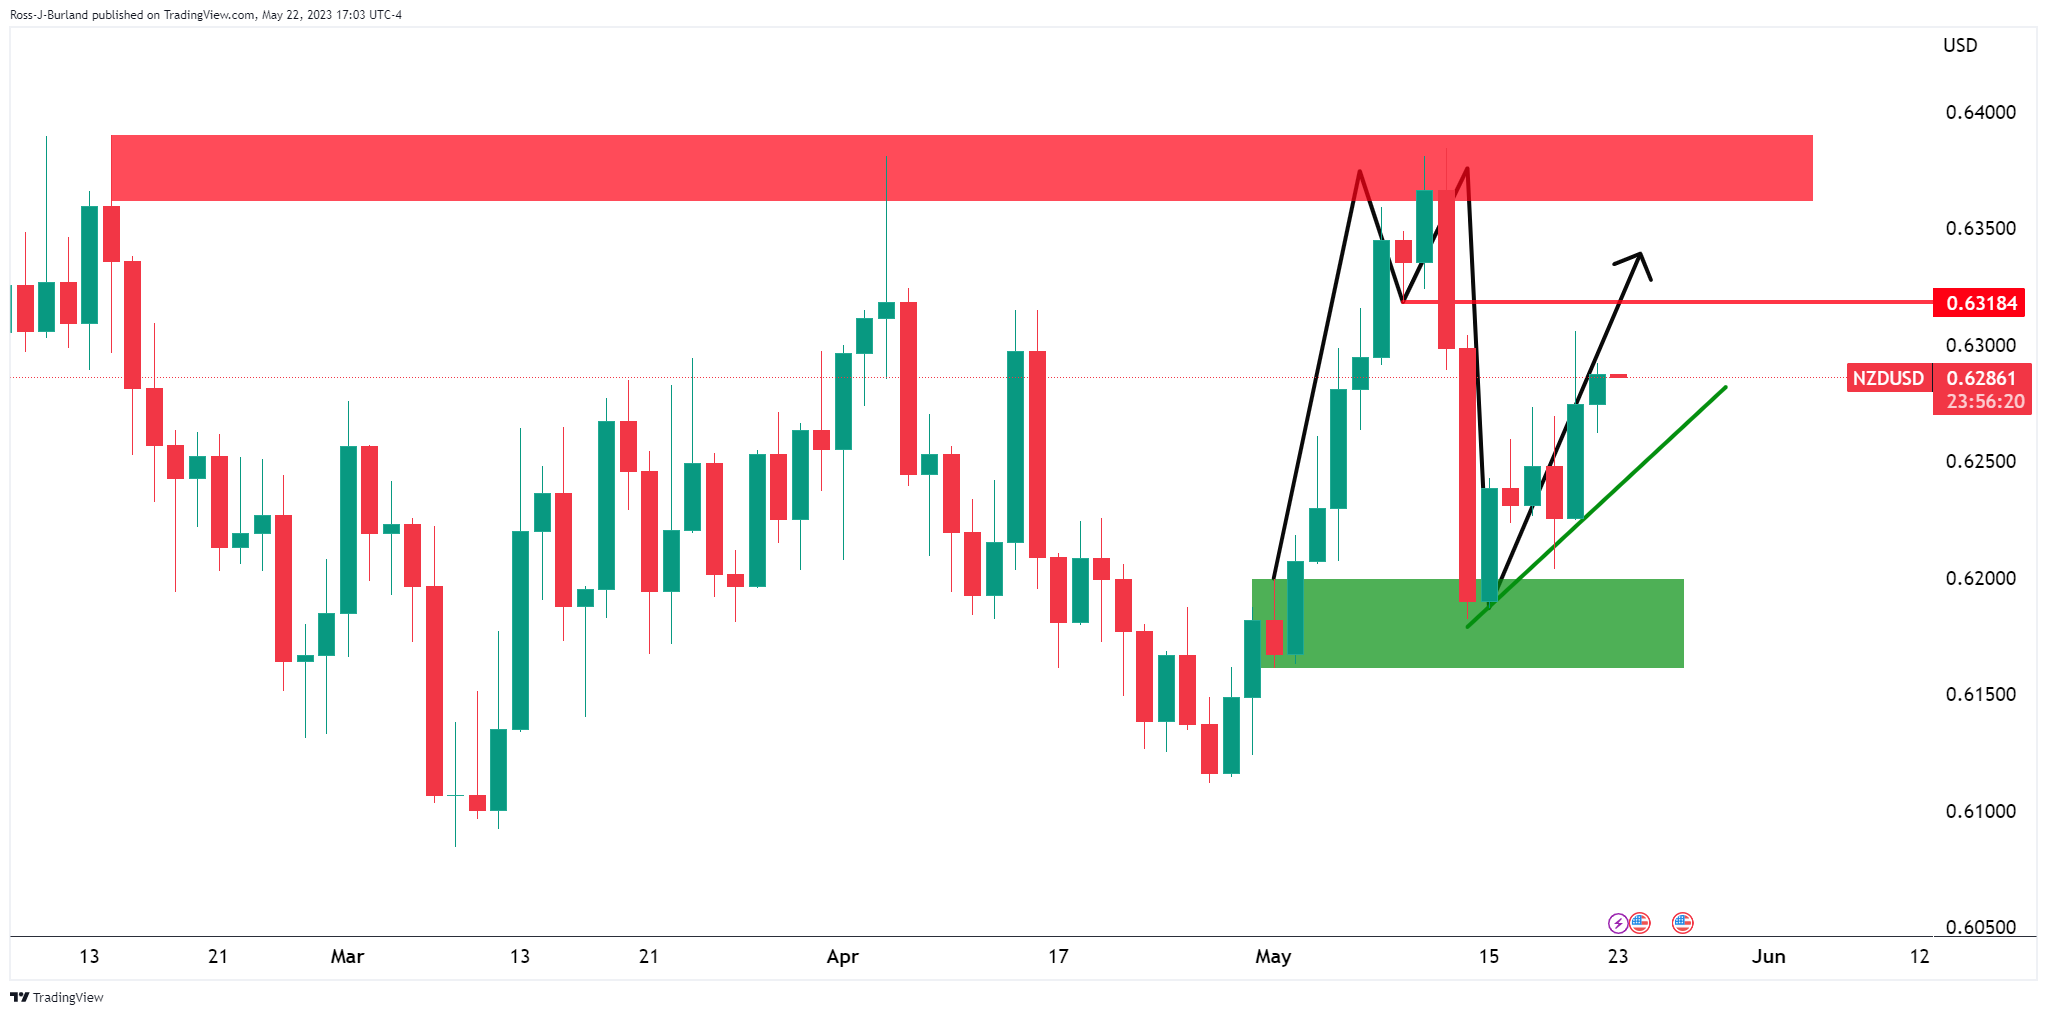
NZD/USD is completing the M-formation pattern with a move toward the neckline.
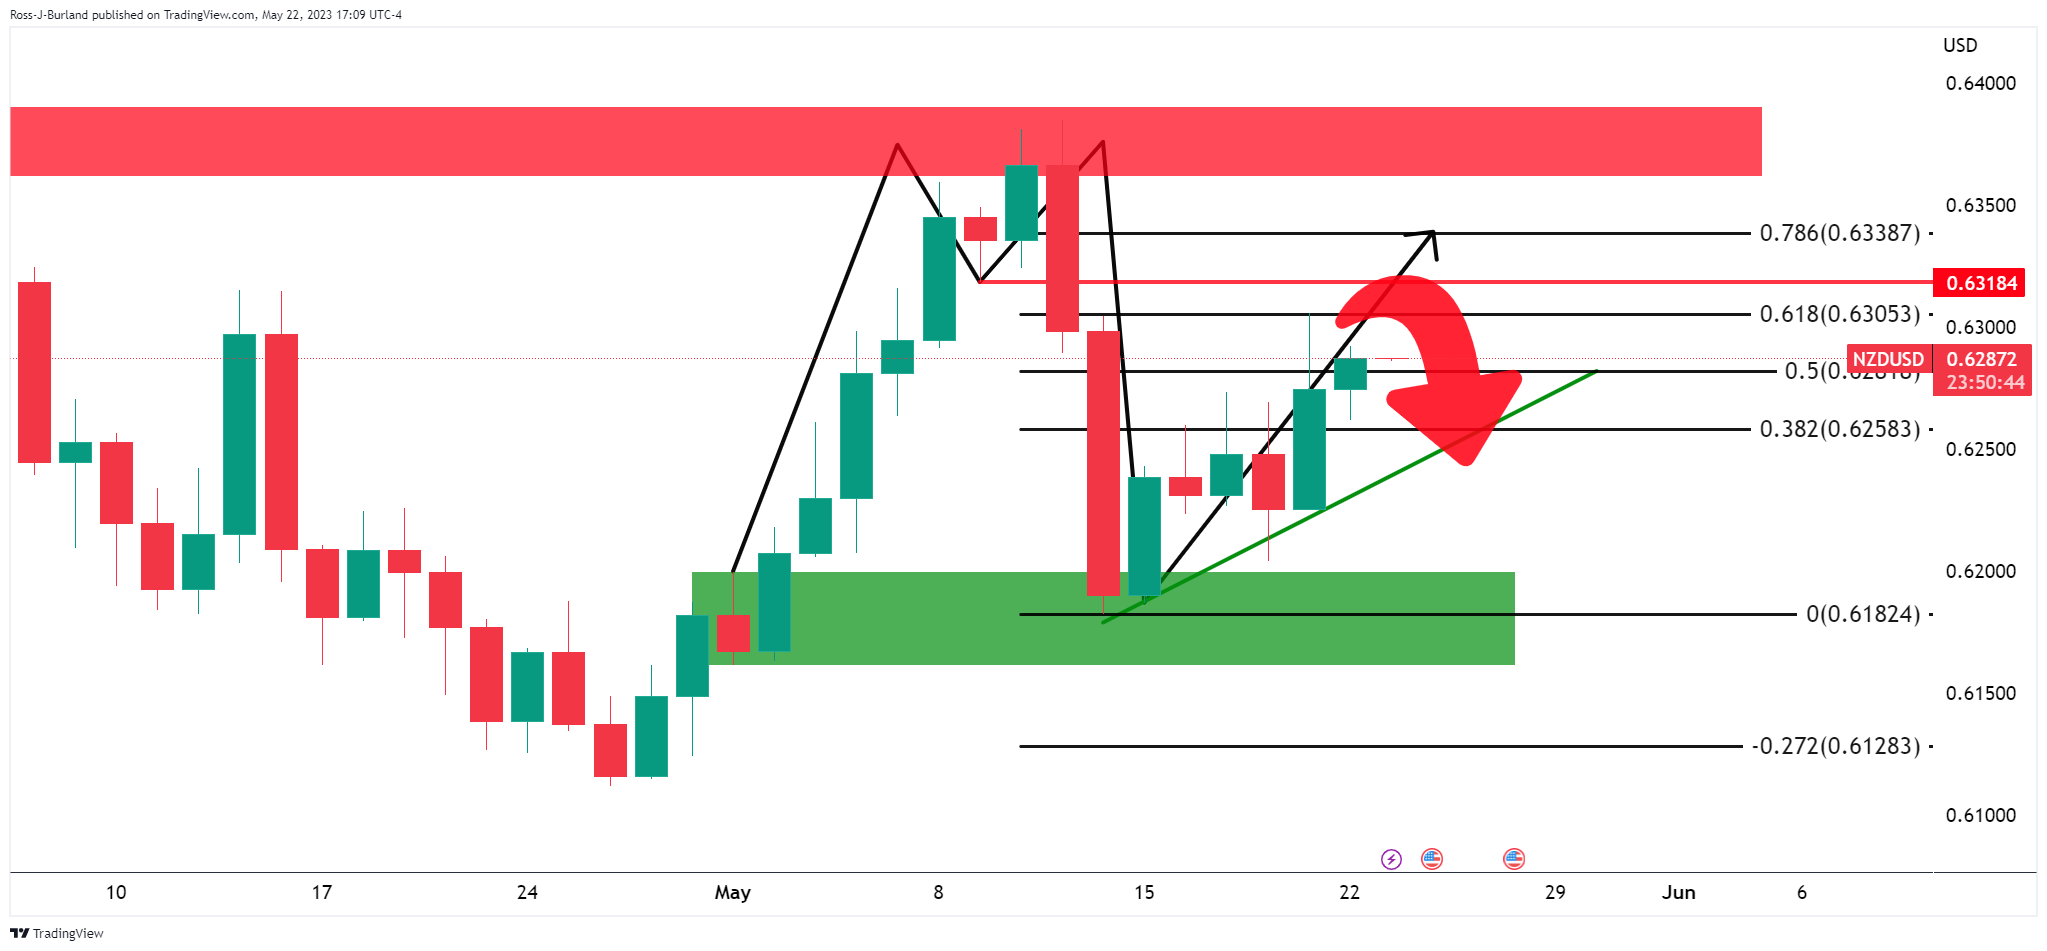
The price has already moved in on the 61.8% Fibonacci retracement level as illustrated above. This pattern´s neckline area could well hold and see a rejection to the downside in the coming days.
Tuesday is an important day for PMIs releases, as it will offer the first glimpse of global economic activity during May. During the Asian session, the S&P Global Composite PMI is scheduled for release in Australia, followed by Japan later in the day. Later will be the turn of Europe and the US.
Here is what you need to know on Tuesday, May 23:
The US dollar ended the day mostly unchanged on a subdued Monday in financial markets. The focus remains on the ongoing negotiations over the US debt limit, with investors keenly awaiting any developments. US President Biden is scheduled to meet with House Speaker McCarthy later on Monday at 21:30 GMT to continue discussions.
Analysts at Wells Fargo warned:
For a deal to be reached and turned into law before early June, a breakthrough in the negotiations will need to occur this week.
Banking concerns continue to ease; however, a report by CNN on Friday indicated that Treasury Secretary Yellen told bank CEOs that more mergers may be necessary. Her comments suggest that a return to normalcy is still a ways off. On Tuesday, attention is expected to shift back to economic data, with the release of the S&P Global PMIs. Additionally, New Home Sales and Richmond Fed Manufacturing will also be released.
US S&P Global PMIs Preview: Dollar set to rise on a slip in the services sector
The Japanese Yen was among the worst performers, weighed down by government bond yields that remain at monthly highs. The 10-year Treasury yield settled at 3.72%, the highest level since March 9. USD/JPY rose above 138.50, toward last week's highs, but faces resistance around the 138.80 area. Monday's data from Japan revealed that the core machinery order unexpectedly dropped by 3.9% in March. The Japan Jibun Bank PMI is due to be released on Tuesday.
After rebounding on Friday, the EUR/USD pair traded flat, moving sideways and testing levels below 1.0800. Market participants are now focused on the release of preliminary Eurozone PMI numbers scheduled for Tuesday. The readings are expected to be crucial (May preliminary), particularly given the current economic environment and the data-dependent forward guidance. Additionally, several European Central Bank (ECB) members, including Guindos, Muller, Nagel, and Villeroy, are set to speak.
GBP/USD finished the day flat, hovering around 1.2430. The UK is set to report on Public Sector Net Borrowing, and PMI data will also be released. On Wednesday, inflation data is due, which could have a significant impact on the pound.
Commodity currencies traded in narrow ranges against the US dollar. USD/CAD rose marginally, closing above 1.3500. The pair continues to move sideways around the 20-day Simple Moving Average (SMA). On Tuesday, Canada is set to release its wholesale inflation data.
AUD/USD remained below the 20-day SMA, but rose to the 0.6650 level during the American session. On Tuesday, Australia is scheduled to release its PMI data.
NZD/USD posted modest gains, managing to record its highest daily close in a week, but still below the 0.6300 level. On Wednesday, the Reserve Bank of New Zealand (RBNZ) is scheduled to announce its decision on monetary policy. Market analysts are expecting a rate hike, with some predicting a 25 basis points increase and others forecasting a 50 bps hike.
The South African rand was the strongest performer on Monday, with USD/ZAR pulling back from record highs to 19.20. In contrast, the Mexican peso underperformed, with USD/MXN rising for the fifth consecutive day and approaching 18.00. On Tuesday, the National Bank of Hungary is scheduled to have its monetary policy meeting.
Gold retraced some of Friday's gains, with XAU/USD sliding towards $1,970/oz. Silver also declined, closing the day at $23.60. Cryptocurrencies had a mixed performance, with BTC/USD failing to reclaim $27,000. Crude oil prices rose modestly; WTI approached $72.00.
Like this article? Help us with some feedback by answering this survey:
- AUD/USD bulls are moving in and eye upside extension.
- The inverse head and shoulders are a bullish feature on the charts.
AUD/USD was boosted on a dovish Federal Reserve Chairman Jerome Powell on Friday. There is a preference for a pause in June from the Chair of the central bank which has outweighed any other hawkish notes from regional Fed presidents. This has enabled the Aussie to correct higher vs. the Greenback of late as the following technical analysis illustrates:
AUD/USD H4 charts
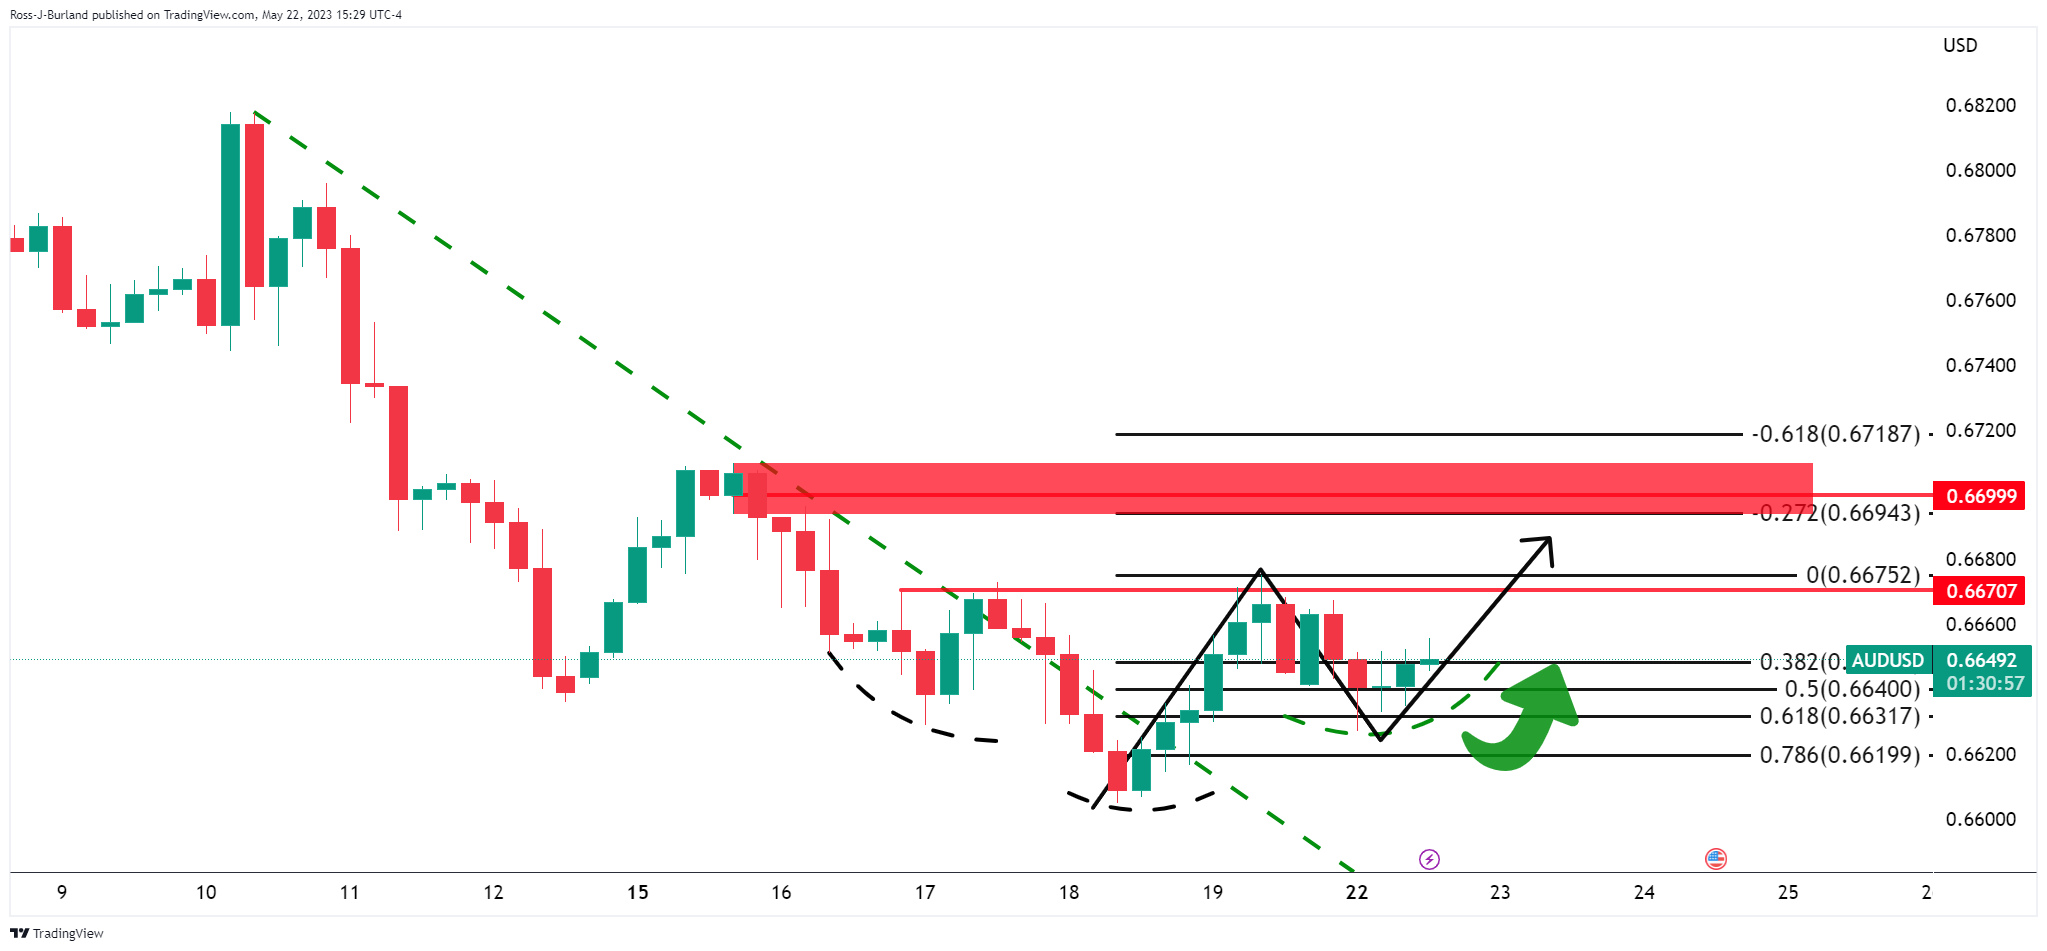
We have an inverse head and shoulders on the 4-hour charts and a correction into the 61.8% Fibonacci retracement level that leaves the bias bullish above the lows of the right-hand shoulder.
AUD/USD H1 charts
The W-formation is a compelling feature on the hourly chart whereby the reversion pattern´s neckline near a 50% mean reversion could be an attractive area for bulls to engage again.
Zooming into the bullish impulse, we can see that bulls might lean against the trendline support on a pullback.
- GBP/USD holds steady, buoyed by positive US debt ceiling discussions but weighed down by hawkish Federal Reserve comments.
- The US Dollar Index remains flat, preventing further GBP/USD gains.
- Money market futures show a high probability of a Bank of England rate hike at the next meeting, potentially offering further support to GBP.
GBP/USD trades flat in the mid-North American session on Monday, following hawkish remarks by US Federal Reserve officials, which weighed on the Pound Sterling (GBP). Nevertheless, a risk-on impulse spurred by improvements in discussions about raising the debt ceiling in the United States (US) was a headwind for the US Dollar (USD). At the time of writing, the GBP/USD is trading at 1.2437.
Uncertainty about US debt-ceiling discussions dissipates, underpins the GBP/USD pair
GBP/USD is still pressured by market sentiment. Discussions about the US debt ceiling showed some improvement, according to US House Speaker Kevin McCarthy, adding that a deal could be struck tonight or tomorrow. Although an agreement was not reached, he emphasized, “We can make it happen by the debt deadline.”
Another reason that keeps the GBP/USD from appreciating further is that Fed speakers continued with their hawkish rhetoric, with St. Louis Fed President James Bullard eyeing two more rate hikes. Nevertheless, there is a split among officials, with some leaning toward the dovish side like Atlanta’s Fed President Raphael Bostic backing a pause on the Fed’s tightening cycle.
In the meantime, the US Dollar Index (DXY), a gauge that measures the buck’s value vs. a basket of six currencies, is almost flat at 103.190, putting a lid on GBP/USD gains.
Across the Atlantic, an absent UK economic docket keeps traders leaning on Tuesday’s S&P Global PMIs on its final reading for May, alongside inflation figures, on Wednesday. Any hints that the Consumer Price Index (CPI) in April exceeded estimates and the prior’s month reading could open the door for further tightening.
Money market futures predict an 81% chance that the Bank of England (BoE) will raise rates by 25 bps at its next meeting. The BoE has lifted rates 11 times since December 2021 as it scrambles to tame sticky inflation.
GBP/USD Price Analysis: Technical outlook
The GBP/USD is still upward biased, though trapped within the boundaries of the 20 and 50-day Exponential Moving Averages (EMAs), each at 1.2485 and 1.2409, respectively. Although price action suggests further upside is expected, the Relative Strength Index (RSI) indicator pushes below the 50-midline. That warrants sellers are gathering momentum, while the 3-day Rate of Change (RoC), shows that sellers are moving in.
Upside risks lie above the 20-day EMA at 1.2485, followed by the 1.2500 figure. On the flip side, the GBP/USD first support would be the 50-day EMA before cracking the 1.2400 mark.
- EUR/JPY bears need to get below the 149.00 area and then 148.70.
- Bulls eye a break of 150.00 and then 150.40.
EUR/JPY has been trying to come up for air since breaking the prior bullish trend´s support line at the start of May´s business. The pair is now battling with resistance again and the following illustrates the prospects of either a bullish continuation or a break to the downside.
EUR/JPY daily chart
The daily chart shows the pair testing trendline support while being on the backside of the prior bullish trend. The 148.70s is key in this regard. To the upside, there are prospects of a break of 149.80 resistance.
EUR/JPY H4 chart
The 4-hour charts show that the bears need to get below the 149.00 area and then 148.70.
On Monday, US House Speaker Kevin McCarthy expressed optimism about reaching a deal on the debt-limit with White House negotiators, stating that discussions had been productive leading up to a meeting with President Joe Biden later in the day.
With the impending "June X" deadline approaching, McCarthy emphasized the need for decisions to be made, but also stated that a deal could be reached as early as the next meeting or even tomorrow.
- Gold price bears are in the market but bulls are lurking.
- Fed speakers and the debt ceiling are on focus.
As per the prior analysis that was done in the pre-pen on Monday, Gold Price Forecast: XAU/USD bears are in the market but bulls step up, the bears have indeed moved in. Gold price is currently trading down some 0.13% and made a low of $1,968.90 in New York as Wall Street opened.
From a fundamental standpoint, it could be argued that due to a couple of US Federal Reserve officials, the non-yielding bullion was pressured by hawkish rhetoric. At the same time, markets are looking for more clarity around the US debt ceiling negotiations.
´´With the June 1 X-date rapidly approaching, markets will look for signs of progress on a debt ceiling deal,´´ the analysts at TD Securities explained:
´´While there have been positive overtures from both sides, the work is not yet complete. Markets appear to be assuming that negotiations are a done deal, suggesting that any souring in tone as negotiations play out could upset risk sentiment.´´
President Joe Biden and House Republican Speaker Kevin McCarthy are discussing the debt ceiling on Monday. as for Fed speak, Minneapolis Fed President Neel Kashkari told CNBC that "it may be that we have to go north of 6%" to get inflation back to the Fed's 2% target, while St. Louis Fed President James Bullard said there might be the need to go higher on policy rate.
Analysts at TD Securities explained that money managers liquidated some gold length and added shorts as debt ceiling optimism and resilient data aided the apparent formation of a triple top.
´´Still, our positioning analytics argue that selling exhaustion is imminent. After all, we estimate a high bar for subsequent CTA trend follower liquidations, whereas discretionary traders remain underinvested and Shanghai traders have begun adding to their positions once more,´´ the analysts added. ´´As expectations for a deeper Fed cutting cycle rise, discretionary traders should increasingly deploy their hoard of capital in the yellow metal, supporting new cycle highs before year-end.´´
Gold technical analysis
In the prior analysis, it was stated that the W-formation is a reversion pattern, so was something to take note of:
Gold price H4 chart, prior analysis
Gold price update, H4 chart
We have seen the pattern complete. Now the bulls need to step in and get on the back side of the trendline and into bullish territory. Failing that, then the broader bullish trendline could come under pressure:
- USD/JPY pair underpinned by high US T-bond yields, strong US Dollar.
- Despite last week’s negative outcome, the USD/JPY clings to gains above a five-month-old support trendline.
- Upside risks lie at 138.74, followed by 139.00; support is seen at 137.20s, 137.00.
USD/JPY resumes its uptrend, creeping higher above the 138.00 figure as the US Dollar (USD) strengthens, underpinned by higher US Treasury bond yields. Hawkish comments by Federal Reserve (Fed) officials, and positive discussions on the US debt ceiling, keeps the USD/JPY pair trading higher. Hence, the USD/JPY is trading at 138.51, a gain of 0.43%.
USD/JPY Price Analysis: Technical outlook
After finishing the last week with a negative session, the USD/JPY is still trading above a five-month-old resistance trendline, which turned support on May 18, which opened the door to a new year-to-date (YTD) high of 138.74, before a pullback to 137.25. The USD/JPYs bounced off that level and reclaimed the 138.00 figure.
Of note, the USD/JPY reached a new higher-high, while the Relative Strength Index (RSI) did not, peaking around 69.00 before entering overbought conditions, retraced towards the 65.00 area, suggesting buyers are losing momentum. The 3-day Rate of Change (RoC) it’s declining as buyers lose steam.
If USD/JPY breaks above the YTD high at 138.74, the next resistance would be the 139.00 figure, a zone that could propel the pair towards the 140.00 area, but buyers must crack the November 30 daily high of 139.89.
On the other hand, the USD/JPY first support would be 138.00. Break below will expose the May 18 low of 137.28 before challenging the 137.00 mark.
USD/JPY Price Action – Daily chart
- US Federal Reserve Chair Jerome Powell hints at a potential pause in rate hikes, indicating a data-dependent approach to monetary policy.
- St. Louis Fed President Bullard predicts two more rate hikes, while others voice the importance of watching how inflation develops.
- Hawkish rhetoric by European Central Bank officials underpins the EUR/USD pair.
The EUR/USD began the week sideways, clinging to the 1.0800 mark amidst a slightly upbeat market sentiment sponsored by an improvement in US ceiling discussions, despite hawkish rhetoric by Federal Reserve’s (Fed) officials. At the time of writing, the EUR/USD is trading at 1.0804, almost flat, after hitting a daily low of 1.0795.
Investors eye upcoming PMI data and further central bank official comments
The market sentiment remains slightly upbeat, with two of three US equity indices posting gains. During the last week, US Federal Reserve (Fed) Chair Jerome Powell struck a neutral tone on remarks last Friday, saying, “The risks of doing too much or doing too little are becoming more balanced, and our policy adjusted to reflect that.” Fed Chair Powell added that the Fed would be data-dependent, opening the door for a pause.
Earlier Monday, Federal Reserve officials commented that more tightening is needed, namely St. Louis Fed President Bullard, foreseeing two more rate hikes. At the same time, Minnesota’s Fed President, Neil Kashkari, is open to pausing but emphasized that it’s important to “not signaling that we’re done.” Of late, Atlanta’s Fed President Raphael Bostic commented that policy tightening acts with a lag, and he’s “comfortable” waiting for how “things play out.” Richmond’s Fed President Thomas Barkin commented that he’s “still looking to be convinced that inflation is in steady decline.”
Data-wise, the Eurozone (EU) economic docket featured that consumer confidence in the bloc rose 0.1 in May to -17.4 vs. April -17.5, though it came below estimates for an improvement toward -16.8.
European Central Bank policymakers on Friday, led by Christine Lagarde and Isabel Schnabel, stuck to its hawkish rhetoric, which trimmed the Euro’s (EUR) losses towards the weekend. ECB President Lagarde said the ECB would do what is necessary to deliver price stability and commented that she would not trade off price and financial stability. The ECB member Isabel Schnabel commented the ECB must continue to fight inflation “with determination.”
In the meantime, negotiations in the United States (US) would resume on Monday, after US President Joe Biden called US House Speaker Kevin McCarthy on Sunday after McCarthy’s and the Republicans stepped out from talks on Friday. Of late, the US Treasury Secretary Janet Yellen said that chances that the US can pay its bill by mid-June are trimming.
Upcoming events
The EU’s economic docket will feature S&P Global PMIs, Current Account figures, and additional ECB speakers. The US economic agenda will feature Federal Reserve speakers alongside the report of final figures of the S&P Global PMIs on Tuesday.
EUR/USD Technical Levels
Federal Reserve Bank of San Francisco President Mary Daly refrained from commenting on the next possible Federal Reserve policy decision but reiterated that they must be very date-dependent right now, as reported by Reuters.
Additional takeaways
"Want to see if policy tightening is affecting economy."
"Banking stresses have calmed, banks are in solid shape."
"Still lots of data to get before June FOMC."
"Tighter credit conditions may be akin to one to two rate hikes."
"Fed must be on watch for slowing economy."
"Inflation expectations are well anchored."
"Do not know how deep and long credit tightening will be."
"FOMC deciding meeting by meeting is more prudent path."
"Global tightening cycle has slowed activity less than expected."
"Balance sheet draw down working effectively."
"Seeing some signs of slowing in otherwise strong job market."
"Fed forecasts only as good as they day they are printed."
"Real wage growth for most Americans overtaken by inflation."
"Not surprising to see some rise in credit troubles for some Americans."
"Would be historical anomaly to get 2% inflation with sub 4% unemployment."
"Seems completely reasonable to see unemployment go above 4%."
Market reaction
The US Dollar Index clings to small daily gains near 103.30 after these comments.
- Uncertainty around the Mexican government seizing Grupo Mexico’s rail line triggers investor fears, leading to a sharp rise in USD/MXN.
- The unexpected military occupation of company facilities contradicts Mexican President AMLO’s campaign promises, impacting investor sentiment towards the Mexican Peso.
- Federal Reserve speakers and the resumption of US debt ceiling discussions add to the volatility of the USD/MXN pair, keeping traders on their toes.
USD/MXN rises sharply and reaches the 17.9609 three-week high courtesy of broad US Dollar (USD) strength, but also uncertainty around the Mexican government seizing Grupo Mexico’s rail line, increasing fears amongst investors in Mexico. Therefore, the USD/MXN opened the week at around 17.6960, but as of writing is trading at around the 17.85000area.
Mexican Peso dips as investors reposition amidst seizure concerns
An article posted by Bloomberg on Friday showed “A section of track in the state of Veracruz was deemed “of public utility” and transferred to a government entity that’s building a line across the Isthmus of Tehuantepec, a relatively narrow strip of land that separates the Pacific Ocean and the Gulf of Mexico.”
According to Bloomberg, “armed Navy personnel occupied company facilities on the Coatzacoalcos-Medias Aguas stretch of track beginning at 6 a.m. on Friday.” The takeover surprised the business community, contradicting campaign promises made by Mexican President Andres Manuel Lopez Obrador that his government wouldn’t seize private property.
Therefore, investors buying the Mexican Peso amidst its political stability and higher interest rates by the Bank of Mexico (Banxico) at 11.25% began to book profits and reposition themselves as the week started. Earlier in the Asian session, the USD/MXN commenced the week at 17.6960, but in one hour of trading, it jumped 1000 pips, toward 17.7957 on uncertainty about the outcome of the Mexican government’s actions.
Aside from this, US debt ceilings discussions would resume on Monday, as US President Joe Biden returned from the G7 reunion. On Friday, the Republicans stepped out from a reunion, halting the negotiations. The US Treasury Secretary Janet Yellen said that chances that the US can pay its bill by mid-June are trimming.
In the meantime, a light US economic agenda keep USD/MXN traders entertained on further Federal Reserve speakers. The Minnesota Fed President Neil Kashkari said, “I think right now it’s a close call, either way, versus raising another time in June or skipping. What’s important to me is not signaling that we’re done.” Of late, James Bullard, the President of the St. Louis Fed, commented he’s thinking of two more rate hikes this year.
Upcoming events
The US economic calendar will feature additional Federal Reserve speakers alongside the report of final figures of the S&P Global PMIs on Tuesday. On the Mexican front, the agenda will feature the 1st half-month of Inflation and Core Inflation in May.
USD/MXN Price Analysis: Technical outlook
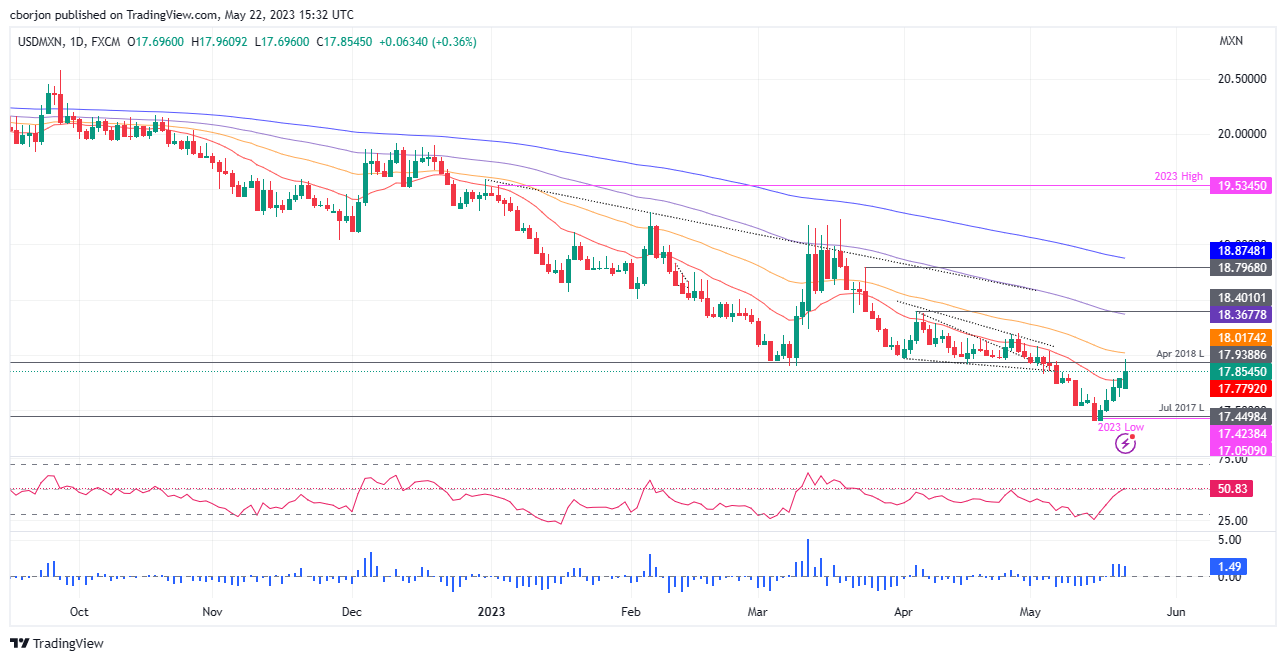
From a technical perspective, the USD/MXN is still neutral to downward biased. However, the slight recovery on Monday threatened to crack the 18.0000 figure, ahead of the 50-day Exponential Moving Average (EMA) at 18.01782. Notably, the Relative Strength Index (RSI) indicator has turned bullish, piercing the 50-midline, which could open the door for further buying strength. Upside risks lie at the May 22 high of 17.9609, followed by the confluence of the 50-day EMA and the 18.0000 figure. A breach of the latter will expose the 100-day EMA at 18.3678. On the other hand, a bearish continuation is likely to happen, below the 20-day EMA at 17.7794 and toward the YTD low of 17.4238.
We are just weeks away from hitting the limit for US government borrowing, and a compromise in Congress has yet to be reached. Economists at UBS analyze the market impact in the event of no agreement.
What happens if the US debt ceiling is not raised?
“In terms of the market impact, we estimate the S&P 500 could fall quickly by more than 10% in this scenario as markets reprice the growth outlook and heightened systemic risks, though it could recover a meaningful portion of this oss if market turmoil pressures Congress into reaching agreement.”
“We think longer-dated Treasury bonds could sell off initially in response to any default, but we would also then expect them to rally back as markets price a heightened probability of recession.”
“A default and subsequent Fed intervention would likely undermine the value of the US Dollar, and we would expect Gold to gain market favor, as it has in previous debt ceiling stalemates.”
"I expect today that we will be at the terminal rate not later than by summer," European Central Bank (ECB) policymaker Francois Villeroy de Galhau said while speaking at an event held at the Bank of France on Monday, per Reuters.
Key takeaways
"Primary question today is not how much further to hike rates, but how large is the pass-through of what is already in the pipe."
"In current tightening cycle, the lag in policy transmission may be at the upper end of 1-2 year range."
"Deceleration in rate increases from 50 bp to 25 bp was wise and cautious."
"We need to monitor the pass-through of our substantial and exceptionally rapid past hikes."
"How long we maintain rates high is now more important than the precise terminal level."
"We will remain data driven, looking meeting by meeting at the outlook for inflation and strength of monetary policy transmission."
Market reaction
EUR/USD stays on the back foot following these comments and was last seen trading a few pips above 1.0800.
According to the findings of the US Federal Reserve's annual survey entitled "Survey of Household Economics and Decisionmaking," households reported a decline in financial well-being.
Key takeaways
"Report shows higher prices have negatively affected most households."
"One third of households cited inflation as their main financial challenge."
"73% of respondents say they were doing 'at least okay financially' in 2022 vs 78% in 2021."
"Share of those saying they were worse off rose to 35%, the highest since the question was first asked in 2014."
"More workers received and asked for a pay increase or promotion in 2022 vs 2021."
"63% of respondents said they would cover a $400 emergency expense with cash, down from record-high 68% in 2021."
"Responses to survey questions suggest there has been some erosion in household financial buffers."
Market reaction
The US Dollar Index clings to small daily gains slightly above 103.20 after this report.
The Dollar’s bounce has run out of steam, but caution is warranted, Kit Juckes, Chief Global FX Strategist at Société Générale, reports.
When do we go short USD in earnest again, then?
“The US rates market has now corrected half the fall in end year Fed pricing that we saw as the banking crisis erupted. There may be a little more Dollar support coming from there, but not much.”
“I think we’re left overall, more data-sensitive than we were. In the end, that means a weaker Dollar but it’s still too early to go in selling the Dollar too excitedly.”
Economists at Société Générale analyze S&P 500 technical outlook.
Bulls target next resistance at 4220/4240
“S&P 500 is challenging the resistance of 4220/4240 representing previous bearish gap and low of January 2022. An initial pullback is not ruled out however the 200-DMA near 3970 should provide support.”
“Once the index establishes beyond 4220/4240, the uptrend is expected to extend. Next potential objectives could be at last August high of 4320 and 4510.”
See: S&P 500 could rise to 4,400 by year-end in a soft landing scenario – UBS
EUR/GBP dipped a little lower in the first part of the month. However, economists at Rabobank continue to expect the pair will turn higher in a 12-month view.
There are currently similarities to be drawn between the drivers of both the EUR and GBP
“Unless forthcoming Eurozone economic data surprises on the upside, there may be only a muted reaction to hawkish commentary from ECB officials in the coming weeks. Similarly, the market is also priced for further BoE rate hikes, suggesting there may be limited additional upside for GBP from ongoing hawkish remarks from BoE policymakers. This backdrop is heavily suggestive of range trading for EUR/GBP in the coming weeks.”
“Further out, we retain our forecast that EUR/GBP will grind higher to 0.90 on a 9 to 12-mth view. In that time frame, the market is likely to be focused on the prospect of looser monetary conditions from both the ECB and the BoE. Our expectation of GBP underperformance over the medium term is drawn from concerns over UK growth potential related to labour market shortages and ongoing low investment and productivity growth in the UK.”
- USD/CHF attracts some dip-buying on Monday and reverses a major part of its intraday losses.
- The optimism over US-China relations weighs on the safe-haven CHF and lends some support.
- US debt ceiling woes weigh on the USD and might keep a lid on any meaningful recovery move.
The USD/CHF pair recovers a major part of its intraday losses to a multi-day low and trades around the 0.8975-0.8970 region, down nearly 0.25% for the day, during the early North American session.
Against the backdrop of worries about a global economic slowdown, a surprise breakdown in the US debt ceiling negotiations weigh on investors' sentiment and drives some haven flows towards the Swiss Franc (CHF). Apart from this, subdued US Dollar (USD) price action, exerts some downward pressure on the USD/CHF pair. The US debt ceiling woes, along with less hawkish remarks by Federal Reserve (Fed) Chair Jerome Powell on Friday, triggers a fresh leg down in the US Treasury bond yields and keeps the USD bulls on the defensive.
Speaking at a Fed research conference, Powell said that it is still unclear if interest rates will need to rise further amid uncertainty about the impact of past hikes and recent bank credit tightening. Furthermore, Minneapolis Fed President Neel Kashkari is out with his take this Monday, saying that it was a close call on whether he will be in favour of hiking the policy rate one more time in June or pausing. That said, the optimism over a potential improvement in US-China relations lends support to the USD/CHF pair and helps limit any further losses.
Spot prices attract some buyers near the 0.8940 region, though any meaningful upside still seems elusive ahead of a key meeting between President Joe Biden and House Republican Speaker Kevin McCarthy to discuss the debt ceiling. Apart from this, the US bond yields will influence the USD price dynamics and provide some impetus to the USD/CHF pair in the absence of any relevant market-moving economic releases from the US. This, along with the broader risk sentiment should allow traders to grab short-term opportunities around the pair.
Technical levels to watch
UOB Group’s Senior Economist Julia Goh and Economist Loke Siew Ting assess the latest trade balance results in Malaysia.
Key Takeaways
“Gross exports declined for a second straight month and the most since May 2020 by 17.4% y/y in Apr (Mar: -1.4%) as a result of a shorter working month, year-ago high base effects, lower commodity price earnings, and dimmer global growth prospects. The reading came in worse than our estimate (-2.5%) and Bloomberg consensus (-5.0%). Gross imports also fell by a double-digit pace for the first time since May 2020 at 11.1% y/y (Mar: -1.8%, UOB est: -3.5% vs Bloomberg est: -2.4%). This brought trade surplus down substantially to MYR12.9bn (from +MYR26.7bn in Mar), the smallest trade surplus since May 2022.”
“The steeper-than-expected export contraction last month was weighed by all three economic sectors and almost all products, except for the refined petroleum products. Sluggish demand was also seen across most major trading partners, with shipments to G3 countries, China, and the ASEAN region all recording a double-digit annual contraction.”
“The latest export outturn has resulted in a year-to-date export contraction of 2.6% in the first four months of 2023 (Jan-Apr 2022: +21.7%), posing downside risks to our full-year export outlook. In view of persistent threats to the export outlook and negative base effects becoming more apparent in coming months, we trim our 2023 full-year export growth projection to -7.0% (from +1.5% previously, BNM est: +1.5%, 2022: +25.0%). Key downside risks include geopolitical tensions, potential financial instability stemming from monetary policy tightening, a pronounced growth slowdown in advanced economies, and a more moderate economic recovery in China.”
- EUR/GBP adds to the current range bound trade.
- Market sentiment remains tilted to the risk-on side.
- EMU Consumer Confidence is due next in the calendar.
Further improvement in the appetite for the risk complex lifts EUR/GBP to the boundaries of the 0.8700 hurdle so far on Monday.
EUR/GBP: Upside appears capped by the 200-day SMA
EUR/GBP moves to 2-day highs and jabs with the critical 0.8700 mark toward the start of the week, a region coincident with the 200-week SMA. Taking a look at the weekly chart, EUR/GBP begins the new trading week with gains after five sequential pullbacks.
Additionally, the cross contributes to the recent marginal advance while remaining well within the multi-session consolidative mood below the 200-day SMA, which is currently near 0.8740.
After it appears that a recession has been avoided on both sides of the Channel, the cross continues to closely monitor developments from the ECB and the BoE as well as the outlook for both economies.
Up until this point, the hawkish views from both central banks support the notion that extra tightening seems the most probable situation in the following month.
EUR/GBP key levels
The cross is gaining 0.08% at 0.8686 and faces the next resistance level at 0.8743 (200-day SMA) followed by 0.8834 (monthly high May 3) and then 0.8875 (monthly high April 25). On the other hand, the breakdown of 0.8661 (2023 low May 11) would expose 0.8547 (monthly low December 1 2022) and finally 0.8386 (weekly low August 17 2022).
Economists at Société Générale analyze USD/MXN technical outlook.
18.20/18.40 likely to contain short-term upside
“USD/MXN extended its downtrend after breaking the lower limit of the range since March. It has achieved the objective of 17.45 representing 2017 lows. An initial bounce is taking shape however it would be interesting to see if the pair can overcome the 50-DMA near 18.20/18.40 which is also recent pivot high. Failure could mean persistence in down move.”
“Break below 17.45 can lead the pair towards next projections at 17.10/16.95 which is also the low formed in 2016.”
- USD/CAD extends its sideways consolidative price move around the 100-day SMA on Monday.
- A modest bounce in Oil prices benefits the Loonie and caps the pair amid subdued USD demand.
- Looming recession risks and US debt ceiling woes help limit the downside for the safe-haven buck.
The USD/CAD pair struggles to a firm intraday direction on Monday and oscillates in a narrow band around the 100-day Simple Moving Average (SMA) through the early North American session. The pair is currently placed around the 1.3500 psychological mark, nearly unchanged for the day, and remains well within a familiar trading range held over the past week or so.
A modest intraday bounce in Crude Oil prices underpins the commodity-linked Loonie and turns out to be a key factor acting as a headwind for the USD/CAD pair amid subdued US Dollar (USD) price action. A surprise breakdown in the US debt ceiling negotiations, along with less hawkish remarks by Federal Reserve (Fed) Chair Jerome Powell, trigger a fresh leg down in the US Treasury bond yields and weighs on the USD.
It is worth recalling that Powell, speaking at a Fed research conference on Friday, said that it is still unclear if interest rates will need to rise further amid uncertainty about the impact of past hikes and recent bank credit tightening. Furthermore, Minneapolis Fed President Neel Kashkari is out with his take this Monday, saying that it was a close call on whether he will be in favour of hiking the policy rate one more time in June or pausing.
Apart from this, the optimism over a potential improvement in US-China relations acts as a headwind for the safe-haven buck. The downside for the USD, however, remains cushioned, at least for the time being, amid worries over slowing global growth, particularly in China. This, in turn, is expected to dent fuel demand, should cap the upside for the Crude Oil prices and contribute to limiting any meaningful slide for the USD/CAD pair.
In the absence of any relevant market-moving economic data from the US, the focus will remain glued to a key meeting between President Joe Biden and House Republican Speaker Kevin McCarthy to discuss the debt ceiling. Apart from this, the US bond yields, along with the broader risk sentiment, will influence the USD. Traders will further take cues from the Oil price dynamics to grab short-term opportunities around the USD/CAD pair.
Technical levels to watch
Ulrich Leuchtmann, Head of FX and Commodity Research at Commerzbank, analyzes EUR/USD outlook.
The Fed is only human too
“EUR/USD levels close to the 1.20 mark are not justifiable in my view. Why? I never had the impression that the market really believed the ‘tough guy’ impression chair Powell wanted to impersonate.”
“For some time now the OIS market has been pricing in Fed rate cuts for the medium term which Powell (it seems to me) wanted to dissuade it from. If I am correct with my (admittedly very subjective) view the US currency does not have far to fall, the realization that the Fed is quite human should then not result in enormous USD depreciation. But nor does it result in EUR/USD levels below 1.08 on a sustainable basis either.”
This could be another good week for the Dollar, according to analysts at ING.
Dollar can find more support
“Given the recent positive short-term reaction of the Dollar to progress on debt-ceiling news and assuming the stalemate will finally be resolved some time this week, we could see the greenback staying supported, especially given that the lack of key data releases should not particularly challenge another hawkish repricing of Fed expectations.”
“A key risk would only come in the form of particularly dovish FOMC minutes, although recent comments by FOMC members are pointing in the opposite direction.”
“We still think that the Fed has already hit the peak, and our US economist expects as much as 100 bps of cuts in late 2023 as the economic outlook deteriorates. With this in mind, we expect any Dollar resilience to prove unsustainable beyond the short term.”
St. Louis Federal Reserve President James Bullard said on Monday that the Fed wants to fight inflation while the labour market remains strong and added that the policy rate will have to go higher this year, perhaps by 50 basis points.
Additional takeaways
"Base case remains relatively slow growth for the rest of this year and into 2024, recession probabilities are overstated."
"SEP median of 5.1% was based on slow growth and inflation improvements that have not occurred."
"Companies are still scrambling for workers; job growth remains above trend."
"Core measures of inflation have not changed much in recent months."
"If inflation is not controlled, the Fed will have to do a lot more, should err on the side of doing more."
"Households are still flush and that will continue to support consumer spending."
Market reaction
These comments failed to trigger a significant reaction in the US Dollar Index, which was last seen trading flat on the day at 103.15.
Senior Economist at UOB Group Alvin Liew reviews the latest Q1 GDP readings in the Japanese economy.
Key Takeaways
“Japan’s 1Q 2023 GDP extended its increase at a stronger than expected pace of 0.4% q/q, 1.6% q/q SAAR while the 0.1% q/q SAAR expansion in 4Q 2022 was revised to -0.1% q/q contraction. With 3Q’s contraction unchanged at -1.0% q/q SAAR, this implied that Japan suffered a brief technical recession (3Q-4Q 2022) and has emerged from it in first quarter of this year.”
“Japan’s growth momentum in 1Q was stronger than forecast as we underestimated the impact of re-opening on private consumption and the surprise jump in business spending, while the fall in commodity prices helped further trim the country’s ballooning import bill. But weaker external demand (as overseas markets continued to slow down) continued to delay the export recovery, exerting a drag on overall growth.”
“Trade Outlook - For the next few months, the expectation is that the global economy will slow further in 2H which in turn means weaker external demand. And given the daunting high base comparison in the rest of 2023, we expect Japan’s exports to contract (y/y) in the next few months of 2023 (after Apr). And while we expect softer demand for Japan’s exports, we also see import declining (y/y) during these months, reducing the trade deficit. We expect Japan’s trade deficit to hit come in just below JPY 7 trillion in 2023. Year-to date, the trade deficit amounted to JPY 5.6 trillion in Apr.”
“Japan GDP Outlook – Weak manufacturing and exports likely to weigh on growth in 2023, while services to provide the much-needed mitigation. That said, the downside risk to services will be the extent of global slowdown in growth. With the weaker 2023 manufacturing outlook, financial market uncertainty and the recession risks in the developed markets of US and Europe on the back of tighter monetary policies while partly cushioned by the improving tourism and barring external events (such as escalating war in Europe, worsening US-China relations and a deadlier variant of COVID-19), we keep our modest 2023 GDP growth forecast of 1.0% (same pace as 2022).”
- USD/JPY rebounds around 80 pips from the daily low and refreshes the daily top in the last hour.
- A combination of factors undermines the safe-haven JPY and lends some support to the pair.
- A modest USD weakness might hold back bulls from placing aggressive bets and cap gains.
The USD/JPY pair attracts some buying following an intraday dip to the 137.50-137.45 region on Monday and climbs to a fresh daily high heading into the North American session. The pair is currently placed around the 138.30-138.35 zone and for now, seems to have stalled its retracement slide from the YTD peak touched on Friday.
Against the backdrop of a more dovish stance adopted by the Bank of Japan (BoJ), the optimism over a potential improvement in US-China relations undermines the safe-haven Japanese Yen (JPY) and acts as a tailwind for the USD/JPY pair. In fact, BoJ Governor Kazuo Ueda said on Friday that tightening monetary policy in the wake of expectations that inflation will slow back below the 2% target in the middle of the current fiscal year would hurt the economy. Ueda added that the BoJ will continue easing with yield curve control.
Meanwhile, US President Joe Biden said during the Group of Seven (G7) summit in Japan that he expects relations between the US and Beijing to improve very shortly. This, to some extent, offsets worries over slowing global growth and weighs on the JPY. The US Dollar (USD), on the other hand, is dragged down by a surprise breakdown in the US debt ceiling negotiations and less hawkish remarks by Federal Reserve (Fed) Chair Jerome Powell. This might hold back traders from placing aggressive bullish bets around the USD/JPY pair.
Speaking at a Fed research conference, Powell said on Friday it is still unclear if interest rates will need to rise further amid uncertainty about the impact of past hikes and recent bank credit tightening. Adding to this, Minneapolis Fed President Neel Kashkari said this Monday that it was a close call on whether he will be in favour of hiking the policy rate one more time in June or pausing. Apart from this, the US debt ceiling woes trigger a fresh leg down in the US Treasury bond yields, which acts as a headwind for the USD and might cap the USD/JPY pair.
In the absence of any relevant market-moving economic data from the US, the focus will remain glued to a key meeting between President Joe Biden and House Republican Speaker Kevin McCarthy to discuss the debt ceiling. Apart from this, the US bond yields will influence the USD price dynamics and provide some impetus to the USD/JPY pair. Traders will further take cues from the broader risk sentiment to grab short-term opportunities ahead of the BoJ Core CPI print and the flash Japan Manufacturing PMI, due during the Asian session on Tuesday.
Technical levels to watch
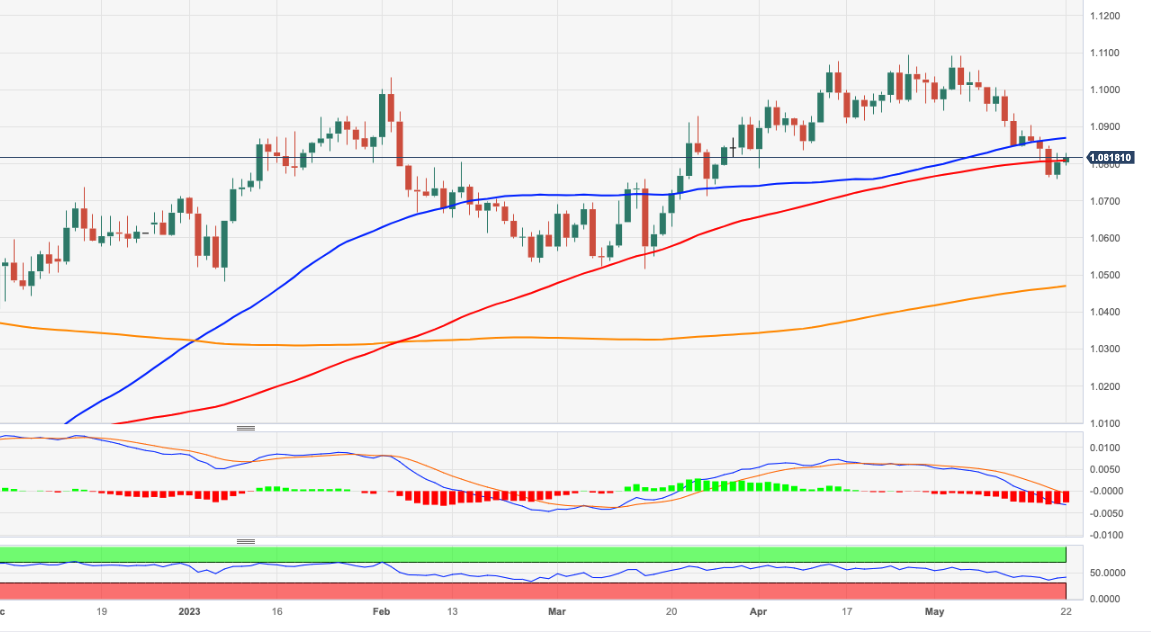
- EUR/USD looks to consolidate the recent breakout of 1.0800.
- Further up comes the transitory barrier at the 55-day SMA.
EUR/USD adds to Friday’s move higher and surpasses the 1.0800 hurdle with some conviction.
While initially supported by the 1.0760 region, occasional bullish attempts could see the pair confront the interim resistance area at the 55-day SMA at 1.0868 prior to the psychological 1.1000 mark.
Extra losses are not ruled out, however, in the current context, although a sustained retracement to the March bottom of 1.0516 (March 15) is not favoured for the time being.
Looking at the longer run, the constructive view remains unchanged while above the 200-day SMA, today at 1.0468.
EUR/USD daily chart
- Oil price opens the week lower on concerns global trade may be impacted by geopolitical wrangling at G7 summit.
- China provokes the United States by banning US-manufactured micro chips.
- Oil recovers after US Dollar weakens on continued debt-ceiling uncertainty as talks reopen in Washington.
Oil price gaps lower at the start of the week on concerns global growth may suffer, after the world’s leading economies antagonized China at the G7 summit in Hiroshima. World leaders discuss ‘de-risking’, or weaning themselves off an over-reliance on Chinese imports at the summit. Washington and Beijing exchanged harsh words as China banned imported chips from US manufacturer Micron, after failing to pass a security test. Support from a weakening US Dollar, however, lifts Crude Oil back up to Friday’s close after the weak open.
At the time of writing, WTI Oil is trading in the upper $71s and Brent Crude Oil in the mid $75s.
Oil news and market movers
- Oil price falls on global growth and trade concerns after major economies clash at the G7 summit in Japan.
- Geopolitics polarizes the G7 into two competing camps – China and Russia, who are seen as threats to world prosperity and peace – and the rest, led by the United States.
- China provokes the US by banning imports of micro chips from US manufacturer Micron, citing security risks.
- Oil price subsequently recovers, however, supported by a weaker US Dollar.
- The Greenback remains under pressure as the debt-ceiling impasse trundles on.
Crude Oil Technical Analysis: Downtrend showing signs of ending
WTI Oil is in a long-term downtrend, making successive lower lows. Given the old adage that the trend is your friend, this favors short positions over long positions. WTI Oil is trading below all the major daily Simple Moving Averages (SMA) and all the weekly SMAs except the 200-week which is at $66.89.
-638203550939866230.png)
WTI US Oil: Daily Chart
A break below the year-to-date (YTD) lows of $64.31 would be required to reignite the downtrend, with the next target at around $62.00 where trough lows from 2021 will come into play, followed by support at $57.50.
Despite the bearish trend dominating, there are signs pointing to a possible conclusion. The mild bullish convergence between price and the Relative Strength Index (RSI) at the March and May 2023 lows – with price making a lower low in May that is not matched by a lower low in RSI – is a sign that bearish pressure is easing.
The long hammer Japanese candlestick pattern that formed at the May 4 (and year-to-date) lows is a sign that it could be a key strategic bottom.
Oil price bulls, however, would need to break above the $76.85 lower high of April 28 to bring the dominant bear trend into doubt.
WTI Oil FAQs
What is WTI Oil?
WTI Oil is a type of Crude Oil sold on international markets. The WTI stands for West Texas Intermediate, one of three major types including Brent and Dubai Crude. WTI is also referred to as “light” and “sweet” because of its relatively low gravity and sulfur content respectively. It is considered a high quality Oil that is easily refined. It is sourced in the United States and distributed via the Cushing hub, which is considered “The Pipeline Crossroads of the World”. It is a benchmark for the Oil market and WTI price is frequently quoted in the media.
What factors drive the price of WTI Oil?
Like all assets, supply and demand are the key drivers of WTI Oil price. As such, global growth can be a driver of increased demand and vice versa for weak global growth. Political instability, wars, and sanctions can disrupt supply and impact prices. The decisions of OPEC, a group of major Oil-producing countries, is another key driver of price. The value of the US Dollar influences the price of WTI Crude Oil, since Oil is predominantly traded in US Dollars, thus a weaker US Dollar can make Oil more affordable and vice versa.
How does inventory data impact the price of WTI Oil
The weekly Oil inventory reports published by the American Petroleum Institute (API) and the Energy Information Agency (EIA) impact the price of WTI Oil. Changes in inventories reflect fluctuating supply and demand. If the data shows a drop in inventories it can indicate increased demand, pushing up Oil price. Higher inventories can reflect increased supply, pushing down prices. API’s report is published every Tuesday and EIA’s the day after. Their results are usually similar, falling within 1% of each other 75% of the time. The EIA data is considered more reliable, since it is a government agency.
How does OPEC influence the price of WTI Oil?
OPEC (Organization of the Petroleum Exporting Countries) is a group of 13 Oil-producing nations who collectively decide production quotas for member countries at twice-yearly meetings. Their decisions often impact WTI Oil prices. When OPEC decides to lower quotas, it can tighten supply, pushing up Oil prices. When OPEC increases production, it has the opposite effect. OPEC+ refers to an expanded group that includes ten extra non-OPEC members, the most notable of which is Russia.
Strategists at TD Securities discuss Gold (XAU/USD) outlook.
Discretionary traders should increasingly deploy their hoard of capital in Gold
“Money managers liquidated some Gold length and added shorts as debt ceiling optimism and resilient data aided the apparent formation of a triple top. Still, our positioning analytics argue that selling exhaustion is imminent.”
“We estimate a high bar for subsequent CTA trend follower liquidations, whereas discretionary traders remain underinvested and Shanghai traders have begun adding to their positions once more.”
“As expectations for a deeper Fed cutting cycle rise, discretionary traders should increasingly deploy their hoard of capital in the yellow metal, supporting new cycle highs before year-end.”
In an interview with CNBC on Monday, Minneapolis Federal Reserve President Neel Kashkari said that it was a close call on whether he will be in favor of hiking the policy rate one more time in June or pausing, per Reuters.
Key takeaways
"Seeing very little imprint of banking problems in Minneapolis Fed district."
"Not seeing evidence yet that banking stress is doing our work for us on inflation."
"Services inflation seems pretty darn entrenched."
"It may be that we have to go north of 6%, but not clear."
"We cannot protect the economy from a debt default, this type of brinksmanship weakens ourselves relative to global competitors."
Market reaction
These comments don't seem to be having a noticeable impact on the US Dollar's performance against its major rivals. As of writing, the US Dollar Index was virtually unchanged on the day at 103.15.
GBP/USD holds steady around mid-1.2400s. Economists at OCBC Bank analyze the pair's technical outlook.
Risks are skewed to the upside
“Mild bearish momentum intact but show signs of fading while RSI rose. Risks are skewed to the upside.”
“Resistance at 1.2470 (23.6% fibo), 1.2515 (21-DMA).”
“Support at 1.2420 (50-Day Moving Average), 1.2345 (38.2% fibo retracement of Mar low to May high).”
“This week’s data focus on prelim PMIs (Tue); CPI (Wed) and Retail Sales (Fri).”
See: Downside risks for Sterling are quite sizeable on soft UK CPI data – ING
Economist at UOB Group Ho Woei Chen, CFA, comments on the upcoming BoK monetary policy meeting (May 25).
Key Takeaways
“The Bank of Korea (BOK) is likely to extend its interest rate pause at the upcoming monetary policy decision on 25 May. BOK’s signal regarding future policy actions will be the key focus of the meeting.”
“Economic data had remained weak. External facing sectors remained under pressure while domestic demand outlook appears to be slightly better.”
“South Korea has not seen much spillover effect of China’s borders reopening. Exports to China continued to contract at double-digit pace in Apr. Chinese tourists accounted for around 8.4% of 1Q23 arrivals which remained a far cry from a third of its total arrivals before the pandemic. However, this should further improve with the release of bottlenecks in China’s tourism sector.”
“Inflation remains a concern especially the core inflation which had stayed elevated. The depreciation in KRW adds to imported inflation while a second 5.3% hike in electricity prices (in addition to 9.5% hike in Jan) will also contribute to the inflationary pressure in South Korea.”
“With US Fed set to pause its rate hike cycle, we think the BOK is likely to start to tone down its hawkish bias in 2H23 and start to lower interest rate in 1Q24 if inflation cools sufficiently.”
- DXY extends further the corrective pullback and retests 103.00.
- The resumption of the uptrend could revisit the 200-day SMA.
DXY appears to have met a decent resistance area around 103.60, or multi-week peaks, so far this month.
In case bulls regain the upper hand, a convincing move past 103.60/65 could pave the way for a potential challenge of the key 200-day SMA, today at 105.76 just ahead of the 2023 high of 105.88 (March 8).
Looking at the broader picture, while below the 200-day SMA the outlook for the index is expected to remain negative.
DXYdaily chart
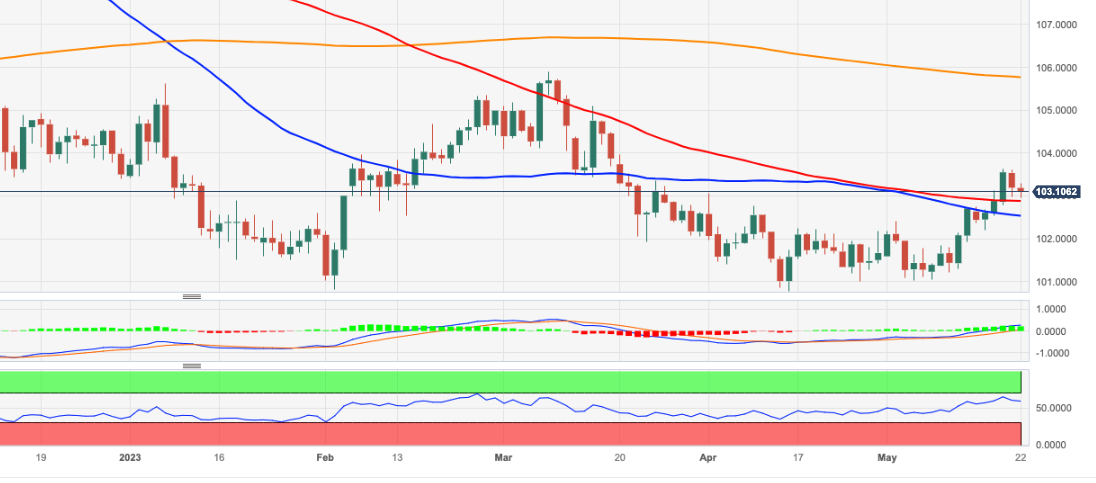
- EUR/JPY appears to have embarked on a consolidation phase.
- The breakout of 150.00 could put the 2023 high on the radar.
EUR/JPY resumes the upside following Friday’s pullback, always below the 150.00 region so far on Monday.
If the cross clears the key round level at 150.00, it could then challenge the 2023 top at 151.61 (May 2).
So far, further upside looks favoured while the cross trades above the 200-day SMA, today at 143.36.
EUR/JPY daily chart
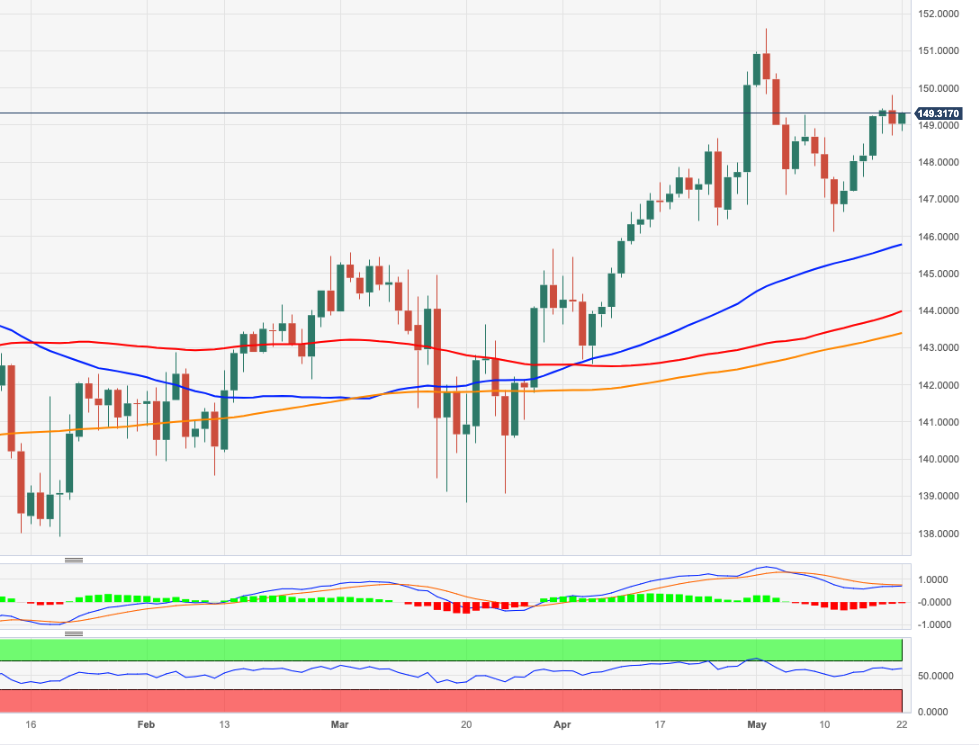
Further upside seems in the pipeline for USD/IDR while above the 14,750 level, notes Markets Strategist Quek Ser Leang at UOB Group.
Key Quotes
“Last Monday (15 May, spot at 14,810), we indicated that ‘improving upward momentum is likely to lead to further USD/IDR strength to 14,930’. However, we held the view that ‘it is too early to expect a break of 14,980’.”
“Our view was not wrong as USD/IDR rose to 14,964 before ending the week at 14,920 (+1.19%). This week, as long as USD/IDR stays above 14,750, there is a chance for USD/IDR to rise further even though it might not be able to break clearly above the resistance at 14,980.”
- AUD/USD oscillates in a narrow range on Monday and is influenced by a combination of factors.
- Looming recession risks weigh on investors’ sentiment and cap gains for the risk-sensitive Aussie.
- A modest USD downtick lends some support to the major and helps limit any meaningful downfall.
The AUD/USD pair struggles to capitalize on Friday's modest gains and seesaws between tepid gains/minor losses through the first half of the European session on the first day of a new week. The pair currently trades around the 0.6650 area, nearly unchanged for the day and is influenced by a combination of factors.
Worries over slowing global growth, along with US debt ceiling woes, weigh on investors' sentiment and turn out to be a key factor acting as a headwind for the risk-sensitive Aussie. Apart from this, expectations that the Reserve Bank of Australia (RBA) might refrain from hiking in June, bolstered by the disappointing release of Australian jobs data last week, contributes to capping the AUD/USD pair. The downside, however, remains cushioned in the wake of a mildly softer tone surrounding the US Dollar (USD).
In fact, the USD Index (DXY), which tracks the Greenback against a basket of currencies, remains on the defensive for the second straight day and moves further from a two-month high touched on Friday. A surprise breakdown in the US debt ceiling negotiations fuels fears of an unprecedented American debt default. This, along with less hawkish remarks by Federal Reserve (Fed) Chair Jerome Powell, triggers a fresh leg down in the US Treasury bond yields and continues to undermine the Greenback.
In the absence of any relevant market-moving economic releases on Monday, traders also seem reluctant ahead of a key meeting between President Joe Biden and House Republican Speaker Kevin McCarthy to discuss the debt ceiling. Apart from this, the US bond yields, along with the broader risk sentiment, will influence the USD price dynamics and provide some impetus to the AUD/USD pair. The market attention will then shift to the release of flash PMI prints from Australia and the US on Tuesday.
Technical levels to watch
Economists at OCBC Bank analyze the USD outlook amid the debt-ceiling issue.
Bullish momentum easing
“We opined that US debt-ceiling issue does not quite matter for FX until it happens. That said, there is no room for complacency. Knee-jerk reaction on breach of debt ceiling should see risk-off trades favouring USD but subsequently, this could be a medium-term negative for USD as implications of a breach/default could accelerate the de-dollarisation story and undermine the USD's safe haven characteristic.”
“Bullish momentum on daily chart shows signs of fading while RSI fell from overbought conditions. Risks to the downside.”
“Support at 102.75/90 levels (61.8% fibo retracement of 2023 low to high, 100-DMA), 102.30 (50-DMA) and 102 (76.4% fibo, 21-DMA).” “Resistance at 103.40 (50% fibo), 103.95 (38.2% fibo).”
CNY weakened sharply last week. Economists at Commerzbank expect Yuan to remain under downside pressure.
CNY weakness should remain in the near term
“Last Friday, the PBoC issued a statement that vowed to curb speculation and called for more stability in the foreign exchange market. The announcement came as a surprise given that the PBoC did not appear to be defending the CNY decisively.”
“While CNY appreciated temporarily against the Dollar following the PBoC statement, currency weakness should remain in the near term.”
“The contrast between China’s monetary easing stance and tightening bias of central banks in the US and Euro area will continue to weigh on CNY.”
- US Dollar is showing a mixed picture with Asian currencies gaining room against the Greenback.
- US Dollar Index torn between Asian upspark on Monday and downbeat remaining G7 currencies.
- US stock futures point to a soft opening on Monday with small losses at hand.
The US Dollar (USD) is showing a very mixed picture this Monday with two clearly defined regions explaining why the US Dollar Index (DXY) is going nowhere. The US Dollar is gaining against most G7 currencies, with the exception of Asian pairs such as the South-Korean Wong (KRW) and the Japanese Yen (JPY), which are gaining traction against the Greenback. The Asian currency rise comes after several headlines from the PBoC , South-Korea trade data and Japanese Machinery Orders.
On the macroeconomic data front, traders will be mulling the progress on the United States debt ceiling talks after a brief hiccup over the weekend, when further talks got cancelled by the Republicans, as they walked away from the negotiating table. Meanwhile, US President Joe Biden has been able to restore the situation and talks began again on Sunday. This week, several important US macroeconomic data will be released and could have big impact on the US Dollar, withPMI numbers on Tuesday and Durable Goods and the PCE Price Index, which is the Fed’s preferred inflation metric, on Friday, leading the way.
Daily digest: US Dollar to float between debt ceiling talks and macroeconomic data
- Indices globally took a turn to the downside at the start of the Asian session on Monday, where Asian indices were able to create a turnaround and print positive numbers.
- US President Joe Biden commented on Monday morning out of Japan that calls with US House Speaker and Republican Kevin McCarthy went well and that talks will resume tomorrow.
- McCarthy, from his side, reiterated that talks will not progress as long as President Biden has not returned to the US.
- Over the weekend, US Treasury Secretary Janet Yellen threw a small spanner in the works by saying that the US Treasury has a quite low probability of being able to pay its bills by June 15.
- On Friday, US Fed Chairman Jerome Powell attended a panel discussion with former Fed Chair Ben Bernanke. Powell commented that rates may not need to rise as high given current credit stress.
- The CME Group FedWatch Tool shows that markets are flip-flopping again after these comments from Powell on Friday and have priced out again a rate hike for June, while an initial rate cut has been delayed until September instead of July before.
- The benchmark 10-year US Treasury bond yield trades at 3.64% and is showing further signs of retreat after peaking to 3.71% on Friday. This could allow for some US Dollar bearish correction.
US Dollar Index technical analysis: Will the uptrend hold?
The US Dollar Index (DXY) has taken out both the 55-day and the 100-day Simple Moving Averages (SMA), respectively, at 102.52 and 102.87. For now, the support looks to be holding at 103 and could see the DXY heading back to challenge 103.61, the high of past Thursday.
On the upside, 105.79 (200-day SMA) still acts as the big target to hit, as the next upside target at 104.00 (psychological level, static level) acts as an intermediary element to cross the open space.
On the downside, 102.87 (100-day SMA) aligns as the first support level to make sure that . In the case that breaks down, watch how the DXY reacts at the 55-day SMA at 102.52 in order to assess any further downturn or upturn.
US Dollar FAQs
What is the US Dollar?
The US Dollar (USD) is the official currency of the United States of America, and the 'de facto' currency of a significant number of other countries where it is found in circulation alongside local notes. It is the most heavily traded currency in the world, accounting for over 88% of all global foreign exchange turnover, or an average of $6.6 trillion in transactions per day, according to data from 2022.
Following the second world war, the USD took over from the British Pound as the world's reserve currency. For most of its history, the US Dollar was backed by Gold, until the Bretton Woods Agreement in 1971 when the Gold Standard went away.
How do the decisions of the Federal Reserve impact the US Dollar?
The most important single factor impacting on the value of the US Dollar is monetary policy, which is shaped by the Federal Reserve (Fed). The Fed has two mandates: to achieve price stability (control inflation) and foster full employment. Its primary tool to achieve these two goals is by adjusting interest rates.
When prices are rising too quickly and inflation is above the Fed's 2% target, the Fed will raise rates, which helps the USD value. When inflation falls below 2% or the Unemployment Rate is too high, the Fed may lower interest rates, which weighs on the Greenback.
What is Quantitative Easing and how does it influence the US Dollar?
In extreme situations, the Federal Reserve can also print more Dollars and enact quantitative easing (QE). QE is the process by which the Fed substantially increases the flow of credit in a stuck financial system.
It is a non-standard policy measure used when credit has dried up because banks will not lend to each other (out of the fear of counterparty default). It is a last resort when simply lowering interest rates is unlikely to achieve the necessary result. It was the Fed's weapon of choice to combat the credit crunch that occurred during the Great Financial Crisis in 2008. It involves the Fed printing more Dollars and using them to buy US government bonds predominantly from financial institutions. QE usually leads to a weaker US Dollar.
What is Quantitative Tightening and how does it influence the US Dollar?
Quantitative tightening (QT) is the reverse process whereby the Federal Reserve stops buying bonds from financial institutions and does not reinvest the principal from the bonds it holds maturing in new purchases. It is usually positive for the US Dollar.
- GBP/USD manages to defend 50-day SMA, though struggles to attract any meaningful buying.
- A combination of factors keeps the USD bulls on the defensive and lends support to the major.
- Speculations for fewer rate hikes by BoE undermine the GBP and contribute to capping the pair.
The GBP/USD pair attracts some dip-buying near the 1.2415 region on Monday and trades with a mild positive bias through the first half of the European session. Spot prices, however, remain well within the striking distance of a nearly one-month low touched last week and currently trade around the 1.2445-1.2450 area up less than 0.10% for the day.
The US Dollar (USD) edges lower for the second successive day, below a two-month high touched on Friday, and turns out to be a key factor that assists the GBP/USD pair to defend the 50-day Simple Moving Average (SMA). A surprise breakdown in the US debt ceiling negotiations raises doubts that a deal will be reached soon and fuels fears of an unprecedented American debt default. This, along with less hawkish remarks by Federal Reserve (Fed) Chair Jerome Powell, keeps the USD bulls on the defensive through the first half of trading on Monday.
The upside for the GBP/USD pair, however, remains capped expectations that fewer rate increases by the Bank of England (BoE) will be needed in the coming months to bring down inflation. The bets were lifted by rather unimpressive UK jobs data released on Tuesday and BoE Governor Andrew Bailey's comments last week, saying that there were some signs of a cooling of inflation and that the labour market is loosening a little. This, in turn, holds back traders from placing aggressive bullish bets around the major and acts as a headwind.
Furthermore, worries over slowing global growth overshadow the optimism over a potential improvement in US-China relations and benefit the Greenback's relative safe-haven status. This is seen as another factor that contributes to capping the upside for the GBP/USD pair in the absence of any relevant market-moving economic data, either from the UK or the US. Traders also seem reluctant and wait on the sidelines ahead of a meeting between President Joe Biden and House Republican Speaker Kevin McCarthy to discuss the debt ceiling.
Technical levels to watch
UK CPI will be key for Sterling this week. Economists at ING expect a cool-down in prices to weigh on GBP.
All about inflation
“Wednesday’s inflation data in the UK will be a make-or-break event for the Pound. If our expectations are correct and CPI data indicates enough of a cool-down in prices to convince the Bank of England to pause tightening in June, the downside risks for Sterling are quite sizeable.”
“Should the Dollar find more support this week, we could see a decisive acceleration in Cable’s correction on diverging Fed-BoE diverging narratives and the 1.2250-1.2300 region being explored, while we see upside risks for EUR/GBP into the 0.8750-0.8800 area in the near term.”
According to Markets Strategist Quek Ser Leang at UOB Group, USD/MYR faces a potential move to the 4.5600 region in the short-term horizon.
Key Quotes
“While we expected USD/MYR to strengthen last week, we held the view that it ‘might not be able to break above the March high of 4.5290’. The anticipated USD/MYR strength exceeded our expectations by a wide margin as USD/MYR lifted off and soared to a 6month high of 4.5510 before ending the week at 4.5360 (+1.32%).”
“The sharp and swift rise appears to be overdone but USD/MYR could test 4.5600 first before the risk of a reversal increases. The next resistance at 4.5750 is unlikely to come into view. Support is at 4.5230, followed by 4.5000.”
Ulrich Leuchtmann, Head of FX and Commodity Research at Commerzbank, explains why the FX market seems to ignore the subject of the “debt ceiling”
Risk of default has not moved USD to such an extent that identification of the effect would be clear
“The market cannot reach consensus about the effect such a one-off event will have. If no market participant can project how all the others would evaluate a US default nobody can deduct positions from their own view as to whether it will happen or not. And that means we are in a situation where the market seems to ignore this risk.”
“Only that that does not mean that nothing would happen to the USD exchange rates if a default really were to arise!”
China's Commerce Minister Wang Wentao hosts a seminar for US firms investing in China on Monday, the Ministry said in its press release.
Additional takeaways
China's economic operation has maintained a good trend of recovery and market potential has continued to be released.
Will continue to welcome US firms to develop in China.
Will continue to provide accurate and efficient service guarantees for foreign-funded enterprises.
This comes after the Wall Street Journal (WSJ) reported that China is banning major Chinese firms from buying from Micron Technology, citing its products pose a major national security risk.
Market reaction
At the time of writing, AUD/USD is trading listlessly near 0.6650 amid mixed US-China news and looming US debt-ceiling risks.
- Gold price oscillates in a narrow trading band and is influenced by a combination of factors.
- A modest intraday US Dollar uptick acts as a headwind and caps the upside for the XAU/USD.
- The downside remains cushioned amid looming recession risks and US debt ceiling woes.
- Fed Chair Powell’s less hawkish remarks on Friday should continue to lend some support.
Gold price struggles to capitalize on Friday's goodish recovery move from the vicinity of the $1,950 level, or its lowest level since early April touched on Friday and kicks off the new week on a subdued note. The XAU/USD seesaws between tepid gains/minor losses through the early European session and currently trades around the $1,980 area, up a little for the second straight day.
Modest US Dollar strength weighs on Gold price
The US Dollar (USD) attracts some dip-buying on Monday and for now, seems to have stalled Friday's retracement slide from a two-month high. This, along with the optimism over a potential improvement in relations between the United States (US) and China, acts as a headwind for the US Dollar-denominated Gold price. In fact, US President Joe Biden said during the Group of Seven (G7) summit in Japan that he expects US-China relations to improve very shortly. This, however, is overshadowed by worries over slowing global growth and a surprise breakdown in the US debt ceiling negotiations.
US debt ceiling woes, economic worries lend support to XAU/USD
It is worth recalling that talks over the potential to raise the government's $31.4 trillion debt ceiling suddenly broke down at the end of the last week. This raises scepticism about a deal being reached soon and fuels fears of an unprecedented American debt default. Apart from this, less hawkish remarks by Federal Reserve (Fed) Chair Jerome Powell act as a headwind for the USD and lend support to the safe-haven Gold price. Speaking at a Fed research conference, Powell said that it is unclear if interest rates will need to rise further amid uncertainty about the impact of past hikes.
Fed Chair Powell’s less hawkish remarks further limit the downside
Powell reiterated that the central bank would now make decisions meeting by meeting and added that officials can afford to look at the data and the evolving outlook to make a careful assessment after a year of aggressive rate increases. Powell's preference to slow rate hikes triggers a fresh leg down in the US Treasury bond yields, which is holding back the USD bulls from placing aggressive bets and contributing to limiting the downside for the non-yielding Gold price. The lack of any meaningful buying, meanwhile, warrants some caution before positioning for any further appreciating move.
Focus shifts to this week’s important US macro data and FOMC minutes
There isn't any major market-moving economic data due for release on Monday from the US. Hence, the focus remains glued to a key meeting between President Joe Biden and House Republican Speaker Kevin McCarthy to discuss the debt ceiling. Apart from this, the US bond yields will influence the USD price dynamics and provide some impetus to Gold price. Traders will further take cues from the broader risk sentiment to grab short-term opportunities ahead of the release of the flash US PMI prints on Tuesday and the Federal Open Market Committee (FOMC) meeting minutes on Wednesday.
Gold price technical outlook
From a technical perspective, a sustained strength beyond the $1,984-$1,985 region has the potential to lift the Gold price back to the $2,000 psychological mark. Some follow-through buying will negate any near-term negative bias and allow the XAU/USD to climb further towards the next relevant hurdle near the $2,011-$2,012 region. The latter should act as a pivotal point, which if cleared decisively might trigger a fresh bout of a short-covering move.
On the flip side, the $1,950 region now seems to have emerged as strong support and should protect the immediate downside. Some follow-through selling, however, will expose the 100-day Simple Moving Average (SMA), currently pegged near the $1,930 zone, below which Gold price could accelerate the fall further towards testing the $1,900 round-figure mark.
Key levels to watch
Economists at Société Générale analyze EUR/CHF’s technical outlook.
Last week’s peak near 0.9770 must be overcome for affirming a meaningful up move
“EUR/CHF is now challenging the interim support zone of 0.9710/0.9670 representing the low of March and the 61.8% retracement from last year. An initial bounce is not ruled out however the peak achieved last week near 0.9770 must be overcome for affirming a meaningful up move.”
“Break below 0.9710/0.9670 could mean a persistent decline towards projections of 0.9600 and 0.9540.”
EUR/USD has been moved almost entirely by the Dollar in the past week or so, as debt-ceiling news dominated. Economists at ING analyze the pair’s outlook for this week.
The balance of risks appears tilted to the downside
“For this week, the balance of risks appears tilted to the downside for EUR/USD as the Dollar may find a bit more support from a debt-ceiling deal and hawkish Fed rate expectations.”
“We can’t exclude the drop extending to sub-1.0700 levels at this stage, although opportunistic buying would probably start to emerge more prominently around such levels.”
Economists at UBS believe the structural bull case for commodities is intact.
Gold prices to rise to $2,200 by March next year
“We believe the structural bull case for commodities is intact, so the sector remains most preferred in spite of recent volatility. Our stance is backed by demand from China's recovery and unresolved supply-side issues. A weakening Dollar, low inventories, and ongoing weather risks should also support prices.”
“We maintain our total return outlook of around 20% over the next 12 months for the asset class. Our most preferred commodities are Oil and Gold, and we see the yellow metal rising to $2,200 by March 2024.”
- NZD/USD attracts some dip-buying on Monday, albeit lacks follow-through.
- An intraday pickup in the USD demand acts as a headwind for the major.
- The downside seems limited as traders keenly await the RBNZ on Tuesday.
The NZD/USD pair struggles to capitalize on the move on Monday and attracts fresh sellers in the vicinity of the 0.6300 round-figure mark. Spot prices drop back closer to the lower end of the daily range and trade around the 0.6265-0.6270 region during the early European session.
The US Dollar (USD) attracts some dip-buying on the first day of a new week and stalls its retracement slide from a two-month high touched on Friday, which, in turn, is seen as a key factor acting as a headwind for the NZD/USD pair. Worries over slowing global growth, to a larger extent, overshadow the optimism over a potential improvement in US-China relations and drive some haven flows towards the Greenback. That said, any meaningful USD upside seems capped in the wake of a surprise breakdown in the US debt ceiling negotiations and less hawkish remarks by Federal Reserve (Fed) Chair Jerome Powell.
It is worth recalling that talks over the potential to raise the government's $31.4 trillion debt ceiling to avoid an unprecedented American debt default suddenly broke down at the end of the last week. Furthermore, Powell said on Friday it is still unclear if interest rates will need to rise further amid uncertainty about the impact of past hikes and recent bank credit tightening. Powell reiterated that the central bank would now make decisions meeting by meeting and added that officials can afford to look at the data and the evolving outlook to make a careful assessment after a year of aggressive rate increases.
The aforementioned factors trigger a fresh leg down in the US Treasury bond yields, which might hold back the USD bulls from placing aggressive bets and limit the downside for the NZD/USD pair. Investors also seem reluctant and prefer to wait on the sidelines ahead of the key Reserve Bank of New Zealand (RBNZ) monetary policy meeting on Tuesday. The recent survey showed that inflation expectations for the first quarter eased to 2.79% from 3.30% and forced investors to scale back their bets for further rate hikes. This might have set the stage for a dovish shift and favour bearish traders.
The market attention will then shift to the release of flash PMI prints from the US on Tuesday, followed by the FOMC meeting minutes on Wednesday. In the meantime, the focus will remain glued to a key meeting between President Joe Biden and House Republican Speaker Kevin McCarthy to discuss the debt ceiling. Apart from this, the US bond yields and the broader risk sentiment, will influence the USD price dynamics and provide some impetus to the NZD/USD pair.
Technical levels to watch
Markets Strategist Quek Ser Leang at UOB Group sees chances of USD/THB to revisit the 34.55 level in the near term.
Key Quotes
“We expected USD/THB to rebound further but we were of the view that ‘any advance is unlikely to break the major resistance at 34.20 this week’. We did not anticipate the surge in momentum as USD/THB soared to a high of 34.52. While short-term conditions are rather overbought, the rapid rise in USD/THB has room to test 34.55 before the risk of a more sustained pullback increases.”
“The next resistance at 34.75 is unlikely to come into view. On the downside, a break of 34.05 (minor support is at 34.20) would indicate that the current upward pressure has faded.”
- EUR/USD trades without a clear direction near 1.0800.
- Market participants remain prudent ahead of debt ceiling debate.
- EMU Flash Consumer Confidence only due later in the euro docket.
The single currency alternates gains with losses vs. the greenback and motivates EUR/USD to hover around the 1.0800 neighbourhood at the beginning of the week.
EUR/USD looks at US debt ceiling, risk trends
EUR/USD fades the initial uptick to the 1.0830 region against the backdrop of the generalized lack of direction in the global markets at the beginning of the week.
Moving forward, all the attention is expected to be on the US debt ceiling negotiations this week, where consensus among investors continues to point to an agreement in the 11th hour (as usual).
The European currency, in the meantime, remains under scrutiny on the back of now shrinking hawkishness from some members of the ECB Board ahead of the next event in June, where a 25 bps rate hike appears well anticipated.
In the docket, the European Commission (EC) will publish its Consumer Confidence gauge for the month of May, while speeches by Fed’s Williams, Bullard and Bostic are only due across the pond.
What to look for around EUR
EUR/USD struggles to reclaim further ground and trades in a vacillating fashion around the key 1.0800 zone.
The movement of the euro's value is expected to closely mirror the behaviour of the US Dollar and will likely be impacted by any differences in approach between the Fed and the ECB with regards to their plans for adjusting interest rates.
Moving forward, hawkish ECB-speak continue to favour further rate hikes, although this view appears in contrast to some loss of momentum in economic fundamentals in the region.
Key events in the euro area this week: EC Flash Consumer Confidence (Monday) – Germany, EMU Advanced Manufacturing/Services PMI (Tuesday) – Germany IFO Business Climate (Wednesday) – Germany Final Q1 GDP Growth Rate, GfK Consumer Confidence (Thursday) – Italy, France Consumer Confidence (Friday).
Eminent issues on the back boiler: Continuation of the ECB hiking cycle in June and July (and September?). Impact of the Russia-Ukraine war on the growth prospects and inflation outlook in the region. Risks of inflation becoming entrenched.
EUR/USD levels to watch
So far, the pair is losing 0.04% at 1.0800 and faces immediate contention at 1.0759 (monthly low May 19) seconded by 1.0712 (low March 24) and finally 1.0516 (low March 15). On the upside, a break above 1.0868 (55-day SMA) would target 1.1000 (round level) en route to 1.1095 (2023 high April 26).
Chinese Yuan is increasingly tracking The Dollar. Thus, economists at TD Securities expect USD/CNY to remain elevated in the near term before falling toward 6.55 by year-end.
CNY will largely track the USD in the short term
“While markets may now be a little warier of pushing the CNY lower, we think the CNY will largely track the USD in the short term, with the next resistance at 7.0865 (76.4% Fib).”
“Further out, our view of USD weakness in the months ahead will keep USD/CNY on track to hit our forecast of 6.55 by the end of 2023.”
Here is what you need to know on Monday, May 22:
The US Dollar (USD) stays on the back foot to start the new week as market participants stay focused on headlines surrounding the debt limit negotiations in the US. In the European session, Germany's Bundesbank will release its monthly report and Eurostat will publish the preliminary Consumer Confidence Index data for May. There won't be any high-impact macroeconomic data releases featured in the US economic docket but several Fed officials will be delivering speeches.
While speaking on Friday, FOMC Chairman Jerome Powell reiterated that they are strongly committed to return inflation to the 2% target. Regarding the potential impact of the recent banking crisis on the policy, Powell said that rates may not need to rise as much as it would have otherwise. Although the US Dollar Index, which tracks the USD's performance against a basket of six major currencies, registered losses on Friday, it ended up closing the second straight week in positive territory.
Following his phone call with House Republican Speaker Kevin McCarthy on Sunday, US President Joe Biden said that the conversation went well and added that they will speak again on Monday. Meanwhile, US Treasury Secretary Janet Yellen said over the weekend that June 1 is the "hard deadline" to raise the debt ceiling.
EUR/USD touched its lowest level since late March at 1.0760 on Friday but managed to stage a technical correction ahead of the weekend. The pair trades in a narrow channel slightly above 1.0800 early Monday.
Despite the broad-based US Dollar strength, GBP/USD held its ground and closed virtually unchanged last week. Nevertheless, the pair is having a difficult time gaining traction at the beginning of the week and moving sideways below 1.2450.
USD/JPY gained more than 200 pips last week and registered its highest weekly close since November. The pair stays quiet in the European morning and fluctuates below 138.00.
Gold price stayed under heavy bearish pressure amid rising US Treasury bond yields last week and came within a touching distance of $1,950. Although XAU/USD recovered decisively on Friday, it is struggling to build on those gains early Monday while trading slightly below $1,980.
AUD/USD trades in the red below 0.6650 early Monday. In the Asian session on Tuesday, S&P Global will release Manufacturing and Services PMI reports for Australia.
Bitcoin posted marginal losses on Sunday but stayed in its weekly range. Early Monday, BTC/USD trades flat on the day slightly below $27,000. Ethereum continues to fluctuate in a tight channel at around $1,800 following the previous week's indecisive action.
Extra gains to the 7.0960 region in USD/CNH could be running out of steam according to UOB Group’s Markets Strategist Quek Ser Leang and Senior FX Strategist Peter Chia.
Key Quotes
24-hour view: “Last Friday, we expected USD to continue to rally but we were of the view that ‘the next major resistance at 7.0960 is likely out of reach’. While our view was not wrong, we did not quite expect how the price actions developed as USD soared to 7.0750 and then pulled back sharply and quickly from the high (low has been 7.0125). The rapid pullback from the high has room to extend but any weakness is likely part of a lower range of 7.0080/7.0400. In other words, a sustained drop below 7.0080 is unlikely.”
Next 1-3 weeks: “We have expected USD to strengthen for more than a week now. Our view turned out to be correct as USD surged last week. In our most recent narrative from last Friday (19 May, spot at 7.0500), we indicated that ‘while we continue to expect USD to strengthen, it remains to be seen if it can break above the next major resistance at 7.0960’. USD rose briefly to 7.0750 in Asian trade last Friday and then pulled back sharply. Short-term upward momentum is beginning to fade and the chance of USD rising to 7.0960 this time around has diminished. However, only a break of 7.0000 (no change in ‘strong support’ level) would indicate the USD strength has eased.”
- Silver edges lower on Monday and reverses a part of Friday’s recovery from the 100-day SMA.
- The technical setup still favours bears and supports prospects for a further depreciating move.
- A sustained strength beyond the $25.00 mark is needed to negate the near-term negative bias.
Silver struggles to capitalize on Friday's goodish rebound from the 100-day Simple Moving Average (SMA) and meets with a fresh supply on the first day of a new week. The white metal remains on the defensive through the early European session and is currently trading around the $23.75 region, representing the 38.2% Fibonacci retracement level of the March-May rally.
From a technical perspective, the recent breakdown through the $24.60-$24.50 horizontal support, coinciding with the 23.6% Fibo. level, favours bearish traders. Moreover, oscillators on the daily chart are holding deep in the negative territory and are still far from being in the oversold zone. This, along with Friday's failure near the $24.00 mark, suggests that the path of least resistance for the XAG/USD is to the downside.
That said, it will be prudent to wait for acceptance below the 100-day SMA, currently pegged near the $23.35-$23.30 area, also marking the lowest level since late March touched last Thursday, before placing fresh bearish bets. The XAG/USD might then accelerate the fall towards 50% Fibo. level, around the $23.00 mark before eventually dropping to the $22.65-$22.60 support en route to the $22.30-$22.25 region, or the 61.8% Fibo. level.
On the flip side, momentum back above the $24.00 round figure might attract fresh sellers near the $24.25 supply zone. Any subsequent strength is more likely to remain capped near the $25.00 psychological mark. This is followed by the $25.30-$25.40 hurdle, which if cleared decisively should allow bulls to make a fresh attempt to conquer the $26.00 mark and challenge the YTD peak, around the $26.10-$26.15 area touched earlier this month.
Silver daily chart
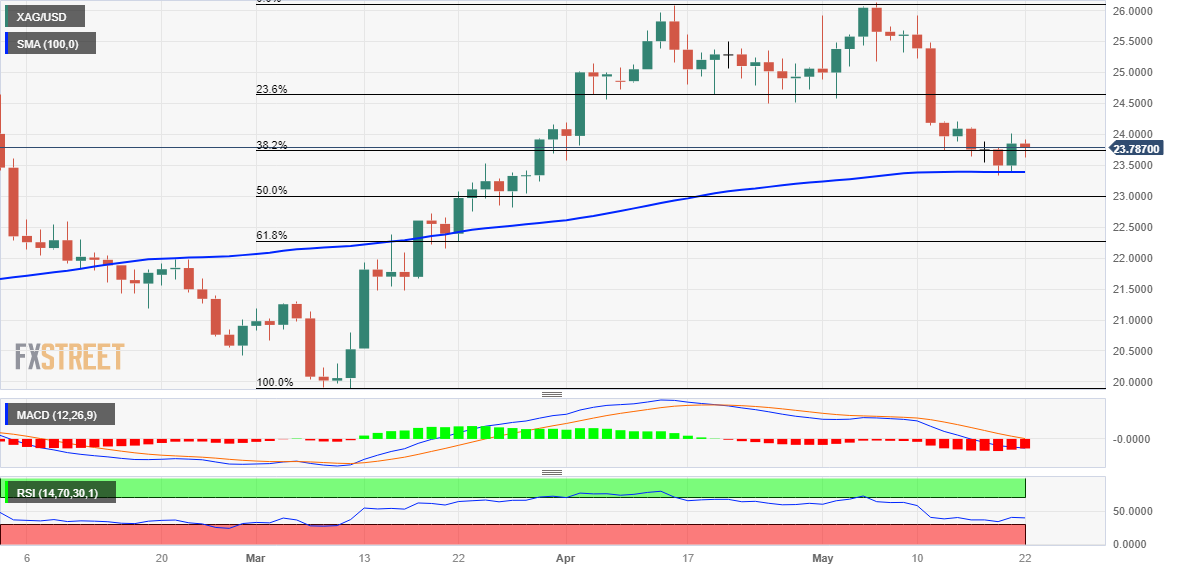
Key levels to watch
- The index extends the corrective decline and puts 103.00 to the test.
- Negotiations over the debt ceiling will take centre stage later in the week.
- The FOMC Minutes, PCE will be in the limelight this week.
The greenback, in terms of the USD Index (DXY), starts the new trading week slightly on the defensive and near the 103.00 neighbourhood.
USD Index focuses on dent ceiling, FOMC
The greenback so far trades with small losses following the opening bell in the old continent on Monday, extending at the same time the corrective move after hitting fresh multi-week highs near 103.60 in the second half of last week.
In the meantime, investors are expected to closely follow another round of negotiations (the last one?) to reach an agreement over the US debt ceiling issue, while speculation of a potential rate hike at the next Fed gathering on June 14 continues to pick up pace.
There are no scheduled data releases in the US docket on Monday, while St. Louis Fed J. Bullard (2025 voter, hawk), Richmond Fed T. Barkin (2024 voter, centrist) and Atlanta Fed R. Bostic (2024 voter, hawk) are all due to speak in a week where the FOMC Minutes (Wednesday) and the PCE (Friday) will be in the limelight.
What to look for around USD
The index now comes under some downside pressure and revisits the key 103.00 region on Monday.
In fact, DXY gives away part of the recent uptick to fresh 2-month highs in the 103.60/65 band amidst diminishing signals that the Fed will probably pause its normalization process in the near future, all in response to the steady resilience of key US fundamentals (employment and prices mainly).
Favouring a pause by the Fed, instead, appears the extra tightening of credit conditions in response to uncertainty surrounding the US banking sector.
Key events in the US this week: Flash Manufacturing/Services PMI, New Home Sales (Tuesday) – MBA Mortgage Applications, FOMC Minutes (Wednesday) – Initial Jobless Claims, Chicago Fed National Activity Index, Pending Home Sales, Advanced Q1 GDP Growth Rate (Thursday) – PCE/Core PCE, Durable Goods Orders, Flash Goods Trade Balance, Personal Income/Spending, Final Michigan Consumer Sentiment (Friday).
Eminent issues on the back boiler: Persistent debate over a soft/hard landing of the US economy. Terminal Interest rate near the peak vs. speculation of rate cuts in late 2023/early 2024. Fed’s pivot. Geopolitical effervescence vs. Russia and China. US-China trade conflict.
USD Index relevant levels
Now, the index is down 0.03% at 103.16 and faces the next support at the 55-day SMA at 102.53 seconded by 101.01 (weekly low April 26) and finally 100.78 (2023 low April 14). On the other hand, the break above 103.62 (monthly high May 18) could open the door to 105.76 (200-day SMA) and then 105.88 (2023 high March 8).
This morning we saw a particularly large jump in the TRY exchange rates. Ulrich Leuchtmann, Head of FX and Commodity Research at Commerzbank, expects Lira to take a depreciation hit.
Central bank will certainly try its best to prevent a TRY crash
“As I write these lines, USD/TRY is still trading in the 20.00 range – well below the extreme swings, but just well above the levels before today's TRY weakness bout. Even if USD/TRY has returned to normal by the time you read these lines, this episode does make it clear that the artificial Lira stabilization is reaching its limits.”
“Until the 2nd round of the presidential election, the central bank will certainly try its best to prevent a TRY crash. However, it cannot work magic. Even before the second round of voting, a scenario is possible in which the dams burst and the Lira takes a depreciation hit.”
- USD/CHF prods 12-day-old ascending support line, extends the previous day’s pullback from 1.5-month high.
- Swiss Q1 Industrial Production growth eased to 3.4% YoY versus 6.1% prior.
- US Dollar traces sluggish markets amid mixed concerns about debt ceiling, Fed.
- US PMIs, Fed Minutes to decorate calendar but US default updates will be crucial for immediate directions.
USD/CHF retreats to 0.8975 as bears jostle with a short-term support line amid the early hours of Monday’s European session. In doing so, the Swiss Franc (CHF) pair fails to justify downbeat first quarter (Q1) Industrial Production growth from Switzerland amid the US Dollar’s failure to cheer the recent positive headlines taming US default fears and hawkish Federal Reserve (Fed) bets.
That said, the Swiss Q1 Industrial Production marked the slowest growth since the fourth quarter (Q4) of 2021 with 3.4% YoY figures compared to 6.1% previous readings. With this, the data defend the Swiss National Bank’s (SNB) hesitance in increasing the benchmark rates after heavily fueling the borrowing costs.
On the other hand, the US Dollar Index (DXY) picks up bids to pare intraday losses around 103.10 but remains down for the second consecutive day amid looming uncertainty surrounding the US debt ceiling expiry. Also challenging the US Dollar’s rebound could be the recently mixed concerns about the Sino-American ties and the Fed’s next moves, despite the latest round of mostly upbeat US data.
US President Joe Biden said at the end of the Group of Seven (G7) summit in Japan on Sunday, that he expected ties with China to improve “very shortly” after a spat over an alleged spy balloon earlier this year derailed relations, per Bloomberg. On the contrary, China’s banning of Micron Technology products, per the Wall Street Journal (WSJ), flags fears of the US-China tussles. US President Biden also conveyed optimism about his discussion with Republican House Speaker Kevin McCarthy went well while also adding that they will again talk on Monday.
On the flip side, Fed Chair Jerome Powell highlighted inflation fears on Friday but also stated that the recent banking crisis, which led to tighter credit standards, has eased the pressure to hike interest rates. During the weekend, Minneapolis Federal Reserve Bank President Neel Kashkari pushed back the talks of the Fed’s policy pivot despite suggesting readiness to vote for holding the rates unchanged. Even so, the market’s bets of a 0.25% Fed rate hike in June increased and the calls for a rate cut in 2023 have gone down due to the last week’s upbeat US economics and hawkish comments from the Fed (Fed) officials.
While portraying the mood, S&P500 Futures reverse the initial downside while making rounds to 4,205, indecisive around the yearly high, whereas the US Treasury bond yields struggle for clear directions but stay pressured of late.
Looking ahead, a softer start to the key week is expected for the USD/CHF amid mixed clues and a light calendar. However, May month PMIs, US debt ceiling talks and Fed Minutes are crucial for a clear guide. Additionally important is the Fed’s preferred inflation gauge, namely Core PCE Price Index.
Technical analysis
The receding bullish bias of the MACD signals and failure to cross the USD/CHF pair’s March-May downside, close to 0.9055 by the press time, keeps the sellers hopeful. However, a convergence of the two-week-old ascending trend line and the 21-day Exponential Moving Average (EMA), close to 0.8965 at the latest, appears a tough nut to crack for the bears to take control.
Further upside could still push USD/JPY to the 139.00 level and beyond, comment UOB Group’s Markets Strategist Quek Ser Leang and Senior FX Strategist Peter Chia.
Key Quotes
24-hour view: “We noted last Friday ‘upward momentum appears to be slowing and USD is unlikely to advance much further’ and we expected USD to ‘trade between 137.80 and 138.80’. We did not expect the increase in volatility as USD dropped to 137.96 in London trade, rebounded to 138.65 in NY before plummeting to a low of 137.41. Today, further choppy price actions are not ruled out, likely in a range of 137.25/138.40.”
Next 1-3 weeks: “Our update from last Friday (19 May, spot at 138.40) still stands. As highlighted, while we continue to expect USD to strengthen further, overbought short-term conditions could lead to a couple of days of consolidation before USD resumes its rally (albeit likely at a slower pace). Looking ahead, the next resistance above 139.00 is at 139.60. The USD strength is intact as long as it stays above 136.80 (no change in ‘strong support’ level from last Friday).”
Against the backdrop of more stubborn inflation, economists at Commerzbank have adjusted their forecast for the Franc slightly and now see it below parity against the EUR for a little longer.
Strong CHF is preferred
“Core inflation remains stubbornly above the SNB's inflation target. The SNB is therefore likely to raise its key rate again in June and prefer a strong Franc for the time being.”
“We have adjusted our forecast slightly, but continue to expect a moderately weaker Franc in the medium term. We, therefore, expect EUR/CHF to rise slowly towards 1.05 in the coming quarters.”

Source: Commerzbank Research
- Natural Gas Price remains pressured after reversing from 11-week high.
- Bearish MACD signals, RSI’s retreat from overbought territory adds strength to downside bias about XNG/USD.
- Weekly support line, 200-SMA holds the key to further downside of the Natural Gas Price.
Natural Gas Price (XNG/USD) remains on the back foot around $2.68 as bears attack a short-term key support line, previous resistance, heading into Monday’s European session.
In doing so, the XNG/USD also justifies the bearish MACD signals and the RSI (14) line’s retreat from the overbought region.
As a result, the energy instrument is likely to break the immediate support line of around $2.66.
However, a one-month-old horizontal support zone, surrounding $2.57-58, appears a tough nut to crack for the Natural Gas bears to retake control.
Even so, the 200-SMA level of near $2.37 may act as the last defense of the XNG/USD buyers, a break of which could direct the commodity towards the monthly low of around $2.14.
On the flip side, the Natural Gas price recovery needs validation from the $2.80 ahead of challenging the March month swing high of near $3.08.
In a case where the XNG/USD remains firmer past $3.08, the yearly high of around $4.17 and then the $5.0 psychological magnet will be in the spotlight.
Overall, Natural Gas price is likely to witness a pullback but the trend remains bullish unless the quote drops below $2.57.
Natural Gas Price: Four-hour chart
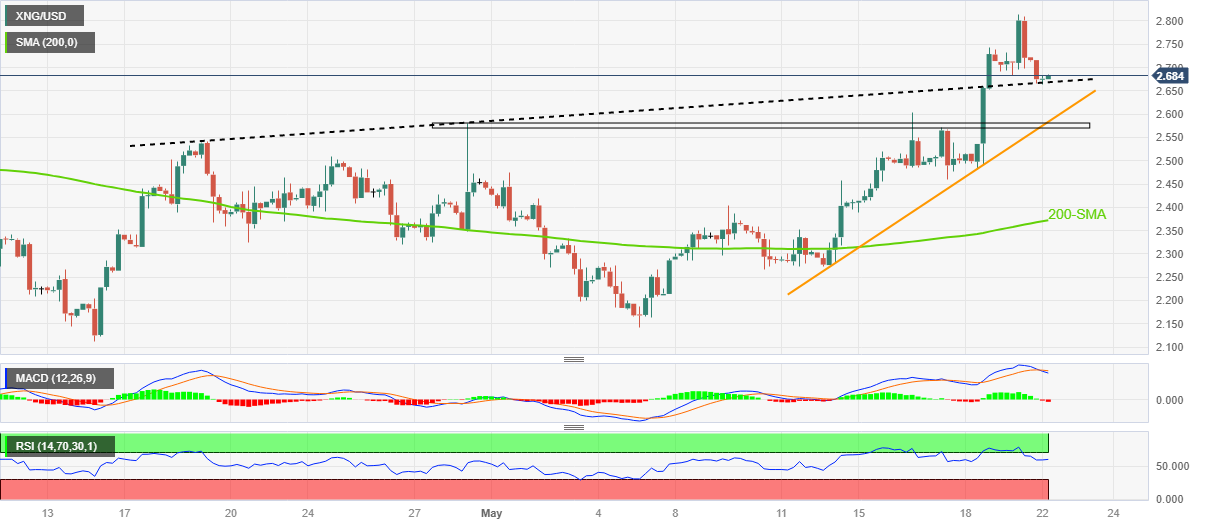
Trend: Limited downside expected
In light of advanced prints from CME Group for natural gas futures markets, open interest reversed two consecutive daily builds and shrank by around 29.2K contracts on Friday. Volume followed suit and resumed the decline, now by nearly 80K contracts.
Natural Gas faces initial resistance near $2.70
Prices of natural gas lost traction following a move to multi-week highs on Friday. The corrective drop was amidst shrinking open interest and volume, removing strength from a potential deeper pullback in the very near term. So far, there is a decent hurdle around the $2.70 mark per MMBtu.
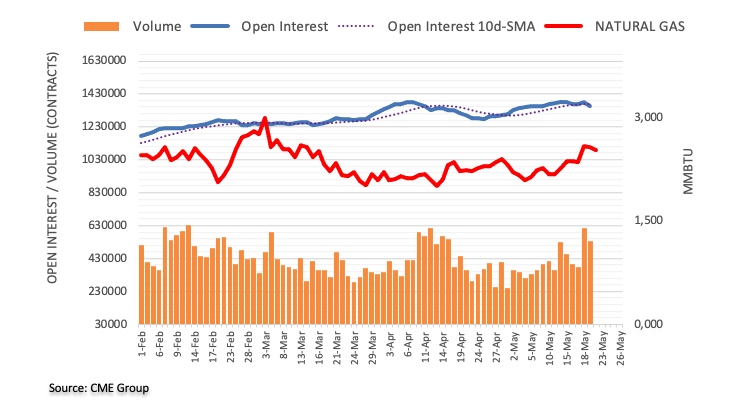
- USD/JPY has scaled sharply to near 138.00 as the USD Index has defended its downside near 103.00.
- The Fed is expected to pause its aggressive policy-tightening spell as US banks’ tight credit conditions have squeezed liquidity disbursement.
- The Japanese economy is showing resilience as Q1 GDP and inflation have expanded significantly.
The USD/JPY pair has extended its sharp recovery from 137.60 in the early European session. The major has regained strength as the US Dollar Index (DXY) has managed to defend its downside after printing a fresh day’s low at 103.00.
Market mood has turned quite positive as the S&P500 futures have recovered their entire losses generated in Asia. Investors are getting confident over US debt-ceiling raise as face-to-face negotiations between US President Joe Biden and House of Representatives Kevin McCarthy will provide might clear things at best.
Another catalyst that is supporting the cheerful market mood is the expectations of better relations between China and the United States. US President Joe Biden said at the end of the Group of Seven summit in Japan on Sunday, he expected ties with China to improve “very shortly” after a spat over an alleged spy balloon earlier this year derailed relations, per Bloomberg.
The USD Index has rebounded to near 103.20 and is looking to stretch its upside further despite the Federal Reserve (Fed) is expected to pause its aggressive policy-tightening spell as US banks’ tight credit conditions have squeezed liquidity disbursement in the economy.
On the Tokyo front, the Japanese economy is showing resilience as Q1 Gross Domestic Product (GDP) has expanded significantly by 0.7%. Also, inflationary pressures have rebounded due to wage growth and demand recovery. In spite of all this, a dovish interest rate stance by the Bank of Japan (BoJ) cannot be ruled out.
In the view of UOB Group’s Markets Strategist Quek Ser Leang and Senior FX Strategist Peter Chia, further retracement in AUD/USD appears on the table while below 0.6630.
Key Quotes
24-hour view: “We indicated last Friday that ‘downward pressure has eased somewhat but AUD could drop towards the 0.6600 level again before a more sustained recovery is likely’. However, after dropping to 0.6618, AUD rebounded to a high of 0.6675 and then closed at 0.6651 (+0.45%). Downward pressure has eased and AUD has likely entered a consolidation phase. Today, AUD is likely to trade sideways between 0.6630 and 0.6680.”
Next 1-3 weeks: “In our latest narrative from last Friday (19 May, spot at 0.6630), we noted that ‘downward momentum has not improved much’ but we see a chance for AUD to drop to 0.6575. AUD dropped to 0.6618, rebounded and then closed at 0.6651 (+0.45%). Short-term downward momentum is beginning to ease and AUD has to break and stay below 0.6630 in the next 1-2 days or the chance of it declining further to 0.6575 will fizzle out. Conversely, a clear breach of 0.6685 (no change in ‘strong resistance’ level from last Friday) would indicate that AUD is not weakening further.”
According to the latest survey released by the National Association for Business Economics (NABE), economists have deferred their expectations of a US Federal Reserve (Fed) rate cut to the first quarter of next year while raising their inflation forecasts and outlook on the US labor markets.
Additional takeaways
“The poll's median view sees modest levels of growth prevailing through 2024, with an expected 0.4% rise between the fourth quarter of 2022 to the final three months of 2023.”
“Respondents upsized their estimate of inflation in 2023, seeing the consumer price index up by 3.3% from the last quarter of 2022 to the final quarter of 2023.”
“Respondents are now saying they expect an average 142,000 jobs to be gained per month, up from 102,000 in the February survey. The jobless rate, currently at 3.4%, is projected to average 3.7% this year, down from 3.9% in the February poll.”
Related reads
- Nibbling away at Fed rate cut expectations
- USD keep the strength through this week ahead
CME Group’s flash data for crude oil futures markets noted traders reduced their open interest positions by around 14.8K contracts at the end of last week. On the other hand, volume kept the choppiness well and sound and this time added more than 83K contracts.
WTI: Next on the downside emerges $70.00
Prices of WTI charted an inconclusive session on Friday amidst shrinking open interest and increasing volume, exposing some near-term consolidation, while bouts of weakness should not be ruled out either. So far, the $70.00 mark per barrel should hold the initial downside test for the time being.
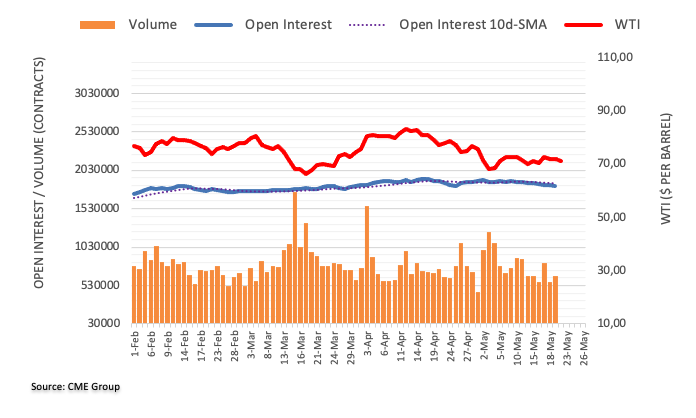
- EUR/USD retreats from intraday high as US Dollar pares recent losses.
- ECB’s Lagarde tries to defend hawkish bias but says to have covered large chunk of journey toward taming inflation.
- Fed Chair Jerome Powell cites banking crisis to ease pressure on the bank to raise rates, Fed’s Kashkari sounds defensive.
- US President Joe Biden’s comments on Sino-American ties, US debt ceiling favor recent sentiment and US Dollar.
EUR/USD extends pullback from intraday high as it drops to 1.0810 heading into Monday’s European session. That said, the Euro pair’s latest rebound could be linked to the cautious optimism surrounding the US-China ties, as well as hopes of witnessing no US default. Further, mixed comments from the European Central Bank (ECB) President Christine Lagarde also weigh on the major currency pair.
That said, US President Joe Biden said at the end of the Group of Seven (G7) summit in Japan on Sunday, that he expected ties with China to improve “very shortly” after a spat over an alleged spy balloon earlier this year derailed relations, per Bloomberg. On the contrary, China’s banning of Micron Technology products, per the Wall Street Journal (WSJ), flags fears of the US-China tussles.
On a different page, US President Biden also conveyed optimism about his discussion with Republican House Speaker Kevin McCarthy went well while also adding that they will again talk on Monday.
Earlier in the day, ECB President Christine Lagarde crossed wires via an interview on the Buitenhof TV show aired Sunday wherein she said, “I think we covered a large chunk of the journey toward taming inflation and bringing it back to our target.”
On the contrary, Federal Reserve Chairman Jerome Powell highlighted inflation fears on Friday but also stated that the recent banking crisis, which led to tighter credit standards, has eased the pressure to hike interest rates. Even so, the market’s bets of a 0.25% Fed rate hike in June increased and the calls for a rate cut in 2023 have gone down due to the last week’s upbeat US economics and hawkish comments from the Fed (Fed) officials.
Against this backdrop, the US Dollar Index (DXY) picks up bids to pare intraday losses around 103.15 while S&P500 Futures also reverse the initial downside while making rounds to 4,205, indecisive around the yearly high. Further, the US Treasury bond yields struggle for clear directions but stay pressured of late.
Moving on, Eurozone Consumer Confidence may direct intraday moves of the EUR/USD pair but major attention will be given to the first readings of the May month PMIs, as well as US debt ceiling talks for a clear guide.
Technical analysis
EUR/USD struggles to defend the upside break of the 100-DMA, around 1.0800 at the latest, within a fortnight-long descending trend channel, currently between 1.0860 and 1.0715. That said, the RSI (14) line’s rebound from nearly oversold conditions allows buyers to remain hopeful even as bearish MACD signals and the falling channel prods Euro bulls.
- GBP/JPY is demonstrating topsy-turvy moves above 171.40.
- Inflationary pressures in the UK economy are not in the mood to ditch the double-digit territory.
- BoJ Ueda believes that Japan's inflation is likely to slow back below 2% in the middle of the current fiscal year.
The GBP/JPY pair is displaying a topsy-turvy move in a narrow range above 171.40 in the early European session. The cross is expected to remain extremely volatile as the street is mixed over further interest rate hikes by the Bank of England (BoE).
Inflationary pressures in the United Kingdom economy are not in the mood to ditch the double-digit territory despite BoE Governor Andrew Bailey is consistently raising interest rates which have pushed them to 4.50%.
Meanwhile, the Bank of Japan (BoJ) is expected to keep the interest rate policy ultra-dovish. BoJ Governor Kazuo Ueda believes that Japan's inflation is likely to slow back below 2% in the middle of the current fiscal year.
GBP/JPY has faced immense pressure while attempting to cross the crucial resistance plotted from May 02 high at 172.33 on a two-hour scale. The cross is forming a volatility contraction pattern, which is expected to explode sooner and a sheer move will be witnessed.
The asset is hovering near the 20-period Exponential Moving Average (EMA) at 171.67, indicating a sideways performance.
Meanwhile, the Relative Strength Index (RSI) (14) has shifted into the 40.00-60.00 range from the bullish range of 60.00-80.00, which signals a loss in the upside momentum.
A breakdown below May 18 low at 171.25 will drag the asset toward May 09 low at 169.85. A slippage below the latter will further drag the asset toward May 03 low at around 169.14.
On the flip side, a confident move above the previous week's high at 172.33 will support the cross to print at a fresh seven-year high of 173.00 followed by 25 January 2016 high at 174.18.
GBP/JPY two-hour chart
-638203311654599855.png)
A breakout of 1.2500 should mitigate the downside pressure in GBP/USD, suggest UOB Group’s Markets Strategist Quek Ser Leang and Senior FX Strategist Peter Chia.
Key Quotes
24-hour view: “We indicated last Friday that ‘as long as GBP stays below 1.2460, it could break below 1.2390’. However, GBP did not break 1.2390 as it rebounded strongly from a low of 1.2393. While downward momentum is waning, it is too early to expect a sustained recovery. Today, GBP is more likely to trade sideways, expected to be in a range of 1.2420/1.2500.”
Next 1-3 weeks: “We have held a negative GBP view for more than a week now. In our latest narrative from last Friday (19 May, spot at 1.2415), we indicated that GBP ‘is likely to weaken further to 1.2350, as low as 1.2300’. We did not quite expect the rebound to a high of 1.2484. While the rebound has slowed the downward momentum, we continue to hold the same view for now. In order to revive the flagging momentum, GBP has to break and stay below 1.2390 these 1-2 days. Otherwise, a clear break above 1.2500 (no change in ‘strong resistance’ level) would indicate that GBP is not weakening further.”
FX option expiries for May 22 NY cut at 10:00 Eastern Time, via DTCC, can be found below.
- EUR/USD: EUR amounts
- 1.0705-10 1.5b
- 1.0720 747m
- 1.0825-30 2.8b
- 1.0840-50 1.1b
- USD/JPY: USD amounts
- 136.00 1.3b
- 137.50 881m
- 138.00 600m
- NZD/USD: NZD amounts
- 0.6165 300m
Open interest in gold futures markets extended the downtrend on Friday, this time by more than 1K contracts according to preliminary readings from CME Group. Volume, instead, increased for the second session in a row, now by 3.5K contracts.
Gold looks well supported near $1950
Friday’s decent gains in prices of gold was amidst the continuation of the downtrend in open interest, which is indicative that a sustained rebound seems out of favour for the time being. In the meantime, the $1950 region per ounce troy emerges as a solid support for the yellow metal.
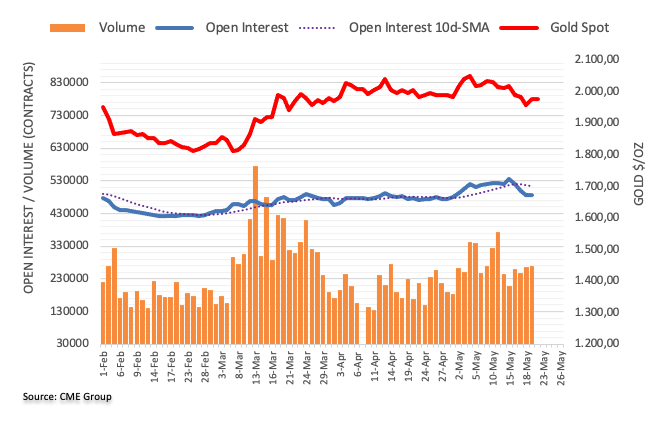
Former Bank of Japan (BoJ) Chief Economist, Toshitaka Sekine, said in an MNI interview on Monday, the central bank “is likely to raise its target for the 10-year bond yield as early as its June 15-16 meeting, given that it can point to a rise in trend inflation rate above 1% from 0%.”
Additional takeaways
"It will be very complicated to explain, but it will be sufficient for the BoJ to point out that the trend inflation rate rose above 1%, which will justify the rise of the long-term target, even though it stayed at about 0% for a prolonged period.”
"It is unreasonable for the BoJ to keep the long-term policy target at about 0% on the basis that the natural rate of interest in real terms is near 0%, but the trend inflation rate is not 0%."
"Suppose that the real natural rate of interest has remained near 0% and trend inflation has risen to 1%, then the natural rate of interest in nominal terms is around 1%. This means that the target of the YCC needs to be adjusted to 1%. If the BoJ is not confident about the level of the nominal natural interest rate, it needs to widen the range of the target to incorporate uncertainty."
The inflation forecasts in the Outlook Report "very amazing.”
"As a result, the BoJ didn't change the policy framework, judging from the second perspective, amid the heightened uncertainties.”
Market reaction
USD/JPY was last seen trading at 137.76, down 0.16% on the day. All eyes remain on the US debt ceiling talks.
- USD/TRY has refreshed its all-time high above 19.80 as the focus has shifted to US Biden-McCarthy talks.
- House of Representative McCarthy wants a hefty 8% cut in overall spending proposed by Democrats for the budget.
- Escalating political uncertainty in Turkey is consistently weighing on the Turkish Lira.
The USD/TRY pair has printed a fresh all-time-high above 19.80 in the Asian session. The asset has witnessed buying interest as the US Dollar Index (DXY) is making efforts for defending further downside near 103.00.
The USD Index has found some support as US President Joe Biden is scheduled to meet House of Representatives Kevin McCarthy for further negotiations on the US debt-ceiling on Monday. However, investors are still worried that approval for an increase in the US borrowing cap won’t be a cakewalk.
House of Representative McCarthy wants a hefty 8% cut in overall spending proposed by Democrats for the budget. While Democrats are ready to cut spending for education and labor enforcement programs by an average of 22%. Therefore, a bipartisan deal is less likely and US President Joe Biden could consider an exercise of his 14th Amendment right in which obligated borrowing will get paid without approval from Republicans.
S&P500 futures have squared-off entire losses posted in Asia, portraying a recovery in the risk appetite of the market participants. The overall market mood is turning bullish as the Federal Reserve (Fed) is set to pause its policy-tightening spell in June. This has trimmed fears of a recession in the United States economy, however, a failure in the US debt-ceiling raise would result in a spike in interest rates.
On the Turkish Lira front, concerns over the possibility that President Erdogan could win another mandate are soaring due to his economic policies, which the general public calls as unorthodox. Escalating political uncertainty in Turkey is consistently weighing on the Turkish Lira.
UOB Group’s Markets Strategist Quek Ser Leang and Senior FX Strategist Peter Chia noted that the likelihood of a move to 1.0750 in EUR/USD appears to be losing momentum.
Key Quotes
24-hour view: “We indicated last Friday that EUR ‘could break below 1.0750 but is unlikely to be able to reach the next major support at 1.0700’. We added, ‘a break of 1.0820 would indicate the weakness in EUR has stabilized’. EUR dipped to a low of 1.0758 in Asian trade and then rebounded to a high of 1.0828 in NY trade. The current price movements are likely part of a consolidation phase. Today, we expect EUR to trade sideways between 1.0785 and 1.0845.”
Next 1-3 weeks: “Last Friday (19 May, spot at 1.0775), we indicated that EUR ‘is still weak and is likely to break below 1.0750’. EUR eked out a fresh two of 1.0758 in Asian trade and then rebounded to end the day at 1.0802 (+0.31%). While we continue to hold the view that EUR could break below 1.0750, after the rebound last Friday, the likelihood of a clear break of 1.0750 has diminished. That said, only a break above 1.0860 (no change in ‘strong resistance’ level from last Friday) would indicate the EUR weakness that started more than a week ago has stabilized.”
- AUD/USD fades bounce off intraday low, struggle to defend the previous day’s bounce off one-month low.
- US President Joe Biden appears optimistic about Sino-American ties, US debt ceiling talks.
- China bans Micron Technology, US Republicans seem to stick to their demand and prod risk-on mood.
- PBOC inaction, doubts about hawkish RBA challenge Aussie pair buyers amid mixed Fed talks.
AUD/USD prods intraday low surrounding 0.6645 as it reverses the early Asian session strength amid mixed macros and a cautious mood ahead of this week’s key data/events. It’s worth noting, however, that the Aussie pair bounced off the lowest levels in a one-month the previous day but has been struggling to defend the bulls of late.
Despite China’s banning of Micron Technology products, per the Wall Street Journal (WSJ), US President Joe Biden said at the end of the Group of Seven (G7) summit in Japan on Sunday, he expected ties with China to improve “very shortly” after a spat over an alleged spy balloon earlier this year derailed relations, per Bloomberg. The policymaker also conveyed optimism about his discussion with Republican House Speaker Kevin McCarthy went well while also adding that they will again talk on Monday.
On a different page, the People’s Bank of China (PBOC) holds its benchmark monetary policy rates, namely the Loan Prime Rates (LPR), unchanged during Monday's announcement. That said, the latest PBOC LPRs for one year and five-year are 3.65% and 4.30%. It should be noted that China Securities Journal (CSJ) earlier raised hopes of China’s economic recovery and favored the AUD/USD bulls to defend the previous day’s rebound before the latest retreat.
Previously, the market’s bets of a 0.25% Fed rate hike in June increased and the calls for a rate cut in 2023 have gone down due to the last week’s upbeat US economics and hawkish comments from the Fed (Fed) officials. It’s worth noting, however, that Federal Reserve Chairman Jerome Powell highlighted inflation fears on Friday but also stated that the recent banking crisis, which led to tighter credit standards, has eased the pressure to hike interest rates.
Against this backdrop, S&P 500 Futures appear indecisive while stocks in the Asia-Pacific zone grind lower amid the market's cautious mood ahead of today’s key US debt ceiling talks and the week’s Aussie-US PMIs, as well as Fed Minutes.
Technical analysis
AUD/USD retreats from the upper line of a one-week-old descending trend channel. close to 0.6670 by the press time. Even so, a convergence of the 100-SMA and 200-SMA, around 0.6685-90, appears a tough nut to crack for the AUD/USD bulls to crack before taking control.
- Gold price struggles to defend Friday’s corrective bounce off seven-week low.
- Haywire US debt ceiling talks flag default fears and weigh on US Dollar, putting a floor under XAU/USD.
- Federal Reserve communications have also been unimpressive and poke Gold bulls.
- US PMIs, Fed’s favorite inflation gauge and debt ceiling negotiations are crucial for XAU/USD directions.
Gold Price (XAU/USD) licks its wounds after a two-week downtrend as markets brace for the top-tier data/events. The precious metal’s latest corrective bounce could be linked to mixed concerns about US debt ceiling expiration as US President Joe Biden appears hopeful of avoiding the default but Republicans appear less in the mood to let go of demands, which in turn stalled previous negotiations. Additionally, the latest shift in Fed Chair Jerome Powell’s tone, citing the banking fears as the catalysts to ease the pressure for higher rates, also allows the XAU/USD to grind higher. Furthermore, upbeat expectations from China add strength to the Gold buyers as they battle the bears.
Alternatively, the recently firmer US data and hawkish Fed bets exert downside pressure on the Gold price, which in turn highlight this week’s US PMIs and Core PCE Price Index, the Fed’s preferred inflation gauge, as the key to determining near-term XAU/USD moves.
Above all, the US debt ceiling announcements are crucial to gauge near-term Gold price moves.
Also read: Gold Price Forecast: Acceptance above $1,990 is critical for XAU/USD on road to recovery
Gold Price: Key levels to watch
As per our Technical Confluence Indicator, the Gold price stays below the $1,990 resistance confluence comprising the 50-DMA, Fibonacci 68.1% on one month and upper band of the Bollinger on the hourly timeframe.
Before that, the previous daily high and 5-DMA caps immediate upside moves of the Gold price near $1,984.
That said, the upper band of the Bollinger on the four-hour chart and Fibonacci 68.1% on one week highlights $1,995 as an extra filter towards the north ahead of challenging the $2,000 round figure comprising Pivot Point one-day R2.
On the flip side, a convergence of the Fibonacci 38.2% on one day and the middle band of the Bollinger on the hourly chart, around $1,970, restricts short-term Gold price downside.
Following that, the Fibonacci 23.6% on one week, close to $1,968, may prod the XAU/USD bears before directing them toward the $1,954 key support encompassing the lower band of the Bollinger on the four-hour chart and the previous daily low.
It’s worth noting that the Gold price weakness past $1,954 could give control to the bears.
Here is how it looks on the tool
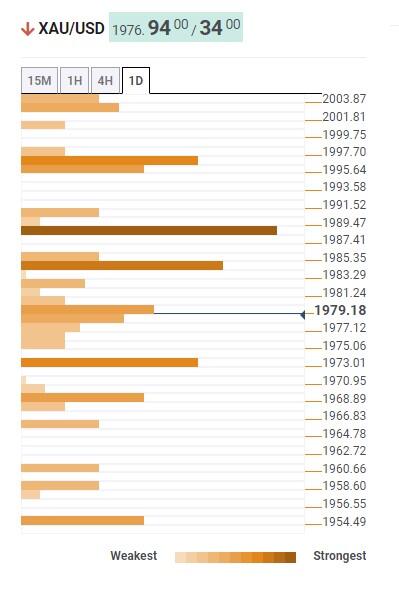
About Technical Confluences Detector
The TCD (Technical Confluences Detector) is a tool to locate and point out those price levels where there is a congestion of indicators, moving averages, Fibonacci levels, Pivot Points, etc. If you are a short-term trader, you will find entry points for counter-trend strategies and hunt a few points at a time. If you are a medium-to-long-term trader, this tool will allow you to know in advance the price levels where a medium-to-long-term trend may stop and rest, where to unwind positions, or where to increase your position size.
- USD/INR has dropped from a two-month high of 82.90 amid a decline in the USD index.
- The headlines of the face-to-face US Biden-McCarthy meeting has improved risk sentiment.
- Fed Kashkari cited that he is interested in supporting Federal Reserve for holding interest rates steady in June.
The USD/INR pair has shown a decent correction from a two-month high of 82.90 in the Asian session. The major has sensed selling pressure as investors have discounted the impact of the overnight decline in the US Dollar Index (DXY).
S&P500 futures have recovered their entire losses posted in the Asian session as investors are confident that the United States economy will not default. US President Joe Biden could exercise his 14th amendment right if a deal with Republicans fails.
Meanwhile, headlines that US President Joe Biden and House of Representatives Kevin McCarthy will be face-to-face on Monday for further negotiations over the raise of the US debt-ceiling deal will keep global financial markets on edge.
The USD Index is facing pressure as the Federal Reserve (Fed) is widely anticipated to keep interest rates steady in its June monetary policy meeting. Minneapolis Fed Bank President Neel Kashkari cited this weekend that he is interested in supporting Federal Reserve for holding interest rates steady in June monetary policy meeting as the central bank needs time in assessing the effects of past rate hikes and the inflation outlook, as reported by Wall Street Journal (WSJ).
On the Indian Rupee front, the Indian government has ordered to withdraw higher denomination currency by September. The currency note of Rs. 2,000 has been banned, however, the general public has misguided it a demonetization. It won’t have a major impact on the Indian economy as expected.
US President Joe Biden said at the end of the Group of Seven summit in Japan on Sunday, he expected ties with China to improve “very shortly” after a spat over an alleged spy balloon earlier this year derailed relations, per Bloomberg.
Biden added, “the US’s move to shoot down a “silly balloon that was carrying two freight cars worth of spying equipment” changed the dynamic after his meeting with President Xi Jinping in November last year.”
In the contrary, the Wall Street Journal (WSJ) reported that China is banning major Chinese firms from buying from Micron Technology, citing its products pose a major national security risk. The Cyberspace Administration of China said its review of Micron products found “significant security risks” that would affect national security.
Market reaction
Amidst mixed US-Sino headlines, AUD/USD is defending minor bids at around 0.6650, having retreated from intraday highs of 0.6688 reached in early Asia. The pair is up 0.08% on the day, at the press time.
- GBP/USD is making efforts for delivering extending upside as the USD Index loses strength.
- Federal Reserve Powell cited that tight credit conditions by the US banks are providing room to hold interest rates steady.
- Bank of England has already conveyed that they underestimated the strength and persistence in inflation.
- GBP/USD delivered a perpendicular fall after a breakdown of the upward-sloping trendline plotted from 1.2275.
GBP/USD is oscillating above 1.2450 after a recovery move and is looking to extend its rally further as the Federal Reserve (Fed) is considering a pause in the policy-tightening spell amid tight credit conditions by the United States regional banks. The US Dollar Index (DXY) is hovering near its day’s low around 103.00 as fears of a default by the US Treasury are escalating.
S&P500 futures have recovered decent losses added in early Asia, however, a cautious approach is still in season. US equities settled negative on Friday after US President Joe Biden denied approving partisan terms offered by House of Representatives Kevin McCarthy against delivering consent for a raise in the US debt-ceiling.
The USD Index is expected to remain on the tenterhooks as any further delay in raising the US borrowing cap limit would push the US economy further toward recession. The demand for US government bonds has rebounded marginally as investors believe that US President Joe Biden has the option of exercising his 14th amendment right in which no approval is required from Republicans for raising the US borrowing cap.
14th Amendment right – an untested law
US President Joe Biden called the bipartisan offer from House of Speaker Joseph McCarthy ‘unacceptable’. Republican leaders demanded a wide wrath of 8% spending cuts against approval of a raise in US borrowing cap. However, US President Joe Biden is ready to do an average cut of 22% in education and some law enforcement programs. Also, US Biden called that Republicans want to prevent them from winning re-election in 2024.
Meanwhile, investors are still less worried that US President Joe Biden could exercise his 14th amendment right, in case Republicans hold their current partisan terms, to save the United States economy from default as it could spike interest rates and bring chaos in financial markets. However, the White House is not sure that they have sufficient time to exercise the un-tested way out.
Federal Reserve to capitalize on US banks’ tight credit conditions
The catalyst that is supporting Asian markets from an intense sell-off is the dovish statement from Federal Reserve (Fed) chair Jerome Powell on interest rate guidance delivered on Friday. Federal Reserve Powell cited that tight credit conditions by the US regional banks are providing room for the central bank to hold interest rates steady for a period of time in order to assess the impact of the current interest rate policy.
Adding to that, Minneapolis Federal Reserve President Neel Kashkari cited this weekend that he is interested in supporting Federal Reserve for holding interest rates steady in June monetary policy meeting as the central bank needs time in assessing the effects of past rate hikes and the inflation outlook, as reported by Wall Street Journal (WSJ).
Bank of England to remain hawkish to tame stubborn UK Inflation
Out of the G7 economies, the United Kingdom economy seems to be the laggard that has failed in bringing down inflation. The UK inflation is still in the double-digit figure led by historic high food inflation and labor shortage due to early retirement. Bank of England Governor Andrew Bailey has already conveyed that they underestimated the strength and persistence of inflation.
Last week, UK Finance Minister Jeremy Hunt promised a decline in tax burden from households, which would fuel retail demand further. This would also undermine the promise by UK Prime Minister Rishi Sunak of halving the inflation pressures by the end of CY2023.
On Thursday, the UK Office for National Statistics (ONS) reported that 18% of UK firms are looking to pass on the impact of higher input prices and costly employment to end-consumers vs. 23% of firms recorded in the last survey.
GBP/USD technical outlook
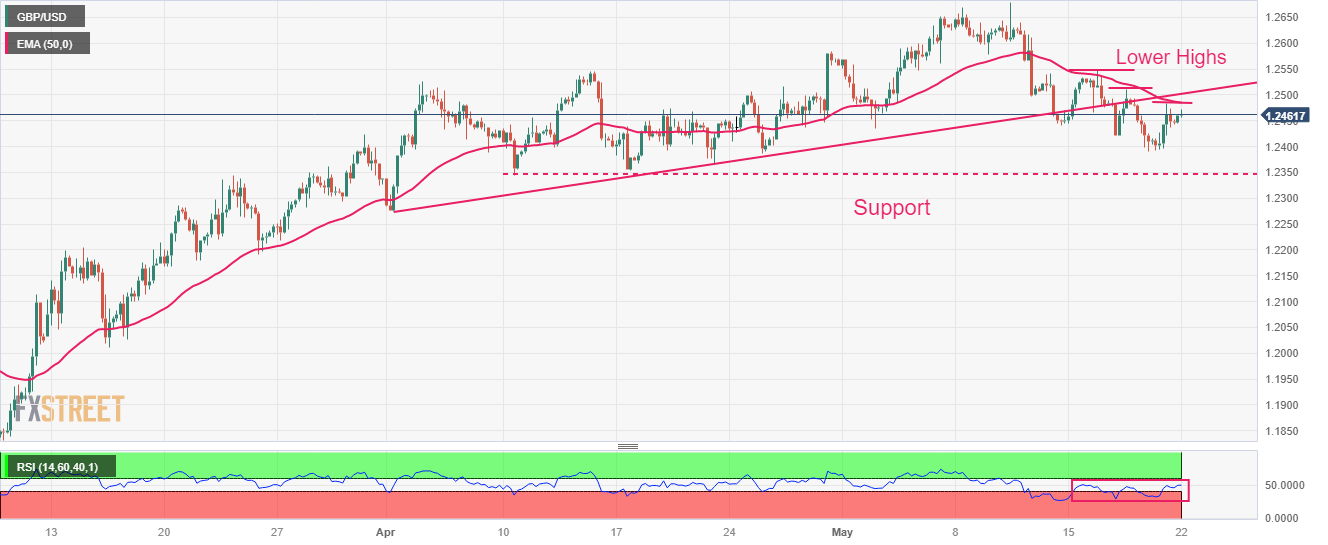
GBP/USD delivered a perpendicular fall after a breakdown of the upward-sloping trendline plotted from April 03 low at 1.2275 on a four-hour scale. The Cable is consistently making lower highs, indicating the strength of the US Dollar bulls. Potential support is placed from April 10 low at 1.2344.
The 50-period Exponential Moving Average (EMA) at 1.2486 is acting as a barricade for the Pound Sterling bulls.
Meanwhile, the Relative Strength Index (RSI) (14) has rebounded into the 40.00-60.00 range, indicating that the US Dollar bulls are losing momentum.
- USD/CAD picks up bids to pare intraday losses amid Canada bank holiday.
- WTI remains pressured amid fears of less energy demand, higher supplies.
- Mixed concerns about US debt ceiling negotiations, Fed keeps Loonie traders on their toes.
- Risk catalysts will be the key for short-term directions.
USD/CAD gathers strength around the intraday low as bears fail to defend the first daily loss in three while bouncing off the 100-DMA during early Monday.
The Loonie pair’s latest rebound could be linked to the downbeat performance of the WTI crude oil, Canada’s main export item. That said, the black gold drops for the third consecutive day as energy bears attack the $71.00, down 1.0% on a day around $71.15 by the press time. In doing so, the black gold justifies expectations of higher Oil production and fears of slower economic growth moving forward. That said, the US Energy Information Agency (EIA) said in its monthly report stating that the US crude oil production grew 5.6% in 2022 compared with 2021 while averaging 11.9 million barrels per day (bpd). “The main drivers of this growth are expected to be increased production in the Permian region and the Federal Offshore Gulf of Mexico,” said the EIA.
Elsewhere, the US Dollar Index (DXY) licks its wounds around 103.00 after reversing from a two-month high the previous day. In doing so, the greenback’s gauge versus the six major currencies cheers the recent cautious optimism about the US policymakers’ ability to overcome the debt ceiling expiry despite the latest failure of talks.
Recently, US President Joe Biden said his discussion with Republican House Speaker Kevin McCarthy went well while also adding that they will again talk on Monday. Previously, Senior White House Adviser Steve Ricchetti said, per Reuters, that they will keep working as he left the debt ceiling meeting early Monday during the Asian session. On the same line, US House Republican Speaker Kevin McCarthy spoke to reporters at the US Capitol following the call and said, per Reuters, that there were positive discussions on solving the crisis and that staff-level talks were set to resume later on Sunday.
On the other hand, the market’s bets of a 0.25% Fed rate hike in June have recently increased and the calls for a rate cut in 2023 have gone down due to the last week’s upbeat US economics and hawkish comments from the Fed (Fed) officials. As a result, the US Dollar Index hesitates in welcoming the bears and keeps the USD/CAD buyers hopeful.
Amid these pays, S&P500 Futures print mild losses of around 4,200 as it defends the previous day’s U-turn from the highest levels since August 2022. Further, the US 10-year and two-year Treasury bond yields also dropped to 3.65% and 4.23% in that order, which in turn portrays the market’s rush towards Treasury bonds for risk safety. It should be noted that Wall Street closed with minor losses on Friday as mixed concerns about the Fed and the US debt ceiling drama.
Moving on, the Canadian holiday may allow the USD/CAD pair traders less impulsive but the US debt ceiling announcements are the key to determining near-term pair moves.
Technical analysis
Despite the latest corrective bounce off the 100-DMA, USD/CAD justifies Friday’s Doji candlestick, as well as a steady RSI (14) line and bullish MACD signals. Even so, the pair is likely to remain sidelined between the 100-DMA and 200-DMA, respectively near 1.3510 and 1.3480.
US President Joe Biden said early Monday, that his discussion with House Speaker Kevin McCarthy ‘went well.”
“We will talk again Monday,” Biden added.
Market reaction
These encouraging comments from President Biden seem to have capped the downside in the US Dollar Index, as it now trades at 103.06, down 0.13% on the day. The Index hit a session low at 102.96 earlier on.
- USD/JPY remains depressed after reversing from the highest levels in six months.
- Bullish MACD signals join resistance-turned-support line, 200-DMA to prod Yen pair sellers.
- USD/JPY buyers need validation from 140.00 round figure to keep the reins.
USD/JPY holds lower ground near 137.70-60 as it prods the multi-month-old support line, previous resistance, during early Monday morning in Europe. In doing so, the Yen pair extends the previous day’s U-turn from the highest levels since late November 2022.
It’s worth noting, however, that the bullish MACD signals join the aforementioned resistance-turned-support line from mid-December 2022, around 137.65 at the latest, to challenge the USD/JPY bears.
Even if the Yen pair marks a daily closing below 137.65, the 200-DMA level surrounding 137.10, quickly followed by the 137.00 round figure, may restrict the quote’s further downside.
In a case where the Yen pair drops below 137.00, the odds of witnessing the quote’s slump towards the early April swing high of around 135.15 can’t be ruled out. Following that, a two-month-long ascending support line near 134.55 can act as the last defense of the USD/JPY buyers.
On the flip side, USD/JPY recovery may initially aim for the latest swing high of near 138.75.
However, the 50% Fibonacci retracement of the pair’s October 2022 to January 2023 downturn, close to 139.60, will presede the late November 2022 top surrounding 139.90 and the 140.00 psychological magnet to challenge short-term the Yen pair buyers.
Should the USD/JPY bulls keep the reins past 140.00, an upward trajectory towards the 61.8% Fibonacci retracement level near 142.50 can’t be ruled out.
USD/JPY: Daily chart
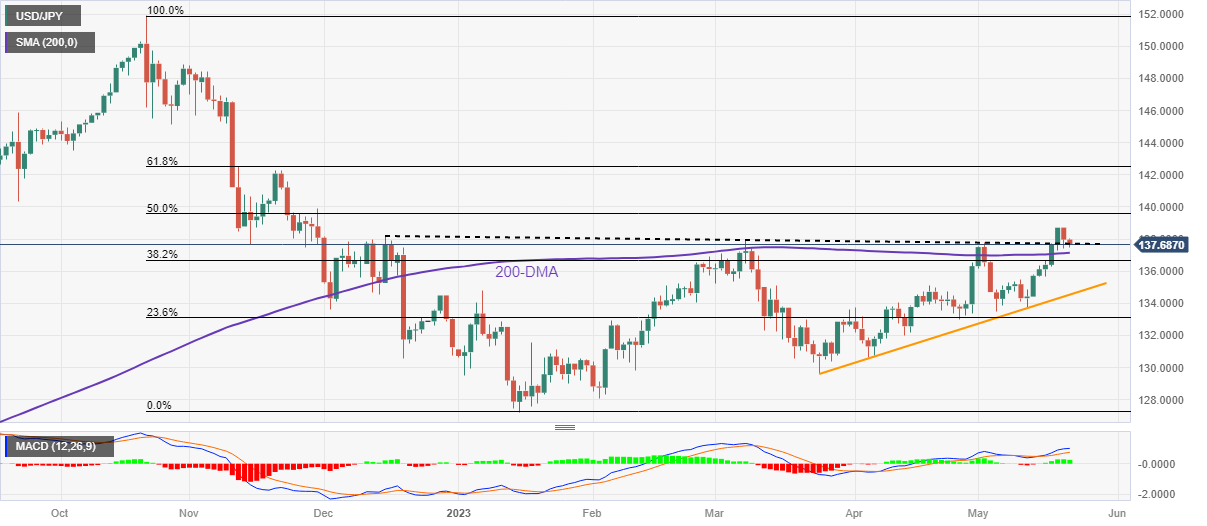
Trend: Bullish
| Raw materials | Closed | Change, % |
|---|---|---|
| Silver | 23.84 | 1.42 |
| Gold | 1977.51 | 0.98 |
| Palladium | 1512.46 | 3.35 |
- Market sentiment fades the previous day’s cautious optimism as US debt ceiling woes prevail.
- S&P500 Futures defend previous day’s U-turn from nine-month high.
- US 10-year Treasury bond yields snap six-day uptrend, reverses from the highest levels in 10 weeks.
- Risk catalysts are the key amid light calendar for today, Biden-McCarthy talks are crucial.
Global traders remain cautious during early Monday as the US policymakers failed to offer any solutions to the looming default woes even as President Joe Biden and US House Republican Speaker Kevin McCarthy agrees to resume debt ceiling talks after initial failures.
While portraying the mood, S&P500 Futures print mild losses around 4,200 as it defends the previous day’s U-turn from the highest levels since August 2022. Further, the US 10-year and two-year Treasury bond yields also dropped to 3.65% and 4.23% in that order, which in turn portrays the market’s rush towards Treasury bonds for risk safety. It should be noted that Wall Street closed with minor losses on Friday as mixed concerns about the Fed and the US debt ceiling drama.
It’s worth noting that Senior White House Adviser Steve Ricchetti said, per Reuters, that they will keep working as he left the debt ceiling meeting early Monday during the Asian session. On the same line, US House Republican Speaker Kevin McCarthy spoke to reporters at the US Capitol following the call and said, per Reuters, that there were positive discussions on solving the crisis and that staff-level talks were set to resume later on Sunday.
Elsewhere, Federal Reserve Chairman Jerome Powell highlighted inflation fears on Friday and stated that the recent banking crisis, which led to tighter credit standards, has eased the pressure to hike interest rates. The same weighed on the hawkish Fed bets and allowed the US Dollar bulls to take a breather. That said, the market’s bets of a 0.25% Fed rate hike in June have recently increased and the calls for a rate cut in 2023 have gone down due to the last week’s upbeat United States economics and hawkish comments from the Federal Reserve (Fed) officials. With this, the market’s previous optimism fades ahead of the top-tier US data.
Looking ahead, the Federal Open Market Committee (FOMC) meeting minutes, preliminary readings of the May month Purchasing Managers Indexes (PMIs) and the Fed’s favorite inflation gauge, namely the US Core PCE Price Index, will be crucial to watch for clear directions. Above all, US debt ceiling announcements are the key to determining near-term US Dollar moves. Should the US policymakers manage to extend the debt ceiling, the market sentiment can improve and propel the US Dollar.
Also read: Forex Today: US Dollar holds firm despite improving risk appetite
- EUR/USD grinds higher around intraday top, extends the previous day’s rebound from two-month low.
- Clear upside break of 100-DMA, RSI rebound from nearly oversold territory underpin bullish bias for Euro.
- 12-day-old bearish channel prods Euro bulls before giving them control; 1.0720-15 is the key challenge for bears.
EUR/USD bulls keep the reins around the intraday high surrounding 1.0825-30 as buyers cheer the upside break of the 100-DMA during Monday’s Asian session. In doing so, the Euro pair stretches the previous day’s recovery moves from the lowest levels in eight weeks while approaching the top line of a fortnight-long descending trend channel.
It’s worth noting that the RSI (14) line’s rebound from nearly oversold conditions joins the EUR/USD pair’s sustained break of the 100-DMA to keep Euro buyers hopeful.
However, a clear upside break of the aforementioned bearish channel’s top line, close to 1.0860, becomes necessary for the bulls to retake control.
Even so, multiple hurdles around 1.0920 and 1.1000 may challenge the EUR/USD buyers before directing them to February’s high of 1.1033. It should be observed that the 1.1095-1100 region appears a tough nut to crack for the Euro bulls past 1.1033.
Meanwhile, EUR/USD sellers may wait for a clear downside break of the 100-DMA support of near 1.0800 for fresh entry.
Following that, the 50% Fibonacci retracement of the pair’s January-April upside, near 1.0790, could lure the EUR/USD bears. Though, a convergence of the previously stated channel’s bottom line and the 61.8% Fibonacci retracement, around 1.0720-15, becomes crucial support to watch for the EUR/USD sellers afterward.
EUR/USD: Daily chart
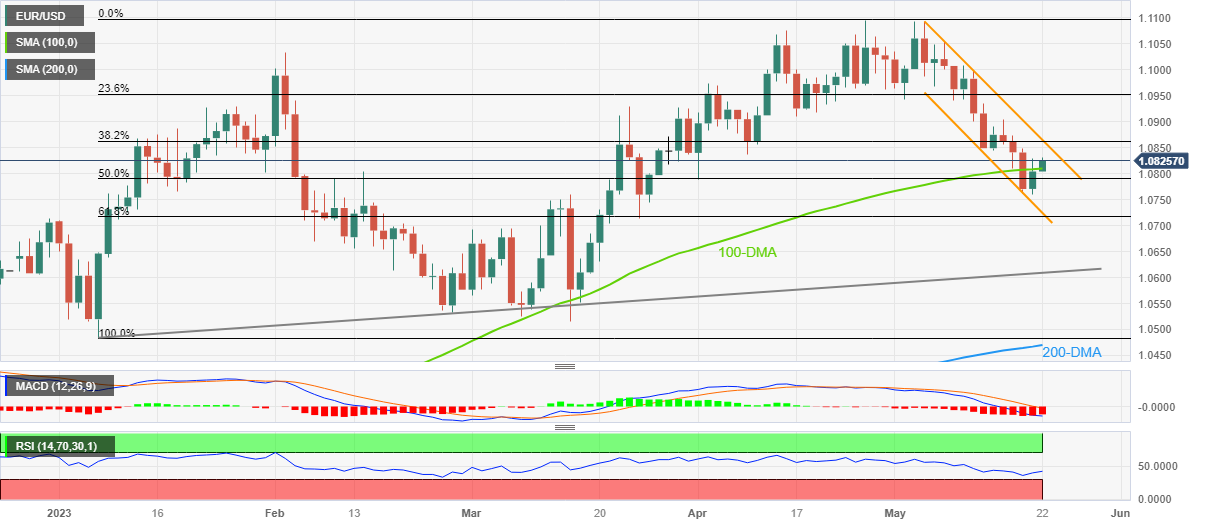
Trend: Further recovery expected
- Gold price has climbed strongly above $1,980.00 ahead of US debt-ceiling talks.
- US Biden might require to call for his 14th amendment right to save the economy from default.
- Fed’s Powell said on Friday that the recent banking crisis, which led to tighter credit standards, has eased the pressure to hike interest rates.
Gold price (XAU/USD) has shifted comfortably above the critical resistance of $1,980.00 in the Tokyo session. The precious metal has got immense strength as the US debt-ceiling talks between the White House and Republicans are failing to reach a deal. Also, a consideration of a steady interest rate policy by the Federal Reserve (Fed) is fueling strength in the Gold bulls.
S&P500 futures have recovered the majority of losses generated in early Asia. However, the overall market mood is cautionary as no deal between US President Joe Biden and House of Representatives Speaker Kevin McCarthy would push the former into the corner. US Biden might require to call for his 14th amendment right to save the economy from default.
The US Dollar Index (DXY) has refreshed its day’s low at 102.96 as the Fed is expected to hold its interest rate policy as tight credit conditions by the US regional banks are effectively weighing pressure on inflation.
Fed’s Powell said on Friday that the recent banking crisis, which led to tighter credit standards, has eased the pressure to hike interest rates. He further added, "Our policy rate may not need to rise as much as it would have otherwise.”
Going forward, preliminary S&P US PMI (May) will remain in the spotlight. Manufacturing PMI is seen declining to 50.0 from the former release of 50.4. The Services PMI is expected to remain steady at 53.6.
Gold technical analysis
Gold price has climbed back above the potential resistance, which has turned into support, plotted from April 19 low at $1,969.26 on a four-hour scale. The precious metal showed a V-shape recovery from around $1,950.00 amid the emergence of responsive buyers.
A confident sustainability above the 20-period Exponential Moving Average (EMA) at $1,980.00 will turn the short-term trend positive.
The Relative Strength Index (RSI) (14) has returned into the 40.00-60.00 range swiftly, which indicates a bullish reversal.
Gold four-hour chart
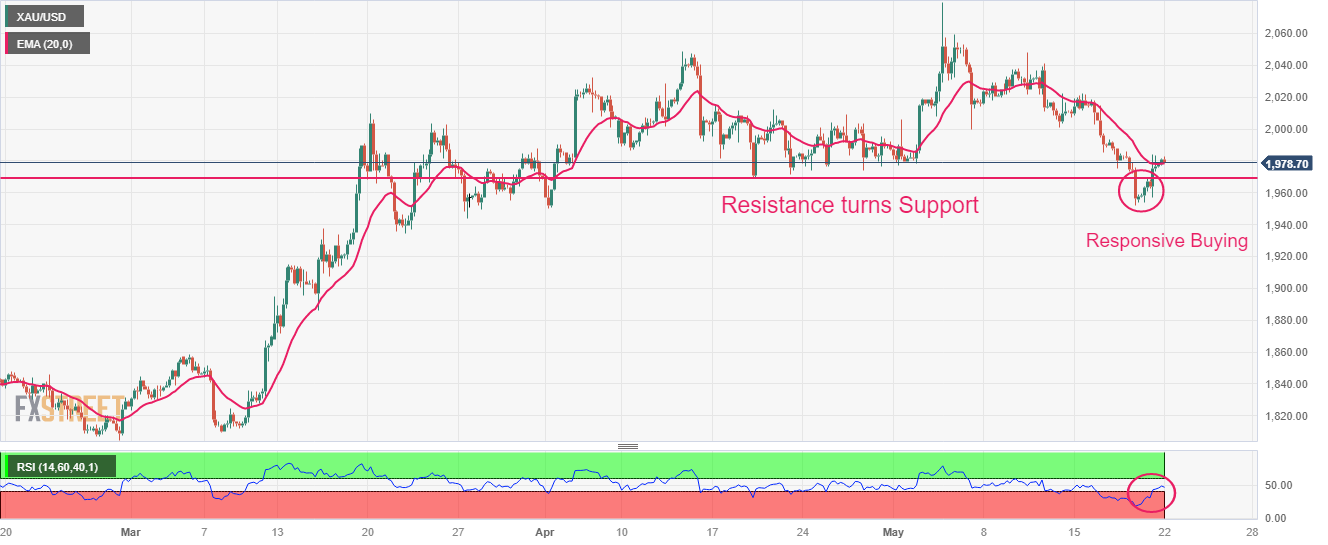
People’s Bank of China (PBOC) holds its benchmark monetary policy rates, namely the Loan Prime Rates (LPR), unchanged during Monday's announcement.
Given the status quo from the Chinese central bank, the latest PBOC LPRs for one-year and five-year are 3.65% and 4.30%.
Also read: PBOC sets USD/CNY reference rate at 7.0157 vs. 7.0356 previous
About PBOC Interest Rate Decision
The PBoC Interest Rate Decision is announced by the People´s Bank of China. If the PBoC is hawkish about the inflationary outlook of the economy and rises the interest rates it is positive, or bullish, for the CNY. Likewise, if the PBoC has a dovish view on the Chinese economy and keeps the ongoing interest rate, or cuts the interest rate it is negative, or bearish.
People’s Bank of China (PBOC) set the USD/CNY central rate at 7.0157 on Monday, versus previous fix of 7.0356 and market expectations of 7.0141. It's worth noting that the USD/CNY closed near 7.0140 the previous day.
“With 2 billion Yuan worth of reverse repos maturing on Monday, China central bank makes no fund injection or withdrawal on a net basis on the day,” said Reuters following the PBOC Fix announcements.
About PBOC fix
China maintains strict control of the yuan’s rate on the mainland.
The onshore yuan (CNY) differs from the offshore one (CNH) in trading restrictions, this last one is not as tightly controlled.
Each morning, the People’s Bank of China (PBOC) sets a so-called daily midpoint fix, based on the yuan’s previous day's closing level and quotations taken from the inter-bank dealer.
“We’ll keep working tonight", Reuters quotes Senior White House Adviser Steve Ricchetti as he left debt ceiling meeting on early Monday in Asia.
During the weekend, Staff members from both sides reconvened at McCarthy's office in the Capitol on Sunday evening for talks that lasted about two-and-a-half hours, per Reuters.
After inconclusive talks, a White House official confirmed Monday's meeting but offered no specific time.
House Republican Speaker Kevin McCarthy, speaking to reporters at the US Capitol following the call, said there were positive discussions on solving the crisis and that staff-level talks were set to resume later on Sunday, per Reuters.
Also read: US Dollar Index: DXY stays pressured around 103.00 as US debt ceiling talks, Fed Minutes loom
- AUD/USD picks up bids to refresh intraday high, challenges one-week-old bearish channel.
- Bullish MACD signals, upbeat RSI (14) suggests further grinding of prices towards the north.
- Convergence of 100-SMA, 200-SMA prods the Aussie pair buyers.
AUD/USD renews intraday high near 0.6665 amid early Monday in Asia. In doing so, the Aussie pair buyers challenge a one-week-old descending trend channel.
That said, bullish MACD signals join the upward-sloping RSI (14) line to keep the AUD/USD buyers hopeful.
With this, the Aussie pair aims to cross the top line of the aforementioned bearish channel, close to 0.6670 by the press time.
Even so, a convergence of the 100-SMA and 200-SMA, around 0.6685-90, appears a tough nut to crack for the AUD/USD bulls to crack before taking control.
In a case where the Aussie bulls dominate past 0.6690, they need validation from the 0.6700 round figure ahead of targeting the monthly high of around 0.6820.
On the flip side, pullback moves may aim for the 0.6600 round figure before testing the aforementioned channel’s lower line, close to 0.6590 at the latest.
Following that, April’s low around 0.6570 and the yearly low marked in March near 0.6565 will be in the spotlight.
Overall, AUDUSD is likely to recover but the road towards the north appears long and bumpy.
AUD/USD: Four-hour chart
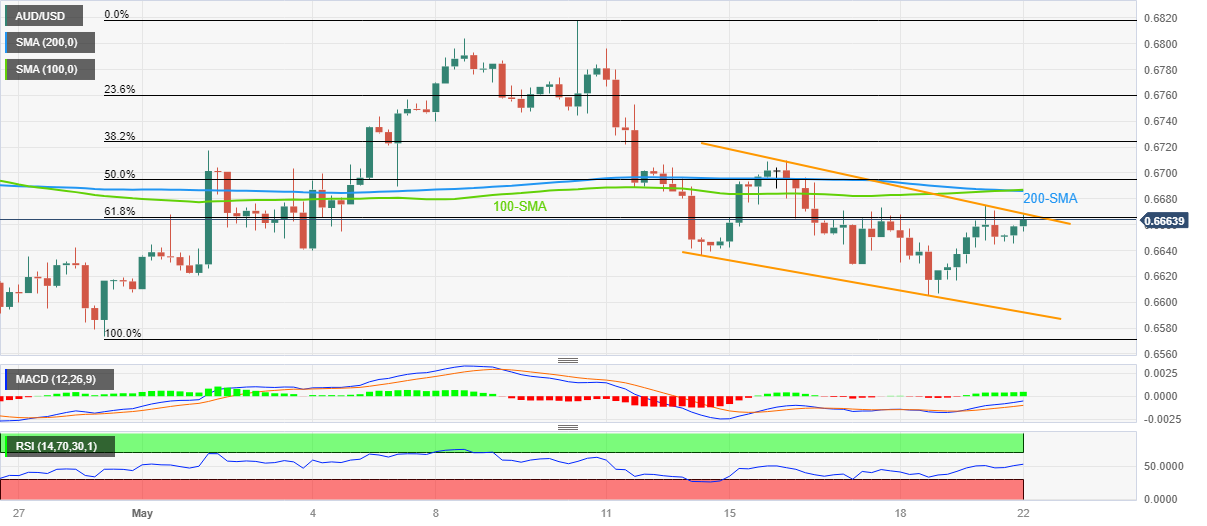
Trend: Limited upside expected
- Oil price is displaying a sideways performance below $72.00 ahead of US debt-ceiling talks.
- US Biden called partisan terms from Republicans unacceptable as the latter demanded an 8% cut on the overall budget.
- The oil price is auctioning in a Symmetrical Triangle chart pattern, which indicates volatility contraction.
West Texas Intermediate (WTI), futures on NYMEX, are displaying back-and-forth action below $72.00 in the Asian session. The oil price is expected to remain sideways as investors are awaiting the outcome of the US debt-ceiling negotiations.
US President Joe Biden and House of Speaker Kevin McCarthy are scheduled to make further negotiations on Monday. Earlier, US Biden called partisan terms from Republicans unacceptable as the latter demanded an 8% cut on big wrath.
Meanwhile, Reuters reported that the G7, the European Union, and Australia agreed to impose a $60-per-barrel price cap on Russian seaborne crude oil and also set an upper price limit for Russian oil products to deprive Moscow of revenues for its invasion of Ukraine.
The oil price is auctioning in a Symmetrical Triangle chart pattern on a four-hour scale, which indicates volatility contraction. The upward-sloping trendline of the chart pattern is placed from May 15 low at $69.39 while the downward-sloping trendline is plotted from May 10 high at $73.81. Earlier, the oil price rebounded firmly after forming a Double Bottom chart pattern around March 20 low at $64.38.
The 20-period Exponential Moving Average (EMA) at $72.00 is stick to the oil price, indicating a lackluster performance.
Also, the Relative Strength Index (RSI) (14) is oscillating in the 40.00-60.00, which signals that investors await a trigger for decisive action.
Going forward, a breakdown of May 15 low at $69.39 will strengthen the downside bias and will send the oil price to May 04 low at $67.47. A breakdown of the latter will further send the asset price toward 17-month low at $64.31.
In an alternate scenario, a solid recovery above May 10 high at $73.80 will allow the asset for further upside towards May 02 high at $76.06. A breach of the latter will expose the asset to April 26 high around $78.00.
WTI four-hour chart
-638203137171439753.png)
“The RMB (Chinese Yuan) exchange rate has accelerated adjustments, but the benchmark situation of a steady rise has not changed, showing a two-way fluctuation and a steady rise,” said the China Securities Journal (CSJ) while quoting Guan Tao, Global Chief Economist at BOC International and a former official at the State Administration of Foreign Exchange (SAFE).
Key details
I believe that the current RMB exchange rate remains basically stable, the domestic foreign exchange supply and demand relationship is basically balanced, the leverage adjustment effect of the exchange rate is functioning normally, the market exchange rate expectation remains basically stable, and the stock exchange resonance has correlation but no causal relationship.
Based on the analysis of the above factors, the impact of two-way fluctuations in the RMB exchange rate on the financial market is generally limited.
Against the background of economic recovery, the stable operation of the capital market has a solid foundation.
The key factor affecting the RMB exchange rate is the fundamentals of the domestic economy.
Although the market has some differences on the specific trend of the future domestic economic recovery, the basic consensus is that the world economy is facing downside risks, and the Chinese economy is expected to recover overall.
Current benchmark situation of a stable and rising RMB exchange rate has not changed.
The RMB exchange rate will not be a linear unilateral trend, but a two-way fluctuation, rising steadily.
With the coordinated efforts of macroeconomic policies, the economy and society will fully resume normal operation.
If positive factors accumulate further and the domestic economic operation picks up steadily, under the circumstances that my country's basic international balance of payments is still relatively strong, it will affect the RMB exchange rate this year.
The policy level is clear, resolutely restrain the fluctuation of the RMB exchange rate.
AUD/USD grinds higher
AUD/USD picks up bids to refresh intraday high near 0.6660 while extending the previous day’s rebound early Monday.
- Silver price remains sidelined after bouncing off seven-week low.
- RSI suggests further recovery but bearish MACD signals, 50-DMA test XAG/USD bulls.
- Silver buyers need validation from $24.65; downside break of 100-DMA highlights sub-$23.00 area for sellers.
Silver price (XAG/USD) struggles to defend the previous day’s rebound from the key moving average to around $23.85 early Monday. In doing so, the bright metal remains sidelined after bouncing off the lowest levels since late March the previous day.
That said, the RSI (14) line recovers from the oversold territory, which in turn favors the XAG/USD rebound from the 100-DMA. However, the 50-DMA hurdle of around $24.25 joins the bearish MACD signals to challenge the metal buyers.
Even if the Silver price manages to remain firmer past $24.25, February’s high of around $24.65 can act as the last defense of the XAG/USD bears before directing the quote toward the $25.00.
Additionally, the Silver price upside past $25.00 may witness multiple stops near $25.30 and $25.50, a break of which might propel the bullion price toward the latest peak of around $26.15.
Alternatively, the XAG/USD sellers may wait for a daily closing beneath the 100-DMA support, close to $23.40 by the press time.
Following that, the 38.2% Fibonacci retracement level of the Silver Price upside from August 2022 to May 2023, near $22.85, will be key to watch for the sellers.
In a case where the XAG/USD stays bearish past $22.85, the 200-DMA and 50% Fibonacci retracement, respectively near $21.95 and $21.80, will be in the spotlight.
Silver price: Daily chart
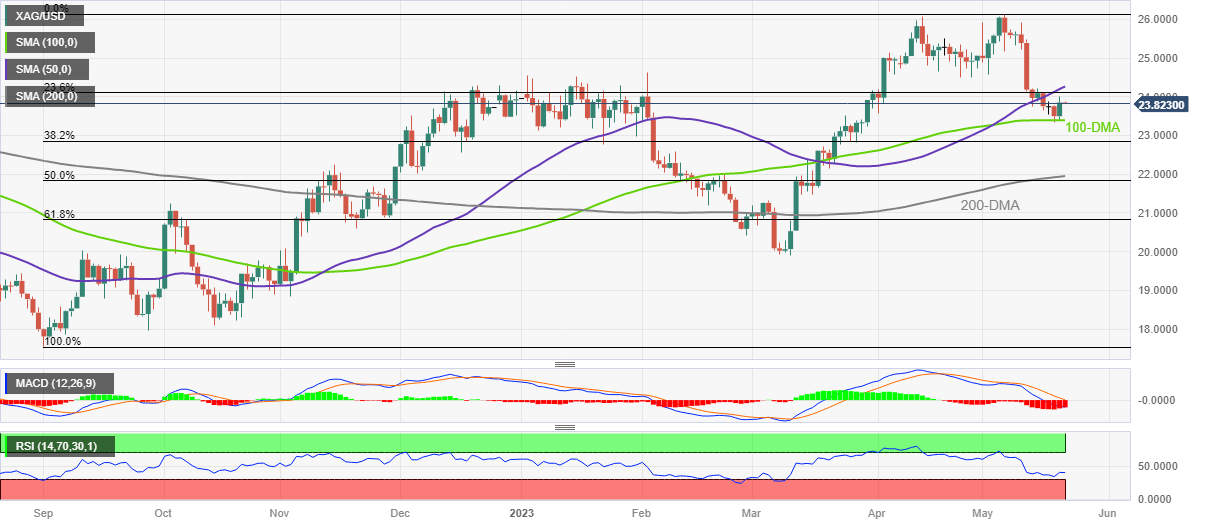
Trend: Limited recovery expected
| Index | Change, points | Closed | Change, % |
|---|---|---|---|
| NIKKEI 225 | 234.42 | 30808.35 | 0.77 |
| Hang Seng | -276.68 | 19450.57 | -1.4 |
| KOSPI | 22.39 | 2537.79 | 0.89 |
| ASX 200 | 42.7 | 7279.5 | 0.59 |
| DAX | 112.02 | 16275.38 | 0.69 |
| CAC 40 | 45.07 | 7491.96 | 0.61 |
| Dow Jones | -109.28 | 33426.63 | -0.33 |
| S&P 500 | -6.07 | 4191.98 | -0.14 |
| NASDAQ Composite | -30.94 | 12657.9 | -0.24 |
- USD/JPY is expected to display more losses below 137.50 amid dovish interest rate guidance by the Fed.
- US Biden might exercise his 14th Amendment right in case Republicans hold their current partisan terms.
- The BoJ will maintain its dovish interest rate policy stance to keep inflation steadily above 2%.
The USD/JPY pair has dropped back to near the crucial support of 137.50 in the Asian session. The asset is expected to deliver more losses below the aforementioned support as a delay in the US debt-ceiling raise is creating chaos in global markets.
S&P500 futures have recovered some losses posted in early Asia, however, the market mood is quite risk-off as US Treasury is coming closer to a default situation each day passes by. US President Joe Biden called off the current bipartisan deal with House of Representatives Kevin McCarthy citing them as unacceptable and offered to prevent Democrats from winning re-elections in 2024.
The street is anticipating that US Biden might exercise his 14th Amendment right, in case Republicans hold their current partisan terms, to save the United States economy from default as it could spike interest rates and bring sheer volatility in financial markets. However, the White House is not sure that they have sufficient time to exercise the un-tested way out.
The US Dollar Index (DXY) is looking for a cushion near 103.00, however, the downside seems favored as the Federal Reserve (Fed) is expected to keep interest rates steady in its June monetary policy meeting. Meanwhile, the 10-year US Treasury yields have faced some pressure while attempting a break above 3.7%.
On the Japanese Yen front, an acceleration in inflationary pressures has shown some signs that economic recovery in Japan is intact. National headline Consumer Price Index (CPI) jumped to 3.5% from the prior release of 3.2% while the street was anticipating a deceleration to 2.5%. Core CPI that doesn’t include food and energy prices accelerated to 4.1% vs. the consensus of 3.4% and the former release of 3.8%. However, the Bank of Japan (BoJ) will maintain its dovish interest rate policy stance to keep inflation steadily above 2%.
| Pare | Closed | Change, % |
|---|---|---|
| AUDUSD | 0.66499 | 0.4 |
| EURJPY | 149.074 | -0.2 |
| EURUSD | 1.08049 | 0.29 |
| GBPJPY | 171.717 | -0.19 |
| GBPUSD | 1.24462 | 0.31 |
| NZDUSD | 0.62741 | 0.73 |
| USDCAD | 1.34981 | -0.01 |
| USDCHF | 0.8993 | -0.63 |
| USDJPY | 137.969 | -0.5 |
European Central Bank (ECB) President Christine Lagarde crossed wires via an interview on the Buitenhof TV show aired Sunday wherein she said, “I think we covered a large chunk of the journey toward taming inflation and bringing it back to our target.”
The policymaker, however, also mentioned, “We are not done yet, we are not pausing based on the information I have today.”
“Inflation outlook is too high and for too long,” added ECB’s Lagarde.
Additional comments
So many things can go wrong that we cannot give what we call forward guidance.
I don’t have a predetermined number in my mind.
EUR/USD prints mild gains
EUR/USD justifies hawkish comments from ECB President Lagarde as it prints mild gains, keeping Friday’s rebound from a two-month low, near 1.0820 during early Monday in Asia.
The latest survey reports from Britain’s property website Rightmove and the UK BDO unveil mixed signals. That said, the former cites a jump in the house asking price to mention the returning confidence to the housing market while the latter states UK firms’ plan to differ investments on tax increase.
Key findings from Rightmove
Asking prices for British homes rose in May by more than in any other month this year as a better economic outlook and steadier mortgage rates offset the impact of the Bank of England's interest rates rises.
The average price of homes coming to the market jumped by 1.8%, or 6,647 pounds ($8,389.18) from April, above the average rise for May of 1.0%.
Rightmove said mortgage rates had been stable on a week-to-week basis.
Other indicators have painted a more mixed picture.
Important details of BDO Survey
Almost half of medium-sized British companies plan to delay investment plans due to last month's rise in corporation tax.
Low business investment is one of the reasons economists give for the weak growth in British productivity and living standards over the last decade, and businesses have complained that higher tax rates reduce their incentive to invest.
Accountants BDO said 46% of businesses surveyed with a turnover of between 10 million and 300 million pounds ($12 million - $379 million) reported that the rise in corporation tax would delay investment, while 39% said it would slow hiring or lead to job losses.
The BDO survey was based on responses from 512 companies polled between March 30 and April 16.
Also read: GBP/USD Price Analysis: Climbs firmly above 1.2450 ahead of Monday’s US borrowing cap talks


© 2000-2026. All rights reserved.
This site is managed by Teletrade D.J. LLC 2351 LLC 2022 (Euro House, Richmond Hill Road, Kingstown, VC0100, St. Vincent and the Grenadines).
The information on this website is for informational purposes only and does not constitute any investment advice.
The company does not serve or provide services to customers who are residents of the US, Canada, Iran, The Democratic People's Republic of Korea, Yemen and FATF blacklisted countries.
Making transactions on financial markets with marginal financial instruments opens up wide possibilities and allows investors who are willing to take risks to earn high profits, carrying a potentially high risk of losses at the same time. Therefore you should responsibly approach the issue of choosing the appropriate investment strategy, taking the available resources into account, before starting trading.
Use of the information: full or partial use of materials from this website must always be referenced to TeleTrade as the source of information. Use of the materials on the Internet must be accompanied by a hyperlink to teletrade.org. Automatic import of materials and information from this website is prohibited.
Please contact our PR department if you have any questions or need assistance at pr@teletrade.global.
transfers