- Analytics
- News and Tools
- Market News
CFD Markets News and Forecasts — 24-05-2023
- USD/CHF is making efforts for a confident break above a five-week high at 0.9067.
- S&P500 dropped heavily on Wednesday as US default fears remain active due to a delay in agreement over the US borrowing cap.
- USD/CHF has entered into a markup phase after delivering a breakout of the Wyckoff Accumulation pattern.
The USD/CHF pair has turned sideways after a mild correction from 0.9060 in the Asian session. The Swiss Franc asset refreshed its five-week high at 0.9067 and is now gathering strength for extending the rally further.
S&P500 futures have added significant gains in early Tokyo. US equities dropped heavily on Wednesday as US default fears remain active due to a delay in agreement over the US borrowing cap. The US Dollar Index (DXY) is looking to capture the crucial resistance of 104.00 despite chances of a pause in the policy-tightening spell by the Federal Reserve (Fed) are sky-rocketing.
USD/CHF has entered into a markup phase after delivering a breakout of the Wyckoff Accumulation pattern formed on a four-hour scale. The Swiss franc asset is expected to display wider bullish ticks and heavy volume as bulls remain solid in the markup phase. Upward-sloping 20-period Exponential Moving Average (EMA) at 0.9000 is providing support to the US Dollar bulls.
A confident break into the bullish range of 60.00-80.00 by the Relative Strength Index (RSI) has strengthened US Dollar bulls further.
Going forward, a decisive break above May 24 high at 0.9067 will drive the asset toward the round-level resistance of 0.9100 followed by March 28 low at 0.9137.
In an alternate scenario, a downside move below May 16 low at 0.8929 will drag the asset toward April 14 low at 0.8867. A slippage below April 14 low will further drag the asset toward the Spring formation around May 04 low at 0.8820.
USD/CHF four-hour chart
-638205683776563659.png)
- NZD/USD stays pressured around monthly low, bounces off key support line.
- Clear break of previously important trend line support, bearish MACD signals favor Kiwi sellers.
- RSI conditions suggest limited downside room; Convergence of 21, 50 DMAs adds to the upside filters.
NZD/USD bears take a breather around 0.6100 amid Thursday’s sluggish Asian session, after falling the most since early February the previous day.
The Kiwi pair’s latest inaction could be linked to the market’s mixed feelings about the Reserve Bank of New Zealand’s (RBNZ) next move as Governor Adrian Orr sounds hawkish but the central bank keeps peak rate unchanged with its 0.25% rate hike.
Also read: RBNZ’s Orr: Committee was confident in the level of restrictiveness of interest rates
Apart from RBNZ Governor Adrian Orr’s latest comments, the downbeat conditions of the RSI (14) line, also allow the NZD/USD pair to lick its wounds after a noteworthy fall the previous day.
With this, the Kiwi pair stays defensive around the key support line stretched from November 2022, around 0.6090. Also acting as a short-term downside filter is the yearly low marked in March around 0.6085.
As a result, the NZD/USD bears need to conquer the 0.6090-85 support zone to keep the reins.
Following that, the pair’s gradual fall towards the 50% and 61.8% Fibonacci retracement of October 2022 to February 2023 upside, respectively near 0.6025 and 0.5900, can be expected.
It should be noted, however, that the NZD/USD pair’s corrective bounce past the previous support line stretched from March, now immediate resistance around 0.6130, can convince short-term buyers.
In that case, a convergence of the 21-DMA and 50-DMA, near 0.6230-40, will be crucial to watch.
NZD/USD: Daily chart
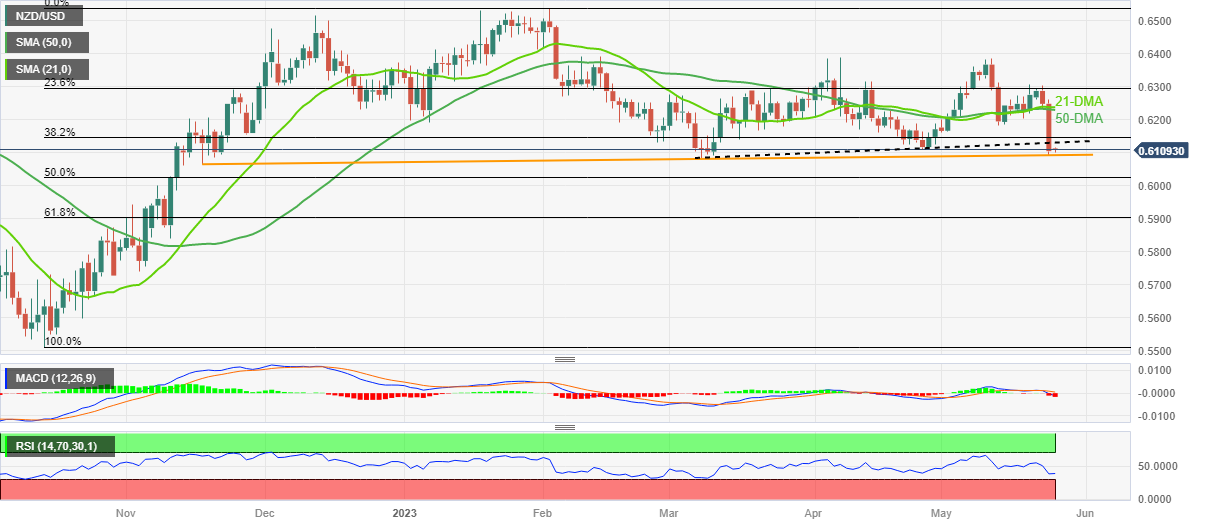
Trend: Corrective bounce expected
- AUD/USD is likely to discover more losses below 0.6530 amid further delay in US debt-ceiling issues.
- Fed Bostic favored that the central bank should not consider interest rate cuts in 2024 too.
- The RBA has started to unwind its pandemic bond purchases as around $20 billion of purchased bonds have matured.
The AUD/USD pair found intermediate support after a vertical fall to near 0.6530 in the early Tokyo session. An absence of recovery in the Aussie asset after gauging a support indicates lack of strength in the Australian Dollar, which advocates further decline ahead.
S&P500 futures have trimmed some gains added in early Asia. The overall market mood is extremely cautious as US debt-ceiling issues are taking more time than thought. Mixed views on US borrowing cap from think tanks are baffling investors.
Fitch Ratings have cited that chances are greater that the debt ceiling will not be raised or suspended. While, managing director of the International Monetary Fund (IMF) Kristalina Georgieva said on Wednesday she was confident the United States would avoid a debt default, as reported by Reuters.
The US Dollar Index (DXY) is looking to refresh its two-month high further after reclaiming the 104.00 resistance as US debt-ceiling issues are still in progress.
Meanwhile, Atlanta Federal Reserve (Fed) President Raphael Bostic has advocated that the central bank should remain data-specific for June’s monetary policy meeting. He further added that no consideration of an interest rate cut well in 2024 would be the best-case scenario.
Going forward, Friday’s US Durable Goods Orders (April) data will remain in the spotlight. The economic data is seen contracting by 1.0% vs. an expansion of 3.2%. An occurrence of the same might ease inflationary pressures ahead.
The Australian Dollar has lost traction against the US Dollar as investors are anticipating a steady interest rate policy by the Reserve Bank of Australia (RBA) for the June meeting. Meanwhile, David Jacobs, head of domestic markets at the Reserve Bank of Australia (RBA), said on Wednesday, he expects the balance sheet unwinding process to run smoothly, though are attentive to the challenges involved. He further added, “Its balance sheet starting to unwind pandemic bond purchases; around $20 billion of purchased bonds have matured.”
- EUR/JPY struggles to overcome the 150.00 resistance; risks point to a potential further slide.
- Support rests at 149.00, with a breach likely to trigger a pullback towards the 20-day EMA at 148.59 and then the 148.00 level.
- Resistance stands at 150.00; surpassing it may fuel a rally towards 151.00 and possibly to the YTD high of 151.61.
EUR/JPY oscillates at around 149.70 after the EUR/JPY tumbled as low as 149.27 in the session. Still, the EUR/JPY is set to print minimal losses of 0.02% on Wednesday after releasing the US Federal Reserve (Fed) last meeting minutes, which weighed on the EUR/USD pair. Therefore, broad Euro (EUR) weakness was the main reason for the EUR/JPY’s price action.
EUR/JPY Price Analysis: Technical outlook
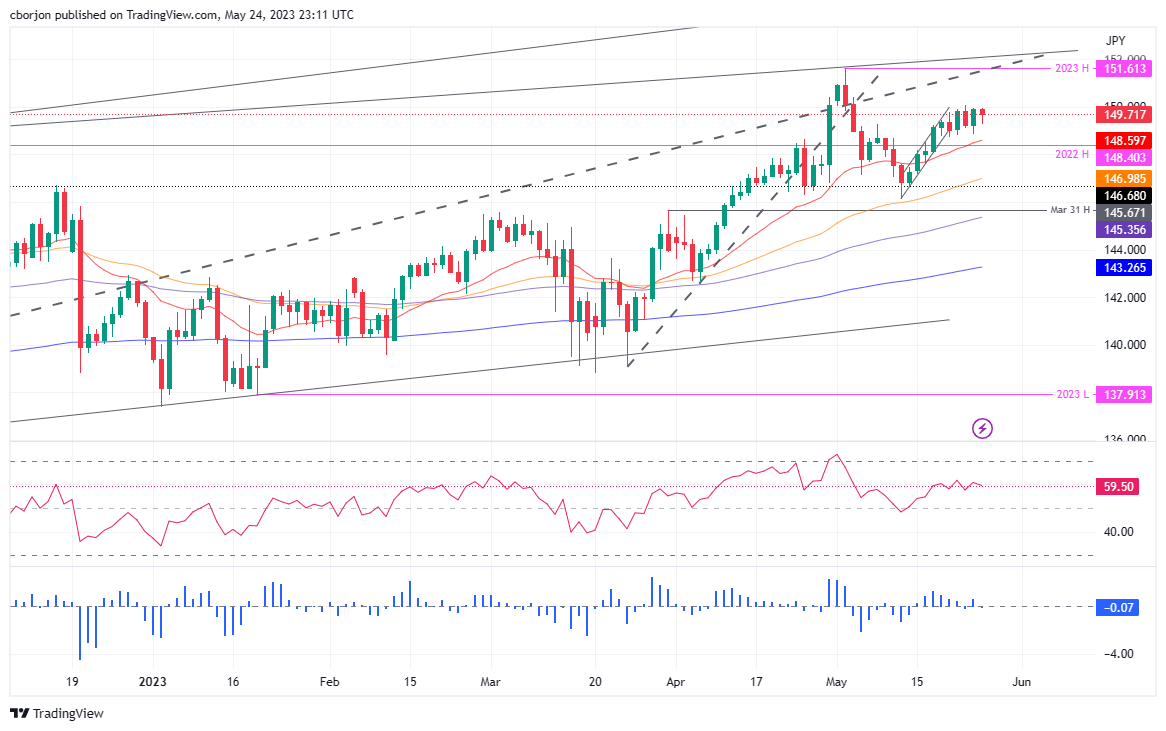
The EUR/JPY daily chart suggests the pair remains neutral but tilted to the downside, with the EUR/JPY failing to decisively clear solid resistance at around 150.00. Downside action is warranted as long as the EUR/JPY stays below the year-to-date (YTD) high of 151.61. That, alongside worse-than-expected Eurozone (EU) data, could pave the way for further downside.
Therefore, the EUR/JPY first support would be the 149.00 figure. A successful break below this resistance will pave the way for a pullback toward the 20-day Exponential Moving Average (EMA) at 148.59 before dipping toward the 148.00 figure. The next stop would be the 50-day EMA at 146.98.
Conversely, the EUR/JPY first resistance is 150.00. A breach of it, and the cross could rally toward 151.00, ahead of the YTD high of 151.61. The Relative Strength Index (RSI) indicator is in bullish territory but turned flat, suggesting that buyers are taking a respite, while the 3-day Rate of Change (RoC) shifts neutral.
EUR/JPY Price Action – Daily chart
- WTI crude oil seesaws at the highest levels in more than three weeks, struggles to extend three-day uptrend.
- EIA inventories marked heavy surprise draw in Weekly Crude Oil Stock Change report for May 19.
- US Dollar cheers market’s risk aversion, fails to justify indecision among Fed policymakers.
- Risk catalysts will be the key to determine short-term Oil price moves.
WTI crude oil stays defensive above $74.00 amid early hours of Thursday’s Asian session, after refreshing a three-week top the previous day. In doing so, the black gold justifies the mixed catalysts about the Oil inventories and the US Dollar.
The energy benchmark refreshed multi-day high after the Energy Information Institute (EIA) reported a massive draw in the weekly inventory levels. That said, the EIA Crude Oil Stocks Change came in at -12.456M versus 0.775M market forecasts and 5.04M previous readings.
Apart from the EIA inventories, warning from Saudi Arabia also fuel the WTI prices. That said, Saudi Arabia's energy minister said short-sellers betting oil prices will fall should "watch out" for pain.
On the other hand, the US Dollar Index (DXY) rose for the third consecutive day to mark the highest levels since March 20, firmer around 103.90 by the press time.
While tracing the DXY catalysts, the market’s fears of the US default, as well as indecision about the Federal Reserve’s (Fed) next move, gain major attention.
That said, US House Speaker Kevin McCarthy said that they are sending their negotiators to the White House to try and finish up debt-limit talks. Alternatively, reports took rounds that the US House members will go back to their homes after Thursday, to cheer the long weekend, before resuming the debt ceiling negotiations, which in turn will escalate the fears of no deal before late May.
It should be noted that the Minutes of the latest Federal Open Market Committee (FOMC) Meeting suggested that the policymakers aren’t on the same table as some suggest it is appropriate to hike the rates while others advocate for a policy pivot.
Talking about the Fed commentary, Federal Reserve (Fed) Bank of Atlanta President Raphael Bostic said, “‘We’re right at the beginning of the hard part’ of taming inflation.” On the same line, Federal Reserve Governor Christopher Waller mentioned that he doesn’t support stopping rate hikes unless getting clear evidence that inflation is moving down towards 2% objective.
Amid these plays, S&P500 Futures print mild gains despite downbeat Wall Street performance whereas the yields remain sidelined after rising to the highest levels since mid-March the previous day.
Moving on, Oil traders should pay attention to risk catalysts for clear directions. Among them the US policymakers’ negotiations to avoid the expiry of the debt ceiling will gain major attention.
Technical analysis
Although the Oil’s clear upside break of the mid-May peak of around $73.80 enables WTI bulls to keep the reins, the 50-DMA and 100-DMA, respectively near $74.55 and $76.10, can challenge the upside momentum.
- EUR/USD drops to the lowest levels since late March, down for the third consecutive day.
- Clear reversal from 100-DMA hurdle, downside break of previous weekly bottom joins bearish MACD signals to favor Euro bears.
- Downbeat RSI conditions suggest limited room towards the south, highlighting six-month-old ascending support line.
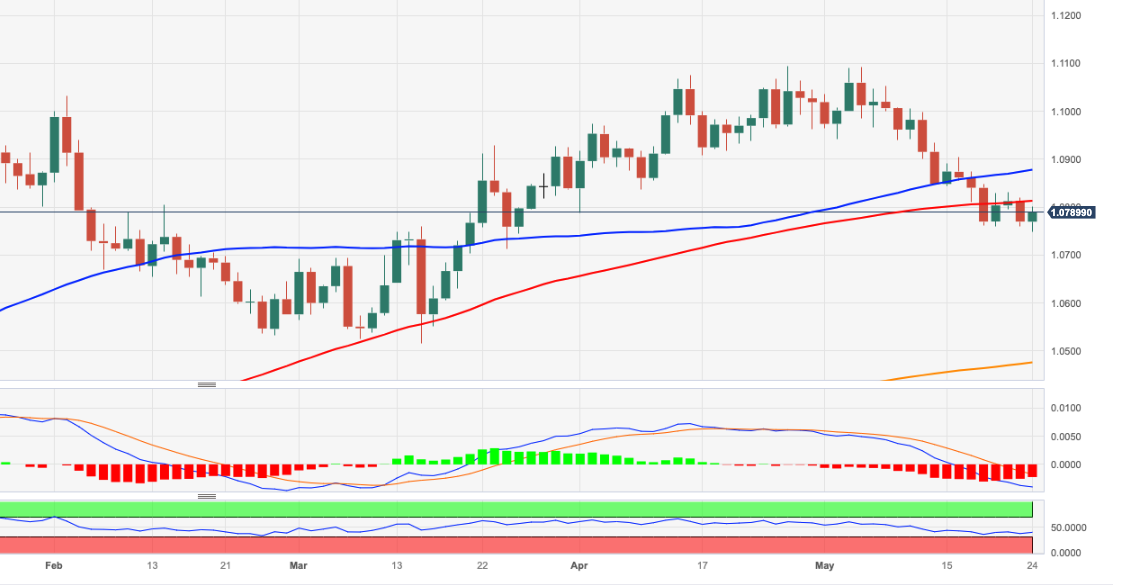
EUR/USD holds lower grounds as bears prod the 1.0750 mark after falling to the fresh low since late March during early Thursday in Asia. In doing so, the Euro pair drops for the third consecutive day while slipping beneath the weekly low, as well as the two-month bottom marked the last week.
It should be noted that the Euro pair’s U-turn from the 100-DMA hurdle and bearish MACD signals add strength to the bearish bias. However, the RSI (14) line is nearly oversold and hence suggests limited downside room before the next leg of the south run.
As a result, the EUR/USD bears are well set to break the 1.0750 support and approach the 1.0700 round figure. However, an upward-sloping support line from late November 2022, close to 1.0690 by the pres time, gains the market’s attention.
In a case where the Euro pair breaks the aforementioned support line, the odds of witnessing a slump toward March’s low of 1.0515 and then toward the yearly low marked in January near 1.0480 can’t be ruled out.
On the other hand, a daily closing beyond the 100-DMA level of 1.0815 isn’t an open welcome for the EUR/USD bulls as the previous support line from September 2022, around 1.0920 at the latest, holds the key for the buyer’s entry.
Following that, the 1.1000 psychological magnet may act as an extra barrier for the Euro buyers targeting further upside of the pair.
EUR/USD: Daily chart
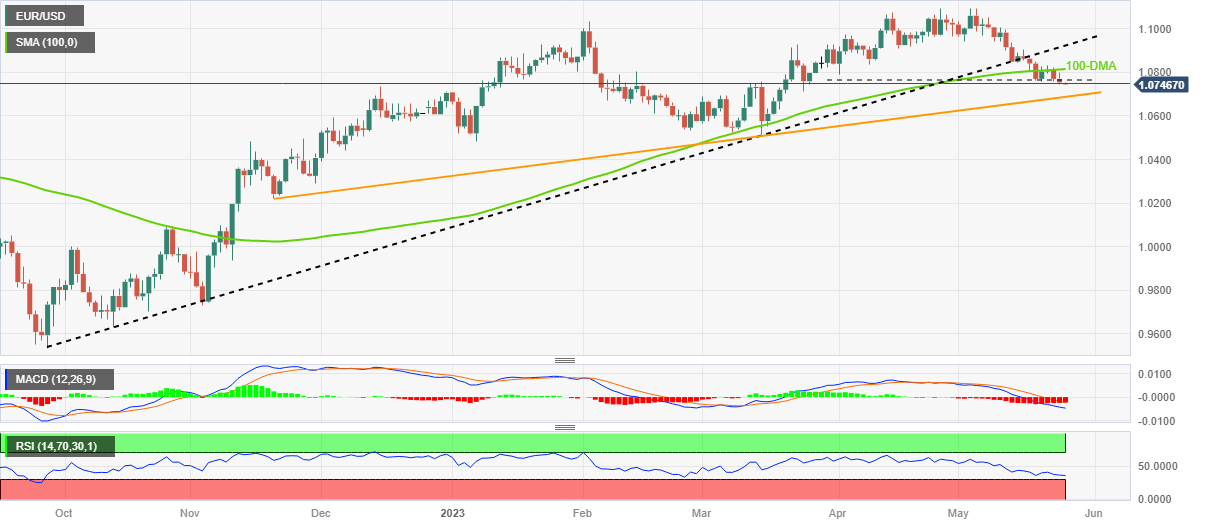
Trend: Limited downside expected
- GBP/USD is struggling in defending its downside amid sheer strength in the US Dollar Index.
- Republicans are not agreeing to the tax increase and higher spending proposed for the budget by congressional Democrats.
- GBP/USD is challenging the demand zone placed in a narrow range of 1.2344-1.2356.
The GBP/USD pair looks vulnerable above the immediate support of 1.2360 in the early Asian session. The Cable is struggling in defending its downside amid sheer strength in the US Dollar Index due to the long-awaited US debt-ceiling raise by the White House.
Wednesday’s negotiations on US borrowing cap issues remained positive among the White House and Republicans, however, the latter are not agreeing to tax increases and higher spending proposed for the budget by congressional Democrats.
S&P500 futures have added stellar gains in early Asia after a sell-off on Wednesday, portraying a recovery in the overall risk-off market mood.
The Pound Sterling remained in the spotlight after the release of the United Kingdom’s inflation data on Wednesday.
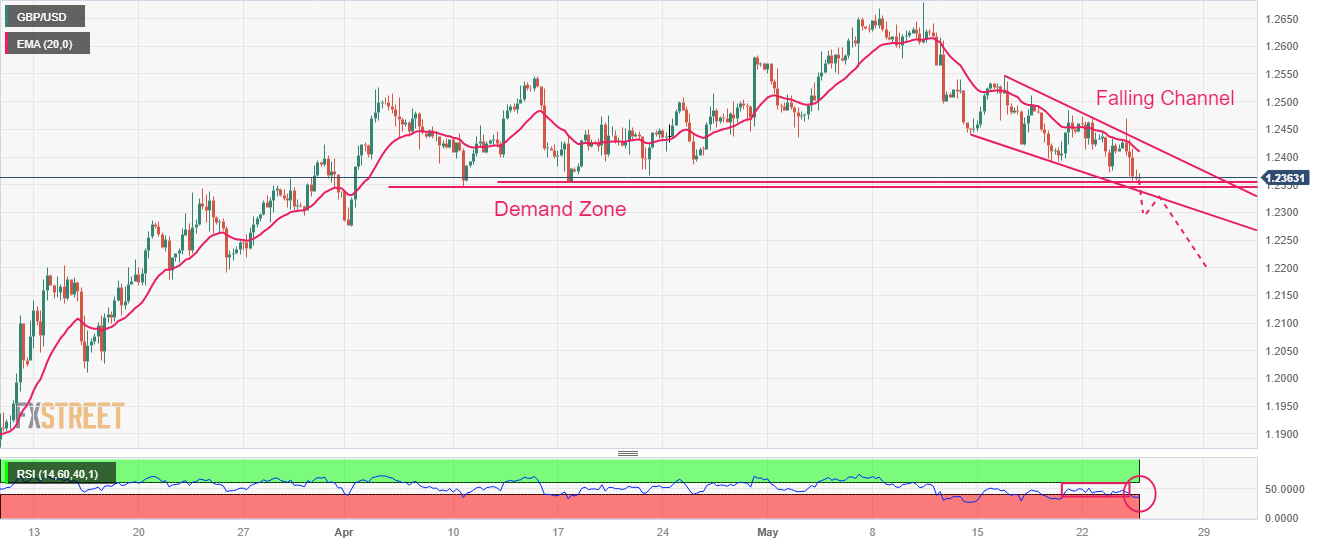
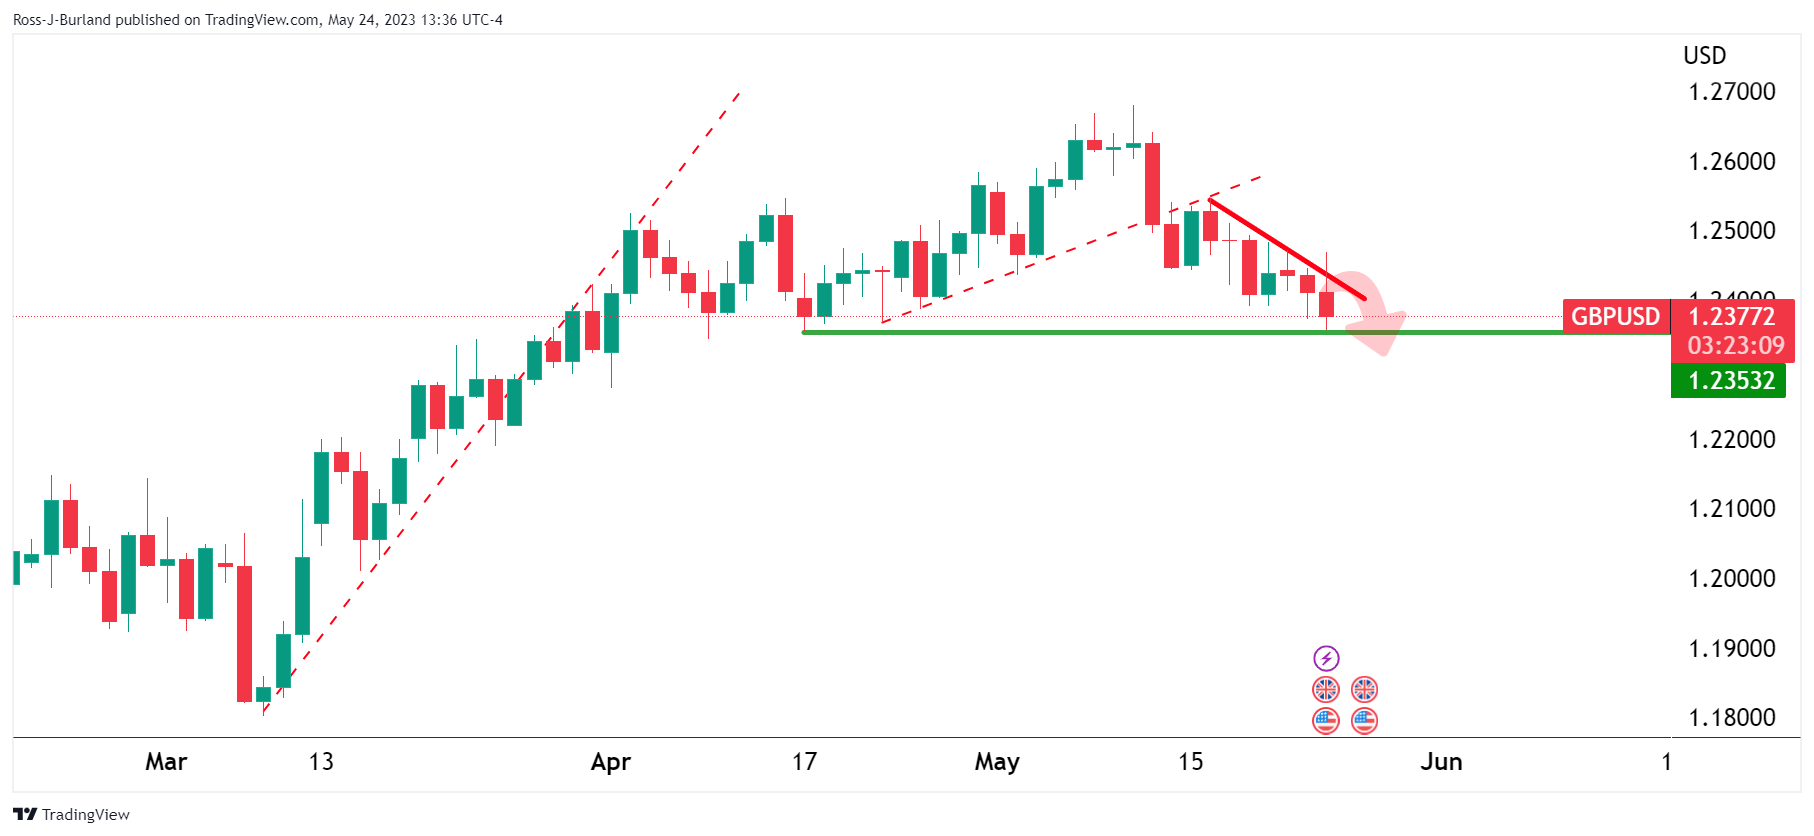
GBP/USD is challenging the demand zone placed in a narrow range of 1.2344-1.2356 on a four-hour scale. The Cable is auctioning in a Falling Channel chart pattern in which each pullback is considered a selling opportunity by the market participants.
The Pound Sterling bulls are consistently facing barricades from the 20-period Exponential Moving Average (EMA) around 1.2412.
Meanwhile, the Relative Strength Index (RSI) (14) has slipped into the bearish range of 20.00-40.00, which indicates that the downside momentum has been triggered.
Should the asset decline below April 10 low at 1.2344, US Dollar bulls will get strengthened further and will drag the Cable toward April 03 low at 1.2275, followed by March 14 high at 1.2204.
On the flip side, a recovery move above May 09 high at 1.2640 will drive the major toward the round-level resistance at 1.2700 and 26 April 2022 high at 1.2772.
GBP/USD four-hour chart
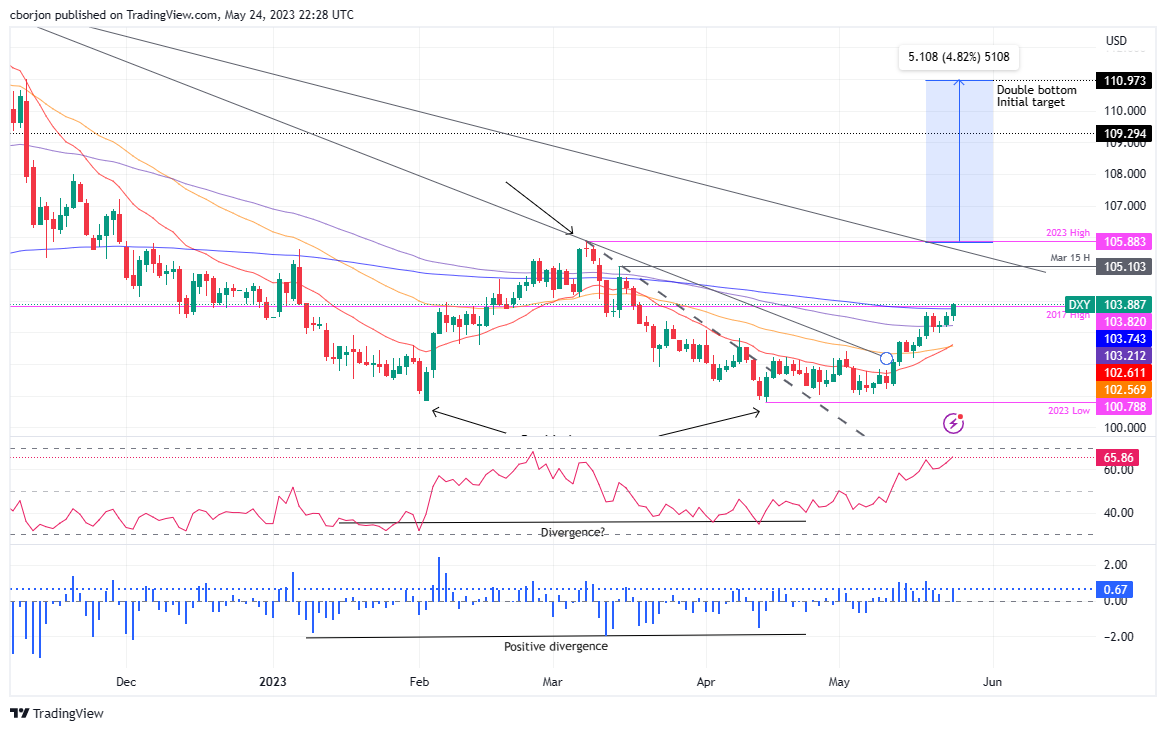
- The US Dollar Index (DXY) gains 0.36%, trading at 103.888, maintaining a rally for three days and surpassing the 200-day EMA.
- DXY must hit 105.883 YTD high to confirm the double-bottom pattern, surpassing multiple resistances.
- Potential risks lie beneath the 200-day EMA; breaking it may lead DXY toward 100-day EMA at 103.212 and May 22's 102.964 low.
The US Dollar Index (DXY), which measures a basket of six currencies against the US Dollar (USD), rallies for three straight days, reclaims the 200-day Exponential Moving Average (EMA) at 103.743 and is also exchanging hands above the 2017 yearly high of 103.820. At the time of writing, the DXY is trading hands at 103.888, gaining 0.36%, with bulls eyeing the 104.000 mark.
US Dollar Index Price Analysis: Technical outlook
From a daily chart perspective, the US Dollar Index is neutral to bullish biased, but it could cement its bias as bullish once the DXY achieves a decisive break above the 200-day EMA. It should be said that the double-bottom that emerged in the weekly chart, as I wrote in a news article on April 14, US Dollar Index: Could a double bottom at the weekly chart drive the DXY to 111.000? remains in play.
However, to validate the double-bottom chart pattern, the DXY must get to the year-to-date (YTD) high of 105.883, though the greenback needs to hurdle some resistance levels on its way up. Meanwhile, the Relative Strength Index (RSI) indicator is in bullish territory, with some room before hitting overbought levels, while the 3-day Rate of Change (RoC) suggests that buyers are gathering momentum.
If the DXY reclaims 104.000, the next resistance level to test would be the March 15 daily high of 105.103. Break above, and the DXY will have a clear run toward testing an eight-month-old resistance trendline around the 105.300-600 area, ahead of piercing the YTD high at 105.883
Downside risks for the DXY remain below the 200-day EMA, which could send the greenback sliding towards the 100-day EMA at 103.212. A clear break will send the DXY toward the May 22 swing low of 102.964, slightly below the 103.000 mark.
US Dollar Index Price Action – Daily chart
“The committee was confident in the level of restrictiveness of interest rates at the present point,” said Reserve Bank of New Zealand (RBNZ) Governor Adrian Orr to New Zealand government Finance and Expenditure Committee on late Wednesday.
Key quotes
They (interest rates) are well above what we would consider neutral, are constraining spending and investment.
There were indicators consumer spending and aggregate demand as a whole were easing and in some places were falling in real terms.
The committee is confident monetary policy is restrictive and doing its job.
The central bank never rules out the need to change that view.
NZD/USD stays depressed
NZD/USD holds lower grounds near early March levels, after falling the most since early February the previous day, defensive near 0.6100 by the press time.
“I expect to see stress in the jobs market when inflation is falling toward target,” said Federal Reserve (Fed) Bank of Atlanta President Raphael Bostic late Wednesday in a media interview shared by Marketplace per Reuters.
Additional comments
FOMC will base its interest rate decisions on data.
Fed does not want to be locked into a pre-determined rate path.
Its problematic for the economy if the Fed doesn't achieve 2% inflation target.
Best case scenario is the Fed will not consider a rate cut well into 2024.
Market reaction
EUR/USD remains on the backfoot around 1.0747 following the news, down for the third consecutive day to around fresh two-month lows.
Also read: Fed's Waller: Need to maintain flexibility on best policy decision for June meeting
“The US House of Representatives will go on recess on Thursday as planned and members will be given 24 hours notice to return to Washington if a deal on raising the debt limit is reached,” said US House Majority Leader Steve Scalise on Wednesday.
The news also adds that members will get 72 hours to read any debt ceiling bill.
Even so, US House Speaker Kevin McCarthy also said that they (policymakers) could get a debt agreement in principle this weekend.
Market implications
The news adds to the market’s fears of a delay in getting the US debt ceiling extension deal, which in turn allows the US Dollar to remain firmer. That said, the US Dollar Index (DXY) rose for the third consecutive day to mark the highest levels since March 20 on Wednesday.
Also read: Forex Today: Dollar strengthens further, Kiwi tumbles
- USD/CAD is building a base for a break above 1.3600 as US debt-ceiling issues have not been resolved yet.
- The release of the dovish interest rate guidance in FOMC minutes failed to impact US Dollar’s rally.
- An upside of the oil price seems restricted around $74.50 despite the US EIA having reported a sharp drawdown in oil inventories.
The USD/CAD pair is showing a back-and-forth action after reaching near the round-level resistance of 1.3600 in the early Toyo session. The Loonie asset is expected to add more gains as the US Dollar Index (DXY) is aiming to extend the upside further towards 104.00.
S&P500 witnessed a sell-off on Wednesday as fears of a US default are deepening further. Negotiations among the White House and Republicans remained positive on Wednesday, according to House of Representatives Speaker Kevin McCarthy, however, until an agreement of bipartisan remains absent, investors would remain worried. Therefore, the overall market mood is quite negative.
The US Dollar Index (DXY) has refreshed its two-month high above 103.92 as the United States economy is swiftly approaching a default situation. Although developments over US borrowing cap negotiations remained positive, the White House accused Republicans of taking the economy hostage to advance an agenda they could otherwise not pass, as reported by Reuters.
Meanwhile, the release of the dovish interest rate guidance in Federal Open Market Committee (FOMC) minutes failed to impact US Dollar’s rally. The FOMC minutes cleared that Federal Reserve (Fed) policymakers agreed that more interest rate hikes are less certain due to a potential banking crisis.
On the oil front, the upside of the oil price seems restricted around $74.50 despite the United States Energy Information Administration (EIA) has reported a sharp drawdown in oil inventories for the week ending May 19. The oil stockpiles dropped by 12.456 million barrels while the street was anticipating a mild build-up.
It is worth noting that Canada is the leading exporter of oil to the United States and restrictions on the upside for the oil price will have an impact on the Canadian Dollar.
- Gold price bears the burden of firmer United States Treasury bond yields, US Dollar.
- US debt ceiling talks’ impasse, hawkish Federal Reserve talks allow T-bond yields, USD to grind higher, weigh on XAU/USD.
- Risk catalysts, second-tier US data eyed for clear directions of the Gold Price.
Gold Price (XAU/USD) remains pressured at weekly low, surrounding the key support juncture, as bears keep the reins around $1,957 during early Thursday in Asia. In doing so, the bright metal bears the burden of the firmer United States Treasury bond yields and the US Dollar amid market’s fears of the US default, as well as indecision about the Federal Reserve’s (Fed) next move.
Gold Price drops on United States default fears
Gold price holds onto its bearish trajectory and is likely to register the third consecutive weekly loss amid fears that the United States policymakers won’t be able to avoid the ‘catastrophic’ default. Adding strength to the XAU/USD’s downside is the indecision surrounding the Federal Reserve’s (Fed) next move.
On Wednesday, US House Speaker Kevin McCarthy said that they are sending their negotiators to the White House to try and finish up debt-limit talks. On the same line, US Treasury Secretary Janet Yellen said that that they will try to increase the level of precision on the date and noted that there will be some obligations that they will not be able to pay. Also reports took rounds that the US House members will go back to their homes after Thursday, to cheer the long weekend, before resuming the debt ceiling negotiations, which in turn will escalate the fears of no deal before late May.
On the other hand, Minutes of the latest Federal Open Market Committee (FOMC) Meeting suggested that the policymakers aren’t on the same table as some suggests its appropriate to hike the rates while the others advocate for a policy pivot. Recently, Federal Reserve (Fed) Bank of Atlanta President Raphael Bostic said, “’We’re right at the beginning of the hard part’ of taming inflation.”
Against this backdrop, the US Dollar Index (DXY) rose for the third consecutive day to mark the highest levels since March 20 while the benchmark US Treasury bond yields also rose to the mid-March highs. That said, Wall Street closed in the red and the same exerted downside pressure on the Gold price.
Moving on, the US weekly Jobless Claims, second reading of the Q1 GDP estimate, the Chicago Fed National Activity Index and Pending Home Sales are on the economic calendar to entertain the Gold traders. However, major attention will be given to the United States debt ceiling drama for clear directions.
Gold Price Technical analysis
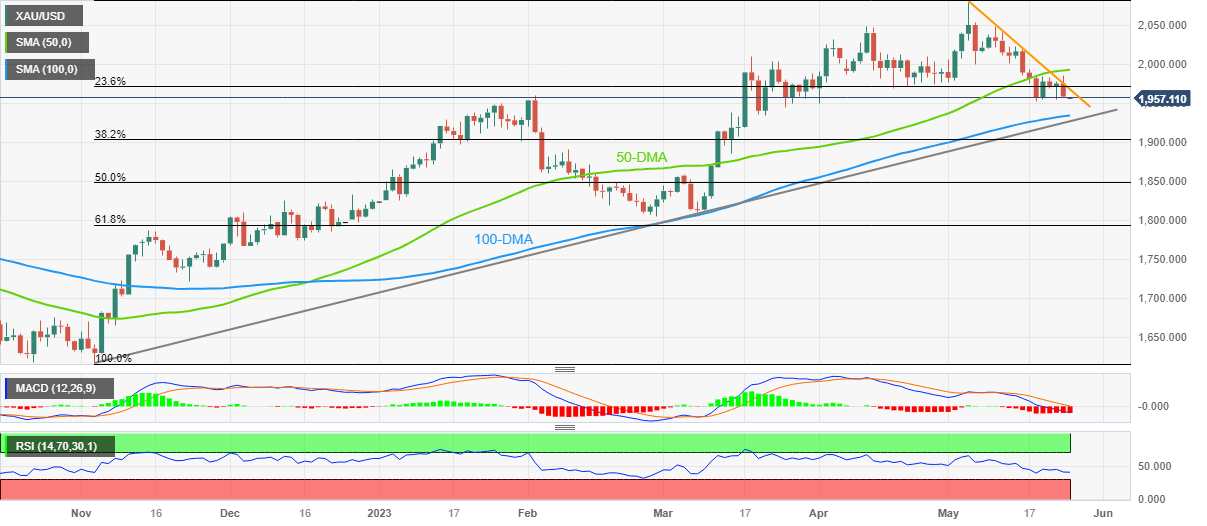
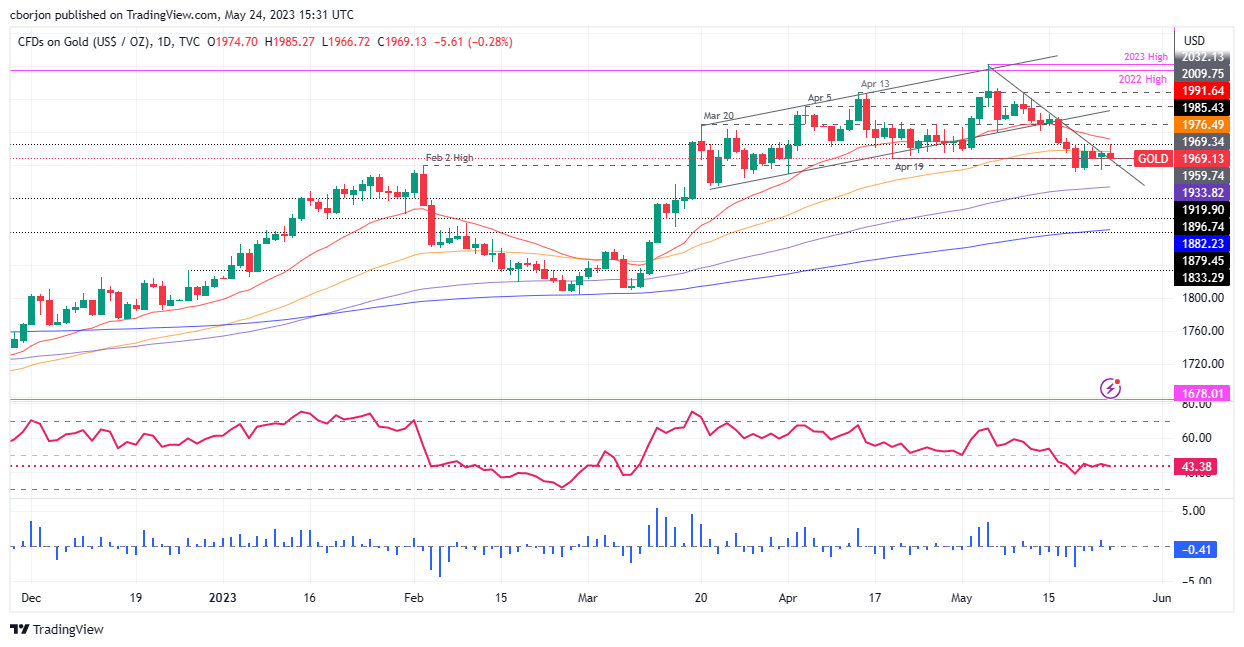
Gold price extends pullback from a three-week-old descending resistance line as it prods the monthly low of around $1,952, quickly followed by January’s peak of around $1,950.
It’s worth noting that the XAU/USD’s sustained trading below the 50-DMA joins the bearish signals from the Moving Average Convergence and Divergence (MACD) indicator to keep the sellers hopeful. However, the below 50.0 levels of the Relative Strength Index (RSI) line, placed at 14, suggests limited downside room for the quote.
As a result, the odds of the Gold price rebound from the 100-DMA support of $1,933, in case the quote breaks the $1,950 support, are higher. If at all the XAU/USD breaks the 100-DMA support, an upward-sloping support line from early November, close to $1,924, will be the key to watch for clear directions.
On the contrary, a daily closing beyond the stated resistance line of near $1,968 needs validation from the 50-DMA resistance of $1,992, as well as the $2,000 round figure, to convince the Gold buyers.
Even so, April’s high of $2,048 and the $2,050 round figure may prod the XAU/USD upside before challenging the record top marked earlier in the month around $2,080.
Overall, the Gold price remains on the bear’s radar below the $2,000 mark but the downside room appears limited.
Gold price: Daily chart
Trend: Further downside expected
- NZD/USD bears throw in the towel at fresh cycle lows.
- FOMC minutes rescue the bird from a dovish RBNZ outcome.
NZD/USD dropped out of the sky on Tuesday and made fresh lows on Wednesday on the back of the Reserve Bank of New Zealand. The pair fell from a high of 0.6256 and to a low of 0.6093.
´´The Kiwi remains on the back foot after getting slaughtered in the wake of yesterday’s extraordinary dovish RBNZ MPS, which suggests, on the face of it that the RBNZ feels it has done enough to tame inflation,´´ analysts at ANZ Bank explained.
´´While markets were taken aback, they haven’t fully bought into it, with the risk of another hike still priced in, but it’s forced a complete re-think for the Kiwi,´´ the analysts added.
´´On the one hand, the decision took away about 40bp of carry we thought we’d get (markets were pricing in a 5.9% peak in the OCR and the RBNZ is at 5.5%), but on the other, the NZD is still the only G10 currency that offers carry vs the USD, and that won’t be missed by anyone who wants to short the USD. So, even though the Kiwi’s pride has taken a hit, it’s still #1 in the carry stakes. That’s a positive,´´ the analysts concluded.
Meanwhile, the Federal Open Market Committee minutes on Wednesday showed that the board members agreed that inflation risks are still unacceptably high but officials also generally agreed that the extent of further hikes are less certain.
FOMC minutes, key notes
- Some participants commented that additional policy firming would likely be warranted at future meetings.
- Some participants stressed it was crucial that policy that the statement not signal the likelihood of rate cuts this year or rule out further hikes.
- Fed staff continue to forecast mild recession starting later this year, followed by a modestly-paced recovery.
- Several participants said if the economy evolved along lines of their outlooks, further policy firming might not be needed.
- Participants generally agreed that the extent to which further interest rate hikes may be appropriate had become less certain.
- Many participants focused on need to retain optionality after May meeting.
- Participants judged that the banking sector stress would likely weigh on economic activity but to an uncertain extent.
- Participants agreed that inflation was unacceptably high, and are declining slower than they had expected.
- Some participants noted concerns that the Federal debt limit may not be raised in a timely manner, threatening significant financial system disruptions, and tighter financial conditions.
Overall, the Fed minutes show officials were split on support for more hikes, resulting in a muted reaction in markets, throwing the bird a lifeline.
- USD/MXN drops over 0.85%, snapping a six-day losing streak for the Mexican Peso amid negative market sentiment and US debt ceiling negotiation woes.
- The peso strengthened despite domestic uncertainty due to recent government actions, including the Grupo Mexico rails’ seizure.
- The latest Federal Reserve minutes reveal a divide among officials over future rate hikes, weakening the US Dollar.
The Mexican Peso (MXN) stages a comeback, snaps six days of losses, as the USD/MXN drops more than 0.85%, amidst deteriorated market sentiment, alongside uncertainty in talks of the US debt ceiling. Additionally, staff at the US Federal Reserve, projecting a mild recession toward the end of the year, weighed on the US Dollar (USD) vs. the MXN. At the time of writing, the USD/MXN exchanges hands at 17.8108, below its opening price.
Concerns over US debt ceiling talks and Federal Reserve projections weigh on USD, boosting MXN
USD/MXN resumed its downward trajectory after weakening since Monday, as over the weekend developments with the Mexican Government seizing rails owned by Grupo Mexico spurred a wave of uncertainty amongst the national and international business community. That, alongside expropriating private land in the State of Mexico, just three days after the Navy occupied Grupo Mexico’s railroads, weakened the Mexican Peso, as the USD/MXN reached a new weekly high of 17.9976.
Nevertheless, the USD/MXN retraced from weekly highs, despite recent developments surrounding German Larrea, Grupo Mexico’s owner, which withdrew from a bid to purchase Citibanamex, quoting worries that the Mexican Government could take it away from him. Mexican branch of Citigroup
The USD/MXN fell shy of testing the 18.0000 figure and dropped to a two-day new low of 17.7659 before reclaiming above the 20-day Exponential Moving Average (EMA) at 17.8010.
Aside from this, the latest minutes of the Federal Reserve showed that although officials voted for a quarter of a percentage increase to the Federal Funds Rate (FFR) for some of them, it would be the last hike; other members cautioned that some flexibility is needed. The minutes showed that Fed policymakers emphasized that no cuts are expected in the year while maintaining the chances for additional tightening if required.
As discussions resumed on Wednesday, little progress has been made regarding the US debt-ceiling discussions between the White House and the US Congress.
USD/MXN Price Analysis: Technical outlook
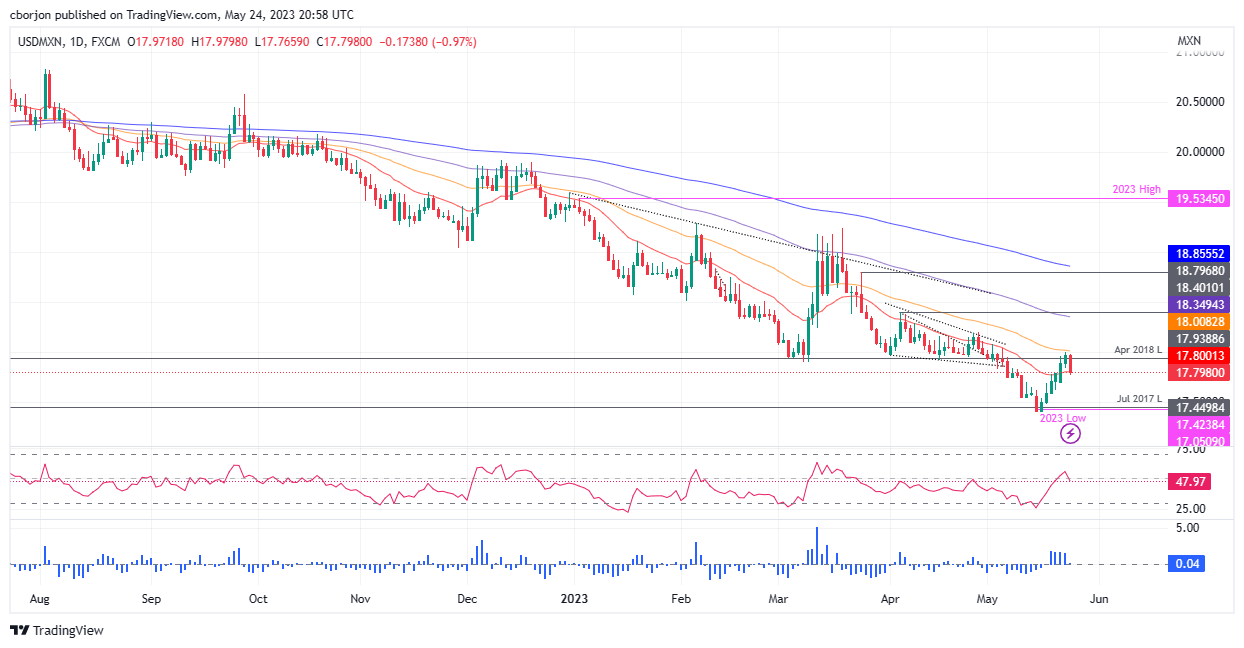
USD/MXN has shifted neutrally biased, as the Mexican Peso (MXN) weakened for six days. Even though upside risks lie at the 50-day EMA at 18.0167, failure to conquer the latter sends the USD/MXN plunging toward the 17.8000 area. The USD/MXN must reclaim the 20-day EMA at 17.8010 for a bearish continuation. Once cleared, the USD/MXN could dive toward the May 22 daily low of 17.6960 before diving to 17.5000. Conversely, if the USD/MXN stays above the 20-day EMA, the next resistance would be the confluence of the 50-day EMA and the 18.0000 figure. A breach of the latter will expose the 100-day EMA at 18.3495 before the USD/MXN reaches the April 5 daily high of 18.4010.
Market participants continue to digest the latest economic data, central bank decisions, and the FOMC minutes while awaiting news regarding the debt-ceiling drama. No major reports are due in the Asian session. Later in the day, Germany and the US will release new estimates for Q1 GDP. The weekly Jobless Claims report is also due in the US.
Here is what you need to know on Thursday, May 25:
The US Dollar Index rose for the third consecutive day and recorded its highest daily close since March 17, just below 104.00. The ongoing risk aversion sentiment continues to support the US Dollar. Wall Street indexes experienced another drop, with the Dow Jones falling 0.77% and reaching its lowest level since late March. The unresolved issue of the debt ceiling remains a concern for investors as negotiations continue in Washington without reaching a deal.
Minutes from the latest FOMC meeting revealed a division among members regarding the future path of monetary policy tightening. Some members highlighted the need for further rate hikes, while others argued that additional tightening may not be necessary after this meeting. The US Dollar maintained its gains following the release of the minutes. On Thursday, economic reports from the US will include the weekly Jobless Claims, a new Q1 GDP estimate, the Chicago Fed National Activity Index, and Pending Home Sales.
EUR/USD continued to drop, hitting two-month lows below 1.0750. The pair is currently trading below the 20-week Simple Moving Average for the first time since November. On Thursday, Germany will report a new estimate of Q1 GDP.
In the UK, data showed that inflation dropped to 8.7% in April, the lowest level since March 2022, but still higher than the market consensus of 8.2%. GBP/USD staged a short-lived recovery but then continued its downward movement, falling to one-month lows near 1.2360.
Analysts at TD Securities wrote:
Today's inflation data was a shocker. Core inflation is proving far more persistent than expected, and the UK is now a clear outlier vs other major economies. As a result, we now expect two more rate hikes from the BoE, taking its terminal rate to 5.00% in August. Risks of further hikes beyond August remain on the table should inflation and employment data not cool.
USD/JPY broke above 139.00 and jumped to 139.40, reaching its highest level in almost six months. This surge was driven by higher US bond yields, which strengthened the US Dollar against the Japanese Yen. On Friday, Japan will release inflation data.
The Reserve Bank of New Zealand (RBNZ) raised interest rates by 25 basis points to 5.5% and signaled an end to monetary policy tightening. As a result, the Kiwi tumbled, extending its losses throughout the day. The currency was the worst performer, with NZD/USD losing over a hundred pips and falling to 0.6100. Meanwhile, AUD/NZD surged above 1.0700.
AUD/USD also succumbed to the strength of the US Dollar and was further dragged down by the Kiwi's decline, technical factors, and a slide in commodities. Breaking through the 0.6570/80 support area, the pair plummeted to as low as 0.6528.
USD/CAD finally broke out of its consolidation phase and experienced a bullish move towards 1.3600 after several days. The upside was limited by another increase in crude oil prices, with the WTI barrel rising 1.40% to $74.00.
The Mexican Peso outperformed on Wednesday, with USD/MXN falling almost 1% and pulling back towards 17.75, thereby erasing most of its recent losses.
The South African Reserve Bank (SARB) will have its meeting on Thursday, and analysts anticipate a 50 basis point interest rate hike to 8.25% due to the recent slide in the value of the South African Rand. Meanwhile, the Central Bank of Turkey is expected to keep its interest rates unchanged at 8.50% ahead of the presidential runoff elections on Sunday. The Bank of Korea and Bank Indonesia are expected to keep their interest rates unchanged at 3.50% and 5.75%, respectively.
Gold reversed its gains, dropping from $1,985 back below $1,960 and remaining under pressure. Silver also experienced a decline and was testing the $23.00 level. Cryptocurrencies witnessed a sharp drop, with Bitcoin falling over 3% and settling around $26,300.
Like this article? Help us with some feedback by answering this survey:
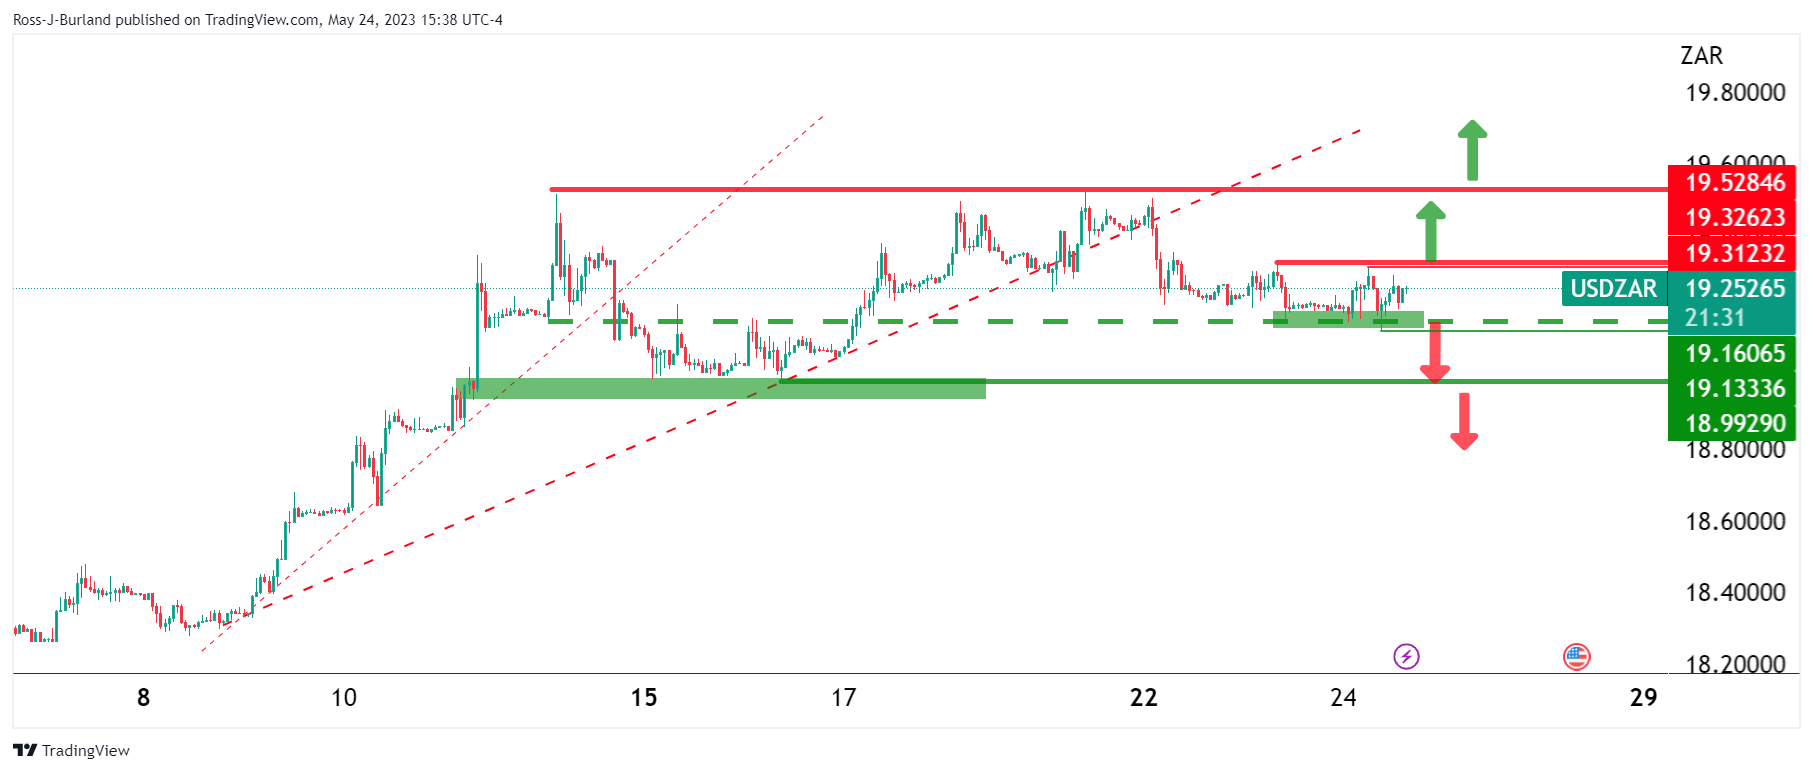
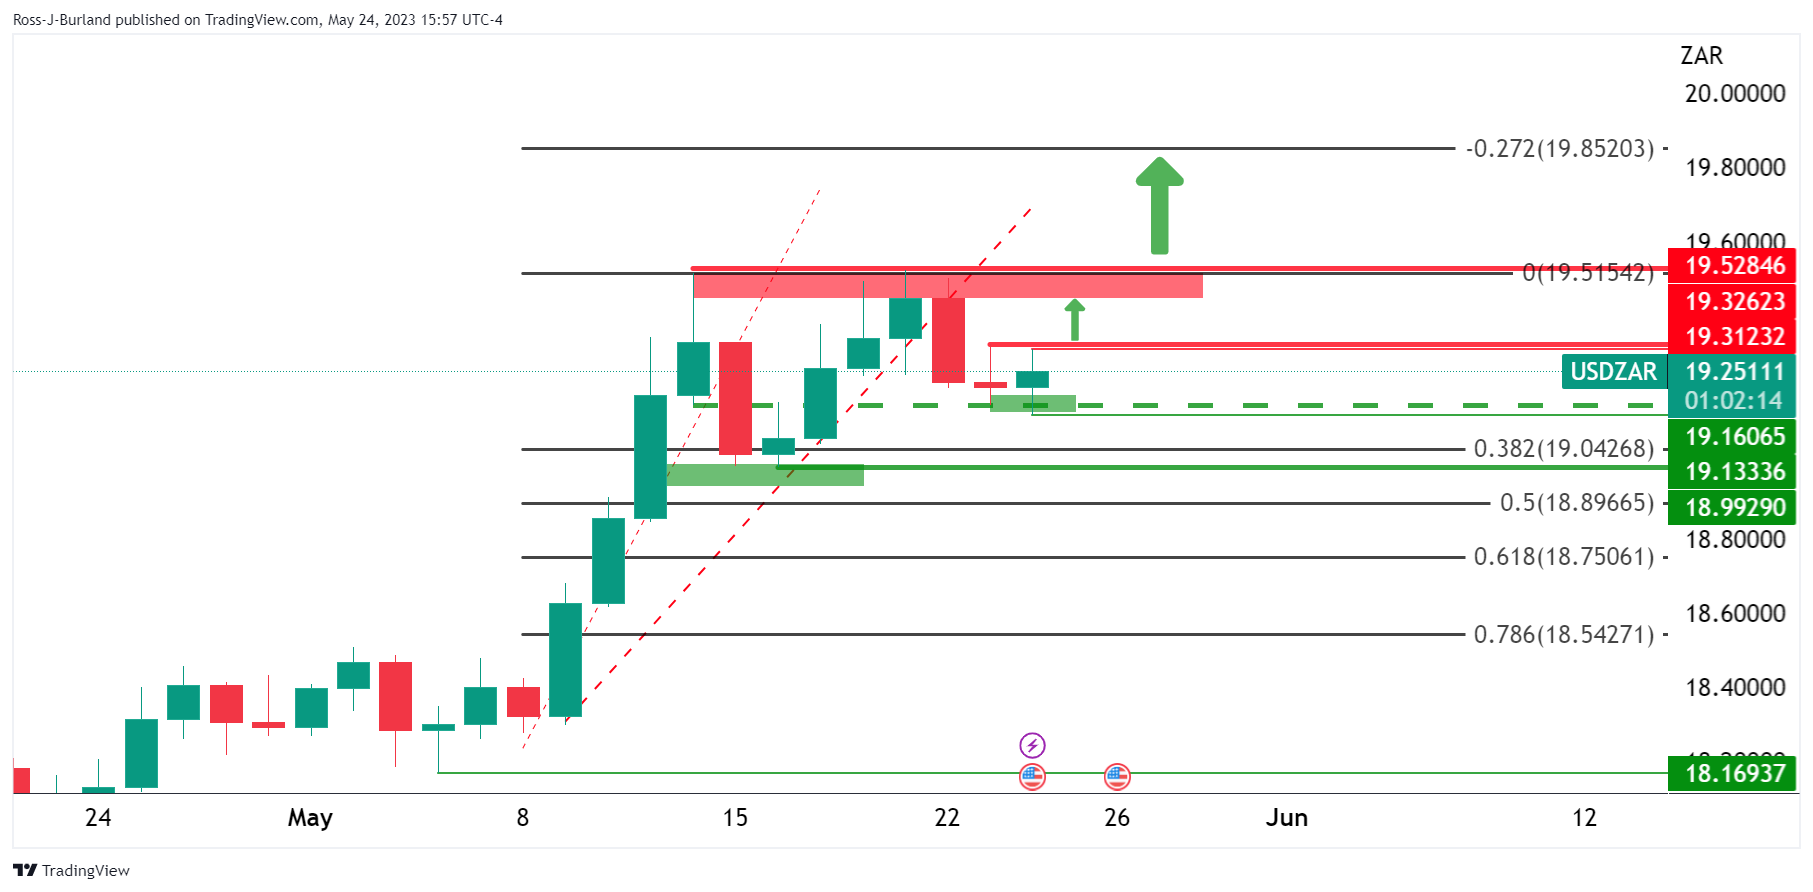
- USD/ZAR bulls eye a bullish continuation on the break of consolidation.
- USD/ZAR bears eye a move into the bullish rally.
USD/ZAR is trading between 19.3123 and 19.1606 in the near term and within a sideways market range of 18.9929 and 19.5285. However, there is a bearish bias while below 19.3123 that will increase on a break of the various supports as illustrated on the following chart:
USD/ZAR H1 chart
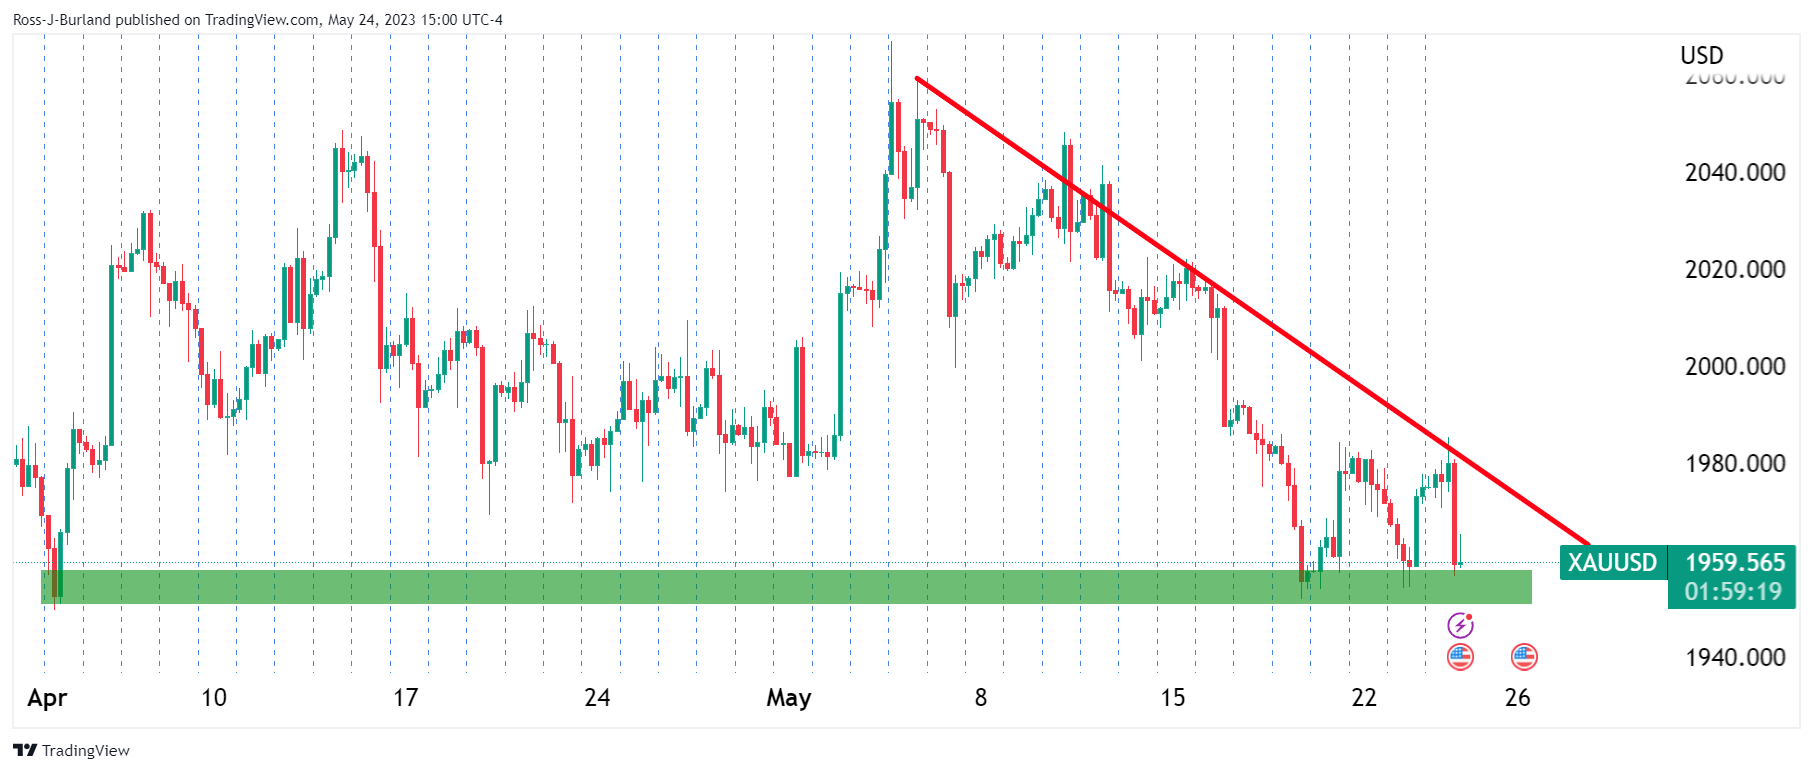
USD/ZAR has been rising from the lows of May near 18.1693 but should ZAR harden, the longs will be put under heat in a long squeeze.
USD/ZAR daily chart
On the other hand, we could easily see a bullish continuation with the bullish bias intact on a break of 19.3262 and 19.5285:
- Gold price is attempting to move lower into support following FOMC minutes.
- Fed minutes show officials split on support for more hikes.
The Gold price is mixed around the Federal Open Market Committee minutes that showed that the board members agreed that inflation risks are still unacceptably high but officials also generally agreed that the extent of further hikes are less certain. Gold price has ranged between a low of $1,961 and a high of $1,965 so far around the event but has traveled in a wider range of between $1,956.77 and $1,985.39 on the day so far.
FOMC minutes, key notes
- Some participants commented that additional policy firming would likely be warranted at future meetings.
- Some participants stressed it was crucial that policy that the statement not signal the likelihood of rate cuts this year or rule out further hikes.
- Fed staff continue to forecast mild recession starting later this year, followed by a modestly-paced recovery.
- Several participants said if the economy evolved along lines of their outlooks, further policy firming might not be needed.
- Participants generally agreed that the extent to which further interest rate hikes may be appropriate had become less certain.
- Many participants focused on need to retain optionality after May meeting.
- Participants judged that the banking sector stress would likely weigh on economic activity but to an uncertain extent.
- Participants agreed that inflation was unacceptably high, and are declining slower than they had expected.
- Some participants noted concerns that the Federal debt limit may not be raised in a timely manner, threatening significant financial system disruptions, and tighter financial conditions.
Overall, the Fed minutes show officials were split on support for more hikes. As such, the market is directionless.
Meanwhile, analysts at TD Securities explained that the debt ceiling headlines are noisy, but there is still signal in the noise.
´´Gold prices managed to rally yesterday despite headwinds from a rising broad dollar, which reveals notable demand behind the scenes. This fits into our view for imminent selling exhaustion in precious metals. In fact, we argue the positioning set-up is favorable for gold bulls, which have kept their position sizes contained, whereas systematic trend followers still hold a high bar for additional CTA liquidations,´´ the analysts explained.
´´Importantly,´´ they said, ´´discretionary traders have yet to buy into the rally, which contrasts with the typical recessionary playbook.´´
´´Meanwhile, pressure on the banking sector is persisting, and data is likely to moderate further and drive expectations for a deepening cutting cycle on the horizon. Recent liquidations and short acquisitions may ultimately add dry-powder for additional price gains,´´ the analysts concluded.
Gold technical analysis
The Gold price is testing the support structure, but while below the trendline resistance, the bias is bearish:
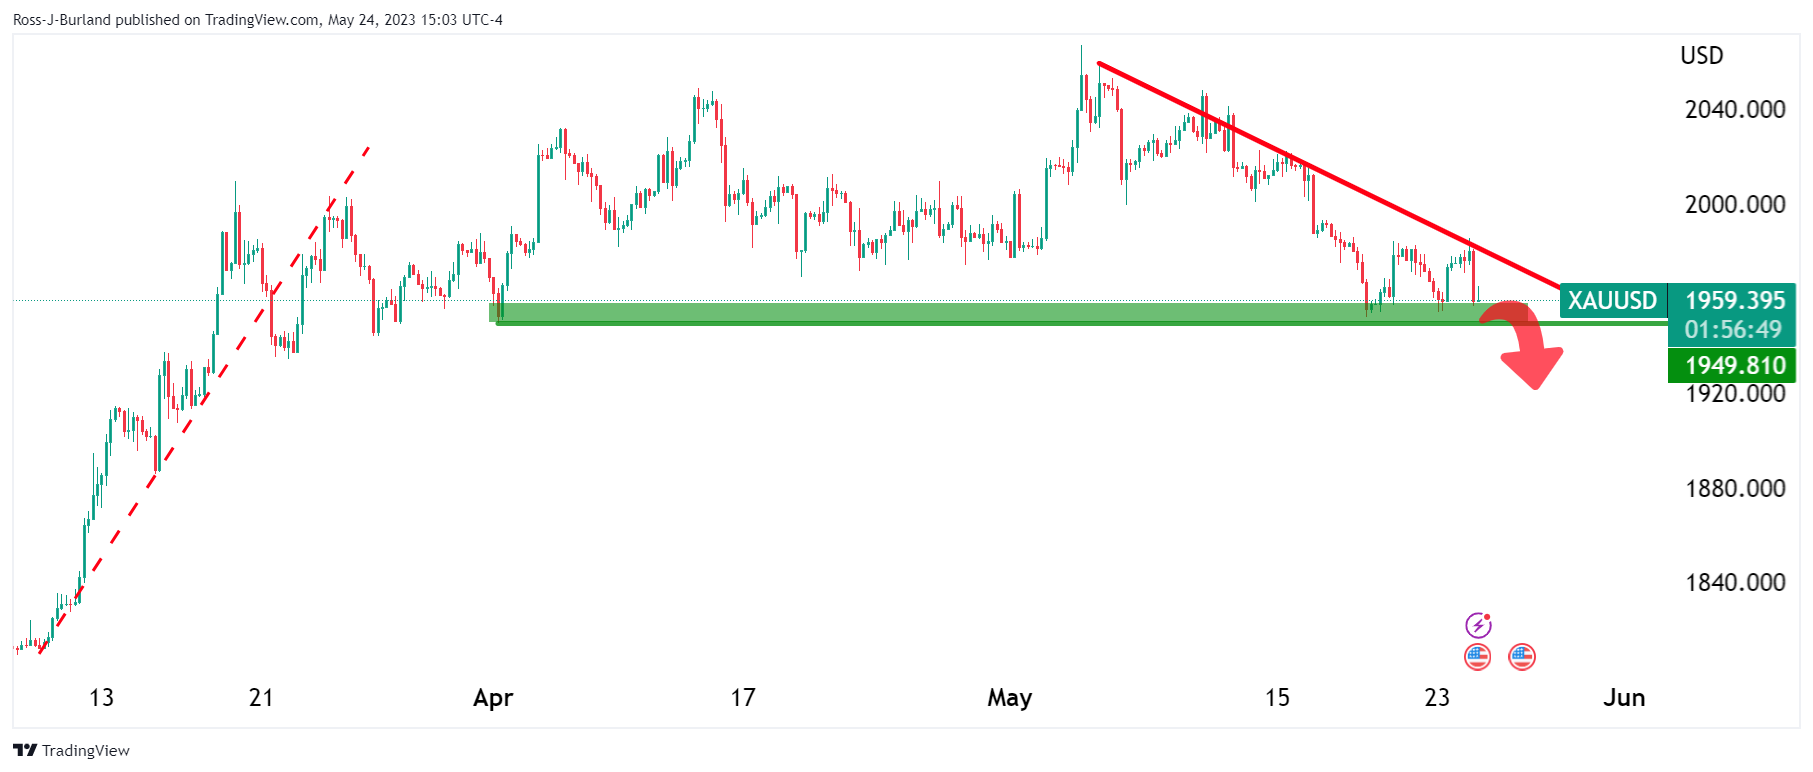
Bears will need to get below $1,950 to confirm the prospects of a continuation into the longs that were building since March.
- AUD/USD remains downward pressured as Fed minutes reveal uncertain future for rate hikes.
- While some Fed officials see the May meeting’s 25 bps rate hike as potentially the last, others caution on the need for flexibility in future meetings.
- Although rate cuts seem unlikely in the near term, policymakers emphasize the need to remain open to rate hikes if necessary, stressing transparency in communication.
AUD/USD prolonged its fall after hitting a new year-to-date (YTD) low of 0.6529. It remains under downward pressure as the Federal Reserve Open Market Committee (FOMC) revealed its May minutes, which showed an uncertain scenario for further tightening. This hints the US central bank is open to holding rates unchanged if needed. At the time of writing, the AUD/USD is trading at 0.6542.
May FOMC’s minutes show uncertainty amongst Fed officials over future hikes
The recently released meeting minutes of the Federal Reserve’s May gathering shed light on the prevailing uncertainty among policymakers. While some officials approved a 25 basis points rate hike, they emphasized that this could potentially be the last one. On the other hand, several policymakers cautioned that flexibility should be maintained in the upcoming meetings.
Officials expressed their belief that if the economy continues to progress “along the lines of their current outlooks,” further tightening of monetary policy may not be necessary beyond the present meeting.
The staff of the Federal Reserve presented projections indicating a mild recession towards the end of the year. They highlighted evidence that the cumulative effect of previous tightening measures has started to impact the economy. In particular, concerns were raised by “almost all participants” regarding the risks to economic growth as bank credit conditions tighten.
During the meeting, participants generally agreed that rate cuts were unlikely in the near term. However, they emphasized the need to remain open to the possibility of rate increases if the circumstances warrant it. In this regard, the importance of transparently communicating the Fed’s data-dependent approach to the public was underscored. The Federal Reserve aims to maintain flexibility in responding to evolving economic conditions by adopting a meeting-by-meeting approach after the May meeting.
AUD/USD reaction to the FOMC’s minutes
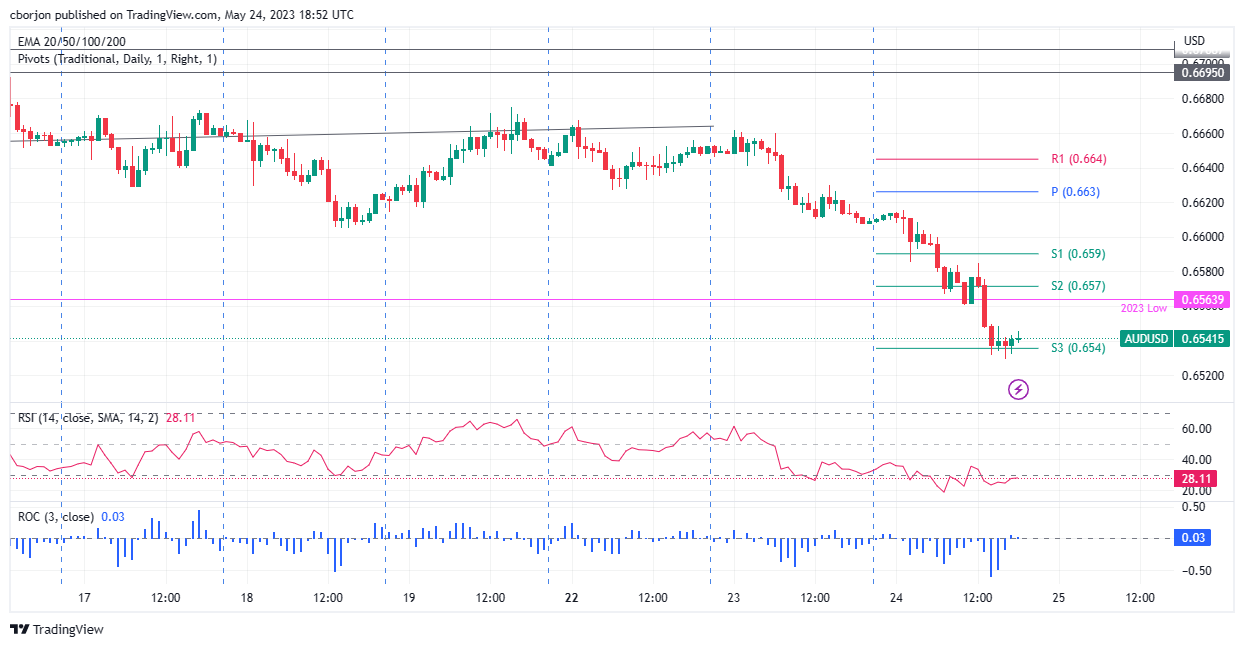
The AUD/USD reaction was muted, following the NZD/USD pair path, after the Reserve Bank of New Zealand (RBNZ) dovish rate hike. Hence, the AUD/USD clashed with the S3 daily pivot before reversing its downward course, and so far is aiming toward the 0.6550 area. Nevertheless, the AUD/USD is still operating with losses, with upside risks at the S2 pivot point at 0.6570, before testing the 0.6600 figure. Conversely, a bearish continuation could open the door for further losses, below the YTD low of 0.6529, like the 0.6500 figure.
- Some Fed officials suggest the May meeting’s 25 bps rate hike may be the last, stressing the need for flexibility in the face of economic changes.
- Federal Reserve staff project a mild recession late in the year, with tightening monetary policy beginning to impact the economy and heightened risks to growth.
- Despite the uncertainty, most participants deem rate cuts unlikely, maintaining the possibility of further rate increases if necessary.
USD/JPY extended its gains of more than 0.39%, as the latest Federal Reserve May meeting minutes showed that a scenario of more rate hikes was “less certain.” At the time of writing, the USD/JPY is trading at 139.05, pointing a new year-to-date (YTD) high of 139.38.
Minutes reveal a split among policymakers, stress the importance of flexibility in upcoming meetings
Fed’s May meeting minutes showed uncertainty amongst policymakers, with some approving the 25 bps rate hike, stressing that it could be the last, while others cautioned that some flexibility is needed at upcoming meetings. Officials stated that if the economy evolves “along the lines of their current outlooks, then further policy firming after this meeting may not be necessary.”
The staff of the Federal Reserve projects a mild recession late in the year, with officials “seeing evidence” that the cumulative tightening has begun to impact the economy, as “almost all participants” see risks to growth as bank credit tightens.
Most participants commented that no rate cuts are likely while keeping rate increases on the table if needed. “Participants emphasized the importance of communicating to the public the data-dependent approach.” Therefore, this confirms the meeting-by-meeting approach after the May meeting, and the US central bank will update its projections after the June 13-14 meeting,
USD/JPY’s reaction to the FOMC’s minutes
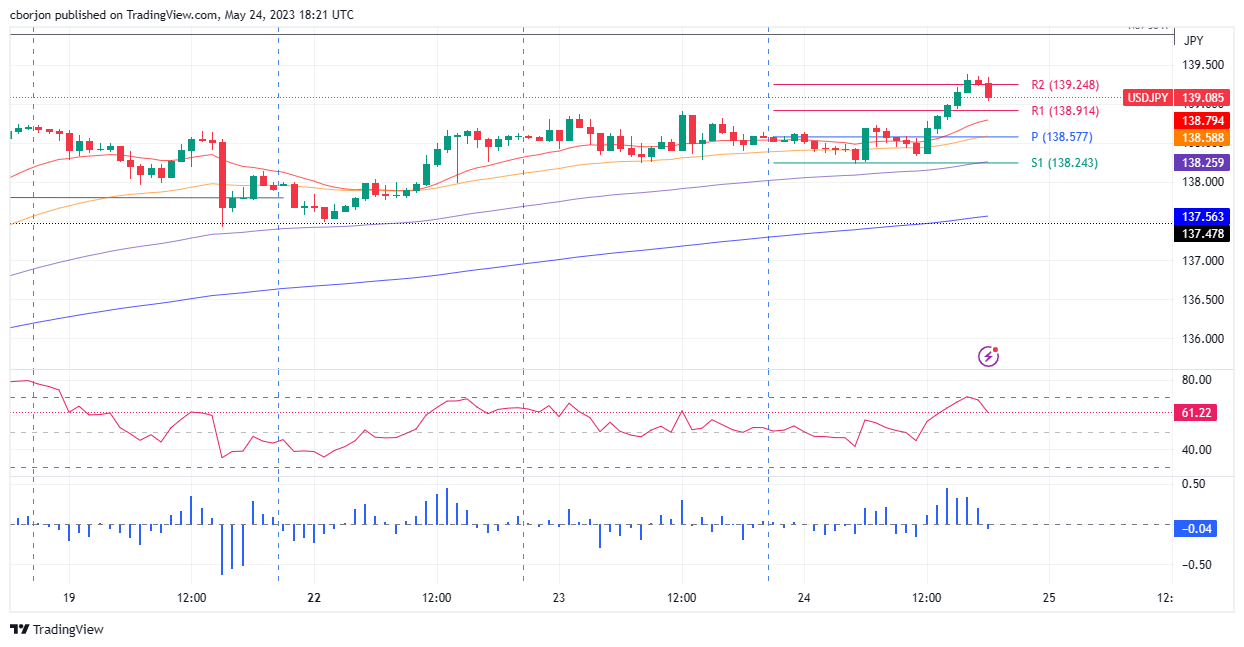
The USD/JPY reacted upwards and hit a new YTD high, above the R2 daily pivot, before pairing some of those gains, with the USD/JPY eyeing a test of the 139.00 figure. The Relative Strength Index (RSI) made a U-turn around the overbought area and heads downwards, while the 3-period Rate of Change (RoC) has dropped below the neutral area, suggesting that sellers may be gathering strength.
Upside risks lie at 139.38, which, once cleared, could pave the way toward 140.00. A bearish continuation is possible if USD/JPY dips below 139.00, exposing the R1 pivot at 138.91, followed by the central daily pivot point at 138.57, ahead of the 100-EMA at 138.25.
- EUR/USD bulls holding the fort in support territory after FOMC minutes.
- Fed minutes show officials split on support for more hikes.
EUR/USD is mixed on the Federal Open Market Committee minutes that show the board members agreed that inflation risks are still unacceptably high but officials also generally agreed that the extent of further hikes are less certain. EUR/USD was testing 1.0750 and the lows of the day on the knee-jerk but has since turned up into the 1.0760s in anew 15-min cnadle.
FOMC minutes, key notes
- Some participants commented that additional policy firming would likely be warranted at future meetings.
- Some participants stressed it was crucial that policy that the statement not signal the likelihood of rate cuts this year or rule out further hikes.
- Fed staff continue to forecast mild recession starting later this year, followed by a modestly-paced recovery.
- several participants said if the economy evolved along lines of their outlooks, further policy firming might not be needed.
- Participants generally agreed that the extent to which further interest rate hikes may be appropriate had become less certain.
- Many participants focused on need to retain optionality after may meeting.
- Participants judged that the banking sector stress would likely weigh on economic activity, but to an uncertain extent.
- Participants agreed that inflation was unacceptably high, and are declining slower than they had expected.
- Some participants noted concerns that the federal debt limit may not be raised in timely manner, threatening significant financial system disruptions, tighter financial conditions.
Overall, the Fed minutes show officials split on support for more hikes. As su8ch, the market is directionless.
EUR/USD technical analysis
EUR/USD is under pressure in the main but the FOMC minutes have not given the bears much in the way of any conviction and therefore, until the price can break 1.0720 convincingly, bulls could be encouraged. However, bulls will need to get above a slew of resistance and into the 1.08 areas, as per the 4-hour chart analysis:
- Federal Reserve released the minutes from its May 2-3 meeting, when it raised rates by 25 bps.
- The minutes showed a division on support for more rate hikes.
- US Dollar holds onto daily gains after minutes.
The Federal Open Market Committee (FOMC) released the minutes of the May 2-3 meeting, triggering a limited reaction across financial markets. According to the document, officials were split on support for more interest rate hikes. They agreed that inflation was still “unacceptably high,” and they continue to see a “mild recession” later this year.
In May, the Federal Reserve (Fed) raised the key interest rates by 25 basis points to 5.00% - 5.25%, as expected. The central bank hinted at a potential pause at the June 13-14 meeting. Since the May meeting, economic data from the US has been mixed, but far from indicating a recession. The Consumer Price Index (CPI) slowed to 4.9% in April; however, the Core CPI rose to 5.5% from a year earlier. On Friday, the US will release April's Core Personal Consumption Expenditure Price Index, the Fed's preferred inflation gauge.
Key takeaways from the minutes:
“The economic forecast prepared by the staff for the May FOMC meeting continued to assume that the effects of the expected further tightening in bank credit conditions, amid already tight financial conditions, would lead to a mild recession starting later this year, followed by a moderately paced recovery.”
“Participants agreed that the U.S. banking system was sound and resilient. They commented that tighter credit conditions for households and businesses were likely to weigh on economic activity, hiring, and inflation. However, participants agreed that the extent of these effects remained uncertain.”
“Participants generally anticipated that under appropriate monetary policy, imbalances in the labor market would gradually diminish, easing pressures on wages and prices.”
“Participants agreed that inflation was unacceptably high.”
“Many participants mentioned that it is essential that the debt limit be raised in a timely manner to avoid the risk of severely adverse dislocations in the financial system and the broader economy.”
“Participants generally agreed that in light of the lagged effects of cumulative tightening in monetary policy and the potential effects on the economy of a further tightening in credit conditions, the extent to which additional increases in the target range may be appropriate after this meeting had become less certain.”
“Participants generally expressed uncertainty about how much more policy tightening may be appropriate. Many participants focused on the need to retain optionality after this meeting.”
“Some participants commented that, based on their expectations that progress in returning inflation to 2 percent could continue to be unacceptably slow, additional policy firming would likely be warranted at future meetings.”
“Several participants noted that if the economy evolved along the lines of their current outlooks, then further policy firming after this meeting may not be necessary.”
“Almost all participants stated that, with inflation still well above the Committee's longer-run goal and the labor market remaining tight, upside risks to the inflation outlook remained a key factor shaping the policy outlook. A few participants noted that they also saw some downside risks to inflation.”
Market reaction:
The US Dollar Index held at two-month highs, slightly below 104.00 after the minutes. The reaction across financial markets was limited. EUR/USD remained near monthly lows under 1.0770.
- Despite trading within a range, the GBP/JPY maintains an upward bias, bolstered by UK inflation figures and expectations of further tightening by the Bank of England.
- GBP/JPY faces a potential pullback, suggested by the negative divergence between its price action and the Relative Strength Index (RSI), with support at 172.00 and the 20-day EMA at 170.27.
- Further gains may be expected if GBP/JPY surpasses 173.00, with the falling wedge measuring an objective of 174.30.
GBP/JPY clings to the 172.00 figure amidst a risk-off impulse as the US debt ceiling woes and the release of the US Federal Reserve (Fed) May minutes loom. Therefore, investors seeking safety moved toward safe-haven peers, except for the Japanese Yen (JPY), weakening against the Pound Sterling (GBP). At the time of writing, the GBP/JPY is trading around 172.30s.
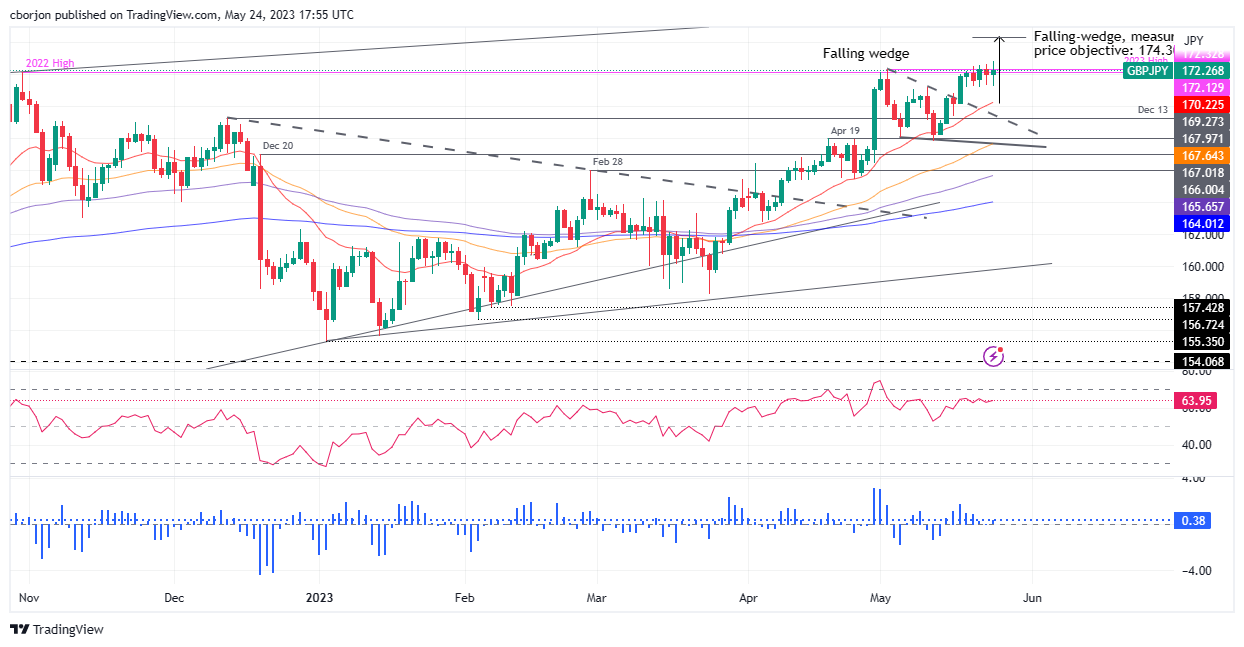
GBP/JPY Price Analysis: Technical outlook
The GBP/JPY continues to trade within a range between the 171.22-172.79 area after inflation figures in the United Kingdom (UK) cooled down, except for the April Core Consumer Price Index (CPI) jumping by 6.8%, above the prior’s month and the consensus 6.2%. That underpinned the GBP as expectations for additional tightening by the Bank of England (BoE) increased.
The GBP/JPY is still upward biased, but since the break of a falling wedge, the pair’s rally towards the measured objective at 174.30 stalled. In n article written on May 23, I wrote: “After three consecutive sessions, the GBP/JPY failed to reach the 173.00 area, which, once cleared, could pave the way towards the 174.00 figure, ahead of getting the measured objective of the falling wedge.” However, Wednesday what no exception to the rule, as the GBP/JPY reached a high of 172.79 but retreated more than 50 pips, oscillating around 172.20s.
As the GBP/JPY price action achieved successive higher highs, the Relative Strength Index (RSI) indicator prints lower peaks. That means a negative divergence between price action and the RSI could open the door for a pullback.
Hence, the GBP/JPY first support is the 172.00 mark. A break below and the GBP/JPY will reach the 20-day Exponential Moving Average (EMA) at 170.27, with the 170.00 figure up for grabs.
On the flip side, if GBP/JPY hits 173.00, that could pave the way for further gains, lile the falling wedge measured an objective of 174.30.
GBP/JPY Price Action – Daily chart
- GBP/USD bears are in the market and eye a break of daily support.
- US FOMC minutes are coming up and could be a catalyst.
GBP/USD is down some 0.28% ahead of the Federal Open Market Committee minutes that come out at the top of the hour. The pair has sunk from a high of 1.2469 and has reached a low of 1.2357 so far. Net GBP speculators’ positions surged higher and have now been positive for five consecutive weeks, which leaves the prospects of a move into the length compelling for the foreseeable future.
The minutes could be a catalyst for a move higher in the US Dollar reflecting a hawkish bias at the Fed. There will also be a number of Fed speakers in the coming days that could tilt the bias further in favor of the US Dollar bulls.
´´A rapidly shifting macro backdrop is making matters more challenging for Fed officials: Inflation remains uncomfortably elevated while lingering banking-sector stress is making the outlook increasingly blurry,´´ analysts at TD Securities argued. ´´We expect the minutes to expand on the Fed's policy views amid these uncertainties, with officials split on what to do next. A June hike is likely to stay on the table.´´
On the other hand, there are a number of variables, including the debt ceiling debacle and the recent slew of less bad UK economic data which led to an upgrade of the BoE’s UK GDP and inflation forecasts at its May policy meeting could keep the pair underpinned.
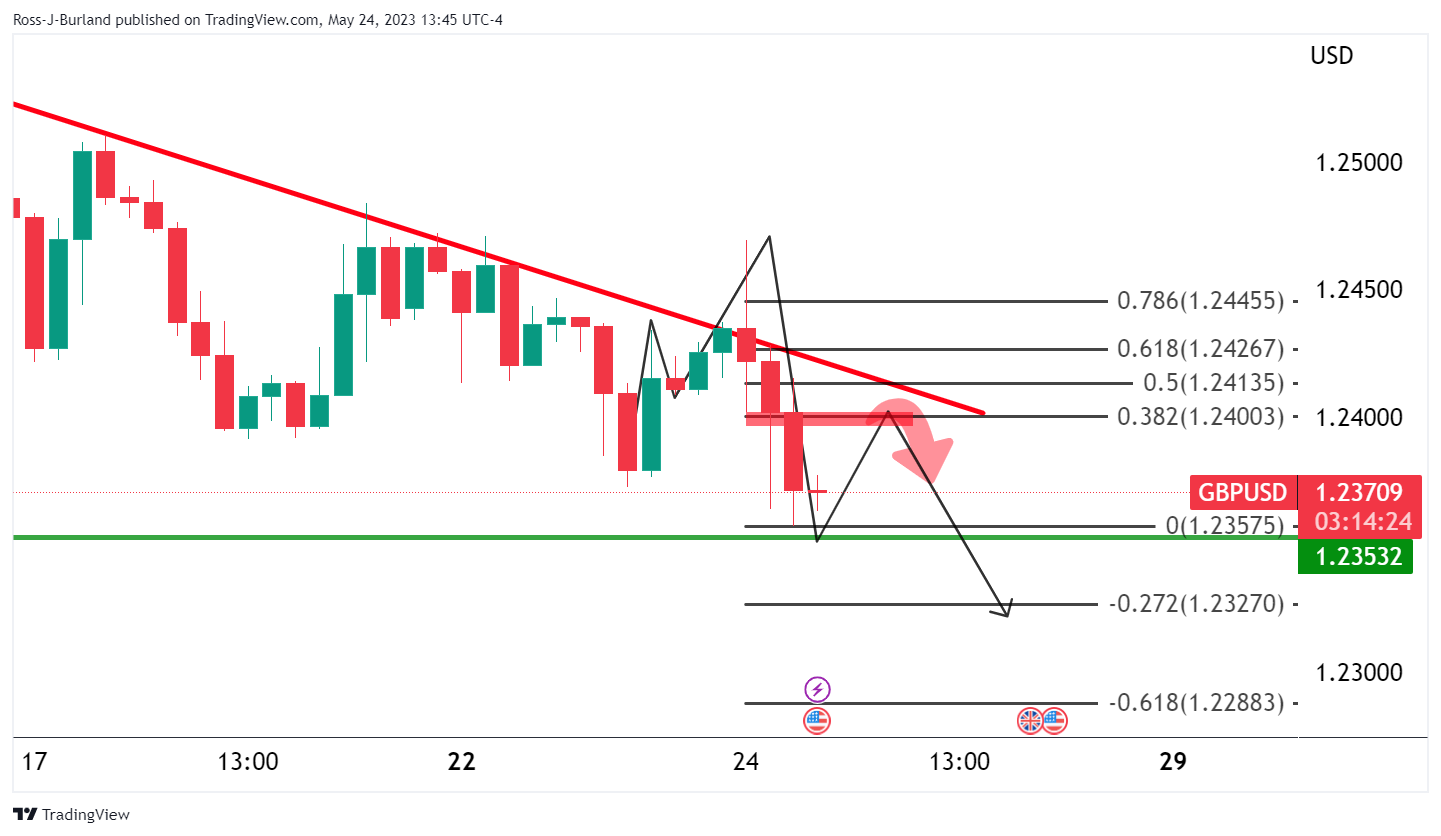
GBP/USD daily chart
GBP/USD bears are heading into a key area of critical support. A break of the 1.2350s could open the path for lower for longer on the charts.
On the 4-hour charts, however, a correction is feasible towards trendline resistance that meets the 38.2% Fibo and market structure as follows:
On Wednesday, May 24, the US Federal Reserve (FED) will release the latest monetary policy meeting minutes of the Federal Open Market Committee (FOMC) at 18:00 GMT, sought by traders as they would provide insight into the US central bank’s forward path.
On May 2-3, the US Federal Reserve (Fed) decided to raise rates by 25 bps, the tenth increase to the Federal Fund Rates (FFR) since the Fed began its tightening cycle on March 2022. Nevertheless, it was perceived as a dovish hike, as the Fed Chair Jerome Powell and Co. opened the door for a pause. Since then, Fed officials have had split views about a pause or another increase, as there lies uncertainty about how much tightening is needed.
It should be said that different postures around Fed officials have emerged after the May meeting. On the dovish side, some policymakers emphasized that monetary policy acts with a lag and that pausing could provide clues about the economy’s performance amidst an aggressive tightening cycle. On the other hand, there have been expressions that additional tightening is needed and that it is too soon to declare victory on inflation, even though data has shown signs of the economy’s deceleration.
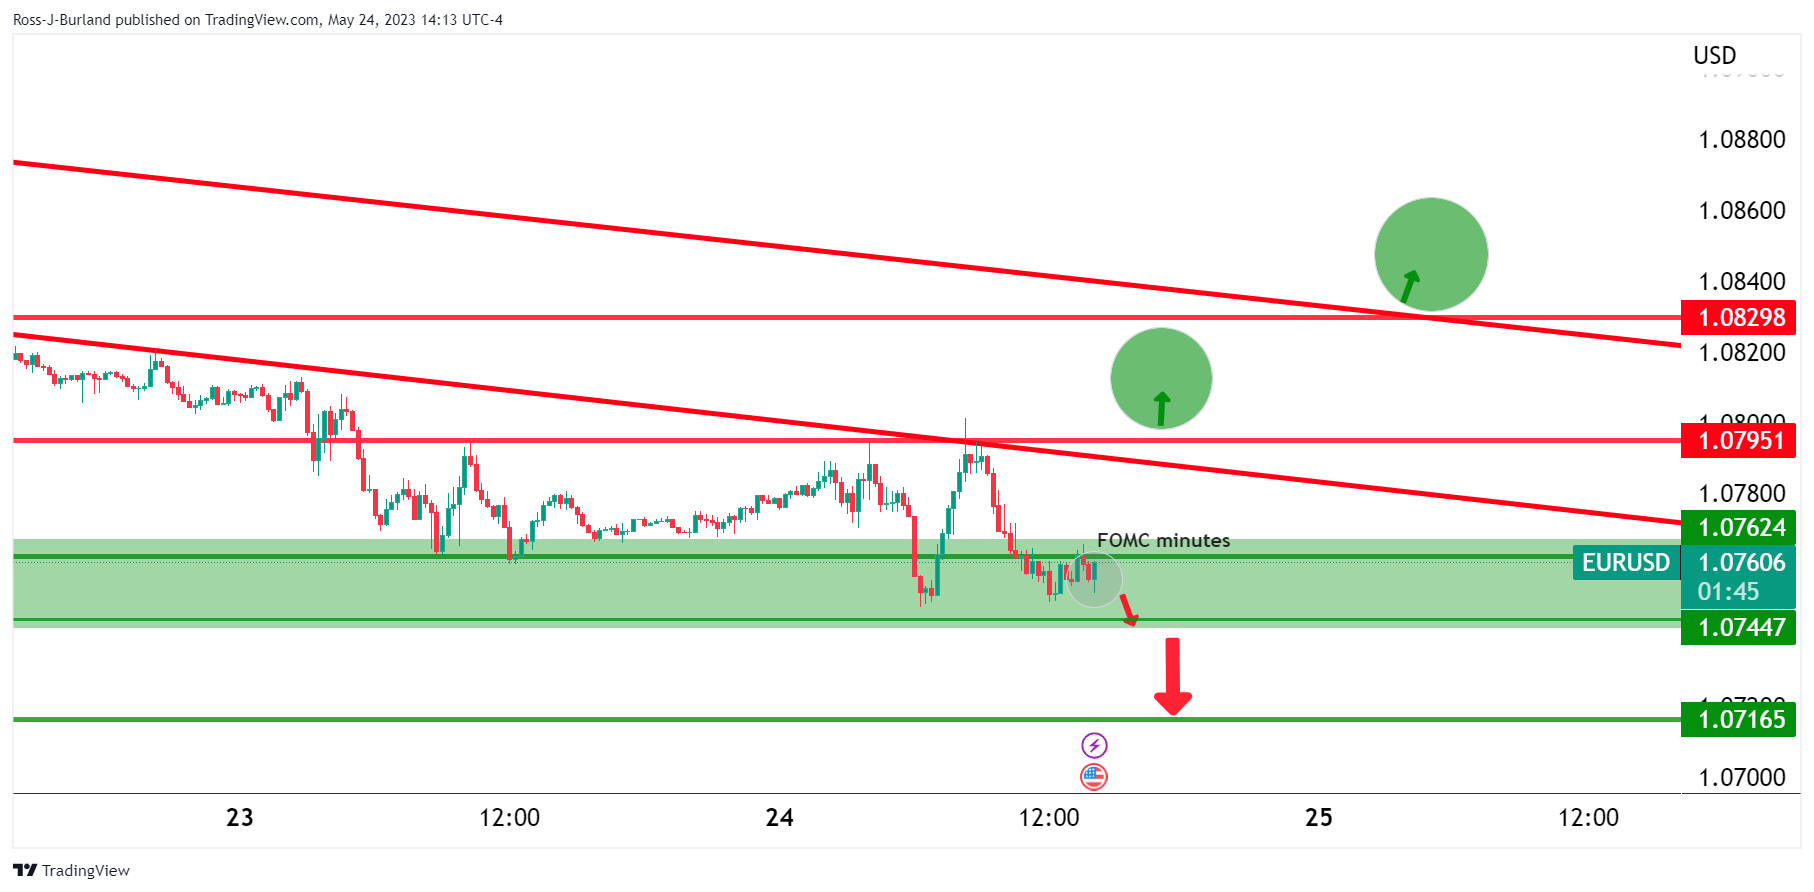
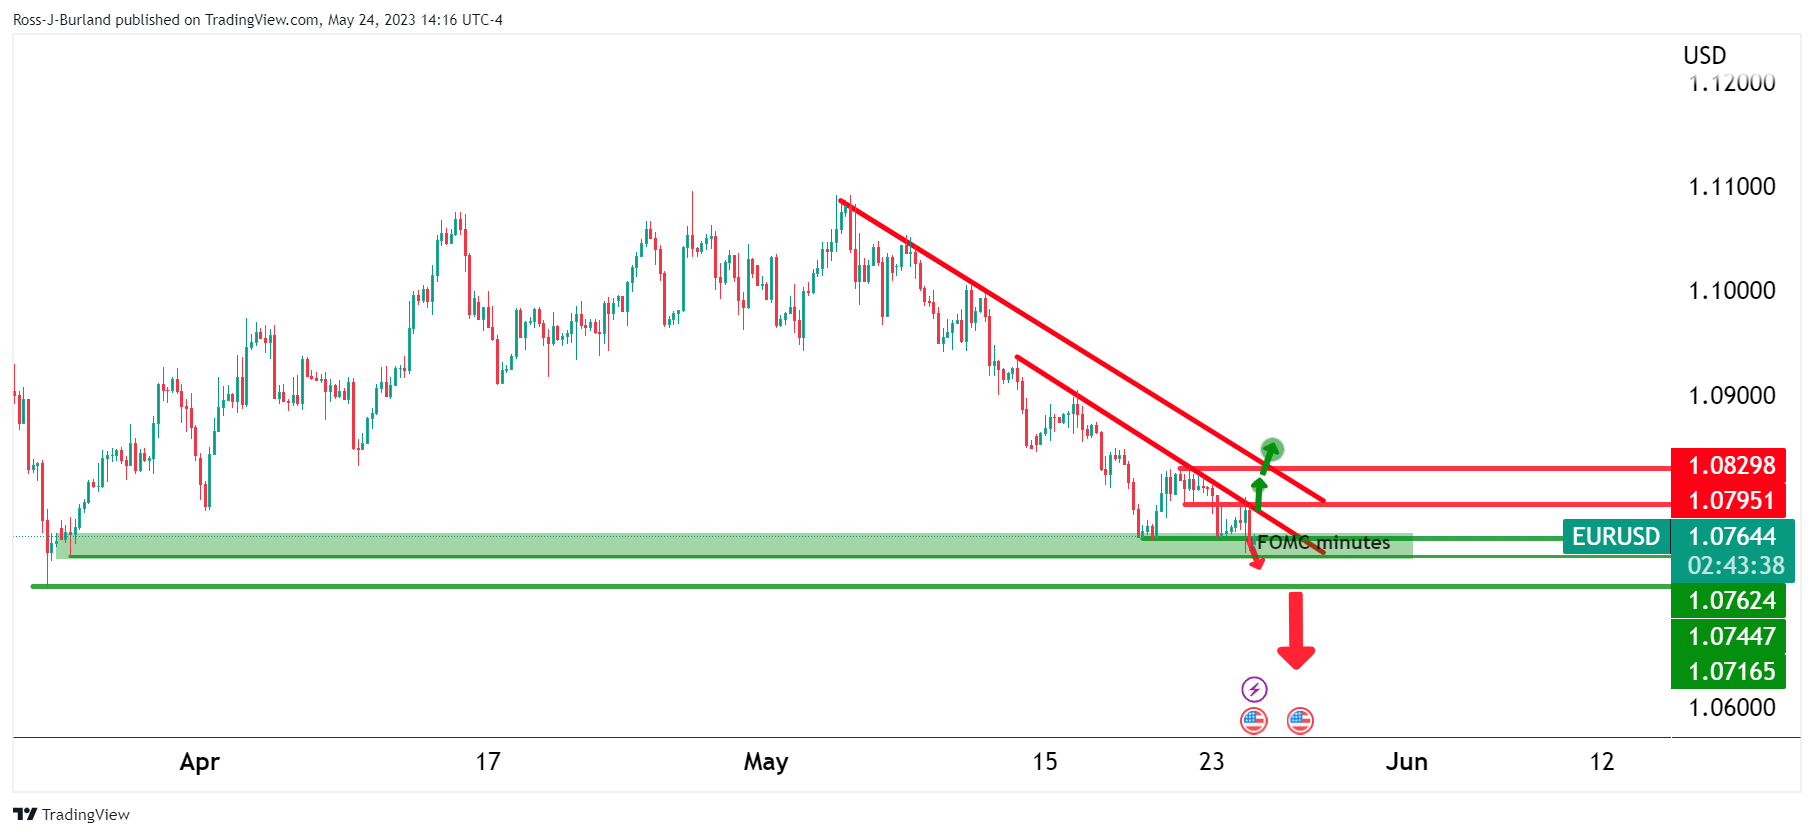
How Could It Affect EUR/USD?
Given that the EUR/USD is trading with a bearish tone in the week, the minute’s resumption of a hawkish posture, like the Fed’s looking higher for longer, could keep the EUR/USD skewed to the downside. Therefore, the EUR/USD pair might hit a new weekly low during the day, beneath 1.0748.
However, the fall could be cushioned even though the latest Eurozone (EU) data showed deterioration in Germany, as shown by its S&P Global PMIs May figures, alongside a weak IFO survey on Business Climate, sliding below the market’s expectations. Nevertheless, the divergence between central banks, with the European Central Bank (ECB) expected to raise rates twice for the foreseeable future while the Fed appears to have peaked, might keep the EUR/USD afloat before testing lower price levels, like the 200-day Exponential Moving Average (EMA) at 1.0683. On the other hand, if minutes lean dovish, the EUR/USD pair could reclaim the 1.0800 and pare some of its weekly losses.
Key Notes
- FOMC Minutes Preview: The complicated task of searching for clues
- EUR/USD Forecast: Bulls fight back but have little chance of winning the battle
About the Federal Reserve Open Market Committee (FOMC) minutes
FOMC stands for The Federal Open Market Committee that organizes 8 meetings in a year and reviews economic and financial conditions, determines the appropriate stance of monetary policy and assesses the risks to its long-run goals of price stability and sustainable economic growth. FOMC Minutes are released by the Board of Governors of the Federal Reserve and are a clear guide to the future US interest rate policy.
Federal Reserve Governor Christopher Waller said on Wednesday that the Fed needs to maintain flexibility on the best policy decision for the June meeting, as reported by Reuters.
"I do not support stopping rate hikes unless we get clear evidence that inflation is moving down towards our 2% objective," Waller explained. "Whether we should hike or skip at the June meeting will depend on how the data come in over the next three weeks."
Additional takeaways
"Prudent risk management may suggest skipping a hike in June, leaning toward July hike depending on inflation data and if banking conditions haven't tightened excessively."
"More loosening of very tight labor market needs to be seen to help take heat off high inflation."
"Concerned about lack of progress on inflation."
"Concerned inflation won't come down much unless growth of average hourly wages nears 3%."
"April PCE inflation, May CPI data will be critical."
"There is higher-than-usual uncertainty about credit conditions."
"Fighting inflation continues to be my priority."
Market reaction
The US Dollar continues to outperform its major rivals following these comments and the US Dollar Index was last seen rising 0.4% on the day at 103.91.
In a press conference on Wednesday, US House Speaker Kevin McCarthy said that they are sending their negotiators to the White House to try and finish up debt-limit talks.
McCarthy further noted that there were still differences over spending but added that he thinks that they could make progress today.
When asked whether he was concerned about a default, "I don't think there will be a default," McCarthy responded.
Market reaction
Markets remain risk-averse following these comments. As of writing, the US Dollar Index was up 0.3% on the day at 103.83 and the S&P 500 Index was down 0.8% at 4,111.
- Gold price hits resistance at 50-day EMA of $1976.47, retraces as US Congress and the White House fail to progress on fiscal talks.
- US Dollar Index (DXY) advances 0.25% amid the stalemate, rising above its 200-day EMA for the first time since March 15, 2023, as XAU/USD slips.
- Traders await the release of the US Federal Reserve Open Market Committee (FOMC) minutes after a dovish rate hike in May.
Gold price faces solid resistance at the 50-day Exponential Moving Average (EMA) at $1976.47, retraces some of its earlier gains after hitting a daily high of $1985.27. Talks between the US Congress and the White House (WH) failed to provide any relief; hence market participants are triggering toward safe-haven assets, not being Gold one of them. At the time of writing, XAU/USD is trading at $1969.20, down by 0.20%.
Political uncertainty triggers flows toward safety, bolstering the US Dollar
Wall Street continues to print losses as sentiment remains dented by the political uncertainty in the United States (US). Several reports on Tuesday updated that talks between President Biden and US House Speaker McCarthy did not make much progress. Divisions are seen in spending cuts proposed by the Republicans, while the White House is pushing for more taxes as part of the agreement.
Recently, US Treasury Secretary Janet Yellen said that “It is hard to be precise exactly which day we will run out of resources,” on Wednesday, as reported by Reuters. The former Fed Chair Yellen added that her office would try to increase the level of precision on the date the US Government will rule out of money.
Before Wall Street opened, XAU/USD rallied towards its daily high above $1985 just to see those gains evaporate as the greenback is staging a comeback, propelled by US bond yields. US real yields are climbing, standing at 1.449%, as shown by Treasury Inflation-Protected Securities (TIPS), while the 10-year benchmark note yields 3.709%, up one bps.
In the meantime, the US Dollar Index (DXY), a gauge of the buck’s value against a basket of its rivals, advance 0.25%, up at 103.776, above its 200-day Exponential Moving Average (EMA) for the first time since March 15, 2023.
XAU/USD traders will focus on the release of the US Federal Reserve Open Market Committee (FOMC) minutes at around 18:00 GMT, where the Federal Reserve (Fed) delivered a dovish rate hike of 25 basis points (bps) at its May 2-3 meeting. Traders would scrutinize the minutes, looking for clues about Fed Chair Jerome Powell and Co’s forward path.
XAU/USD Price Analysis: Technical outlook
XAU/USD is still neutral-biased, though a daily close below the 50-day Exponential Moving Average (EMA) can open the door for further weakness. However, sellers are still pending from breaking below the $1950 psychological level, tested three times in the last five trading days, with Gold sellers unable to drag prices toward the 100-day EMA at $1933.84. In that outcome, the next support would be the $1900 mark. Otherwise, Gold’s daily close above $1977 will keep buyers hopeful of a re-test of the $2000 figure.
Gold is coming under increasing pressure after rejecting the major $2,063/75 multi-year highs, strategists at Credit Suisse report.
Gold will eventually move to new record highs
“Gold has started to back away more decisively from pivotal resistance at the $2,063/75 record highs posted in 2020 and 2022, in line with the tiring short-term momentum picture that we have been highlighting over the past month, with a triple bearish momentum divergence still in place.”
“Next supports are seen at $1,949/40, below which would point to a correction down to $1,892, which we would then look to hold.”
“Post the current corrective phase, we believe the market will eventually move to new record highs, supported by lower US Real Yields into year-end. With this in mind, above $2,075 on a weekly closing basis would be seen to mark a significant break higher, opening up a move to our first core upside objective at $2,330/2,360.”
Copper has now lost all of the gains it made this year. Economists at ING believe there are more downside risks in the near term.
Copper prices to average $8,970/t in 2023
“In the near term, copper prices are likely to continue to be dictated by the pace of China’s economic recovery as well as the Fed’s interest rate hiking path.”
“We expect Copper prices to remain volatile as the market will continue to react to any policy change from China. We expect prices to average $8,970/t in 2023.”
“In the longer term, Copper’s fundamentals as an EV and green energy metal will support higher prices over the next few years, but for now, the market will remain focused on the disappointing demand picture from China.”
Equities are focused on the good news, not the risks, economists at UBS report.
A resolution to the US’s debt ceiling remains elusive
“While a last-minute deal remains our expectation, the current large gap between the demands from both sides mean that investors should brace for more volatility in markets in the lead-up to an eventual compromise.”
The Fed’s next rate decision is data-dependent
“Fed Chair Jerome Powell on Friday said it remains unclear if rates will need to rise further, reiterating that decisions will be made ‘meeting by meeting.’ Our base case is for a pause in the June FOMC meeting, but the prospect of a hike is more than a tail risk.”
Health of some regional US banks remains a concern, and tighter credit conditions could put further strain on US economy
“While we believe the US regional banking sector in aggregate has adequate capital and liquidity, this may suggest lingering stress in the banking system. Tighter credit conditions at a time when US economic growth is slowing, could continue to put corporate profits under pressure.”
"It is hard to be precise exactly which day we will run out of resources," US Treasury Secretary Janet Yellen said regarding the debt-ceiling deadline on Wednesday, as reported by Reuters.
Yellen further added that they will try to increase the level of precision on the date and noted that there will be some obligations that they will not be able to pay.
Market reaction
Markets remain risk-averse in the American session following these comments. As of writing, the S&P 500 Index was down 0.9% on a daily basis at 4,109.
Most recently, USD/CAD has principally trended upwards. But economists at Commerzbank see moderate upside potential for the Loonie.
US debt ceiling row versus rate hike expectations
“CAD is unable to keep up; and clearly the uncertain outcome of the row about the debt ceiling is having a bigger effect than the rising rate expectations for Canada (stronger compared with the US).”
“From our point of view this entails moderate potential for further CAD recovery against USD once it becomes clear that an agreement can be reached at the last minute.”
“It cannot be excluded that the market will also see a higher likelihood of a Fed rate hike after the US debt conflict is resolved, but CAD should at least be well supported against a Dollar which remains in good demand.”
- NZD/USD extends the RBNZ-inspired slump and drops to a nearly one-month low.
- A combination of factors continues to underpin the USD and contributes to the fall.
- Investors now look to the FOMC meeting minutes for a fresh directional impetus.
The NZD/USD pair adds to its heavy intraday losses and tumbles to a nearly one-month low during the early North American session on Wednesday, with bears now awaiting a break below the 0.6100 mark before placing fresh bets.
The New Zealand Dollar (NZD) comes under intense selling pressure in reaction to the Reserve Bank of New Zealand's (RBNZ) dovish shift, signalling that it was done with its most aggressive hiking cycle since 1999. Furthermore, the RBNZ forecasts the official cash rate to peak at its current level, which, along with a generally weaker risk tone, weighs heavily on the risk-sensitive Kiwi and drags the NZD/USD pair lower for the second straight day.
The market sentiment remains fragile amid worries about slowing global economic growth, particularly in China. In fact, data from China last week indicated that the world's second-largest economy underperformed in April. Apart from this, the US debt ceiling woes temper investors' appetite for riskier assets. The anti-risk flow is evident from a fresh leg down in the equity markets, which, in turn, benefits the safe-haven US Dollar (USD).
Adding to this, firming expectations that the Federal Reserve (Fed) will keep interest rates higher for longer push the USD Index (DXY), which tracks the Greenback against a basket of currencies, to a two-month high and contributes to the heavily offered tone surrounding the NZD/USD pair. The current market pricing indicates a small chance of another 25 bps lift-off in June and the bets were lifted by the recent hawkish comments by a slew of Fed officials.
Hence, the market focus will remain glued to the release of the FOMC meeting minutes, due later during the US session. Investors will look for cues about the Fed's future rate-hike path, which will play a key role in influencing the near-term USD price dynamics and provide some meaningful impetus to the NZD/USD pair. Nevertheless, a surprise dovish shift by the RBNZ suggests that the path of least resistance for spot prices is to the downside.
Technical levels to watch
Economists at Credit Suisse analyze US Dollar Index (DXY) technical outlook.
The potential for a “double bottom” reversal in the USD is seen to be building
“We look for strength back to the March highs, 200-DMA and 38.2% retracement of the 2022/2023 fall at 105.63/106.13. Above here though is needed to see a ‘double bottom’ reversal confirmed to open the door to a more sustained and material phase of USD strength with next resistance seen at 107.78/99.”
“Support at 102.20 needs to hold to keep the immediate risk higher.”
- GBP/USD bounces off earlier lows near 1.2360.
- UK inflation figures surprised to the upside in April.
- BoE Bailey said inflation expectations are retreating.
Following an earlier drop to new monthly lows near 1.2360, GBP/USD manages to regain some balance and retake the 1.2400 neighbourhood on the back of some loss of traction in the US dollar.
GBP/USD now looks at FOMC Minutes
GBP/USD now alternates gains with losses around the 1.2400 region as the European trading session draws to a close on Wednesday.
In the meantime, the British pound remains under scrutiny in the wake of higher than expected UK inflation figures tracked by the CPI in April. As a matter of fact, UK consumer prices rose more than estimated during last month, although they lost traction vs. the previous readings.
From the BoE, Governor A. Bailey argued that around a third of rate raises have hit the economy so far, at the time when he reiterated that the labour market remains tight and inflation expectations seem to be running out of steam. In addition, Bailey acknowledged that the main issue is how sticky and stubborn is the way down in inflation.
Still around the BoE, market consensus now appears to lean towards two extra rate hikes in the next months, while the probability of a rate cut in November now runs (very) thin.
Later in the NA session, investors will closely follow the release of the FOMC Minute.
GBP/USD levels to consider
As of writing, the pair is losing 0.04% at 1.2406 and faces the next support at 1.2364 (monthly low May 24) followed by 1.2344 (weekly low April 10) and finally 1.2274 (monthly low April 3). On the other hand, the surpass of 1.2668 (2023 high May 8) would open the door to 1.2864 (200-week SMA) and then 1.3000 (psychological level).
- AUD/USD drifts lower for the second straight day and drops to a fresh YTD low on Wednesday.
- Looming recession risks weigh on investors’ sentiment and undermine the risk-sensitive Aussie.
- Retreating US bond yields cap gains for the USD and lends support ahead of the FOMC minutes.
The AUD/USD pair remains under heavy selling pressure for the second successive day and drops to the 0.6560 area, its lowest level since November 2022 during the early North American session.
Worries over slowing global growth, particularly in China, along with the lack of progress in talks over increasing the US debt ceiling, continue to weigh on investors' sentiment and turn out to be a key factor weighing on the Australian Dollar (AUD). In fact, data from China last week indicated that the world's second-largest economy underperformed in April. Furthermore, Representatives of President Joe Biden and congressional Republicans ended another round of debt ceiling talks without an agreement to raise the government's $31.4 trillion borrowing limit. This, along with speculations that the Reserve Bank of Australia (RBA) might refrain from hiking in June, exerts additional downward pressure on the perceived riskier Aussie.
The US Dollar (USD), on the other hand, consolidates its recent gains to a two-month low and remains well supported by firming expectations that the Federal Reserve (Fed) will keep interest rates higher for longer. In fact, the markets have started pricing in the possibility of another 25 bps lift-off at the next policy meeting in June and the bets were lifted by the recent hawkish remarks by a slew of influential Fed officials. That said, the ongoing retracement slide in the US Treasury bond yields is holding back the USD bulls from placing aggressive bets and helping limit the downside for the AUD/USD pair. Investors also seem reluctant and prefer to wait on the sidelines ahead of the release of the FOMC meeting minutes, due later during the US session.
The minutes will be closely scrutinized for clues about the Fed's future rate-hike path, which, in turn, will play a key role in influencing the near-term USD price dynamics and provide a fresh directional impetus to the AUD/USD pair. Nevertheless, the aforementioned fundamental backdrop suggests that the path of least resistance for the major is to the downside and any attempted recovery might still get sold into. Spot prices now seem vulnerable to weaken further towards testing the next relevant support near the 0.6500 psychological mark.
Technical levels to watch
Antje Praefcke, FX Analyst at Commerzbank, discusses how FOMC Minutes could impact the US Dollar.
The future is more important
“I don’t think that the minutes of the last Fed meeting in early May will provide much momentum for the Dollar, as the next FOMC meeting will be held in exactly three weeks.”
“25 bps more or less will not make much difference for the Dollar, something we have often pointed out. Instead, it is about how hawkish the Fed actually is.”
“As long as the comments and data tend to suggest that the Fed might deliver more or that the market’s rate cut expectations for the second half of the year are overly ambitious and might have to be adjusted, the Dollar is likely to be able to defend its gains.”
Economist at UOB Group Lee Sue Ann suggests the Bank Indonesia (BI) could leave its monetary conditions unchanged at this week’s event.
Key Quotes
“BI remains of the view that inflation expectations are anchored and lower than previous expectations, and that rupiah stability will continue. Specifically, BI expects that headline and core inflation rates have returned to BI's target range of 2-4% from its highest levels in Sep last year.”
“As such, we see BI keeping its benchmark rate steady at 5.75%, with the possibility of a 25bps rate cut in early-2024.”
- EUR/USD drops to new lows near 1.0750 on Wednesday.
- Further selling could revisit the minor level at 1.0712.
EUR/USD manages well to reverse the initial knee-jerk to fresh 2-month lows in the 1.0750/45 band midweek.
Despite the ongoing bounce and the apparent consolidative mood, the breach of the May low near 1.0750 could spark a deeper move to the minor support level at 1.0712 (March 24).
A deeper decline to the March bottom of 1.0516 (March 15), in the meantime, remains not favoured for the time being.
Looking at the longer run, the constructive view remains unchanged while above the 200-day SMA, today at 1.0474.
EUR/USD daily chart
- Oil price continues to rally after Saudi Prince Abdulaziz bin Salman, the country’s Oil minister, warns short-sellers to “watch out”.
- Inventory data shows a steep drawdown in the prior week, reflecting rising demand ahead of US driving season.
- A bullish triangle pattern forms on the 4-hour chart, increasing the evidence the bearish trend may be reversing.
- EIA inventory data to be released soon could provide volatility.
Oil price trades roughly a percentage point higher on Wednesday after data from the US showed a dramatic fall in Oil inventories, indicating rising demand. The Oil price was given a further lift after the Saudi Oil Minister warned Oil short-sellers to “watch out” ahead of the OPEC+ meeting on June 4.
At the time of writing, WTI Oil is trading around $74 and Brent Crude Oil in the upper $77s. A bullish right-angled triangle has completed on the 4-hour chart, posing a challenge to the overall bear trend.
Oil news and market movers
- Oil price rises after the American Petroleum Institute (API) publishes weekly inventory data which shows a 6.7 million barrel drop in stocks, indicating rising demand.
- Analysts had expected the API data to show a 525,000 barrel rise in inventories.
- Saudi Oil Minister, Prince Abdulaziz bin Salman, warned Oil speculators to "watch out" and that they might suffer as they did "in April".
- His comments have been taken as warning to short-sellers that the Oil price might rise.
- Abdulaziz defended OPEC and its decision to cut production by 2 million barrels per day (bpd) at its meeting in October 2022. Given the Oil price is at similar levels to October, it may suggest there is a risk the cartel will announce another supply cut in June.
- Oil continues to be underpinned by optimism that a deal will be reached on the US debt ceiling.
- Republican House Speaker Kevin McCarthy said, after talks with Democrats on Monday that, “I believe we can still get there. I believe we can get it done.” Adding that he thought the talks were the most productive so far.
- The US Memorial Day weekend kicks off on May 27 and marks the beginning of the US summer driving season which will provide a seasonal lift to Oil demand, supporting prices.
- Oil price has decoupled temporarily from the US Dollar which catches a bid as Federal Reserve (Fed) officials continue to talk about the possibility of more rate hikes, and US macro data supports.
- Talk of more rate hikes ought to provide a headwind for Oil, which is priced in USD.
- EIA inventory data scheduled for release at 14:30 GMT will provide an official estimate of Oil inventories. If the data supports the API drop, it could give another lift to Crude prices.
Crude Oil Technical Analysis: Bullish triangle in downtrend
WTI Oil is in a long-term downtrend from a technical perspective, making successive lower lows. Given the old adage that the trend is your friend, this favors short positions over long positions. WTI Oil is trading below all the major daily Simple Moving Averages (SMA) and all the weekly SMAs except the 200-week which is at $66.89.
-638205297185157521.png)
WTI US Oil: Daily Chart
A break below the year-to-date (YTD) lows of $64.31 would be required to re-ignite the downtrend, with the next target at around $62.00 where trough lows from 2021 will come into play, followed by support at $57.50.
Despite the bearish trend dominating, there are growing signs pointing to a possible conclusion and reversal. The mild bullish convergence between price and the Relative Strength Index (RSI) at the March and May 2023 lows – with price making a lower low in May that is not matched by a lower low in RSI – is a sign that bearish pressure is easing.
The long hammer Japanese candlestick pattern that formed at the May 4 (and year-to-date) lows is a sign that it could be a key strategic bottom.
Further, a right-angled triangle has formed on the 4-hour chart below (drawn in dotted lines), which because of its shape is biased to breakout higher.
-638205297625449360.png)
WTI US Oil: 4-hour Chart
The triangle formed after price recovered from the May 4 YTD lows. The initial rebound off the May 4 lows could be a Wave A, with Wave B descending between May 8-15. Wave C then probably rose in the week that followed and then pulled back in a Wave D. This week’s recovery is probably a Wave E. Since most triangles are only composed of five waves this one is now probably complete. It could break out at any moment.
There is a chance the triangle might break in either direction, but it is biased to break higher because the top border is flat (it is right angled). A breakout higher could see price rise in a volatile rally to a potential target of $79.75, calculated by using the usual technical method, which is to take 61.8% the height of the triangle and extrapolate it from the breakout point higher. Oil price could even go as far as a 100% extrapolation in bullish cases, however, the 61.8% level coincides with the 200-day SMA, heightening its importance as a key resistance level.
Such a break and assuming Oil price reaches its target would mean price breaking above the $76.85 lower high of April 28, thereby, bringing the dominant bear trend into doubt.
False breaks are common with this pattern, however, and traders should ideally wait for a ‘decisive’ break. Such a break is characterized by a longer-than-average bullish green bar which pierces completely through the upper borderline of the triangle and closes near the 4-hour period’s highs, or alternatively three green bars in a row that also pierce above the borderline.
The RSI on the 4-hour chart is also showing a mild bearish divergence between the tops of Waves C and E and RSI. Whilst price has climbed higher in Wave E, RSI has not followed suit and remains beneath the level it was at when Wave C peaked. This suggests waning bullish interest although given it is mild, there is still a possibility of a breakout if momentum suddenly picks up.
Given the downtrend is dominant there is still also a possibility WTI Oil price could break lower, with a decisive break below the lower border, likewise required, and a target at $67.27. This is just above where the 200-week SMA is located and likely to offer support. Traders might even wish to wait for a break below the lows of Wave B at $69.40 for added confirmation.
WTI Oil FAQs
What is WTI Oil?
WTI Oil is a type of Crude Oil sold on international markets. The WTI stands for West Texas Intermediate, one of three major types including Brent and Dubai Crude. WTI is also referred to as “light” and “sweet” because of its relatively low gravity and sulfur content respectively. It is considered a high quality Oil that is easily refined. It is sourced in the United States and distributed via the Cushing hub, which is considered “The Pipeline Crossroads of the World”. It is a benchmark for the Oil market and WTI price is frequently quoted in the media.
What factors drive the price of WTI Oil?
Like all assets, supply and demand are the key drivers of WTI Oil price. As such, global growth can be a driver of increased demand and vice versa for weak global growth. Political instability, wars, and sanctions can disrupt supply and impact prices. The decisions of OPEC, a group of major Oil-producing countries, is another key driver of price. The value of the US Dollar influences the price of WTI Crude Oil, since Oil is predominantly traded in US Dollars, thus a weaker US Dollar can make Oil more affordable and vice versa.
How does inventory data impact the price of WTI Oil
The weekly Oil inventory reports published by the American Petroleum Institute (API) and the Energy Information Agency (EIA) impact the price of WTI Oil. Changes in inventories reflect fluctuating supply and demand. If the data shows a drop in inventories it can indicate increased demand, pushing up Oil price. Higher inventories can reflect increased supply, pushing down prices. API’s report is published every Tuesday and EIA’s the day after. Their results are usually similar, falling within 1% of each other 75% of the time. The EIA data is considered more reliable, since it is a government agency.
How does OPEC influence the price of WTI Oil?
OPEC (Organization of the Petroleum Exporting Countries) is a group of 13 Oil-producing nations who collectively decide production quotas for member countries at twice-yearly meetings. Their decisions often impact WTI Oil prices. When OPEC decides to lower quotas, it can tighten supply, pushing up Oil prices. When OPEC increases production, it has the opposite effect. OPEC+ refers to an expanded group that includes ten extra non-OPEC members, the most notable of which is Russia.
- USD/JPY oscillates in a narrow trading band just below the YTD peak touched on Tuesday.
- A modest USD pullback from a two-month high and a softer risk tone cap gains for the pair.
- The Fed-BoJ policy divergence continues to act as a tailwind ahead of the FOMC minutes.
The USD/JPY pair extends its sideways consolidative price move for the second straight day and remains confined in a narrow band through the early North American session on Wednesday. The pair is currently placed just below mid-138.00s and remains well within the striking distance of the YTD peak touched the previous day.
The US Dollar (USD) pulls back following an early uptick to a fresh two-month high amid a further decline in the US Treasury bond yields. Apart from this, a generally weaker tone around the equity markets drives some haven flow towards the Japanese Yen (JPY) and acts as a headwind for the USD/JPY pair. Against the backdrop of worries about a global economic slowdown, the lack of progress in talks over increasing the US debt ceiling tempers investors' appetite for riskier assets and benefits traditional safe-haven assets.
The downside for the USD, meanwhile, seems cushioned amid firming expectations that the US central bank will keep interest rates higher for longer, bolstered by the recent hawkish comments by a slew of Federal Reserve (Fed) officials. In fact, the markets have been pricing in the possibility of another 25 bps lift-off in June. This marks a big divergence in comparison to a more dovish stance adopted by the Bank of Japan (BoJ), which continues to undermine the JPY and is seen lending some support to the USD/JPY pair.
Traders also seem reluctant to place aggressive bets and prefer to wait on the sidelines ahead of the release of the FOMC meeting minutes, due later during the US session. The minutes will be closely scrutinized for clues about the Fed's future rate-hike path, which will play a key role in influencing the USD price dynamics and provide a fresh directional impetus to the USD/JPY pair. Nevertheless, the aforementioned fundamental backdrop favours bulls and suggests that the path of least resistance for spot prices is to the upside.
Technical levels to watch
- DXY clinches fresh monthly highs near 103.80 on Wednesday.
- Further buying pressure could challenges the 104.00 zone.
DXY advances to fresh highs in the 103.75/80 band before losing some momentum on Wednesday.
In case bulls regain the upper hand, the next up-barrier emerges at the 104.00 hurdle prior to the key 200-day SMA, today at 105.73, and the 2023 peak of 105.88 (March 8).
Looking at the broader picture, while below the 200-day SMA the outlook for the index is expected to remain negative.
DXY daily chart
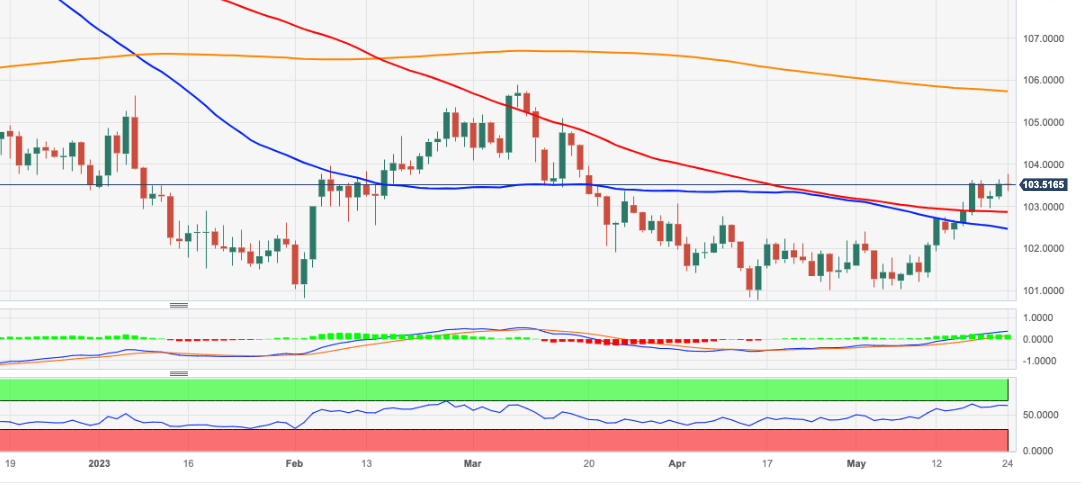
- EUR/JPY regains the upside following Tuesday’s marked decline.
- The surpass of 150.00 could trigger further gains near term.
EUR/JPY trades with decent gains above the 149.00 region on Wednesday.
While the cross seems to have embarked on a consolidative phase, a convincing breakout of the key round level at 150.00 could encourage the cross to dispute the 2023 top at 151.61 (May 2) in the short-term horizon.
So far, further upside looks favoured while the cross trades above the 200-day SMA, today at 143.49.
EUR/JPY daily chart
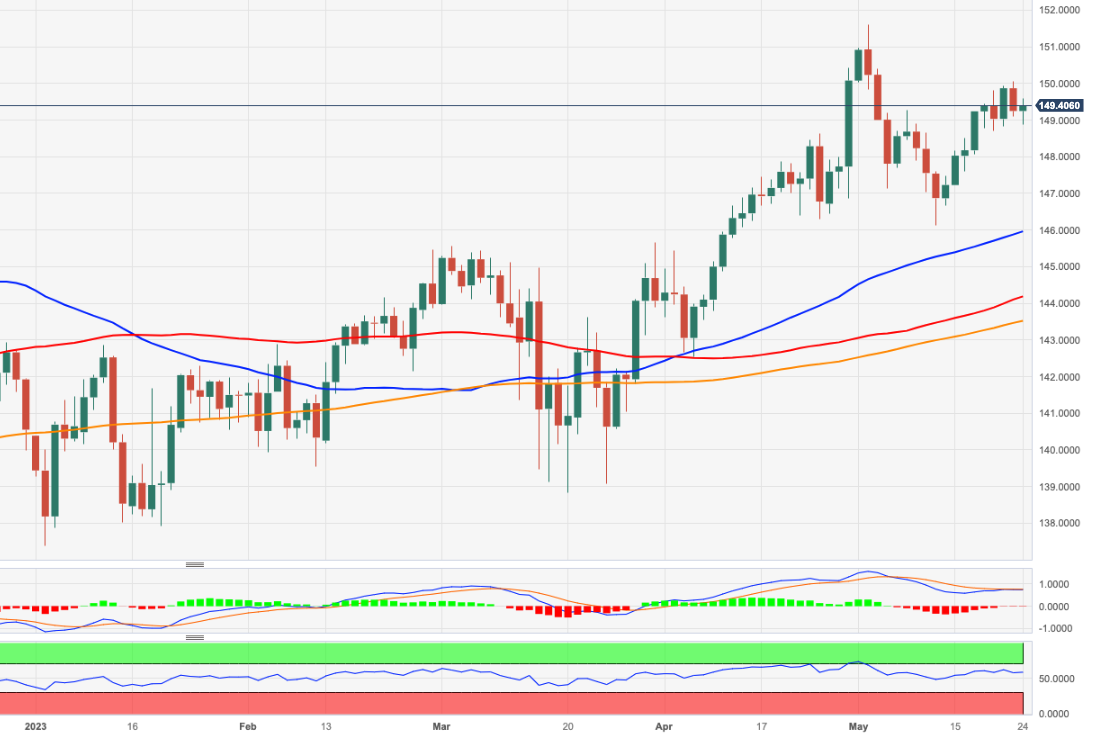
EUR/USD has corrected lower so far this month after failing to break above the 1.1000 level on a sustained basis in late April/early May. Economists at MUFG analyze the pair’s outlook amid US debt-ceiling negotiations.
A more timely deal to raise the debt ceiling would be better for the USD
“The main source of uncertainty for the performance of EUR/USD in the month ahead will be the US debt-ceiling negotiations.”
“We expect the EUR to strengthen against the USD if the negotiations move closer to the so-called ‘X-date’, and then reverse once a deal is reached.”
“A more timely deal to raise the debt ceiling would be better for the USD and expectations for further Fed rate hikes in the near-term.”
Economists at Credit Suisse analyze USD/CAD technical outlook.
Key support is seen at 1.3301
“USD/CAD continues to trade in the middle of its range, but in our view, the price action looks like a clear potential bullish ‘triangle’ continuation pattern, which reinforces our broader USD bullish view.”
“Next key resistance is seen at 1.3670, then 1.3864, above which would definitively confirm the “triangle” to open up a move to 1.3978/4000 next, then 1.4099.”
“Key support is seen at 1.3301, which needs to hold to maintain the bull ‘triangle’ potential.”
UOB Group’s Economist Enrico Tanuwidjaja and Junior Economist Agus Santoso review the latest current account figures in Indonesia.
Key Takeaways
“Indonesia’s 1Q23 Current Account (CA) position recorded a surplus of USD3bn (0.9% of GDP), though slightly lower than the previous period's surplus of USD4.2bn (1.3% of GDP). The capital and financial account recorded a surplus of USD3.4bn (1% of GDP), a significant increase from a surplus of USD0.3bn (0.1% of GDP) in 4Q22. Overall, Indonesia's balance of payments (BOP) position in 1Q23 remained strong and steady to USD6.5bn, higher than 4Q22’s USD4.7bn.”
“Robust demand from Indonesia's main trading partners underpinned strong exports performance and coupled with deeper imports contraction amid lower global oil prices and a more sluggish capital goods demand as the final phase of several downstream projects kicked in yielded consistent trade surplus, which in turn support CA surplus in 1Q23.”
“We expect Indonesia’s CA position to turn from a surplus of 1% of GDP in 2022 into a slight deficit of around -0.3% in this year. The anticipated global economic slowdown and a more moderate financial account performance are key reasons for our forecast of a slight deficit in CA position for 2023.”
Another quiet trading session saw the Dollar grind higher yesterday. Today, economists at ING expect the USD to get a boost after the FOMC minutes.
FOMC minutes in focus
“The highlight of today’s session will be the release of the Fed minutes. It seems too early for the Fed to countenance easing – suggesting the Dollar will hold recent gains.”
“And with EMFX on the back foot – e.g. USD/CNH trading up to 7.06 – we think this dollar correction could have a little further to run.”
“We would be bracing for Dollar strength in the aftermath of the FOMC minutes.”
- USD/CAD climbs to over a one-week high amid the emergence of fresh USD buying.
- Hawkish Fed expectations and a softer risk tone continue to benefit the Greenback.
- Bullish Oil prices underpin the Loonie and cap gains ahead of the FOMC minutes.
The USD/CAD pair attracts fresh buying on Wednesday and climbs to a one-and-half-week high, around mid-1.3500s during the first half of the European session.
A combination of supporting factors pushes the US Dollar (USD) to a fresh two-month high, which, in turn, acts as a tailwind for the USD/CAD pair. The recent hawkish remarks by a slew of influential Federal Reserve (Fed) officials reaffirmed market expectations that the US central bank will keep interest rates higher for longer. In fact, the markets have started pricing in the possibility of another 25 bps lift-off in June. This, along with a generally weaker risk tone, further benefits the Greenback's relative safe-haven status.
The market sentiment remains fragile amid worrying signs of slowing global economic growth, particularly in China, and US debt ceiling woes. In fact, data from China last week indicated that the world's second-largest economy underperformed in April. Furthermore, representatives of President Joe Biden and congressional Republicans ended another round of debt ceiling talks without an agreement to raise the government's borrowing limit. This tempers investors' appetite for riskier assets and drives some haven flows.
It, however, remains to be seen if bulls can capitalize on the move amid a further rise in Crude Oil prices, which tends to benefit the commodity-linked Loonie. In fact, US West Texas Intermediate (WTI) Crude rallied nearly 2% intraday, to over a three-week high after Saudi Arabia's energy minister warned that short sellers should watch out for pain, fueling speculations for further OPEC+ output cuts. This, in turn, warrants some caution before placing fresh bullish bets around the USD/CAD pair and positioning for further gains.
Market participants might also prefer to wait on the sidelines ahead of the release of the FOMC meeting minutes, due later during the US session. The minutes will be closely scrutinized for clues about the Fed's future rate-hike path, which, in turn, will influence the USD demand in the near term and help investors to determine the next leg of a directional move for the USD/CAD pair. Apart from this, Oil price dynamics might further contribute to producing short-term trading opportunities around the major.
Technical levels to watch
Economists at Commerzbank discuss Eurozone economic outlook and its implications for the ECB policy and, therefore, the Euro.
ECB’s rate hikes will hit the Eurozone’s economy at some point
“The PMIs are already suggesting that the ECB’s rate hikes will hit the Eurozone’s economy at some point. That means that the doves on the ECB board might gain the upper hand at some stage, at which point the Euro would lose important support.”
“Not only would the market possibly have to revise its view that there will be two further rate steps in the ECB’s hiking cycle, but it might also allocate a higher likelihood to the ECB cutting its key rate again due to an economic slowdown. It will be a while until we know that; but over the course of the year the Euro might meet some more headwinds too.”
- US Dollar in a mixed mode again with no real big moves noticeable in any major pair.
- US debt-ceiling talks in stalemate while CME Fed futures are at 50% for another hike in July.
- US Dollar Index holding on to marginal gains as a new two-month high is in reach.
The US Dollar (USD) has paused its advance against most currencies on Wednesday after cold water got poured on the debt ceiling talks. Both sides departed on Tuesday night with no agreement, no new date set for further talks and no comments from both parties while the 1st of June is approaching fast. Markets will look for further info from US Treasury Secretary Yellen who is due to speak at 14:00 GMT.
On the macroeconomic data front, some fireworks are expected in the US session with Fed’s Waller due to speak and the FOMC Minutes from the latest meeting to be released at 18:00 GMT. Traders will want to see the voting behaviour and discussion punts that have been put on the table in the last meeting in order to assess if another rate hike in July is plausible. From the looks of the strong S&P Global Services PMI numbers released on Tuesday, one more rate hike looks possible.
Daily digest: US Dollar looking for clues in the FOMC Minutes
- Talks about the US debt ceiling are now officially in gridlock with no future date set for further negotiations and no comments from both sides when the meeting ended on Tuesday evening.
- US equities did not react well, breaking down the positive tone, and headed lower.
- All Asian and European equities are being dragged in the red as well with the negative mood out of the United States.
- On Tuesday, Richmond Fed Manufacturing Index contracted to -15 from -10. Business Conditions bounced a little to -17, coming from -27.
- US S&P Global May Flash Services PMI came at 55.1 vs 53.6 from April. The Flash Composite PMI printed 54.5 vs 53.4 in April, and the Flash Manufacturing PMI came at 48.5 vs 50.2 in April.
- US Credit Default Swaps (CDS) jump higher and are nearing the peak of last Wednesday.
- US equity futures are mildly in the red with the VIX still unchanged at 17.
- The CME Group FedWatch Tool shows that markets are pricing in a 50% chance of rate hike for July after hawkish comments from Federal Reserve officials Jim Bullard and Neal Kashkari. Rate cuts have moved down the line, to as early as November 2023. The FOMC Minutes later this Wednesday could lock in the rate hike for the next meeting.
- The benchmark 10-year US Treasury bond yield trades at 3.70% and eases a little bit in yield as US and German bonds jump higher.
US Dollar Index technical analysis: Hiccup in Washington pauses uptrend
The US Dollar Index (DXY) has taken out both the 55-day and the 100-day Simple Moving Averages (SMA), respectively, at 102.45 and 102.85 on the upside. A new high got printed briefly for the past two months, but contracts a touch on Wednesday with the impasse in Washington on the talks to sort out the debt ceiling.
On the upside, 105.75 (200-day SMA) still acts as the price target to hit, as the next upside key level at 104.00 (psychological, static level) acts as an intermediary element to cross the open space.
On the downside, 102.85 (100-day SMA) aligns as the first support level to confirm a change of trend. In the case that breaks down, watch how the DXY reacts at the 55-day SMA at 102.48 in order to assess any further downturn or upturn.
US Dollar FAQs
What is the US Dollar?
The US Dollar (USD) is the official currency of the United States of America, and the 'de facto' currency of a significant number of other countries where it is found in circulation alongside local notes. It is the most heavily traded currency in the world, accounting for over 88% of all global foreign exchange turnover, or an average of $6.6 trillion in transactions per day, according to data from 2022.
Following the second world war, the USD took over from the British Pound as the world's reserve currency. For most of its history, the US Dollar was backed by Gold, until the Bretton Woods Agreement in 1971 when the Gold Standard went away.
How do the decisions of the Federal Reserve impact the US Dollar?
The most important single factor impacting on the value of the US Dollar is monetary policy, which is shaped by the Federal Reserve (Fed). The Fed has two mandates: to achieve price stability (control inflation) and foster full employment. Its primary tool to achieve these two goals is by adjusting interest rates.
When prices are rising too quickly and inflation is above the Fed's 2% target, the Fed will raise rates, which helps the USD value. When inflation falls below 2% or the Unemployment Rate is too high, the Fed may lower interest rates, which weighs on the Greenback.
What is Quantitative Easing and how does it influence the US Dollar?
In extreme situations, the Federal Reserve can also print more Dollars and enact quantitative easing (QE). QE is the process by which the Fed substantially increases the flow of credit in a stuck financial system.
It is a non-standard policy measure used when credit has dried up because banks will not lend to each other (out of the fear of counterparty default). It is a last resort when simply lowering interest rates is unlikely to achieve the necessary result. It was the Fed's weapon of choice to combat the credit crunch that occurred during the Great Financial Crisis in 2008. It involves the Fed printing more Dollars and using them to buy US government bonds predominantly from financial institutions. QE usually leads to a weaker US Dollar.
What is Quantitative Tightening and how does it influence the US Dollar?
Quantitative tightening (QT) is the reverse process whereby the Federal Reserve stops buying bonds from financial institutions and does not reinvest the principal from the bonds it holds maturing in new purchases. It is usually positive for the US Dollar.
USD/CNY has gained upward momentum in recent weeks. Nonetheless, economists at MUFG Bank expect the pair to move back lower.
CNY to strengthen in the year ahead
“We still expect CNY to strengthen in the year ahead, albeit with less degree of appreciation against the US Dollar.”
“Steadier and faster growth for China’s economy in the second half of this year should help improve market sentiment.”
“We expect USD/CNY to drop back to 6.8500 by the end of Q2 2023 and 6.6500 by the end of this year.”
- Silver oscillates in a narrow trading band around the 100-day SMA on Wednesday.
- The setup still favours bearish traders and supports prospects for further losses.
- A sustained strength beyond the $24.25-30 hurdle could offset the negative bias.
Silver struggles to capitalize on the overnight bounce from the vicinity of the $23.00 mark or the 50% Fibonacci retracement level of the March-May rally - and oscillates in a narrow trading band on Wednesday. The white metal seesaws between tepid gains/minor losses through the first half of the European session and currently trades just below mid-$23.00s, nearly unchanged for the day.
Against the backdrop of the recent failures near the $24.00 mark and the overnight slide below the technically significant 100-day Simple Moving Average (SMA) favours bearish traders. Moreover, technical indicators on the daily chart are holding deep in the negative territory and are still far from being in the oversold zone. This, in turn, suggests that the path of least resistance for the XAG/USD is to the downside and supports prospects for an extension of the retracement slide from over a one-year top, around the $26.15 region touched earlier this month.
Some follow-through selling below the $23.00 mark, or the 50% Fibo. level will reaffirm the negative outlook. The XAG/USD might then accelerate the fall towards intermediate support near the $22.60-$22.55 region before eventually dropping to the 61.8% Fibo. level, around the $22.25-$22.20 region. This is followed by the $22.00 mark, which if broken decisively will set the stage for a further near-term depreciating move.
On the flip side, any subsequent recovery is more likely to attract fresh sellers and remain capped near the 38.2% Fibo. level, around the $23.75 area. This is closely followed by the $24.00 round-figure mark and resistance near the $24.20-$24.25 region. A sustained strength beyond the latter might negate the near-term bearish outlook and prompt an aggressive short-covering rally. This should allow the XAG/USD to aim back to reclaim the $25.00 psychological mark.
Silver daily chart
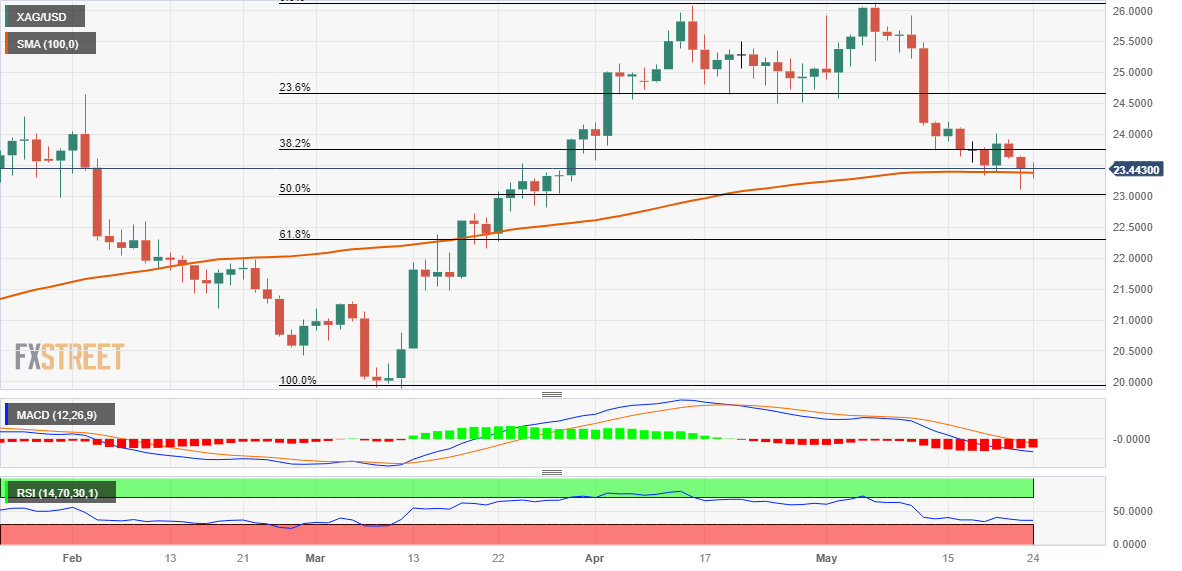
Key levels to watch
The continuation of the upside bias could propel USD/CNH to the 7.1200 region in the short-term horizon, comment UOB Group’s Economist Lee Sue Ann and Markets Strategist Quek Ser Leang.
Key Quotes
24-hour view: “We expected USD to strengthen yesterday but we were of the view that it ‘is unlikely to challenge last Friday’s high of 7.0750’. While our view was correct as USD rose to 7.0721, it broke above 7.0750 in Asian trade today. Strong upward momentum is likely to lead to further advance and it might break above the major resistance at 7.0960. Support is at 7.0600, followed by 7.0450.”
Next 1-3 weeks: “We have held a positive USD view for close to 2 weeks now. In our latest narrative from two days ago (22 May, spot at 7.0215), we noted that short-term upward momentum is beginning to fade and the chance of USD rising to 7.0960 this time around has diminished. We added, ‘only a break of 7.0000 would indicate the USD strength has ended’. Yesterday, USD soared to 7.0721 and it extended its advance in Asian trade. The boost in momentum suggests USD is likely to break above 7.0960. A breach of this level will shift the focus to 7.1200. On the downside, the ‘strong support’ level has moved higher from 7.0000 to 7.0280.”
CME Group’s flash data for natural gas futures markets noted traders scaled back their open interest positions for the third session in a row on Tuesday, now by around 1.4K contracts. In the same line, volume shrank for the third consecutive session, this time by around 90.6K contracts.
Natural Gas: Interim support comes near $2.280
Tuesday’s decline in prices of the natural gas came amidst declining open interest and volume and removes strength from the likelihood of further weakness in the very near term at least. That said, there is a temporary contention area around the 55-day SMA near the $2.28 mark per MMBtu.
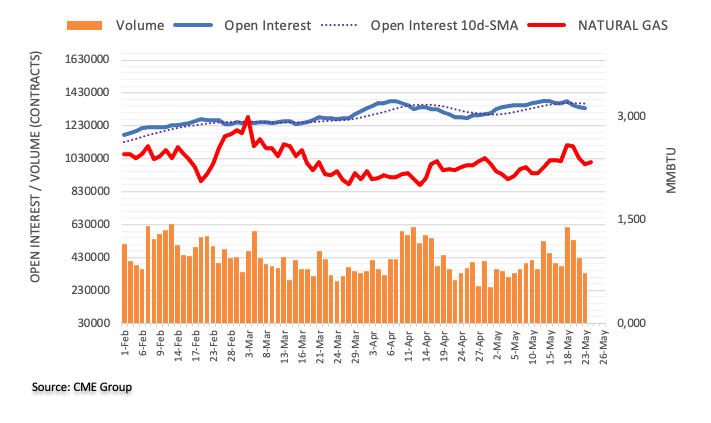
Economists at TD Securities like EUR versus some European peers like SEK, NOK and GBP.
ECB remains relatively more hawkish than both the Fed and the BoE
“Despite recent dovish tones in Fed speeches, the ECB remains relatively more hawkish than both the Fed and the BoE. Coupled with the supportive terms of trade tailwinds, this could provide some cushion for EUR downside if the positioning squeeze intensifies.”
“Nevertheless, the current transitional phase in the FX market during the early summer months is likely to favor RV strategies rather than a broad focus on the direction of the USD.”
“We maintain a positive outlook on EUR against SEK, NOK, and GBP in the coming months.”
Further buying interest could lift USD/JPY above the 139.00 region in the next few weeks, according to UOB Group’s Economist Lee Sue Ann and Markets Strategist Quek Ser Leang.
Key Quotes
24-hour view: “Yesterday, we indicated that USD could advance further but ‘it remains to be seen if it has enough momentum to break clearly above 139.00 today’. Our view was not wrong as USD rose briefly to 138.90 and then eased off to close little changed at 138.58 (0.01%). The price actions are likely part of a consolidation phase and today, we expect USD to trade between 138.00 and 138.90.”
Next 1-3 weeks: “Our update from yesterday (23 May, spot at 138.) still stands. As highlighted, short-term upward momentum appears to be building again and the odds of USD breaking clearly above 139.00 have increased. The next level to focus on is 139.60. On the downside, a breach of 137.55 (‘strong support’ previously at 137.30) would indicate that the USD strength that started early last week has ended.”
Considering advanced prints from CME Group for crude oil futures markets, open interest increased by around 9.7K contracts on Tuesday, adding to the previous daily build. Volume followed suit and went up by around 206.8K contracts, reversing the previous daily pullback.
WTI: Longer-term barrier comes at $80.00
Prices of WTI extended the positive start of the week amidst rising open interest and volume on Tuesday. Against that, the commodity could see its rebound pick up impulse and shift its focus to the key barrier at the $80.00 mark per barrel, and area also reinforced by the 200-day SMA.
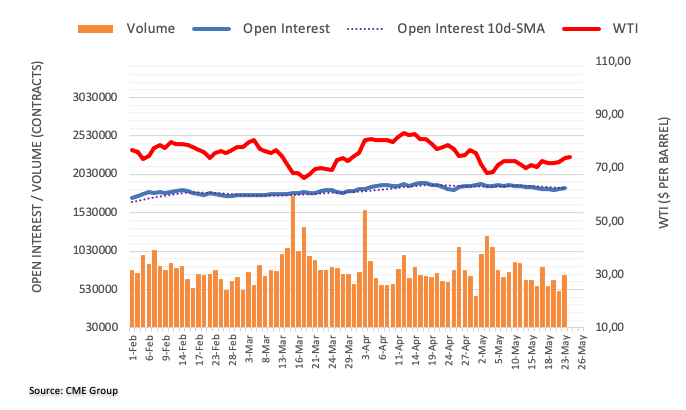
UK Finance Minister Jeremy Hunt said on Wednesday, they “must get inflation down so we could safely cut taxes.”
Additional comments
Today's inflation data shows there is no room for complacency.
Target of halving inflation this year is absolutely deliverable.
Biggest way to put money in people's pockets is by halving inflation.
Tax cuts now would be the wrong thing to do.
Market reaction
At the time of writing, GBP/USD is trading at 1.2409, modestly lower on the day, having erased all if its intraday gains.
In the view of UOB Group’s Economist Lee Sue Ann and Markets Strategist Quek Ser Leang, AUD/USD still faces downside risks in the near term.
Key Quotes
24-hour view: “We expected AUD to trade in a range between 0.6630 and 0.6675 yesterday. We did anticipate the sharp decline as AUD fell to a low of 0.6608. Further decline appears likely even though the major support at 0.6575 could be out of reach today. Resistance is at 0.6635; a break of 0.6655 would indicate that AUD is not weakening further.”
Next 1-3 weeks: “On Monday (22 May, spot at 0.6655), we indicated that AUD has to break and stay below 0.6630 in the next 1-2 days or the chance of it declining further to 0.6575 will fizzle out. Yesterday (23 May), AUD broke below 0.6630 and fell to a low of 0.6608. While the risk for AUD is still on the downside, it is worth noting that the levels between 0.6565 and 0.6575 are very strong support. On the upside, a breach of 0.6670 (‘strong resistance’ level previously at 0.6685) would indicate that the downward pressure in AUD that started more than a week ago has faded.”
International Monetary Fund’s (IMF) Managing Director Kristalina Georgieva said on Wednesday, “I'm confident the US won't default.”
Additional takeaways
“We don't expect a rapid shift in dollar's reserves, 'don't kiss your dollars goodbye yet'.”
“Rates won’t start to fall until 2024, early 2025.”
Open interest in gold futures markets dropped for yet another session on Tuesday, this time by around 1.4K contracts according to preliminary readings from CME Group. Volume, instead, resumed the uptrend and rose by around 65.4K contracts.
Gold faces initial resistance around $1980
Tuesday’s uptick in gold prices came amidst shrinking open interest, which leaves the prospects for extra gains somewhat curtailed in the very near term. Furthermore, the precious metal should meet a temporary hurdle around the 55-day SMA at $1980 per ounce troy.
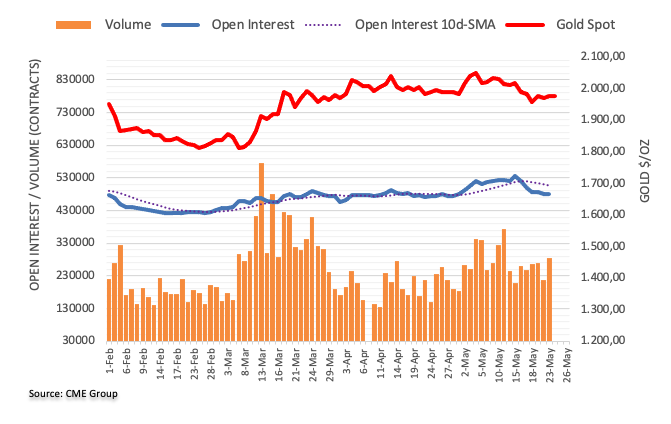
Further decline in GBP/USD remains in store as long as it trades below 1.2500, note UOB Group’s Economist Lee Sue Ann and Markets Strategist Quek Ser Leang.
Key Quotes
24-hour view: “We did not anticipate the increase in volatility as GBP plummeted to 1.2373 and then snapped back up to the day at 1.2416 (-0.15%). The sharp rebound from the low suggests GBP is unlikely to weaken much further. Today, GBP is more likely to trade in a range between 1.2385 and 1.2465.”
Next 1-3 weeks: “Two days ago (22 May, spot at 1.2460), we highlighted that downward momentum has slowed but only a clear break above 1.2500 would indicate that the GBP weakness has come to an end. Yesterday, we indicated that ‘if GBP breaks below 1.2390 in the next couple of days, the next level to watch is 1.2350’. In London trade, GBP broke below 1.2390 in London and then rebounded strongly from 1.2373. Despite breaking 1.2390, there is no clear increase in momentum. That said, the downside risk remains as long as GBP does not break above 1.2500.”
- GBP/USD attracts some intraday buying in reaction to stronger UK inflation data.
- Expectations for fewer BoE rate hikes cap any further gains amid a bullish USD.
- Investors now look to the FOMC meeting minutes for a fresh directional impetus.
The GBP/USD pair fades an intraday bullish spike to the 1.2470 region and retreats to the lower end of its daily trading range during the first half of the European session. The pair is currently placed around the 1.2420 area and seems vulnerable to prolonging its recent retracement slide witnessed over the past two weeks or so.
The British Pound (GBP) did get a minor lift in a knee-jerk reaction to the release of stronger-than-expected UK inflation figures, though the intraday uptick runs out of steam rather quickly. The Office for National Statistics reported that the headline UK CPI rose 8.7% YoY in April as compared to consensus estimates for a reading of 8.2%. This, however, marks a sharp deceleration from the 10.1% YoY rate registered in March, reaffirming expectations that fewer rate increases by the Bank of England (BoE) will be needed in the coming months to bring down inflation. This, along with the underlying bullish sentiment surrounding the US Dollar (USD), contributes to capping the upside for the GBP/USD pair.
In fact, the USD Index (DXY), which tracks the Greenback against a basket of currencies, stands tall near a two-month high set on Tuesday and continues to draw support from the possibility of further rate hikes by the Federal Reserve (Fed). The speculations were fueled by the recent hawkish comments by several Fed officials, suggesting that the US central bank will keep rates higher for longer. Apart from this, a softer risk tone - amid worries about the slowing global economy and the US debt ceiling woes - further benefits the Greenback's relative safe-haven status. This, in turn, attracts some sellers around the GBP/USD pair, though the downside remains cushioned ahead of the release of the FOMC minutes.
Investors will look for fresh clues about the Fed's rate-hike path, which will play a key role in influencing the near-term USD price dynamics and provide a fresh directional impetus to the GBP/USD pair. Nevertheless, the aforementioned fundamental backdrop seems tilted in favour of bearish traders and suggests that the path of least resistance for spot prices is to the downside. Even from a technical perspective, the overnight breakdown below the 50-day Simple Moving Average (SMA) supports prospects for an extension of the pullback from over a one-year high touched earlier this month.
Technical levels to watch
USD/ZAR has extended its uptrend after overcoming the peaks of last October/March. Economists at Société Générale expect the pair to enjoy further gains.
Technicals for USD/ZAR look overbought
“Domestic factors and higher US bond yields are clouding the near-term outlook for the Rand.”
“Though technicals for USD/ZAR look overbought, a retest of the highs at 19.50 cannot be ruled out if the bear trend in global bonds continues.”
“Next potential objectives are located at projections of 19.72 and the upper limit if a multi month channel near 20.20.”
Following the release of the German IFO Business Survey, the institute’s Economist Klaus Wohlrabe said that the “German economy heading towards stagnation in Q2.”
Additional quotes
German economy is treading water.
Strong collapse in expectations in industry is striking.
Industry export expectations have fallen markedly.
Rate hikes have appeared to dampen demand.
Market reaction
EUR/USD was last seen trading at 1.0782, up 0.12% on the day.
We are seeing the Euro a little softer across the board this week. Economists at ING believe that the EUR/USD pair could test the 1.0700 level.
Dollar correction may have a little further to run
“Yesterday’s release saw May flash PMIs on the soft side, but inflation in the service sector did stay resilient – which will be troubling for the ECB.”
“We think this Dollar correction may have a little further to run and EUR/USD could trade down to the 1.0700 area if the Fed fails to play down the risk of future rate hikes.”
- German IFO Business Climate Index declined modestly in May.
- EUR/USD clings to small daily gains but stays below 1.0800.
The headline German IFO Business Climate Index edged lower to 91.7 in May from 93.4 in April (revised from 93.6). This reading came in weaker than the market expectation of 93.
Meanwhile, the Current Economic Assessment dropped to 88.6 from 93.1 and the IFO Expectations Index – indicating firms’ projections for the next six months, improved to 94.8 from 91.7, surpassing analysts' estimate of 91.9.
Market reaction
EUR/USD showed no immediate reaction to this report and was last seen posting small daily gains at 1.0785.
About German IFO
The headline IFO business climate index was rebased and recalibrated in April after the IFO Research Institute changed the series from the base year of 2000 to the base year of 2005 as of May 2011 and then changed the series to include services as of April 2018. The survey now includes 9,000 monthly survey responses from firms in the manufacturing, service sector, trade and construction.
- EUR/USD looks to extend the rebound from 1.0760.
- IFO Business Climate in Germany surprised to the downside.
- ECB C. Lagarde speaks later in the European evening.
The single currency regains some poise and now lifts EUR/USD to the 1.0790 region on Wednesday.
EUR/USD focuses on Lagarde, data, debt ceiling
EUR/USD regains some upside traction following Tuesday’s marked pullback and attempts to leave behind the area of recent monthly lows around 1.0760 on Wednesday.
In the meantime, the tepid recovery attempt in the pair comes along an improvement in the risk-associated universe despite US debt talks now seem to have entered a pause until the next week, according to latest news.
No reaction in the FX universe from the lower-than-expected Business Climate tracked by the IFO institute in Germany. Indeed, the survey showed a drop to 91.7 in May while Current Conditions receded to 88.6 (from 94.8) and Expectations improved to 94.8 (from 92.2).
Data wise in the US, usual weekly MBA Mortgage Applications are due seconded by the publication of the FOMC Minutes of the May event.
What to look for around EUR
EUR/USD attempts another move to retake the 1.0800 hurdle and beyond on Wednesday.
The movement of the euro's value is expected to closely mirror the behaviour of the US Dollar and will likely be impacted by any differences in approach between the Fed and the ECB with regards to their plans for adjusting interest rates.
Moving forward, hawkish ECB-speak continue to favour further rate hikes, although this view appears in contrast to some loss of momentum in economic fundamentals in the region.
Key events in the euro area this week: Germany IFO Business Climate (Wednesday) – Germany Final Q1 GDP Growth Rate, GfK Consumer Confidence (Thursday) – Italy, France Consumer Confidence (Friday).
Eminent issues on the back boiler: Continuation of the ECB hiking cycle in June and July (and September?). Impact of the Russia-Ukraine war on the growth prospects and inflation outlook in the region. Risks of inflation becoming entrenched.
EUR/USD levels to watch
So far, the pair is gaining 0.11% at 1.0780 and a break above 1.0876 (55-day SMA) would target 1.1000 (round level) en route to 1.1095 (2023 high April 26). On the other hand, immediate contention aligns at 1.0759 (monthly low May 19) seconded by 1.0712 (low March 24) and finally 1.0516 (low March 15).
- NZD/USD comes under intense selling pressure in reaction to the FBNZ’s surprise dovish shift.
- The USD stands tall near a two-month high and further contributes to the steep intraday slide.
- The fundamental backdrop favours bearish traders as the focus shifts to the FOMC minutes.
The NZD/USD pair extends the previous day's rejection slide from the 0.6300 round-figure mark and comes under heavy selling pressure after the Reserve Bank of New Zealand (RBNZ) announced its policy decision this Wednesday. The downward trajectory remains uninterrupted through the early part of the European session and drags spot prices to a nearly one-month low, around the 0.6130 region in the last hour.
The New Zealand dollar tumbled across the board after the RBNZ caught markets off-guard and signalled it was done with its most aggressive hiking cycle since 1999. It is worth recalling that the central bank raised its official cash rate (OCR) by 25 bps earlier this Wednesday, to 5.5% - the highest level since the 2008 financial crisis. In the accompanying monetary policy statement, the RBNZ forecasts the official cash rate to peak at its current level, which, along with a bullish US Dollar (USD), prompts aggressive selling around the NZD/USD pair.
In fact, the USD Index (DXY), which tracks the Greenback against a basket of currencies, holds steady near a two-month high touched on Tuesday amid expectations that the Federal Reserve (Fed) will keep interest rates higher for longer. In fact, the markets are now pricing in the possibility of another 25 bps lift-off in June and the bets were reaffirmed by the recent hawkish comments by several Fed officials. Apart from this, worries about slowing global economic growth, further benefit the safe-haven buck and weigh on the risk-sensitive Kiwi.
The USD bulls, meanwhile, seem reluctant and prefer to wait for the release of the FOMC meeting minutes, due later during the US session. The minutes will be closely scrutinized for clues about the Fed's rate-hike path, which will drive the USD in the near term and provide a fresh directional impetus to the NZD/USD pair. Nevertheless, the RBNZ's unexpected dovish shift suggests that the path of least resistance for spot prices is to the downside. Hence, any attempted recovery move might still be seen as a selling opportunity and fizzle out rather quickly.
Technical levels to watch
USD/CNY has broken out to new 2023 highs, suggesting further upside is likely, according to economists at Credit Suisse.
Key support seen at 6.9639/9560
“USD/CNY has broken out above a series of important resistance levels starting at 6.9733 and stretching up to 6.9982/7.0082, with an associated pickup in short and medium-term momentum indicators.”
“With the USD turning stronger and the Chinese recovery from covid lockdowns underwhelming, we see a strong case for further upside, with next resistance seen at 7.0843, then the 78.6% retracement of the 2022/23 fall at 7.1982.”
“Key support at the 6.9639/9560 breakout zone ideally holds.”
EUR/USD risk stays seen lower for a test of the lower end of its five-month channel, analysts at Credit Suisse report.
Move above 1.0906 is now needed to warn of strength back
“EUR/USD maintains its decisive rejection from the top of the shallow uptrend channel from the beginning of January and with support from the 55-DMA removed as looked for this should confirm a more important downturn. We thus stay tactically negative looking for a fall to support next at 1.0729/14 and eventually the lower end of the channel, now at 1.0550.”
“Above 1.0906 is now needed to warn of strength back to retest 1.1097/1.1107, but with a fresh cap expected here.”
David Jacobs, head of domestic markets at the Reserve Bank of Australia (RBA), said on Wednesday, he expects the balance sheet unwinding process to run smoothly, though are attentive to the challenges involved.
Additional quotes
“Its balance sheet starting to unwind pandemic bond purchases; around $20 billion of purchased bonds have matured.”
“Pace of these maturities will increase to around A$35–45 bln per year.”
“Around A$4bln of TFF funding has been repaid so far; large maturities are due ahead of September this year and June next year.”
“As its bond holdings fall, process of private sector absorbing more issuance might place some modest upward pressure on yields.”
“Decline in es balances will be particularly rapid as TFF rolls off; has potential to cause some strains.“
“ES balances will remain well above pre-pandemic levels for some time, so will be ample for the banking system’s payment needs.”
Market reaction
AUD/USD is testing daily lows near 0.6570 on the above comments, losing 0.53% on the day. The Aussie bears the brunt of a dovish RBNZ policy announcement and a cautious market mood.
Here is what you need to know on Wednesday, May 24:
Investors cling to a cautious approach mid-week amid a lack of progress in US debt-ceiling negotiations between Republicans and White House. US stock index futures trade modestly lower in the European morning and the US Dollar Index consolidates Tuesday's gains. IFO sentiment survey from Germany will be featured in the European economic docket. In the late American session, the US Federal Reserve (Fed) will release the minutes of May policy meeting.
FOMC Minutes Preview: The complicated task of searching for clues.
During the Asian trading hours on Wednesday, the Reserve Bank of New Zealand (RBNZ) announced that it raised its policy rate by 25 basis points to 5.5% as expected. The policy statement revealed that the RBNZ expects to hold the rate unchanged at 5.5% by September. In the post-policy meeting press conference, "we are getting on top of inflation," RBNZ Governor Adrian Orr said and noted that the labour market was becoming less pressured. NZD/USD fell sharply and was last seen trading at its lowest level in nearly a month at 0.6150, losing more than 1.5% on a daily basis.
The UK's Office for National Statistics reported early Wednesday that the Consumer Price Index rose 8.7% on a yearly basis in April. This reading followed the 10.1% increase recorded in March but surpassed the market expectation of 8.2%. The Core CPI, which excludes volatile food and energy prices, increased 6.8%, compared to analysts' estimate of 6.2%. Finally, the Retail Price Index rose 11.4%, down from 13.5% in March. Following the stronger-than-expected inflation figures, GBP/USD gained traction and climbed above 1.2450.
EUR/USD touched its lowest level in two months at 1.0760 on Tuesday and spent the Asian session in a very tight range on Wednesday. The pair tries to stage a rebound early Wednesday but stays well below 1.0800. European Central Bank President Lagarde will be delivering a speech at 1745 GMT.
Following Monday's upsurge, USD/JPY fluctuated in a narrow range on Tuesday and closed the day flat. The pair remains indecisive early Wednesday and moves up and down at around 138.50.
Gold price fell toward $1,950 on Tuesday but managed to stage a rebound in the late American session amid retreating US Treasury bond yields. XAU/USD consolidates its losses near $1,970 in the European morning.
Bitcoin registered modest gains for the second straight day on Tuesday but came under renewed bearish pressure early Wednesday. BTC/USD was last seen losing nearly 2% on the day at $26,700. Ethereum rose toward $1,900 on Tuesday but lost its traction before testing that level. ETH/USD stays on the back foot and declined toward $1,800 in the European morning.
- Gold price meets with a fresh supply on Wednesday, though the downside seems cushioned.
- Hawkish Federal Reserve expectations underpin the US Dollar and cap gains for the XAU/USD.
- Looming recession risks and US debt ceiling woes could lend support to the safe-haven metal.
Gold price struggles to capitalize on its modest intraday uptick and attracts some selling near the $1,980 region during the early European session on Wednesday. The XAU/USD drops back closer to the $1,970 level in the last hour and for now, seems to have stalled the overnight bounce from the vicinity of the monthly low touched last week.
Hawkish Federal Reserve expectations cap gains for Gold price
The recent hawkish remarks by several Federal Reserve (Fed) officials raised the possibility of further rate hikes, with markets now pricing in a 30% chance of another 25 basis points (bps) lift-off in June. This turns out to be a key factor acting as a headwind for the non-yielding Gold price. Hence, the market focus will remain glued to the release of the Federal Open Market Committee (FOMC) meeting minutes, due later during the US session. Investors will look for clues about the future rate-hike path, which will play a key role in influencing the near-term US Dollar (USD) price dynamics and provide a fresh directional impetus to the XAU/USD.
US debt ceiling woes and looming recession risks lend support to XAU/USD
In the meantime, the lack of progress in talks over increasing the United States (US) debt ceiling, along with worries about a global economic slowdown, could limit the downside for the safe-haven Gold price. It is worth recalling that Representatives of President Joe Biden and congressional Republicans ended another round of debt ceiling negotiations on Tuesday without an agreement to raise the government's $31.4 trillion borrowing limit. This raises fears of an unprecedented American debt default and weighs on investors' sentiment. Apart from this, looming recession risks might further hold back bears from placing aggressive bets around the XAU/USD.
Bullish US Dollar might continue to act as a headwind for Gold price
The market concerns resurfaced on Tuesday after the flash Eurozone PMIs showed that the overall business activity slowed slightly more than anticipated as the dominant services industry lost a little of its shine and the downturn in the manufacturing sector deepened in May. This comes on the back of dismal Chinese macro data released last week, which indicated that the world's second-largest economy underperformed in May. This, in turn, warrants some caution before positioning for the resumption of the recent pullback from the all-time high. The upside potential, meanwhile, seems limited amid the underlying bullish sentiment surrounding the USD.
In fact, the USD Index (DXY), which tracks the Greenback against a basket of currencies, holds steady near a two-month high touched on Tuesday amid firming expectations that the Fed will keep interest rates higher for longer. This might continue to undermine demand for the US Dollar-denominated Gold price ahead of the crucial FOMC meeting minutes. Traders will further take cues from the US debt ceiling negotiations, which, along with the US bond yields, will drive the USD demand. Apart from this, the broader risk sentiment might further contribute to producing short-term trading opportunities around the XAU/USD.
Gold price technical outlook
From a technical perspective, the $1,955-$1,950 region now seems to have emerged as an immediate strong support. This is followed by the 100-day Simple Moving Average (SMA), currently pegged around the $1.935-$1,930 area. A convincing break below the latter will be seen as a fresh trigger for bearish traders and expose the $1,900 round-figure mar.
On the flip side, the $1,980-$1,984 supply zone might continue to act as a strong barrier, which if cleared decisively could trigger a short-covering rally. The Gold price might then aim to reclaim the $2,000 psychological mark and climb further towards the next relevant hurdle near the $2,020-$2,025 region. Some follow-through buying will negate any near-term negative outlook and shift the bias back in favour of bullish traders.
Key levels to watch
The Reserve Bank of New Zealand (RBNZ) hiked its key policy rate by 25 bps to 5.5%. Following the decision, the New Zealand Dollar slumped. Economists at ING believe that NZD/USD could test 0.61.
RBNZ may be done with tightening
“The RBNZ surprised markets with a dovish 25 bps hike. The decision to hike by 25 bps today was a close one (five to two vote split), and rate projections signal this is indeed the peak of the tightening cycle in New Zealand.”
“NZD/USD fell sharply after the announcement, trading below 0.6200, and may test 0.6100 by the end of the week if USD momentum remains strong.”
- AUD/USD takes offers to refresh monthly low, extends previous day’s fall.
- Clear downside break of 2.5-month-old ascending trend line, bearish MACD signals favor sellers.
- Below 50.0 RSI levels, nearness to key supports suggest limited downside room for Aussie bears to cheer.
AUD/USD drops to a fresh low since late April as bears cheer technical breakdown, as well as trace New Zealand Dollar (NZD), amid early Wednesday morning in Europe. In doing so, the Aussie pair prints a two-day downbeat as it flashes 0.6585 level by the press time.
That said, a daily close below the 10-week-long rising support line and bearish MACD signals keep the Aussie pair sellers hopeful. However, lows marked in April and March, respectively around 0.6575 and 0.6565, can lure intraday bears.
It’s worth noting though that the October 2022 peak joins the 61.8% Fibonacci retracement level of the pair’s run-up from the last October to February to highlight the 0.6545 mark as short-term key support.
In a case where the Aussie pair breaks the same, the odds of witnessing a fall towards November’s low of near 0.6270 can’t be ruled out.
On the contrary, the support-turned-resistance line, around 0.6610 by the press time, limits the immediate upside of the Aussie pair.
Following that, a convergence of the 21-DMA and 50% Fibonacci retracement, close to 0.6670 at the latest, could challenge the AUD/USD bulls.
Above all, the 100-DMA and 38.2% Fibonacci retracement surrounding 0.6780 holds the key to the buyer’s dominance.
AUD/USD: Daily chart
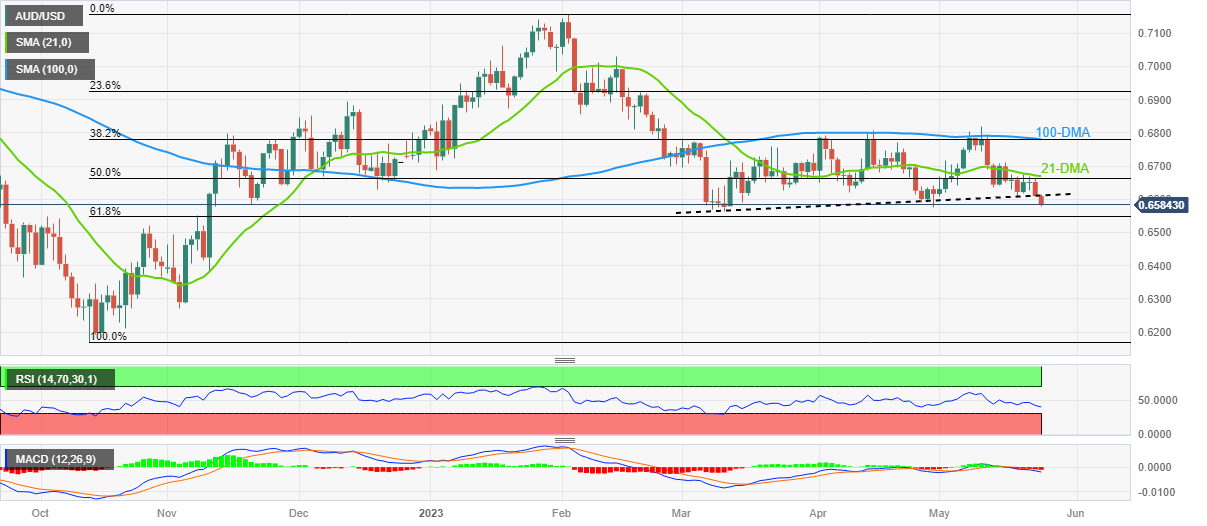
Trend: Limited downside expected
USD/JPY has seen a strong move higher for a break above key price and “neckline” resistance at 137.70/98 to set an important base, which is expected to clear the way for a more important turn higher, analysts at Credit Suisse report.
USD/JPY has already established a base
“USD/JPY has seen a further strong move higher for a break above key price and ‘neckline’ resistance at 137.70/98 to negate our ‘triangle’ roadmap and instead set an important base. This is expected to clear the way for a more important turn higher with resistance then seen next at the 50% retracement of the 2022/2023 fall at 139.54/59, then the 61.8% retracement and late November 2022 high at 142.25/50, which we look to prove a tougher initial barrier.”
“Support is seen at 107.29/10 initially, with 135.60 now ideally holding fresh pullbacks if seen.”
FX option expiries for May 24 NY cut at 10:00 Eastern Time, via DTCC, can be found below.
- EUR/USD: EUR amounts
- 1.0750-60 1.3b
- 1.0830 401m
- GBP/USD: GBP amounts
- 1.2350 350m
- 1.2375 641m
- USD/JPY: USD amounts
- 137.95-138.00 406m
- 138.25 500m
- AUD/USD: AUD amounts
- 0.6610 555m
- 0.6700 834m
- USD/CAD: USD amounts
- 1.3400 463m
- 1.3495 432m
- 1.3525 332m
- EUR/GBP: EUR amounts
- 0.8660 200m
- 0.8700 403m
Central banks and most economists are forecasting inflation will broadly return to 2% at the end of their forecast horizons. But will it? Economists at Nomura share their thoughts.
Will inflation settle at 2%?
“There may be tail risks of inflation settling at higher than 2% in both the medium and long term, although for now, this is not our base case.”
“In the medium term, labour markets may remain sufficiently tight and inflation expectations may prove to be stubbornly high. In the long term, we think the climate transition, demographic challenges and de-globalisation will make achieving 2% inflation increasingly challenging.”
“Central banks have a 2% inflation target. Does that mean these targets go out of the window? We don’t think so. A 2% target is essential to maintain the credibility of central banks.”
“Instead of entering a world of permanently higher inflation, we believe we are more likely to enter a world of permanently higher interest rates and lower long-run growth.”
GBP/USD picks up bids to refresh intraday high as UK inflation for April offers positive surprise.
UK CPI marks 8.7% YoY numbers for April versus 10.1% prior, 8.2% expected.
Pound Sterling benefits from US Dollar’s retreat amid an impasse in debt ceiling talks.
BoE’s Bailey needs to defend hawkish bias to favor Cable buyers.
GBP/USD renews intraday high near 1.2465 as the UK’s inflation numbers rose more than expected in April. Adding strength to the Cable pair’s latest run-up could be the US Dollar’s retreat ahead of the key data/events, as well as due to fresh fears of US default.
That said, the UK’s inflation, per the Consumer Price Index (CPI) gauge, rose 8.7% YoY in April compared to 10.1% marked in the last month and 8.2% forecasts.
Also read: Breaking: UK annualized CPI inflation falls to 8.7% in April vs. 8.2% expected
The strong inflation data justifies the latest hawkish bias of the Bank of England (BoE) officials including Governor Andrew Bailey, during the previous day’s BoE Monetary Policy Hearings. The same allows the Pound Sterling to brace for the biggest daily gain in a week.
Apart from the UK data, the US Dollar’s weakness also favors the GBP/USD buyers as the US Dollar Index (DXY) snaps a two-day winning streak as it prints mild losses around 103.45 by the press time. While tracing the USD’s recent retreat, the ongoing US debt ceiling drama gains major attention as policymakers recently struggle to justify the hopes of avoiding default.
On the contrary, firmer prints of the US data and hawkish Fed concerns challenge the Cable pair buyers. That said, the odds of witnessing a 0.25% rate hike in June’s Fed meeting recently increased and allow the US Dollar to remain firmer.
Talking about the sentiment, the risk profile remains dicey as S&P500 Futures ignore Wall Street’s downbeat performance to print mild gains whereas the US 10-year and two-year Treasury bond yields retreated from the highest levels since early March the previous day.
Having witnessed the initial reaction to the UK inflation numbers, the GBP/USD pair may witness a lackluster session as traders could turn cautious ahead of a speech from BoE Governor Andrew Bailey and Minutes of the latest Federal Open Market Committee (FOMC) Monetary Policy Meeting.
Technical analysis
A daily closing beyond the 50-DMA hurdle of around 1.2430 becomes necessary to defend the GBP/USD pair’s latest run-up.
- EUR/USD has stretched its rebound move above 1.0780 amid a sluggish performance by the USD Index.
- Federal Reserve Powell favored a pause in the rate-hiking spell amid tight credit conditions by US regional banks.
- European Central Bank Lagarde is expected to throw some light on June’s monetary policy.
- EUR/USD is oscillating inside the 50% and 61.8% Fibonacci retracements plotted at 1.0806 and 1.0738 respectively.
EUR/USD has stretched its recovery further above the immediate resistance of 1.0780 in the early European session. The major currency pair has got some traction as the US Dollar Index (DXY) is balancing below 103.50. Earlier, the shared currency pair rebounded after dropping to near 1.0760 as the USD Index faced stiff barricades in extending its upside rally further above the previous week’s high at 103.62.
S&P500 futures have managed to hold gains added in Asia and have taken further in early London, portraying a minor recovery in the risk appetite of the market participants. US indices witnessed an intense sell-off on Tuesday as investors eased positions in technology stocks. Investors are worried as a delayed response on US debt-ceiling issues by US President Joe Biden has triggered fears of a default by the Federal government.
Broadly, the US Dollar Index is showing signs of volatility contraction below 103.60 as investors are awaiting the release of the Federal Open Market Committee (FOMC) minutes for May’s monetary policy meeting.
Fears of a catastrophic US default deepen
Fears of investors that the United States economy would announce a default after June 01 while addressing its obligated payments are deepening. US House Speaker Kevin McCarthy told House Republicans during a closed GOP meeting on Tuesday that “I need you all to hang with me on the debt limit, we are nowhere near a deal yet,” This indicates that expectations of a bipartisan by Republicans with the White House are losing its spirit.
No fresh commentary from US President Joe Biden over the agreement of a rise in US borrowing cap is making the market participants extremely anxious. US Treasury Secretary is continuously warning that the Federal will be out of funds by June 01, which would cause the loss of millions of jobs domestically. Also, it will bring chaos in global financial markets and would lead to a spike in interest rates.
FOMC minutes to remain in spotlight
For making a decisive action, investors are awaiting the release of the FOMC minutes. The minutes for May’s monetary policy meeting are expected to provide a detailed explanation behind the 25 basis points (bps) interest rate hike by the Federal Reserve (Fed). Also, it will provide current economic prospects and guidance about interest rates.
However, Federal Reserve chair Jerome Powell in a meeting on Friday favored a pause in the rate-hiking spell as tight credit conditions by US regional banks have squeezed the flow of credit into the economy. Firms are facing working capital issues due to the enrolment of more filters by US banks, which could force them to underutilize their entire capacity.
European Central Bank President Christine Lagarde’s speech in focus
A power-pack action was delivered by the Euro remained on Tuesday after the release of mixed preliminary May PMI data. Manufacturing PMI contracted to 44.6 from the estimates of 46.2 and the former release of 45.8. A figure below 50.0 is measured as a contraction in manufacturing activities. While Services PMI jumped to 55.9 vs. the consensus of 55.6 but remained lower than the prior release of 56.2. Analysts at Commerzbank expect a slight decline in real GDP in the second half of the year.
On Wednesday, the speech from European Central Bank (ECB) President Christine Lagarde will be keenly watched. European Central Bank Lagarde is expected to throw some light on June’s monetary policy as she already announced that more than one interest rate hikes are appropriate to tame stubborn Eurozone inflation.
EUR/USD technical outlook
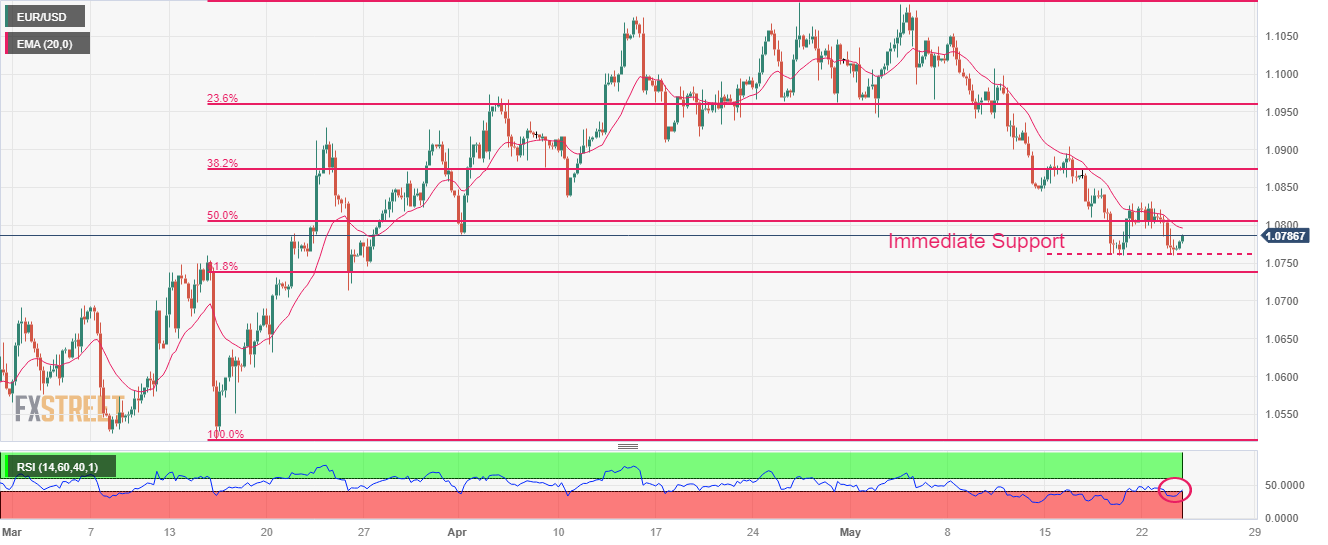
EUR/USD is oscillating inside the 50% and 61.8% Fibonacci retracements (plotted from March 15 low at 1.0516 to April 26 high at 1.1095) at 1.0806 and 1.0738 respectively on a four-hour scale. The 20-period Exponential Moving Average (EMA) at 1.0796 is acting as a strong barrier for the Euro bulls. The major currency pair has attempted a recovery move after finding strength near the immediate support plotted around 1.0760.
The Relative Strength Index (RSI) (14) is attempting a range shift move into the 40.00-60.00 zone from the bearish territory of 20.00-40.00, which indicates that the downside momentum has faded for now.
- UK CPI rises 8.7% YoY in April vs. 8.2% expected.
- Monthly UK CPI arrives at 1.2% in April vs. 0.8% expected.
- GBP/USD rises above 1.2450 on upbeat UK CPIs.
According to the latest data published by the UK Office for National Statistics (ONS) on Wednesday, the United Kingdom annualized Consumer Price Index (CPI) rose 8.7% in April against the 10.1% jump recorded in March. The market consensus was for an 8.2% increase.
Meanwhile, the Core CPI gauge (excluding volatile food and energy items) increased 6.8% YoY last month, compared with a 6.2% rise seen in March while beating expectations of a 6.2% clip.
The monthly figures showed that the UK Consumer Price Index climbed 1.2% in March vs. 0.8% estimates and 0.8% previous.
The UK Retail Price Index for April accelerated 1.5% MoM and 11.4% YoY, beating expectations across the time horizon.
An official from the UK Finance Minister Jeremy Hunt’s office said that “we must stick resolutely to plan to get inflation down.”
Meanwhile, Hunt noted, “although it is positive that it is now in single digits, food prices are still rising too fast.”
Additional takeaways (via ONS)
UK core CPI rate highest since March 1992.
Food and non-alcoholic drink inflation eased slightly to 19.1% from 19.2%.
FX implications
In an initial reaction to the UK CPI numbers, the GBP/USD pair jumped nearly 20 pips to hit daily highs at 1.2466 before reversing slightly to 1.2455, where it now wavers. The pair is up 0.32% on the day.
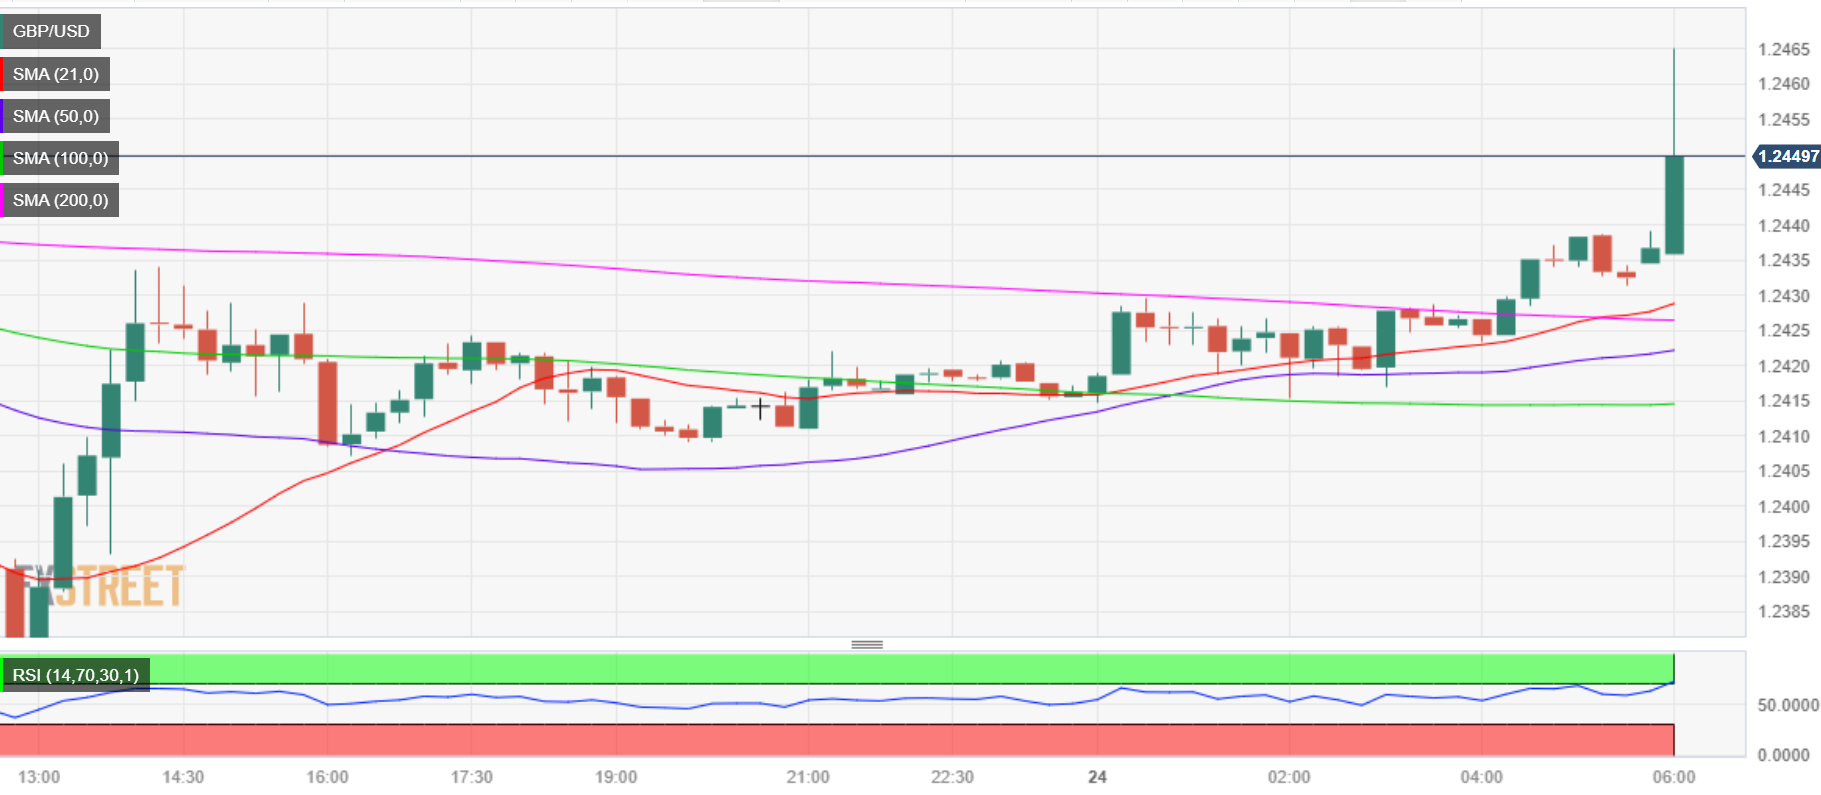
GBP/USD: 15-minutes chart
Why does UK inflation matter to traders?
The Bank of England (BOE) is tasked with keeping inflation, as measured by the headline Consumer Price Index (CPI) at around 2%, giving the monthly release its importance. An increase in inflation implies a quicker and sooner increase in interest rates or the reduction of bond buying by the BOE, which means squeezing the supply of pounds. Conversely, a drop in the pace of price rises indicates looser monetary policy. A higher-than-expected result tends to be GBP bullish.
- The index fades part of the recent 2-day advance on Wednesday.
- US debt talks entered an impasse on Tuesday.
- Weekly Mortgage Applications, FOMC Minutes next on tap.
The upside momentum in the greenback appears to struggle to gather fresh impulse beyond 103.50/60 when gauged by the USD Index (DXY).
USD Index focuses on debt ceiling, FOMC Minutes
The index comes under pressure and leaves behind two consecutive daily advances on the back of some recovery in the sentiment surrounding the risk complex on Wednesday.
In the meantime, negotiations to reach a deal to avoid an unprecedented US default have once again yielded no results on Tuesday and left the door open to an agreement on the last minute at some point during last week.
In the US docket, weekly Mortgage Applications tracked by MBA are due later ahead of the release of the FOMC Minutes of the May 3-4 gathering.
What to look for around USD
The index seems to have met some decent resistance area around 2-month highs near 103.60/70 so far this week.
In the meantime, monthly highs in the 103.60/65 band emerge as immediate targets for bulls amidst diminishing signals that the Fed will probably pause its normalization process in the near future, all in response to the steady resilience of key US fundamentals (employment and prices mainly).
Favouring a pause by the Fed, instead, appears the extra tightening of credit conditions in response to uncertainty surrounding the US banking sector.
Key events in the US this week: MBA Mortgage Applications, FOMC Minutes (Wednesday) – Initial Jobless Claims, Chicago Fed National Activity Index, Pending Home Sales, Advanced Q1 GDP Growth Rate (Thursday) – PCE/Core PCE, Durable Goods Orders, Flash Goods Trade Balance, Personal Income/Spending, Final Michigan Consumer Sentiment (Friday).
Eminent issues on the back boiler: Persistent debate over a soft/hard landing of the US economy. Terminal Interest rate near the peak vs. speculation of rate cuts in late 2023/early 2024. Fed’s pivot. Geopolitical effervescence vs. Russia and China. US-China trade conflict.
USD Index relevant levels
Now, the index is down 0.12% at 103.39 and faces the next support at the 55-day SMA at 102.45 seconded by 101.01 (weekly low April 26) and finally 100.78 (2023 low April 14). On the upside, a break above 103.65 (monthly high May 23) could open the door to 105.73 (200-day SMA) and then 105.88 (2023 high March 8).
- USD/JPY portrays bearish chart formation at the highest levels in six months.
- Downbeat MACD signals also lure Yen pair bears, 100-HMA, 200-HMA act as extra checks for sellers.
- Bulls need validation from 139.40 to retake control.
USD/JPY grinds lower past 139.00, mildly offered near 138.40 heading into Wednesday’s European session.
The Yen pair rose to a fresh high since November 2022 before posting an unimpressive closing the previous day. In doing so, the major currency pair portrays a one-week-old rising wedge bearish chart formation.
Not only the bearish pattern but the downbeat MACD signals and failure to remain firmer at the multi-day high also lures the USD/JPY sellers.
However, the 100-Hour Moving Average (HMA) level of around 138.30 restricts the immediate downside of the Yen pair, a break of which highlights the stated wedge’s confirmation point, namely the lower line surrounding 138.00.
Following that, a quick fall towards the 200-HMA surrounding 137.20 can’t be ruled out. It should be noted, however, that the rising wedge confirmation hints at the 136.00 round figure as a theoretical target.
Alternatively, the stated wedge’s top line, close to the 139.00 round figure by the press time, restricts immediate USD/JPY recovery. Also likely to challenge the Yen pair buyers is the July 2022 high of near 139.40.
Even if the Yen pair manage to cross the 139.40 hurdle, the 140.00 round figure may prod the buyers.
Overall, USD/JPY bulls appear to run out of steam but the sellers wait for clear signals.
USD/JPY: Hourly chart
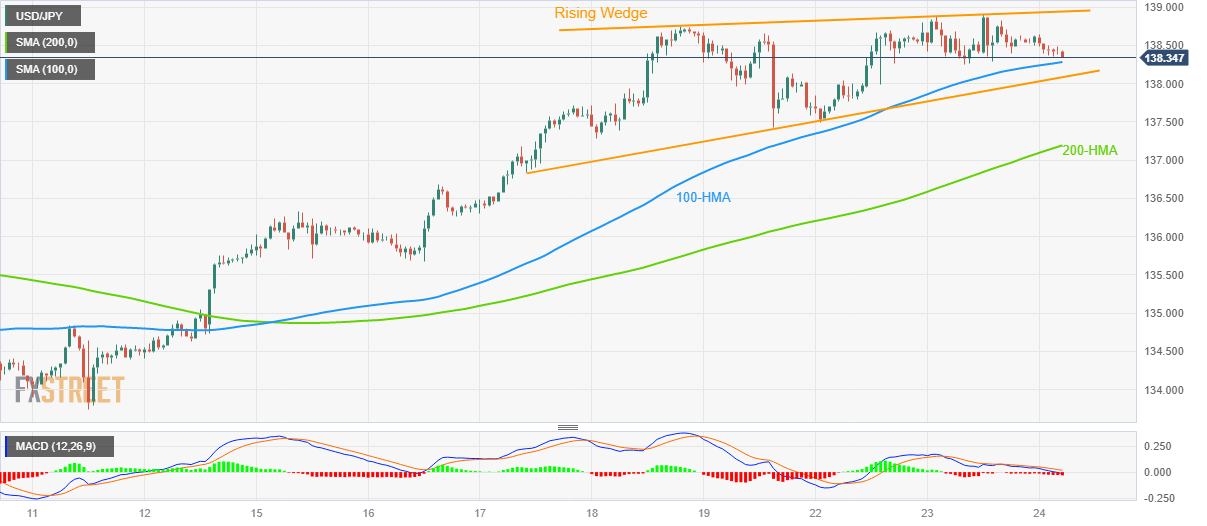
Trend: Pullback expected
UOB Group’s Economist Lee Sue Ann and Markets Strategist Quek Ser Leang note EUR/USD could revisit the 1.0700 region once 1.0750 is cleared.
Key Quotes
24-hour view: “Our view for EUR to trade sideways yesterday was incorrect as it plummeted to 1.0758, the same low as last week. Downward momentum has improved but EUR has to break clearly below the major support at 1.0750 before a sustained decline is likely. That said, the next major support at 1.0700 is unlikely to come into view today. The risk of EUR breaking clearly below 1.0750 will remain intact as long as it stays below 1.0805 (minor resistance is at 1.0785).”
Next 1-3 weeks: “We have held a negative EUR view for two weeks now. In our latest narrative from two days ago (22 May, spot at 1.0820), we indicated that the likelihood of EUR breaking clearly below 1.0750 has diminished. We added, ‘only a break above 1.0860 would indicate the EUR weakness has stabilized’. Yesterday, EUR fell to a low of 1.0758. Downward momentum has improved, albeit not much. EUR has to crack 1.0750 in these 1 to 2 days for it to drop further to 1.0700. If EUR were to breach 1.0835 (‘strong resistance’ level previously at 1.0860), it would suggest that it is not weakening further.”
The UK CPIs Overview
The cost of living in the UK, as represented by the Consumer Price Index (CPI) for April, is due early on Wednesday at 06:00 GMT.
Knowing the fact that Bank of England (BoE) Governor Andrew Bailey believes that interest rates in the United Kingdom have yet not been reached, today’s data will be watched closely by the GBPUSD traders.
The headline CPI inflation is expected to soften to 8.2% YoY figure versus 10.1% released for March while the Core CPI, which strips off volatile food and energy items, is seen steady at 6.2% YoY during April. Regarding the monthly figures, the CPI is expected to maintain a pace of 0.8% recorded in March.
It’s worth noting that easing labor market conditions due to higher interest rates reported last week also highlight the Producer Price Index (PPI) as an important catalyst for the immediate GBP/USD direction.
That being said, the PPI Core Output YoY is seen softening to 7.3% on a non-seasonally adjusted basis whereas the monthly prints could decelerate further to 0.1% versus 0.3% the prior release. Furthermore, the Retail Price Index (RPI) is also on the table for release, which is expected to drop to 11.1% YoY from 13.5% prior while the MoM prints could show a higher pace of 1.2% from 0.7% in previous readings.
Deviation impact on GBP/USD
Readers can find FXStreet's proprietary deviation impact map of the event below. As observed the reaction is likely to remain confined around 20-pips in deviations up to + or -2, although in some cases, if notable enough, a deviation can fuel movements over 30-40 pips.
How could it affect GBP/USD?
UK’s inflation has remained tied to the double-digit territory for the past nine months. Think tanks believe that labor shortages and historically high food inflation are the real culprits of extremely stubborn inflation. Individuals are announcing early retirements and the Brexit event dropped the number of job-seekers from the UK market. No doubt, the duo of UK PM Rishi Sunak and UK FM Jeremy Hunt has taken some measures to force individuals for avoiding early retirement, however, those measures need plenty of time to act.
On Tuesday, BoE Chief Economist Huw Pill in his testimony agreed that the central bank misunderstood the strength and persistence of UK inflation. BoE Pill said, “We are trying to understand why we have made errors in inflation forecasts.” However, BoE policymaker remained confident that longer-term inflation expectations have not drifted away from the target.
While BoE Governor Andrew Bailey in his testimony in front of UK parliament's Treasury Select Committee (TSC) gave assurance that declining gas prices and losing momentum in food prices are weighing heavily on inflationary pressures. Private sector wages are not accelerating as expected, which could fade bumper retail demand.
Technically, GBP/USD has swiftly approached the upper portion of the Falling Wedge chart pattern on a two-hour scale in which each pullback is considered a selling opportunity by the market participants. Also, chances of a bullish reversal remain higher as BoE Bailey is expected to raise interest rates further. A 40.00-60.00 range oscillation by the Relative Strength Index (RSI) (14) will get a decisive move after the release of the UK Inflation.
Keynotes
GBP/USD Price Analysis: Remains inside falling wedge ahead of UK Inflation
GBP/USD looks to regain 1.2450, focus on UK inflation, BoE’s Bailey and Fed Minutes
About the UK CPIs
The Consumer Price Index released by the Office for National Statistics is a measure of price movements by the comparison between the retail prices of a representative shopping basket of goods and services. The purchasing power of the GBP is dragged down by inflation. The CPI is a key indicator to measure inflation and changes in purchasing trends. Generally, a high reading is seen as positive (or bullish) for the GBP, while a low reading is seen as negative (or Bearish).
- USD/CAD remains illiquid for the fourth consecutive day, retreating from intraday high of late.
- Oil price prods two-day uptrend at the highest levels in three weeks, struggles recently amid cautious markets.
- US Dollar tracks yields to pare recent gains amid deadlock in debt ceiling talks.
- FOMC Meeting Minutes, US default and weekly Oil inventories updates will be the key for clear directions.
USD/CAD keeps making rounds to 1.3500 ahead of Wednesday’s European session, after three consecutively volatile days that ended without any daily gains/losses. In doing so, the Loonie pair tracks moves of the prices of Canada’s main export item, WTI crude oil, while ignoring the latest retreat in the US Dollar.
Markets turn inactive during early Wednesday as an impasse in the US debt ceiling talks joins the cautious mood ahead of the Fed Minutes. Also, mixed concerns about the risk and an absence of major incentives restrict the Oil price moves and limit the USD/CAD performance of late.
That said, the US Dollar Index (DXY) snaps a two-day winning streak as it prints mild losses around 103.45 by the press time while WTI crude oil clings to minor gains at the highest levels in three weeks, up 0.08% intraday near $73.85 by the press time.
It’s worth noting that the lack of progress in the talks to avoid the US debt ceiling expiration and fears that the US may mark the ‘catastrophic’ default weighed on the market sentiment of late. Recently, US House Speaker Kevin McCarthy crossed wires, via Reuters, while suggesting no deal on the debt ceiling extension today but repeating previous optimism that they will get an agreement before June 01. Previously, Washington rolled out news stating the US Treasury has asked multiple agencies if they can delay the payment demands.
Even so, firmer prints of the US data and hawkish Fed concerns challenge the Loonie pair sellers. On Tuesday, preliminary figures of the May monthly PMIs signaled that the US Services sector keeps outgrowing the manufacturing ones and fuelled the Composite PMI figure to the highest levels in a year. Further, the latest comments from Atlanta Fed President Raphael Bostic, Richmond Fed President Thomas Barkin and San Francisco President Mary C Daly backed the calls for higher Fed rates while citing the inflation woes, which in turn propelled the bets on the Fed rate increase in June.
Elsewhere, the US Dollar’s retreat and a surprise depletion in the Oil inventories per the American Petroleum Institute (API) allowed the WTI crude oil to refresh a multi-day high the previous day. However, challenges to sentiment recently limited the black gold’s moves.
While portraying the risk profile, S&P500 Futures ignore Wall Street’s downbeat performance to print mild gains whereas the US 10-year and two-year Treasury bond yields retreated from the highest levels since early March the previous day.
Moving on, major attention will be given to the US debt ceiling talks and Minutes of the latest Federal Open Market Committee (FOMC) Monetary Policy Meeting for clear directions. If the US policymakers manage to overcome the default fears, as well as the Fed Minutes appear hawkish, the US Dollar may regain its charm and can recall the USD/CAD bulls.
Technical analysis
Tuesday’s Gravestone Doji needs validation from the 12-day-old ascending support line, around 1.3490 by the press time, to convince USD/CAD bears.
- USD/ZAR is looking to extend its downside built after printing an all-time high of 19.52.
- The US Dollar Index has shifted below the crucial support of 103.50 ahead of the FOMC minutes.
- The South African Rand remained in a weak spot due to deepening tensions between South Africa and the US.
The USD/ZAR pair is struggling in holding its auction above the immediate support of 19.15 in the Asian session. The asset is expected to deliver more downside as the upside for the US Dollar Index (DXY) seems barricaded due to an absence of development in US debt-ceiling issues.
Decent gains have been generated in the Asian session by the S&P500 futures but are insufficient to cheer the overall market mood. US equities witnessed a sheer sell-off on Tuesday, weighed heavily by selling pressure on technology stocks. Investors are worried that a default by the United States economy due to a delay in US debt-ceiling raise would result in a loss of millions of jobs in the domestic economy and a ripple effect on global markets.
The US Dollar Index (DXY) has shifted below the crucial support of 103.50 ahead of the Federal Open Market Committee (FOMC) minutes. The street is eyeing cues about interest rate guidance. However, dovish commentary delivered by Federal Reserve (Fed) chair Jerome Powell last week is advocating no further interest rate hikes in June.
US firms are already facing issues in availing credit fur to tight conditions on disbursal by US regional banks. This would allow tight labor market conditions to lose some heat, which will have a negative impact on stubborn inflation as retail demand will get impacted significantly.
This week, USD/ZAR retreated firmly after posting all-time high at 19.52. The South African Rand remained in a weak spot due to deepening tensions between South Africa and the US. US ambassador accused South Africa of supplying arms to Russia. In response to that South African Finance Minister Godongwana claimed that the diplomatic row has been resolved, and it is unlikely to result in the US imposing penalties such as sanctions.”
- USD/INR takes offers to refresh intraday low, reverses from five-week high.
- Failure to cross five-month-old resistance line joins overbought RSI to lure Indian Rupee buyers.
- Descending trend line from October 2022, bullish MACD signals prod bears.
USD/INR renews intraday bottom around 82.80 while extending pullback from a five-week high during early Wednesday. In doing so, the pair registers failure to cross the yearly resistance line amid the overbought RSI.
However, the bullish MACD signals and the resistance-turned-support line stretched from late 2022, close to 82.80 by the press time, challenge the Indian Rupee (INR) buyers of late.
Should the quote manages to provide a daily close below the 82.80 level, it can quickly fall to the previous monthly high of near 82.50 ahead of targeting the late April swing high of around 82.40.
Though, a convergence of the 50-DMA and 100-DMA, around 82.15, appears a tough nut to crack for the USD/INR bears afterward.
Even if the quote breaks the 82.15 level, an upward-sloping support line from November 2022, close to 81.75 at the latest, can act as the last defense of the USD/INR buyers.
On the contrary, a daily closing beyond the falling resistance line from the last December, near the 83.00 round figure, won’t hesitate to challenge the record high marked in 2022 around 83.40.
It’s worth noting that the late 2022 peaks of near 83.20 may offer intermediate halts during the quote’s upside past 83.00.
USD/INR: Daily chart
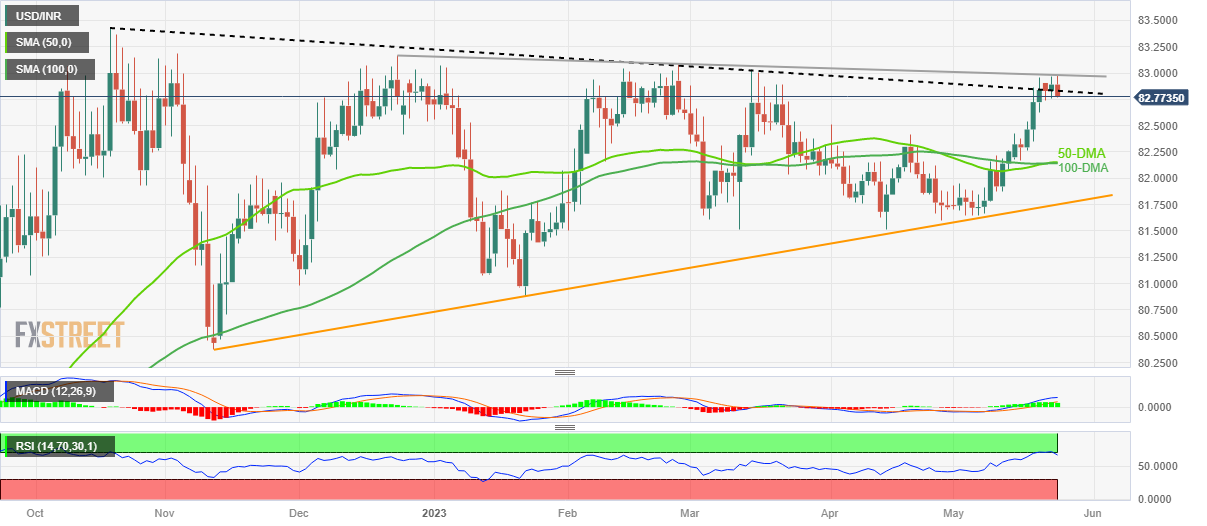
Trend: Further downside expected
- AUD/USD has managed to climb back above 0.6600 amid subdued performance by the USD index.
- Speaker McCarthy made clear that we are nowhere near cracking bipartisan with the White House as their partisan terms are ‘unacceptable’.
- The Australian economy has started slowing down as labor market conditions are facing the heat of higher interest rates.
The AUD/USD pair has returned above the 0.6600 resistance after a downside move in the Asian session. The Aussie asset is looking to extend its recovery further as the US Dollar Index (DXY) has displayed a subdued performance.
S&P500 futures are holding nominal gains posted in early Asia, however, the overall market mood is still risk-averse amid the lack of development over US debt-ceiling issues. US House of Representatives Kevin McCarthy made clear on Tuesday that we are nowhere near cracking bipartisan with the White House as their partisan terms are ‘unacceptable’.
Republicans are demanding a sheer 8% cut in the budget’s big spending wrath. They are worried that further budget deficit could put long-term liabilities on the upcoming generation. So it would be better if Democrats return to the CY2022 budget style. Also, Republicans have criticized extra tax on the Wealthy community.
The US Dollar Index (DXY) has posted minor losses in Tokyo as investors have been sidelined ahead of the release of the Federal Open Market Committee (FOMC) minutes for the May meeting. The FOMC minutes are expected to provide cues about further monetary policy action by the Federal Reserve (Fed). Fed chair Jerome Powell in a meeting on Friday favored a pause in the rate-hiking spell as tight credit conditions by US regional banks have squeezed the flow of credit into the economy.
Meanwhile, the Australian Dollar is likely to remain under pressure as the street is anticipating a pause in the policy-tightening regime by the Reserve Bank of Australia (RBA). The Australian economy has started slowing down as labor market conditions and economic activities are facing the heat of higher interest rates.
- Gold Price remains sidelined around key support confluence as markets await for Fed Minutes, US debt ceiling extension.
- Anxiety ahead of the key data/events prods XAU/USD traders amid mixed clues.
- Hawkish Fed bets, hopes of no US default underpin bearish bias about the Gold price.
Gold Price (XAU/USD) treads water around $1,975 heading into Wednesday’s European session. In doing so, the precious metal portrays the market’s inaction amid mixed feelings and cautious mood ahead of the key data/events. That said, the Gold Price previously cheered the US Dollar’s retreat amid a deadlock in the talks to resolve the debt ceiling problem. Also likely to prod the US Dollar bulls is the latest retreat in the US Treasury bond yields amid mixed US PMIs, mostly upbeat.
It should be observed that the market sentiment remains sluggish ahead of the US debt ceiling talks and Minutes of the latest Federal Open Market Committee (FOMC) Monetary Policy Meeting.
Also read: Gold Price Forecast: XAU/USD holds within familiar level ahead of FOMC Minutes
Gold Price: Key levels to watch
Our Technical Confluence Indicator signals that the Gold price seesaws around $1,970 support confluence comprising a middle band of the Bollinger on four-hour, Fibonacci 38.2% on one day and 23.6% on one-week.
In a case where the Gold Price remains bearish past $1,970, the odds of witnessing a slump toward the late swing low of $1,934 can’t be ruled out.
However, the lower band of the Bollinger on the Daily chart, around $1,950, may act as an intermediate halt during the XAU/USD’s fall between $1,970 and $1,934.
Alternatively, Pivot Point one-day R1 and the upper line of the Bollinger on the four-hour chart, around $1,985, caps the immediate upside of the Gold price.
Following that, Fibonacci 61.8% on one-week, around $1,997, will precede the $2,000 round figure to prod the XAU/USD buyers.
Here is how it looks on the tool
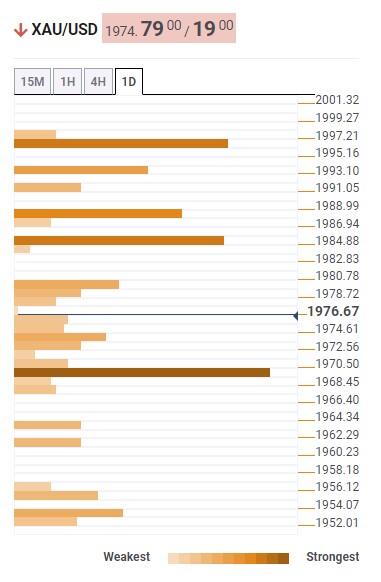
About Technical Confluences Detector
The TCD (Technical Confluences Detector) is a tool to locate and point out those price levels where there is a congestion of indicators, moving averages, Fibonacci levels, Pivot Points, etc. If you are a short-term trader, you will find entry points for counter-trend strategies and hunt a few points at a time. If you are a medium-to-long-term trader, this tool will allow you to know in advance the price levels where a medium-to-long-term trend may stop and rest, where to unwind positions, or where to increase your position size
- NZD/USD remains on the back foot despite recent corrective bounce following comments from RBNZ Governor Orr.
- RBNZ’s Orr struggles to restore market’s confidence despite keeping peak rate unchanged, matching 0.25% rate hike expectations.
- Clear downside break of 200-SMA, one-month-old ascending trend line keeps Kiwi pair sellers hopeful.
NZD/USD remains on the back foot around a three-week low under 0.6200, close to 0.6180 by the press time, even as Reserve Bank of New Zealand (RBNZ) Governor Adrian Orr tries to placate Kiwi bears early Wednesday. That said, the quote dropped 150 pips after the RBNZ disappointed markets while keeping the peak rate unchanged, as well as matching the broad forecasts of increasing the Official Cash Rate (OCR) by 0.25%.
Also read: NZD/USD slumps below 0.6200 as RBNZ offers no hawkish surprise with 25 bps rate hike
RBNZ Governor Orr said that the latest data is satisfactory after a long battle (with inflation).
Also read: RBNZ’s Orr: Today was first time monetary policy committee went to vote for a decision
With the NZD/USD pair’s downside break of the 0.6220 key level on the dovish RBNZ bias, the sellers are likely to keep the reins amid bearish MACD signals. it’s worth noting that an upward-sloping trend line from late April joins 200-SMA to highlight 0.6220 as the key support-turned-resistance.
As a result, the Kiwi pair is well set for a fresh monthly low, currently around 0.6160. In doing so, the previous monthly bottom of around 0.6110 and the yearly trough near 0.6084 marked in March will be in the spotlight.
Alternatively, NZD/USD pair’s corrective bounce fails to push back the Kiwi buyers unless crossing the 0.6220 level.
Even so, a two-week-old descending resistance line, around 0.6305 by the press time, can challenge the NZD/USD bulls ahead of directing them to the monthly high of 0.6385.
NZD/USD: Four-hour chart
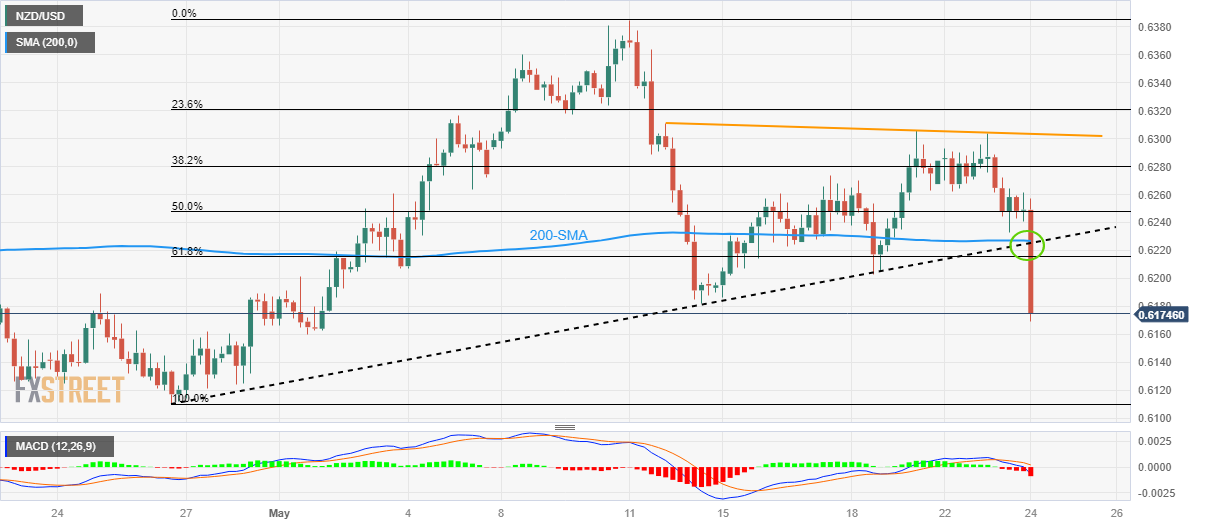
Trend: Further downside expected
Reserve Bank of New Zealand (RBNZ) Governor Adrian Orr is speaking at the press conference that follows the May monetary policy decision this Wednesday. The central bank delivered a dovish 25 basis points (bps) Official Cash Rate (OCR) rate hike and squashed the Kiwi Dollar.
Key quotes
Today was first time monetary policy committee went to vote for a decision.
Outlook for fiscal spending contractionary on demand.
Latest data is satisfactory.
Its been a long battle.
We want to see deposit rates rise further.
The labour market is becoming less pressured.
Foreshadowing keeping a restrictive monetary policy for some time.
Projection is surge in immigration eases off.
House prices now much closer to their sustainable levels.
Market reaction
NZD/USD remains heavy below 0.6200 on Orr’s comment. The pair is trading at 0.6176, down 1.14% on the day.
- EUR/USD picks up bids to consolidate recent losses, forms bullish chart pattern.
- Convergence of 50-HMA, 100-HMA and fortnight-long resistance line appears a tough nut to crack for Euro buyers.
- Sellers can aim for late March swing lows on 1.0760 breakdown.
- ECB’s Lagarde, Fed Minutes eyed for clear directions.
EUR/USD glides on a dicey floor with mild gains around 1.0775 as it waits for the key catalysts on early Wednesday in Europe. In doing so, the Euro pair forms a bullish chart pattern called the “Double Bottom” with eyes on a speech from European Central Bank (ECB) President Christine Lagarde and Minutes of the latest Federal Open Market Committee (FOMC) Monetary Policy Meeting.
Also read: EUR/USD dribbles below 1.0800 amid lackluster US debt ceiling talks, focus on ECB’s Lagarde, Fed Minutes
Not only the “Double Bottom” formation but the recent improvements in the RSI (14) line from the oversold territory and the bullish MACD signals also underpin the hopes of the EUR/USD pair’s further recovery.
However, the 100-Hour Moving Average (HMA) joins the 50-HMA and a downward-sloping trend line from early May to constitute the 1.0800 as the key upside hurdle for the Euro buyers to cross to retake control.
Following that, a quick run-up towards the 200-HMA and mid-May low, respectively near 1.0835 and 1.0845 can’t be ruled out.
On the contrary, EUR/USD pullback remains elusive unless the quote stays beyond the “Double Bottom” of around 1.0760.
Should the Euro bears manage to conquer the 1.0760 key support and defy the bullish chart formation, the pair becomes vulnerable to plunging toward the late March low of near 1.0715.
EUR/USD: Hourly chart
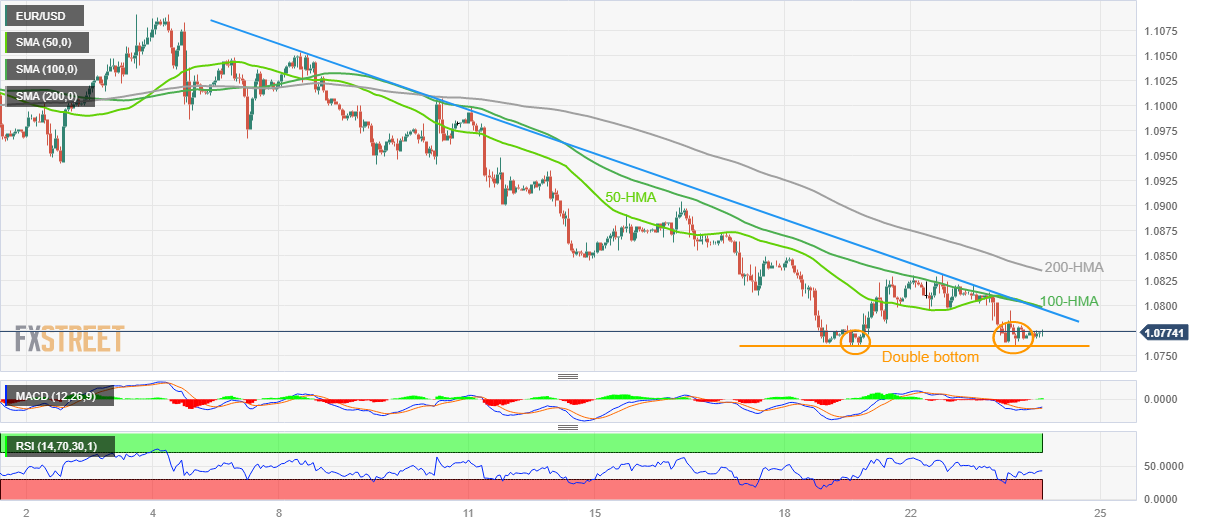
Trend: Limited recovery expected
| Raw materials | Closed | Change, % |
|---|---|---|
| Silver | 23.446 | -0.78 |
| Gold | 1975.26 | 0.18 |
| Palladium | 1456.28 | -1.71 |
- AUD/NZD has shown a stellar run above 1.0650 after the RBNZ hiked its OCR by 25 bps to 5.5%.
- The RBNZ was expected to hike its OCR further as NZ inflation has not shown evidence of decent softening.
- Australia’s Unemployment Rate has soared sharply to 3.7% as firms are anticipating a bleak economic outlook due to higher interest rates.
The AUD/NZD pair has soared dramatically as the Reserve Bank of New Zealand (RBNZ) has hiked its Official Cash Rate (OCR) by 25 basis points (bps). RBNZ Governor Adrian Orr has pushed its OCR to 5.50%, in line with the expectations of the street.
Earlier, Stats New Zealand reported a steep contraction in Q1 Retail Sales data. Households’ retail demand contracted by 1.4% while the street was anticipating a contraction of 0.4%. NZ Retail Sales contracted by 0.6% in the last quarter of CY2022. A spree of a decline in retail demand would weigh heavily on inflationary pressures ahead.
Analysts at ING stated “Markets are pricing in a peak at around 5.80%, but we think the RBNZ can deliver an extra bit of hawkishness and signal tightening until the 6.00% mark.
Investors should note that the Kiwi economy is currently operating at quarterly inflation of 6.7%, significantly higher than desired levels. NZ inflation softened to 6.7% in the first quarter of CY2023 from sticky inflation levels around 7.2%.
On the Australian Dollar front, signs of a slowdown in the economy are accelerating due to higher interest rates from the Reserve Bank of Australia (RBA). Australian Employment and economic activities have been hit hard in the battle between higher inflation and higher interest rates by the RBA Governor Philip Lowe.
Australia’s Unemployment Rate has soared sharply to 3.7% as firms are anticipating a bleak economic outlook due to higher interest rates.
- NZD/JPY slumps to the lowest level in a week, extends previous pullback from yearly high.
- RBNZ announces 0.25% OCR hike, keeps peak rate forecasts unchanged.
- Retreat in yields, upbeat concerns about Japan manufacturers also weigh on prices.
- Risk catalysts are the key, RBNZ’s Orr eyed for immediate directions.
NZD/JPY stands on slippery grounds as it takes offers around 81.50, down more than 100 pips on a day, as the Reserve Bank of New Zealand (RBNZ) fails to offer hawkish surprise to the markets on early Wednesday.
RBNZ announces 0.25% increase to its Official Cash Rate (OCR), as expected, during May month monetary policy meeting. It’s worth noting that the RBNZ defends its cash rate peak at 5.5% and exert downside pressure on the NZD/USD prices.
Also read: Breaking: RBNZ hikes rates by 25 bps to 5.50% in May, widely expected
Apart from the RBNZ moves, the retreat in the US Treasury bond yields and recently upbeat concerns about Japan also weigh on the exotic pair.
That said, the US 10-year and two-year Treasury bond yields retreated from the highest levels since early March the previous day. On the other hand, “Business sentiment at big Japanese manufacturers turned positive for the first time this year and service-sector morale hit a five-month high, providing more evidence of an economy on the mend after a COVID-led recession,” per the monthly results of the Reuters Tankan survey.
Moving on, challenges to sentiment and the bond market moves can entertain the NZD/JPY pair traders while a press conference by RBNZ Governor Adrian Orr could offer immediate directions to the cross-currency pair. Should the policymaker manages to defend the hawkish bias, the New Zealand Dollar (NZD) may witness a corrective bounce.
Technical analysis
Despite the latest retreat, a one-month-old ascending support line, near 85.15 by the press time, challenges the NZD/JPY bears dominance.
- NZD/USD drops nearly 50 pips even as RBNZ matches rate hike expectations.
- RBNZ matches market expectations of announcing 0.25% OCR hike.
- Pullback in US Dollar, Treasury bond yields put a floor under Kiwi pair prices.
- RBNZ’s Orr, US debt ceiling negotiations and Fed Minutes are the key for further directions.
NZD/USD nosedives nearly 50 pips to 0.6190 as it fails to cheers the Reserve Bank of New Zealand’s (RBNZ) 25 basis points (bps) of rate hike on early Wednesday.
RBNZ announces 0.25% increase to its Official Cash Rate (OCR), as expected, during May month monetary policy meeting. It’s worth noting that the RBNZ defends its cash rate peak at 5.5% and exert downside pressure on the NZD/USD prices.
Also read: Breaking: RBNZ hikes rates by 25 bps to 5.50% in May, widely expected
Earlier in the day, New Zealand’s first quarter (Q1) Retail Sales marked a contraction of 1.4% QoQ versus -0.4% expected and -0.6% prior while the YoY figures dropped to -4.1% versus -4.0% previous readings.
It’s worth observing that the US Dollar Index (DXY) retreat eclipsed the NZ data-led pessimism for the NZD/USD earlier in the day. That said, the greenback’s gauge against the six major currencies struggles to extend two-day advances at the highest levels in nine weeks, grinding near 103.50 by the press time.
While tracing reasons for the US Dollar’s latest pullback, a lack of progress in the talks to avoid the US debt ceiling expiration and fears that the US may mark the ‘catastrophic’ default gain major attention. Additionally, the latest retreat in the US Treasury bond yields also challenges the greenback ahead of the key Fed Minutes. Even so, hawkish Fed bets and recently upbeat US data keep the USD bulls hopeful, which in turn prod the NZD/USD run-up.
While portraying the market’s mood, S&P500 Futures ignore Wall Street’s downbeat performance to print mild gains whereas the US 10-year and two-year Treasury bond yields retreated from the highest levels since early March the previous day.
Having witnessed the initial market reaction to the RBNZ Interest Rate Decision, the NZD/USD pair traders will keep their eyes on a press conference by RBNZ Governor Adrian Orr. Should the policymaker manages to defend the hawkish bias, the Kiwi pair may have further upside to track, especially amid the recent retreat in the US Dollar.
Following that, major attention will be given to the US debt ceiling talks and Minutes of the latest Federal Open Market Committee (FOMC) Monetary Policy Meeting for clear directions. If the US policymakers manage to overcome the default fears, as well as the Fed Minutes appear hawkish, the US Dollar may regain its charm and can exert downside pressure on the NZD/USD price.
Technical analysis
A daily closing below a one-month-old ascending support line, around 0.6225 by the press time, becomes necessary for the NZD/USD bears to retake control. Until then, the hopes of witnessing another battle with the key resistance line stretched from early February, close to 0.6385 at the latest, can’t be ruled out.
At the May policy meeting, the Reserve Bank of New Zealand (RBNZ) board members decided to increase the official cash rate (OCR) by 25 basis points (bps) from 5.25% to 5.50%, as widely expected.
Minutes of the meeting and Summary of the statement
Sees official cash rate at 5.5% in September 2023 (pvs 5.43%).
Sees official cash rate at 5.5% in June 2024 (pvs 5.5%).
Sees twi nzd at around 71.5% in June 2024 (pvs 71.5%).
Sees annual CPI 3.7% by June 2024 (pvs 3.6%).
Sees official cash rate at 5.43% in September 2024 (pvs 5.44%).
Sees official cash rate at 3.31% in June 2026.
Sees cash rate peak at 5.5%.
Sees march quarter GDP at +0.3% .
Forecasts negative GDP growth for Q2, Q3 in 2023.
Level of interest rates constraining spending and inflation.
Interest rates will need to remain at restrictive level for forseeable future.
Global growth remains weak, inflation pressures are easing.
In New Zealand inflation is expected to continue to decline from peak.
Core inflation pressures will remain until capacity constraints ease further.
OCR set to remain restrictive .
Businesses reporting slower demand for goods and services.
Raising the OCR to 5.50% is consistent with the projections.
Reached a consensus that interest rates will need to remain at a restrictive level for the foreseeable future.
By a majority of five votes to two, the committee agreed to increase the OCR by 25 basis points.
Market reaction
In an immediate reaction to the RBNZ announcement, NZD/USD lost nearly 70 pips to surrender the 0.6200 level. The pair is down 0.93% on the day at 0.6187, as of writing.
Why the RBNZ decision matters to traders?
The Reserve Bank of New Zealand (RBNZ) holds monetary policy meetings seven times a year, announcing their decision on interest rates and the economic assessments that influenced their decision. The central bank offers clues on the economic outlook and future policy path, which are of high relevance for the NZD valuation. Positive economic developments and an upbeat outlook could lead the RBNZ to tighten the policy by hiking interest rates, which tends to be NZD bullish.
- WTI bulls eye a continuation from support structure.
- Bulls remain in control on the front side of the bullish trend.
As per the prior analysis, WTI Price Analysis: Bulls are engaged, eyes on upside break, where a bullish bias was mapped out on the charts, the following illustrates the bullish developments according to the analysis:
WTI prior analysis
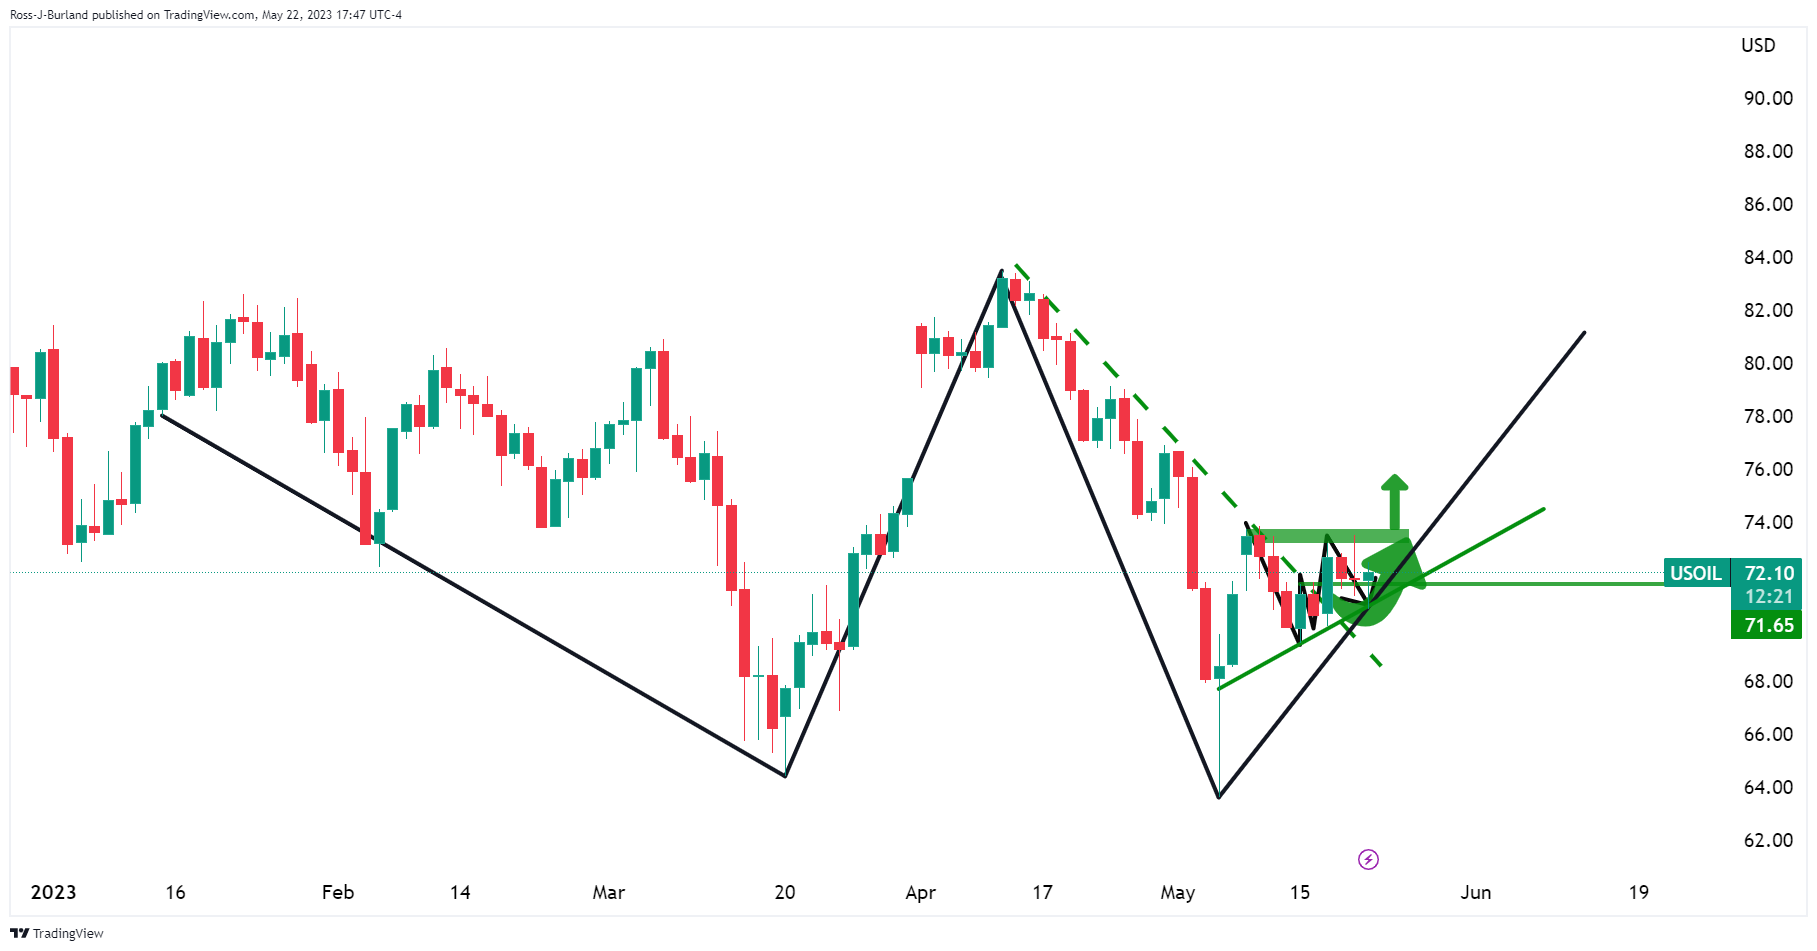
We had a major double bottom on the longer-term outlook.
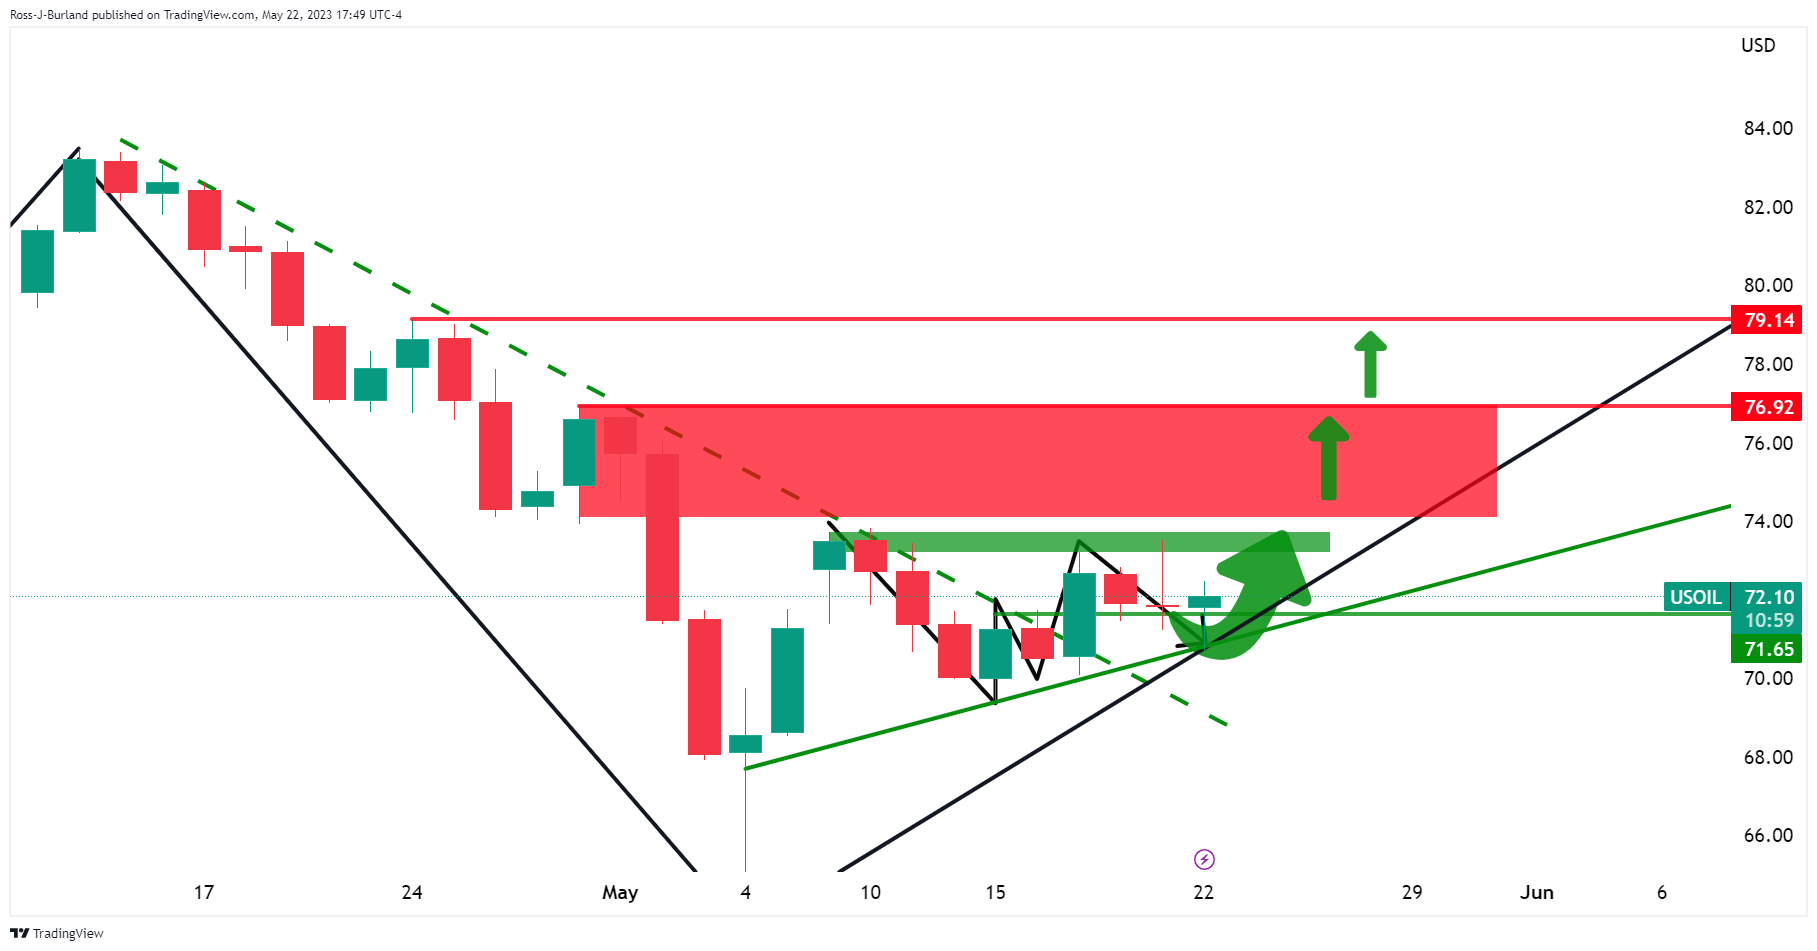
Zooming in, we saw that the market had broken out of the bearish trend and is now riding a dynamic support line.
We had a W-formation neckline area that was being respected also.
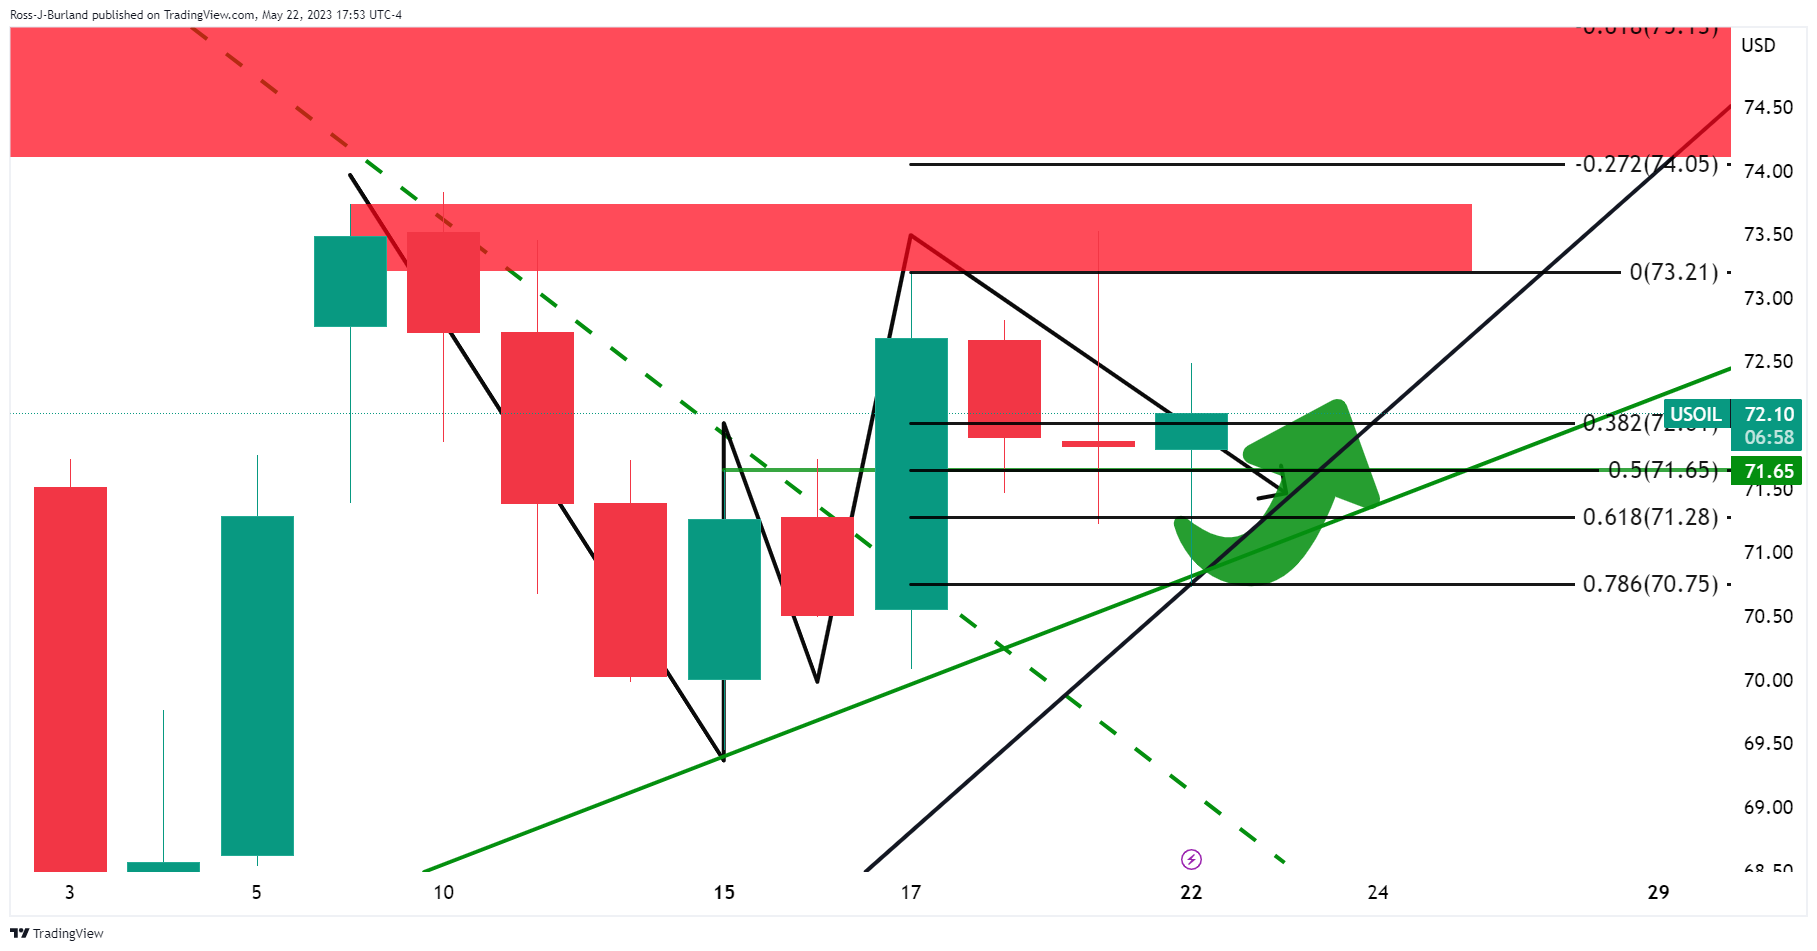
The Fibonacci retracement tool measured across the bullish impulse saw the 78.6% Fibo meeting the support line and lows of the correction.
WTI Updates
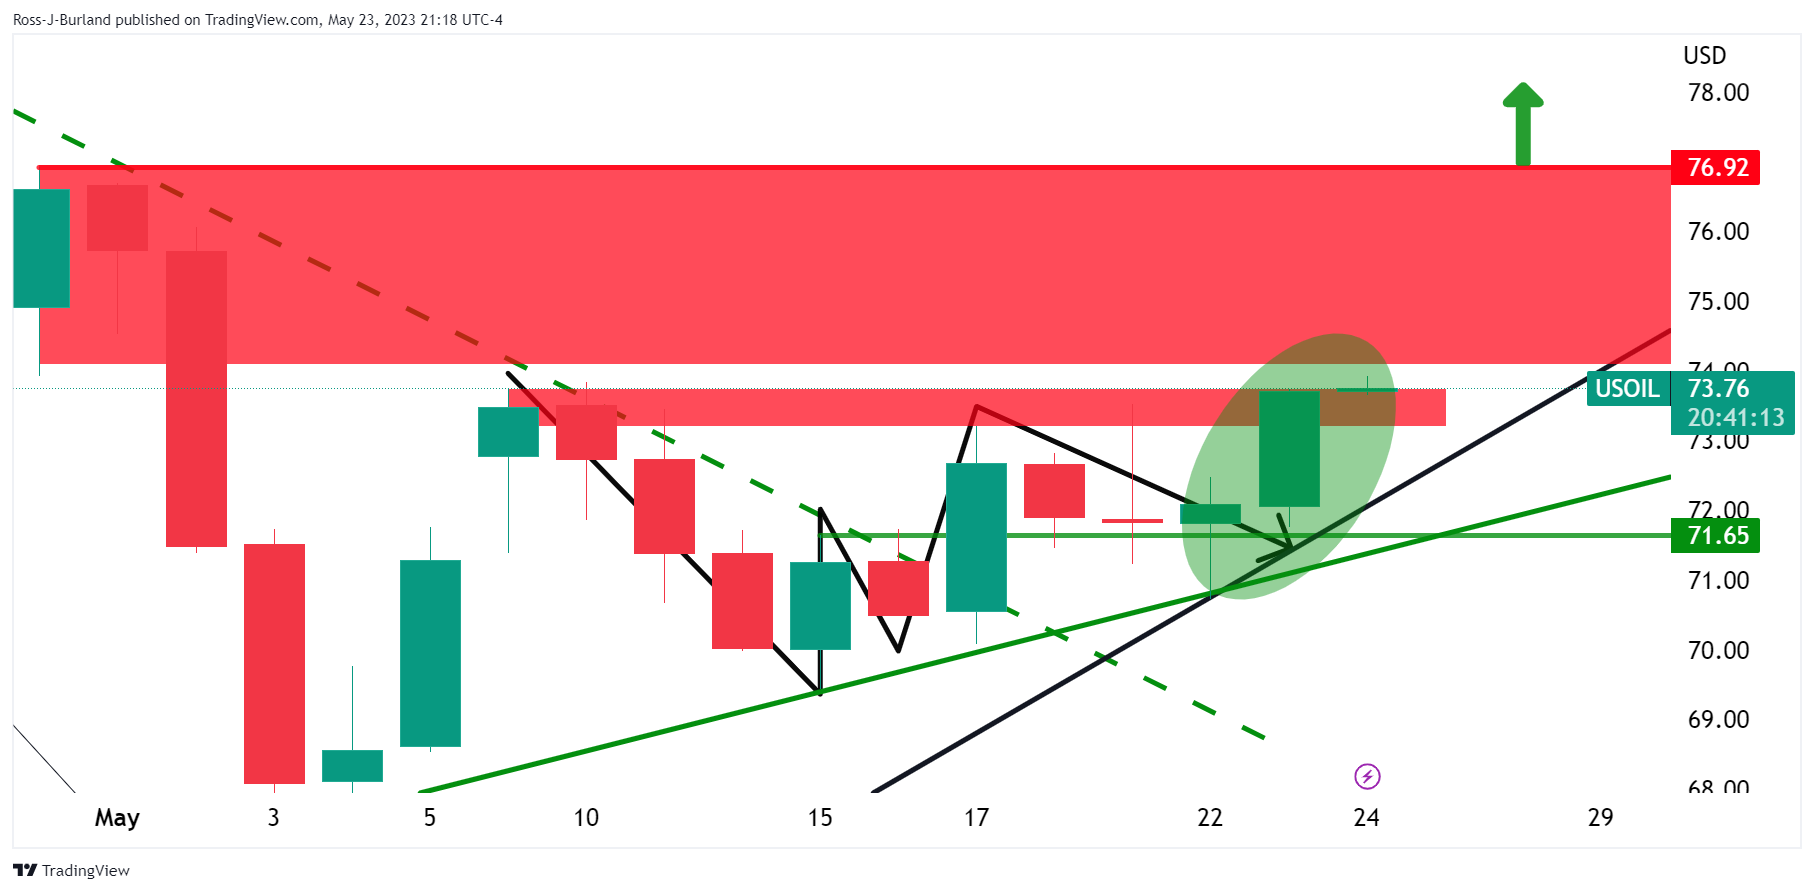
The daily chart shows the price popping higher into test resistance. The 4-hour chart, below, shows that there could be support at this juncture and move higher:
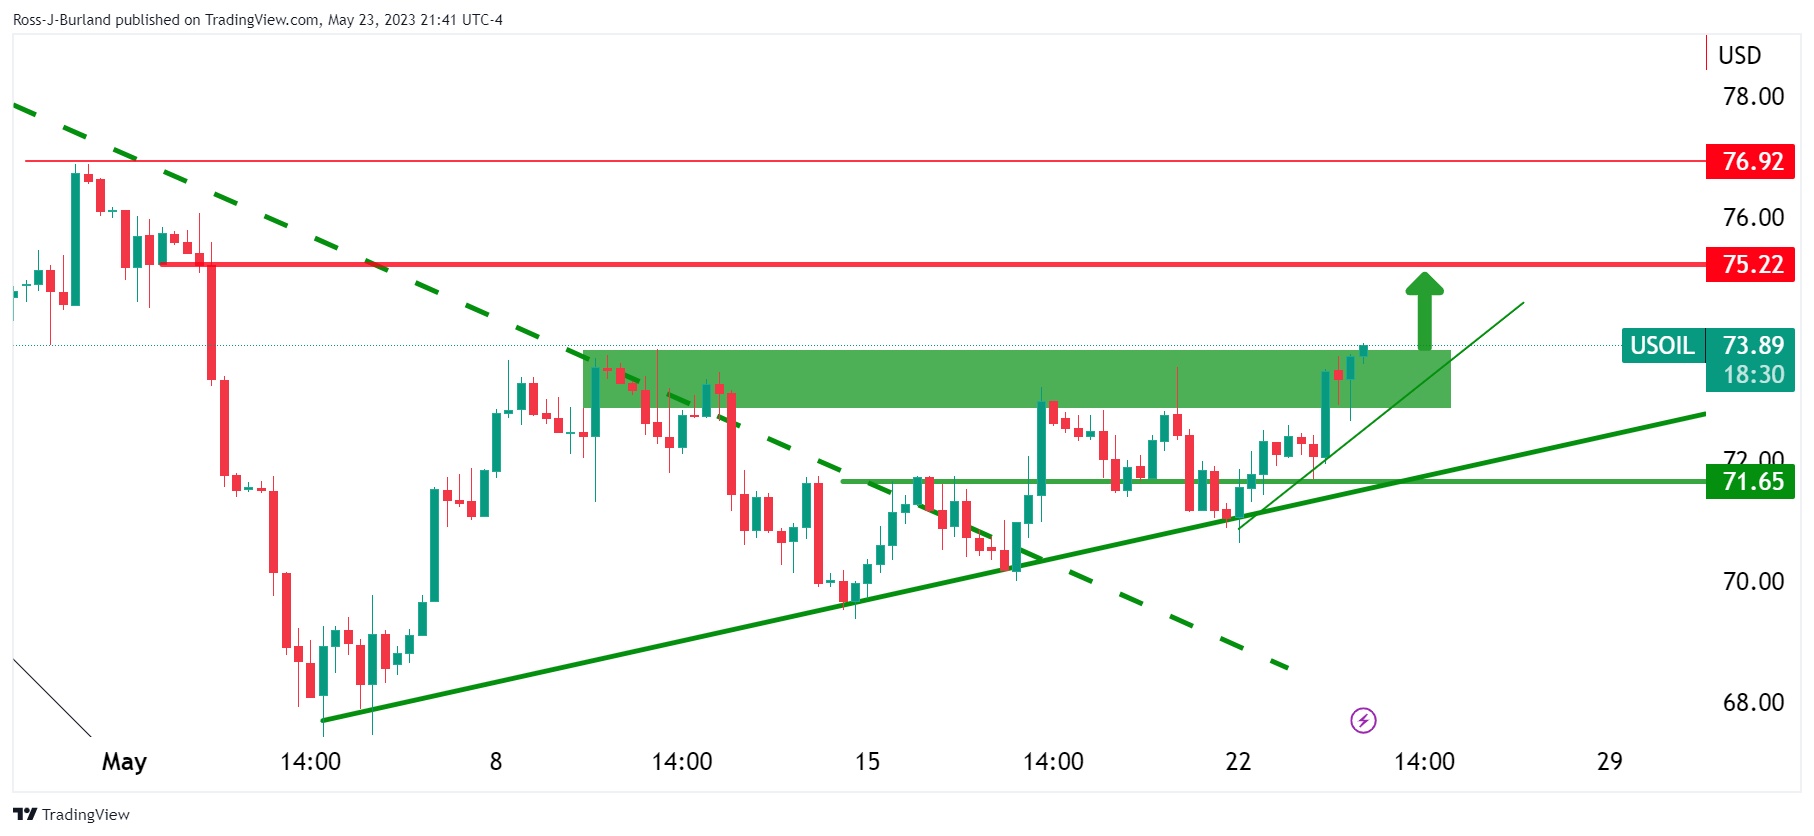
- USD/CHF has displayed a recovery move from 0.9010 as investors await cues from FOMC minutes about interest rate guidance.
- Headlines over the US debt-ceiling issues will remain in focus as the long-term credibility of the US economy is on the line.
- USD/CHF has delivered a breakout of the Wyckoff Accumulation pattern and is in a markup phase.
The USD/CHF pair has witnessed some recovery from the immediate support of 0.9010 in the Asian session. The Swiss Franc asset has rebounded after building a base around 0.9010 as investors are shifting their focus toward the release of May’s meeting Federal Open Market Committee (FOMC) minutes.
The release of the FOMC minutes will provide a detailed explanation behind the interest rate hike of 25 basis points (bps) by Federal Reserve (Fed) chair Jerome Powell. Also, investors will look for cues about interest rate guidance. However, Fed Powell has already advocated for a pause in the policy-tightening spell in June.
Meanwhile, the US Dollar Index (DXY) is showing a subdued performance in the Asian session. Investors will keep an eye on further developments over the US debt-ceiling issues as the long-term credibility of the United States economy is on the line.
USD/CHF has delivered a breakout of the Wyckoff Accumulation pattern formed on a four-hour scale. The Swiss franc asset is in a mark-up phase which displays wider bullish ticks and heavy volume. Upward-sloping 20-period Exponential Moving Average (EMA) at 0.9000 is providing support to the US Dollar bulls.
A confident break into the bullish range of 60.00-80.00 by the Relative Strength Index (RSI) will strengthen US Dollar bulls further.
Going forward, a decisive break above May 18 high at 0.9063 will drive the asset toward the round-level resistance of 0.9100 followed by March 28 low at 0.9137.
In an alternate scenario, a downside move below May 16 low at 0.8929 will drag the asset toward April 14 low at 0.8867. A slippage below April 14 low will further drag the asset toward the Spring formation around May 04 low at 0.8820.
USD/CHF four-hour chart
-638204890914979416.png)
- GBP/USD picks up bids to pare weekly losses, bounce off one-month low to snap two-day downtrend.
- Deadlock in US debt ceiling talks, market’s consolidation ahead of top-tier data/events allow Cable pair to rebound.
- UK Consumer Price Index for April might help BoE’s Bailey to defend hawkish bias and favor Pound Sterling buyers.
GBP/USD prints the first daily run-up in three as it clings to mild gains near 1.2420 ahead of the key UK inflation data and a speech from Bank of England (BoE) Governor Andrew Bailey, scheduled for Wednesday. In doing so, the Cable pair recovers from the lowest levels in a month amid the US Dollar’s retreat, as well as due to the market’s consolidation ahead of the key data/events.
US Dollar Index (DXY) struggles to extend two-day advances at the highest levels in nine weeks, grinds near 103.50 by the press time. It’s worth noting that the fears of the US debt ceiling expiry join the upbeat concerns from the UK Consumer Price Index (CPI) inflation data and a speech from BoE’s Bailey keep the GBP/USD buyers hopeful of late.
Among the key catalyst that weighs on the US Dollar is the lack of progress in the talks to avoid the US debt ceiling expiration and fears that the US may mark the ‘catastrophic’ default weighed on the market sentiment of late. Recently, US House Speaker Kevin McCarthy crossed wires, via Reuters, while suggesting no deal on the debt ceiling extension today but repeating previous optimism that they will get an agreement before June 01. Previously, Washington rolled out news stating the US Treasury has asked multiple agencies if they can delay the payment demands.
Alternatively, firmer prints of the US data and hawkish Fed concerns weigh on the Cable prices. That said, preliminary figures of the May monthly PMIs signaled that the US Services sector keeps outgrowing the manufacturing ones and fuelled the Composite PMI figure to the highest levels in a year. Further, the latest comments from Atlanta Fed President Raphael Bostic, Richmond Fed President Thomas Barkin and San Francisco President Mary C Daly who backed the calls for higher Fed rates while citing the inflation woes, which in turn propelled the bets on the Fed rate increase in June. The same push back the Fed rate cut and allows the US Dollar to remain firmer despite a retreat in the US Treasury bond yields.
At home, BoE Monetary Policy Hearings again defended the policymakers’ readiness to lift the rates while citing the inflation woes. "I can't tell you whether we're near to the peak, I can't tell you whether we are at the peak," said BoE’s Bailey. On the same line, BoE Chief Economist Huw Pill said that longer-term inflation expectations have not drifted away from target. It should be noted that the mixed prints of the UK PMIs, mostly downbeat, challenge the GBP/USD buyers.
Amid these plays, the hawkish bias about the BoE regains attention and prods the Sterling Pound sellers ahead of the key UK inflation data for April, likely to print mixed picture. That said, Wall Street benchmarks saw the red but the S&P 500 Futures seem to struggle for clear directions, marking mild gains of late.
Technical analysis
GBP/USD recovery remains elusive unless the quote stays below the 50-DMA hurdle of around 1.2430.
In recent trade today, the People’s Bank of China (PBOC) set the yuan at 7.0560 vs the close of 7.0551.
About the fix
China maintains strict control of the yuan’s rate on the mainland.
The onshore yuan (CNY) differs from the offshore one (CNH) in trading restrictions, this last one is not as tightly controlled.
Each morning, the People’s Bank of China (PBOC) sets a so-called daily midpoint fix, based on the yuan’s previous day's closing level and quotations taken from the inter-bank dealer.
- EUR/GBP is expected to deliver a sheer downside below 0.8660 as BoE’s interest rate peak is far from over.
- BoE Pill remained confident that longer-term UK inflation expectations have not drifted away from the target.
- A slight decline in Eurozone’s real GDP is anticipated in the second half of the year.
The EUR/GBP pair looks vulnerable above the immediate support of 0.8660 in the Asian session. The cross is expected to discover more losses as Bank of England (BoE) Governor Andrew Bailey has made clear that current interest rates have not peaked yet. BoE Bailey reiterated that they must use the tool of interest rate rises carefully in front of the United Kingdom parliament's Treasury Select Committee (TSC).
BoE Bailey seems confident at the meeting with Treasury Select Committee that UK’s inflation will soften sharply ahead. Gas prices have already lowered by 10%, and food inflation is also losing momentum. About UK Employment, BoE Bailey said "Private sector wages are not growing faster than we thought."
On the contrary, BoE Chief Economist Huw Pill in his testimony agreed that the central misunderstood strength and persistence in UK inflation. BoE Pill said “We are trying to understand why we have made errors in inflation forecasts.” However, BoE policymaker remained confident that longer-term inflation expectations have not drifted away from the target.
Going forward, UK’s April inflation data will remain in the spotlight. As per the preliminary report, headline inflation is seen softening sharply to 8.2% from the former release of 10.1%. Core Consumer Price Index (CPI) that excludes oil and food prices impact is expected to remain steady at 6.2%.
Meanwhile, the Euro remained in action on Tuesday after mixed preliminary May PMI data. Manufacturing PMI contracted to 44.6 from the estimates of 46.2 and the former release of 45.8. While Services PMI jumped to 55.9 vs. the consensus of 55.6 but remained lower than the prior release of 56.2. Analysts at Commerzbank expect a slight decline in real GDP in the second half of the year.
In the Eurozone, European Central Bank (ECB) Vice President Luis de Guindos said on Tuesday, “The non-bank financial sector has remained largely stable in recent months, despite the stress in the banking sector that emerged in March.”
Early Wednesday at 02:00 GMT market sees the key monetary policy decision by the Reserve Bank of New Zealand (RBNZ) amid hopes of another hawkish play by the New Zealand central bank, despite doves flexing muscles of late.
RBNZ is up for fueling the market moves with its 12th consecutive rate hike, expectedly worth 0.25%, during early Wednesday. The Interest Rate Decision will be accompanied by the RBNZ Rate Statement which can provide further details on the central bank’s next moves, making it crucial for the NZD/USD pair traders to watch. Furthermore, RBNZ Governor Adrian Orr’s presser at 03:00 GMT also amplifies Wednesday’s importance for the Kiwi pair traders.
Ahead of the event, Australia and New Zealand Banking Group (ANZ) said,
We expect a hike of 25bp to 5.5% with a firm tone, and a firm OCR track too, peaking around 6% (previously 5.5%). We see a 40% chance of a 50bp hike, and upside risk to our own forecast OCR peak of 5.75%, as that forecast preceded the Budget. We can’t be sure how much upside fiscal risk was already built into the unexpected 50bp hike in April. How much the RBNZ will make of soaring migration numbers is another key uncertainty.
On the same line, FXStreet’s Dhwani Mehta said,
Should the Reserve Bank of New Zealand deliver a dual surprise by lifting the rates by 50 bps and raising the peak rate projection to 6.0%, the NZD/USD pair is likely to see a decisive flight toward the critical supply zone near 0.6390, from where the pair has faced rejection five times since early February.
How could it affect NZD/USD?
NZD/USD portrays the typical pre-RBNZ inaction after falling the most in a week the previous day. In doing so, the Kiwi pair also pays little heed to the latest first quarter (Q1) New Zealand (NZ) Retail Sales.
Given the clear early signals of witnessing a 0.25% rate hike, the NZD/USD may offer no major reaction to the RBNZ’s rate hike if it matches the market consensus and lifts the peak rate forecasts unchanged. However, recent concerns that the inflation is still too high, despite easing of late, join the fears of more price pressures due to the nation’s “no frill” budget, to keep the RBNZ hawks hopeful and hence any surprise 0.50% rate hike could provide a tailwind to the Kiwi pair.
Apart from the interest rates, the economic forecasts and language of the RBNZ Rate Statement will also be the key for the NZD/USD pair traders to watch.
Technically, a fortnight-old symmetrical triangle restricts immediate moves of the NZD/USD between 0.6225 and 0.6270 as RSI, as well as the MACD, teases bears.
Keynotes
NZD/USD stays bearish around mid-0.6200s on downbeat NZ Retail Sales, RBNZ, Fed Minutes eyed
NZD/USD Price Analysis: RBNZ in focus, bears are engaged
About the RBNZ interest rate decision and rate statement
The RBNZ interest rate decision is announced by the Reserve Bank of New Zealand. If the RBNZ is hawkish about the inflationary outlook of the economy and raises the interest rates it is positive, or bullish, for the NZD. The RBNZ rate statement contains explanations of their decision on interest rates and commentary about the economic conditions that influenced their decision.
- AUD/USD bears remain in control while on the front side of the trendline.
- The bulls need to get over a 61.8% ratio.
AUD/USD bears remain in control with the market still unable to get over the line, submerged below the dynamic trendline resistance. The price is currently trying to firm up in an area of support, but the bias remains bearish as the following illustrates:
AUD/USD bearish bias
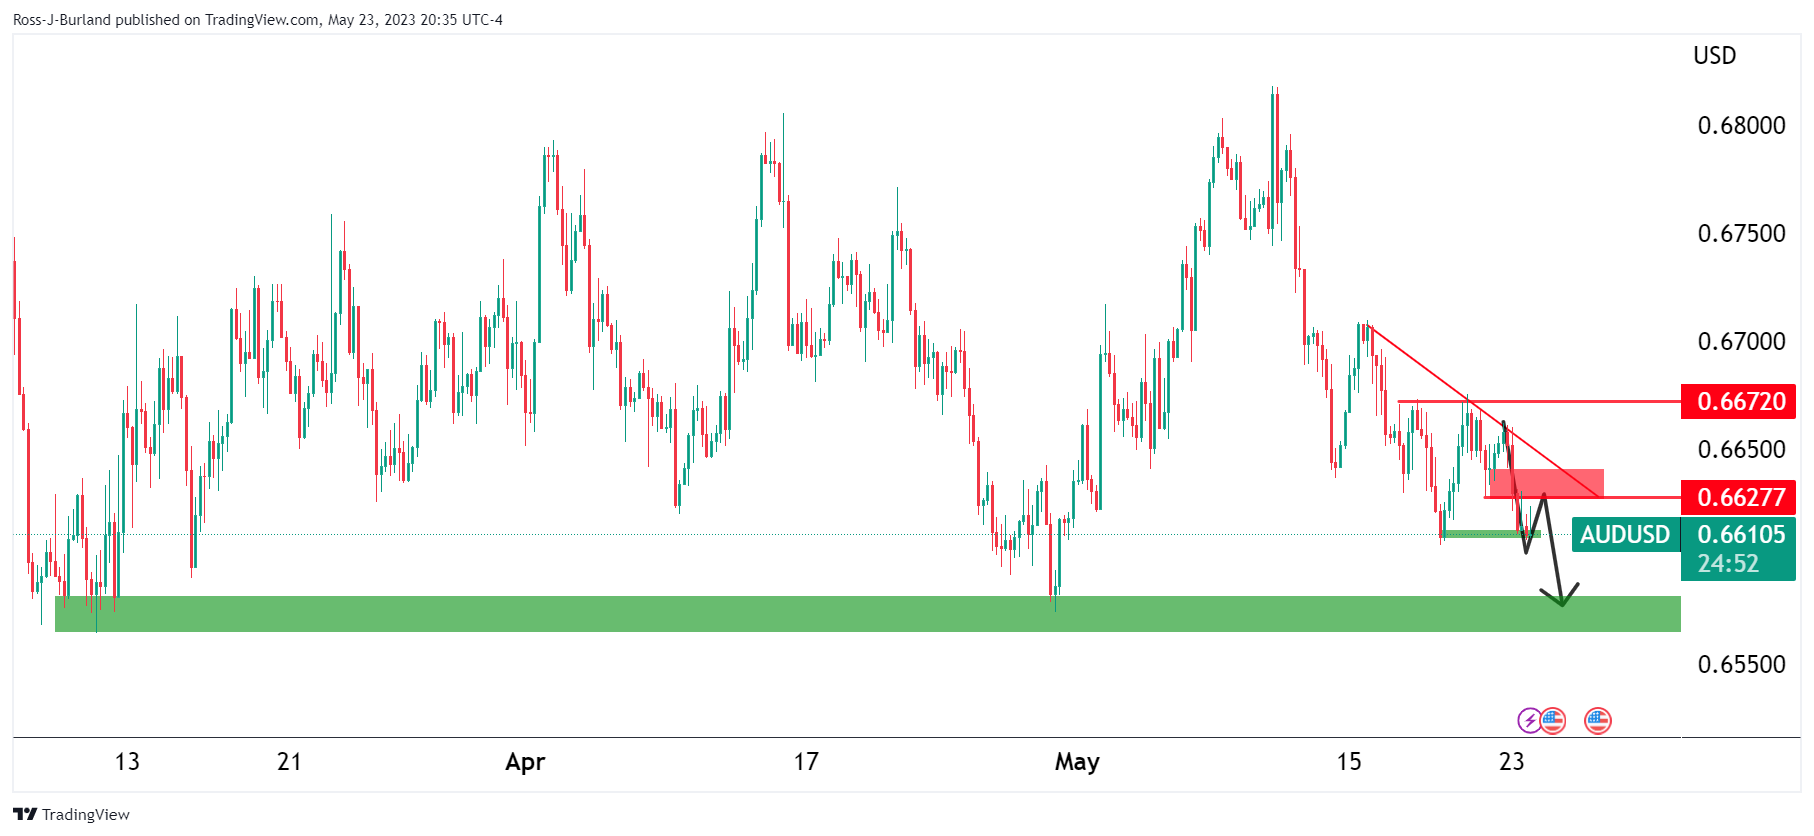
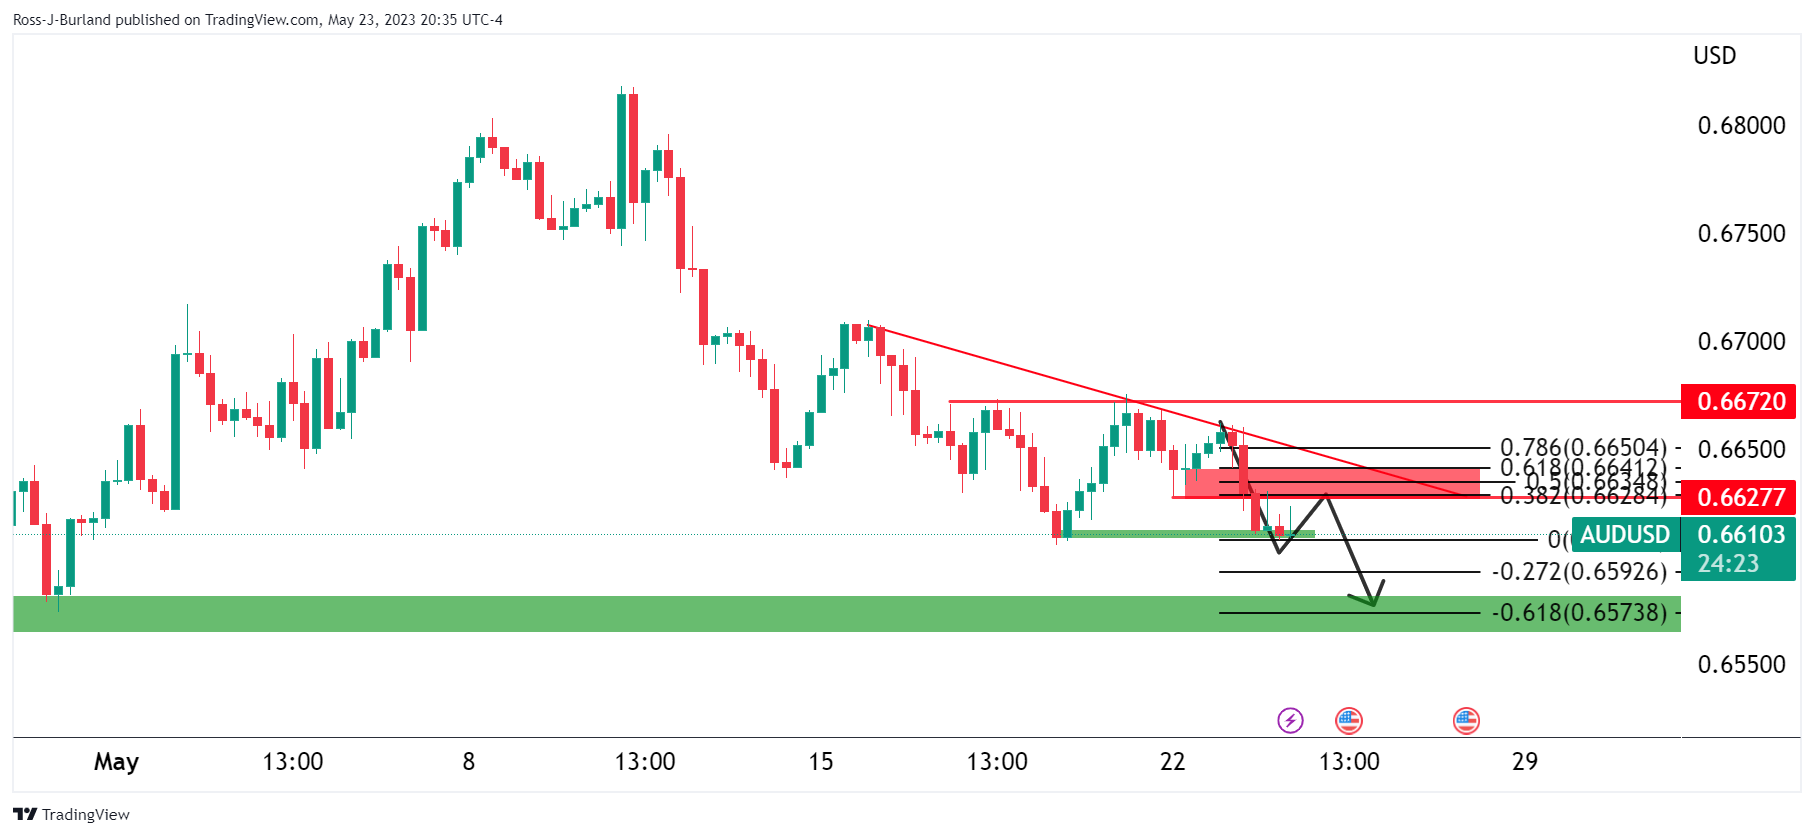
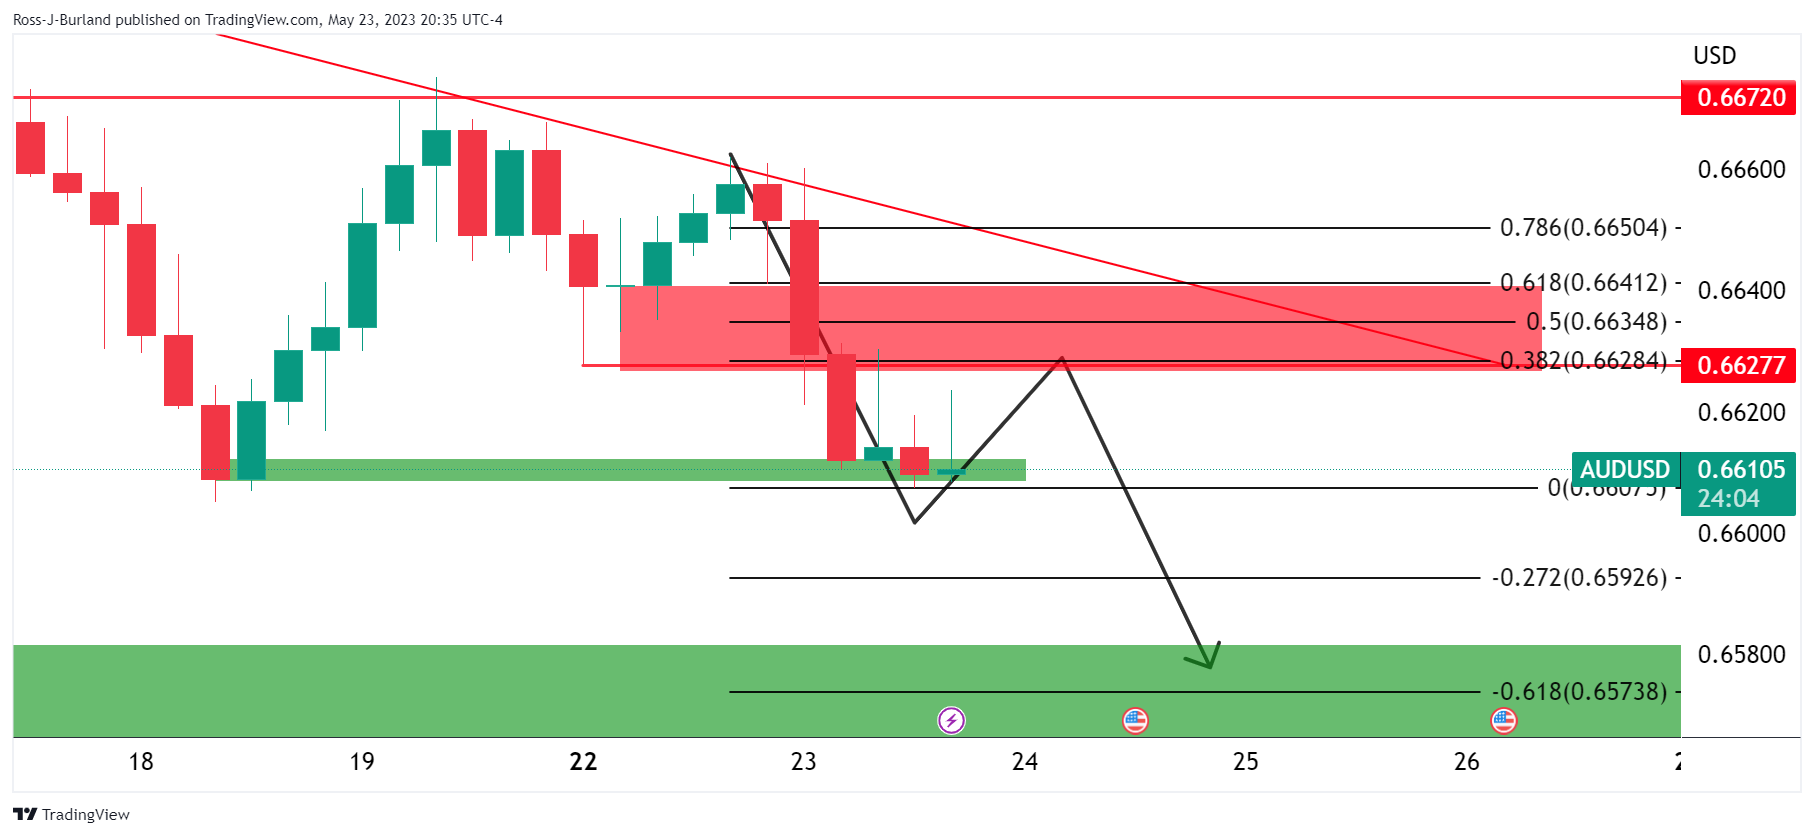
Should the bears firm up on a correction, on the front side of the bearish trendline, then there would be prospects of a break of support and a continuation towards 0.6570 in the near term.
AUD/USD bullish scenario
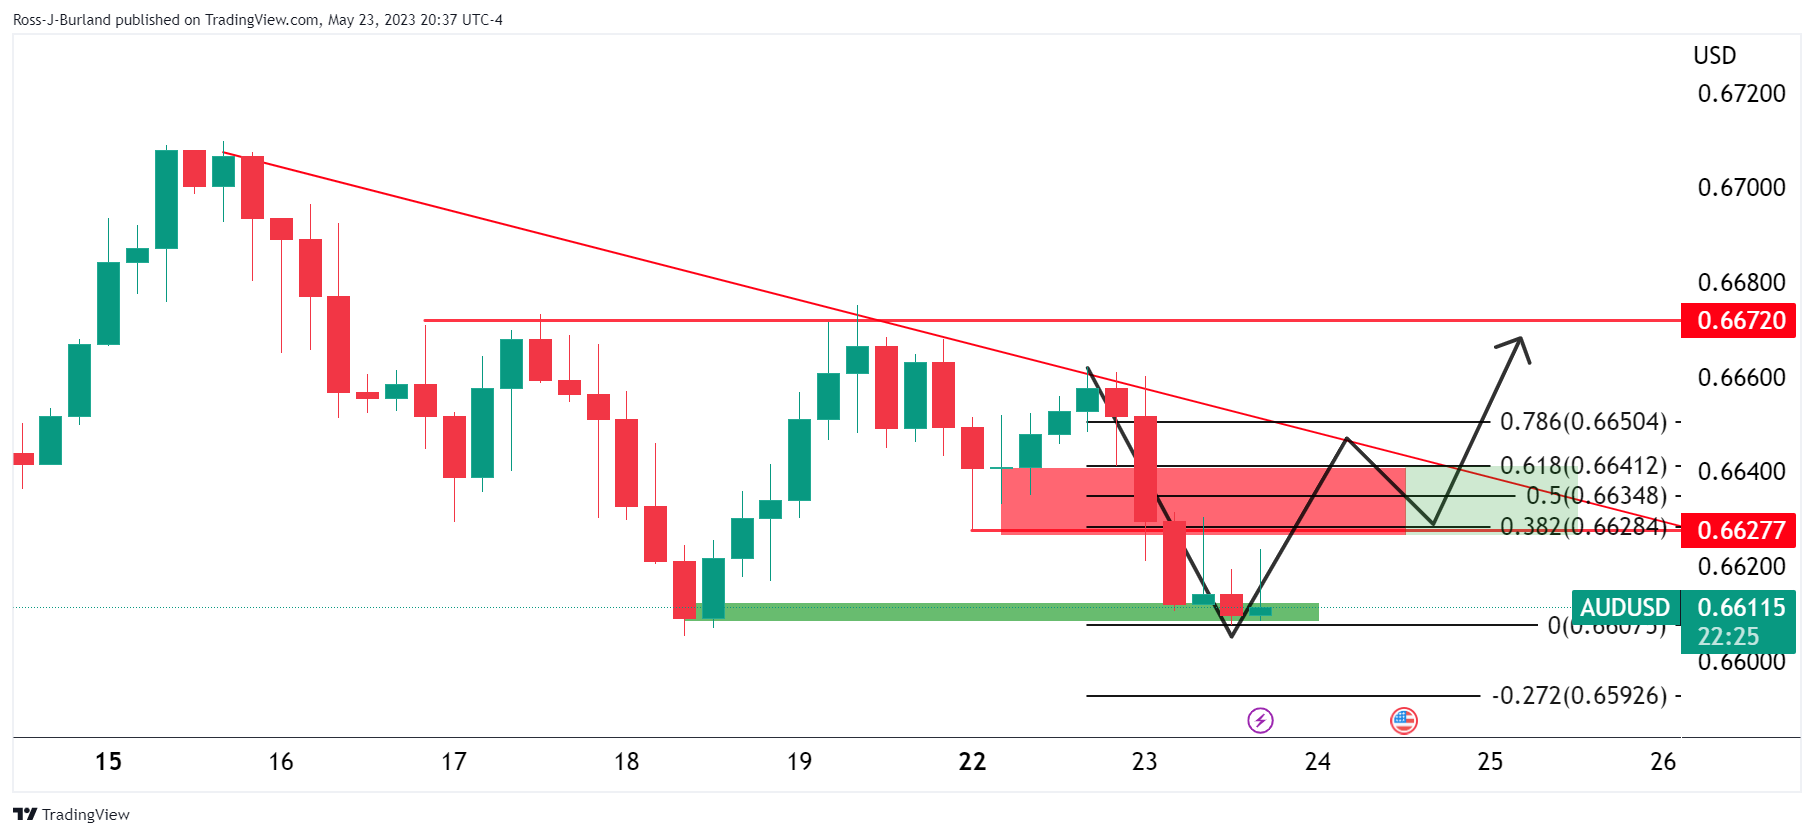
Should the bulls finally get back some control, a break of the trendline resistance will be needed. A move into the 50% mean reversion area would be a good start from where a test into the 61.8% ratio could see the bulls over the line.
- Gold Price stabilizes after bouncing off seven-week-old support.
- Fears of United States default spread amid lackluster debt ceiling talks, upbeat US PMIs justify hawkish Federal Reserve concerns.
- FOMC Minutes should justify rate hike expectations to keep XAU/USD on bear’s radar.
- US political updates, Sino-American tension are extra catalysts to watch as sluggish Treasury yields prod US Dollar bulls.
Gold Price (XAU/USD) struggles to defend the previous day’s corrective bounce from the short-term key support line, mildly bid around $1,975 amid early Wednesday. In doing so, the precious metal awaits more clues to cheer the latest pause in the US Dollar’s run-up at the multi-day high as the Federal Open Market Committee (FOMC) Meeting Minutes loom.
It’s worth noting that a pullback in the US Treasury bond yields and doubts over the US debt ceiling extension deal seem to prod the Gold buyers of late. However, the hawkish Federal Reserve (Fed) concerns and expectations that the US policymakers will be able to tackle the default conditions keep the XAU/USD sellers hopeful.
Gold Price improves as US Treasury bond yields retreat amid debt ceiling woes
Gold price benefits from the latest easing in the United States Treasury bond yields, especially as the US debt ceiling woes escalate. That said, the US 10-year and two-year Treasury bond yields retreated from the highest levels since early March the previous day.
It should be noted that a lack of progress in the talks to avoid the US debt ceiling expiration and fears that the US may mark the ‘catastrophic’ default weighed on the market sentiment of late. Recently, US House Speaker Kevin McCarthy crossed wires, via Reuters, while suggesting no deal on the debt ceiling extension today but repeating previous optimism that they will get an agreement before June 01. Previously, Washington rolled out news stating the US Treasury has asked multiple agencies if they can delay the payment demands. Even so, US President Biden and House Speaker McCarthy remain hopeful of avoding the ‘catastrophic’ default.
Hence, the US decision-makers’ optimism to avoid the default keeps the Gold price buyers on the positive side despite the latest challenges to sentiment. While portraying the mood, Wall Street benchmarks saw the red but the S&P 500 Futures seem to struggle for clear directions, marking mild gains of late.
Hawkish Federal Reserve concerns, upbeat Untied States data prod XAU/USD bulls
While cautious mood amid the mixed feelings for the United States default conditions allow the Gold price to recover from short-term key support, impressive US data and hawish Federal Reserve (Fed) bets lure the Gold price sellers.
On Tuesday, preliminary figures of the May monthly PMIs signaled that the US Services sector keeps outgrowing the manufacturing ones and fuelled the Composite PMI figure to the highest levels in a year. That said, the US S&P Global Manufacturing PMI eased to 48.5 from 50.2 versus 50.0 market forecasts whereas Sevices PMI rose to 55.1 compared to 52.6 expected and 53.6. With this, the Composite PMI marked 54.5 figures versus the analysts’ expectations of 50.0 and 53.4.
Elsewhere, the latest comments from Atlanta Fed President Raphael Bostic, Richmond Fed President Thomas Barkin and San Francisco President Mary C Daly who backed the calls for higher Fed rates while citing the inflation woes, which in turn propelled the betts on the Fed rate increase in June. The same push back the Fed rate cut and allows the US Dollar to remain firmer despite a retreat in the US Treasury bond yields, which in turn challenges the Gold price buyers.
FOMC Minutes, US default woes are the key for Gold price directions
Given the mixed markets and the Gold price consolidation ahead of the key events, namely Minutes of the latest Federal Open Market Committee (FOMC) Monetary Policy Meeting, traders may witness further lack of activity. Even so, updates about the US debt ceiling negotiations and the US-China tension, which are on the spike of late, will be the key to watch for clear directions of the XAU/USD.
Ahead of the FOMC Minutes, FXStreet’s Matias Salord says, “The rise in US yields has been a significant factor behind the US Dollar Index's recent upward movement. The upcoming release could further boost Dollar's strength, especially if they provide an upbeat perspective. However, if the FOMC minutes fail to do so and the outlook is pessimistic, yields could drop, posing a challenge to the current bullish outlook.”
Also read: FOMC Minutes Preview: The complicated task of searching for clues
Gold Price Technical Analysis
Gold price grinds higher after bouncing off an upward-sloping support line from early April, close to $1,954 by the press time. The XAU/USD rebound also takes clues from the bullish signals from the Moving Average Convergence and Divergence (MACD) indicators, as well as justifies the steady Relative Strength Index (RSI) line, placed at 14, surrounding 50.0 level.
With this, the Gold price may extend the latest recovery towards the $1,985 resistance confluence comprising the 50-SMA and a three-week-old descending trend line.
If at all the XAU/USD manages to cross the $1,985 hurdle, the 200-SMA level of near $2,003 can challenge the Gold buyers before directing them to the previous monthly high of around $2,050.
On the flip side, a sustained break of the $1,954 support line could direct the Gold price towards the late March swing low of around $1,934 before giving control to the bears.
In that case, the 61.8% Fibonacci retracement of the bullion’s March-May upside, near $1,911, might offer an intermediate halt to the XAU/USD sellers.
Overall, the Gold Price is likely to grind higher but the upside room remains limited.
Gold Price: Four-hour chart
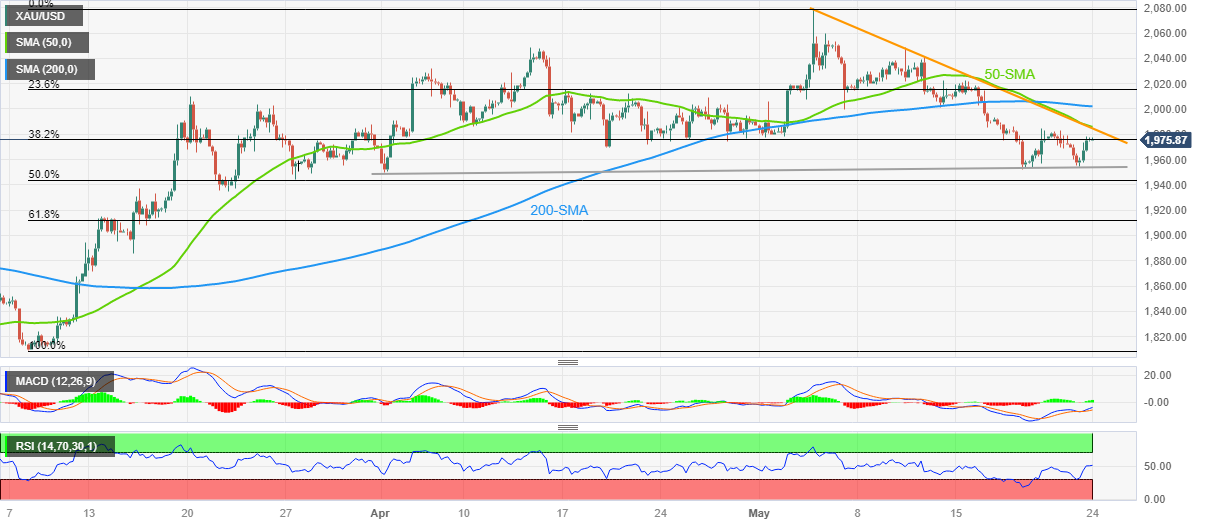
Trend: Limited recovery expected
| Index | Change, points | Closed | Change, % |
|---|---|---|---|
| NIKKEI 225 | -129.05 | 30957.77 | -0.42 |
| Hang Seng | -246.92 | 19431.25 | -1.25 |
| KOSPI | 10.47 | 2567.55 | 0.41 |
| ASX 200 | -3.4 | 7259.9 | -0.05 |
| DAX | -71.13 | 16152.86 | -0.44 |
| CAC 40 | -99.45 | 7378.71 | -1.33 |
| Dow Jones | -231.07 | 33055.51 | -0.69 |
| S&P 500 | -47.05 | 4145.58 | -1.12 |
| NASDAQ Composite | -160.54 | 12560.25 | -1.26 |
- USD/JPY has turned quiet around 138.60 amid a lack of clarity over further action after a delay in the US debt-ceiling raise.
- The US Dollar Index is in an inventory adjustment phase after reclaiming the previous week’s high above 103.60.
- Japanese economic prospects are getting stronger amid wage growth and a recovery in overall demand.
The USD/JPY pair is displaying signs of a sheer decline in volatility around 138.60 as investors are confused about further action in the FX domain. The asset is struggling to deliver a decisive move amid a lack of clarity as US debt-ceiling issues are not reaching a bipartisan deal.
S&P500 futures have posted some gains in early Tokyo. US equities were heavily sold on Tuesday as investors are worried that a default by the United States economy in addressing its obligated payments will trigger a recession. Market sentiment has dampened amid obscurity in global markets.
The US Dollar Index (DXY) is in an inventory adjustment phase after reclaiming the previous week’s high above 103.60. It is difficult to consider further direction as investors are awaiting the release of the May meeting Federal Open Market Committee (FOMC) minutes.
Investors should not that Federal Reserve (Fed) chair Jerome Powell cited in May’s meeting that the central bank will be more data-dependent from now after hiking interest rates by 25 basis points (bps). On Friday, Fed Powell delivered a dovish interest rate guidance, supported a pause for June’s monetary policy meeting as tight credit conditions by US regional banks are weighing heavily on inflationary pressures.
On the Japanese Yen front, economic prospects are getting stronger amid wage growth and a recovery in overall demand. Reuters Tankan Survey reported Business sentiment at big Japanese manufacturers turned positive for the first time this year and service-sector morale hit a five-month high, providing more evidence of an economy on the mend after a COVID-led recession,”
Also, Manufacturing PMI (May) jumped to 50.8 vs. the estimates of 49.5 while Services PMI soared to 56.3 against the estimates of 55.2 in the same period. These conditions might support Japan’s inflation for steadily remaining above 2%.
| Pare | Closed | Change, % |
|---|---|---|
| AUDUSD | 0.66105 | -0.61 |
| EURJPY | 149.224 | -0.4 |
| EURUSD | 1.07727 | -0.37 |
| GBPJPY | 171.985 | -0.19 |
| GBPUSD | 1.24162 | -0.15 |
| NZDUSD | 0.62477 | -0.64 |
| USDCAD | 1.3501 | -0.01 |
| USDCHF | 0.90129 | 0.38 |
| USDJPY | 138.525 | -0.03 |
- Silver Price remains sidelined within “Bearish Megaphone” after refreshing multi-day low.
- Steady RSI, sustained trading below 200-HMA and trend-widening formation keep XAG/USD bears hopeful.
- Silver price recovery remains elusive below $24.25; bears may witness a bumpy road ahead.
Silver Price (XAG/USD) remains sidelined around $23.45 amid a sluggish Asian session on Wednesday, after falling to the fresh low in two months the previous day. That said, RSI (14) line’s bounce off the oversold territory and the bullish MACD signals seem to defend the XAG/USD’s latest corrective bounce off the multi-day bottom.
Even so, the bright metal remains on the seller’s radar as it portrays a “Bearish Megaphone” trend-widening chart pattern while connecting levels marked since May 12. Additionally, the Silver Price’s sustained trading below the 200-Hour Simple Moving Average (HMA) keeps the XAG/USD sellers hopeful.
It’s worth noting, however, that the latest trough of $23.11 and the bottom line of the stated megaphone, close to $23.05, quickly followed by the $23.00 round figure, may test the Silver sellers.
Following that, the bullion can drop to the late February swing high of around $22.00, with the $22.70 and $22.20 likely offering intermediate halts during the anticipated fall.
Alternatively, XAG/USD recovery may aim for the 200-HMA hurdle, near $23.75 by the press time. Following that, the stated chart formation’s top line, close to $23.90, as well as the $24.00 round figure may prod the Silver buyers.
In a case where the Silver Price remains firmer past $24.00, a fortnight-old horizontal resistance near $24.25, will act as the last defense of the XAG/USD bears.
Silver price: Hourly chart
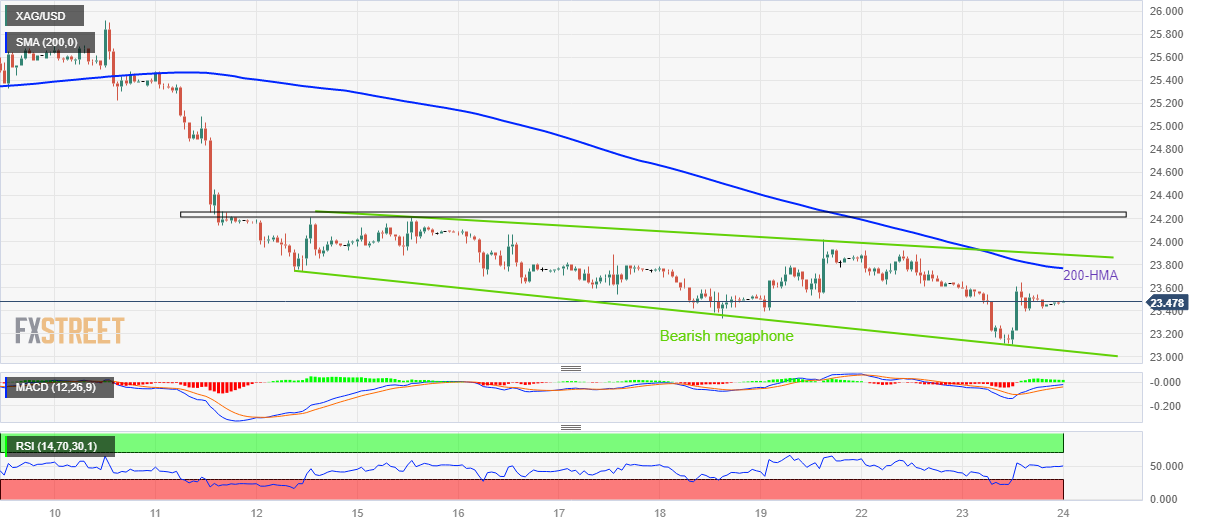
Trend: Further downside expected


© 2000-2026. All rights reserved.
This site is managed by Teletrade D.J. LLC 2351 LLC 2022 (Euro House, Richmond Hill Road, Kingstown, VC0100, St. Vincent and the Grenadines).
The information on this website is for informational purposes only and does not constitute any investment advice.
The company does not serve or provide services to customers who are residents of the US, Canada, Iran, The Democratic People's Republic of Korea, Yemen and FATF blacklisted countries.
Making transactions on financial markets with marginal financial instruments opens up wide possibilities and allows investors who are willing to take risks to earn high profits, carrying a potentially high risk of losses at the same time. Therefore you should responsibly approach the issue of choosing the appropriate investment strategy, taking the available resources into account, before starting trading.
Use of the information: full or partial use of materials from this website must always be referenced to TeleTrade as the source of information. Use of the materials on the Internet must be accompanied by a hyperlink to teletrade.org. Automatic import of materials and information from this website is prohibited.
Please contact our PR department if you have any questions or need assistance at pr@teletrade.global.
transfers