- Analytics
- News and Tools
- Market News
CFD Markets News and Forecasts — 30-04-2020
| Time | Country | Event | Period | Previous value | Forecast |
|---|---|---|---|---|---|
| 00:30 | Japan | Manufacturing PMI | April | 44.8 | 43.7 |
| 01:30 | Australia | Producer price index, q / q | Quarter I | 0.3% | |
| 01:30 | Australia | Producer price index, y/y | Quarter I | 1.4% | |
| 06:00 | United Kingdom | Nationwide house price index, y/y | April | 3% | 2.5% |
| 06:00 | United Kingdom | Nationwide house price index | April | 0.8% | -0.3% |
| 08:30 | United Kingdom | Net Lending to Individuals, bln | March | 5.2 | |
| 08:30 | United Kingdom | Mortgage Approvals | March | 73.55 | 60 |
| 08:30 | United Kingdom | Consumer credit, mln | March | 0.9 | 0.7 |
| 08:30 | United Kingdom | Purchasing Manager Index Manufacturing | April | 47.8 | 32.8 |
| 13:45 | U.S. | Manufacturing PMI | April | 48.5 | 36.9 |
| 14:00 | U.S. | Construction Spending, m/m | March | -1.3% | -3.5% |
| 14:00 | U.S. | ISM Manufacturing | April | 49.1 | 36.9 |
| 17:00 | U.S. | Baker Hughes Oil Rig Count | May | 378 |
FXStreet reports that economists at Credit Suisse apprise that further strength is expected in AUD/NZD as a base is in place.
“The market has now established a base, reinforcing the recent upswing.”
“We see resistance initially at the 61.8% retracement of the 2017/2020 fall at 1.0796/98. Removal of here would then challenge the 2019 high at 1.0866, before the trend resistance from January 2019 at 1.1001, which would cap if reached.”
“Support is seen at the 55-day average and mid-April low at 1.0514/0484, ahead of the 200-day average at 1.0386, which ideally caps any correction lower.”
FXStreet reports that Sal Guatieri from the Bank of Montreal recaps the latest economic data released by the US.
“Due to business closures and distancing measures, Personal Spending plunged 7.5% in March, by far the steepest on record though little surprise after yesterday's Q1 GDP release.”
“Core PCE prices declined an expected 0.1% in the month, trimming the yearly rate to 1.7%. It is headed toward 1% in the year ahead.”
“Initial Jobless Claims tallied 3.84 million last week, topping the consensus call and taking the six-week total to an unprecedented 30.3 million, or nearly 19% of the labour force. The number should drop-off quickly in coming weeks as more businesses reopen, but won't return to pre-virus levels of around 200,000 for a long time.”
Fed announced on Thursday it is expanding the scope and eligibility for the Main Street Lending Program.
As part of its broad effort to support the economy, the Federal Reserve developed the Main Street Lending Program to help credit flow to small and medium-sized businesses that were in sound financial condition before the pandemic.
... In response to the public input, the Board decided to expand the loan options available to businesses, and increased the maximum size of businesses that are eligible for support under the program. The changes include:
- Creating a third loan option, with increased risk sharing by lenders for borrowers with greater leverage;
- Lowering the minimum loan size for certain loans to $500,000; and
- Expanding the pool of businesses eligible to borrow.
- Expects April jobs report to show unemployment rate at around 19%
- White House should have better ideas soon if more stimulus for economy needed
FXStreet notes that industry-level GDP was unchanged in February (market: 0.1%) on a muted performance across both goods and services. Unsurprisingly, stale data was ignored by the CAD, economists at TD Securities brief.
“The Canadian economy was on a softer footing than expected heading into the COVID shutdowns, with industry-level GDP unchanged during the month of February (market: 0.1%).”
“Unsurprisingly, the CAD ignored the data. With month-end dynamics the primary focus this week, a stale GDP report was never going to be that interesting to follow anyway.”
“1.3850/00 marks an interim pivot with 1.3725/50 being the next major support level below. The former pivot looks attractive to layer in fresh longs before USD/CAD makes its inevitable push back above 1.40.”
MNI Indicators' report revealed on Thursday that business activity in Chicago decreased significantly this month, as business confidence dipped sharply amid the current spread of COVID-19.
The MNI Chicago Business Barometer, also known as Chicago purchasing manager's index (PMI) came in at 35.4 in April, down from an unrevised 47.8 in April. That was the lowest level since March 2009.
Economists had forecast the index to come in at 38.0.
A reading above 50 indicates improving conditions, while a reading below this level shows worsening of the situation.
According to the report, Production tumbled 19 points in April, hitting the lowest level since June 1980, while New Orders plunged 21 points, recording the largest decline on record, as respondents noted a severe negative COVID-19 impact on both demand and production. In addition, Employment fell in April to the lowest level since June 2009, while Order Backlogs eased, following two straight months of gains. Meanwhile, Inventories rose substantially, although remaining below the 50-mark for a ninth successive month.
The Commerce Department reported on Thursday that consumer spending in the U.S. tumbled 7.5 percent m-o-m in March after a 0.2 percent m-o-m increase in February. That was the largest monthly decline in personal spending on record. Economists had forecast the reading to show a 5.0 percent m-o-m decrease.
Meanwhile, consumer income fell 2.0 percent m-o-m in March, following a 0.6 percent m-o-m advance in the previous month. That was the biggest monthly decrease in personal income since January 2013. Economists had forecast a 1.5 percent m-o-m drop.
The March decrease in personal income and spending was, in part, due to the response to the spread of COVID-19, as governments issued "stay-at-home" orders. This led to rapid changes in demand, as businesses and schools switched to remote work or canceled operations, and consumers canceled, restricted, or redirected their spending, the report said.
The personal consumption expenditures (PCE) price index, excluding the volatile categories of food and energy, which is the Fed's preferred inflation measure, fell 0.1 percent m-o-m in March, following an unrevised 0.2 percent m-o-m advance in the prior month. Economists had projected the index would edge down 0.1 percent m-o-m.
In the 12 months through March, the core PCE increased 1.7 percent, following an unrevised 1.8 percent growth in the 12 months through February. Economists had forecast an advance of 1.6 percent y-o-y.
FXStreet reports that Douglas Porter from the bank of Montreal notes that Canadian real GDP was flat in February in the last month before the economy was hit with the full force of the pandemic and shutdowns.
“Just prior to the pandemic, strikes and blockades cut GDP by 0.2 ppts, holding output flat. Combined with the small upward revision in January, this leaves StatsCan's initial estimate of a 10% annualized decline in Q1 on track.”
“We continue to look for a much deeper setback in Q2, when GDP is expected to fall nearly 14%.”
“In a separate release, payroll jobs fell 35,000 in February, cutting the y/y trend to 1.2%. There were declines in both factories and transportation. More timely, March producer prices fell 0.9% (and down 2.4% y/y), amid the steep drop in oil prices.”
U.S. stock-index futures fell on Thursday, as stunning jobless claims data overshadowed upbeat earnings from major tech companies.
Global Stocks:
| Index/commodity | Last | Today's Change, points | Today's Change, % |
| Nikkei | 20,193.69 | +422.50 | +2.14% |
| Hang Seng | 24,643.59 | +67.63 | +0.28% |
| Shanghai | 2,860.08 | +37.64 | +1.33% |
| S&P/ASX | 5,522.40 | +129.00 | +2.39% |
| FTSE | 5,994.30 | -120.95 | -1.98% |
| CAC | 4,619.01 | -52.10 | -1.12% |
| DAX | 10,983.21 | -124.53 | -1.12% |
| Crude oil | $16.62 | | +10.36% |
| Gold | $1,711.20 | | -0.13% |
- Says recovery speed and scale remain highly uncertain
- Policy helps support flow of credit to companies
- Welcomes government measures
- Says continued ambitious efforts needed
- Announces new PELTROs or non-targeted pandemic emergency longer-term refinancing operations in an effort to support liquidity conditions in the euro area financial system and contribute to preserving the smooth functioning of money markets by providing and if effective liquidity backstop
- ECB expects to keep the main refinancing operation and the interest rates on marginal lending rate facility and the deposit facility at present levels or lower levels until it has seen the inflation outlook robustly converts to a level of sufficiently close to but below 2%
- Notes that ensuring monetary policy transmitted to all countries
- ECB is ready to adjust all instruments by as much as necessary and as long as necessary
- Says pandemic severely affected manufacturing and services
- Economic impact likely to even be more severe in Q2
- Growth expected to resume as containment is lifted
- Duration epidemic highly uncertain
- ECB prepared to extend PEPP for as long as needed
- Euro area GDP can fall by -5% to as low as -12%
- Expects headline inflation to drop considerably in coming months
- Virus implications for longer-term inflation highly uncertain
- Coordinated fiscal stance is critical
- Longer-term inflation expectations less affected
- More favorable TLTRO III terms should encourage lending
(company / ticker / price / change ($/%) / volume)
| 3M Co | MMM | 155 | -1.26(-0.81%) | 6864 |
| ALCOA INC. | AA | 8.61 | -0.06(-0.69%) | 47183 |
| ALTRIA GROUP INC. | MO | 41.3 | 0.83(2.05%) | 21298 |
| Amazon.com Inc., NASDAQ | AMZN | 2,407.79 | 35.08(1.48%) | 105355 |
| American Express Co | AXP | 94 | -2.12(-2.21%) | 31219 |
| Apple Inc. | AAPL | 288.88 | 1.15(0.40%) | 410925 |
| AT&T Inc | T | 31.33 | -0.10(-0.32%) | 75860 |
| Boeing Co | BA | 138.25 | -0.75(-0.54%) | 584815 |
| Caterpillar Inc | CAT | 118.6 | -1.46(-1.22%) | 169230 |
| Chevron Corp | CVX | 94.74 | 0.12(0.13%) | 40111 |
| Cisco Systems Inc | CSCO | 43.25 | -0.09(-0.21%) | 62599 |
| Citigroup Inc., NYSE | C | 49.16 | -1.10(-2.19%) | 140918 |
| Deere & Company, NYSE | DE | 147.9 | 0.80(0.54%) | 263 |
| E. I. du Pont de Nemours and Co | DD | 47.5 | -0.67(-1.39%) | 4729 |
| Exxon Mobil Corp | XOM | 47.59 | 0.13(0.27%) | 302096 |
| Facebook, Inc. | FB | 208.11 | 13.92(7.17%) | 1066623 |
| FedEx Corporation, NYSE | FDX | 129.21 | -0.27(-0.21%) | 2135 |
| Ford Motor Co. | F | 5.2 | -0.06(-1.14%) | 582091 |
| Freeport-McMoRan Copper & Gold Inc., NYSE | FCX | 9.06 | -0.20(-2.16%) | 47859 |
| General Electric Co | GE | 6.56 | -0.02(-0.30%) | 2372031 |
| General Motors Company, NYSE | GM | 23.48 | -0.30(-1.26%) | 51480 |
| Goldman Sachs | GS | 187.6 | -2.43(-1.28%) | 8977 |
| Google Inc. | GOOG | 1,329.00 | -12.48(-0.93%) | 12268 |
| Hewlett-Packard Co. | HPQ | 16.3 | 0.02(0.12%) | 6449 |
| Home Depot Inc | HD | 219.99 | -1.82(-0.82%) | 9065 |
| HONEYWELL INTERNATIONAL INC. | HON | 145.5 | -0.66(-0.45%) | 1841 |
| Intel Corp | INTC | 61.5 | -0.30(-0.49%) | 58558 |
| International Business Machines Co... | IBM | 127.9 | -0.79(-0.61%) | 11002 |
| International Paper Company | IP | 37 | 0.48(1.31%) | 3311 |
| Johnson & Johnson | JNJ | 149.19 | -1.05(-0.70%) | 217739 |
| JPMorgan Chase and Co | JPM | 95.97 | -1.89(-1.93%) | 141225 |
| McDonald's Corp | MCD | 184.05 | -3.77(-2.01%) | 102040 |
| Merck & Co Inc | MRK | 80.21 | -0.56(-0.69%) | 7189 |
| Microsoft Corp | MSFT | 179.63 | 2.20(1.24%) | 745994 |
| Nike | NKE | 87.4 | -0.67(-0.76%) | 27774 |
| Pfizer Inc | PFE | 38.25 | 0.13(0.34%) | 52060 |
| Procter & Gamble Co | PG | 116.11 | -0.97(-0.83%) | 6827 |
| Starbucks Corporation, NASDAQ | SBUX | 76.48 | -0.38(-0.49%) | 63345 |
| Tesla Motors, Inc., NASDAQ | TSLA | 858.62 | 58.11(7.26%) | 549354 |
| The Coca-Cola Co | KO | 47.1 | -0.02(-0.04%) | 58702 |
| Travelers Companies Inc | TRV | 104.41 | -1.59(-1.50%) | 4651 |
| Twitter, Inc., NYSE | TWTR | 29.12 | -1.97(-6.34%) | 6987027 |
| UnitedHealth Group Inc | UNH | 283.94 | -3.71(-1.29%) | 6286 |
| Verizon Communications Inc | VZ | 57.89 | -0.23(-0.40%) | 9774 |
| Visa | V | 181.6 | -0.19(-0.10%) | 69244 |
| Wal-Mart Stores Inc | WMT | 123.87 | 0.27(0.22%) | 28649 |
| Walt Disney Co | DIS | 110.7 | -1.55(-1.38%) | 118575 |
| Yandex N.V., NASDAQ | YNDX | 38.51 | -1.10(-2.78%) | 2608 |
Microsoft (MSFT) target raised to $200 from $192 at Griffin Securities
Facebook (FB) upgraded to Hold from Sell at Pivotal Research Group; target raised to $225
The data from the Labor Department revealed on Thursday the number of applications for unemployment drop last week from the previous four weeks, but still remained huge, showing that the coronavirus' damage to the U.S. labor market remains profound.
According to the report, the initial claims for unemployment benefits totaled 3,839,000 for the week ended April 25. That brings the number of job losses over the past six weeks to 30.3 million.
Economists had expected 3,500,000 new claims last week.
Claims for the prior week were revised upwardly to 4,442,000 from the initial estimate of 4,427,000.
Meanwhile, the four-week moving average of claims fell to 5,033,250 from a revised 5,790,250 in the previous week.
| Time | Country | Event | Period | Previous value | Forecast | Actual |
|---|---|---|---|---|---|---|
| 07:55 | Germany | Unemployment Change | April | 1 | 76 | 373 |
| 07:55 | Germany | Unemployment Rate s.a. | April | 5% | 5.2% | 5.8% |
| 09:00 | Eurozone | Harmonized CPI ex EFAT, Y/Y | April | 1% | 0.7% | 0.9% |
| 09:00 | Eurozone | Harmonized CPI, Y/Y | April | 0.7% | 0.1% | 0.4% |
| 09:00 | Eurozone | Unemployment Rate | March | 7.3% | 7.7% | 7.4% |
| 09:00 | Eurozone | GDP (YoY) | Quarter I | 1% | -3.1% | -3.3% |
| 09:00 | Eurozone | GDP (QoQ) | Quarter I | 0.1% | -3.5% | -3.8% |
| 11:45 | Eurozone | ECB Interest Rate Decision | 0% | 0% | 0% | |
| 12:30 | U.S. | Continuing Jobless Claims | April | 15818 | 19238 | 17992 |
| 12:30 | Canada | Industrial Product Price Index, y/y | March | -0.3% | -2.4% | |
| 12:30 | Canada | Industrial Product Price Index, m/m | March | -0.5% | -1.7% | -0.9% |
| 12:30 | U.S. | Personal spending | March | 0.2% | -5% | -7.5% |
| 12:30 | U.S. | Employment Cost Index | Quarter I | 0.7% | 0.6% | 0.8% |
| 12:30 | Canada | GDP (m/m) | February | 0.2% | 0.1% | 0% |
| 12:30 | U.S. | Initial Jobless Claims | April | 4442 | 3500 | 3839 |
| 12:30 | U.S. | PCE price index ex food, energy, Y/Y | March | 1.8% | 1.6% | 1.3% |
| 12:30 | U.S. | PCE price index ex food, energy, m/m | March | 0.2% | -0.1% | -0.1% |
| 12:30 | U.S. | Personal Income, m/m | March | 0.6% | -1.5% | -2% |
| 12:30 | Eurozone | ECB Press Conference |
EUR dropped slightly against most other major currencies in the European session on Thursday, as market participants digested the outcomes of the European Central Bank's (ECB) meeting and disappointing Q1 GDP data.
As widely expected, the ECB decided to leave key interest rates unchanged at its latest meeting and reiterated it is willing to do more to support the Eurozone economy. It said that conditions on the targeted longer-term refinancing operations (TLTRO) had been further eased and announced the new series of non-targeted pandemic emergency longer-term refinancing operations (PELTROs) to support liquidity conditions in the euro area financial system. The Bank also stated that the purchases under the new pandemic emergency purchase programme (PEPP) would continue to be conducted in a flexible manner over time, across asset classes and among jurisdictions, and the net purchases under the asset purchase programme (APP) would continue at a monthly pace of €20 billion, together with the purchases under the additional €120 billion temporary envelope until the end of the year. In addition, the ECB said it was fully prepared to increase the size of the PEPP by as much as necessary and for as long as needed.
In the morning, investors received disappointing data from Eurostat, which showed that the euro area's economy contracted more than forecast. According to Eurostat's preliminary estimate, Eurozone's GDP fell 3.8 percent q/q in the first quarter of 2020 after a 0.1 percent q/q advance in the fourth quarter of 2019. This was the steepest quarterly decline since the time series started in 1995 and exceeded economists' forecast of a 3.5 percent q/q decline. In y/y terms, the economy shrank 3.3 percent in the first quarter after growing 1.0 percent in the fourth quarter. This was the sharpest drop since the third quarter of 2009. Economists had forecast that GDP would fall 3.1 percent.
FXStreet reports that according to analysts at Credit Suisse, Brent Crude Oil is similarly holding multi-year support at $16.65/14.53, although the trend stays down.
“Although the overall downtrend remains intact, we look for an attempt to find a floor at the $16.65/14.53 multi-year support. Strong resistance though will be expected though at $26.50/27.00.”
“Below $14.53 would warn of a further significant deterioration, with support next at $12.33, then the $9.55 low of 1998.”
The European Central Bank (ECB) remained its main refinancing rate unchanged at 0.00 percent on Thursday, as widely expected.
Its interest rates on the marginal lending facility and the deposit facility were also left unchanged at 0.25 percent and -0.50 percent, respectively.
In its policy statement, the ECB said:
- Conditions on the targeted longer-term refinancing operations (TLTRO III) have been further eased;
- New series of non-targeted pandemic emergency longer-term refinancing operations (PELTROs) will be conducted to support liquidity conditions in the euro area financial system;
- Net purchases under the asset purchase programme (APP) will continue at a monthly pace of €20 billion, together with the purchases under the additional €120 billion temporary envelope until the end of the year;
- Since the end of March, purchases have been conducted under the Governing Council's new pandemic emergency purchase programme (PEPP), which has an overall envelope of €750 billion;
- Fully prepared to increase the size of the PEPP and adjust its composition, by as much as necessary and for as long as needed;
- Will conduct net asset purchases under the PEPP until it judges that the coronavirus crisis phase is over, but in any case until the end of this year;
- Expects the key ECB interest rates to remain at their present or lower levels until it has seen the inflation outlook robustly converge to a level sufficiently close to, but below 2%.
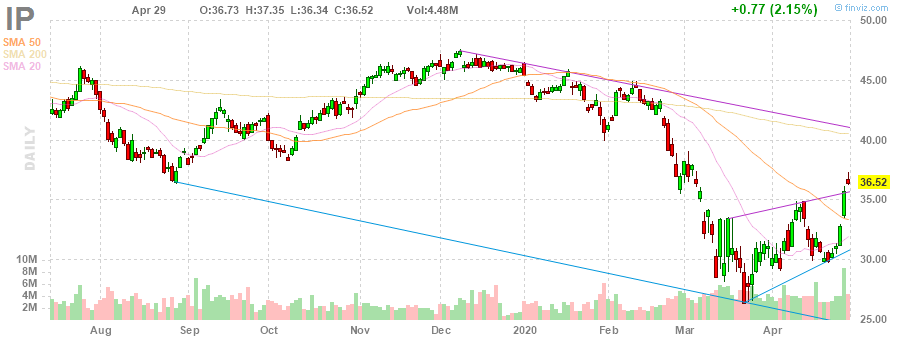
Int'l Paper (IP) reported Q1 FY 2020 earnings of $0.57 per share (versus $1.11 per share in Q1 FY 2019), beating analysts' consensus estimate of $0.42 per share.
The company's quarterly revenues amounted to $5.352 bln (-5.2% y/y), roughly in line with analysts' consensus estimate of $5.315 bln.
IP closed Wednesday's trading session at $36.52 (+2.15%).
FXStreet reports that analysts at Nordea note the Eurozone economy shrank 3.8% q/q in Q1, as containment measures shut down large parts of activity in the region in mid-March. Most of the corona effect will come in Q2.
“Eurozone GDP declined by 3.8% q/q and 3.3% y/y in the first quarter of 2020. GDP declined 5-6% both in Spain and in France.”
“The decline shows only a small part of the chaos caused by the coronavirus because in many countries, the corona crisis hit only in the middle of March and most of the first quarter can still be qualified as a pre-crisis period. Thus, we expect to see a much more dramatic decline in the second quarter.”
“Eurozone unemployment for March rose marginally to 7.4% from 7.3% in February, mainly thanks to a jump in Spain. The official unemployment numbers may be misleading when it comes to the labour market developments during the corona crisis.”
“Headline inflation in the Euro area slumped to 0.4% y/y in April according to the flash estimate. Core inflation was 0.9% y/y, just slightly down from 1.0% in March.”
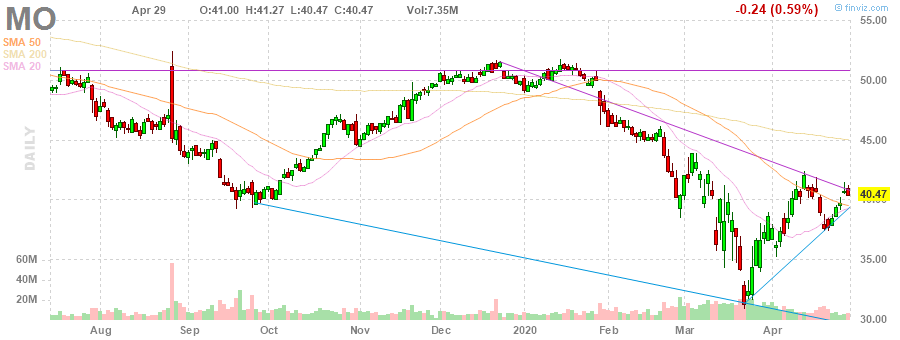
Altria (MO) reported Q1 FY 2020 earnings of $1.09 per share (versus $0.90 per share in Q1 FY 2019), beating analysts' consensus estimate of $0.99 per share.
The company's quarterly revenues amounted to $4.328 bln (+16.0% y/y), missing analysts' consensus estimate of $4.514 bln.
Altria withdrew its FY 2020 guidance due to the uncertainties related to the impact of the COVID-19 pandemic and economic recovery scenarios.
MO rose to $41.54 (+2.64%) in pre-market trading.
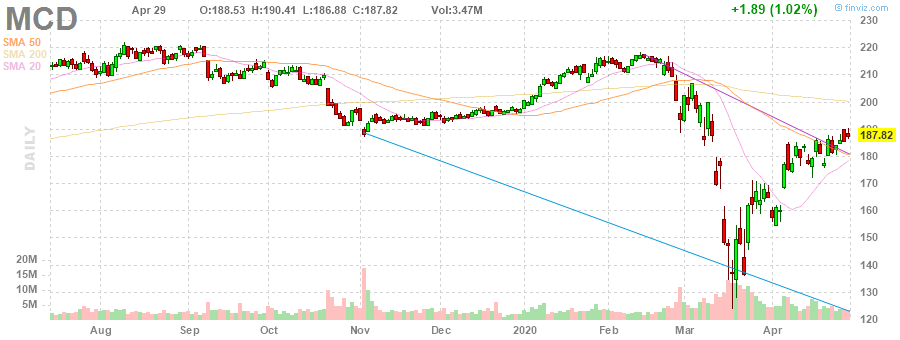
McDonald's (MCD) reported Q1 FY 2020 earnings of $1.47 per share (versus $1.78 per share in Q1 FY 2019), missing analysts' consensus estimate of $1.55 per share.
The company's quarterly revenues amounted to $4.714 bln (-6.2% y/y), beating analysts' consensus estimate of $4.662 bln.
MCD fell to $187.00 (-0.44%) in pre-market trading.
FXStreet notes that the Gold rally is losing momentum, but strategists at Credit Suisse continue to look for eventual new record highs.
“Gold is struggling to hold its move above its ‘measured base objective’ at $1700/05 and upside momentum is waning near-term and the threat of a consolidation phase is growing.”
“Support at $1660 needs to hold to see this averted to keep the immediate risk higher still with resistance at $1796/1803 next.”
“Below $1660 would signal a more protracted consolidation phase, with support seen initially at $1638.”
“Big picture, we continue to look for new highs above $1921.”
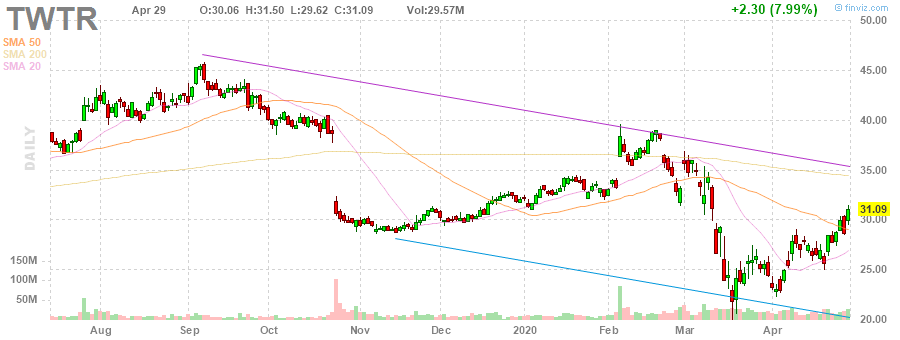
Twitter (TWTR) reported Q1 FY 2020 loss of $0.01 per share (versus earnings of $0.37 per share in Q1 FY 2019), worse than analysts' consensus estimate of earnings of $0.11 per share.
The company's quarterly revenues amounted to $0.808 bln (+2.6% y/y), beating analysts' consensus estimate of $0.773 bln.
TWTR rose to $34.13 (+9.78%) in pre-market trading.
FXStreet reports that according to Westpac’s economists, the UK appears to have passed its peak COVID-19 cases, but the lockdown is to remain in place until mid-May. With little data of note, GBP/USD range may edge up to 1.23-1.28.
“UK PM Johnson has pushed back on prospects for any relaxing of social distancing before mid-May and so the pressures on the economy are set to persist.
“UK’s lockdown has been less stringent than the likes of Italy but the case tally and death toll, though seen as flawed, are similar, suggesting that the peak is in place and cases should fall over the next week.”
“The peak may allow GBP/USD to lift into a slightly firmer 1.23-1.28 range again into the BoE updates.”
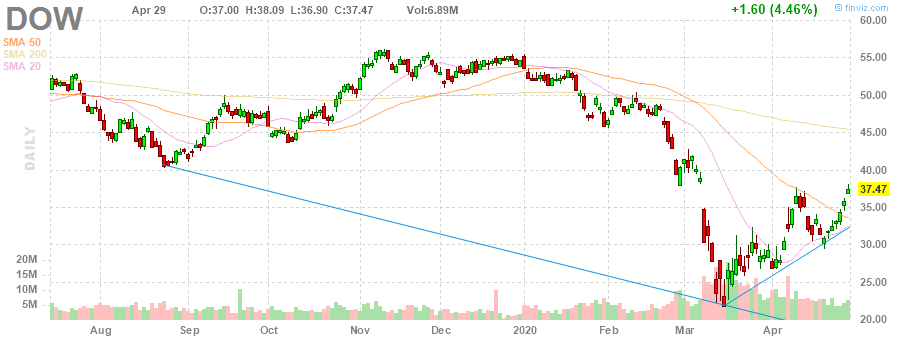
Dow (DOW) reported Q1 FY 2020 earnings of $0.59 per share, beating analysts' consensus estimate of $0.58 per share.
The company's quarterly revenues amounted to $9.770 bln (%-11.3 y/y), roughly in line with analysts' consensus estimate of $9.687 bln.
DOW closed Wednesday's trading session at $37.47 (+4.46%).
FXStreet reports that economists at Rabobank note that downtrend in EUR/JPY reasserted itself in April after a choppy period from mid-February through to the end of March.
“The USD may have stolen the crown as the safe-haven currency of choice in this crisis. However, the JPY has still outperformed the dollar in the year to date and remains particularly sensitive to risk events in Asia, such as rumours regarding the leadership in North Korea or tensions in the South China Sea.”
“We continue to see scope for EUR/JPY to edge lower towards 113.4 on a 3-month view, although the EUR/JPY 115.5 area will likely offer support.”
Tesla (TSLA) reported Q1 FY 2020 earnings of $1.24 per share (versus -$2.90 per share in Q1 FY 2019), better than analysts' consensus estimate of -$0.21 per share.
The company's quarterly revenues amounted to $5.985 bln (+31.8% y/y), beating analysts' consensus estimate of $5.853 bln.
The company also noted that its near-term guidance of net income and free cash flow would likely be inaccurate due to the wide range of potential outcomes. It promised to again revisit its FY 2020 guidance in Q2 update.
TSLA rose to $869.25 (+8.59%) in pre-market trading.

FXStreet reports that according to analysts at Credit Suisse, the market is expected to see further strength in the near-term, with 0.6687/6706 then expected to cap.
“We keep our short-term bias to the upside, whilst watching closely for any signs of a reversal as the daily RSI is now approaching overbought territory and risk assets are still expected to turn back lower.”
“Everything taken together though, resistance is next seen at 0.6613. Removal of here would turn the spotlight back to the 200-day average and 78.6% retracement at 0.6687/6706, where we would expect to see a cap if reached.”
“Support is initially seen at 0.6487/82, then 0.6434/27.”
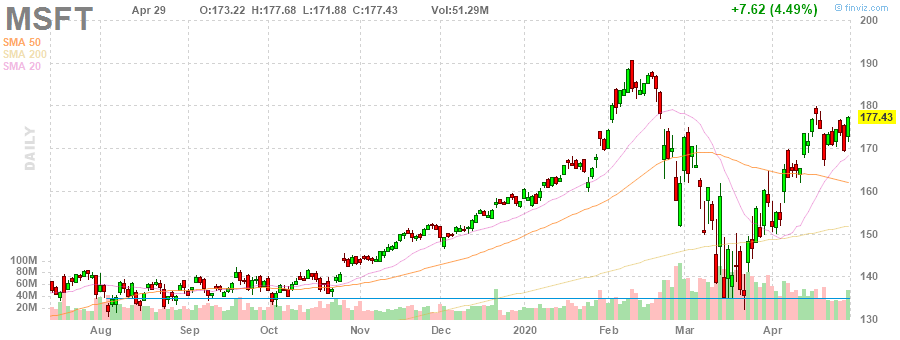
Microsoft (MSFT) reported Q1 FY 2020 earnings of $1.40 per share (versus $1.14 per share in Q1 FY 2019), beating analysts' consensus estimate of $1.25 per share.
The company's quarterly revenues amounted to $35.021 bln (+14.6% y/y), beating analysts' consensus estimate of $33.699 bln.
The company also issued in-line guidance for Q2 FY 2020, projecting revenue of $35.85-36.80 bln versus analysts' consensus estimate of $36.40 bln.
MSFT rose to $182.00 (+2.58%) in pre-market trading.
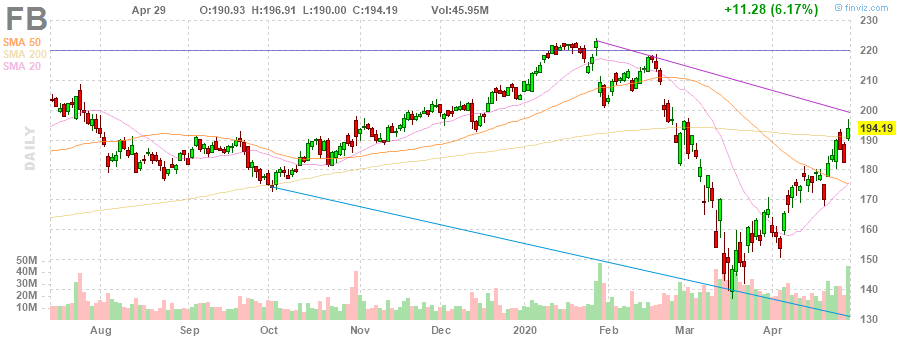
Facebook (FB) reported Q1 FY 2020 earnings of $1.71 per share (versus $1.89 per share in Q1 FY 2019), in line with analysts' consensus estimate.
The company's quarterly revenues amounted to $17.737 bln (+17.6% y/y), beating analysts' consensus estimate of $17.251 bln.
The company's DAUs were 1.73 billion on average for March 2020, a gain of 11% y/y, while its MAUs were 2.60 billion as of March 31, 2020, an advance of 10% y/y.
Facebook did not provide specific revenue guidance due to the uncertainties revolving around COVID-19 and its economic impact. However, the company noted that it had seen signs of stability during the first three weeks of April, where revenue had been approximately flat y/y, down from the 17% y/y growth in Q1 FY 2020.
FB rose to $212.60 (+9.48%) in pre-market trading.
FXStreet reports that strategists at UOB Group's Quarterly Global Outlook suggest the ounce troy of the precious metal could edge higher to the $1,800 mark in early 2021.
"Global central banks have all cut rates all the way down to the zero bound and re-introduced Quantitative Easing (QE), yet gold did not seem to respond well to this latest round of monetary policy easing. More importantly, gold would appear to have failed spectacularly as a risk aversion hedge."
"The main culprit to gold's puzzling behaviour is the on-going USD funding crunch that is holding financial markets hostage at the moment. As a result, gold was sold off alongside the equities melt-down as global investors rushed to raise cash."
"Going forward, once this USD funding crunch dissipates after 2Q, gold should respond well to the massive amount of global monetary policy easing. By then, there is significant default risk as the global economy slows down drastically. Hence, gold's safe haven role should return with a vengeance. Furthermore, recent global lockdowns have resulted in a shortage of physical gold as global transportation links get cut. As such, we would expect Gold to rebound significantly in the quarters ahead. We update our gold forecast to USD 1,650 in 2Q, 1,700 in 3Q, 1,750 in 4Q and 1,800 in 1Q21."
Eurostat said, in April 2020, a month marked by COVID-19 containment measures in all euro area countries, euro area annual inflation is expected to be 0.4%, down from 0.7% in March. Economists had expected a fall to 0.1%. Meanwhile, the core figures rose 0.9 % in the reported month when compared to 0.7% expectations and 1.0% previous.
Looking at the main components of euro area inflation, food, alcohol & tobacco is expected to have the highest annual rate in April (3.6%, compared with 2.4% in March), followed by services (1.2%, compared with 1.3% in March), non-energy industrial goods (0.3%, compared with 0.5% in March) and energy (-9.6%, compared with -4.5% in March).
According to the report from Eurostat, in March 2020, the month when COVID-19 containment measures began to be widely introduced by Member States, the euro area seasonally-adjusted unemployment rate was 7.4%, up from 7.3% in February 2020. Economists had expected an increase to 7.7%. The EU unemployment rate was 6.6% in March 2020, up from 6.5% in February 2020.
Eurostat estimates that 14.141 million men and women in the EU, of whom 12.156 million in the euro area, were unemployed in March 2020. Compared with February 2020, the number of persons unemployed increased by 241 000 in the EU and by 197 000 in the euro area.
In March 2020, 2.763 million young persons (under 25) were unemployed in the EU, of whom 2.275 million were in the euro area. In March 2020, the youth unemployment rate was 15.2% in the EU and 15.8% in the euro area, up from 14.8% and 15.4% respectively in the previous month. Compared with February 2020, youth unemployment increased by 59 000 in the EU and by 52 000 in the euro area.
According to a preliminary flash estimate published by Eurostat, seasonally adjusted GDP decreased by 3.8% in the euro area and by 3.5% in the EU during the first quarter of 2020, compared with the previous quarter. These were the sharpest declines observed since time series started in 1995. Economists had expected a 3.5% decrease in the euro area. In March 2020, the final month of the period covered, COVID-19 containment measures began to be widely introduced by Member States. In the fourth quarter of 2019, GDP had grown by 0.1% in the euro area and by 0.2% in the EU.
Compared with the same quarter of the previous year, seasonally adjusted GDP decreased by 3.3% in the euro area and by 2.7% in the EU in the first quarter of 2020, after +1.0% and +1.3% respectively in the previous quarter. These were the sharpest declines since the third quarter of 2009 (-4.5% for euro area and -4.4% for EU).
FXStreet reports that USD/CNY has stabilised and economists at Danske Bank look for a 7.0-7.20 range over the next six months.
"We look for economic growth to be 1.0% in 2020 (previously 5.2%) but to rebound to 9.0% in 2021 (previous 6.3%). We expect the government to add more economic stimulus but to do so in a measured way."
"As we look for EUR/USD to be broadly stable over the next 12 months, with a slight strengthening bias, we also expect USD/CNY to remain range bound between 7.0 and 7.2. This implies that we look for EUR/CNY to stay in a narrow range of 7.6-7.9."
eFXdata reports that SEB Research discusses its expectations for ECB policy meeting.
"Under the already announced programmes, the ECB's net asset purchases total EUR 1110bn in 2020. Assuming a linear distribution, this equals around EUR 112bn / month between mid -March and end -December. We expect the ECB to repeat that purchases can be increased if needed but regard it as unlikely that the bank would specify an explicit increase already now," SEB notes.
"The ECB needs to address the rise in Euribor rates, but the solution is more complicated. The easiest way to support banks' unsecured funding would be to increase government bond purchases in the very short maturities and expand the corporate bond purchase program to include banks.
Nothing stops the ECB from buying the 1 -2y sector already now, but buying bank credit is unlikely. Therefore, the ECB just needs to keep adding liquidity and hope that investors increase the demand for bank credit enough," SEB adds.
FXStreet reports that China's April manufacturing PMI remained in expansion, but is edging dangerously back into contraction territory, per TD Securities.
"China's official April manufacturing PMI was very close to expectations at 50.8 (TD 50.0, mkt 51.0). The breakdown revealed that output and new orders fell from the previous month, but remain in expansion territory at 53.7 and 50.2, respectively. The resilience in output in particular is impressive, but looks unsustainable."
"Demand side weakness is just beginning. The drop in new export orders to a record low of 33.5 from 46.4 in March, reflects the dramatic collapse in overseas demand, a factor that will weigh on recovery."
"We continue to think that China has little interest in utilising the CNY as a tool to boost trade, especially as a weaker currency will do little to boost exports at a time when external demand is collapsing. Nonetheless, if our view of a firmer USD into the next few months proves correct, expect USD/CNY to move higher to our forecast of 7.20 by end Q3 20."
FXStreet reports that the longest economic expansion in U.S. history has officially come to an end, Krishen Rangasamy from the National Bank of Canada informs.
"The world's largest economy saw a real GDP contract 4.8% annualized in Q1. That's the first quarterly contraction in six years and the largest since 2008 Q4 when the U.S. was mired in recession."
"With social distancing measures (if not outright lockdowns) expected to extend into May, the outlook for Q2 is even worse, a GDP contraction of more than 30% annualized is in the cards for that quarter."
"We're still expecting a rebound in the second half of the year as firms replenish inventories and consumers make use of increased savings. But the amplitude of the rebound will largely depend on the extent of capacity destruction in the first half."
KOF Economic Research Agency said that the KOF Economic Barometer declines in April more than ever before in its history. Within a very short period of time, it thus drops to a level (63.5 points) comparable to the 2009 financial crisis. Only in the first three months of 2009 the barometer values were still slightly lower than at present.
In April, the KOF Economic Barometer declines by 28.2 points. This monthly decline is more than twice as large as previous very strong declines. In comparison: in February 2015, after the minimum franc exchange rate was lifted, the barometer fell by 10.0 points. In November 2008, after the collapse of Lehman Brothers, it was 7.1.
After the Economic Barometer already dropped by 10.1 points in March, it declined to the 63.5 mark in April. Only during the financial crisis was the barometer slightly lower in the first three months of 2009. Currently, nearly all indicator groups are pushing the barometer sharply downward. The decline is led by the indicators for the manufacturing industry and other services. However, the indicators for the accommodation and food service activities, foreign demand, construction, consumption and for financial and insurance service providers are also heavily in the red.
| Time | Country | Event | Period | Previous value | Forecast | Actual |
|---|---|---|---|---|---|---|
| 01:00 | China | Non-Manufacturing PMI | April | 52.3 | 53.2 | |
| 01:00 | New Zealand | ANZ Business Confidence | April | -63.5 | -66.6 | |
| 01:00 | China | Manufacturing PMI | April | 52 | 51 | 50.8 |
| 01:30 | Australia | Export Price Index, q/q | Quarter I | -5.2% | 2.7% | |
| 01:30 | Australia | Private Sector Credit, y/y | March | 2.8% | 3.6% | |
| 01:30 | Australia | Private Sector Credit, m/m | March | 0.4% | 1.1% | |
| 01:30 | Australia | Import Price Index, q/q | Quarter I | 0.7% | -1% | |
| 05:00 | Japan | Housing Starts, y/y | March | -12.3% | -16% | -7.6% |
| 05:00 | Japan | Consumer Confidence | April | 30.9 | 21.6 | |
| 05:30 | France | GDP, q/q | Quarter I | -0.1% | -3.5% | -5.8% |
During today's Asian trading, the US dollar rose slightly against the euro, and fell against the yen after the results of the Federal reserve meeting (Fed) and on the eve of the European Central Bank (ECB) decision on the rate.
The ICE Dollar index, which shows the value of the us dollar against six major world currencies, fell by 0.03% compared to the previous day.
Yesterday, the Fed kept the interest rate in the range of 0% to 0.25% per annum. The FOMC decision coincided with the forecasts of economists and market participants. It was adopted by all ten members of the Committee unanimously.
Now traders are waiting for the results of the ECB meeting, which will be announced later on Thursday.
National Institute of Statistics and Economic Studies (INSEE) said, in March 2020, household consumption expenditure on goods dropped by 17.9% in volume. It is the strongest decrease ever recorded in a month since the beginning of the time series in 1980. Economists had expected a 5.5% decrease.
Manufactured good consumption dropped sharply (-42.3% after -0.6%) and energy expenditure decreased markedly (-11.4% after -0.9%). Only food consumption increased (+7.8% after -0.1%). The fall in household consumption in March 2020 was essentially due to the implementation of lockdown measures from mid-March onwards.
Over the whole first quarter of 2020, household expenditure on goods fell markedly (-7.3%).
According to the report from Federal Statistical Office (FSO), turnover adjusted for sales days and holidays fell in the retail sector by 6.2% in nominal terms in March 2020 compared with the previous year.
Seasonally adjusted, nominal turnover fell by 6.0% compared with the previous month. Following the COVID-19 pandemic, turnover slumped markedly in some sectors.
Real turnover adjusted for sales days and holidays fell in the retail sector by 5.6% in March 2020 compared with the previous year. Real growth takes inflation into consideration. Compared with the previous month, real, seasonally adjusted retail trade turnover registered a decline of 6.2%.
Adjusted for sales days and holidays, the retail sector excluding service stations showed a 4.5% decrease in nominal turnover in March 2020 compared with March 2019 (in real terms -4.0%). This resulted in reductions in turnover for service stations of 26% (in real terms -21.6%).
Retail sales of food, drinks and tobacco registered an increase in both nominal and real turnover of 8.4%, whereas the non-food sector registered a nominal minus of 15.8% (in real terms -15.0%).
Due to the business closures in the Corona crisis, sales in individual retail sectors fell sharply in March 2020. At the same time, the strong demand for daily necessities led to increased sales in other areas, such as supermarkets and pharmacies.
According to provisional results of the Federal Statistical Office (Destatis), retail sales in Germany decreased by 2.8% in real terms (price-adjusted) and 1.5% in nominal terms (not price-adjusted) in March 2020 compared with March 2019.
After calendar and seasonal adjustment, sales in March 2020 were 5.6% lower in real terms and 5.7% lower in nominal terms compared to February 2020. This is the largest decline in sales compared to the previous month since January 2007.
-
CNBC reports that the International Energy Agency (IEA) said Thursday that it expects global energy demand to plunge this year amid the Covid-19 pandemic, in what the Paris-based agency called the biggest shock since World War II.
-
China reported four new cases and no deaths as of April 29.
-
More than 3.1 million people have been infected by the coronavirus around the world and over 227,000 people have died from the respiratory disease Covid-19.
-
Australia said a coronavirus outbreak in the state of Tasmania likely originated from the Ruby Princess cruise ship, according to a government report published Thursday.
-
Global cases: More than 3.1 million
-
Global deaths: Over 227,000
-
Most cases reported: United States (over 1 million), Spain (236,899), Italy (203,591), France (166,541), and United Kingdom (166,441).
According to the report from Insee, in Q1 2020, GDP in volume terms fell sharply: -5.8%, the biggest drop in the series' record, since 1949. In particular, it is bigger than the ones recorded in Q1 2009 (-1.6%) or in Q2 1968 (-5.3%). GDP's negative evolution in Q1 2020 is primarily linked to the shut-down of "non-essential" activities in the context of the implementation of the lockdown since mid-March.
Household consumption expenditures dropped (-6.1%), as did total gross fixed capital formation in a more pronounced manner (GFCF: -11.8%). Overall, final domestic demand excluding inventory changes fell sharply: it contributed to -6.6 points to GDP growth.
Exports also fell this quarter (-6.5%) along with imports (-5.9%), in a less pronounced manner. All in all, the foreign trade balance contributed negatively to GDP growth: -0.2 points, after -0.1 points the previous quarter. Conversely, changes in inventories contributed positively to GDP growth (+0.9 points).
EUR/USD
Resistance levels (open interest**, contracts)
$1.0939 (993)
$1.0916 (570)
$1.0901 (624)
Price at time of writing this review: $1.0865
Support levels (open interest**, contracts):
$1.0841 (1778)
$1.0815 (1384)
$1.0779 (1843)
Comments:
- Overall open interest on the CALL options and PUT options with the expiration date May, 8 is 68585 contracts (according to data from April, 29) with the maximum number of contracts with strike price $1,1200 (2877);
GBP/USD
Resistance levels (open interest**, contracts)
$1.2581 (350)
$1.2549 (698)
$1.2524 (518)
Price at time of writing this review: $1.2480
Support levels (open interest**, contracts):
$1.2452 (1073)
$1.2435 (261)
$1.2405 (344)
Comments:
- Overall open interest on the CALL options with the expiration date May, 8 is 16479 contracts, with the maximum number of contracts with strike price $1,2700 (1714);
- Overall open interest on the PUT options with the expiration date May, 8 is 18281 contracts, with the maximum number of contracts with strike price $1,2850 (1073);
- The ratio of PUT/CALL was 1.11 versus 1.09 from the previous trading day according to data from April, 29
* - The Chicago Mercantile Exchange bulletin (CME) is used for the calculation.
** - Open interest takes into account the total number of option contracts that are open at the moment.
| Raw materials | Closed | Change, % |
|---|---|---|
| Brent | 21.77 | 7.4 |
| Silver | 15.28 | 1.06 |
| Gold | 1712.074 | 0.28 |
| Palladium | 1945.87 | 2.02 |
| Index | Change, points | Closed | Change, % |
|---|---|---|---|
| Hang Seng | 67.63 | 24643.59 | 0.28 |
| KOSPI | 13.47 | 1947.56 | 0.7 |
| ASX 200 | 80.3 | 5393.4 | 1.51 |
| FTSE 100 | 156.75 | 6115.25 | 2.63 |
| DAX | 312.11 | 11107.74 | 2.89 |
| CAC 40 | 101.32 | 4671.11 | 2.22 |
| Dow Jones | 532.31 | 24633.86 | 2.21 |
| S&P 500 | 76.12 | 2939.51 | 2.66 |
| NASDAQ Composite | 306.98 | 8914.71 | 3.57 |
| Time | Country | Event | Period | Previous value | Forecast |
|---|---|---|---|---|---|
| 01:00 | China | Non-Manufacturing PMI | April | 52.3 | |
| 01:00 | New Zealand | ANZ Business Confidence | April | -63.5 | |
| 01:00 | China | Manufacturing PMI | April | 52 | 51 |
| 01:30 | Australia | Private Sector Credit, y/y | March | 2.8% | |
| 01:30 | Australia | Private Sector Credit, m/m | March | 0.4% | |
| 01:30 | Australia | Export Price Index, q/q | Quarter I | -5.2% | |
| 01:30 | Australia | Import Price Index, q/q | Quarter I | 0.7% | |
| 05:00 | Japan | Housing Starts, y/y | March | -12.3% | -16% |
| 05:00 | Japan | Consumer Confidence | April | 30.9 | |
| 05:30 | France | GDP, q/q | Quarter I | -0.1% | -3.5% |
| 06:00 | Germany | Retail sales, real unadjusted, y/y | March | 6.4% | |
| 06:00 | Germany | Retail sales, real adjusted | March | 1.2% | -7.3% |
| 06:30 | Switzerland | Retail Sales (MoM) | March | 0.4% | |
| 06:30 | Switzerland | Retail Sales Y/Y | March | 0.3% | |
| 06:45 | France | CPI, m/m | April | 0.1% | |
| 06:45 | France | Consumer spending | March | -0.1% | -5.5% |
| 06:45 | France | CPI, y/y | April | 0.7% | |
| 07:00 | Switzerland | KOF Leading Indicator | April | 92.9 | 63.5 |
| 07:55 | Germany | Unemployment Change | April | 1 | 76 |
| 07:55 | Germany | Unemployment Rate s.a. | April | 5% | 5.2% |
| 09:00 | Eurozone | Harmonized CPI ex EFAT, Y/Y | April | 1% | 0.7% |
| 09:00 | Eurozone | Harmonized CPI, Y/Y | April | 0.7% | 0.1% |
| 09:00 | Eurozone | Unemployment Rate | March | 7.3% | 7.7% |
| 09:00 | Eurozone | GDP (YoY) | Quarter I | 1% | -3.1% |
| 09:00 | Eurozone | GDP (QoQ) | Quarter I | 0.1% | -3.5% |
| 11:45 | Eurozone | ECB Interest Rate Decision | 0% | 0% | |
| 12:30 | Canada | Industrial Product Price Index, y/y | March | -0.3% | |
| 12:30 | Canada | Industrial Product Price Index, m/m | March | -0.5% | -1.7% |
| 12:30 | U.S. | Continuing Jobless Claims | April | 15976 | 19476 |
| 12:30 | U.S. | Personal spending | March | 0.2% | -5% |
| 12:30 | U.S. | Employment Cost Index | Quarter I | 0.7% | 0.6% |
| 12:30 | Canada | GDP (m/m) | February | 0.1% | 0.1% |
| 12:30 | U.S. | Initial Jobless Claims | April | 4427 | 3500 |
| 12:30 | U.S. | PCE price index ex food, energy, Y/Y | March | 1.8% | 1.6% |
| 12:30 | U.S. | PCE price index ex food, energy, m/m | March | 0.2% | -0.1% |
| 12:30 | U.S. | Personal Income, m/m | March | 0.6% | -1.5% |
| 12:30 | Eurozone | ECB Press Conference | |||
| 13:45 | U.S. | Chicago Purchasing Managers' Index | April | 47.8 | 38 |
| 23:30 | Japan | Tokyo CPI ex Fresh Food, y/y | April | 0.4% | 0.1% |
| 23:30 | Japan | Tokyo Consumer Price Index, y/y | April | 0.4% |
| Pare | Closed | Change, % |
|---|---|---|
| AUDUSD | 0.65558 | 1.04 |
| EURJPY | 115.922 | 0.25 |
| EURUSD | 1.08729 | 0.48 |
| GBPJPY | 132.893 | 0.12 |
| GBPUSD | 1.24669 | 0.36 |
| NZDUSD | 0.61334 | 1.3 |
| USDCAD | 1.38777 | -0.87 |
| USDCHF | 0.97375 | -0.07 |
| USDJPY | 106.607 | -0.22 |


© 2000-2026. All rights reserved.
This site is managed by Teletrade D.J. LLC 2351 LLC 2022 (Euro House, Richmond Hill Road, Kingstown, VC0100, St. Vincent and the Grenadines).
The information on this website is for informational purposes only and does not constitute any investment advice.
The company does not serve or provide services to customers who are residents of the US, Canada, Iran, The Democratic People's Republic of Korea, Yemen and FATF blacklisted countries.
Making transactions on financial markets with marginal financial instruments opens up wide possibilities and allows investors who are willing to take risks to earn high profits, carrying a potentially high risk of losses at the same time. Therefore you should responsibly approach the issue of choosing the appropriate investment strategy, taking the available resources into account, before starting trading.
Use of the information: full or partial use of materials from this website must always be referenced to TeleTrade as the source of information. Use of the materials on the Internet must be accompanied by a hyperlink to teletrade.org. Automatic import of materials and information from this website is prohibited.
Please contact our PR department if you have any questions or need assistance at pr@teletrade.global.
transfers