- Analytics
- News and Tools
- Market News
CFD Markets News and Forecasts — 28-04-2020
| Time | Country | Event | Period | Previous value | Forecast |
|---|---|---|---|---|---|
| 01:30 | Australia | Trimmed Mean CPI q/q | Quarter I | 0.4% | 0.4% |
| 01:30 | Australia | CPI, q/q | Quarter I | 0.7% | 0.2% |
| 01:30 | Australia | Trimmed Mean CPI y/y | Quarter I | 1.6% | 1.6% |
| 01:30 | Australia | CPI, y/y | Quarter I | 1.8% | 2% |
| 08:00 | Eurozone | Private Loans, Y/Y | March | 3.8% | |
| 08:00 | Eurozone | M3 money supply, adjusted y/y | March | 5.5% | 5.5% |
| 09:00 | Eurozone | Industrial confidence | April | -10.8 | -25.1 |
| 09:00 | Eurozone | Consumer Confidence | April | -11.6 | -22.7 |
| 09:00 | Eurozone | Economic sentiment index | April | 94.5 | 74.4 |
| 09:00 | Eurozone | Business climate indicator | April | -0.28 | |
| 12:00 | Germany | CPI, m/m | April | 0.1% | 0% |
| 12:00 | Germany | CPI, y/y | April | 1.4% | 0.5% |
| 12:30 | U.S. | PCE price index, q/q | Quarter I | 1.4% | |
| 12:30 | U.S. | GDP, q/q | Quarter I | 2.1% | -4% |
| 14:00 | U.S. | Pending Home Sales (MoM) | March | 2.4% | |
| 14:30 | U.S. | Crude Oil Inventories | April | 15.022 | |
| 18:00 | U.S. | Fed Interest Rate Decision | 0.25% | 0.25% | |
| 18:30 | U.S. | Federal Reserve Press Conference | |||
| 23:50 | Japan | Retail sales, y/y | March | 1.7% | -4.7% |
| 23:50 | Japan | Industrial Production (MoM) | March | -0.3% | -5.2% |
| 23:50 | Japan | Industrial Production (YoY) | March | 5.7% |
FXStreet reports that Danske Bank's view of stabilization and mild strength across CEE in RUB, PLN, CZK and marginally HUF appears to be playing out.
“EUR/PLN to see downward pressure as virus concerns in the global economy ease.”
“EUR/HUF continues to drift higher and HUF strength is likely to prove short-lived.”
“EUR/CZK has stabilised but near term likely sideways to slightly lower.”
“USD/RUB has likely overshot its fair value and we continue to be optimistic on RUB, 75.00 in 12M.”
FXStreet notes that the covid shock has translated into a broad convergence, with all metals in the industrial complex trading in line with the commodity demand indicator of TD Securities.
“All metals in the complex exhibit a strong downtrend more than 50% of all technical indicators (both mean-revering and momentum) are short for every metal in the complex.”
“Some granular divergences can be observed, with copper, aluminium, and zinc exhibiting a weakening downtrend while nickel and lead's downtrend continues to strengthen.”
“We think it is more likely that the recent strength observed in prices has been driven by profit-taking, synonymous with a bear market rally, and does not imply a change in trend for the complex. Nonetheless, the aggregate breadth of signals remains firmly tilted towards the shorts across the complex.”
The Conference Board announced on Tuesday its U.S. consumer confidence gauge fell 31.9 points to 86.9 in April from a 118.8 in March.
Economists had expected consumer confidence to come in at 88.0.
March's consumer confidence reading was revised up from originally estimated 120.0.
The survey, however, showed that the expectations index increased from 86.8 last month to 93.8 this month. Meanwhile, the present situation index plunged from 166.7 in March to 76.4.
"Consumer confidence weakened significantly in April, driven by a severe deterioration in current conditions," noted Lynn Franco, Senior Director of Economic Indicators at The Conference Board. "The 90-point drop in the Present Situation Index, the largest on record, reflects the sharp contraction in economic activity and surge in unemployment claims brought about by the COVID-19 crisis. Consumers' short-term expectations for the economy and labor market improved, likely prompted by the possibility that stay-at-home restrictions will loosen soon, along with a re-opening of the economy. However, consumers were less optimistic about their financial prospects and this could have repercussions for spending as the recovery takes hold. The uncertainty of the economic effects of COVID-19 will likely cause expectations to fluctuate in the months ahead."

- Says demand is expected to moe back as states reopen
- Administration does not see additional aid for state and local governments unless there is absolute bipartisan support
S&P reported on Tuesday its Case-Shiller Home Price Index, which tracks home prices in 20 U.S. metropolitan areas, surged 3.5 percent y-o-y in February, following an unrevised 3.1 percent y-o-y increase in January. This was the biggest annual advance in house prices since December of 2018.
Economists had expected an advance of 3.3 percent y-o-y.
Phoenix (+7.5 percent y-o-y), Seattle (+6.0 percent y-o-y), Tampa (+5.2 percent y-o-y) and Charlotte (+5.2 percent y-o-y) recorded the highest y-o-y advances in February. Overall, 17 of the 20 cities reported greater price gains in the year ending February versus the year ending January.
Meanwhile, the S&P/Case-Shiller U.S. National Home Price Index, which measures all nine U.S. census divisions, climbed 4.2 percent y-o-y in February, up from 3.9 percent y-o-y in the previous month.
"The stable growth pattern established in the last half of 2019 continued into February," said Craig J. Lazzara, Managing Director and Global Head of Index Investment Strategy at S&P Dow Jones Indices. However, he noted that today's report covers real estate transactions closed during the month of February, and shows no signs of any adverse effect from the governmental suppression of economic activity in response to the COVID-19 pandemic. "As much of the U.S. economy was shuttered in March, next month's data may begin to reflect the impact of these policies on the housing market", he added.
U.S. stock-index futures rose on Tuesday, as investors continued to be optimistic about the reopening efforts in some U.S. states and assessed a slew of big earnings reports.
Global Stocks:
| Index/commodity | Last | Today's Change, points | Today's Change, % |
| Nikkei | 19,771.19 | -12.03 | -0.06% |
| Hang Seng | 24,575.96 | +295.82 | +1.22% |
| Shanghai | 2,810.02 | -5.47 | -0.19% |
| S&P/ASX | 5,313.10 | -8.30 | -0.16% |
| FTSE | 5,957.07 | +110.28 | +1.89% |
| CAC | 4,590.93 | +85.67 | +1.90% |
| DAX | 10,850.62 | +190.63 | +1.79% |
| Crude oil | $11.69 | | -8.53% |
| Gold | $1,729.30 | | +0.32% |
(company / ticker / price / change ($/%) / volume)
| 3M Co | MMM | 160.9 | 7.25(4.72%) | 106159 |
| ALCOA INC. | AA | 7.54 | 0.17(2.31%) | 74532 |
| ALTRIA GROUP INC. | MO | 40.72 | 0.97(2.44%) | 14696 |
| Amazon.com Inc., NASDAQ | AMZN | 2,383.00 | 7.00(0.29%) | 51191 |
| American Express Co | AXP | 86.51 | 1.45(1.70%) | 26333 |
| AMERICAN INTERNATIONAL GROUP | AIG | 25.09 | 0.91(3.76%) | 9980 |
| Apple Inc. | AAPL | 285.25 | 2.08(0.73%) | 166892 |
| AT&T Inc | T | 30.99 | 0.45(1.47%) | 132338 |
| Boeing Co | BA | 130.83 | 2.15(1.67%) | 306734 |
| Caterpillar Inc | CAT | 115.26 | 0.06(0.05%) | 154541 |
| Chevron Corp | CVX | 90.7 | 0.99(1.10%) | 86281 |
| Cisco Systems Inc | CSCO | 43.63 | 0.57(1.32%) | 33732 |
| Citigroup Inc., NYSE | C | 48.65 | 2.09(4.49%) | 159923 |
| E. I. du Pont de Nemours and Co | DD | 44.86 | 1.04(2.37%) | 67997 |
| Exxon Mobil Corp | XOM | 44.35 | 0.41(0.93%) | 128183 |
| Facebook, Inc. | FB | 189.56 | 2.06(1.10%) | 271624 |
| FedEx Corporation, NYSE | FDX | 126.98 | -0.31(-0.24%) | 7778 |
| Ford Motor Co. | F | 5.52 | 0.35(6.77%) | 1192259 |
| Freeport-McMoRan Copper & Gold Inc., NYSE | FCX | 9.1 | 0.25(2.82%) | 62684 |
| General Electric Co | GE | 6.56 | 0.13(2.02%) | 893149 |
| General Motors Company, NYSE | GM | 23.15 | 0.70(3.12%) | 31754 |
| Goldman Sachs | GS | 188.88 | 5.34(2.91%) | 12216 |
| Google Inc. | GOOG | 1,290.00 | 14.12(1.11%) | 9166 |
| Hewlett-Packard Co. | HPQ | 15.25 | 0.22(1.46%) | 8134 |
| Home Depot Inc | HD | 221.9 | 4.14(1.90%) | 10529 |
| HONEYWELL INTERNATIONAL INC. | HON | 141.4 | 1.52(1.09%) | 2833 |
| Intel Corp | INTC | 60.05 | 0.58(0.98%) | 53805 |
| International Business Machines Co... | IBM | 127.89 | 1.97(1.56%) | 13888 |
| Johnson & Johnson | JNJ | 153.5 | -0.79(-0.51%) | 87697 |
| JPMorgan Chase and Co | JPM | 97.7 | 3.08(3.26%) | 169384 |
| McDonald's Corp | MCD | 189.1 | 3.21(1.73%) | 9636 |
| Merck & Co Inc | MRK | 82 | -1.98(-2.36%) | 100432 |
| Microsoft Corp | MSFT | 175.45 | 1.40(0.80%) | 248337 |
| Nike | NKE | 90.48 | 1.11(1.24%) | 130023 |
| Pfizer Inc | PFE | 39.21 | 0.88(2.30%) | 264537 |
| Procter & Gamble Co | PG | 118.15 | 0.70(0.60%) | 7445 |
| Starbucks Corporation, NASDAQ | SBUX | 78.92 | 1.18(1.52%) | 54997 |
| Tesla Motors, Inc., NASDAQ | TSLA | 799.6 | 0.85(0.11%) | 329539 |
| The Coca-Cola Co | KO | 47.55 | 0.77(1.65%) | 36512 |
| Travelers Companies Inc | TRV | 103.91 | 1.02(0.99%) | 1020 |
| Twitter, Inc., NYSE | TWTR | 30.45 | 0.45(1.50%) | 202102 |
| UnitedHealth Group Inc | UNH | 296.5 | 2.52(0.86%) | 3176 |
| Verizon Communications Inc | VZ | 58.02 | 0.21(0.36%) | 25151 |
| Visa | V | 174.4 | 2.64(1.54%) | 45353 |
| Wal-Mart Stores Inc | WMT | 129.25 | 0.95(0.74%) | 28352 |
| Walt Disney Co | DIS | 108.25 | 2.19(2.06%) | 93068 |
| Yandex N.V., NASDAQ | YNDX | 38.3 | 1.34(3.63%) | 170740 |
Says it is highly unlikely that the government would buy stocks
The issue of lost state revenues will be debated by Congress
Treasury expects to get paid back on loans to airlines and national security-linked firms
We will do full audit of every loan over $2 million, faults borrowers that inaccurately certified that they needed them
Walt Disney (DIS) resumed with a Sector Perform at RBC Capital Mkts; target $110
Johnson & Johnson (JNJ) downgraded to Neutral from Buy at UBS; target lowered to $160
| Time | Country | Event | Period | Previous value | Forecast | Actual |
|---|---|---|---|---|---|---|
| 10:00 | United Kingdom | CBI retail sales volume balance | April | -3 | -40 | -55 |
| 12:30 | U.S. | Goods Trade Balance, $ bln. | March | -59.89 | -64.22 |
GBP rose against USD and CHF in the European session on Tuesday, as investors' risk appetite improved as several countries in Europe and some states in the U.S. are beginning easing restrictions imposed to fight the coronavirus. The pound, however, was little changed against other major currencies.
Investors are also awaiting the announcements of the outcomes of the policy meetings of the Federal Reserve (due on Wednesday) and European Central Bank (due on Thursday), at which the central bankers are expected to expand stimulus to help their coronavirus-hit economies.
Meanwhile, market participants ignored the latest CBI's survey of the UK's retailers, which showed a deeper-than-forecast contraction in retail sales volumes in April. According to the CBI, retail sales volume balance stood at -55 in the year to April, sharply down from -3 in March. That was the steepest fall in sales since December 2008. Economists had forecast the reading to decrease to -40. The survey also revealed the retailers expect a similar pace of decline in annual next month, - the weakest expectations in the survey history.
FXStreet reports that analysts at Credit Suisse note the S&P 500 has gapped higher, leaving the market pushing above the beginning of the ‘ideal’ recovery objective/resistance at 2879/83, although significantly on lower volume.
“A test of the 63-day average at 2904 is still seen likely, potentially the 61.8% retracement of the Q1 collapse at 2934, but our view remains unchanged to look for a peak in this 2883/2934 zone.”
“Should strength instead above 2934 this would open the door to a move to 2986, potentially a test of the pivotal 200-day average, now at 3007.”
“Support moves to 2853 initially, then the lower of yesterday’s price gap at 2843/37, which needs to hold to maintain an immediate upside bias.”
“VIX is expected to fall back to support at 27.27/22.60, the ‘neckline’ to the 2019/2020 large base, 78.6% retracement and 200-day average. We look for a fresh floor here.”
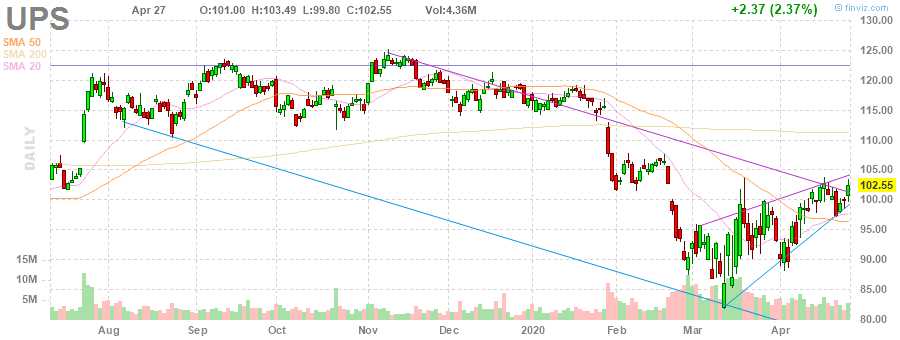
UPS (UPS) reported Q1 FY 2020 earnings of $1.15 per share (versus $1.39 per share in Q1 FY 2019), missing analysts' consensus estimate of $1.23 per share.
The company's quarterly revenues amounted to $18.035 bln (+5.1% y/y), beating analysts' consensus estimate of $17.174 bln.
The company withdrew its FY 2020 guidance.
UPS fell to $ 98.98 (-3.48%) in pre-market trading.
NFXStreet reports that according to Karen Jones from Commerzbank, Brent Crude Oil slips back towards minor support at 16.65 but is expected to hold above 15.98 this week at least.
“ICE Brent Crude Oil slid back to the October 2001 low at 16.65 below which it found support at 15.98 before rising back the April 23 high at 23.22. From there it is coming off again but for this week at least we expect Brent Crude Oil to remain above its 15.98 multiyear low and range trade between it and the 25.00 region.”
“Resistance below the 25.00 level can be spotted between the March 18 and 23 lows at 24.52/68 while support is seen at the October 2001 low at 16.65.”
“Below the next lower 15.98 low lies the July 1995 low at 15.41 and also the January 1994 low at 12.90.”
Pfizer (PFE) reported Q1 FY 2020 earnings of $0.80 per share (versus $0.85 per share in Q1 FY 2019), beating analysts' consensus estimate of $0.71 per share.
The company's quarterly revenues amounted to $12.028 bln (-8.3% y/y), beating analysts' consensus estimate of $11.381 bln.
The company also reaffirmed guidance for FY 2020, projecting EPS of $2.82-2.92 versus analysts' consensus estimate of $2.70 and revenues of $48.5-50.5 bln versus analysts' consensus estimate of $47.01 bln.
PFE rose to $39.00 (+1.75%) in pre-market trading.

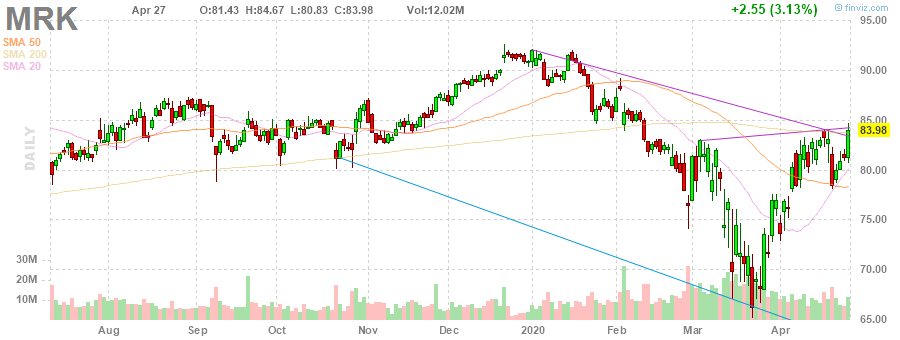
Merck (MRK) reported Q1 FY 2020 earnings of $1.50 per share (versus $1.22 per share in Q1 FY 2019), beating analysts' consensus estimate of $1.34 per share.
The company's quarterly revenues amounted to $12.057 bln (+11.5% y/y), beating analysts' consensus estimate of $11.458 bln.
The company also lowered guidance for FY 2020, projecting EPS of $5.17-5.37 (down from $5.62-5.77 previously) versus analysts' consensus estimate of $5.54 and revenues of $46.1-48.1 bln (down from $48.8-50.3 bln previously) versus analysts' consensus estimate of $48.65 bln.
MRK fell to $82.51 (-1.75%) in pre-market trading.
FXStreet reports that economist at UOB Group Lee Sue Ann gives her opinion on the upcoming ECB event (Thursday).
“We think the ECB has stepped up meaningfully so far. The onus is now on various European governments to step up fiscal efforts”.
“That said, the ECB could also get even more creative and expand the range of assets it purchases, by including, for example, equities, wholesale loans and banks’ bonds, if the need arises. However, we do not see a move in rates for some time.”
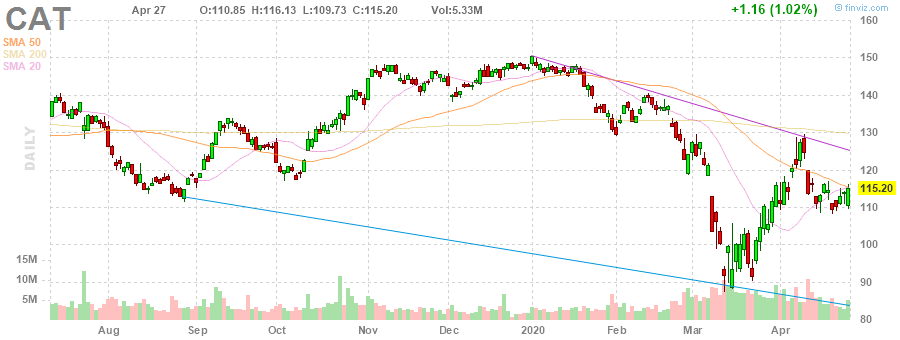
Caterpillar (CAT) reported Q1 FY 2020 earnings of $1.60 per share (versus $2.94 per share in Q1 FY 2019), missing analysts' consensus estimate of $1.67 per share.
The company's quarterly revenues amounted to $10.635 bln (-21.0% y/y), missing analysts' consensus estimate of $10.980 bln.
CAT rose to $117.00 (+1.56%) in pre-market trading.
- We need to be able, where necessary, look more closely at purchases of key companies in healthcare sector from third countries
- Critical purchases by non-EU states of German firms that make or develop vaccines, medicines, medical protective gear and other medical goods to treat highly infectious diseases need to be reported to economy ministry
FXStreet reports that according to analysts at Commerzbank, WTI Crude Oil retests the 11.42/9.75 support area, a fall through which would target last week’s 6.50 low.
“Nymex Light Crude Oil is swiftly heading back down and currently probes the 11.42/9.75 support area. It consists of the June 1998 and December 1998 lows as well as the April 1986 low. Were it to be slid through, last week’s low at 6.50 would be next in line.”
“Below 6.50 there is no support until minor psychological support at 5.00 and major psychological support at zero.”
“Resistance can be seen between the April 23 high at 18.26 and the June 1997 low at 18.35.”
3M (MMM) reported Q1 FY 2020 earnings of $2.16 per share (versus $2.23 per share in Q1 FY 2019), beating analysts' consensus estimate of $2.01 per share.
The company's quarterly revenues amounted to $8.075 bln (+2.7% y/y), beating analysts' consensus estimate of $7.855 bln.
The company also withdrew its previously announced FY 2020 outlook, which was provided in January, as it "currently is not able to estimate the full duration, magnitude and pace of recovery across its diverse end markets with reasonable accuracy" due to "the evolving and uncertain impact of the COVID-19 pandemic".
MMM rose to $159.50 (+3.81 %) in pre-market trading.

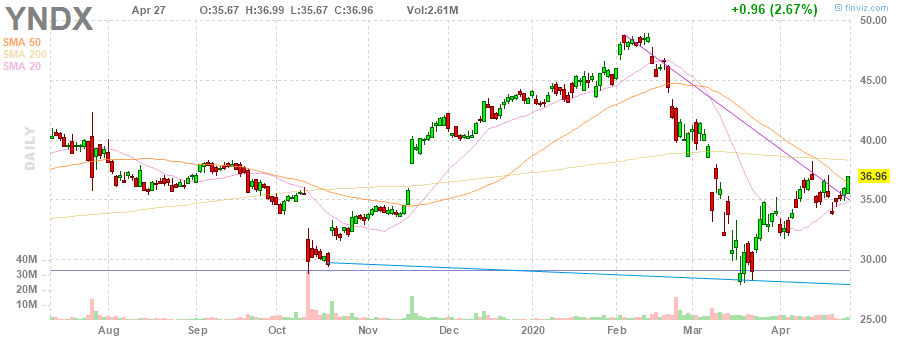
Yandex N.V. (YNDX) reported Q1 FY 2020 earnings of RUB15.53 per share (versus RUB16.35 per share in Q1 FY 2019), missing analysts' consensus estimate of RUB20.55 per share.
The company's quarterly revenues amounted to RUB47.003 bln (+26.1% y/y), generally in line with analysts' consensus estimate of RUB47.256 bln.
The company also noted that "the extent to which the COVID-19 crisis impacts the Company's results will depend on future developments, which are highly uncertain and cannot be predicted."
YNDX rose to $37.50 (+1.46%) in pre-market trading.
FXStreet reports that strategists at Credit Suisse look for a break above the 200-day average and key highs at 0.9796/9803 to reinforce the bull ‘triangle’ pattern.
“We look for another attempt to tackle the 200-day average and key highs at 0.9796/9803. Although this may continue to prove a tough barrier, we stay biased towards an eventual break higher, to see strength extend to the more important resistance zone at 0.9875/0.9926, which includes 2020 high and downtrend from 2019.”
“Support moves to 0.9748, then 0.9713/06, which should floor the market to keep the risks higher.”
The Confederation of British Industry (CBI) reported on Tuesday its latest survey of retailers showed retail sales volume balance stood at -55 in the year to April, sharply down from -3 in March. Economists had forecast the reading to decrease to -40. That was the steepest fall in sales since December 2008.
Moreover, retailers expect a similar pace of decline in annual next month (balance of -54 in the year to May), the weakest expectations in the survey history.
The report also revealed that orders placed on suppliers also plunged (balance of -48 in April, down from -19 in March), with a similar pace expected next month (-50).
In other survey results, wholesalers recorded sales volumes decline at the fastest pace since January 2009, and motor traders were unanimous in reporting a drop in sales. Wholesalers expect a sharper fall in sales next month, while the vast majority of motor traders expect sales to decrease again in the year to May. Internet sales growth dropped close to its weakest since the start of this series in August 2009 (the second-lowest reading ever, the weakest being in June 2019) and is expected to remain well below the long-run average next month.
Rain Newton-Smith, CBI Chief Economist, noted: "It's no surprise that the lockdown is hitting retailers hard. Two-fifths have shut up shop completely for now. And sales of groceries and other essentials also fell, suggesting households may have been dipping into stockpiles built up prior to the lockdown or tightening their belts more generally as incomes take a hit."
FXStreet reports that economists at UBS believe gold can protect against inflation and act as a portfolio diversifier.
"Post-crisis, emergency spending measures will end, but fiscal spending will remain high well beyond 2020. There will be regional variations in how governments finance this debt, but broadly we expect continued financial repression, higher taxes, and moderately higher inflation."
"The experience of the last decade has shown that generating inflation is not straightforward. We also don't think governments will try to inflate away their debt, because large parts of government spending are directly linked to inflation and thus higher inflation increases deficits."
"Given the risk that potential debt monetization leads to higher inflation, gold can help provide inflation protection. With high-quality bond yields remaining low due to financial repression, the downside protection from nominal bonds will be more expensive, and gold could also serve as an alternative portfolio diversifier."
According to the report from Office for National Statistics, the net rate of return for private non-financial corporations (PNFCs) stood at 9.3% in Quarter 4 (Oct to Dec) 2019, down from the revised estimate of 9.8% for Quarter 3 (July to Sept) 2019.
The net rate of return for manufacturing companies fell to 9.4% in Quarter 4 2019, down 1.5 percentage points from the previous quarter's revised net rate of return of 10.9%.
The net rate of return for services companies stood at 14.9% in Quarter 4 2019, a decrease of 0.2 percentage points from the revised estimate of 15.1% in Quarter 3 2019.
The net rate of return for UK continental shelf (UKCS) companies fell to 1.8% in Quarter 4 2019, down from the revised estimate of 2.4% in Quarter 3 2019.
"A rise in the net capital employed coupled with a fall in the net operating surplus led to the downward movement in the net rate of return," the Office for National Statistics said.
FXStreet reports that FX Strategists at UOB Group noted USD/JPY seems to be accelerating the downtrend, with the focus of attention now on the 106.70 level.
24-hour view: "Instead of 'consolidating between 107.25 and 107.95', USD dipped to 106.97 before recovering quickly. The rapid rebound appears to have scope to extend higher but any advance is viewed as part of a 107.00/107.60 range (a sustained rise beyond 107.60 is unlikely)."
Next 1-3 weeks: "USD dipped a few pips below our expected 107.00/109.00 range (low of 106.97) before rebounding. While downward momentum is beginning to pick-up, it is too early to expect a sustained decline in USD. Only a NY closing below 106.70 would indicate that USD is ready to move to 106.00. For now, the prospect for such a scenario is not high but it would continue to increase unless USD moves back above 107.80 within these few days."
FXStreet reports that economists at UBS are confident to see a recovery in oil prices later in the year.
"Energy stocks have a small index weight and sector valuations have also moved to price in the weaker outlook, with the S&P 500 energy sector trading at a 70% discount on price-to-book relative to the index as a whole."
"While the oil market is heavily oversupplied this quarter, we expect it to move toward balance next quarter and become under-supplied in 4Q this year as lockdown restrictions are eased and oil demand picks up."
"We forecast Brent to recover to USD 43/bbl by year-end."
Reuters reports that ECB said in a bank lending survey that euro zone banks recorded a surge in emergency credit demand from corporate clients in the first quarter and a further rise is likely as the coronavirus pandemic batters the economy.
Credit standards, or banks' internal loan approval criteria, were also tightened but this deterioration was "small" compared to the global financial crisis and the bloc's subsequent debt crisis, the ECB added.
"Firms' demand for loans or drawing of credit lines surged in the first quarter of 2020, on account of firms? emergency liquidity needs," the ECB added. "In the second quarter, firms? loan demand is expected to increase further, to the highest net balance since the start of the survey in 2003."
Still, credit standards for corporate borrowers will likely to ease considerably in the second quarter, helped by ECB liquidity measures and government guarantees, the ECB said based on a survey of 144 banks done between March 19 and April 3, the height of Europe's coronavirus lockdown.
For households, credit standards were tightened more than for corporate clients and a further tightening is likely in the second quarter, the ECB added.
Bloomberg reports that according to analysis by Goldman Sachs Group Inc., U.S. stocks may be able to look through a dismal earnings season or two, and the deepest economic contraction in modern history.
That's based on historical analysis that suggests equities price in macroeconomic performance over a two-year horizon. As long as projections are -- as they indeed are now -- for the economy to rebound after the current and coming period of pain, then stocks don't need to fall, the Wall Street bank concluded.
"Investors usually discount at least the next two years of macroeconomic performance, suggesting markets may continue to look through bad news over the near term if it can reasonably be expected to reverse in the coming quarters," Zach Pandl, co-head of global FX and EM strategy, wrote in a research note.
Stocks have recovered globally over the past month as governments lay out plans to ease shutdowns to fight the Covid-19 outbreak. The S&P 500 is up 29% from its March 23 close, though remains 15% off the February record high.
FXStreet reports that economists at Westpac Institutional Bank have updated their economic and financial forecasts for New Zealand. NZD/USD is trading at 0.600.
"We expect annual GDP to drop 6.3% in 2020, and to rebound by only 4.3% in 2021. Such a weak economic outlook will require a massive monetary and fiscal response."
"We expect Government debt will rise to 50% of GDP by 2024."
"Unemployment will peak at 9.5%, and we anticipate only a slow return to below 5%."
"We forecast that the RBNZ will lower the OCR by 75 basis points to -0.5% in November this year."
-
economy contracting by 1.9% in Q1, 12.2% in Q2
-
economy returning to pre-crisis levels only at the end of 2021
According to the report from Insee, in April 2020, due to the sanitary crisis, households' confidence in the economic situation decreased sharply (compared to early March): the synthetic index lost 8 points, its most important decrease since the creation of the survey, in 1972. Standing at 95, it is now below its long term average (100). However, experts expected the index to fall to 83.
In April, the share of households considering it is a suitable time to make major purchases dropped substantially. The corresponding balance lost 43 points and hit its lowest level since the creation of the survey (-59 vs. -42 in December 1995). Moreover, households' opinion balance on their future financial situation decreased strongly. It lost 15 points (its strongest decrease since the creation of the survey) and fell to the level of May 2014. Yet, the balance related to their past financial situation gained 5 points and remains above its long-term average.
In April, the share of households considering it is a suitable time to save decreased. The corresponding balance lost 5 points and remains well below its long-term average. Households' opinion balance on their current saving capacity improved again. It gained 4 points and remains above its long-term average. On the contrary, households' opinion balance related to their expected saving capacity decreased slightly. It lost 2 points but stays above its long-term average.
Households' fears about the unemployment trend increased strongly in April. The corresponding balance increased by 42 points and hits a level that had not been reached since July 2015.
During today's Asian trading, the US dollar was almost unchanged against the euro and the yen. The ICE Dollar index, which shows the value of the us dollar against six major world currencies, rose by 0.09% compared to the previous day.
Authorities in a number of countries are beginning or planning to gradually relax the restrictive measures that were introduced against the background of the spread of the coronavirus. Italian Prime Minister Giuseppe Conte said over the weekend that the country will gradually ease quarantine measures from May 4, while France is due to present a strategy for lifting restrictions on Tuesday.
Yesterday, British Prime Minister Boris Johnson returned to work after an illness. During the speech, the Prime Minister expressed confidence that the UK will overcome the coronavirus, but he noted that the time has not yet come to relax the measures imposed due to the pandemic. The authorities will be able to weaken them only when they are sure that a second peak in the incidence will not occur because of this, Johnson said.
This week, investors are waiting for the results of the meeting of the US Federal reserve (Fed) and the European Central Bank (ECB).
FXStreet reports that FX Strategists at UOB Group noted the outlook on EUR/USD remains mixed for the time being.
24-hour view: "We highlighted yesterday that the 'rebound in EUR has room to extend higher but a sustained break of 1.0855 is unlikely'. EUR subsequently rose to 1.0861 before retreating. Upward momentum has eased and EUR has likely moved into a consolidation phase. In other words, EUR is expected to trade sideways for today, likely between 1.0790 and 1.0855."
Next 1-3 weeks: "We have held the same view since 16 Apr (spot at 1.0890) wherein 'the outlook is mixed' and EUR could 'continue to trade in an undecided manner within a broad 1.0750/1.1000 range for a period'. When EUR moved towards the bottom of our expected range at 1.0750, we indicated last Friday (24 Apr, spot at 1.0780) that only "a NY closing below 1.0720 would suggest EUR could weaken further to 1.0635". EUR subsequently dipped to 1.0725 before staging a robust rebound. Downward pressure has eased and the outlook for EUR remains mixed for now. From here, EUR could continue to trade in an undecided manner and a 1.0725/1.0940 range is likely wide enough to contain the movement in EUR for a while more."
eFXdata reports that CIBC Research discusses AUD/USD outlook and targets the pair at 0.62 in Q2.
"AUD/USD has appreciated over 14% from lows seen in mid-March. In response to COVID, the RBA cut rates to 0.25%, and introduced YCC in order to keep the cost of borrowing low. We do not foresee any further cuts from the Bank, which will limit downside moves in the currency. For now, expect risk sentiment to be the major driver of price action," CIBC notes.
"We expect AUD/USD prices to stabilize as the market awaits coronavirus updates on a go-forward basis," CIBC adds.
Reuters reports that Japan's March jobless rate rose to its highest in a year, while job availability slipped to a more than three-year low, official data showed on Tuesday, as the coronavirus outbreak and containment measures caused the nation's job market to ease.
The seasonally adjusted unemployment rate rose to 2.5%, its highest level since March last year, internal affairs ministry data showed, and matching economists' 2.5% median forecast. The unemployment rate stood at 2.2% in December, the lowest since 1992.
The jobs-to-applicants ratio fell to 1.39 in March, the lowest since September 2016 and below the median forecast of 1.40, health ministry figures showed.
"The employment situation is expected to worsen further in April, so I think it's still the start of a deterioration," said Atsushi Takeda, chief economist at Itochu Research Institute.
"There is no doubt that the number of unemployed people is rising," he said. "I think there will be a sharp reduction in job offers in April."
While conditions in Japan's labour market aren't as severe as in the United States, unemployment in the country could rise to 4% in the months ahead, Takeda said.
-
CNBC said that more than 3 million people are now reported to have been infected by the coronavirus around the world and over 210,800 have died.
-
The virus outbreak was reported in China's Hubei province late last year before it spread rapidly to all parts of the world in mere months.
-
Most cases reported: United States (987,022), Spain (229,422), Italy (199,414), France (165,962), and Germany (158,434).
EUR/USD
Resistance levels (open interest**, contracts)
$1.0936 (855)
$1.0907 (576)
$1.0885 (622)
Price at time of writing this review: $1.0823
Support levels (open interest**, contracts):
$1.0787 (1789)
$1.0758 (1863)
$1.0723 (1373)

Comments:
- Overall open interest on the CALL options and PUT options with the expiration date May, 8 is 68738 contracts (according to data from April, 27) with the maximum number of contracts with strike price $1,1200 (3129);
GBP/USD
Resistance levels (open interest**, contracts)
$1.2555 (694)
$1.2527 (517)
$1.2472 (267)
Price at time of writing this review: $1.2416
Support levels (open interest**, contracts):
$1.2370 (344)
$1.2320 (676)
$1.2289 (499)

Comments:
- Overall open interest on the CALL options with the expiration date May, 8 is 16410 contracts, with the maximum number of contracts with strike price $1,2700 (1714);
- Overall open interest on the PUT options with the expiration date May, 8 is 17828 contracts, with the maximum number of contracts with strike price $1,2850 (1073);
- The ratio of PUT/CALL was 1.09 versus 1.07 from the previous trading day according to data from April, 27

* - The Chicago Mercantile Exchange bulletin (CME) is used for the calculation.
** - Open interest takes into account the total number of option contracts that are open at the moment.
| Raw materials | Closed | Change, % |
|---|---|---|
| Brent | 19.93 | -9.53 |
| Silver | 15.16 | -0.2 |
| Gold | 1714.499 | -0.6 |
| Palladium | 1921.54 | -4.67 |
| Index | Change, points | Closed | Change, % |
|---|---|---|---|
| NIKKEI 225 | 521.22 | 19783.22 | 2.71 |
| Hang Seng | 448.81 | 24280.14 | 1.88 |
| KOSPI | 33.76 | 1922.77 | 1.79 |
| ASX 200 | 78.8 | 5321.4 | 1.5 |
| FTSE 100 | 94.56 | 5846.79 | 1.64 |
| DAX | 323.9 | 10659.99 | 3.13 |
| CAC 40 | 111.94 | 4505.26 | 2.55 |
| Dow Jones | 358.51 | 24133.78 | 1.51 |
| S&P 500 | 41.74 | 2878.48 | 1.47 |
| NASDAQ Composite | 95.64 | 8730.16 | 1.11 |
| Time | Country | Event | Period | Previous value | Forecast |
|---|---|---|---|---|---|
| 06:45 | France | Consumer confidence | April | 103 | 83 |
| 10:00 | United Kingdom | CBI retail sales volume balance | April | -3 | -40 |
| 12:30 | U.S. | Goods Trade Balance, $ bln. | March | -59.89 | |
| 13:00 | U.S. | S&P/Case-Shiller Home Price Indices, y/y | February | 3.1% | 3.3% |
| 14:00 | U.S. | Richmond Fed Manufacturing Index | April | 2 | |
| 14:00 | U.S. | Consumer confidence | April | 120 | 88 |
| 22:45 | New Zealand | Trade Balance, mln | March | 594 |
| Pare | Closed | Change, % |
|---|---|---|
| AUDUSD | 0.64632 | 1.11 |
| EURJPY | 116.137 | -0.18 |
| EURUSD | 1.08291 | 0.06 |
| GBPJPY | 133.228 | 0.24 |
| GBPUSD | 1.24239 | 0.48 |
| NZDUSD | 0.6039 | 0.41 |
| USDCAD | 1.4018 | -0.53 |
| USDCHF | 0.9745 | 0.17 |
| USDJPY | 107.236 | -0.23 |


© 2000-2026. All rights reserved.
This site is managed by Teletrade D.J. LLC 2351 LLC 2022 (Euro House, Richmond Hill Road, Kingstown, VC0100, St. Vincent and the Grenadines).
The information on this website is for informational purposes only and does not constitute any investment advice.
The company does not serve or provide services to customers who are residents of the US, Canada, Iran, The Democratic People's Republic of Korea, Yemen and FATF blacklisted countries.
Making transactions on financial markets with marginal financial instruments opens up wide possibilities and allows investors who are willing to take risks to earn high profits, carrying a potentially high risk of losses at the same time. Therefore you should responsibly approach the issue of choosing the appropriate investment strategy, taking the available resources into account, before starting trading.
Use of the information: full or partial use of materials from this website must always be referenced to TeleTrade as the source of information. Use of the materials on the Internet must be accompanied by a hyperlink to teletrade.org. Automatic import of materials and information from this website is prohibited.
Please contact our PR department if you have any questions or need assistance at pr@teletrade.global.
transfers