- Analiza
- Novosti i instrumenti
- Vesti sa tržišta
Forex-novosti i prognoze od 10-08-2022
- EUR/JPY remains pressured towards short-term key SMA after declining the most in more than a week.
- Downside break of the one-week-old support line keeps sellers hopeful.
- 200-SMA, descending trend line from late June adds to the upside filters.
EUR/JPY holds lower ground near 136.80, after renewing the multi-day low on the break of the weekly support line. However, the 50-SMA challenges the pair sellers during Thursday’s initial Asian session.
Even so, downbeat RSI (14), not oversold, joins the bearish MACD signals to favor EUR/JPY bears.
Hence, the EUR/JPY prices are likely to break the immediate support, namely the 200-SMA level of 136.45, which in turn could direct the quote towards two-week-old horizontal support near 135.70.
Should the pair remains bearish past 135.70, the monthly low near 133.40 will be in focus.
On the flip side, a convergence of the previous support line and the 200-SMA appears a tough nut to crack for the EUR/JPY bulls, around 139.05 at the latest.
Even if the quote rises past 139.05, a downward sloping resistance line from late June, near 139.40-45, will precede the 140.00 threshold to challenge the EUR/JPY pair’s further upside.
Overall, EUR/JPY remains on the bear’s radar while targeting the monthly low as nearby support.
EUR/JPY: Four-hour chart
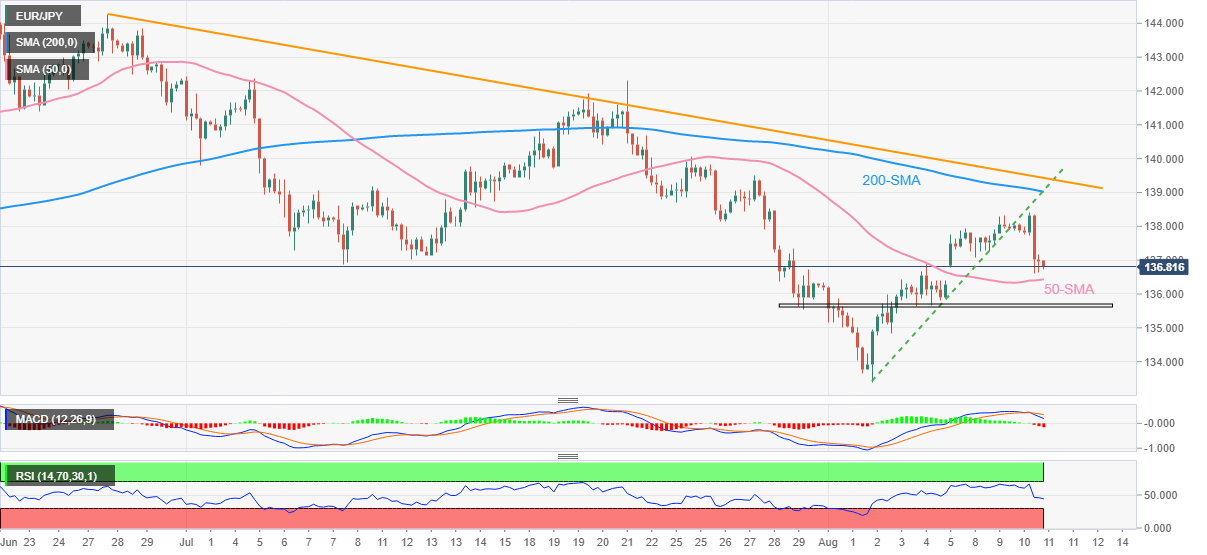
Trend: Further weakness expected
- WTI crude oil struggles to keep the US inflation-linked bullish bias.
- Resumption of Russian oil pipeline flows after six-day halt challenges US CPI-led advances.
- EIA inventory build, Fedspeak and challenges to risk profile also exert downside pressure on the oil prices.
- Monthly demand forecasts from OPEC, IEA will be important for immediate direction.
WTI crude oil prices struggle to keep US inflation-led gains during Thursday’s Asian session, staying mostly idle around $90.85 after stepping back from $91.79. That said, challenges to risk profile join a cautious mood ahead of monthly demand forecasts from the Organization of the Petroleum Exporting Countries (OPEC) and the International Energy Agency (IEA).
The black gold cheered the US dollar’s slump the previous day to post over 1.0% gains amid receding hawkish Fed bets. Though, the latest comments from Fed policymakers and the US-China tariff story challenged the bulls afterward. Additionally, headlines suggesting Russian oil pipeline flows resumed after Hungarian firm settled transit bill joined downbeat weekly official inventory data from the US Energy Information Administration (EIA) to also exert downside pressure on the energy benchmark.
“Russian oil pipeline flows resumed to Central Europe on Wednesday, ending a six-day halt, after Hungarian group MOL paid transit fees owed to Ukraine, providing a temporary solution to the latest disruption of Russian energy supplies,” said Reuters. On the other hand, the
EIA Crude Oil Stocks Change rose to 5.458M for the week ended on August 05 versus 0.073M forecasts and 4.467M prior.
US Dollar Index (DXY) dropped to the fresh low since June 30 after the US Consumer Price Index (CPI) declined to 8.5% on YoY in July versus 8.7% expected and 9.1% prior. “After Wednesday's CPI report, traders of futures tied to the Fed's benchmark interest rate pared bets on a third straight 75-basis-point hike at its Sept. 20-21 policy meeting, and now see a half-point increase as the more likely option,” said Reuters following the data.
It’s worth noting that US President Joe Biden also mentioned that they are seeing some signs that inflation may be moderating, as reported by Reuters. "We could face additional headwinds in the months ahead," Biden added. "We still have work to do but we're on track," added US President Biden.
Furthermore, Minneapolis Fed President Neel Kashkari mentioned, “The Fed is ‘far, far away from declaring victory’ on inflation. The policymaker also added that he hasn't ‘seen anything that changes’ the need to raise the Fed's policy rate to 3.9% by year-end and to 4.4% by the end of 2023. Elsewhere, Chicago Fed President Charles Evans mentioned, “The economy is almost surely a little more fragile, but would take something adverse to trigger a recession.” Fed’s Evans also called inflation "unacceptably" high.
Also challenging the oil buyers was Reuters news saying US President Biden rethinks steps on China tariffs in wake of Taiwan response, per sources.
Looking forward, the OPEC and IEA demand projections will be important after the EIA raised its 2022 oil consumption forecasts to 99.43 million bpd. OPEC left 2022 world oil demand growth forecast unchanged at 3.36 million bpd in its latest projections while EIA warned that global natural gas demand growth is likely to contract slightly in 2022 and will continue its sluggish trend over the next three years.
Technical analysis
Despite the latest rebound, WTI crude oil prices remain below the 200-DMA hurdle surrounding $94.40, which in turn joins sluggish RSI and MACD to keep sellers hopeful of revisiting the six-month low marked in the last week, around $86.40.
- USD/CAD bulls have started to move in for the kill.
- A phase of accumulation could be playing out in the lower time frames.
USD/CAD has stalled in the sell-off which gives rise to the prospects of a bullish continuation. The following illustrates this from a daily, hourly and the 15-minute time frame perspective.
USD/CAD daily chart
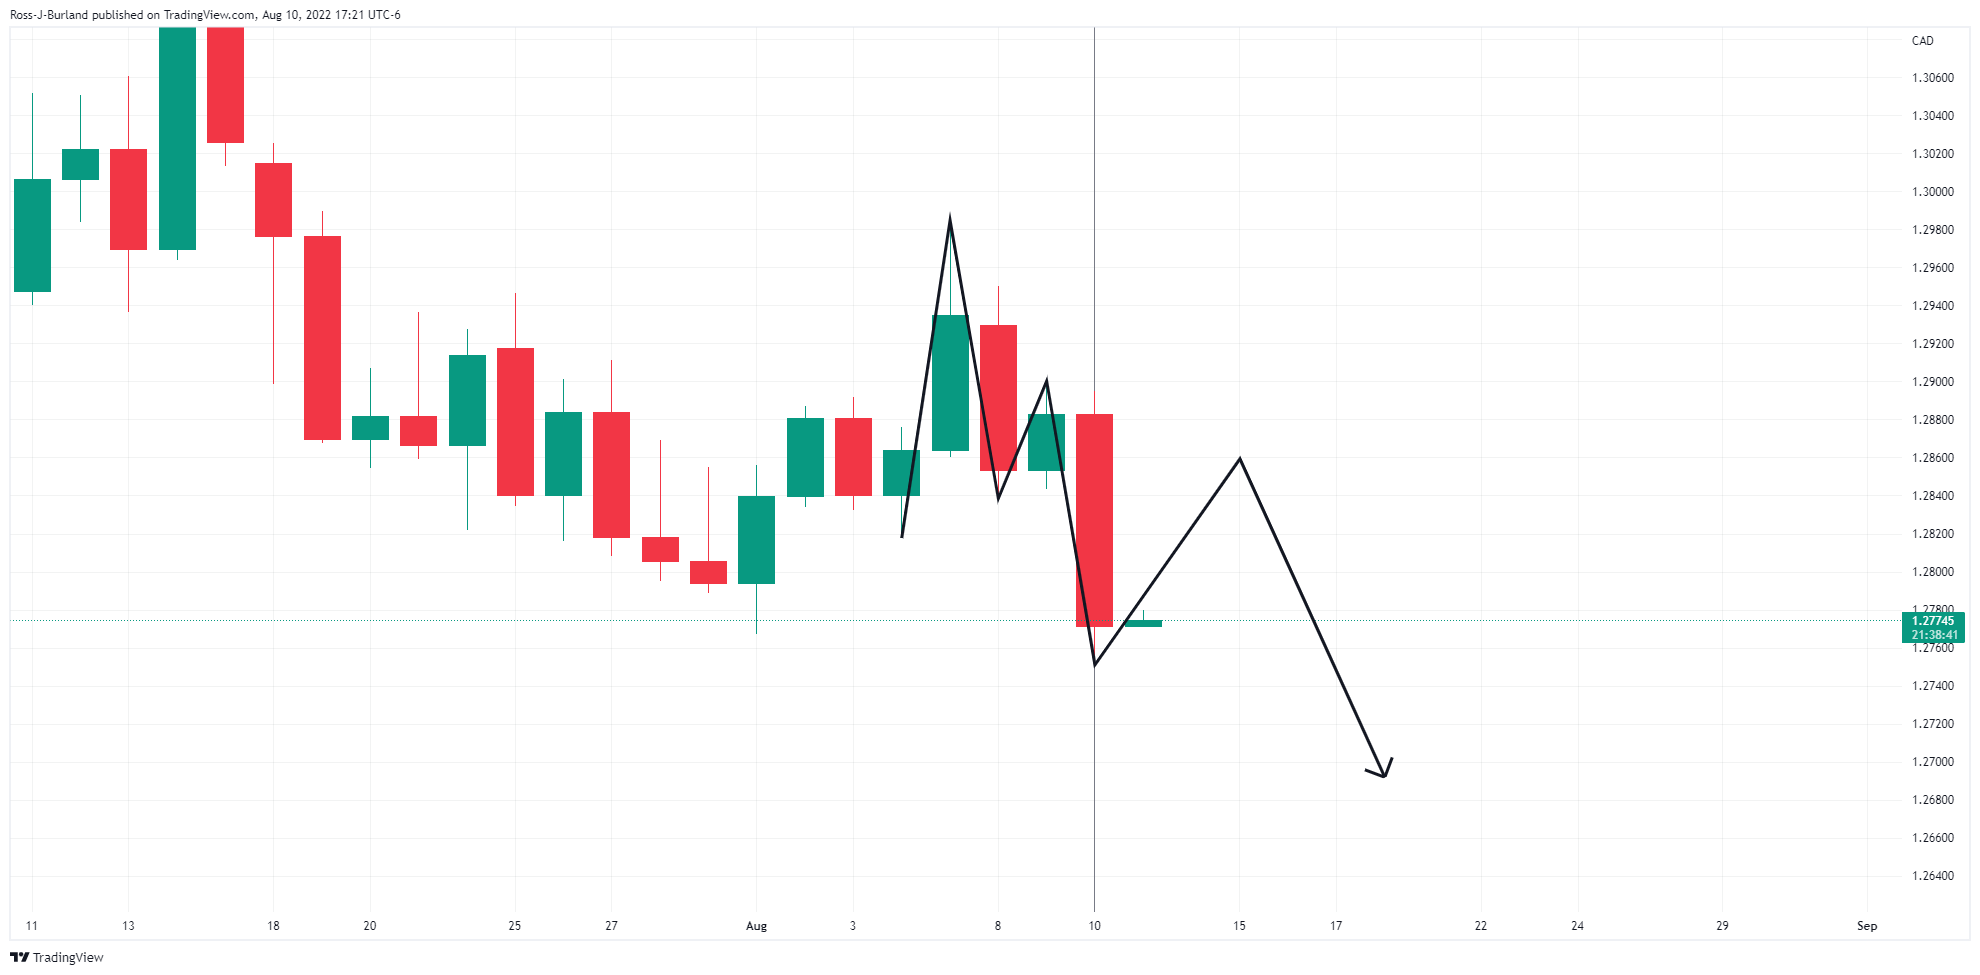
The daily chart's M-formation is compelling as this is a reversion pattern that could see the price pulled back into the neckline of the 'M' in the coming sessions. the optimal entry point will be dependent on the forthcoming price action and dependent on a lower time frame break of structure.
USD/CAD H1 chart
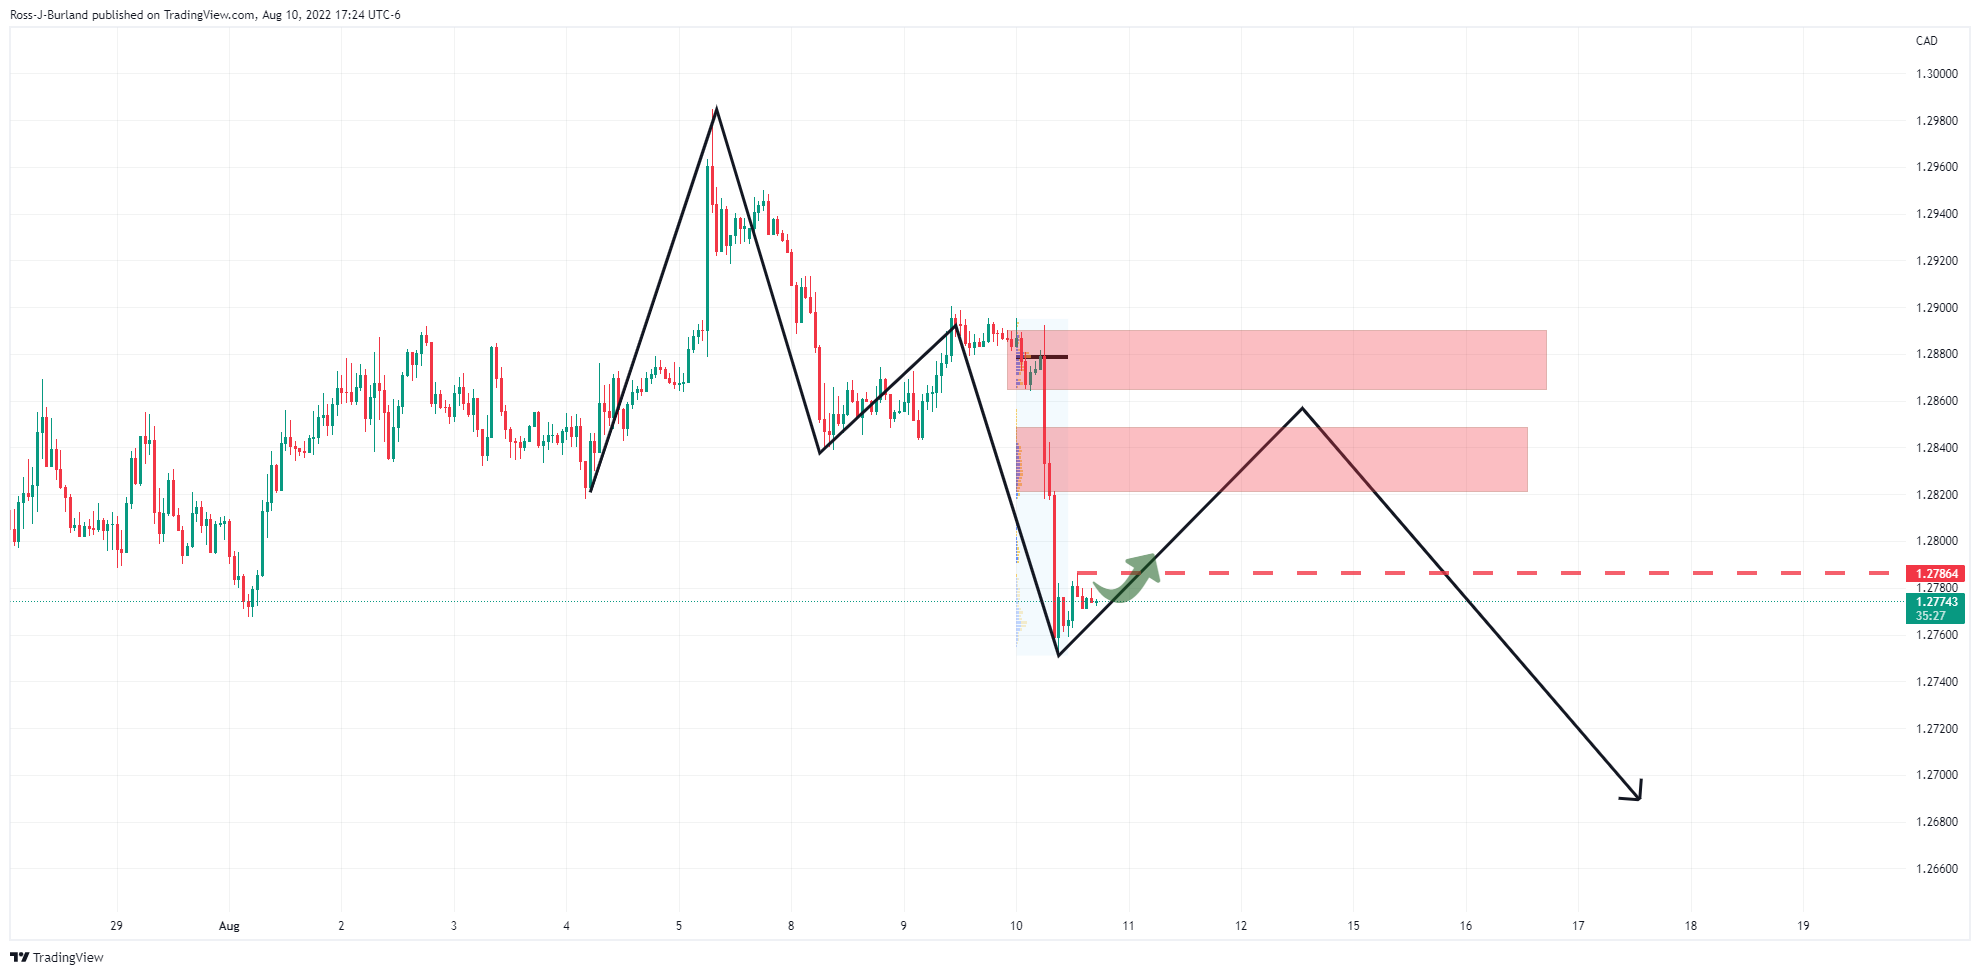
The hourly chart shows that the price has made a recent corrective high. The bulls will want to see this cleared before thinking about engaging as it will signal a higher probability that the sell-off is indeed decelerating.
USD/CAD M15 chart
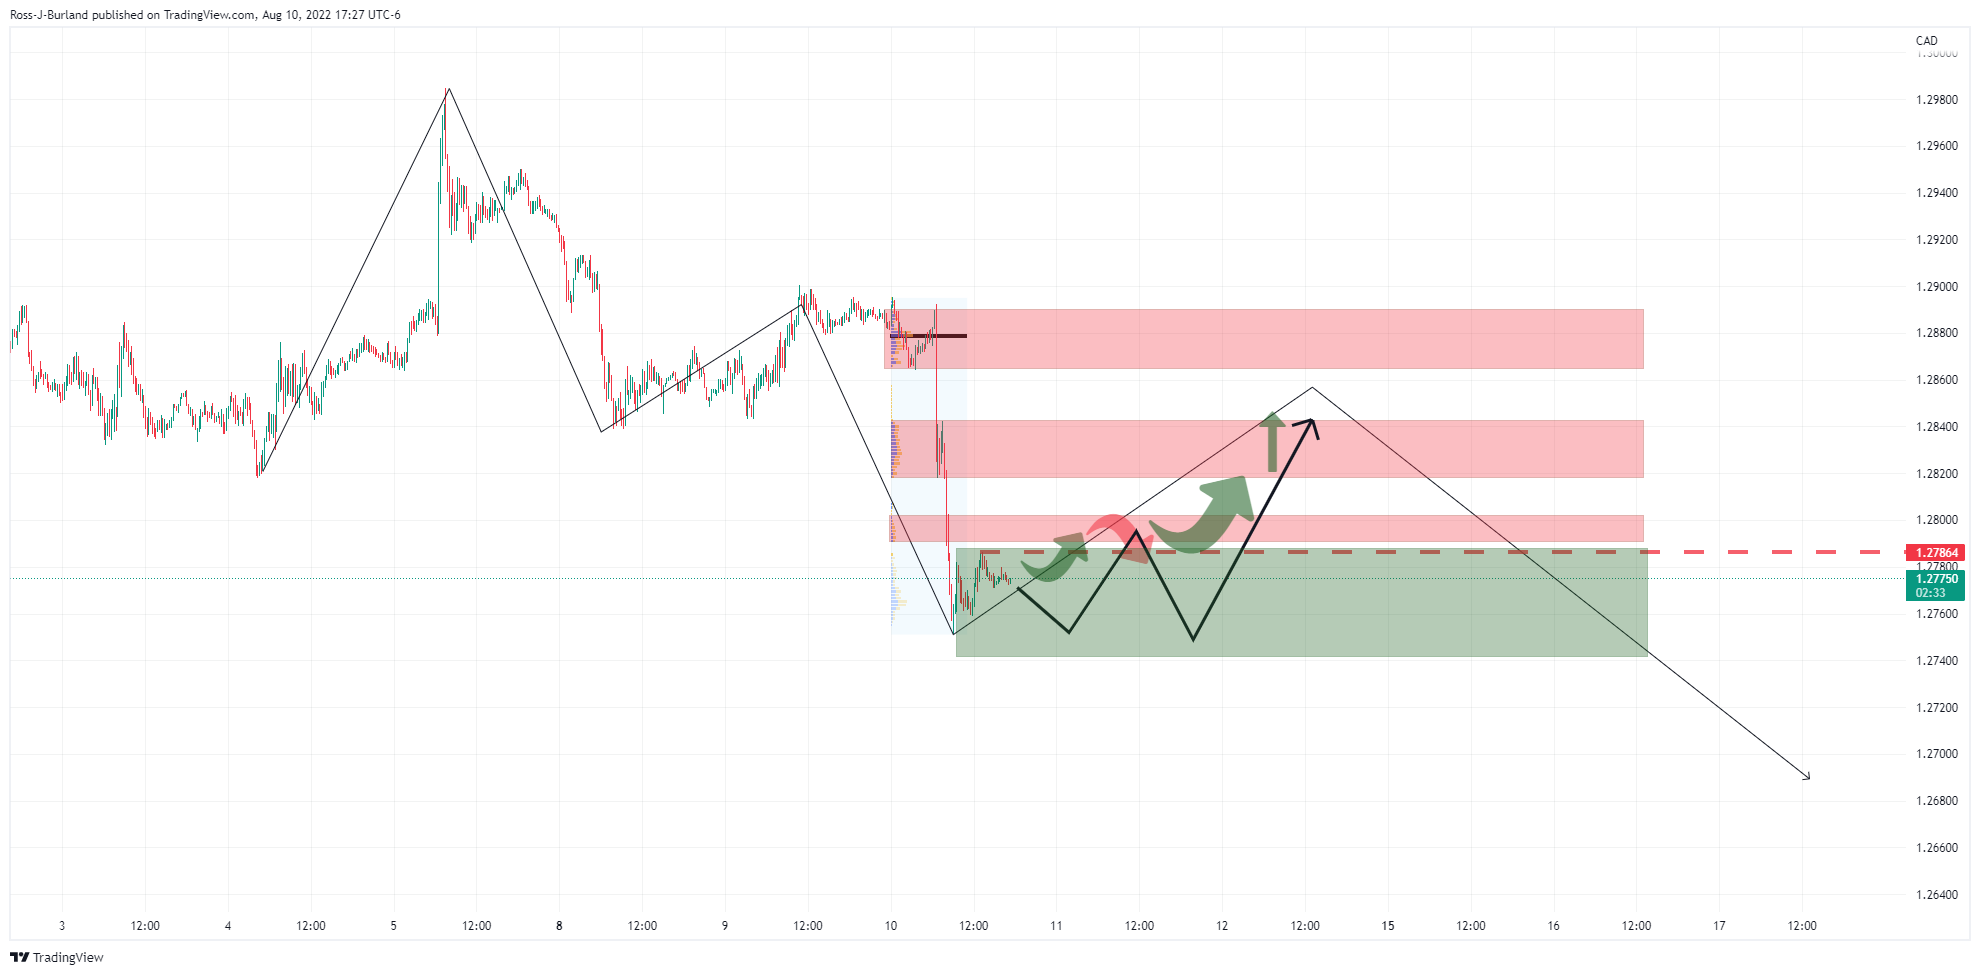
From a 15-min perspective, the price action could develop over the coming sessions as follows. In a fast market, the price would be expected to correct steeply, but in a long drawn-out process in which there is a lack of commitment from the bulls, the ride could be a bumpy one along the support area as illustrated above. This would potentially result in an even lower low yet to come before the bulls fully commit to the correction in a phase of accumulation.
- AUD/NZD is auctioning a marked territory as investors await Australian Consumer Inflation Expectations.
- Aussie Inflation Expectations are likely to remain higher due to the unavailability of a downside signal.
- The RBNZ has already raised its OCR to 2.5% to combat price pressures.
The AUD/NZD pair is displaying back and forth moves below the critical hurdle of 1.0600 in the early Asian session. The cross is juggling in a range of 1.0384-1.0642 as investors are awaiting the release of the Australian Consumer Inflation Expectations data.
The University of Melbourne will dictate the Consumer Inflation Expectations, which presents the consumer expectations of future inflation during the next 12 months. Earlier, the inflation data landed at 6.3%. This time, an upside surprise is expected as price pressures are soaring vigorously in the Australian economy. Earlier, the aussie inflation landed at 6.1% for the second quarter of CY2022, higher than the prior release of 5.1%. The inflation figure of 6.1% is the highest recorded since 1990, which indicates that the price pressures are not likely to find a sigh of relief.
This will keep the Reserve Bank of Australia (RBA) on its toes as policy tightening measures are critical to combat the ramping inflation. It is worth noting that the RBA has already elevated its Official Cash Rate (OCR) to 1.85% after three consecutive 50 basis points (bps) interest rate hike announcements.
On the NZ front, price pressures are already soaring in the NZ economy and have not displayed a meaningful exhaustion sign yet. As per the June print, an inflation rate of 7.3% is sufficient to create headwinds for the households. To contain the inflation mess, Reserve Bank of New Zealand (RBNZ) Adrian Orr is continuously elevating its interest rates, which are now moved to 2.5%, the highest since March 2016.
- GBP/JPY is expected to report more losses after a downside move below 162.00.
- Vulnerable expectations for the UK economic data will keep the sterling bulls on the back foot.
- Japan’s cabinet re-shuffle is expected to result in a dramatic change in the Japanese yen on a broader basis.
The GBP/JPY pair has dropped sharply after facing barricades around the critical hurdle of 162.80. Earlier, the cross delivered a downside break of the balance auction formed in a 162.58-163.84 range. Upon establishment of a downside bias, the asset is expected to extend its losses after violating the immediate support of 162.00.
Investors are paring their positions in the pound amid lower estimates for the UK Gross Domestic Product (GDP) data which is due on Friday. The market participants see a shrink in the second quarter by 0.2% against the expansion of 0.3%. Also, the UK economy is expected to shrink by 1.3% against the expansion of 0.5% on a monthly basis. Adding to that, the estimate for annual GDP is 2.8%, significantly lower than the prior print of 8.7%.
Observing the other economic data, an underperformance is expected on the Manufacturing production front. The annual data is likely to slip lower to 1.3% vs. the prior release of 2.3%. Whereas, Industrial Production could display an uptick to 1.6% from 1.4% annually.
Investors are preferring to remain on the sidelines from sterling due to an expected underperformance on the critical economic data front.
On the Tokyo front, the ongoing cabinet re-shuffle is expected to result in a dramatic change in the situation of the Japanese yen on a broader basis. The Bank of Japan is worried over the subdued Labor Cost Index as it is critical for keeping the inflation rate above the desired levels. Finance Minister Shunichi Suzuki said that Japan’s financial position is still severe. He added that “it's critical to continue reacting to covid and inflation.”
- USD/CHF remains depressed at four-month low, sidelined of late.
- Clear downside break of the 200-DMA, descending support line from late May favor sellers.
- 61.8% Fibonacci retracement level adds to the immediate upside filters.
USD/CHF licks its wounds at the lowest levels since mid-April, taking rounds to 0.9420-25 during Thursday’s Asian session.
The Swiss currency (CHF) pair dropped the most since mid-June the previous day in the aftermath of the US inflation data. The south-run also broke key supports and joins downbeat oscillators to keep bears hopeful of late.
That said, a daily closing below the 200-DMA and a descending previous support line from May 27, around 0.9435-30 by the press time, suggests the USD/CHF pair’s further weakness.
Also adding strength to the downside bias are the bearish MACD signals and the RSI (14) that still has some space before hitting the oversold territory.
With this, the USD/CHF sellers approach an upward sloping support line from January, near 0.9360.
Following that, the late January high near 0.9340 and February’s low near 0.9150 will be in focus.
Alternatively, corrective pullback remains elusive below the 0.9435-30 support-turned-resistance.
Even so, the 61.8% Fibonacci retracement level of the January-May upside, around 0.9465, could challenge the USD/CHF bulls.
USD/CHF: Daily chart
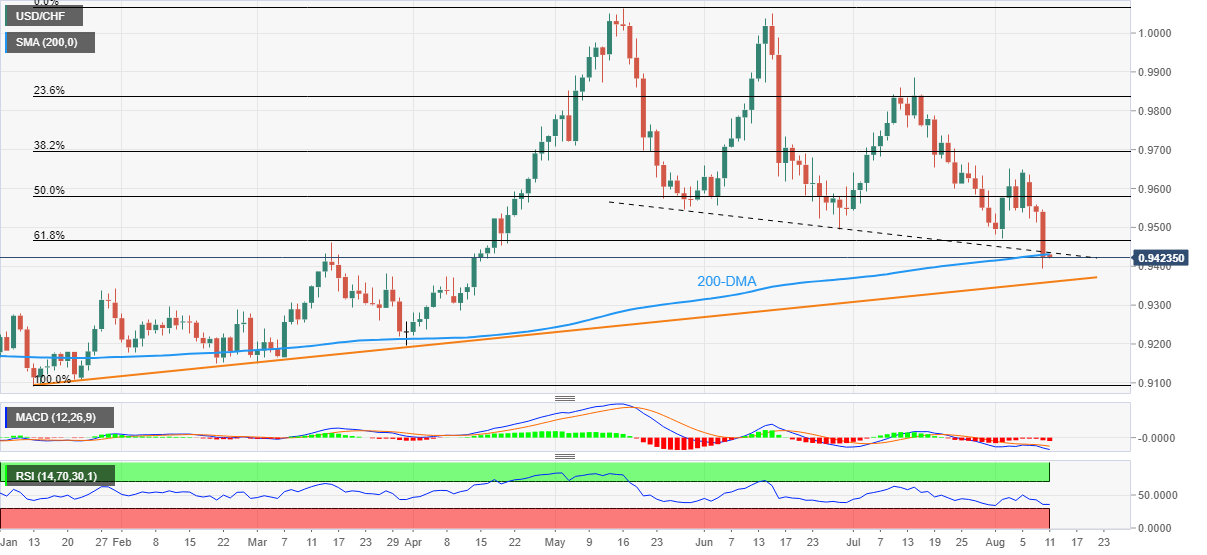
Trend: Further weakness expected
- On Wednesday, the USD/JPY slide more than 1.50%, its largest daily loss since July 28.
- USD/JPY buyers unable to break above 135.30 exacerbated the fall below the 133.00 mark.
The USD/JPY tanked more than 200 pips on Wednesday, courtesy of cooler-than-expected US CPI data, suggesting that the Federal Reserve might pivot, towards a dovish stance, spurring a risk-on impulse, with Wall Street’s recording substantial gains while the greenback weakened. However, as Thursday’s Asian Pacific session begins, the USD/JPY is trading at 132.85, further extending its weekly losses.
USD/JPY Price Analysis: Technical outlook
On Wednesday, the USD/JPY faced the confluence of three-technical signals above the exchange rate, which was the USD/JPY’s first resistance level. The convergence of the 20, 50-DMAs and a one-month-old downslope trendline around the 135.20-30 area was challenging to break. Nevertheless, Wednesday’s fall is attributed to US economic data releases. Still, the previously mentioned confluence of technical signals played its role for the last four days, with buyers unable to crack it. Therefore, the USD/JPY shifted its bias from neutral-upwards to neutral.
USD/JPY traders should notice that the Relative Strength Index is in bearish territory, indicating that sellers are gathering momentum. Unless buyers reclaim the 135.50 area, even though the pair is neutral, it is tilted to the downside.
Therefore, the USD/JPY’s first support will be the August 10 low at 132.03. Break below will expose the 100-day EMA at 131.20, the August 2 swing low at 131.20, and the psychological 130.00 figure.
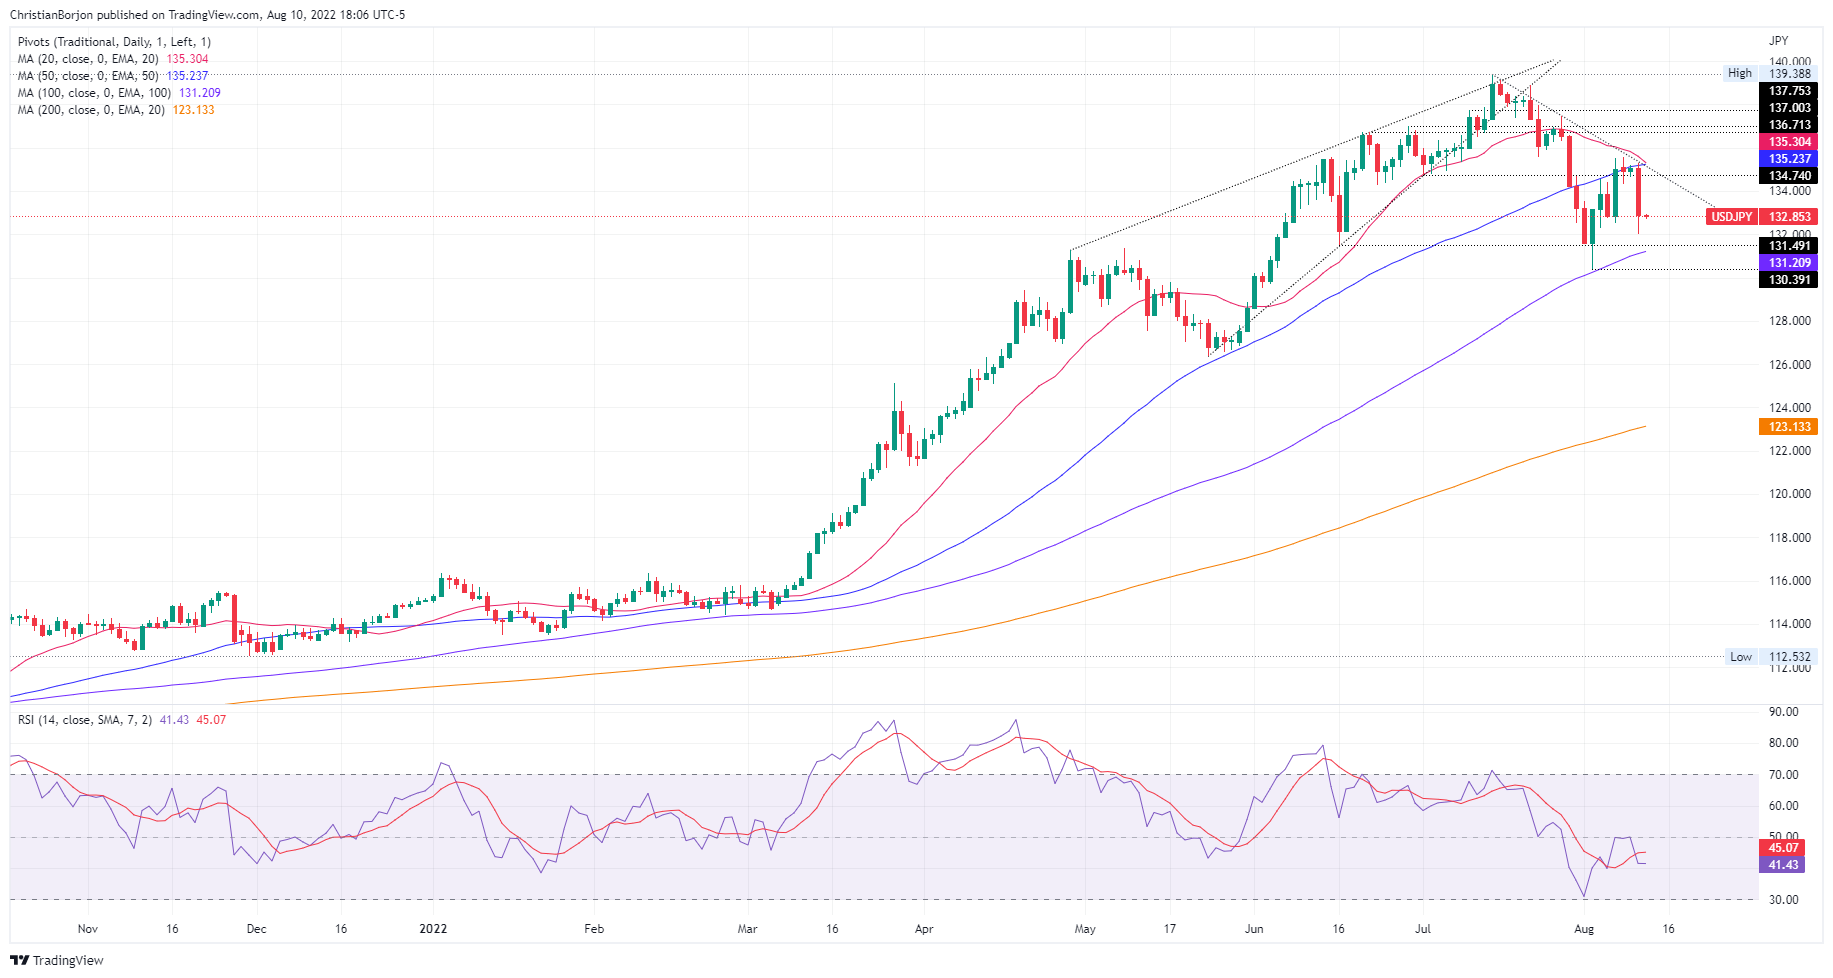 USD/JPY Daily chart
USD/JPY Key Technical Levels
- AUD/USD bulls take a breather around two-month top, after printing the biggest daily jump in eight weeks.
- Hawkish Fed bets slumped on easy US CPI for July, Fedspeak remains worrisome.
- US rethinks over China tariffs after the Taiwan incident and pokes risk-on mood amid recession fears.
- Australia’s Consumer Inflation Expectations for August appear important catalyst.
AUD/USD treads water around 0.7080, after rallying to the fresh two-month high, as the recent Fedspeak and headlines surrounding the China tariffs seemed to have poked the bulls. That said, the Aussie pair traders remain cautious ahead of the monthly Consumer Inflation Expectations from Australia.
The Aussie pair rallied the most since mid-June after the US inflation figures tamed the market’s expectations of aggressive Fed rate hikes going forward. However, the Fed policymakers’ latest speeches signal no conviction and join the US-China tariff story to challenge the bulls.
As per the latest US inflation data, the US Consumer Price Index (CPI), declined to 8.5% on YoY in July versus 8.7% expected and 9.1% prior. The Core CPI, which excludes volatile food and energy prices, stayed unchanged at 5.9% YoY, compared to the market consensus of 6.1%.
Following the US inflation release, US President Joe Biden said on Wednesday that they are seeing some signs that inflation may be moderating, as reported by Reuters. "We could face additional headwinds in the months ahead," Biden added. "We still have work to do but we're on track," adds US President Biden.
“After Wednesday's CPI report, traders of futures tied to the Fed's benchmark interest rate pared bets on a third straight 75-basis-point hike at its Sept. 20-21 policy meeting, and now see a half-point increase as the more likely option,” said Reuters.
It should be noted that Minneapolis Fed President Neel Kashkari mentioned, “The Fed is ‘far, far away from declaring victory’ on inflation. The policymaker also added that he hasn't ‘seen anything that changes’ the need to raise the Fed's policy rate to 3.9% by year-end and to 4.4% by the end of 2023. Elsewhere, Chicago Fed President Charles Evans mentioned, “The economy is almost surely a little more fragile, but would take something adverse to trigger a recession.” Fed’s Evans also called inflation "unacceptably" high.
Against this backdrop, Wall Street rallied but the US Treasury yields remained mostly unchanged by ending the day at around 2.776%.
Looking forward, Australia’s Consumer Inflation Expectations for August, prior 6.3%, will be important for immediate direction. Following that, the weekly readings of the US Jobless Claims and the monthly Producer Price Index (PPI) for July could entertain the AUD/USD traders. However, major attention should be given to the qualitative factors in the wake of recent risk-negative headlines.
Technical analysis
A daily closing beyond the downward sloping trend line from April 20, around 0.7015 by the press time, keeps AUD/USD buyers hopeful of overcoming the immediate hurdle, namely the 200-DMA surrounding 0.7120.
- AUD/JPY has been seesawing within a 60-pip trading range for the last couple of days.
- The AUD/JPY daily chart is neutral, while the hourly time-frame further cements the case for consolidation.
The AUD/JPY finished Wednesday’s session almost flat, forming a quasi dragonfly-doji, meaning that neither buyers/sellers dominated the trading session amidst a risk-on impulse. Factors like lower-than-expected US inflation and tempering tensions between China-Taiwan improved risk appetite. At the time of writing, the AUD/JPY is trading at 94.05, down 0.02%, as the Asian session begins.
AUD/JPY Price Analysis: Technical outlook
The AUD/JPY daily char chart illustrates the pair as neutral bias, with the 20 and 50-day EMAs meandering around the exchange rate, a reason to think that consolidation lies ahead. Further confirming the aforementioned, Wednesday’s price action printing a dragonfly-doji, indecision amongst AUD/JPY traders.
Switching towards a short-term picture, the AUD/JPY has been seesawing for the last couple of days, within the 93.80-94.40 area, with some candles breaching the aforementioned levels. Still, the price has returned to its “mean reversion” area.
Upwards, the AUD/JPY’s first resistance would be the August 10 high at 94.30. Once cleared, the next supply zone will be the weekly high at 94.43, followed by the psychologically 95.00 area. On the other hand, the AUD/JPY first support will be the 94.00 area. A breach of the latter will send the cross towards the 100-hour EMA at 93.72 (tested on August 10), followed by the August 10 daily low at 93.47.
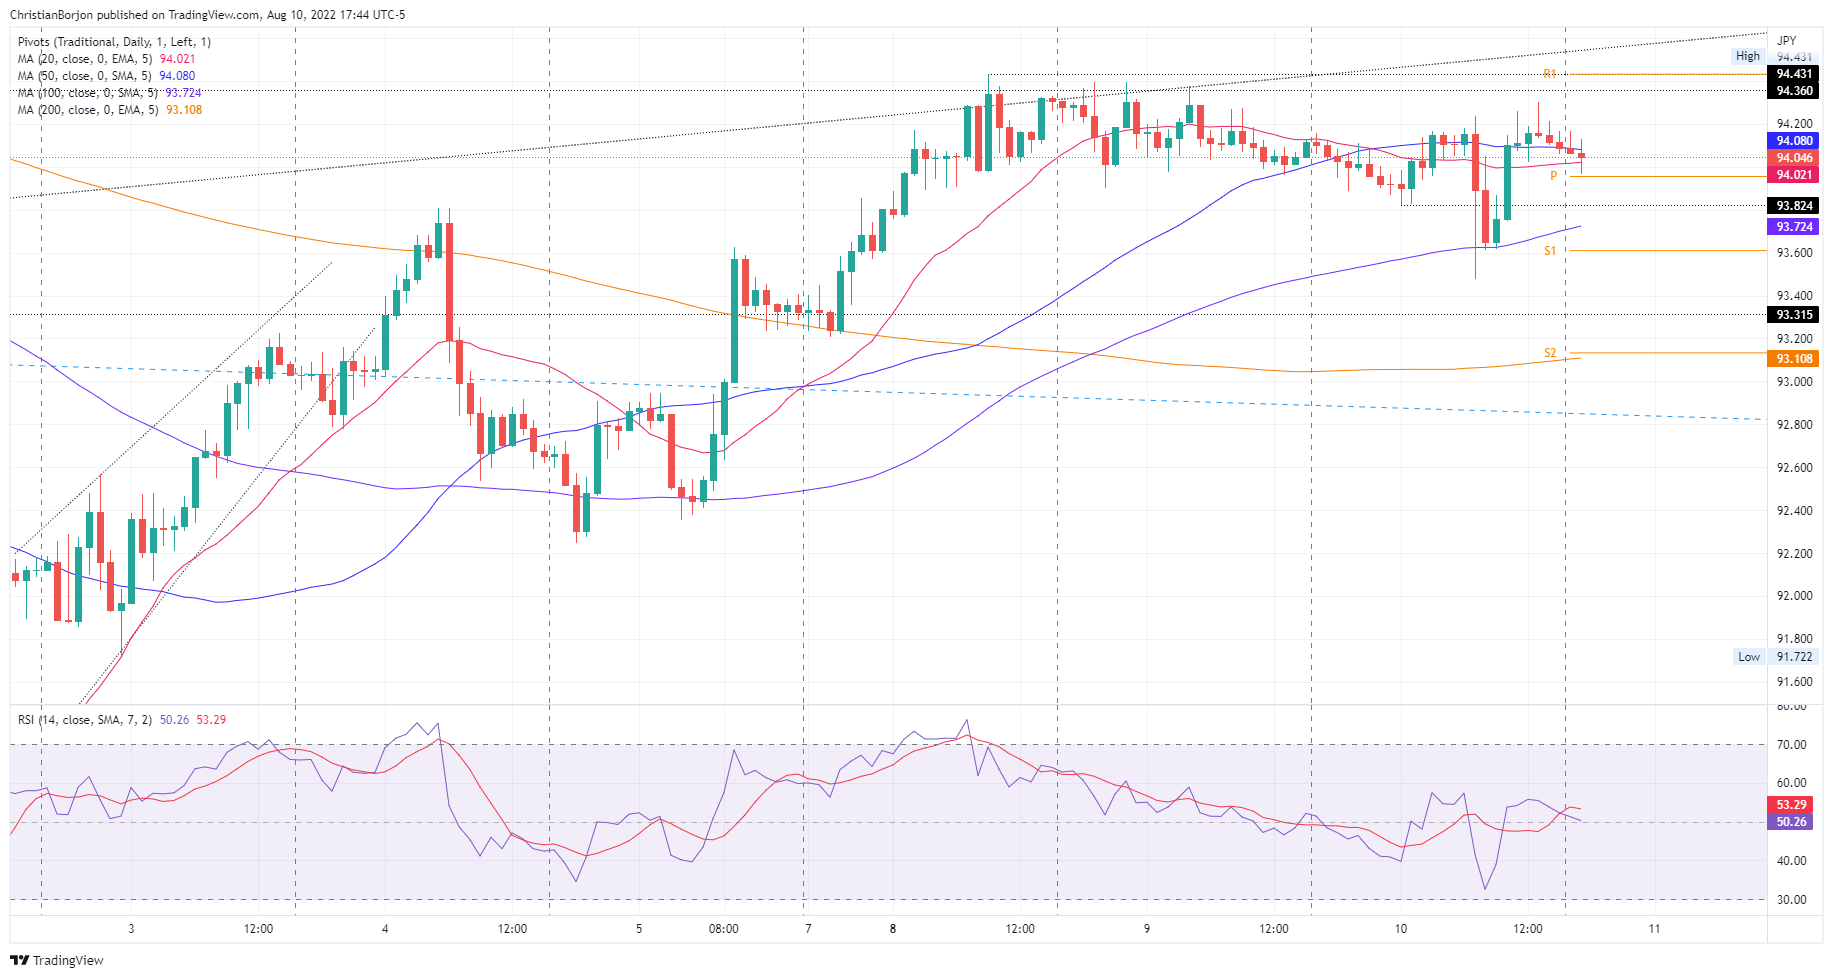 AUD/JPY Hourly chart
AUD/JPY Key Technical Levels
- EUR/USD retreats from five-week high of 1.0368, remains steady of late.
- US CPI tamed hawkish Fed expectations by easing below market forecasts, prior in July.
- Fed’s Kashkari backed recession fears, Biden teases Sino-American tussles.
- US PPI, Jobless Claims can entertain traders, risk catalysts are the key.
EUR/USD flirts with the 1.0300 threshold, after posting the biggest daily gains to refresh five-week high, as traders reassess the risk profile during early Thursday morning in Europe. The reduction in the US inflation numbers propelled hopes that the US Federal Reserve (Fed) could ease on its rate hike trajectory. However, recession fears and the Sino-American tussles, as well as the Fedspeak appeared to have poked the pair buyers of late.
As per the latest US inflation data, the US Consumer Price Index (CPI), declined to 8.5% on YoY in July versus 8.7% expected and 9.1% prior. The Core CPI, which excludes volatile food and energy prices, stayed unchanged at 5.9% YoY, compared to market consensus of 6.1%. On the other hand, Germany’s final readings of Harmonized Index of Consumer Prices (HICP) inflation gauge for July confirmed 8.5% YoY readings.
Following US inflation release, US President Joe Biden said on Wednesday that they are seeing some signs that inflation may be moderating, as reported by Reuters. "We could face additional headwinds in the months ahead," Biden added. "We still have work to do but we're on track," adds US President Biden.
It’s worth noting, however, that Minneapolis Fed President Neel Kashkari recently said that The Fed is "far, far away from declaring victory" on inflation. The policymaker also added that he hasn't "seen anything that changes" the need to raise the Fed's policy rate to 3.9% by year-end and to 4.4% by the end of 2023. Elsewhere, Chicago Fed President Charles Evans mentioned, “The economy is almost surely a little more fragile, but would take something adverse to trigger a recession.” Fed’s Evans also called inflation "unacceptably" high.
Elsewhere, the news that US President Biden rethinks steps on China tariffs in wake of Taiwan response, per Reuters, also seemed to have probed the pair buyers.
Amid these plays, Wall Street rallied but the US Treasury yields remained mostly unchanged by ending the day around 2.776%.
Moving on, the weekly readings of the US Jobless Claims and the monthly Producer Price Index (PPI) for July could entertain the EUR/USD traders. However, major attention should be given to the qualitative factors in the wake of recently risk-negative headlines.
Technical analysis
Despite the latest run-up EUR/USD remains below the downward sloping trend line from late March, around 1.0320, as well as the key resistance area near 1.0345-60, including the 50-DMA and lows marked in May and June. However, late July high near 1.0280 restricts short-term downside of the major currency pair.
- GBP/USD has picked bids around 1.2200 after a minor correction on the soaring market mood.
- Although the US inflation rate has been trimmed, the journey towards desired inflation is far from over.
- A downbeat consensus for UK GDP could conclude the run-up of pound bulls.
The GBP/USD pair has sensed buying interest after correcting to near the critical support of 1.2200. The asset is aiming to recapture its six-week high at 1.2293 as investors’ risk appetite has improved dramatically after a significant decline in the US inflation rate.
The release of the plain-vanilla US Consumer Price Index (CPI) at 8.5%, significantly lower than the forecasts of 8.7%, and the former figure of 9.1% has soared the market mood. The market participants were cautious as the Federal Reserve (Fed) was expected to remain harsh on interest rates after the release of the upbeat US Nonfarm Payrolls (NFP). Well, hawkish bets are still not down as the Fed has a long way to go to reach the desired inflation.
Also, comments from Neel Kashkari that “He is happier to see inflation surprised to the downside, the Fed is far far far away from declaring victory on inflation” confirms the continuation of a hawkish stance by the fed. Adding to that, Fed policymaker sees interest rates to 3.9% by the end of this year and at 4.4% by next year.
On the UK front, the pound bulls are awaiting the release of the Gross Domestic Product (GDP), which will release on Friday. As per the preliminary data, the UK economy has shrunk by 0.2% in this quarter vs. an expansion of 0.8% reported earlier. On an annual basis, the economic data is likely to drop to 2.8% from the former figure of 8.7%.
“China's war games around Taiwan have led Biden administration officials to recalibrate their thinking on whether to scrap some tariffs or potentially impose others on Beijing, setting those options aside for now, according to sources familiar with the deliberations,” said Reuters in late Wednesday.
Key quotes
President Joe Biden has not made a decision on the issue, officials said.
‘I think Taiwan has changed everything,’ said one source familiar with the latest developments in the process, details of which have not been previously reported.
The Biden administration's next steps could have a significant impact on hundreds of billions of dollars of trade between the world's two largest economies.
As US officials considered getting rid of some of the tariffs, they sought reciprocal rollbacks from Beijing and were rebuffed, two sources said.
One of the sources, who said a unilateral removal of some U.S. tariffs on Chinese imports has been put on hold, said this was done in part because China failed to show any willingness to take reciprocal actions or meet its "Phase 1" trade deal commitments.
Biden has been concerned about rolling back tariffs in part because of labor, which is a key constituency for him, and because of China's failure to buy the products it had agreed to purchase, according to the first source.
FX reactions
The news seemed to have probed the market’s optimism led by the downbeat US inflation data published for July, a few hours back. However, no major reaction could be witnessed.
Read: Forex Today: Dollar plunges on easing inflation
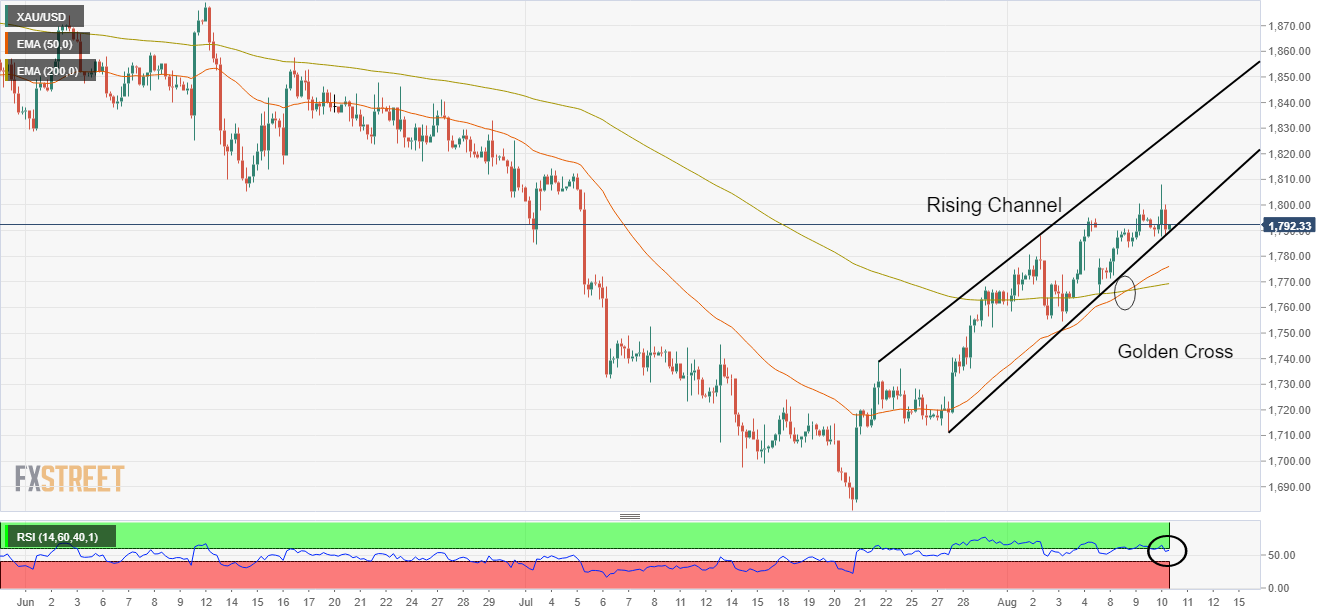
- Gold price is advancing towards $1,800.00 after a healthy correction.
- A risk-on impulse has infused fresh blood into the gold bulls.
- Lower-than-expected US CPI has trimmed extremely hawkish Fed bets.
Gold price (XAU/USD) has picked bids below $1,790.00 and is extending its recovery above the immediate hurdle of $1,792.00 amid a broader risk-on in the global market. The precious metal is expected to continue its upside run-up after a healthy correction to near $1,808.00 as the Federal Reserve (Fed) has got a sigh of relief after a downward shift in the US Consumer Price Index (CPI).
On Wednesday, the US Inflation landed at 8.5%, lower than the expectations of 8.7% and the prior release of 9.1%. Oil prices were vulnerable in July and they have been the real catalyst behind the soaring price pressures. Well, the downside pressure on the oil prices is temporary as the Russia-Ukraine war has made a serious dent in the oil supply for a prolonged period. And, the Fed needs a series of declines in the inflation rate to shift its stance to ‘neutral’.
Meanwhile, the US dollar index (DXY) is oscillating around 105.20, however, the downside remains favored as a lower inflation rate has trimmed the odds of an extremely ‘hawkish’ stance by Fed chair Jerome Powell in September monetary policy meeting.
Gold technical analysis
Gold price has sensed a decent buying interest after declining to near the lower portion of the Rising Channel at $1,788.00, formed on the four-hour scale. The upper portion of the above-mentioned chart pattern is placed from July 22 high at $1,739.37 while the lower portion is plotted from July 27 low at $1,711.55.
A golden cross, represented by the 50-and 200-period Exponential Moving Averages (EMAs) at $1,768.90 adds to the upside filters.
While the Relative Strength Index (RSI) has shifted into the 40.00-60.00 range pertaining to a mild correction. The gold bulls have lost the upside momentum for a while, however, the bullish bias is far from over.
Gold four-hour chart
- Silver price edged up 0.57% on Wednesday after US inflation eased from 4-decade highs.
- US inflation annually decelerated from above 9% as gasoline prices dropped.
- Fed’s Evans and Kashkari expect further rate hikes.
- Fed’s Kashkari foresees the Federal funds rate (FFR) at 4% by the end of 2022.
Silver price falters to rally on Wednesday after the US Department of Labor reported that inflation in the US lowered from 4-decade highs above the 9% threshold, which traders used as a reason to increase their bets on riskier assets. Consequently, US bond yields fell, which usually lifts precious metals prices, but not this time. At the time of writing, XAGUSD is trading at $20.63.
XAGUSD seesaws, failing to capitalize on US dollar weakness
US equities finished with hefty gains, between 1.6% and almost 3%, driven by US economic data. July’s inflation cooled down, as shown by the Consumer Price Index (CPI) dipping to 8.5% YoY, less than estimated and lower than June’s 9.1%. Excluding volatile items like food and energy, also called core CPI, increased by 5.9% YoY, aligned with the previous month’s figures, less than the 6.1% foreseen.
Investors reacted positively to the report, dumping the greenback, with the US Dollar Index sliding 1%, sitting at 105.234, while US bond yields fell.
Late during the day, Fed speakers led by Chicago Fed President Charles Evans and Minnesota Fed’s Neil Kashkari crossed newswires.
Evans said that albeit CPI data was the “first positive report,” inflation is unacceptably high. He added that he expects the Federal funds rate (FFR) to be at 3.25-3.50% by year’s end. He added that by the end of 2023, he foresees the FFR between 3.75-4.00%.
In the meantime, Minnesota Fed’s Kashkari said that although the CPI news was good, he said that the Fed is “far, far away from declaring victory.” He added that he hadn’t seen anything that changes the Fed’s path to 3.9% by year-end and the 4.4% by 2023. Kashkari also pushed back against the market’s rate cuts expectations early in the next year and said they are “not realistic.”
XAGUSD prices reacted downwards, with Kashkari remarks, sliding from around $20.90 to $20.51, while the US 10-year bond yield trimmed earlier losses and finished almost flat at 2.785%.
What to watch
Ahead in the week, the US economic calendar will feature prices paid by producers, also known as PPI, alongside Initial Jobless Claims on Thursday. By Friday, the University of Michigan’s Consumer Sentiment and Inflation Expectations.
Silver (XAGUSD) Key Technical Levels
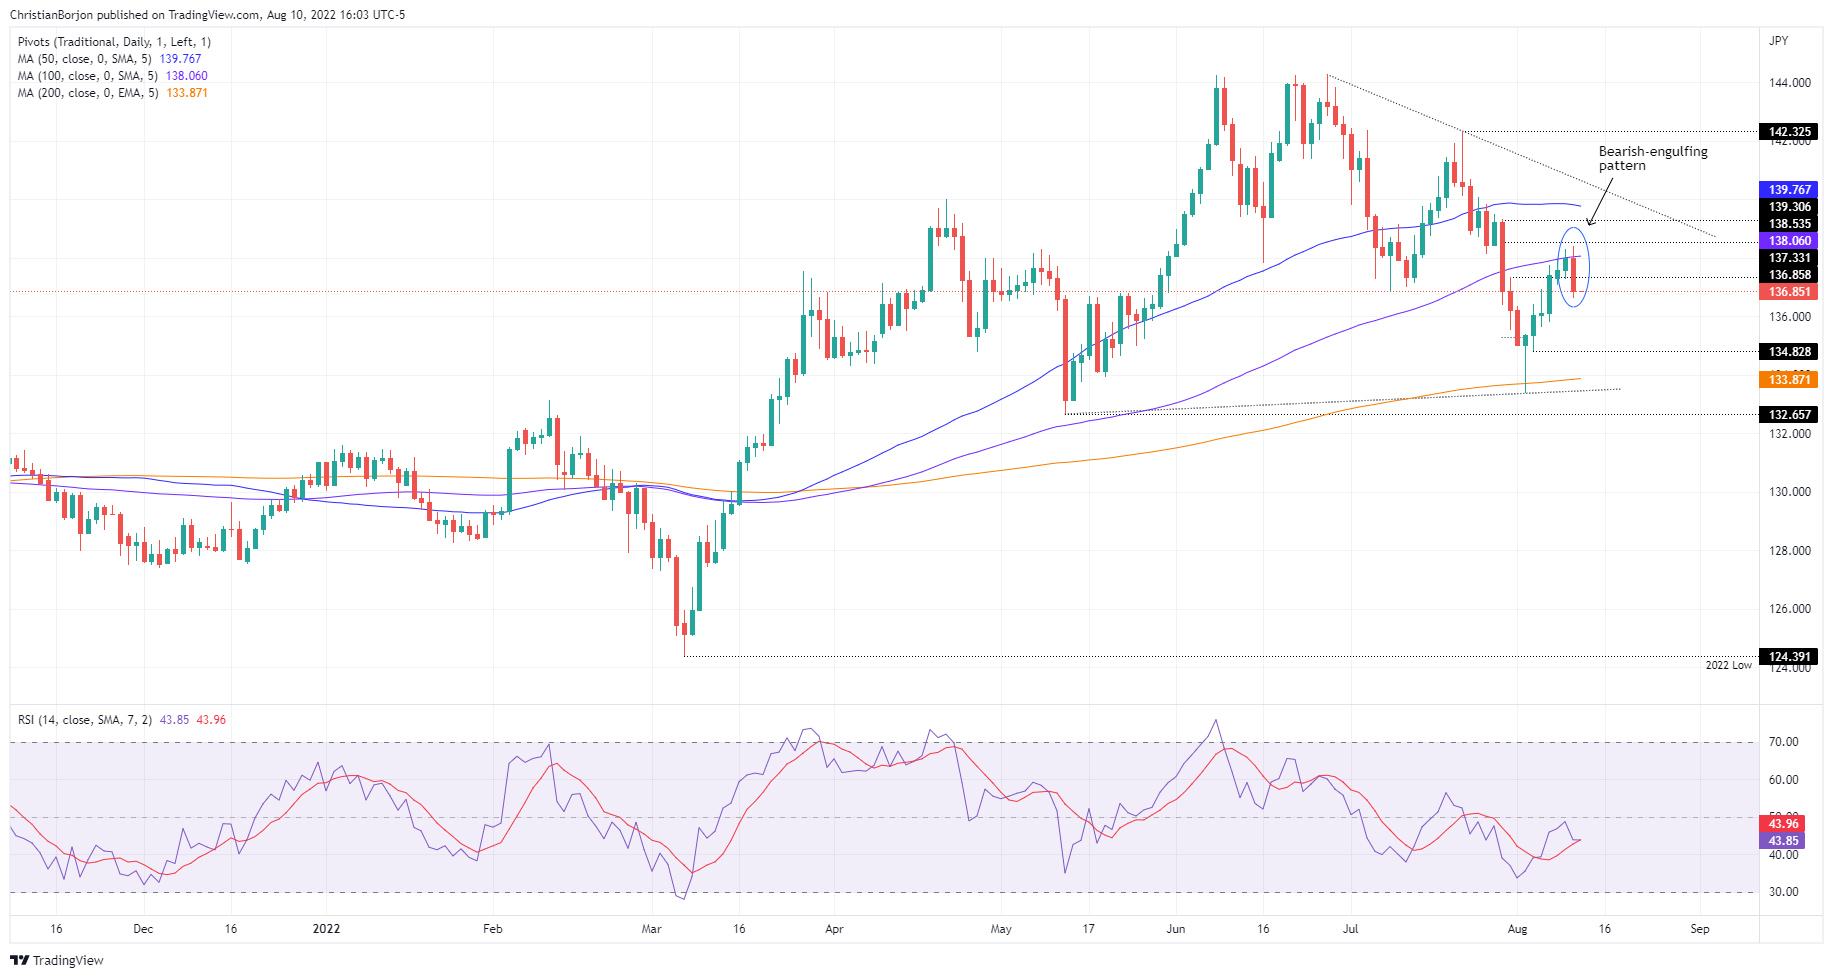
- EUR/JPY daily chart forms a bearish-engulfing candle pattern with bearish implications.
- In the short-term, the EUR/JPY might print a leg-up before extending the downtrend.
The EUR/JPY plunged on Wednesday due to a risk-on impulse spurred by US inflation data, which ticked lower, dissipating the Federal Reserve’s need for an aggressive tightening. The reaction was that the US 10-year bond yield retraced, dragging the USD/JPY. Hence, the EUR/JPY followed suit, diving more than 100 pips towards its daily low at 136.94. At the time of writing, the EUR/JPY is trading at 136.86, down 0.81%.
EUR/JPY Price Analysis: Technical outlook
From a daily chart perspective, the EUR/JPY is forming a bearish-engulfing candle pattern, meaning that sellers outweighed buyers. Additionally, the cross-currency tumbled below the 100-day EMA at 138.03 and, at the time of writing, is testing the August 4 high at 136.92, previous resistance-turned-support. If the latter is broken, that will keep sellers in the driver’s seat, paving the way for further losses.
 EUR/JPY Daily chart
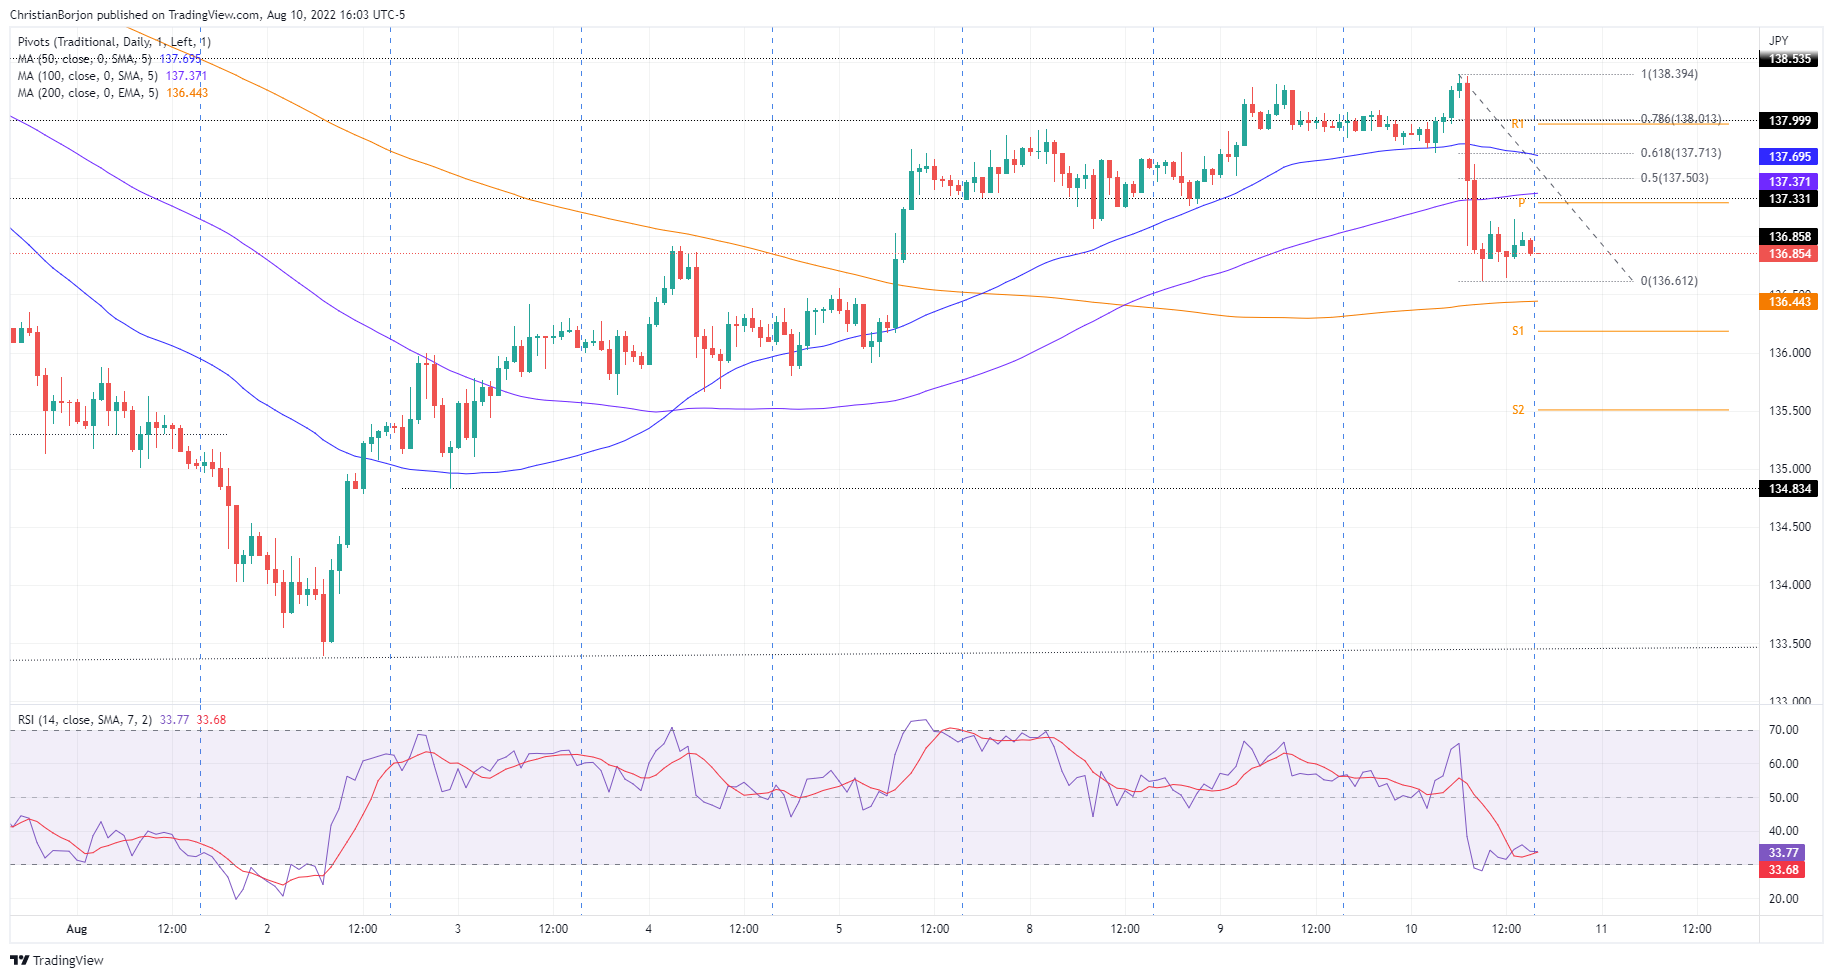
Short-term, the EUR/JPY hourly chart, illustrates the pair as neutral-upwards, but prices falling below the weekly opening price of 137.32, might pave the way for further losses. The downtrend seems to lose steam as the Relative Strength Index (RSI) entered oversold conditions, which means that the EUR/JPY might print a leg-up towards the 50% Fibonacci retracement at 137.50 before resuming the downtrend.
If the above scenario plays out, the EUR/JPY first support would be the 137.00 figure. Once cleared, the next support level will be the August 10 low at 136.61, followed by the 200-hour EMA at 136.44, before sliding to the psychological 136.00 figure.
 EUR/JPY Hourly chart
EUR/JPY Key Technical Levels
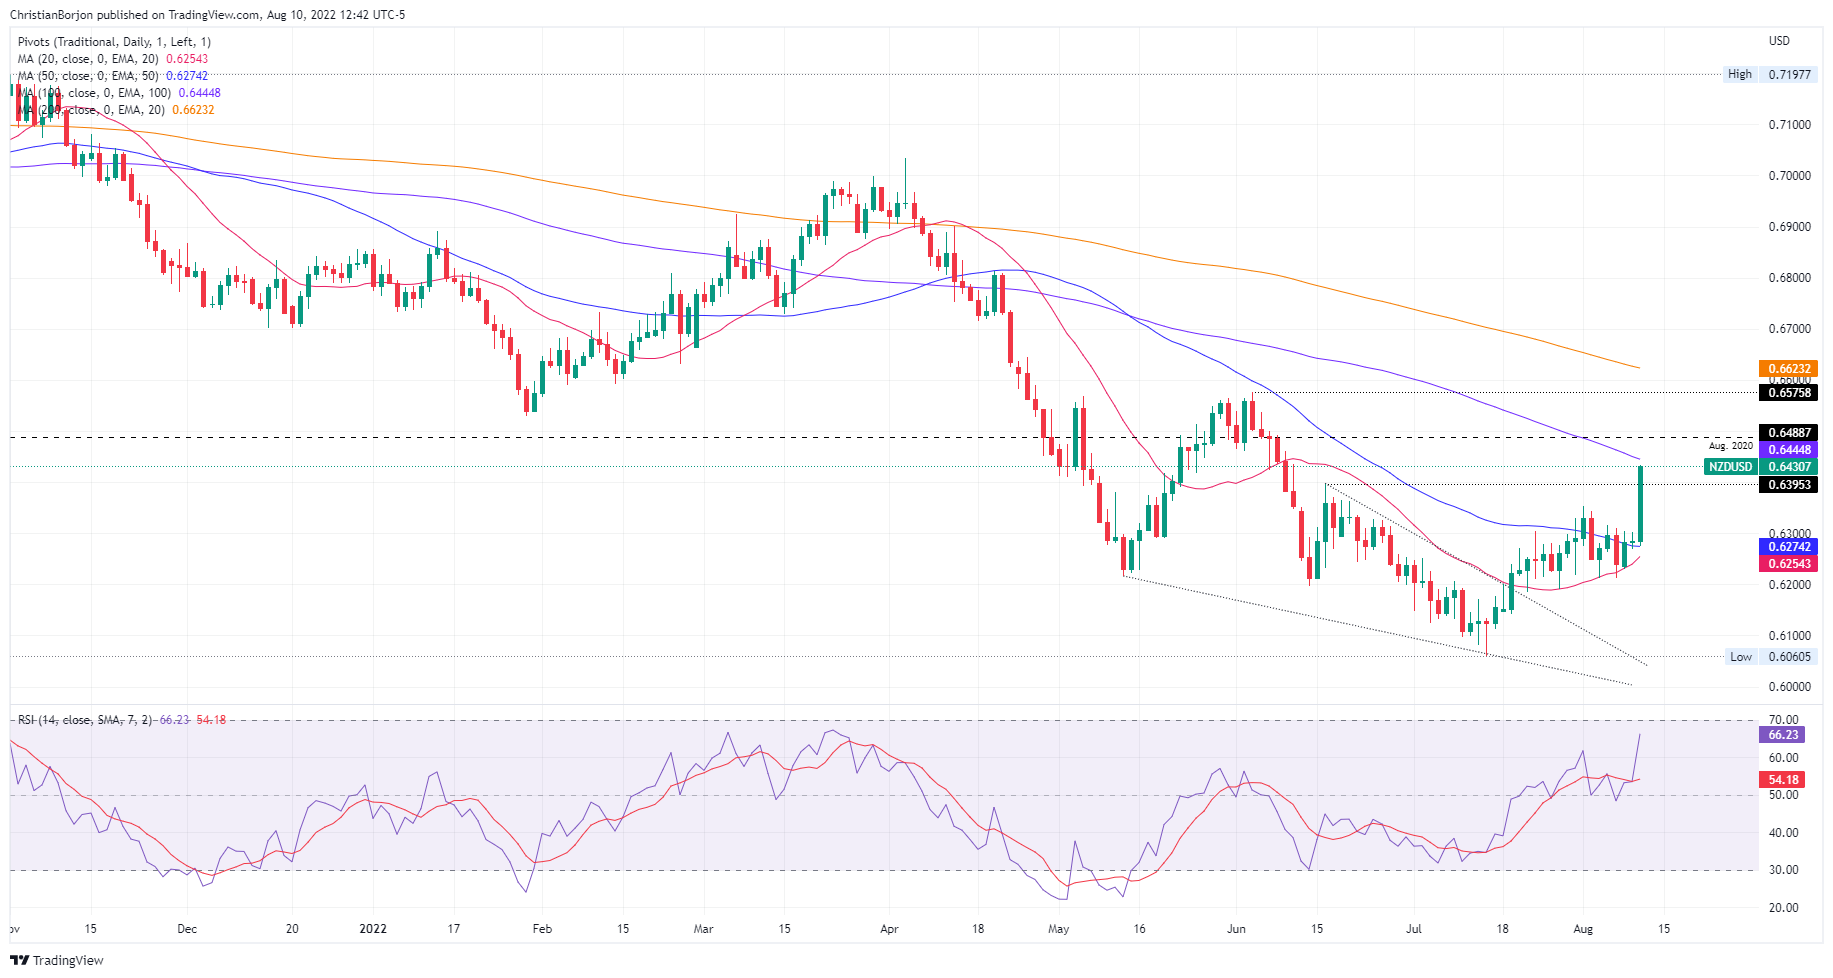
- NZD/USD rallied to fresh corrective highs on US CPI.
- The price is in no man's land at this juncture, a bearish correction, as per the W-formation on the daily chart, could be on the cards.
NZD/USD is 1.85% higher, rising from a low of 0.6275 on the day to reach a high of 0.6434. The bulls have taken the baton on the back of weakness in US yields and the greenback following the US inflation report. The kiwi is sporting a 0.64 handle for the first time since early June, but it is vulnerable to a correction as illustrated below.
Despite the prospects of a peak in US inflation, the market's broader sentiment is for the Fed to maintain its aggressive tightening bias in the months ahead. Nevertheless, US prices have risen 8.5% annually in July, a slower pace than the 9.1% rise reported in June and below analysts' consensus expectations for an 8.7% rise.
However, Federal Reserve's Neel Kashkari spoke after the data in late afternoon New York trade and has said that while he is happier to see inflation surprised to the downside, the Fed is far, far, far away from declaring victory on inflation. He added that ''this doesn't change my rate hike path'', and he is expecting 3.9% end of this year 4.4% end of next year.
''The Fed will be looking for "clear and convincing" evidence of inflation turning the corner, and we are not there yet,'' analysts at TD Securities argued. ''An epic collapse across USD pairs. The question is whether this will stick.''
While there are fewer possibilities of a 75bps hike in September with markets now in anticipation of just a 50bp rate hike instead, the Fed aims to reach a more restrictive policy posture before the end of the year and that would be expected to keep the greenback underpinned. This means, depending on data and other potential surprises, the kiwi will be vulnerable to ongoing strength in US yield and the US dollar.
''The first downside surprise in monthly headline inflation since September 2021 pushed investors to lower the odds of a 75bp hike in September from 85% to just 44% and the pricing for the terminal funds rate to 3.5% from nearly 3.7%,'' analysts at TD Securities noted. ''We expect market pricing for hikes to continue gyrating between extremes as investors digest more data ahead of the September FOMC. We think short-term price action will reflect risk sentiment,'' the analysts explained with respect to the values of the US dollar.''
Meanwhile, analysts at ANZ Bank noted that US bond yields had unwound most of their knee-jerk move lower. ''That leaves us a tad cautious, anticipating potential volatility. Still, the data has cleared the decks for the market to focus on the RBNZ MPS next week. We think it will be hawkish, and even if some of the dents is taken out of the USD in coming days, the RBNZ’s tone should help the NZD.''
NZD/USD technical analysis
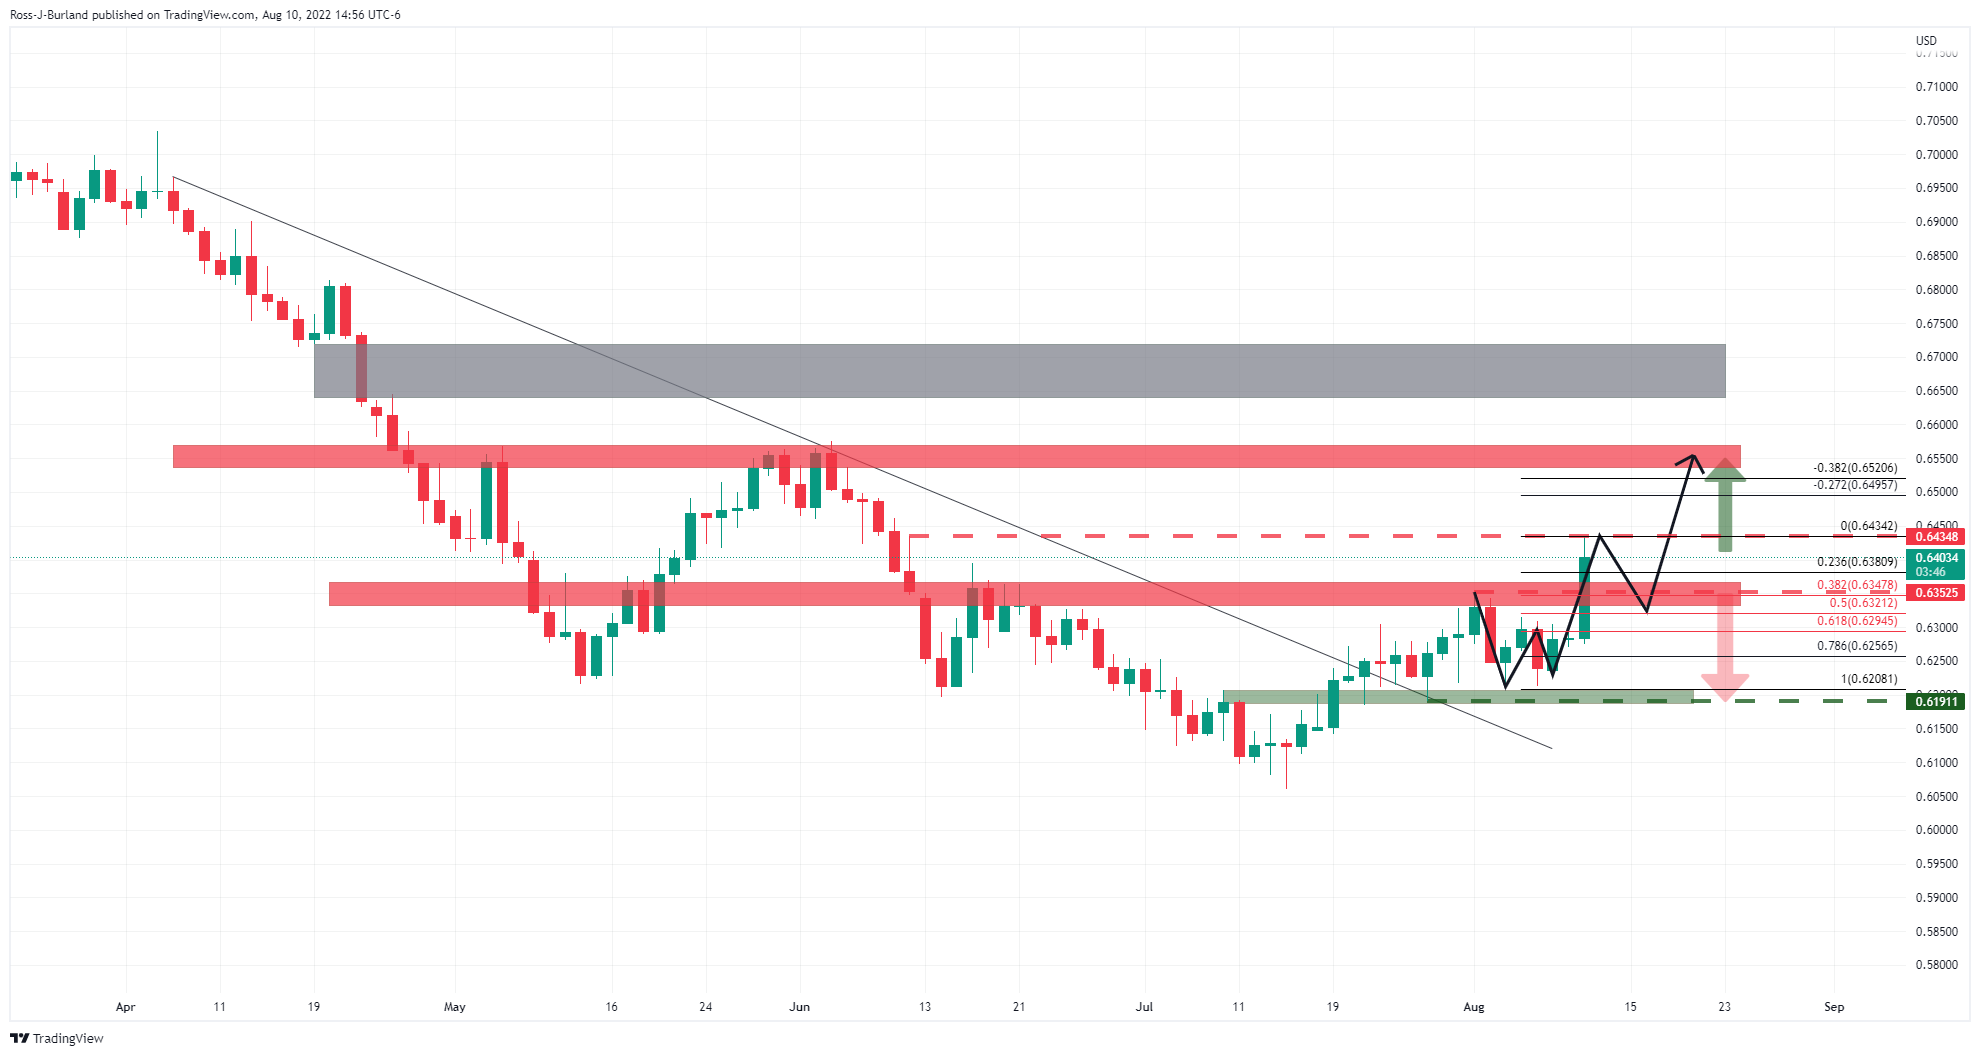
The price is in no man's land at this juncture, meeting resistance at a prior structure and could be due for a bearish correction, as per the W-formation on the daily chart. A 38.2% Fibonacci level meets prior resistance and below there we have the neckline of the formation at a 50% mean reversion.
- AUD/USD bulls are staying in control following CPI miss.
- There will be prospects of a correction so long as the Fed is seen to stay firm.
- The Aussie data to watch will be the employment report, 18 August.
AUD/USD remains firmly bid in the US session, but a touch below the impulse highs that were printed following a sell-off in the greenback on the back of the US inflation miss of expectations. AUD/USD shot to a high of 0.7109, extending its climb from the low of 0.6946.
The pair were stuck in the mud following the Chinese inflation data in the Asian session, hovering around 0.6950 and drifting higher into the European markets in anticipation of the US inflation data, tipped to come in below that of June's super high print.
China's July Consumer Price Index and Producer Price Index inflation came in lower than expected. CPI inflation increased to 2.7% YoY (cons. 2.9%, TD 3.0%, last 2.5%) while PPI inflation fell to 4.2% (TD and cons. 4.9% YoY, last 6.1%).
Indeed, the markets were positioned correctly into the data and the outcome sent the US dollar lower across the board. Risk rallied sharply, and for its high beat qualities, the antipodeans followed suit.
Prices rose 8.5% on an annualized basis in July, a slower pace than the 9.1% rise reported in June and below analysts' consensus expectations for an 8.7% rise. However, it is too soon to claim victory and there is a long way to go until the Federal Reserve's next meeting in September, which means potential speed bumps along the way for the Aussie.
In fact, Federal Reserve's Neel Kashkari has recently crossed the wires and has said that while he is happier to see inflation surprised to the downside, the Fed is far, far, far away from declaring victory on inflation. He added that ''this doesn't change my rate hike path'', and he is expecting 3.9% end of this year 4.4% end of next year.
''The Fed will be looking for "clear and convincing" evidence of inflation turning the corner, and we are not there yet,'' analysts at TD Securities argued. ''An epic collapse across USD pairs. The question is whether this will stick.'' Despite the prospects of peak inflation, the broader sentiment in the markets is for the Fed to maintain its aggressive tightening bias in the months ahead. There are fewer possibilities of a 75bps hike in September, however, with markets in anticipation of a 50bp rate hike instead but the pedal will be to the metal as the Fed aims to reach a more restrictive policy posture before the end of the year.
Aussie CPI and RBA implications
As for domestic inflation data, we have a long way until the Australian Bureau of Statistics (ABS) will publish a monthly CPI data series in October, likely on 26 October in tandem with the usual quarterly CPI release. Analysts at TD Securities said that they think it is likely that the trimmed mean measure (RBA's preferred core CPI indicator) will also be published alongside the headline CPI but will wait for more details from the information paper on the 16th of August.
''We think the release of a monthly CPI series should give the Reserve Bank of Australia more policy insights on the impact of its aggressive monetary policy tightening on inflation, and in turn greater clarity on the path of this rate hike cycle. From the last MPS, the Bank appears more comfortable about embracing the notion of slowing the pace of rate hikes and moderation in m/m inflation prints should give the Bank the confidence to dial back its hawkish stance.''
In other data that will be key for the Aussie, traders will need to wait for the July employment report on 18 August. However, in the meantime, recent commodity price support for the Aussie has been rather mixed.'Oil has been notably below the pre-Russia invasion of Ukraine levels, but more upbeat are metals prices. Iron ore was been rebounding over the week despite reports that China is downplaying its 2022 economic growth target, as noted by analysts at Westpac explained.
What you need to take care of on Thursday, August 11:
The greenback plummeted on the back of US inflation figures, ending the day in the red against all major rivals. The July Consumer Price Index contracted more than anticipated, down to 8.5% YoY from 9.1% in June. More relevantly, the core reading held steady at 5.9%, better than the uptick towards 6.1% anticipated.
Also, the Chinese Consumer Price Index rose by less than anticipated in July, up by 2.7% YoY from 2.5% in the previous month but below the 2.9% expected. In the same period, the Producer Price Index rose by 4.2%, well below the previous 6.1% and the expected 8%. Germany confirmed the July CPI at 7.5% YoY.
Stock markets soared with the news, as equities rallied on relief as easing US inflation should mean a less aggressive monetary tightening. Meanwhile, US government bond yields initially fell but quickly returned to pre-release levels, with the 10-year Treasury note currently yielding 2.78%.
US Federal Reserve officials hit the wires. On the one hand, Chicago Fed President Charles Evans said that he does not expect the Fed is finished with rate increases and that he expects the funds rate to top out at 4%. He also expects rates to rise this year and next. On the other, Minneapolis Fed President Neel Kashkari noted that the idea of cutting interest rates early next year is unrealistic but warned that the country may enter into a recession in the near future.
The EUR/USD pair topped at 1.0368 and is now battling to retain the 1.0300 threshold. GBP/USD trades around 1.2220. Commodity-linked currencies were among the best performers amid soaring equities, with AUD/USD at 0.7080 and USD/CAD down to 1.2780.
Safe-haven currencies also appreciated against the greenback, with USD/CHF now changing hands at 0.9426 and USD/JPY trading at 132.90.
Gold was the worst performer, ending the day in the red at $1,789.30 a troy ounce. Crude oil prices benefited from Wall Street’s strength and recovered early losses. The barrel of WTI is currently at $91.60.
Like this article? Help us with some feedback by answering this survey:
Top 3 Price Prediction Bitcoin, Ethereum, Ripple: How to trap a hungry bear
- The EUR/USD rises close to 1% after a lower-than-expected US inflation report.
- The shared currency failed to crack the 50-DMA early in the New York session.
- From a long-term perspective, the pair is neutral-to-downward, but the one-hour chart keeps buyers hopeful once they clear 1.0344.
The EUR/USD rallies towards the 50-day EMA, reaching a five-week high of around 1.0366, amidst an upbeat sentiment, courtesy of lower than estimated US inflation. That, alongside investors’ scaling back odd of a 75 bps rate hike by the Fed, spurred a risk on reaction, with US equities soaring. At the time of writing, the EUR/USD is trading at 1.0303. up by almost 1%.
EUR/USD Price Analysis: Technical outlook
From a daily chart perspective, the EUR/USD is still neutral to downward biased. However, buyers are gathering momentum, as shown by the Relative Strength Index, decisively breaking above the 50-midline for the first time since June 8, signaling buyers are stepping in. Nevertheless, sellers would get the upper hand until buyers reclaim the 50-day EMA at 1.0344.
In the one-hour time-frame, the EUR/USD rally appears to be losing steam, at the daily high at 1.0368, with the major retreating towards current price levels, at the R3 daily pivot. The fall might be attributed to the Relative Strength Index (RSI), which advanced sharply towards overbought territory at 87 before exiting and sits at 64 as buyers take a breather. Therefore, the pair is upward biased in the near term.
Upwards, the EUR/USD’s first resistance would be the August 10 high at 1.0368. Once cleared, the next supply zone would be the 1.0400 figure, followed by the July 4 daily high at 1.0445.
 EUR/USD Hourly chart
EUR/USD Key Technical Levels
- Gold is back under pressure following a relief rally to the weekly 61.8% Fibo.
- Bulls will be seeking space above $1,800 but the Fed is still a long way off from its target despite today's CPI miss of expectations.
At $1,791.43, gold is around 0.17% higher on the day. It has rallied from a low of $1,787.60 to a fresh bullish corrective high of $1,807.96. The gold price has shot up to finally move to the 61.8% golden ratio on the weekly chart following today's US inflation data that came in below expectations. The data has raised hopes that inflation may have seen a peak. Consequently, the US 10-Year Treasury yield dropped, as did the US dollar. In turn, gold bulls enjoyed the ride higher.
However, it is too soon to claim victory by the gold bugs for there is a long way to go until the Federal Reserve's next meeting in September, which means potential speed bumps along the way for gold.
''The Fed will be looking for "clear and convincing" evidence of inflation turning the corner, and we are not there yet,'' analysts at TD Securities argued. ''An epic collapse across USD pairs. The question is whether this will stick.''
Federal Reserve's Neel Kashkari has recently crossed the wires and has said that while he is happier to see inflation surprised to the downside, the Fed is far, far, far away from declaring victory on inflation. He added that ''this doesn't change my rate hike path'', and he is expecting 3.9% end of this year 4.4% end of next year.
Gold for December delivery was last seen down $2.5 to $1,809.90 per ounce, after rising to US$1,824.60 immediately following the release of US July inflation figures. The spot price is also giving back some ground as US yields recover as the market digest the inflation report. Prices rose 8.5% on an annualized basis in July, a slower pace than the 9.1% rise reported in June and below analysts' consensus expectations for an 8.7% rise.
Despite the prospects of peak inflation, the broader sentiment in the markets is for the Fed to maintain its aggressive tightening bias in the months ahead. There are fewer possibilities of a 75bps hike in September, however, with markets in anticipation of a 50bp rate hike instead but the pedal will be to the metal as the Fed aims to reach a more restrictive policy posture before the end of the year.
This means, depending on data and other potential surprises, the gold price will be vulnerable to ongoing strength in US yield and the US dollar.
''The first downside surprise in monthly headline inflation since September 2021 pushed investors to lower the odds of a 75bp hike in September from 85% to just 44% and the pricing for the terminal funds rate to 3.5% from nearly 3.7%,'' analysts at TD Securities noted.
''We expect market pricing for hikes to continue gyrating between extremes as investors digest more data ahead of the September FOMC.''
''We think short-term price action will reflect risk sentiment,'' the analysts explained with respect to the values of the US dollar.
Between now and the next meeting, there will be plenty of noise between Fed speakers and US data as well as global calendar events to keep the US dollar in tow.
Not only do we have another inflation reading but also the Jackson Hole Economic Symposium scheduled for August 25-27 will be keenly eyed. Fed Chairs often use this symposium in August to announce or hint at policy shifts ahead of the September FOMC meetings.
The analysts at BBH explained that ''by late August, we will have seen all the major July data and some of the early August surveys such as the preliminary S&P Global PMI readings and regional Fed surveys. The Fed will also have a good idea of how the economy is doing in Q3. That said, we do not think the Fed will make any major policy announcements or paint itself into a corner ahead of next month’s FOMC meeting.''
Gold technical analysis
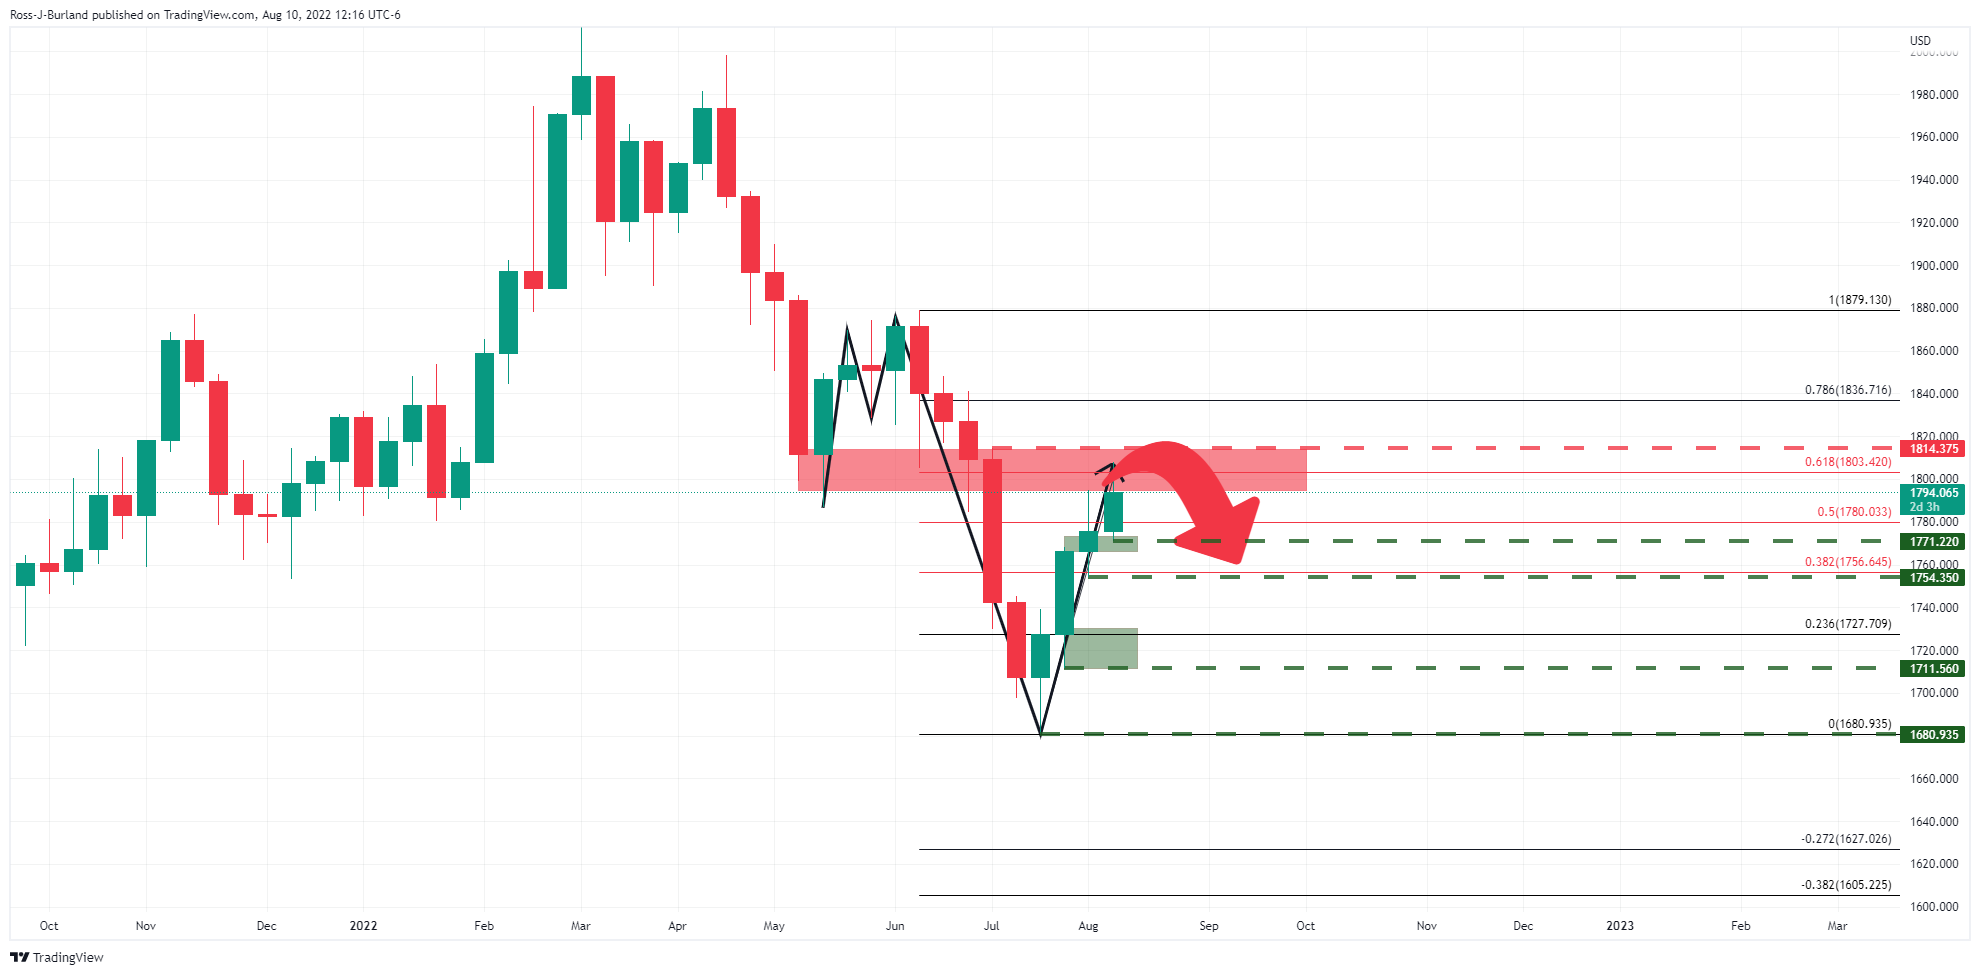
As illustrated, the price has run up to the 61.8% golden ratio where some profit taking would be expected to occur. A build-up of supply could pick up over the course of the coming days and weeks ahead resulting in a topping of this correction of the M-formation's bearish leg.
Federal Reserve's Neel Kashkari: said while he is happier to see inflation surprised to downside, the Fed is far far far away from declaring victory on inflation. He added that ''this doesn't change my rate hike path'', and he is expecting 3.9% end of this year 4.4% end of next year.
The idea of rate cutting next year is not realistic. he said the Fed will raise rates and leave until inflation is well on its way to 2%.
More to come...
- The NZD/USD is advancing more than 2% on Wednesday, courtesy of broad US dollar weakness.
- Investors’ mood shifted positively once US inflation cooled down, while traders expected a less aggressive US Fed.
- US headline inflation and core CPI were lower and aligned with estimations.
- Fed’s Evans expects the Federal funds rate (FFR) to finish around 3.25-3.50% in 2022.
The NZD/USD advances sharply following a better-than-expected US inflation report that showed prices are tempering, a signal for traders that the Federal Reserve might continue to tighten, but at a slower rhythm, even though CPI remains above 8% YoY.
The NZD/USD exchanges hands at 0.6430 after hitting a daily low at 0.6275 during the Asian session. However, the major skyrocketed on US economic data.
NZD/USD skyrockets on lower US inflation-data
The Bureau of Labor Statistics reported that inflation in the US moderated when it revealed its report. The US Consumer Price Index for July increased by 8.5%, lower than the 8.7% estimations. Meanwhile, the core CPI remained unchanged at 5.9% YoY.
Traders cheered the report, with flows flying away from safe-haven assets towards riskier ones. Wall Street record gains between 1.50% and 2.52%, while the greenback remains on the defensive.
The NZD/USD advanced sharply from its lows above the 50-day EMA, remaining shy of the 100-day EMA at 0.6444.
Elsewhere, the Chicago Fed President Charles Evans said that the CPI report is the “first positive,” while adding that inflation is unacceptably high. Evans said that the US Federal Reserve is “not done” with raising rates, and he would expect rates to finish around the 3.25-3.50% level by the end of 2022.
On the kiwi side, inflation expectations reached 3.07% on Monday, lower than the previous month’s reading at 3.29%, which could be considered that price pressures might be peaking, though that would not deter the RBNZ from hiking rates again.
Westpac analysts, in a note, commented that even with expectations lowering, they are forecasting an additional 50 bps rate increase to the Overnight Cash Rate at the next week’s RBNZ policy meeting.
What to watch
The US economic docket will feature Minnesota Fed President Neil Kashkari on Wednesday. By Thursday, the calendar will unveil prices paid by producers, also known as PPI and Initial Jobless Claims.
NZD/USD Price Analysis: Technical outlook
The NZD/USD is neutral biased, despite Wednesday’s price action posing a threat for NZD/USD sellers. If buyers like to regain control, they would need a decisive break above the 100-day EMA, which could put into play a test of the June 3 high at 0.6576, almost 40 pips below the 200-day EMA. Once that is achieved, then the major bias would shift to neutral-upwards. Nevertheless, sellers remain hopeful that if the NZD/USD prints a daily close below 0.6400, that would put them in charge.
 NZD/USD Daily chart
According to the Federal Reserve Bank of Atlanta's GDPNow model, the US economy is expected to grow at an annualized rate of 2.5% in the third quarter, up from 1% in the previous estimate.
"After recent releases from the US Bureau of Labor Statistics and the US Census Bureau, the nowcast of third-quarter real personal consumption expenditures growth, third-quarter real gross private domestic investment growth, and third-quarter real government spending growth increased from 1.8% to 2.7%, -0.3% to 0.2%, and 1.4% to 1.7%, respectively, while the nowcast of the contribution of the change in real net exports to third-quarter real GDP growth decreased from 0.35 percentage points to 0.30 percentage points," Atlanta Fed explained in its publication.
Market reaction
The US Dollar Index showed no immediate reaction to this report and was last seen losing 1.2% on the day at 105.00.
Bank of England Chief Economist Huw Pill said on Wednesday that wage growth in the UK is running too fast at present, as reported by Reuters.
Pill further noted that the companies' pricing pass-through was excessively high. "I don't want people who are subject to political forces setting monetary policy," Pill added.
Market reaction
These comments don't seem to be having a noticeable impact on the British pound's performance against its major rivals. As of writing, the GBP/USD pair was trading at 1.2235, where it was up 1.3% on a daily basis.
- The USD/CHF is recording its biggest daily fall since June 15, down 1.16%.
- The pair refreshes multi-month lows, just below the 0.9400 figure.
- US headline inflation eases to 8.5% YoY, but the core remains unchanged.
- Fed’s Evans: The Fed is not done hiking rates; expect the Fed funds to be at 3.25-3.50% by year-end.
The USD/CHF plunges in the North American session after the US Department of Labor reported that inflation in the US increased at a slower pace, which could deter the US Federal Reserve from tightening aggressively. Additionally, tensions between Taiwan and China seem to ease, exacerbating a positive mood.
At the time of writing, the USD/CHF is trading at 0.9413 after hitting a daily high in the early Asian session at 0.9542. However, upbeat US economic data tripped down the major, which dived to a multi-month low at 0.9393, before bouncing towards current prices.
US inflation drops from 9.1% YoY in June to 8.5%
The US inflation report showed that July’s Consumer Price Index, annually based, increased by 8.5%, less than estimations of an 8.7% uptick. Meanwhile, excluding volatile items like food and energy, the so-called core-CPI rose 5.9% YoY, unchanged compared to June and less than forecasts. The fall is due to gasoline prices a $1 less than in June, offsetting increases in food and shelter.
Investors reacted with a sign of relief, sending US equity markets rallying, between 1.90% and 2.60%, while the greenback fell. The US Dollar Index, a measure of the buck’s values vs. a basket of peers, is losing 1.27%, tumbling below the 105.00 mark. US bond yields in the short-end maturity are dropping, while the 20s and 30s are up.
The USD/CHF immediately reacted to the downside, breaking on its way south, the 200-day EMA at 0.9424, exacerbating a push below the 0.9400 figure. Nevertheless, in the last hour, the major recovered some ground, and once the dust settled, buyers reclaimed the latter.
Late during the session, the Chicago Fed President Charles Evans crossed newswires. Even though the CPI is the “first positive report,” inflation is unacceptably high. He added that the Fed is not done hiking rates, and he expects the Federal funds rate (FFR) to be at 3.25-3.50% by year’s end. He added that by the end of 2023, he foresees the FFR between 3.75-4.00%.
What to watch
The US economic docket will feature Minnesota Fed President Neil Kashkari on Wednesday. By Thursday, the calendar will unveil prices paid by producers, also known as PPI and Initial Jobless Claims.
USD/CHF Key Technical Levels
Despite the broad-based slide of the US dollar on Wednesday following the US CPI, analysts at Rabobank still see the GBP/USD vulnerable to the downside and warn it could drop back again under 1.20 on a one to three-month view.
Key Quotes:
“Last week the market was taken by surprise by the candid tone adopted by the BoE in its warnings about the UK economic outlook. The Bank forecast that the economy would fall into a 15 month recession starting in Q4 this year and that GDP would drop a little over 2 ppt from peak to trough in a downturn similar to the one experienced in the early 1990s. While it was a surprise to hear the Bank speak in such frank terms, the fact that the UK growth outlook is poor was not a total shock.”
“Although fresh UK economic data has been limited so far this week, there has been plenty of evidence illustrating the precarious position of the UK economy. Bloomberg news is reporting that the UK government is preparing for the possibility of energy blackouts in the forthcoming winter. Additionally, estimates are circulating that average household annual energy bills could rise to over £4000 in the new year. Since the average salary for full-time UK workers is around £38,400, this could have a devasting impact on consumer demand.”
“The USD has softened in the wake of today’s US CPI inflation report. However, we retain the view that the pound remains vulnerable vs. the USD and see risk of another break below the 1.20 level on a 1 to 3 month view. In our view, GBP has a better chance of holding its ground vs. the EUR into the winter, given the energy crisis currently facing the Eurozone.”
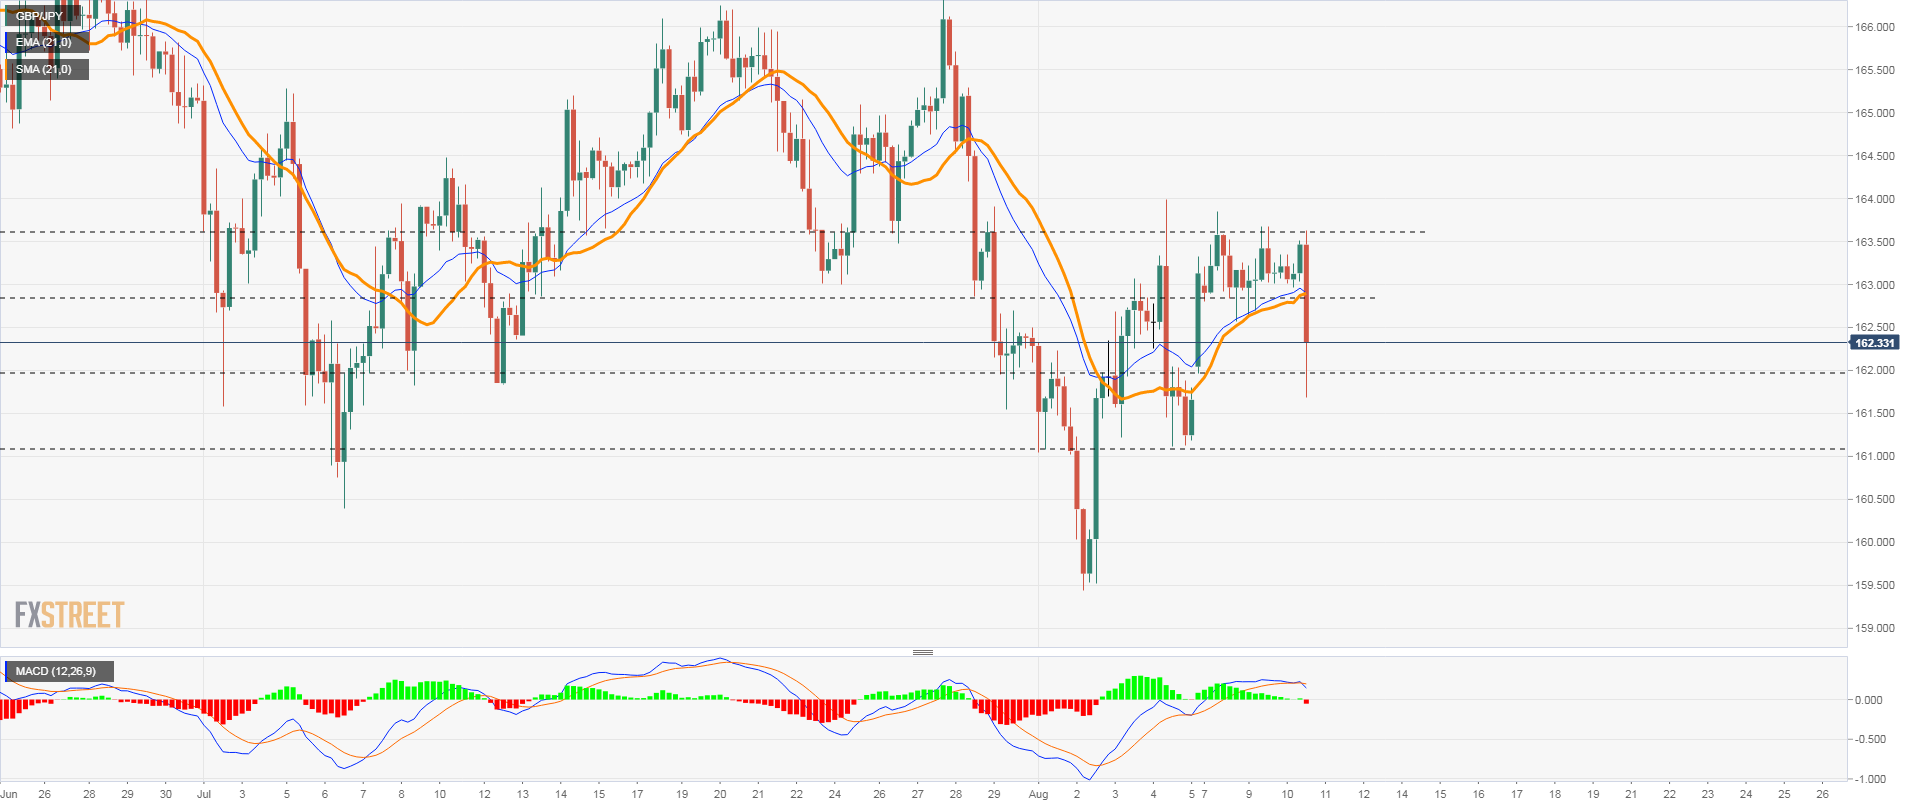
- Japanese yen soars across the board after economic data.
- July US CPI rises below expectations triggering a rally in Treasuries.
- GBP/JPY trims losses after falling to as low as 161.67, the lowest since August 5.
The GBP/JPY cross lost almost 200 pips following the release of US inflation data that triggered a rally of the Japanese yen across the board. It bottomed at 161.67 and then rebounded back above 162.00.
US CPI ends a quiet period
The annual US CPI rate dropped from 9.1% to 8.5% in July, against the market consensus of 8.7%. The numbers triggered a rally in US stocks and bonds. Expectations still point to more tightening from the Federal Reserve but the doors are open to less aggressive action. Still, market participants see a rate hike of at least 50 basis points at the next meeting.
The improvement in risk appetite failed to boost GBP/JPY that pulled back amid lower yields and despite the rally of GBP/USD above 1.2200.
The GBP/JPY cross was testing the key resistance around 163.60 before the report. In the move lower, it broke 162.80 which is now the immediate resistance.
Technical indicators favor the downside in the short term. A recovery above 162.80 would put the pound back on its way for another test of 163.80. While under 162.80, the crucial area on the downside is 162.00; a break lower would expose the next support zone at 161.10.
GBP/JPY 4-hour chart
Chicago Fed President Charles Evans said on Wednesday that he does not expect that the Fed is finished with rate increases, as reported by Reuters.
Additional takeaways
"At the end of this year, I expect fed funds to be 3.25%-3.5%."
"I expect by end of next year rates will be 3.75%-4%."
"I expect fed funds rate to top out at 4%."
"We are in a good place on rates, can pivot to be more restrictive if needed, or not raise rates as much."
"We are well positioned for turns in the data over the next couple of months."
"It will be challenging to get inflation down."
Market reaction
The dollar stays on the back foot and the US Dollar Index was last seen losing 1.25% on a daily basis at 105.00.
Chicago Fed President Charles Evans acknowledged on Wednesday that the latest CPI data was the first positive inflation report but noted that inflation was still unacceptably high, as reported by Reuters.
Additional takeaways
"US labor market is vibrant."
"Employment is so strong, a sign of a still-strong economy."
"Optimistic economy will continue to grow in the second half of the year."
"I expect we will increase rates this year and next year."
"It's an optimistic forecasting that next year core PCE inflation will be closer to 2.5%."
"I'm not looking for the economy to turn down in a significant fashion any time soon."
"The economy is almost surely a little more fragile, but would take something adverse to trigger a recession."
"I expect economic growth next year to be 1.5% -2%."
"Quite possible we will be able to tighten monetary policy enough to bring inflation down and unemployment will only rise toward 4.25%."
Market reaction
These comments failed to help the dollar stage a rebound and the US Dollar Index was last seen losing 1.4% on the day at 104.80.
The US Consumer Price Index surprised to the downside in July, showed data released on Wednesday. Analysts at Wells Fargo point out that falling prices for gasoline, used autos and travel service categories such as airline fares, car rentals and lodging away from home helped cool monthly inflation from the torrid pace seen in May and June. They consider it will take several more soft inflation prints before the FOMC begins to feel confident that it is getting price pressures in check. They expect at least a 50 bps rate hike at the September meeting.
Key Quotes:
“CPI inflation in July cooled from the scorching hot pace seen in May and June. Consumer prices were unchanged in July, the smallest month-over-month change since May 2020. On a year-ago basis, prices were up 8.5%, down from the 9.1% year-over-year pace registered in June. Falling gasoline prices were a major contributor to the slowdown in price growth. Motor fuel prices were down 7.6% in July on a seasonally adjusted basis.”
“Through the first half of August there has been some additional relief at the pump, and we would not be surprised to see another sizable decline in motor fuel prices in next month's CPI release. Energy services inflation also eased to just 0.1% from 3.0% and 3.5% in May and June, respectively, as natural gas prices receded in early July.”
“It is important to remember that this is just one data point, and the past couple CPI reports have included significant upside surprises. In addition, there have been head fakes in the inflation data before, and we highly doubt the FOMC is ready to declare victory over inflation after just one softer-than-expected CPI report. Core CPI is still up 5.9% year-over-year and has grown at a 6.8% annualized pace over the past three months. The next CPI report will be released on September 13, just one week before the next FOMC meeting. A 75 bps rate hike at that meeting remains our base case, but the FOMC could go "just" 50 bps if that report provides additional evidence that inflation is slowing on a sustained basis.”
- USD/CAD plummets after hitting a daily high near the 1.2900 mark.
- July’s US Consumer Price Index (CPI) slows to 0% MoM.
- Despite US inflation data, ING Analysts expect the Fed to hike 75 bps in September.
- Fed’s Evans and Kashkari will cross wires late during the day.
The USD/CAD nosedives after a softer than estimated US inflation report, used by investors as an excuse to shift towards riskier assets, awaiting Fed policymakers which could pave the way towards the FOMC September monetary policy meeting. Consequently, mood improved, additionally spurred by China-Taiwan tussles tempering as the former announced the end of its military drills, but it will continue patrolling the Taiwan strait.
The USD/CAD is trading at 1.2762 after hitting a daily high at 1.2895, but better-than-expected US inflation data sent the dollar tumbling close to 1.50%, with the US Dollar Index dropping from 106.403 to 104.840.
USD/CAD sinks as US inflation eases
Before Wall Street opened, the Labor Department reported that US inflation in July rose by 8.5% YoY, less than the 9.1% in June and lower than the 8.7% estimate. Excluding volatile items like food and gas, it increased by 5.9%, less than forecasts, and aligned with June’s reading.
According to ING analysts, the report provides the “notion” that US headline inflation peaked, with gasoline prices down $1 a gallon from their highest in June. “We are forecasting the YoY rate dropping to 8.3%.” They added that core inflation would likely remain on its “upward trajectory” due to higher rental costs, services sector inflation pressures, and wages.
Analysts added, “we don’t see core inflation peaking until around September/October time with the core rate up at around 6.5% YoY by then.” Furthermore, they commented that they expect the Fed to tighten 75 bps.
The reasoning is that “…inflation remains far from the target, the economy added more than half a million jobs last month, and third-quarter GDP is set to rebound based on consumer movement data. Add to all that a positive contribution from net trade and a less negative drag from inventories then the case for a third consecutive 75bp Federal Reserve rate hike in September remains strong.”
In the meantime, the USD/CAD reacted downwards, plunging below 1.2800, further extending its losses, despite falling crude oil prices and the lack of Canadian economic data to be reported.
What to watch
An absent Canadian economic calendar would leave USD/CAD leaning on US data. The US docket will feature the Producer Price Index (PPI9 for July, alongside Initial Jobless Claims.
USD/CAD Price Analysis: Technical outlook
The USD/CAD extended its losses beyond the 20, 50, and 100-day EMAs, eyeing the 200-day EMA at 1.2739. Further accelerating its fall is the Relative Strength Index, crossing below the 50-midline and dropping under 42 readings, with some room to spare, before hitting oversold conditions. However, a break below the 200-DMA will expose the 1.2700 figure, followed by the June 10 daily low at 1.2680.
- US dollar tumbles across the board, on the worst day in months.
- Inflation numbers trigger a rally in Treasuries.
- USD/JPY looks for another test at the 100-day SMA.
The USD/JPY collapse following the release of US inflation data. The numbers triggered a sell-off of the US Dollar across the board pushing the pair toward 132.00
Before the release of the US CPI, USD/JPY was trading near 135.00. Recently it bottomed at 132.00. The pair is back into negative territory for August. Below 132.00 attention would turn to the 100-day Simple Moving Average at 131.05/10. The mentioned SMA capped the downside a week ago.
The move lower took place amid a broad-based decline of the dollar that is still going on. The DXY is falling more than 1.50%, as it trades under 104.70. The US 10-year yield is at 2.74%, after bottoming at 2.67%.
Lower yields, risk appetite and expectations of a less aggressive Federal Reserve weighed on the USD/JPY. The annual US CPI rate dropped from 9.1% to 8.5%, against the market consensus of 8.7%. Analysts at Commerzbank, point out that inflation has probably passed its peak. “However, the collapse in the price of gasoline played a decisive role. The further decline in the inflation rate is therefore likely to be slow.”
Market participants still see the Fed raising rates at the next meeting which will be in September. Before the meeting, August inflation data will be published.
US Inflation Analysis: It is peak inflation only until the Fed's verdict, stock rally at risk
Technical levels
A downside surprise in Consumer Price Index (CPI) data has triggered an epic collapse across USD pairs. The question is whether this will stick. Economists at TD Securities have some reservations about that but nonetheless think short-term price action will reflect risk sentiment.
USD/CAD will find demand on dips
“While the initial knee-jerk reaction is for risk assets to celebrate, we are cautious in extrapolating continued optimism. We are concerned that the fall period will present new risks on the geopolitical front, especially with the US midterms on the horizon.”
“It remains premature to be strategically long EUR and spot very important fundamental resistance below 1.04.”
“We expect USD/JPY to reflect a broad 130/135 range.”
“We think USD/CAD dips will find demand as we near peak BoC hawkishness as housing dynamics worsen.”
US President Joe Biden said on Wednesday that they are seeing some signs that inflation may be moderating, as reported by Reuters.
"We could face additional headwinds in the months ahead," Biden added. "We still have work to do but we're on track."
Earlier in the day, the data published by the US Bureau of Labor Statistics showed that the annual Consumer Price Index (CPI) declined to 8.5% in July from 9.1% in June.
Market reaction
The greenback struggles to find demand following soft inflation data and the US Dollar Index was last seen losing 1.2% on a daily basis at 105.00.
- The index loses further momentum and breaches 105.00.
- US Headline CPI came below estimates in July.
- The probability of a 75 bps hike dwindled after the data.
The greenback collapsed to multi-week lows in the sub-105.00 region when measured by the US Dollar Index (DXY) on Wednesday.
US Dollar Index plummeted after CPI prints
The index depreciated rapidly after US inflation figures showed the headline CPI rose less than initially expected in July. Indeed, consumer prices rose 8.5% and 5.9% when it comes to the core reading, both prints slowing the upside traction from the previous month.
The perception that inflation pressures might be at or near their peak seems to have prompted investors to re-price the possibility of a large rate hike (75 bps) at the next FOMC event in September. This view was also reflected in the marked correction lower in US yields across the curve, which in turn added to the buck’s daily decline.
Supporting the above, CME Group’s FedWatch Tool now shows the probability of a 75 bps rate hike in September is at nearly 39% from around 70% prior to the CPI release.
Extra data in the US calendar saw MBA Mortgage Applications expand 0.2% in the week to August 5 and Wholesale Inventories expand 1.8% in June vs. the previous month.
What to look for around USD
The index suddenly came under extra pressure and trades in the 105.00 zone, as market participants continue to assess the recent publication of US inflation figures.
The dollar, in the meantime, is poised to suffer some extra volatility amidst investors’ repricing of the next move by the Federal Reserve.
Looking at the macro scenario, the dollar appears propped up by the Fed’s divergence vs. most of its G10 peers (especially the ECB) in combination with bouts of geopolitical effervescence and occasional re-emergence of risk aversion.
Key events in the US this week: MBA Mortgage Applications, Inflation Rate, Wholesale Inventories (Wednesday) Initial Claims, Producer Prices (Thursday) – Flash Consumer Sentiment (Friday).
Eminent issues on the back boiler: Hard/soft/softish? landing of the US economy. Escalating geopolitical effervescence vs. Russia and China. Fed’s more aggressive rate path this year and 2023. US-China trade conflict. Future of Biden’s Build Back Better plan.
US Dollar Index relevant levels
Now, the index is losing 1.13% at 105.09 and a breach of 104.94 (monthly low August 10) would expose 103.67 (weekly low June 27) and finally 103.52 (100-day SMA). On the upside, a breakout of 107.42 (weekly high post-FOMC July 27) would expose 109.29 (2022 high July 15) and then 109.77 (monthly high September 2002).
- AUD/USD catches aggressive bids amid softer US CPI-inspired broad-based USD selloff.
- The weaker data smashes expectations for a larger Fed rate hike and weighs on the USD.
- The risk-on impulse further undermines the buck and benefits the risk-sensitive aussie.
The AUD/USD pair rallies to its highest level since June 16 in reaction to softer US consumer inflation figures and now seems to have stabilized around the 0.7055-0.7060 region.
The US dollar witnesses a broad-based selloff and plunges to a five-week low during the early North American session, which, in turn, provides a strong lift to the AUD/USD pair. The intraday USD slump follows the release of the US CPI report, which pointed to easing inflationary pressures. The markets react quickly and push back expectations for a more aggressive policy tightening by the Fed.
In fact, the odds for a 75 bps Fed rate hike in September tumble to 35% from 80% pre-CPI and trigger a steep decline in the US Treasury bond yields, which, in turn, weigh heavily on the USD. Apart from this, a fresh wave of the global risk-on rally - as depicted by bullish sentiment around the equity markets - further undermines the safe-haven buck and benefits the risk-sensitive aussie.
This, along with technical buying above the 0.7000 psychological mark, further contributed to the strong bid tone surrounding the AUD/USD pair. A subsequent move beyond the previous monthly swing high, around the 0.7045 region, might have already set the stage for additional gains. That said, overbought RSI on hourly charts is holding back bulls from placing fresh bets, at least for now.
Nevertheless, the AUD/USD pair now seems poised to prolong the upward trajectory and aim to reclaim the 0.7100 round-figure mark. Some follow-through buying beyond the said handle should pave the way for a move towards challenging the very important 200-day SMA, currently around mid-0.7100s. The latter could keep a lid on any further gains for spot prices and act as a pivotal point for traders.
Technical levels to watch
- Gold catches aggressive bids in the last hour and jumps to a fresh multi-week high.
- The post-US CPI broad-based USD selloff provides a goodish lift to the commodity.
- Diminishing odds for a larger Fed rate hike in September further benefits the metal.
- The risk-on impulse caps the safe-haven XAU/USD and warrants caution for bulls.
Gold turns positive for the third successive day on Wednesday and jumps to a fresh six-week high, around the $1,808 region during the early North American session.
The US dollar weakens across the board, plunging to its lowest level since July 4 in reaction to softer US consumer inflation figures. This turns out to be a key factor pushing the dollar-denominated gold higher for the third successive day on Wednesday. The Bureau of Labour Statistics reported that the headline US CPI remained flat in July against expectations for a modest 0.2% rise and 1.3% in the previous month.
Adding to this, the yearly rate decelerated more than anticipated, to 8.5% in July from the 9.1% previous. Furthermore, the core CPI, which excludes volatile food and energy prices, held steady at 5.9% YoY, missing the forecast for a 6.1% increase. The data suggests that US inflation might have already peaked and pushed back expectations for an aggressive tightening by the Fed, which, in turn, weighs heavily on the USD.
In fact, the odds for a 75 bps Fed Rate hike move in September tumble to just 35 from 80% pre-CPI. This triggers a steep decline in the US Treasury bond yields, which further contributes to driving flows towards the non-yielding yellow metal. The strong move up, meanwhile, lifts spot prices beyond the $1,800 mark, though a massive rally in the US equity futures keeps a lid on any further gains for the safe-haven gold.
The XAU/USD now retreats below the $1,800 pivotal point, warranting some caution for bullish traders and positioning for any further appreciating move. That said, any meaningful pullback might still be seen as a buying opportunity and remain limited amid worries about a global economic downturn and US-China tensions over Taiwan.
Technical levels to watch
The US CPI data delivered the first sign of peak inflation. Gold hit the highest level in over a month at $1,808 in a knee-jerk reaction to the data. In the view of strategists at TD Securities, a massive CTA buying program may exacerbate the rally in gold.
Chinese bid in gold continues to unwind
“The downside miss on the highly anticipated US inflation data may catalyze a substantial buying program in gold, bringing the margin of safety for trend signals to razor-thin levels.”
“The Chinese bid in gold continues to unwind. This has likely exacerbated price action amid a short covering rally. However, with the associated geopolitical risk receding, the cohort is now selling their recently added gold length, but additional CTA purchases would likely overwhelm this selling pressure.”
“The pain trade remains to the downside, but prices may be able to trade higher before macro headwinds weigh on the yellow metal once more.”
- EUR/USD surpasses the key 1.0300 level post-US CPI.
- Germany Final CPI rose 7.5% YoY in July.
- US CPI surprised to the downside at 8.5% in July.
EUR/USD sees its upside gathers further traction and advance to new multi-week peaks past the 1.0300 level on Wednesday.
EUR/USD boosted by USD-weakness
EUR/USD quickly left behind the key hurdle at 1.0300 the figure after US inflation figures tracked by the CPI disappointed expectations. Indeed, consumer prices rose 8.5% in the year to July, while the CPI excluding food and energy costs rose 5.9% from a year earlier, coming in also below initial estimates for a 6.1% YoY gain.
The pair’s sharp upside follows the equally abrupt – although in the opposite direction – decline in the greenback, as investors now perceive that the Federal Reserve might save a 75 bps rate hike for later and raise rates by half point instead at the September gathering.
On the latter, the probability of a 75 bps hike by the Fed in September shrank to around 27% from nearly 70% before the CPI data was published, according to CME Group’s FedWatch Tool.
What to look for around EUR
EUR/USD breaks above the 1.0300 hurdle with certain conviction helped by the intense drop in the dollar in the wake of lower-than-expected US CPI prints for the month of July.
Price action around the European currency, in the meantime, is expected to closely follow dollar dynamics, geopolitical concerns, fragmentation worries and the Fed-ECB divergence.
On the negatives for the single currency emerges the so far increasing speculation of a potential recession in the region, which looks propped up by dwindling sentiment gauges and the incipient slowdown in some fundamentals.
Key events in the euro area this week: Germany Final Inflation Rate (Wednesday) – EMU Industrial Production (Friday).
Eminent issues on the back boiler: Continuation of the ECB hiking cycle. Italian elections in late September. Fragmentation risks amidst the ECB’s normalization of monetary conditions. Impact of the war in Ukraine on the region’s growth prospects and inflation.
EUR/USD levels to watch
So far, spot is gaining 1.23% at 1.0340 and faces the next up barrier at 1.0346 (monthly high August 10) seconded by 1.0377 (55-day SMA) and finally 1.0615 (weekly high June 27). On the flip side, a break below 1.0096 (weekly low July 26) would target 1.0000 (psychological level) en route to 0.9952 (2022 low July 14).
- GBP/USD adds to its intraday gains and rallies to a one-and-half-week high amid a brutal USD selloff.
- A weaker US CPI report pushed back expectations for a larger Fed rate hike and weighed on the USD.
- A strong rally in the US equity futures exerts additional downward pressure on the safe-haven buck.
The GBP/USD pair catches aggressive bids and surges past the 1.2200 mark, hitting a one-and-half-week high during the early North American session.
The intraday US dollar selling picks up pace following the release of weaker US consumer inflation figures, which, in turn, provides a goodish lift to the GBP/USD pair. The Bureau of Labour Statistics reported that the headline US CPI remained flat in July against the 0.2% rise anticipated. Adding to this, the yearly rate decelerated to 8.5% during the reported month, again missing estimates pointing to a fall to 8.7% from the 9.1% in June.
Furthermore, core inflation, which excludes food and energy prices, came in at 0.3% MoM and held steady at a 5.9% YoY rate vs 0.5% and 6.1% anticipated, respectively. The softer data now seems to have pushed back market expectations for a larger Fed rate hike move at the September policy meeting and prompts aggressive selling around the USD. Apart from this, a strong rally in the US equity markets exerts additional pressure on the safe-haven buck.
The strong intraday move up allowed the GBP/USD pair to break through the 1.2130-1.2140 resistance zone, triggering an aggressive short-covering move. Hence, it remains to be seen if the momentum is backed by genuine buying or turns out to be a stop run amid the Bank of England's gloomy economic outlook.
Technical levels to watch
Inflation in the United States, as measured by the Consumer Price Index (CPI), declined to 8.5% on a yearly basis in July from 9.1% in June, the data published by the US Bureau of Labor Statistics revealed on Wednesday. This reading came in lower than the market expectation of 8.7%.
The Core CPI, which excludes volatile food and energy prices, stayed unchanged at 5.9%, compared to analysts' forecast for an increase to 6.1%. On a monthly basis, core inflation rose by 0.3% following June's increase of 0.7%.
Follow our live coverage of the market reaction to US inflation data.
Market reaction
With the initial market reaction, the greenback came under heavy pressure and the US Dollar Index was last seen losing 1% on the day at 105.22.
- USD/TRY keeps the erratic trade just below 18.00.
- Türkiye Unemployment Rate ticked lower to 10.3% in June.
- US CPI next of note in the docket.
The Turkish lira loses some ground and motivates USD/TRY to resume the upside on Wednesday, always amidst the prevailing multi-session consolidative theme.
USD/TRY remains capped by 18.00
USD/TRY fades Tuesday’s pullback and extends the side-lined trade for yet another session, always on the back of bulls’ lack of conviction to advance further north of the key barrier at the 18.00 yardstick.
In the domestic calendar, the jobless rate in Türkiye eased a tad to 10.3% in June vs. a month earlier.
Later in the session, all the attention is expected to be on the release of US inflation figures gauged by the CPI for the month of July.
What to look for around TRY
The upside bias in USD/TRY remains unchanged and stays on course to revisit the key 18.00 zone.
In the meantime, the lira’s price action is expected to keep gyrating around the performance of energy and commodity prices - which are directly correlated to developments from the war in Ukraine - the broad risk appetite trends and the Fed’s rate path in the next months.
Extra risks facing the Turkish currency also come from the domestic backyard, as inflation gives no signs of abating (despite rising less than forecast in July), real interest rates remain entrenched in negative figures and the political pressure to keep the CBRT biased towards low interest rates remains omnipresent. In addition, there seems to be no Plan B to attract much-needed foreign currency, despite the recent increase in the country’s FX reserves.
Key events in Türkiye this week: Unemployment Rate (Wednesday) – Current Account (Thursday) – End year CPI Forecast, Industrial Production, Retail Sales (Friday).
Eminent issues on the back boiler: FX intervention by the CBRT. Progress (or lack of it) of the government’s new scheme oriented to support the lira via protected time deposits. Constant government pressure on the CBRT vs. bank’s credibility/independence. Bouts of geopolitical concerns. Structural reforms. Presidential/Parliamentary elections in June 23.
USD/TRY key levels
So far, the pair is gaining 0.46% at 17.9583 and faces the immediate target at 17.9874 (2022 high August 3) seconded by 18.2582 (all-time high December 20) and then 19.00 (round level). On the other hand, a breach of 17.1903 (weekly low July 15) would pave the way for 16.2174 (100-day SMA) and finally 16.0365 (monthly low June 27).
Norway’s inflation surprised sharply to the upside in July. Thus, in the view of analysts at TD Securities another 50 bps Norges Bank hike is now likely.
Norway inflation surges
“Inflation came in much stronger than expected in July, with the headline rate rising to 6.8% YoY and underlying inflation soaring to a new series high of 4.5% YoY. This puts headline and core inflation 1.7ppts and 1.3ppts above Norges Bank's latest forecasts.”
“We now expect Norges Bank to raise its policy rate by 50 bps for the second consecutive meeting next week.”
See – EUR/NOK to tick down on indications of Norges Bank hiking rates again notably – Commerzbank
- EUR/USD flirts with weekly highs around 1.0250 on Wednesday.
- Further gains look likely on a close above 1.0300.
EUR/USD trades on a positive performance around the 1.0250 region midweek.
The so far August high at 1.0293 (August 2) emerges as the magnet for bulls for the time being. Above this level, spot is expected to see its uptrend reinvigorated and could challenge the temporary 55-day SMA in the near term, today at 1.0377.
In the longer run, the pair’s bearish view is expected to prevail as long as it trades below the 200-day SMA at 1.0906.
EUR/USD daily chart
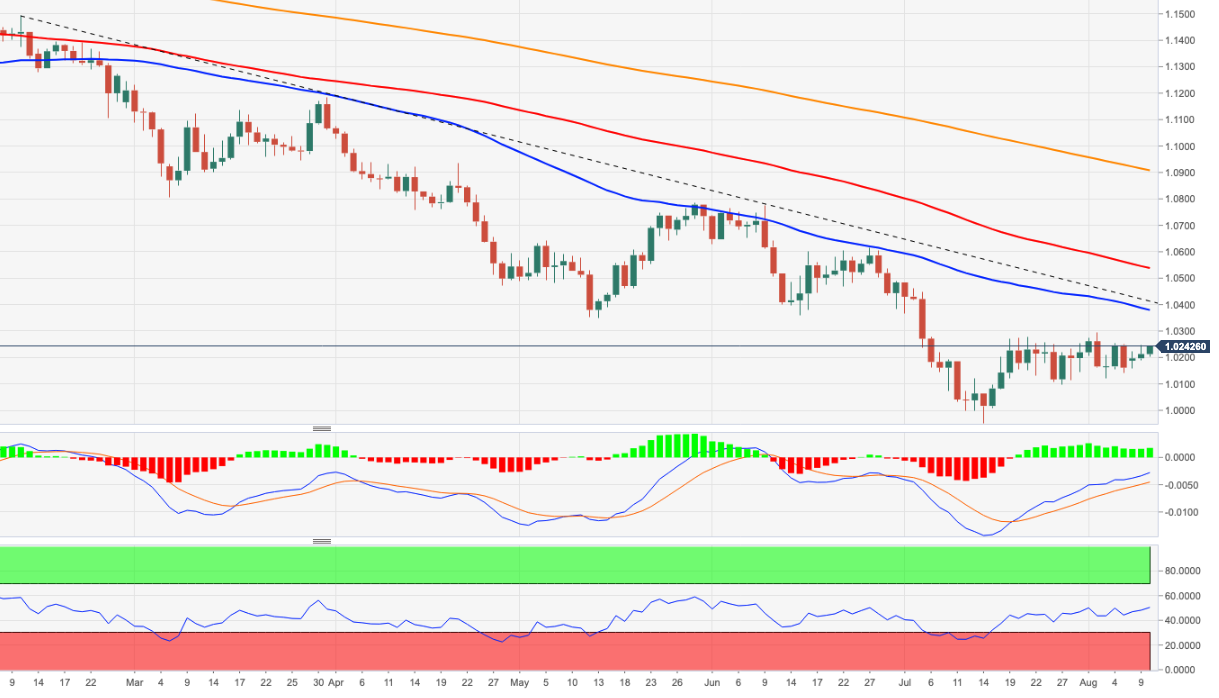
- DXY comes under further downside pressure near 106.00.
- Extra weakness could see the 105.00 zone retested near term.
DXY retreats for the third session in a row and challenges once gain the 106.00 neighbourhood ahead of the release of US inflation figures.
If the selling bias picks up extra pace, the dollar risks a deeper pullback to, initially, the August low near 105.00 (August 2). This area of initial contention appears reinforced by the 55-day SMA, today at 105.19.
The short-term constructive stance is expected to remain supported by the 6-month support line, today near 104.50.
Furthermore, the broader bullish view in the dollar remains in place while above the 200-day SMA at 99.93.
DXY daily chart
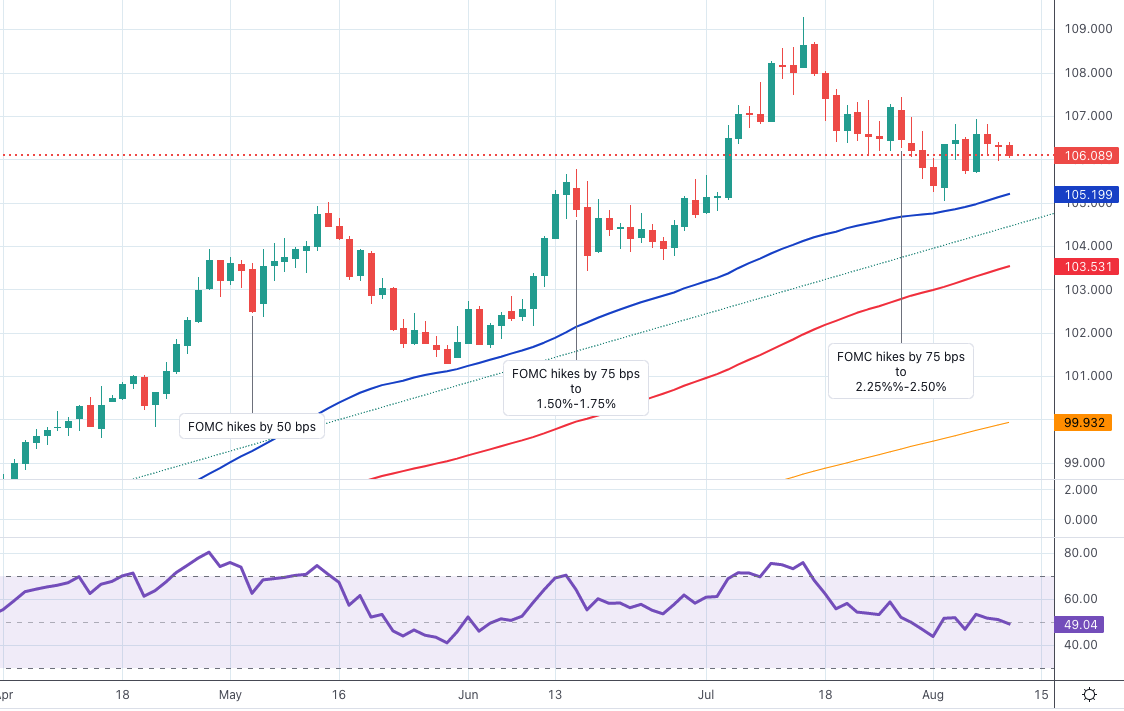
Economist at UOB Group Lee Sue Ann suggests the PBoC could reduce further the policy rate in the next months.
Key Quotes
“China’s economy continues to face the same set of challenges including COVID-19 resurgences and perhaps even greater pessimism in the domestic property market as well as high global energy and food prices.”
“In view of higher domestic risks, we continue to see prospects for the 1Y loan prime rate (LPR) to move slightly lower to 3.55% by end-3Q22 from current 3.70%.”
US CPI Overview
Wednesday's US economic docket highlights the release of the critical US consumer inflation figures for July, scheduled later during the early North American session at 12:30 GMT. The headline CPI is anticipated to rise by 0.2% during the reported month, down sharply from the 1.3% in June. The yearly rate is also expected to decelerate to 8.7% in July from the 9.1% previous. Meanwhile, core inflation, which excludes food and energy prices, is projected to rise by 0.5% in July and jump to 6.1% on yearly basis from 5.9% in May.
According to Eren Sengezer, European Session Lead Analyst at FXStreet: “A CPI print of 8.7% in July would suggest that inflation may have peaked in June. A reading of 8.8%, however, would show that prices continued to rise in July, regardless of the decline in the annual inflation rate. Investors will also pay close attention to the Core CPI figure, which excludes volatile food and energy prices.”
How Could it Affect EURUSD?
Ahead of the key release, modest US dollar weakness assists the EUR/USD pair to gain positive traction for the third successive day. A stronger-than-expected US CPI print would reaffirm market bets for another 75 bps rate hike move at the September FOMC meeting. This, in turn, would push the US Treasury bond yields higher, along with the buck.
Conversely, a softer reading would push back expectations for a more aggressive policy tightening by the Fed and exert some downward pressure on the greenback. The immediate market reaction, however, is likely to remain short-lived amid recession fears, which might continue to act as a tailwind for the safe-haven USD. This, along with growing concerns over the energy crisis in Europe, suggests that the path of least resistance for the EUR/USD pair is to the downside.
Eren Sengezer offers a brief technical outlook for the EURUSD pair and outlines important technical levels: “The symmetrical triangle that seems to have formed on the four-hour chart confirms the view that the pair is about to break out of its range. On the upside, 1.0230/1.0240 (Fibonacci 38.2% retracement of the latest downtrend, 200-period SMA on the four-hour chart) aligns as key resistance. With a weak CPI print, the pair could rise above that level and target 1.0300 (psychological level, Fibonacci 50% retracement) and 1.0370 (Fibonacci 61.8% retracement.”
“Significant support is located at 1.0200 (psychological level, 100-period SMA, 50-period SMA). If the dollar regathers strength on a hot inflation report, the pair could pierce through that support and extend its decline toward 1.0150 (Fibonacci 23.6% retracement) and 1.0100 (psychological level, static level),” Eren adds further.
Key Notes
• US CPI Preview: It is the hard core that counts, five scenarios for critical inflation data
• US July CPI Preview: What is the base effect and why it matters
• EUR/USD Forecast: Breakout imminent on US inflation data
About the US CPI
The Consumer Price Index released by the US Bureau of Labor Statistics is a measure of price movements by the comparison between the retail prices of a representative shopping basket of goods and services. The purchasing power of the USD is dragged down by inflation. The CPI is a key indicator to measure inflation and changes in purchasing trends. Generally speaking, a high reading is seen as positive (or bullish) for the USD, while a low reading is seen as negative (or Bearish).
- USD/CHF turns lower for the third straight day and drops to a one-week low on Wednesday.
- Modest USD weakness exerts pressure amid growing recession fears and US-China tensions.
- Investors might refrain from placing aggressive bets and wait for the crucial US CPI report.
The USD/CHF pair attracts fresh selling near the 0.9545 region on Wednesday and turns lower for the third successive day. The pair extends the steady intraday descent through the first half of the European session and slips below the 0.9500 psychological mark, hitting a one-week low in the last hour.
The uncertainty over the Fed's rate hike path prompts some selling around the US dollar, which turns out to be a key factor exerting downward pressure on the USD/CHF pair. Investors pushed back against expectations for a more aggressive policy tightening after the New York Fed’s Survey of Consumer Expectations showed that the inflation outlook fell sharply in July. The markets, however, are still pricing in around 70% chances for a 75 bps rate hike at the September FOMC meeting.
Apart from this, the prevalent cautious mood offers some support to the safe-haven Swiss franc and further contributes to the offered tone surrounding the USD/CHF pair. The market sentiment remains fragile amid growing worries about a global economic downturn and US-China tensions over Taiwan. The downside, however, seems cushioned as traders might refrain from placing aggressive bets and prefer to wait for the US consumer inflation figures, due later during the early North American session.
The crucial US CPI report would be looked upon for fresh clues about the Fed's near-term policy outlook. This, in turn, would play a key role in influencing the USD price dynamics and help determine the next leg of a directional move for the USD/CHF pair. Hence, any subsequent decline is more likely to find decent support and stall near the 0.9470 area, or a four-month low touched on August 2.
Technical levels to watch
In recent weeks, the discussion about the effectiveness of Western sanctions against Russia has increased. Strategists at Commerzbank come to four main conclusions.
Success or failure?
“The Russian sanctions imposed by the EU and other Western countries do not lead to a collapse of the Russian economy. But they can be expected to significantly harm it in the longer-run. Indicators such as the RUB strength do not prove otherwise.”
“The EU's first four sanctions packages followed the economic logic of maximizing economic damage to the targeted country with minimal damage to the sanctioning countries. The fact that the EU nevertheless experienced deteriorating terms of trade, while the effect on Russia's terms of trade is ambiguous, is not due to the sanctions but to increased supply insecurity.”
“With the sixth sanctions package, the EU departed from its previous path. The purpose of the package was to reduce the effectiveness of Russian counter-sanctions as political leverage. This purpose cannot be fully achieved, because a balance must be struck between this goal and the economic damage within the EU.”
“The sanctions may not stop the invasion of Ukraine. But even then, they create significant signaling effects.”
GBP/USD has been moving sideways at around 1.2100. 1.2050 support could fail on strong US Core CPI, FXStreet’s Eren Sengezer reports.
GBP/USD could target 1.2150 if buyers managed to flip 1.21 into support
“An unexpected fall in the Core CPI reading could trigger a dollar selloff and open the door for a decisive recovery in GBP/USD. With the UK economy facing a high risk of recession before the end of the year, however, investors could refrain from betting on long-term GBP strength and key technical levels could cap the pair's upside in the near term.”
“1.2050 aligns as key support for GBP/USD. With a four-hour close below that level, additional losses toward 1.2000 and 1.1920 could be witnessed.”
“On the upside, the pair could target 1.2150 and 1.2175 if buyers managed to flip 1.2100 into support.”
See – US CPI Preview: Forecasts from nine major banks, soaring inflation to ease off in July
- EUR/JPY keeps pushing higher and trades around 138.00.
- Extra gains could challenge the 55-day SMA around 139.60.
EUR/JPY extends the uptrend for yet another session and gyrates around the 138.00 neighbourhood.
Considering the ongoing price action, further upside in the cross appears likely for the time being. That said, the next temporary target aligns at the 55-day SMAs, today at 139.61. If the cross clears this area, the door could then open to a probable visit to the July top at 142.32 (July 21).
While above the 200-day SMA at 133.84, the outlook for the cross is expected to remain constructive. This contention zone also appears underpinned by the proximity of the August low at 133.39 (August 2).
EUR/JPY daily chart
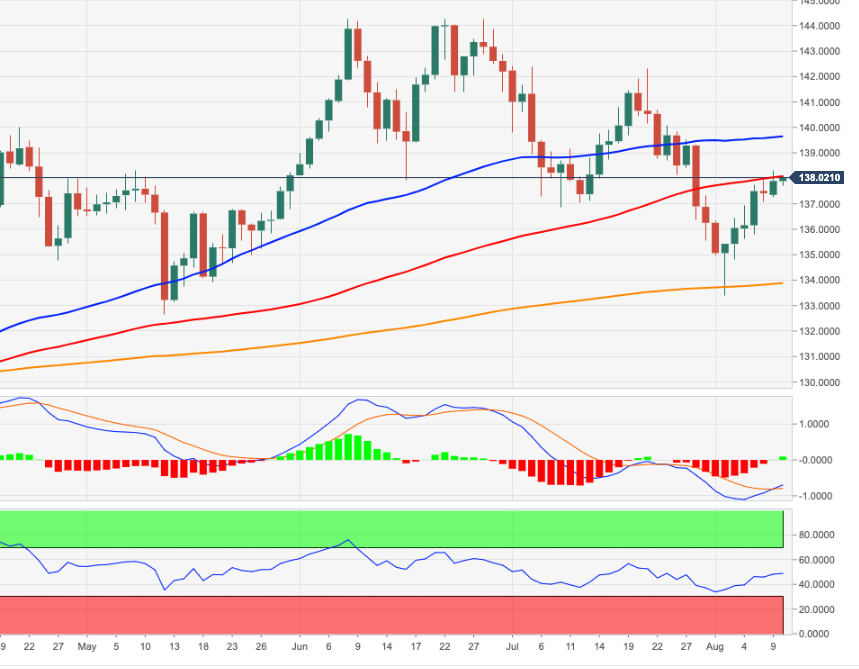
USD/IDR trades below the 15,000 mark. Strategists at TD Securities believe that Bank Indonesia (BI) will defend this level.
A number of factors offer support to the rupiah
“Indonesia's terms of trade have looked increasingly attractive over recent months, offering support to its current account position and the IDR. News that China has pledged to increase palm oil imports from Indonesia is another factor that will help on this front.”
“We think BI will continue to defend the USD/IDR 15,000 level, which will act as a strong line in the sand.”
“Relatively higher real policy rates than other countries in Asia also offers the IDR more protection and we also see a strong chance that BI hikes this month, with the Bank shifting its stance towards a less accommodative one.”
GBP/USD lacks follow-through beyond 1.21. Economists at MUFG expect the British pound to continue struggling over the coming weeks.
Bank of England forecasts GDP contraction for five consecutive quarters
“The BoE is forecasting GDP contraction for five consecutive quarters commencing in Q4 2022 and the baseline assumptions do not assume energy supply restrictions that result in blackouts and potentially major disruptions so we’d expect this story if confirmed to undermine confidence in the outlook for growth even further.”
“The pound is the 2nd worst performing G10 currency so far in August and we see no reason for that performance to change over the coming weeks.”
The US dollar is broadly stable to slightly stronger ahead of the key inflation data. All in all, economists at MUFG expect the greenback to enjoy further gains over the coming months.
2s10s set to further invert
“Evidence of any broadening of inflationary pressures beyond rents in the core would likely result in further pricing of more aggressive action by the Fed before the end of the year. That would mean a further inversion of the 2s10s yield curve which is fast approaching - 50 bps. That must surely be the short-term risk.”
“Breakeven rates have dropped and other measures of inflation expectations have turned lower. So there is good news ahead in all likelihood but for now, the hard data is likely to keep investors concerned over monetary overkill which points to renewed US dollar appreciation over the coming months.”
See – US CPI Preview: Forecasts from nine major banks, soaring inflation to ease off in July
- USD/CAD meets with a fresh supply on Wednesday and erodes a part of the overnight gains.
- Subdued USD price action turns out to be the only factor exerting some downward pressure.
- Weaker oil prices could undermine the loonie and lend support ahead of the US CPI report.
The USD/CAD pair struggles to capitalize on the overnight positive move and meets with a fresh supply in the vicinity of the 1.2900 mark on Wednesday. The pair remains depressed through the first half of the European session and is currently trading near the daily low, around the 1.2865-1.2870 region.
The US dollar continues with its struggle to gain any meaningful traction amid the uncertainty over the Fed's rate hike path and turns out to be a key factor offering support to the USD/CAD pair. The New York Fed’s Survey of Consumer Expectations showed that the inflation outlook fell sharply in July and pushed back speculations for a more aggressive policy tightening by the Fed.
The markets, however, are still pricing in around 70% chances for a 75 bps rate hike at the September FOMC meeting. This, along with the prevalent cautious mood, is acting as a tailwind for the safe-haven buck and should help limit deeper losses for the USD/CAD pair. The market sentiment remains fragile amid growing recession fears and US-China tensions over Taiwan.
Investors, meanwhile, remain concerned that a global economic downturn could hit fuel demand. Adding to this, the latest progress to revive the Iran nuclear accord might clear the way to boost crude supply in a tight market. This, in turn, prompts fresh selling around crude oil prices, which might undermine the commodity-linked loonie and further lend support to the USD/CAD pair.
Traders might also refrain from placing aggressive bets and prefer to wait on the sidelines ahead of the US consumer inflation figures, due for release later during the early North American session. The crucial US CPI report would play a key role in influencing the near-term USD price dynamics and help determine the next leg of a directional move for the USD/CAD pair.
Technical levels to watch
EUR/USD has extended its sideways grind into a third straight day. As FXStreet’s Eren Sengezer notes, the pair has the potential to move sharply in either direction.
Breakout imminent on US inflation data
“The symmetrical triangle that seems to have formed on the four-hour chart confirms the view that the pair is about to break out of its range.
“On the upside, 1.0230/1.0240 (Fibonacci 38.2% retracement of the latest downtrend, 200-period SMA on the four-hour chart) aligns as key resistance. With a weak CPI print, the pair could rise above that level and target 1.0300 (psychological level, Fibonacci 50% retracement) and 1.0370 (Fibonacci 61.8% retracement.”
“Significant support is located at 1.0200 (psychological level, 100-period SMA, 50-period SMA). If the dollar regathers strength on a hot inflation report, the pair could pierce through that support and extend its decline toward 1.0150 (Fibonacci 23.6% retracement) and 1.0100 (psychological level, static level).”
See – US CPI Preview: Forecasts from nine major banks, soaring inflation to ease off in July
- GBP/USD gains some positive traction on Wednesday amid subdued USD price action.
- Recession fears, the BoE’s gloomy outlook could act as a headwind and cap the major.
- Traders might also prefer to move on the sidelines ahead of the crucial US CPI report.
The GBP/USD pair edges higher during the first half of the European session on Wednesday and climbs to the 1.2100 neighbourhood or a fresh daily high in the last hour.
The uncertainty over the Fed's rate hike path keeps the USD bulls on the defensive, which, in turn, offers some support to the GBP/USD pair. The New York Fed’s Survey of Consumer Expectations on Monday showed that the inflation outlook fell sharply in July. This might have pushed back speculations for a more aggressive policy tightening by the Fed. The markets, however, are still pricing in around 70% chances for a 75 bps rate hike move at the September FOMC meeting.
Hence, the market focus would remain glued to the latest US consumer inflation figures, due for release later during the early North American session. The crucial US CPI report would be looked upon for fresh clues about the Fed's near-term policy outlook, which will play a key role in influencing the USD price dynamics. In the meantime, the prevalent cautious market mood - amid growing recession fears - could lend support to the safe-haven buck. This, along with the Bank of England's gloomy outlook, should cap the GBP/USD pair.
Even from a technical perspective, the emergence of fresh selling near the 1.2130-1.2140 region since the beginning of this week warrants caution for bullish traders. This further makes it prudent to wait for strong follow-through buying before positioning for any further intraday appreciating move amid absent relevant market-moving economic data from the UK.
Technical levels to watch
China's military said on Wednesday that they have completed various tasks around Taiwan and noted that they will continue to carry out military training to be "combat-ready," as reported by Reuters.
The People's Liberation Army's Eastern Theatre Command said they will keep a close eye on changes in the situation while conducting regularised patrols in the Taiwan Strait.
Market reaction
This headline doesn't seem to be having a significant impact on risk sentiment. As of writing, US stock index futures were up between 0.2% and 0.35%:
- AUD/USD reverses modest intraday slide, through the uptick lacks bullish conviction.
- Subdued USD price action turns out to be a key factor lending support to the major.
- The cautious mood caps the risk-sensitive as the focus remains on the US CPI report.
The AUD/USD pair attracts some buying near the 0.6945 area on Wednesday and climbs to a fresh daily high during the early part of the European session. The uptick, however, lacked follow-through, though spot prices manage to reverse a part of the previous day's downfall.
The US dollar continues with its struggle to gain any meaningful traction, which turns out to be a key factor extending some support to the AUD/USD pair. The New York Fed’s Survey of Consumer Expectations on Monday showed that the inflation outlook declined significantly in July. This seems to have tempered speculations for a more aggressive policy tightening by the Fed. The markets, however, are pricing in around 70% chances of a 75 bps Fed rate hike move at the September meeting. The uncertainty over the Fed's policy tightening path keeps the USD bulls on the defensive ahead of the crucial US consumer inflation figures.
The US CPI report, due later during the early North American session on Wednesday, would be looked upon for fresh clues about the prospects for a larger Fed rate hike move. This, in turn, would play a key role in influencing the US dollar and provide a fresh directional impetus to the AUD/USD pair. In the meantime, an uptick in the US Treasury bond yields, along with the cautious mood, is acting as a tailwind for the safe-haven buck and capping the risk-sensitive aussie. The market sentiment remains fragile amid growing recession fears and US-China tensions over Taiwan. This, in turn, warrants some caution for bullish traders.
Even from a technical perspective, the recent two-way price moves witnessed over the past one week or so point to indecision over the near-term trajectory for the AUD/USD pair. This further makes it prudent to wait for some follow-through buying before positioning for an extension of a near one-month-old recovery trend from the 0.6680 region, or over a two-year low touched in July.
Technical levels to watch
Germany’s Finance Minister Christian Lindner said on Wednesday that the economic outlook for the euro area’s powerhouse is fragile.
Earlier on, Lindner had said that high inflation in Germany was eroding economic foundations.
Germany is bearing the brunt of the Russia-Ukraine war, as the European gas crisis deepens. The economy is on brink of recession, as companies expect significantly worse business activity in the coming months.
Despite growing recessionary fears, the European Central Bank (ECB) remains on track for a 50 bps rate hike at its September meeting. The eurozone money markets now fully price in 50 bps rate increase next month.
Market reaction
EUR/USD is testing bids around 1.0200, seeing renewed selling pressure amid a minor recovery in the US dollar and a risk-off market profile. All eyes remain on the US inflation data for a fresh direction in the pair.
- EUR/USD exchanges gains with losses in the 1.0210 region.
- Final Germany CPI rose 7.5% YoY in the month of July.
- US CPI is expected to show a slowdown in the inflation in July.
The single currency struggles to gather traction and motivates EUR/USD to remain stuck just above the 1.0200 yardstick so far on Wednesday.
EUR/USD stays vigilant ahead of US data
EUR/USD’s upside momentum appears to be taking a breather after climbing as high as the 1.0250 region on Tuesday, as investors show increasing prudence ahead of the key release of US inflation figures during last month. On this, consensus expects the CPI to have lost some momentum and rise 8.7% over the last twelve months (from 9.1%).
In the meantime, the energy crisis – particularly exacerbated after the Russian invasion of Ukraine – remains as a key drag for the growth outlook in the broader euro area as well as a source of elevated inflation, all amidst the start of the normalization process by the ECB and its plans to tighten its policy further in September.
In the domestic calendar, final CPI in Germany showed consumer prices rose at an annualized 7.5% in July.
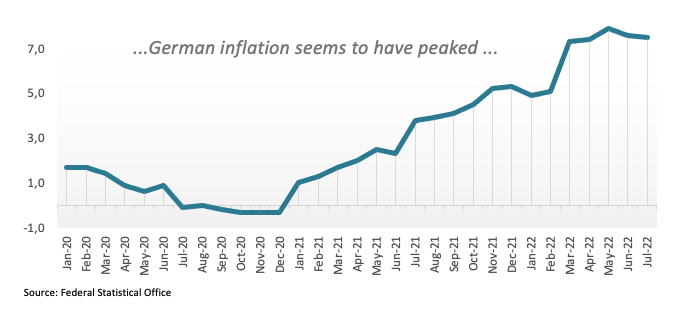
Later in the NA session, MBA Mortgage Applications, Wholesale Inventories and the Monthly Budget Statement are all also due.
What to look for around EUR
EUR/USD so far keeps the 1.0100-1.0300 range unchanged against the backdrop alternating risk appetite trends.
Price action around the European currency, in the meantime, is expected to closely follow dollar dynamics, geopolitical concerns, fragmentation worries and the Fed-ECB divergence.
On the negatives for the single currency emerges the so far increasing speculation of a potential recession in the region, which looks propped up by dwindling sentiment gauges and the incipient slowdown in some fundamentals.
Key events in the euro area this week: Germany Final Inflation Rate (Wednesday) – EMU Industrial Production (Friday).
Eminent issues on the back boiler: Continuation of the ECB hiking cycle. Italian elections in late September. Fragmentation risks amidst the ECB’s normalization of monetary conditions. Impact of the war in Ukraine on the region’s growth prospects and inflation.
EUR/USD levels to watch
So far, spot is gaining 0.01% at 1.0214 and faces the next up barrier at 1.0293 (monthly high August 2) seconded by 1.0377 (55-day SMA) and finally 1.0615 (weekly high June 27). On the flip side, a break below 1.0096 (weekly low July 26) would target 1.0000 (psychological level) en route to 0.9952 (2022 low July 14).
- The index trade within a narrow range near 106.30.
- Price action in US yields also remain apathetic near Tuesday’s close.
- All the attention will be on the release of US inflation figures later in the day.
The greenback, when tracked by the US Dollar Index (DXY), navigates a tight range in the low-106.00s on Wednesday.
US Dollar Index focused on CPI
The index keeps the bearish performance so far this week amidst the resurgence of the appetite for the risk complex, while investors appear to have already digested July’s strong Payrolls figures and continue to price in a 75 bps rate hike at the next Fed gathering in September.
In the meantime, prudence still prevails among market participants ahead of the publication of US inflation figures for the month of July, due later in the NA session, while US yields remain flat and trade close to Tuesday’s closing levels.
Other than the CPI release, the US docket will include the usual weekly MBA Mortgage Applications, Wholesale Inventories, the EIA’s report on US crude oil inventories and the Monthly Budget Statement.
What to look for around USD
The index remains under pressure and trades near the 106.00 region ahead of key releases in the US calendar.
The dollar, in the meantime, is poised to extend the current range bound theme amidst persistent cautiousness pre-US CPI and prospects for the continuation of the aggressive normalization by the Federal Reserve.
Looking at the macro scenario, the dollar appears propped up by the Fed’s divergence vs. most of its G10 peers (especially the ECB) in combination with bouts of geopolitical effervescence and occasional re-emergence of risk aversion.
Key events in the US this week: MBA Mortgage Applications, Inflation Rate, Wholesale Inventories (Wednesday) Initial Claims, Producer Prices (Thursday) – Flash Consumer Sentiment (Friday).
Eminent issues on the back boiler: Hard/soft/softish? landing of the US economy. Escalating geopolitical effervescence vs. Russia and China. Fed’s more aggressive rate path this year and 2023. US-China trade conflict. Future of Biden’s Build Back Better plan.
US Dollar Index relevant levels
Now, the index is losing 0.02% at 106.27 and a breach of 105.04 (monthly low August 2) would expose 103.67 (weekly low June 27) and finally 103.5 (100-day SMA). On the upside, a breakout of 107.42 (weekly high post-FOMC July 27) would expose 109.29 (2022 high July 15) and then 109.77 (monthly high September 2002).
- Silver witnesses some selling for the second straight day and moves away from a multi-week high.
- The technical set-up still seems tilted in favour of bulls and supports prospects for additional gains.
- A sustained break below the $19.20 region is needed to negate the near-term constructive outlook.
Silver edges lower for the second successive day and retreats further from a six-week peak touched on Monday. The white metal remains depressed through the early European session on Wednesday and is currently placed near a two-day low, around the $20.40-$20.35 region.
The aforementioned area marks confluence support, comprising the 50-day SMA and the 50% Fibonacci retracement level of the $22.52-$18.15 downfall. A convincing break below could prompt some technical selling and drag the XAG/USD back towards the $20.00 psychological mark.
The latter should act as a pivotal point, which if broken decisively would make the XAG/USD vulnerable. Some follow-through selling below the $19.80-$19.75 region (38.2% Fibo. level) would reaffirm the negative bias and expose the 23.6% Fibo. level, around the $19.20 zone.
This is followed by the $19.00 round-figure mark, below which the XAG/USD could accelerate the downfall towards the next relevant support near the $18.40 area. Spot prices could eventually drop to challenge the YTD low, around the $18.15 region touched on July 14.
On the flip side, the $20.65-$20.70 zone now seems to act as an immediate resistance ahead of the 61.8% Fibo. level, around the $20.85 region, and the $21.00 mark. Sustained strength beyond would be seen as a fresh trigger for bullish traders and pave the way for additional gains.
The subsequent move up has the potential to lift the XAG/USD towards an intermediate resistance near the $21.40-$21.50 area en route to the 100-day SMA, currently around the $21.85 region, and the $22.00 round-figure mark.
Silver daily chart
-637957132688300111.png)
Key levels to watch
It has been a trendless week for the dollar so far. Today sees the biggest data event risk of the week – and probably of the month, The Consumer Price Index (CPI) in the United States. Economists at ING expect the report to keep the dollar well supported.
CPI to cement the cycle
“US July CPI is expected to soften a little on a headline basis but nudge up on a core basis to just above 6% year-on-year. Stubbornly high core inflation should support the Federal Reserve’s position that its work is far from done. It should also support pricing in the US money market curve that sees the policy rate taken around 125 bps higher in this cycle.”
“Barring a massive upside surprise that can demand an extra 25-50 bps or so priced into the back end of the curve (and sending the dollar a leg higher), we expect the inflation data to cement current tightening expectations and keep the dollar bid near the high.”
“105.70-107.00 are now the short-term parameters for DXY.”
See – US CPI Preview: Forecasts from nine major banks, soaring inflation to ease off in July
UK equities have held up well. The FTSE 100 index is up 1.5% year to date, outperforming other major markets. Economists at UBS see reasons why UK equities can continue to do well.
The drivers of the FTSE 100 are more international
“FTSE 100 companies generate around 75% of their revenues outside the UK, which means the market is less sensitive to domestic growth concerns. While risks to global growth have risen, incoming data – strong US jobs growth, higher US ISM services, robust China export growth – suggest global activity, though slower, is still holding up.”
High exposure to value, commodity, and defensive sectors
“Value sectors such as energy, basic resources, and financials – accounting for c. 40% of the index – have benefited from higher interest rates and commodity prices. In addition, domestic growth concerns have led to strong performance of the defensive healthcare sector, which has c. 14% weight.”
Strong earnings and attractive valuations
“We expect the UK to deliver one of the highest earnings growth rates, of 12%, this year. A weaker GBP can also provide a further boost to earnings as three-quarters of sales are overseas with a large share in US dollars. Amid the threat of an energy supply shortage this winter and weak economic growth, we expect GBP/USD to fall to 1.15 by end-2022. From a valuation perspective, the FTSE 100 trades on a 12-month forward P/E of 10.2x, an attractive 34% discount to the MSCI AC World index.”
“We continue to rate the UK as most preferred and see a modest 4% upside, targeting the FTSE 100 at 7,700, by end-2022.”
July inflation will be published today in the Czech Republic. The EUR/CZK pair trades around the 24.50 level and economists at ING expect the market to simmer an attack to the 24.60-70 zone.
Tricky inflation print to test CNB pain threshold
“We expect inflation to jump from 17.2% to 18.5% today, while the market is expecting 17.9%. The central bank expects 18.8% in its new forecast, but even a higher number cannot be ruled out at this point. For the Czech National Bank, however, we believe the pain threshold is high given that any surprise will come from energy prices, which the new board places on the cost side, thus out of the central bank's reach.”
“Yesterday's 20 bps jump in the short end of the curve, presumably in preparation for today's inflation, and profit-taking should limit that market reaction.”
“On the FX front, the market remains safely away from the 24.60-24.70 level after last week's CNB meeting and for now is vainly gathering strength for another stage of attack against the central bank, which has been defending the koruna.”
EUR/USD steadies near 1.0220. In the view of economists at ING, the pair does not show signs to buy it.
Too many challenges
“EUR/USD continues to languish near the lows and there does not seem a compelling case to buy it. Medium valuation considerations do not show it as particularly undervalued. And the larger geopolitical event risks leave Europe more exposed than North America.”
“Declining levels of implied volatility suggest investors may be in no mood to chase EUR/USD out of a 1.0100-1.0300 range near-term.”
EUR/USD extends its sideways grind near 1.0200 into the third straight day on Wednesday. Looking ahead, tighter monetary policy and the lingering global energy crunch render economists at Danske Bank confident in their call for EUR/USD to drop back below parity.
EUR/USD seen at 0.95 in 12 months
“Besides tighter monetary policy, the USD feeds off the positive energy terms of a trade shock to the US economy.”
“As the heating season begins in a couple of months, US LNG exporters sit on the winning end of Russia’s threat to shut down natural gas exports to the EU. Consequently, we are confident in our call for EUR/USD to drop back below parity over the coming months.”
“We forecast EUR/USD at 0.95 in 12M.”
Here is what you need to know on Wednesday, August 10:
Major currency pairs are struggling to make a decisive move in either direction as market participants remain on the sidelines while waiting for the US Bureau of Labor Statistics to release the July inflation report. The market mood remains cautious early Wednesday with the US stock index futures trading in negative territory and the benchmark 10-year US Treasury bond yield holding steady at around 2.8%. The Consumer Price Index (CPI) in the US is expected to decline to 8.7% on a yearly basis in July from 9.1% in June and the annual Core CPI is forecast to edge higher to 6.1% from 5.9%:
US July CPI Preview: What is the base effect and why it matters.
After having closed the previous day flat, the US Dollar Index continues to move up and down in a tight range above 106.00 in the European morning. St. Louis Fed President James Bullard said on Tuesday that he would like the rates to move up to 4% by the end of the year and added that the Fed is prepared to hold rates "higher for longer" should inflation continue to surprise to the upside.
US CPI Preview: It is the hard core that counts, five scenarios for critical inflation data.
Earlier in the day, the data from China revealed that the annual CPI rose to 2.7% in July from 2.5% in June. This reading failed to trigger a noticeable market reaction during the Asian trading hours. Meanwhile, in a whitepaper published on Wednesday, China reiterated its policy of 'one country, two systems' for Taiwan and said that it will not rule out the use of force.
EUR/USD extends its sideways grind near 1.0200 into the third straight day on Wednesday. Germany's Destatis reported that the annual CPI stood at 7.5% in July, matching the flash estimate and the market expectation.
GBP/USD failed to hold reclaim 1.2100 after having risen above that level during the European trading hours on Tuesday. The pair returned to the 1.2070 area early Wednesday.
USD/JPY closed the day virtually unchanged near 135.00 on Tuesday. The pair continues to fluctuate in a narrow band near that level mid-week.
Gold touched its highest level in a month above $1,800 on Tuesday but went into a consolidation phase. At the time of press, XAU/USD was posting modest daily losses near $1,790.
Bitcoin lost nearly 3% on Tuesday and erased all the gains it recorded on Monday. BTC/USD stays on the backfoot early Wednesday and trades in negative territory below $23,000. Ethereum continues to push lower and trades below $1,700 after having fallen 4% on Tuesday.
- USD/JPY lacks any firm directional bias and remains confined in a narrow trading range.
- Traders prefer to move on the sidelines ahead of the crucial US consumer inflation data.
- The Fed-BoJ policy divergence, meanwhile, continues to act as a tailwind for the major.
The USD/JPY pair continues with its struggle to gain traction on Wednesday and remains confined in a range around the 135.00 mark for the second straight day.
The subdued price action comes amid investors' reluctance to place aggressive bets ahead of the crucial US consumer inflation figures, due for release later during the early North American session. The US CPI report would be looked upon for fresh clues about the Fed's policy tightening path. This, in turn, would play a key role in influencing the US dollar and provide a fresh directional impetus to the USD/JPY pair.
In the meantime, a big divergence in the policy stance adopted by the Fed and the Bank of Japan continues to act as a tailwind for the USD/JPY pair. In fact, the markets are pricing in around 70% chances of a 75 bps Fed rate hike at the September meeting. In contrast, the BoJ has repeatedly said that it will stick to its ultra-easy policy settings and its commitment to keep the 10-year Japanese government bond yield around 0%.
That said, the prevalent cautious mood offers some support to the safe-haven JPY and seems to cap the upside for the USD/JPY pair. The market sentiment remains fragile amid growing recession fears and US-China tensions over Taiwan. The mixed fundamental backdrop warrants caution before positioning for a firm intraday direction. This, in turn, suggests that the pair is more likely to prolong its range-bound price action heading into the key data risk.
Technical levels to watch
CME Group’s flash data for natural gas futures markets noted open interest dropped for the fourth consecutive session on Tuesday, this time by more than 2K contracts. In the same line, volume went down by around 77.8K contracts after two daily builds in a row.
Natural Gas could slip back to $7.50
Tuesday’s uptick in prices of natural gas was amidst shrinking open interest and volume, indicative that a potential rebound looks unsustainable for the time being. Against that, the commodity could slip back to the key support region around $7.50 per MMBtu.
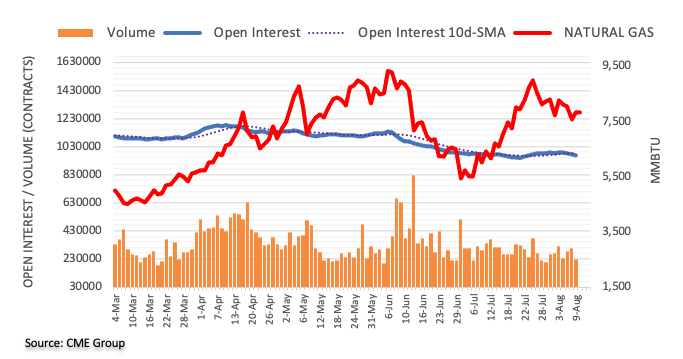
Gold price tested the $1,800 mark for the first time in over a month on Tuesday. Economists at Credit expect the yellow metal to eye the 200-day moving average (DMA) on a sustained break above 55-DMA at $1,792.
A major “double top” continues to threaten
“A convincing break above the 55-DMA, currently seen at $1,792, would confirm further ranging in the 2-year range, with next resistance then seen at the even more important 200-DMA, currently at $1,842.”
“We continue to stress that a closing break below $1,691/77 would be sufficient to complete a large ‘double top’, which would turn the risks lower over at least the next 1-3 months. We note that the next support should this top be triggered is seen at $1,618/16, then $1,560.”
- Gold price is easing from near monthly highs ahead of US inflation.
- US CPI will shape the Fed rate hike policy and market sentiment.
- XAU/USD sees healthy barriers on both sides amid a sense of caution.
Gold price is snapping its two-day uptrend to monthly highs of $1,800, as investors resort to repositioning ahead of the highly-influential US inflation release. Markets are reluctant to place large bets heading into the CPI showdown, as the data will be scrutinized closely for fresh insights on how steeply the Fed will raise rates in the coming months. The non-interest-bearing gold braces for huge volatility on the data release, especially after being sold off into the bumper US Nonfarm Payrolls last week. This Wednesday, the odds of a 75 bps Fed lift-off in September stand at 67.5% while the two-year Treasury rate surpasses the 10-year by nearly 50 bps, indicating that the inversion is around the deepest since 2000. A softer US CPI reading is critical to dissuading the Fed from going too aggressive on its rate-hike track amid growing recession fears.
Also read: Gold Price Forecast: Bears cross to challenge XAU/USD bulls ahead of US inflation
Gold Price: Key levels to watch
The Technical Confluence Detector shows that the gold price eyes immediate cushion around $1,785, the convergence of the Fibonacci 23.6% one-week, SMA50 one-day and the pivot point one-day S1.
Bears will then attack the previous day’s low of $1,783, where the SMA5 one-day aligns. The next support awaits at the Fibonacci 38.2% one-week at $1,780.
The intersection of the Fibonacci 161.8% and SMA50 four-hour around $1,774 will be next on sellers’ radars, with the last line of defense for buyers seen at $1,770. At that level, the Fibonacci 61.8% one-week meets SMA10 one-day.
On the upside, a powerful resistance is pegged near $1,791, the meeting point of the SMA10 four-hour and the previous low four-hour. The next relevant barrier is seen at the Fibonacci 38.2% one-day at $1,793.
Acceptance above the previous week’s high of $1,795 is important to unleashing the further upside towards the $1,800 round figure.
Bulls will then aim for the $1,805 and $1,810 resistance levels, the Bollinger Band one-day Upper and the pivot point one-day R2 respectively.
Here is how it looks on the tool
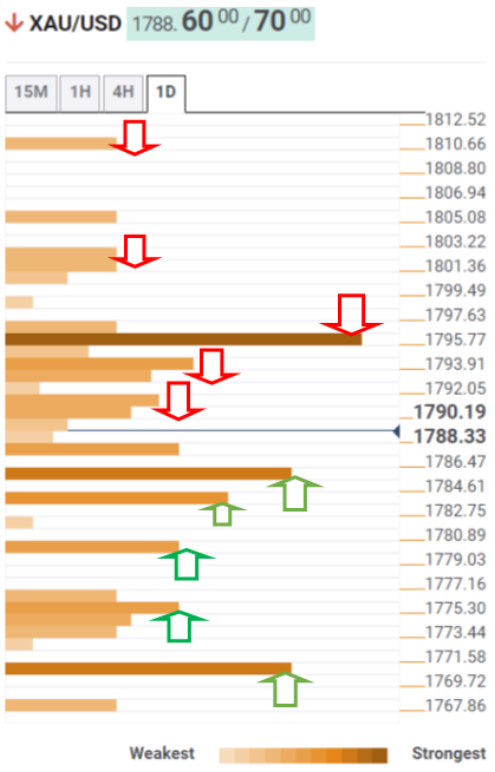
About Technical Confluences Detector
The TCD (Technical Confluences Detector) is a tool to locate and point out those price levels where there is a congestion of indicators, moving averages, Fibonacci levels, Pivot Points, etc. If you are a short-term trader, you will find entry points for counter-trend strategies and hunt a few points at a time. If you are a medium-to-long-term trader, this tool will allow you to know in advance the price levels where a medium-to-long-term trend may stop and rest, where to unwind positions, or where to increase your position size.
AUD/USD extends its pause. Nevertheless, analysts at Credit Suisse stay bearish whilst below the 200-day moving average (DMA) at 0.7155.
Scope for the pause to continue for now
“Whilst we see scope for the pause to continue for now, we maintain our core bearish outlook from a technical perspective and look for strength to eventually fade for a turn back lower to the YTD low at 0.6680, with a sustained close below here needed to prompt a deeper setback to the 61.8% retracement of the 2020/21 uptrend at 0.6461.”
“Whilst above 0.7069 would warn of a stronger recovery, only above the falling 200-DMA at 0.7155 would lead us to reevaluate our negative AUD/USD view.”
China’s inflation report for July was acceptable and showed few signs for concern. USD/CNY is flat on the data. Economists at Commerzbank expect the USD/CNY pair to move within the 6.70-6.80 range near-term.
Generally good news on inflation
“CPI picked up to 2.7% YoY. Core inflation, which excludes food and energy, remained subdued at 0.8% YoY in July and averaged just 1% year-to-date (YTD).”
“Headline inflation is just 1.8% YTD and well below the government’s target of 3% set earlier this year. If anything, there was in fact some good news with PPI inflation slowing to 4.2%. It is expected to moderate further for the rest of the year owing to the highest base in H2 last year.”
“For CNY, it is still in a wait-and-see mode and PBoC may be content to let it continue to trade within the 6.70-6.80 range near-term.”
Economists at Credit Suisse revise their EUR/CHF target downward from 0.9700 to 0.9400. They still believe that the fundamental drivers for a lower EUR/CHF are in place.
Daily close above 1.0060 to invalidate the target
“As we still believe that the fundamental drivers for a lower EUR/CHF are in place, we revise our target downward again to 0.9400.”
“As a level where we would consider our view incorrect, we suggest a daily NY close above 1.0060, down from 1.0525 previously.”
The price action in the Brazilian real in Q3 so far has been in line with a cautiously bullish view. However, economists at Commerzbank expect the USD/BRL pair to turn back higher.
Political risks are likely to remain a burdening factor
“In a market environment dominated by risk-off and with the end of the BCB's rate hike cycle in sight, the BRL is likely to struggle to maintain or even extend recent gains against the USD.”
“Political risks in the wake of the upcoming presidential elections in October are likely to remain a burdening factor.”
USD/CHF is edging towards the 0.9469/26 key support zone. Economists at Credit Suisse look for this area to continue to hold.
Break above 0.9668 is needed to shift the risk back higher
“With a number of key supports, which include the recent price low, a retracement support, the breakout point from April, and the 200-day average, all coinciding at 0.9469/9426, we look for the weakness to be held here and for an eventual upside towards the middle of the range to unfold.”
“Above 0.9668 is needed to shift the risk back higher within the range. In contrast, a sustained move below 0.9426 would negate the range and support a deeper decline to the potential uptrend from 2021 at 0.9277.”
- Advancing Treasury yields are indicating that the US CPI is likely to surprise on the upside.
- The upbeat US NFP has already bolstered the odds of status quo maintenance by the US Inflation.
- Fed’s Bullard sees interest rates at 4% by the end of CY2022.
The 10-year US Treasury yields are aiming to recapture the weekly high of 2.81% ahead of the release of the US Consumer Price Index (CPI). Bond buying is squeezing by the time as investors believe that the price pressures could surprise on the upside despite the downward consensus.
As per the preliminary estimates, a decent drop is expected in the plain-vanilla CPI by 40 basis points (bps) to 8.7%. Thanks to the oil prices, which remained vulnerable in July, and have trimmed inflation expectations. However, the US Nonfarm Payrolls (NFP) remained surprisingly upbeat than the expectations.
An addition of 528k jobs in July against the expectations of 250k has indicated that the overall demand is upbeat and investments are driving higher, which has led to a rise in employment generation. No doubt, the concept is indicating an elevation in price pressures. This may keep the odds of continuation of a hawkish stance intact.
The deviation between 10-year and two-year US Treasury yields is the widest since 2000 and therefore, recession fears are sky-rocketing. Fed's St. Louis President James Bullard has also warned for an upside surprise by the US CPI and is eyeing interest rates to 4% by the end of CY2022. The margin between current rates at 2.50-2.75% to 4% favors two more rate hikes: 50 bps and 75 bps, which are sufficient to place a recession situation in the US.
The Norwegian krone has been able to retrace the losses seen in early summer and is now trading under the 10 level. Economists at Commerzbank expect the EUR/NOK to move downward if the Norges Bank hikes rates substantially next week.
NOK strength and electricity shortage?
“If we see increasing indications of Norges Bank hiking rates again notably next week, while possibly also raising the rate path NOK might be able to regain further ground against the euro.”
“There is no risk of an imminent electricity crisis in Great Britain or other parts of Europe as long as there is no risk of power shortages in Norway. However, it does illustrate that we might see some side shows in the European energy crisis if the water levels in the Norwegian water reservoirs do not improve.”
Considering preliminary readings from CME Group for crude oil futures markets, traders increased their open interest positions by around 2.3K contracts on Tuesday after three consecutive daily retracements. Volume followed suit and rose by around 92.6K contracts, offsetting the previous daily drop.
WTI risks a move to $81.94
Prices of the WTI charted an inconclusive session on Tuesday, trespassing the $92.00 mark although ending the session just above $90.00 per barrel. The daily price action was accompanied by rising open interest and volume, leaving the door open to the continuation of the downtrend in the very near term. There is a decent support at $81.94 (January 24 low).
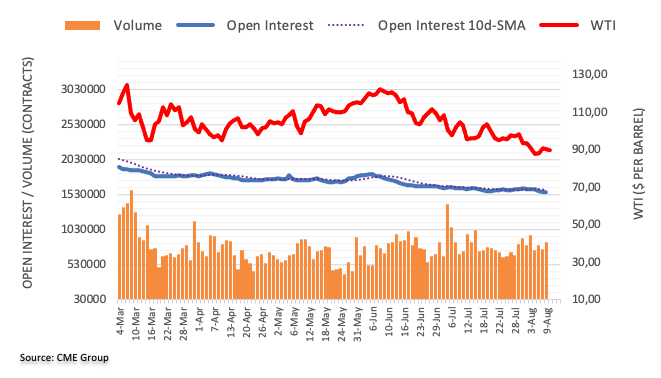
USD/JPY is seeing its consolidation phase as looked for following strength to just shy of the psychological 140.00 barrier. In the view of analysts at Credit Suisse, weakness stays seen as a correction in the long-term uptrend, although this may persist for some time yet.
Weekly MACD has crossed lower
“With weekly MACD crossing lower and with 10yr US Bond Yields maintaining a top we look for this corrective phase to extend further and potentially for a lengthy period of time.”
“Support is seen at 132.52 initially, below which would warn of a fall back to 130.40, then the 38.2% retracement of the 2022 rally at 129.50. We would not rule out a test of the ‘neckline’ to the multi-year base at 127.40, but our bias remains to look for an important floor in this 129.50/127.40 zone.”
“Big picture, we continue to view weakness as corrective, with our core long-term objective at 147.62/153.01 – the 38.2% retracement of the entire fall from 1982 and price high of 1998.”
In the view of economists at Commerzbank, the US inflation rate, due for publication today, will not cause the Fed to change its course. Therefore, the EUR/USD pair is set to remain within its current range of 1.00-1.04.
The Fed is likely to hike its key rate to 4% by year-end
“Even though today’s data might cause speculation on the market that inflation might have peaked I do not believe that this will be sufficient to change rate expectations massively.”
“The Fed is likely to hike its key rate to 4% by year-end according to our experts. The market is a little more cautious regarding the peak. As consensus too is expecting a slightly weaker CPI result for today (8.7%) this is unlikely to change and as a result, EUR/USD is likely to remain in its range.”
See – US CPI Preview: Forecasts from nine major banks, soaring inflation to ease off in July
Brent Crude Oil closed below its 200-day average last week but still holds the 38.2% retracement of the entire 2020/2022 uptrend at $92.09. A move below here is seen as needed to reinforce thoughts of an important turn lower, strategists at Credit Suisse report.
A top has not yet been confirmed
“A clear drop below the 38.2% retracement of the entire 2020/2022 uptrend at $92.09 is needed to reinforce thoughts of a top with support seen next at $86.70, which is the October 2021 high. However, this is not our base case for now.”
“Near-term resistance is seen at recent gap resistance at $104.43/106.90, which we are biased to cap.”
Open interest in gold futures markets extended the erratic performance and shrank by around 1.9K contracts on Tuesday according to advanced prints from CME Group. Volume reversed the previous daily drop and went up by around 19.5K contracts.
Gold remains capped by $1,800
Gold prices briefly tested the $1,800 mark on Tuesday, ending the session with decent gains. The daily uptick, however, was on the back of shrinking open interest, exposing some near-term correction. In the meantime, the $1,800 zone remains as the next target for bulls.
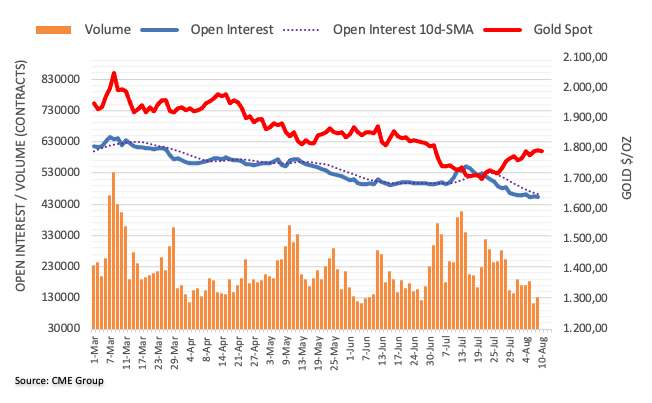
- NZD/USD remains mildly bid as bulls approach short-term resistance line amid sluggish session.
- Sustained trading beyond 50-HMA, firmer RSI adds strength to bullish bias.
- One-week-old horizontal support area adds to the downside filters.
NZD/USD picks up bids to 0.6290 as buyers struggle to keep reins during the dicey session heading into the European open on Wednesday.
In doing so, the Kiwi pair justifies the sustained trading beyond the 50-HMA, as well as the recently firmer RSI (14), amid an inactive trading day ahead of the US inflation data.
However, a downward sloping resistance line from the last Thursday, near the 0.6300 threshold by the press time, appears to challenge immediate NZD/USD upside moves.
Following that, a run-up towards the monthly peak of 0.6352 can’t be ruled out. However, the quote’s upside past-0.6352 appears difficult amid the likely overbought RSI on the short time frame at that place.
Should the NZD/USD remains firmer above 0.6352, the mid-June swing high near 0.6400 could return to the charts.
On the contrary, the 50-HMA level of 0.6280 restricts the immediate downside of the NZD/USD pair.
Following that, the 61.8% Fibonacci retracement of July 27 to August 01 up-moves, near 0.6250, will precede the one-week-old horizontal support zone around 0.6210 to challenge further declines of the Kiwi pair.
If at all the NZD/USD remains bearish past 0.6210, the 0.6200 may act as the last defense of the bulls before directing prices towards the yearly low marked in July near 0.6060.
NZD/USD: Hourly chart
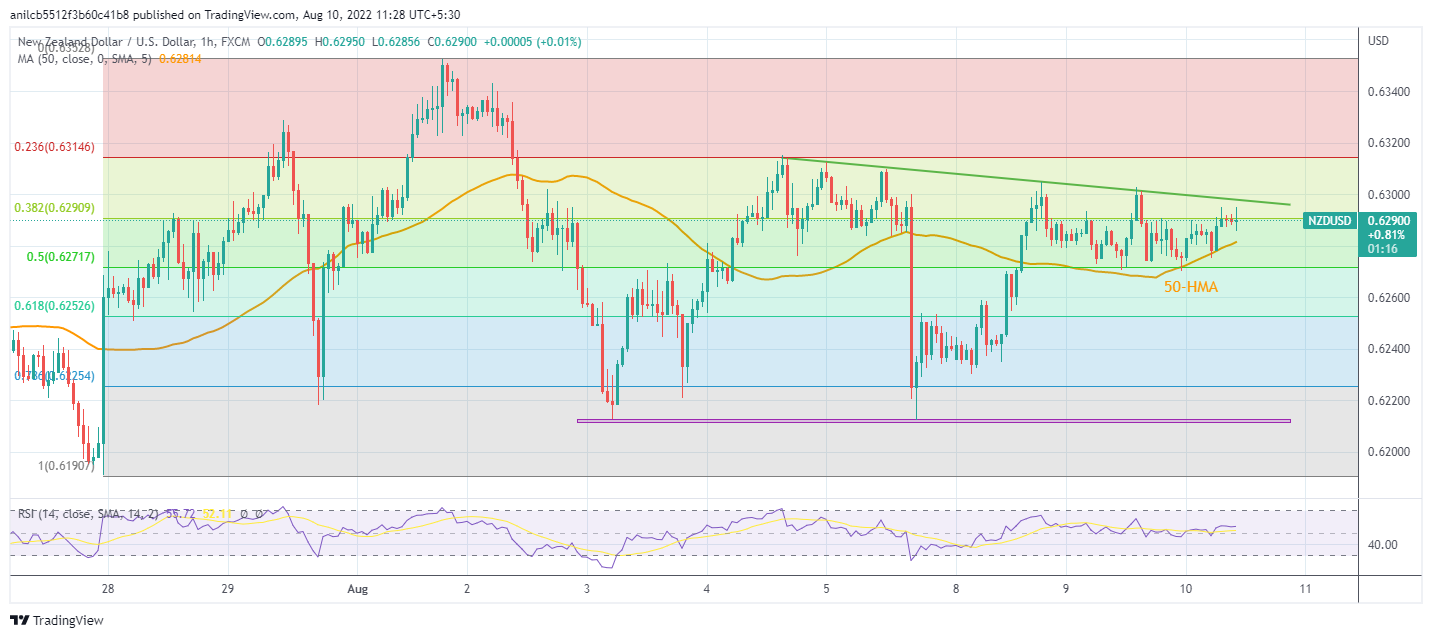
Trend: Pullback expected
FX option expiries for August 10 NY cut at 10:00 Eastern Time, via DTCC, can be found below.
- EUR/USD: EUR amounts
- 1.0050-55 674m
- 1.0100 874m
- 1.0145-50 555m
- 1.0160 254m
- 1.0170-75 1.84b
- 1.0185 544m
- 1.0195-05 690m
- 1.0210-20 1.95b
- 1.0225 300m
- 1.0260 398m
- GBP/USD: GBP amounts
- 1.1990-00 277m
- 1.2040-50 558m
- USD/JPY: USD amounts
- 133.90-00 1.18b
- 134.05-15 718m
- USD/CHF: USD amounts
- 0.9420 350m
- AUD/USD: AUD amounts
- 0.6900-10 307m
- 0.6985-0.7000 735m
- USD/CAD: USD amounts
- 1.2900 1.4b
- EUR/GBP: EUR amounts
- 0.8670 524m
- USD/ZAR: USD amounts
- 16.50 260m
Gold price hovers below $1,800 but well above the bearish 50-Daily Moving Average (DMA), now at $1,785. The yellow metal could defy the bearish odds if the US inflation shows signs of peaking, FXStreet’s Dhwani Mehta reports.
Bear cross to challenge XAU/USD bulls ahead of US inflation
“A failure to sustain above 50 DMA at $1,785 will revive bearish interest, triggering a drop towards Monday’s low of $1,771, below which the $1,765 demand area will come into play.”
“The August 3 high of $1,754 and the $1,750 psychological level could be tested if the US CPI surprises on the upside and jacks up big Fed rate hike bets.”
“With the 100 DMA having crossed 200 DMA for the downside, a bear cross is confirmed, which keeps sellers hopeful.”
“Gold bulls need acceptance above the $1,800 mark to continue with their recovery momentum. Bulls will then guard the July 5 high at $1,812 should the rebound gain traction.”
See – US CPI Preview: Forecasts from nine major banks, soaring inflation to ease off in July
The US Treasury yield curve is likely to deepen further amid the aggressive Fed tightening policy, Meghan Swiber, Director of US rates strategy at Bank of America (BofA), noted.
Key quotes (via Bloomberg)
While US inversions beyond 50 basis points have been rare in recent decades, “there is no natural limit on how inverted the 2s10s curve can go.”
The prospect of a hard landing for the US economy, “will likely skew curves flatter as hikes near term will probably be viewed as needed cuts in the future.”
If growth remains strong, “the curve may continue to flatten but to a lesser extent with longer-dated tenors also supported.”
Should “hold curve flattening positions until inflation and employment data moderate, given possible further upward re-pricing of the terminal rate.”
- A 50% Fibo retracement at 0.8463 is acting as a major barricade for the cross.
- An establishment in a bullish range (60.00-80.00) by the RSI (14) indicates bullish momentum.
- The 200-EMA is still untouched, however, the upside momentum warrants a break of the same.
The EUR/GBP pair is displaying wild swings as investors are reshuffling their positions ahead of the European session. The cross has remained in the 0.8443-0.8459 range after a modest rally from a low of 0.8410 recorded on Monday.
After a decent rally, the shared currency bulls are struggling to overstep the 50% Fibonacci retracement (which is placed from July 21 high at 0.8586 to the August 2 low at 0.8340) at 0.8463.
The cross has firmly established above the 50-period Exponential Moving Average (EMA) at 0.8422, which indicates that the short-term bull trend is intact. However, the 200-EMA is still above the asset prices at around 0.8467 and may get violated sooner.
Meanwhile, the Relative Strength Index (RSI) (14) has shifted into the bullish range of 60.00-80.00,w which indicates that upside momentum is intact.
A confident violation of the 50% Fibo retracement at 0.8463 will strengthen the shared currency bulls further and will drive the asset towards July 22 low at 0.8487, followed by the psychological resistance at 0.8500.
On the flip side, the pound bulls could drag the cross towards July 31 high at 0.8400 and August 1 low at 0.8352 if the asset drops below July 12 low at 0.8433.
EUR/GBP four-hour chart
-637957067712627572.png)
- USD/CHF picks up bids to reverse recent losses inside the daily trading range.
- US dollar traces yields ahead of the key CPI data amid recession woes, recently up hawkish Fed bets.
- Sluggish markets, light calendar amplified pre-data anxiety, equity futures stay indecisive.
USD/CHF treads water around 0.9560, despite picking up bids ahead of Wednesday’s European session, as markets remain quiet amid a cautious mood before the US inflation data release.
While portraying the market’s action, the US 10-year Treasury yields struggle to extend the previous day’s rebound to 2.79%, around 2.797% by the press time. On the same line is the S&P 500 Futures that drops 0.08% intraday to 4,121 at the latest, by tracking Wall Street’s losses. It should be noted that the US Dollar Index (DXY) retreats from an intraday high while snapping a two-day downtrend with mild gains around 106.30.
The market’s anxiety ahead of the US Consumer Price Index (CPI) data for July appears to restrict the pair’s latest moves. The inflation numbers become even more important of late as the recently firmer US jobs report underpinned the hawkish Fed bets.
On Tuesday, US Nonfarm Productivity improved to -4.6% during the second quarter (Q2), -4.7% expected and -7.4% prior, whereas the Unit Labor Cost increased to 10.8% from 12.7% prior and 9.5% market consensus during the said period. Before that, the US Nonfarm Payrolls (NFP) and Unemployment Rate also flashed welcome signs for July. Following the data, St. Louis Fed President James Bullard said on Tuesday that he wants rates at 4% by the end of the year. This joins recently firmer interest rate futures suggesting nearly 70% odds favoring the 75 basis points (bps) of a Fed rate hike in September.
It’s worth mentioning that the recession fears emanating from Europe and China’s downbeat inflation data, published earlier in Asia, also challenge the risk appetite.
Moving on, the US CPI is expected to ease to 8.7% from 9.1% on YoY while the CPI ex Food & Energy could rise from 5.9% to 6.1% during the stated month, per the latest market consensus. Should the US inflation remain firmer the US dollar will have a reason to extend the latest rebound amid hawkish expectations from the Fed.
Also read: US CPI Preview: It is the hard core that counts, five scenarios for critical inflation data
Technical analysis
A sustained pullback from the 100-DMA, around 0.9630 by the press time, directs USD/CHF bears towards the latest low near 0.9470. However, the 200-DMA support at around 0.9430 could challenge the bears afterward.
USD/CAD retreats to 1.2885 inside the 20-pip daily trading range heading into Wednesday’s European session. In doing so, the Loonie pair justifies the options market signals that tease bears of late.
That said, the one-month risk reversal (RR) of the USD/CAD, a spread between the call options and the put options, drop for the second consecutive day to -0.020 by the end of Tuesday’s North American session. With this, the weekly RR prints the biggest fall in four weeks.
It should be noted, however, that the market’s anxiety ahead of the US Consumer Price Index (CPI) data for July appear to challenge the pair’s latest moves. The inflation numbers become even more important of late as the recently firmer US jobs report underpinned the hawkish Fed bets.
On Tuesday, US Nonfarm Productivity improved to -4.6% during the second quarter (Q2), -4.7% expected and -7.4% prior, whereas the Unit Labor Cost increased to 10.8% from 12.7% prior and 9.5% market consensus during the said period. Before that, the US Nonfarm Payrolls (NFP) and Unemployment Rate also flashed welcome signs for July.
Additionally, St. Louis Fed President James Bullard said on Tuesday that he wants rates at 4% by the end of the year. This joins recently firmer interest rate futures suggesting nearly 70% odds favoring the 75 basis points (bps) of a Fed rate hike in September.
It’s worth noting that the US CPI is expected to ease to 8.7% from 9.1% on YoY while the CPI ex Food & Energy could rise from 5.9% to 6.1% during the stated month, per the latest market consensus.
Also read: USD/CAD struggles to regain 1.2900 on softer oil, firmer USD ahead of US inflation
- GBP/USD is juggling in six-pips as investors are expected to create positions post US Inflation data.
- For Fed’s neutral stance, a spree of a slowdown in price pressures is required.
- The UK's GDP is expected to remain vulnerable ahead.
The GBP/USD pair is displaying topsy-turvy moves in a range of 1.2079-1.2085 after a mild recovery from a low near 1.2070. Investors have preferred to remain on the sidelines ahead of the US Consumer Price Index (CPI) data, which is highly expected to surprise the market participants this time.
The investing community is aware of the fact that soaring oil prices remained responsible for driving the price pressures to the sky. Now, fixed supply worries and a gloomy demand outlook on the oil front resulted in a steeper fall in oil prices. And, its multiplier effect will be witnessed in the inflation rate.
The street estimates are indicating a decent drop in the plain-vanilla inflation rate by 40 basis points (bps) to 8.7% from the prior release. Whereas, the core CPI that doesn’t inculcate oil and food prices is expected to elevate to 6.1% from the prior release of 5.9%.
For the Federal Reserve (Fed) to remain calm and turn neutral, a series of drops in the cost-push inflation is desired. A one-time slowdown in the price pressures won’t be enough to trim the journey towards the neutral rate, however, exhaustion signals would delight Fed policymakers.
On the UK front, the Gross Domestic Product (GDP) is expected to land at -0.2% vs. 0.8% in the prior release. And, the annual data is indicating a downward shift to 2.8% against the prior release of 8.7%. Also, the estimates for Manufacturing Production data are not displaying a rosy picture. The economic data is likely to tumble to 1.3% from the former print of 2.3%. This may keep the pound bulls on the back foot.
- Steel price retreats amid cautious markets, fears of less margin on the production front.
- Softer China inflation, economic slowdown concerns join pre-CPI anxiety to weigh on sentiment.
- The anticipated increase in output joins firmer coke prices to challenge profits of steel producers.
Steel price tracks other commodities to the south as market players await the key US inflation data on early Wednesday. Also exerting downside pressure on the metal are the softer Consumer Price Index (CPI) and Producer Price Index (PPI) data from China.
That said, the most active Steel rebar contract on the Shanghai Futures Exchange (SFE) renews the intraday low 4,050 yuan, down nearly 1.5%, while extending the previous day’s pullback from the monthly high. It’s worth noting that the prices of the hot-rolled coil and stainless steel futures on the SFE are also down 1.5% and 1.2% by the press time.
China’s headline CPI eased to 2.7% YoY in July versus 2.9% expected and 2.5% prior, whereas the PPI dropped to 4.2% compared to 8.0% market forecasts and 6.1% previous readings during the stated month.
On the other hand, recently increasing steel output propelled coke prices and hence eat away profits, which in turn could fade the incentive to increase steel production. The same joins China’s plans to reduce output citing environmental issues to keep steel buyers hopeful. Additionally, firmer China car production data also underpin optimism on the metal front.
However, hopes that Chinese steel output may increase in August, per SMM Survey, joins the market’s risk-off mood to pour cold water on the face of the metal bulls.
Elsewhere, chatters that the US tax, climate and health-care bill won’t be able to tame recession woes, as per JP Morgan, join the fears of more hardships for the Eurozone due to the Russian energy crisis to underpin the risk-aversion.
Amid these plays, the US 10-year Treasury yields struggle to extend the previous day’s rebound to 2.79%, around 2.786% by the press time. Also portraying the sluggish market is the S&P 500 Futures that remains unchanged at 4,125 at the latest, despite Wall Street’s losses.
Looking forward, the US CPI, expected to ease to 8.7% from 9.1% on YoY, as well as the CPI ex Food & Energy which is likely to rise from 5.9% to 6.1%, will be crucial for steel traders to watch for clear directions.
- Asian equities have dropped sharply as investors have turned risk-averse ahead of US Inflation.
- China’s inflation has increased to 2.7% but remained lower than expectations of 2.9%.
- Oil prices have slipped back below $90.00 on inventory buildup reported by API.
Markets in the Asian domain are displaying a vulnerable performance as investors have turned risk-averse ahead of the US Consumer Price Index (CPI). Asian indices have trimmed sharply despite lower consensus for the plain-vanilla US inflation. As per the market consensus, the annual US CPI is expected to shift lower to 8.7% from the prior release of 9.1%.
At the press time, Japan’s Nikkei225 tumbled 0.78%, China A50 plunged 1.19%, Hang Seng dived 2.05%, and Nifty50 eased 0.28%.
Investors have preferred to trim their positions ahead of the US inflation as the cost pressures are expected to scale down. No doubt, the forecasts are lower but upbeat US Nonfarm Payrolls (NFP) has indicated that the inflation rate could surprise on the upside. Whether the cost-push inflation releases lower or maintains its status quo, Federal Reserve (Fed)’s stance would remain unnerved.
Chinese indices have declined sharply after the release of the inflation data. The National Bureau of Statistics of China reported a higher Consumer Price Index (CPI) at 2.7% than the prior release of 2.5%. However, the annual cost pressures remained lower than the expectation of 2.7%. The monthly data remains in line with the estimates of 0.5%.
The inflation universe constituent, which measures the average price change received by the Chinese producers, the Producer Price Index (PPI), remained extremely lower at 4.2% than the forecasts of 8% and the prior release of 6.1%.
On the oil front, oil prices have failed to establish above the psychological resistance of $90.00 as the American Petroleum Institute (API) has reported a buildup of crude inventory by 2.156 million barrels. A consecutive buildup of oil inventory indicates that the demand for oil is gloomy. Apart from that, a promise of more oil pumping by the OPEC+ is already weighing pressure on the black gold.
- AUD/USD remains indecisive below 200-HMA inside bullish chart formation.
- RSI, MACD hints at further weakness, 200-HMA guards immediate upside.
- Bulls need validation from 0.6980 resistance, weekly horizontal support tests bears.
AUD/USD retreats to 0.6960 while portraying sluggish moves inside a short-term bull flag. That said, the Aussie pair recently eased from the 200-HMA during Wednesday’s Asian session.
Given the lower high in RSI (14) backing the latest weakness in the AUD/USD prices, as well as the bearish MACD signals, the quote is likely to remain depressed inside a flag, currently between 0.6940 and 0.6980.
It’s worth noting that the 23.6% Fibonacci retracement level of August 01-05 declines, near 0.6910, could test the AUD/USD bears after 0.6940. However, a one-week-old horizontal area near 0.6885 might restrict the Aussie pairs’ further downside.
On the contrary, the 200-HMA level near 0.6965 guards the quote’s immediate recovery.
Following that, the stated flag’s upper line, close to 0.6980 by the press time, holds the key to the AUD/USD pair’s rally.
During the rise, the Aussie pair may take a breather around tops marked on Monday and on August 01, near 0.6995 and 0.7045-50 in that order, ahead of fueling the run-up towards the theoretical target surrounding 0.7080.
AUD/USD: Hourly chart
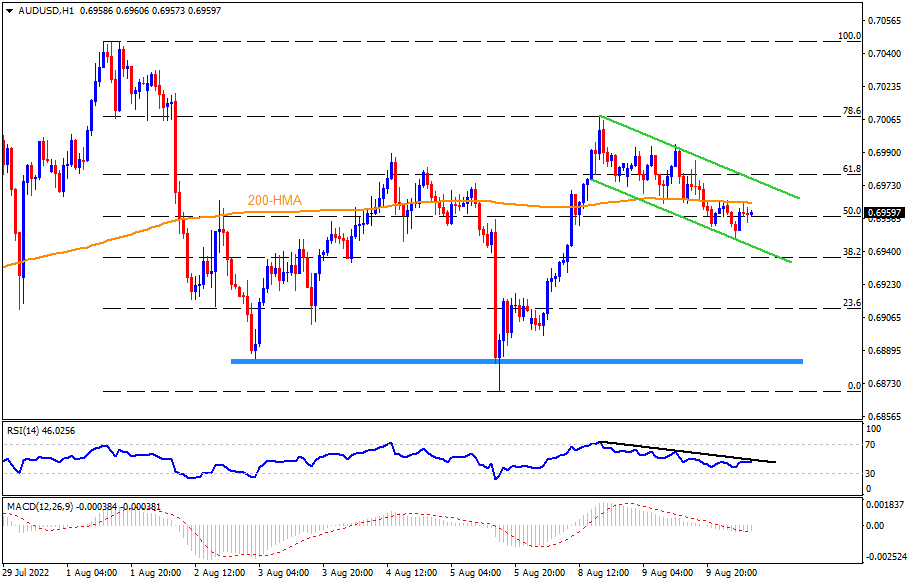
Trend: Pullback expected
- USD/INR is expected to stretch its valuations after overstepping the weekly high at around 79.80.
- A one-time drop in US inflation won’t be sufficient to trim Fed's hawkish stance.
- Oil prices have failed to recapture the $90.00 territory.
The USD/INR pair is displaying wild moves in the opening session after a holiday of Muharram as investors are paring their stretched positions. The asset has remained bullish in the entire month and is expected to extend gains after overstepping the weekly high at around 79.80.
In today’s session, investors’ entire focus will remain on the US Consumer Price Index (CPI). The plain-vanilla US inflation is expected to trim to 8.7% from the prior release of 9.1%. Well, the Federal Reserve (Fed) policymakers are doing the laborious job of containing price pressures by deploying policy tightening measures for the past six months. Signs of exhaustion are in front of us, thanks to the weaker oil prices in June.
However, the case is temporary as a promise of higher supply by the oil cartel won’t sustain due to the unavailability of additional production capacity. Also, a one-time slowdown signal is not sufficient to compel Fed chair Jerome Powell to sound less hawkish. In addition to that, higher job addition in the US labor force in July has refreshed signs of soaring price pressures in the US economy.
On the Indian rupee front, the return of Foreign Portfolio Investors (FPIs) on Dalal Street is likely to support the Indian rupee bulls. Meanwhile, oil prices have failed to sustain above the psychological resistance of $90.00. This may bring offers again to the table and the Indian economy, being a major oil consumer will be delighted with the declining oil prices.
- Gold price takes offers to renew intraday low, reverses from monthly top.
- US dollar traces sluggish yields, dicey market sentiment ahead of US CPI for July.
- Softer US inflation can join technical details to favor XAU/USD bulls targeting $1,805.
Gold price (XAU/USD) reverses the from the monthly top, snapping two-day uptrend, as the sellers attack the $1,790 mark during early Wednesday morning in Europe. In doing so, the precious metal portrays the market’s anxiety ahead of the US inflation statistics, amid increasing hawkish bets on the US Federal Reserve’s (Fed) next move.
Other than the pre-CPI caution, the fears of economic slowdown also weigh on the XAU/USD prices. That said, fears of economic slowdown escalated after Russia announced a stoppage of oil flow, due to a halt in the Druzhba pipeline supplying the black gold. “Russia reportedly suspended oil flows via the southern leg of the Druzhba pipeline, amid transit payment issues,” said Reuters.
On the other hand, chatters that the US tax, climate and health-care bill won’t be able to tame recession woes, as per JP Morgan, also weigh on the bullion prices. “The bill passed the Senate on Sunday and is headed for the House on Friday, puts a slimmed-down version of President Joe Biden’s domestic agenda on a path to becoming law after a year of Democratic infighting that the White House was unable to control,” said analysts from the US bank per Bloomberg.
Elsewhere, firmer prints of the second-tier US data and hawkish Fedspeak also played their role in marking the risk-off mood and challenging the XAU/USD buyers.
On Tuesday, US Nonfarm Productivity improved to -4.6% during the second quarter (Q2), -4.7% expected and -7.4% prior, whereas the Unit Labor Cost increased to 10.8% from 12.7% prior and 9.5% market consensus during the said period. Additionally, St. Louis Fed President James Bullard said on Tuesday that he wants rates at 4% by the end of the year. This joins recently firmer interest rate futures suggesting nearly 70% odds favoring the 75 basis points (bps) of a Fed rate hike in September.
Against this backdrop, the US 10-year Treasury yields struggle to extend the previous day’s rebound to 2.79%, around 2.786% by the press time. Also portraying the sluggish market is the S&P 500 Futures that remains unchanged at 4,125 at the latest, despite Wall Street’s losses.
Moving on, the US CPI, expected to ease to 8.7% from 9.1% on YoY, as well as the CPI ex Food & Energy which is likely to rise from 5.9% to 6.1%, will be crucial for gold traders to clear directions.
Technical analysis
Gold price remains above the $1,785 support confluence despite the recent pullback from a one-month-high. Also teasing the XAU/USD buyers is the firmer RSI (14), not overbought, as well as bullish MACD signals.
That said, the 50-DMA joins the previous resistance line from March and a three-week-old ascending trend line to highlight the $1,785 as crucial support, a break of which could quickly drag the metal prices towards the previous weekly low near $1,754.
On the contrary, June’s bottom surrounding $1,805 could lure XAU/USD buyers during the quote’s fresh upside moves. Following that, the 38.2% and 50% Fibonacci retracement levels of the March-July downturn, close to $1,830 and $1,875 in that order, might gain the gold bull’s attention.
Overall, gold is likely to remain firmer until the quote stays beyond $1,785.
Gold: Daily chart
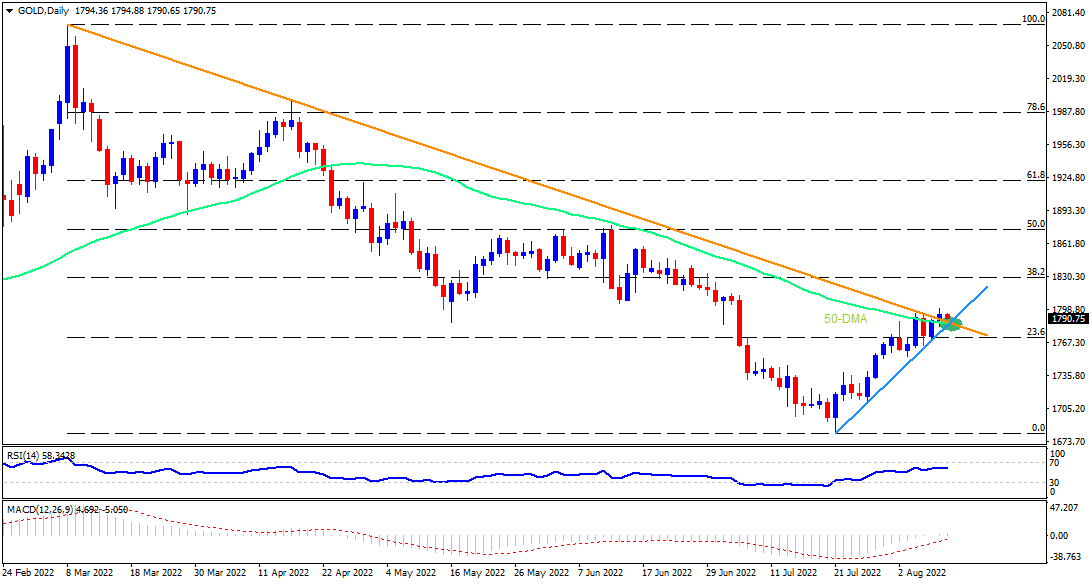
Trend: Further upside expected
Xiao Qian, the top representative of China's Communist Party in Australia, responded to the Australian-Sino trade conflict and the issue of the political imprisonment of an Australian in China on Wednesday.
Xiao said, "Currently, there have been top-level communications, high-level contacts even face-to-face contacts, but we have not yet come to the stage to discuss how to solve those specific issues either political issues or trade issues or some other individual cases issues.”
“We're ready to compare notes with the new government and to get engaged in the process,” he added.
Following the Japanese Cabinet reshuffle on Wednesday, the country’s Finance Minister Shunichi Suzuki said that Japan’s financial position is still severe.
He added that “it's critical to continue reacting to covid and inflation.”
Market reaction
Amidst the Japanese political news and a renewed US dollar selling, USD/JPY breached the 135.00 level.
The spot was last seen trading at 134.94, down 0.15% on the day.
- EUR/USD picks up bids to reverse early Asian session losses, stays mildly bid around weekly top.
- DXY tracks sluggish yields even as Fedspeak favors 75 bps rate hike in September.
- Russian oil pipeline halt, softer China inflation underpin recession fears and the US dollar.
- Final readings of Germany’s HICP inflation for July can entertain traders ahead of US CPI.
EUR/USD grinds higher around the daily top surrounding 1.0220 during the early European morning on Wednesday. The major currency pair recently cheered the US dollar rebound but the cautious mood ahead of the inflation numbers from Germany and the US appear to challenge the pair buyers.
Fears of economic slowdown escalated after Russia announced a stoppage of oil flow, due to a halt in the Druzhba pipeline supplying the black gold. “Russia reportedly suspended oil flows via the southern leg of the Druzhba pipeline, amid transit payment issues,” said Reuters.
On the same line were the talks that the US stimulus bill to battle inflation could do little to avoid economic slowdown. “The landmark tax, climate and health-care bill, which passed the Senate on Sunday and is headed for the House on Friday, puts a slimmed-down version of President Joe Biden’s domestic agenda on a path to becoming law after a year of Democratic infighting that the White House was unable to control,” said JP Morgan per Reuters.
Elsewhere, softer prints of China’s inflation for July also weigh on the market’s mood. China’s headline Consumer Price Index (CPI) eases to 2.7% YoY in July versus 2.9% expected and 2.5% prior. Further, the Producer Price Index (PPI) dropped to 4.2% compared to 8.0% market forecasts and 6.1% in previous readings.
Talking about the mood, the US 10-year Treasury yields struggle to extend the previous day’s rebound to 2.79%, around 2.786% by the press time. Also portraying the sluggish market is the S&P 500 Futures that remains unchanged at 4,125 at the latest, despite Wall Street’s losses.
It should be noted that St. Louis Fed President James Bullard said on Tuesday that he wants rates at 4% by the end of the year. This joins recently firmer interest rate futures suggesting nearly 70% odds favoring the 75 basis points (bps) of a Fed rate hike in September.
Looking forward, to the final readings of Germany’s Harmonized Index of Consumer Prices (HICP) Inflation data for the said month. However, major attention will be given to the US CPI, expected to ease to 8.7% from 9.1% on YoY, as well as the CPI ex Food & Energy which is likely to rise from 5.9% to 6.1%.
Given the hawkish expectations from the Core CPI, as well as from the Fed, the US dollar may witness further upside in case of the strong inflation prints for July.
Technical analysis
EUR/USD remains above the 21-DMA and a two-week-old support line, respectively around 1.0175 and 1.0150, which in turn keeps buyers hopeful of refreshing the monthly high near 1.0300. However, a downward sloping resistance line from March, close to 1.0330 at the latest, appears a tough nut to crack for the bulls.
- A consolidation above the 200-EMA adds to the upside filters.
- The RSI (14) is oscillating in a 40.00-60.00 range and awaits a potential trigger.
- For more upside, the greenback bulls need to break above the 134.34-135.58 range decisively.
The USD/JPY pair has witnessed mild selling pressure after printing an intraday high of 135.24 in the Asian session. The asset is walking northwards briskly to recapture its two-week high at 135.58. However, a slower upside move signals exhaustion and could trigger downside momentum at any time.
Movement in a marked territory for the past three trading sessions is indicating the unavailability of a potential trigger for a decisive move. The asset is oscillating in a 134.34-135.58 range and is likely to remain lackluster till the announcement of the US Consumer Price Index (CPI) data.
The asset is comfortably established above the 200-period Exponential Moving Average (EMA) at 135.58, which adds to the upside filters. Also, the 50-EMA at 134.90 is advancing higher, which warrants a bullish short-term scenario.
Meanwhile, the Relative Strength Index (RSI) (14) is oscillating in the 40.00-60.00 range and advocates a wait and watch approach.
A decisive break above Monday’s high at 135.58 will drive the asset towards July 26 high at 136.27, followed by the round-level resistance at 137.00.
On the contrary, the yen bulls could regain control if the asset drops below Friday’s low at 132.52. An occurrence of the same will drag the asset towards the August 1 low at 131.60 and the August 2 low at 130.39.
USD/JPY hourly chart
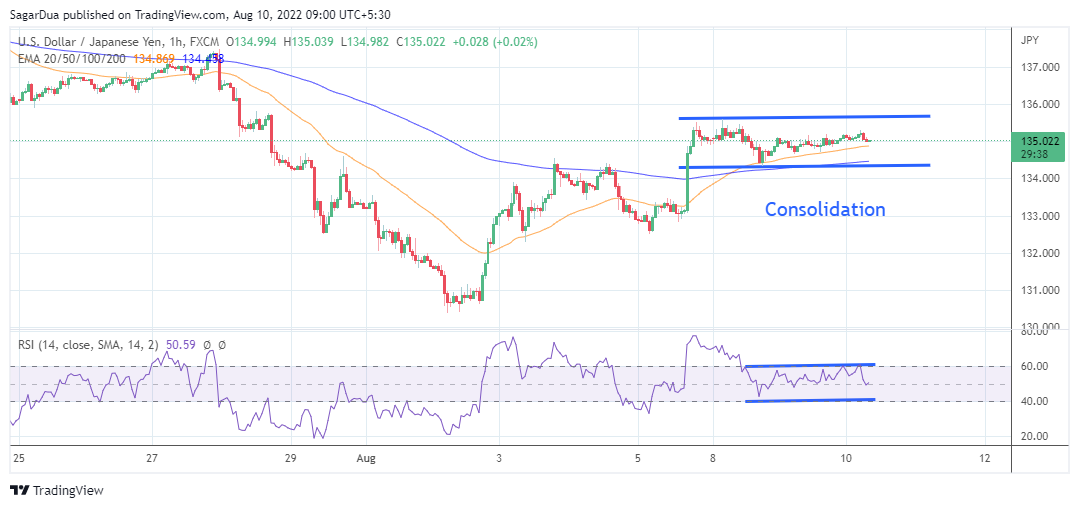
- NZD/USD is scaling towards 0.6300 as the DXY has declined ahead of US CPI.
- A lower consensus for the US CPI has forced investors to dump the DXY.
- China's inflation has increased to 2.7% but remained lower than expectations.
The NZD/USD pair is advancing sharply towards the round-level resistance of 0.6300 after the National Bureau of Statistics of China reported a higher Consumer Price Index (CPI) at 2.7% than the prior release of 2.5%. However, the annual cost pressures remained lower than the expectation of 2.7%. The monthly data remains in line with the estimates of 0.5%.
The inflation universe constituent, which measures the average price change received by the Chinese producers, the Producer Price Index (PPI), remained extremely lower at 4.2% than the forecasts of 8% and the prior release of 6.1%. Well, the initiations of bids for the antipodean seem backed by a drop in the US dollar index (DXY).
The mighty US dollar index (DXY) has delivered a downside break of the consolidation formed in a 106.30-106.40 range. A bearish open rejection-reverse formation in the DXY has underpinned a risk-on market mood. The market participants are expected to dump the DXY ahead of the US CPI data release. The consensus for the plain-vanilla US CPI is lower at 8.7% than the former figure of 9.1% as oil prices have remained vulnerable in July.
O the kiwi front, inflation expectations released at 3.07% on Monday, lower than the prior release of 3.29% is considered a sign of exhaustion in the price pressures but more warrants for the claim are still desired.
For now, price pressures are already soaring in the NZ economy and have not displayed a meaningful exhaustion sign yet. As per the June print, an inflation rate of 7.3% is sufficient to create headwinds for the households.
| Raw materials | Closed | Change, % |
|---|---|---|
| Silver | 20.522 | -0.66 |
| Gold | 1794.21 | 0.32 |
| Palladium | 2214.38 | -0.54 |
According to a state media outlet, China released a whitepaper on the Taiwan situation this Wednesday.
Key takeaways
China reiterates its policy of 'one country, two systems' for Taiwan.
China says it will not rule out the use of force.
more to come ....
- AUD/JPY fades bounce off intraday low after softer-than-expected China data.
- China CPI, PPI dropped below market forecasts in July, Japan PPI improved on YoY.
- Sluggish yields, cautious mood act as extra barriers to trading.
- US inflation data will be important for market players amid talks of the Fed’s aggression, economic slowdown.
AUD/JPY pays a little heed to softer China data on Wednesday, staying sidelined near 94.00 amid the mid-Asian session. The cross-currency pair’s inaction could be linked to the sluggish US Treasury yields amid the market’s cautious mood ahead of the US Consumer Price Index (CPI) for July.
China’s headline CPI eased to 2.7% YoY in July versus 2.9% expected and 2.5% prior. Further, the Producer Price Index (PPI) dropped to 4.2% compared to 8.0% market forecasts and 6.1% previous readings. Earlier in the day, Japan’s PPI for July matched 0.4% MoM forecasts but rose to 8.6% YoY versus 8.4% market consensus.
Elsewhere, the US 10-year Treasury yields struggle to extend the previous day’s rebound to 2.79%, around 2.786% by the press time. Also portraying the sluggish market is the S&P 500 Futures that remains unchanged at 4,125 at the latest, despite Wall Street’s losses.
It should be noted that the mixed data from Australia and China joined firmer yields to weigh on the AUD/JPY prices the previous day. That said, National Australia Bank’s Business Conditions and Business Confidence data for July printed upbeat results as the former rose to 20, versus 15 market consensus and 13 prior. Further, Business Confidence matched 7 forecasts while rising past 1 prior. On the contrary, Australia’s Westpac Consumer Confidence Index for August eased to 81.2, below 83.8 prior. Also, China marked a 20.1% YoY gain in passenger car sales during July, per china auto industry body CPCA.
On the other hand, MNI cited people familiar with the Japanese central bank's thinking to mention that the Bank of Japan (BOJ) expects prices to rise more quickly than officials had anticipated at their July meeting. “The jump in inflation to 3% or higher later this year, however, will not be enough to prompt any shift in its easy policy stance unless it feeds into an acceleration of wages next spring,” added MNI.
Elsewhere, the political uncertainty, suggesting Japanese Prime Minister Fumio Kishida’s readiness for shuffling the cabinet, also should have weighed on the JPY but did not. Finance Minister Shunichi Suzuki is likely to retain his position, per Reuters, which in turn flashes no major challenges for the Bank of Japan’s (BOJ) easy money policies. The same should keep the JPY bears hopeful.
Looking forward, AUD/JPY traders should pay attention to the risk headlines surrounding the economic slowdown in Europe, mainly due to the Russian halt of oil supplies. Also important to watch will be the chatters surrounding the BOJ’s next move and the US CPI data for July.
Technical analysis
AUD/JPY sellers need validation from the 50-DMA level surrounding 93.85 to extend the previous day’s losses. Until then, the looming bull cross on the MACD and firmer RSI favor the buyers to aim for the weekly top near 94.45.
- USD/CNH snaps two-day downtrend after softer-than-expected China CPI, PPI for July.
- Bulls pierced weekly resistance line, 200-HMA after data, sustained break of 6.7600 awaited for further upside.
- 61.8% Fibonacci retracement level, ascending trend line from July 31 restrict immediate downside.
USD/CNH remains firmer around the daily top after China flashed downbeat inflation numbers for July. That said, the offshore Chinese yuan (CNH) pair marks the first daily gains in three while grinding higher around 6.7600.
China’s headline Consumer Price Index (CPI) eases to 2.7% YoY in July versus 2.9% expected and 2.5% prior. Further, the Producer Price Index (PPI) dropped to 4.2% compared to 8.0% market forecasts and 6.1% previous readings.
Following the data, the USD/CNH bulls crossed the 6.7600 key hurdle comprising the 200-HMA and a one-week-old descending resistance line, before retreating from 6.7600.
However, a pick-up in the RSI (14) and the quote’s successful trading above the 61.8% Fibonacci retracement of July 29 to August 02 upside, near 6.7540, keeps the USD/CNH buyers hopeful.
That said, the weekly top surrounding 6.7710 is likely luring the pair buyers of late, a break of which could direct the north-run towards the monthly peak of 6.7955 and then to the 6.8000 threshold.
Meanwhile, pullback moves remain elusive beyond the 61.8% gold ratio near 6.7540. Also acting as a downside filter is the seven-day-long support line close to 6.7485.
In a case where USD/CNH drops below 6.7485, the odds of its slump to the late July low near 6.7285 can’t be ruled out
USD/CNH: Hourly chart
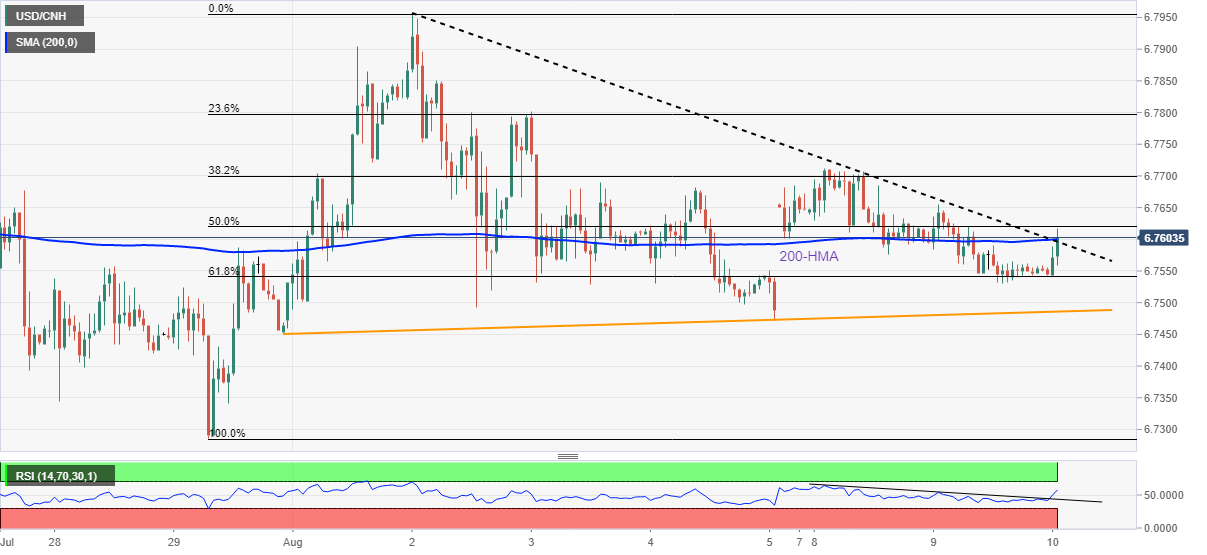
Trend: Further upside expected
- AUD/USD remains pressured for the second consecutive day, recently pushed by China inflation data.
- China CPI, PPI rose more than market forecasts in July.
- Risk appetite remains dicey ahead of the US inflation data, US dollar traces sluggish yields.
- Firmer US CPI could joins hawkish Fedspeak to underpin USD run-up.
AUD/USD holds lower ground near 0.6960 during Wednesday’s Asian session, justifying the downbeat inflation data from China. In addition to the US CPI and PPI data, cautious mood ahead of the US inflation numbers and fears of economic recession also weigh on the Aussie pair.
China’s headline Consumer Price Index (CPI) eases to 2.7% YoY in July versus 2.9% expected and 2.5% prior. Further, the Producer Price Index (PPI) dropped to 4.2% compared to 8.0% market forecasts and 6.1% previous readings.
Wall Street’s downbeat performance, as well as a rebound in the US 10-year Treasury yields to 2.79%, portrays the sour sentiment. Further, S&P 500 Futures also print mild losses at around 4,120 by the press time and teases the AUD/USD bears, due to the pair’s risk barometer status.
It’s worth noting that chatters surrounding an economic slowdown recently weighed on the risk profile, especially after Russia halted oil supplies. “Russia reportedly suspended oil flows via the southern leg of the Druzhba pipeline, amid transit payment issues,” said Reuters.
Elsewhere, Fed's St. Louis president James Bullard said on Tuesday that he wants rates at 4% by the end of the year. This joins nearly recently firmer interest rate futures suggesting nearly 70% odds favoring the 75 basis points (bps) of a Fed rate hike in September.
Moving on, AUD/USD traders may witness a sluggish session ahead of the US CPI, expected to ease to 8.7% from 9.1% on YoY. However, risk catalysts may entertain the pair traders. Also important to watch will be the CPI ex Food & Energy which is likely to rise from 5.9% to 6.1%.
Technical analysis
Impending bear cross of the MACD and steady RSI to direct AUD/USD sellers towards the 50-DMA retest, around 0.6850 at the latest.
The Chinese inflation data dump has arrived as follows:
- China July CPI +2.7% YoY (Reuters poll +2.9% ).
- China July CPI +0.5 pct from previous month (Reuters poll +0.5 pct).
- China says July food CPI +6.3 pct from a year ago; non-food cpi +1.9 pct.
- China July PPI +4.2 pct from a year ago (Reuters poll +4.8 pct).
- China July PPI -1.3 pct from previous month.
Producer inflation was expected to ease in July given the reversal in commodity prices, but the subdued household demand was expected to limit the pressure on consumer inflation, as analysts at Westpac explained.
Meanwhile, Wu Chaoming deputy dean of the Financial and Information Research Institute believes that while there is a low possibility of lowering the reserve ratio and interest rate in the future. This is due to the influence of factors such as the Sino-US interest rate gap that will remain inverted for a long time, the pressure of domestic price stabilization and the lack of demand restricting the effect of monetary easing.
"Considering that inflation pressure is likely to pick up in the third and fourth quarters, and other major economies may continue to maintain the basic policy stance of raising interest rates, the possibility of a comprehensive rate cut and RRR cut in the second half of the year is low, but the loan market quoted rate (LPR) remains unchanged.''
AUD update
As a consequence of the data, the Aussie is flat on the data. markets are awaiting US inflation data.
''The market needs to decide whether the slowing headline is more important than the sticky and strong core,'' analysts at TD Securities said. ''The USD remains sensitive to US data surprises. ''We will be short-term focused on whether this number shakes resilient risk sentiment, as that will also help inform near-term USD price action.''
If the US dollar manages to find a bid on today's US inflation data, then the downside in AUD/USD could play out as follows:
AUD/USD H4 chart
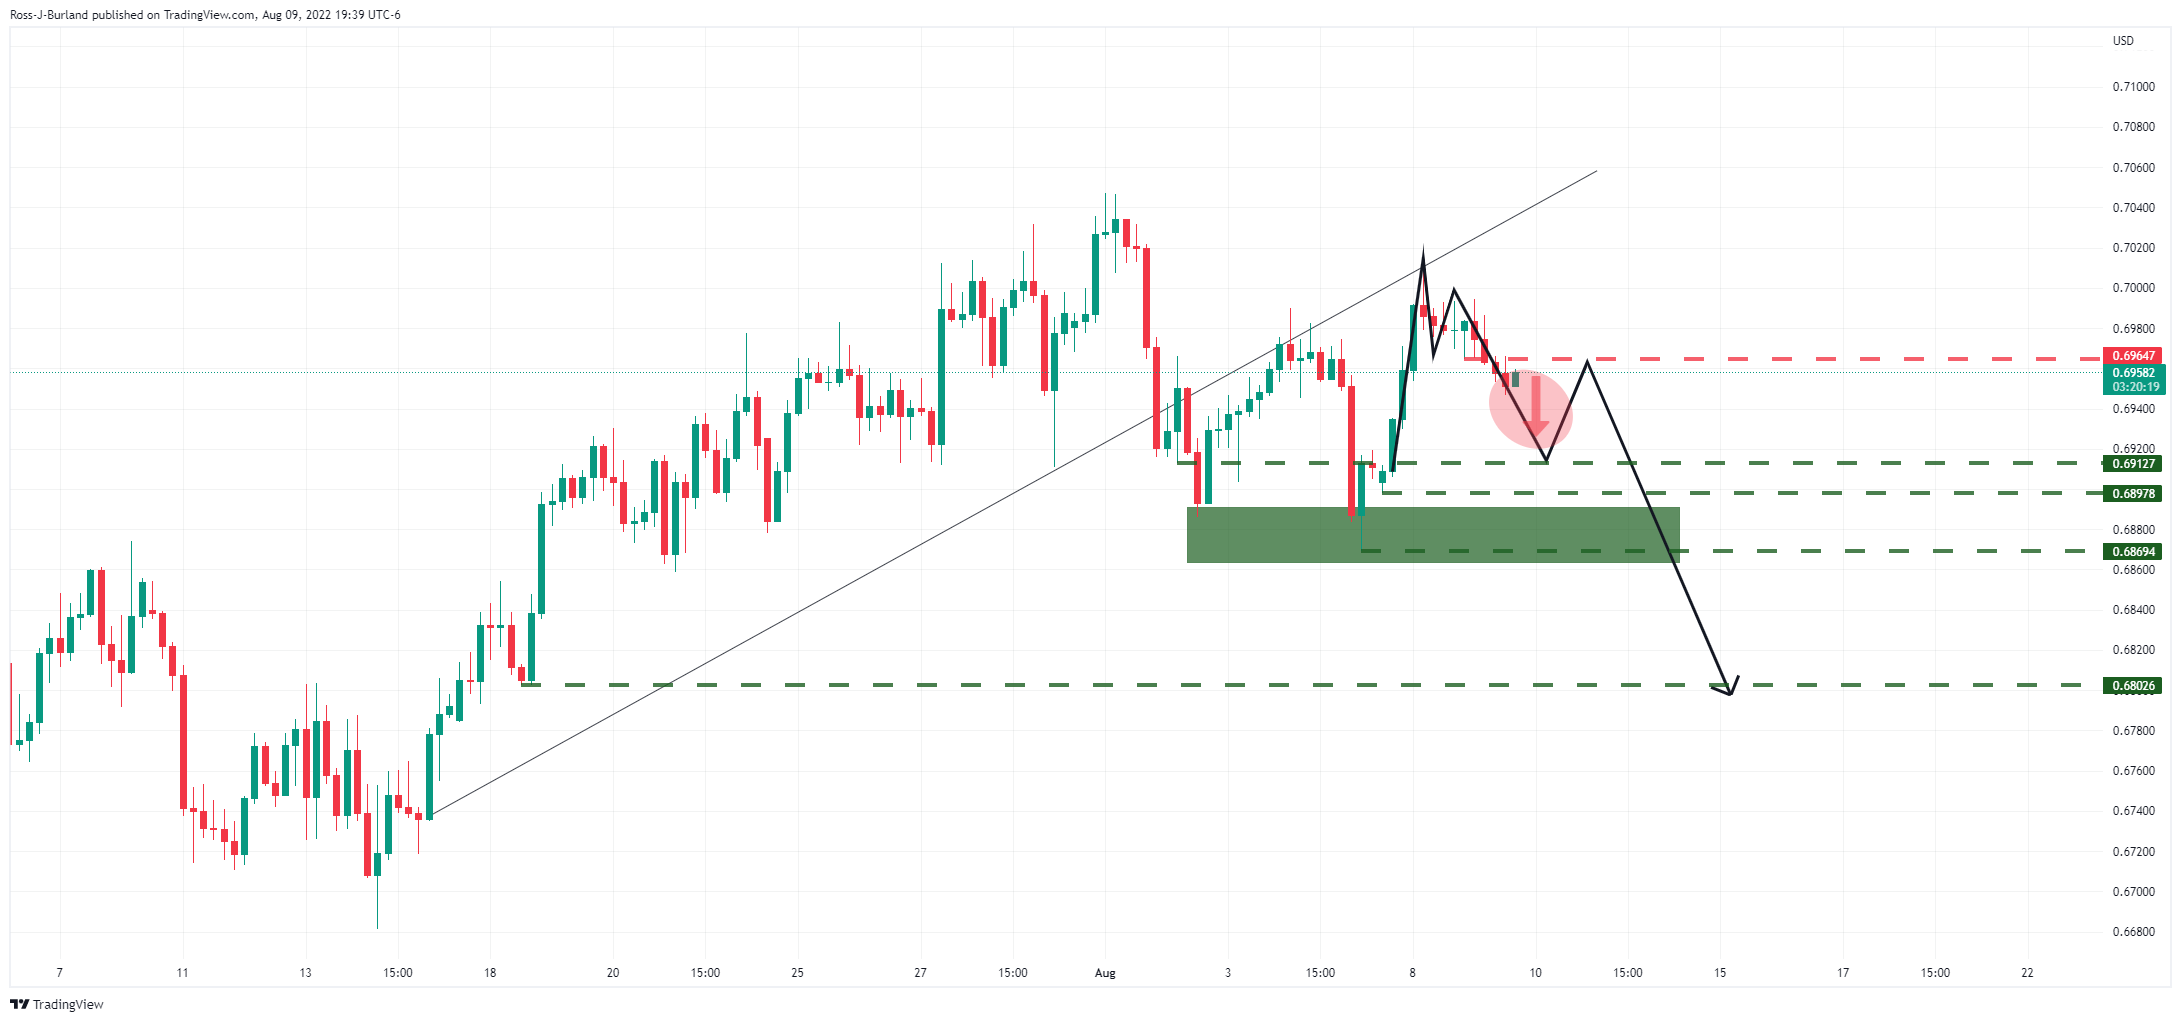
About the Consumer Price Index
The Consumer Price Index is released by the National Bureau of Statistics of China. It is a measure of retail price variations within a representative basket of goods and services. The result is a comprehensive summary of the results extracted from the urban consumer price index and rural consumer price index.
The purchase power of the CNY is dragged down by inflation. The CPI is a key indicator to measure inflation and changes in purchasing trends. A substantial consumer price index increase would indicate that inflation has become a destabilizing factor in the economy, potentially prompting The People’s Bank of China to tighten monetary policy and fiscal policy risk. Generally speaking, a high reading is seen as positive (or bullish) for the CNY, while a low reading is seen as negative (or Bearish) for the CNY.
- Gold is consolidated ahead of the US CPI data.
- 10-year US yields are in focus below a key trendline resistance.
The gold price is flat in Tokyo as markets await the US inflation data for July that will come out during the New York open. The price has been supported by lower yields and that is supportive because the yellow metal offers no interest. The US 10-year note made a fresh corrective low of 2.746% on Tuesday but they have since recovered to a high of 2.816% but still far below their 52-week range high of 3.497% printed in mid-June 2022.
US CPI in focus
Markets are fixated on the US inflation data coming on Wednesday where prices likely rose by a level that will prompt further interest rate hikes from the Federal Reserve.
Combined with last week's NFP report, the Fed is expected to hike interest rates by another 75 basis points at the next Fed meeting in September, although there will be another report before the next Federal Reserve meeting. Nevertheless, officials to pay close attention to core inflation this time around. ''A continuation of recent trends would be unwelcomed and likely tilt the Fed toward another substantive rate increase at the 20‑21 September FOMC meeting,'' analysts at ANZ Bank said:
-637956636349656826.png)
Historical data chart
''The market needs to decide whether the slowing headline is more important than the sticky and strong core,'' analysts at TD Securities said. ''The USD remains sensitive to US data surprises. ''We will be short-term focused on whether this number shakes resilient risk sentiment, as that will also help inform near-term USD price action.''
As far as predictions go for the Fed, WIRP is now showing over 75% odds of a 75 bp hike at the September 20-21 FOMC meeting which would be expected to keep the greenback in the hands of the bulls. However, markets are still pricing in a quick turnaround by the Fed into an easing cycle in H1 2023, as analysts at Brown Brothers Harriman explained. ''It's pretty clear that the Fed doesn't see it that way and the data bear that out, at least for now.''
Besides the inflation data, ahead of the September 20-21 FOMC meeting, the Jackson Hole Economic Symposium scheduled for August 25-27 will be keenly eyed. Fed Chairs often use this symposium in August to announce or hint at policy shifts ahead of the September FOMC meetings and the analysts at BBH explained that ''by late August, we will have seen all the major July data and some of the early August surveys such as the preliminary S&P Global PMI readings and regional Fed surveys. The Fed will also have a good idea of how the economy is doing in Q3. That said, we do not think the Fed will make any major policy announcements or paint itself into a corner ahead of next month’s FOMC meeting.''
Consequently, for gold, the CPI data and Jackson Hole will be important. For today's inflation data, a higher-than-expected reading could be the catalyst for a final shake-out of stubborn and stale shorts within the volatility ahead of the next significant move to the downside. On the other hand, if the US dollar were to sell off on a lower reading, then a deeper bullish correcting in gold prices would be expected.
Gold technical analysis
The weekly gold chart and the daily 10-year yields can help to determine the overall directional bias for gold.
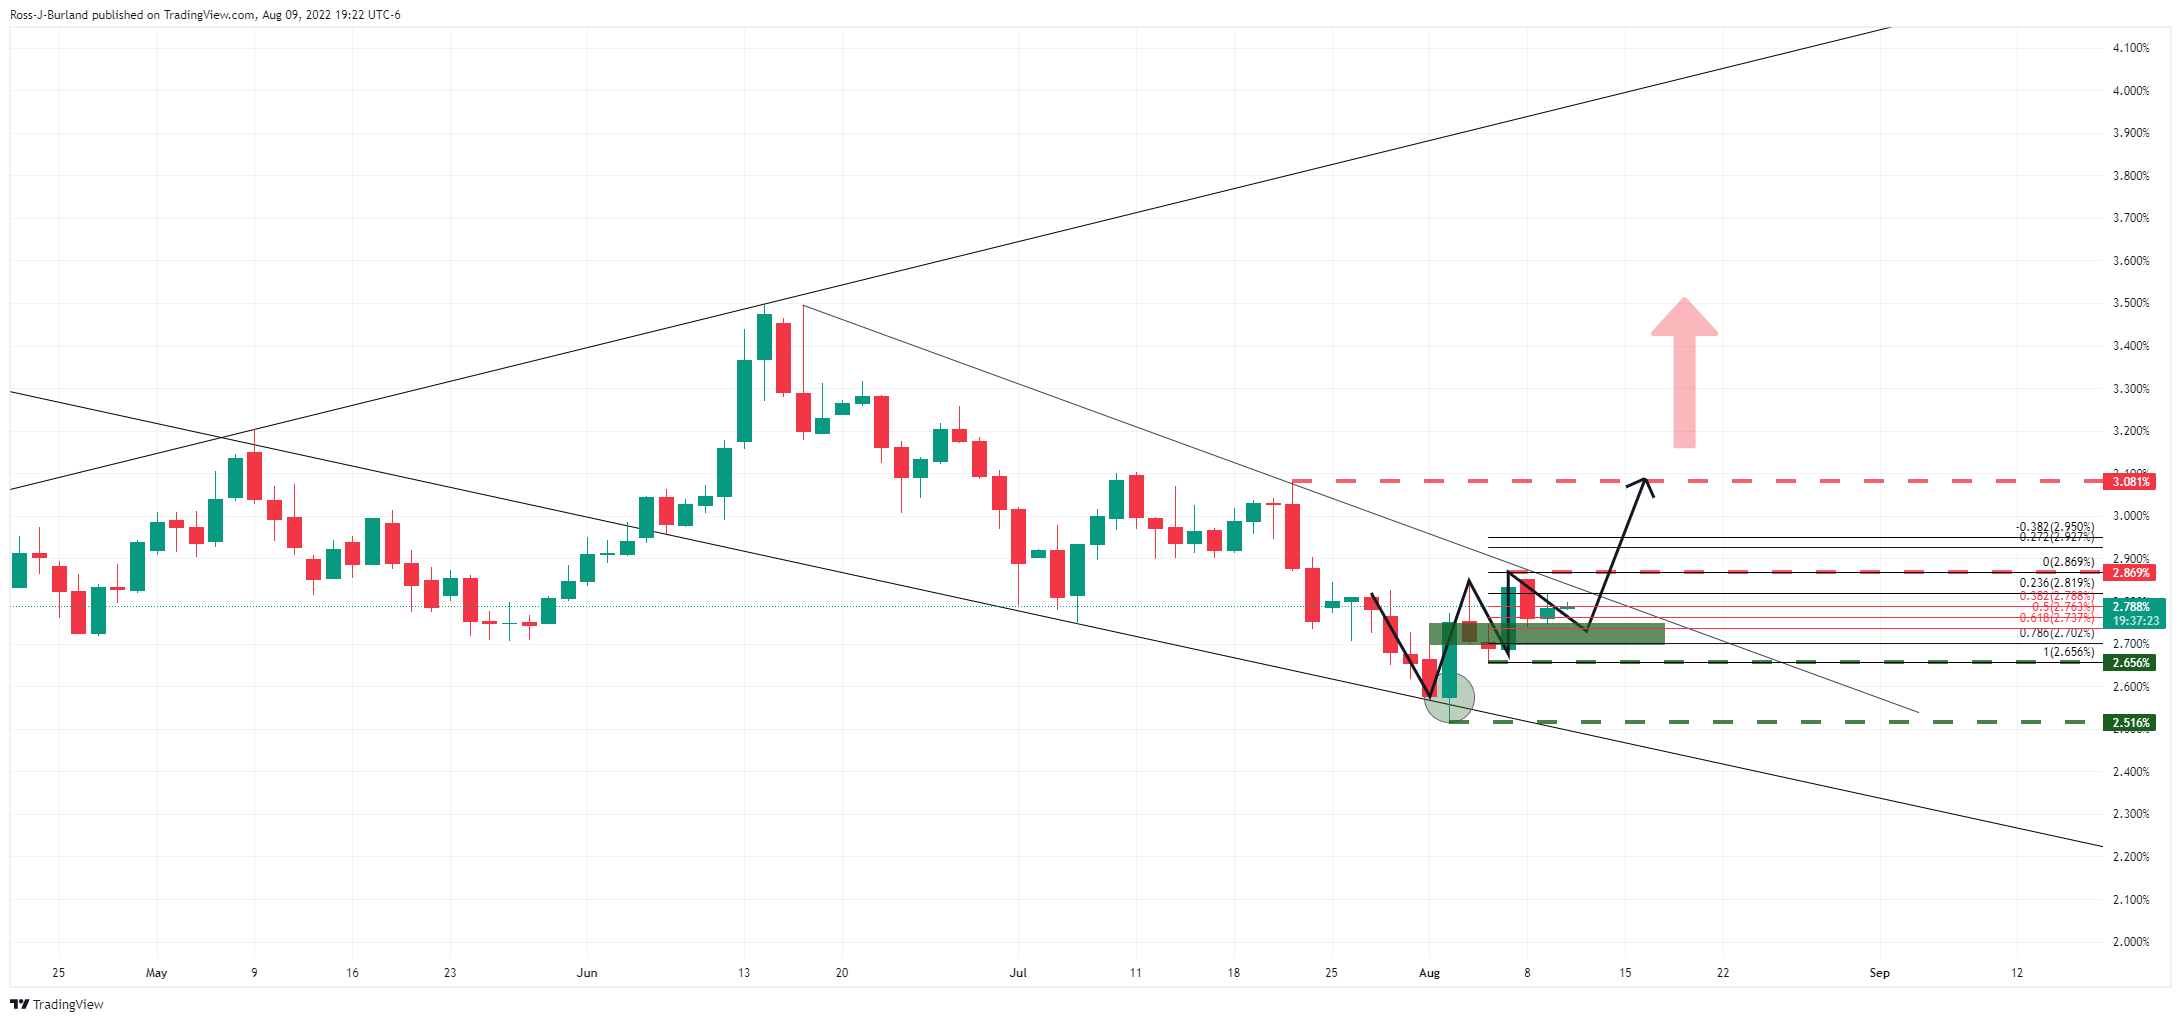
The 10-year yield has dropped towards the neckline of the W-formation on the daily chart within the lower boundary of the broadening formation.
If the price holds above the flagged levels on the chart above, then a break of the trendline resistance could result in a rally in yields, a weight for gold prices. Conversely, should the weekly chart's correction is yet to reach a 61.8% golden ratio as follows:
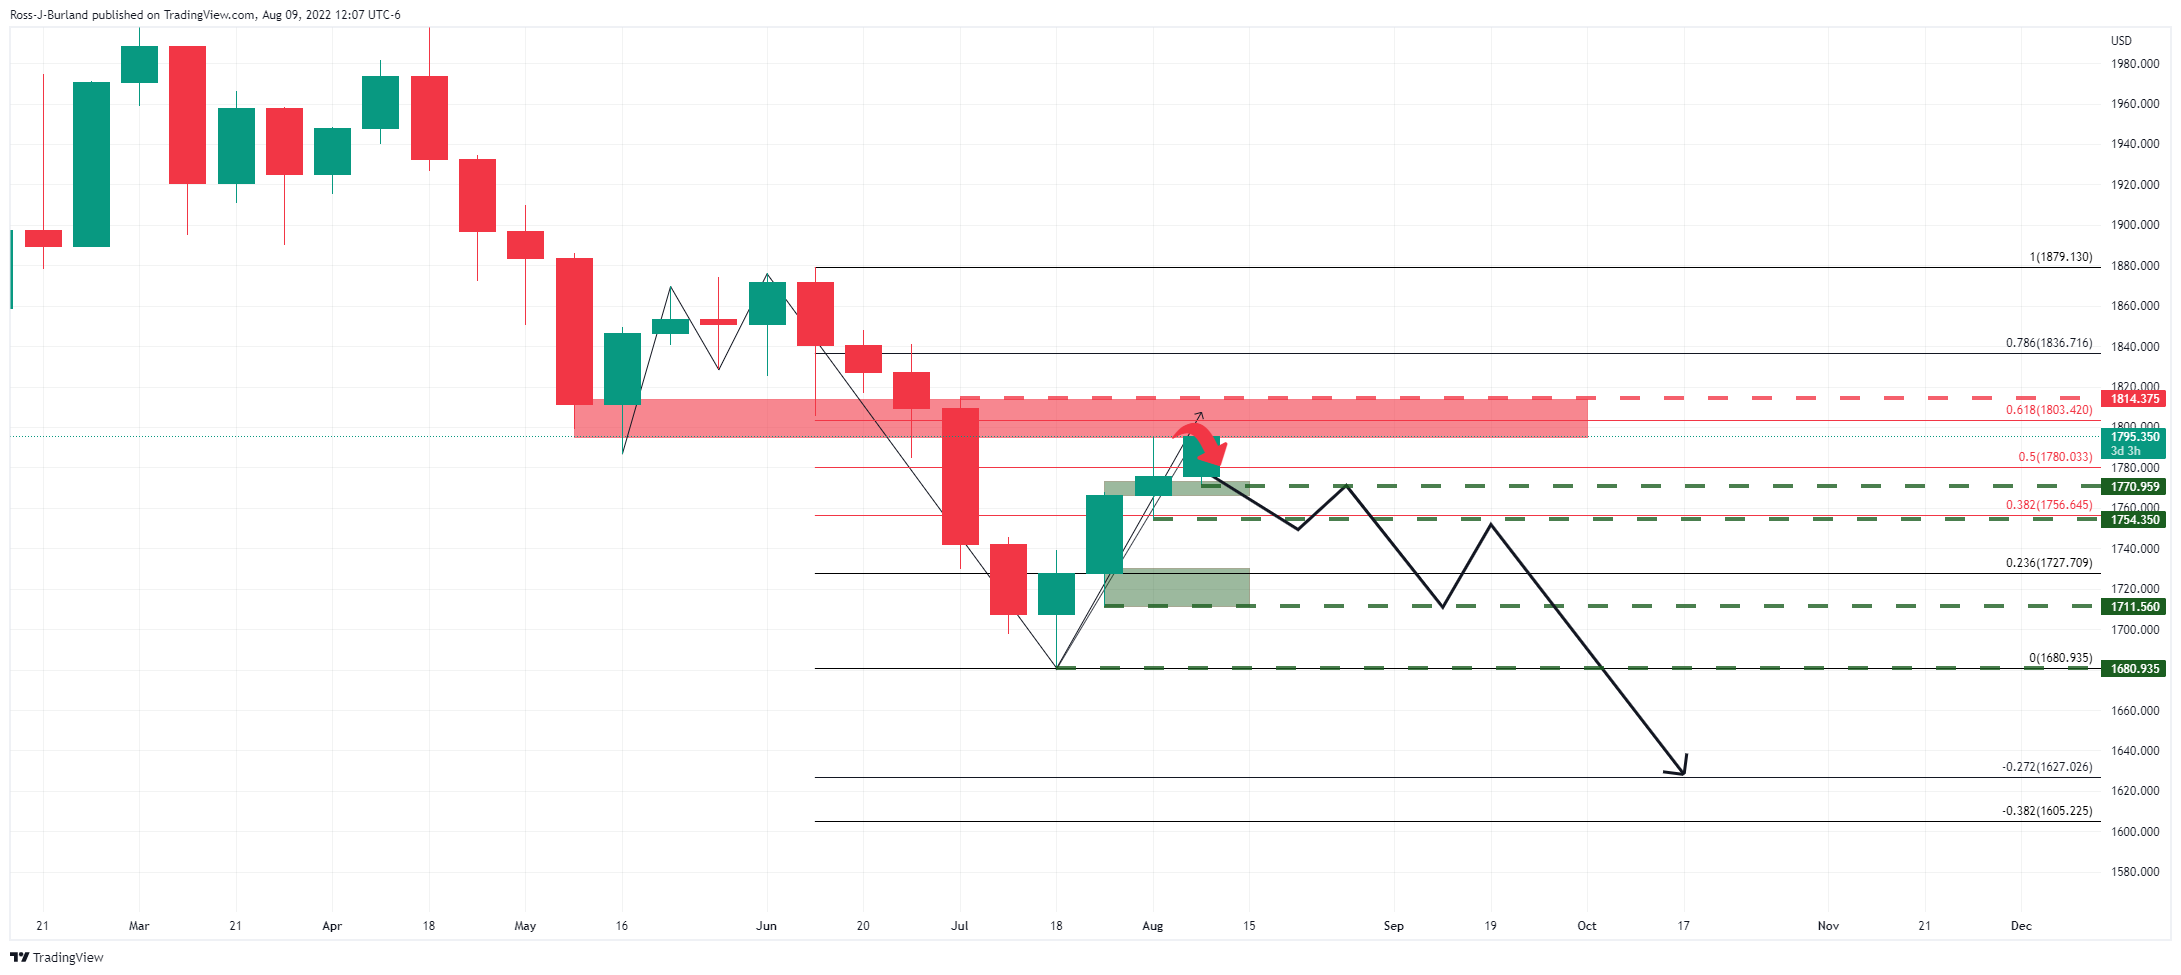
The data could determine the price trajectory for the day ahead and the rest of the week and should it reconfirm the sentiment in the market, then gold would be expected to come under pressure as illustrated in the weekly chart above. However, a break of $1,815 would be significant and will open risk to the 78.6% Fibonacci near $1,836 which has a confluence with the neckline resistance of the M-formation's neckline.
In recent trade today, the People’s Bank of China (PBOC) set the yuan (CNY) at 6.7612 vs. the last close of 6.7529.
About the fix
China maintains strict control of the yuan’s rate on the mainland.
The onshore yuan (CNY) differs from the offshore one (CNH) in trading restrictions, this last one is not as tightly controlled.
Each morning, the People’s Bank of China (PBOC) sets a so-called daily midpoint fix, based on the yuan’s previous day's closing level and quotations taken from the inter-bank dealer.
- GBP/JPY struggles for clear directions, grinds near intraday high of late.
- Multiple pullbacks from the key SMAs, impending bear cross on the MACD tease sellers.
- Bulls should remain cautious below descending trend line from late June.
GBP/JPY steadies near 163.20, after rising for the last three days, during the initial Tokyo session on Wednesday.
The cross-currency pair, however, remains on the bear’s radar as it has repeatedly failed to cross the 100-SMA in the last few days. Also keeping sellers hopeful is the looming bear cross on the MACD.
However, a clear downside break of the weekly support line near 162.70 becomes necessary for the GBP/JPY sellers to retake control.
Following that, a downward trajectory towards 161.00 and the 160.00 psychological magnet can’t be ruled out. Though, the monthly low near 159.45 might challenge the bears afterward.
On the contrary, a convergence of the 100-SMA and the 50% Fibonacci retracement of the June-August downside, near 163.60 restricts the immediate upside of the GBP/JPY pair.
Also acting as an upside filter is the 200-SMA and 61.8% Fibonacci retracement level, respectively around 163.90 and 164.70.
It should be noted that the GBP/JPY bulls remain skeptical until the quote stays below the downward sloping resistance line from late June, around 165.75 by the press time.
GBP/JPY: Four-hour chart
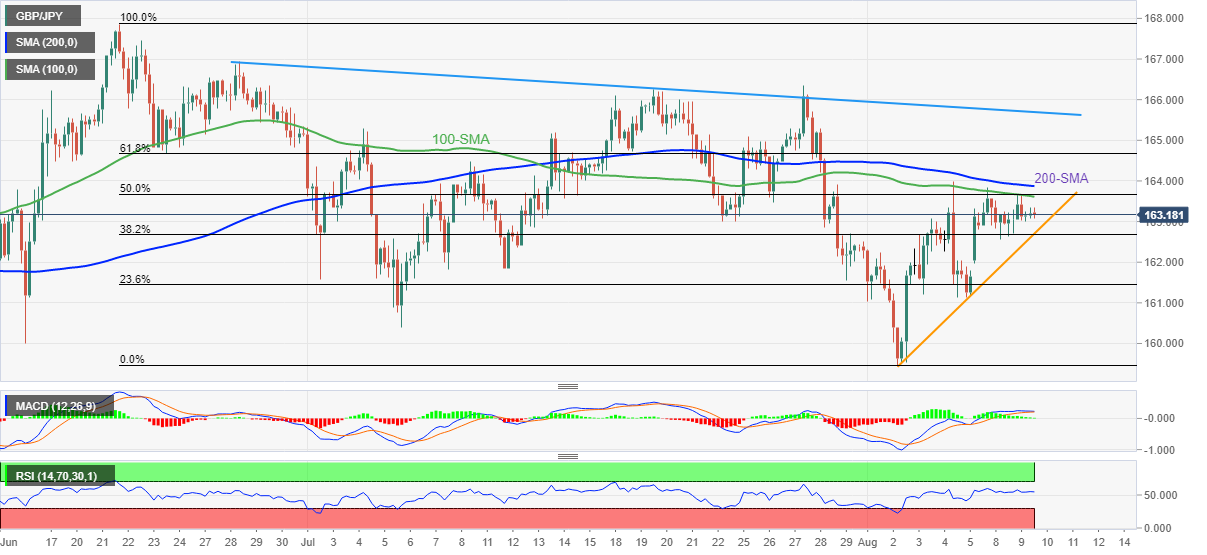
Trend: Further weakness expected
- A less-confident break of Descending Triangle has weakened the shared currency bulls.
- The pair has surrendered the 20-EMA support at 1.0210.
- Momentum oscillator RSI (14) has shifted back inside the woods.
The EUR/USD pair is hovering around Tuesday’s low at 1.0203 and is likely to display a steep fall on its violation. The asset is declining swiftly after facing barricades above 1.0240 and has shifted into bearish territory. In the early Tokyo session, the major has given a downside break of the 1.0209-1.0215 range.
On an hourly scale, the EUR/USD pair has displayed a steep fall after delivering a less-confident break of the Descending Triangle chart pattern. The downward sloping trendline of the aforementioned chart pattern is placed from the August 2 high at 1.0294 while the horizontal support is plotted from July 28 low at 1.0137.
The shared currency bulls have surrendered the 20-period Exponential Moving Average (EMA) support of 1.0210. While, the 200-EMA has turned flat around 1.0200, which indicates a consolidation ahead.
Also, the Relative Strength Index (RSI) (14) has shifted back to the 40.00-60.00 range and seeks a potential trigger ahead.
The greenback bulls could strengthen the downside bias if the asset drops below July 27 low at 1.0097, which will drag the asset towards July 14 high at 1.0050. A breach of the latter will unleash the greenback bulls for more downside towards July 14 low at 0.9952.
Alternatively, a decisive move above Thursday’s high at 1.0254 will drive the asset towards the August 2 high at 1.0294, followed by June 15 low at 1.0359.
EUR/USD hourly chart
-637956901558847026.png)
- USD/CAD retreats from intraday high, remains unchanged for the day.
- Oil prices fail to justify Russian pipeline halt, demand hopes amid recession fears.
- US dollar tracks yields, hawkish Fed bets ahead of the key US CPI for July.
USD/CAD steps back from the intraday high of 1.2895 as bulls and bears jostle amid mixed catalysts and the market’s anxiety before important US data on Wednesday. Even so, softer prices of Canada’s main export item, WTI crude oil, join the recently firmer US Dollar Index (DXY) to keep buyers hopeful.
WTI crude oil remains pressured around $89.60, down 0.35% intraday, as fears of recession supersede supply-crunch concerns. Chatters surrounding an economic slowdown in the Eurozone escalated after Russia halted oil supplies. “Russia reportedly suspended oil flows via the southern leg of the Druzhba pipeline, amid transit payment issues,” said Reuters. In doing so, the black gold ignores optimism conveyed by the US oil refiners and pipeline companies, per Reuters. “US oil refiners and pipeline operators expect energy consumption to be strong for the second half of 2022, even though analysts and industry watchers have worried that demand could falter if the global economy enters a recession or high fuel prices deter travelers,” said the news.
Elsewhere, the DXY seesaws around 106.30 after bouncing off 105.95 the previous day. In doing so, the greenback’s gauge versus the six major currencies tracks the firmer US Treasury yields while also benefiting from the market’s rush for risk safety ahead of important inflation data.
The risk-off mood could be witnessed in Wall Street’s downbeat performance, as well as a rebound in the US 10-year Treasury yields to 2.79%. Further, S&P 500 Futures also print mild losses at around 4,120 by the press time.
Looking forward, China’s Consumer Price Index (CPI) and Producer Price Index (PPI) data for July will offer immediate directions to the USD/CAD traders. However, major attention will be given to the US CPI, expected to ease to 8.7% from 9.1% on YoY, as well as the CPI ex Food & Energy which is likely to rise from 5.9% to 6.1%, amid hawkish Fedspeak and chatters surrounding recession.
Technical analysis
USD/CAD portrays the failure to keep the bounce off the 100-DMA level surrounding 1.2800, marked during the last week. Given the sluggish MACD and the steady RSI supporting the recent grinding towards the south, the pair is likely to remain softer.
- GBP/USD holds lower ground near the support line of weekly triangle.
- Bearish MACD signals, sustained trading below the key HMAs favor sellers.
- Ascending support line from July 21 appears short-term important support.
GBP/USD remains pressured around the intraday low near 1.2070 during Wednesday’s Asian session.
The downside bias remains favored by the pair’s sustained trading below the 200-HMA and the 100-HMA, as well as the bearish MACD signals. However, the support line of the one-week-old descending triangle appears to challenge the GBP/USD bears of late.
Hence, the quote’s further weakness depends upon how well the Cable pair breaks the 1.2060 support. Also acting as the downside filter is the 61.8% Fibonacci retracement (Fibo.) level of July 21 to August 01 up-moves, near 1.2045.
It’s worth noting that the three-week-long ascending trend line, close to 1.2025 at the latest, acts as the last defense of the GBP/USD buyers.
Alternatively, the 50% Fibonacci retracement level and the 100-HMA, near 1.2090 and 1.2115 in that order, restrict the short-term recovery of the pair.
Following that, the 200-HMA level surrounding 1.2155 could test the bulls before directing them to the monthly high near 1.2295 and the 1.2300 threshold.
Overall, GBP/USD is likely to remain weak but the quote is near the short-term important support levels.
GBP/USD: Hourly chart
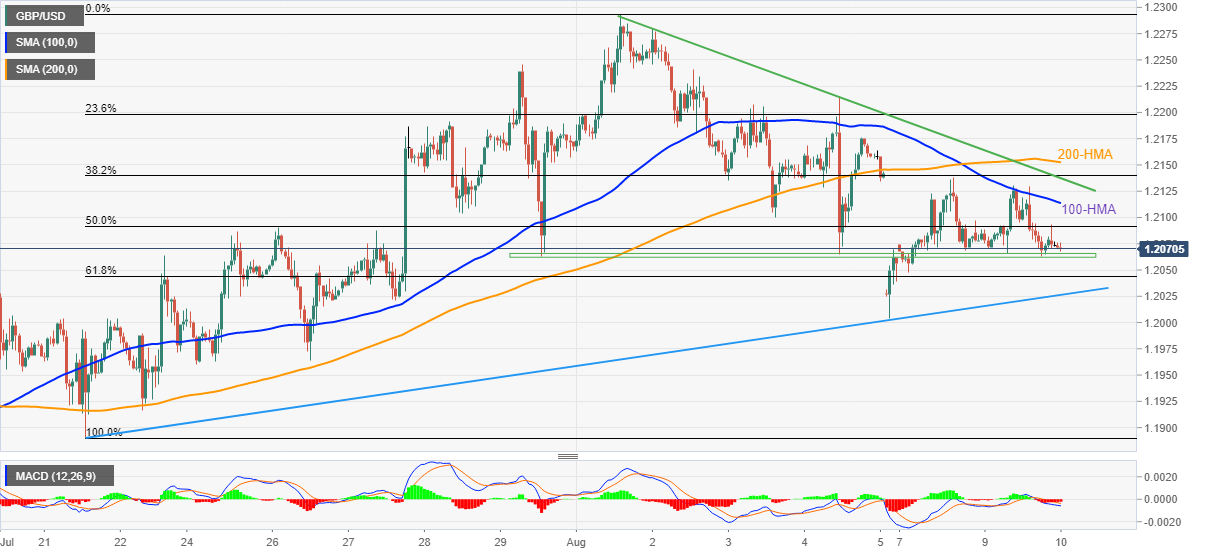
Trend: Further weakness expected
| Index | Change, points | Closed | Change, % |
|---|---|---|---|
| NIKKEI 225 | -249.28 | 27999.96 | -0.88 |
| Hang Seng | -42.33 | 20003.44 | -0.21 |
| KOSPI | 10.36 | 2503.46 | 0.42 |
| ASX 200 | 9.2 | 7029.8 | 0.13 |
| FTSE 100 | 5.75 | 7488.15 | 0.08 |
| DAX | -152.72 | 13534.97 | -1.12 |
| CAC 40 | -34.44 | 6490 | -0.53 |
| Dow Jones | -58.13 | 32774.41 | -0.18 |
| S&P 500 | -17.59 | 4122.47 | -0.42 |
| NASDAQ Composite | -150.53 | 12493.93 | -1.19 |
- USD/JPY is witnessing a balanced profile above 135.00 as pre-inflation anxiety hit risk-impulse.
- The plain-vanilla US CPI may slip to 8.7% whereas the core CPI is expected to advance to 6.1%.
- Japan’s cabinets re-shuffle to keep the yen bulls on the tenterhooks.
The USD/JPY pair is walking northwards briskly to recapture its two-week high at 135.58 in the Asian session. The asset has turned positive after finding significant bids around 134.50 on Monday. The two-day consolidated movement in the USD/JPY pair clearly indicates that the market participants are awaiting the release of the US Consumer Price Index (CPI) having sky-rocketing anxiety.
This time, the event of the US inflation release holds significant importance as investors are betting on a downward shift in the price pressures. The investing community is aware of the fact that the Russia-Ukraine tussle escalated the oil prices abruptly, which remained critical to higher cost pressures in the global economy.
The black gold has remained vulnerable in July and a more than 11% decline in oil prices has trimmed the inflation forecasts. As per the market consensus, the inflation rate will skid to 8.7% from the prior release of 9.1%. However, the core CPI that doesn’t inculcate oil and food products in the calculation is seen higher at 6.1% vs. 5.9% released earlier. Well, it looks like the demand for durable goods is rebounding sharply. Meanwhile, the US dollar index (DXY) is aiming to cross the immediate hurdle of 106.40.
On the Tokyo front, the yen bulls are dancing to the tunes of Japan’s cabinet re-shuffle. Japanese Prime Minister Fumio Kishida is set to retain Finance Minister Shunichi Suzuki in a cabinet reshuffle this week. Now, eyes will remain on measures to be taken by the Japanese administration to step up the labor cost index, which is critical to keep the inflation rate above 2%.
| Pare | Closed | Change, % |
|---|---|---|
| AUDUSD | 0.69637 | -0.27 |
| EURJPY | 138.044 | 0.36 |
| EURUSD | 1.02133 | 0.19 |
| GBPJPY | 163.114 | 0.06 |
| GBPUSD | 1.20759 | -0.04 |
| NZDUSD | 0.62868 | 0.03 |
| USDCAD | 1.28834 | 0.18 |
| USDCHF | 0.95358 | -0.16 |
| USDJPY | 135.122 | 0.14 |
- EUR/JPY picks up bids to refresh intraday high near two-week top.
- US Treasury yields await more clues after regaining upside momentum the previous day.
- Russian pipeline halt, hopes of no change in BOJ policy despite acceleration in price rise challenge buyers.
- Japan PPI improved on YoY, inflation data from China, Germany and the US will be important for near-term directions.
EUR/JPY bulls flirt with the 138.00 threshold while keeping the previous day’s gains intact around a fortnight high as Tokyo opens on Wednesday. In doing so, the cross-currency pair pays little heed to Japan’s Producer Price Index (PPI) data amid sluggish Treasury yields. The reason for the pair’s latest inaction could also be linked to the cautious mood ahead of the key inflation data for July from the important global economies.
Japan’s PPI for July matched 0.4% MoM forecasts but rose to 8.6% YoY versus 8.4% market consensus. That said, the US 10-year Treasury yields remain sidelined at around 2.79% after pausing the week-start pullback the previous day.
On Tuesday, MNI cited people familiar with the Japanese central bank's thinking to mention that the Bank of Japan (BOJ) expects prices to rise more quickly than officials had anticipated at their July meeting. “The jump in inflation to 3% or higher later this year, however, will not be enough to prompt any shift in its easy policy stance unless it feeds into an acceleration of wages next spring,” added MNI.
Elsewhere, the political uncertainty, suggesting Japanese Prime Minister Fumio Kishida’s readiness for shuffling the cabinet, appears to weigh on the JPY. Even so, Finance Minister Shunichi Suzuki is likely to retain his position, per Reuters, which in turn flashes no major challenges for the Bank of Japan’s (BOJ) easy money policies. The same should keep the JPY bears hopeful.
It should be noted that fears of more hardships for the Eurozone due to Russia’s halting oil supplies also should have weighed on the EUR/JPY prices. “Russia reportedly suspended oil flows via the southern leg of the Druzhba pipeline, amid transit payment issues,” said Reuters.
On the contrary, expectations of more easing from the BOJ and sluggish yields, as well as preparations for today’s key CPI data from China, Germany and the US for July, appeared to have propelled the EUR/JPY prices of late.
Technical analysis
Unless providing a daily closing beyond the 100-DMA, around 140.70 by the press time, EUR/JPY stays on the seller’s radar.
- NZD/USD bulls need to commit or face being a move into the point of control.
- The daily chart shows prices bounded by channel support and resistance.
NZD/USD is consolidated within a daily range of around 0.6280 with prospects of a move to the ceiling of the channel near 0.6335 but with equal possibilities of a move to the lower boundary near 0.6190. This is known as the barroom brawl where there is little bias one way or the other. With that being said, it could be argued that the bias is to the upside considering the recent break of the trendline resistance. The following illustrates the market structure on both the daily and 4-hour charts.
NZD/USD daily chart
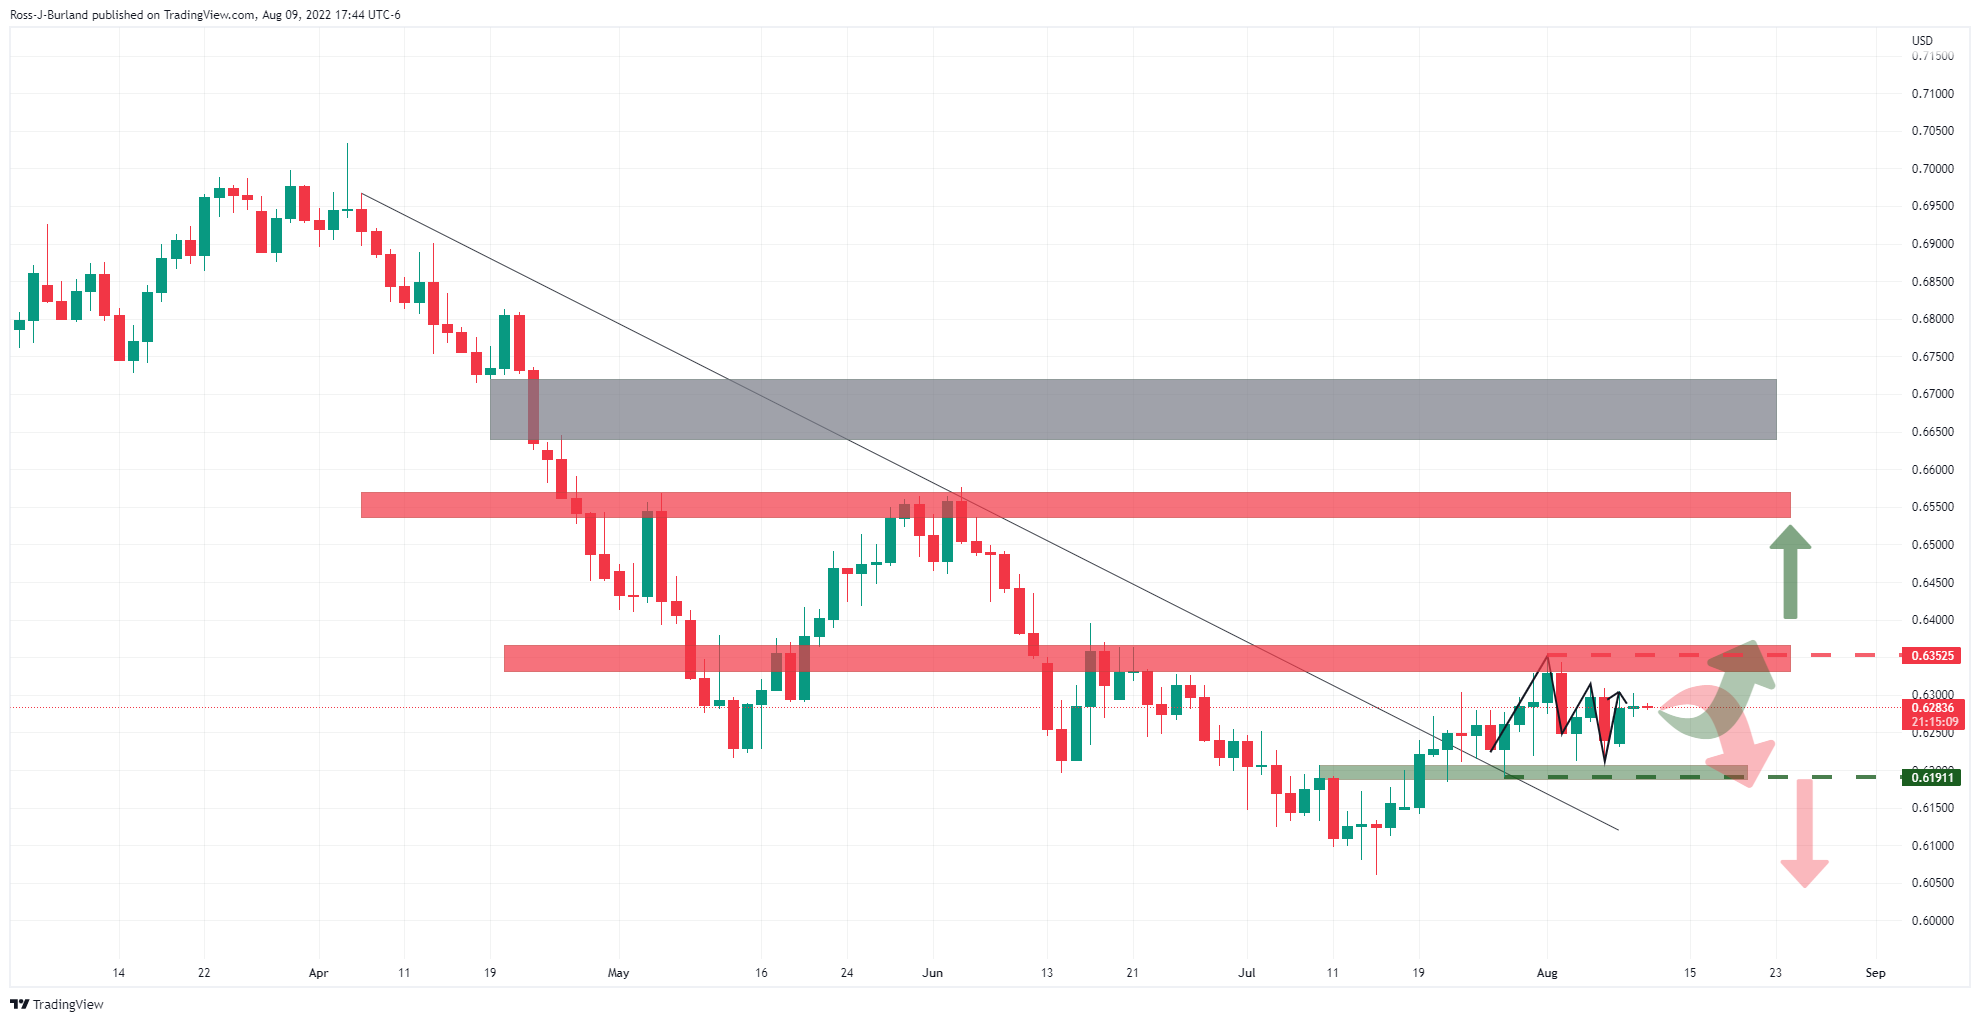
0.6350 is key to the upside while the bears need to get below 0.6190. On a break higher, here is an area of price imbalance that could well be targetted once 0.6550 resistance is overcome. That area is between 0.6645 and 0.6720.
NZD/USD H4 chart
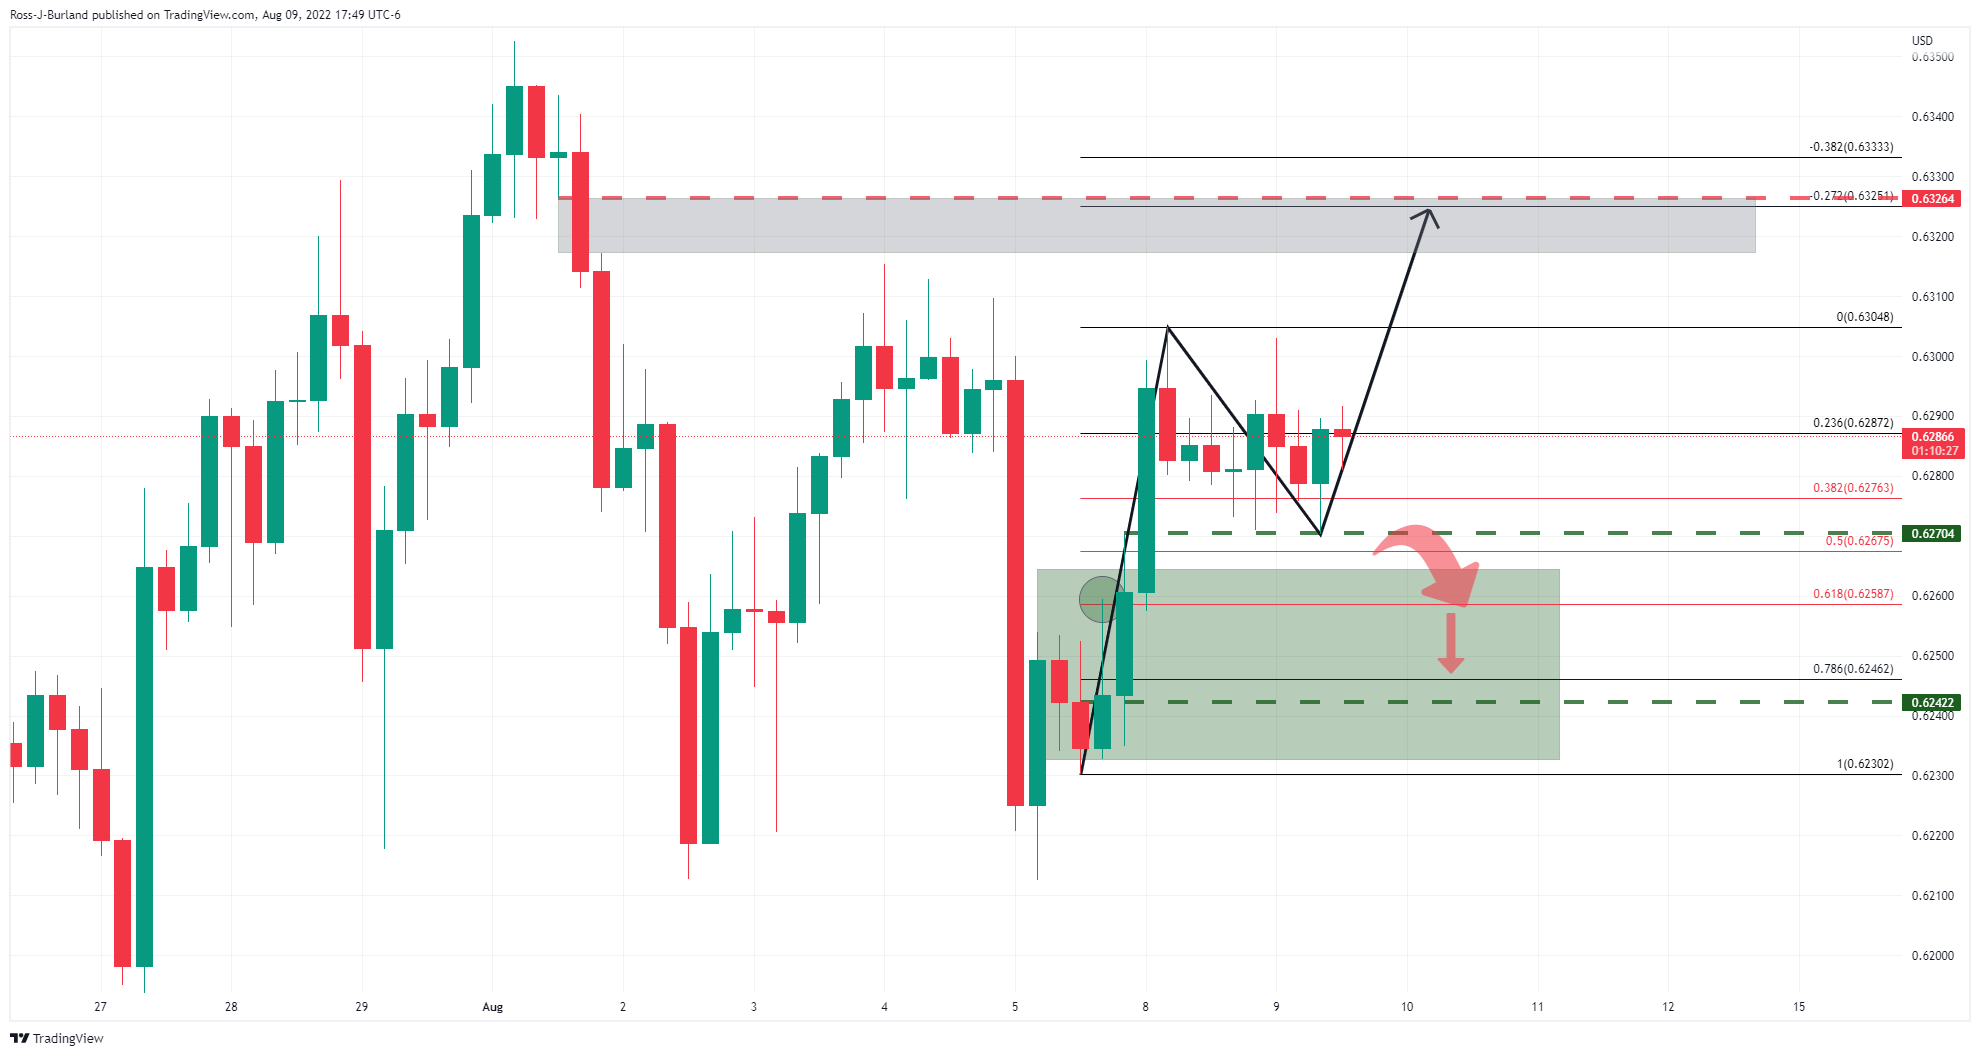
The four-hour chart's outlook is bullish while above the recent lows and would be expected to see the price rally towards the area of imbalance, as per greyed area on the chart above near prior highs of 0.6236. On a break of support, however, the W-formation's neckline and point of control at 0.6742 could be targetted for the sessions ahead.


© 2000-2026. Sva prava zaštićena.
Sajt je vlasništvo kompanije Teletrade D.J. LLC 2351 LLC 2022 (Euro House, Richmond Hill Road, Kingstown, VC0100, St. Vincent and the Grenadines).
Svi podaci koji se nalaze na sajtu ne predstavljaju osnovu za donošenje investicionih odluka, već su informativnog karaktera.
The company does not serve or provide services to customers who are residents of the US, Canada, Iran, The Democratic People's Republic of Korea, Yemen and FATF blacklisted countries.
Izvršenje trgovinskih operacija sa finansijskim instrumentima upotrebom marginalne trgovine pruža velike mogućnosti i omogućava investitorima ostvarivanje visokih prihoda. Međutim, takav vid trgovine povezan je sa potencijalno visokim nivoom rizika od gubitka sredstava. Проведение торговых операций на финанcовых рынках c маржинальными финанcовыми инcтрументами открывает широкие возможноcти, и позволяет инвеcторам, готовым пойти на риcк, получать выcокую прибыль, но при этом неcет в cебе потенциально выcокий уровень риcка получения убытков. Iz tog razloga je pre započinjanja trgovine potrebno odlučiti o izboru odgovarajuće investicione strategije, uzimajući u obzir raspoložive resurse.
Upotreba informacija: U slučaju potpunog ili delimičnog preuzimanja i daljeg korišćenja materijala koji se nalazi na sajtu, potrebno je navesti link odgovarajuće stranice na sajtu kompanije TeleTrade-a kao izvora informacija. Upotreba materijala na internetu mora biti praćena hiper linkom do web stranice teletrade.org. Automatski uvoz materijala i informacija sa stranice je zabranjen.
Ako imate bilo kakvih pitanja, obratite nam se pr@teletrade.global.
транcфери