- Analiza
- Novosti i instrumenti
- Vesti sa tržišta
Forex-novosti i prognoze od 08-08-2022
- GBP/USD fades the previous day’s corrective pullback but 200-SMA defends buyers.
- 38.2% Fibonacci retracement level adds to the downside filters.
- Bulls to remain cautious unless crossing 1.2175 hurdle.
GBP/USD retreats to 1.2085 after a mildly positive start to the week, sidelined during Tuesday’s initial Asian session. In doing so, the Cable pair pokes the 200-SMA support while fading the bounce off the 38.2% Fibonacci retracement of June 16 to July 14 downturn.
Given the bearish MACD signals and the recently downward sloping RSI (14), the GBP/USD pair is likely to remain pressured.
However, the aforementioned key SMA and the Fibonacci retracement levels, respectively neat 1.2060 and 1.2000, will be tough nuts to crack for the bears before retaking control.
Following that, a downward trajectory towards the multi-month low marked in July, around 1.1760, can’t be ruled out.
On the flip side, a convergence of the one-week-old descending trend line and the 61.8% Fibonacci retracement level near 1.2160 could restrict the short-term recovery of the GBP/USD pair.
Even if the Cable pair rises past 1.2160, the buyers need validation from the previous support line from mid-July, around 1.2175 to remain on the throne.
To sum up, GBP/USD remains on the seller’s radar but the downside remains sluggish.
GBP/USD: Four-hour chart
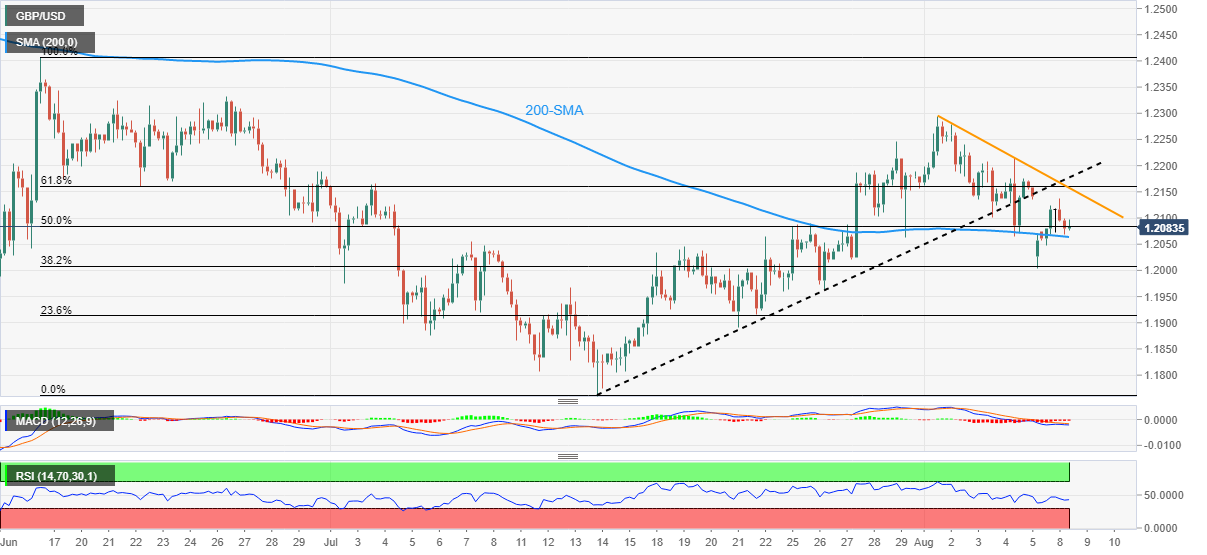
Trend: Pullback expected
Silver price (XAG/USD) steadies around $20.70 during Tuesday’s initial Asian session, after refreshing the monthly high the previous day.
In doing so, the bright metal tracks the cautious optimism in the options market as bulls retreat of late.
That said, the one-month risk reversal (RR) of silver prices, the difference between the call options and the put options, appear to retreat of late. The weekly RR prints 0.0000 figures after easing to 0.420 in the last week, from 0.950. It’s worth noting that the daily options market gauge remains indecisive at 0.000 by the press time.
Given the receding bullish bias in the options market, coupled with the anxiety ahead of the US Consumer Price Index (CPI) for July, up for publishing on Wednesday, XAG/USD prices may find it difficult to extend the latest run-up.
Also read: Silver Price Analysis: XAG/USD jumps back above $20.00, 50 DMA/50% Fibo. holds the key
- WTI grinds higher after bouncing off the key Fibonacci retracement support.
- Sluggish RSI, MACD challenge further upside momentum but 61.8% golden ratio probes bears.
- Convergence of 200-DMA, two-month-old resistance line and 50% Fibonacci retracement level restricts short-term upside.
WTI crude oil prices struggle to extend the latest rebound at around $90.00 during Tuesday’s initial Asian session.
The black gold began the week on a positive side while extending Friday’s recovery from the 61.8% Fibonacci retracement level of December 2021 to the March 2022 upside, near $86.90.
However, downbeat RSI and sluggish MACD seem to challenge the WTI crude oil’s further recovery, which in turn restricts the quote’s latest moves below $90.00.
It’s worth noting that the commodity’s further upside past the $90.00 immediate hurdle needs validation from the $94.30-50 resistance area comprising the 50-DMA, 50% Fibonacci retracement level and a downward sloping trend line from early July.
During the quote’s pullback, the 61.8% Fibonacci retracement level near $86.90 could restrict immediate downside ahead of the late January swing low around $81.70.
Should WTI price remain weak past $81.70, the $80.00 round figure and early December 2021 swing high around $73.70 should lure the oil bears.
WTI: Daily chart
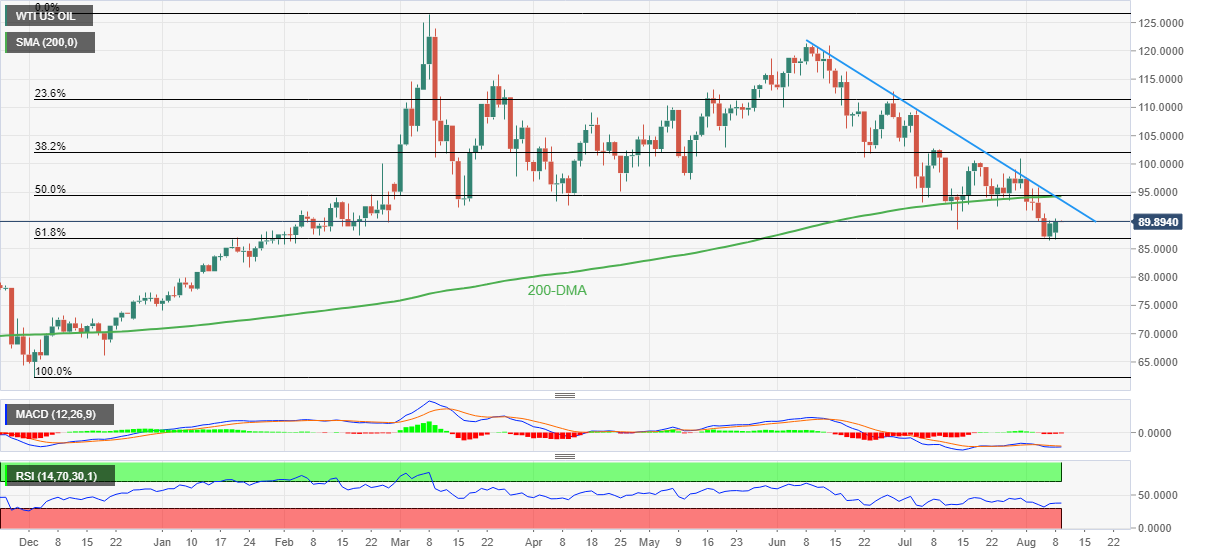
Trend: Limited upside expected
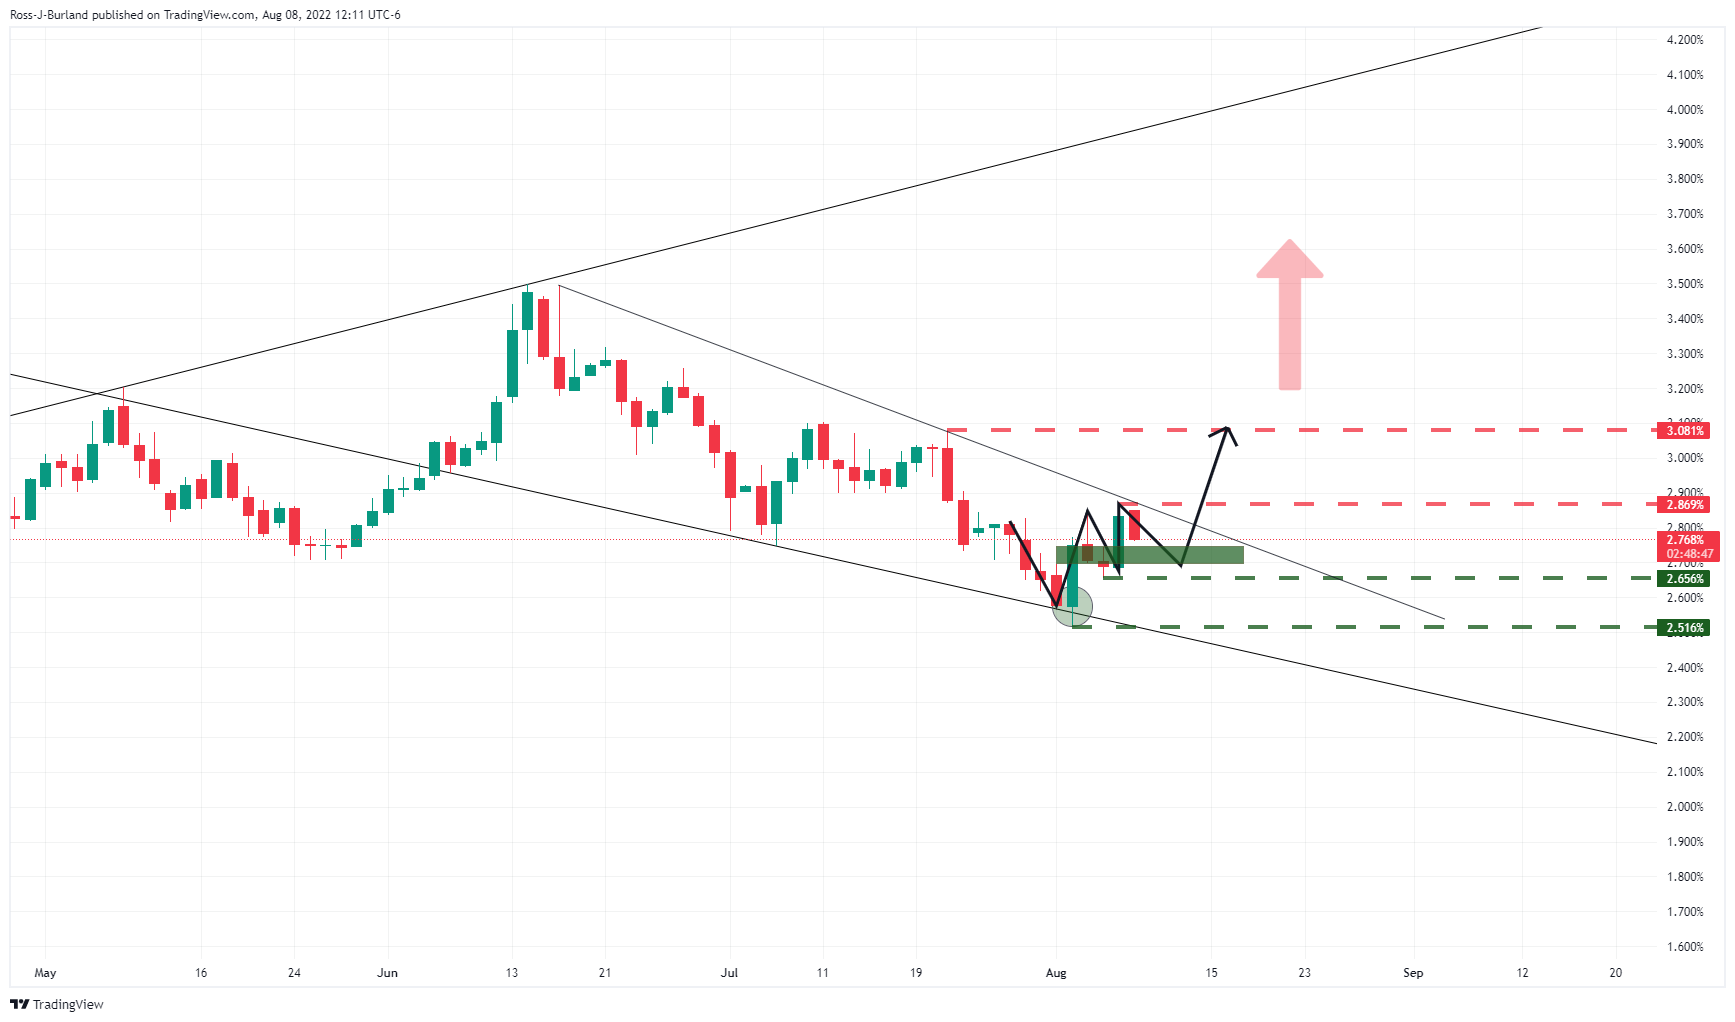
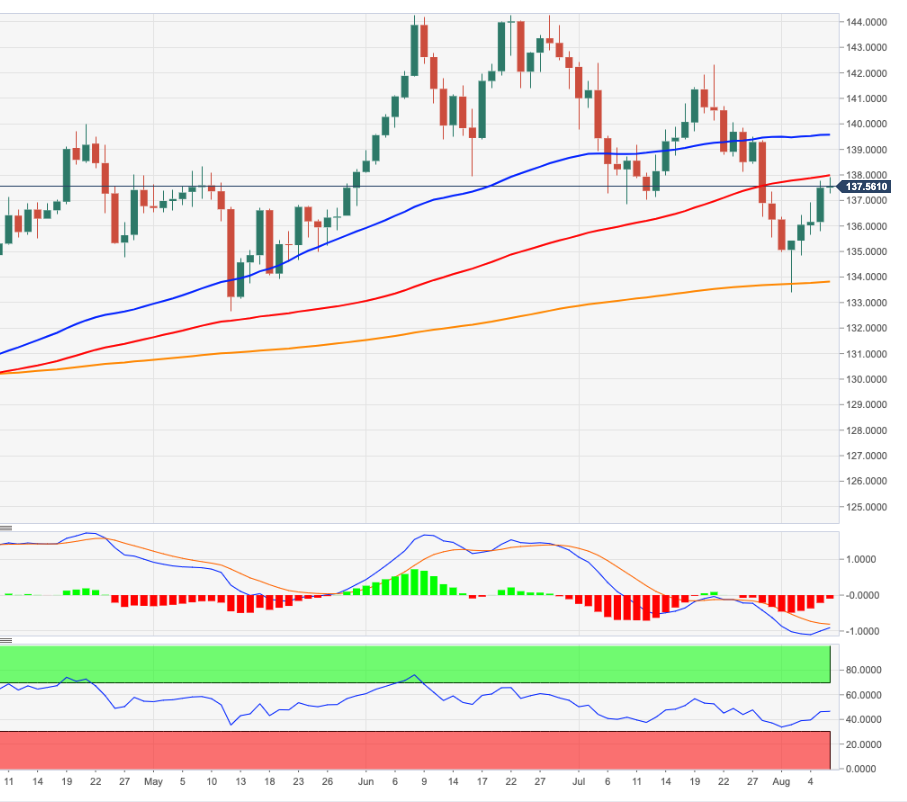
- A symmetrical triangle formation after a juggernaut rally hints continuation of an upside.
- Overlapping 50-EMA and asset’s price indicates short-term consolidation ahead.
- Aussie bulls will recapture a seven-year high at 96.88 on triangle breakout.
The AUD/JPY pair has picked bids around 94.20 after a soft decline from 94.37 in the early Asian session. Broadly, the cross has turned sideways in a 93.97-94.42 range after a vertical upside move on Monday. Aussie bulls have not exhausted yet and are expected to extend their gains further.
On a daily chart, the asset is oscillating in a Symmetrical Triangle chart pattern that signals an extreme slippage in the standard deviation. The upward-sloping trendline of the above-mentioned chart pattern is placed from May 12 low at 87.31 while the downward-sloping trendline is plotted from June 8 high at 96.88.
The 50-period Exponential Moving Average (EMA) at 93.35 is overlapping with the asset prices, which signals a consolidation ahead.
Meanwhile, the Relative Strength Index (RSI) (14) is oscillating in the 40.00-60.00 range. The prolonged upside bias is hinting for the continuation of an upside after a symmetrical breakout. And, a break above 60.00 will trigger the upside momentum.
Should the asset oversteps July 27 high at 95.70, the aussie bulls will drive the risk barometer towards a seven-year high at 96.88. A breach of the latter will send the cross towards May 2015 high at 97.30.
On the flip side, a decisive drop below Friday’s low at 92.24 will drag the asset towards Wednesday’s low at 91.72, followed by August low at 90.52.
AUD/JPY daily chart
-637955977820943348.png)
- NZD/USD remains sidelined after rising the most in three weeks the previous day.
- New Zealand Electronic Card Retail Sales improved MoM, dropped on YoY during July.
- Softer US Treasury yields weighed DXY, China trade numbers favored Antipodeans.
- Kiwi bears ignored softer prints of Q3 RBNZ Inflation Expectations with eyes on US CPI for July.
NZD/USD bulls struggle amid mixed retail sales data at home, as well as an absence of major catalysts, after rising the most in three weeks the previous day. That said, the Kiwi pair seesaws around 0.6280-85 during the initial hour of Tuesday’s Asian session.
New Zealand Electronic Card Retail Sales for July rose to -0.2% MoM versus -1.3% market forecasts and downwardly revised 0.0% prior. The yearly figure, however, slumped to -0.5% versus 6.9% expected and 1.9% prior.
It’s worth noting that the Reserve Bank of New Zealand’s (RBNZ) third quarter (Q3) Inflation Expectations eased to 3.07% versus 3.29% prior.
Even so, the Kiwi pair began the key week comprising the US inflation on a front foot amid a softer US dollar, as well as hopes of economic recovery from China.
That said, US Dollar Index (DXY) traced Treasury yields to consolidate Friday’s heavy gains that offered the greenback gauge the first weekly positive in three. That said, the DXY registered a 0.19% daily loss to 106.37 by the end of Monday whereas the US 10-year Treasury yields dropped nearly seven basis points (bps) to 2.75% at the latest, following a 14-bps run-up the previous day.
On the other hand, optimism surrounding China could be witnessed in the July month trade numbers from the dragon nation, as well as the market’s lack of interest in the Sino-American tussles over Taiwan. The dragon nation continues its military drills near the Taiwan border but the US recently signaled no major escalation in the geopolitical risks likely from Beijing. Elsewhere, China’s trade numbers for July. The headline Trade Balance rose to $101.26B versus $90B forecasts and $97.94B. Further details suggest that Exports increased by 18% compared to 15% expected and 17.9% prior whereas the Imports eased to 2.3% compared to 3.7% expected and 1.0% prior.
Amid these plays, Wall Street began Monday’s trading on a firmer footing before closing mixed, which in turn should have challenged the NZD/USD buyers amid hawkish Fed bets.
Given the recently cautious mood in the market, the Kiwi pair may remain sidelined and can witness a pullback should the scheduled second-tier US job numbers print strong outcomes. Forecasts suggest that the second quarter (Q2) US Nonfarm Productivity could improve to -4.6% from -7.3% prior while Unit Labor Costs may ease to 9.5% during the stated period versus 12.6% in previous readings. Furthermore, headlines surrounding Taiwan and Russia will also be important for clear directions.
Technical analysis
Although 20-DMA puts a floor under the short-term NZD/USD downside around 0.6240, a downward sloping resistance line from June 16, close to 0.6335-40 challenges the pair buyers.
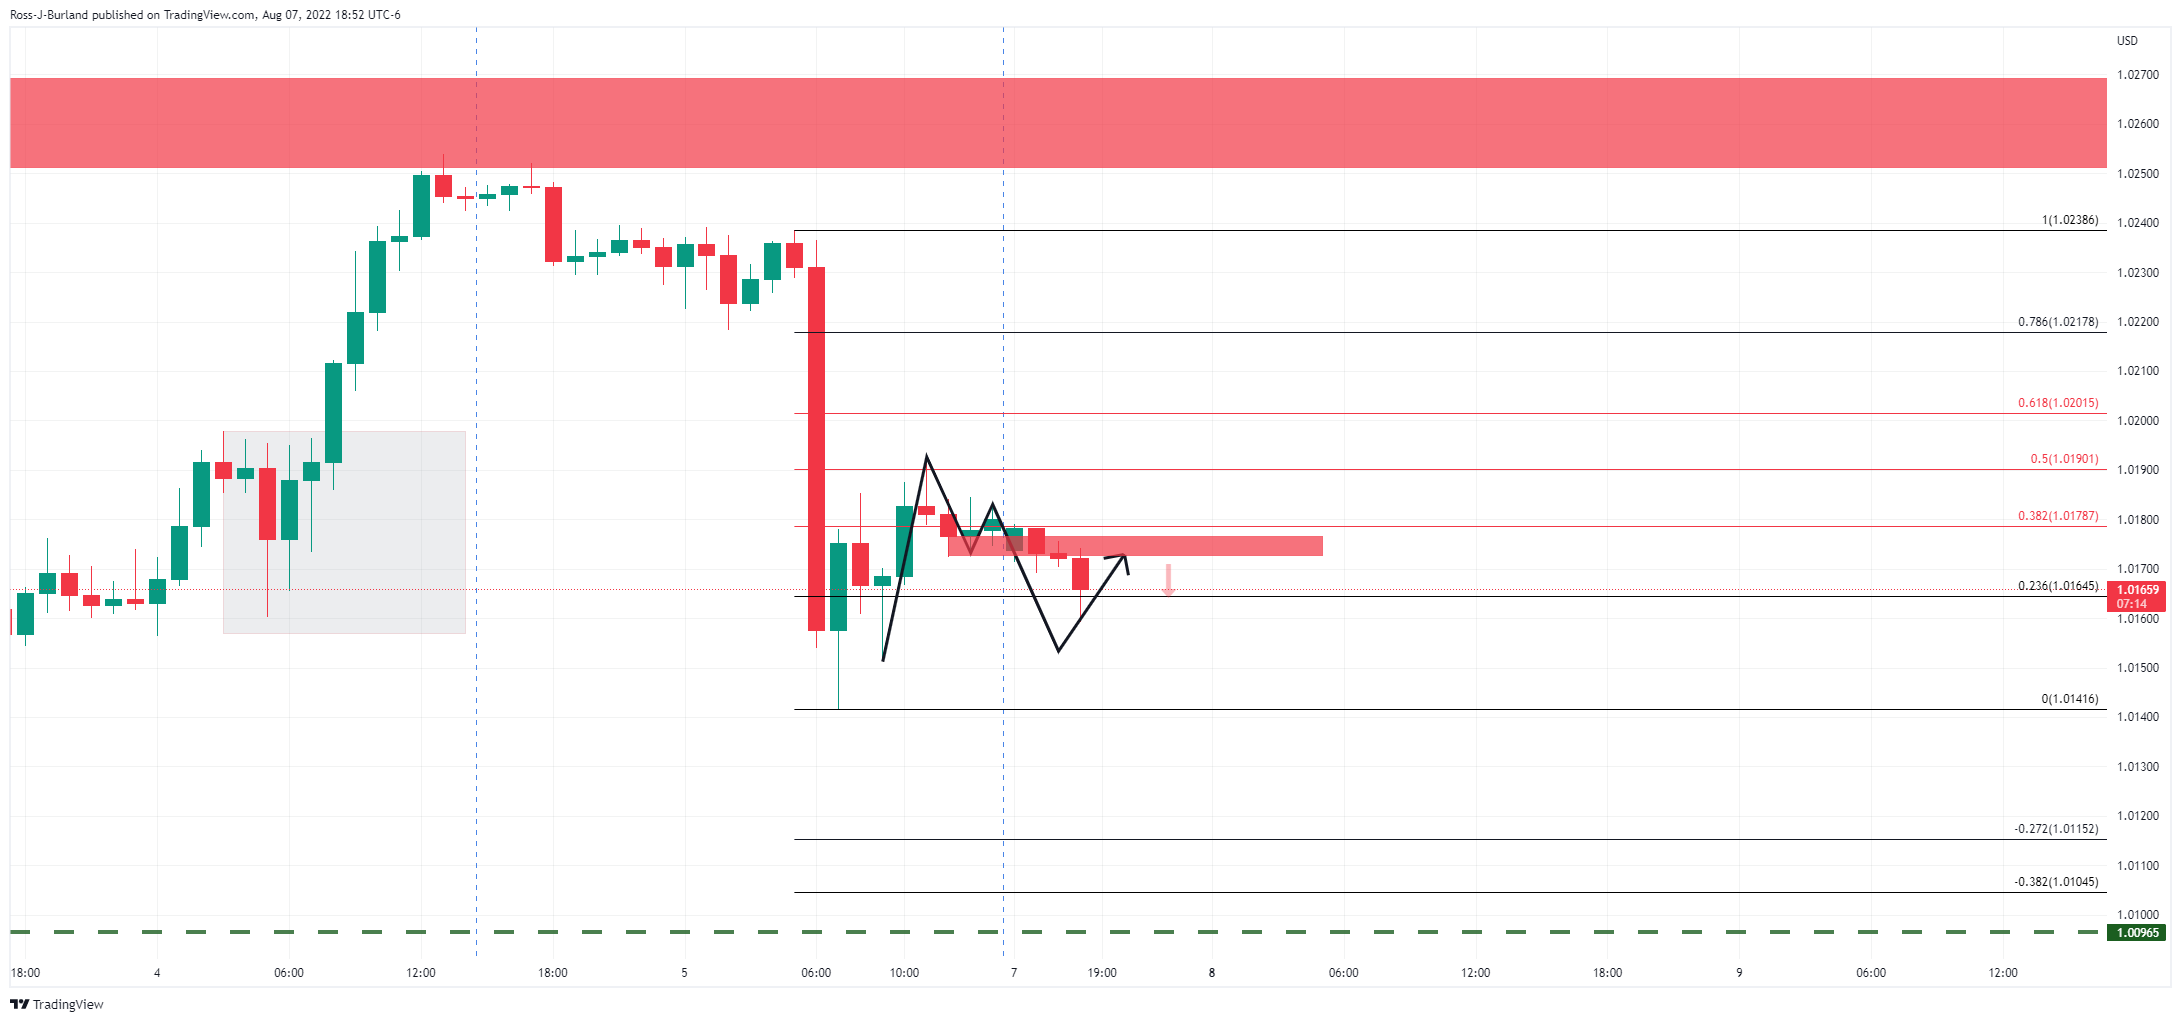
- USD/CAD is trapped between key hourly support and resistance.
- USD/CAD breakout prospects diminished with US CPI ahead.
As per the start of the week's analysis, USD/CAD Price Analysis: Bears lurking with eyes on a deeper correction, USD/CAD indeed fell into the hands of the bears as the following illustrates:
USD/CAD prior analysis
For the hourly time frame, it was explained that ''a break to the downside opens the probability of a move into the area of price imbalance. 1.2880 is a potentially key structure that if broken may give way to a deeper correction towards 1.2820 and 1.2770.''
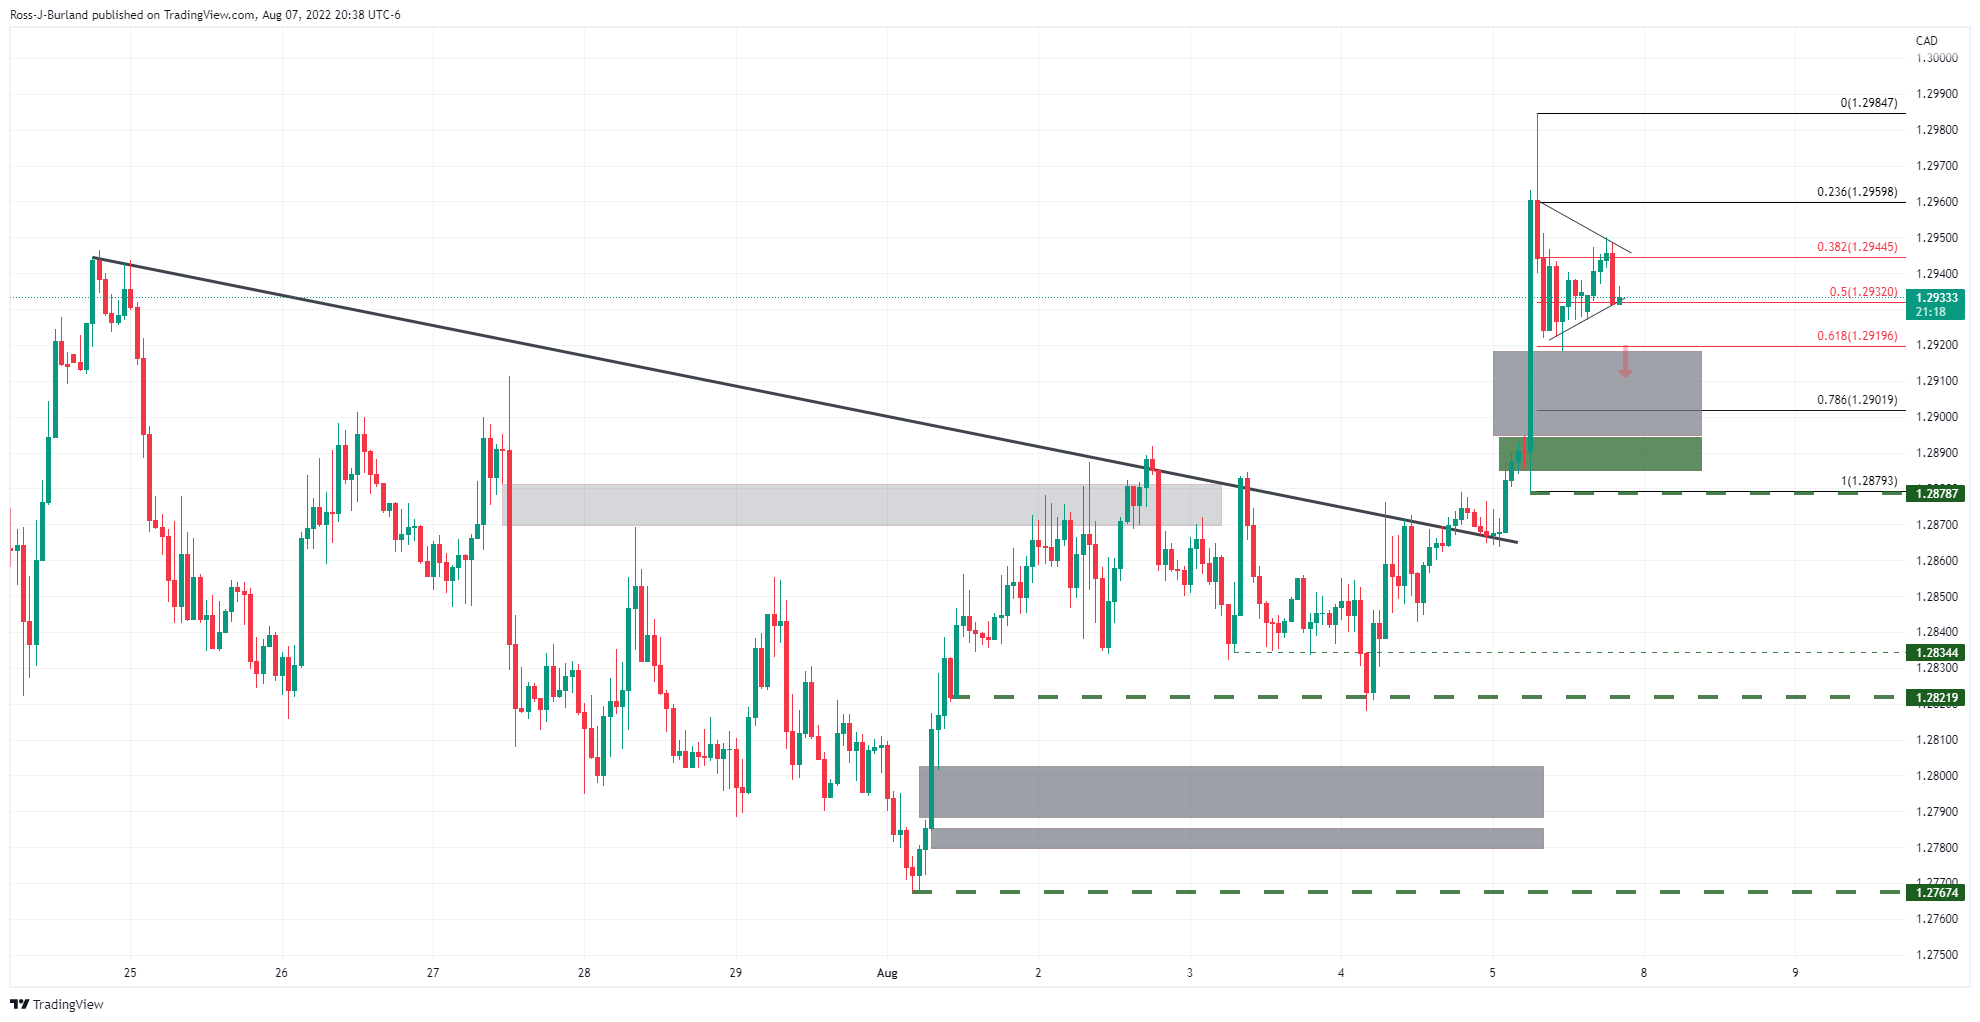
(USD/CAD H1 chart, above, daily chart below)
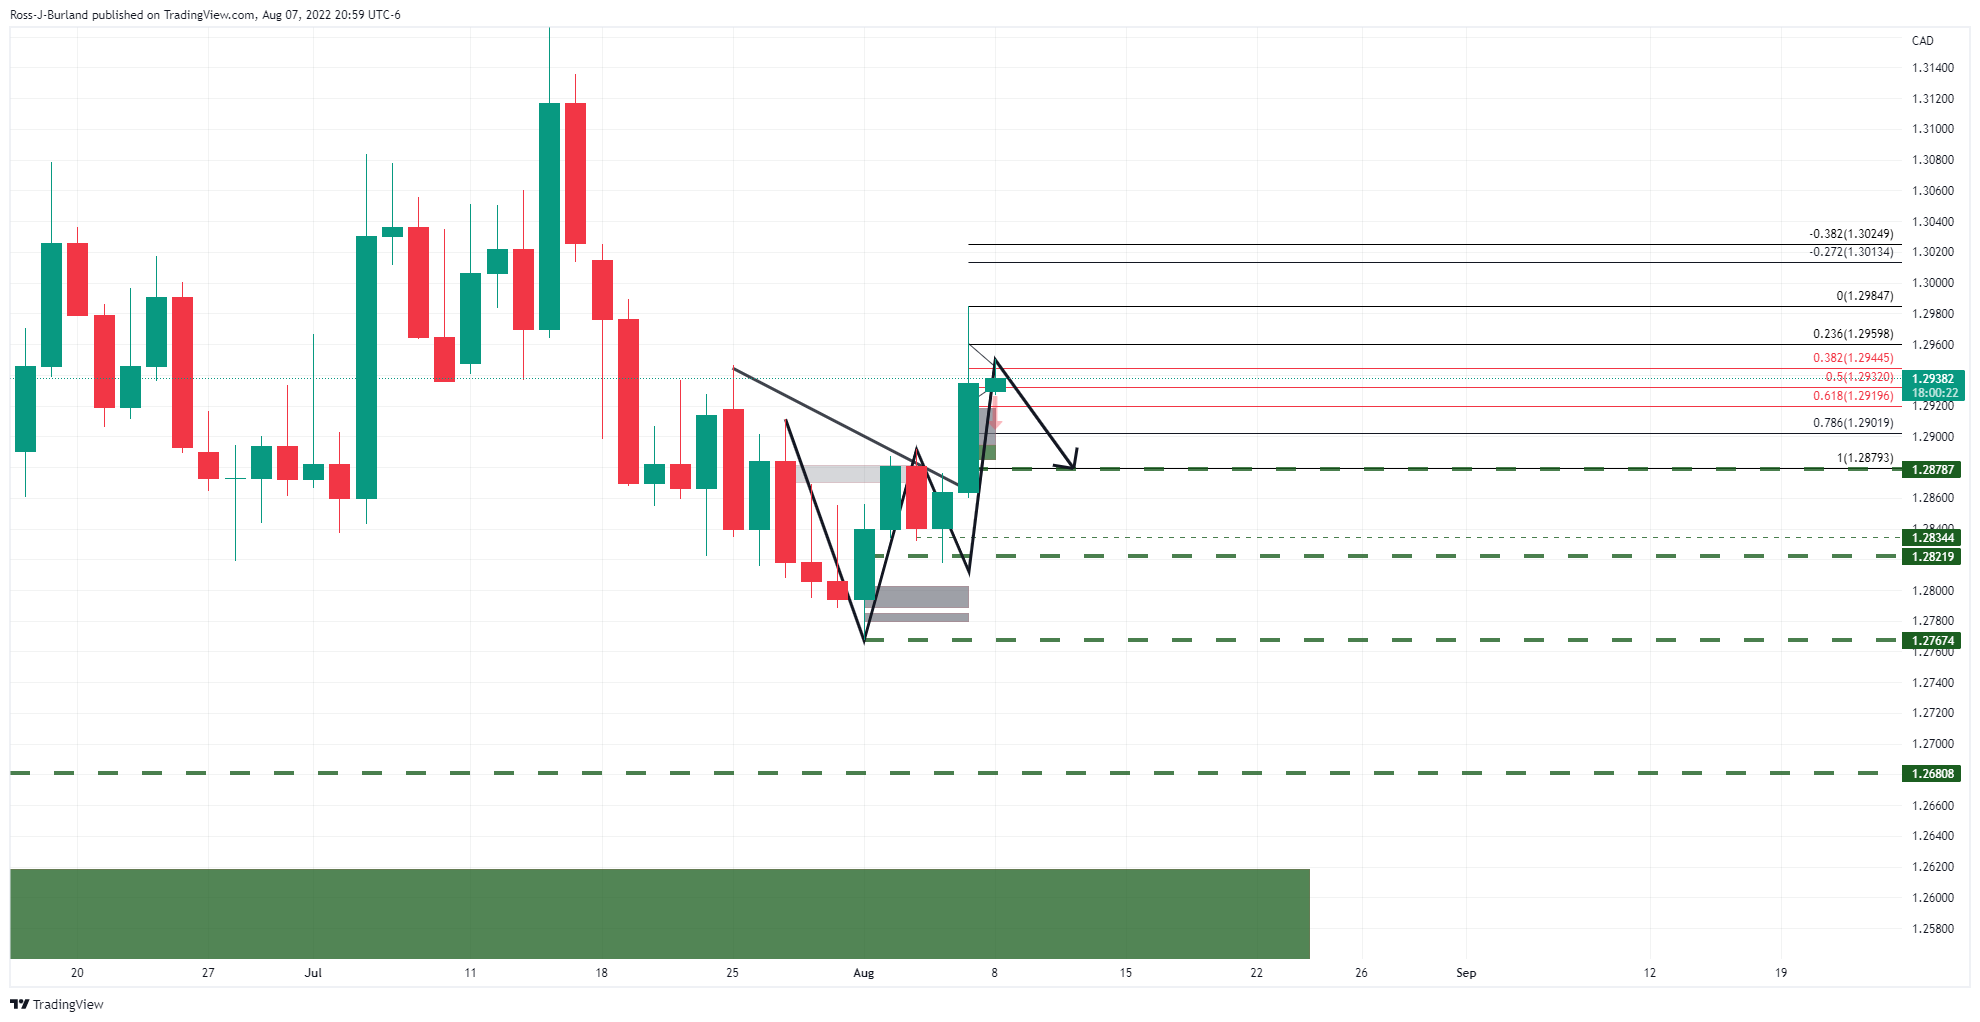
It was explained that ''the daily chart's W-formation is a bearish feature with price anticipated to correct the daily bullish impulse towards the neckline. ''
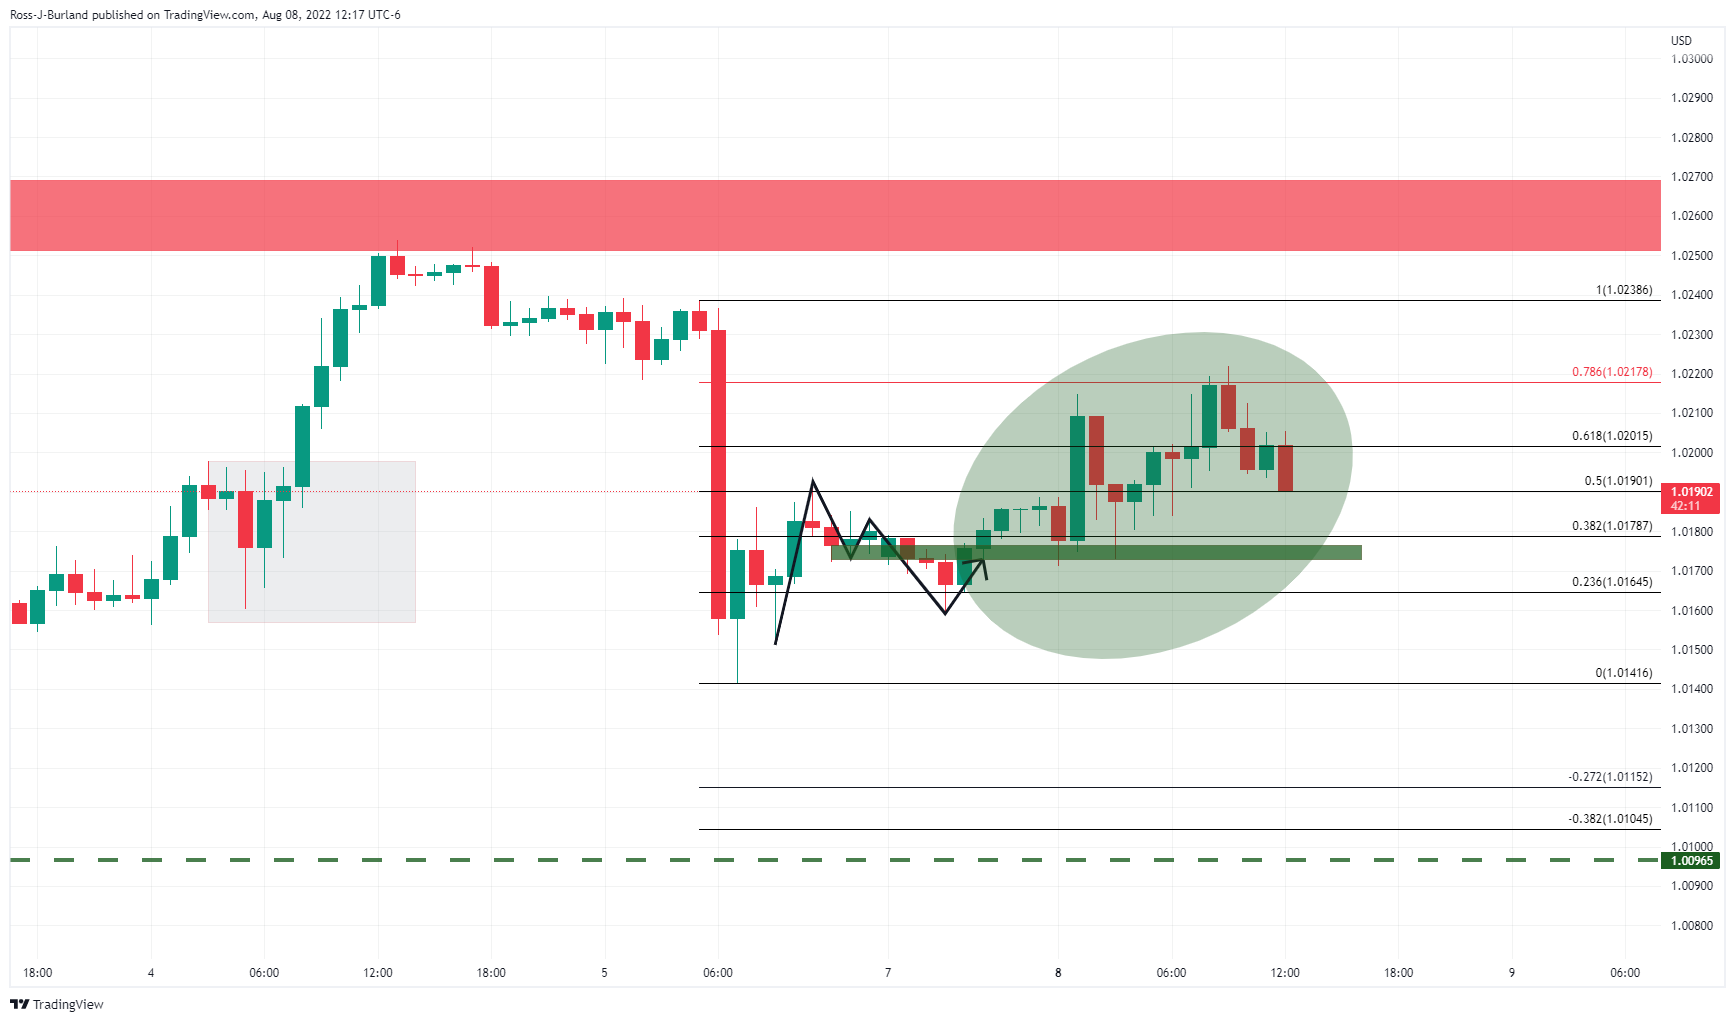
USD/CAD live chart
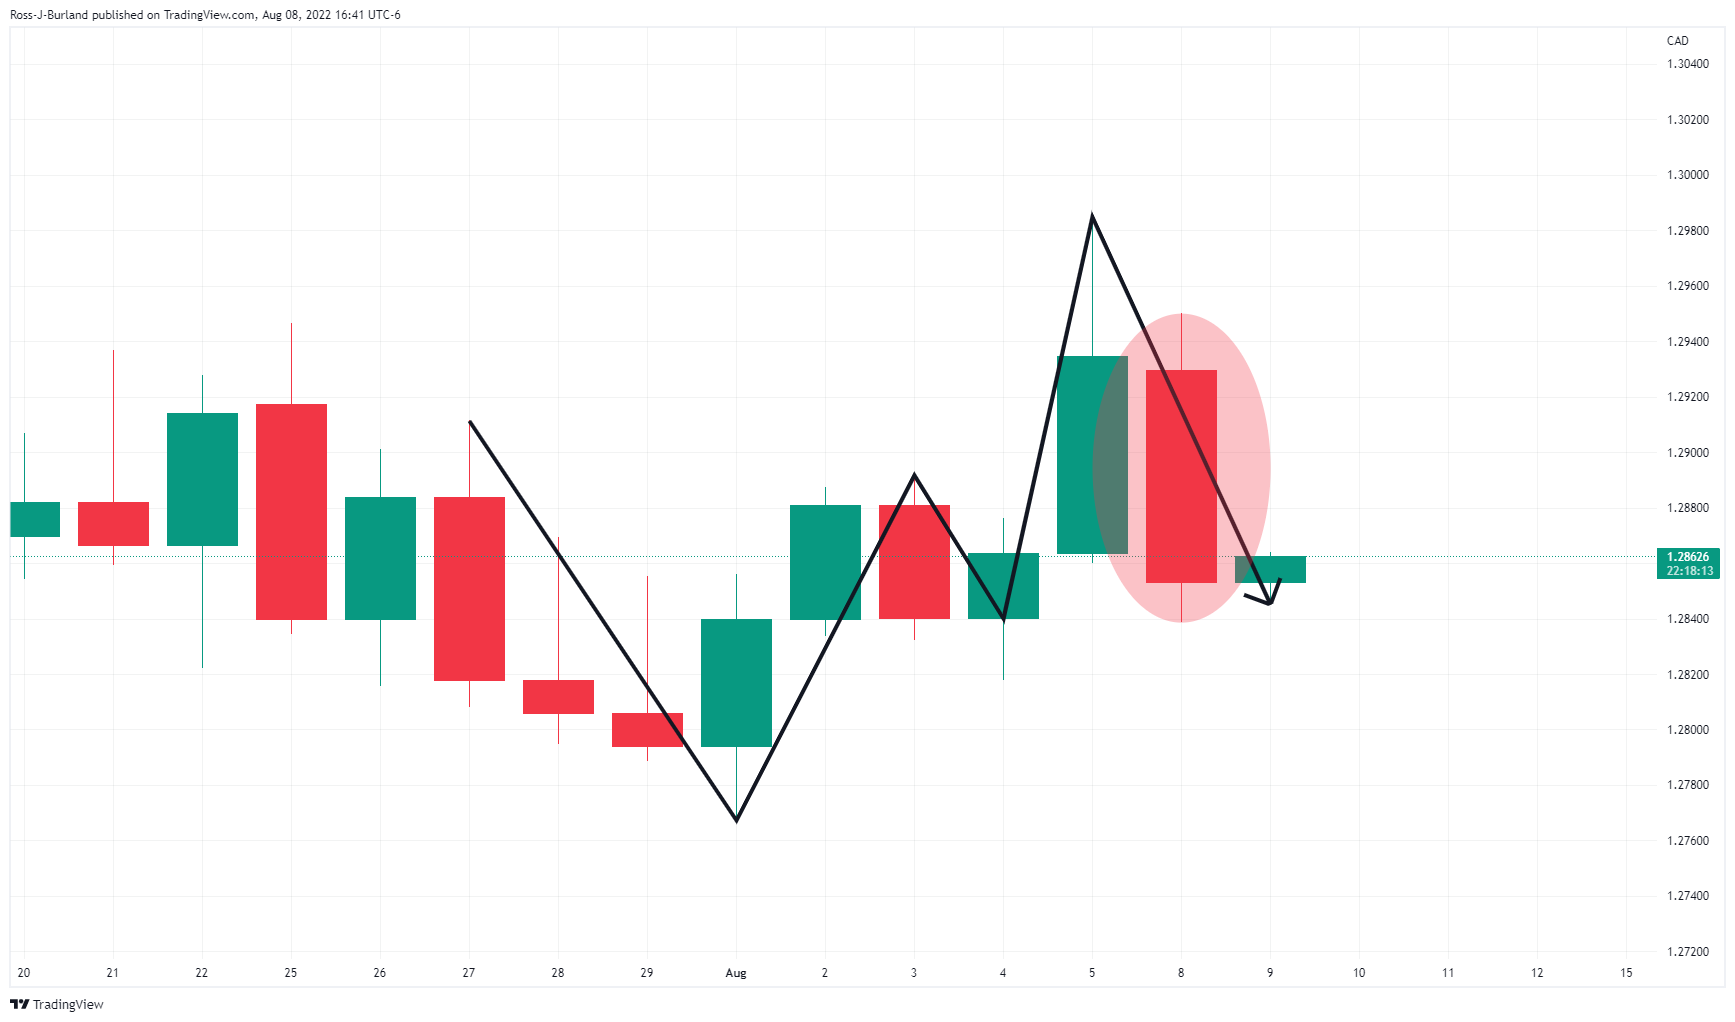
As illustrated, the price has indeed dropped, respecting the prior analysis of the W-formation and the subsequent pull into the neckline.
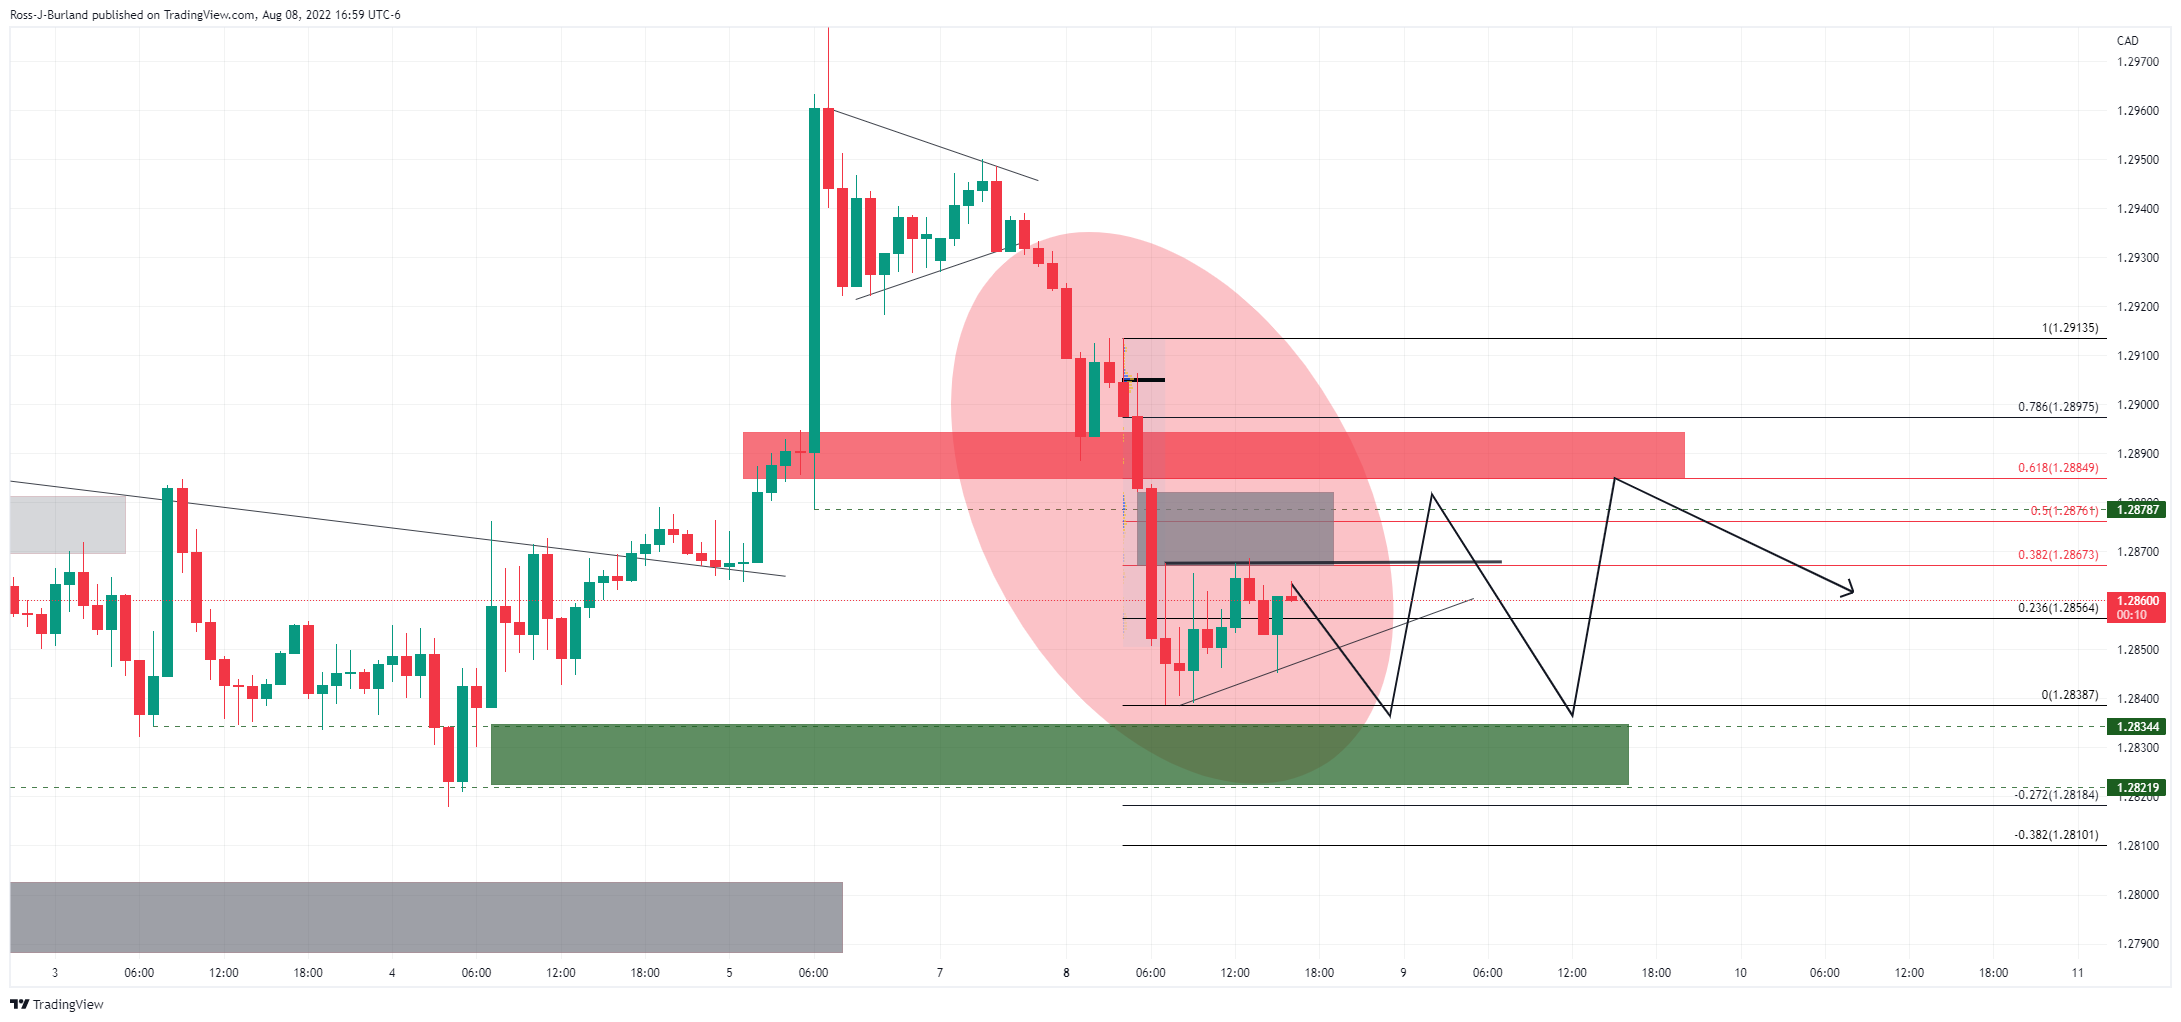
As for the 1-hour chart, the price fell out of the coil and besides a brief spell of price discovery in the 1.2880s, the bears stayed in control to test below 1.2850:
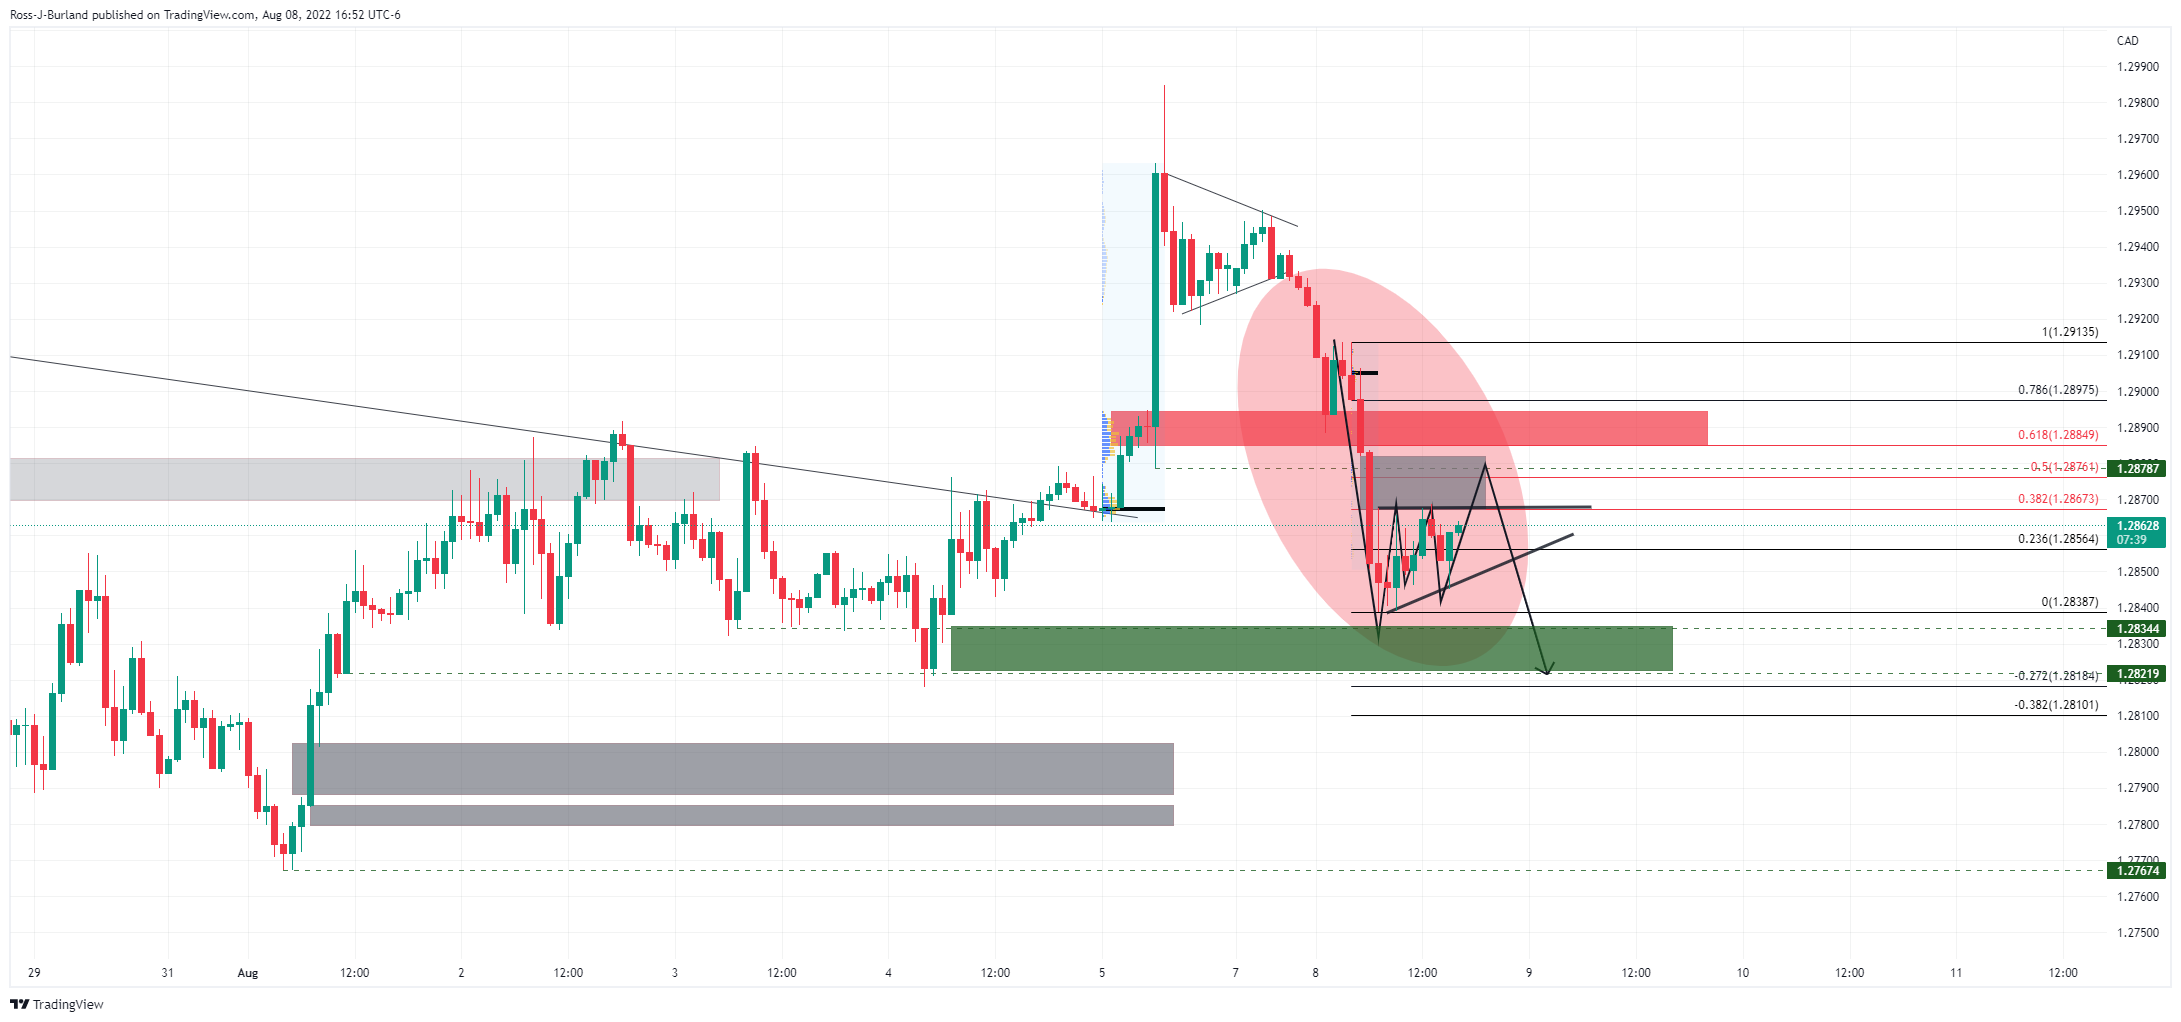
The price is coiling again and a break of the corrective highs will likely see the bulls mitigate the price imbalance above. However, resistance could hold and see the price reverse in a continuation of the downside and in an extension of the prior bearish impulse to test towards 1.2820 and potentially beyond with daily structure eyed at 1.2767.
Alternatively, we could simply see the price bounded between 1.2900 and 1.2820 as we head into key US inflation data mid-week:
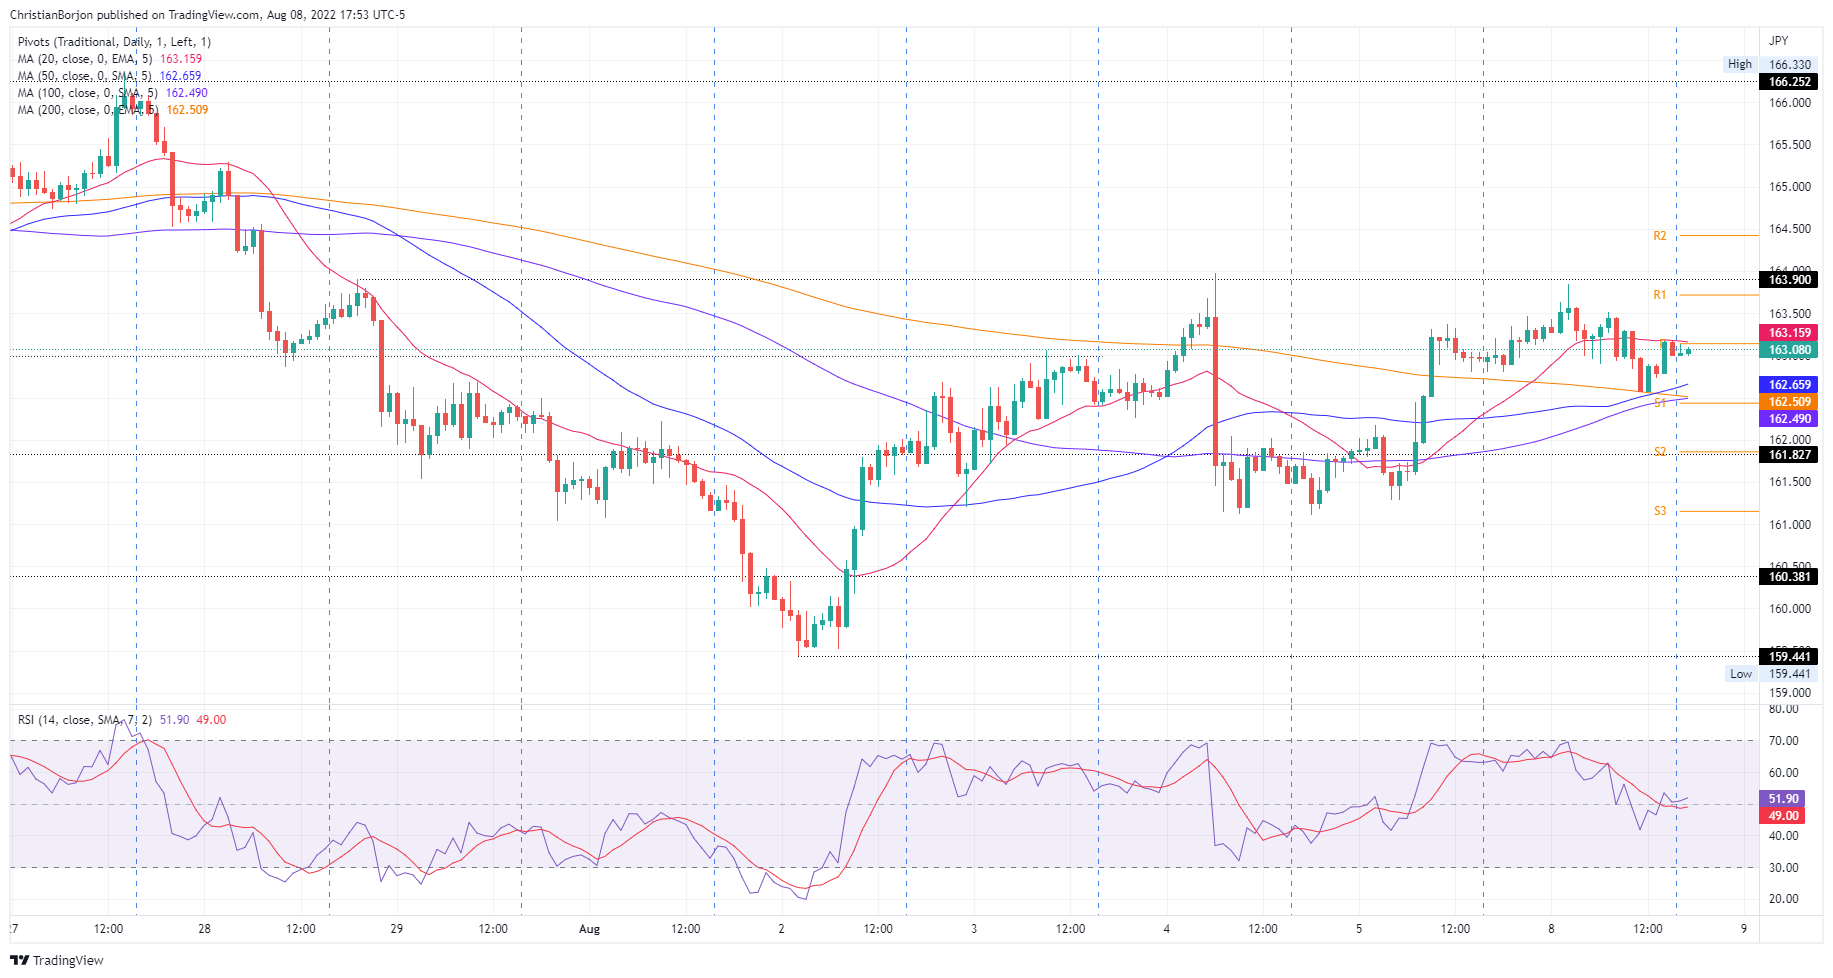
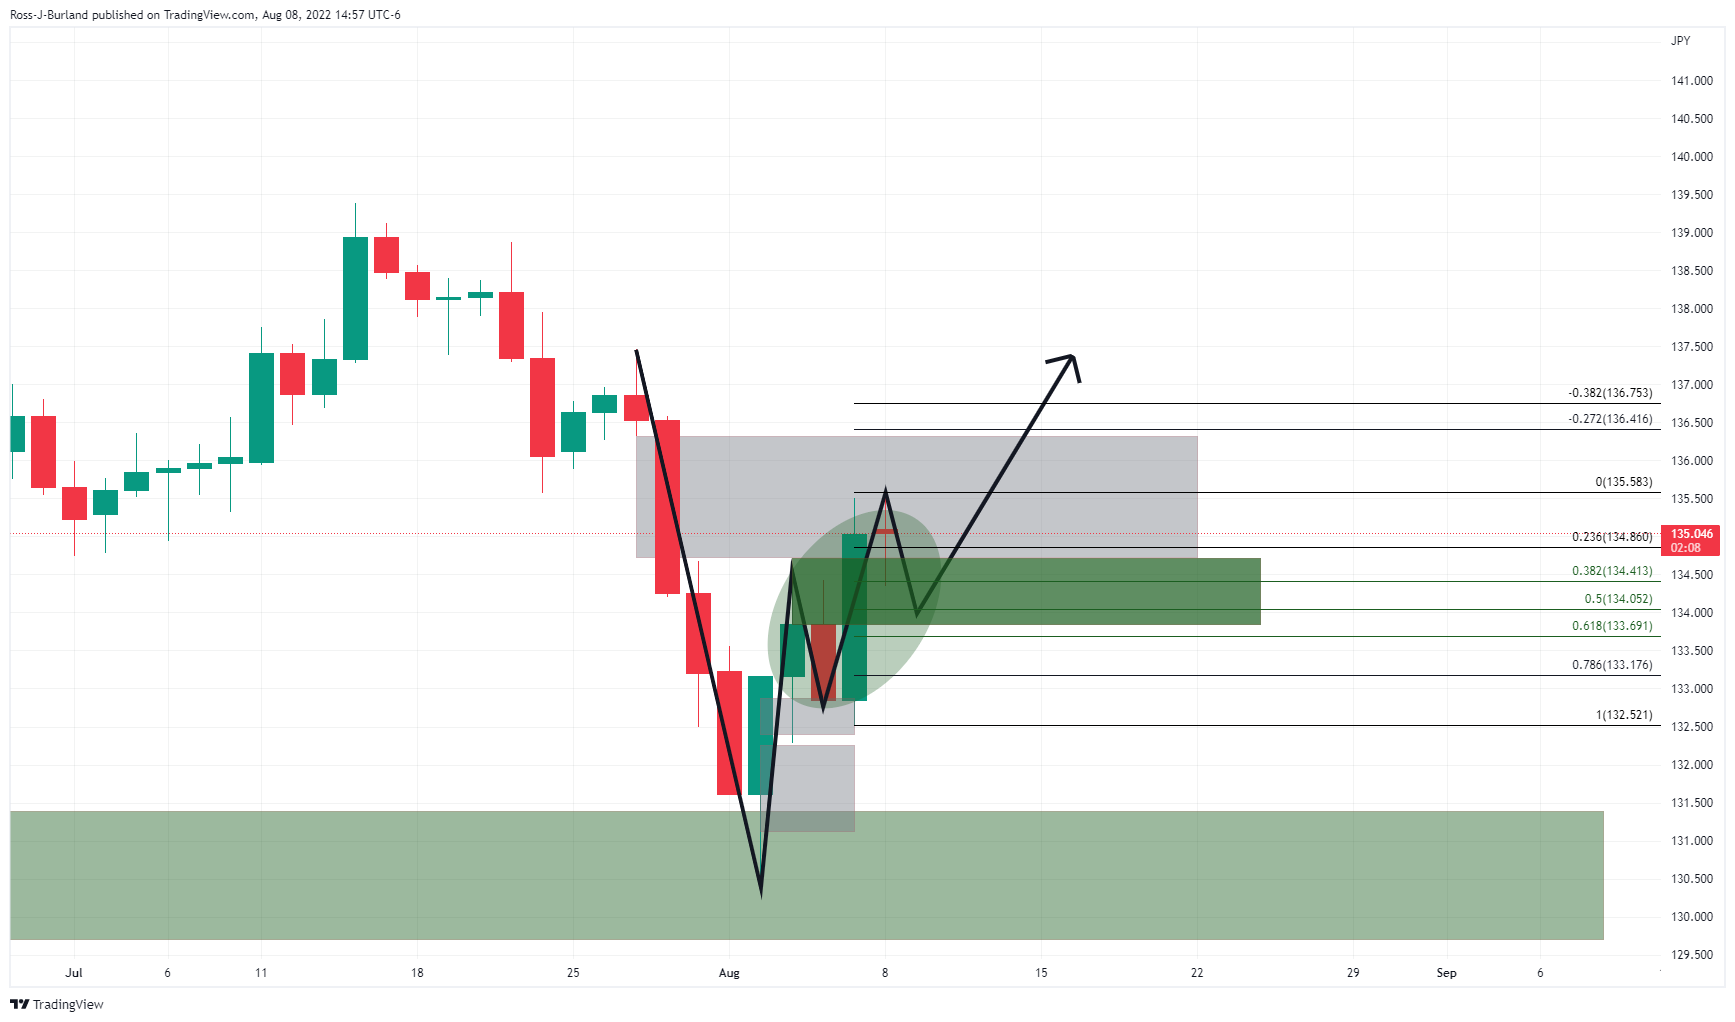
- The GBP/JPY daily chart portrays the pair as neutral-to-downwards, pierce of 163.00, to send the pair towards the 163.10s area.
- From a short-term perspective, the GBP/JPY is range bound, but the higher-time frame could lean the pair neutral-to-downwards.
The GBP/JPS is almost flat as Tuesday’s Asian Pacific session begins, seesawing around the 100-day EMA after hitting the weekly high at 163.84 on Monday. At the time of writing, the GBP/JPY is trading at 163.06, amid a risk-off mood as shown by Asian futures preparing to open lower.
GBP/JPY Price Analysis: Technical outlook
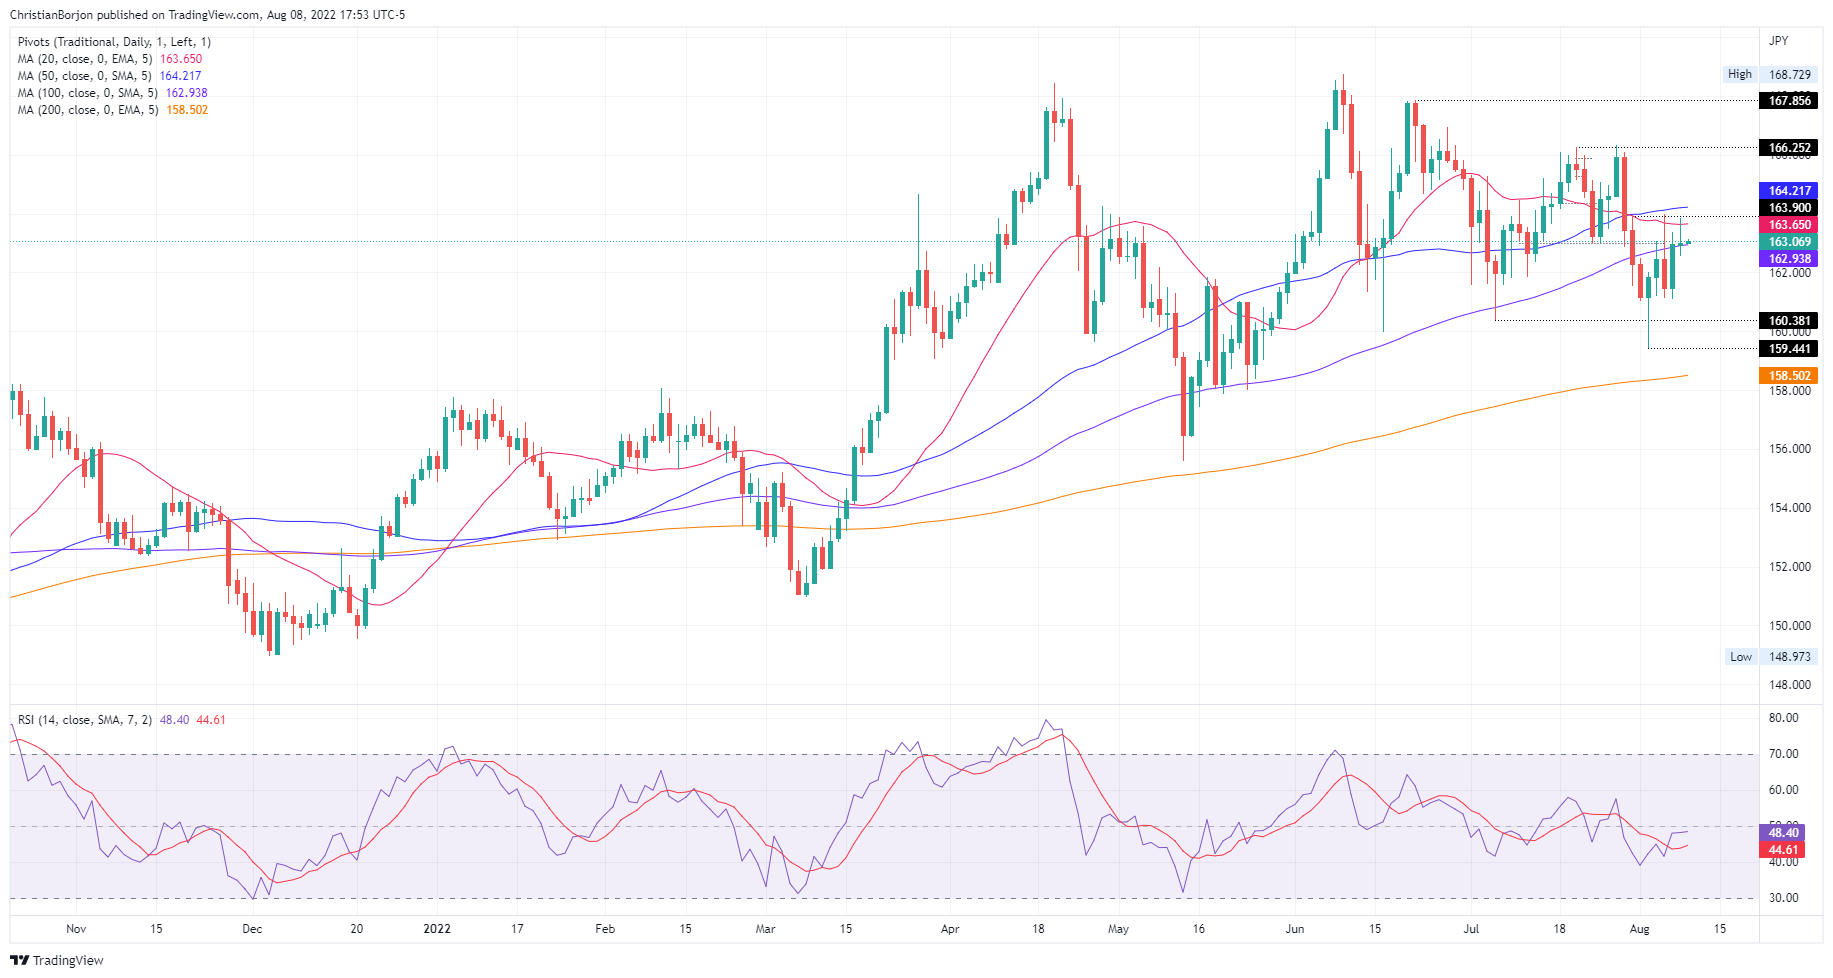
The GBP/JPY daily chart shows the pound remains heavy, albeit finishing Monday’s session with gains. Nevertheless, buyers’ inability to breach the 20-day EMA at 136.64 opened the door for sellers, who stepped in, sending the cross-currency diving towards the 163.00 figure. All that said, the pair is neutral-to-bearish biased.
Therefore, the GBP/JPY’s first support would be the August 8 low at 162.56. Break below will expose the August 5 low at 161.11, followed by the August 2 swing low at 159.44. Otherwise, if buyers reclaim the 20-day EMA at 163.64, that would open the door for a test of the 50-day EMA at 164.21.
 GBP/JPY Daily chart
The cross-currency pair is neutral biased from a short-term perspective, capped by the August 5 low and the August 8 high, at 161.11-163.84, respectively. Additionally, the Relative Strength Index (RSI), is almost flat, just above the 50-midline, but directionless. Therefore, a break above 163.84 could send the pair towards the August 4 high at 163.97, which, once cleared, could open the door for further gains. On the flip side, the GBP/JPY first support would be a busy support area, with the intersection of the 50, 200, and 100-hour EMAs around the 162.49-162.65. Once cleared, the next support would be the S2 pivot point at 161.86, followed by the S3 daily pivot at 161.16.
 GBP/JPY Hourly chart
GBP/JPY Key Technical Levels
- USD/CHF is eyeing the 0.9550 figure, critical support ahead of the US Inflation.
- Declining oil prices are responsible for lower consensus for US CPI.
- SNB’s hawkish stance is still fresh despite the unchanged inflation rate at 3.5% released last week.
The USD/CHF pair has turned sideways after catching bids around 0.9550 in the early Tokyo session. On Monday, the asset defended the two-day support of 0.9540 and a responsive buying action pushed the asset higher. The major is likely to display action as per the positions adjusting ahead of the US Inflation.
As per the market consensus, the US Consumer Price Index (CPI) is likely to trim to 8.7% from the prior release of 9.1%. A drop by 40 basis points in the consensus is backed by declining oil prices over the past few weeks. The black gold lost its mojo on accelerating recession fears and trimming supply worries. This may delight the Federal Reserve (Fed) to head a little soft this time on interest rates.
Apart from that, the upbeat US Nonfarm Payrolls have shrugged off higher unemployment fears. The job additions in the labor market at 528k were more than doubled the expectations of 250k despite a halt in the recruitment process by various US corporate players.
Well, the economic condition is not fixed yet as the US CPI is still to release. Also, a continuous slowdown in the price pressures is crucial to determine a decline in the price rise index. Therefore, a wait-and-watch game will continue to persist.
On the Swiss franc front, the unchanged inflation rate released last week at 3.5% doesn’t trim the odds of a rate hike by the Swiss National Bank (SNB) ahead, but hawkish guidance could get mild. A light Swiss economic calendar this week will remain more dependent on the greenback.
US inflation expectations, per the 10-year breakeven inflation rate per the St. Louis Federal Reserve (FRED) data, rose for the second consecutive day by the end of Monday’s North American session. That said, the inflation gauge recently flashed the 2.48% mark, reversing the previous week’s losses of late.
The recovery in the long-term inflation expectations should ideally help the US dollar as traders brace for this week’s US Consumer Price Index (CPI) for July, up for publishing on Wednesday.
Also likely to have underpinned the data could be the recently firmer US jobs report for July and the hawkish Fedspeak. On Friday, the headline Nonfarm Payrolls (NFP) rose to 528K versus 250K expected and 398K upwardly revised prior. Further, the Unemployment Rate also inched lower to 3.5% compared to 3.6% expected and previous readings. Following the data, San Francisco Fed President Mary Daly said during the weekend that the Fed is far from done in combating inflation. The policymaker also added, “50 bps increase is definitely in play. We need to keep an open mind.” On the same line was Fed Governor Michelle Bowman who said, “Fed should consider more 75 basis-point interest rate hikes at coming meetings to bring high inflation back down to the central bank's goal.”
It’s worth noting, however, that a lack of major data/events offered a sluggish start to the key week.
Also read: Forex Today: Adjusting positions ahead of US inflation figures
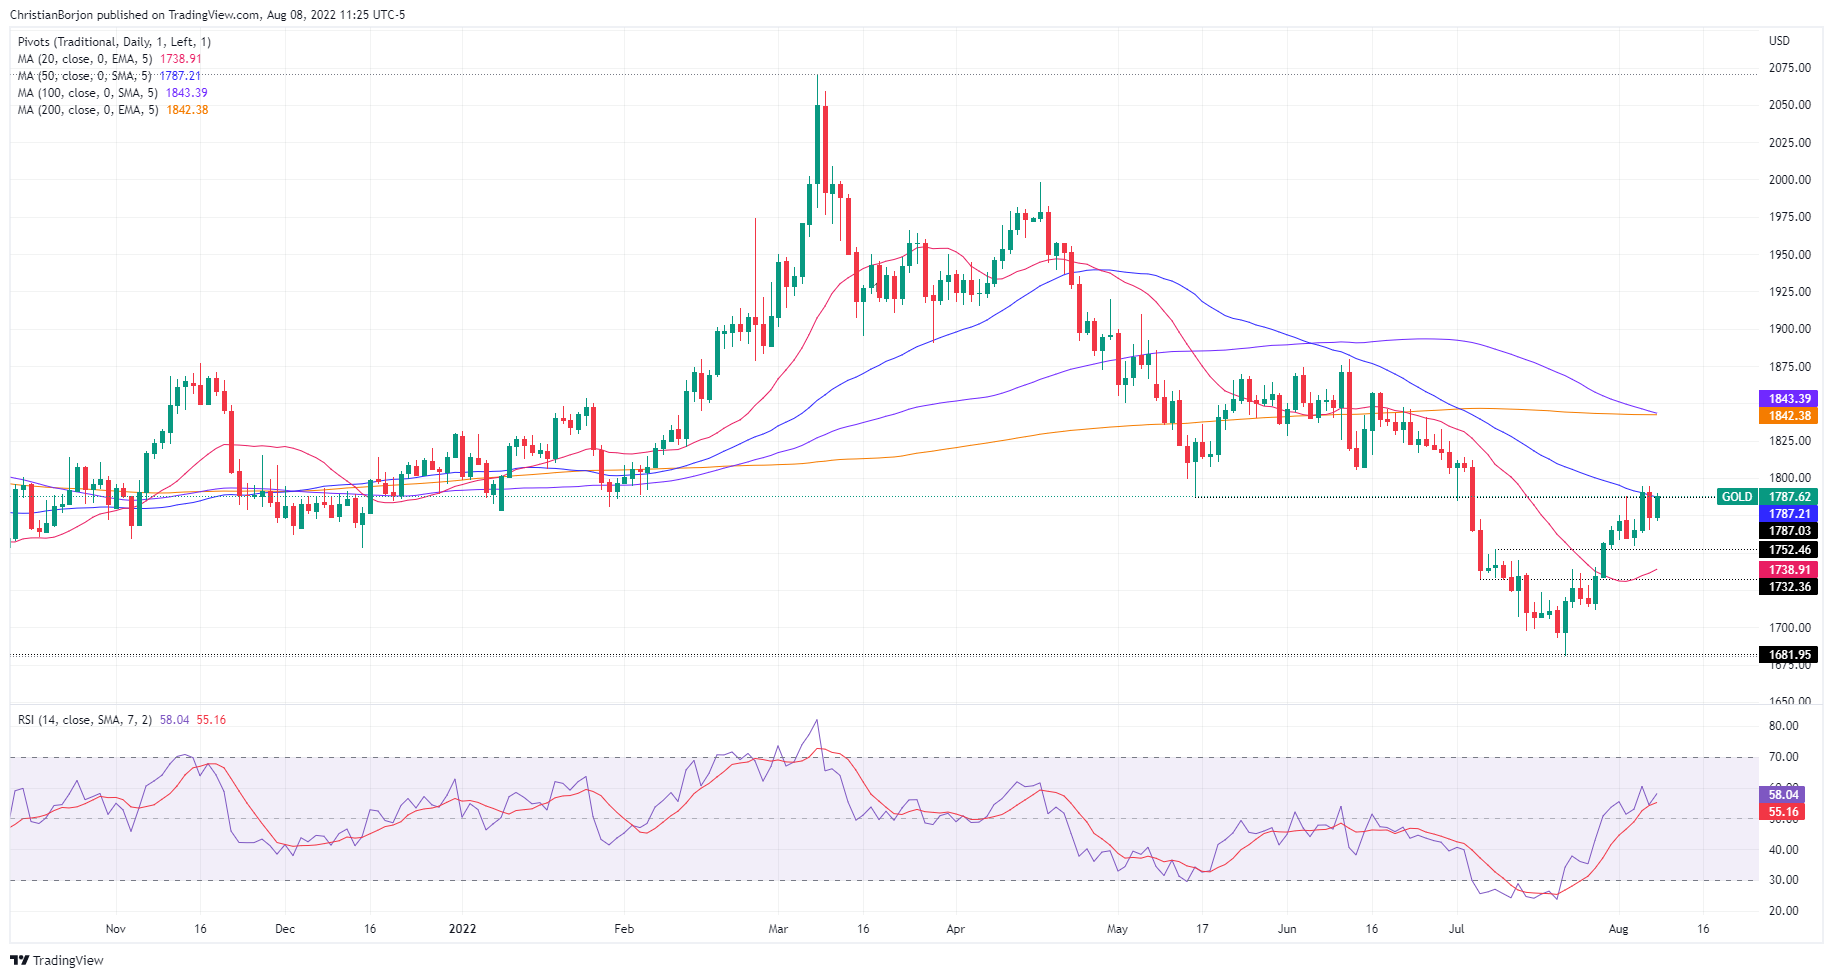
- Gold price bounced off 13-day-old support line amid softer US dollar.
- Market’s preparations for US inflation, pullback in yields and a light calendar favored XAU/USD buyers.
- Second-tier US jobs numbers, risk catalysts can entertain bulls ahead of US CPI for July.
Gold price (XAU/USD) cheered US dollar pullback and softer yields to print the latest gains, before taking rounds to $1,790 during the initial Asian session on Tuesday. The metal’s upward trajectory also took clues from equities as the key began the week’s trading on a positive side but retreated by the end of the day.
US Dollar Index (DXY) traced Treasury yields to consolidate Friday’s heavy gains that offered the greenback gauge the first weekly positive in three. That said, the DXY registered a 0.19% daily loss to 106.37 by the end of Monday whereas the US 10-year Treasury yields dropped nearly seven basis points (bps) to 2.75% at the latest, following a 14-bps run-up the previous day.
Also favoring the gold buyers could be the market’s lack of attention to the US-China tussles over Taiwan and China’s solid trade numbers for July. That said, the dragon nation continues its military drills near the Taiwan border but the US recently signaled no major escalation in the geopolitical risks likely from Beijing. Elsewhere, China’s trade numbers for July. The headline Trade Balance rose to $101.26B versus $90B forecasts and $97.94B. Further details suggest that Exports increased by 18% compared to 15% expected and 17.9% prior whereas the Imports eased to 2.3% compared to 3.7% expected and 1.0% prior.
It’s worth noting, however, that escalating hawkish Fed bets and the Fed policymakers’ favor for the aggressive rate hikes challenged the XAU/USD bulls. That said, the interest rate futures signaled a 73% chance of the Fed’s 75 bps rate hike in September following the strong US jobs report for July. The headline Nonfarm Payrolls (NFP) rose to 528K versus 250K expected and 398K upwardly revised prior. Further, the Unemployment Rate also inched lower to 3.5% compared to 3.6% expected and previous readings.
After the data, San Francisco Fed President Mary Daly said during the weekend that the Fed is far from done in combating inflation. The policymaker also added, “50 bps increase is definitely in play. We need to keep an open mind.” On the same line was Fed Governor Michelle Bowman who said, “Fed should consider more 75 basis-point interest rate hikes at coming meetings in order to bring high inflation back down to the central bank's goal.”
Looking forward, the US dollar weakness may favor gold buyers, together with the technical details mentioned below. Also important to watch will be the US Nonfarm Productivity and Unit Labor Costs for the second quarter (Q2). Forecasts suggest that the US Nonfarm Productivity could improve to -4.6% from -7.3% prior while Unit Labor Costs may ease to 9.5% versus 12.6% previous readings. Furthermore, headlines surrounding Taiwan and Russia will also be important for clear directions.
Technical analysis
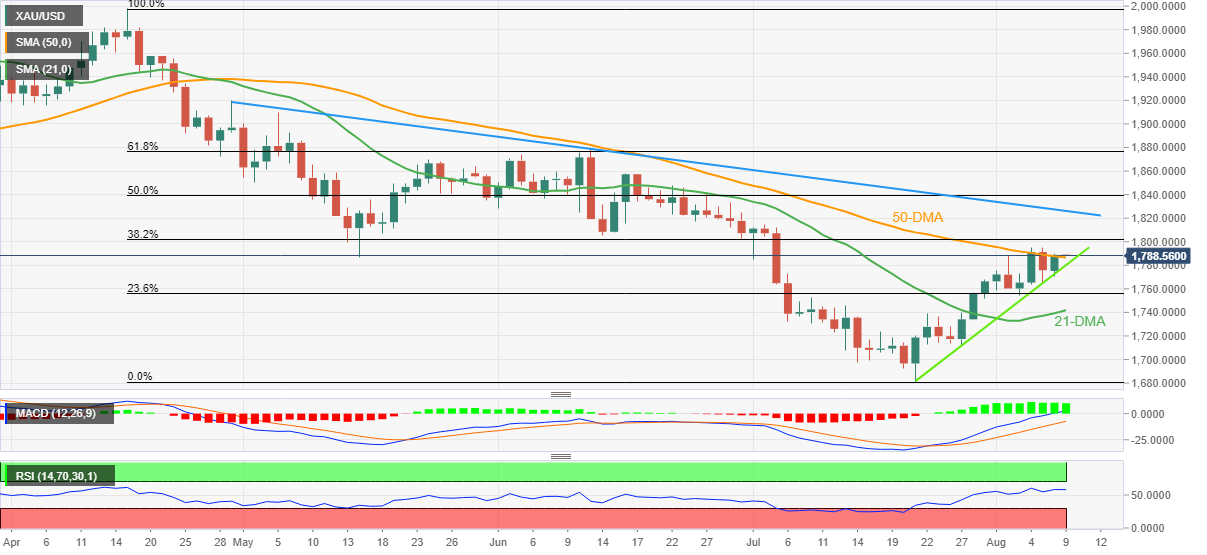
Gold price not only bounced off a short-term key support line but also crossed the 50-DMA on a daily closing for the first time since late April. The upside move takes clues from the firmer RSI (14), not overbought, as well as bullish MACD signals to keep buyers hopeful.
That said, the XAU/USD buyers are ready to renew the monthly high near the $1,800 threshold before poking the 38.2% Fibonacci retracement of April-July fall, close to $1,802.
However, a downward sloping resistance line from mid-June, close to $1,827, could challenge the gold bulls afterward.
Meanwhile, the 50-DMA and the aforementioned support line, respectively near $1,786 and $1,780, could restrict the metal’s short-term downside.
Following that, the 23.6% Fibonacci retracement level and the 21-DMA, around $1,755 and $1,741 in that order, should gain the XAU/USD sellers’ attention.
Overall, the gold price is ready to extend the latest gains toward the 1.5-month-old resistance line.
Gold: Daily chart
Trend: Further upside expected
- Volatility contraction escalates on a follow-up Diamond after a consolidation.
- Overlapping 50-EMA with asset prices is hinting at a sideways move ahead.
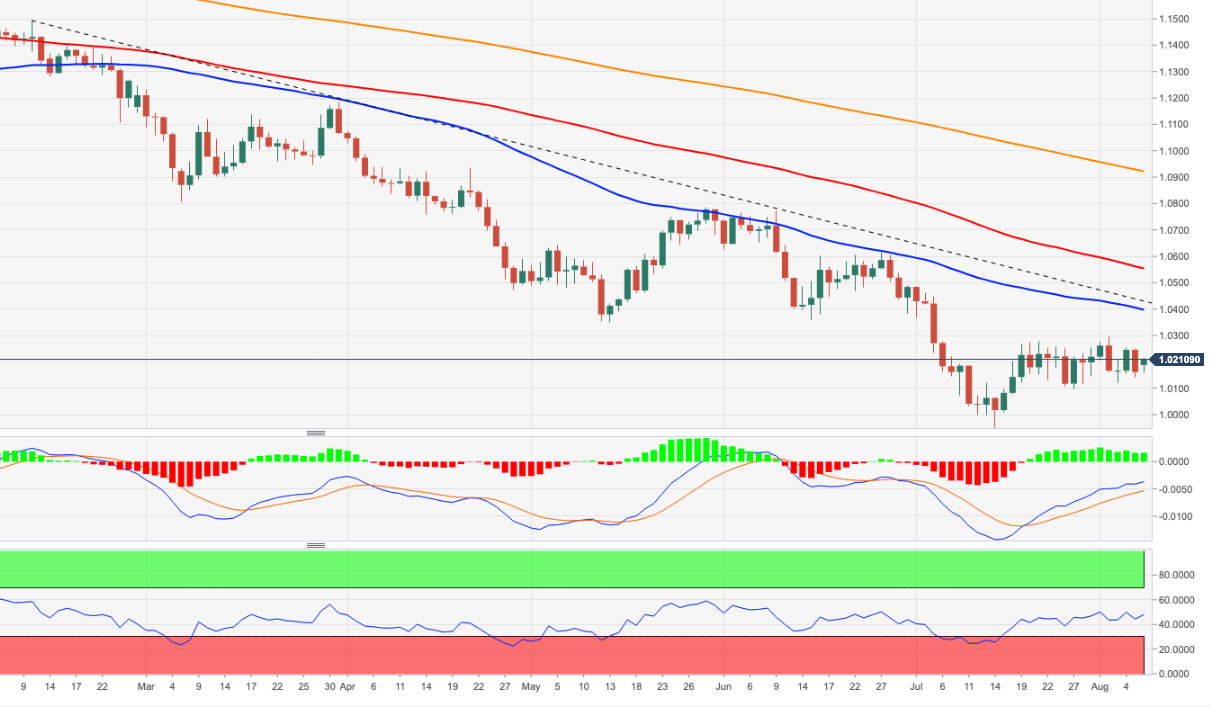
- The shared currency bulls are continuously facing barricades around 1.0200.
The EUR/USD pair has displayed a gradual decline and has slipped to near 1.0193 after failing to surpass the critical hurdle of 1.0220 in the New York session. On a broader note, the asset is advancing modestly after printing a low of 1.0146 last week. The asset is facing barricades in establishing above the psychological resistance of 1.0200
A formation of a Diamond pattern after a prolonged consolidation indicates that the asset is still inside the woods and will take sufficient time to conclude its volatility contraction. Usually, a breakout of a volatility contraction in an asset is followed by volumes and wide-range ticks.
The 50-period Exponential Moving Average (EMA) at 1.0193 is overlapping with the asset prices, which signals a consolidation ahead.
Also, the Relative Strength Index (RSI) (14) is oscillating in the 40.00-60.00 range, which indicates that the market participants are awaiting a fresh trigger for a decisive move.
A decisive move above Thursday’s high at 1.0254 will drive the asset towards the August 2 high at 1.0294, followed by June 15 low at 1.0359.
Alternatively, the greenback bulls could cripple the upside bias if the asset drops below July 27 low at 1.0097, which will drag the asset towards July 14 high at 1.0050. A breach of the latter will unleash the greenback bulls for more downside towards July 14 low at 0.9952.
EUR/USD hourly chart
-637955936412348412.png)
- AUD/USD grinds higher after the heavy gains amid a lack of major catalysts.
- China trade data, market’s preparations for US CPI appeared to have favored buyers.
- Mixed equities probed upside momentum, yields underpinned the US dollar pullback.
- Australia’s NAB data for July, second-tier US job numbers may entertain intraday traders, Taiwan headlines are important too.
AUD/USD bulls take a breather after the biggest daily jump in three weeks, taking rounds to 0.6880-90 amid the initial hour of Tuesday’s Asian session. In doing so, the Aussie pair cheered the US dollar’s pullback, as well as firmer China data, before portraying a cautious mood ahead of sentiment data from the National Australia Bank (NAB) and the key US Consumer Price Index 9CPI) for July.
The Aussie pair began the week on the front foot as the US Dollar Index (DXY) traced Treasury yields to consolidate the latest gains. That said, the DXY registered a 0.19% daily loss to 106.37 by the end of Monday whereas the US 10-year Treasury yields dropped nearly seven basis points (bps) to 2.75% at the latest, following a 14-bps run-up on Friday.
Also helping the AUD/USD bulls were firmer prints of China’s trade numbers for July. The headline Trade Balance rose to $101.26B versus $90B forecasts and $97.94B. Further details suggest that Exports increased by 18% compared to 15% expected and 17.9% prior whereas the Imports eased to 2.3% compared to 3.7% expected and 1.0% prior.
It’s worth noting, however, that the hawkish Fedspeak and anxiety ahead of the US inflation data capped the AUD/USD prices. The Fed policymakers welcomed Friday’s strong US jobs report while supporting the aggressive rate hikes.
On Friday, the headline Nonfarm Payrolls (NFP) rose to 528K versus 250K expected and 398K upwardly revised prior. Further, the Unemployment Rate also inched lower to 3.5% compared to 3.6% expected and previous readings. Following the data, San Francisco Fed President Mary Daly said during the weekend that the Fed is far from done in combating inflation. The policymaker also added, “50 bps increase is definitely in play. We need to keep an open mind.” On the same line was Fed Governor Michelle Bowman who said, “Fed should consider more 75 basis-point interest rate hikes at coming meetings in order to bring high inflation back down to the central bank's goal.”
Moving on, NAB Business Confidence and NAB Business Conditions for July, expected 15 and 7 versus 13 and 1 in that order, will direct short-term moves of the AUD/USD ahead of the US Nonfarm Productivity and Unit Labor Costs for the second quarter (Q2). Forecasts suggest that the US Nonfarm Productivity coooulddd improve to -4.6% from -7.3% prior while Unit Labor Costs may ease to 9.5% versus 12.6% previous readings. Other than that, headlines surrounding Taiwan and Russia will also be important for clear directions.
Technical analysis
AUD/USD remains firmer above the 50-DMA support of 0.6880 but the upside momentum needs validation from a downward sloping resistance line from mid-June, close to 0.7025 by the press time.
- On Monday, the EUR/JPY registered minimal gains of 0.14%.
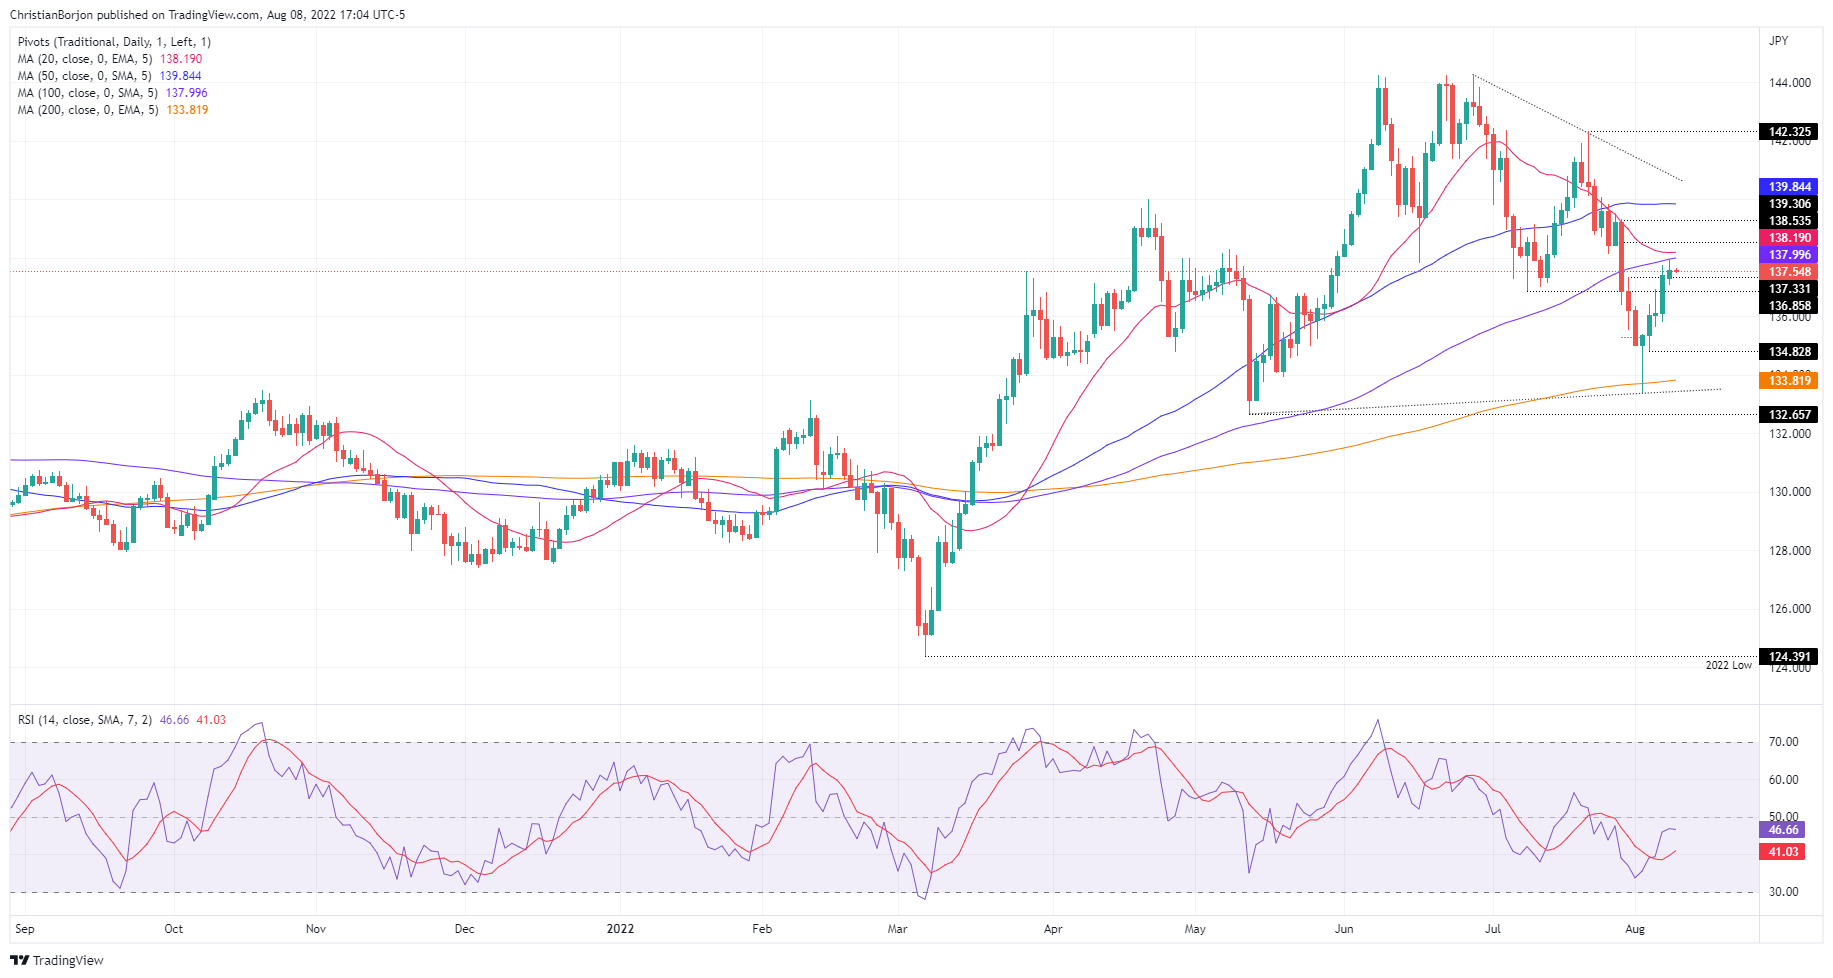
- EUR/JPY daily chart depicts the pair as neutral-to-downward biased; however, a break above 137.92 could shift the bias.
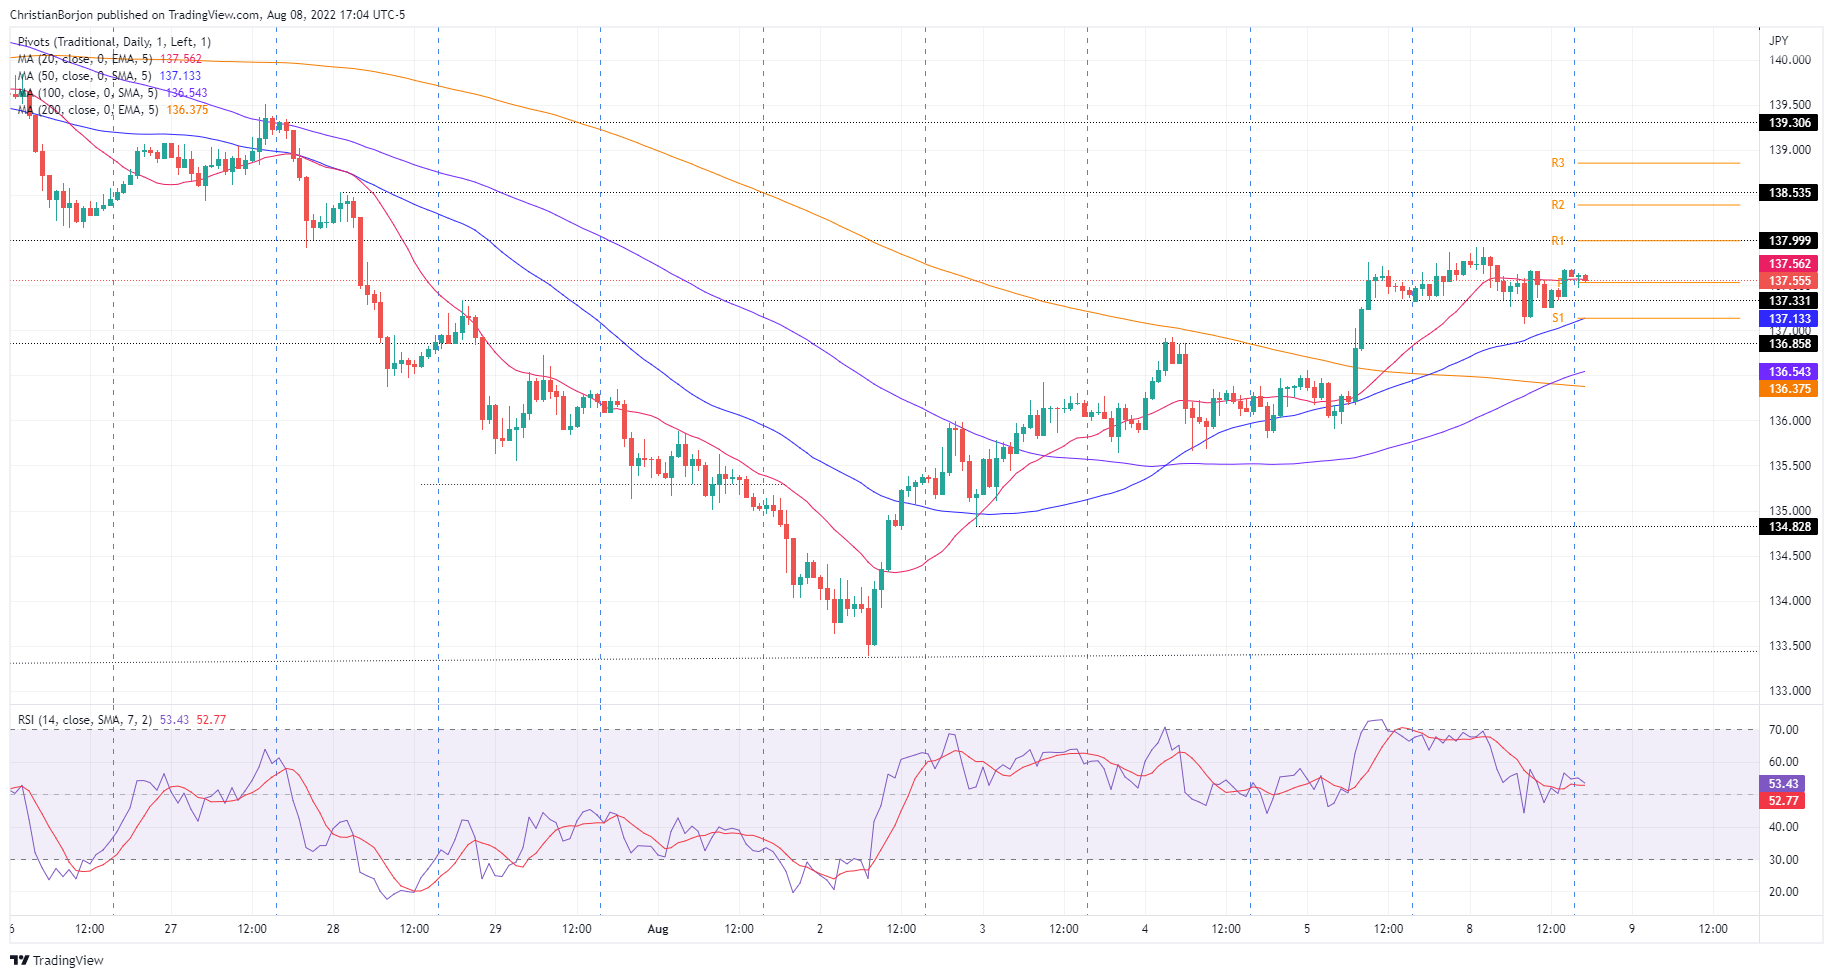
- Short term, the EUR/JPY is neutral-to-upwards, but breaks below 137.06, shift the bias to neutral.
The EUR/JPY seesaws as the Asian Pacific session begins, just below the confluence of the 20 and 100-day EMA, around 137.99-138.19 area, amidst fragile sentiment, as shown by Asian equity futures set to open lower, while US equities closed mixed. At the time of writing, the EUR/JPY is trading at 137.62, slightly up 0.02%.
EUR/JPY Price Analysis: Technical outlook
From a daily chart perspective, the EUR/JPY is bearish biased. Successions of lower highs/lows, alongside daily EMAs above the exchange rate, confirm those above. Also, sellers are gathering momentum, per the Relative Strength Index (RSI) shows, at 46.05, with an almost horizontal slope, but still in negative territory. Therefore, the EUR/JPY's first support would be the August 8 daily low at 137.06. A break below could pave the way towards 135.80 August 5 low, exacerbating further downside action. On the flip side, the EUR/JPY's first resistance would be the August 8 high at 137.92.
 EUR/JPY Daily chart
Meanwhile, the EUR/JPY hourly chart portrays an opposite bias to the daily chart, neutral-to-upwards. Factors like the hourly EMAs, below the exchange rate, alongside the Relative Strength Index (RSI) at bullish territory, back up the bias.
Therefore, the EUR/JPY's first resistance would be the confluence of the August 8 high and the R1 pivot around 137.92-138.00. A breach of the latter will expose the R2 daily pivot at 138.40, followed by the R3 pivot point at 138.87. On the other hand, a EUR/JPY break below 137.06 might shift the bias to neutral, opening the door for further losses.
 EUR/JPY Hourly chart
EUR/JPY Key Technical Levels
- GBP/USD is sensing barricades around 1.2080 as investors await US CPI data.
- Downbeat oil prices have trimmed US CPI forecasts and Fed’s rate hike hopes.
- A lower consensus for BRC Like-for-Like Retail Sales in times of higher inflation indicates vulnerable demand.
The GBP/USD pair is struggling to cross the immediate hurdle of 1.2080 and has marked its territory after a sheer downside move from the critical hurdle of 1.2130. The cable is oscillating in a narrow range of 1.2068-1.2081 from the late New York session and is likely to remain topsy-turvy as investors are awaiting the release of the US Inflation.
Wednesday’s US Consumer Price Index (CPI) is likely to shift lower to 8.7% on an annual basis as oil prices have remained vulnerable in July. Accelerating recession fears in the Western economies and China have trimmed the demand forecasts vigorously, which forced the market participants to dump oil longs.
The investing community is aware of the fact that the volatile oil prices were driving the price rise index higher. Now, downbeat oil prices are clearly diminishing the inflation forecasts and the continuation of a 75 basis point (bps) rate hike odds by the Federal Reserve (Fed). While the core CPI that doesn’t inculcate volatile oil and food products is expected to elevate to 6.1% from the prior release of 5.9%.
On the UK front, investors are awaiting the release of the Gross Domestic Product (GDP), which is due on Friday. The economic data is expected to plummet to 2.8% vs. 8.7% reported earlier on an annual basis. An occurrence of the same will send the pound bulls on the back foot.
But before that, the release of the British Retail Consortium (BRC) Like-For-Like Retail Sales holds significant importance. The economic data may plunge sharply to -8.4% vs. -1.3% reported last month. A significant drop in Retail Sales, in times when the inflation rate is accelerating, displays that the decline is higher than the absolute and relative plunge. Higher inflation should elevate Retail Sales data but a decline vulnerable retail demand in the economy.
- NZD/USD advances despite a lack of catalyst, lifted by the AUD/USD.
- Sentiment remains mixed, tilted positively, as shown by the FX space, with safe-haven peers pressured.
- Fed policymakers are still pushing back against dovish tilt, as money market STIRs odds of a 75 bps hike lie at 90%.
- RBNZ survey of inflation expectations easied, with 2-year inflation at around 3%.
The NZD/USD climbs as the New York session winds down, up 0.72%, as US equities finished mixed, reflecting a fragile mood. Nevertheless, in the FX space, a risk-on impulse underpinned risk-sensitive currencies like the New Zealand dollar, despite increasing odds of further tightening by the Federal Reserve.
The NZD/USD is trading at 0.6285. earlier, the NZD/USD reached a daily low at 0.6230 before rallying sharply and hitting a daily high at 0.6305, around the London fix time.
The sentiment is stills mixed. The greenback ended Monday’s session on the wrong foot, though late trimmed losses, with the US Dollar Index at 106.387, down 0.18%. Contrarily, US bond yields, led by the US 10-year T-bond yield, dropped almost nine bps, at 2.746%.
The financial market narrative hasn’t changed. Strong US jobs report in last Friday, with US Nonfarm Payrolls surprisingly doubling estimation had seen a jump in Fed’s rate hikes expectations. Since money market futures STIRs show a 90% chance of a 75 bps rate hike, further fueled by Fed’s Michelle Bowman, over the weekend. She said, “I supported the FOMC’s decision last week to raise the federal funds rate another 75 basis points,” while adding that the Fed should keep considering significant hikes.
Furthermore, San Francisco’s Fed Mary Daly said that the Fed is nowhere near done with its fight against inflation. Meanwhile, the July New York Fed Consumer survey revealed that inflation expectations dropped to 6.2% YoY from 6.8% for a 1-year horizon.
In the meantime, the Reserve Bank of New Zealand (RBNZ) survey of expectations released on Monday portrays that 2-year inflation expectations tempered to 3.07%. Meanwhile, the 5-year ahead measure slipped to 2.3%, while the 10-year remained stable at 2.1%.
Analysts at Westpac wrote in a note that: “Even so, today’s survey still points to solid inflation pressures in the New Zealand economy and reinforces the case for rate rises. We’re forecasting another 50bp rise at next week’s RBNZ policy meeting. “
What to watch
The New Zealand economic calendar will feature Electronic Card Retail Sales MoM and YoY for July. On the US front, the economic calendar will unveil July’s CPI and PPI data on Wednesday and Thursday, respectively. Further Fed speaking, led by Charles Evans, Neil Kashkari, and Mary Daly, would offer fresh impetus to NZD/USD traders.
NZD/USD Key Technical Levels
- USD/JPY bulls could be about to move back in on the daily chart.
- US CPI will be key this week, with eyes on US yields.
USD/JPY has been in recovery mode for the best part of a week, but it came up against resistance following last week’s strong July labour market data in the US. On Monday, the pair is ending the New York session flat for the day at around 135 the figure having ranged between 134.34 and 135.58.
Analysts at ANZ Bank said that despite clear signs of a moderation in Gross Domestic Product growth globally, ''the slower growth and less accommodative monetary environment have yet to show up in increased labour market slack. Until clear evidence emerges that both labour markets and core inflation are moderating, central banks will remain dedicated to getting inflation down, a bias that points to the potential for further large incremental rate hikes.''
The focus for the week ahead will be the July US inflation data in Consumer Price Index that is expected to confirm core inflation (ex-food & energy) rose 0.5% MoM, up 6.1% YoY (5.9%). ''That is way too high for the Fed amid a tightening labour market. The priority of reducing inflation in order to underpin the expansion in domestic demand and sustainable jobs growth will ring loud and clear from the August 25-27 Jackson Hole symposium,'' analysts at ANZ Bank explained.
The analysts at ANZ Bank also said that before the Federal Open Market Committee meets again in September, it will also have the August CPI and labour market data. ''Unless that moderates meaningfully from July’s strong gains, the risks are significant that the Fed may need to hike rates by another 75bps at the 20-21 September meeting.''
Meanwhile, from a positioning perspective, JPY net short positions fell according to the latest CFTC data. In the spot market the JPY had recovered some ground vs the USD as US yields dropped back. ''The stronger than expected US July payrolls report, however, has subsequently caused US 2-year yields to push higher and this has lent fresh support to USD/JPY in the spot market,'' analysts at Rabobank explained.
USD/JPY technical analysis
As per the prior analysis, USD/JPY Price Analysis: Bears are lurking within a strong bullish trend, the price moved in to correct the bearish impulse:
(Prior daily chart, above, prior H4 chart, below)
USD/JPY live market
As illustrated, the price indeed moved in towards the targetted area of mitigation as per the prior analysis forecasted and explained. At this juncture, there are prospects of a correction of Friday's bullish candle into the neckline of the W-formation as follows:
The upside prospects will send on the performance of US yields, but there are stacking up for a bullish continuation in the 10-year yields according to the recovery attempts within the broadening formation as follows:
The yield has corrected towards the neckline of the W-formation on the daily chart within the lower boundary of the broadening formation.
In turn, should the price hold above the flagged levels on the chart above, then a break of the trendline resistance could result in a rally in yields, a weight for gold prices.
What you need to take care of on Tuesday, August 9:
The dollar eased on Monday as government bond yields retreated, providing support to stock markets. Still, the absence of relevant news maintained US indexes seesawing within familiar levels. European indexes posted modest intraday gains, but Wall Street closed mixed.
Market players hold their breath ahead of the US Consumer Price Index to be released next Wednesday. Concerns about economic growth and aggressive tightening in the US re-surged on Friday after a strong job report. Investors will make a reassessment of the situation after the release of inflation figures.
Tensions between Germany and Russia over natural gas delivery undermined demand for the shared currency. The EUR/USD pair flirted with the 1.0200 level and settled at around 1.0190.
GBP/USD ended the day pretty much unchanged at 1.2075. Commodity-lined currencies surged against their American rival, shedding some ground ahead of the close but holding to intraday gains. AUD/USD trades at around 0.6980, while USD/CAD is down to 1.2860.
The USD/JPY pair hovers around 135.00, while USD/CHF trades at 0.9560.
Spot gold retained gains at the end of the day at settled at $1,788 a troy ounce. Crude oil prices posted a modest advance, with WTI currently trading at $90.50 a barrel.
Top 3 Price Prediction Bitcoin, Ethereum, Ripple: Are your bags packed for FOMO Season?
Like this article? Help us with some feedback by answering this survey:
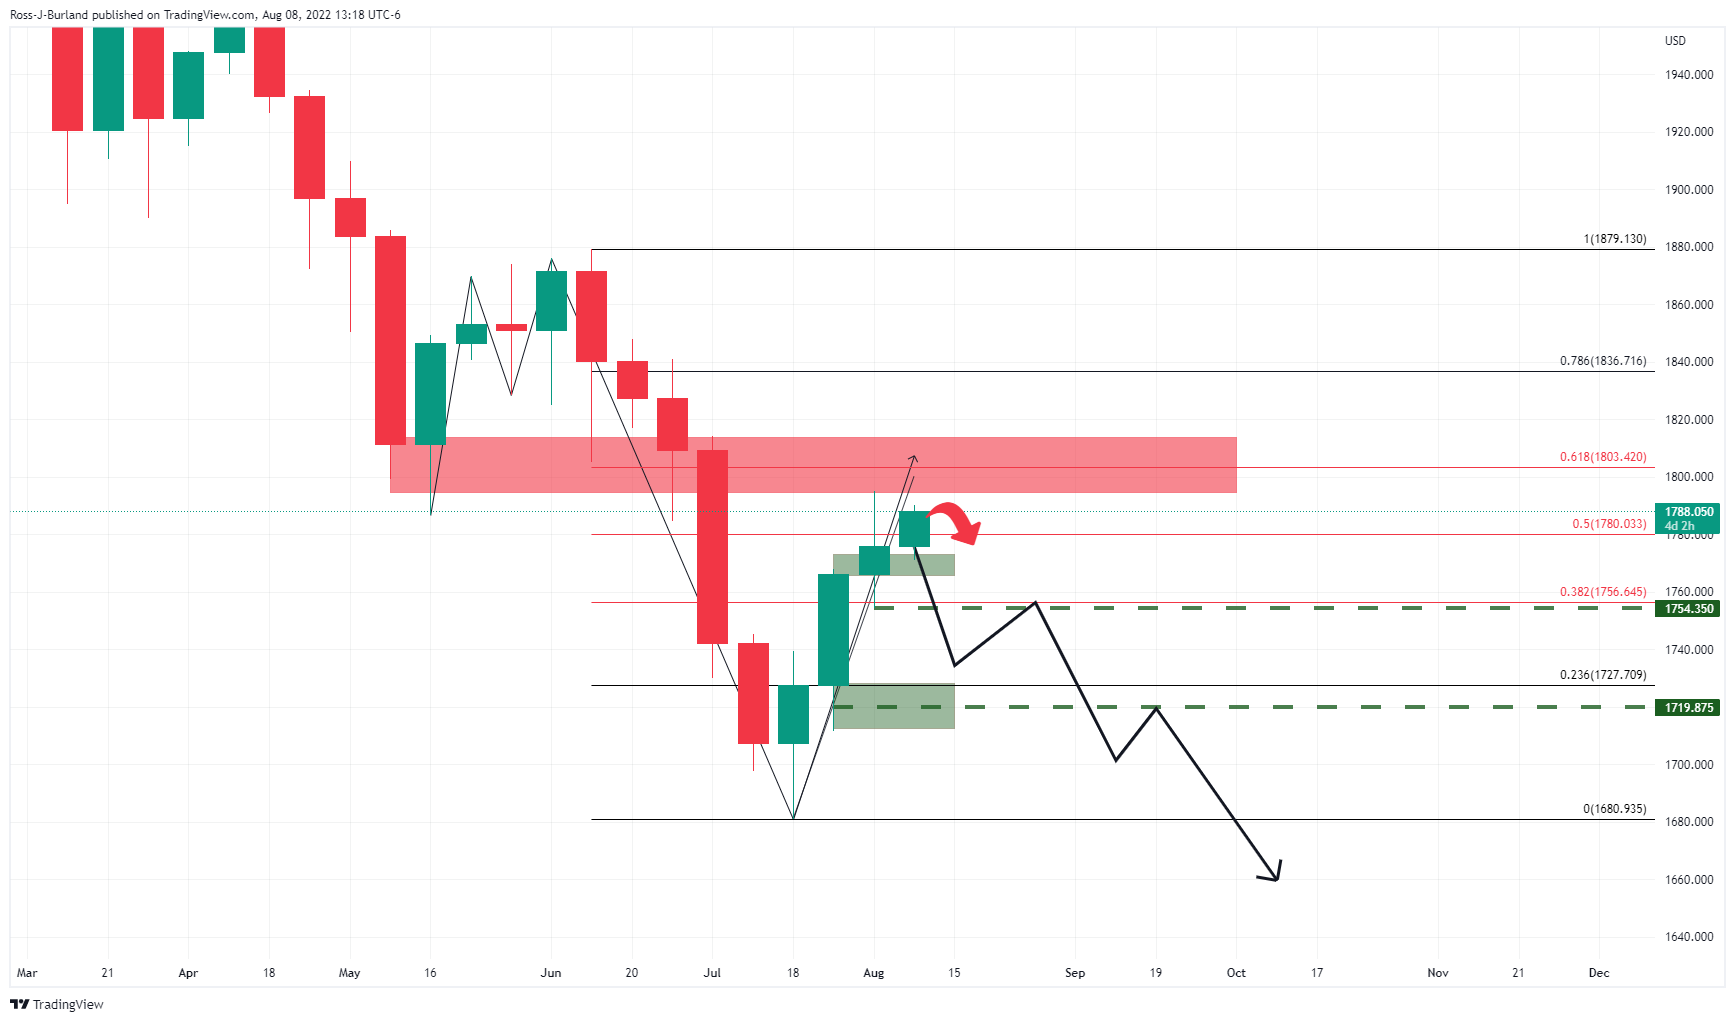
- Gold price is attempting a move higher but faces headwinds, both technically and fundamentally.
- The US CPI data on Wednesday could be pivotal for the gold price.
At $1,787.86, the gold price is firm at the start of the week, trading 0.7% higher having climbed from a low of $1,771.22 to a high of $1,790.04. However, the $1,800 psychological level remains elusive ahead of a critical inflation report due on Wednesday from the US calendar which could be pivotal for the yellow metal, US dollar and US yields.
Meanwhile, the US dollar has given back some of the gains made after last week's blockbuster Nonfarm Payrolls data that has soothed some of the fears about an economic slowdown.
Nevertheless, investors remained cautious as the payrolls data added to expectations of a hawkish US Federal Reserve. US rate futures have priced in a 67.5% chance of a 75-basis-point hike at the Fed's September meeting, up from about 41% before payrolls data on Friday beat market expectations.
However, US 10-year yields remain below the recent highs of 2.869% so far. There is daily support in Monday's lows near 2.7610% at this juncture which could mean the relief is temporary with the focus now on consumer prices data on Wednesday. The inflation data will help to confirm if the Fed's tightening efforts have been successful in starting to tame inflation or if continued Fed tightening is needed and could be a critical milestone for forex markets and indeed the euro.
-
US CPI Preview: It is the hard core that counts, five scenarios for critical inflation data
''While market pricing has shifted more toward another 75bp hike in September, it is far from locked in and with CPI data set for release midweek, the yellow metal has been able to hold firm,'' analysts at TD Securities noted.
However, ''alternatively,'' the analysts warned, ''prop traders in particular still hold a significant amount of long positions, and a continuation of strong economic data could be the catalyst needed to see an unwind. In this sense, we have yet to see capitulation in gold, suggesting the pain trade is still to the downside, and we expect the recent rally will ultimately fade.''
Gold technical analysis
It is worth noting the broadening formation in the US 10-year yield as follows:
The yield has corrected towards the neckline of the W-formation on the daily chart within the lower boundary of the broadening formation.
In turn, should the price hold above the flagged levels on the chart above, then a break of the trendline resistance could result in a rally in yields, a weight for gold prices.
On the other hand, the weekly chart's correction is yet to reach a 61.8% golden ratio as follows:
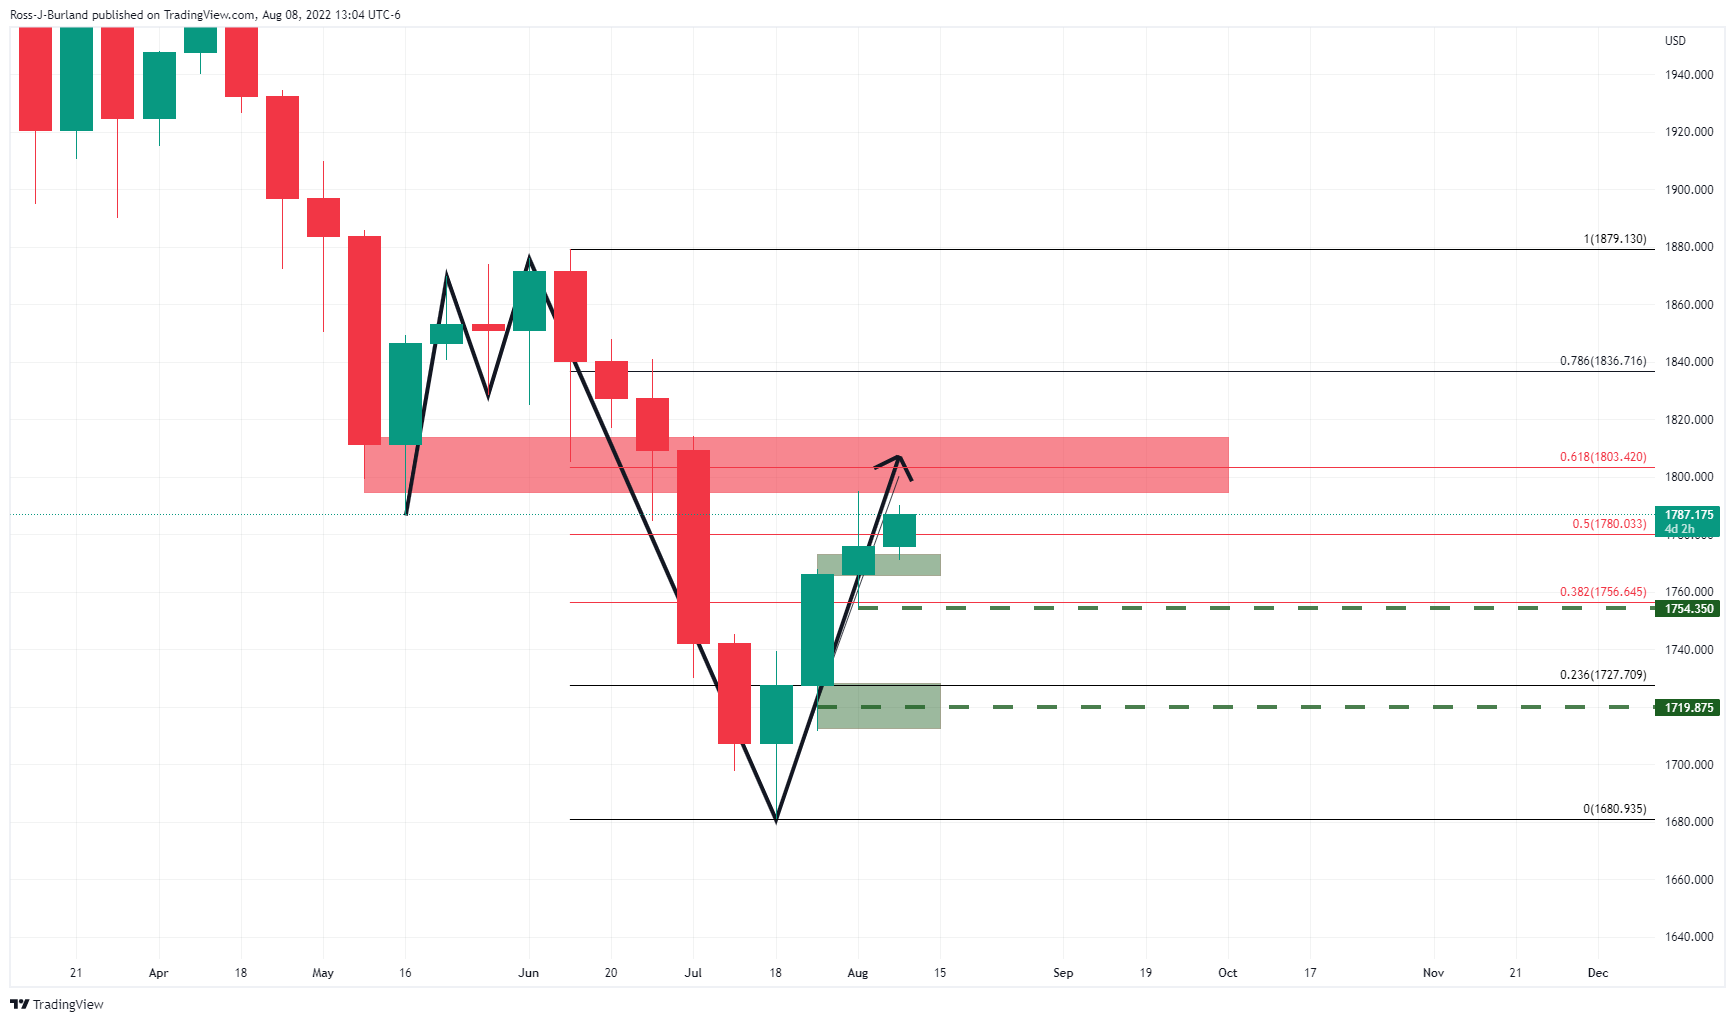
With that being said, should the bears move in this week, a close below $1,754.35 could be pivotal in opening the prospects of a significant downside continuation beyond $1,720.
- AUD/USD edges up by 1%, boosted by a soft greenback.
- China’s Trade Balance surplus increased the appetite for the risk-sensitive AUD.
- The AUD/USD got bolstered by last week’s RBA’s tightening expectations.
The AUD/USD rallied during the North American session as the market mood turned mixed, with US equities fluctuating, while the greenback tumbles on the back of falling US Treasury bond yields after a strong US jobs report.
The AUD/USD is trading at 0.6980, shy of the day’s highs, reached late in the New York session. During the Asian session, the major gapped down and printed the daily low at 0.6897, but since never looked back, advancing sharply, towards 0.7009, before retracing to current price levels.
AUD/USD bolstered by China’s Trade Balance data, as the US dollar weakened
Last Friday’s US Nonfarm Payrolls report showed that the US economy added 528K employees, further cementing the case for the US Federal Reserve to continue its “aggressive” tightening path. That spurred a jump in US bond yields. Meanwhile, money market future STIRs expectations of a 75 bps rate hike for the FOMC’s September meeting, topping 90%.
Over-the-weekend, Fed’s board member Michelle Bowman crossed newswires. She said, “I supported the FOMC’s decision last week to raise the federal funds rate another 75 basis points,” and added that “similarly-sized” hikes should be on the table until we (the Fed) see inflation declining consistently.
Even though that’s positive for the greenback, the US Dollar Index is falling 0.20% at 106.370, undermined by diving US T-bond yields. Therefore, the AUD/USD is recording its largest gain since July 19.
During the Asian session, an absent Australian economic docket left traders leaning toward China’s data. Chinese exports grew at an 18% YoY pace, vs. 14.1% YoY estimations, up from June’s figures. Imports slowed to 2.3% YoY vs. 4.0% estimated. Consequently, the Trade Balance recorded a surplus of $101 B vs. $89 B foreseen.
That said, alongside last week’s Reserve Bank of Australia (RBA) signaling more tightening in the upcoming months, it was a tailwind for the Aussie. The AUD/USD rebounded near the 20-day EMA at 0.6904 and, on its way towards the daily high, reclaimed the 50-day EMA.
What to watch
The Australian economic docket will feature July’s NAB Business Conditions and Business Confidence. On the US front, the US calendar will feature July’s CPI, and PPI data on Wednesday and Thursday, respectively. That, alongside further Fed commentary led by Charles Evans, Neil Kashkari, and Mary Daly, would shed some light regarding the posture of the central bank.
AUD/USD Key Technical Levels
- EUR/USD bulls moved in for the kill at the start of the week in a risk-on environment,
- Given the bullish environment surrounding US yield and the greenback, the floodgates could open up below 1.0150.
EUR/USD is treading water in the green at the start of the week and holding up by 0.20% in the midday New York session. The pair has ranged between a low of 1.0159 and 1.0221 so far and is currently trying to hold onto 1.0200 but is pressured. The US dollar has given back some of the gains made after last week's blockbuster Nonfarm Payrolls data that has soothed some of the fears about an economic slowdown.
Nevertheless, investors remained cautious as the payrolls data added to expectations of a hawkish US Federal Reserve. US rate futures have priced in a 67.5% chance of a 75-basis-point hike at the Fed's September meeting, up from about 41% before payrolls data on Friday beat market expectations.
However, US 10-year yields are anchored below 2.869% so far, ducking below those recently made highs. However, there is daily support in Monday's lows near 2.7610% at this juncture which could mean the relief is temporary with the focus now on consumer prices data on Wednesday. The inflation data will help to confirm if the Fed's tightening efforts have been successful in starting to tame inflation or if continued Fed tightening is needed and could be a critical milestone for forex markets and indeed the euro.
''Insofar as the strong payrolls release was unable to push EUR/USD outside of the range that has been maintained since late July, the market will now be looking for fresh direction,'' analysts at Rabobank argued. ''Although we would expect the EUR/USD 1.01 area to act as solid support going forward, we retain the view that EUR/USD is likely to drop back below parity again on a 1 to 3-month view. However, for this to happen USD strength will likely have to be complemented with another bout of fresh EUR negative news.''
Meanwhile, domestically, the analysts at Rabobank see the odds of a recession in the Eurozone as ''strong'', though also note, that recent reports have played down the prospects of energy rationing for the industry.
''While the news on gas storage has been reassuring, a cold winter and the possibility that gas through Nord Stream 1 is totally shut off are among the risks that are faced by Europe in the months ahead.''''FX positioning data suggest that the market has already built up substantial short EUR positions.
This will de-sensitise the single currency to bad news to some degree. That said, faced with uncertainties connected to energy supply, recession and Italian politics we continue to see further downside potential for the EUR on a 1 to 3-month view. Coincidentally, we expect the USD to remain well supported in this period.''
EUR/USD technical analysis
Firstly, it is worth noting that the US 10-year yield's support zone could see the price rejected higher again in the coming days:
Meanwhile, as per the EUR/USD prior analysis, the H1 M-formation pulled in the price and there was a follow-through beyond the neckline resistance which gave way to a stronger correction into the 78.6% Fibonacci retracement level as follows:
It was stated that the M-formation that was developing was a reversion pattern ''that would be expected to see the price attracted to the neckline again in due course.''
The bulls have run away with it but given the bullish environment surrounding US yield and the greenback, the floodgates could open up below 1.0150.
- GBP/USD trims some of last Friday’s losses but remains trapped between the 20 and 50-DMA.
- The daily chart depicts the pair trending between a descending channel as sellers eye the 20-day EMA.
- The GBP/USD 4-hour scale depicts the pair as neutral-downward biased and might test the 1.2000 figure, short term.
The GBP/USD records minimal gains after hitting a daily high at 1.2137, shy of the 50-day EMA at 1.2166, which has proven to be solid resistance in the last four days. However, the British pound retreated under 1.2100 but remained above the opening price, recording gains of 0.12%. At the time of writing, the GBP/USD is trading at 1.2081.
GBP/USD Price Analysis: Technical outlook
The GBP/USD daily chart illustrates the major as neutral-to-downward biased. Further confirmation of the previously mentioned is that sellers are gathering momentum, as shown by the Relative Strength Index (RSI), aiming lower, residing below the 50-midline. Also, the major trades within a descending channel and the spot price is 50 pips shy of the 20-day EMA at 1.2039. Once cleared, it would exacerbate a fall towards the bottom of the channel, near the YTD low at 1.1759.
 GBP/USD Daily chart
Meanwhile, the GBP/USD 4-hour chart shows that an ascending channel was broken to the downside last Friday, adding further selling pressure on the pair. Worth noting that GBP/USD buyers lifted the pair from the confluence of the 100 and 200-EMAs, near the 1.2040s lows of the day. However, sellers piling around the 20-EMA at 1.2113 weighed on the pair, which slid below the 1.2100 mark.
Hence, the GBP/USD 4-hour chart is still neutral-to-downward biased. Therefore, the GBP/USD first support would be the confluence of the 100 and 200-EMA around 1.2065-68. The break below will send the pair tumbling towards the S1 pivot at 1.1990, followed by the S2 at 1.1910.
 GBP/USD 4-hour chart
GBP/USD Key Technical Levels
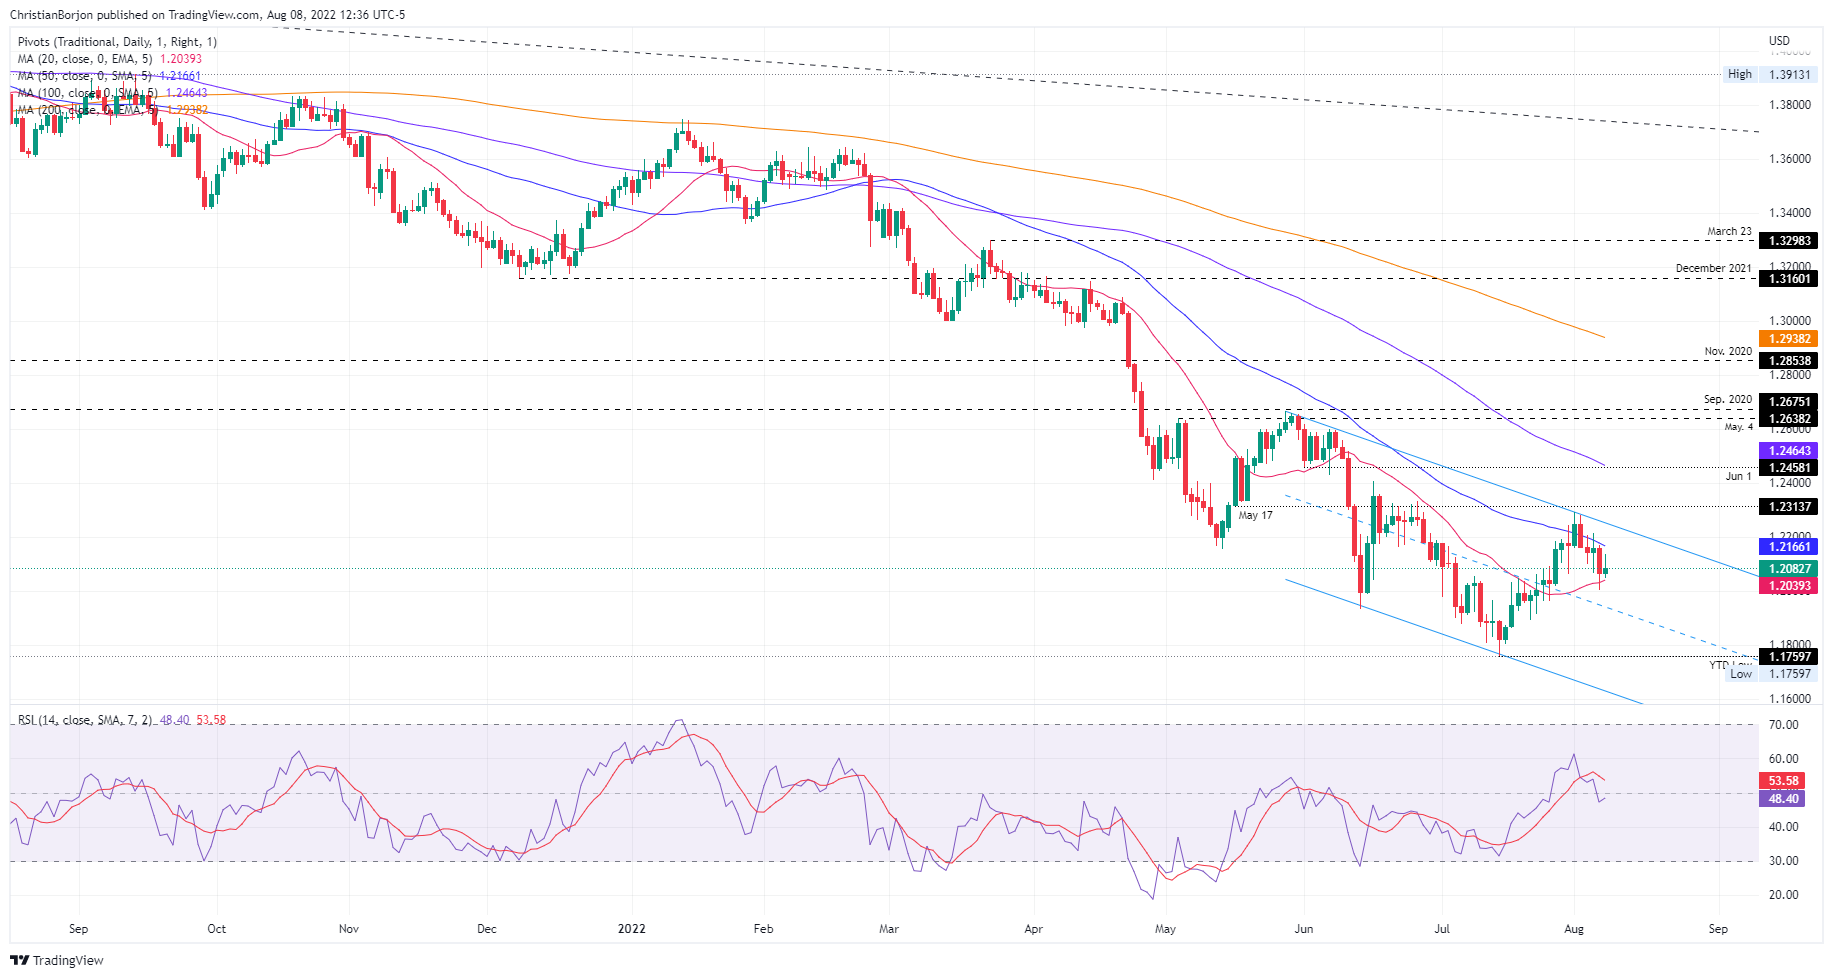
The USD/CAD pair will likely decline toward 1.22 in the coming quarters with the oil/loonie correlation turning positive again, point out analysts at National Bank of Canada. They see the WTI oil price stabilizing at 90$ per barrel.
Key Quotes:
“July was a roller coaster ride for the Canadian dollar. The loonie started the month at 1.29 before losing several feathers, with USD/CAD even reaching our Q3 target of 1.32 on July 14, faster than we had envisioned in our previous Forex piece and despite an unexpected jumbo rate hike from the Bank of Canada. After rallying 4 cents through August 1, the loonie has returned to 1.29 against the greenback on disappointing jobs data.”
“Unforced retirements, not layoffs, seem to be the main cause of recent job losses. We still see USD/CAD converging to 1.22 in the coming quarters.”
- Risk appetite on Monday favors the kiwi.
- US dollar erases NFP gains, DXY falls toward 106.00.
- NZD/USD supported by the 20-day SMA.
The NZD/USD is rising on Monday, although it trimmed gains during the last hours. The pair peaked at 0.6303 and then pulled back to 0.6280. It is positive ground for the day, supported by a weaker US dollar and risk appetite.
The greenback is falling across the board as US yields move to the downside. The US 10-year stands at 2.76%, far from Friday’s top of 2.88%. The DXY falls 0.25% and trades below 106.30.
A report from the Reserve Bank of New Zealand showed a decline in inflation expectations. “The outcome provides some relief but does little to alter the bigger picture - short-term inflation expectations (2y) remain well above the 1-3% target band, Q2 headline CPI and non-tradeable inflation handily exceeded the RBNZ's May MPS forecasts while core inflation measures are edging higher. Along with accelerating wages growth, the data suggest that the RBNZ's job is still not done and look for a 4th straight 50bps hike at the upcoming Aug meeting”, explained analysts at TD Securities.
In the US the key number of the week is the CPI on Wednesday. The NFP report opened again the doors to a more aggressive Federal Reserve. Inflation figures (also the PPI on Thursday) will likely impact on Fed rate expectations.
Technical outlook
The NZD/USD remains supported by the 0.6210/20 area and the 20-day Simple Moving Average (SMA), today at 0.6230. A consolidation below those levels should point to more losses in the short-term.
On the upside, NZD/USD is testing the 0.6300 area that contains the 55-day SMA. A break higher could lead to a test of the August high at 0.6332.
Technical levels
- Gold price edges higher on Monday, up by 0.72%, as US bond yields fall.
- Broad US dollar weakness keeps the non-yielding metal buoyant, underpinned by the US-China conflict in Taiwan.
- Fed’s Bowman: Backs a 75 bps in September and supports “similar-size” moves in subsequent meetings.
- Gold Price Forecast (XAUUSD): Neutral-to-bearish below $1800; otherwise, a correction to $1738.91.
Gold price rises to fresh week highs around $1790 in the mid-New York session, as the greenback gets battered, down by 0.34%, per the US Dollar Index at 106.217, as traders brace for July’s US Consumer Price Index, amidst a light US calendar on Monday and Tuesday. However, the NY Fed revealed consumer inflation expectations at 6.2%, from 6.8% in June. At the time of writing, XAUUSD is trading at $1787.62.
XAUUSD rises on falling US bond yields as US-China tensions elevate
The market mood is positive, as European bourses are about to close while US equities rise. US bond yields pare some of last Friday’s gains following a stellar US jobs report that added 528,000 employees to the working force, fueling expectations that the US Federal Reserve might not step out of the pedal. It should be noted that the Unemployment Rate fell to 3.5%, so expectations of a dovish tilt by the US central bank faded.
Therefore, XAUUSD traders scaled back their gold longs as US bond yields jumped, while the US 10-year TIPS, a proxy for real yields, edged higher towards 0.370%.
Amidst those plays, geopolitical concerns around Taiwan, and US-China tussles, are also adding uncertainty to the global economic outlook. That said, precious metals witnessed augmented demand, with investors seeking safety in the yellow metal.
Elsewhere, Fed speaking continued during the weekend, with Michell Bowman crossing newswires. She said, “I supported the FOMC’s decision last week to raise the federal funds rate another 75 basis points,” and added that “similarly-sized” hikes should be on the table until we (the Fed) see inflation declining consistently.
In the meantime, the US 10-year bond yield is falling almost six bps, sitting at 2.775%, while US 10-year TIPS is yielding 0.306%, seven bps less than last Friday’s peak. All that said, a tailwind for XAUUSD,
What to watch
The US economic docket will feature July’s CPI, and PPI data on Wednesday and Thursday, respectively. That, alongside further Fed commentary led by Charles Evans, Neil Kashkari, and Mary Daly, would shed some light regarding the posture of the central bank.
Gold Price Forecast (XAUUSD): Technical outlook
XAUUSD is neutral-to-upward biased, though facing solid resistance at the 50-day EMA at $1787.19. Gold traders should be attentive that unless buyers reclaim the $1800 figure, a correction towards the 20-day EMA at $1738.91 is on the cards. However, in the near term, the gold price could test higher prices, supported by the Relative Strength Index (RSI) at 58, gathering upside momentum.
- USD/JPY tumbles, due to its high correlation with the US 10-year bond yield, dropping below 2.80%.
- Fed’s Bowman: The Fed should consider 75 bps in future meetings.
- US CPI and PPI for July, both inflations readings are eyed.
The USD/JPY begins the week on the wrong foot, slides below the 50-day EMA, on a soft US dollar, undermined by falling US Treasury yields, amidst an upbeat sentiment, despite worries of an aggressive Fed and China-US jittery on Taiwan.
At the time of writing, the USD/JPY is trading at 134.63 after hitting a daily high at 135.58. Nevertheless, the appetite for US Treasuries keeps the US 10-year bond yield down five bps at 2.778%, so the USD/JPY pierced below the 50-day EMA at 134.98.
USD/JPY drops on lower US bond yields, even though the narrative supports the US dollar
A light US calendar keeps investors reassessing last week’s employment report, pouring cold water on recession fears while fueling expectations of a Federal Reserve 75 bps rate hike. Nevertheless, with the US Consumer Price Index (CPI) for July looming, focus shifted to expectations that a lower reading might deter the US central bank from tightening aggressively. In the meantime, Fed’s money market futures STIRs odds of a 75 bps hike are at 90%, up from last week’s 76.5%.
That said, Federal Reserve speakers in the last week had been hawkish since the dovish reaction after the FOMC’s meeting. Also, policymakers reiterated the Fed’s commitment to bringing inflation down. Over the weekend, Fed’s board member Michell Bowman reiterated that the Fed should consider 75 bps rate hikes at future meetings to get inflation back down to the central bank target. She added that she would be data-dependent for the following meetings.
Elsewhere, the Japanese calendar featured Bank Lending for July, which increased 1.8% YoY, doubling estimations. At the same time, the current account shrank the deficit from ¥-703 billion to ¥-132.4 billion.
However, the USD/JPY remains irrespective of the current economic environment during the day. Even though the pair pushed below the 50-day EMA unless sellers achieve a daily close below the August 4 daily high at 134.42, buyers remain in charge.
What to watch
The Japanese economic docket will feature Preelimnary Machine Tool Orders. On the US front, the calendar will reveal the NFIB Small Business Optimism Index, Consumer Inflation Expectations, and the US IBD/TIPP Economic Optimism for July, estimated at 38.6.
USD/JPY Key Technical Levels
- Swiss franc among top performers on Monday, despite risk appetite.
- US Dollar weakens amid lower US yields.
- USD/CHF suffers the worst decline in weeks, down almost a hundred pips.
The USD/CHF dropped further after the beginning of the American session and bottomed at 0.9521, reaching the lowest level since Tuesday. It is hovering around 0.9530, with a negative tone, down a hundred pips for the day.
The Swiss franc is among the strongest currencies of the day. EUR/CHF fell from near 0.9800 to 0.9717 (1-week low) and GBP/CHF tumbled to 1.1543 (lowest since July 26). CHF/JPY rose back above the 20-day Simple Moving Average and the 141.00 area.
The US dollar is falling across the board. The DXY is down 0.37%, approaching 106.00. The US 10-year yield stands at 2.78% and the 30-year at 3.00%, both far from Friday’s top.
On Friday, the US dollar rallied following the release of the US employment report that came in above expectations. On Monday it lost most of those gains. Regarding data, attention now turns to the July CPI due on Wednesday.
The bias in USD/CHF is tilted to the downside. A consolidation below 0.9540 would keep the door open for a test of 0.9500. Below the next support is the August low at 0.9469. If the USD dollar break above 0.9660 it would negate the bearish bias: it would be back above critical supports and surpass the 20, 55 and 100-day Simple Moving Averages.
Technical levels
The Federal Reserve Bank of New York's monthly Survey of Consumer Expectations showed on Monday that the US Consumers' one-year inflation expectations declined to 6.2% in July from 6.2% in June. The three-year inflation expectations edged lower to 3.2% from 3.6%.
Key takeaways as summarized by Reuters
"Consumers' median 5-year inflation outlook declined to 2.3% from 2.8% in June."
"Consumers see home prices up 3.5% in the next year, down from 4.4% in June."
"Consumers' year-ahead earnings growth expectation was unchanged in July at 3%."
"Consumers' median 1-year household income growth expectation rises to 3.4% in July, a new series high, from 3.2% in June."
"Consumers in July on average see 40.2% probability of higher unemployment rate in a year, down from 40.4% in June."
"Consumers' median 1-year household spending growth expectation fell 1.5 percentage point to 6.9%."
"Rising share of consumers say credit has been harder to get in the last year and will be in the year ahead."
"Fewer consumers surveyed in July said their household financial situation had deteriorated from a year ago and fewer expect it to deteriorate in the year ahead compared to June."
Market reaction
The greenback stays on the backfoot following this report and the US Dollar Index was last seen losing 0.45% on the day at 106.12.
- Gold regains positive traction on Monday amid retreating US bond yields, a weaker USD.
- The risk-on impulse, along with hawkish Fed expectations, should cap any further gains.
- The market focus would remain glued to the US consumer inflation data on Wednesday.
Gold manages to attract fresh buying on Monday and builds on its steady intraday ascent through the early North American session. The XAU/USD climbs to a fresh daily high, around the $1,786-$1,787 region in the last hour and has now reversed a major part of Friday's post-NFP losses.
The US dollar comes under some renewed selling pressure on the first day of a new week and turns out to be a key factor lending support to the dollar-denominated gold. The market reaction to the upbeat US monthly jobs data released on Friday fades rather quickly amid a fresh leg down in the US Treasury bond yields. In fact, the yield on the benchmark 10-year US government bond slips back below the 2.80% mark, which keeps the USD bulls on the defensive and further seems to benefit the non-yielding yellow metal.
That said, a combination of factors might hold back bulls from placing fresh bets around gold and cap any further gains. The risk-on impulse could act as a headwind for the safe-haven XAU/USD amid speculations that the Fed would stick to its aggressive policy tightening path. The bets were lifted by the blockbuster headline US NFP print, showing that the economy added 528K jobs in July. Adding to this, higher-than-expected wage growth data suggested a further rise in inflationary pressures.
Hence, the market focus now shifts to the latest US consumer inflation figures, scheduled for release on Wednesday. The data would influence Fed rate hike expectations and play a key role in driving the near-term USD demand, which, in turn, should help determine the next leg of a directional move for gold. In the meantime, the US bond yields, the USD price dynamics and the broader risk sentiment would be looked upon for some impetus amid absent relevant market-moving economic releases from the US.
Technical levels to watch
Head of Research at UOB Group Suan Teck Kin, CFA, assesses the latest RBI monetary policy decision.
Key Takeaways
“The Reserve Bank of India (RBI) lifted its benchmark repo rate by 50 bps to 5.40% from 4.90% in its Aug monetary policy meeting in a unanimous decision. The move was more aggressive than Bloomberg survey of a 25bps hike but matched our expectation. The Monetary Policy Committee (MPC) will remain focused on the withdrawal of accommodation to ensure that inflation stays within the target going forward, while supporting growth.”
“The MPC noted that despite a challenging global environment, domestic economic activity is showing signs of broader recovery, while inflationary pressures appear to be in an inflection point with ‘incipient signs of a confluence of factors’ that could lead to further softening of domestic inflationary pressures. Inflation is expected to remain above the upper tolerance band of 6% in 2Q and 3Q. With the crude oil price assumed at an average of US$105/bbl and a normal monsoon, RBI kept its inflation rate projection at 6.7% in 2022-23 (which was last raised from previous forecast of 5.7% at the Jun MPC).”
“RBI remains sanguine on its growth outlook, with both consumer and business sentiment improving and the rebound in contact-intensive services is expected to sustain urban consumption. GDP growth forecast for 2022-23 is kept at 7.2% (after having downgraded it from 7.8% in Apr), with ‘risks broadly balanced’. RBI noted headwinds from global forces - protracted geopolitical tensions, rising global financial market volatility, tightening global financial conditions; and global recession risks.”
“With the policy priority on containing inflationary pressures from second-round effects of supply side shocks and anchoring long term inflation expectations, there is still room for the RBI in its rate hike trajectory. After kicking off with the surprise unscheduled 40bps move on 4 May and the 50bps hikes in Jun and Aug, we think that the RBI will add on another 50bps rate increases in the two remaining MPCs in 2022 to bring the repo rate to 5.90% by the end of the year.”
- EUR/USD looks to advance further north of the 1.0200 mark.
- Extra gains are in store once 1.0300 is cleared.
EUR/USD embarks on a decent recovery following Friday’s marked retracement at the beginning of the week.
The so far August high at 1.0293 (August 2) emerges as the magnet for bulls for the time being. Above this level, spot is expected to see its uptrend reinvigorated and could challenge the temporary 55-day SMA in the near term, today at 1.0394.
In the longer run, the pair’s bearish view is expected to prevail as long as it trades below the 200-day SMA at 1.0920.
EUR/USD daily chart
Alvin Liew, Senior Economist at UOB Group, comments on the release of Retail Sales figures in Singapore.
Key Takeaways
“Singapore’s retail sales declined by -1.4% m/m, following 1.8% increase in May, breaking the streak of 3 consecutive months of m/m increase. That translated to a weaker-than-expected 14.8% y/y expansion in Jun (from 17.8% in May), against Bloomberg median forecast of a 18.3% y/y growth. That said, this was still the third consecutive month of double-digit growth. Excluding motor vehicle sales, the m/m decrease was more pronounced at -1.9%, (from 2.7% in May), translating to a +19.8% y/y increase (from 22.6% y/y in May).”
“While the growth fell short of forecast, Jun retail sales growth still added to a solid foundation for domestic demand in the 2Q22, it should be noted that according to the Department of Statistics Singapore, the y/y increase was again distorted by the low base effect of the prior year (Jun 2021) when COVID-19 restriction measures were in place, such as international travel restrictions. The weaker m/m print could also be due to more households on overseas holidays during the school break, leading to lower on-shore expenditure during Jun.”
“Year-to-date, retail sales grew by 10.4% y/y. We believe domestic retailers will likely see domestic and external support, complemented by the return of major events such as the F1 formula night race in Sep. On the flipside, we believe that the elevated commodity price pressures, especially on energy and food prices, will feed into higher retail prices in the next few months and eat into the average household’s disposable income, thereby reducing their spending on discretionary items. Barring the re-emergence of fresh COVID-19 or other health-related risks in Singapore and around the region (leading to re-imposition of social and travel restrictions, which is not our base case), we still project retail sales to expand by 9.0% in 2022 (implying a more conservative forecast of 7.6% growth in 2H 2022). The primary driver is still low base effect which is likely to continue to uplift retail sales growth prints in the coming months.”
- DXY fades part of the Friday’s strong advance and returns to 106.30.
- Further weakness could see recent lows near 105.00 revisited.
DXY comes under pressure on Monday and partially reverses Friday’s gains to the proximity of 107.00.
The continuation of the selling pressure could facilitate a deeper pullback to, initially, the August low near 105.00 (August 2). This area of initial contention appears reinforced by the 55-day SMA.
The short-term constructive stance is expected to remain supported by the 6-month support line, today near 104.30.
Furthermore, the broader bullish view in the dollar remains in place while above the 200-day SMA at 99.81.
Economist at UOB Group Enrico Tanuwidjaja reviews the latest FX reserves figures in Indonesia.
Key Takeaways
“Indonesia’s foreign exchange reserves fell to USD132.2bn in July 2022, the lowest since June 2020 and a decrease of USD4.2bn from a 3-month high of USD136.4bn the previous month.”
“The latest reserve level was equivalent to finance 6.2 months of import or 6.1 months of imports and servicing the government’s external debt, well above the international adequacy standard of 3 months of imports.”
“Bank Indonesia (BI) maintains their view that the official reserve assets will remain adequate, supported by the stability and solid domestic economic outlook in line with several responsive policies to support long-term economic recovery.”
- AUD/USD gains strong positive traction on Monday and is supported by a combination of factors.
- Sliding US bond yields undermine the USD and offer support to the aussie amid the risk-on impulse.
- Hawkish Fed expectations could limit losses for the USD ahead of the US CPI report on Wednesday.
The AUD/USD pair climbs to a four-day high during the early North American session, with bulls now eyeing a move towards reclaiming the 0.7000 psychological mark.
The US dollar meets with a fresh supply on the first day of a new week and erodes a part of Friday's post-NFP strong gains, which, in turn, acts as a tailwind for the AUD/USD pair. The USD weakness could be attributed to a fresh leg down in the US Treasury bond yields. Apart from this, the risk-on impulse further seems to undermine the safe-haven greenback and benefit the risk-sensitive aussie.
That said, growing worries about a global economic downturn, along with the US-China tensions over Taiwan, could keep a lid on any optimistic move in the markets. Furthermore, speculations for a larger Fed rate hike move in September should act as a tailwind for the US bond yields and lend support to the USD. This, in turn, could cap any meaningful upside for the AUD/USD pair, at least for now.
Investors might also prefer to move on the sidelines ahead of the latest US consumer inflation figures, scheduled for release on Wednesday. Against the backdrop of the upbeat US monthly jobs report, a stronger CPI print would reaffirm hawkish Fed expectations and provide a fresh lift to the USD. The fundamental backdrop warrants caution before placing aggressive bullish bets around the AUD/USD pair.
In the meantime, the US bond yields would play a key role in influencing the USD price dynamics amid absent relevant market-moving economic releases on Monday. Apart from this, traders would take cues from the broader market risk sentiment to grab short-term opportunities around the AUD/USD pair.
Technical levels to watch
Sterling has been one of the weakest currencies among the majors over the past week. Economists at Scotiabank expect the GBP/USD to drop back under the 1.20 level.
GBP prone to a bit more softness
“GBP price action last week overall pushed cable below the rising trend in place since mid-Jul and leaves spot at clear risk of a return to sub-1.20 levels.”
“Support is 1.2040 and 1.2000/05.”
“Resistance is 1.2125.”
A blockbuster jobs report sparked a brief repricing in gold, but prices have bounced back firmly. Nevertheless, strategists at TD Securities expect the yellow metal's rally to be largely reversed.
Market continues to grapple with expectations for the Fed's next move
“While market pricing has shifted more toward another 75 bps hike in September, it is far from locked in and with CPI data set for release midweek, the yellow metal has been able to hold firm. Nonetheless, the post-FOMC short covering has likely run out of steam, particularly amid the stronger data and continued pushback against a pivot in Fedspeak.”
“After briefly hitting CTA triggers to spark another round of short covering, the jobs report has quickly put a cap on the move and the buying flow has turned to modest selling.”
“Prop traders still hold a significant amount of long positions, and a continuation of strong economic data could be the catalyst needed to see an unwind. In this sense, we have yet to see capitulation in gold, suggesting the pain trade is still to the downside, and we expect the recent rally will ultimately fade.”
EUR/USD is little changed from Friday’s close as early spot gains above 1.02 in European trade were quickly erased. Economists at Scotiabank look for more range trading in the short run, with the EUR retaining a soft undertone.
EUR/USD needs to erode 1.2035/45 to enjoy further gains
“A look at the short-term EUR chart shows spot moving sideways in a broad 1.0125/1.0275 range over the past three weeks, leaving spot at levels which are enticing neither for buyers nor sellers in the short run.”
“Short-term gains will need to push through and hold above 1.0235/45 to have any chance of extending.”
“Support is 1.0155/65 intraday.”
- EUR/JPY extends the recovery to the vicinity of 138.00 on Monday.
- Further up now emerges the interim 55-day SMA around 139.50.
EUR/JPY remains on recovery-mode and already flirts with the 138.00 area at the beginning of the week.
Considering the ongoing price action, further upside in the cross appears likely for the time being. That said, the next temporary target aligns at the 55-day SMAs, today at 139.54.
While above the 200-day SMA at 133.79, the outlook for the cross is expected to remain constructive.
EUR/JPY daily chart
- USD/CAD witnesses fresh selling on Monday amid modest USD weakness.
- Retreating US bond yields, the risk-on impulse weighs on the safe-haven USD.
- Bearish oil prices could undermine the loonie and help limit any further losses.
The USD/CAD pair attracts fresh selling on the first day of a new week and retreats further from a nearly three-week high, around the 1.2985 area touched on Friday. The intraday downtick extends through the mid-European session and drags spot prices to a fresh daily low, around the 1.2870 region in the last hour.
The US dollar struggles to capitalize on the post-NFP strong move up and edges lower on Monday, which turns out to be a key factor exerting downward pressure on the USD/CAD pair. Retreating US Treasury bond yields, along with a generally positive tone around the equity markets, temper the greenback's relative safe-haven status. The downside, however, seems cushioned, warranting some caution before placing aggressive bearish bets.
The upbeat US monthly jobs report released on Friday lifted bets for a larger, 75 Fed rate hike move at the September policy meeting. This should act as a tailwind for the US bond yields and help revive the USD demand. Crude oil prices, meanwhile, languished near a multi-month low, which should undermine the commodity-linked loonie and further contribute to limiting any meaningful downside for the USD/CAD pair, at least for the time being.
In the absence of any major market-moving economic releases, the US bond yields and the broader market risk sentiment would play a key role in driving the USD demand. Apart from this, traders will take cues from oil price dynamics to grab short-term opportunities around the USD/CAD pair. The focus, however, would remain on the release of the US consumer inflation figures on Wednesday, which might provide a fresh directional impetus to spot prices.
Technical levels to watch
EUR/USD has traded fairly choppily this morning around the 1.02 level. Looking ahead, economists at Rabobank continue to see further downside potential for the EUR on a one to three-month view.
USD to remain well supported
“Although we would expect the EUR/USD 1.01 area to act as solid support going forward, we retain the view that EUR/USD is likely to drop back below parity again on a one to three-month view. However, for this to happen USD strength will likely have to be complemented with another bout of fresh EUR negative news.”
“In our view the value of the USD is likely to remain firm until the environment for risky currencies improves. This suggests scope for a firm USD well into 2023.”
In the view of FX Strategist Quek Ser Leang at UOB Group’s Global Economics & Markets Research, USD/IDR is likely to trade within the 14,825-14,900 range for the time being.
Key Quotes
“Our expectation for USD/IDR to dip below 55-day exponential moving average support last week was incorrect as it popped briefly to 14,900 before pulling back.”
“The outlook for this week is mixed and USD/IDR is likely to trade sideways, expected to be within a range of 14,825/14,990.”
Oscar Munoz, Macro Strategist at TD Securities, notes that the July Consumer Price Index (CPI) report will be the key highlight of the US data calendar this week.
Fed officials to double down on inflation concerns
"We are looking for core prices to have stayed strong on a m/m basis despite our expectation of slowing vs June."
"Apart from the inflation data, market participants are likely to focus on the preliminary release of the University of Michigan survey for August. We expect the recent improvement in gasoline and equity prices to lead to a new gain in sentiment."
"Separately, turning to Fedspeak, we look for Fed officials this week to double down on concerns about inflation and a tight labor market, and that they remain top of mind over those for growth."
GBP/USD has stabilized after its post-BoE sell-off but remains heavy. Economists at BBH expect the pair to drop under July 29 low around 1.2065.
BoE is set to continue tightening
“A move above 1.21 earlier today failed to trigger any follow-through buying. We believe GBP/USD is still on track to break below the July 29 low near 1.2065.”
“Despite the gloomy outlook, the Bank of England is set to continue tightening as inflation spirals ever higher.”
Economists at BBH note that they maintain their strong dollar call as Fed officials are making it clear that markets misread the Fed’s commitment to lowering inflation.
Fed tightening expectations continue to adjust
"Markets are still digesting last week’s blockbuster jobs report. Nearly a million jobs were added in the past two months, driving the unemployment down to a new cycle low of 3.5%. More importantly, wages continue to grow nicely and should help support consumption. While a strong labor market does not preclude a recession, it does drive home the point that the Fed will have more confidence to continue tightening policy in order to bring inflation down. "
Fed tightening expectations continue to adjust. WIRP is now showing over 75% odds of a 75 bp hike at the September 20-21 FOMC meeting. Looking ahead, the swaps market is now pricing in a 3.75% terminal rate vs. 3.5% at the start of last week."
" We think this is the correct read and if the market gives the Fed 75 bp next month, the Fed will take it. However, the market is still pricing in a quick turnaround by the Fed to move into an easing cycle in H1 2023. It's pretty clear that the Fed doesn't see it that way and the data bear that out, at least for now. Markets should also reprice these easing expectations in the coming days and weeks."
A spokesperson for the German government told reports on Monday that they have ruled out the approval of the shelved Nord Stream 2 gas pipeline, as reported by Reuters.
"We face difficult months ahead," the spokesperson added. "But it is clear that we stand firmly on the side of Ukraine and we stand behind the sanctions that we agreed together with the European Union and the international community."
Market reaction
These comments don't seem to be having a noticeable impact on risk perception. As of writing, Germany's DAX 30 Index was up 0.6% on a daily basis at 13,654.
USD/MYR faces prospects for extra upside in the near term. according to FX Strategist Quek Ser Leang at UOB Group’s Global Economics & Markets Research.
Key Quotes
“We highlighted last Monday (01 Aug, spot at 4.4480) that USD/MYR ‘could drift lower but is unlikely to threaten the rising trend-line support at 4.4300’. USD/MYR dropped briefly to 4.4450 on Friday before rebounding. While USD/MYR extended its advance during Asian hours today, upward momentum is not strong.”
“That said, there is scope for USD/MYR to edge higher but for this week, a break of 4.4700 is unlikely (there is another resistance at 4.4650). Support is at 4.4450 followed by the rising trend-line support at 4.4350. The rising trendline support is unlikely to come under threat this week.”
- EUR/USD regains marginal upside traction around 1.0200.
- EMU Sentix index improves a tad for the current month.
- Next risk event in the pair will be the release of the US CPI.
The single currency manages to regain some traction in an uneventful start of the week, lifting EUR/USD briefly above the 1.0200 mark although losing momentum afterwards.
EUR/USD remains stuck within the 1.0100-1.0300 range
EUR/USD advances tepidly on Monday and stays close to the 1.0200 neighbourhood, as investors appear prudent ahead of the publication of key US inflation figures later in the week.
In addition, the upside bias in the dollar seems to have fizzled out following Friday’s strong advance after the stellar results from the US jobs report. It is worth recalling that Friday’s sharp climb in the buck came in response to further pricing in by market participants of a large rate hike at the FOMC event in September.
According to CME Group’s FedWatch Tool, the probability of a 75 bps rate hike next month is now at nearly 68%.
On the latter, Fed’s M.Bowman (permanent voter, hawk) suggested over the weekend that 75 bps rate hikes are possible until inflation runs out of steam. She said she finds few, if any, signs that the move higher in consumer prices has reached a top, while she also sees the possibility that the Fed’s hiking cycle could slow or halt the job growth.
In the domestic calendar, EMU’s Investor Confidence tracked by the Sentix Index “improved” a little to -25.2 in August.
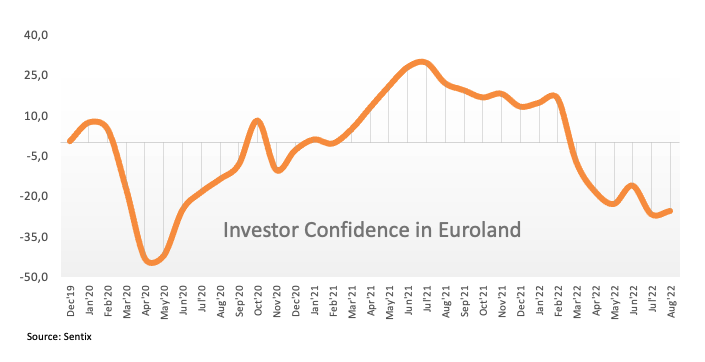
What to look for around EUR
EUR/USD so far keeps the 1.0100-1.0300 range unchanged against the backdrop alternating risk appetite trends.
Price action around the European currency, in the meantime, is expected to closely follow dollar dynamics, geopolitical concerns, fragmentation worries and the Fed-ECB divergence.
On the negatives for the single currency emerges the so far increasing speculation of a potential recession in the region, which looks propped up by dwindling sentiment gauges and the incipient slowdown in some fundamentals.
Key events in the euro area this week: EMU Sentix Index (Monday) – Germany Final Inflation Rate (Wednesday) – EMU Industrial Production (Friday).
Eminent issues on the back boiler: Continuation of the ECB hiking cycle. Italian elections in late September. Fragmentation risks amidst the ECB’s normalization of monetary conditions. Impact of the war in Ukraine on the region’s growth prospects and inflation.
EUR/USD levels to watch
So far, spot is gaining 0.02% at 1.0182 and faces the next up barrier at 1.0293 (monthly high August 2) seconded by 1.0394 (55-day SMA) and finally 1.0615 (weekly high June 27). On the flip side, a break below 1.0096 (weekly low July 26) would target 1.0000 (psychological level) en route to 0.9952 (2022 low July 14).
- USD/JPY witnesses a modest pullback from over a one-week high touched earlier this Monday.
- Retreating US bond yields keep the USD bulls on the defensive and act as a headwind for the pair.
- The Fed-BoJ policy divergence should help limit the downside amid a bullish technical setup.
The USD/JPY pair surrenders its modest intraday gains to over a one-week high set earlier this Monday and slips below the 135.00 mark during the early part of the European session.
Retreating US Treasury bond yields keep the US dollar bulls on the defensive, which, in turn, acts as a headwind for spot prices. That said, a big divergence in the monetary policy stance adopted by the Bank of Japan and the Federal Reserve should help limit deeper losses for the USD/JPY pair.
From a technical perspective, Friday's strong move up beyond the 50% Fibonacci Retracement level of the recent pullback from the 24-year high favours bullish traders. Hence, any meaningful pullback could be seen as a buying opportunity near the mid-134.00s and remain limited near the 134.00-133.90 area.
The latter coincides with the 38.2% Fibo. level, which if broken decisively would negate the near-term positive bias and make the USD/JPY pair vulnerable. Spot prices would then accelerate the fall towards the 133.00 mark before eventually dropping to the 132.50 area, or the 23.6% Fibo. level.
On the flip side, the 135.50-135.60 area now seems to have emerged as immediate resistance. Some follow-through buying has the potential to lift the USD/JPY pair towards the 61.8% Fibo. level, around the 136.00 marks. A sustained strength beyond would be seen as a fresh trigger for bulls and pave the way for a more toward the 136.65 intermediate hurdle en-route the 137.00 and the 137.45 region.
USD/JPY 4-hour chart
-637955507426599934.png)
Key levels to watch
- GBP/USD surrenders a major part of its intraday gains and turns neutral below the 1.2100 mark.
- The BoE’s bleak economic outlook continues to weigh on the GBP and act as a headwind for the pair.
- Investors now look forward to the US CPI and the UK GDP this week for a fresh directional impetus.
The GBP/USD pair struggles to preserve its modest intraday gains and retreats nearly 50 pips from the intraday peak touched during the early European session. The pair is currently trading just a few pips above the daily low, around the 1.2075-1.2070 region.
The Bank of England offered a bleak outlook last week, which continues to act as a headwind for the British pound and turns out to be a key factor that capped the GBP/USD pair. In fact, the UK central bank warned that a prolonged UK recession would start in the fourth quarter and indicated that the monetary policy is not on a pre-set path. This, in turn, suggests that the BoE is more likely to slow down the pace of its tightening cycle.
The US dollar, on the other hand, struggles to capitalize on Friday's post-NFP strong move up amid a fresh leg down in the US Treasury bond yields. Apart from this, a generally positive tone around the equity markets further undermines the safe-haven buck and offers some support to the GBP/USD pair. That said, the prospects for a more aggressive policy tightening by the Fed should act as a tailwind for the US bond yields and favours the USD bulls.
The upbeat US monthly jobs report released on Friday showed that the economy added 528K jobs in July, smashing consensus estimates by a big margin. Additional details revealed that Average Hourly Earnings rose 0.5% MoM in July and suggested a further rise in inflationary pressures, lifting bets for a 75 bps Fed rate hike move at the next policy meeting in September.
Hence, the market focus now shifts to the release of the latest US consumer inflation figures, due on Wednesday. The data would influence Fed rate hike expectations and play a key role in driving the near-term USD demand. Apart from this, investors will take cues from the prelim UK Q2 GDP report on Friday to determine the next leg of a directional move for the GBP/USD pair.
In the meantime, USD price dynamics would play a key role in influencing spot prices on Monday amid absent relevant market moving data, either from the UK or the US. This, in turn, suggests that any meaningful downfall might continue to find decent support near the 1.2000 psychological mark, which should now act as a key pivotal point for short-term traders.
Technical levels to watch
In July, the Thai baht weakened against the US dollar in terms of London closing rates from 35.341 to 36.364. Despite potential positives in domestic fundamentals, the THB looks to be adversely affected by global risks, in the view of economists at MUFG Bank.
Domestic growth may face downside risks
“We revise our USD/THB higher, to 37.50 in Q3 and 38.00 in Q4. This is on the back of market concerns about global growth weighing on the positioning of the THB. Domestic growth may face downside risks, against our forecast of 3.4% GDP growth in 2022. China’s challenging recovery and covid-zero strategy may also continue to weigh on Thailand’s tourism sector in 2022 and parts of 2023.”
“Despite our forecast of a 50 bps rate hike by the BOT this year, it may pale in comparison to other central banks’ moves.”
“We forecast some downsides in 2023 as the headwinds dissipate, down to 37.25 in Q1-2023 and 36.250 in Q2-2023.”
FX Strategist Quek Ser Leang at UOB Group’s Global Economics & Markets Research sees USD/THB weakening further in the short term.
Key Quotes
“We highlighted last Monday (01 Aug, spot at 36.27) that USD/THB ‘could dip below the rising trend-line support at 35.92’. We added, ‘the next major support at 33.58 (55-day exponential moving average) is not expected to come into the picture’.”
“The anticipated weakness exceeded our expectations as USD/THB dropped to 35.54 on Friday before rebounding quickly. While further USD/THB weakness is not ruled out this week, oversold conditions suggest a sustained decline below 35.50 is unlikely (next support is at 35.20). Resistance is at 36.05 but only a break of 36.36 would indicate that the current downward pressure has eased.”
The Indonesian rupiah weakened against the US dollar in July. Economists at MUFG Bank have updated their forecasts and now expect the USD/IDR to see more gains.
USD strength to persist in the coming months
“Owing to near-term dollar strength possibly persisting in the coming months, we move our USD/IDR forecast profile higher.”
“We forecast USD/IDR to move lower from 15,100 in Q3 and 15,200 in Q4 to 15,000 in Q1-2023 and 14,750 in Q2-2023.”
GBP continues to underperform but not as badly as EUR. Still, the British pound is set to move downward in the third quarter, economists at MUFG Bank report.
GBP downside risks in near-term
“Political uncertainty has had limited impact on GBP so far. Liz Truss's victory could trigger a more volatile GBP reaction. Looser fiscal and tighter monetary policy combination is normally supportive for a currency.”
“The risks for cable in Q3 remain to the downside given GBP tends to perform poorly as global financial conditions tighten. Beyond then, we expect cable to recover as the USD weakens more broadly.”
The US dollar has staged a rebound over the past week. US yield surge will keep USD supported ahead of CPI data, economists at MUFG Bank report.
Blow-out NFP report pushes back expectations for dovish Fed pivot
“The NFP report surprisingly revealed that employment growth surged higher by 528K in July. Leading indicators continue to signal that employment growth is likely to slow sharply later this year, but for now, the robust pace of employment growth combined with more evidence of stronger average hourly earnings growth (+0.5% MoM) in July keeps pressure on the Fed to keep raising rates further into restrictive territory above 3.00%.”
“Renewed upward pressure on short-term US yields should encourage an even a stronger US dollar. We believe there is room for the US dollar to rebound further in the near-term.”
In the view of economists at CIBC Capital Markets, the Canadian dollar is set to see modest weakening as slower global growth hits commodities, and the Federal Reserve slightly outguns the Bank of Canada (BoC).
Global slowdown shaves CAD value
“While we expect another nonstandard hike at the September meeting, if it’s a 75 bps move, that won't be bullish for the loonie if the market sees that as the end of the BoC's tightening cycle.”
“We see USDCAD reaching 1.33 in early 2023, with a widening in the travel services trade deficit and a cooler path for commodities. But a broad softening in the USD that year as the Fed stays on hold suggests that the loonie won't weaken further over the balance of next year. Overall, CAD is still a rangebound currency.”
EUR/USD could test December 2002 lows as costly nat-gas prices and ongoing supply threats leave the eurozone facing elevated recession risks, which will weigh on the euro ahead, economists at CIBC Capital Markets report.
Recession risks to weigh on euro
“Costly natural gas prices and ongoing supply threats leave the eurozone facing elevated recession risks.”
“A data-dependent ECB may look to tighten again at its next meeting. However, recession concerns and fragmentation risks, due to rising credit concerns, point towards early December 2002 EUR/USD lows at 0.9863 remaining in view.”
- Gold price nurses losses after impressive US NFP-inspired sell-off.
- US dollar eases in tandem with the Treasury yields amid a better mood.
- XAU/USD looks south towards $1,750, as 75 bps Sept Fed rate hike bets rise.
Gold price is licking its wound below the $1,800 mark, awaiting a fresh catalyst for the next leg lower. Risk-on flows have returned at the start of the week, fuelling a broad-based US dollar retreat while the Treasury yields also ease. Investors assess the implications of a super-sized Fed rate next months, the odds for which now stand at 70% after a big upside surprise in the US Nonfarm Payrolls for July. The jobs blowout raised the stakes for the July US inflation report due on Wednesday. The US Consumer Price Index (CPI) could likely see a slight pullback in headline growth but the core figure is seen accelerating. The debate of peak inflation remains in play heading into the key event risk of the week. The non-yielding bullion is expected to remain highly reactive to the US employment and inflation data after the Fed said that it remains data-dependent while deciding on its policy outlook.
Also read: Gold Price Forecast: XAU/USD could challenge $1,750, with big Fed rate hike bets back in play
Gold Price: Key levels to watch
The Technical Confluence Detector shows that the gold price needs to slice through a bunch of healthy support levels around the $1,772-$1,771 area to resume the post-NFP sell-off.
That demand zone is the convergence of the SMA5 one-day, Fibonacci 23.6% one-day and the previous low four-hour.
The Fibonacci 61.8% one-week at $1,769 will be next on sellers’ radars. However, bears need acceptance below the confluence of the Fibonacci 61.8% one-month and pivot point one-day S1 at $1,763 to negate the recent bullish momentum.
Further south, the intersection of the previous week’s low and the pivot point one-week S1 at $1,754 will guard the downside.
On the upside, the immediate resistance appears at $1,775, above which the Fibonacci 38.2% one-week at %1,780 will be challenged.
The next resistance levels are located at $1,784 and $1,786, which are the Fibonacci 61.8% one-day and Fibonacci 23.6% one-week respectively.
Here is how it looks on the tool
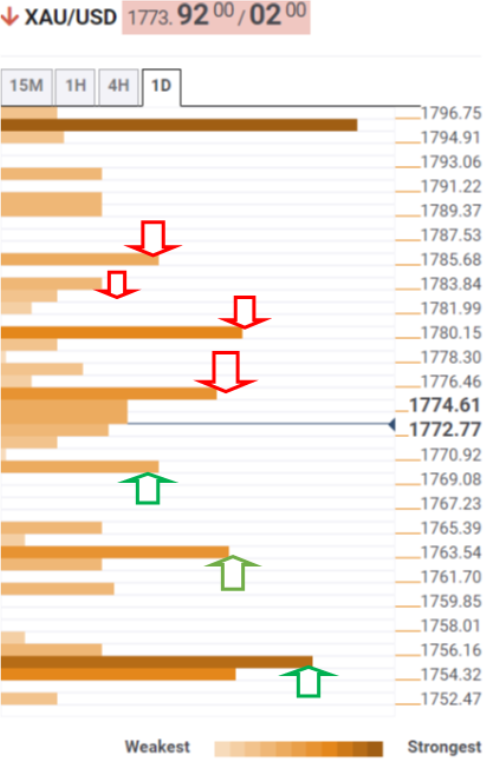
About Technical Confluences Detector
The TCD (Technical Confluences Detector) is a tool to locate and point out those price levels where there is a congestion of indicators, moving averages, Fibonacci levels, Pivot Points, etc. If you are a short-term trader, you will find entry points for counter-trend strategies and hunt a few points at a time. If you are a medium-to-long-term trader, this tool will allow you to know in advance the price levels where a medium-to-long-term trend may stop and rest, where to unwind positions, or where to increase your position size.
GBP/USD has failed to reclaim 1.21 following the earlier recovery attempt. The pair faces significant support at 1.2050 and sellers are likely to dominate the pricing action if that level fails, FXStreet’s Eren Sengezer reports.
Bears to take action with a drop below 1.2050
“In case the market environment remains risk-positive in the second half of the day, GBP/USD's downside could remain limited. Nevertheless, market participants are unlikely to bet on a steady rebound in the pair ahead of the highly-anticipated US inflation report on Wednesday.”
“The Fibonacci 50% retracement level of the latest uptrend forms significant support at 1.2050. In case sellers drag the pair below that level, additional losses toward 1.2000 (psychological level, Fibonacci 50% retracement) and 1.1920 (static level) could be witnessed.”
On the other hand, 1.2100 (psychological level, Fibonacci 38.2% retracement) aligns as significant resistance. If the pair starts using that level as support, technical recovery could stretch higher toward 1.2150 (50-period SMA) and 1.2175 (Fibonacci 23.6% retracement).”
- EUR/GBP attracts some dip-buying on Monday, though the uptick lacks follow-through.
- The BoE’s gloomy economic outlook is behind the GBP’s relative underperformance.
- Recession fears acted as a headwind for the euro and kept a lid on any meaningful gains.
The EUR/GBP cross attracts some dip-buying near the 0.8415 region and turns positive for the fourth successive day on Monday. Spot prices refresh daily high during the early European session, though seem struggling to capitalize on the move beyond the very important 200-day SMA around the 0.8435-0.8440 zone.
The Bank of England last week painted a particularly bleak outlook for the UK economy and indicated that a prolonged recession would start in the fourth quarter. This is seen as a key factor behind the British pound's relative underperformance and lending some support to the EUR/GBP cross, though the uptick lacks bullish conviction.
Investors remain worried that a halt of gas flows from Russia could trigger an energy crisis in the Eurozone, which could drag the region's economy faster and deeper into recession. This might continue to act as a headwind for the shared currency and keep a lid on any meaningful upside for the EUR/GBP cross, warranting caution for bulls.
On the economic data front, the Eurozone Sentix Investor Confidence index improved slightly from -26.4 in July to -25.2 in August. Furthermore, the current situation was up slightly at -16.3 in August from the -16.5 previous and the Expectations Index came in at -33.8. This, however, did little to impress bulls or provide any impetus to the EUR/GBP cross.
The mixed fundamental backdrops make it prudent to wait for strong follow-through buying before confirming that the EUR/GBP cross has formed a base near the 0.8340 region, or a multi-month low touched on August 3.
Technical levels to watch
- The index loses momentum following the bull run to 106.80.
- US yields shed part of Friday’s strong advance.
- The 3-month/6-month Bill Auctions are only due in the docket.
The greenback, in terms of the US Dollar Index (DXY), trades with marginal losses following another unsuccessful attempt to revisit the 107.00 mark earlier in the session on Monday.
US Dollar Index stays capped by 107.00
The index exchanges gains with losses in the mid-106.00s and keeps the daily lack of direction well in place in the European midday, as market participants appear to have already digested Friday’s solid print from Nonfarm Payrolls (+528K jobs).
The inconclusive price action in the greenback so far comes amidst the mild drop in US yields across the curve after the post-NFP upside recorded at the end of last week.
Nothing scheduled data wise in the US docket other than a short-term bill auction. It is worth recalling that the release of inflation figures measured by the CPI (Wednesday) will be the salient event this week.
What to look for around USD
The index comes under pressure after advancing to the boundaries of the 107.00 mark soon after solid results from US Nonfarm Payrolls more than doubled its initial estimates in July.
The outlook for the dollar has improved somewhat after the index bottomed out near the 105.00 yardstick (August 2) in response to recession-induced weakness, all following the release of the flash Q2 US GDP figures. However, Friday’s stellar figures from July’s Payrolls reignited the prospects for another large rate hike (75 bps?) at the September event, opening the door to extra gains in the very near term.
Looking at the macro scenario, the dollar appears propped up by the Fed’s divergence vs. most of its G10 peers (especially the ECB) in combination with bouts of geopolitical effervescence and occasional re-emergence of risk aversion.
Key events in the US this week: MBA Mortgage Applications, Inflation Rate, Wholesale Inventories (Wednesday) Initial Claims, Producer Prices (Thursday) – Flash Consumer Sentiment (Friday).
Eminent issues on the back boiler: Hard/soft/softish? landing of the US economy. Escalating geopolitical effervescence vs. Russia and China. Fed’s more aggressive rate path this year and 2023. US-China trade conflict. Future of Biden’s Build Back Better plan.
US Dollar Index relevant levels
Now, the index is losing 0.02% at 106.55 and a breach of 105.04 (monthly low August 2) would expose 103.67 (weekly low June 27) and finally 103.38 (100-day SMA). On the upside, a breakout of 107.42 (weekly high post-FOMC July 27) would expose 109.29 (2022 high July 15) and then 109.77 (monthly high September 2002).
EUR/USD has recovered toward 1.0200 following Friday's selloff. Nonetheless, sellers are ser to retain control as long as the 1.0250 resistance holds, FXStreet’s Eren Sengezer reports.
EUR/USD unlikely to gather bullish momentum unless it clears 1.0250
“EUR/USD faces interim resistance at 1.0230 (Fibonacci 38.2% retracement of the latest downtrend) ahead of 1.0250 (200-period SMA on the four-hour chart). With a four-hour close above the latter, buyers could show interest and open the door toward the next bullish target at 1.0300 (psychological level, Fibonacci 50% retracement).”
“On the downside, additional losses toward 1.0150 (Fibonacci 23.6% retracement) and 1.0100 (psychological level, static level) could be witnessed in case 1.0200 (100-period SMA, 50-period SMA) is confirmed as resistance.”
Given the war in Ukraine, does it make sense to talk of a war economy in the European Union? In the opinion of analysts at Natixis, the economic tensions caused by the war in Ukraine are quite similar to what would have been caused, without the war in Ukraine, by the normalisation of Europe’s defence effort and by the energy transition.
Economic tensions in the EU would have occurred without the war in Ukraine
“The European Union is experiencing economic tensions (reduction in the use of fossil fuels, need for increased defence spending) due to the war in Ukraine. But similar tensions would have occurred: To align defence spending with other countries; To invest sufficiently in the energy transition; To maintain the purchasing power of low-income households due to the rise in prices caused by the transition.”
“The war in Ukraine is requiring Europe to make adjustments (increased defence spending, huge energy transition investments, rise in the relative price of energy) that would have happened anyway.”
- A combination of factors assists NZD/USD to catch fresh bids on the first day of a new week.
- Retreating US bond yields undermines the USD and offers support amid a positive risk tone.
- Recession fears, larger Fed rate hike bets could limit the USD losses and cap gains for the pair.
The NZD/USD pair regains positive traction on the first day of a new week and recovers a major part of Friday's decline to the 0.6215-0.6210 support zone. The intraday buying picks up pace during the early European session and lifts spot prices to the 0.6270 area, or a fresh daily high in the last hour.
The US dollar struggles to capitalize on its post-NFP strong move up and meets with a fresh supply on Monday, which, in turn, offers some support to the NZD/USD pair. A fresh leg down in the US Treasury bond yields keeps the USD bulls on the defensive. Apart from this, a generally positive tone around the equity markets further undermines the safe-haven buck and benefits the risk-sensitive kiwi.
That said, growing worries about a global economic downturn and the US-China tension over Taiwan should keep a lid on any optimistic move in the markets. Furthermore, renewed speculations for a more aggressive policy tightening by the Fed should act as a tailwind for the US bond yields. This supports prospects for the emergence of some USD dip-buying and should cap the NZD/USD pair.
The US monthly jobs report released on Friday showed that the economy added 528K jobs in July, smashing consensus estimates by a big margin. Furthermore, the unemployment rate unexpectedly edged lower to 3.5% from the 3.6% in the previous month. Moreover, Average Hourly Earnings also beat expectations and rose 0.5% MoM in July. The data pointed to a further rise in inflationary pressures and lifted bets for a 75 bps Fed rate hike move at the next policy meeting in September.
Hence, the market focus now shifts to the release of the latest US consumer inflation figures, due on Wednesday. The US CPI report would influence Fed rate hike expectations and play a key role in driving the near-term USD demand, which, in turn, should help determine the next leg of a directional move for the NZD/USD pair. In the meantime, the USD remains at the mercy of the US bond yields, which, along with the broader risk sentiment, might provide some impetus to the major.
Technical levels to watch
The Eurozone Sentix Investor Confidence index came in at -25.2 in August from -26.4 in May vs. -24.7 expected. The index resumed its recovery but failed to ease off recession fears.
The current situation in the eurozone was up very slightly at -16.3 in August after falling to -16.5 in the previous month, which was its lowest since March 2021.
An expectations index rose to -33.8, still close to its July level, which was the lowest since December 2008.
Key takeaways
"The economic situation in the eurozone remains difficult.”
"A recession in the eurozone is still very likely.”
EUR/USD reaction
The shared currency remains unimpressed by the minor improvement in the Eurozone Sentix data. EUR/USD is modestly flat on the day, currently trading at 1.0185.
According to FX Strategists at UOB Group Lee Sue Ann and Quek Ser Leang, USD/CNH is expected to keep navigating the 6.7350-6.8000 range for the time being.
Key Quotes
24-hour view: “USD traded between 6.7468 and 6.7686 last Friday, close to our expected sideway-trading range of 6.7470/6.7700. Further sideway trading seems likely even though the slightly firmed underlying tone suggests a higher range of 6.7540/6.7750.”
Next 1-3 weeks: “We continue to hold the same view as last Wednesday (03 Aug, spot at 6.7750) where is USD is likely to trade between 6.7350 and 6.8000 for now.”
- Silver regains traction on Monday and reverses a major part of Friday’s fall to over a one-week low.
- Bulls still need to wait for a move beyond the $20.30-35 confluence before placing aggressive bets.
- A convincing break below the $19.20 support zone would negate any near-term positive outlook.
Silver attracts some dip-buying near the $19.80 region on Monday and recovers further from over a one-week low set in the previous session. The white metal builds on its steady intraday ascent through the early European session and climbs back above the $20.00 psychological mark in the last hour.
From a technical perspective, any subsequent move up is more likely to confront stiff resistance and remain capped near the $20.30-$20.35 confluence. The said barrier comprises the 50-day SMA and the 50% Fibonacci retracement level of the $22.52-$18.15 downfall, which should act as a pivotal point.
Oscillators on the daily chart, meanwhile, are holding in the bullish territory and have again started gaining positive traction on hourly charts. This, in turn, supports prospects for an eventual breakout through the aforementioned hurdle and a move towards the 61.8% Fibo. level, around the $20.85 area.
Some follow-through buying beyond the $21.00 mark would be seen as a fresh trigger for bulls and pave the way for a more toward the next relevant hurdle near the $21.40-$21.50 area. The XAG/USD could eventually aim to reclaim the $22.00 round figure, which coincides with the 100-day SMA resistance.
On the flip side, the 38.2% Fibo. level, around the $19.80-$19.75 region, now seems to protect the immediate downside. Any further decline is more likely to stall and find support near Friday's swing low, around the $19.55 area, which is followed by the 23.6% Fibo. level, around the $19.20 zone.
Failure to defend the aforementioned support levels would shift the bias back in favour of bearish traders and make the XAG/USD vulnerable to weaken below the $19.00 mark. The downfall could then drag spot prices to the $18.40 support en route to the YTD low, around the $18.15 region touched on July 14.
Silver daily chart
-637955421996854797.png)
Key levels to watch
Considering advanced prints from CME Group for natural gas futures markets, open interest shrank for the second session in a row on Friday, now by nearly 5K contracts. Volume, instead, reversed the previous daily pullback and went up by around 50.4K contracts.
Natural Gas faces support near $7.50
Friday’s downtick in prices of natural gas edged lower at the end of last week and broke below the key $8.00 mark amidst declining open interest. Against that, the continuation of the downtrend appears unlikely for the time being, while the commodity faces decent support in the $7.50 region per MMBtu.
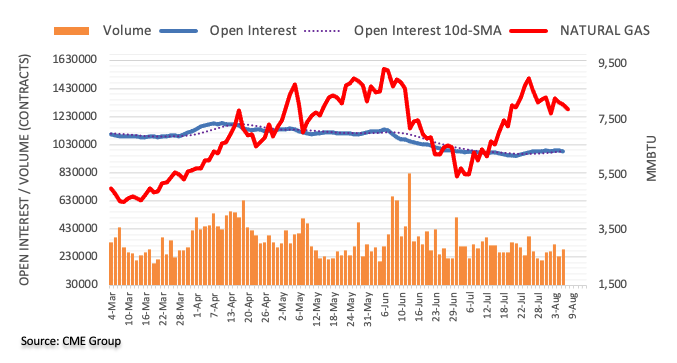
Further upside momentum could lift USD/JPY back to the 136.00 region in the next weeks, note FX Strategists at UOB Group Lee Sue Ann and Quek Ser Leang.
Key Quotes
24-hour view: “USD traded sideways last Friday until NY session when it rocketed to 135.49. Impulsive momentum suggests further USD strength is likely but in view of the overbought conditions, a break of 136.00 is unlikely for now (next resistance is at 136.50). Support is at 134.90 followed by 134.40.”
Next 1-3 weeks: “In our latest narrative from last Wednesday (03 Aug, spot at 133.50), we highlighted that USD is likely to trade between 131.30 and 135.60. USD soared to 135.49 on Friday before closing higher by +1.60% (NY close of 134.97), its largest 1-day gain in 7 weeks. Shorter-term upward momentum has improved and USD could advance to 136.00, with lower chance for extension to 136.50. The USD strength is intact as long as USD does not move below 134.00 (‘strong support’ level) within these few days.”
EUR/USD continues to trade below 1.02 at the beginning of the week. The pair is set to remain soft within a 1.01-1.03 range, analysts at ING report.
Italy's rating outlook change will not help the euro
“Rating agency Moodys shifted its rating outlook on Italy's sovereign debt from stable to negative. That has raised some eyebrows and no doubt will call the European Central Bank into further supportive action, be it through the more aggressive re-investment of the Pandemic Emergency Purchase Programme or potentially even using its new support instrument – the Transmission Protection Instrument (TPI). None of this will help the beleaguered euro. Indeed, if quiet summer markets prompt renewed interest in the carry trade, the euro will probably be one of the preferred funding currencies.”
“EUR/USD was understandably hit by Friday's strong US jobs release data and looks like it can stay offered in a 1.01-1.03 trading range.”
“EUR/CHF will be monitoring the performance of Italian bonds today and can probably edge back towards the lower end of a 0.97-0.98 range – a move that will not be unwelcome to the newly hawkish Swiss National Bank.”
The dollar starts the new week on the firm side after some impressive US July jobs figures on Friday. Firm US July CPI data this week can see the dollar continue to trade near its highs, economists at ING report.
Dollar to hold near highs, but interest in carry could emerge
“Pricing in the US money markets now sees a further 125 bps of Fed hikes this year (we see hikes of 50 bps, 50 bps, and 25 bps in September, November and December). And those money markets price in around 50 bps of cuts from summer '23 onwards. Current pricing is consistent with our house view and perhaps could usher in a period of calm for Fed pricing and the dollar. That pricing looks unlikely to be altered much this week with a strong US July CPI, where the core rate should stay near 6% year-on-year and keep the Fed concerned.
“There should be focus this week on the Senate's approval of what is now called the Inflation Reduction Act. It will be interesting to see whether new taxation on stock buybacks next year triggers a rush of stock buybacks this year – potentially supporting US equities (and probably the dollar) into year-end.”
“Expect DXY to hold near its recent highs of 107. But if the dollar is not going anywhere in a hurry, there could be renewed interest in the carry trade.”
Economists at ING have been bearish on EUR/USD this year, but not bearish enough. They are cutting their EUR/USD forecast by roughly 4-5% across 2022-24 profile curve.
Lowering the forecast profile
“A cut in our EUR/USD forecast profile is now more consistent with our Rate Strategy Team’s view on the eurozone/US two-year swap spread divergence. It has this spread continuing to move against EUR/USD into year-end, with Fed easing expectations only starting to make their mark in 1Q23.”
“Combining macro, monetary policy, valuation and geopolitical views together, it now feels like the right time to take 4-5% off our EUR/USD forecast profile curve.”
CME Group’s flash data for crude oil futures markets noted open interest shrank for the second session in a row on Friday, this time by almost 30K contracts. Volume, instead, remained choppy and rose by nearly 73K contracts.
WTI faces initial hurdle at the 200-day SMA
Prices of the barrel of the WTI dropped to 6-month lows near the $87.00 mark on Friday, regaining some poise and closing the session with modest gains. The small uptick was accompanied by diminishing open interest, hinting at the idea that further decline could be in the pipeline in the near term. Occasional bullish attempts, in the meantime, are expected to meet the next hurdle at the 200-day SMA, today at $95.25.
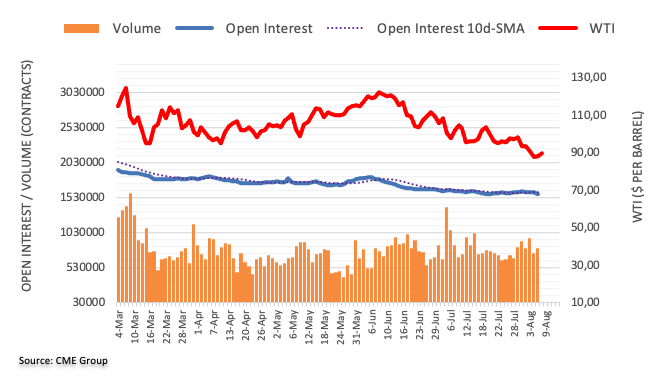
Gold plunged down to support levels near $1,772, after the release of much stronger-than-expected US July payrolls data. In the view of strategists at TD Securities, the gold rally is ready for a significant reversal as traders are increasingly considering the possibility that the market has priced a premature Federal Reserve pivot away from its current hawkish stance.
There are plenty of inflationary pressures in the system
“There is a high probability that the recent rally, which took prices from a July low of $1,681 to a high near $1795, will be largely reversed as money managers reduce recently acquired long exposure.”
“The combination of hawkish statements from Fed officials and stronger-than-expected data are the likely catalysts which can trigger additional selling in the days and weeks ahead.”
“The US July CPI data on Wednesday, particularly the core, will be the one to watch as any hint of stubborn inflation pressures in the system should help to debunk the early pivot argument.”
- AUD/USD attracts fresh buying on Monday and recovers further from over a two-week low.
- A positive risk tone offers support to the risk-sensitive aussie amid a modest USD downtick.
- Recession fears, US-China tensions, hawkish Fed expectations could limit losses for the USD.
The AUD/USD pair builds on Friday's late bounce from the 0.6870 area, or over a two-week low, and gains some positive traction on the first day of a new week. The steady intraday ascent extends through the early European session and pushes spot prices to a fresh daily high, around mid-0.6900s in the last hour.
The upbeat Chinese trade balance data released over the weekend turns out to be a key factor offering support to the China-proxy Australian dollar. Apart from this, subdued US dollar price action act as a tailwind for the AUD/USD pair. A softer tone surrounding the US Treasury bond yields keeps the USD bulls on the defensive. This, along with signs of stability in the equity markets, is undermining the safe-haven buck and driving flows towards the risk-sensitive aussie.
That said, growing worries about a global economic downturn and the US-China tension over Taiwan should keep a lid on any optimistic move in the markets. Furthermore, renewed speculations for a more aggressive policy tightening by the Fed support prospects for the emergence of some USD dip-buying. This, in turn, warrants caution before placing aggressive bullish bets around the AUD/USD pair amid absent relevant market-moving economic releases from the US on Monday.
The US monthly jobs report on Friday showed that the economy added 528K jobs in July, smashing consensus estimates by a big margin. Additional details revealed that the unemployment rate unexpectedly edged lower to 3.5% from the 3.6% in the previous. Moreover, Average Hourly Earnings also beat expectations and rose 0.5% MoM in July, suggesting a further rise in inflationary pressures and lifting bets for a 75 bps Fed rate hike move at the next policy meeting in September.
Hence, the market focus now shifts to the release of the latest US consumer inflation figures, due on Wednesday. The data would influence Fed rate hike expectations and play a key role in driving the near-term USD demand, which, in turn, should help determine the next leg of a directional move for the AUD/USD pair. In the meantime, the US remains at the mercy of the US bond yields, which, along with the broader risk sentiment, might provide some impetus to the major.
Technical levels to watch
FX option expiries for August 8 NY cut at 10:00 Eastern Time, via DTCC, can be found below.
- EUR/USD: EUR amounts
- 1.0100-05 692m
- 1.0175 234m
- 1.0200-05 353m
- 1.0245-55 423m
- 1.0300 567m
- GBP/USD: GBP amounts
- 1.1900 670m
- 1.2250 510m
- USD/JPY: USD amounts
- 134.00 445m
- 134.75-85 372m
- 135.00 510m
- 135.50 260m
- 135.90 230m
- 135.90-00 639m
- 137.50 960m
- USD/CHF: USD amounts
- 0.9450 300m
- AUD/USD: AUD amounts
- 0.6910 300m
- 0.7000 975m
- USD/CAD: USD amounts
- 1.2800-10 340m
- 1.2950 1.07b
- NZD/USD: NZD amounts
- 0.6400 330m
Here is what you need to know on Monday, August 8:
Boosted by the upbeat July jobs report, the US Dollar Index (DXY) gained 0.8% on Friday and ended up snapping a two-week losing streak. Markets stay relatively quiet early Monday and the DXY consolidates Friday's gains. The European economic docket will feature the Sentix Investor Confidence Index data for August. There won't be any high-impact data releases from the US and the risk perception could drive the market action in the second half of the day. The US stock index futures are up modestly in the European morning, pointing to a neutral market mood.
The Bureau of Labor Statistics reported on Friday that Nonfarm Payrolls rose by 528,000 in July, surpassing the market expectation of 250,000 by a wide margin. According to the CME Group FedWatch Tool, the probability of a 75 basis points Fed rate hike in September now stands at 68.5%, compared to 29% a week ago. With hawkish Fed bets dominating the markets, the benchmark 10-year US Treasury bond yield climbed above 2.8%. In an appearance before the Kansas Bankers Association over the weekend, Fed Governor Michelle Bowman said that she strongly supports super-sized rate increases to fight inflation.
NFP Analysis: America's labor market is red hot, only weak inflation could dethrone King Dollar.
Meanwhile, China is reportedly continuing the military drills in the seas and skies around Taiwan on Monday. Ahead of the weekend, China’s Foreign Ministry announced that they will sanction US House of Representative Speaker Nancy Pelosi over her visit to Taiwan.
The data from China showed that the trade surplus widened to $101.26 billion in July from $97.94 billion in June. On a yearly basis, Exports rose by 18% in that period, surpassing analysts' estimate of 15%.
During the Asian trading hours, the Reserve Bank of New Zealand's Inflation Expectations for the third quarter declined to 3.07% from 3.29% in the previous quarter. NZD/USD's reaction to this data was relatively muted, however, and the pair was last seen trading at 0.6240, where it was up 0.24% on a daily basis.
EUR/USD dropped below 1.0250 after the US jobs report on Friday but managed a erase a portion of its daily losses. Nevertheless, the pair continues to trade below 1.0200 at the beginning of the week.
After having snapped a two-week winning streak, GBP/USD trades in a relatively tight range below 1.2100 early Monday.
Fueled by surging yields and the broad-based dollar strength, USD/JPY gained more than 200 pips on Friday. The pair continues to edge higher toward 135.50 in the European morning.
Gold lost its bullish momentum on Friday and suffered heavy losses. XAU/USD moves up and down in a narrow range above $1,770 on Monday.
Bitcoin gathered bullish momentum on Monday and was last seen gaining more than 2% on the day at $23.750. Ethereum trades near the upper limit of its two-week-old range near $1,700, rising 2% on the day.
- Gold price remains sidelined, recently bouncing off intraday low amid sluggish markets.
- Easing risk-aversion, pullback in Treasury yields favor recent consolidation in metal prices.
- China, inflation are the key catalysts amid a likely calmer week ahead.
Gold price (XAU/USD) pares intraday losses at around $1,775 amid the initial Monday morning in Europe. The yellow metal’s latest rebound could be linked to the technical support, as well as the US dollar’s retreat, amid a sluggish start to the key week.
That said, the US Dollar Index (DXY) traces the Treasury yields to trim the post-NFP gains. That said, the DXY eases to 106.65, after refreshing the two-week high to 206.93 the previous day. It’s worth noting that the US 10-year Treasury yields ease back to near 2.816% after rallying 14 basis points (bps) to 2.83% after the strong US jobs report for July.
Further, S&P 500 Futures also print mild gains and the Asia-Pacific shares remain indecisive as Taiwan-linked fears ease.
Elsewhere, strong prints of the US Fed fund futures suggesting the Fed’s 75 basis points (bps) rate hike in September keep the XAU/USD bears hopeful despite the latest rebound. For that, the US Consumer Price Index (CPI) for May, up for publishing on Wednesday, will be crucial for near-term directions.
Additionally, the recent rebound in China’s trade numbers and chatters that the dragon nation will overcome the latest economic crisis appear to have underpinned the XAU/USD’s corrective pullback, due to Beijing’s status among the world’s largest gold users.
Technical analysis
Gold price stays defensive around the 50-HMA, fading the bounce from a two-week-old support line, around $1,770-69 by the press time. Given the recently easing bearish bias of the MACD and the metal’s sustained trading beyond the short-term key support line, the quote is likely to remain firmer.
However, a clear upside break of the 50-HMA hurdle surrounding $1,777 appears necessary to recall the short-term XAU/USD bulls. Even so, the latest double tops around $1,795 and the $1,800 threshold challenge the metal’s further upside.
Meanwhile, the 200-HMA level of $1,757 adds to the downside filter, a break of which could direct the gold bears towards a July 22 swing high near $1,739.
Overall, gold grinds higher but the buyers need strong fundamental support to keep reins.
Gold: Hourly chart
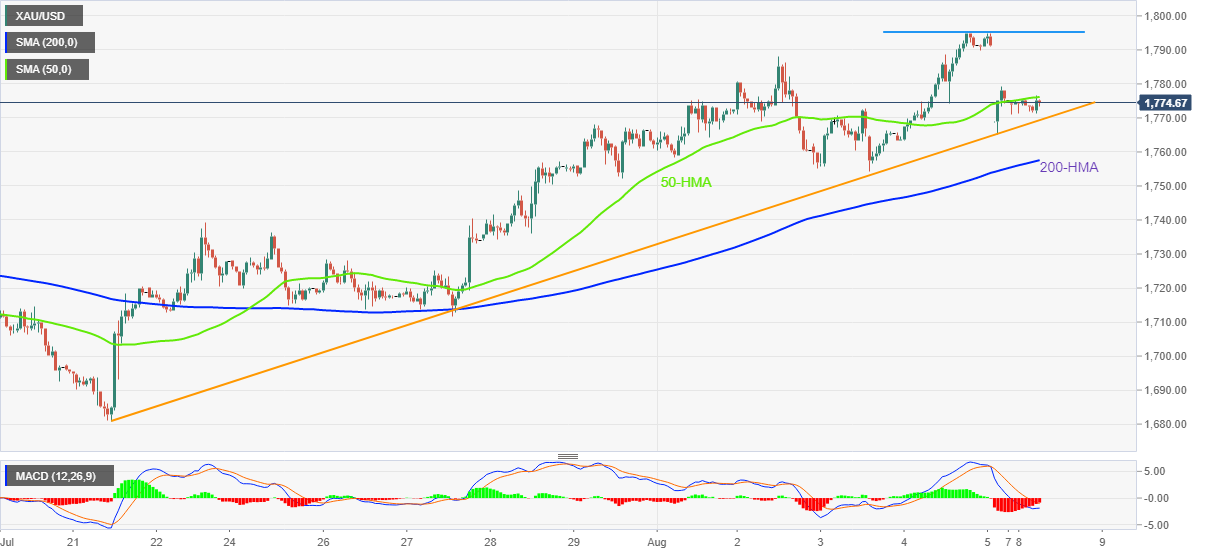
Trend: Limited recovery expected
Extra downside in AUD/USD now appears limited around the 0.6855 level, comment FX Strategists at UOB Group Lee Sue Ann and Quek Ser Leang.
Key Quotes
24-hour view: “The sharp drop in AUD to 0.6870 came as a surprise (we were expecting sideway-trading). Despite the decline, downward momentum has not improved by much and AUD is unlikely to weaken further. For today, AUD is likely trade sideways between 0.6880 and 0.6945.”
Next 1-3 weeks: “We highlighted last Friday (05 Aug, spot at 0.6955) that downward momentum has fizzled out and we expected AUD to consolidate and trade between 0.6885 and 0.7035. AUD subsequently dropped to 0.6870 before closing on a soft note at 0.6911 (-0.82%). Downward momentum has improved somewhat and AUD could edge lower from here. At this stage, any weakness is likely limited to 0.6855. On the upside, a breach of 0.6965 would indicate that the current mild downward pressure has eased.”
European companies’ return on equity (RoE) will inevitably decline in the future due to four reasons. These developments will result in significant changes in the functioning of capitalism, economists at Natixis report.
What consequences of a decline in the RoE?
“The profitability of European companies, both the return on equity and the economic return on capital, will now inevitably decline due to: The need to make investments in the energy transition whose financial returns are often low; The inevitable increase in corporate taxes needed to finance redistributive policies to offset the inequality caused by the energy transition; Faster wage growth due to the upturn in wage earners’ bargaining power; The reshoring of strategic industries.”
“Given both the decline in companies’ RoE and the rise in interest rates on risk-free bonds, the corporate risk premium (the difference between the RoE and the risk-free interest rate) will normalise in the eurozone. This will have significant effects on the functioning of European capitalism: less use of leverage effects, less incentive for offshoring.”
Gold is trading slightly below $1,780. This mark aligns as a key technical level for XAU/USD, FXStreet’s Eren Sengezer reports.
First support is located at $1,740
“In order to remain technically bullish, XAU/USD needs to confirm $1,780, where the Fibonacci 23.6% retracement of the latest downtrend and the descending trend line meet, as support. In that scenario, $1,800 (psychological level 50-day SMA) and $1,830 (Fibonacci 38.2% retracement) align as next bullish targets.”
“On the downside, the first support is located at $1,740 (20-day SMA) before $1,700 (psychological level) and $1,680 (July 21 low, static level from March 2021).”
Gold started the month of August on a firm footing and climbed toward $1,800 before erasing a portion of its weekly gains on Friday. According to FXStreet’s Eren Sengezer, recovery could end if US CPI data confirms a 75 bps Fed hike.
July inflation data from the US could trigger a strong reaction
“On Wednesday, the US Bureau of Labor Statistics will release the Consumer Price Index (CPI) figures for July. On a yearly basis, the CPI inflation is forecast to edge lower to 8.9% from 9.1% in June. The market reaction to inflation data should be pretty straightforward with a higher-than-expected CPI print triggering a dollar rally and a soft reading forcing the currency to face renewed selling pressure.”
“A CPI reading above 9% should allow hawkish Fed bets to continue to dominate the market action and ramp up the bearish pressure on gold.”
“On Friday, the University of Michigan will release its flash Consumer Sentiment Index for August. In July’s final version, the long-run inflation expectations stood at 2.8%. Any reading above 3% could help the dollar gather strength and hurt XAU/USD while a 2.8%-or-lower print should weigh on the USD.”
Open interest in gold futures markets remained erratic on Friday and dropped by nearly 7K contracts, according to preliminary readings from CME Group. On the other hand, volume reversed two daily drops in a row and increased by around 13.3K contracts.
Gold looks to retest $1,800
Prices of the ounce troy of gold faltered just below the key $1,800 mark in past sessions. Friday’s downtick was on the back of shrinking open interest, suggesting further downside could be limited and always with the immediate target at the $1,800 mark.
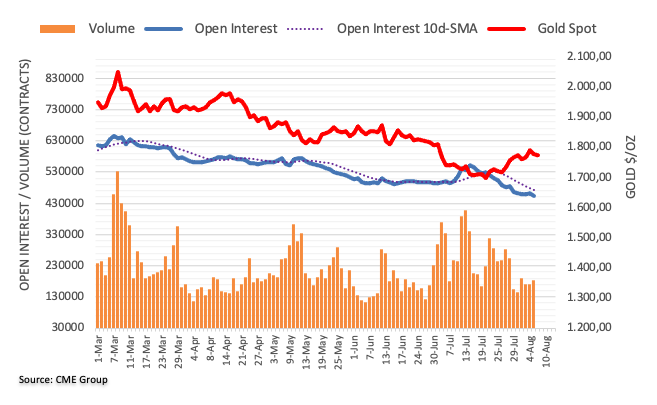
- Steel price rebounds from one-week low amid cautious optimism in metal markets.
- Turkish entry into global scrap market, easing fears of US-China tension over Taiwan also underpin corrective pullback.
- Maintenance closures in European steel manufacturing units, strong China trade numbers for July favor steel buyers.
- Hawkish expectations from Fed, recession fears challenge metal prices.
Steel price regains upside momentum, after Friday’s pullback to a one-week low, as concerns surrounding short-term supply deterioration join nearby demand increase. However, fears of the Fed’s aggression and economic slowdown join anxiety ahead of Wednesday’s US inflation data to probe the metal buyers.
That said, the most active contract of steel rebar on the Shanghai Futures Exchange (SFE) picks up bids to 4,125 yuan heading into Monday’s European session.
“Demand picked up in mid-July, with buyers stocking up small volumes before the August summer holidays, but this activity has since reduced with mills closing for the low season, Fastmarkets heard,” said Reuters.
Elsewhere, Turkey re-enters global scrap markets after a brief absence, which in turn helps the demand matrix and helps the metal prices. Additionally, a drop in China’s steel inventory and output figures during July offers extra strength to the steel price.
It should be noted that China’s trade numbers for June marked upbeat results with the Exports rising the most in the year, which in turn favor the latest Steel price recovery. That said, the headline Trade Balance rose to $101.26B versus $90B forecasts and $97.94B. Further details suggest that Exports increased by 18% compared to 15% expected and 17.9% prior whereas the Imports eased to 2.3% compared to 3.7% expected and 1.0% prior.
On a different page, receding fears over the US-China tussles over Taiwan also seem to favor steel buyers. Recently, Reuters came out with the news suggesting that China is up for ‘regular’ military drills east of the Taiwan Strait median line. That said, the dragon nation’s Foreign Ministry announced on Friday that they will sanction US House of Representative Speaker Nancy Pelosi over the Taiwan visit. On the other hand, Taiwan's Defense Ministry reported 66 Chinese aircraft conducting activities in the Taiwan Strait as of 5 pm local time on Sunday. Further, US Secretary of State Anthony Blinken mentioned that China's provocative actions were a significant escalation.
However, a jump in the hawkish Fed bets and fears of recession seem to challenge steel buyers. The interest rate futures signal 73% odds favoring the 75 basis-point interest rate hike at coming meetings. The odds of the Fed’s aggression jumped after the strong US jobs report for July. That said, the headline Nonfarm Payrolls (NFP) rose to 528K versus 250K expected and 398K upwardly revised prior. Further, the Unemployment Rate also inched lower to 3.5% compared to 3.6% expected and previous readings.
Moving on, the monthly inflation numbers from the US will be crucial for the steel traders amid hopes of witnessing the fresh metal demand, especially from China.
In the opinion of FX Strategists at UOB Group Lee Sue Ann and Quek Ser Leang, GBP/USD risks a deeper pullback on a breach of the 1.2000 yardstick.
Key Quotes
24-hour view: “We did not expect the sharp drop in GBP to 1.2004 last Friday and the subsequent strong rebound from the low. Despite the strong rebound, the immediate pressure is still on the downside. While there is room for GBP to weaken, a break of the major support at 1.2000 is unlikely (minor support is at 1.2025). On the upside, a breach of 1.2115 (minor resistance is at 1.2085) would indicate that the current downward pressure has eased.”
Next 1-3 weeks: “Our latest narrative was from Wednesday (03 Aug, spot at 1.2160) where GBP is in a consolidation phase and is likely to trade within a range of 1.2040/1.2255. On Friday (05 Aug), GBP cracked 1.2040 and dropped to 1.2004. Shorter-term downward momentum is beginning to improve and the risk for GBP is tilted to the downside. That said, GBP has to crack the major support at 1.2000 before a sustained decline is likely. Overall, only a break of 1.2155 (‘strong resistance’ level) would indicate that the downside risk has dissipated.”
- USD/JPY is expected to witness more gains if the asset oversteps 135.50 decisively.
- Fed’s intention to elevate interest rates will remain intact despite lower US CPI print.
- The BOJ is committed to bringing pre-pandemic growth rates.
The USD/JPY pair is addressing an inventory distribution phase after a perpendicular upside move from the critical support of 133.00. Auctioning in an inventory distribution phase after an upside move indicates a continuation of an upside move after the climax of volatility contraction. The asset will prefer an establishment above 136.00 initially and later on will advance towards the all-time-highs around 139.40.
The US dollar index (DXY) got strengthened after the upbeat US Nonfarm Payrolls (NFP). The US Nonfarm Payrolls (NFP) landed at 528k, significantly higher than the expectations of 250k and the prior release of 372k. Also, the jobless rate slipped to 3.5% from the consensus and the former print of 3.6%.
One fact which is concerning the market participants is the flat Average Hourly earnings data. The economic data has remained unchanged at 5.2%. Well, inflationary pressures are forcing the households to higher payouts for similar quantity purchased and, flat earnings growth at this stage are creating headwinds for them. This may trim consumer confidence dramatically.
This week, the spotlight will remain on the US inflation data. As per the consensus, the inflation rate may shift lower to 8.7% from its prior release of 9.1%. Thanks to the weak oil prices in July, which have managed to bring some exhaustion signals in the inflation data. An occurrence of the same may drag the DXY extensively.
On the Tokyo front, the continuation of an ultra-loose monetary policy by the Bank of Japan (BOJ) will keep haunting the yen bulls. The BOJ is committed to spurting the growth rate and lifting that to the pre-pandemic levels as early as possible. Therefore, it is critical to pump much liquidity into the economy so that the investments could ramp up the wage price index and the inflation will remain above 2%.
Gold price witnessed a dramatic U-turn from monthly highs on Friday. XAU/USD could challenge $1,750, with big Fed rate hike bets back in play, FXStreet’s Dhwani Mehta reports.
July inflation report from the US will be the next significant catalyst
“Attention now turns towards the critical US inflation data due this Wednesday, which could likely cement a 75 bps Fed rate hike next month. The greenback could regain the upside traction amid unnerved markets and aggressive Fed tightening calls.”
“The renewed downside has opened up floors for a retest of the $1,750 psychological barrier. Ahead of that, buyers could challenge the August 3 high of $1,754.”
“Buyers need acceptance above the $1,800 mark to continue with its recovery momentum. The next stop for bulls is seen at the horizontal trendline resistance connecting the July 5 high at $1,812.”
- USD/CAD remains mildly offered while paring the biggest daily gains in three weeks.
- US dollar retreats amid sluggish session, oil prices cheer firmer China trade numbers, easing fears surrounding Taiwan.
- Canada jobs report failed to favor bulls but US NFP propelled hawkish Fed bets.
- US inflation will be important data for the week, risk catalysts may entertain intraday traders.
USD/CAD renews intraday low near 1.2930 as the bulls take a breather after posting the biggest run-up in three weeks heading into Monday’s European session. In doing so, the Loonie pair also justifies the rebound in oil prices, Canada’s main export item.
That said, the WTI crude oil prices pick up bids around $89.00 while extending Friday’s corrective pullback from a six-month low.
The black gold joins the Antipodeans to cheer the US dollar pullback as traders await the key US Consumer Price Index (CPI) data for July, up for publishing this Wednesday.
US Dollar Index (DXY) retreats from a one-week high, down 0.05% around 106.50 by the press time, as traders seek more clues to extend Friday’s heavy run-up. Also exerting downside pressure on the greenback gauge is the receding fears over the US-China tussles over Taiwan.
Recently, Reuters came out with the news suggesting that China is up for ‘regular’ military drills east of the Taiwan Strait median line. That said, the dragon nation’s Foreign Ministry announced on Friday that they will sanction US House of Representative Speaker Nancy Pelosi over the Taiwan visit. On the other hand, Taiwan's Defense Ministry reported 66 Chinese aircraft conducting activities in the Taiwan Strait as of 5 pm local time on Sunday. Further, US Secretary of State Anthony Blinken mentioned that China's provocative actions were a significant escalation.
Elsewhere, the US 10-year Treasury yields ease back to near 2.82% after rallying 14 basis points (bps) to 2.83% the previous day. Further, S&P 500 Futures print mild losses and the Asia-Pacific shares also remain pressured.
It’s worth noting that the USD/CAD rallied on Friday after the US jobs report impressed Fed hawks while the Canadian employment data for July couldn’t justify the Bank of Canada’s (BOC) optimism.
On Friday, a firmer US employment report for July underpinned hawkish Fed bets and recalled the US dollar bulls, allowing the US Dollar Index (DXY) to snap a two-week downtrend. That said, the headline Nonfarm Payrolls (NFP) rose to 528K versus 250K expected and 398K upwardly revised prior. Further, the Unemployment Rate also inched lower to 3.5% compared to 3.6% expected and previous readings.
On the other hand, Canada’s headline Net Change in Employment dropped to -30.6K versus 20K market forecasts and -43.2K previous readout. However, the Unemployment Rate reprinted the 4.9% compared to expectations of rising to 5.0%.
Looking forward, USD/CAD traders should pay attention to the moves of the WTI crude oil, as well as risk catalysts, for fresh impulse amid a light calendar. However, Wednesday’s US inflation data will be important to watch for clear directions.
Technical analysis
Despite the latest pullback, USD/CAD holds onto the previous day’s break of the 21-DMA surrounding 1.2910, the first in three weeks, which in turn keeps buyers hopeful of challenging multiple tops marked since May around 1.3080.
- A test of H&S formation has sidelined the retail participants.
- Declining 20-and 50-EMAs add to the downside filters.
- A drop below 40.00 by the RSI (14) will trigger the downside momentum.
The GBP/USD pair is displaying back and forth moves in a narrow range of 1.2048-1.2080 in the early Tokyo session. The cable has displayed a pullback move after dropping near the psychological support of 1.2000 on Friday. Pound bulls are failing to gain strength and are likely to remain on the tenterhooks.
A test of a Head and Shoulder formation on an hourly scale has kept the investors on the sidelines. Usually, the above-mentioned pattern indicates a bearish reversal after a prolonged positive move in the asset. The neckline of the chart pattern is marked from July 29 low at 1.2063.
The 20-and 50-period Exponential Moving Averages (EMAs) at 1.2090 and 1.2120 respectively are declining sharply, which adds to the downside filters.
Meanwhile, the Relative Strength Index (RSI) (14) is oscillating around 40.00 and may display a sheer downside move on its violation.
A downside move below Monday’s low at 1.2050 will drag the cable towards the psychological support at 1.2000, followed by July 16 low at 1.964.
Alternatively, the pound bulls could regain their mojo and may drive the asset higher towards the August 3 low and high at 1.2135 and 1.2200 after violating the 20-EMA at 1.2090.
GBP/USD hourly chart
-637955338122627481.png)
Analysts at Goldman Sachs note that they stick to their call of a 50 bps rate hike by the Reserve Bank of New Zealand next week, despite a modest easing in the Q3 inflation expectations.
Key quotes
“The RBNZ's survey of inflation expectations for Q322 showed a modest easing in expectations at both the 2-year (-20bp to 3.1%) and 5-year (-10bp to 2.3%) ahead horizons, although near-term expectations remain elevated in level terms.”
“Looking through the volatility, we note that medium- to long-run expectations remain well-anchored around the midpoint of the RBNZ's 1-3% target band, which should provide the RBNZ some relief given concerns around an unanchoring of inflation expectations given high spot inflation.”
We continue to expect the RBNZ to hike by 50bp to 3% at the August meeting."
FX Strategists at UOB Group Lee Sue Ann and Quek Ser Leang expect EUR/USD to remain side-lined within the 1.0100-1.0300 range in the next few weeks.
Key Quotes
24-hour view: “We highlighted last Friday ‘the chance for EUR to break 1.0260 has increased’. However, instead of breaking 1.0260, EUR plunged to 1.0139 during NY session before rebounding to close at 1.0181 (-0.61%). The rapid decline appears to be running ahead of itself and EUR is unlikely to weaken much further. For today, EUR is likely to consolidate and trade between 1.0135 and 1.0205.”
Next 1-3 weeks: “Last Friday (05 Aug, spot at 1.0245), we highlighted that shorter-term upward momentum is beginning to build. We added, ‘EUR has to break 1.0300 before a sustained advance is likely’. EUR did not break 1.0300 as it plummeted to a low of 1.0139. The build-up in momentum fizzled out quickly. Overall, EUR does not appear to be ready to break out of the 1.0100/1.0300 range just yet and it could trade within this range for a while more.”
- USD/CHF takes offers to refresh intraday low, extends pullback from 100-SMA, 200-SMA.
- RSI retreat, sluggish MACD signals also keep sellers hopeful.
- One-week-old ascending trend line challenges bears, short-term bullish channel keeps buyers hopeful.
USD/CHF renews intraday low around 0.9610, keeping the previous day’s pullback from the key SMAs during early Monday morning in Europe.
Given the RSI retreat and the MACD line’s recent struggle, the USD/CHF prices are likely to extend the latest weakness towards the 0.9600 threshold.
However, a convergence of the one-week-old ascending trend channel’s support line and 23.6% Fibonacci retracement of the July 14 to August 02 downturn, close to 0.9570, could challenge the pair bears afterward.
In a case where USD/CHF sellers break the 0.9570 support, the odds of witnessing the fresh monthly low, currently around 0.9470 can’t be ruled out.
Alternatively, the 100-SMA and the 200-SMA limit the short upside moves of the pair respectively around 0.9635 and 0.9650.
During the quote’s run-up beyond 0.9650, the 50% Fibonacci retracement level and the upper line of the stated channel, close to 0.9680 and 0.9700 in that order, will be important to watch for the USD/CHF bulls.
Overall, USD/CHF is likely to consolidate recent gains inside a bullish chart pattern.
USD/CHF: Four-hour chart
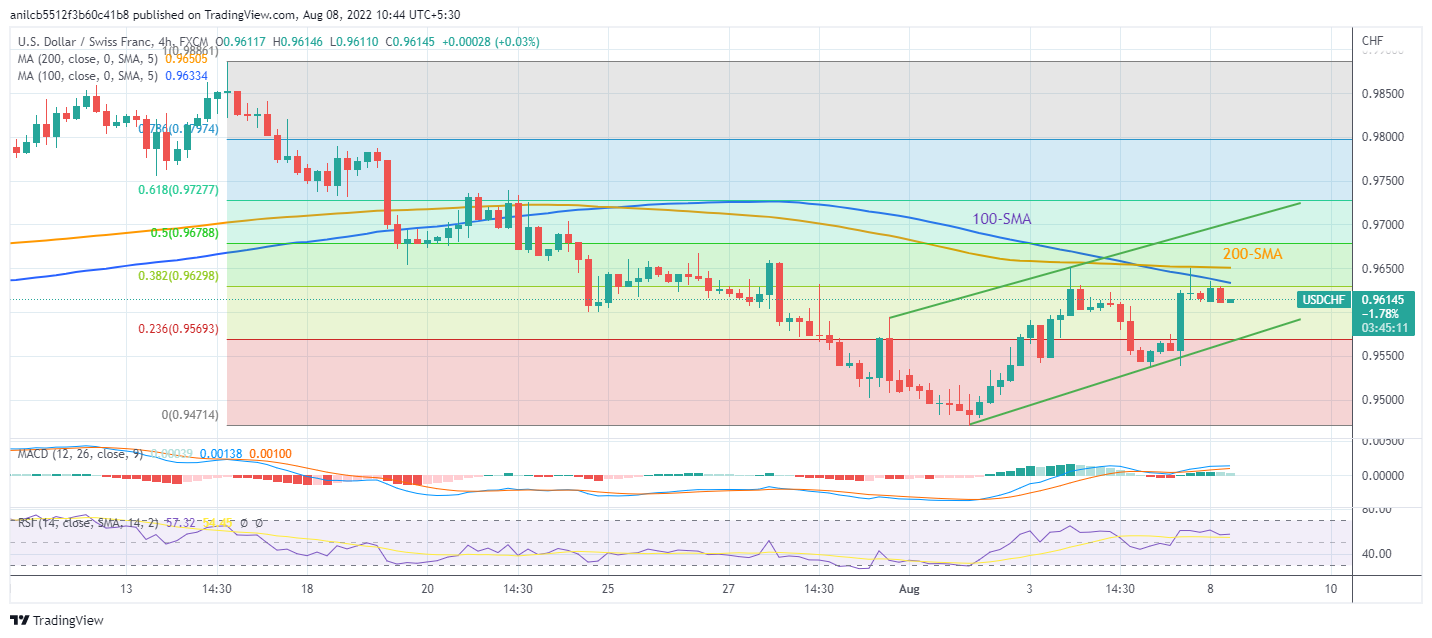
Trend: Limited downside expected
The Eastern Theater Command of China's People's Liberation Army said on social media Weibo that it is continuing drills in the seas and skies around Taiwan on Monday.
The military has carried out an unprecedented set of naval and air force drills in areas near Taiwan following US House Speaker Nancy Pelosi's visit to the island.
more to come ...
- Asian equities are displaying a mixed performance as the DXY turns sideways.
- The DXY may remain on the sidelines ahead of the US Inflation.
- Oil prices are establishing below $90.00 as supply worries have trimmed.
Markets in the Asian domain are displaying a mixed performance as the S&P500 is performing subdued. The US markets remained mixed on Friday after the release of the US Nonfarm Payrolls (NFP). The US Nonfarm Payrolls (NFP) landed at 528k, significantly higher than the expectations of 250k and the prior release of 372k. Investors were expecting that commentary from US corporate players citing a halt in the recruitment process after the US Fed hiked interest rates to squeeze liquidity from the market will make the US economy crippled in employment generation.
At the press time, Japan’s Nikkei225 added 0.19%, China A50 eased 0.40%, Hang Seng tumbled 0.70%, while Nifty50 gained 0.34%.
The US dollar index (DXY) has surrendered its entire gains in the Asian session and has slipped below open. Investors are shifting their focus towards the release of the US Consumer Price Index (CPI), which is due on Wednesday. As per the market consensus, US inflation is seen at 8.7%, lower than the prior release of 9.1%. It is worth noting that this could be an initial sign of exhaustion in the price pressures. This could be a relief for the US households as the higher price rise index was cutting their ‘paychecks’ dramatically.
On the oil front, soaring odds of a recession and a promise of higher oil supplies by the OPEC+ have pushed the oil prices lower. The oil prices have settled below the psychological support of $90.00 and are likely to display losses further.
- EUR/JPY prints five-day uptrend while extending the bounce off the lowest levels since mid-May.
- Softer US dollar, hopes of sustained easy money policies from the Bank of Japan (BOJ) favor pair buyers.
- Moody’s downgrade Italy’s credit outlook, yields pare post-NFP gains amid a sluggish session.
- Downbeat Japan data, weekend numbers from China appeared to have favored bulls as well.
EUR/JPY remains on the front foot for the fifth consecutive day, taking rounds to intraday high surrounding 137.70 of late. In doing so, the cross-currency pair justifies the broad Euro strength despite Italian political fears, as well as ignoring downbeat US Treasury yields.
That said, the Euro appears to cheer the pullback in the US dollar as traders brace for Wednesday’s US Consumer Price Index (CPI) data amid hawkish hopes from the Fed. That said, the greenback rallied on Friday after the US employment report for July propelled the odds of the Fed’s 0.75% rate hike in September.
Elsewhere, political jitters in Italy and Moody’s announcement of cutting Italy’s outlook from “Stable” to “Negative”, while keeping the sovereign rating at Baa3, also should have exerted downside pressure on the EUR/JPY prices.
It should be noted that the US 10-year Treasury yields ease back to near 2.81% after rallying 14 basis points (bps) to 2.83% the previous day, mainly due to the market’s rush for risk safety after the US Nonfarm Payrolls (NFP) propelled hawkish Fed bets.
Additionally likely to favor the EUR/JPY prices is the reduction in Japan’s Trade Balance on BOP Basis for June, down to ¥-1,114B from ¥-760.2B expected and ¥-1,951.2B prior.
Moving on, headlines surrounding Italy and Japan’s Eco Watchers Survey for July could entertain short-term traders.
Technical analysis
EUR/JPY bulls need a clear upside break of the 100-DMA, around the 138.00 mark, to keep the reins. Otherwise, a pullback towards the previous resistance line from July 21 and the 200-DMA, respectively near 135.20 and 133.80, can’t be ruled out.
Analysts at Scotiabank offer a sneak peek at what they expect from Wednesday’s US inflation release.
Key quotes
“The Cleveland Fed’s inflation ‘nowcast’ points toward inflation running a tenth or two beneath 9% y/y and it has been slightly underestimating actual CPI inflation for several months.”
“Further, while some PMIs have been indicating lessening price pressures, small businesses are not.”
“Other drivers are somewhat mixed.”
“Year-ago base effects will shift toward dragging the year-over-year headline and core rates down by about a half percentage point or slightly less in both cases.”
“July is typically a modest month for seasonality.”
“House prices will probably keep owners’ equivalent rent on the hot side.”
“All-grades retail gasoline prices fell by over 7% m/m NSA and about half that in seasonally adjusted terms. Henry hub natural gas prices fell by about 5% m/m NSA but the tiny weight on piped gas of under 1% should mean minimal drag.”
“Used vehicle prices seem to have fallen and are estimated to knock about 0.1% m/m off overall inflation while new vehicle prices seemed to be fairly flat.”
“Food-at-home and food-away-from-home are assumed to combine for another gain of around 1% m/m but pressures may be abating.”
“There is also likely to be an ongoing reopening effect upon prices as pent-up services demand continues to get unleashed.”
- AUD/USD consolidates Friday’s losses around 12-day low, grinds higher around the daily top of late.
- Convergence of 50-SMA, weekly resistance line challenges buyers.
- 200-SMA restricts short-term downside, RSI rebound also keeps buyers hopeful.
AUD/USD picks up bids to refresh intraday high near 0.6930, extending the previous day’s rebound from the 200-SMA during early Monday morning in Europe.
In addition to the U-turn from the key moving average, the recent run-up in the RSI (14) from oversold territory and sluggish MACD also tease the buyers.
However, a confluence of the 50-SMA and one-week-old descending resistance line, around 0.6960 by the press time, challenges AUD/USD bulls.
Following that, a north-run towards the 0.7000 threshold and then to the monthly peak near 0.7050 can’t be ruled out.
On the contrary, a downside break of the 0.6880 support level, comprising the 200-SMA, should recall the AUD/USD sellers.
That said, the 50% Fibonacci retracement of the July-August upside, near 0.6860, could act as an additional filter to the south.
Overall, AUD/USD prices signal further recovery moves. However, bulls await a clear upside break of 0.6960 to retake control.
AUD/USD: Four-hour chart
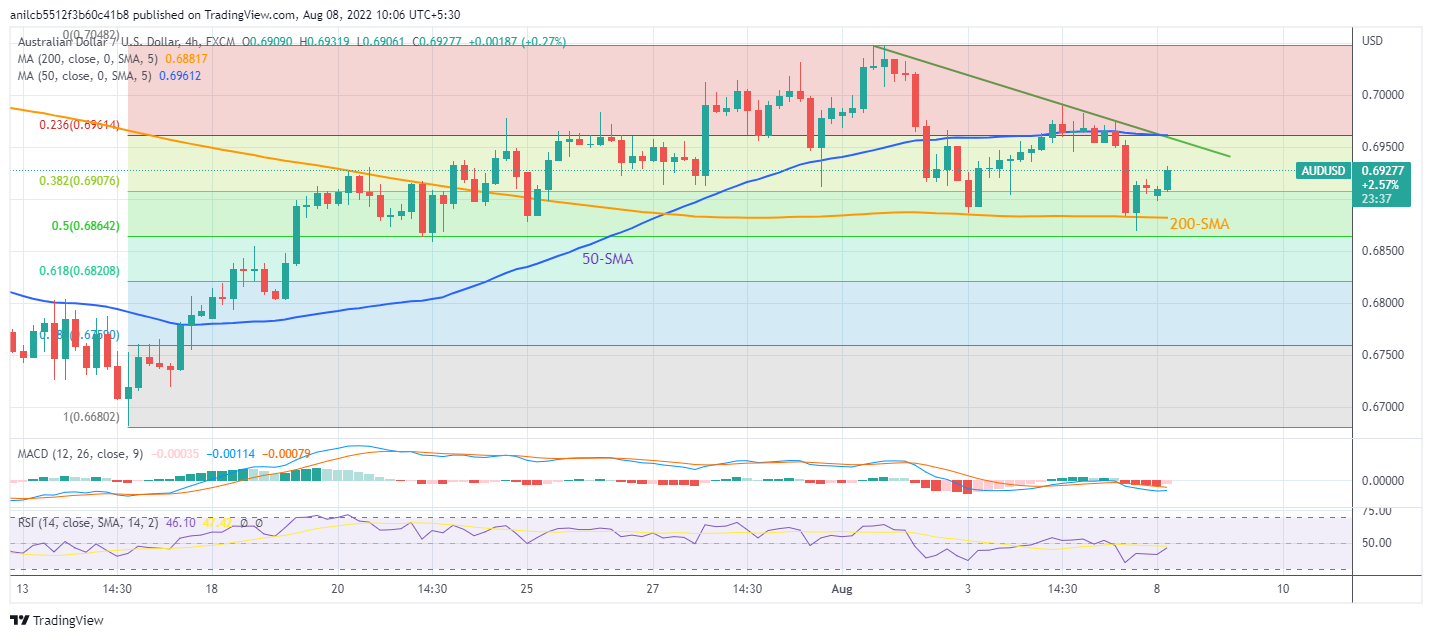
Trend: Further recovery expected
- Gold price is displaying a balanced auction profile above $1,770.00 as investors await US CPI.
- A solid growth rate and upbeat US NFP will delight the Fed.
- Lower oil prices are responsible for lower consensus for the US Inflation rate.
Gold price (XAU/USD) has chartered its territory in a narrow range of $1,771.60-1,776.30 as the US dollar index (DXY) is expecting a bumpy ride after facing barricades around 106.80. The precious metal is in a consolidation territory followed by a sheer downside move after the US Bureau of Labor Statistics reported upbeat US Nonfarm Payrolls (NFP).
The US economy has added 528k jobs in the US labor market, significantly higher than the expectations of 250k and the prior release of 372k. This is going to support the Federal Reserve (Fed) in hiking interest rates unhesitatingly. The growth rate in the US economy is rock solid and now surprisingly higher US NFP despite a halt in the recruitment process by the US corporate will delight Fed policymakers to sound hawkish.
Meanwhile, the US dollar index (DXY) has surrendered its entire intraday gains and has slipped below the opening price. Now, investors are awaiting the release of the US Consumer Price Index (CPI). The annual inflation figure is likely to remain lower at 8.7% against the prior release of 9.1%. Oil prices have remained in a negative trajectory in July, which might be the critical factor for a decent slippage in the price rise index.
Gold technical analysis
On a four-hour scale, the gold price is declining towards the lower portion of the Rising Channel, which is placed from July 21 low at $1,681.87. While the upper portion is plotted from July 22 high at $1,739.37.
The precious metal has defended the 200-period Exponential Moving Average (EMA) at $1,765.80. Also, the bright metal is holding above the 50-EMA at $1,760.00, which signals the strength of the gold prices.
While, the Relative Strength Index (RSI) (14) has shifted into the 40.00-60.00 range, which indicates that the gold bulls are not holding a bullish momentum for a while.
Gold four-hour chart
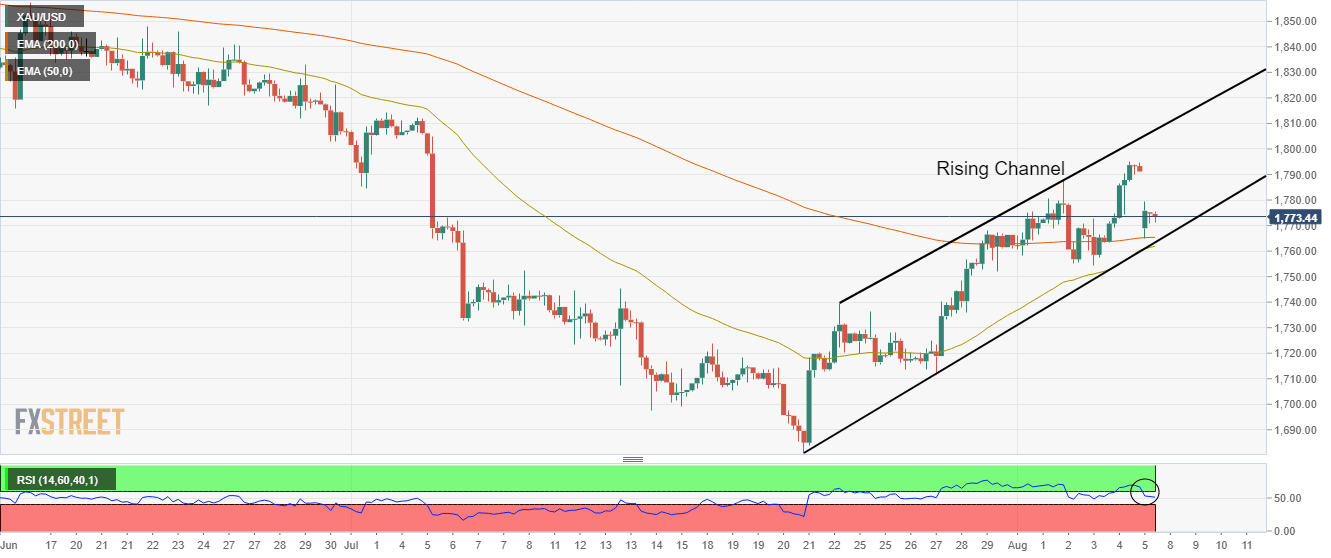
- USD/INR takes the bids to print four-day uptrend, renews daily high of late.
- Fed rate futures signal 73% chances of 0.75% rate hike in September after upbeat US jobs report for May.
- Recovery in oil prices test pair sellers cheering hawkish RBI moves.
- US CPI on Wednesday, India CPI on Friday will be crucial for short-term directions.
USD/INR prints a four-day uptrend around 79.48 as the US dollar cheers hawkish Fed bets during early Monday morning in Europe. Also underpinning the Indian rupee (INR) pair’s run-up is the recently firmer oil prices and the market’s fears that the Reserve Bank of India’s (RBI) rate hike appears less impactful.
WTI crude oil prices extend the previous day’s rebound from a six-month low towards $89.00 heading into Monday’s European session. The black gold’s latest rebound could be linked to the firmer China trade numbers.
China’s trade numbers for June marked upbeat results with the Exports rising the most in the year. That said, the headline Trade Balance rose to $101.26B versus $90B forecasts and $97.94B. Further details suggest that Exports increased by 18% compared to 15% expected and 17.9% prior whereas the Imports eased to 2.3% compared to 3.7% expected and 1.0% prior.
Elsewhere, the interest rate futures hint at the 73% chance of the Fed’s 75 basis points (bps) rate hike in September. The odds of the Fed’s aggression jumped after the strong US jobs report for July. That said, the headline Nonfarm Payrolls (NFP) rose to 528K versus 250K expected and 398K upwardly revised prior. Further, the Unemployment Rate also inched lower to 3.5% compared to 3.6% expected and previous readings.
Following the data, San Francisco Fed President Mary Daly said during the weekend that the Fed is far from done in combating inflation. The policymaker also added, “50 bps increase is definitely in play. We need to keep an open mind.” On the same line was Fed Governor Michelle Bowman who said, “Fed should consider more 75 basis-point interest rate hikes at coming meetings in order to bring high inflation back down to the central bank's goal.”
It should be noted that the RBI’s 0.50% rate hike couldn’t impress the INR bulls amid broad fears of inflation and recession, especially tied to Asia amid the US-China tussles over Taiwan. Reuters came out with the news suggesting that China is up for ‘regular’ military drills east of the Taiwan Strait median line. That said, the dragon nation’s Foreign Ministry announced on Friday that they will sanction US House of Representative Speaker Nancy Pelosi over the Taiwan visit. On the other hand, Taiwan's Defense Ministry reported 66 Chinese aircraft conducting activities in the Taiwan Strait as of 5 pm local time on Sunday. Further, US Secretary of State Anthony Blinken mentioned that China's provocative actions were a significant escalation.
Looking forward, the monthly inflation numbers from the US and India will be crucial for the USD/INR buyers amid hopes of witnessing the 80.00 psychological magnet back to the chart.
Technical analysis
A daily closing beyond the three-week-old descending resistance line, around 79.60, appears necessary for the USD/INR buyers to keep reins. Until then, the odds of witnessing a pullback towards the 50-DMA support near 78.80 can’t be ruled out.
- EUR/USD consolidates the first weekly loss in three, retreats from intraday high of late.
- Moody’s cut Italy’s credit rating amid political jitters, US NFP propelled hawkish Fed bets.
- US-China tension over Taiwan also underpins the US dollar’s safe-haven demand.
- Intraday traders should focus on risk catalysts amid a light calendar.
EUR/USD treads water after the recently downbeat performance as bears struggle to justify their strength amid a sluggish start to the key week. That said, the major currency pair seesaw around 1.0180-85 during early Monday morning in Europe.
The quote’s latest inaction could be linked to the absence of major data, as well as anxiety ahead of the key US Consumer Price Index (CPI) for July. However, hawkish bias over the US Federal Reserve’s (Fed) next move and pessimism surrounding the Eurozone keep the EUR/USD bears hopeful.
The US employment report for July and the Sino-American tension over Taiwan gain major attention when it comes to the strongly bullish catalyst for the US dollar. The headline Nonfarm Payrolls (NFP) rose to 528K versus 250K expected and 398K upwardly revised prior. Further, the Unemployment Rate also inched lower to 3.5% compared to 3.6% expected and previous readings. Following the data, San Francisco Fed President Mary Daly said during the weekend that the Fed is far from done in combating inflation. The policymaker also added, “50 bps increase is definitely in play. We need to keep an open mind.”
On the other hand, Reuters came out with the news suggesting that China is up for ‘regular’ military drills east of the Taiwan Strait median line. That said, the dragon nation’s Foreign Ministry announced on Friday that they will sanction US House of Representative Speaker Nancy Pelosi over the Taiwan visit. On the other hand, Taiwan's Defense Ministry reported 66 Chinese aircraft conducting activities in the Taiwan Strait as of 5 pm local time on Sunday. Further, US Secretary of State Anthony Blinken mentioned that China's provocative actions were a significant escalation.
It should be noted that political jitters in Italy and Moody’s announcement of cutting Italy’s outlook from “Stable” to “Negative”, while keeping the sovereign rating at Baa3, also exert downside pressure on the EUR/USD prices.
Amid these plays, the US 10-year Treasury yields ease back to near 2.82% after rallying 14 basis points (bps) to 2.83% the previous day. Further, S&P 500 Futures print mild losses and the Asia-Pacific shares also remain pressured.
Looking forward, a light calendar for the may restrict short-term EUR/USD moves ahead of the key US inflation data, up for publishing on Wednesday. Also important will be how the Italian politicians will be able to manage the national politics ahead of the September elections.
Technical analysis
Although the 20-DMA restricts short-term EUR/USD downside near 1.1665, the RSI (14) and the MACD signals suggest that the buyers are running out of steam.
- A lower print of RBNZ inflation expectations at 3.07% vs. 3.29% has brought a sell-off.
- The kiwi bulls are attempting an establishment above 50% Fibo retracement.
- Momentum oscillators RSI (14) has shifted into the bullish range of 60.00-80.00.
The NZD/JPY pair surpassed the immediate hurdle of 84.62 in the Asian session but has slipped back inside the wood on a surprisingly downward shift in Reserve Bank of New Zealand (RBNZ) inflation expectations. The economic data has released at 3.07%, lower than the prior release of 3.29%. The cross has displayed a bullish open-drive session in which the asset initiates moving upside right from the first tick of the session. On a broader note, the asset has given an upside break of the consolidation formed in an 83.50-84.07 range.
On an hourly scale, the asset crossed the downward-sloping trendline placed from July 20 high at 86.60 but has slipped lower again. Also, the cross if finding cushion around 50% Fibonacci retracement (which is placed from July 20 high at 86.60 to Aug 2 low at 82.14) at 84.32.
The asset has crossed the 50-and 200-period Exponential Moving Averages (EMAs) at 84.00 and 84.11 respectively. It is worth noting that the 200-EMA is auctioning higher than the 50-EMA, which indicates that the buying interest is extremely strong.
Also, the Relative Strength Index (RSI) (14) has shifted into the 60.00-80.00 range, which adds to the upside filters.
A beak above Monday’s high at 84.72 will drive the asset towards 61.8% Fibo at 84.90, followed by July 27 high at 85.65.
On the flip side, the yen bulls could gain strength if the cross drops below 50-EMA at 84.00. An occurrence of the same will drag the asset towards Thursday’s low and 23.65 Fibo at 83.46 and 83.19 respectively.
NZD/JPY hourly chart
-637955263786185261.png)
- AUD/NZD takes the bids to refresh intraday high after RBNZ Q3 Inflation Expectations.
- RBNZ Q3 Inflation Expectations eased to 3.07% versus 3.29% prior.
- Upside break of 200-HMA, upbeat oscillators also favor buyers.
- Nearby support confluence around 1.1065 restricts immediate downside.
AUD/NZD remains on the front foot, extending Friday’s upside break of the one-week-old descending trend line, after softer inflation expectations data from the Reserve Bank of New Zealand (RBNZ) during early Monday in Europe.
That said, the Q3 RBNZ Inflation Expectations dropped below 3.29% prior to 3.07%, which in turn joins recently mixed data from New Zealand to weaken the New Zealand dollar (NZD) after the release.
Following the data, AUD/NZD pokes the 200-HMA, around 1.1090 while extending the previous day’s upside break of the key resistance line, now support near 1.1065.
Additionally favoring the AUD/NZD bulls are the firmer RSI and bullish MACD signals, not to forget a two-day-old support line near 1.1065.
With this, the quote is ready to cross the 1.100 threshold, which in turn could please buyers while directing them towards the monthly high near 1.1125.
Alternatively, pullback remains elusive until the quote stays beyond 1.1065, a break of which could direct the AUD/NZD sellers towards the previous weekly low around the 1.10000 psychological magnet.
AUD/NZD: Hourly chart
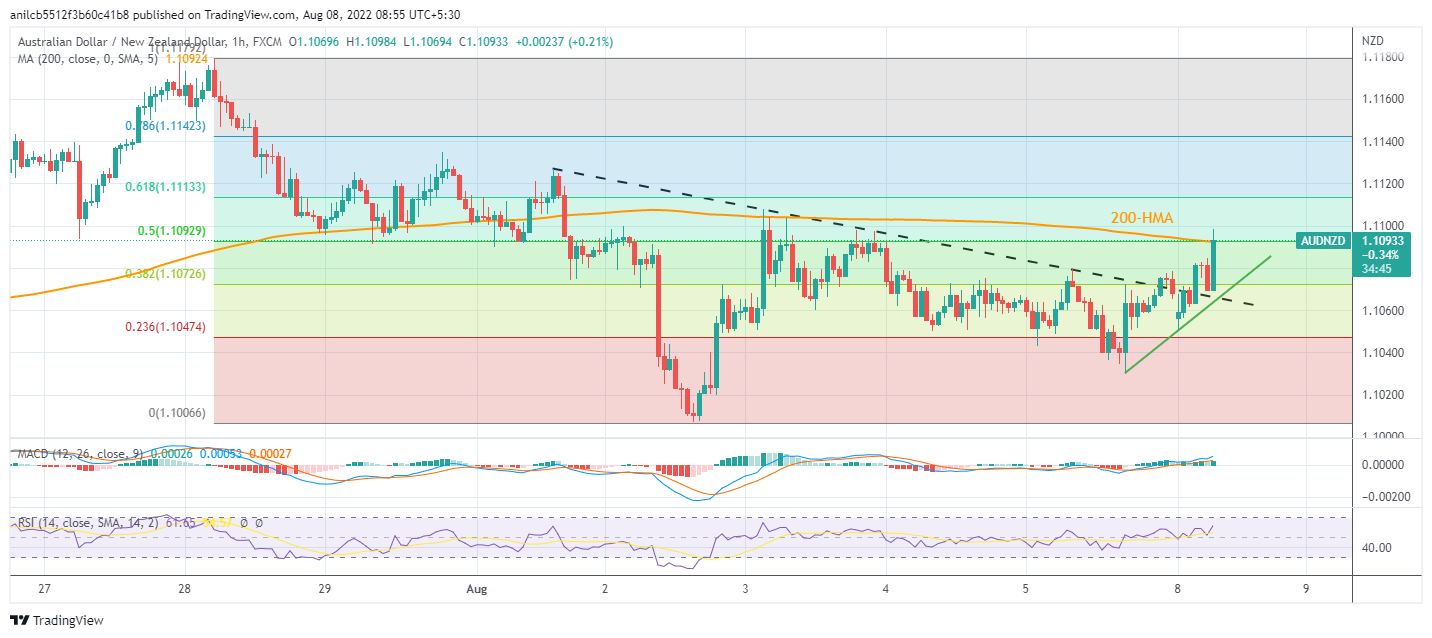
Trend: Further upside expected
- NZD/USD has declined to near 0.6240 on lower RBNZ inflation expectations.
- The RBNZ inflation expectations have declined to 3.07% vs. 3.29% reported earlier.
- This week, the US Inflation data holds significant importance.
The NZD/USD pair has faced selling pressure while attempting a break above the immediate hurdle of 0.6260. The asset has witnessed offers after the Reserve Bank of New Zealand (RBNZ) reported the inflation expectations at 3.07%, lower than the prior release of 3.29%. It could be a sign of exhaustion in the price pressures but more warrants for the claim are still desired.
For now, price pressures are already soaring in the NZ economy and have not displayed any exhaustion sign yet. As per the June print, an inflation rate of 7.3% is sufficient to create headwinds for the households. To combat the same the RBNZ is continuously accelerating its policy tightening measures. RBNZ Adrian Orr has already elevated its Official Cash Rate (OCR) by 2.50%.
On the US dollar front, the US dollar index (DXY) has surrendered its entire intraday gains and is auctioning near the day’s open at 106.60. The DXY has faced selling pressure while attempting a break above the critical resistance of 106.80. This week, investors are focused on the release of the US Consumer Price Index (CPI), which will release on Wednesday.
The annual inflation figure is likely to remain lower at 8.7% against the prior release of 9.1%. Oil prices have remained in a negative trajectory in July, which might be the critical factor for a decent slippage in the price rise index. While the US CPI that doesn’t include volatile food and oil prices may improve to 6.1% from the prior print of 5.9%.
- The daily chart's W-formation is a bearish feature.
- The hourly chart's price action is coiling for a breakout.
USD/CAD burst through an hourly trendline resistance on Friday and is now consolidating in a phase of price discovery. The following illustrates the market structure and prospects of a deeper retracement for the coming sessions:
As illustrated, the price has burst through the trendline resistance and the price is coiling between support and resistance. A break to the downside opens the probability of a move into the area of price imbalance. 1.2880 is a potentially key structure that if broken may give way to a deeper correction towards 1.2820 and 1.2770. On the other hand, considering the price has already corrected 61.8% of the impulse, should the bulls commit, an upside breakout and extension could be around the corner.
USD/CAD daily chart
The daily chart's W-formation is a bearish feature with price anticipated to correct the daily bullish impulse towards the neckline.
New Zealand's (NZ) inflation expectations ease across the time curve in the third quarter of 2022, the latest monetary conditions survey conducted by the Reserve Bank of New Zealand (RBNZ) showed on Monday.
Two-year inflation expectations, seen as the time frame when RBNZ policy action will filter through to prices, came in a tad lower at 3.07% from 3.29% previous.
NZ Q3 average one-year inflation expectations ticked down to 4.86% vs. 4.88% seen in the second quarter.
Kiwi shrugs off inflation data
The easing in NZ inflation expectations clipped the wings of kiwi, as NZD/USD slipped from daily highs of 0.6259.
At the time of writing, the kiwi is trading at 0.6247, still up 0.31% on the day. The inflation expectations data douse chances of a hawkish RBNZ rate hike.
In an appearance before the Kansas Bankers Association, on Saturday, US Federal Reserve (Fed) Governor Michelle Bowman said that she strongly supports super-sized rate increases to fight inflation, per Wall Street Journal (WSJ).
Key quotes
“Strongly supported the Fed’s 0.75-percentage-point rate increase last month” and “similarly-sized increases should be on the table until we see inflation declining in a consistent, meaningful and lasting way.”
“Expect the labor market to remain strong,” adding that the “current outlook sees economic growth picking up during the second half of the year.”
“Our primary challenge is to get inflation under control.”
The recent inflation figure is “concerningly high.”
“Few, if any, concrete indications” that support the expected inflation has peaked.
“I will need to see unambiguous evidence of this decline before I incorporate an easing of inflation pressures into my outlook.”
Market reaction
At the time of writing, the US dollar index is off the weekly highs, consolidating around 106.60 before the next push higher.
| Raw materials | Closed | Change, % |
|---|---|---|
| Silver | 19.895 | -1.51 |
| Gold | 1775.29 | -0.86 |
| Palladium | 2115.33 | 2.98 |
Analysts at Goldman Sachs stick to their view of a 50 basis points September rate hike by the Fed, despite Friday’s strong US Nonfarm Payrolls and wage growth data.
Key quotes
“The overall message is that wage growth is going sideways at a rate that is probably a couple of percentage points stronger than what would be compatible with achieving 2 per cent inflation”
“The Fed has even further to go than we thought before today.”
“Maintain projection for a 50bp rate hike at the September 20-21 FOMC.”
- USD/JPY pares intraday gains around one-week high as bulls take a breather after the biggest daily jump in seven weeks.
- Yields retreat from fortnight high as traders prepare for Wednesday’s US CPI.
- US NFP propelled hawkish Fed bets and favored USD bulls, Taiwan concerns also underpin greenback’s safe-haven demand.
- Japan’s trade deficit widened in June, Eco Watchers Survey eyed.
USD/JPY seesaws around 135.30 as buyers find less acceptance around a one-week high during Monday’s Asian session. The yen pair’s latest inaction could be linked to the cautious mood ahead of the key US inflation data, as well as mixed Japanese statistics and fears surrounding the US-China tension over Taiwan. Above all, the retreat in the US Treasury yields seems to challenge the pair buyers of late.
That said, the US 10-year Treasury yields ease back to near 2.82% after rallying 14 basis points (bps) to 2.83% the previous day. Also important to note is a reduction in Japan’s Trade Balance on BOP Basis for June, down to ¥-1,114B from ¥-760.2B expected and ¥-1,951.2B prior.
The US bond coupons took clues from the strong US employment data to portray the hawkish Fed bets and propel the USD/JPY prices on Friday. The headline Nonfarm Payrolls (NFP) rose to 528K versus 250K expected and 398K upwardly revised prior. Further, the Unemployment Rate also inched lower to 3.5% compared to 3.6% expected and previous readings.
It’s worth noting that Wall Street benchmarks closed negative and also helped to renew the US dollar strength, due to the greenback’s safe-haven nature.
Other than the NFP-inspired US dollar strength, the Sino-American tension also seemed to have propelled the USD/JPY the previous day. Reuters came out with the news suggesting that China is up for ‘regular’ military drills east of the Taiwan Strait median line. That said, the dragon nation’s Foreign Ministry announced on Friday that they will sanction US House of Representative Speaker Nancy Pelosi over the Taiwan visit. On the other hand, Taiwan's Defense Ministry reported 66 Chinese aircraft conducting activities in the Taiwan Strait as of 5 pm local time on Sunday. Further, US Secretary of State Anthony Blinken mentioned that China's provocative actions were a significant escalation.
Amid these plays, S&P 500 Futures print mild losses and the Asia-Pacific shares also remain pressured.
Looking forward, US Consumer Price Index (CPI) for July is the key data to watch for this week, especially after the recent strong US employment numbers. For intraday moves, Japan’s Eco Watchers Survey for July and risk catalysts may entertain the momentum traders.
Technical analysis
Despite the latest pullback, USD/JPY holds onto Friday’s breakout of the 50-DMA and a downward sloping trend line from July 21, respectively around 135.00 and 134.60. However, the upside momentum needs validation from the 21-DMA hurdle surrounding 136.00.
- AUD/NZD perks up ahead of key NZ data event.
- The RBNZ inflation expectations survey for the third quarter is eyed.
AUD/NZD is a touch higher on the day, moving from a low of 1.1050 to a high of 1.1082 so far. The US dollar is under pressure in a correction of some of Friday's rally following the US Nonfarm Payrolls blockbuster report.
RBNZ inflation expectations in focus
Meanwhile, today's main event for the antipodeans will be the Reserve Bank of New Zealand’s inflation expectations survey for the third quarter. This is not expected to rise materially, according to analysts at Westpac, but it will likely remain at an elevated level. The 2-year expectation was 3.29% in Q2.
On a separate note, the analysts explained that the RBNZ’s latest survey of inflation expectations came hot on the heels of the 32-year high in inflation that was reached in the June quarter. ''With that in mind, we expect the August survey will show that expectations for inflation over the coming year remain elevated.''
''The bigger focus for the RBNZ will be on expectations at longer horizons (2 or more years ahead). If expectations at those horizons push higher, that would stoke concerns about more enduring inflation and wage pressures, and that would reinforce the case for further rate hikes,'' the analysts said. ''However, we think that recent developments actually point towards expectations remaining fairly steady. While still elevated, inflation looks to have peaked and prices for petrol are now falling. In addition, the OCR is now pushing into tight territory and the global economy is softening.''
RBA cash rate peak seen near 3.35%
Meanwhile, turning to the Reserve Bank of Australia, traders are expecting the central bank to put through another 50bp rate hike which will be the third 50bp move in three months and the fourth hike since April, the analysts have noted. The Bank's cash rate assumption is for a year-end 2022 target rate of 3% and the RBA assumes another 115bps of hikes over the next 4 meetings. That means RBA is placing some chance of delivering a 50bps hike and 3x25bps hikes for a total of 125bps in hikes by year-end. This would take the year-end 2022 cash rate to 3.10%. The exchange rate is assumed to be stable. The WIRP suggests a 25 bp hike on September 6 is fully priced in, with around 45% odds of a larger 50 bp move. The swaps market, nevertheless, sees 150 bp of tightening over the next 12 months which would see the cash rate peak near 3.35%.
AUD/USD picks up bids to refresh intraday high around 0.6920 during the mid-Asian session on Monday. The Aussie pair’s latest gains could be linked to the options market optimism, despite hawkish Fed bets and the Sino-American tension.
That said, the one-month risk reversal (RR) of the AUD/USD rose for the third consecutive day on Friday, to 0.055 at the latest, per the daily print. Even so, the weekly RR appeared to drop for the first time in three weeks.
It’s worth noting that the RR is the difference between the bullish bets (call options) and the bearish bets (put options).
The options market players might have been preparing for Wednesday’s US Consumer Price Index (CPI) data after witnessing a recent jump in the US Nonfarm Payrolls (NFP). Also likely to have favored the AUD/USD buyers could be the weekend release of China’s trade numbers for July.
Even so, the risk-off mood and the ongoing US-China tussles over Taiwan challenge the Aussie pair buyers during the sluggish start to the key week.
Also read: AUD/USD: Corrective pullback fades around 0.6900, Taiwan, US inflation in focus
- USD/CNH retreats from intraday as bulls take a breather after snapping three-day downtrend on Friday.
- MACD, RSI suggests continuation of slower grind to the north.
- One-month-old ascending trend line adds to the downside filters.
- Bulls need successful break of 78.6% Fibonacci retracement level to keep reins.
USD/CNH struggles to extend the previous day’s gains as it steps back from its intraday high to 6.7660 as markets in China open for Monday’s trading.
Even so, the offshore Chinese yuan (CNH) pair holds onto the latest rebound from the 21-DMA, which in turn keeps the buyers hopeful. Also favoring the bullish bias is the steady RSI and an absence of major bearish MACD.
That said, the quote remains on the way to the 78.6% Fibonacci retracement of the May-June downturn surrounding 6.7900. However, the USD/CNH upside beyond the same could refresh the yearly high marked in May, currently around 6.8375.
It should be noted that the 6.8000 round figure may also challenge the USD/CNH bulls.
Alternatively, a downside break of the 21-DMA level surrounding 6.7550 could direct the pair sellers towards the monthly support line close to 6.7470.
In a case where USD/CNH drops below 6.7470 support, it becomes vulnerable to testing the late July lows near 6.7280.
USD/CNH: Daily chart
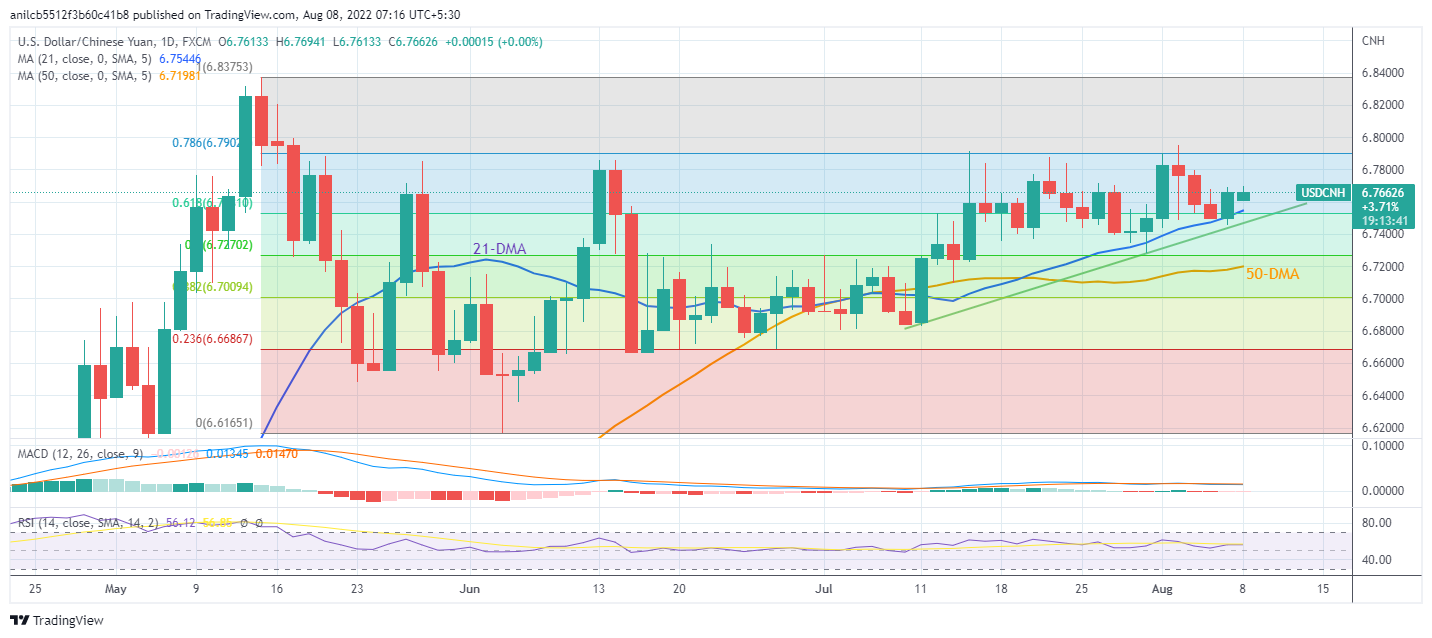
Trend: Further upside expected
In recent trade today, the People’s Bank of China (PBOC) set the yuan (CNY) at 6.7695 vs. the last close of 6.763.
About the fix
China maintains strict control of the yuan’s rate on the mainland.
The onshore yuan (CNY) differs from the offshore one (CNH) in trading restrictions, this last one is not as tightly controlled.
Each morning, the People’s Bank of China (PBOC) sets a so-called daily midpoint fix, based on the yuan’s previous day's closing level and quotations taken from the inter-bank dealer.
- Market sentiment dwindles amid fears of Fed’s aggression, Sino-America tussles.
- S&P 500 Futures extend Friday’s pullback from two-month high, mildly offered of late.
- US 10-year Treasury yields fade recovery amid the market’s indecision.
- US employment data renewed hawkish Fed bets the previous day.
Risk profile deteriorates during Monday’s Asian session, extending Friday’s sour sentiment, as traders await the US Consumer Price Index (CPI) data for July. In addition to the anxiety ahead of the key data, fears surrounding the Fed’s aggression and the US-China tussles over Taiwan also contribute to the risk-off mood.
That said, the S&P 500 Futures drop 0.20% intraday while extending the previous day’s pullback from the two-month high to around 4,138. Further, the US 10-year Treasury yields ease back to near 2.82%. It’s worth noting that Wall Street benchmarks closed negative and the US 10-year Treasury yields rallied to 2.83%, up 14 basis points (bps), to renew the US dollar strength.
Among the major catalysts, the US employment report for July and the Sino-American tension over Taiwan gain major attention. A strong US employment report for July underpinned hawkish Fed bets and recalled the US dollar bulls the previous day. That said, the headline Nonfarm Payrolls (NFP) rose to 528K versus 250K expected and 398K upwardly revised prior. Further, the Unemployment Rate also inched lower to 3.5% compared to 3.6% expected and previous readings.
Following the data, San Francisco Fed President Mary Daly said during the weekend that the Fed is far from done in combating inflation. The policymaker also added, “50 bps increase is definitely in play. We need to keep an open mind.”
Elsewhere, Reuters came out with the news suggesting that China is up for ‘regular’ military drills east of the Taiwan Strait median line. That said, the dragon nation’s Foreign Ministry announced on Friday that they will sanction US House of Representative Speaker Nancy Pelosi over the Taiwan visit. On the other hand, Taiwan's Defense Ministry reported 66 Chinese aircraft conducting activities in the Taiwan Strait as of 5 pm local time on Sunday. Further, US Secretary of State Anthony Blinken mentioned that China's provocative actions were a significant escalation.
Alternatively, firmer trade numbers from China should have challenged the pessimists during the sluggish week-start. The headline Trade Balance rose to $101.26B versus $90B forecasts and $97.94B. Further details suggest that Exports increased by 18% compared to 15% expected and 17.9% prior whereas the Imports eased to 2.3% compared to 3.7% expected and 1.0% prior.
Looking forward, a light calendar keeps the traders’ focus on the risk catalysts for fresh impulse ahead of the key US inflation data, up for publishing on Wednesday.
- USD/CAD remains firmer after refreshing three-week high the previous day.
- RSI, MACD also favor recovery from 200-SMA, horizontal resistance line from July 19 tests bulls.
- Weekly support line, 61.8% Fibonacci retracement level challenge bears.
USD/CAD bull keep reins around 1.2950 as the quote extend the previous day’s bounce off 200-SMA to Monday’s Asian session.
The Loonie pair’s recent rebound also takes clues from the firmer RSI, not overbought, as well as the MACD signals, which in turn keep buyers hopeful.
However, tops marked on July 19 and also on Friday, around 1.2985, appear to challenge the USD/CAD bulls.
Following that, a horizontal area comprising multiple levels marked since June 17, near 1.3080, will be important to watch for further upside moves. Also, the 1.3000 psychological magnet may act as an intermediate halt during the anticipated north-run.
Meanwhile, pullback moves remain elusive beyond the 200-SMA level of 1.2920.
Even so, an upward sloping support line from August 01, close to 1.2845 by the press time, could challenge the USD/CAD bears.
It’s worth noting that the recent swing low around the 61.8% Fibonacci retracement of June 08 to July 14 upside, near 1.2790, appears the last defense of USD/CAD bulls.
USD/CAD: Four-hour chart

Trend: Further upside expected
- GBP/USD aims for a downside establishment after the upbeat US NFP.
- Despite a lower consensus for US inflation, Fed’s hawkish stance will remain intact.
- The UK is expected to display a subdued performance this week.
The GBP/USD pair has declined gradually towards the immediate support of 1.2050 but is likely to extend losses after violating the immediate support. The cable is expected to reclaim its weekly lows near 1.2000 as the US dollar index (DXY) is expected to display a stellar performance ahead after the upbeat US Nonfarm Payrolls (NFP).
The US Nonfarm Payrolls (NFP) landed at 528k, significantly higher than the expectations of 250k and the prior release of 372k. Investors were expecting that commentary from US corporate players citing a halt in the recruitment process after the Fed hiked interest rates to squeeze liquidity from the market will make the US economy crippled in employment generation.
The US economy is seeing soaring price pressures and a solid labor market has always been a major supporting factor in announcing policy tightening measures. Now, the continuous upbeat performance from the US labor market will support Fed chair Jerome Powell to announce rate hikes unhesitatingly. Also, the Unemployment Rate has trimmed to 3.5% against expectations and the former print of 3.6%.
This week, the US Inflation data and UK’s GDP numbers will be of key importance. Lower oil prices in July after displayed an exhaustion sign in the US price pressures. The US inflation is likely to slip lower to 8.7% from the prior release of 9.1% on an annual basis. However, the core inflation that doesn’t inculcate oil and food prices may improve to 6.1%.
On the UK front, the UK Gross Domestic Product GDP) data will be of utmost importance. As per the market consensus, the economic data is expected to shift downward to 2.8% from the prior release of 8.7 on an annual basis for the second quarter of CY2022.
- EUR/USD is pressured towards key weekly support.
- The bears are eyeing a downside weekly extension.
The EUR/USD price on the weekly chart has corrected to a 50% mean reversion of the prior weekly sell-off. Last week's sell-off could be the start of the bearish extension
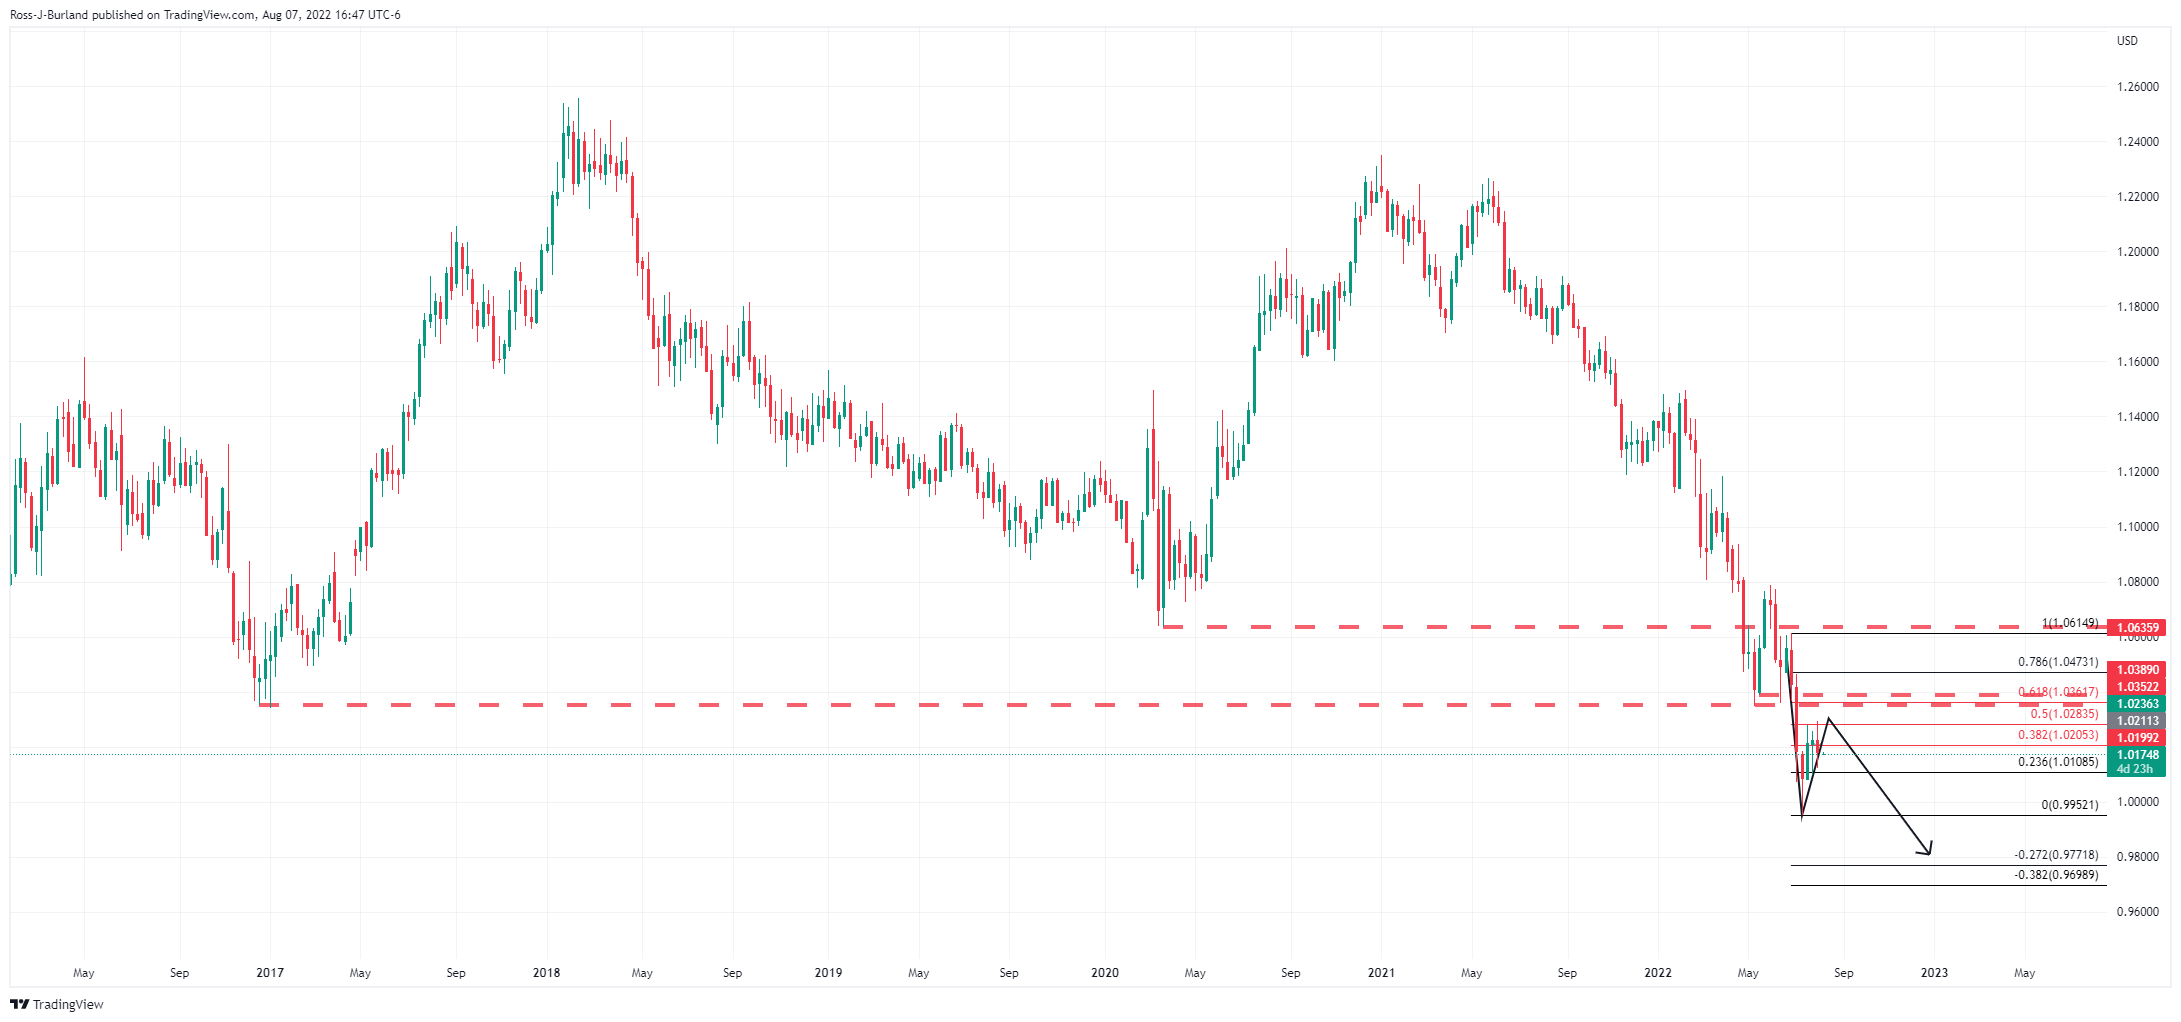
A break of 1.00965 will be important:
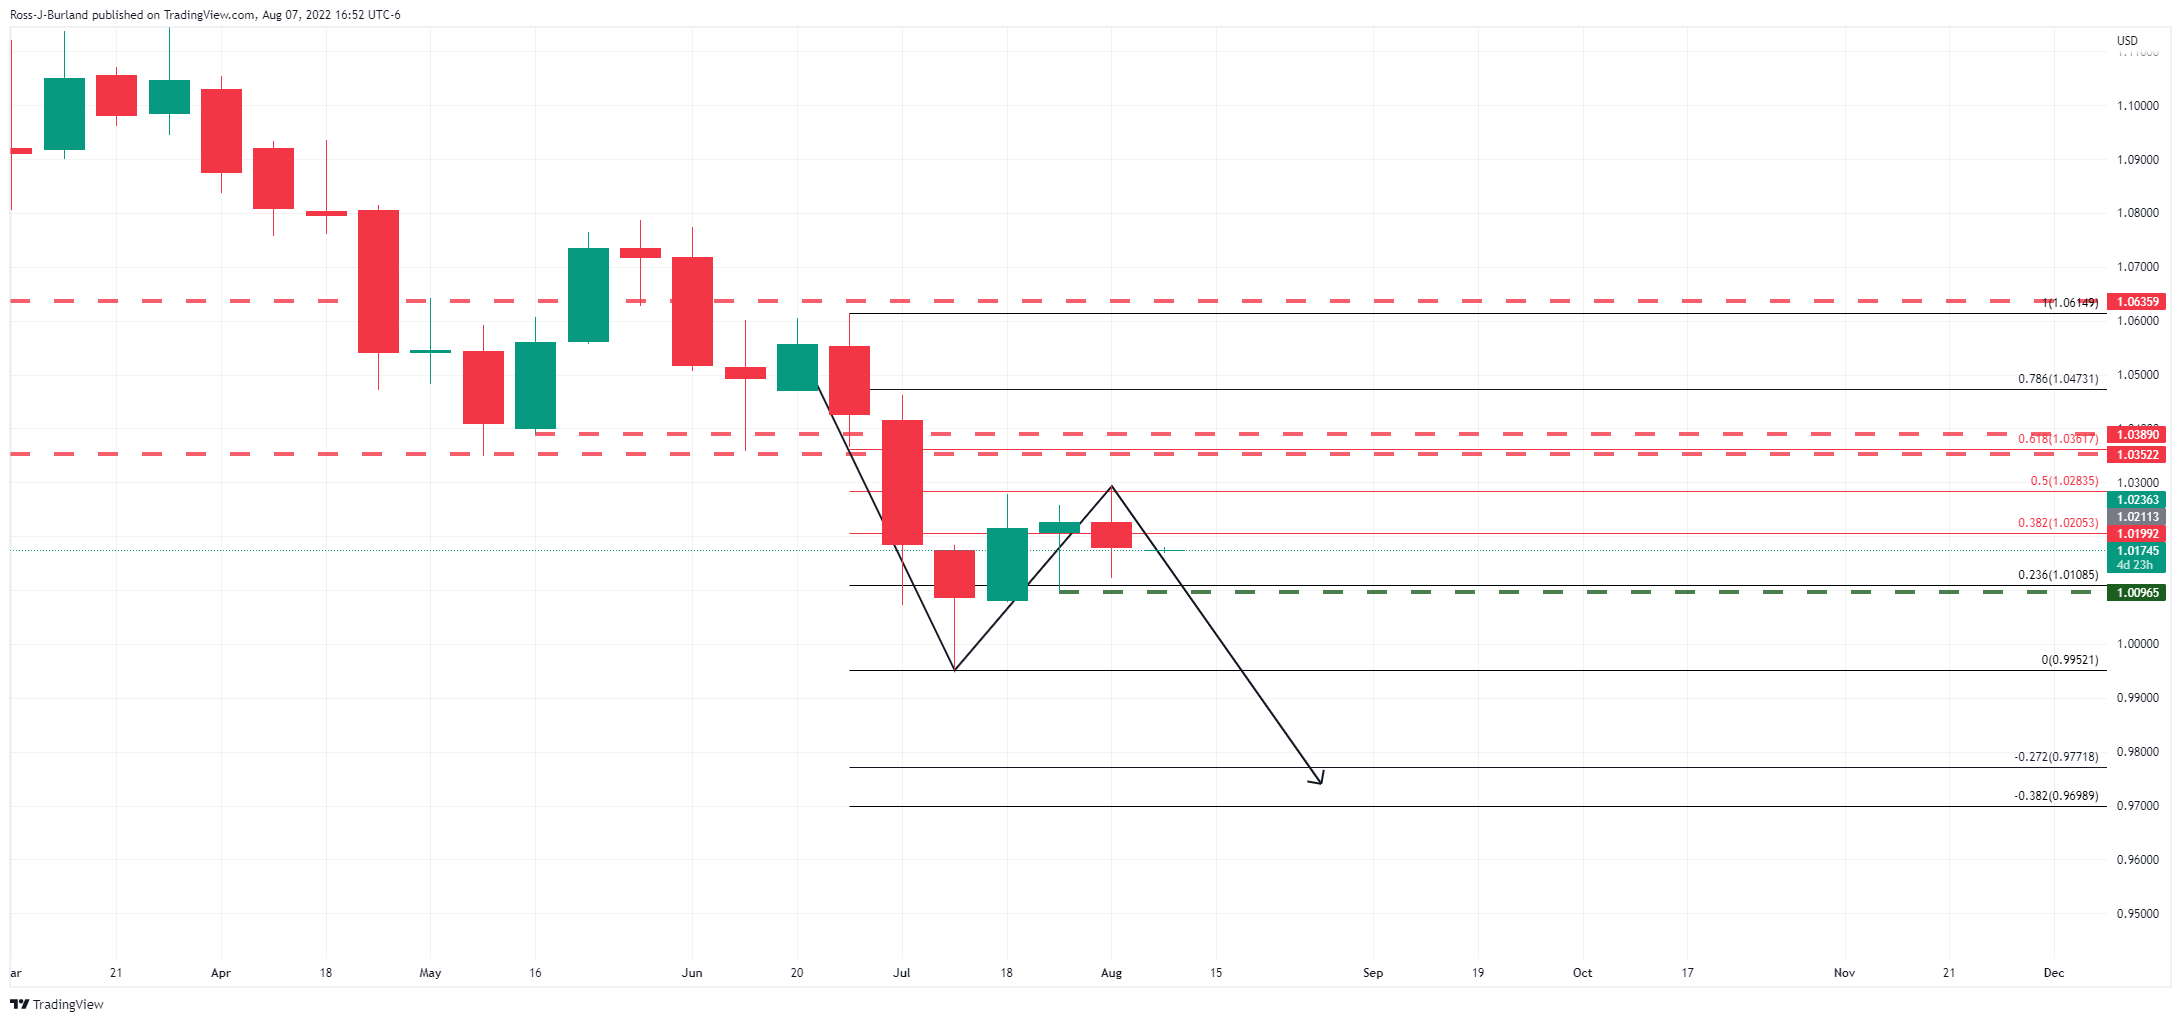
EUR/USD, daily chart
On the daily chart, the price has left behind a failed inverse head and shoulders:
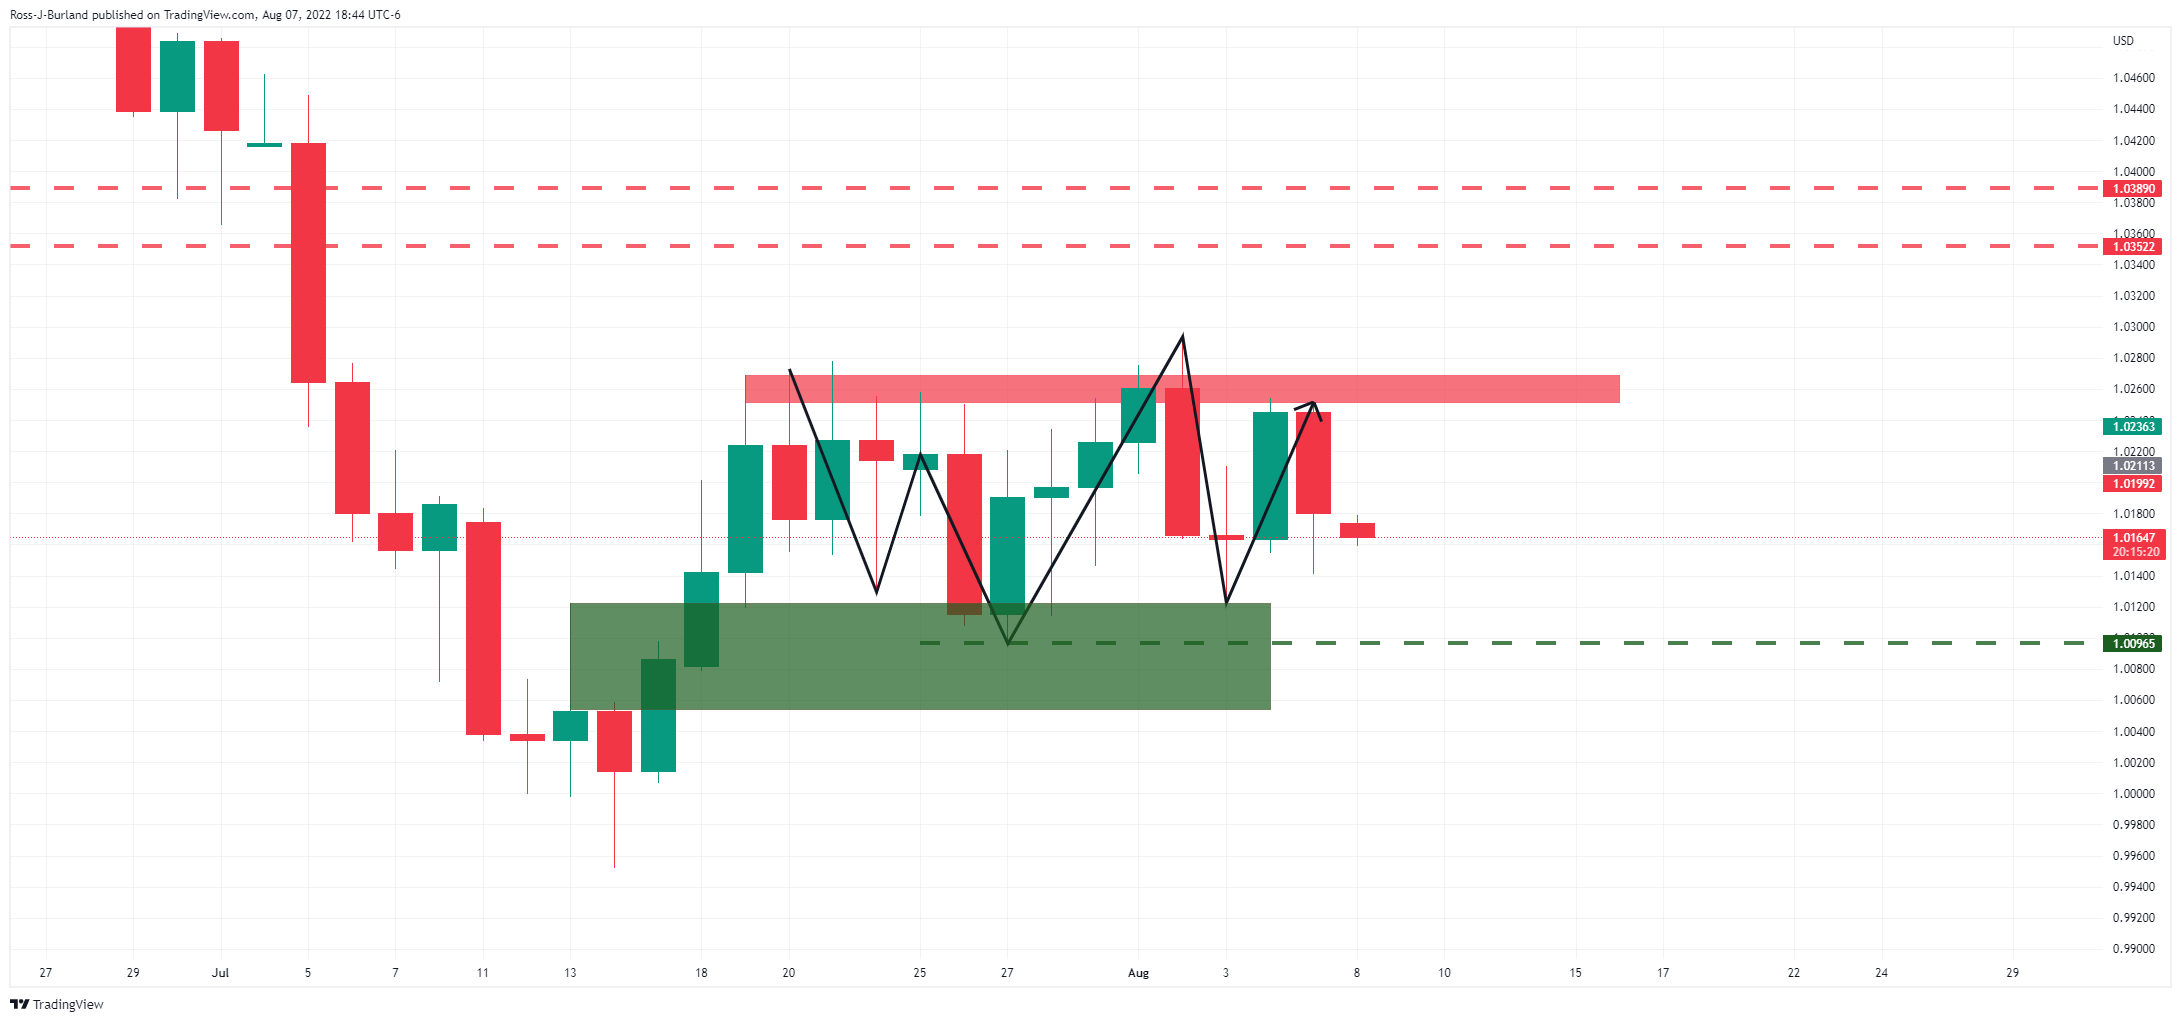
However, the bearish bias will only be confirmed at the break of the weekly structure around 1.0010.
EUR/USD H1 chart
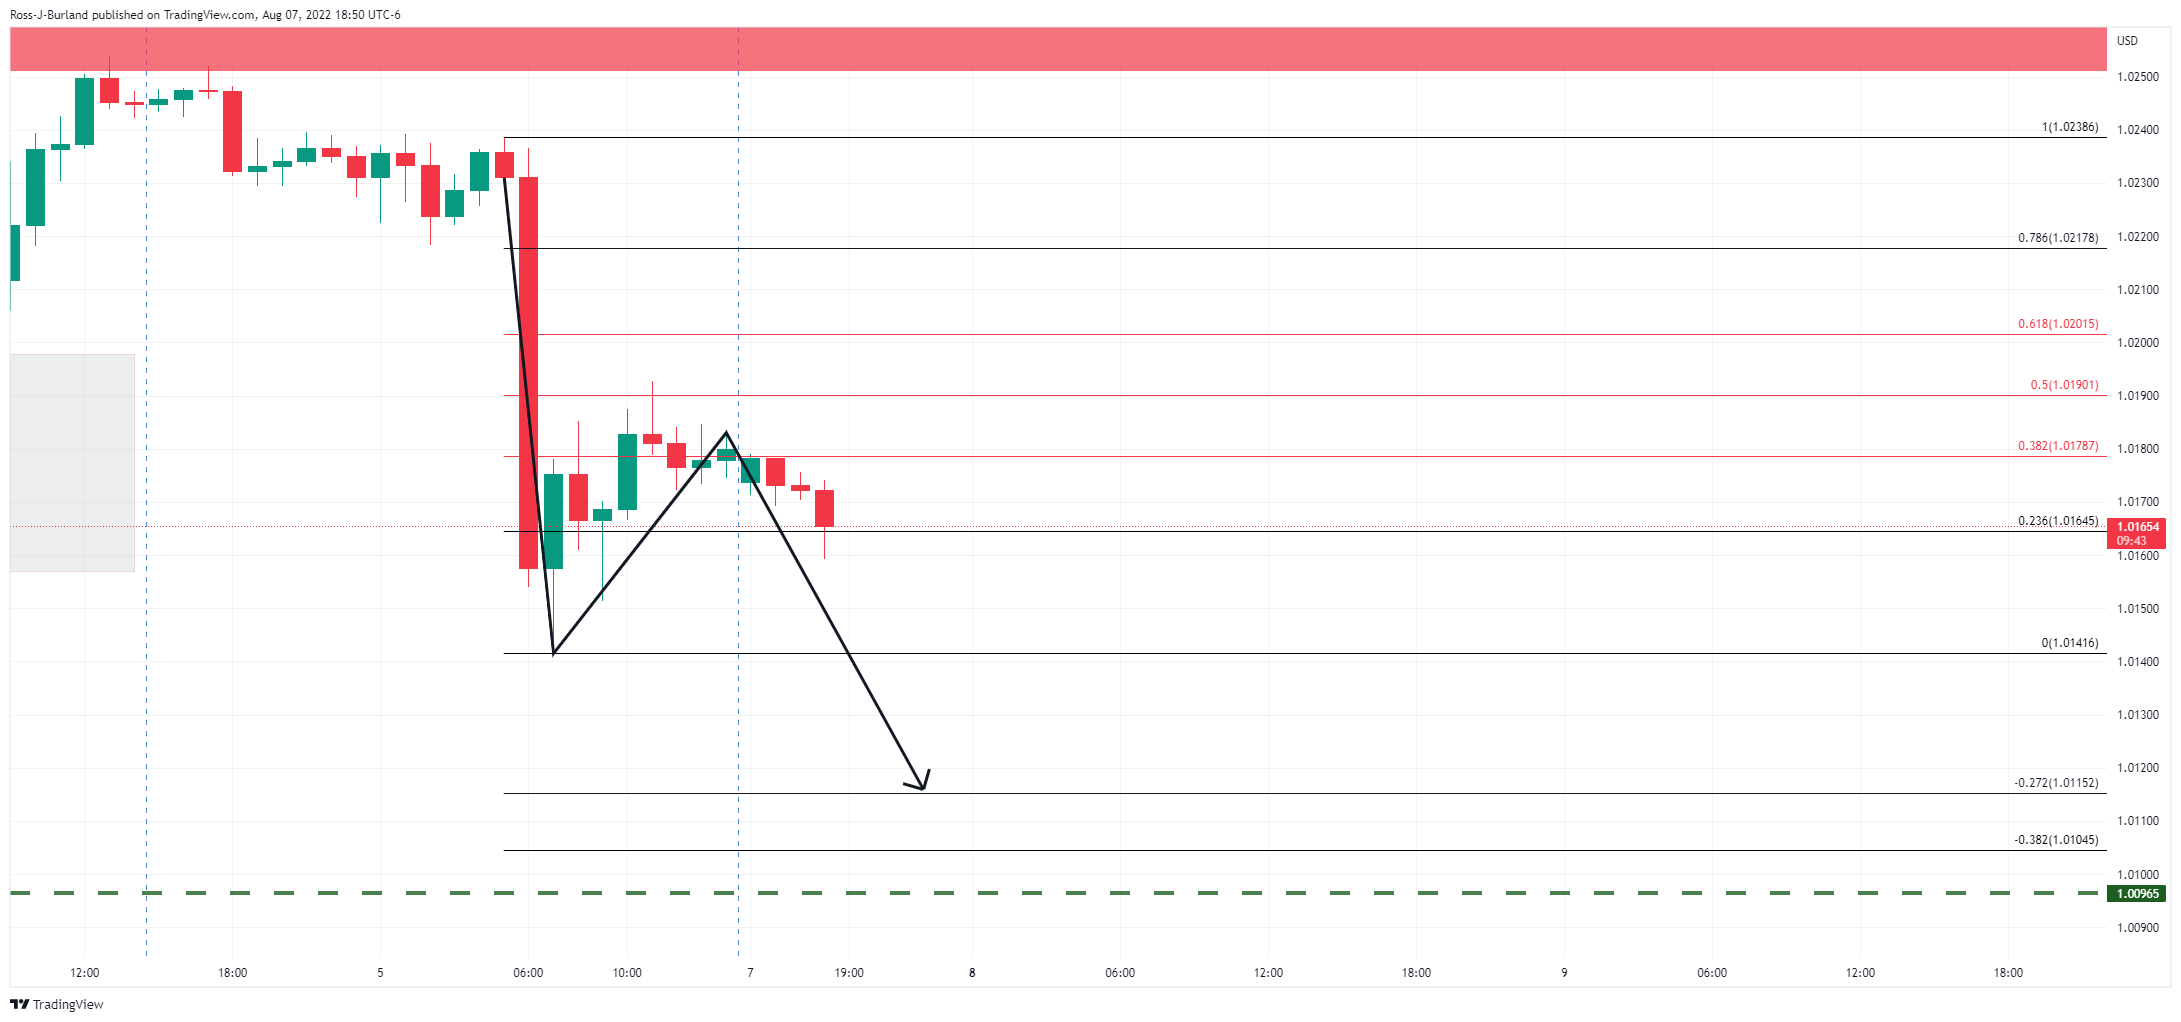
From an hourly perspective, the price has corrected 50% of the prior bearish impulse and has started to decelerate into a potential bearish extension for the sessions ahead.
Nevertheless, the M-formation that is developing is a reversion pattern that would be expected to see the price attracted to the neckline again in due course.
- Gold price extends Friday’s pullback from monthly high, holds lower ground of late.
- Market sentiment sours on US-China tussles over Taiwan, hawkish Fed bets.
- US employment numbers renewed hopes of the Fed’s aggression, July’s CPI will be crucial for clear directions.
Gold price (XAU/USD) remains pressured near $1,773, down 0.10% intraday, as risk-aversion underpins the US dollar’s safe-haven demand during Monday’s Asian session. Also keeping the greenback buyers hopeful are the recently increased hopes of the Federal Reserve’s (Fed) 0.75% rate hike in September.
The sour sentiment could be gauged from the S&P 500 Futures’ losses of around 4,138, as well as the mixed performance of the US 10-year Treasury yields near 2.3%. It’s worth noting that Wall Street benchmarks closed negative and the US 10-year Treasury yields rallied to 2.83%, up 14 basis points (bps), to renew the US dollar strength.
The US Dollar Index (DXY) remains firmer around 106.75, up 0.15% intraday while extending Friday’s recovery moves at the latest. A strong US employment report for July underpinned hawkish Fed bets and recalled the US dollar bulls the previous day. That said, the headline Nonfarm Payrolls (NFP) rose to 528K versus 250K expected and 398K upwardly revised prior. Further, the Unemployment Rate also inched lower to 3.5% compared to 3.6% expected and previous readings.
It should be noted that San Francisco Fed President Mary Daly said during the weekend that the Fed is far from done in combating inflation. The policymaker also added, “50 bps increase is definitely in play. We need to keep an open mind.”
Also keeping the greenback buyers hopeful is the US-China tussles surrounding Taiwan. Reuters came out with the news suggesting that China is up for ‘regular’ military drills east of the Taiwan Strait median line. That said, the dragon nation’s Foreign Ministry announced on Friday that they will sanction US House of Representative Speaker Nancy Pelosi over the Taiwan visit. On the other hand, Taiwan's Defense Ministry reported 66 Chinese aircraft conducting activities in the Taiwan Strait as of 5 pm local time on Sunday. Further, US Secretary of State Anthony Blinken mentioned that China's provocative actions were a significant escalation.
During the weekend, China’s trade numbers for June marked upbeat results with the Exports rising the most in the year. That said, the headline Trade Balance rose to $101.26B versus $90B forecasts and $97.94B. Further details suggest that Exports increased by 18% compared to 15% expected and 17.9% prior whereas the Imports eased to 2.3% compared to 3.7% expected and 1.0% prior. Given the dragon nation’s status as one of the world’s top gold consumers, firmer trade numbers appeared to have probed the XAU/USD bears of late.
Moving on, a light calendar ahead of Wednesday’s US Consumer Price Index (CPI) could trouble momentum traders, which in turn highlights the risk catalysts for fresh impulse.
Technical analysis
Gold price directs the previous day’s U-turn from the 50-DMA hurdle towards the two-week-old support line, around $1,767 by the press time.
Given the recent RSI retreat and the MACD line’s sustained move in the negative zone, XAU/USD is likely to break the immediate trend line support.
However, the 21-DMA level surrounding $1,738 could challenge the metal sellers before directing them to the yearly low of $1,680.
Alternatively, upside clearance of the 50-DMA resistance surrounding $1,788 isn’t an open invitation to the gold buyers as the downward sloping resistance line from May appears a crucial hurdle towards the north, close to $1,832-33 by the press time.
Gold: Daily chart
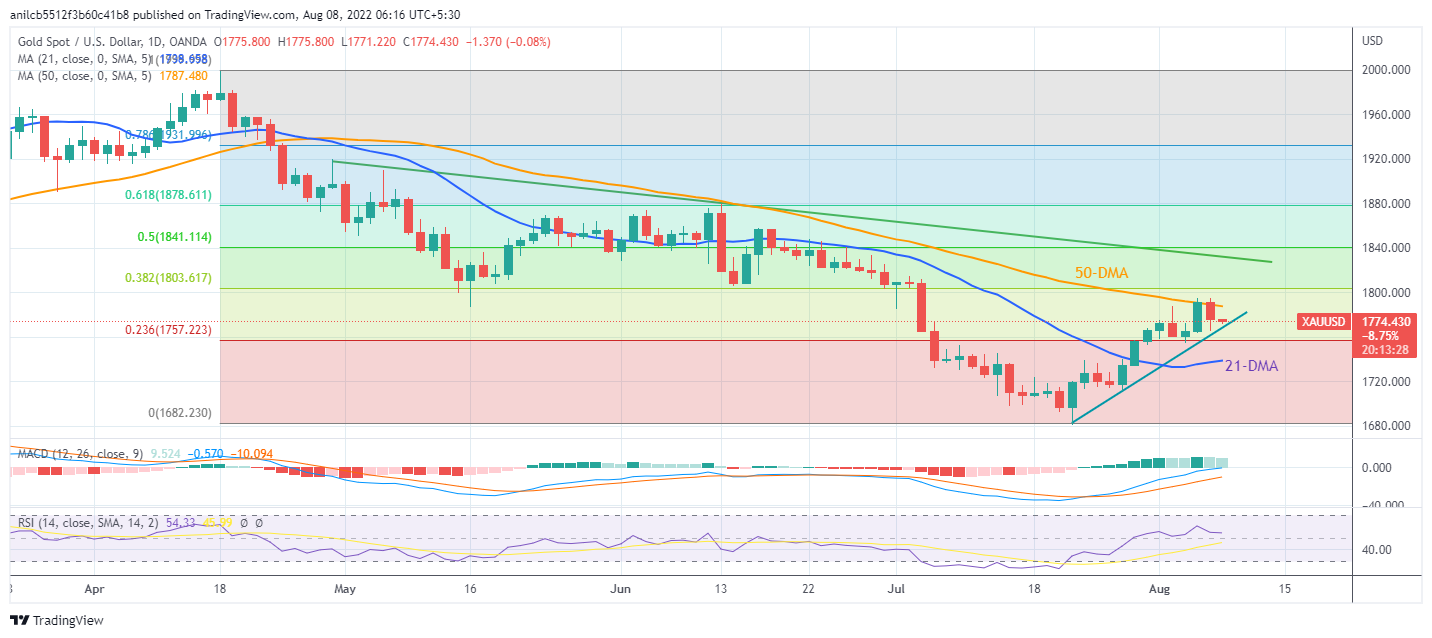
Trend: Further weakness expected
- GBP/JPY is expected to extend their gains above 163.50 on higher UK inflation expectations.
- The UK economic data comprising GDP, Industrial Production, and others are likely to remain downbeat.
- Japan’s Overall Household Spending improved to 3.5% vs. -0.5% and the expectations of 1.5%.
The GBP/JPY pair has given an upside break of the consolidation formed in a narrow range of 162.80-163.20 in the Asian session. The cross has turned positive as investors have ignored the soaring inflation expectations guided by the Bank of England (BOE) in its monetary policy meeting last week.
BOE Governor Andrew Bailey warned the investing community that the inflation rate could reach 13% due to volatile oil and food prices. The runaway inflation is now turning into a galloping one and the BOE is carrying less potential for tightening its policy aggressively. The BOE announced a 50 basis point (bps) interest rate hike and has elevated the rates to 1.75%.
Thanks to the subdued economic data and the ongoing political instability after the resignation of UK PM Boris Johnson, which have created a bummer situation for the BOE. In case of the occurrence of an inflation rate near 13%, a situation of recession in the UK economy is highly likely.
Going forward, the UK Gross Domestic Product GDP) data will be of utmost importance. As per the market consensus, the economic data is expected to shift downward to 2.8% from the prior release of 8.7 on an annual basis for the second quarter of CY2022. Also, the other economic data are expected to display an underperformance.
On the Tokyo front, the Overall Household Spending has improved dramatically to 3.5% from the prior release of -0.5% and the expectations of 1.5%. This may support the yen bulls as the economic data is an inflation indicator. A decent improvement in the economic data advocates that the inflation rate may accelerate further. However, the data could be driven majorly by soaring energy bills. Still, to keep the inflation rate above 2%, an increase in Labor Cost Index is imminent.
| Index | Change, points | Closed | Change, % |
|---|---|---|---|
| NIKKEI 225 | 243.67 | 28175.87 | 0.87 |
| Hang Seng | 27.9 | 20201.94 | 0.14 |
| KOSPI | 17.69 | 2490.8 | 0.72 |
| ASX 200 | 40.7 | 7015.6 | 0.58 |
| FTSE 100 | -8.4 | 7439.7 | -0.11 |
| DAX | -88.75 | 13573.93 | -0.65 |
| CAC 40 | -41.04 | 6472.35 | -0.63 |
| Dow Jones | 76.65 | 32803.47 | 0.23 |
| S&P 500 | -6.75 | 4145.19 | -0.16 |
| NASDAQ Composite | -63.03 | 12657.55 | -0.5 |
- NZD/USD retreats from intraday high as bears poke short-term key DMA support.
- Downbeat oscillators, descending resistance line from mid-June also favor bears.
- Buyers should remain cautious unless witnessing clear break of 0.6400.
NZD/USD fades the corrective pullback portrayed during the week-start move as it drops to 0.6235 during a mid-Asian session on Monday.
With this, the kiwi pair pokes the 20-DMA support as the MACD line teases bear cross while the RSI (14) also portrays the downbeat momentum.
Hence, the quote is likely to extend the latest weakness towards the downward sloping trend line from early May, near 0.6160. However, a daily closing below the 20-DMA support of 0.6229 appears necessary.
Should the quote remains weak past 0.6160, the 0.6100 round figure and the previous monthly low, also the yearly bottom, surrounding 0.6060, will be in focus.
On the flip side, a 1.5-month-old descending resistance line around 0.6340 limits the immediate upside of the NZD/USD pair.
Following that, the monthly high and mid-June top, close to 0.6352 and 0.6395 on that order, could challenge the NZD/USD buyers. Also acting as an upside filter is the 0.6400 threshold.
In a case where the prices rally beyond 0.6400, an upward trajectory towards June’s high near 0.6575 can’t be ruled out.
NZD/USD: Daily chart
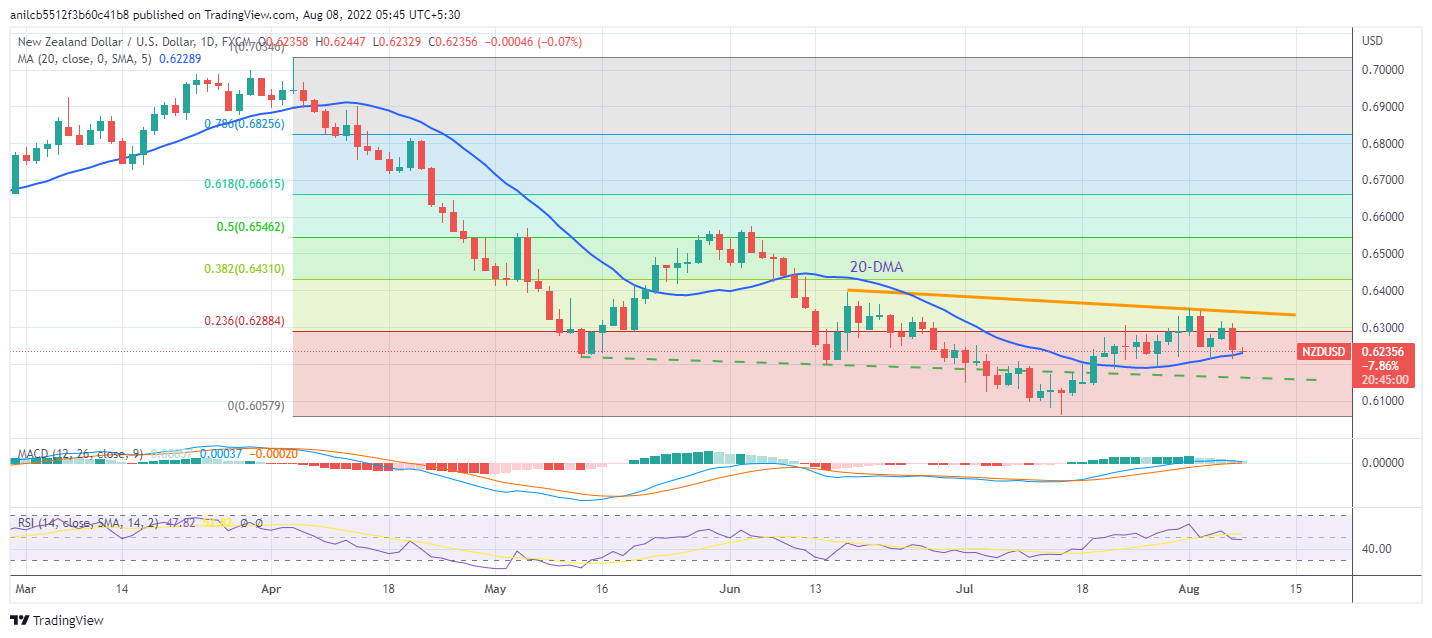
Trend: Further downside expected
| Pare | Closed | Change, % |
|---|---|---|
| AUDUSD | 0.69106 | -0.79 |
| EURJPY | 137.395 | 0.78 |
| EURUSD | 1.01781 | -0.67 |
| GBPJPY | 162.964 | 0.75 |
| GBPUSD | 1.20743 | -0.7 |
| NZDUSD | 0.62383 | -0.88 |
| USDCAD | 1.29358 | 0.55 |
| USDCHF | 0.96165 | 0.73 |
| USDJPY | 134.985 | 1.46 |
- USD/JPY is gearing up for a fresh bullish impulsive wave despite lower consensus for US CPI.
- The outstanding US NFP has infused fresh blood in Fed policymakers’ confidence.
- BOJ’s ultra-loose monetary policy will keep the yen bulls on a bumpy ride.
The USD/JPY pair has turned sideways in the Asian session following the footprints of the US dollar index (DXY). On a broader note, the asset is displaying back and forth moves after a juggernaut rebound from 133.00 on Friday.
The greenback bulls were driving the asset higher like there is no tomorrow after the release of the bumper US employment data. The US Nonfarm Payrolls (NFP) landed at 528k, significantly higher than the expectations of 250k and the prior release of 372k. Despite the headwinds of a halt in the recruitment process by US corporate and lower investments due to rising interest rates by the Federal Reserve (Fed), the employment data has remained upbeat and may support the Fed.
Now, the entire focus is shifting toward the US Consumer Price Index (CPI) data, which will release on Friday. A downside print is expected to be 8.7% from the former release of 9.1% on an annual basis. The US households were facing severe pressure from the higher price rise index. Thanks to the weaker oil prices in July, which is resulting in a steep fall in the US inflation data. However, this may not trim the extent of policy tightening measures by the Fed in September.
On the Tokyo front, the continuation of an ultra-loose monetary policy by the Bank of Japan (BOJ) will keep haunting the yen bulls. The BOJ is committed to spurting the growth rate and lifting that to the pre-pandemic levels as early as possible. Therefore, it is critical to pump much liquidity into the economy so that the investments could ramp up the wage price index and the inflation will remain above 2%.


© 2000-2026. Sva prava zaštićena.
Sajt je vlasništvo kompanije Teletrade D.J. LLC 2351 LLC 2022 (Euro House, Richmond Hill Road, Kingstown, VC0100, St. Vincent and the Grenadines).
Svi podaci koji se nalaze na sajtu ne predstavljaju osnovu za donošenje investicionih odluka, već su informativnog karaktera.
The company does not serve or provide services to customers who are residents of the US, Canada, Iran, The Democratic People's Republic of Korea, Yemen and FATF blacklisted countries.
Izvršenje trgovinskih operacija sa finansijskim instrumentima upotrebom marginalne trgovine pruža velike mogućnosti i omogućava investitorima ostvarivanje visokih prihoda. Međutim, takav vid trgovine povezan je sa potencijalno visokim nivoom rizika od gubitka sredstava. Проведение торговых операций на финанcовых рынках c маржинальными финанcовыми инcтрументами открывает широкие возможноcти, и позволяет инвеcторам, готовым пойти на риcк, получать выcокую прибыль, но при этом неcет в cебе потенциально выcокий уровень риcка получения убытков. Iz tog razloga je pre započinjanja trgovine potrebno odlučiti o izboru odgovarajuće investicione strategije, uzimajući u obzir raspoložive resurse.
Upotreba informacija: U slučaju potpunog ili delimičnog preuzimanja i daljeg korišćenja materijala koji se nalazi na sajtu, potrebno je navesti link odgovarajuće stranice na sajtu kompanije TeleTrade-a kao izvora informacija. Upotreba materijala na internetu mora biti praćena hiper linkom do web stranice teletrade.org. Automatski uvoz materijala i informacija sa stranice je zabranjen.
Ako imate bilo kakvih pitanja, obratite nam se pr@teletrade.global.
транcфери