- Analiza
- Novosti i instrumenti
- Vesti sa tržišta
Forex-novosti i prognoze od 17-05-2023
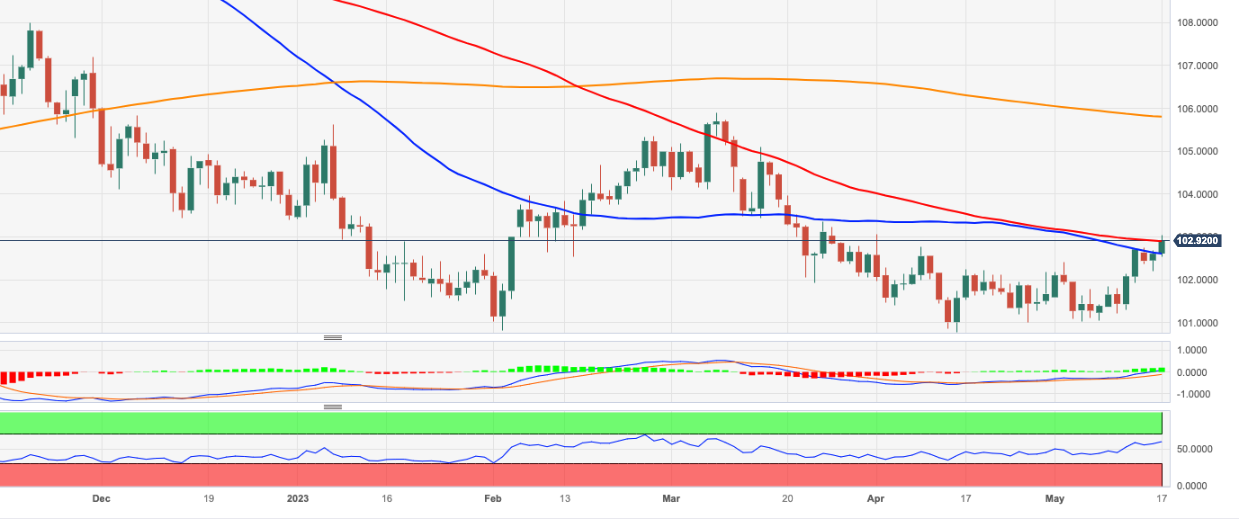
- US Dollar Index fades upside momentum after rising to late March highs.
- US policymakers appear hopeful of getting a deal to avoid default ahead of debt-ceiling expiry.
- Fewer details on the US debt limit negotiations, doubts on retail sales raised by Target Corp prod DXY bulls.
- Light calendar may allow US Dollar Index to pare recent gains at multi-day top.
US Dollar Index (DXY) buyers struggle to keep the reins at the highest levels in seven weeks during early Thursday in Asia. That said, the greenback’s gauge versus the six major currencies grinds near 102.90 while reversing the late Wednesday’s pullback from a multi-day high.
The DXY previously cheered optimism surrounding no US default, as well as hawkish comments from the Federal Reserve (Fed) officials, to rise to nearly two-month top. However, the latest doubt on the policymakers’ ability to agree on a wide range of details, as well as fears of easing US retail sales, seem to prod the US Dollar Index buyers.
Global markets turned optimism after a brief meeting between US President Joe Biden and House Speaker Kevin McCarthy conveyed that the policymakers are ready to compromise for a greater benefit. While portraying the same, US House Speaker Kevin McCarthy said in an interview on CNBC, "Now we have an opportunity to find common ground but only a few days to get the job done." Further, US President Joe Biden said that he is confident that they will be able to reach a budget agreement and noted that it would be catastrophic if the US failed to pay bills, per Reuters. "Will have a news conference on Sunday on the debt issue,” added US President Joe Biden.
However, the clock it ticking and the US Treasury Department has already signaled early June expiry of the debt-limit, as well as cited ‘catastrophic’ default of the US, if policymakers fail to strike a deal of multiple issues that can help solve the debt-limit problem. With this, markets reassess the previous optimism and prod the DXY bulls.
On the other hand, Reuters said that US retail sales have remained resilient despite higher prices but consumers have been careful about their spending, hurting companies such as Target and Home Depot, whose merchandise largely consists of discretionary products.
Previously, upbeat US data allowed the Federal Reserve (Fed) officials to reconfirm their hawkish bias about the monetary policy. On Wednesday, US Housing Starts came out as unimpressive with 1.401M figures for April versus 1.4M expected and 1.371M prior (revised). Alternatively, the Building Permits for the said month eased to 1.416M from 1.437M edited previous readings and market forecasts. Before that, upbeat US Retail Sales and Industrial Production details for April allowed the Federal Reserve (Fed) officials to remain hawkish and prod the risk-on mood. The latest among them were Federal Reserve Bank of Chicago President Austan Goolsbee and Atlanta Fed President Raphael Bostic who reiterate inflation fears and favored the US Dollar Index bulls.
Amid these plays, S&P 500 Futures print mild losses despite the upbeat Wall Street close whereas the US Treasury bond yields also remain sidelined at the multi-day top.
With this, the DXY may witness hardships in extending the latest run-up amid a light calendar. However, risk catalysts are the key to watch for clear directions.
Technical analysis
A daily close beyond the six-week-old horizontal resistance, around 102.75, struggles with the 100-DMA hurdle, near 102.90, to convince the DXY bulls. That said, nearly overbought RSI, however, suggest a pullback in prices.
- Gold price remains weak despite recent rebound from the lowest level in three weeks.
- United States debt ceiling drama, hawkish Federal Reserve talks underpin US Treasury bond yields, USD and weigh on XAU/USD.
- Second-tier US data, risk catalysts eyed for clear direction of the Gold price.
Gold price (XAU/USD) licks its wounds at a three-week low, picking up bids to print mild gains around $1,985 amid the early hours of Thursday’s Asian session. In doing so, the XAU/USD bears take a breather after declining in the last two consecutive days amid a lack of major data/events. Even so, expectations that the United States will be able to stretch its debt limit and join the hawkish Federal Reserve (Fed) talks to weigh on the Gold price.
Gold price bears burden of United States Treasury bond yields, US Dollar
Gold price broke short-term triangle support earlier in the week and dropped further afterward to refresh the multi-day low amid the firmer United States Treasury bond yields and the US Dollar.
That said, the US 10-year and two-year Treasury bond yields rose to the highest levels since May 01 and April 24 while portraying a four-day uptrend near 3.57% and 4.16% respectively, remaining unchanged by the press time. The same allows the US Dollar Index (DYX) to stay upbeat despite the latest retreat from a seven-week high to 102.85.
With this, the Gold price remains pressured as the markets cheer the firmer US Dollar amid upbeat expectations.
US debt ceiling drama, hawkish Federal Reserve talks favor US T-bond yields, USD
In addition to the United States debt ceiling jitters, the Federal Reserve officials’ hawkish bias also favors the US Treasury bond yields and the US Dollar, which in turn weighs on the Gold price.
Although markets doubt a brief meeting between US President Joe Biden and House Speaker Kevin McCarthy and portray the latest corrective bounce off the Gold price, comments from both key diplomats propel hopes of no US debt ceiling expiry and challenge the XAU/USD bulls. On Wednesday, US House Speaker Kevin McCarthy said in an interview on CNBC, "Now we have an opportunity to find common ground but only a few days to get the job done." Further, US President Joe Biden said that he is confident that they will be able to reach a budget agreement and noted that it would be catastrophic if the US failed to pay bills, per Reuters. "Will have a news conference on Sunday on the debt issue,” added US President Joe Biden.
On the other hand, recently upbeat US data allow the Federal Reserve (Fed) officials to reconfirm their hawkish bias about the monetary policy and exert additional downside pressure on the Gold price. On Wednesday, US Housing Starts came out as unimpressive with 1.401M figures for April versus 1.4M expected and 1.371M prior (revised). Alternatively, the Building Permits for the said month eased to 1.416M from 1.437M edited previous readings and market forecasts. Previously, upbeat US Retail Sales and Industrial Production details for April allowed the Federal Reserve (Fed) officials to remain hawkish and prod the risk-on mood. The latest among them were Federal Reserve Bank of Chicago President Austan Goolsbee and Atlanta Fed President Raphael Bostic who reiterate inflation fears and pleased the Gold sellers.
Qualitative catalysts are the key for XAU/USD watchers
Moving on, a light calendar with only second-tier United States jobs and activity data may not be able to entertain the Gold price traders. As a result, headlines surrounding the US default and comments from the global central bankers, mainly from the Federal Reserve (Fed) officials will be watched carefully for clear XAU/USD directions.
Gold price technical analysis
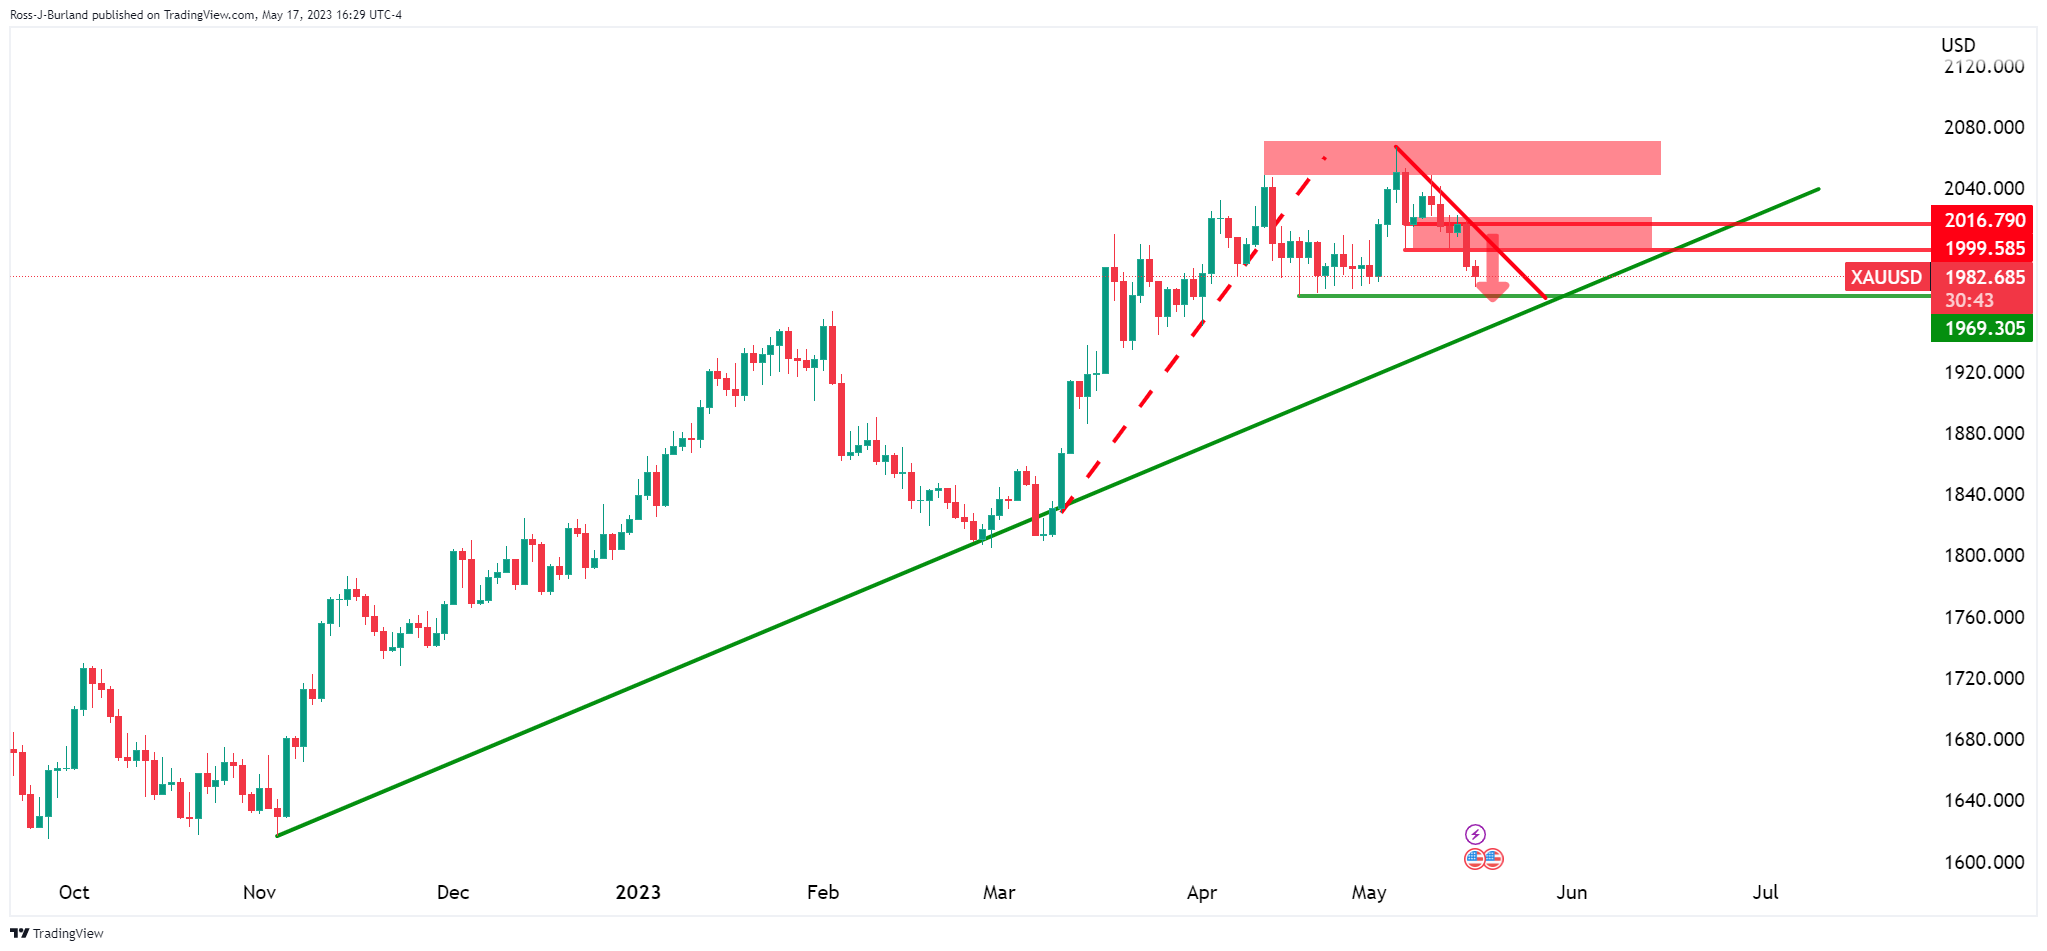
Confirmation of a two-month-old bearish triangle joins the bearish signals from the Moving Average Convergence and Divergence (MACD) indicator to favor the Gold price downside at the lowest levels in a month.
However, the below 50 level of the Relative Strength Index (RSI) line, placed at 14, suggests the XAU/USD bears wait for sustained trading beneath the 50-DMA, around $1,985 by the press time, before adding more short positions.
Following that, the yellow metal could drop to the 50% Fibonacci retracement of its March-May upside, around $1,945, ahead of testing the 100-DMA support of $1,925 and the golden Fibonacci ratio, the 61.8% mark, of around $1,910.
In a case where the Gold price remains bearish past $1,910, the odds of witnessing a slump in the XAU/USD can’t be ruled out.
Alternatively, the Gold price recovery needs to sustain beyond the stated triangle’s bottom line, $1,995, quickly followed by the $2,000 round figure hurdle.
Even so, the 23.6% Fibonacci retracement level and the aforementioned triangle’s top, respectively near $2,015 and $2,050 will be in the spotlight.
To sum up, the Gold price remains on the bear’s radar even as the road towards the south is long and bumpy.
Gold price: Daily chart
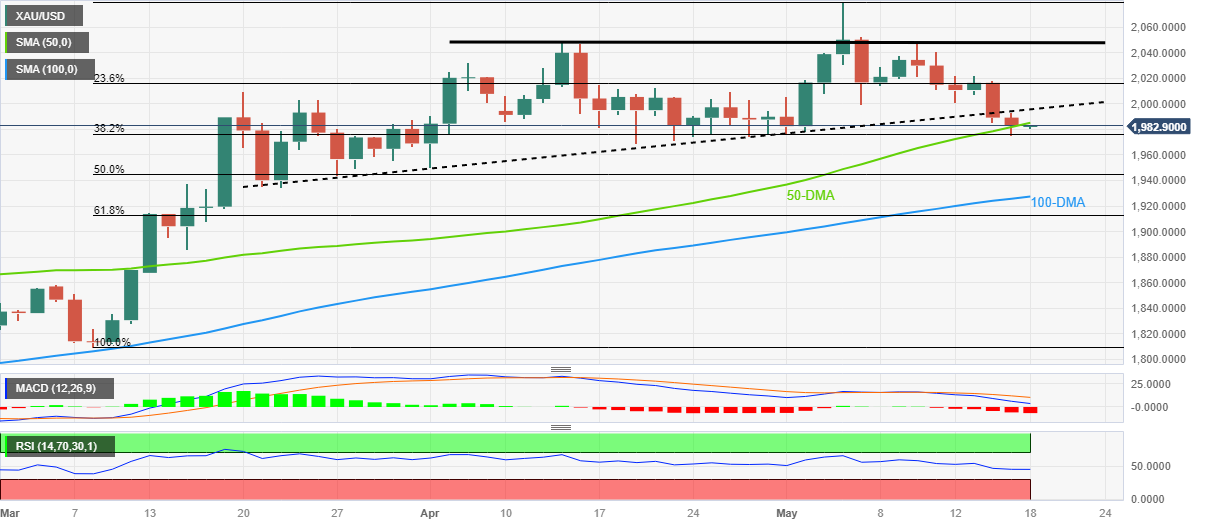
Trend: Further downside expected
- AUD/JPY is looking to re-test the 10-day high around 92.00 as the focus has shifted to Australian Employment.
- The stubborn labor cost index could keep the overall demand elevated and eventually the Australian inflation.
- Japan’s economy is likely to continue moderate pickup ahead due to wage hikes, and a strong corporate appetite for investment.
The AUD/JPY pair is looking to reclaim the 10-day high around 92.00 in the early Tokyo session. The risk barometer showed a significant jump on Wednesday as investors are worried that the Reserve Bank of Australia (RBA) could raise interest rates further to tame Australian inflation.
On Wednesday, the Australian Bureau of Statistics reported mixed Q1 Wage Price Index data. The quarterly labor cost index remained steady at 0.8% but lower than the estimate of 0.9%. On an annual basis, the economic data accelerated to 3.7% vs. the consensus of 3.6% and the former release of 3.3%. A stubborn labor cost index could keep the overall demand elevated and eventually, the Australian inflation, which could force RBA Governor Philip Lowe to tighten monetary policy further.
Going forward, Australia’s Employment data (April) will provide more clarity. As per the consensus, the Australian economy added 25K fresh jobs in April, lower than the additions of 53K made in March. The Unemployment Rate is seen unchanged at 3.8%. Lower additions of fresh payrolls would be a comfort for the agenda of bringing inflation down ahead.
Economists at Commerzbank believe that “The main risk remains that the labor market data might surprise to the upside. A surprise of that nature would further fuel recent hopes of a further rate step and would no doubt be positive for the Aussie.”
On the Japanese Yen front, Japan’s Gross Domestic Product (GDP) showed a decent rise in Q1 numbers. Preliminary Q1 GDP accelerated by 0.4% vs. the estimates of 0.1%. In the last quarter, the GDP growth remained stagnant. Japan’s Economy Minister Shigeyuki Goto cited “Economy likely to continue moderate pickup ahead due to improving sentiment, wage hikes and strong corporate appetite for investment.
- AUD/NZD picks up bids to snap two-day downtrend but remains indecisive ahead of the key data/events.
- Upbeat sentiment, softer New Zealand data allow bears to take a breather.
- Strong Aussie jobs report necessary to justify RBA’s hawkish surprise, New Zealand’s “no frill” budget needs validation from rating agencies.
AUD/NZD renews its intraday high near 1.0670 as it prints the first daily gains in three ahead of the all-important Australian employment report and New Zealand’s annual budget, scheduled for publishing on Thursday.
The exotic pair’s latest rebound from a 1.5-month-old ascending support line could be linked to the market’s cautious optimism, as well as downbeat New Zealand (NZ) inflation clues.
That said, New Zealand’s first quarter (Q1) Producer Price Index Input and Output numbers ease to 0.2% and 0.3% respectively versus 0.5% and 0.9% priors in that order. It’s worth noting that these figures are way below the market forecasts of 1.5% and 1.3% for Input and Output respectively.
Adding to the pair’s recovery moves could be the latest hopes of the US policymakers’ ability to avoid the ‘catastrophic’ default. Although markets doubt a brief meeting between US President Joe Biden and House Speaker Kevin McCarthy, comments from both key diplomats propel hopes of no US debt ceiling expiry.
On Wednesday, US House Speaker Kevin McCarthy said in an interview on CNBC, "Now we have an opportunity to find common ground but only a few days to get the job done." Further, US President Joe Biden said that he is confident that they will be able to reach a budget agreement and noted that it would be catastrophic if the US failed to pay bills, per Reuters. "Will have a news conference on Sunday on the debt issue,” added US President Joe Biden.
In addition to the US-inspired run-up, hopes of more investment from China also underpinned the AUD/NZD recovery as China’s State Planner National Development and Reform Commission of the People's Republic of China (NDRC) mentioned on Wednesday that it'll take measures to unleash consumption potential and to make continuous efforts in stabilizing and expanding manufacturing investment.
To portray the risk-on scenario, Wall Street closed with gains while Treasury bond yields remain firmer at a two-week high.
Moving on, AUD/NZD pair traders should close attention to today’s Australia Employment data for April as the headline Employment Change is expected to ease to 25K, versus 53K prior, whereas the Unemployment Rate and Participation Rate may stay unchanged at 3.5% and 66.7% respectively. Should the data match downbeat forecasts, or show a further easing of the jobs market, the RBA will have a tough time justifying the latest hawkish surprise, which in turn can weigh on the pair prices.
Additionally, New Zealand’s “no frill” budget needs acceptance from the rating agencies and bond markets to favor the New Zealand Dollar (NZD) buyers. With this in mind, ANZ said, “Despite the ‘no frills’ label being attached to Budget 2023 ahead of its release, we expect it to add a little more stimulus to an already capacity-constrained economy.”
Technical analysis
AUD/NZD pair’s recovery from a six-week-old ascending support line, close to 1.0640 at the latest, remains elusive unless crossing a convergence of the 50-DMA and 21-DMA, near 1.0735 by the press time. That said, easing the bearish bias of the MACD and steady RSI favors the pair’s latest corrective bounce.
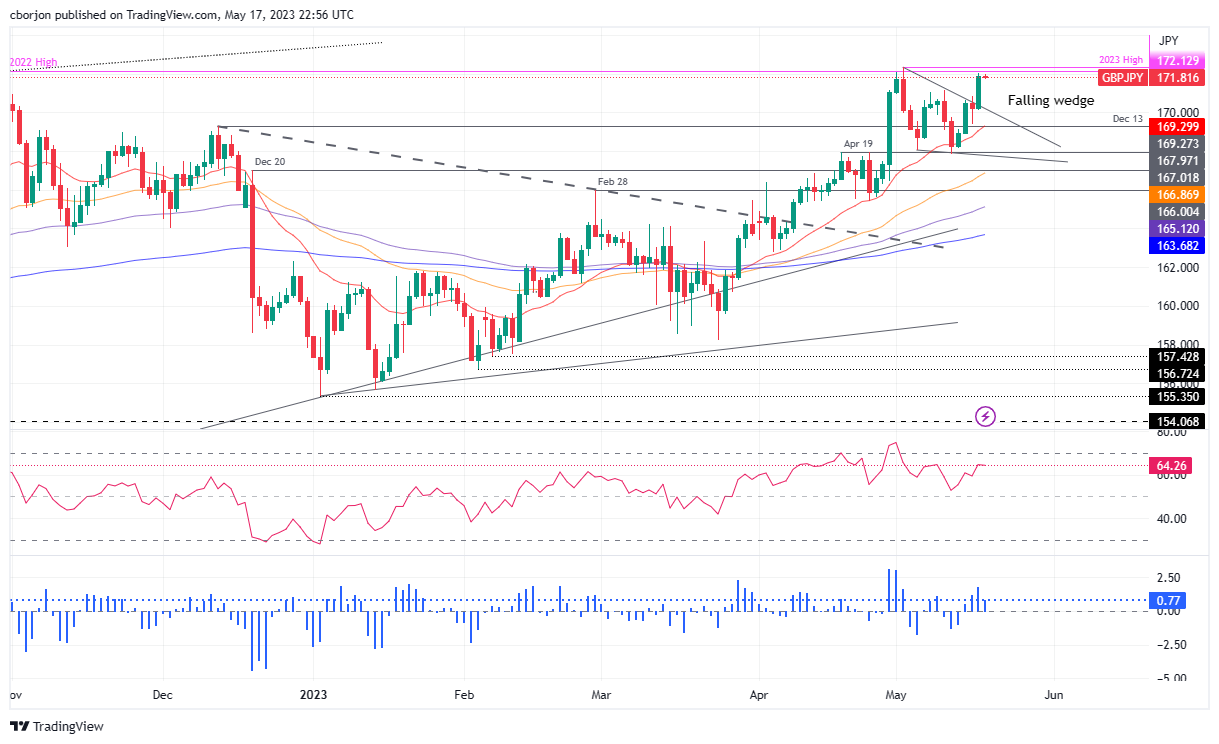
- GBP/JPY breaks falling wedge approaches YTD high of 172.33; currently trading at 171.86, down 0.01%.
- The technical outlook turns bullish, but resistance at 173.00 and 175.00 could pose challenges for further gains.
- Negative divergence on the RSI indicator suggests a possible pullback; downside risks emerge below the 170.00 psychological figure.
The GBP/JPY rallied sharply as a falling wedge, usually a bullish chart pattern, has been broken decisively to the upside, and the GBP/JPY approaches the year-to-date (YTD) high of 172.33 as the Asian session begins. At the time of writing, the GBP/JPY is trading at 171.86, down 0.01%.
GBP/JPY Price Analysis: Technical outlook
The GBP/JPY uptrend remains intact from a daily chart perspective, but solid resistance levels will be tested in the short term. If the GBP/JPY breaks 172.33, that could open the door for further gains, supported by momentum oscillators, turning bullish.
Although bullish, the Relative Strength Index (RSI) indicator printed a lower peak than the previous one, while price action is reaching higher highs. That means a negative divergence could emerge, meaning that a pullback might be on the cards.
But if GBP/JPY breaks above 173.00, the next resistance to challenge would be the 175.00 figure. Once cleared, the GBP/JPY could rally towards the 2016 year high of 177.37. A breach of the latter, and the next supply zone, would be the 180.00 figure, which could open the door for a test of 2015 high of 195.88.
Conversely, a failure at 172.00, the GBP/JPY could retreat towards the May 16 high of 170.83. Break below will expose the May 17 daily low of 170.11 before cracking the 170.00 psychological figure.
GBP/JPY Price Action – Daily chart
- GBP/USD is aiming to reclaim the 1.2500 resistance as the USD index is expected to correct further.
- The Fed is widely anticipated to pause its policy-tightening process in June.
- The risk impulse is positive as investors are expecting that the US debt-ceiling will get raised this week.
The GBP/USD pair has gauged an intermediate support around 1.2480 after a mild correction and is looking to reclaim the psychological resistance of 1.2500. The Cable is expected to get stronger due to a correction in the US Dollar Index (DXY) and an absence of evidence of United Kingdom inflation softening ahead.
S&P500 futures are showing nominal losses in early Asia followed by a meaningful bullish Wednesday as the White House and Republican leaders are expected to approve the deal of raising the US debt ceiling. However, spending initiatives for the budget will get compromised as each member who attended US debt-ceiling talks admitted that a raise in the US borrowing cap along with a higher spending budget will be a disaster for the economy. The overall market mood is indicating that investors have underpinned the risk-appetite theme.
The US Dollar Index (DXY) witnessed an extreme selling pressure around 103.10 and dropped to near 102.80. Further downside in the USD index seems possible as investors are shifting their focus to June’s monetary policy meeting by the Federal Reserve (Fed) in which a neutral stance on interest rates is widely anticipated.
On the Pound Sterling front, higher inflationary pressures are causing worry for the Bank of England (BoE) policymakers. On Wednesday, BoE Governor Andrew Bailey cited that easing of United Kingdom labor market tightness is happening at a slower pace than we expected in February and the labor market remains very tight.
Also, UK Finance Minister Jeremy Hunt said on Wednesday, there is “nothing automatic about bringing down inflation.” He further added the administration supports the BoE fully and is focusing on getting taxes down.
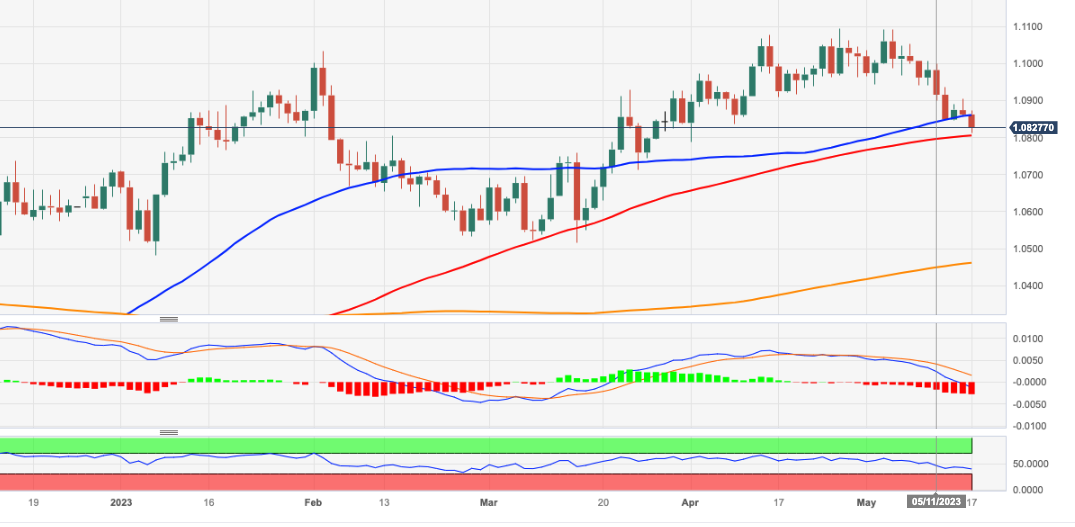
- EUR/USD remains sidelined after bouncing off six-week low.
- Downbeat RSI (14) line, 100-DMA favors underpin recovery move.
- Convergence of 50-DMA, previous support line from September 2022 highlights 1.0900 hurdle.
- Euro buyers can remain hopeful beyond 1.0480, multiple levels prod bulls past 1.1000.
EUR/USD seesaws around 1.0840 as the previous day’s corrective bounce from 1.5-month low fades during the early hours of Thursday.
That said, the downbeat RSI (14) conditions and the 100-DMA support triggered the Euro pair’s rebound from the 1.0800 mark on Wednesday. However, a bearish MACD signal and cautious mood ahead of a speech from European Central Bank (ECB) President Christine Lagarde, as well as amid US default jitters, check the pair buyers.
Hence, the EUR/USD recovery needs validation and highlights a convergence of the 50-DMA and the support-turned-resistance line stretched from September 2022, close to 1.0900 by the press time, as the key for the pair’s further advances.
Following that, the early May low of near 1.0940 and February’s high surrounding 1.1035 can challenge the buyers.
Adding to the upside filters are multiple tops marked during April and May around 1.1090 and 1.1100.
On the flip side, a daily closing below the 100-DMA level of near 1.0800 will be enough to recall the EUR/USD sellers.
In that case, the 23.6% Fibonacci retracement level of the pair’s run-up from September 2022 to April 2023, around 1.0725, can act as an extra filter to the south.
It’s worth noting that a broad support zone comprising multiple levels marked since November 2022, around 1.0520-480, becomes a tough nut to crack for the EUR/USD sellers.
To sum up, EUR/USD is likely to remain bearish despite the latest corrective bounce.
EUR/USD: Daily chart
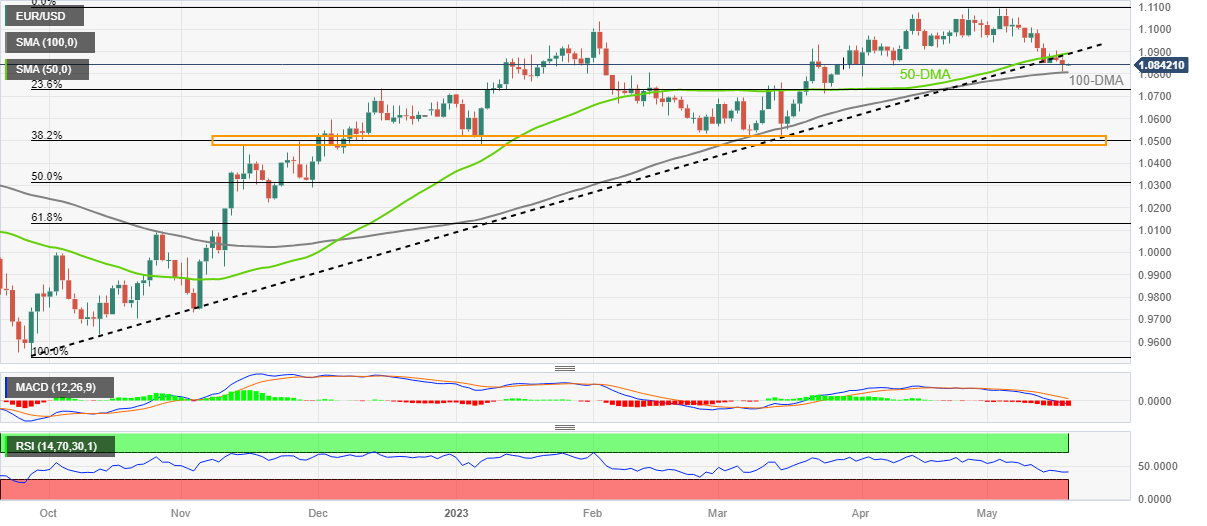
Trend: Limited recovery expected
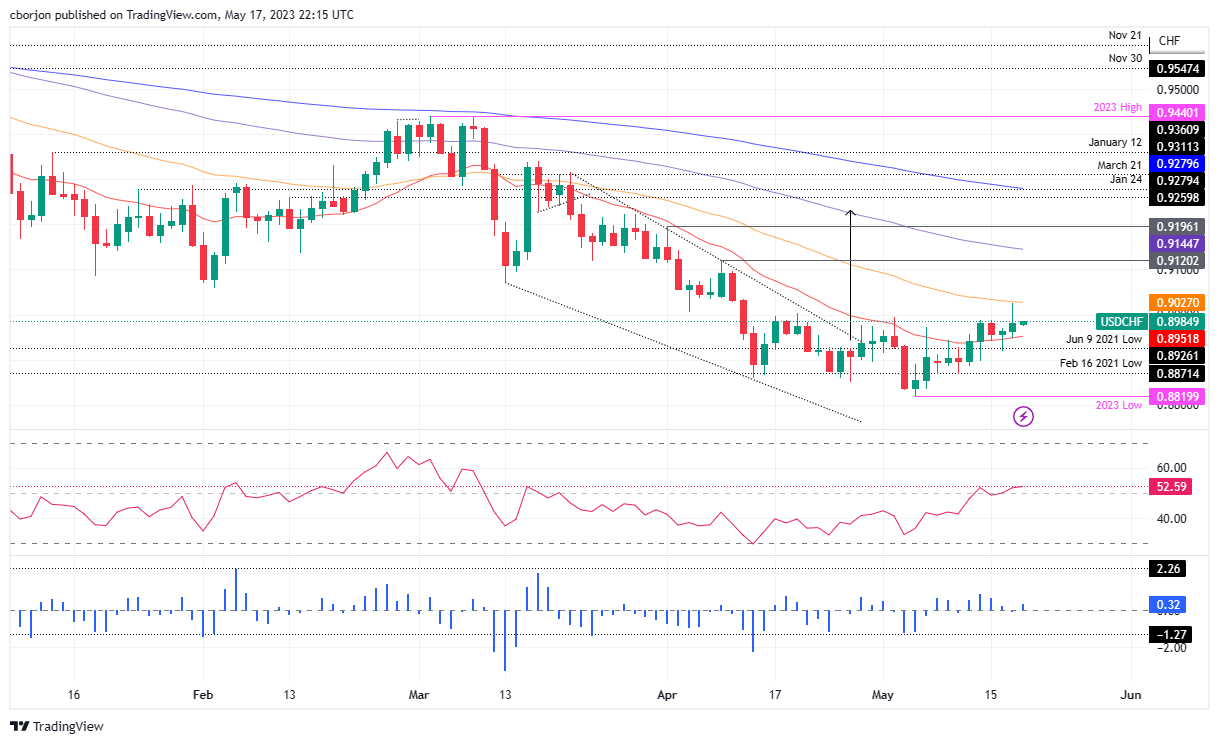
- USD/CHF trades below the weekly high, failing to conquer the 50-day EMA; currently trading at 0.8984, up 0.05%.
- The technical outlook remains neutral unless the pair can reclaim the 50-day EMA at 0.9027 and the 100-day EMA at 0.9144.
- RSI indicator suggests buyers are moving in, but key resistance levels lie ahead; downside risks emerge below the 20-day EMA.
USD/CHF holds to its earlier gains achieved after three days of consecutive gains. However, it’s trading well below the weekly high, which tested the 50-day Exponential Moving Average (EMA) at 0.9027 but failed to conquer the latter. Hence, the USD/CHF retreated beneath the 0.9000 figure, and as the Asian session begins is trading at 0.8984, up 0.05%.
USD/CHF Price Analysis: Technical outlook
Wednesday’s price action formed an inverted hammer candlestick that fell shy of cracking the 50-day EMA, though it retreated and stood above the 20-day EMA at 0.8951. However, the USD/CHF bias remains neutrally biased unless buyers reclaim the 50-day EMA at 0.902, followed by the 100-day EMA at 0.9144.
The Relative Strength Index (RSI) indicator entered the bullish territory, suggesting buyers are moving in, while the 3-day Rate of Change (RoC) jumped above the neutral line.
Therefore, the path of least resistance is upward biased in the near term. The USD/CHF first resistance would be the 0.9000 figure, followed by the 50-day EMA at 0.9027. Once cleared, ad upside risks lie at 0.9120, the April 10 high, followed by the April 3 daily high of 0.9196.
Conversely, downside risks for the USD/CHF emerge below the 20-day EMA at 0.8951, followed by the psychological 0.8900 mark.
USD/CHF Price Action – Daily chart
- USD/CAD has sensed some buying interest near 1.3440 as the focus shifts to Canadian Retail Sales data.
- S&P500 ended Wednesday’s session on a bullish note on hopes that US Treasury will get raise in debt-ceiling.
- Rising expectations of US debt ceiling raise approval have eased demand for US Treasury bonds.
The USD/CAD pair has attempted a recovery after gauging bids near 1.3440 in the early Asian session. The Loonie asset has rebounded as the US Dollar Index (DXY) has also picked bids near 102.80. Earlier, the USD index witnessed selling pressure after failing to sustain above the critical resistance of 103.00 as Republican House of Representatives Joseph McCarthy announced that negotiations with the White House will reach a deal of raising the US borrowing limit.
S&P500 ended Wednesday’s session on a bullish note on hopes that US Treasury will get raised in debt-ceiling and will be able to pay its obligated bills on time. Also, the expectations for a pause in the policy-tightening process are solid as tight credit conditions by the Federal Reserve (Fed) have resulted in lower credit disbursals by regional banks to small-scale firms. The overall issue is easing labor market conditions and firms are underutilizing their overall capacity due to lower working capital credit.
US delegates don’t have another option than to allow raising the US debt ceiling to avoid default in obligated payments by the Federal, however, spending initiatives will definitely cut ahead. Rising expectations of US debt ceiling raise approval have eased demand for US Treasury bonds. This has led to a jump in the 10-year US Treasury yields above 3.57%.
On the Canadian Dollar front, after recording some persistence in inflationary figures, investors are shifting their focus toward Friday’s Retail Sales (March) data. Monthly Retail Sales data is seen contracting by 1.4% vs. a contraction of 0.2% recorded earlier. A decline in households' demand would offset the impact of a rebound in inflation and will allow the Bank of Canada (BoC) to keep its interest rate policy steady further.
- AUD/USD grinds higher ahead of the key Aussie jobs report after bouncing off two-week low.
- US policymakers’ statements weigh on pessimism surrounding US debt ceiling expiry.
- Mixed Australia Wage Price Index, US housing numbers fail to impress traders.
- Upbeat Aussie employment report can validation RBA’s hawkish surprise and propel AUD/USD further towards the north.
AUD/USD portrays a typical pre-data anxiety around 0.6660 amid the early hours of Thursday’s trading in Asia, after posting a notable rebound from a fortnight low. That said, the Aussie pair initially dropped on Wednesday amid mixed sentiment and downbeat Aussie data but the upbeat sentiment allowed the risk-barometer pair to recover ahead of the key Aussie data.
After quick debt ceiling negotiations, the US policymakers appear quite optimistic as US President Joe Biden and House Speaker Kevin McCarthy both conveyed hopes of reaching an agreement over avoiding the default.
That said, US House Speaker Kevin McCarthy said in an interview with CNBC on Wednesday, "Now we have an opportunity to find common ground but only a few days to get the job done." Further, US President Joe Biden said that he is confident that they will be able to reach a budget agreement and noted that it would be catastrophic if the US failed to pay bills, per Reuters. "Will have a news conference on Sunday on the debt issue,” added US President Joe Biden.
Apart from the US-inspired run-up, hopes of more investment from China also underpinned the AUD/USD recovery as China’s State Planner National Development and Reform Commission of the People's Republic of China (NDRC) mentioned on Wednesday that it'll take measures to unleash consumption potential and to make continuous efforts in stabilizing and expanding manufacturing investment.
While portraying the mood, Wall Street closed with gains while Treasury bond yields remain firmer at a two-week high. It’s worth noting, however, that the US Dollar also stays upbeat despite the latest retreat from a seven-week high, which in turn prods the AUD/USD bulls.
On the other hand, the US data came in mixed while the Aussie Wage Price Index for the first quarter (Q1) of 2023 also arrived as unimpressive. That said, Australia’s Wage Price Index repeated 0.8% QoQ figures for the first quarter (Q1) of 2023, below the 0.9% market consensus, whereas the YoY numbers improved to 3.7% versus 3.6% expected and 3.3% previous readings. Further, US Housing Starts came out as unimpressive with 1.401M figures for April versus 1.4M expected and 1.371M prior (revised). Alternatively, the Building Permits for the said month eased to 1.416M from 1.437M edited previous readings and market forecasts.
Moving on, AUD/USD pair traders should close attention to today’s Australia Employment data for April as the headline Employment Change is expected to ease to 25K, versus 53K prior, whereas the Unemployment Rate and Participation Rate may stay unchanged at 3.5% and 66.7% respectively. Should the data match downbeat forecasts, or show a further easing of the jobs market, the RBA will have a tough time justifying the latest hawkish surprise, which in turn can weigh on the pair prices.
Also read: Australian Employment Change Preview: Another strong report?
More importantly, headlines surrounding the US debt ceiling and second-tier US data can direct the AUD/USD moves amid a likely busy day.
Technical analysis
A daily closing beyond a convergence of the 21-DMA and 10-DMA, near 0.6685 at the latest, becomes necessary for the AUD/USD bulls to keep the reins. That said, repeated failures to cross 0.6700 keeps the pair sellers hopeful of visiting an upward-sloping support line from early March, close to 0.6610 at the latest.
- NZD/USD bulls remain in control riding the trendline support.
- A break of the trendline support opens risk of a move lower.
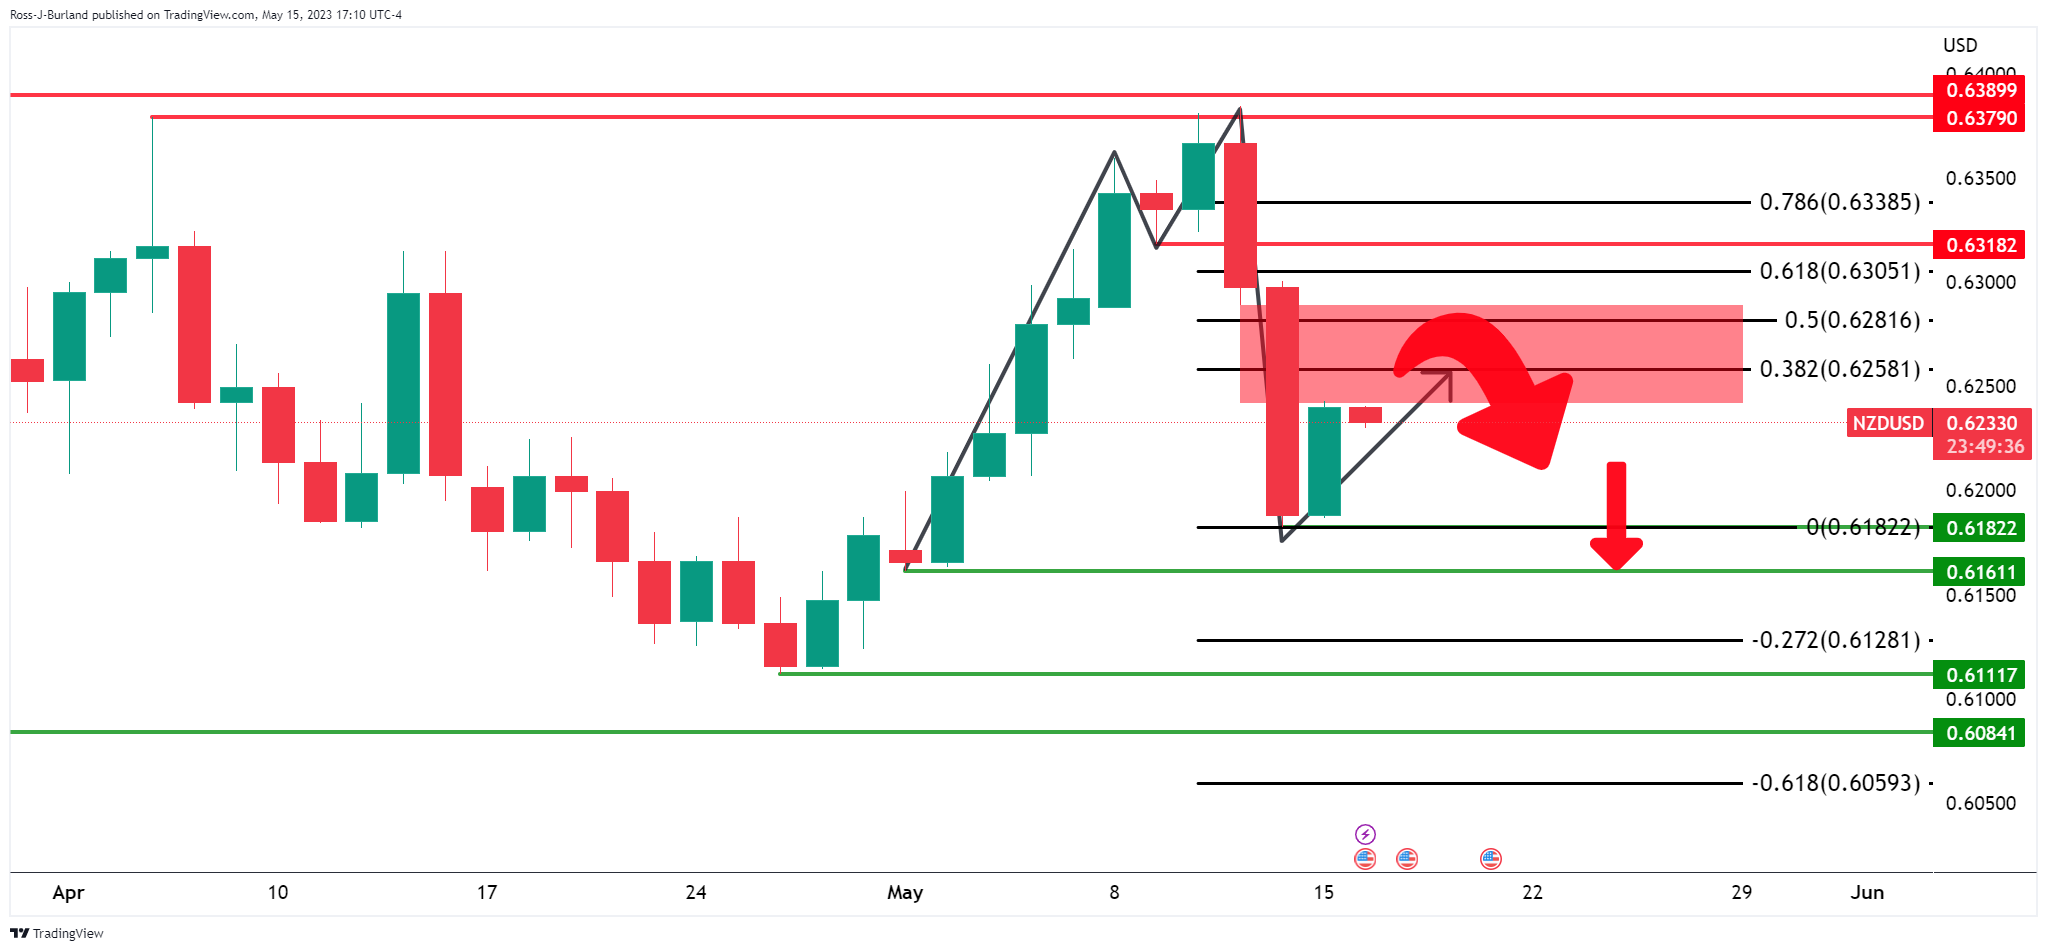
NZD/USD was moving higher midweek and reached 0.6273 after climbing from a low of 0.6224. At the time of writing, the pair is trading flat at around 0.6243.
´´The Kiwi is at the upper end of the week’s ranges early this morning following a whippy night that also saw a rebound in the USD, which has of course meant that the Kiwi has done well on most crosses,´´ the analysts at ANZ Bank said in a note on Wednesday.
The analysts note that today is Budget day and say that it has been flagged as a no-frills one.
´´Rating agencies are hoping for restraint, and FX markets are in turn hoping that rating agencies give it a tick. But with the tax take slowing, demands on the public purse growing, and deficits expected to persist for longer, FX markets are worried rating agencies might caution us, especially given our record current account deficit.´´
Meanwhile, the US Dollar index, a measure of the greenback's value against six major currencies, climbed as high as 103.11 and to its strongest level since late March. There was the possibility of agreement on the US debt ceiling while US President Joe Biden expressed confidence an agreement will be reached. House Representative Speaker Kevin McCarthy argued that a debt-ceiling agreement by Sunday is doable. Meanwhile, US Vice President Kamala Harris is to brief on preventing a default on Thursday.
NZD/USD technical analysis
As per the prior day´s analysis, NZD/USD bulls in the market and eye a firm correction, the pair moved up into the 38.2% Fibonacci resistance and came close to a 50% mean reversion:
Prior analysis:
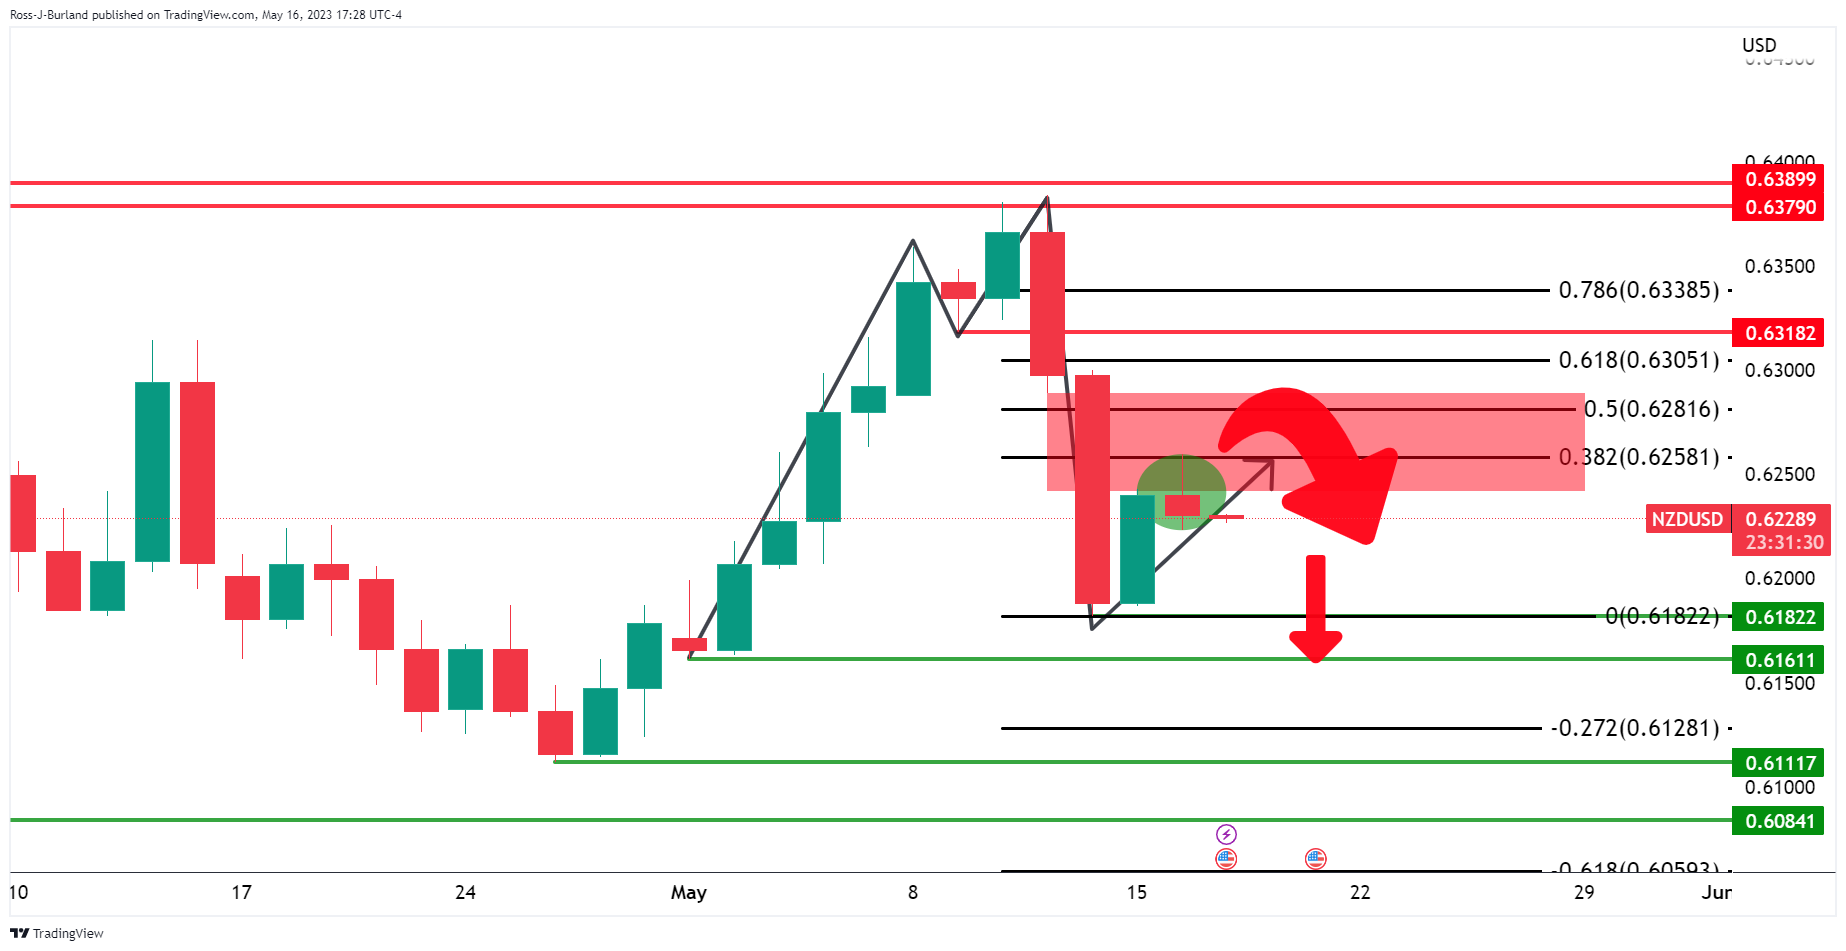
Update 1:
Update 2, live market:
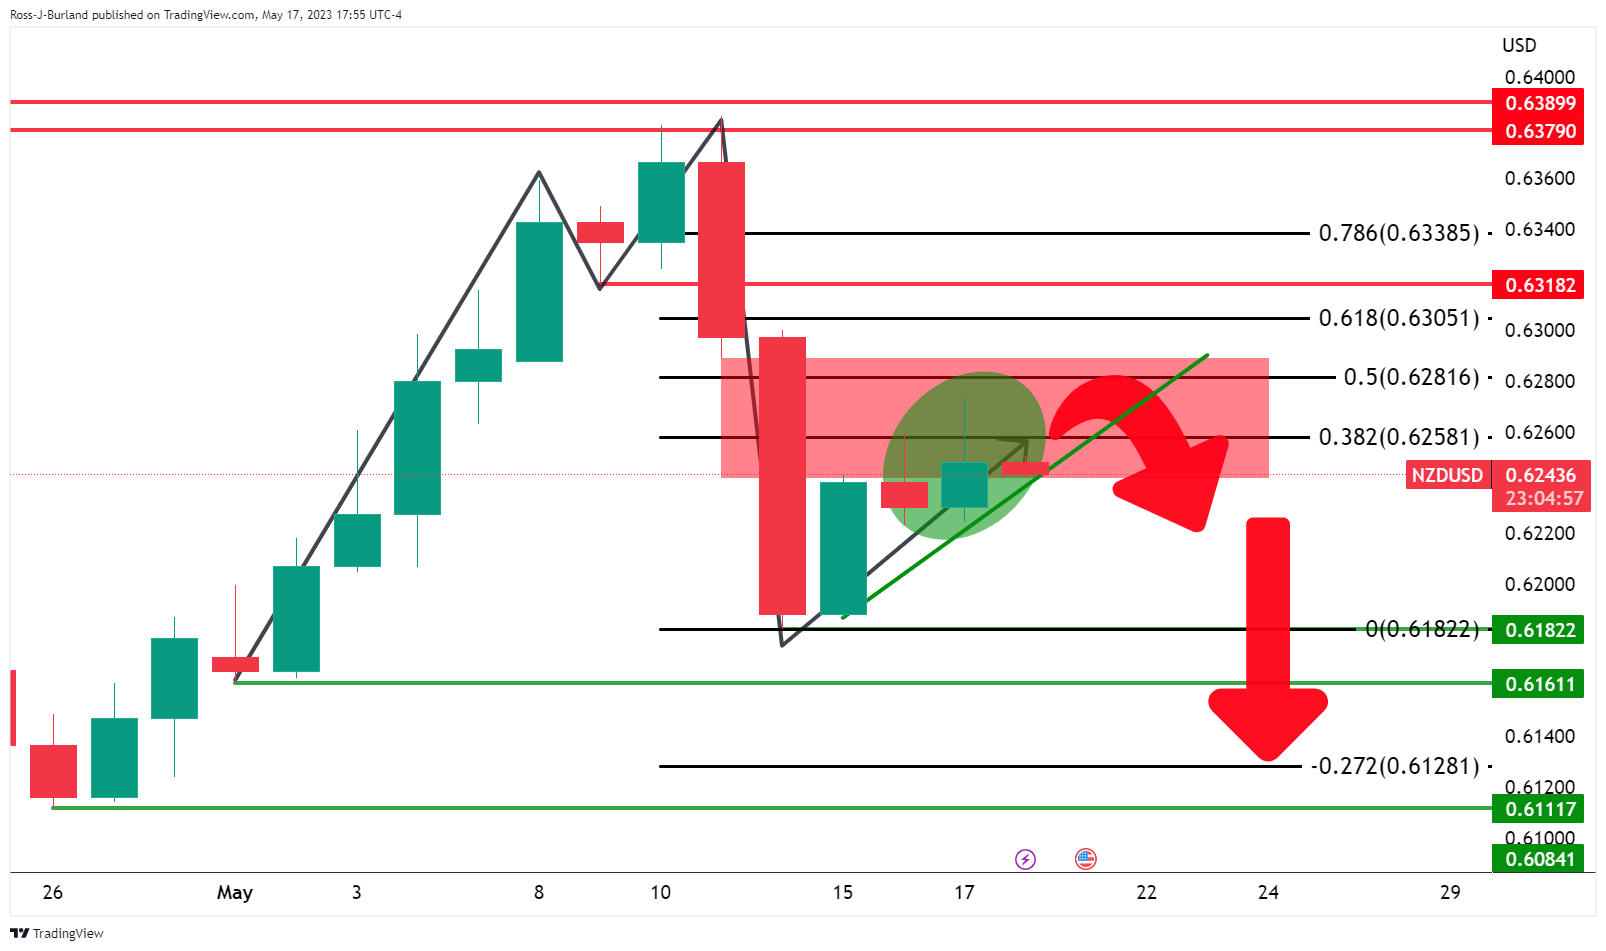
There are still prospects of a move lower although the 4-hour and 1-hour charts can be used to gauge as to whether there is going to be a deceleration in the bullish correction and so far, it is early days still. After all, the price is still on the front side of the bullñish dynamic trendline support.
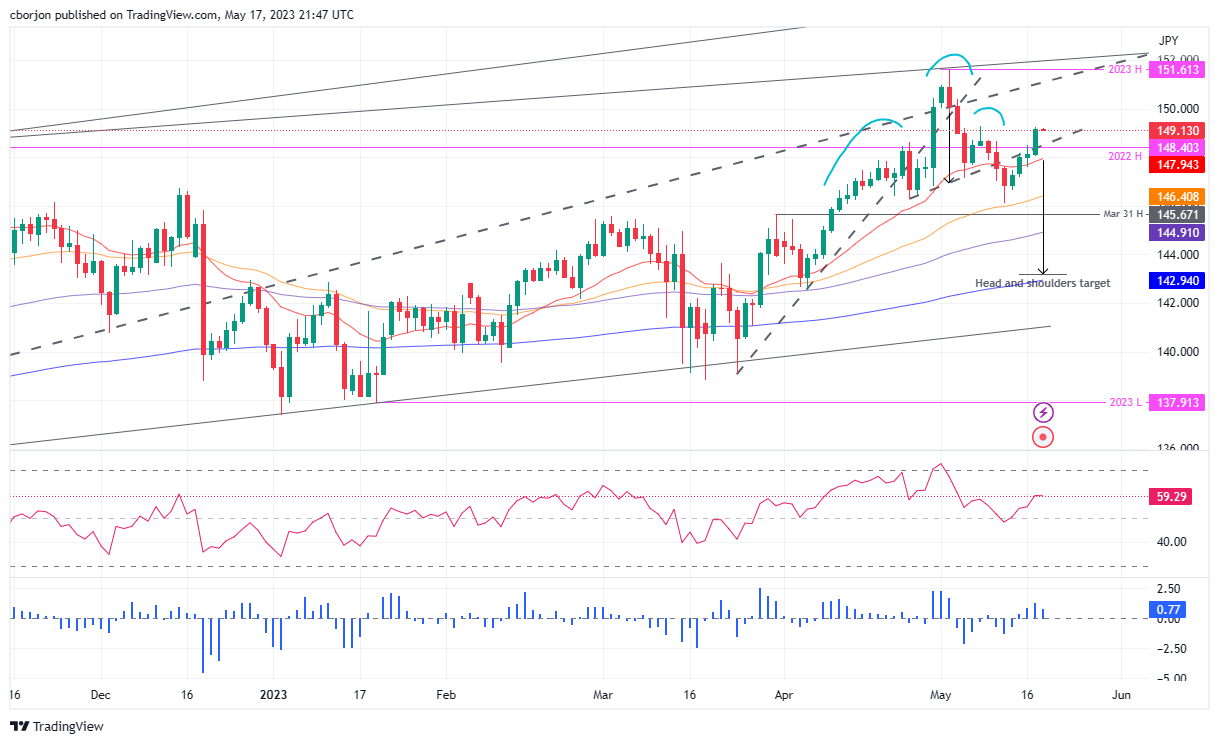
- EUR/JPY breaks head-and-shoulders neckline, bolstered by high EU inflation and hawkish ECB comments.
- The uptrend remains intact as the pair holds above the 20-day EMA, but further gains require a break above the month-to-date high.
EUR/JPY rallied sharply on Wednesday, breaking above a head-and-shoulders chart pattern neckline, invalidating the pattern, as buyers emerged on a high inflation report in the Eurozone (EU). That, alongside European Central Bank’s (ECB) hawkish commentary, opened the door for further gains. As the Asian session begins, the EUR/JPY trades at 149.17, registering a minuscule gain of 0.01%.
EUR/JPY Price Analysis: Technical outlook
After the EUR/JPY struggled to crack the 2022 high of 148.40, the cross-currency pair extended its gains and cleared the neckline of a head-and-shoulders chart pattern. Therefore, the EUR/JPY’s uptrend remains intact in play, as also the pair jumped off the 20-day Exponential Moving Average (EMA) at 147.94. Nevertheless, to further cement its bias, a break above the month-to-date (MTD) high of 149.26 is needed, so the EUR/JPY could threaten to crack the 150.00 figure.
The Relative Strength Index (RSI) indicator shows buyers entered the market but has turned flat as the Asian session begins. The 3-day Rate of Change (RoC) portrays that buying pressure is fading; hence, mixed signals around the pair could prevent traders from opening fresh long positions.
On the upside, if EUR/JPY buyers reclaim 49.26, the psychological 150.00 figure is up for grabs. A breach of the latter will expose the year-to-date (YTD) high of 151.61.
Conversely, the EUR/JPY first support would be the 149.00 mark. Downside risks will emerge below the latter, like the 2022 high turned support at 148.40, ahead of the 20-day EMA at 147.94.
EUR/JPY Price Action – Daily chart
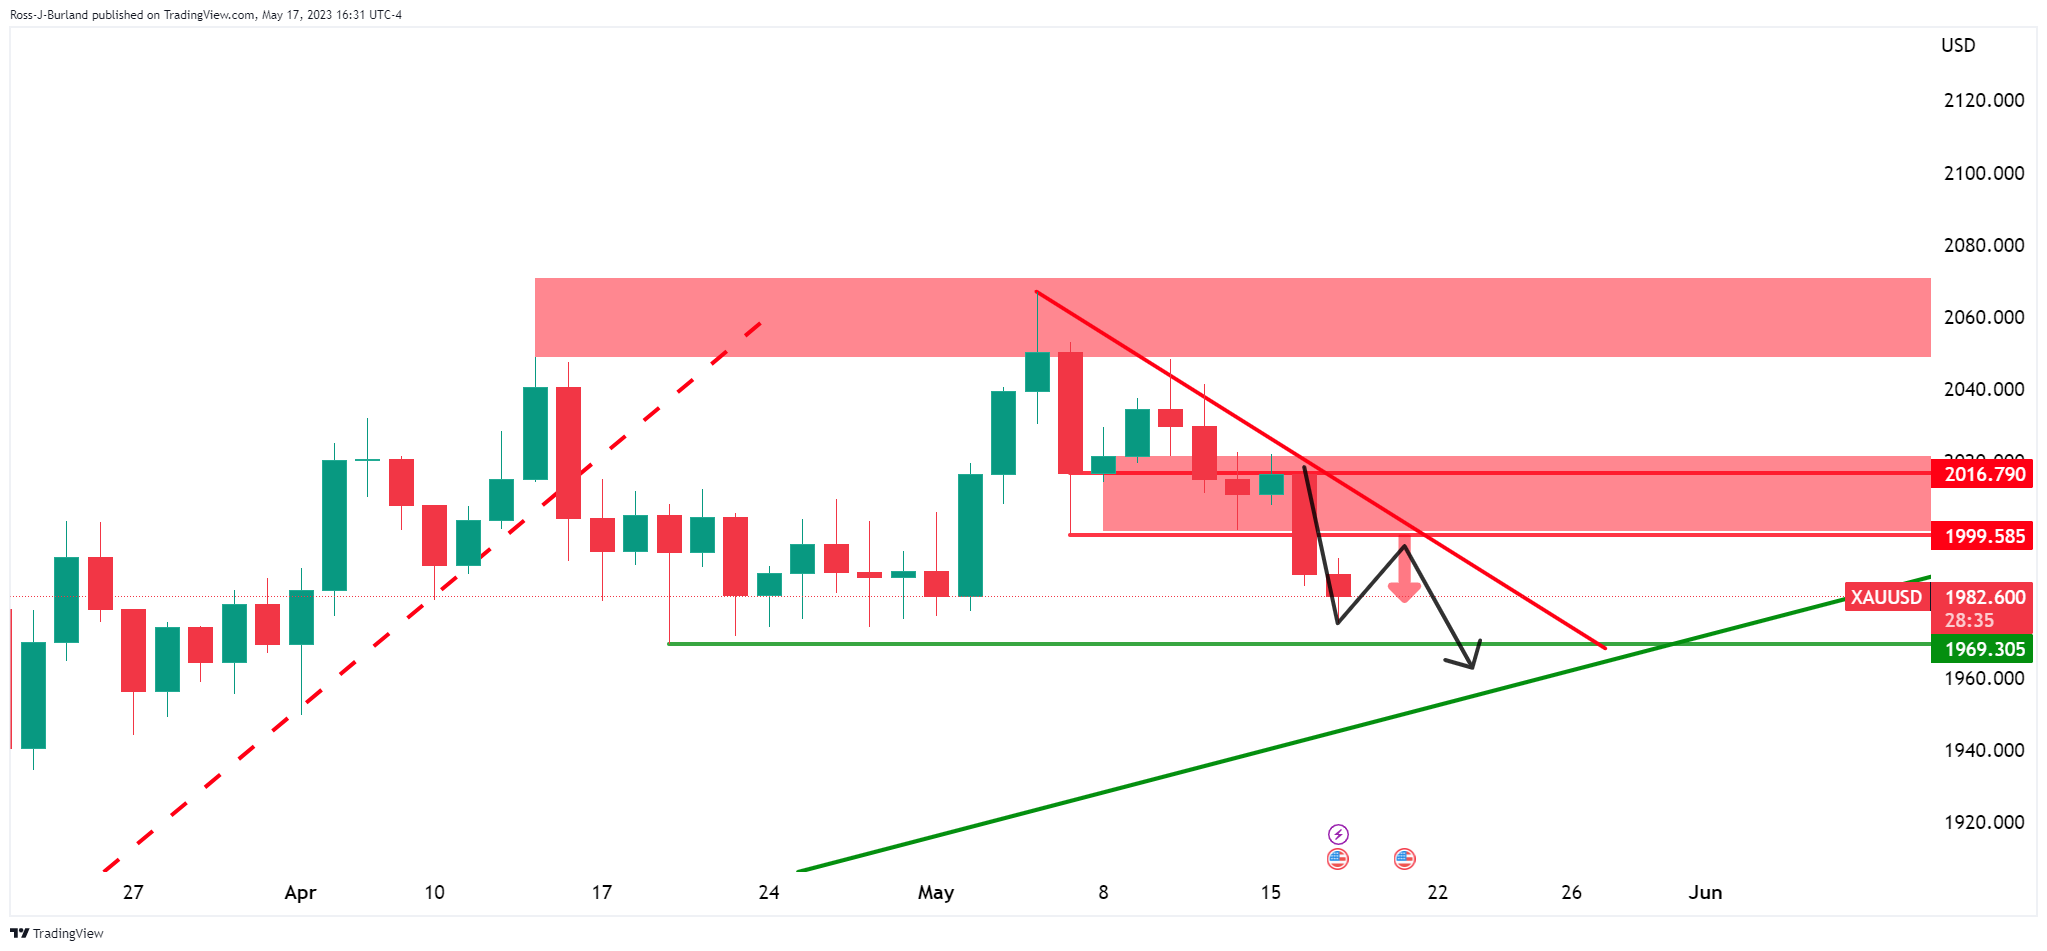
- Gold price is on the front side of the bearish trend.
- Bears eye the bullish trendline for a test as US Dollar firms.
Gold price dropped on Wednesday, pressured for a second day below the psychological $2,000 mark in the face of a firm US dollar and US Treasury yields.
The US Dollar has been in favor with favorable US data and while the debt-ceiling negotiations continue in Washington. The threat of potential defaults has been pushing up treasury yields while the outlook is mixed for the greenback.
However, there was some improvement in the optimism over the possibility of agreement on the US debt ceiling while US President Joe Biden expressed confidence an agreement will be reached. House Representative Speaker Kevin McCarthy argued that a debt-ceiling agreement by Sunday is doable. Meanwhile, US Vice President Kamala Harris is to brief on preventing a default on Thursday.
The US Dollar index was last seen up 0.27% to 102.87, making gold more expensive for international buyers while the US two-year note was last seen paying 4.165%. The 10-year note printed a high of 3.57%.
Analysts at TD Securities have said that ´´the gold price may well be near all-time highs, but the positioning set-up is inconsistent with a cycle top.´´
´´The bar for algorithmic liquidations in gold is high, whereas Shanghai trader length is also nearing year-to-date lows,´´ the analysts added.
´´Dry-powder analysis also highlights that position sizing for gold bulls remains near average levels, and our gauge of discretionary trader positioning continues to suggest that this cohort has yet to participate in the precious metals rally.´´
Lastly, the analysts said, ´´looking forward, we expect a hoard of discretionary capital to flow towards gold, given strong historical linkages with market expectations for a deepening Fed cutting cycle over the next year. In turn, we expect gold to print new cycle highs over the coming months.´´
Gold daily chart
Gold price is pressured on the front side of the bearish trend on the daily charts and is headed toward both horizontal and dynamic support areas.
Gold H4 chart
From a 4-hour perspective, the price could continue lower to support or it may well correct a little before the next decisive move lower.
A busy session is ahead in Asia, with several key reports scheduled for release. The most important report will be the Australian employment data. In New Zealand, the government will deliver the Budget 2023, and wholesale inflation data is also due. Japan will report its trade balance figures. The Kiwi has been outperforming, but the Budget and the PPI could challenge its strength. The Aussie has been under pressure, and the jobs numbers could be crucial for its performance.
Here is what you need to know on Thursday, May 18:
Wall Street indexes rose more than 1%, while the US Dollar pulled back amid an improvement in market sentiment. However, higher US yields provided support to the Greenback. Easing bets for year-end rate cuts pared further, and on the contrary, odds of a rate hike in June advanced on US economic data, optimism about a debt ceiling deal, and fewer concerns about the banking sector.
Debt ceiling talks show some progress, but a resolution is not yet on the table. US President Biden shortened his trip to Asia. Housing data from the US came in mixed. On Thursday, the US will report weekly Jobless Claims, the Philly Fed, and Existing Home Sales.
The US Dollar Index (DXY) finished higher near 103.00, but off highs. The US 10-year Treasury yield rose to 3.57%, the highest level in almost a month.
EUR/USD hit monthly lows near 1.0800 before rising to the 1.0850 area. However, the Euro lagged following comments from European Central Bank (ECB) officials with a dovish tilt. EUR/GBP posted the lowest daily close since mid-December around 0.8675.
GBP/USD hit weekly lows at 1.2420 and then rose back to 1.2500. Bank of England (BoE) Governor Bailey sounded hawkish, helping the Pound.
USD/JPY jumped from 136.40 to 137.55, posting the strongest close since December, boosted by higher government bond yields and the better tone in equity markets. Japan reported better-than-expected Q1 GDP data and will release trade data on Thursday.
AUD/USD reached weekly lows at 0.6627 but finished modestly higher, uplifted by a weaker US Dollar. Australia will release the April Employment report on Thursday, and the market consensus is for a 25,000 increase in jobs.
NZD/USD rose on Wednesday and peaked at the 100-day Simple Moving Average (SMA) at 0.6270 before pulling back a bit. New Zealand's Q1 Producer Price Index is due on Thursday, and the government will present the Budget 2023.
The Loonie outperformed among commodity currencies, boosted by a 2.70% rally in crude oil prices. USD/CAD dropped almost a hundred pips from the intraday highs, settling at 1.3445.
On a volatile day, USD/MXN climbed to 17.68 and then eased to 17.55. The Bank of Mexico will announce its decision on Thursday, and it is expected to be a close call.
Gold remains under pressure while silver offered some signs of stabilization. XAU/USD bottomed at $1,974 but is still holding above the crucial support area of $1,970.
Like this article? Help us with some feedback by answering this survey:
- GBP/USD bulls hit a brick wall in the Wall Street risk rally.
- The daily chart offers a bearish scenario for the days ahead.
GBP/USD is back to flat in the day after initial losses that were sparked in the face of the Bank of England Governor Andrew Bailey reiterating that he expected price pressures to ease, as soon as April. Also, data showed Britain's jobless rate rose to 3.9%, while the rate of increase in total pay held steady. At the time of writing, GBP/USD is trading near 1.2490 and is correcting lower from a 4-hour resistance area.
GBP/USD daily chart
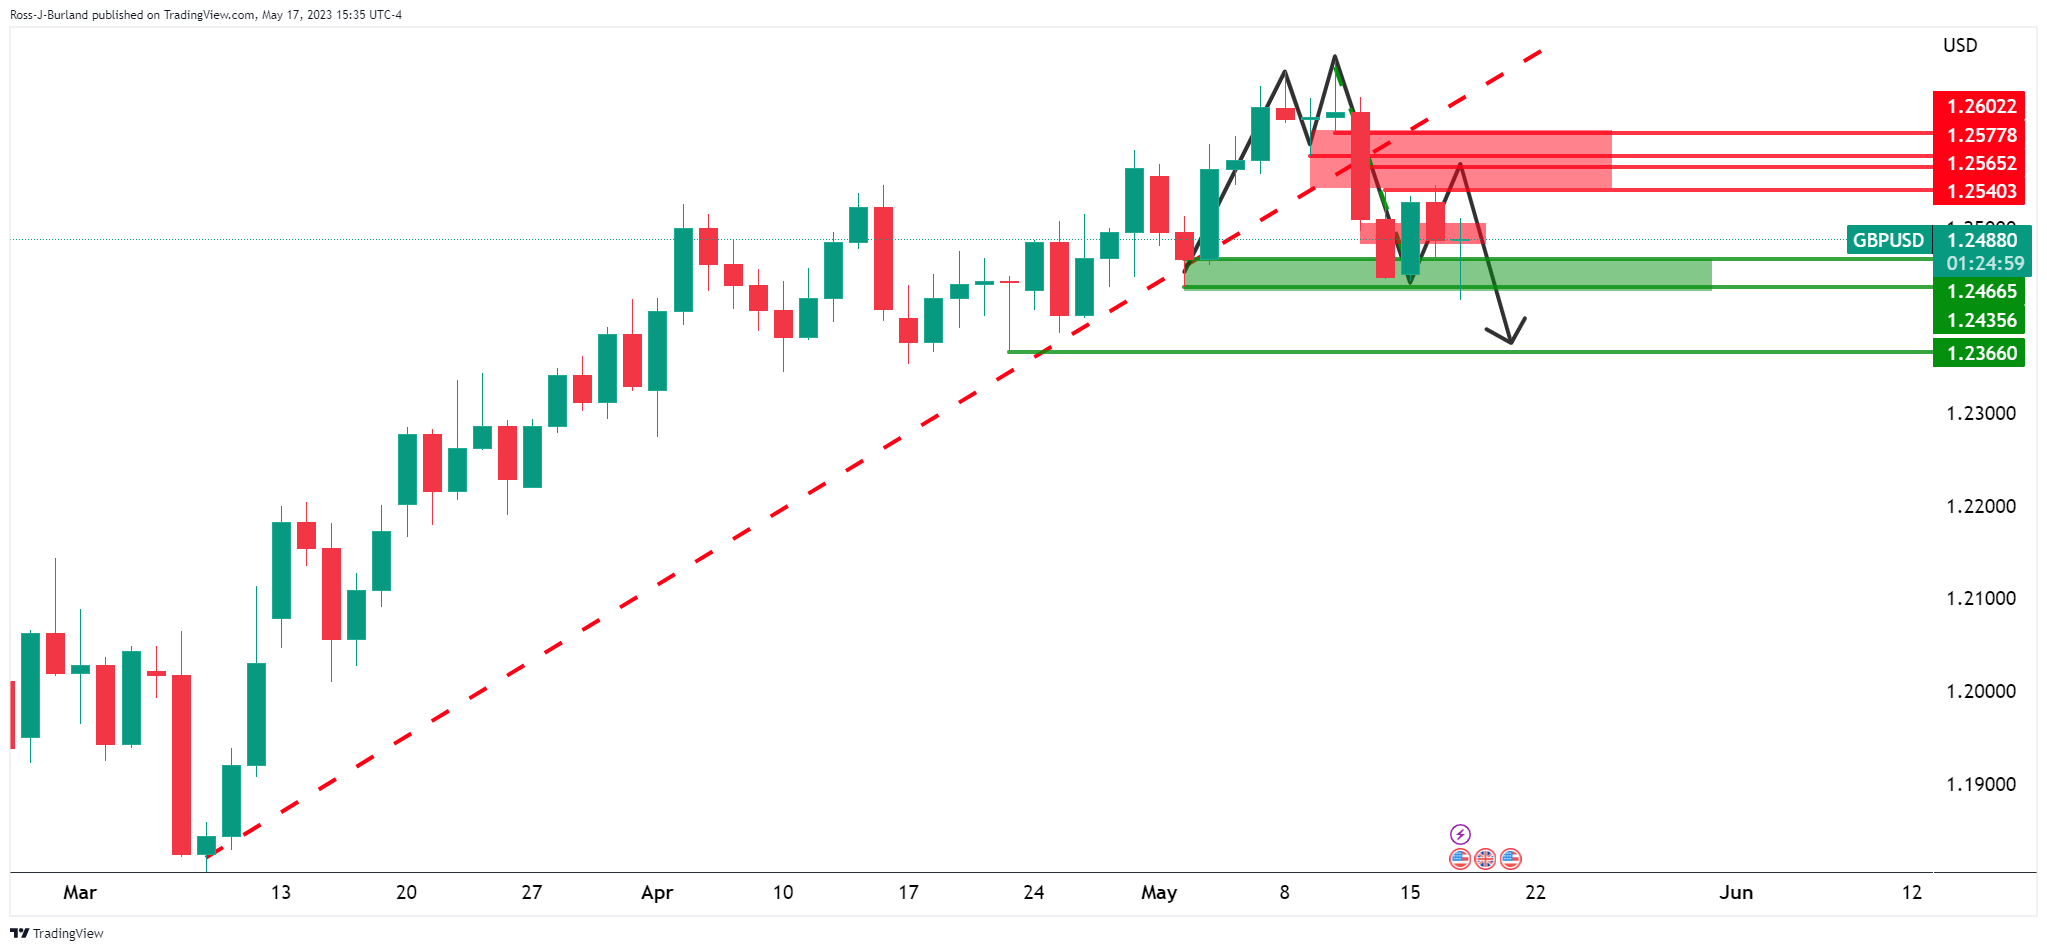
The M-formation is a topping pattern that has formed as the potential for the final stage of the prior bullish rally. The price is now on the backside of that trendline, so shorts could be the more favorable playbook for traders:
GBP/USD H4 chart
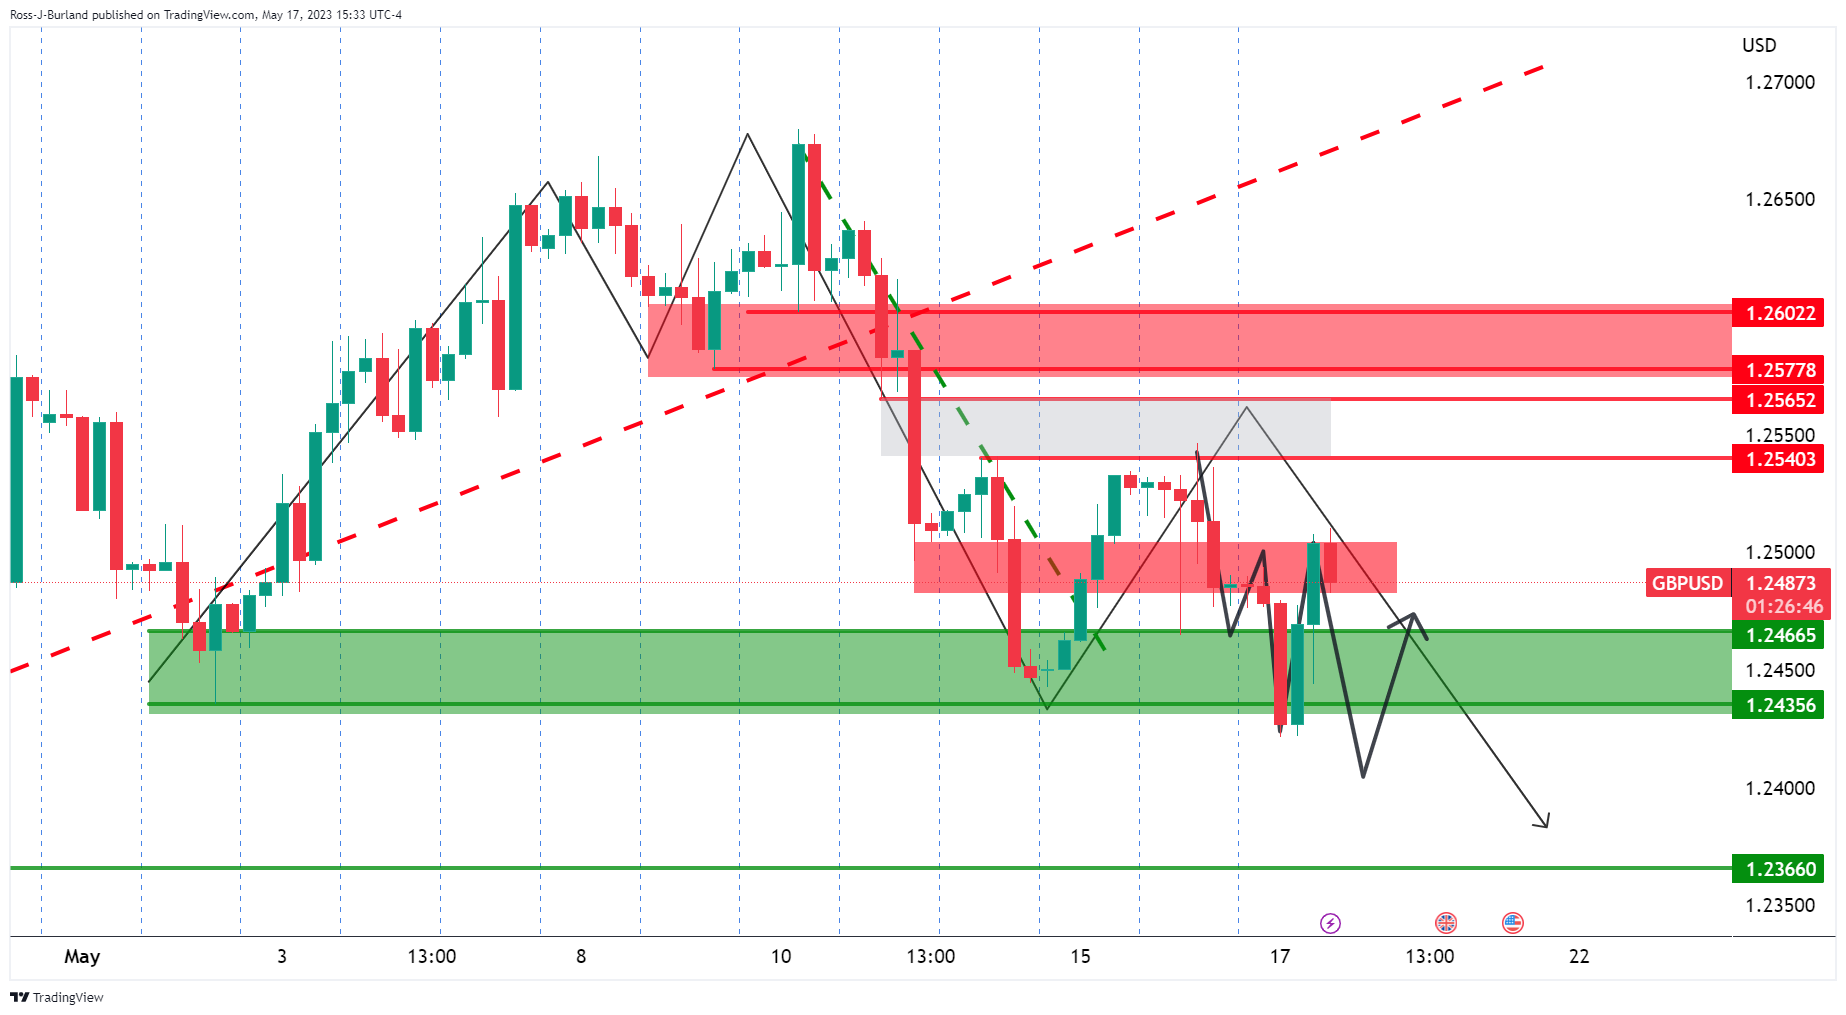
The price has shot up to test resistance and while there are prospects of an onward continuation, the price can easily head lower as illustrated in the chart above.
- Optimism around US debt ceiling talks and solid economic data push US T-bond yields higher.
- US housing market data shows improvement, with Building Permits and Housing Starts exceeding expectations.
- Eurozone inflation remains high, supporting further ECB tightening, while Fed officials maintain hawkish rhetoric.
EUR/USD continued to trend lower on Wednesday and reached a new six-week low of 1.0810 on optimism around the US debt ceiling talks amidst a tranche of positive economic data in the US. Hence, US T-bond yields jumped, underpinning the US Dollar (USD), a headwind for the Euro (EUR). At the time of writing, the EUR/USD is trading at 1.0838.
US T-bond Yields climb, while Eurozone inflation data supports ECB tightening
Wall Street continues its advance as sentiment improvement keeps traders leaning on riskier assets. US Treasury bond yields had risen, bolstering the US Dollar (USD) to new weekly highs. Negotiations between the White House and the US Congress about the debt ceiling seem to advance, as both sides commented that a default is not an option. The US House Speaker Kevin McCarthy commented that reaching an agreement this week is “doable.”
US data on Wednesday showed the housing market is improving. Building Permits for April dropped -1.5%, less than the expected -3% plunge, while Housing Starts for the same period smashed March’s -4.5% contraction and jumped by 2.2%. That, alongside Tuesday’s Retail Sales and Industrial Production printing positive numbers, paints a solid economic outlook in the United States.
Therefore, speculators trimmed the chances of seeing the US Federal Reserve (Fed) cutting rates three times a year to only two. The CME Fed Watch Tool shows odds of 40.8% for a 50 bps rate cut by the year’s end, higher than Tuesday’s reading.
US Federal Reserve officials crossed newswires. Loretta Mester, Thomas Barkin, and Raphael Bostic continued to push back against rate cuts, though the latter has moderated its stance. On the dovish front, Aaron Golsbee and Lorie Logan took a cautious stance but emphasized that no rate cuts are expected in 2023.
Across the pond, Eurozone (EU) inflation was aligned with estimates, though it remains at around 7% YoY in headline inflation. The core Harmonized Index of Consumer Prices (HICP) rose by 5.6%, aligned with estimates. Given that inflation remains three times the European Central Bank (ECB) objective, further tightening by the ECB is expected.
ECB officials continued to lean towards the hawkish side, but the ECB’s Vice President Luis de Guindos said that the ECB tightening is mostly done but still has a way to go.
EUR/USD Technical Levels
- Wall Street stocks rally on optimism in earnings and the debt ceiling outlook.
- US500 index is tracking higher towards key resistance area.
US stock indexes rose on Wednesday and the S&P 500 was up 43 points, or 1.07%%, at 4,153 at the time of writing. The index made a high of 4,164.67 on the day, rising from a low of 4,113.62.
The index was helped by Tesla and after Western Alliance amid optimism about a potential breakthrough in the deadlock in Washington over the nation's debt limit. The debt ceiling talks continue after top-ranking lawmakers met with President Joe Biden at the White House on Tuesday. House Representative Speaker Kevin McCarthy argued that a debt-ceiling agreement by Sunday is doable. Meanwhile, US Vice President Kamala Harris is to brief on preventing a default on Thursday.
Stocks in Tesla Inc extended gains to rise 3.9% after its annual shareholder meeting on Tuesday. ´´Top boss Elon Musk played down market rumors that he may step down as CEO of Tesla, touched upon two new mass-market models the company is developing, and reaffirmed that deliveries of its long-delayed Cybertruck pickup would start this year,´´ Reuters reported.
Reuters also reported that ´´US regional banks rose, led by a 14.0% rise in Western Alliance Bancorp
as the lender's deposit growth exceeded $2 billion and brokerage Bank of America Global Research resumed coverage of the bank with a "buy" rating.´´
US500 technical analysis
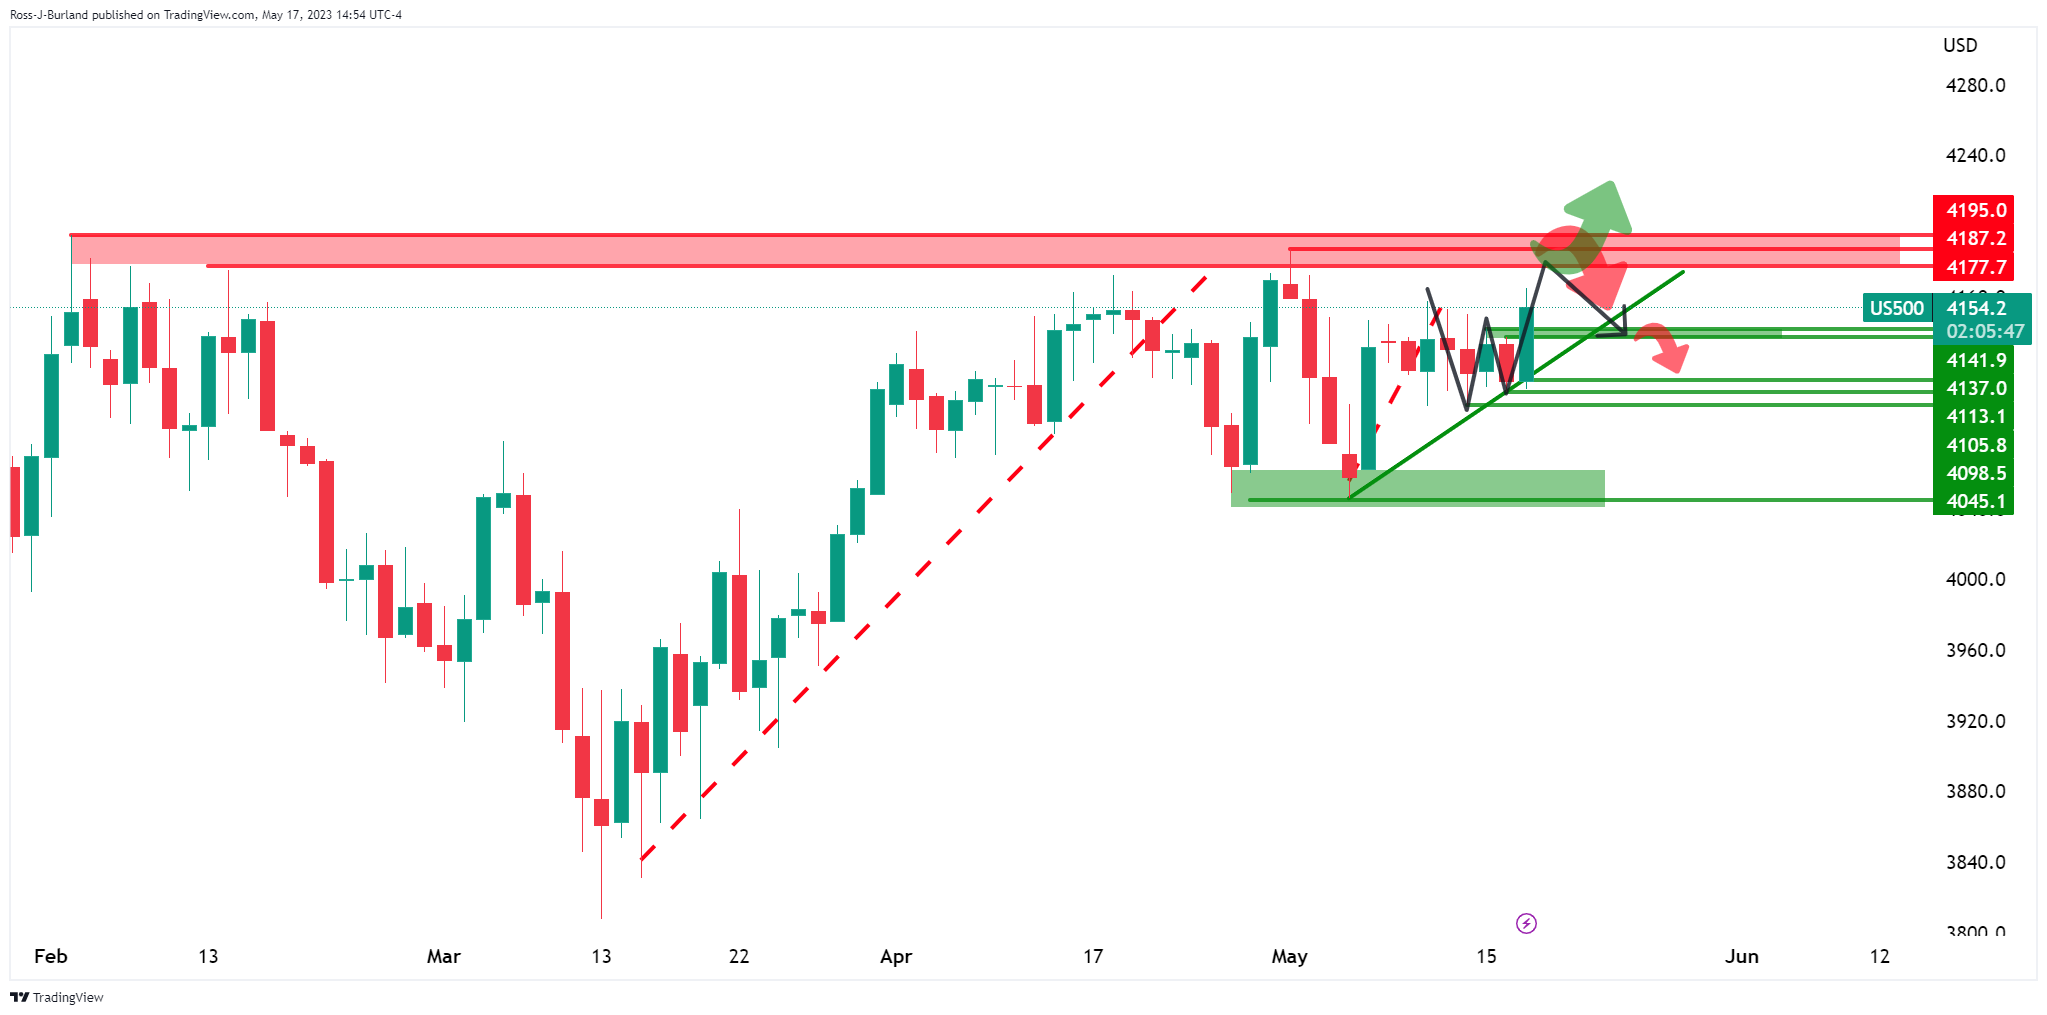
The index has rallied and is now facing a layer of resistance that could lead to a downside correction into the W-formation´s neckline and a test of dynamic support in the sessions ahead.
- AUD/USD recovers from the lows and seeks fresh highs for the day.
- A risk-on rally on Wall Street is supporting AUD ahead of the local key jobs data event.
AUD/USD has come back to life in the midday New York session as it attempts to print a fresh high for Wednesday. The pair has traveled between a low of 0.6629 and a high of 0.6673 so far.
Earlier in the day, the US Dollar rallied to a seven-week high as investors moved in due to its safe-haven allure amid the risk of a US debt default. Additionally, firm US Consumer Spending and Housing data gave the currency a boost as traders anticipated the higher odds of another Federal Reserve interest rate hike.
The US Dollar index, a measure of the greenback's value against six major currencies, climbed as high as 103.11
DXY, its strongest level since late March. It was last up 0.2% at 102.806.
The move in the high beta Aussie was helped by a rise in US indices on Wall Street. The debt ceiling talks continue after top-ranking lawmakers met with President Joe Biden at the White House on Tuesday. House Representative Speaker Kevin McCarthy argued that a debt-ceiling agreement by Sunday is doable. Meanwhile, US Vice President Kamala Harris is to brief on preventing a default on Thursday.
All eyes on Aussie jobs
Meanwhile, domestically, net AUD short positions had moved up to their highest levels since November as the Reserve Bank of Australia moves towards a perceived peak in the policy rate. With that being said, however, we have key data out later today in the Employment report.
´´After the strong jobs report last month, we expect Employment to expand at a still-firm pace of +20k in April (cons: 25k, Mar: 53k) though the risk is biased to the upside given favorable seasonals,´´ analysts at TD Securities said.
´´We think labour demand is still outstripping supply and expect the tightness in the labour market to only ease gradually. We look for the participation rate to stay unchanged at 66.6% and the unemployment rate to rise to 3.6% (last: 3.5%) due to higher working-age population growth,´´ the analysts explained. ´´Overall, we think another strong jobs report may pressure the RBA to retain a hawkish tone and the June meeting could be another live decision.´´
- International Energy Agency predicts supply to fall behind demand by 2 million bpd in H2.
- Positive developments in US debt ceiling talks boost market sentiment, lifting oil prices.
- US crude oil prices rise despite increased inventories as China’s economic growth tempers.
Western Texas Intermediate (WTI) advanced more than 3% in the late New York session, exchanging hands at around the $72.90 area due to renewed optimism after UD debt ceiling negotiations pointed to an agreement. At the same time, the International Energy Agency (IEA) revealed that demand would outpace supply, bolstering oil prices.
Oil demand is set to outpace supply, while China accounts for 60% of the demand increase in 2023
The IEA revealed that supply would surpass demand by 2 million barrels per day (bpd) in the second half of the year, with China’s making up 60% of the oil demand increase in 2023.
In the meantime, US President Joe Biden commented that he’s confident about reaching a debt ceiling as he embarks on a trip to Japan. The US House Speaker Kevin McCarthy commented that he planned to be engaged in negotiations, while Biden said he planned to remain in close contact with the speaker and negotiators.
US crude oil prices defy the increase in US inventories, according to the US Energy Information Administration (EIA). Stockpiles rose 5 million barrels in the last week to 467.6 million barrels, compared to analysts’ expectations for a drop of 900K.
Aside from this, China’s recent economic data revealed that the economy is tempering its growth. According to sources cited by Reuters, “A bunch of Chinese macro-economic data for April released on Tuesday confirmed the narrative of a patchy and slow recovery in the country and continue to weigh on oil market sentiment.”
WTI Price Analysis: Technical outlook
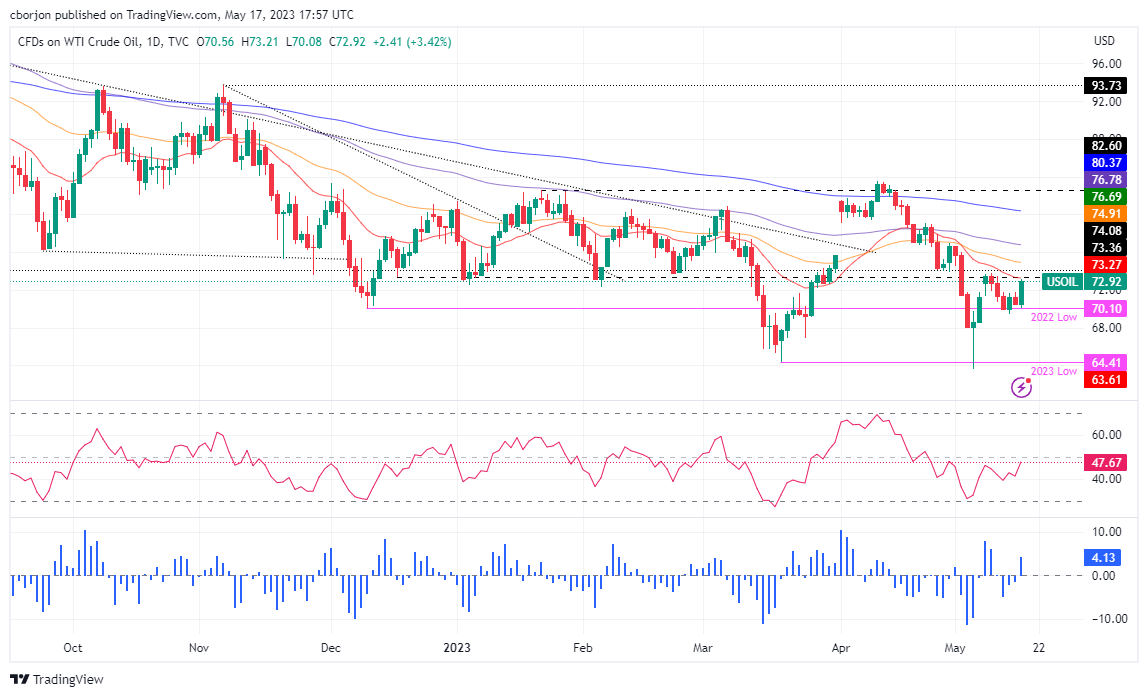
WTI has recovered some ground after dipping below the last year’s low of $70.10, reaching a two-week low of $69.44. However, WTI buyers moved in, lifting the price toward the 20-day Exponential Moving Average (EMA), which, once cleared, could pave the way to test the 50-day EMA at $74.91. Once cleared and up next would be the 100-day EMA at $76.78. Nevertheless, the Relative Strength Index (RSI) indicator continues at bearish territory, suggesting that sellers remain in charge. Therefore, WTI’s failure to crack the $73.00 PB area and a dip towards the $69.00 area is on the cards.
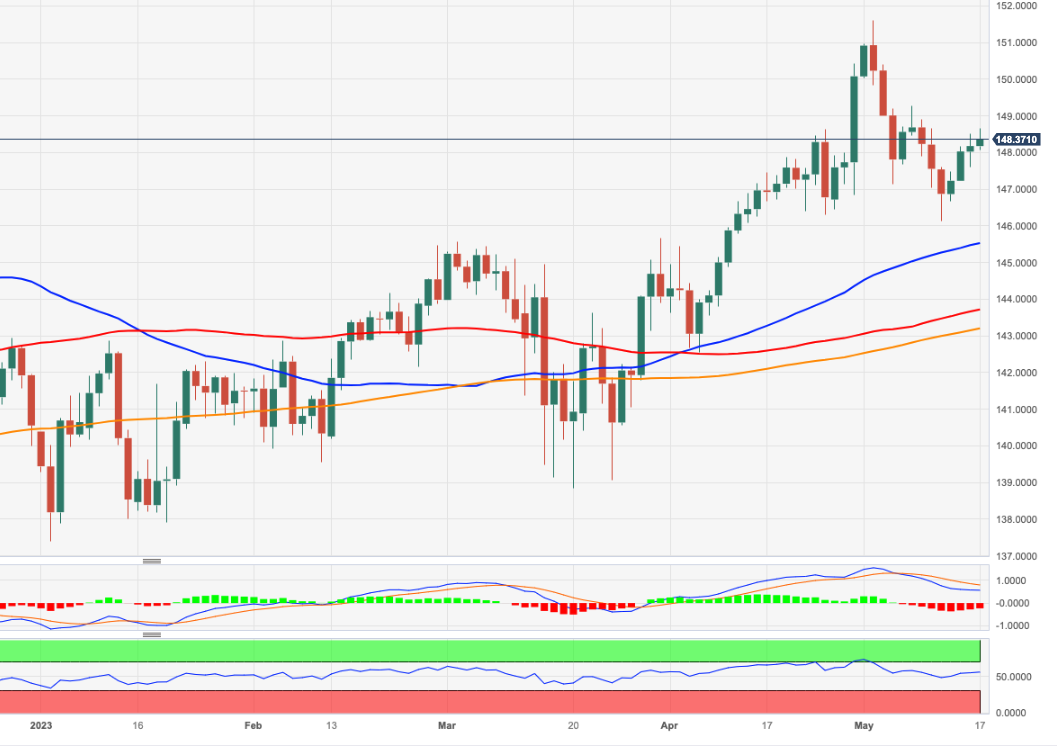
- Solid US housing market data and upbeat sentiment in US equities weaken the Japanese Yen.
- Improved US debt ceiling negotiations and hawkish Fed speakers keep the US Dollar climbing.
- Japanese economy surprises with better-than-expected Q1 GDP and consumption figures.
USD/JPY rises to fresh two-week highs of 137.57, propelled by higher US Treasury bond yields due to solid US data reported on Tuesday and Wednesday. In addition, an improvement in US debt ceiling negotiations between the White House and the US Congress keeps the US Dollar (USD) rising. Therefore, the USD/JPY is trading at 137.49 after hitting a daily low of 136.30.
Rising US Treasury bond yields and upbeat sentiment weaken the safe-haven Yen
US equities portray an upbeat sentiment in the financial markets, to the detriment of safe-haven peers, like the Japanese Yen (JPY). The US housing market shows signs of improvement, as April’s Building Permits dropped to -1.5%, better than the expected -3% plunge, as permits improved from 1.437M to 1.416M. Housing Starts for the same period jumped 2.2%, smashing the prior month’s data of -4.5%, growing at a 1.401M pace.
That data, alongside the latest Retail Sales and Industrial Production figures, showed that the US economy is pointing to a soft landing. The Atlanta Fed GDP Now for Q2 rose from a previous 2.6% to 2.9%.
Therefore, traders had begun to slash their bets of three rate cuts by the US Federal Reserve in 2023 amidst the ongoing hawkish rhetoric by some officials. Loretta Mester, Thomas Barkin, and Raphael Bostic continued to push back against rate cuts, though the latter has moderated its stance. On the dovish front, Aaron Golsbee and Lorie Logan took a cautious stance but emphasized that no rate cuts are expected in 2023.
Odds that the Fed would cut rates by 50 bps toward year’s end lie at 40.8%, compared to Tuesday’s 39%, according to the CME FedWatch Tool.
The US debt ceiling theme continues to grab USD/JPY traders’ attention, though a negotiation improvement calmed investors’ nerves. The US House Speaker McCarthy stated the two sides remain apart. Nevertheless, he acknowledged that a deal could be done by the week’s end. Wall Street cheered Tuesday’s results, as the three major indices posted gains above the 0.30% threshold.
Given the backdrop, US Treasury bond yields advanced, with the 10-year benchmark note rate at 3.570%, gaining three basis points. Consequently, the US Dollar Index (DXY), which tracks the US Dollar performance against a basket of six currencies, advanced 0.23%, up at 102.830.
In the meantime, the Japanese agenda revealed a surprise in Gross Domestic Product in Q1, at 0.4%, exceeding estimates of 0.1%. On a year-over-year (YoY), figures rose by 201%, above the prior’s 1.2%, while Consumption rose by 0.6%, above estimates of 0.4%.
USD/JPY Price Analysis: Technical outlook
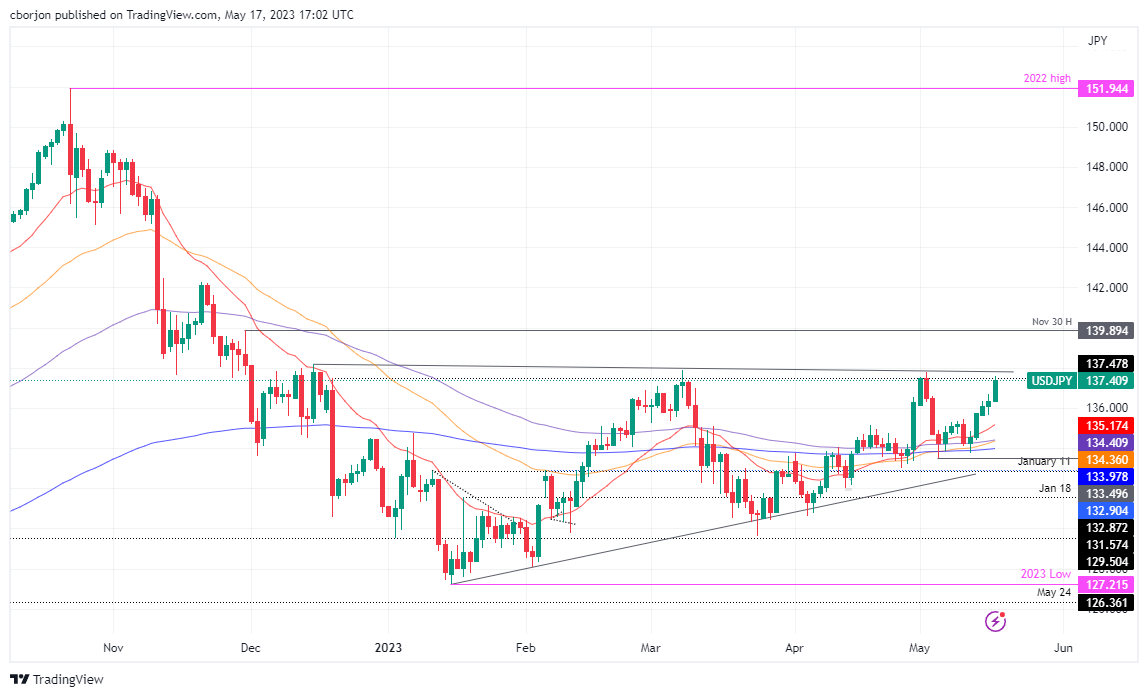
The USD/JPY daily chart portrays a strong uptrend facing solid resistance at around the year-to-date (YTD) highs of 137.91. Additionally, if surpassed, a six-month-old resistance trendline passes around that area, which could pave the way for the USD/JPY to test the November 30 high at 139.89 before testing 140.00. On the downside, failure to crack 138.00, a pullback towards the 137.00 mark is on the cards.
Upcoming events
- US housing market data shows the recovery, bolstering the US Dollar and limiting NZD/USD gains.
- Improving US debt ceiling discussions boost Wall Street and investor sentiment.
- Despite some dovish-leaning Fed speakers, no rate cuts are expected by year’s end.
NZD/USD holds to its earlier gains but retraces after piercing the 200-day Exponential Moving Average (EMA) at 0.6256, as data from the United States (US) shows the housing market seems to recover. Therefore, the US Dollar (USD) is appreciating and putting a lid on the NZD/USD rise. The NZD/USD is trading at 0.6238 after hitting a daily low of 0.6224.
US debt ceiling talks progress; Fed speakers maintain the hawkish tone
The NZD/USD remains underpinned by an upbeat sentiment, though at the brisk that a sudden shift could turn into losses. US debt ceiling discussions would continue today after Tuesday’s talks improved, although US House Speaker McCarthy said the two sides remain apart. Nevertheless, he acknowledged that a deal could be done by the week’s end. Wall Street cheered Tuesday’s results, as the three major indices post gains above the 0.30% threshold.
The United States (US) data showed the housing market’s recovery. April’s Building Permits improved from a -3% plunge to a -1.5% contraction, as permits improved to 1.416M, lower than March’s 1.437M. Surprisingly, Housing Starts rose by 2.2%, crushing March’s figures of -4.5% contraction, expanding at a 1.401M annualized pace.
That, alongside solid US Retail Sales and Industrial Production, revealed on Tuesday, keeps the US Dollar (USD) in the driver’s seat, cushioning the NZD/USD’s rally. The US Dollar Index (DXY), a gauge that tracks the performance of six currencies vs. the USD, climbs 0.33%, up at 102.937, a headwind for the NZD/USD.
Given the backdrop, US Treasury bond yields advanced, while bets that the Federal Reserve would cut rates in 2023 diminished. On Tuesday, odds for 75bps of rate cuts were 33.5%, while as of writing, diminished under 27%, as shown by the CME FedWatch Tool. Most investors are still pricing 50 bps of cuts by December 2023.
In the meantime, Federal Reserve speakers maintained their hawkish stance. However, the newly appointed Chicago Fed President Aaron Golsbee and Dallas Fed President Lorie Logan are leaning towards a dovish posture. Nevertheless, both commented that no rate cuts are expected by the year’s end.
On the New Zealand front, the economic calendar was empty. Nevertheless, a strong jobs report at the beginning of the month increased the likelihood of another rate hike, as the Overnight Cash Rate (OCR) sits at 5.25%. Swaps are pricing for the Reserve Bank of New Zealand (RBNZ) to raise rates to 5.50% in the upcoming May meeting.
NZD/USD Price Analysis: Technical outlook
US President Joe Biden said on Wednesday that he is confident that they will be able to reach an agreement on budget and noted that it would be catastrophic if the US failed to bay bills, per Reuters.
Additional takeaways
"We're going to come together because there is no alternative."
"This negotiation is about the outlines of what the budget will look like."
"Leaders all agree, we will not default."
"Group of negotiators met Tuesday night, will meet again Wednesday."
"Will be in close touch with negotiators during the trip."
"Will continue discussions until we reach agreement."
"Will have a news conference on Sunday on debt issue."
"Will not accept work requirements that will affect medical needs of people."
"There is a possibility of some work requirements."
Market reaction
The market mood remains relatively upbeat following these comments and the S&P 500 Index was last seen rising 0.4% on the day at 4,126.
Gold is still stalling, but strategists at Credit Suisse stay biased towards an eventual move to new record highs above $2,070/75.
Support aligns at $1,969/66
“We look for the $2,070/2,075 record highs posted in 2020 and 2022 to remain a formidable barrier for now for further sideways consolidation.”
“Post the current ranging phase, we believe the market will eventually move to new record highs, supported by lower US Real Yields. With this in mind, above $2,075 on a weekly closing basis would be seen to mark a significant break higher, opening up a move to our first core upside objective at $2,330/2360.”
“Support is seen at $1,969/66, which includes the 55-DMA, below which would point to a more decisive rejection of the $2,075/70 highs.”
- US economic data reinforces robust growth, diminishing odds for rate cuts by year-end.
- Hawkish Fed speakers bolster the US Dollar, pushing USD/MXN past critical resistance levels.
- The market awaits the Bank of Mexico’s rate decision amid anticipation of a pause in the tightening cycle.
USD/MXN rallies sharply by more than 0.50%, cracking critical resistance levels like the 17.5000 figure and the 17.6000 area, amidst a light economic calendar on the Mexican front, ahead of the Bank of Mexico’s (Banxico) decision. The latest round of economic data from the United States (US) proved that the economy is robust, while Fed speakers continued to favor rate hikes. The USD/MXN is trading at around 17.6710 after hitting a low of 17.4809.
Bank of Mexico decision looms, US data support Fed hawkish narrative
Upward pressure on the USD/MXN has been sponsored by the above reasons. Retail Sales in the US showed the consumer’s resilience, while Industrial Production showed signs of a recovery on Tuesday. Wednesday’s data showed that Building Permits in April missed estimates by 1.437M to 1.416M, while Housing Starts improved from March’s plunge of -4.5%, to 2.2% in April, to a 1.401M annualized rate.
Given that the latest data still shows signs that the economy is solid, expectations that the Federal Reserve (Fed) would cut rates by the year’s end had been pushed back. Odds for two rate cuts by December lie at 40.4%, while for three rate cuts, they diminished to 26.9%, as shown by the CME FedWatch Tool.
Hence, US Treasury bond yields reflect the above-mentioned recovering ground and underpin the US Dollar (USD), a tailwind for the USD/MXN. The USD Dollar Index (DXY) is advancing 0.38%, up at 102.989, and about to test the 100-day Exponential Moving Average (EMA) at 103.187.
On the Fed speaking front, Fed officials maintained their hawkish rhetoric, led by Loretta Mester, Thomas Barkin, and John Williams. On the more neutral spectrum remains the newly appointed Aaron Golsbee, and Lorie Logan, though both reiterated that no rate cuts are expected.
Aside from this, the debt ceiling discussions showed some improvement, despite US House Speaker McCarthy continuing to say the two sides remain apart. He acknowledged that a deal could be done by the week’s end. President Biden announced that there was “consensus, I think, among the congressional leaders that defaulting on the debt is simply not an option.”
Before the meeting even started, there was news that President Biden was going to shorten his upcoming trip to Asia and return to Washington on Sunday after the G-7 summit in Japan.
On the Mexican front, USD/MXN traders’ eyes are on Banxico’s decision on Thursday, with most analysts estimating that the central bank will pause on its tightening cycle.
USD/MXN Price Analysis: Technical outlook
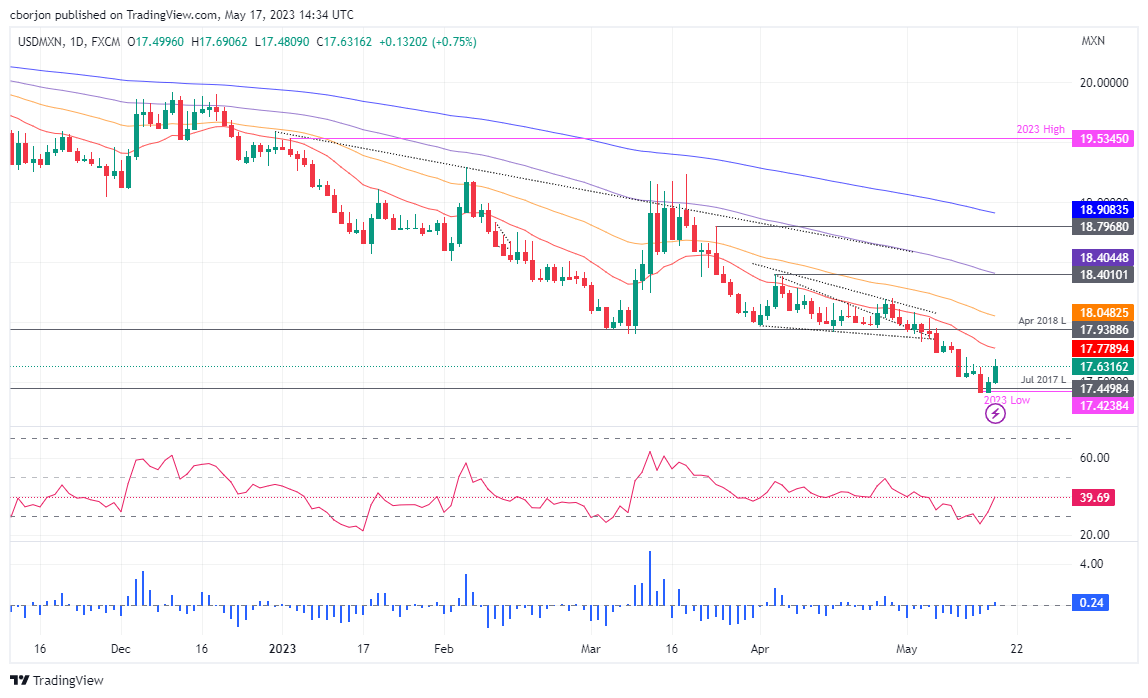
Even though the USD/MXN achieved back-to-back bullish sessions, the bias remains downwards. However, today’s jump in the spot price puts into play a test of the 20-day Exponential Moving Average (EMA), which, if broken, it would open the door to test the April 2018 swing low-turned-resistance at 17.9388. A breach of the latter will expose the 18.0000 as the USD/MXN pair recovers from early-year losses. Conversely, a retracement below 17.5000 would open the door to re-test the year’s lows around 17.40s.
ING’s year-end target for EUR/USD now sits at 1.20.
The bumpy path to a higher EUR/USD
“Based on our view that the Fed tightening cycle is over and that a credit crunch makes a US recession more likely, we believe the Dollar is about to embark on a multi-quarter (if not multi-year) decline. The bulk of that Dollar decline may come in 2H23 as the US disinflation story builds and the Fed front-loads easing with 100 bps of cuts in 4Q23. That could see EUR/USD at 1.20 end year.”
“The road to a Dollar decline will not be smooth, however. The most pressing risks are the US banking crisis and the risk of a US Treasury default in the June/July window. Historically, stress in US money markets has triggered a temporary surge in the Dollar.”
“Any flash crash below 1.05 should be temporary, however.”
Did Banxico end its rate hike cycle at 11.25% in March, or will it hike again tomorrow? Economists at Commerzbank expect the Peso to struggle if Banxico remains on hold.
Finished or not? Banxico's exciting interest rate decision
“The majority of analysts surveyed by Bloomberg and Reuters expect a pause tomorrow. This could put some pressure on the Peso, as a minority still seems to expect another rate hike.”
“Fundamentally, however, we see the MXN as well supported and expect it to trade sideways around current levels. With core inflation at 7.7%, Mexico offers an attractive real interest rate in a stable political environment. Moreover, we expect Banxico to leave no doubt that it will promptly address any upside risks to inflation.”
- The index pierces 103.00 and prints new multi-week tops.
- Markets’ attention remains on the debt ceiling issue.
- US housing data came in mixed in April.
The USD Index (DXY), which tracks the greenback vs. a bundle of its main rival currencies, keeps the buying pressure well and sound near the 103.00 region on Wednesday.
USD Index looks at debt ceiling discussions
DXY pushes higher and revisits the area just above the 103.00 barrier for the first time since early April on the back of the persistent risk aversion, while the recovery in US yields across the curve also lend wings to the dollar.
According to the bipartisan discussions that took place on Tuesday, there appears to be a glimmer of optimism regarding the resolution of the debt ceiling issue in the upcoming days despite the fact that investors' feelings of risk aversion continue to dominate.
Despite the persistent hawkish narrative from policymakers, particularly when it comes to the inflation that has remained stubbornly elevated, expectations of an impasse in the hiking cycle at the June event appear to be steady from the Fed's perspective. In this regard, R. Bostic of the Atlanta Fed stated late on Tuesday that the Fed is anticipated to face significant pressure in the event of higher unemployment and persistent inflation.
In the US calendar, Mortgage Applications decreased by 5.7% in the week ending May 12, while Housing Starts increased by 2.2% MoM (1.401 million units) and Building Permits dropped 1.5% MoM (1.416 million units) in April's housing sector data.
What to look for around USD
The index returns to the area of multi-week highs in the 103.00 zone amidst the marked resurgence of the risk-off mood among market participants.
The index seems to be facing downward pressure in light of the recent indication that the Fed will probably pause its normalization process in the near future. That said, the future direction of monetary policy will be determined by the performance of key fundamentals (employment and prices mainly).
Favouring an impasse by the Fed appears the persevering disinflation – despite consumer prices remain well above the target – incipient cracks in the labour market, the loss of momentum in the economy and rising uncertainty surrounding the US banking sector.
Key events in the US this week: MBA Mortgage Applications, Building Permits, Housing Starts (Wednesday) – Philly Fed Index, Initial Jobless Claims, CB Leading Index, Existing Home Sales (Thursday) – Fed J. Powel (Friday).
Eminent issues on the back boiler: Persistent debate over a soft/hard landing of the US economy. Terminal Interest rate near the peak vs. speculation of rate cuts in late 20223. Fed’s pivot. Geopolitical effervescence vs. Russia and China. US-China trade conflict.
USD Index relevant levels
Now, the index is up 0.39% at 103.01 and the break above 103.05 (monthly high April 3) could open the door to 105.80 (200-day SMA) and then 105.88 (2023 high March 8). On the downside, the next support emerges at 101.01 (weekly low April 26) prior to 100.78 (2023 low April 14) and finally 100.00 (psychological level).
S&P 500 remains trapped in a very tight range above its 63-Day Moving Average at 4052/48, with a break below here needed to confirm a rejection of key resistance at 4195 and a renewed fall, analysts at Credit Suisse report.
Looking for a top to form beneath the 4195 YTD high
“With daily MACD momentum having turned lower, we still think the broader risk is shifting towards a ‘risk off’ phase and our bias stays lower for an eventual break below 4052/48 to confirm a near-term top for a fall to test the 200-DMA, now at 3975.”
“Above 4195 YTD high would now be seen to mark an important break higher, especially give the extreme net short in positioning to clear the way for a test of the summer 2022 high and 61.8% retracement of the entire 2022 fall at 4312/4325.”
- GBP/USD rebounds from a multi-week low, albeit lacks follow-through buying.
- Hawkish remarks by the BoE Governor Bailey boost the GBP and lend support.
- Sustained USD buying caps any further recovery and warrants caution for bulls.
The GBP/USD pair stages a goodish intraday bounce from the 1.2420 area, or over a three-week low touched this Wednesday and climbs to the top end of its daily trading range during the early North American session. The pair, however, remains in the negative territory for the second straight day and is currently placed around the 1.2470-1.2475 region, down over 0.10% for the day.
The British Pound finds some support in reaction to Bank of England (BoE) Governor Andrew Bailey's hawkish remarks and assists the GBP/USD pair to attract some buyers at lower levels. Speaking at the British Chambers of Commerce, Bailey said that inflation is much too high and we need to bring it back sustainably to our 2% target. Bailey added that the easing of labour market tightness is happening at a slower pace than expected in February and the labour market remains very tight.
The upside for the GBP/USD pair, however, remains capped, at least for the time being, amid strong follow-through US Dollar (USD) buying for the second successive day. In fact, the USD Index (DXY), which tracks the Greenback against a basket of currencies, hits a six-week high amid speculations that the Federal Reserve (Fed) will keep rates higher for longer, bolstered by the recent hawkish remarks by several FOMC members. That said, a combination of factors could cap gains for the buck.
US President Joe Biden and Republican leaders have expressed cautious optimism that a deal to raise the US debt ceiling is within reach. This, in turn, boosts investors' confidence and leads to a modest recovery in the global risk sentiment, which is evident from a generally positive tone around the equity markets and undermines the safe-haven Greenback. Apart from this, a modest downtick in the US Treasury bond yields is further holding back the USD bulls from placing aggressive bets.
On the economic data front, the mixed US housing market data did little to impress traders or provide any meaningful impetus to the GBP/USD pair. Nevertheless, the aforementioned fundamental backdrop suggests that the path of least resistance for the buck is to the upside. This makes it prudent to wait for strong follow-through buying before positioning for any further recovery for the major ahead of the BoE's Monetary Policy Report Hearings, scheduled on Thursday.
Technical levels to watch
USD/CNH has popped its head above 7 for the first time year. Does USD/CNH point to a broader Dollar bounce? Kit Juckes, Chief Global FX Strategist at Société Générale, believes that the USD could maintain its bid tone.
If the Yuan’s a canary, the Dollar’s bounce has further to go
“We are now likely to see USD/CNY head higher – to 7.3 by the end of this year.”
“If USD/CNH consolidates above 7 in the next few days, that may well open the way for further downside tests of USD/GBP and EUR/USD (and AUD/USD, for that matter). Meanwhile though, our USD/CNH forecast change also implies a solid gain ahead for CAD/CNH.”
- EUR/USD loses further ground and trades closer to 1.0800.
- The loss of this level exposes a move to April low at 1.0788.
EUR/USD maintains the bearish price action and slips back to the vicinity of the 1.0800 neighbourhood on Wednesday.
The 1.0800 area appears supported by the temporary 100-day SMA (1.0804) and the loss of this region could trigger a deeper drop to, initially, the April low at 1.0788 (April 3). Further south emerges the March bottom of 1.0516 (March 15).
Looking at the longer run, the constructive view remains unchanged while above the 200-day SMA, today at 1.0460.
EUR/USD daily chart
- USD/CAD surrenders its modest intraday gains and drops to a fresh daily low in the last hour.
- A modest uptick in Oil prices underpins the Loonie and exerts downward pressure on the pair.
- Sustained USD buying might hold back bearish traders from placing fresh bets and limit losses.
The USD/CAD pair struggles to capitalize on its modest intraday gains and meets with a fresh supply near the 1.3535 region on Wednesday. Spot prices drop to a fresh daily low, around the 1.3470 region during the North American session, though the downside seems cushioned amid strong follow-through US Dollar (USD) buying.
In fact, the USD Index (DYX), which tracks the Greenback against a basket of currencies, sticks to its gains just below its highest level since March 27 touched today amid speculations that the Federal Reserve (Fed) will keep rates higher for longer. In fact, the recent hawkish comments by several FOMC members pushed back against market expectations for interest rate cuts later this year. This, in turn, continues to boost the buck and lends some support to the USD/CAD pair.
That said, the emergence of some buying around Crude Oil prices, along with hotter-than-expected Canadian consumer inflation figures released on Tuesday, underpin the commodity-linked Loonie. This, in turn, attracts some sellers around the USD/CAD pair and contributes to the intraday pullback of over 50 pips. Hence, it will be prudent to wait for strong follow-through buying and acceptance above the 100-day Simple Moving Average (SMA) before placing fresh bullish bets.
On the economic data front, the mixed US housing market data did little to provide any meaningful impetus to the USD/CAD pair.
The US Census Bureau reported that Housing Starts climbed 2.2% on a monthly basis in April as compared to the 1.9% rise anticipated and the 4.5% decline registered in the previous month. Building Permits, however, fell by 1.5% last month against consensus estimates pointing to a 3% increase and the 3% fall recorded in March.
Technical levels to watch
- Building Permits in the US declined unexpectedly in April.
- US Dollar Index clings to strong daily gains near 103.00.
The monthly data published by the US Census Bureau revealed on Wednesday that Housing Starts rose by 2.2% on a monthly basis in April following March 4.5% decline. This reading came in better than the market expectation for an increase of 1.9%.
In the same period, Building Permits fell 1.5%, compared to analysts' estimate for a 3% growth.
Market reaction
The US Dollar Index preserves its bullish momentum after these data and was last seen rising 0.4% on the day at 103.00.
- DXY extends the upside and pierces the 103.00 barrier.
- A convincing break above 103.05 exposes further gains.
DXY adds to Tuesday’s advance and climbs to multi-week peaks just beyond the 103.00 barrier on Wednesday.
Further upside seems like the most probable scenario for the index so far. Against that, a sustained surpassing of the April top at 103.05 (April 3) is expected to mitigate the downside pressure and encourage DXY to extend its march north further.
The index is seen facing the next resistance level of significance not before the 2023 top of 105.88 (March 8).
Looking at the broader picture, while below the 200-day SMA today at 105.80, the outlook for the index is expected to remain negative.
DXY daily chart
In an interview with CNBC on Wednesday, US House Speaker Kevin McCarthy defended Republicans' call for greater spending limits, as reported by Reuters.
Additional takeaways
"Work requirements help people get jobs, help the economy and that's what we should be doing."
"The problem is the spending level."
"There will not be tax discussion in debt ceiling talks."
"Now we have an opportunity to find common ground but only a few days to get the job done."
"I'm going to spend all my effort to make sure we get the job done."
"The only thing I'm confident about is now we have a structure to find a way to come to a conclusion."
Market reaction
These comments don't seem to be having a significant impact on the US Dollar's performance against its major rivals. As of writing, the US Dollar Index was up 0.3% on the day at 102.90.
Economists at TD Securities believe that discretionary trades have yet to buy into the Gold rally.
Positioning in Gold is far from bloated
“The bar for algorithmic liquidations in Gold to pressure prices is elevated, whereas Shanghai trader length is nearing year-to-date lows. Further, dry-powder analysis highlights that position sizing for gold bulls remains near average levels, which points to less pain associated with the recent pullback. Our gauge of discretionary trader positioning continues to suggest that this cohort has yet to participate in the precious metals rally.”
“Looking forward, we expect discretionary capital to flow towards Gold given strong historical linkages with market expectations for a deepening Fed cutting cycle over the next year.”
In a speech to the British Chambers of Commerce on Wednesday, Bank of England (BoE) Governor Andrew Bailey said there are signs that the labour market is loosening a little, per Reuters.
Additional takeaways
"Inflation is much too high and we need to bring it back sustainably to our 2% target."
"After the initial recovery in 2020, the level of economic activity, measured by monthly GDP, has failed to grow beyond its pre-pandemic level on a sustained basis."
"We know that higher interest rates make things hard for many people but we’re conscious that high inflation always hits the least well-off the hardest."
"I’d like to push back strongly against one argument you sometimes hear, which is that inflation is high because monetary policy was too loose in the past."
"Things are looking a bit brighter than they did a couple of months ago."
"We have good reasons to expect inflation to fall sharply over the coming months, beginning with the April number."
"As headline inflation falls, second-round effects are unlikely to go away as quickly as they appeared."
"The easing of labour market tightness is happening at a slower pace than we expected in February and the labour market remains very tight."
Market reaction
GBP/USD managed to rebound from the multi-week low it set near 1.2420 after these comments. As of writing, the pair was trading at 1.2463, losing 0.2% on a daily basis.
Economists at ING expect the US Dollar to remain supported amid the crisis over raising the debt ceiling.
Tentative debt-limit progress not enough to lift sentiment
“Debt-limit negotiations in Washington yielded a more conciliatory tone, but not enough tangible progress to keep markets away from their defensive Dollar positions. This may not change for now.”
“The Dollar is seeing a new round of strengthening and we think that there is still room for appreciation until we get clearer indications that the two sides have gotten closer on core issues when it comes to debt-limit negotiations.”
“We still suspect the lingering uncertainty will prompt markets to favour defensive trades, and DXY could extend its rebound to the 103.50/104.00 area by the end of the week.”
- EUR/JPY extends the weekly leg higher and surpasses 148.00.
- Extra strength could see the weekly high near 149.30 revisited.
EUR/JPY advances for the fourth session in a row and clinches multi-day highs further north of the 148.00 barrier on Wednesday.
Extra gains beyond the latter could encourage the cross to challenge the weekly peak at 149.26 (May 8), while the surpass of this level could pave the way for a potential test of the YTD high at 151.61 (May 2).
So far, further upside looks favoured while the cross trades above the 200-day SMA, today at 143.19.
EUR/JPY daily chart
- Gold price languishes near a two-week low amid sustained US Dollar buying on Wednesday.
- Hawkish Federal Reserve expectations contribute to capping the upside for the XAU/USD.
- Concerns about the US debt ceiling lend some support and help limit further losses, for now.
Gold price enters a bearish consolidation phase and oscillates in a narrow trading band just above a two-week low touched earlier this Wednesday. The XAU/USD remains on the defensive through the first half of the European session and currently trades around the $1,987-$1,988 region, down less than 0.10% for the day.
Stronger US Dollar acts as headwind for Gold price
The US Dollar (USD) gains positive traction for the second straight day and climbs to a nearly two-month high, which turns out to be a key factor undermining Gold price. The recent hawkish comments from several Federal Reserve (Fed) officials pushed back against speculations for interest rate cuts later this year and continue to underpin the Greenback. In fact, Cleveland Fed President Loretta Mester said on Tuesday that interest rates are not at a sufficiently restrictive level and that the central bank isn't at the spot to hold rates yet.
Hawkish Federal Reserve expectations contribute to cap XAU/USD
Separately, Chicago Fed President Austan Goolsbee said that it was premature to be discussing interest rate cuts. Furthermore, Atlanta Fed president Raphael Bostic noted that the central bank would need to stay super strong in fighting inflation, even if the unemployment rate starts to rise later in the year. This comes on the back of a rise in consumer inflation expectations and lifts market bets that the Fed will keep interest rates higher for longer, which is seen as another factor acting as a headwind for the non-yielding Gold price.
US debt ceiling concerns lend some support to Gold price
The CME FedWatch tool, however, indicates a greater chance that the Fed will stand pat on rates in June. This, along with a standoff to raise the federal government's borrowing limit, lends some support to the safe-haven Gold price and helps limit the downside, at least for the time being. House of Representatives Speaker Kevin McCarthy told reporters that the two sides were still far apart. US President Joe Biden and Republican leaders, meanwhile, have expressed cautious optimism that a deal to raise the US debt ceiling is within reach.
Bias seems tilted in favour of XAU/USD bears
This leads to a modest recovery in the global risk sentiment, which is evident from a generally positive tone around the equity markets and might hold back traders from placing aggressive bullish bets around the Gold price. Moreover, the lack of any buying interest suggests that the path of least resistance for the XAU is to the downside and any attempted recovery runs the risk of fizzling out rather quickly. Market participants now look to the US housing market data and developments surrounding the US debt-limit negotiations for a fresh impetus.
Gold price technical outlook
From a technical perspective, some follow-through selling below the $1,980 area will expose the next relevant support near the $1,970 region. A convincing break below the latter will be seen as a fresh trigger for bearish traders and make the Gold price vulnerable to prolong its recent corrective pullback from the all-time high, around the $2,078-$2,079 area touched earlier this month. The XAU/USD might then accelerate the fall towards testing the 100-day Simple Moving Average (SMA), currently pegged near the $1,925 region, with some intermediate support near the $1,950-$1,948 region.
On the flip side, the $2,000 psychological mark now seems to act as an immediate hurdle. Any subsequent move up might attract fresh sellers and remain capped near the $2,020-$2,021 hurdle. That said, some follow-through buying has the potential to lift the Gold price to the $2,035-$2,040 region. Some follow-through buying should allow the XAU/USD to climb back towards the all-time high and extend the momentum further towards conquering the $2,100 round-figure mark.
Key levels to watch
Economists at the Bank of Montreal analyze the USD and CAD versus European currencies.
One of the biggest areas of uncertainty for the FX market is timing
“We expect the Fed and BoC pause to put near-term ceilings on the USD and CAD vs. the major European currencies over the next couple of months while central banks in the region pursue tighter monetary policies.”
“Further out in 2023 (i.e., 6M), we expect a portion of the strength in European currencies to evaporate as the lagged impact of tightening feeds through to growth. There are also economic hard landing risks in Europe if central banks have a more difficult time bringing inflation back to acceptable rates.”
“However, one of the biggest areas of uncertainty for the FX market is timing. There are near-term upside risks to the USD and CAD vs. European currencies if expectations for weaker economic growth in the region are brought forward, or if the USD deals with a persistent bid due to risk-off conditions in financial markets.”
Economists at ING discuss AUD/NZD and AUD/USD outlook.
USD decline should materialise in the second half of the year
“We think AUD can gain some relative advantage against other commodity currencies from an under-priced RBA hike, AUD/NZD upside looks rather attractive in this sense.”
“AUD/USD could remain vulnerable on the back of the challenging risk environment and USD's good momentum for a little longer. Still, we target 0.73 as the year-end value as a USD decline should materialise in the second half of the year.”
Debt dispute continues to simmer. The US Dollar could come under pressure, economists at Commerzbank report.
No solution in the US debt dispute
“As expected, the summit about raising the US debt ceiling did not result in an agreement. The FX market does not show any signs of nervousness in view of the approaching debt deadline.”
“The longer it takes to find a resolution for the debt dispute, the more the sentiment in the US is likely to be affected by the suspense. As that would point more towards a further cooling of the economic momentum this is likely to support the expectation of imminent Fed rate cuts from the market’s point of view, thus principally putting pressure on the Dollar.”
- AUD/USD drops to over a two-week low on Wednesday amid sustained USD buying.
- Hawkish Fed expectations and looming recession fears continue to benefit the buck.
- A positive risk tone caps the USD and lends some support to the risk-sensitive Aussie.
The AUD/USD pair remains under some selling pressure for the second successive day on Wednesday and drops to over a two-week low during the early European session. Spot prices, however, trim a part of intraday losses and now trade with a mild negative bias, just below mid-0.6600s.
The US Dollar (USD) climbs to a nearly two-month high amid hawkish Federal Reserve (Fed) expectations and turns out to be a key factor weighing on the AUD/USD pair. In fact, Cleveland Fed President Loretta Mester said on Tuesday that interest rates are not at a sufficiently restrictive level and that the central bank isn't at the spot to hold rates yet. This further fuels speculations that the US central bank will keep interest rates higher for longer and continues to underpin the Greenback.
That said, a modest downtick in the US Treasury bond yields might hold back the USD bulls from placing aggressive bets. Apart from this, a generally positive tone around the equity markets could cap gains for the safe-haven buck and lend some support to the risk-sensitive Aussie. Any meaningful recovery, however, still seems elusive amid worries about a deeper global economic slowdown, warranting some caution before confirming that a one-week-old downtrend has run its course.
The softer Chinese macro data released on Tuesday pointed to a wobbly post-COVID recovery in the world's second-largest economy. This comes on the back of a standoff to raise the federal government's borrowing limit and fuels recession fears. In fact, the Wall Street Journal (WSJ) reports that House Democrats will begin collecting signatures Wednesday for a discharge petition to raise the debt ceiling, in a desperate attempt to circumvent House Republican leadership and force a vote.
This should keep a lid on any optimism in the markets and contribute to capping the upside for the AUD/USD pair. Market participants now look to the US economic docket, featuring the release of Housing Starts and Building Permits, for some impetus later during the early North American session. Apart from this, the US bond yields, along with the broader risk sentiment, will influence the USD price dynamics and contribute to producing short-term opportunities around the major.
Technical levels to watch
UOB Group’s Economist Enrico Tanuwidjaja and Junior Economist Agus Santoso comment on the latest trade balance figures in Indonesia.
Key Takeaways
“Trade surplus in Apr gained slightly higher to USD3.9bn from USD2.8bn in Mar, though it is around USD1.5bn below the highest position thus far in 2023.”
“Oil and gas (OG) exports contracted by 12.2% y/y, much worse from -4.8% in Mar, followed by non-oil and gas (non-OG) exports’ decline which continue to record double digits contraction at -30.4% y/y.”
“OG imports contracted by 22.5% y/y, larger than previous month's contraction of 13.7%, followed by non-OG imports contraction by 22.3% in Apr, larger than Mar’s contraction of 11.7%.”
EUR/USD is coming under pressure again. Economists at ING expect the pair to test the 1.0800 level.
Pressure on 1.0800 coming?
“We keep stressing how 1.0800 is probably a key benchmark level to gauge market sentiment about the US debt-ceiling story.”
“We could see some good support at 1.0800, and a break lower could indicate the FX market moving more seriously to price in a US default.”
“The domestic story for the Euro is not deteriorating materially and the decline is almost entirely driven by the dollar leg, although yesterday’s ZEW figures in Germany did send some worrying signals.”
- GBP/USD drifts lower for the second straight day and dives to a three-week low on Wednesday.
- Speculations for fewer BoE rate hikes undermine the GBP and weigh amid sustained USD buying.
- The fundamental/technical setup supports prospects for an extension of the downward trajectory.
The GBP/USD pair adds to the previous day's losses and remains under heavy selling pressure for the second successive day on Wednesday. The downward trajectory remains uninterrupted through the first half of the European session and drags spot prices to a three-week low, around the 1.2420 region in the last hour.
The British Pound continues to be undermined by rather unimpressive UK monthly jobs data released on Tuesday, which fueled speculations that fewer rate increases by the Bank of England (BoE) will be needed in the coming months to bring down inflation. This, along with some follow-through US Dollar (USD) buying, aggravates the bearish pressure surrounding the GBP/USD pair and contributes to the steep intraday decline.
In fact, the USD Index (DXY), which tracks the Greenback against a basket of currencies, jumps to a nearly two-month high and draws support from a combination of factors. The overnight hawkish comments by Cleveland Federal Reserve (Fed) President Loretta Mester reaffirmed expectations that the US central bank will keep interest rates higher for longer. Apart from this, worries about a global economic slowdown benefits the safe-haven buck.
The softer Chinese macro data released on Tuesday pointed to a wobbly post-COVID recovery in the world's second-largest economy and fueled recession fears. This comes on the back of a standoff to raise the federal government's borrowing limit and drives some haven flows towards the Greenback. That said, a modest bounce in the US equity futures, along with a downtick in the US Treasury bond yields, might cap the USD.
Nevertheless, the aforementioned fundamental backdrop suggests that the path of least resistance for the GBP/USD pair is to the downside. Even from a technical perspective, last week's breakdown through the lower end of over a one-month-old ascending trend channel favours bearish traders and supports prospects for a further near-term depreciating move towards the next relevant support near the 1.2375-1.2370 region.
Technical levels to watch
Citing Brendan Boyle, the top-ranking Democrat on the House Budget Committee, the Wall Street Journal (WSJ) reports that House Democrats will begin collecting signatures Wednesday for a discharge petition to raise the debt ceiling, in a desperate attempt to circumvent House Republican leadership and force a vote.
Key takeaways
“We only have two weeks to go until we may hit the x-date.”
“We must raise the debt ceiling now and avoid economic catastrophe.”
“I’ve always said a discharge petition is not a high-probability move. But at this point, we must try whatever it takes.”
“I urge my Republican colleagues, especially those who like to call themselves moderate at election time, to join us and ensure America pays its bills.”
“It takes the signatures of 218 House members—a majority, regardless of party—to move a bill to the floor by discharge petition. Republicans control the House, 222-213, so for their petition to succeed, Democrats would need at least five GOP representatives to sign on,” according to the WSJ.
Market reaction
Risk sentiment is taking a hint on the above headlines, strengthening the rebound in the US Dollar across the board. At the time of writing, the US Dollar Index is adding 0.41% on the day to trade at 102.98.
European Central Bank (ECB) policymaker and Bank of Spain's Governor Pablo Hernandez de Cos said in an MNI interview on Wednesday, “the persistence of higher inflation would slow the recovery and would very likely lead to further tightening in the euro area.”
“The longer higher interest rates remain, the more likely that financing cost rises for banks and a deterioration in the quality of credit risk, de Cos added.
Market reaction
At the time of writing, EUR/USD is extending losses toward 1.0800, down 0.33% on the day at 1.0826. Broad-based US Dollar strength amid a cautious market mood is weighing on the main currency pair.
We are expecting the latest Australian labour market data, the last major data publication ahead of the next monetary policy meeting of the Reserve Bank of Australia (RBA). Economists at Commerzbank analyze how the employment report could affect the Aussie.
Rate expectations in Australia on a knife edge
“When it comes to the labour market data the economists polled by Bloomberg expect a slower, but still slightly positive increase in jobs. The slowing trend is likely to confirm the central bank’s view that the rate hikes are having an effect and that inflation and the economy are cooling. As a result, the RBA is likely to act more cautiously and take a wait and see approach in early June once again.”
“The main risk remains that the labour market data might surprise to the upside. A surprise of that nature would further fuel recent hopes of a further rate step and would no doubt be positive for the Aussie.”
UK Finance Minister Jeremy Hunt said on Wednesday, there is “nothing automatic about bringing down inflation.”
Additional quotes
“We support Bank of England 150%.”
“I agree with people who are worried about high tax.”
“We need to get taxes down.”
“Overwhelming priority has to be lowering inflation.”
“We aren't in a position to know if we will have headroom to cut taxes before the election.”
“We will always be pragmatic on immigration.”
“I think we will get to a point where default is people will work from office unless there is a good reason, except in certain sectors.”
Market reaction
Despite the encouraging comments from Hunt, GBP/USD is losing 0.40% on the day at 1.2435, as of writing.
- USD/JPY gains traction for the fifth straight day and climbs to over a two-week high on Wednesday.
- Hawkish Fed expectations push the USD to a nearly two-month top and act as a tailwind for the pair.
- The fundamental backdrop favours bulls and supports prospects for a further appreciating move.
The USD/JPY pair scales higher for the fifth successive day on Wednesday and climbs to over a two-week high during the early European session. Spot prices currently trade around the 137.00 round-figure mark, which bulls now awaiting a move beyond a technically significant 200-day Simple Moving Average (SMA) before placing fresh bets.
The US Dollar (USD) continues to draw support from the recent hawkish remarks by several Federal Reserve (Fed) officials and climbs to a nearly two-month high, which, in turn, is seen as a key factor acting as a tailwind for the USD/JPY pair. Cleveland Fed President Loretta Mester said on Tuesday that interest rates are not at a sufficiently restrictive level and that the central bank isn't at the spot to hold rates yet. This, in turn, reaffirms market expectations that the US central bank will keep interest rates higher for longer and provides a goodish lift to the Greenback.
The Japanese Yen (JPY), on the other hand, is weighed down by a more dovish stance adopted by the Bank of Japan (BoJ). It is worth recalling that BoJ Governor Kazuo Ueda said last week that it was too early to discuss specific plans for an exit from the massive stimulus program. This, along with a modest uptick in the US equity futures, undermines the JPY's safe-haven status and remains supportive of the USD/JPY pair's ongoing positive move. That said, a modest downtick in the US Treasury bond yields might hold back bulls from placing aggressive bets.
Nevertheless, the aforementioned fundamental backdrop suggests that the path of least resistance for the USD/JPY pair is to the upside. Hence, a subsequent strength back towards retesting the monthly swing high, near the 137.75-137.80 region, looks like a distinct possibility. Some follow-through buying beyond the YTD peak, around the 137.90 area touched in March, will mark a fresh bullish breakout and pave the way for a further appreciating move. Traders now look to the US housing market data - Building Permits and Housing Starts - for a fresh impetus.
Technical levels to watch
Economist at UOB Group Enrico Tanuwidjaja reviews the latest Q1 GDP figures in Thailand.
Key Takeaways
“The Thai economy picked up growth pace in 1Q23 to 2.7% y/y (UOB: 3.0%), almost double the 1.4% recorded in 4Q22, on the back of continued recovery in the tourism industry and steady agriculture production.”
“Private consumption and investment expenditures increased by 5.4% y/y and 3.1% y/y, respectively. Exports of goods and services rose by 3.0%, reversing a decline seen in 4Q22. Nevertheless, government consumption and imports fell by 6.2% and 1.0%, respectively.”
“Based on the 1Q23 GDP data, the Thai economy remains on track to grow at least 3% for this year. We keep our 2023 growth forecast unchanged at 3.1% as the strength of domestic economic recovery appears to be more modest than expected. Nevertheless, we continue to expect higher and steadier tourism income as China’s reopening should bode well for services exports performance. We also keep our forecast for BOT to keep rates unchanged for the rest of 2023 in support of growth recovery as inflation risks subside.”
EUR/GBP is starting to move in the right direction, economists at ING report.
EUR/GBP to hit 0.89 by the summer
“EUR/GBP has started to edge higher and we expect more upside room on the pair on the back of ECB-BoE policy divergence.”
“Our UK economist is calling for a June pause, and given 20 bps of tightening are priced into the Sonia curve for June and 40 bps in total before the peak, there is ample room for GBP to be hit by a dovish re-pricing.”
“We still target 0.8900 in EUR/GBP by the summer.”
- EUR/USD adds to the weekly leg lower and retests 1.0830.
- The greenback appears well bid amidst persistent risk aversion.
- EMU Final Inflation Rate due next in the domestic docket.
Sellers remain in control of the sentiment around the European currency – and the risk complex in general – and now drag EUR/USD to new lows in the vicinity of 1.0830 on Wednesday.
EUR/USD weaker on USD-buying
The persevering risk aversion continues to underpin investors’ preference for the greenback and keeps EUR/USD on the defensive for the second consecutive week so far on Wednesday.
Indeed, spot navigates an area last seen in early April around 1.0830 amidst unabated concerns surrounding the US debt ceiling issue, while a small decline in the German 10-year Bund yields also accompany the daily downtick.
Collaborating with the sour mood in the single currency, ECB’s Board member de Cos suggested that the bank’s hiking cycle is getting close to its end. His view, however, appears quite in contrast to many of his colleagues’, who kept favouring the continuation of the tightening bias in the June and July meetings (and September?).
Data wise in the region, New Car Registrations in the EU rose 17.2% in the year to April, while final inflation figures in the broader Euroland for the month of April are due later in the morning.
Across the pond, weekly Mortgage Applications come in the first turn seconded by Housing Starts and Building Permits.
What to look for around EUR
EUR/USD extends the weekly decline and gradually approaches the key 1.0800 neighbourhood on Wednesday.
The movement of the euro's value is expected to closely mirror the behaviour of the US Dollar and will likely be impacted by any differences in approach between the Fed and the ECB with regards to their plans for adjusting interest rates.
Moving forward, hawkish ECB-speak continue to favour further rate hikes, although this view appears in contrast to some loss of momentum in economic fundamentals in the region.
Key events in the euro area this week: EMU Final Inflation Rate (Wednesday).
Eminent issues on the back boiler: Continuation of the ECB hiking cycle in June and July (September?). Impact of the Russia-Ukraine war on the growth prospects and inflation outlook in the region. Risks of inflation becoming entrenched.
EUR/USD levels to watch
So far, the pair is retreating 0.21% at 1.0838 and faces immediate contention at 1.0831 (weekly low April 10) seconded by 1.0804 (100-day SMA) and finally 1.0788 (monthly low April 3). On the flip side, the breakout of 1.1095 (2023 high April 26) would target 1.1100 (round level) en route to 1.1184 (weekly high March 21 2022).
The US Dollar Index (DXY) is still down around 10% from its September 2022 peak. Economists at UBS continue to expect the US dollar to weaken against key counterparts over the next 6-12 months.
Position for renewed US Dollar weakness
“Any safe-haven boost to the USD from the debt ceiling impasse should be short-lived. We are confident Congress will come to an agreement and expect safe-haven inflows to reverse.”
“The US rate-hike cycle is nearing its end, while Europe still has room to go.”
“A reduction in the US yield carry and a reversal in Europe’s terms of trade should be key headwinds for the US Dollar in the second half of 2023. The market focus on potential interest rates cuts in the US toward year-end and in 2024 could intensify in the coming months and will likely push US yields down further. In addition, the Euro is benefiting from an improvement in the region's trade balance due to falling energy prices.”
Economists at Commerzbank still expect a solid EUR/USD performance this year.
ECB to resist rate cuts next year
“50 bps more or less, as we have often stressed here, matter less for the Euro than the fundamental monetary policy outlook.”
“Our ECB watchers continue to expect the ECB to resist rate cuts next year. As long as this is the case, while the Fed is cutting, it still seems plausible to us to bet on well-supported EUR/USD levels towards the end of the year.”
- NZD/USD regains some positive traction on Wednesday, albeit lacks follow-through.
- A combination of factors lifts the USD to a fresh multi-week high and caps the pair.
- The fundamental backdrop warrants some caution before placing fresh bullish bets.
The NZD/USD pair attracts fresh buying on Tuesday and sticks to its modest intraday gains, just below mid-0.6200s through the early European session. Spot prices, however, remain below a technically significant 200-day Simple Moving Average (SMA).
The positive move, meanwhile, lacks any obvious fundamental catalyst and runs the risk of fizzling out rather quickly amid some follow-through US Dollar (USD) buying. In fact, the USD Index (DXY), which tracks the Greenback against a basket of currencies, climbs to a fresh high since April and draws support from a combination of factors. This, in turn, warrants some caution before placing fresh bullish bets around the NZD/USD pair and positioning for any further appreciating move.
Cleveland Federal Reserve (Fed) President Loretta Mester said that interest rates are not at a sufficiently restrictive level and that the central bank isn't at the spot to hold rates yet. This, in turn, reaffirmed market expectations that the US central bank will keep interest rates higher for longer. Furthermore, looming recession risks, along with concerns about the US debt ceiling, continue to weigh on investors' sentiment, which further benefits the safe-haven buck and contributes to capping the risk-sensitive Kiwi.
Apart from this, diminishing odds for further rate hikes by the Reserve Bank of New Zealand (RBNZ), bolstered by a slide in inflation expectations for the first quarter, suggests that the path of least resistance for the NZD/USD pair is to the downside. Hence, any subsequent move-up is more likely to attract fresh sellers and remain capped. Traders now look to the US housing market data - Building Permits and Building Permits - for a fresh impetus later during the early North American session.
The market attention will then shift to the New Zealand government's Annual Budget, due for release during the Asian session on Thursday, which might influence the New Zealand Dollar (NZD). The focus, however, will remain glued to Fed Chair Jerome Powell's appearance on Friday. Powell's comments will play a key role in driving the near-term USD demand and help investors to determine the next leg of a directional move for the NZD/USD pair.
Technical levels to watch
The continuation of the bullish move could push USD/CNH to the 7.0500 area in the near term, comment Economist Lee Sue Ann and Markets Strategist Quek Ser Leang at UOB Group.
Key Quotes
24-hour view: “The strong surge in USD to a high of 6.9991 came as a surprise (we were expecting USD to consolidate). USD continues to rise as it broke above 7.0000 in early Asian trade. Despite the break of the solid resistance at 7.0000, there is no significant increase in momentum. Today, USD could strengthen further but the next major resistance at 7.0500 is unlikely to come into view (minor resistance is at 7.0200). Support is at 6.9850, followed by 6.9750.”
Next 1-3 weeks: “Our most recent narrative was from last Thursday (11 May, spot at 6.9330) where we indicated that ‘upward momentum is beginning to build and USD is likely to trade with an upward bias’. However, we noted that both 6.9750 and 7.0000 are strong resistance levels. After holding below 6.9750 for a few days, USD jumped above this level and soared to a high of 6.9991 in NY trade before taking out 7.0000 today. The price actions continue to suggest the risk for USD is to the upside. The next level to watch is 7.0500. Overall, we will continue to hold a positive USD view as long as it holds above 6.9560 (‘strong support’ level previously at 6.9400).”
- The index extends the bid bias near 103.00 on Wednesday.
- The debt ceiling issue remains in centre stage as driver of sentiment.
- Mortgage Applications, housing data next on tap in the docket.
The greenback, in terms of the USD Index (DXY), adds to Tuesday’s gains and revisits the area of multi-week highs in the 102.80/90 region on Wednesday.
USD Index now looks at 103.00 and above
The index advances for the second session in a row and flirts with the key resistance area of 102.80 on the back of subdued price action in the risk-linked galaxy and the so far lack of direction in the US bonds market.
While the risk aversion continues to dominate the mood among investors, there seems to be a spark of optimism regarding the solution of the debt ceiling issue in the next few days, as emerged from Tuesday’s bipartisan discussions.
From the Fed’s universe, expectations of an impasse of the hiking cycle at the June event appear so far steady despite persistent hawkish narrative from policy makers, particularly when it comes to the stubbornly elevated inflation. On this, Atlanta Fed R. Bostic said late on Tuesday that the Fed is expected to face a big pressure in an scenario of higher unemployment and stick inflation.
Back to the US docket, the housing sector will be in the limelight amidst the release of usual weekly MBA Mortgage Applications, Building Permits and Housing Starts.
What to look for around USD
The index returns to the area of 5-week highs in the 102.75/80 band amidst further weakness in the appetite for the risk complex.
The index seems to be facing downward pressure in light of the recent indication that the Fed will probably pause its normalization process in the near future. That said, the future direction of monetary policy will be determined by the performance of key fundamentals (employment and prices mainly).
Favouring an impasse by the Fed appears the persevering disinflation – despite consumer prices remain well above the target – incipient cracks in the labour market, the loss of momentum in the economy and rising uncertainty surrounding the US banking sector.
Key events in the US this week: MBA Mortgage Applications, Building Permits, Housing Starts (Wednesday) – Philly Fed Index, Initial Jobless Claims, CB Leading Index, Existing Home Sales (Thursday) – Fed J. Powel (Friday).
Eminent issues on the back boiler: Persistent debate over a soft/hard landing of the US economy. Terminal Interest rate near the peak vs. speculation of rate cuts in late 20223. Fed’s pivot. Geopolitical effervescence vs. Russia and China. US-China trade conflict.
USD Index relevant levels
Now, the index is up 0.23% at 102.82 and the break above 103.05 (monthly high April 3) could open the door to 105.80 (200-day SMA) and then 105.88 (2023 high March 8). On the downside, the next support emerges at 101.01 (weekly low April 26) prior to 100.78 (2023 low April 14) and finally 100.00 (psychological level).
Gold and Silver prices are staging an impressive pullback. But strategists at TD Securities see timing selling exhaustion in precious metals.
Gold positioning set-up remains inconsistent with a cycle peak
“Without an additional macro catalyst, our positioning analytics highlight that selling exhaustion in precious metals could be imminent, barring a debt-ceiling catastrophe.”
“Gold prices are near all-time highs, but the positioning set-up remains inconsistent with a cycle peak.”
See – Gold Price Forecast: Dispute over US debt ceiling likely to shore up XAU/USD – Commerzbank
Here is what you need to know on Wednesday, May 17:
Choppy action continues in the financial markets mid-week despite renewed optimism about a debt limit deal in the US. The US Dollar Index holds comfortably above 102.50 while the 10-year US Treasury bond yield fluctuates above 3.5%. Eurostat will release revisions to April inflation data. Later in the day, April Housing Starts and Building Permits will be featured in the UE economic docket.
Reuters reported late Tuesday that the meeting between US President Joe Biden, top congressional Republican Kevin McCarthy and other congressional leaders on debt ceiling ended on an upbeat note. Coming out of the meeting, McCarthy told reporters that it was possible to get a deal by the end of the week. Early Wednesday, US stock index futures trade mixed, reflecting the cautious market stance. Meanwhile, the US Census Bureau reported that Retail Sales in the United States rose 0.4% in April to $686.1 billion. This reading followed the 0.7% (revised from -0.6%) decrease recorded in March and came in below the market expectation for an increase of 0.7%.
EUR/USD rose above 1.0900 on Tuesday but failed to gather further recovery momentum. The pair trades in a very narrow channel slightly above 1.0850 early Wednesday. Market participants will pay close attention to comments from European Central Bank (ECB) officials, who have been delivering mixed remarks regarding the policy outlook since the beginning of the week.
GBP/USD closed in negative territory below 1.2500 on Tuesday. The pair stays on the back foot in the European morning and continues to push lower toward 1.2450. Bank of England (BoE) Governor Andrew Bailey will deliver a speech at British Chambers of Commerce Global Annual Conference at 0950 GMT.
The data from Japan showed earlier in the day that the Gross Domestic Product expanded at an annualized rate of 1.6% in the first quarter. This reading followed the 0.1% growth recorded in the previous quarter and came in much higher than the market expectation of 0.7%. USD/JPY gathered bullish momentum during the Asian trading hours and was last seen trading at its highest level in two weeks near 136.80.
USD/CAD fell toward 1.3400 after Statistics Canada reported on Tuesday that the annual Consumer Price Index rose 4.4% in April, compared to the market expectation of 4.1%. With retreating crude oil prices weighing on the commodity-sensitive Canadian Dollar, however, the pair regained its traction and climbed above 1.3500 early Wednesday.
Gold price broke below $2,000 and touched its weakest level since early May at $1,985 late Tuesday, pressured by rising US Treasury bond yields. XAU/USD stays relatively quiet at around $1,990 on Wednesday.
Following Monday's modest rebound, Bitcoin failed to make a decisive move in either direction on Tuesday. BTC/USD fluctuates in a tight channel near $27,000 in the European morning. Ethereum managed to register small gains for the third straight day on Tuesday. ETH/USD seems to have stabilized slightly above $1,800 mid-week.
Canadian inflation picked up in April. Loonie benefited initially. Nevertheless, economists at Commerzbank do not expect the CPI report to have a significant impact on the CAD.
Canadian inflation rate recorded surprise rise in April
“Yesterday’s inflation data for April is unlikely to be to the Bank of Canada’s (BoC) taste (core inflation, i.e. trim and median both at 4.2%, which means that they are in line with expectations). The overall rate on the other hand rose slightly to 4.3%. As we mentioned yesterday, the BoC expects an inflation rate of 3.3% on average in Q2.”
“Yesterday’s inflation data provided notable momentum for rate hike expectations on the market, which also benefitted the CAD at least temporarily. However, the OIS rate expectations signal that the market only prices in a 50% chance of a further 25 bps rate step in the summer (until July). That the market is only partially betting on a further rate hike is probably also due to the fact that the threshold for this step is likely to be reasonably high.”
“The BoC will publish its report on the Canadian financial system tomorrow and in it the bank will look at the risks for financial stability. The presentation will be accompanied by a press conference and is likely to be of interest to the market, but we do not expect any market-moving surprises.”
- Silver consolidates the overnight slide to its lowest level since early April.
- The setup favours bearish traders and supports prospects for further losses.
- Any attempted recovery is likely to remain capped near the $24.25-30 area.
Silver enters a bearish consolidation phase on Wednesday and oscillates in a narrow trading band around the $23.70-$23.75 area, just above its lowest level since April 3 touched the previous day.
From a technical perspective, the aforementioned area represents the 38.2% Fibonacci retracement level of the March-May rise. Some follow-through selling will expose the 100-day Simple Moving Average (SMA), currently pegged around the $23.40-$23.35 region, below which the XAG/USD could slide towards 50% Fibo. level, around the $23.00 round-figure mark.
Some follow-through selling below the latter will be seen as a fresh trigger for bearish traders and set the stage for an extension of the recent sharp pullback from over a one-year top touched earlier this month. The XAG/USD might then accelerate the fall towards the $22.65-$22.60 intermediate support before dropping to the $22.30-$22.25 zone, or the 61.8% Fibo. level.
Meanwhile, oscillators on the daily chart are holding deep in the negative territory and are still far from being in the oversold zone. Hence, any attempted recovery back above the $24.00 mark is more likely to attract fresh sellers and remain capped near the $24.25-$24.30 supply zone. That said, some follow-through buying might prompt an aggressive short-covering rally.
The XAG/USD might then surpass the 23.6% Fibo. level, around the $24.60 zone, aim to reclaim the $25.00 psychological mark. The momentum could get extended further towards the $25.30-$25.40 supply zone en route to the $26.00 round figure and the YTD peak, around the $26.10-$26.15 region.
Silver daily chart
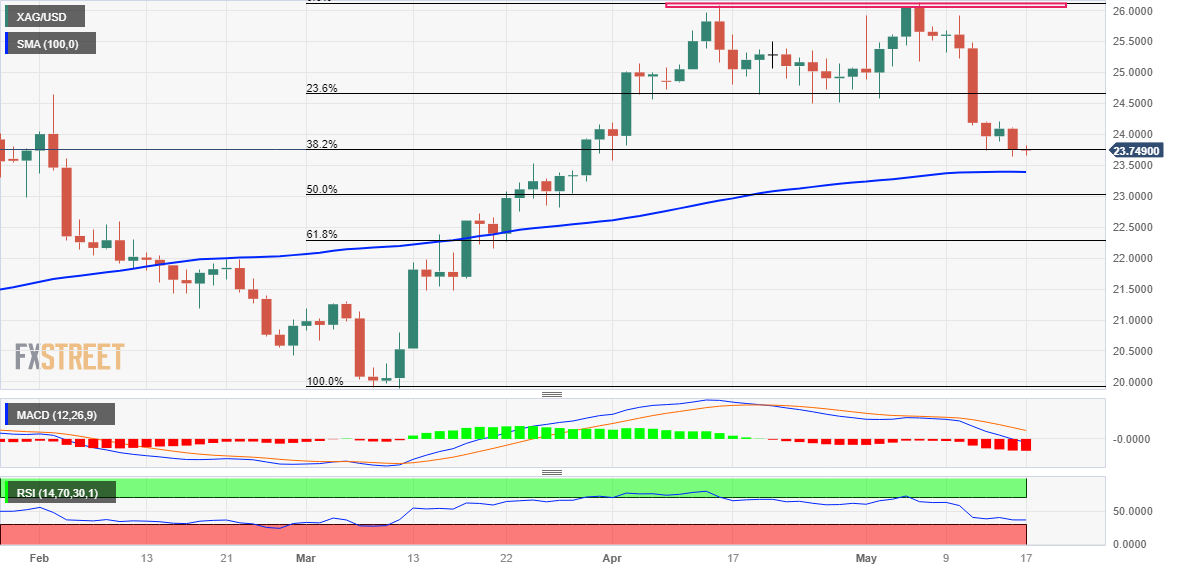
Key levels to watch
In the opinion of Economist Lee Sue Ann and Markets Strategist Quek Ser Leang at UOB Group, extra gains in USD/JPY is predicted to face a tough barrier around 136.80 in the short-term horizon.
Key Quotes
24-hour view: “Yesterday, we expected USD to trade sideways in a range of 135.60/136.35. In NY trade, USD dropped to 135.67 and then rebounded quickly to 136.68 before closing at 136.37 (+0.19%). While USD could rise further, there is no clear improvement in upward momentum, and any advance is likely part of a higher range of 135.80/136.80. In other words, USD is unlikely to break clearly above 136.80.”
Next 1-3 weeks: “There is no change in our view from Monday (15 May, spot at 135.80). As highlighted, while the risk in USD has shifted to the upside, it is worth noting that there is a solid resistance near 136.80 ahead of the early May high near 137.80. Overall, only a breach of 135.30 (‘strong support’ level was at 135.00 yesterday) would suggest USD is not ready to head higher towards 136.80.”
- NZD/USD retreats from intraday high but prints mid gains as risk dwindles.
- Doubts about US policymakers’ optimism for debt ceiling extension, hawkish Fed talks and upbeat data weigh on Kiwi pair.
- Positive expectations from New Zealand budget allow NZD/USD to grind higher amid light calendar.
NZD/USD struggles to defend intraday gains around 0.6240, recently easing from daily tops, as the US Dollar benefits from mixed market sentiment during early Wednesday morning in Europe. Also challenging the Kiwi pair buyers is the anxiety ahead of New Zealand’s (NZ) annual budget announcements, scheduled for Thursday.
US Dollar Index (DXY) grinds near intraday top, making rounds to 102.70, after refreshing the six-week high as the greenback traders struggle for clear directions amid looming US default and hawkish Fed signals, not to forget strong US data.
US congressional leaders cited possibilities of a deal to avoid the debt default by next week after US President Joe Biden and House Speaker Kevin McCarthy wrapped up debt limit negotiations within an hour. However, a lack of details and mixed outlook of Democrats seem to prod the optimism of late.
Elsewhere, strong prints of the US Retail Sales and Industrial Production details allowed the Federal Reserve (Fed) officials to remain hawkish. Recent ones among them were Federal Reserve Bank of Chicago President Austan Goolsbee and Atlanta Fed President Raphael Bostic who cited inflation and employment pressures to defend the hawkish bias.
On the other hand, hopes of an upbeat NZ budget and likely more investment from China, per the early statements from New Zealand Finance Minister (FinMin) Grant Robertson and China’s State Planner National Development and Reform Commission of the People's Republic of China (NDRC), allow the NZD/USD pair to remain firmer.
NZ FinMin Robertson previously stated that the government budget would have a focus on fiscal sustainability as the government does its bit to keep inflation under control, reported Reuters. That said, China’s NDRC recently mentioned that it'll take measures to unleash consumption potential and to make continuous efforts in stabilizing and expanding manufacturing investment.
While portraying the mood, S&P500 Futures remain mildly bid near 4,132 and the key US Treasury bond yields retreat from the two-week high marked the previous day. However, the US Dollar Index (DXY) bounces off its intraday low to 102.65 whereas the Asia-Pacific shares grind lower of late.
Looking ahead, the US housing numbers may entertain the NZD/USD pair traders ahead of Thursday’s New Zealand Producer Price Index (PPI) and annual budget. “Local participants are starting to size up the Budget, with the bond markets nervous about bond supply and FX markets worried about how credit rating agencies will perceive the Budget, hoping for a tick, but fearing the opposite,” said ANZ ahead of the NZ budget.
Technical analysis
NZD/USD rebound remains elusive unless providing a daily close beyond the 200-day Exponential Moving Average (EMA), around 0.6250 by the press time.
CME Group’s flash data for natural gas futures markets noted traders scaled back their open interest positions for the second session in a row on Tuesday, this time by around 14.1K contracts. In the same line, volume shrank for the second straight session, now by around 62.8K contracts.
Natural Gas: Gains remain capped near $2.50
Tuesday’s bullish move in natural gas prices faltered just ahead of the $2.50 level, eventually ending the session with marginal gains. The price action was in tandem with declining open interest and volume and leaves the door open to some near-term correction. So far, the $2.50 zone per MMBtu remains a key resistance area.
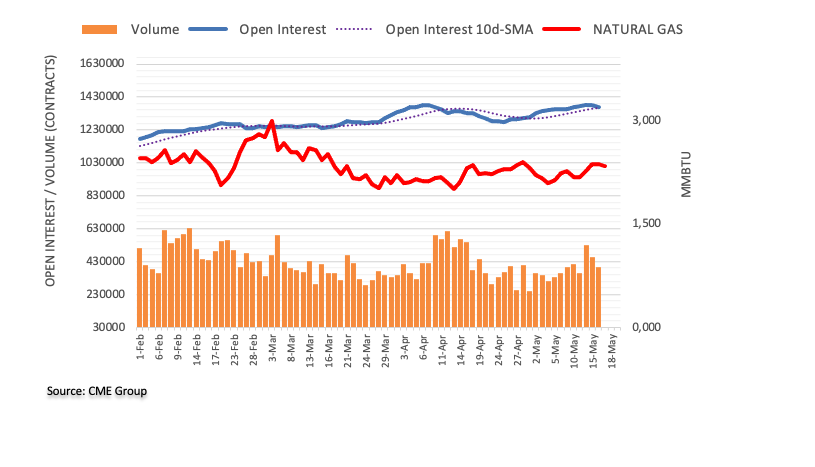
Economists at Danske Bank have a near-term negative stance on NOK given a mismatch in fiscal FX transactions and shaky global risk appetite.
More bullish secular case for energy and by extension NOK over the coming 5 years
“We have a near-term negative stance on NOK given a mismatch in fiscal FX transactions and shaky global risk appetite amid slowing global growth, contractionary monetary and credit signals and bank sector concerns.”
“We still believe in a more positive case for energy and by extension NOK for the coming 5 years but we highlight the risk that our NOK positive view could take longer to play out.”
“We forecast EUR/NOK at 11.70 in 3M and 10.80 in 12M.”
- USD/CHF picks up bids to refresh intraday high, extends previous recovery.
- Upbeat oscillators, sustained trading beyond 200-HMA favor Swiss Franc sellers.
- One-month-old descending resistance line, nearly overbought RSI conditions prod pair buyers.
- Sellers need validation from the fortnight-long ascending support line.
USD/CHF renews intraday high near 0.8970 as it extends the previous day’s recovery moves heading into Wednesday’s European session.
In doing so, the Swiss Franc (CHF) pair cheers sustained trading above the 200-Hour Moving Average (HMA) amid bullish MACD signals and upbeat RSI (14), not overbought. However, the RSI (14) has limited room towards the north before hitting the overbought territory, which in turn highlights a downward-sloping resistance line from April 19, close to 0.8990 at the latest, as the short-term key resistance.
In a case where the USD/CHF remains firmer past 0.8990, the April 19 high of around 0.9000 and April 10 peak of near 0.9135 could challenge the pair buyers before directing them to the previous monthly top surrounding the 0.9200 round figure.
Meanwhile, USD/CHF pullback moves remain elusive unless it breaks the 200-HMA support of 0.8925.
Even if the Swiss Franc (CHF) pair breaks the 0.8925 HMA support, an upward-sloping support line from May 04, near 0.8920 at the latest, will act as an extra filter towards the south.
If at all, the USD/CHF weakness past 0.8920 could direct the bears toward the monthly low of 0.8820.
Overall, USD/CHF remains on the bull’s radar even if there prevails a little room on the upside.
USD/CHF: Hourly chart
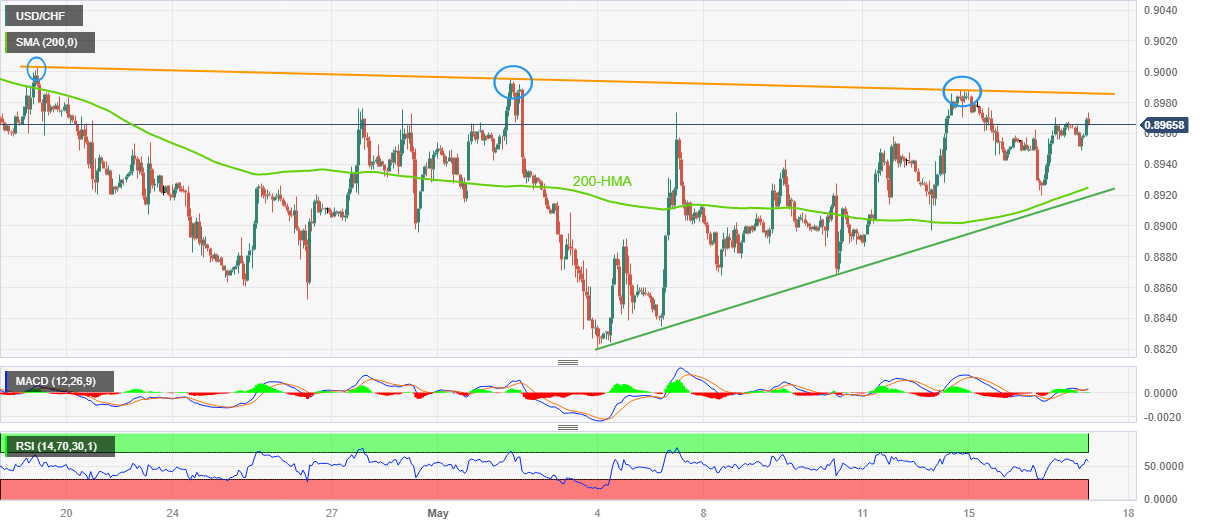
Trend: Limited upside expected
Further retracement in AUD/USD appears likely while below the 0.6630 level, suggest Economist Lee Sue Ann and Markets Strategist Quek Ser Leang at UOB Group.
Key Quotes
24-hour view: “Our expectation for ‘the rebound in AUD to extend’ was incorrect as it fell to a low of 0.6651 before closing on a soft note at 0.6654 (0.69%). Downward pressure has not increased much and while AUD is likely to trade with a downward bias today, a sustained break below the major support of 0.6630 is unlikely. The mild downward bias is intact as long as AUD stays below 0.6700 (minor resistance is at 0.6675).”
Next 1-3 weeks: “There is not much to add to our update from Monday (15 May, spot at 0.6650). As highlighted, while the bias for AUD is tilted to the downside, it has to break and stay below 0.6630 before a sustained decline to 0.6575 is likely. The odds of AUD breaking clearly below 0.6630 will remain intact as long as it stays below 0.6725 (no change in ‘strong resistance’).”
Considering advanced prints from CME Group for crude oil futures markets, open interest dropped for the 5th consecutive session on Tuesday, now by around 8.4K contracts. Volume followed suit and went down by around 87.4K contracts.
WTI: A minor contention emerges around $70.00
Prices of the WTI appears to have moved into a consolidative phase so far this week. Tuesday’s negative price action was accompanied by shrinking open interest and volume and is indicative that the continuation of the downtrend looks out of favour for the time being. So far, the $70.00 mark per barrel should act as an initial contention zone.
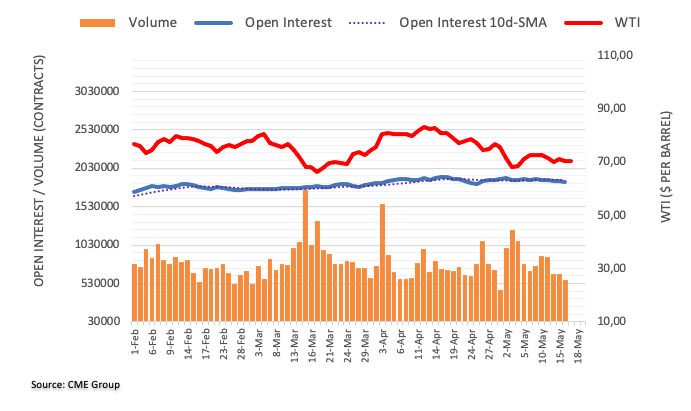
Activity data from April all came in below market expectations and suggest China’s recovery is losing steam, economists at Commerzbank report.
China’s recovery is stalling
“April’s data point to weakness in manufacturing, while consumer spending also slowed after a strong recovery.”
“Given the disappointing data for April, policymakers will likely need to maintain, or even step up, their policy stimulus effort.”
“It will take time for new credit to filter through to the economy. The question is how long. Cutting lending rates further may not necessarily help much. However, rate cuts could signal further easing stance of the central bank so it may still be a useful step to take.”
“More policy support helps. However, the key to the economic recovery lies in private sector confidence.”
Economist Lee Sue Ann and Markets Strategist Quek Ser Leang at UOB Group note GBP/USD could weaken further and revisit 1.2390 in the next few weeks.
Key Quotes
24-hour view: “We expected GBP to trade sideways between 1.2475 and 1.2545 yesterday. GBP dropped briefly to a low of 1.2466 in London trade, rebounded to 1.2546 and then fell back down to end the day at 1.2487 (-0.36%). Today, the weakened underlying tone is likely to lead to GBP edging lower but a sustained drop below 1.2440 is unlikely. On the upside, a breach of 1.2530 (minor resistance is at 1.2505) indicates that the current mild downward pressure has faded.”
Next 1-3 weeks: “Our most recent narrative was from Monday (15 May, spot at 1.2455) wherein GBP is likely to weaken further to 1.2390 but oversold short-term conditions could slow the pace of any further decline. We continue to hold the same view. Only a breach of 1.2560 (no change in ‘strong resistance’ level) would indicate that 1.2390 is not coming into view.”
- EUR/GBP has climbed sharply above 0.8700 as the BoE is expected to pause its rate-hiking spree ahead.
- Downbeat UK Employment data adds to factors advocating for a pause in the policy-tightening spell by the BoE.
- ECB Lagarde already confirmed that more than one interest rate hikes are in pipeline.
The EUR/GBP pair has scaled firmly above the round-level resistance of 0.8700 in the early European session. The cross has witnessed a decent buying interest as investors are anticipating that the Bank of England (BoE) will pause its policy-tightening spell ahead.
Investors should not that BoE Governor Andrew Bailey raised interest rates by 25 basis points (bps) to 4.50% in its May monetary policy to tame the double-digit United kingdom inflation.
Economists at UOB believes that “The MPC no longer expects the UK economy to enter recession this year and now expects GDP to grow by 0.25% in 2023 and by 0.75% in 2024. Inflation is expected to remain above 10%, before falling sharply over the coming months, driven largely by falling energy prices.” They further added, “Whether the MPC will be comfortable with pausing by the time of the next meeting on 22 Jun will depend very much on incoming data and developments. However, we stick to our view that the BOE may pause as soon as next month.”
On Tuesday, UK‘s Employment data also remained below estimates. Three-month Unemployment Rate jumped to 3.9% vs. the estimates and the former release of 3.8%. Claimant Count Change (April) soared to 46.7K while the street was anticipating a decline by 10.8K. Also, Average Earnings excluding bonuses landed at 6.7%, missed estimates of 6.8%. This also adds to factors advocating for a pause in the policy-tightening spell by the BoE.
Meanwhile, the Euro is expected to perform relatively better as the European Central Bank (ECB) is expected to raise interest rates further. ECB President Christine Lagarde already confirmed that more than one interest rate hikes are in pipeline.
Open interest in gold futures markets shrank by around 14.2K contracts on Tuesday according to preliminary readings from CME Group. Volume, instead, reversed two consecutive daily pullbacks and went up by around 52.3K contracts.
Gold: Next on the downside comes $1970
Tuesday’s marked retracement in gold prices was on the back of diminishing open interest and suggests that extra weakness seems unlikely for the time being. The commodity, in the meantime, is expected to meet the next support of note around $1970, where coincides lows seen in the second half of April and the temporary 55-day SMA.
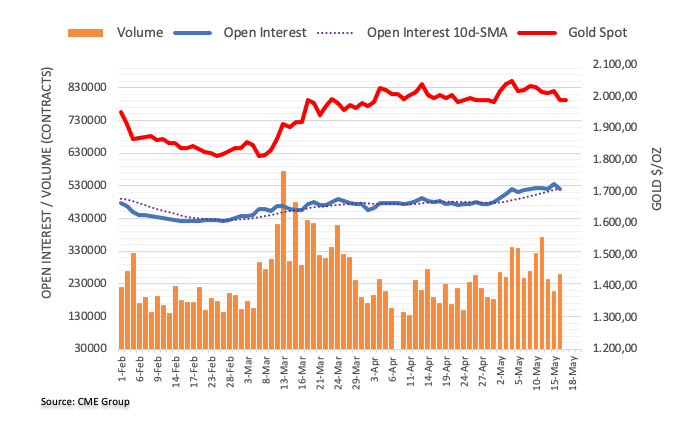
- Gold price remains depressed near the lowest levels in two weeks.
- US Dollar recovers amid mixed feelings about debt ceiling negotiations, ignores pullback in yields.
- Light calendar restricts XAU/USD moves, headlines about US default, Fed appear the key catalysts.
- Hawkish Fed talks, upbeat US data keep the Gold price below a short-term key resistance.
Gold price (XAU/USD) grinds near the lowest levels in a fortnight, recently easing from the intraday top, as market sentiment dwindles amid a lack of clarity about the US default conditions.
That said, the recently firmer US data and hawkish Federal Reserve (Fed) commentary allow the US Dollar to ignore a retreat in the Treasury bond yields and remain firmer, which in turn exerts additional downside pressure on the Gold price.
Above all, sour sentiment and the metal’s inability to cross the short-term key upside hurdle keep the XAU/USD bears hopeful, especially amid a light calendar and mixed risk catalysts.
Also read: Gold Price Forecast: ‘Sell the bounce’ in XAU/USD, as technical indicators turn bearish
Gold Price: Key levels to watch
Our Technical Confluence Indicator suggests that the Gold price remains bearish below the key $2,013 resistance confluence comprising the Fibonacci 23.6% on one week, Fibonacci 38.2% on one month and 5-DMA.
That said, the XAU/USD currently prods the $1,987 support encompassing the Fibonacci 61.8% on one month, a break of which could direct the Gold price towards $1,975 support including the Pivot Point one week S2.
Following that, the previous monthly low of around $1,950 will be in the spotlight.
Alternatively, a slew of resistances stands tall to challenge the Gold price recovery before the quote hits the $2,013 key upside hurdle.
Among them, Fibonacci 38.2% on one day around $1,998 and the $2,000 guards the XAU/USD’s immediate rebound.
In a case where the Gold price remains firmer past $2,000, the middle band of the Bollinger on the daily chart, near $2,008, can act as an extra filter ahead of the $2,013 resistance confluence.
It’s worth noting that the $2,050 is a tough nut to crack for the Gold buyers if they manage to keep the reins past $2,013.
Here is how it looks on the tool
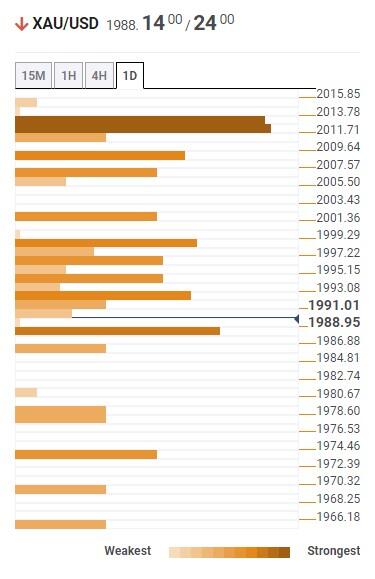
About Technical Confluences Detector
The TCD (Technical Confluences Detector) is a tool to locate and point out those price levels where there is a congestion of indicators, moving averages, Fibonacci levels, Pivot Points, etc. If you are a short-term trader, you will find entry points for counter-trend strategies and hunt a few points at a time. If you are a medium-to-long-term trader, this tool will allow you to know in advance the price levels where a medium-to-long-term trend may stop and rest, where to unwind positions, or where to increase your position size.
FX option expiries for May 17 NY cut at 10:00 Eastern Time, via DTCC, can be found below.
- EUR/USD: EUR amounts
- 1.0795-10 751m
- 1.0825-35 556m
- 1.0915-20 619m
- USD/JPY: USD amounts
- 134.50 2.1b
- 135.50 1.3b
- 136.00-10 1.3b
- 136.80 806m
- 137.00 503m
- USD/CAD: USD amounts
- 1.3400 1.2b
- 1.3450 1.3b
- EUR/JPY: EUR amounts
- 141.00 1b
According to Economist Lee Sue Ann and Markets Strategist Quek Ser Leang, EUR/USD risks a potential drop to the 1.0800 region in the short term.
Key Quotes
24-hour view: “Yesterday, we expected EUR to consolidate in a range of 1.0845/1.0900. EUR traded between 1.0853 and 1.0904 before closing slightly lower at 1.0861 (-0.010%). The underlying tone has softened somewhat and EUR is likely to edge lower today, but any decline is likely part of a lower range of 1.0835/1.0890. In other words, a clear break below 1.0835 is unlikely.”
Next 1-3 weeks: “Our update from Monday (15 May, spot at 1.0850) is still valid. As highlighted, the outlook for EUR remains negative and the level to watch is 1.0800. On the upside, a breach of 1.0935 (no change in ‘strong resistance’ level) would indicate that the EUR weakness that started in the middle of last week has come to an end.”
- USD/CAD is eyeing to reclaim the 1.3500 resistance amid a solid recovery in the USD Index.
- The postponement of US debt ceiling issues till the weekend has weighed on US Treasury yields.
- The oil price has dropped sharply as investors are worried about deepening fears of a US recession.
The USD/CAD pair is looking to reclaim the psychological resistance of 1.3500 in the early London session. The Loonie asset has rebounded after a mild correction to near 1.3463 amid the recovery move by the US Dollar Index (DXY). The USD Index has refreshed its day’s high at 102.68 as US debt-ceiling issues have deepened further.
S&P500 futures generated moderate gains in the Asian session after a bearish Tuesday. The market mood seems mixed as risk-perceived currencies are facing severe pressure. The postponement of US debt ceiling issues till the weekend has weighed on Treasury yields. The yields offered on 10-year US Treasury bonds have slipped to near 3.52%.
The US Treasury is worried as each passing day is pushing the US economy towards recession. A default in obligated payments by the US Treasury will result in the loss of millions of jobs and Gross Domestic Product (GDP) figures.
On the Canadian Dollar front, a rebound in inflationary figures (April) has renewed fears of further interest rate hikes from the Bank of Canada (BoC). Annual headline Consumer Price Index (CPI) landed at 4.4%, higher than the consensus of 4.1% and the former release of 4.3%. While the core inflation landed between the estimates of 3.9% and the prior release of 4.3% at 4.1%. Also, monthly headline CPI jumped to 0.7% vs. the estimates of 0.4%.
The oil price has dropped sharply as investors are worried about deepening fears of a US recession. Going forward, the oil inventory data by the US Energy Information Administration (EIA) will be keenly watched. It is worth noting that Canada is the leading exporter of oil to the US and lower oil prices impact the Canadian Dollar.
- AUD/USD reverses from intraday high amid fresh challenges to sentiment.
- Australia cancels quad meeting on Biden’s change of schedule.
- Aussie Wage Price Index remains unchanged on QoQ, improves on YoY.
- US policymakers appear hopes of avoiding default but lack of details raise doubts on optimism.
AUD/USD takes offers to prod the intraday low surrounding 0.6645 as market sentiment fades the early Asian session optimism ahead of Wednesday’s European morning. In doing so, the Aussie pair also takes clues from the mixed Australian wage data, as well as political headlines from Canberra.
Although the US congressional leaders cited possibilities of a deal to avoid the debt default by next week, a lack details and mixed outlook of Democrats seem to prod the optimism of late. Additionally, fears that the global markets will witness a shock on the US debt ceiling expiry, looming early June, also weigh on the sentiment.
At home, the headlines suggesting the cancellation of the quad meeting in Australia and the mixed Aussie wage price index exert downside pressure on the Australian Dollar. “Australia Prime Minister Anthony Albanese said, per Reuters, “The leaders of Australia, the United States, India and Japan would instead meet at the G7 in Japan this weekend, after Biden canceled a trip to Sydney on the second leg of his upcoming Asia trip, which was also to have included a visit to Papua New Guinea.”
On the same line, upbeat US Retail Sales and Industrial Production details for April allowed the Federal Reserve (Fed) officials to remain hawkish and prod the risk-on mood, as well as the AUD/USD buyers. Recently among them were Federal Reserve Bank of Chicago President Austan Goolsbee and Atlanta Fed President Raphael Bostic.
It’s worth mentioning that Australia’s Wage Price Index repeated 0.8% QoQ figures for the first quarter (Q1) of 2023, below the 0.9% market consensus, whereas the YoY numbers improved to 3.7% versus 3.6% expected and 3.3% previous readings.
Further, hopes of more investment from China also should have favored the AUD/USD prices but did not amid the latest shift in the sentiment. China’s State Planner National Development and Reform Commission of the People's Republic of China (NDRC) recently mentioned that it'll take measures to unleash consumption potential and to make continuous efforts in stabilizing and expanding manufacturing investment.
Against this backdrop, S&P500 Futures remain mildly bid near 4,132 and the key US Treasury bond yields retreat from the two-week high marked the previous day. However, the US Dollar Index (DXY) bounces off its intraday low to 102.65 whereas the Asia-Pacific shares grind lower of late.
Looking ahead, AUD/USD pair remains vulnerable to shifts in the market sentiment and the US Dollar amid a light calendar at home and abroad ahead of Thursday’s monthly employment report. Should the scheduled Aussie jobs data print upbeat figures, the Reserve Bank of Australia (RBA) hawks could justify their latest rate hikes and allow the pair to consolidate the latest losses.
Technical analysis
The failure to provide a daily closing beyond the 10-DMA hurdle, around 0.6715, directs AUD/USD towards an upward-sloping support line from March 10, close to 0.6605 by the press time.
- GBP/USD is juggling in a narrow range above 1.2480 amid sideways performance by the USD Index.
- Weak UK Employment data has provided some relief to BoE policymakers.
- GBP/USD is hovering near the lower portion of the Rising Channel pattern plotted at 1.2276.
The GBP/USD pair is demonstrating a back-and-forth action above 1.2480 in the early European session. The Cable is struggling to find any decisive move, following the footprints of the sideways US Dollar Index (DXY). The US Dollar Index (DXY) is auctioning topsy-turvy below the immediate resistance of 102.70.
The FX domain failed to show any action despite discussions over the US debt-ceiling postponed further to later this week. However, US President Joe Biden has cleared that he will remain in touch with Speaker McCarthy each day to resolve negotiations.
Meanwhile, weak United Kingdom Employment data has provided some relief to Bank of England (BoE) policymakers. Investors should note that labor shortages and historically high food inflation have remained major catalysts for double-digit UK inflation.
GBP/USD is hovering near the lower portion of the Rising Channel chart pattern plotted from April 03 low at 1.2276. The upper portion of the aforementioned chart pattern is placed from April 04 high at 1.2525. The 20-period Exponential Moving Average (EMA) has restricted the upside of the Pound Sterling.
The Relative Strength Index (RSI) (14) seems vulnerable in the 40.00-60.00 range, A sharp slippage below 40.00 will trigger the downside momentum.
A downside move below May 12 low at 1.2440 will trigger a breakdown of the Rising Channel pattern and will expose the Cable to April 21 low at 1.2367 followed by April 03 low at 1.2276.
On the flip side, a recovery move above May 09 high at 1.2640 will drive the major toward the round-level resistance at 1.2700 and 26 April 2022 high at 1.2772.
GBP/USD four-hour chart
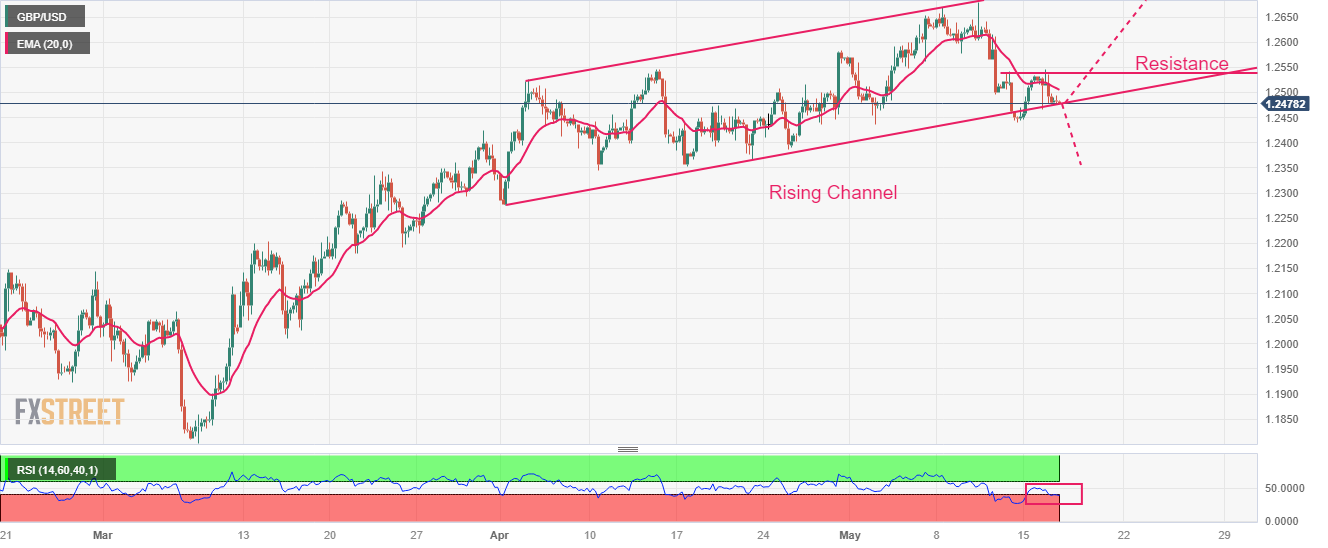
- Asia-Pacific markets edge lower despite mildly upbeat sentiment on broader front.
- S&P500 Futures print mild gains, Japan’s Nikkei 225 renews 20-month high.
- China’s NDRC hints at more investments to fueling consumption, US policymakers appear hopeful of avoiding debt payment default.
- Aussie PM cancels quad meeting on US President Biden’s actions.
Market sentiment in the Asia-Pacific zone remains mixed, mostly downbeat, during early Wednesday despite the stellar performance of Japanese stocks and upbeat S&P500 Futures. The reason could be linked to traders’ doubt about the US debt ceiling extension, despite policymakers’ optimism, as well as hawkish hopes from the respective central bank. Adding strength to the cautious mood could be the geopolitical concerns surrounding Australia and China.
Amid these plays, MSCI’s index of Asia-Pacific shares outside Japan remains indecisive with minor losses whereas Japan’s Nikkei 225 rises to a fresh high since September 2021, up 0.80% intraday near 30,080 by the press time. On a broader front, S&P500 Futures print mild gains around 4,135 and defy Wall Street’s downbeat performance whereas the US 10-year and two-year Treasury bond yields print the first daily losses in four by the press time. That said, the US Dollar Index (DXY) retreats to 102.57 following Tuesday’s 0.18% intraday gain to reverse the week-start losses.
It should be noted that Japan’s upbeat preliminary reading of the first quarter (Q1) 2023 Gross Domestic Product (GDP) figures, to 0.4% QoQ versus 0.1% expected and 0.0% prior, pleases the bulls in Tokyo by posting the first quarter-on-quarter gain in three quarters.
On the same line, China’s State Planner National Development and Reform Commission of the People's Republic of China (NDRC) recently mentioned that it'll take measures to unleash consumption potential and to make continuous efforts in stabilizing and expanding manufacturing investment.
The stocks in China, Hong Kong, Australia and New Zealand, however, remain depressed amid fears of the hawkish Fed and skepticism about the US diplomats’ ability to overcome the debt default fears. Additionally weighing on the risk appetite could be the headlines suggesting the cancellation of the quad meeting in Australia and the mixed Aussie wage price index. “Australia Prime Minister Anthony Albanese said, per Reuters, “The leaders of Australia, the United States, India and Japan would instead meet at the G7 in Japan this weekend, after Biden canceled a trip to Sydney on the second leg of his upcoming Asia trip, which was also to have included a visit to Papua New Guinea.”
It should be observed that the US congressional leaders’ optimism contrasts with upbeat US data and hawkish Fed talks to prod the market bulls.
Also read: S&P500 Futures recover, yields soften as US default fears diminish
- EUR/USD has faced selling interest after a short-lived pullback to near 1.0873.
- A mild expansion is US Retail Sales is insufficient to impact expectations for a steady monetary policy by the Federal Reserve.
- The street is anticipating more than one interest rate hike from European Central Bank.
- EUR/USD has dropped below the 38.2% Fibonacci retracement at 1.0876.
EUR/USD has sensed selling pressure around 1.0873 after a less-confident recovery move as the US Dollar Index (DXY) is preparing for coming out of the woods and climbing above the immediate resistance of 102.70. The major currency pair witnessed an intense sell-off on Tuesday after the release of the preliminary Eurozone Q1 Gross Domestic Product (GDP) data.
S&P500 futures have generated some decent gains in Asia, and managed to battle against the bearish sentiment faced on Tuesday. It seems that appeal of US equities has improved despite fears of catastrophic default by the United States Treasury have deepened further. The USD Index is displaying a sideways performance after a solid recovery to near 102.70. A continuation of sideways performance is expected from the USD Index as US debt-ceiling negotiations have been further postponed to later this week.
The postponement of approval for debt-ceiling cap has improved demand for US government bonds. This has led to a decline in 10-year US Treasury yields below 3.53%.
US debt-ceiling concludes without constructive outcome
Investors were keenly awaiting the approval of raising the US borrowing cap by Republican House of Representatives Joseph McCarthy, keeping in mind that President’s spending initiatives will get reduced. However, the decision of raising debt-ceiling to safeguard the US Treasury from making default on obligated payments was postponed further to later this week.
From the meeting, one thing is for sure the proposal of default is off the table as every delegate agreed that a higher debt-ceiling along with widened budget deficit due to higher spending initiatives will be a disaster. US President Joe Biden has cleared that he will remain in touch with Speaker McCarthy each day to resolve negotiations.
A further delay in US debt-ceiling decision has deepened fears of a default by the US Treasury. US Treasury Secretary Janet Yellen has already warned that the Federal will be out of funds in early June and a default would result in the loss of millions of jobs, a contraction in GDP, and a situation of recession in the United States economy.
Slow US Retail Sales growth strengthens hopes of neutral Federal Reserve rate policy
On Tuesday, monthly US Retail Sales data (April) expanded at a slower pace at 0.4% against the estimate of 0.7%. It is worth noting that the retail demand was contracted by 0.7% in March. Higher inflation is biting households’ pocket that is resulting in weak demand and showing consistent weight on US inflation. A mild expansion is insufficient to impact expectations for a steady monetary policy by the Federal Reserve (Fed), however, a persistent nature could force the central bank to raise interest rates further.
Atlanta Federal Reserve President Raphael Bostic said “It is unclear what the Federal Reserve would do in the case of a debt default”. He further added that a stick US inflation and rising unemployment will put immense pressure on the Federal Reserve.
Eurozone GDP maintains status-quo
European Central Bank (ECB) policymakers have been very confident of solid demand and labor shortage in Eurozone. Therefore, the need for more interest rate hikes is warranted as inflation is far from desired levels. The street is anticipating more than one interest rate hike from European Central Bank President Christine Lagarde as announced in the last monetary policy meeting.
On Tuesday, the Euro bulls faced a sell-off despite Eurozone GDP match estimates. Quarterly and annual GDP maintained the pace at 0.1% and 1.3% respectively.
EUR/USD technical outlook
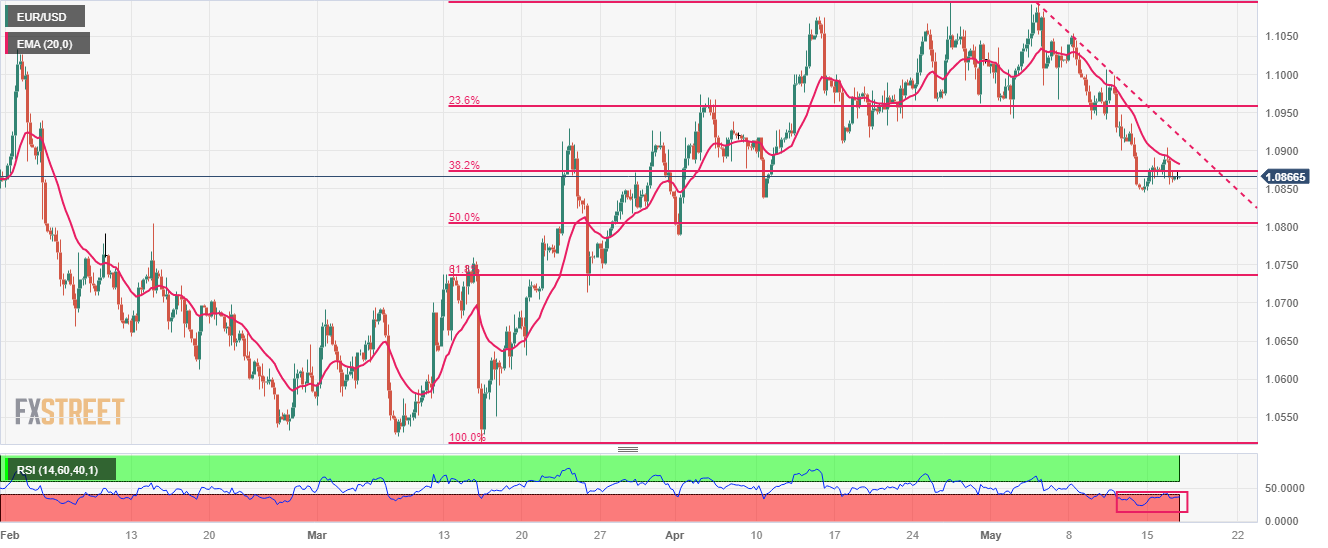
EUR/USD has dropped below the 38.2% Fibonacci retracement (placed from March 15 low at 1.0516 to April 26 high at 1.1095) at 1.0876 on a four-hour scale. The downward-sloping trendline from May 04 high at 1.1077 will act as a barricade for the Euro bulls.
Also, the 20-period Exponential Moving Average (EMA) at 1.0883 is restricting the upside for the shared currency bulls.
The Relative Strength Index (RSI) (14) is oscillating in the bearish range of 20.00-40.00, indicating more weakness ahead.
- USD/INR struggles for clear directions after snapping three-day uptrend the previous day.
- One-month-old horizontal region, ascending trend line from May 07 limit immediate moves of Indian Rupee pair.
- Upbeat RSI (14) suggests continuation of northward grind; 200-SMA acts as the last defense of USD/INR bulls.
USD/INR treads water around 82.30 as it jostles with the one-month-old horizontal resistance area during early Wednesday.
That said, the Indian Rupee (INR) pair retreated from the stated hurdle surrounding 82.40-42 the previous day while printing the first daily loss in four.
However, the upbeat RSI (14) line, not overbought, favors the extension of the Indian Rupee (INR) pair’s slow grind toward the north triggered earlier in May. With this, the USD/INR pair buyers are hopeful of overcoming the 82.42 resistance zone.
Following that, the 61.8% Fibonacci retracement level of the pair’s March-April downside, near 82.45 and the previous monthly high of around 82.50 may check the USD/INR bulls before directing them to the March’s high of 83.03.
Alternatively, a one-week-old ascending support line, close to 82.20 by the press time, puts a floor under the USD/INR prices for the short term.
In a case where the USD/INR breaks the 82.20 support, the 82.00 psychological magnet and the 200-SMA surrounding 81.95 could probe the pair sellers before giving them control.
To sum up, USD/INR is expected to keep the latest upside move but the road toward the north is long and bumpy.
USD/INR: Four-hour chart
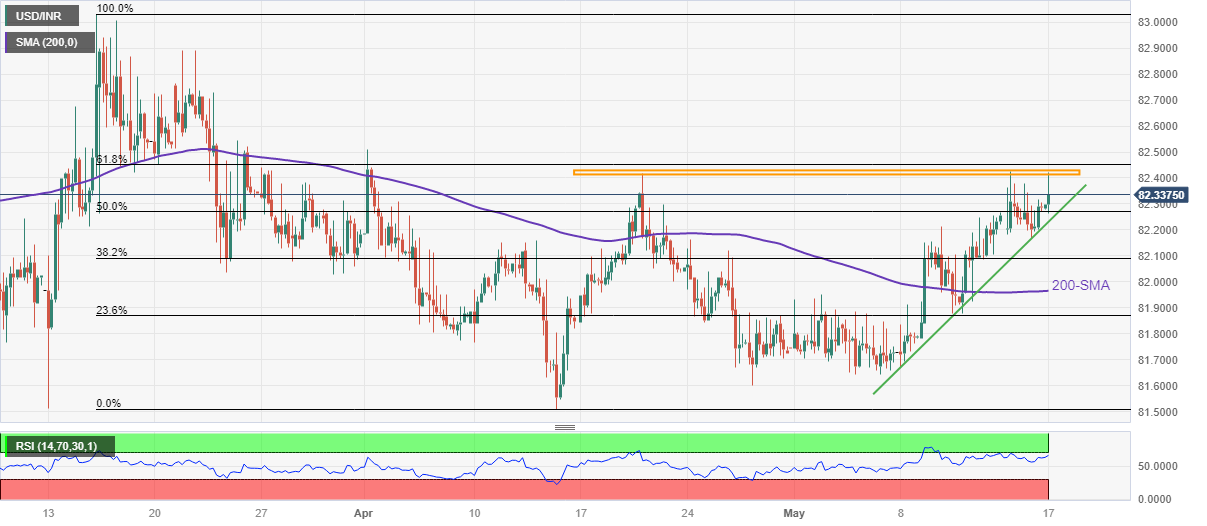
Trend: Gradual upside expected
- USD/JPY has climbed above 136.50 as the USD Index is gathering strength for surpassing the immediate resistance of 102.70.
- Preliminary Japan’s Q1 GDP beat estimates but failed to strengthen the Japanese Yen.
- USD/JPY is marching towards its two-month high resistance plotted at 137.91.
The USD/JPY pair has resumed its upside journey after a marginal correction below 136.50 in the Asian session. The major is aiming to recapture Tuesday’s high at 136.68 as the Japanese Yen has failed to find strength despite upbeat Q1 Gross Domestic Product (GDP) numbers. Preliminary Q1 GDP accelerated by 0.4% vs. the estimates of 0.1%. In the last quarter, the GDP growth remained stagnant.
The US Dollar Index (DXY) has turned sideways after failing to extend recovery above 102.70 despite the absence of approval for an extension in the US borrowing cap to safeguard the US Treasury from default for obligated payments.
Later this week, Japan’s National Consumer Price Index (CPI) data (April) will be keenly watched. Headline CPI is seen softening to 2.5% from the former release of 3.2%. Also, the core inflation is expected to decelerate to 3.4% against the prior figure of 3.8%.
USD/JPY is marching towards its two-month high resistance plotted from March 08 high at 137.91. The asset is auctioning in an Ascending Triangle chart pattern on a daily scale, which signals a decline in volatility. Upward-sloping trendline from March 24 low at 129.64 will continue to act as a support for the US Dollar bulls.
Advancing 10-period Exponential Moving Average (EMA) at 135.60 indicates strength in USD/JPY.
The Relative Strength Index (RSI) (14) is making efforts for shifting into the bullish range of 60.00-80.00, which will activate the upside momentum.
Should the asset break above Tuesday’s high at 136.68, US Dollar bulls will drive the pair toward March 02 high at 137.10 and a two-month high at 137.91.
On the flip side, a downside move below May 10 high at 135.47 will strengthen the Japanese Yen bulls. This would drag the USD/JPY pair towards May 11 high at 134.84 followed by May 11 low at 133.74.
USD/JPY daily chart
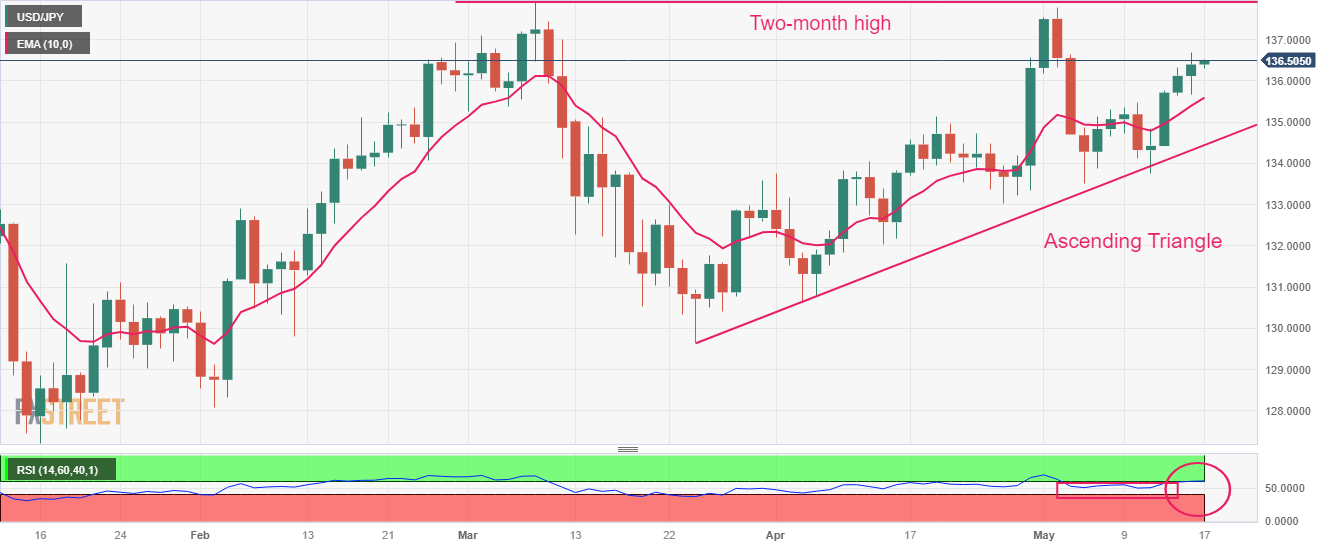
- Gold price picks up bids to pare the biggest daily loss in a week at the lowest level in fortnight.
- Mildly positive sentiment, light calendar weigh on US Dollar, allowing XAU/USD to rebound.
- US Dollar traces pullback in Treasury bond yields amid receding fears of government default on debt payment.
- Absence of major data/events allows the Gold price to recover but technical details keep bears hopeful.
Gold price (XAU/USD) renews its intraday high near $1,993 as it reverses the previous day’s losses at the lowest levels in two weeks amid early Wednesday’s cautiously optimistic markets. Adding strength to the XAU/USD rebound is the lack of major data/events, as well as the Gold price-positive headlines from China.
A meeting between US President Joe Biden and House Speaker Kevin McCarthy renewed the market’s optimism that the US policymakers will be able to avoid the “catastrophic” default. Following the less-than one-hour-long meeting, congressional leaders, said, "It is possible to get a deal by the end of the week." The optimism triggered a fall in the one-year US Credit Default Swap (CDS) spreads.
On the other hand, China’s State Planner National Development and Reform Commission of the People's Republic of China (NDRC) recently mentioned that it'll take measures to unleash consumption potential and to make continuous efforts in stabilizing and expanding manufacturing investment. It’s worth noting that China is one of the world’s largest Gold consumers and hence any positives from the Dragon Nation can favor the XAG/USD buyers.
Alternatively, upbeat US Retail Sales and Industrial Production details for April allowed the Federal Reserve (Fed) officials to remain hawkish and prod the risk-on mood. Recently among them were Federal Reserve Bank of Chicago President Austan Goolsbee and Atlanta Fed President Raphael Bostic.
Against this backdrop, S&P500 Futures print mild gains around 4,135 and defy Wall Street’s downbeat performance whereas the US 10-year and two-year Treasury bond yields print the first daily losses in four by the press time. That said, the US Dollar Index (DXY) retreats to 102.57 following Tuesday’s 0.18% intraday gain to reverse the week-start losses.
Looking forward, a light calendar may allow the Gold price to extend the latest rebound but second-tier housing data from the US can entertain the traders. Above all, headlines about the central banks and US default will be key to watch for clear XAU/USD directions.
Gold price technical analysis
Gold price portrays a corrective bounce from the lowest level in two weeks amid an oversold RSI (14) line. The recovery moves, however, appear elusive as bearish MACD signals join the metal’s clear downside break of the previous key support line stretched from mid-March and the 200-SMA.
Even if the Gold price manages to cross the key SMA and the multi-day-old previous support line, respectively near $2,005 and $2,010, a downward-sloping resistance line from May 03, close to $2,020 at the latest, will be an additional check for the XAU/USD bulls.
On the contrary, multiple bottoms around the 38.2% Fibonacci retracement level of the Gold price run-up during the March-May period, close to $1,975, may restrict short-term declines of the bullion.
In a case where the Gold price remains weak past $1,975, April’s low of around $1,950 and late March's bottom of near $1,932 may lure the XAU/USD bears.
Overall, the Gold Price remains on the bear’s radar despite the latest short-covering move targeting the support-turned-resistance line.
Gold price: Four-hour chart
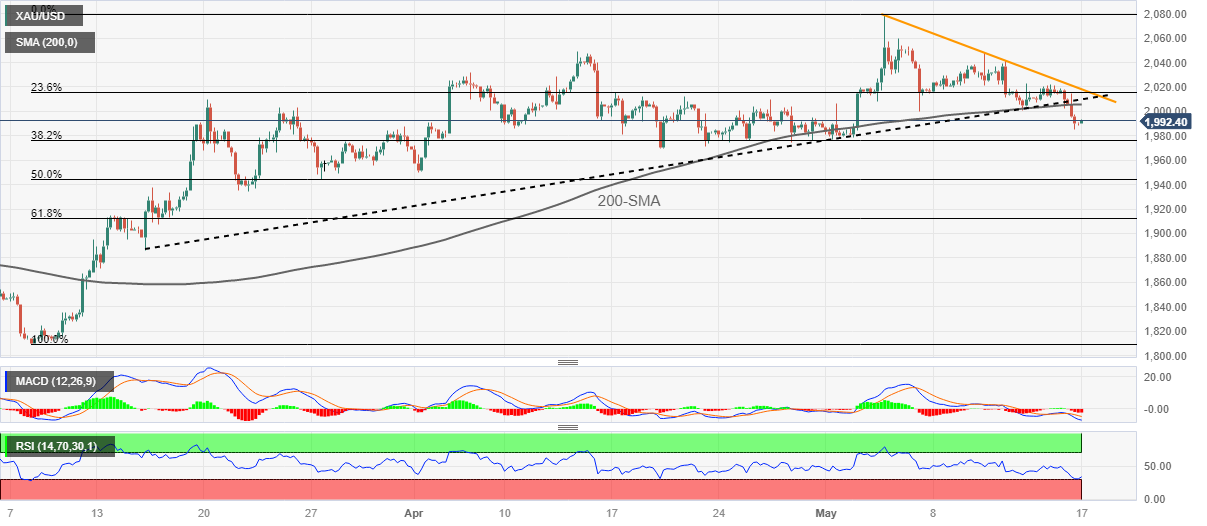
Trend: Limited recovery expected
Following the release of the Japanese Q1 Gross Domestic Product (GDP) data early Wednesday, the country’s Economy Minister Shigeyuki Goto said that “GDP data shows moderate economic pickup continuing.”
Additional takeaways
Economy likely to continue moderate pickup ahead due to improving sentiment, wage hikes and strong corporate appetite for investment.
Govt aims to extend positive moves in economy to stble virtuous cycle of wages and prices.
Govt to spread recognition that economy won't return to deflation and to achieve end of deflation and private demand-led sustainable growth.
Japan nominal gdp hits record 570.1 trln yen, exceeding pre-covid high for first time in 3-1/2 years.
Downside risks to global economy warrants attention.
Need to carefully watch impact of price hikes on consumption ahead.
Meanwhile, Japanese Chief Cabinet Secretary Matsuno said that the “government views economy as a whole continues to gradually recover.”
- Market sentiment improves as US policymakers appear optimistic about avoiding “catastrophic” default.
- S&P500 Futures ignore Wall Street’s losses to print mild gains, US Treasury bond yields retreat from two-week high.
- Hawkish Federal Reserve talks, upbeat US data challenge risk-on mood amid light calendar.
The market’s risk appetite solidifies on early Wednesday as traders remain hopeful of witnessing no US default. Adding to the consolidation mode could be a light calendar after a busy day, as well as cautious optimism among the US policymakers.
While portraying the mood, S&P500 Futures print mild gains around 4,135 and defy Wall Street’s downbeat performance whereas the US 10-year and two-year Treasury bond yields print the first daily losses in four by the press time. That said, the US Dollar Index (DXY) retreats to 102.57 following Tuesday’s 0.18% intraday gain to reverse the week-start losses. Furthermore, the Gold price rebounds from the lowest level in a fortnight whereas prices of Crude Oil and Natural Gas also portray the market’s cautious optimism.
US President Joe Biden and House Speaker Kevin McCarthy’s meeting renewed the market’s optimism that the US policymakers will be able to avoid the “catastrophic” default. Following the less-than one-hour-long meeting, congressional leaders, said, "It is possible to get a deal by the end of the week." The optimism triggered a fall in the one-year US Credit Default Swap (CDS) spreads.
In addition to the US debt-ceiling concerns, Japan’s upbeat preliminary reading of the first quarter (Q1) 2023 Gross Domestic Product (GDP) figures, to 0.4% QoQ versus 0.1% expected and 0.0% prior, also favor the market sentiment as the Asian major reported notable growth after three quarters of sluggish economic performance.
On the contrary, the Federal Reserve (Fed) officials remain hawkish and prod the risk-on mood, especially amid upbeat US data. That said, Federal Reserve Bank of Chicago President Austan Goolsbee and Atlanta Fed President Raphael Bostic defended the US central bank’s hawkish moves by citing inflation woes as they spoke at a conference hosted by the Atlanta Fed late Tuesday.
Talking about the data, US Retail Sales improved to 0.4% MoM for April, from -0.7% prior (revised) versus 0.7% expected. More importantly, Retail Sales Control Group for the said month crossed market forecasts of 0.0% and -0.4% prior with 0.7% actual figure whereas Retail Sales ex Autos matches 0.4% MoM estimations for April¸ surpassing the -0.5% prior. Further, the US Industrial Production MoM rose to 0.5% for April versus expectations of printing a 0.0% figure.
Not only the Fed officials but policymakers from the European Central Bank (ECB) and Bank of England (BoE) also backed the hawkish moves of their respective central banks, which in turn underpin the recession fears and test the latest optimism.
Moving on, a light calendar may restrict the market moves on Wednesday but second-tier inflation and housing data from the US and Europe will join the BoE Governor Andrew Bailey’s speech to entertain the traders.
Also read: Forex Today: Higher US yields, risk aversion lead to a stronger US Dollar
- Silver price licks its wounds at the lowest levels in six weeks.
- Daily closing below 50-DMA, bearish MACD signals keep XAG/USD sellers hopeful.
- 100-DMA, nearly oversold RSI (14) line can restrict Silver Price downside.
Silver price (XAG/USD) remains mildly bid around $23.75-80 as it pares the biggest daily loss in a week at a 1.5-month low, marked the previous day, amid early Wednesday in Europe.
Despite the latest inaction, or say a short-covering move, the XAG/USD remains on the bear’s radar as it keeps Tuesday’s closing breakdown of the 50-DMA. Adding strength to the Silver Price downside bias are the bearish MACD signals.
With this, the XAG/USD is well-set to drop test the 100-DMA support of near $23.40 before poking the 50% Fibonacci retracement level of its March-May upside, close to the $23.00 round figure.
It’s worth noting, however, that the RSI (14) line is near to the oversold territory and hence suggests bottom-picking of the XAG/USD around the aforementioned supports.
Should the Silver price drop below $23.00, the 61.8% Fibonacci retracement level, also known as the golden Fibonacci ratio, can challenge the XAG/USD bears near $22.30.
On the contrary, recovery moves need validation from the 50-DMA hurdle surrounding $24.10.
Even if the Silver price manages to provide a daily closing beyond $24.10, a horizontal area comprising levels marked since late March, around $24.20, can act as an extra filter towards the north before welcoming the XAG/USD bulls.
Following that, multiple levels marked during the April-May period, around $24.50-55, can act as the last defense of the XAG/USD bears.
Silver price: Daily chart
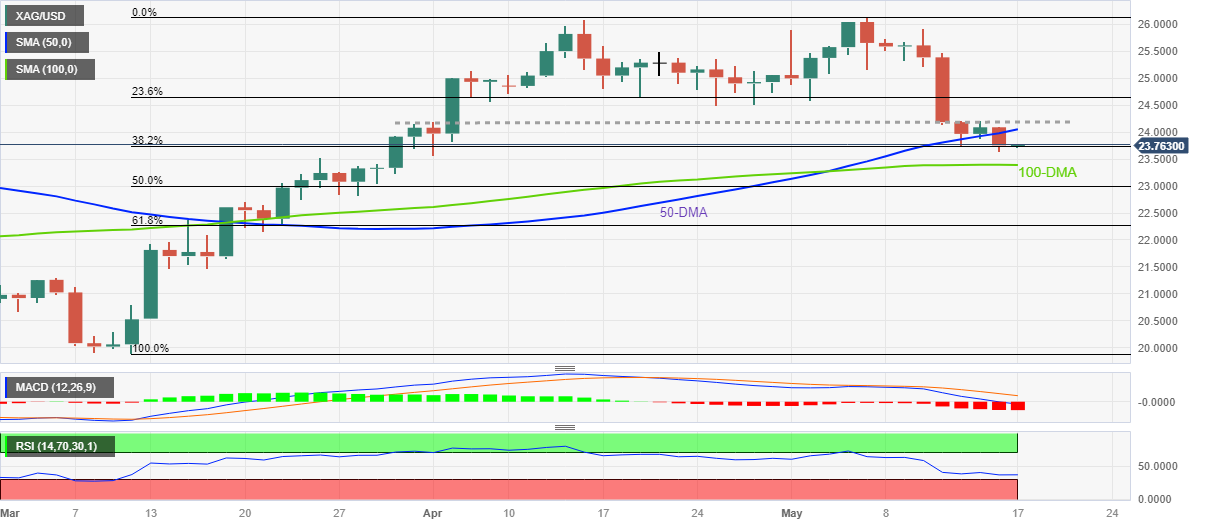
Trend: Limited downside expected
| Raw materials | Closed | Change, % |
|---|---|---|
| Silver | 23.74 | -1.46 |
| Gold | 1988.71 | -1.38 |
| Palladium | 1488.43 | -1.52 |
- Natural Gas price remains sidelined after reversing from the highest levels in two months.
- Market sentiment improves as US policymakers raise hopes of avoiding default.
- Upbeat US data, hawkish Fed speak and fears of more XNG/USD output weigh on the commodity price.
- Risk catalysts are the key ahead of weekly EIA Natural Gas Storage Change.
Natural Gas Price (XNG/USD) treads water around $2.50 amid Wednesday’s sluggish Asian session, after reversing from the highest levels since mid-March, as well as snapping a three-day uptrend, the previous day.
The energy instrument previously dropped amid the broad US Dollar rebound on sour sentiment and upbeat US data, not to forget the hawkish Federal Reserve (Fed) comments. However, receding fears of the US default and a light calendar allow the XNG/USD to pause the previous reversal from the multi-day top.
US Dollar Index (DXY) retreats to 102.57 following Tuesday’s 0.18% intraday gain to reverse the week-start losses.
That said, US Retail Sales improved to 0.4% MoM for April, from -0.7% prior (revised) versus 0.7% expected. More importantly, Retail Sales Control Group for the said month crossed market forecasts of 0.0% and -0.4% prior with 0.7% actual figure whereas Retail Sales ex Autos matches 0.4% MoM estimations for April¸ surpassing the -0.5% prior. Further, the US Industrial Production MoM rose to 0.5% for April versus expectations of printing a 0.0% figure.
While justifying the data, as well as defending the rate hike bias, Federal Reserve Bank of Chicago President Austan Goolsbee and Atlanta Fed President Raphael Bostic defended the US central bank’s hawkish moves by citing inflation woes as they spoke at a conference hosted by the Atlanta Fed on late Tuesday.
Talking about the risks, US President Joe Biden and House Speaker Kevin McCarthy’s meeting renewed the market’s optimism that the US policymakers will be able to avoid the “catastrophic” default. Following the less-than one-hour-long meeting, congressional leaders, said, "It is possible to get a deal by the end of the week." The optimism triggered a fall in the one-year US Credit Default Swap (CDS) spreads while also helping the S&P500 Futures to print mild gains and defy Wall Street’s downbeat performance.
It’s worth noting that the previous day’s downbeat China data renews fears of less energy demand from the world’s biggest commodity user. Adding to the Natural Gas market’s pessimism are concerns about higher supplies from Russia and the renewal of European gas flows.
Looking ahead, a light calendar may allow the XNG/USD to pare recent losses ahead of the weekly release of the US Energy Information Administration’s (EIA) Natural Gas Storage Change data, prior 78B. Apart from that, the updates surrounding the central banks and the US default will be more impactful and shouldn’t be missed for clear direction.
Technical analysis
Despite the failure to provide a daily closing beyond a two-month-old ascending resistance line, around $2.60 at the latest, the Natural Gas Price remains on the bull’s radar unless providing a daily close below a convergence of the 21-DMA and 50-DMA, near $2.37 at the latest.
- USD/CAD bulls eye support near a 50% mean reversion and a 61.8% Fibonacci area.
- Bulls need to break 1.3500 and daily trendline resistance.
At the time of writing, USD/CAD is trading around the 1.3480s and rallied from a low of 1.3404 overnight. There are prospects of a run to test the 1.3500 resistance, considering the price is now on the back side of the prior bearish micro trend.
USD/CAD H1 chart
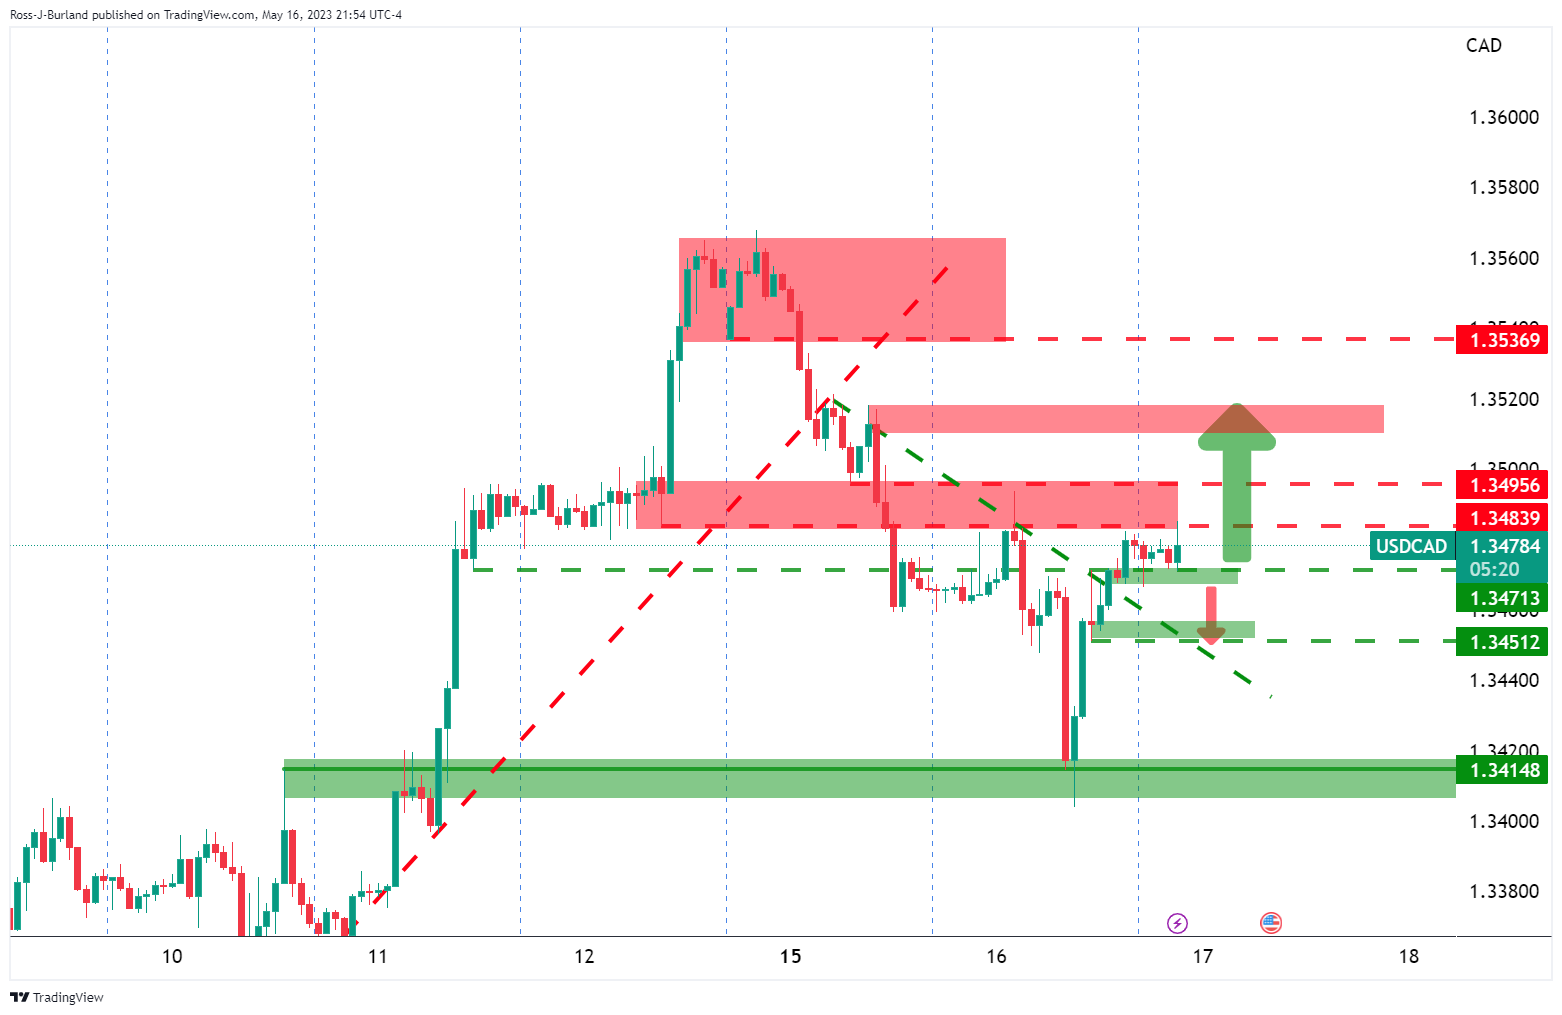
However, if the bears commit to resistance, there will be prospects of a move to restest the now counter-trendline support and the 1.3450s.
On the daily chart, below, such a move would tally with a 50% mean reversion support and below there, a 61.8% Fibonacci area around the 1.3420 and trendline support:
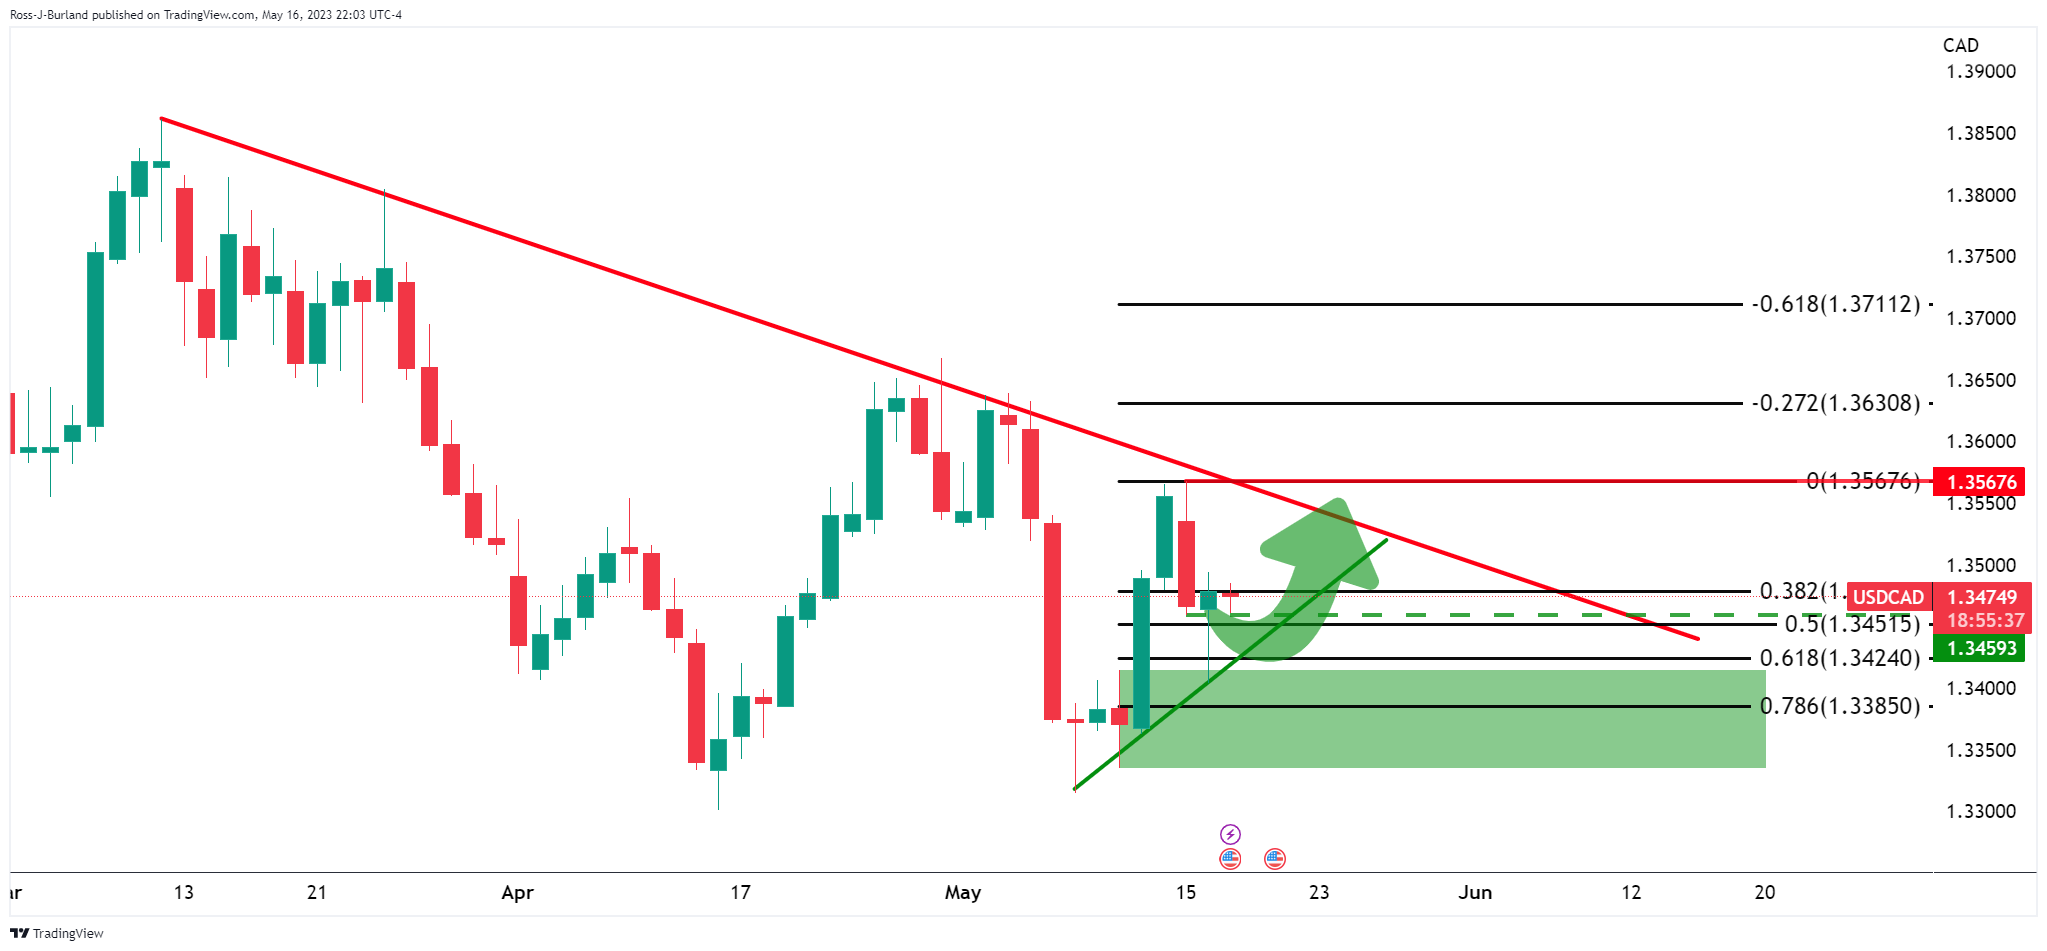
If the bulls commit, then there will be prospects of a move through the daily trendline resistance.
- NZD/USD has witnessed buying interest above 0.6220 amid a subdued performance by the USD Index.
- S&P500 futures have added significant gains in Asia, portraying a recovery in the risk appetite.
- Republican delegates denied approving the default as it would widen the already vulnerable budget deficit.
The NZD/USD pair has displayed a solid recovery after building a base above 0.6220 in the Tokyo session. The Kiwi asset has gained some traction as the US Dollar Index (DXY) has delivered a subdued performance in Asia.
S&P500 futures have added significant gains in Asia after a bearish Tuesday, portraying a recovery in the risk appetite of the market participants. The USD Index is facing barricades in stretching its recovery above 102.70.
The USD Index has failed to find traction despite the further postponement of the US borrowing cap raise approval by House of Representatives Joseph McCarthy. Republican delegates denied approving the default as it would widen the already vulnerable budget deficit. Meanwhile, US President Joe Biden cited that he will be in regular touch with Speaker McCarthy for US debt-ceiling issues.
However, each day spent without raising of US debt-ceiling is pushing the United States economy swiftly toward recession. The US Treasury has already conveyed that it will be out of funds by June 01 and might default in addressing obligated payments.
About interest rate guidance, Atlanta Federal Reserve (Fed) President Raphael Bostic said “It is unclear what the Fed would do in the case of a debt default”. He further added that a stick US inflation and rising unemployment will put immense pressure on the Fed.
On the New Zealand Dollar front, investors are awaiting the release of the Trade Balance data, which will release on Friday.
- AUD/USD has sensed selling pressure near 0.6660 amid mixed Aussie Wage Price Index data.
- Quarterly labor cost index missed estimates, however, annual data outperformed the consensus.
- The approval for raising the US borrowing cap postponed again to the end of the week.
The AUD/USD pair has sensed selling pressure near 0.6660 as the Australian Bureau of Statistics has reported mixed Q1 Wage Price Index data. Quarterly labor cost index has remained steady at 0.8% but lower than the estimate of 0.9%. On an annual basis, the economic data has accelerated to 3.7% vs. the consensus of 3.6% and the former release of 3.3%. This might allow the Reserve Bank of Australia (RBA) to keep interest rates steady at 3.85%.
Earlier, the Aussie asset remained sideways despite the approval for raising the US borrowing cap being postponed again to the end of the week. However, one thing is clear the default is not an option now as each delegate has considered it as a disaster.
Meanwhile, the US Dollar Index (DXY) is showing signs of volatility contraction after failing in extending its recovery above 102.70.
Scrutiny of AUD/USD’s four-hour scale indicates that the upside is capped from April 14 high around 0.6806 while the downside is restricted from March 07 low around 0.6580. Intermediate support is plotted from May 03 low around 0.6640. The 200-period Exponential Moving Average (EMA) at 0.6700 is indicating a sideways trend.
Meanwhile, the Relative Strength Index (RSI) (14) has rebounded from 40.00, indicating weak downside bias.
An acceptance above the round-level resistance at 0.6800 confidently, Australian Dollar bulls will firmly drive the asset higher toward February 06 low at 0.6855 followed by February 21 high at 0.6920.
In an alternate scenario, US Dollar bulls will flex their muscles if the Aussie asset will drop below March 15 low at 0.6590. An occurrence of the same will expose the asset to March 08 low at 0.6568 followed by 02 November 2022 high around 0.6500.
AUD/USD four-hour chart
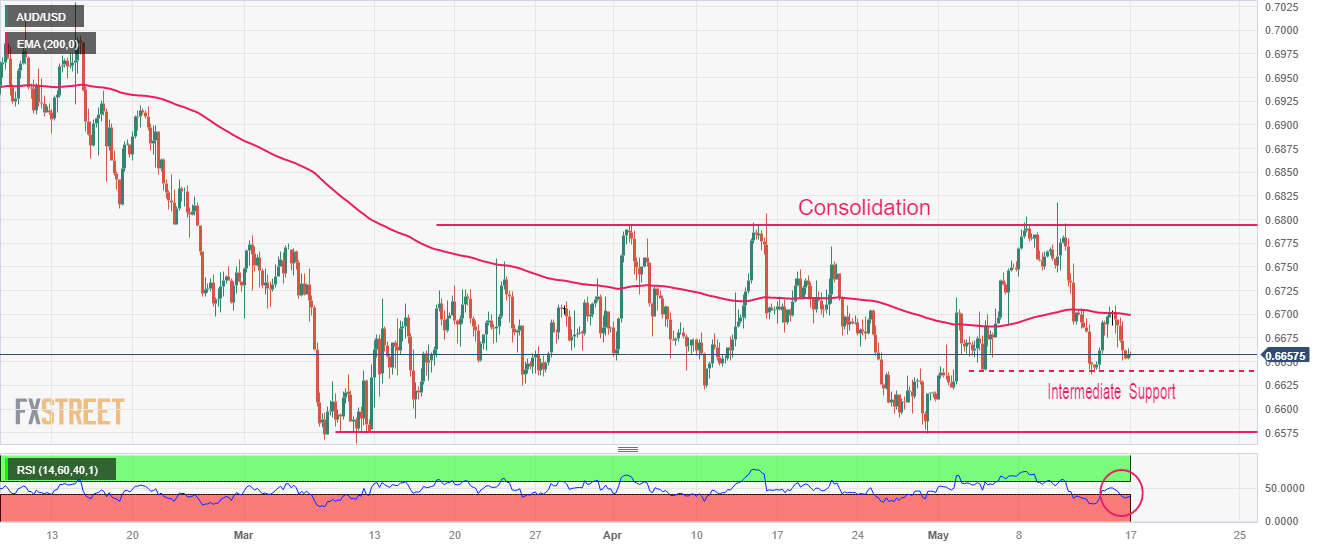
- EUR/USD picks up bids to reverse the previous day’s pullback from weekly high.
- US policymakers’ optimism about debt ceiling extension favor sentiment and Euro buyers.
- Hawkish Fed bets, upbeat US data and unimpressive Eurozone statistics previously lured EUR/USD bears.
- Final readings of Eurozone inflation, US housing numbers may entertain Euro pair traders.
EUR/USD prints mild gains around 1.0870 as it pares the previous day’s losses amid very early Wednesday morning in Europe. In doing so, the Euro pair struggles to cheer the market’s cautious optimism about the US debt ceiling extension amid a light calendar and mixed clues.
That said, US President Joe Biden and House Speaker, as well as a top congressional Republican, Kevin McCarthy’s meeting renewed the market’s optimism that the US policymakers will be able to avoid the “catastrophic” default. Following the less-than one-hour-long meeting, congressional leaders, said, "It is possible to get a deal by the end of the week."
The optimism triggered a fall in the one-year US Credit Default Swap (CDS) spreads while also helping the S&P500 Futures to print mild gains and defy Wall Street’s downbeat performance. With this, the US Dollar Index (DXY) retreats to 102.57 following Tuesday’s upbeat performance as market sentiment improved on hopes of no US default.
It’s worth noting, however, that the recently hawkish Federal Reserve (Fed) talks and upbeat US data contrast with softer Eurozone statistics to prod the EUR/USD bulls.
Late Tuesday, Federal Reserve Bank of Chicago President Austan Goolsbee and Atlanta Fed President Raphael Bostic defended the US central bank’s hawkish moves by citing inflation woes as they spoke at a conference hosted by the Federal Reserve Bank of Atlanta. Previously, Richmond Fed Thomas Barkin said in an interview with the Financial Times (FT) that if inflation persists, or God forbid accelerates, there’s no barrier in my mind to further increases in rates. On the same line, Cleveland Fed President Loretta Mester said, “I don’t think we're at that hold rate yet.”
At home, the preliminary reading of the Eurozone’s first quarter (Q1) 2023 Gross Domestic Product (GDP) matches 0.1% QoQ and 1.3% market forecasts and priors. Further, the Eurozone ZEW Economic Sentiment Index dropped to -9.4 for May from 6.4 prior and the market estimates of 8.2 whereas Germany’s ZEW Economic Sentiment Index dropped to -10.7 from 4.1 in April, versus the market expectation of -5.5.
It should be noted that the European Central Bank (ECB) policymakers have been hawkish but seemed to have stopped suggesting the need for strong rate hikes of late, which in turn challenge the Euro pair buyers.
Looking ahead, final readings of the Eurozone inflation numbers for April, per the Harmonized Index of Consumer Prices (HICP) gauge, will precede the second-tier US housing data to direct intraday EUR/USD. Though, headlines surrounding the central banks and the US default will be more impactful and shouldn’t be missed for clear direction.
Technical analysis
Despite the latest recovery, EUR/USD justifies the previous day’s downside break of a weekly bullish channel, as well as the bearish MACD signals, amid a nearly oversold RSI (14) line. Apart from the RSI that suggests limited room for the Euro pair towards the south, multiple lows marked since April 10 around 1.0837-45 also challenge the bears. Meanwhile, the stated channel’s bottom line, near 1.0885 by the press time, guards the immediate rise of the Euro pair.
In recent trade today, the People’s Bank of China (PBOC) set the yuan at 6.9748 vs. the last close of 6.9783 and an estimate of 6.9750.
About the fix
China maintains strict control of the yuan’s rate on the mainland.
The onshore yuan (CNY) differs from the offshore one (CNH) in trading restrictions, this last one is not as tightly controlled.
Each morning, the People’s Bank of China (PBOC) sets a so-called daily midpoint fix, based on the yuan’s previous day's closing level and quotations taken from the inter-bank dealer.
- GBP/USD stays pressured after retreating from weekly top.
- Unimpressive UK employment figures contrast with positive surprise from US data to prod Pound Sterling buyers.
- BoE, Fed officials cite inflation, employment numbers to defend hawkish plays.
- Easing fears of US default joins hopes of witnessing upbeat comments from BoE Governor Bailey to challenge Cable bears.
GBP/USD remains depressed around 1.2485 amid early Wednesday, after reversing from a weekly high the previous day. In doing so, the Pound Sterling justifies the market’s indecision amid a pause in the US Dollar’s run-up and cautious mood ahead of the Bank of England (BoE) Governor Andrew Bailey’s speech.
That said, the US Dollar Index (DXY) retreats to 102.57 following Tuesday’s upbeat performance as market sentiment improved on hopes of no US default. That said, US President Joe Biden and top congressional Republican Kevin McCarthy’s meeting ended within an hour and raised expectations of positive development as congressional leaders, said, "It is possible to get a deal by the end of the week."
While portraying the optimism, Reuters quotes the S&P Global Market Intelligence data while marking a fall in the one-year US Credit Default Swap (CDS) spreads from 164 basis points (bps) to 155 bps. “Spreads on five-year CDS decreased to 69 basis points from 72 bps on Monday,” reported the news. On the same line, the US Treasury bond yields grind higher after posting a notable rally whereas S&P500 Futures print mild gains to defy Wall Street’s downbeat performance.
It’s worth noting, however, that a contrasting play between the US and the UK data seems to weigh on the Cable prices of late.
On Tuesday, UK Claimant Count Change jumped by 46.7K in April versus -10.8K expected and 26.5K prior while ILO Unemployment Rate for three months to March rose to 3.9% against expectations of witnessing no change figure of 3.8%. Further, the Average Earnings excluding bonus and including for three months to March came in unimpressive despite crossing the forecasts.
On the other hand, US Retail Sales improved to 0.4% MoM for April, from -0.7% prior (revised) versus 0.7% expected. More importantly, Retail Sales Control Group for the said month crossed market forecasts of 0.0% and -0.4% prior with 0.7% actual figure whereas Retail Sales ex Autos matches 0.4% MoM estimations for April¸ surpassing the -0.5% prior. Further, the US Industrial Production MoM rose to 0.5% for April versus expectations of printing a 0.0% figure.
It should be noted that BoE Chief Economist Huw Pill recently followed the footsteps of BoE Governor Bailey while trying to push back the dovish hopes after the “Old Lady”, as the UK central bank is informally known, announced a dovish hike in the last week.
Moving on, BoE’s Bailey needs to repeat the hawkish comments and should stop citing easy inflation to recall the Pound Sterling buyers. Even so, the second-tier US housing data and risk catalysts will be the key to determining near-term GBP/USD moves.
Technical analysis
GBP/USD grinds between a three-week-old ascending support line and the 10-DMA, respectively near 1.2450 and 1.2555, as downside bias gains momentum.
- EUR/JPY bears are focused on 148.00 and trendline support with eyes then set on 147.50.
- Bulls need to get over the resistance around 148.50.
EUR/JPY is flat on the day and has stuck to a range of between 148.05 and 148.29 so far. The price action has been range bound for the initial balance of the week testing in the 147.50s and 100 pips higher to the 148.50s. The following will illustrate the prospects of a move up to test daily support while the bullish trend on a mico basis remains intact:
EUR/JPY daily chart
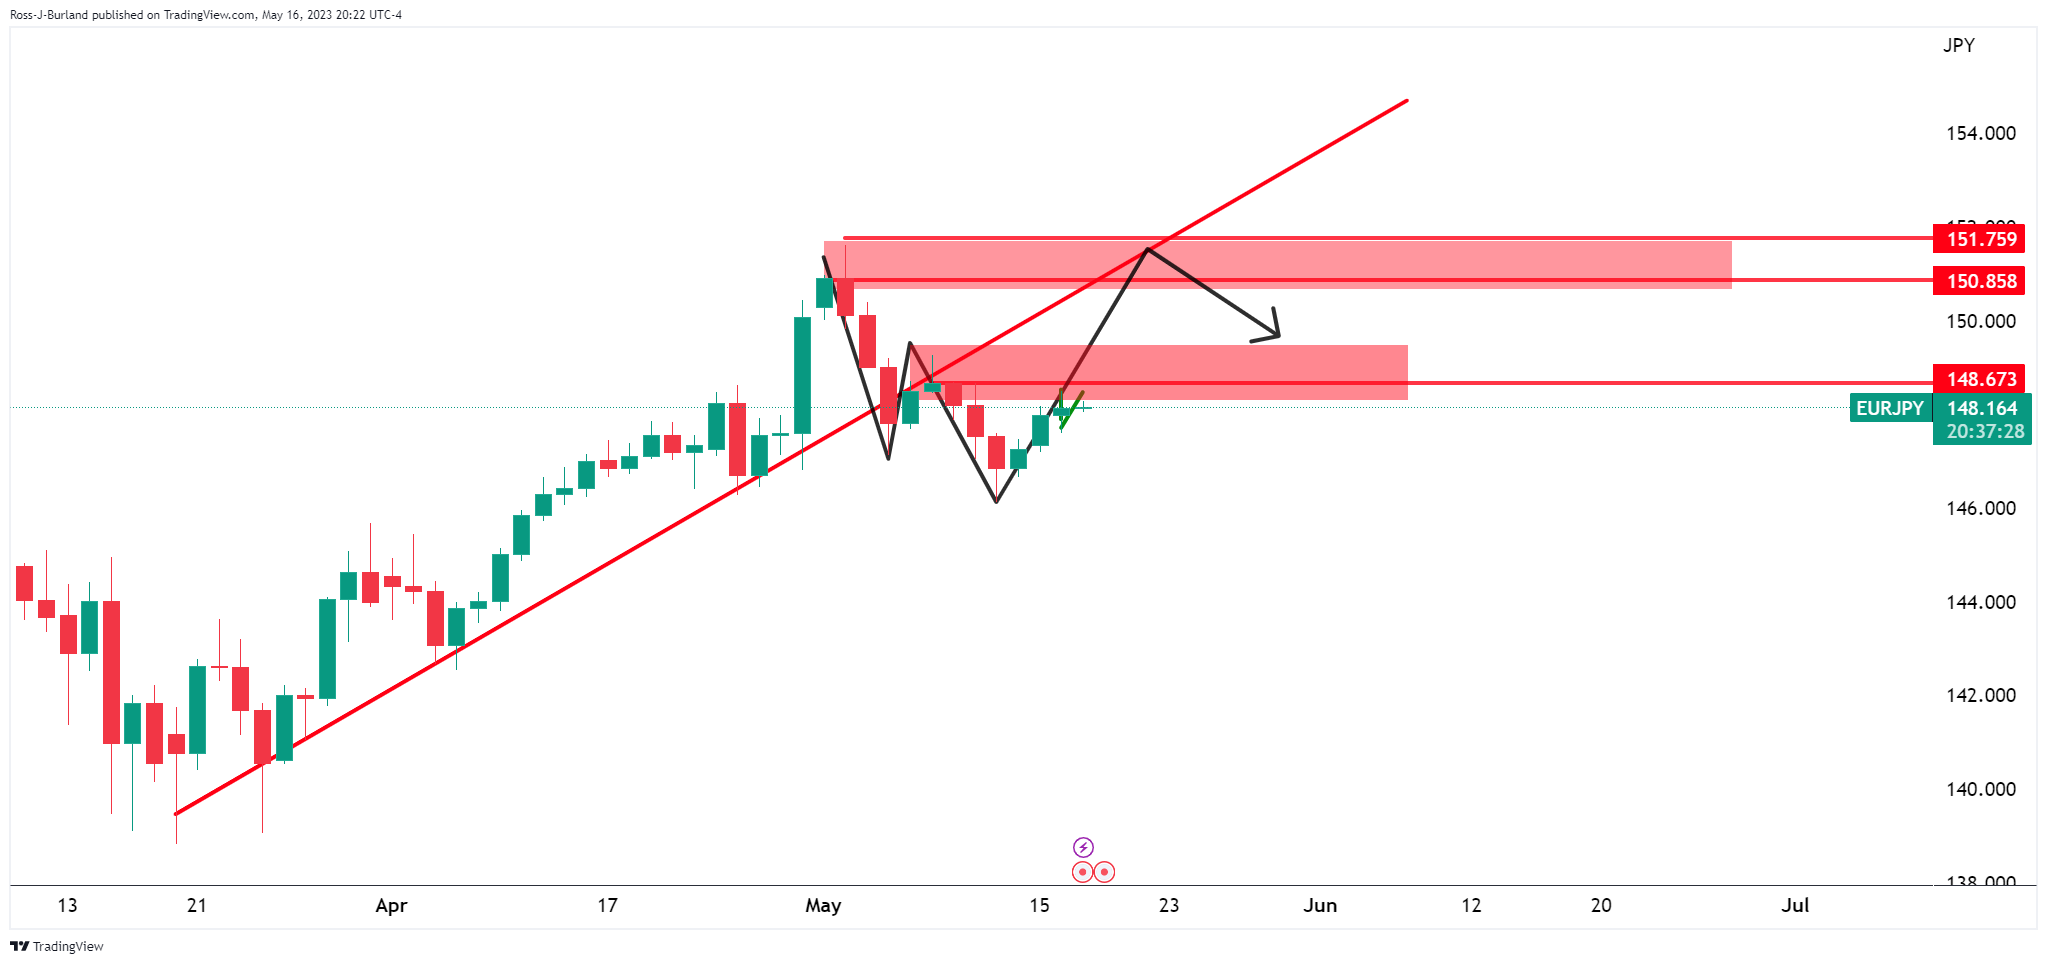
A break of the resistance will open prospects of a move to the counter-trendline.
EUR/JPY H1 charts
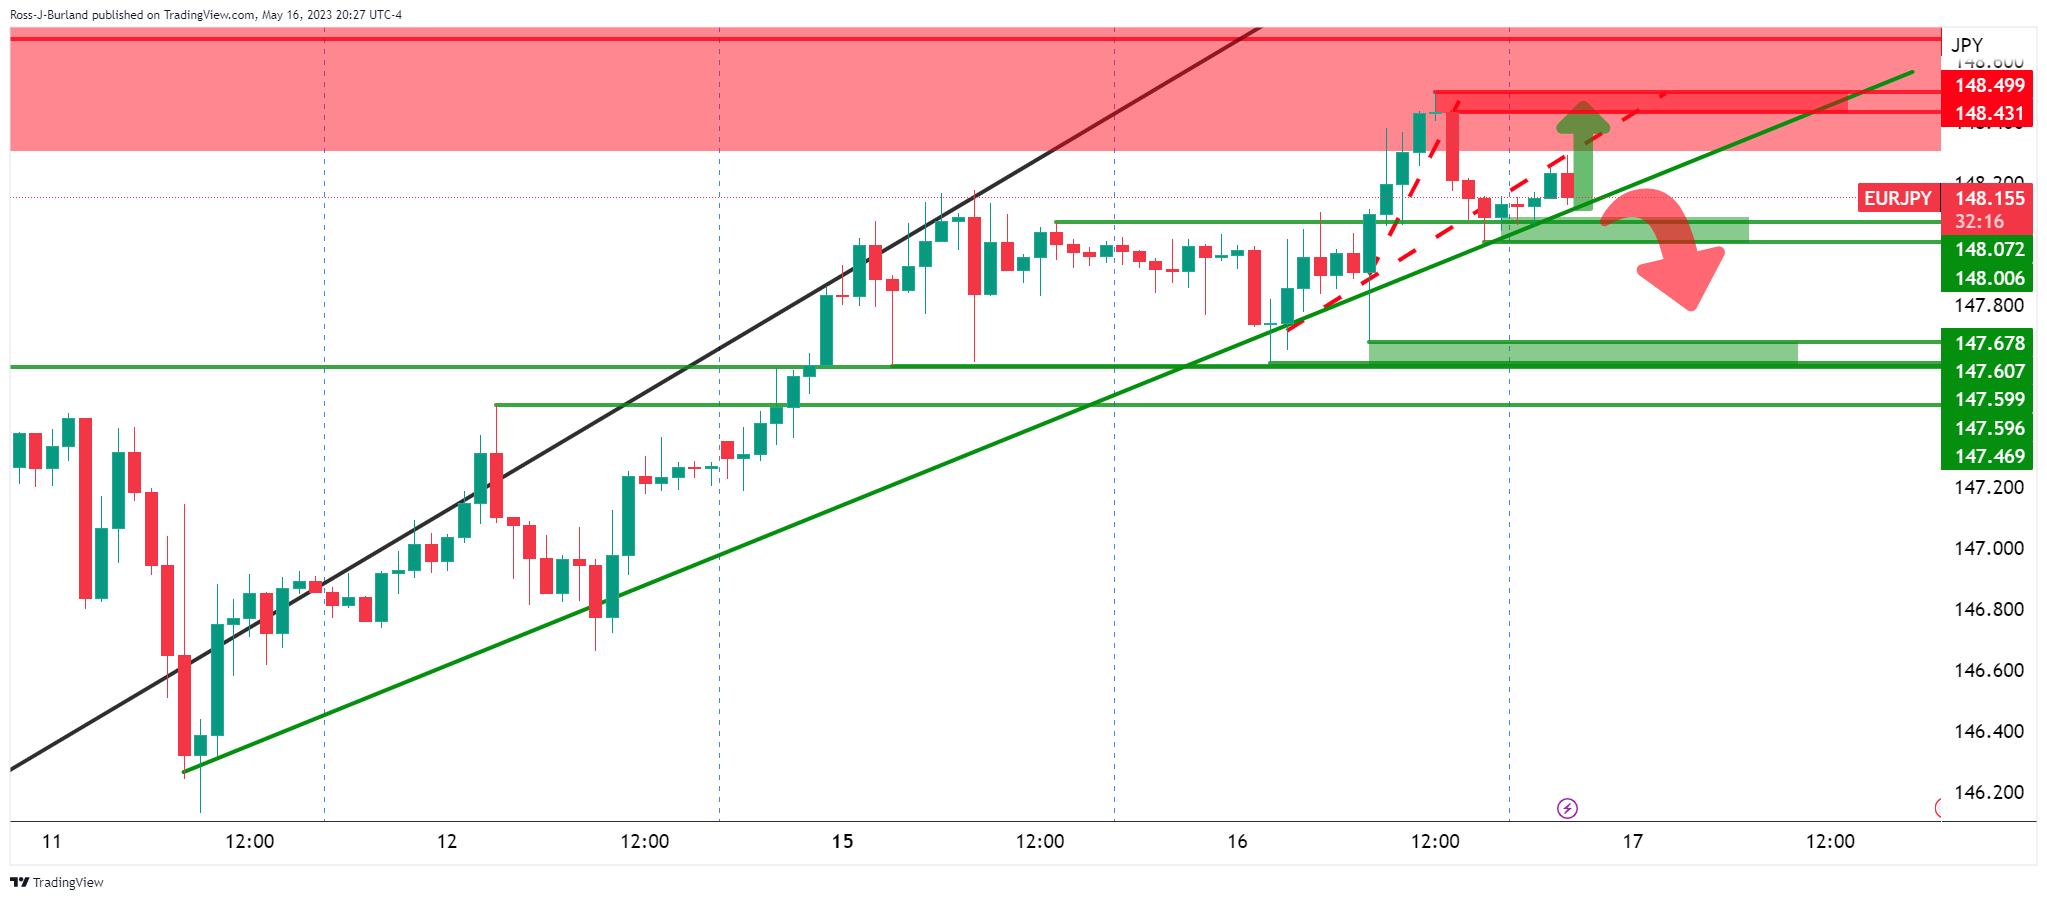
A break of support, however, creates a scenario whereby the bears could be encouraged in move below 148.00 with eyes then set on 147.50.
- Gold price is retesting the breakdown of the Rising Channel pattern amid a delay in US debt-ceiling issues.
- A slower pace in the expansion of US Retail Sales has strengthened expectations of a steady monetary policy stance by the Fed.
- The postponement of approval for the debt-ceiling cap has improved demand for US government bonds.
Gold price (XAU/USD) has shown some buying interest after dropping below $1,990.00 in the Tokyo session. The precious metal has witnessed some recovery as the US Dollar Index (DXY) is struggling in extending its upside move further above 102.70. The Gold price has yet not developed a strong upside bias as it needs to pass through more filters for gaining traction.
S&P500 futures have added decent gains in Asia despite the postponement of approval for raising the US Treasury borrowing cap limit. One thing is for sure that the approval of default is off the table. Every delegate has admitted that the US debt-ceiling cannot be raised along with bulking spending initiatives as it could be a disaster.
The postponement of approval for the debt-ceiling cap has improved demand for US government bonds. This has led to a decline in 10-year US Treasury yields to 3.53%.
The USD Index is facing barricades in extending its recovery above 102.70 as a slower pace in the expansion of US Retail Sales has strengthened expectations of a steady monetary policy stance by the Federal Reserve (Fed). The economic data expanded at a slower pace of 0.4% against the estimate of 0.7%. A mild expansion is insufficient to impact expectations for a steady monetary policy by the Fed.
Gold technical analysis
Gold price has delivered a breakdown of the Rising Channel chart pattern formed on a four-hour scale, however, the breakdown needs to pass some more filters yet. An intermediate resistance is plotted from May 05 low at $1,999.54. Downward-sloping 10-period Exponential Moving Average (EMA) at $2,000.00 is barricading the Gold bulls.
The Relative Strength Index (RSI) (14) has slipped into the bearish range of 20.00-40.00, which indicates more downside ahead.
Gold four-hour chart
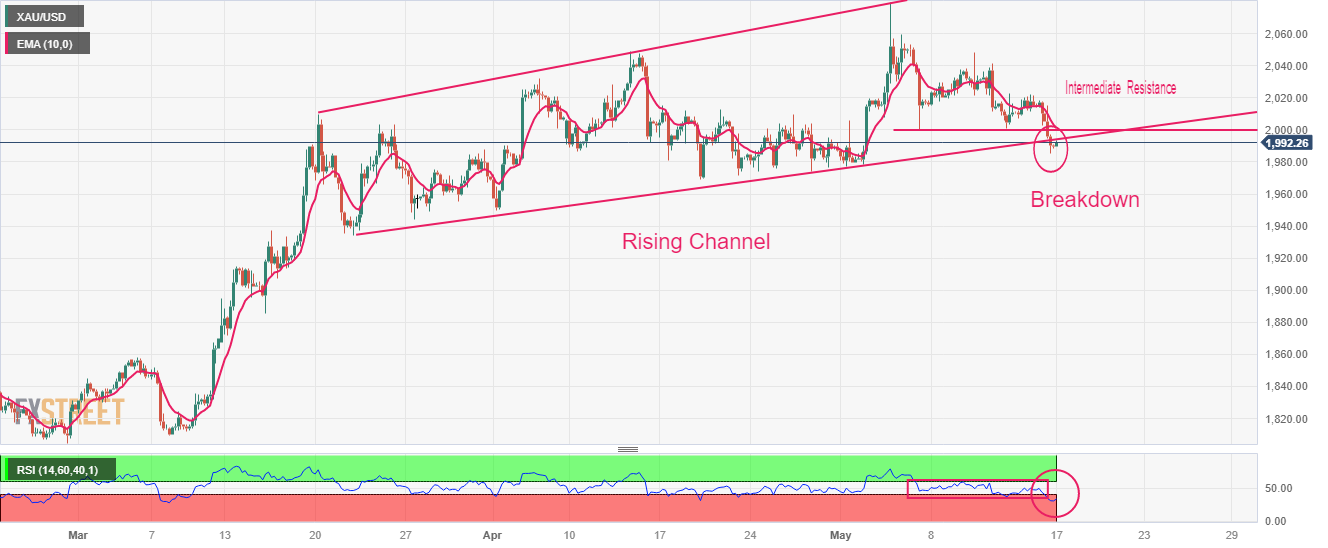
- GBP/JPY defends the previous day’s retreat from one-week high, retreats on upbeat Japan Q1 GDP.
- U-turn from monthly resistance line directs cross-currency pair towards 170.00 support confluence.
- Bears need validation from 200-SMA and BoE Governor Bailey.
GBP/JPY remains pressured around 170.25 while extending the previous day’s U-turn from a one-week high on early Wednesday. In doing so, the cross-currency pair justifies the upbeat Japan growth numbers while keeping Tuesday’s pullback from a descending resistance line stretched from May 01.
That said, Japan’s first quarter (Q1) 2023 Gross Domestic Product (GDP) rose to 0.4% QoQ versus 0.1% expected and 0.0% prior, per the preliminary reading.
Also read: Japan Q1 GDP improves to 0.4% QoQ versus 0.1% expected, 0.0% prior
Given the upbeat Japan data and the pair’s U-turn from the key resistance line, backed by a firmer RSI (14), the GBP/JPY is likely to decline further.
However, a convergence of the 50-SMA and a one-week-old ascending trend line, near 169.90 by the press time, could restrict the short-term downside of the GBP/JPY pair.
Following that, the double tops marked during late April around 168.00 and the current monthly can prod the pair sellers. It should be observed that the 200-SMA level of around 167.50 acts as the last defense of the GBP/JPY buyers.
Alternatively, recovery moves may aim for the aforementioned monthly resistance line surrounding 170.60 ahead of challenging a seven-week-old upward-sloping previous support line of near 170.90. Following that, GBP/JPY can target an upside move toward the monthly peak of 172.35.
GBP/JPY: Four-hour chart
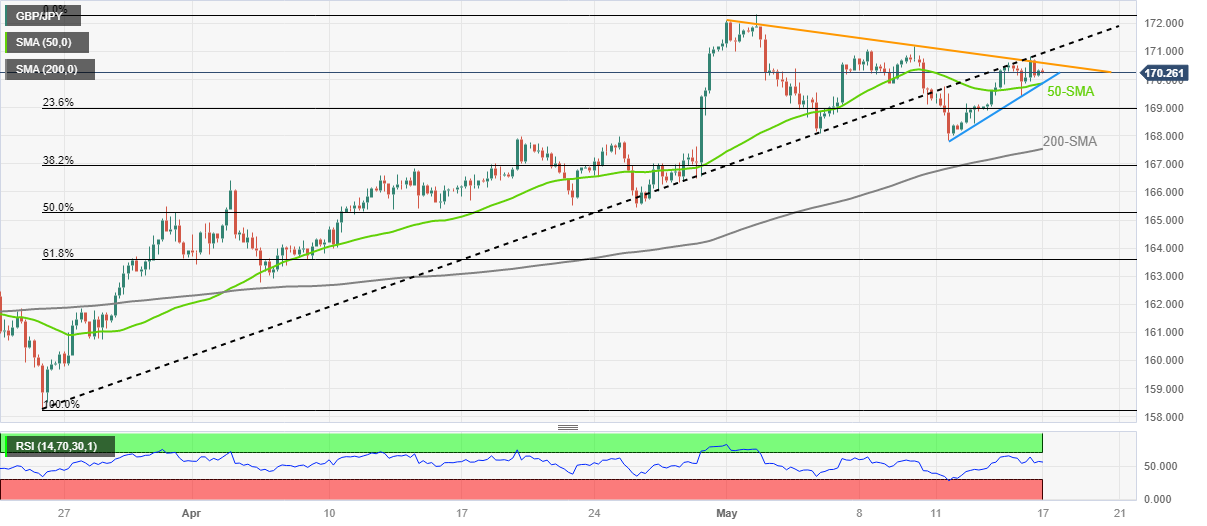
Trend: Limited downside expected
| Index | Change, points | Closed | Change, % |
|---|---|---|---|
| NIKKEI 225 | 216.65 | 29842.99 | 0.73 |
| Hang Seng | 7.12 | 19978.25 | 0.04 |
| KOSPI | 0.89 | 2480.24 | 0.04 |
| ASX 200 | -32.4 | 7234.7 | -0.45 |
| FTSE 100 | -26.62 | 7751.08 | -0.34 |
| DAX | -19.31 | 15897.93 | -0.12 |
| CAC 40 | -12.2 | 7406.01 | -0.16 |
| Dow Jones | -336.46 | 33012.14 | -1.01 |
| S&P 500 | -26.38 | 4109.9 | -0.64 |
| NASDAQ Composite | -22.16 | 12343.05 | -0.18 |
| Pare | Closed | Change, % |
|---|---|---|
| AUDUSD | 0.66554 | -0.7 |
| EURJPY | 148.112 | 0.12 |
| EURUSD | 1.08615 | -0.12 |
| GBPJPY | 170.222 | -0.12 |
| GBPUSD | 1.24823 | -0.37 |
| NZDUSD | 0.62287 | -0.22 |
| USDCAD | 1.34768 | 0.11 |
| USDCHF | 0.89638 | 0.1 |
| USDJPY | 136.367 | 0.25 |
- USD/JPY retreats from intraday high, stays sluggish around two-week top, after strong Japan GDP growth.
- Hawkish Fed bets, upbeat US data favor Yen pair buyers.
- US policymakers appear optimistic about avoiding default after the latest debt ceiling talks.
- Second-tier US, Japan data eyed for intraday clues, risk catalysts are the key for clear directions.
USD/JPY eases from intraday high to 136.35 as it snaps the five-day winning streak on upbeat Japan growth numbers published early Wednesday. Also exerting downside pressure on the risk barometer pair could be the US Dollar’s retreat amid easing fears of the US default. Even so, the Yen pair remains indecisive as hawkish Federal Reserve (Fed) statements join upbeat US data.
Japanese economic growth came in as 0.4% versus 0.1% expected and 0.0% prior, per the preliminary reading of the first quarter (Q1) 2023 Gross Domestic Product (GDP) figures. Following the data release, a Japanese government official said, “Japan's Q1 GDP posts the first QoQ gain in three quarters.”
Also read: Japan Q1 GDP improves to 0.4% QoQ versus 0.1% expected, 0.0% prior
On the other hand, US Retail Sales improved to 0.4% MoM for April, from -0.7% prior (revised) versus 0.7% expected. More importantly, Retail Sales Control Group for the said month crossed market forecasts of 0.0% and -0.4% prior with 0.7% actual figure whereas Retail Sales ex Autos matches 0.4% MoM estimations for April¸ surpassing the -0.5% prior. Further, the US Industrial Production MoM rose to 0.5% for April versus expectations of printing a 0.0% figure.
Recently, Federal Reserve Bank of Chicago President Austan Goolsbee and Atlanta Fed President Raphael Bostic defended the US central bank’s hawkish moves by citing inflation woes as they spoke at a conference hosted by the Federal Reserve Bank of Atlanta. Previously, Richmond Fed Thomas Barkin said in an interview with the Financial Times (FT) that if inflation persists, or God forbid accelerates, there’s no barrier in my mind to further increases in rates. On the same line, Cleveland Fed President Loretta Mester said, “I don’t think we're at that hold rate yet.”
Elsewhere, US President Joe Biden and top congressional Republican Kevin McCarthy’s meeting ended within an hour and raised expectations of positive development as congressional leaders, said, "It is possible to get a deal by the end of the week." Following the news, Reuters quotes the S&P Global Market Intelligence data while marking a fall in the one-year US Credit Default Swap (CDS) spreads from 164 basis points (bps) to 155 bps. “Spreads on five-year CDS decreased to 69 basis points from 72 bps on Monday,” reported the news.
It should be noted that the Bank of Japan (BoJ) officials have been defending easy money policy and hence keeping the monetary policy divergence between the Fed and the BoJ intact, which in turn propel the USD/JPY prices.
Apart from the Japanese GDP, recent hopes of more investment by private firms in Japan also weigh on the USD/JPY pair. That said, Japanese media Yomiuri mentioned that Prime Minister Fumio Kishida plans to seek chip firms' active investment in Japan and cooperation with Japanese companies.
Elsewhere, US Treasury bond yields grind higher after posting a notable rally whereas S&P500 Futures print mild gains to defy Wall Street’s downbeat performance.
Looking forward, Japan's Industrial Production for March will precede the US Building Permits and Housing Starts for April to decorate today’s calendar. However, major attention will be given to US debt ceiling updates and Fed-BoJ divergence for clear directions.
Technical analysis
Unless dropping back below the early-month top surrounding 135.50, the USD/JPY remains capable of marking another attempt in crossing the 200-DMA hurdle of around 137.10.
- Oil price is defending its crucial support of $70.50 ahead of US oil inventory data.
- Postponement of approval for increasing US debt-ceiling limit has deepened fears of US recession.
- Oil price is auctioning in an Ascending Triangle chart pattern, which indicates a sheer contraction in volatility.
West Texas Intermediate (WTI), futures on NYMEX, have defended their immediate support of $70.50 in the Asian session. Earlier, the oil price slipped sharply as investors are worried that further postponement of approval for increasing the US debt-ceiling limit has deepened fears of a recession in the United States economy.
The US Dollar Index (DXY) is aiming to stretch its recovery above 102.70 as investors have turned cautious due to an absence of a meaningful outcome from US debt-ceiling negotiations.
On Wednesday, investors will keep an eye on the oil inventories data to be reported by the United States Energy Information Administration (EIA) for the week ending May 12.
Oil prices are auctioning in an Ascending Triangle chart pattern on an hourly scale, which indicates a sheer contraction in volatility. The upward-sloping trendline of the chart pattern is placed from May 15 low at $69.39 while the horizontal resistance is plotted from May 12 high at $71.74. The black gold price is hovering near the upward-sloping trendline of the aforementioned pattern, advocating a downside bias.
The 20-period Exponential Moving Average (EMA) at $70.80 is stuck to the oil price, indicating a lackluster performance.
Also, the Relative Strength Index (RSI) (14) is oscillating in the 40.00-60.00, which signals that investors are awaiting a fresh trigger for further action.
Going forward, a breakdown of 15 low at $69.39 will strengthen the downside bias and will send the oil price to May 04 low at $67.47. A breakdown of the latter will further send the asset price toward a 17-month low at $64.31.
In an alternate scenario, a solid recovery above May 10 high at $73.80 will allow the asset for further upside towards May 02 high at $76.06. A breach of the latter will expose the asset to April 26 high around $78.00.
WTI hourly chart
-638198790983314883.png)


© 2000-2026. Sva prava zaštićena.
Sajt je vlasništvo kompanije Teletrade D.J. LLC 2351 LLC 2022 (Euro House, Richmond Hill Road, Kingstown, VC0100, St. Vincent and the Grenadines).
Svi podaci koji se nalaze na sajtu ne predstavljaju osnovu za donošenje investicionih odluka, već su informativnog karaktera.
The company does not serve or provide services to customers who are residents of the US, Canada, Iran, The Democratic People's Republic of Korea, Yemen and FATF blacklisted countries.
Izvršenje trgovinskih operacija sa finansijskim instrumentima upotrebom marginalne trgovine pruža velike mogućnosti i omogućava investitorima ostvarivanje visokih prihoda. Međutim, takav vid trgovine povezan je sa potencijalno visokim nivoom rizika od gubitka sredstava. Проведение торговых операций на финанcовых рынках c маржинальными финанcовыми инcтрументами открывает широкие возможноcти, и позволяет инвеcторам, готовым пойти на риcк, получать выcокую прибыль, но при этом неcет в cебе потенциально выcокий уровень риcка получения убытков. Iz tog razloga je pre započinjanja trgovine potrebno odlučiti o izboru odgovarajuće investicione strategije, uzimajući u obzir raspoložive resurse.
Upotreba informacija: U slučaju potpunog ili delimičnog preuzimanja i daljeg korišćenja materijala koji se nalazi na sajtu, potrebno je navesti link odgovarajuće stranice na sajtu kompanije TeleTrade-a kao izvora informacija. Upotreba materijala na internetu mora biti praćena hiper linkom do web stranice teletrade.org. Automatski uvoz materijala i informacija sa stranice je zabranjen.
Ako imate bilo kakvih pitanja, obratite nam se pr@teletrade.global.
транcфери