- Analiza
- Novosti i instrumenti
- Vesti sa tržišta
Forex-novosti i prognoze od 18-05-2022
- USD/CHF is balancing below 0.9900 after the testimony of SNB’s Jordan.
- SNB’s Jordan dictated that CHF is a safe haven and that negative monetary policy will support targeted inflation.
- Fed policymakers are betting on two more interest rate hikes this year.
The USD/CHF pair is looking for an establishment below 0.9900 after witnessing a steep fall on Wednesday. The asset has remained vulnerable this week after failing to sustain above the psychological figure of 1.0000.
The Swiss franc bulls are strengthening against the greenback after the testimony of Swiss National Bank (SNB) Chairman Chris Jordan on Wednesday. SNB’s Jordan dictated in his speech that the Swiss franc (CHF) is a safe-haven asset and continuation of a negative monetary policy is necessary to justify the inflation parameter. The targeted inflation figure at 2% has been well maintained by the SNB and any temporary rise above the targeted figure will be diluted quickly due to intervention of the SNB. This week the spotlight will remain on Swiss Industrial Production. Earlier, it landed at 7.3%.
Meanwhile, the US dollar index (DXY) is weakened in front of the Swiss franc bulls despite soaring negative market sentiment. The DXY is hovering a little lower from 104.00 but is expected to surpass the figure amid an improved safe-haven appeal. Counting on galloping inflation, the Federal Reserve (Fed) may elevate its interest rates by 50 basis points (bps) twice in June and July. Philadelphia Fed Bank President Patrick Harker has favored a 25 bps rate hike tradition after announcing two jumbo rate hikes by the Fed in June and July.
- NZD/USD bears take a breather following the biggest daily fall in a week.
- Short-term SMAs stop bears on the way to weekly horizontal support comprising multi-month low.
- Descending RSI, not oversold, keep sellers hopeful, 100-SMA limits upside momentum.
NZD/USD holds lower ground near 0.6300, after declining the most in a week, as bears await the key New Zealand Annual Budget Release during early Thursday.
In doing so, the Kiwi pair jostles with the 21-SMA and 50-SMA amid a downward sloping RSI (14) line, not oversold.
Not only the RSI but the pair’s inability to cross one-week-old horizontal resistance, as well as stay beyond a monthly descending trend line also keeps NZD/USD sellers hopeful.
That said, the quote’s latest weakness aims the area comprising the monthly low, also the lowest levels since 2020, around 0.6225-15.
Following that, the 0.6200 threshold may offer an intermediate halt before directing bears towards April 2020 peak near 0.6175.
Alternatively, a one-month-old downward sloping resistance line restricts immediate upside around 0.6335, a break of which will direct buyers towards a horizontal region from May 09, surrounding 0.6375-85.
Even if the NZD/USD prices rise past 0.6385, a clear run-up past-100-SMA, close to 0.6390, becomes necessary for the buyers to retake control.
NZD/USD: Four-hour chart
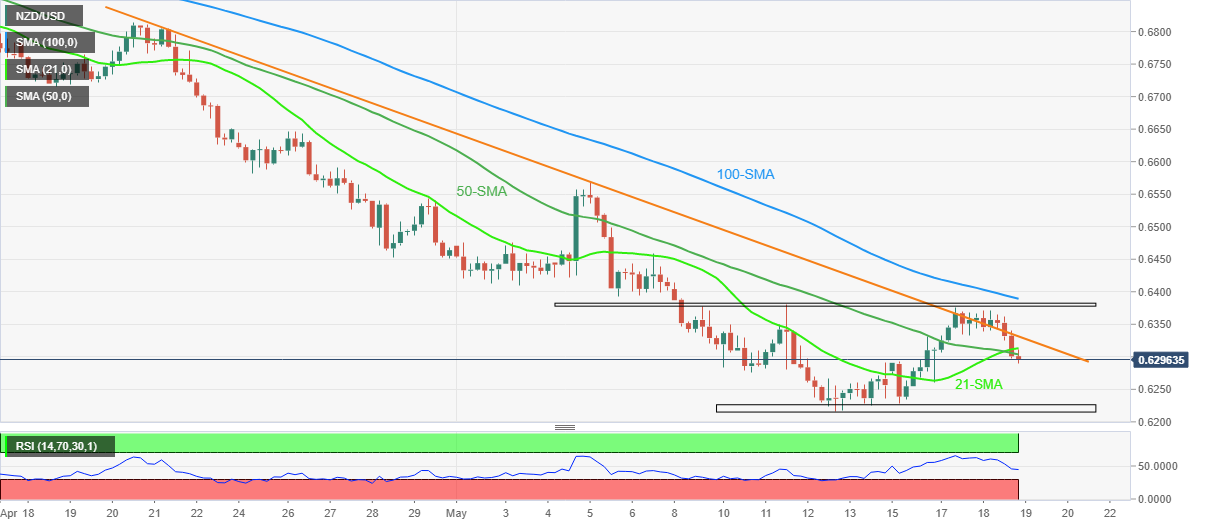
Trend: Further weakness expected
- Risk-off tones weighed on the commodities markets.
- Big beats to UK and Canadian CPI stoked inflationary fears and Wall Street tanked.
At $108.59, the price of West Texas Intermediate (WTI) crude is down around 0.45% and the price has fallen from a high of $109.40 to a low of $108.56, despite an unexpected drop in US oil inventories overnight as investors shed risk assets.
The Energy Information Administration reported US oil inventories fell by 3.4-million barrels, while analysts on average expected a 1.3-million barrel rise. Gasoline inventories fell by 4.8-million barrels, while distillate stocks rose by 1.2-million barrels. However, economic data kicked up inflaiton fears created a risk-off tone across markets and commodities came under pressure, with oil suffering a sharp contraction.
''Big beats to UK and Canadian CPI stoked inflationary fears, and US retailer stocks have been hammered. So we’re back to watching the ebb and flow of global risk appetite again, and it’s still volatile, and showing no real signs of basing,'' analysts at ANZ Bank said.
On Wall Street, setting of a a slide in risk appatite, Target reported that higher-than-expected costs ate into its quarterly earnings. The stock fell over 25% and was tracking its worst day since the Black Monday crash on Oct. 19, 1987, highlighting worries about the US economy after the retailer became the latest victim of surging prices. As a result, the Dow Jones Industrial Average tumbled by 3.6% to 31,490.07 while the S&P 500 plunged 4% to 3,923.68. The Nasdaq Composite was 4.7% lower at 11,418.15. The US 10-year yield fell by 8.6 basis points to 2.88%.
Meanwhile, Reuters reported China is allowing 864 of Shanghai's financial firms to resume operations as the city reported no new Covid-19 cases outside of quarantine zones for three days. ''The lockdown on the city of 25 million, as well as other areas of the country, has depressed Chinese demand by more than one-million barrels per day.''
''The mood wasn’t helped by reports of more COVID-19 cases in Beijing. The market had been optimistic it was past the worst, after Shanghai recorded several days without new cases outside quarantine,'' analysts at TD Securities explained. ''However, the latest outbreak threatens to weigh on oil demand, as more cities are placed in lockdown. The selloff contrasted with data showing the oil market is tightening''
Meanwhile, OPEC production continues to underperform benchmarks materially, and analysts at TD Securities argued that, in this context, ''crude oil markets may be in the early innings of another break higher''.
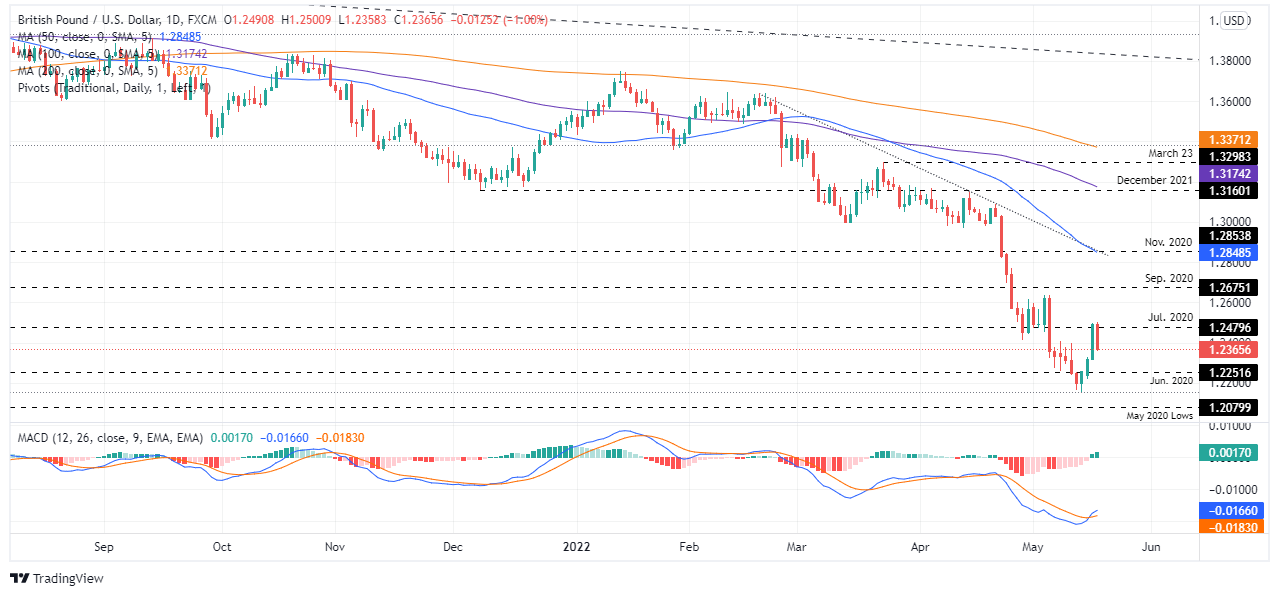
- GBP/USD holds lower ground after declining the most in two weeks.
- EU eyes punitive measures on UK to stop NIP alteration.
- UK inflation missed mark despite rallying to two decade high.
- Fears of inflation, growth kept markets in jittery mode, USD benefits from risk-aversion.
GBP/USD remains pressured around 1.2350, following the heaviest daily fall in a fortnight, as traders seek fresh clues during Thursday’s Asian session. Even so, downbeat headlines concerning Brexit and a broad risk-off mood keep sellers hopeful.
Following UK Prime Minister (PM) Boris Johnson’s announcements to alter part of the Northern Ireland Protocol (NIP), backed by British Foreign Minister Liz Truss’ confirmation, the European Union (EU) hesitantly braces for talks on the matter and offered olive branch. However, the bloc is also heard to prepare punishments for Britain to stop it. “The European Union is considering a targeted trade war on troublesome Brexiteer MPs and Tory ministers, sources told The Telegraph, as the bloc war-gamed its response to Boris Johnson’s plan to override the Northern Ireland Protocol,” said The UK Telegraph.
Elsewhere, higher inflation numbers from the UK, Eurozone and Canada appear to be fueling the fears of slowing growth moving forward. That said, the UK Consumer Price Index (CPI) rose to a fresh high since the 1980s despite being lesser than the 9.1% YoY forecast, with 9.0% the figure for April.
Also contributing to the risk-aversion wave and exerting downside pressure on the GBP/USD price is Shanghai’s refrain from total unlocks and an increase in covid cases in mainland China, as well as fresh virus-led activity restrictions in Tianjin, the port city near Beijing.
Against this backdrop, Wall Street benchmarks saw the red while the US 10-year Treasury yields dropped 11 basis points (bps) to 2.88% by the end of Wednesday’s North American trading session. It’s worth noting that the S&P 500 Futures drops 0.25% intraday at the latest.
Looking forward, a lack of UK data highlights second-tier US statistics and risk catalysts, mainly including updates over inflation, Brexit and covid, as the key factors to determine near-term GBP/USD moves.
Technical analysis
A U-turn from 21-DMA, around 1.2475 by the press time, joins the GBP/USD pair’s failures to hold 1.2350 to direct the quote towards a one-week-old horizontal support zone near 1.2250.
- USD/JPY is observing selling pressure around 128.50 amid broader strength in yen.
- A disclosure of less negative GDP numbers by Japan has strengthened the yen bulls.
- Investors should brace for the continuation of BOJ’s ultra-loose monetary policy.
The USD/JPY pair has witnessed a minor rebound after hitting a low of 128.00 in the late New York session. The pair faced decent selling pressure on Wednesday despite a broader strength in the greenback. It is worth noting that the heightened risk-off impulse in the market is underpinning the greenback against the majority of the risk-sensitive currencies. However, the Japanese yen has shown strength against the greenback bulls, which indicates that yen bulls are gaining their safe-haven glory.
The yen bulls have strengthened against the greenback after displaying less negative Gross Domestic Product (GDP) numbers on Wednesday. The annualized figure for Japan’s GDP remains higher at -1% against the consensus of -1.8%. While the quarterly figure landed at -0.2% remained negative but still outperformed the forecasts of -0.4%.
The Japanese economy has yet not recovered its growth rate that could match its pre-pandemic levels. Therefore, the Bank of Japan (BOJ) will continue with its ultra-loose monetary policy. Going forward, the weekly major event will be the release of Japan’s inflation on Friday. The annual National Consumer Price Index (CPI) is seen at 1.5% against the prior print of 1.2%. The unavailability of inflationary pressures will push the BOJ to keep infusing liquidity into its economy.
Meanwhile, the US dollar index (DXY) is auctioning in a tight range below 104.00 amid a light economic calendar this week. The asset has gained significant bids on Wednesday as risk-off impulse soars on mounting price pressures.
- USD/CAD fades bounce off two-week low as markets consolidate recent moves.
- Risk-aversion underpins US dollar strength, downbeat oil prices.
- Canada CPI failed to impress bears as inflation fears propel flight to safety, softer US data was ignored as well.
- Fedspeak, second-tier US statistics may entertain momentum traders, risk catalysts are crucial too.
USD/CAD meets sellers around 1.2900, fading the previous day’s recovery moves from a fortnight low, as traders take a breather from the latest risk-aversion amid a sluggish start to the Asian session. That said, the Loonie pair takes offers to renew intraday low around 1.2875 by the press time.
Fears of a slowdown in the US GDP growth and the Fedspeak favoring ‘only’ 50 basis points (bps) of rate hikes for the next two meetings seem to have underpinned the latest consolidation in the market moves. A lack of major catalysts could also be linked to the recent moves, especially after the rout in risk assets the previous day.
That said, the Wall Street benchmarks saw the red while the US 10-year Treasury yields dropped 11 basis points (bps) to 2.88% by the end of Wednesday’s North American trading session.
Higher inflation numbers from the UK, Eurozone and Canada stoked fears of slowing growth and propelled risk-aversion on Wednesday. That said, Canada’s Consumer Price Index (CPI) couldn’t reject the USD/CAD bulls despite printing better-than-expected figures of 6.8% YoY for April.
Not only the sour sentiment fuelled the US dollar but also weighed on prices of WTI crude oil, Canada’s key exports, offering a double whammy of attacks on the Canadian Dollar (CAD). Also contributing to the oil price weakness are fears of demand slowdown, especially emanating from China due to the covid spread and fresh lockdown in Tianjin, the port city near Beijing.
That being said, USD/CAD traders may now keep their eyes on the risk catalysts for fresh impetus ahead of the second-tier data relating to housing and manufacturing from the US and Canada. Above all, clues over the firming of inflation fears will be crucial to watch.
Technical analysis
Failure to provide a daily closing beyond the 10-day EMA, around 1.2890 at the latest, joins the pair’s sustained trading below the previous support line from April 21, close to 1.2965, to keep USD/CAD bears hopeful of meeting the monthly low near 1.2715.
- On Wednesday, the EUR/GBP recorded gains of 0.42%, erasing Tuesday’s losses.
- A dampened market mood weighed on the risk-sensitive British pound.
- EUR/GBP Price Forecast: The 1-hour chart depicts the formation of a falling wedge preceded by an uptrend, with the 200-hour SMA as its target.
EUR/GBP recovers some ground after falling towards the 50-day moving average (DMA) at around 0.8396, though it is staging a recovery during the day but faltering to break above the 0.8500 mark, settling at around 0.8470s. At 0.8481, the EUR/GBP sits above the 200, 50, and 100-DMA and is ready to re-test the one-year-old downslope trendline, broken on May 6, though later reclaimed by EUR/GBP bears.
Risk-aversion keeps risk-sensitive currencies like the British pound under pressure. That benefits the shared currency, which despite recording losses against the greenback, its low-yield status vs. the pound, attracts investors as they seek safe-haven protection.
During the overnight session for North American traders, the EUR/GBP opened near the lows of the session, around 0.8440, and rose once EU inflationary readings crossed wires, at the same time that UK’s figures showed that inflation reached 9%. Both news caused a jump near the 0.8500 mark, but EUR bulls could not pierce the figure, retreating towards the 100-hour simple moving average (SMA) at 0.8479.
EUR/GBP Price Forecast: Technical outlook
The 1-hour chart depicts the pair as neutral biased but slightly tilted to the upside. EUR/GBP traders need to be aware of a falling-wedge chart pattern formed after a bullish impulse, meaning that once broken, the EUR/GBP should aim higher, targeting the 200-hour SMA at 0.8517.
However, for that scenario to play out, EUR/GBP traders would need to break above 0.8500. Break above would expose the 200-hour SMA at 0.8517, which, once cleared, would open the door for further gains around the R2 daily pivot at 0.8530, followed by the R3 pivot point at 0.8560.
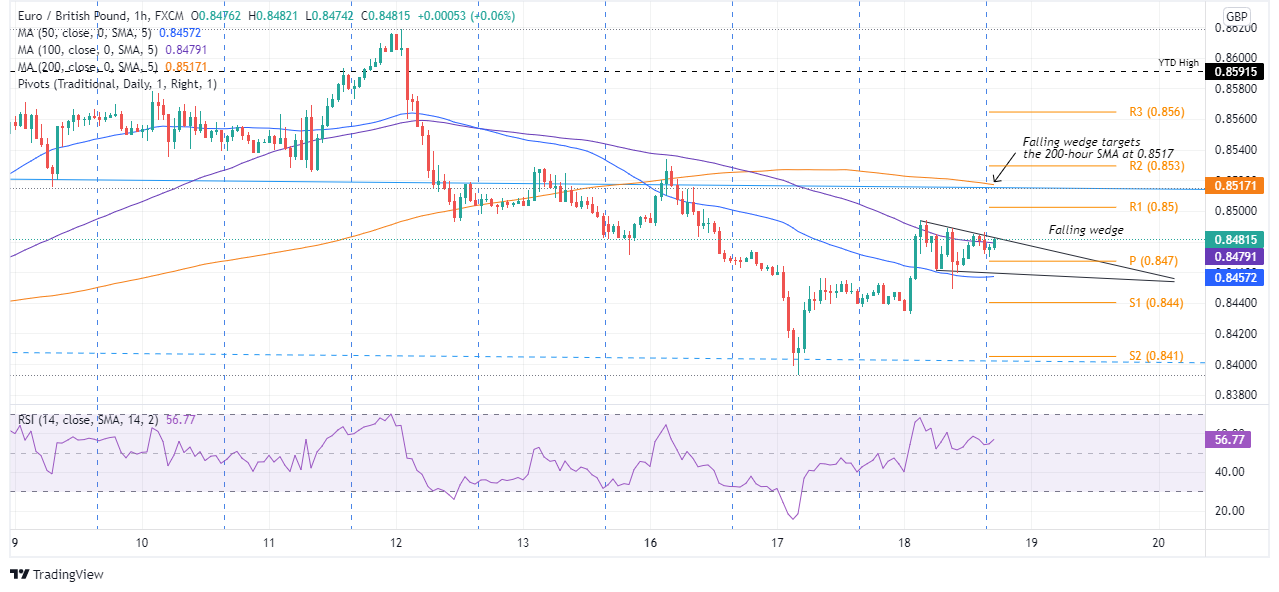
Key Technical Levels
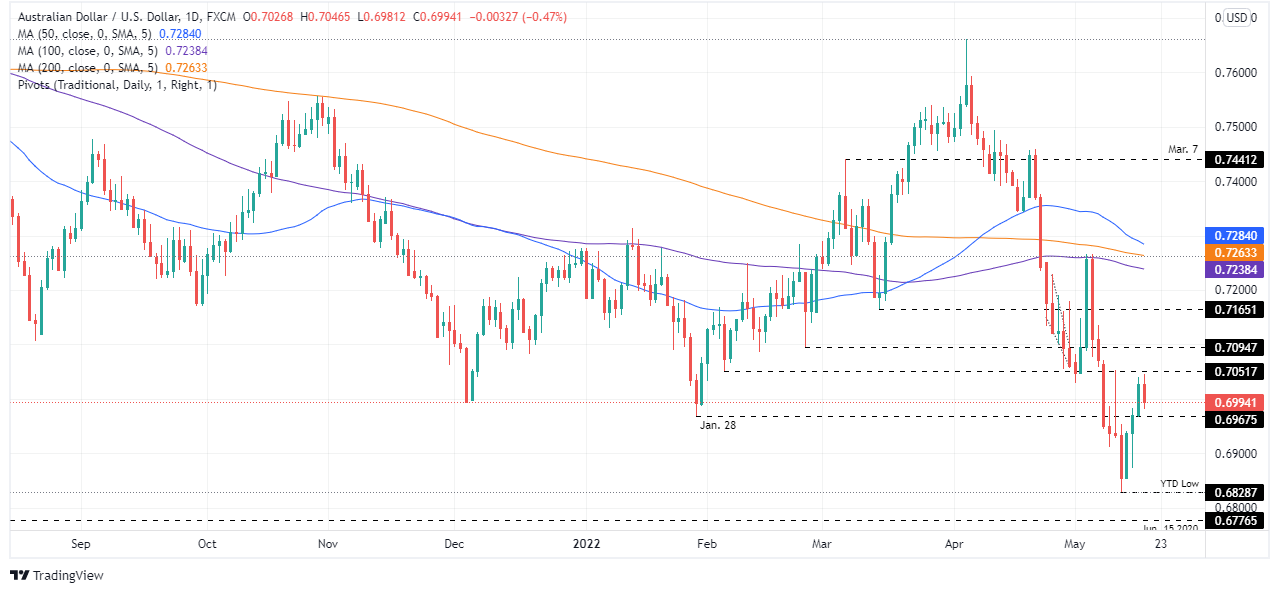
- AUD/USD pares the biggest daily loss in a week, picks up bids of late.
- Risk appetite worsens on inflation, covid fears, softer Aussie, China data also strengthened bearish impulse.
- Australia's jobs report for April will be eyed amid chatters of RBA’s 40 bps rate hike.
AUD/USD reverses the pullback from the weekly top, after posting the biggest daily fall in a week, as traders prepare for the all-important Australia employment report for April. Even so, the broad risk-off mood probe the recovery moves near 0.6975-80 amid the early Thursday morning in Asia.
Market sentiment soured the previous day with the usual catalysts, namely inflation and growth, weighing down the risk appetite. Higher inflation numbers from the UK, Eurozone and Canada appear to be fueling the fears of slowing growth moving forward. The same could be witnessed in the recently watered-down US Gross Domestic Product (GDP) forecasts from the leading banks.
Elsewhere, Shanghai’s refrain from total unlocks and an increase in covid cases in mainland China joined fresh virus-led activity restrictions in Tianjin, the port city near Beijing, also contributing to the risk-aversion and weighing on AUD/USD prices.
Additionally, downbeat prints of Australia’s Westpac Leading Index for April, Q1 2022 Wage Price Index and China’s housing numbers were also responsible for the AUD/USD pair’s downside. It’s worth noting that the US housing data for April gained little importance as the flight to safety underpinned the US Dollar Index (DXY) to post the biggest daily gains of a week, not to forget snapping the previous three-day downtrend.
Amid these plays, Wall Street benchmarks saw the red while the US 10-year Treasury yields dropped 11 basis points (bps) to 2.88% by the end of Wednesday’s North American trading session.
Looking forward, Australia is up for publishing April month employment data that bears upbeat forecasts with the headline Employment Change likely rising to 30.0K from 17.9K previous readout whereas the Unemployment Rate is expected to ease to 3.9% versus 4.0% prior.
“Given that weekly payrolls suggest weather and holiday events dampened jobs growth in April, Westpac anticipates employment to lift by 20k for the month. The participation rate holding flat at 66.4% should see the unemployment rate move downwards (Westpac f/c: 3.9%),” said Westpac ahead of the release.
Technical analysis
AUD/USD reverses from 100-SMA on 4H, around 0.7035 by the press time, for the third time in a month as MACD teases bears, suggesting further downside towards the weekly bottom surrounding 0.6870.
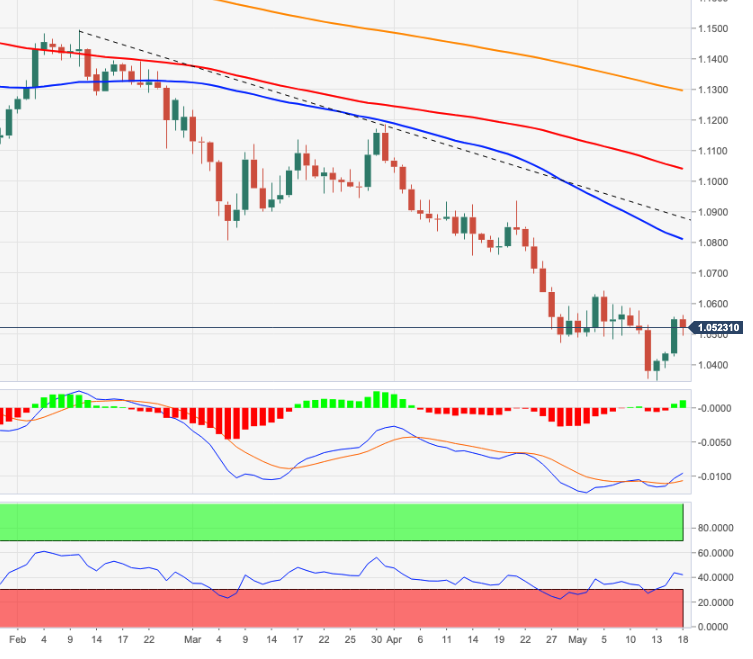
- EUR/USD is expecting more downside on souring market mood.
- Sustained Eurozone HICP numbers are compelling for a rate hike by the ECB.
- The DXY has rebounded sharply on improvement in safe-haven appeal.
The EUR/USD pair is attempting to find a cushion around 1.0460 after a sheer downside move from 1.0564 recorded on Wednesday. A thunderous FX arena on a soaring risk-aversion theme brought a swift sell-off in the risk-sensitive currencies. The asset sees more weakness as negative market sentiment is still dominating the global markets.
The shared currency bulls found barricades near their crucial resistance at 1.0550 after the Eurostat reported the Harmonized Index of Consumer Prices (HICP) on Wednesday. The annualized Eurozone HICP landed at 7.4%, a little lower than the estimates and prior figure of 7.5%. The euro bulls are facing tremendous pressure despite a minor fall in the HICP numbers as investors have started believing that the inflationary pressures will persist longer due to supply chain issues and the Eastern European crisis. To contain the ramping up inflation, European Central Bank (ECB) policymakers advocate a rate hike cycle to start with a quarter-to-a-percent rate hike in July.
On the dollar front, the US dollar index (DXY) has rebounded sharply amid an improved safe-haven appeal. The DXY is oscillating marginally below 104.00 and is expected to overstep the round-level resistance as market sentiment may remain negative for a little longer. Also, Philadelphia Federal Reserve (Fed) Bank President Patrick Harker has favored two 50 basis points (bps) rate hikes in June and July.
This week, the Eurozone Consumer Confidence will remain in focus. The confidence of the European consumers is expected to improve to -21.5 against the prior print of -22.
JP Morgan cut its expectation for US real Gross Domestic Product (GDP) for the second half of 2022 and for 2023, per Reuters.
The details suggest that the firm’s economic and policy research department cut its second half view to 2.4% from 3% and cut its first half 2023 target to 1.5% from 2.1% and for the second half of 2023 it cut its view to 1% from 1.4%.
The forecast report also mentions, “It said there may be enough of a growth slowdown to lead to a gradual increase in the unemployment rate later next year, helping to relieve some wage pressures that have been building.”
In the end, the research led by economist Michael Feroli concludes, “In short, we forecast a soft landing, but are well aware that this outcome has rarely (if ever) occurred.”
FX implications
Fears of inflation and growth are omnipresent nowadays and exert major pressure on the risk assets. The same weighs on the Antipodeans and underpins the US dollar strength. That said, the US Dollar index snapped a three-day downtrend on Wednesday whereas the AUD/USD prices declined the most in a week the previous day, around 0.6970 by the press time.
Read: Forex Today: Dollar soars as Wall Street plunges
- On Wednesday, the AUD/JPY grinds lower by almost 2% on weak Aussie data and dismal sentiment.
- A bearish flag in the 1-hour chart targets 88.40, but the market mood could drive prices towards 88.00.
- AUR/JPY Price Forecast: In the 1-hour chart is downward biased and could aim towards 87.30 if bears achieve a daily close below 88.40.
The Australian dollar gave back its Tuesday’s gains after Wednesday’s Asian Pacific session began on the wrong foot, once the Wage Price Index (WPI) rose lower than estimations, meaning that expectations of a 40-plus bps rate hike by the Reserve Bank of Australia (RBA) wane, putting 25-bps instead in play. At the time of writing, the AUD/JPY is trading at 89.22.
Sentiment remains dismal, as shown by US equities tumbling between 3.57% and 5.06%. Asian stocks point to a lower open, and those factors in the FX market weighed on risk-sensitive currencies, like the AUD, the NZD, the CAD, and the GBP.
During the Asian session, the Australian economic docket featured the Q1 Wage Price Index rose by 2.4% y/y, lower than the 2.5% estimated, while the quarterly reading grew 0.7%, also less than the 0.8% foreseen. Even though both figures grew more than the previous period, they are trailing the high inflationary pressures in Australia, with the inflation rate reported at 3.7%, the highest since 2009, and headline inflation reaching 5.1%.
Once the data is in the rearview mirror, that would likely deter the RBA from increasing the size of tightening monetary policy, as some banks backpedaled from expecting a 40-bps rate hike to a 25-bps one.
Meanwhile, during the overnight session for North American traders, the AUD/JPY opened around 90.89, but once the Aussie WPI was released, the cross-currency pair tumbled, following the AUD/USD, which also erased Tuesday’s gains. That said, the AUD/JPY fell below the 50, 200, and 100-hour simple moving averages (SMAs) each at 990.44, 90.19, and 89.77, respectively, and settled around 89.10s.
AUD/JPY Price Forecast: Technical outlook
From a daily chart perspective, the cross stills neutral-upward biased, but failure at 91.00 leave the pair vulnerable to further selling pressure, which means that the AUD/JPY might tumble towards 87.30 before resuming the uptrend.
The AUD/JPY 1-hour chart depicts the pair as downward biased. The ascending channel, which depicted a bearish flag, kept the price within those boundaries until it finally broke around 90.10, which exacerbated the cross fall towards 89.10s.
That said, the AUD/JPY first support would be the 89.00 mark. Break below would expose the S1 daily pivot at 88.44, followed by the 88.00 mark, and the S2 daily pivot at 87.72, before reaching the abovementioned 87.30 YTD low.
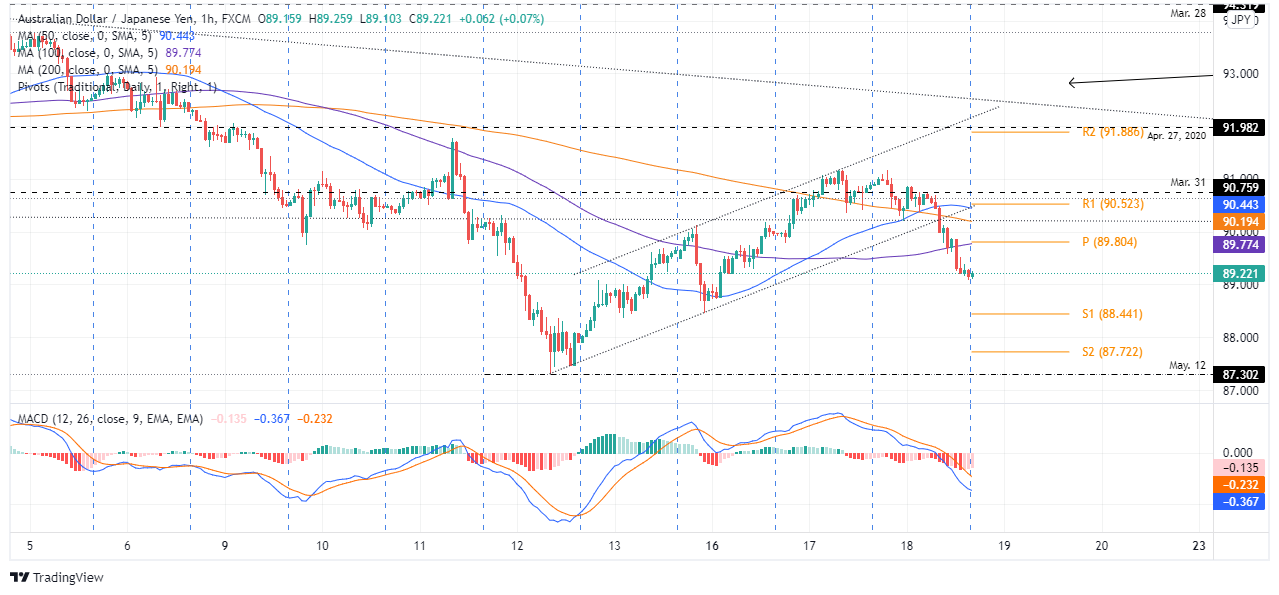
Key Technical Levels
- Gold price has turned topsy-turvy despite negative market sentiment looms.
- Fed policymaker is expecting two more jumbo rate hikes in June and July.
- A 40.00-60.00 range of the RSI (14) is indicating rangebound moves going forward.
Gold price (XAU/USD) is oscillating in a tight range of $1,815.64-1,822.05 in the early Asian session despite the market mood jitters on soaring inflation worldwide. The precious metal has not been affected by intensified negative impulse in the FX domain. Risk-sensitive currencies have taken a bullet and global equities have witnessed an intense sell-off on Wednesday as the risk-off impulse heightened.
The gold prices are untouched amid carnage in the risk-perceived assets while the US dollar index (DXY) has rebounded sharply after hitting a low of 103.20 on Wednesday. Earlier, the DXY eased 1.5% from its 19-year high at 105.00 recorded last week.
Meanwhile, Philadelphia Federal Reserve (Fed) Bank President Patrick Harker has dictated that the Fed is expected to feature two 50 basis points (bps) interest rate hikes in June and July’s monetary policy meetings. Later, it will stick to a traditional quarter-to-a-percent rate hike to contain the price pressures.
The gold prices are expected to react to risk sentiment and the movement of the DXY amid the unavailability of any major economic event in the US that could result in a decisive move for the bright metal.
Gold technical analysis
On an hourly scale, gold prices have rebounded sharply after successfully testing their previous lows at $1,807.72. The precious metal has formed a Double Bottom chart pattern that signals a bullish reversal on lower selling volume while testing the previous lows. The 20- and 50-period Exponential Moving Averages (EMAs) at $1,817.37 and $1,816.43 respectively have turned flat, which signals a directionless move. Meanwhile, the Relative Strength Index (RSI) (14) is oscillating in a 40.00-60.00 range that signals the further auction in a tight range.
Gold hourly chart
-637885073723250764.png)
- NZD/USD on the backfoot in borad risk-off sentiment.
- Wall Street's route came on the heels of an uber hawkish Fed chairman and inflation fears.
At 0.6294, NZD/USD is under pressure in the open of Asian trade due to generalised rout in risk assets. The moves in markets come on the heels of the US Federal Reserve Chair Jerome Powell who amplified a strong hawkish tone yesterday, pledgeding to ratchet up interest rates as high as needed, including taking rates above neutral, in order to cap runaway inflation that he said threatened the foundation of the economy.
The initial reaction in markets immeadiately after the interview with the Walls Street Journal was a firmer US dollar and risk-off in financial markets, but the moves were soon pared and the US benchmarks rallied to fresh highs on the day.
However, all of this was reversed on wednesday when the retailer, Target, reported that higher-than-expected costs ate into its quarterly earnings. The stock fell over 25% and was tracking its worst day since the Black Monday crash on Oct. 19, 1987, highlighting worries about the US economy after the retailer became the latest victim of surging prices.
Consequently, the Dow Jones Industrial Average tumbled by 3.6% to 31,490.07 while the S&P 500 plunged 4% to 3,923.68. The Nasdaq Composite was 4.7% lower at 11,418.15. The US 10-year yield fell by 8.6 basis points to 2.88%.
''Big beats to UK and Canadian CPI stoked inflationary fears, and US retailer stocks have been hammered. So we’re back to watching the ebb and flow of global risk appetite again, and it’s still volatile, and showing no real signs of basing,'' analysts at ANZ bank said.
Today is new Zealand's Budget day
''Budgets don’t tend to be as important for FX as they are for bonds, but anything that clearly upsets the fragile fiscal sustainability/growth/
- AUD/USD bears are coming back to the table.
- The outlook is bearish below 0.6980 and a fresh daily low could be in the making.
As per the prior analysis, AUD/USD Price Analysis: Bulls rest up at 50% mean reversion target, the price has started to melt from the resistance of the 50% mean reversion area on the daily chart. There are now prospects of a downside continuation for the days ahead.
AUD/USD daily chart, prior analysis
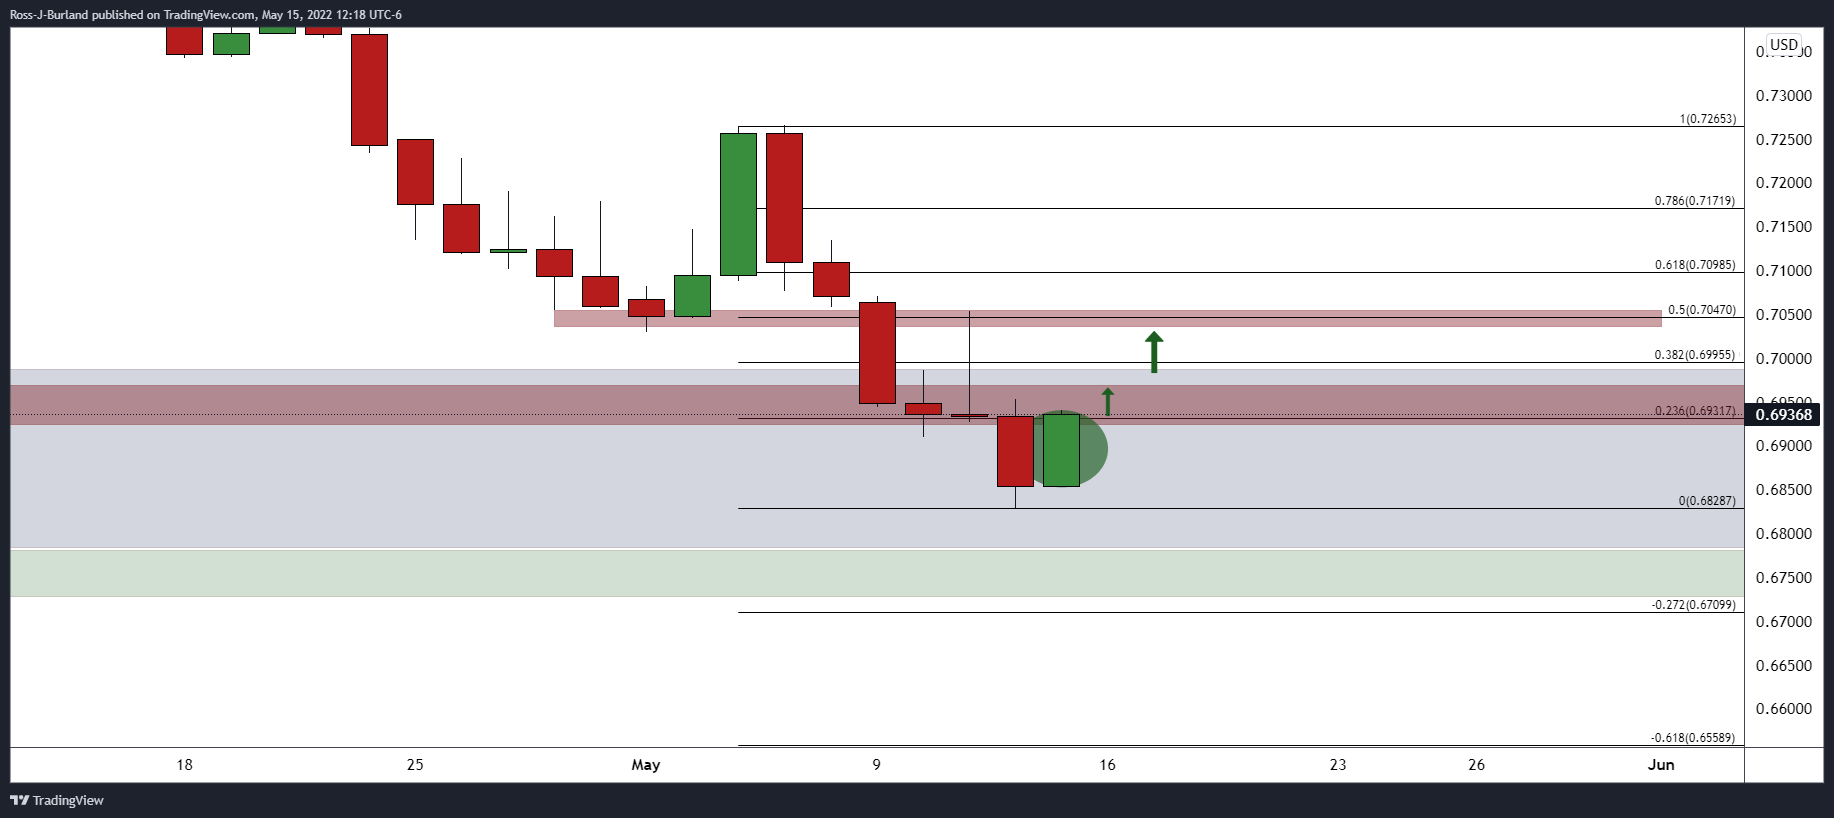
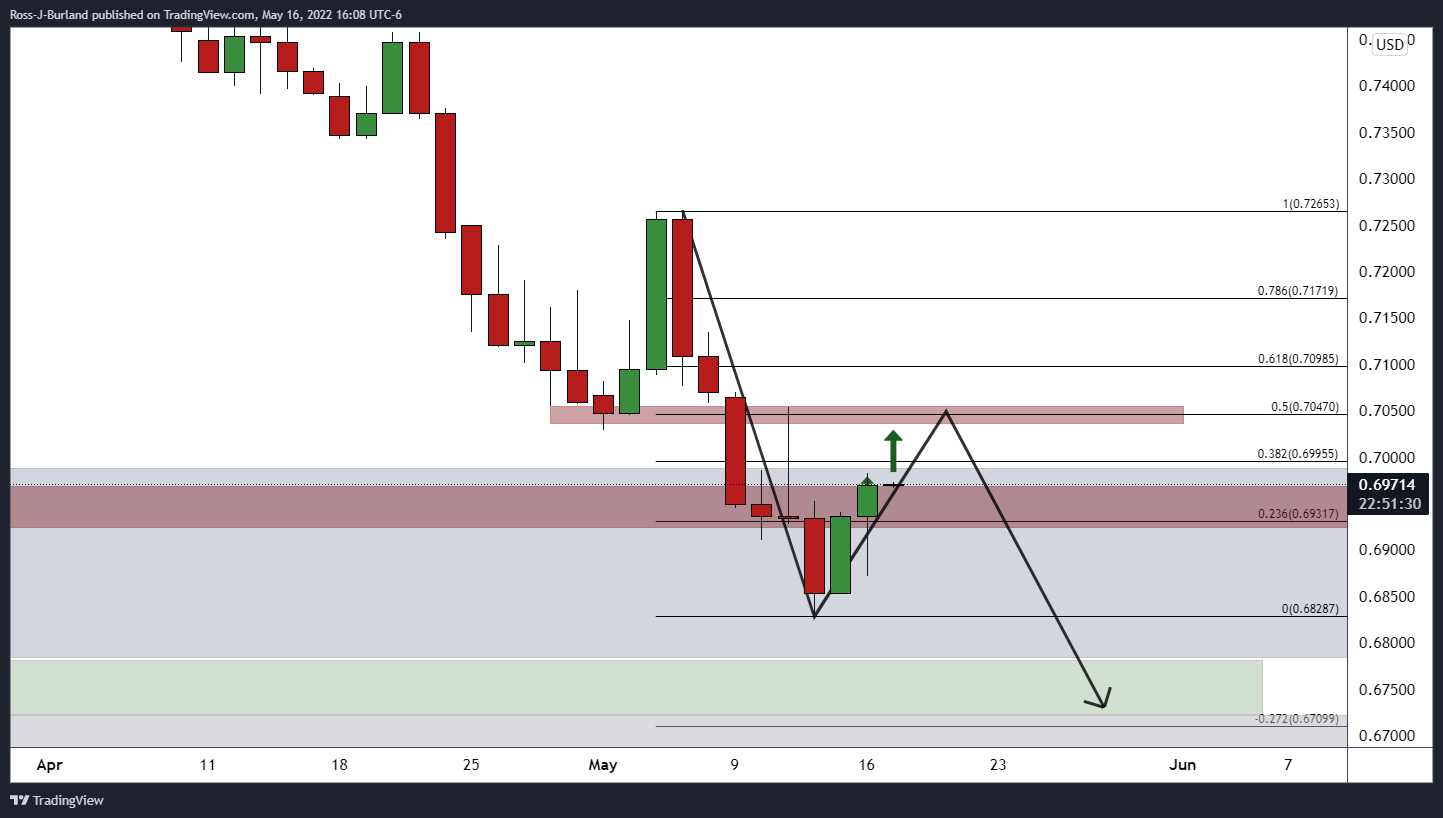
AUD/USD live market
The price is being met by sellers at the resistance zone and should the bears commit beyond the 0.6950s, the case for a downside continuation of the broader bear trend will be strong.
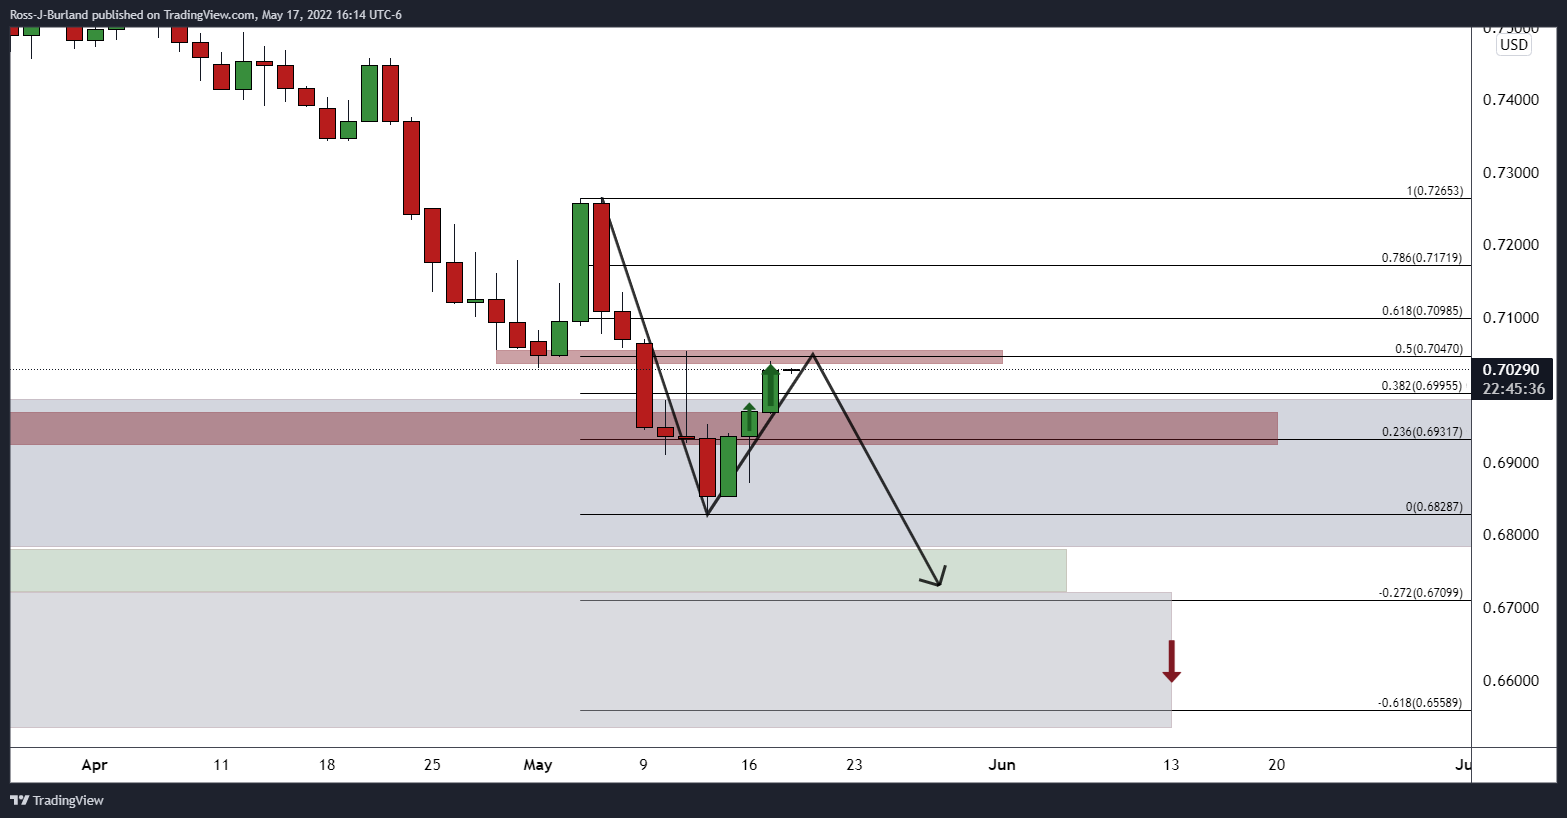
AUD/USD H4 chart
From a four-hour perspective, the price has moved in on what could be a support zone, resulting in a reversion to retest the old support near 0.6990. If bears commit to there, then the path of least resistance will likely be to the downside for a fresh daily low towards 0.6750/70.
Reuters reported that Philadelphia Federal Reserve Bank President Patrick Harker on Wednesday said he expects the US central bank to deliver two more half-point rate hikes before switching to quarter-point increments until the "scourge" of inflation is beaten back.
Key notes
- Expect 50bps rate hikes in June, July.
- Anticipate sequence of 'measured' rate hikes after.
- Until confident inflation moving toward 2%.
- Sees 3% US GDP growth this year.
- Job market tight through 2022.
- elevated energy prices could be with us for while.
"Going forward, if there are no significant changes in the data in the coming weeks, I expect two additional 50 basis point rate hikes in June and July," Harker said in remarks prepared for delivery to the Mid-Size Bank Coalition of America.
"After that, I anticipate a sequence of increases in the funds rate at a measured pace until we are confident that inflation is moving toward the Committee’s inflation target."
Market implications
While the comments have had no direct impact on markets, there is an undertone of hawkishness at the Fed that is roiling markets on Wednesday.
As a consequence, the US dollar is firmly higher on Wednesday, on pace to snap a three-session losing streak. Rising inflation has knocked sentiment following yesterday's WSJ interview with the Federal Reserve Chair Jerome Powell who struck a more hawkish tone.
What you need to take care of on Thursday, May 19:
The greenback edged higher against its high-yielding rivals but eased against safe-haven currencies, reflecting the dismal market mood.
Inflation was the primary catalyst of the latest bout of risk aversion. The EU Consumer Price Index was confirmed at 7.4% YoY in April, while the UK CPI increased by 9% in the year to April. Finally, the Canadian benchmark hit 6.8%. Overheating price pressures are a drag on economic growth, already undermined by supply-chain issues and the Eastern European crisis.
Two US institutes, Wells Fargo and S&P, downwardly revised growth forecasts but expect inflation to remain high. Wall Street resumed its slump, with the three major indexes sinking in the red. The DJIA is about to close over 1,100 lower, while the S&P 500 and the Nasdaq Composite are down over 4% each.
The yield on the US 10-year Treasury note stands below 2.90%, as investors rushed into bonds’ safety.
The EUR/USD pair trades around 1.0460, while GBP/USD is now at 1.2340. The AUD/USD pair plunged to 0.6960 while USD/CAD recovered the 1.2800 threshold. On the other hand, the USD/CHF fell to 0.9880 while USD/JPY trades in the 128.20 price zone.
XAUUSD was unable to attract speculative interest, now hovering around $1,816 a troy ounce. Crude oil prices edged lower, with WTI now changing hands at $106.90 a barrel.
Top 3 Price Prediction Bitcoin, Ethereum, XRP: Cryptos build momentum for a flash crash
Like this article? Help us with some feedback by answering this survey:
- The shared currency collapsed against the Japanese yen, spurred by a downbeat market mood.
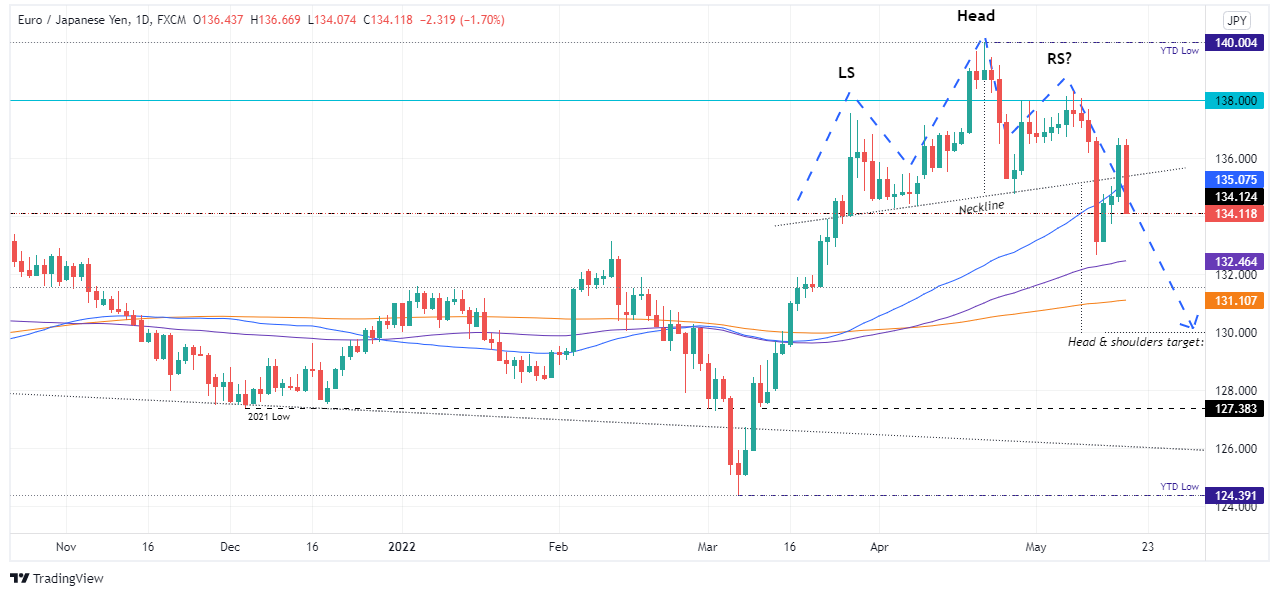
- EUR/JPY Price Forecast: The bias shifted neutral-downwards and would turn downwards if bears pushed the exchange rate below 132.60.
The EUR/JPY is plunging more than 1.50% on Wednesday, reversing Tuesday’s gains as EUR/JPY bears regained control and pushes the exchange rate below the head-and-shoulders neckline, keeping the pattern in play. At the time of writing, the EUR/JPY is trading at 134.11.
The market sentiment remains negative, carrying on from the European to the whole New York session. Also, EU economic data, particularly inflation figures, rose below than expected and in line with previous readings, easing the prospects of a hawkish European Central Bank (ECB).
In the overnight session, the EUR/JPY opened at around 136.50s and reached a daily high at 136.67 before tumbling 220-pips, breaking below the 50, 100, and 200-hour simple moving averages (SMAs), as sentiment turned sour
EUR/JPY Price Forecast: Technical outlook
On Tuesday, the EUR/JPY bias shifted upwards when the cross-currency pair rallied more than 200-pips. Nevertheless, Wednesday was revenge day for EUR/JPY bears, which caused a drop of more than 220-pips during the day and kept the head-and-shoulders chart pattern in play, which was threatened by Tuesday’s price action.
Albeit the bears are in control, they are not out of the woods yet. A break below 132.65 is needed to increase the possibility of reaching the head-and-shoulders chart pattern target at 130.00.
That said, the EUR/JPY first support would be 134.00. Break below would expose the May 16 daily low at 133.74, followed by May 13 swing low at 133.09 and then the 100-day moving average (DMA) at 132.25, before exposing the 200-DMA at 131.10.
Key Technical Levels
- GBP/JPY is sinking in the market rout due to fears of runaway inflation.
- Wall Street stocks were pressured as Target reported that higher-than-expected costs ate into its quarterly earnings.
At 158.20, BP/JPY is down some 2% at the time of writing as risk appetite fades due to concerns about the outlook for global economic growth and rising inflation that has knocked sentiment. The moves in markets could be a delayed reaction to Tuesday's rhetoric from the US Federal Reserve Chair Jerome Powell who amplified a strong hawkish tone.
Powell pledged the US central bank would ratchet up interest rates as high as needed, including taking rates above neutral, in order to cap runaway inflation that he said threatened the foundation of the economy. The initial reaction was a firmer US dollar and risk-off in financial markets, but the moves were soon pared and the US benchmarks rallied to fresh highs on the day.
However, the mood has been soured on Wednesday on Wall Street. The retailer, Target, reported that higher-than-expected costs ate into its quarterly earnings. The stock fell over 25% and was tracking its worst day since the Black Monday crash on Oct. 19, 1987, highlighting worries about the US economy after the retailer became the latest victim of surging prices.
Interest-rate sensitive mega-cap growth stocks added to the declines on Wall Street and pulled the S&P 500 and Nasdaq lower. Tesla Inc lost 7.5%, Nvidia and Amazon both lost more than 6% and Apple and Microsoft each fell over 4%. Consequently, US Treasury yields have fallen as investors pile into safety, leading to a rout in risk assets. This in turn has put a bid into the yen, sinking GBP/JPY to a low of 158.11 in recent trade.
GBP is not out of the woods
Meanwhile, the pound is also feeling the heat, losing over 1% vs. the US dollar despite the stronger than expected UK labour data released the prior day that has raised the prospect that the Bank of England may have to go further with policy tightening to rein in inflationary pressures.
However, as analysts at Rabobank argued, ''while a strong labour market is a good reflection of economic health, it is not good news for everyone insofar as higher interest rates will compound the impact of the cost of living crisis for many lower-income households.''
''We continue to view the medium-term outlook for risk appetite as vulnerable and don’t view GBP/USD as being out of the woods,'' the analysts at Rabobank argued.
As for Japan's economy, Wednesday's release of Japanese preliminary Q1 Gross Domestic Product data was better than expected although it still showed a -0.2% QoQ contraction which highlights the continued vulnerability of the Japanese economy and justifies the central bank's continued support from both fiscal and monetary fronts.
''While better Japanese current account data and a bout of short-covering have pushed USD/JPY away from its recent highs, we continue to see the potential for further upside over the summer as the Fed continues to hike rates. Assuming an improvement in Japanese economic data, speculation of a potential alteration to the BoJ’s YCC policy has the potential to rein back USD/JPY into the autumn,'' the analysts at Rabobank explained.
This week's inflation data will be important for the yen. Japanese April Consumer Price Inflation is expected to show a headline rate of 2.5% YoY. The analysts at Rabobank, however, explain that underlying inflation is expected at a much softer +0.7% YoY a snapback from the deflationary -0.7% YoY released the previous month. ''Comments from ex-BoJ board member Sakurai have suggested that if inflation were to hold above the 1% y/y area, there may be room for the BoJ to tweak its YCC policy in the autumn.''
- Overall, US dollar strength weighed on the precious-metals complex as silver fell in the New York session.
- Fed’s Powell reiterates that the Fed will achieve the inflation target and says they would move “aggressively” to achieve it.
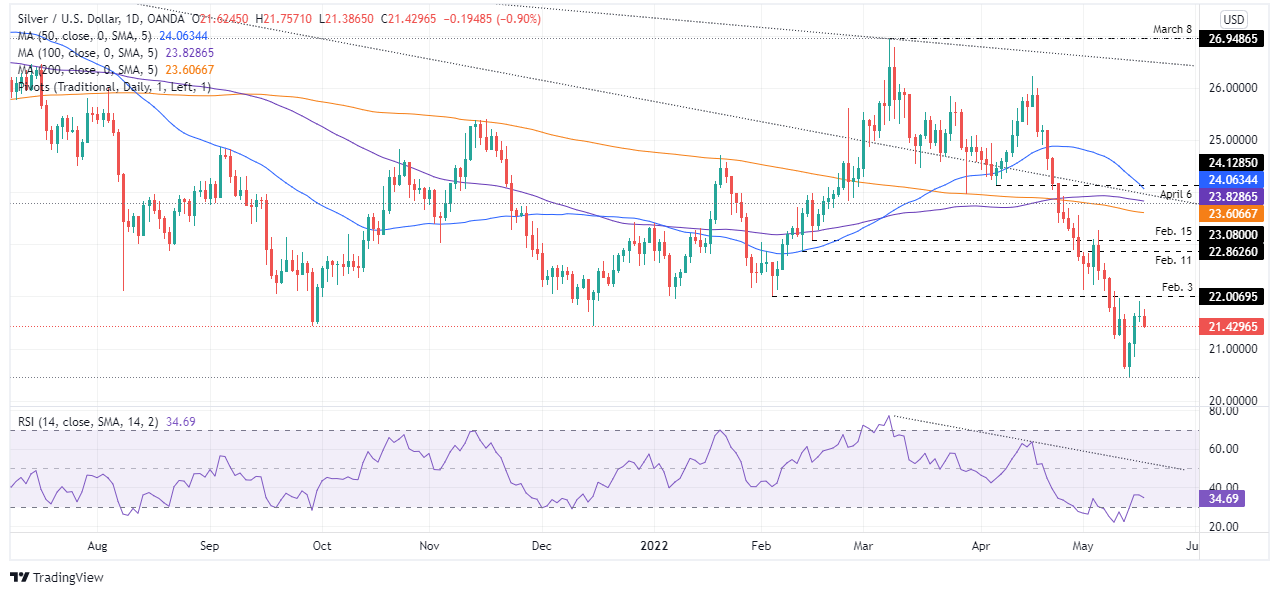
- Silver Price Forecast (XAG/USD): It is downward biased, and as the RSI exits from oversold territory and aims lower, it puts in play a re-test to the YTD lows.
Silver spot (XAG/USD) is losing its ground, and it is falling on Wednesday, recording losses of almost 1%, courtesy of a buoyant greenback and a negative market mood that usually propels precious metals upwards. At $21.46, XAG/USD stays above $21.42, but failure at $22.00 might have opened the door for further losses.
A stronger US dollar and a “hawkish” Powell weigh on XAG/USD prices
The US Dollar Index, a gauge of the greenback’s measurement against a basket of six peers, is advancing some 0.42% in the day, sitting at 103.727, a headwind for XAG/USD. Contrarily, falling US Treasury yields, led by the 10-year benchmark note, are retreating ten basis points, sitting at 2.887%, which would usually hurt the buck and are being ignored by investors.
Another factor to consider is Fed Chair Jerome Powell’s Q and A event, held on Tuesday by the Wall Street Journal. Powell said that the Fed “needs to see” that inflation is coming down in a “clear and convincing way, and we’re going to keep pushing until we see that. If that involves moving past broadly understood levels of ‘neutral,’ we won’t hesitate at all to do that.” Furthermore, Powell added that if the US central bank fails to see that, “then we’ll have to consider moving more aggressively.”
Elsewhere, the US docket featured Building Permits and additional housing data, which came mixed. Building Permits rose higher than foreseen, but Housing Starts missed expectations as the US economy began to show signs of the Federal Reserve tightening.
Philadelphia’s Fed Patrick Harker would cross wires late in the day, followed by Thursday’s Initial Jobless Claims.
Silver Price Forecast (XAG/USD): Technical outlook
Meanwhile, XAG/USD’s price action depicts that the white metal bias is still downwards. As above-mentioned, the $22.00 barrier proved challenging to overcome, and with bears re-entering the market and the Relative Strength Index (RSI) at 34.76 aiming lower, a re-test towards the YTD lows at around $20.45 is on the cards.
With that said, the XAU/USD’s first support would be $21.00. A breach of the latter would expose the May 16 daily low at $20.84, followed by May 12 lows at $20.61, and then the YTD low at $20.45.
- USD/CAD bulls are moving in across a key support structure.
- The bulls eye the 50% and 61.8% ratios for the sessions ahead.
USD/CAD has started to stall on the offer and the bulls could be moving in for a run towards old support near a 50% mean reversion of the bearish impulse on the daily chart located at 1.2936. The M-formation is a reversion pattern that typically results in a retest of the neckline as illustrated in the following analysis o the daily chart:
USD/CAD daily chart
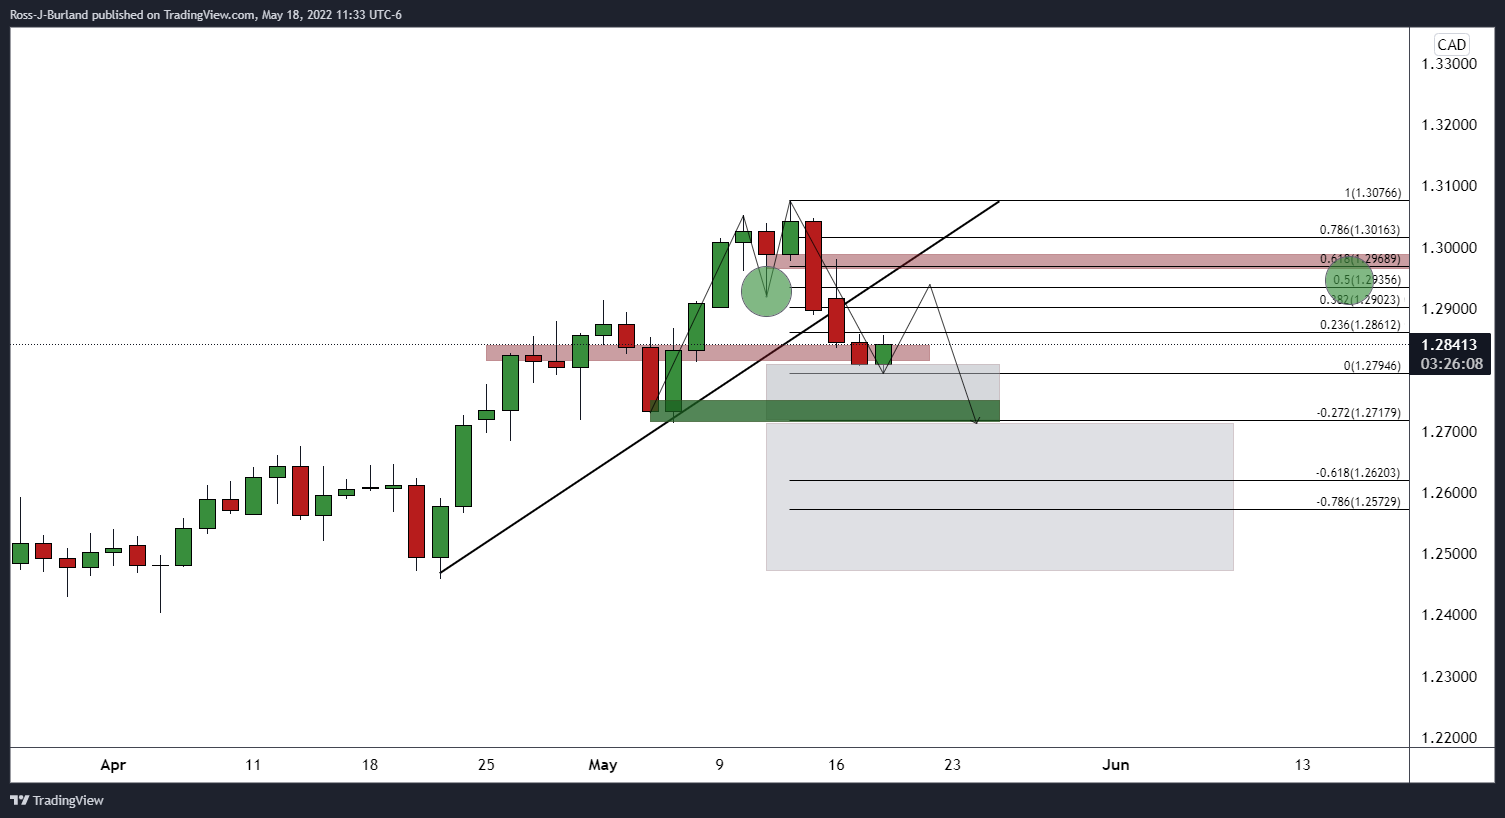
Beyond the 50% mean reversion and neckline of the M-formation, the 61.8% Fibonacci aligns with the base of the neckline for a deeper target near 1.2970. As an approximate mean of the two ratio targets, the psychological round1.2950 number could be an important figure for the forthcoming sessions.
USD/CAD H1 chart
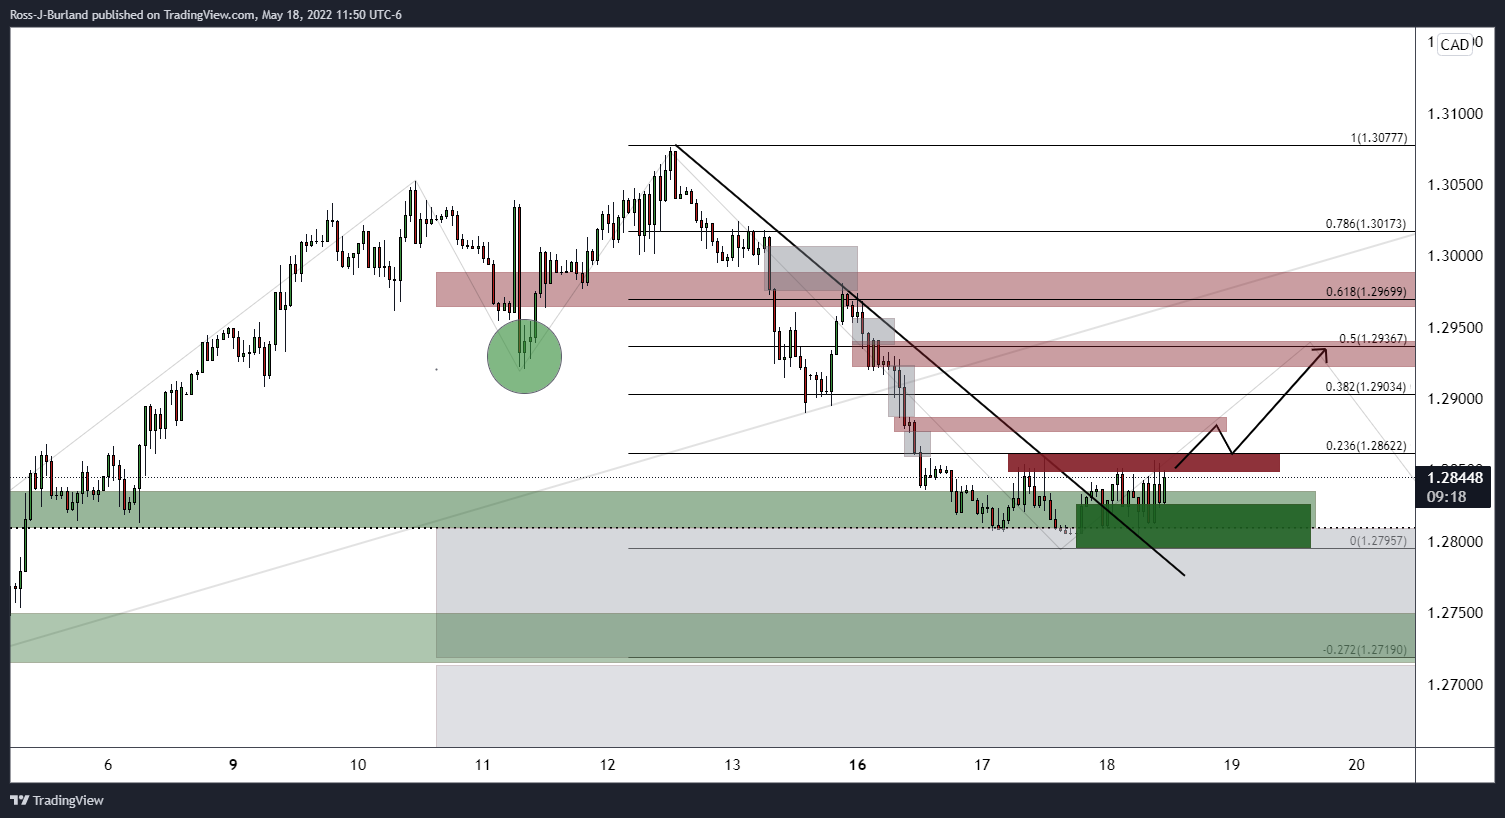
USD/CAD is accumulating across a support structure on the hourly chart and a break of 1.2860 and then 1.2880 should open the way towards the 50% and 61.8% ratios for the bulls.
- GBP/USD is recording losses of 0.98%, almost pairing Tuesday’s gains.
- UK’s inflation rises to 9%, an increase of 2% compared to the previous reading of 7%.
- GBP/USD Price Analysis: Remains downward biased and might re-test the YTD lows at around 1.2155.
The GBP/USD snaps three days of gains and is losing close to 1% during Wednesday’s session, trimming some of Tuesday’s gains, on a dampened mood in the financial markets, despite higher than expected inflation reported from the UK. At 1.2365, the GBP/USD reflects a drop of more than 100-pips and almost a full reversal move from Tuesday.
Sentiment remains negative, another factor to consider when trading the British pound. Due to its status as a risk-sensitive currency, when sentiment is negative, traders would seek safe-haven peers, like the greenback and the JPY. Also, the Sterling was struck by high inflation figures, and recapping the Bank of England (BoE) could reach double digits throughout the year. That, coupled with central bank hiking rates and lower growth, is threatening to push UK’s economy into stagflation. Consequently, cable’s outlook looks cloudy and could weaken further until May 2020 swing lows at around 1.2080.
During the overnight session, the GBP/USD opened near the highs of the session, at around 1.2490, and tumbled when the UK’s inflation crossed newswires, breaking several figures on its way down and recording as of writing a new daily low at around 1.2360s.
GBP/USD Price Forecast: Technical outlook
The GBP/USD remains downward biased. The rally from YTD lows at around 1.2150s was short-lived, and GBP/USD bull’s failure to reclaim Jul 2020 swing low-turned-resistance at 1.2479 exposed the major to further selling pressure. Also, the slope of MACD’s line is “almost” horizontal, meaning that it could cross under the signal line, aiming lower, signaling that the GBP/USD might extend its losses.
With that said, the GBP/USD first support would be May 17 daily low at 1.2315. A break below would expose the June 2020 swing lows at around 1.2251, followed by the YTD low at 1.2155.
Key Technical Levels
Analysts at Rabobank continue to favour the US dollar over the Japanese yen as a safe haven in this current crisis and they see scope for a move in USD/JPY towards 132.00 on a one to three-month view, assuming the Federal Reserv hikes interest rates at an aggressive pace in the coming months and that the Bank of Japan retains an extremely dovish policy position.
Key Quotes:
“Despite the pressure on the trade balance, Japan’s current account recorded a second straight surplus in March, proving that investment income into the country can still outweigh the impact of surging energy and commodity costs. The better than expected current account release helped restore confidence in the JPY’s safe haven status and coincided with a dip lower in the value of USD/JPY towards the end of last week. We continue to favour the USD over the JPY as a safe haven in this current crisis and see scope for a move towards USD/JPY132.00 on a 1 to 3 month view. This view assumes that the Fed hikes interest rates at an aggressive pace in the coming months and that the BoJ retains an extremely dovish policy position.”
“While better Japanese current account data and a bout of short-covering has pushed USD/JPY away from its recent highs, we continue to see the potential for further upside over the summer as the Fed continues to hike rates. Assuming an improvement in Japanese economic data, speculation of a potential alteration to the BoJ’s YCC policy has the potential to rein back USD/JPY into the autumn.”
Data released on Wednesday showed the annual inflation rate rose to 6.8%, the highest level since January 1991. Analysts at CIBC point out inflation could rise further in May before starting to slowdown during the second half of the year.
Key Quotes:
“There's no respite yet for Canadian consumers when it comes to inflationary pressures. Headline CPI accelerated further to 6.8%, from 6.7% in the prior month and against consensus expectations for an unchanged reading. Moreover, with gasoline and agricultural prices still on the rise, headline inflation could well accelerate again in May before finally starting to slow in the second half of the year and into 2023.”
“Some like it hot, but not the Bank of Canada when it comes to inflation. The fact that inflation is pushing further above the Bank's MPR forecasts virtually guarantees another 50bp hike at its next meeting, and it could well follow that up with another outsized move to get the overnight rate to the bottom end of its neutral range (2-3%) quickly. However, after that, signs of a slowing in the domestic economy and home-grown inflationary pressures should slow down the pace of rate hikes, and we still suspect that the Bank won’t have to take rates above 2.5% in order to slow growth enough to bring inflation down to its 2% target in 2023.”
- Swiss franc jumps across the board amidst risk aversion and despite Jordan’s words.
- Bearish correction in USD/CHF gains speed.
- Next support is below 0.9880 at 0.9830 and 0.9800.
The USD/CHF fell sharply during the American session from 0.9970 to 0.9860, reaching the lowest level since May 6. It remains near the lows, under pressure amid risk aversion. The Swiss franc and the Japanese yen are the best performers.
CHF soars, Wall Street plummets
The Swiss franc started to rally after comments from Thomas Jordan, Swiss National Bank Chairman. He reiterated that the SNB is ready to intervene in the currency market and act if inflation strengthens. Despite reaffirming the negative interest rate policy, the Swiss franc started to rise. It then accelerated as stocks in the US turned sharply lower.
The Dow Jones is falling 2.65%, and the Nasdaq tumbles 3.72%. The demand for safety is boosting the yen, the franc, the dollar and bonds. Crude oil reversed and is now down 1.70%. Cryptocurrencies are again under pressure, with BTC/USD below $29,000.
Despite more comments about rate hikes from European Central Bank officials, the EUR/CHF is having the worst day in months. During the last hours it dropped from 1.0490 to 1.0338, the lowest intraday level since May 6.
The short-term technical outlook in USD/CHF changed dramatically during the last two days. After a rally from 0.9330 to 1.0054 (May 16 high), the pair lost momentum and on Tuesday started a correction that is still strong. A consolidation below 0.9880 should keep the negative momentum in place. The next support is seen at 0.9830 and then at 0.9800/10 awaits the 20-day Simple Moving Average.
Technical levels
- The Australian dollar is losing ground vs. the greenback, as the AUD/USD is down 0.46%.
- Australia’s WPI to put the RBA in doubt of hiking aggressively?
- Fed’s Powell commented that if inflation does not abate, they will move “more aggressively.”
- AUD/USD Price Forecast: Failure at 0.7051 sent the pair below the 0.7000 figure.
AUD/USD is giving back some of Tuesday’s gains, after reaching a daily high at around 0.7046, but fell on a lower than foreseen Australian Wage Price Index (WPI), which puts the Reserve Bank of Australia (RBA) in doubt about tightening monetary policy at a faster pace than other central banks in the world, like the Federal Reserve, in the US. At 0.6994, the AUD/USD extends its losses, also helped by dismal market sentiment.
Australia’s WPI to put the RBA in doubt of hiking aggressively?
During the Asian session, the Wage Price Index rose by 2.4% y/y, lower than the 2.5% estimated, while the quarterly reading grew 0.7%, also less than the 0.8% foreseen. Although both readings grew more than in the previous period, they are still trailing the high inflation rate in Australia, which was reported at 3.7%, the highest since 2009, with headline inflation reaching 5.1%.
RBA forecasts wage growth to gradually accelerate to 2.7% by June and 3% by the end of the year. However, the last reading will disappoint the central bank, which raised rates in May, expecting to hit a wage spiral, though the WPI report showed the opposite. Meanwhile, money market futures scaled back expectations of an RBA’s cash rate increase in June, dropping to 92% odds from a 100% of a 25-bps increase
Analysts at ANZ Bank scaled back its 40-bps forecast, attributed to WPI figures. They wrote in a note that “the RBA is likely to hike the cash rate another 25bp in June, rather than a larger 40 or 50bp hike. But there are still important data to come, with the April labour market release tomorrow and average earnings per hour in the National Accounts on 1 June.”
A “hawkish” Powell boosts the prospects of the greenback
Elsewhere, on Tuesday, the Federal Reserve Chair Jerome Powell said that “What we need to see is inflation coming down in a clear and convincing way, and we’re going to keep pushing until we see that.” If the central bank does not see clear evidence of abating inflation, Powell emphasized that “we’ll have to consider moving more aggressively.”
In the meantime, the US Dollar Index is trimming Tuesday’s losses and marches firmly, gaining 0.36%, sitting at 103.676, also a headwind for the AUD/USD. Contrarily, US Treasury yields are trading lower in the day, down seven and a half basis points, at 2.919%.
Before Wall Street opened, the US economic docket revealed Building Permits and additional housing data, which came mixed. Building Permits rose to 1.819 M, better than the 1.812 M expected. However, Housing Starts grew at a slower pace, coming at 1.724 million, less than the 1.765 million estimated, beginning to show signs of the Federal Reserve tightening. Later in the day, Philadelphia’s Fed Patrick Harker would cross wires.
AUD/USD Price Forecast: Technical outlook
The AUD/USD Tuesday’s price action was attributed to an improved market mood, as China’s reported better handling of the coronavirus crisis. However, AUD/USD bull’s failure to reclaim 0.7051 left the major exposed to selling pressure, as AUD/USD bears entered the market on lower than expected WPI and sent the pair towards fresh daily lows below the 0.7000 figure.
With that said, the AUD/USD’s first support would be the January 28 swing low at 0.6967. Break below would expose 0.6900, followed by the YTD low at 0.6828.
- US dollar strengthens amid risk aversion, DXY up 0.30%.
- EUR/USD trims a fraction of its recent gains.
- EUR/CHF plummets more than a hundred pips in minutes.
The EUR/USD is back under 1.0500 as the US dollar strengthened amid a deterioration in market sentiment. At the same time, a sharp slide in EUR/CHF also weighed on the euro.
Wall Street and EUR/CHF on free fall
Leading stocks indices in Wall Street are falling by more than 2% and have erased the gains for the previous two trading days. Pessimism about the global economic outlook is back on the table and also affected by a more hawkish rhetoric from Federal Reserve and European Central Bank officials.
As risk-off set in, the demand for Treasuries emerged. The US 10-year yield fell to 2.90% and the 30-year to 3.11%. The decline in yields so far avoids a larger appreciation of the US dollar.
The context boosted the Swiss franc and the yen, that are the best performers on Wednesday. The EUR/CHF lost more than a hundred pips during the last two hours, falling from 1.0480 to 1.0364 and hitting the euro. Today, Swiss National Bank Chairman Thomas Jordan repeated that they are “ready to intervene in currency markets when necessary."
Recovery over?
As of writing, EUR/USD trades at 1.0489, the daily low. Price is testing the 55 and 200-hours Simple Moving Average (SMA). A consolidation below should point to a potential end of the rally from the multi-year low. The following support stands at 1.0435, followed by 1.0390.
On the upside, the critical short-term area to watch is 1.0525/30, a horizontal resistance and the 20-hour SMA. Above the euro should look at 1.0555 and the daily high at 1.0563.
Technical levels
- On Wednesday, the non-yielding metal is almost flat as investors assess the pace of the Fed’s tightening.
- A buoyant US Dollar keeps gold defensive, though holding above $1800.
- TD Securities analysts report that Gold ETF holdings have fallen for a ninth consecutive day.
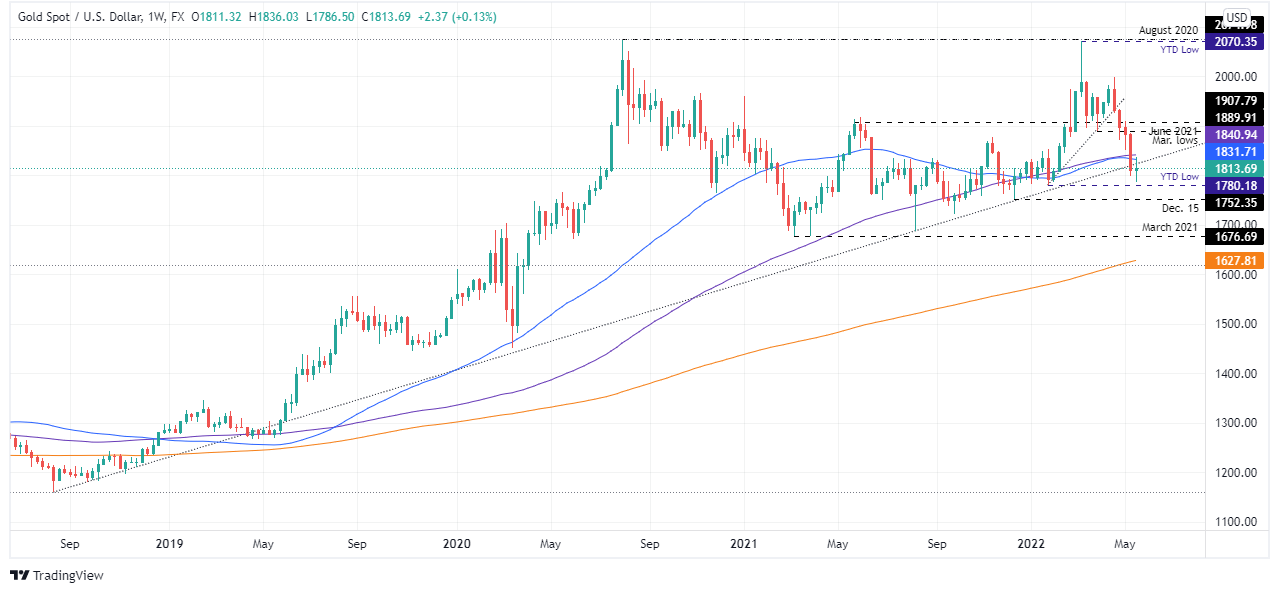
- Gold Price Forecast (XAU/USD): The bias is tilted neutral-downward, and a break below $1800 could send XAU/USD towards $1700.
Gold spot (XAU/USD) is trading negative in the day, though it remains at familiar levels, trapped in the $1800-20 region amid the lack of a catalyst that can push the bright metal beyond its current boundaries. At the time of writing, XAU/USD is trading at $1813.69
Gold remains defensive, despite having a risk-off environment, which usually helps the yellow metal. However, US Dollar strength overshadows XAU/USD’s prospects, as the greenback gains some 0.18% against a basket of currencies, portrayed by the US Dollar Index at 103.486. Also, on Tuesday, Federal Reserve Chair Jerome Powell said that “What we need to see is inflation coming down in a clear and convincing way, and we’re going to keep pushing until we see that. If that involves moving past broadly understood levels of ‘neutral,’ we won’t hesitate at all to do that.”
Meanwhile, financial analysts chatter has expressed that the Fed will struggle to achieve a soft economic landing, meaning that could cause a recession if needed to bring inflation down. This environment could be positive for gold, but gold bulls have been unable to challenge the 200-DMA at around $1837, much less the $1890 level, which needed to be reclaimed if they aim to lift prices above $1900.
Analysts at TD Securities wrote in a note that “With downside momentum firming among the precious metals complex, and broad macro liquidations also weighing, we continue to see further downside potential for gold. ETF holdings have fallen for a ninth straight day while positioning analytics still argue for the potential of additional pain for gold bugs.”
Macroeconomic-wise, the US docket featured Building Permits and additional housing data, which came mixed. Building Permits rose to 1.819 million, higher than the 1.812 million foreseen, but Housing Starts increased by 1.724 million, lower than the 1.765 million estimated, beginning to show signs of the Federal Reserve tightening. Later in the day, Philadelphia’s Fed Patrick Harker would cross wires.
Gold Price Forecast (XAU/USD): Technical outlook
As of writing, XAU/USD is trading below the two-year-old upslope trendline, drawn from September 2018 swing lows, as depicted by the weekly chart. It’s also worth noting that the 50-week moving average (WMA) crossed under the 100-WMA, each located at $1831.76 and $1840.96, respectively, a signal of sellers’ strength entering the market.
With that said, XAU/USD’s first support would be $1800. A breach of the latter would put the YTD lows at $1780.18 in play, a level needed to be broken by gold bears if they aim to push prices towards $1700. Once XAU/USD bears reclaim $1780.18, the last line of defense would be December 15, 2021 swing low at $1752.35, followed by $1700.
Key Technical Levels
- WTI has dipped back towards $110, with oil prices weighed amid a downturn in macro risk sentiment.
- But dips may be attractive to potential buyers as lockdown ease in Shanghai and as Russian/OPEC output struggles.
- Crude oil prices fell in recent trade despite a larger than expected headline draw according to weekly US EIA data.
Further constructive updates about an easing of lockdown restrictions in Shanghai failed to old up oil markets on Wednesday, with prices coming under pressure in tandem with global equities as investors mulled the prospect of rapid central bank tightening against a backdrop of slowing global growth. Front-month WTI futures nearly hit fresh highs on the week in the mid-$155s earlier in the session, but have since fallen back to just above the $110 mark, down around $2.50 on the day. Prices were down in recent trade despite a larger than expected draw in headline weekly US crude oil inventories, data released by the Energy Information Agency (EIA) showed.
Regarding crude oil-relevant developments, China reportedly allowed hundreds of financial institutions in Shanghai to resume work and eased some testing requirements on inbound US and other travelers, raising hopes that lockdown-hit crude oil demand in the world’s second-largest economy and second-largest oil consumer might soon rebound. Meanwhile, though the EU Commission on Wednesday announced a EUR 300B investment plan until 2030 to wean the bloc off of all Russian fossil fuel imports, the bloc continues to fail to persuade Hungary to sign up to its proposed ban on Russian oil imports within the next few months.
Some said the continued failure to come to an agreement on the much-anticipated Russian oil embargo is starting to weigh on prices, or at least prevent a further push above the late-March highs in the $116s. Elsewhere and perhaps also contributing to some of the recent profit-taking that has seen WTI pullback towards $110, there were some reports that the US is planning a relaxation of some of the sanctions on Venezuela. Reportedly, the US might even allow US oil giant Chevron to negotiate oil licenses with Venezuela’s national oil producer PDVSA.
Downside in global equities may well see WTI pullback below $110, but traders should remember that WTI has been consistently supported by dip-buying in recent weeks. As long as China continues to head towards a more open economy, the EU heads towards a Russian oil ban, Russian output continues to shrink and the rest of OPEC+ continues to struggle lifting output (as a survey on Tuesday revealed remained the case in April), dips into the $100s will remain attractive.
- NZD/USD is under pressure and back below 0.6350 as global equities move lower as traders digest hawkish Fed rhetoric.
- Amid a lack of important economic events for the rest of the week, broader risk appetite will drive price action.
Downside in global equity markets as traders digest Fed Chair Jerome Powell’s hawkish comments on Tuesday is weighing on the risk-sensitive kiwi on Wednesday and NZD/USD has turned lower as a result. The pair was last trading just below the 0.6350 mark, down about 0.2% on the day, having failed for a second successive session to push above last Wednesday’s highs around the 0.6380 mark.
A quiet economic calendar for the rest of the week that sees the release of a few tier two US data points, New Zealand Q1 Producer Price Inflation plus the release of the New Zealand annual budget (both on Thursday) means that NZD/USD is likely to continue taking its queue from risk sentiment. Concerns about hawkish central banks at a time when global growth expectations are being revised lower suggests risk assets are unlikely to turn substantially higher before the week is out.
From a technical standpoint, NZD/USD looks very much to still locked within the negative trend that has been in play since early April. Since then, the pair has posted a series of lower lows followed by lower highs. Short-term speculators might thus be shorting the pair at current levels in the hope it will drop back to test last week’s lows just above 0.6200. A break below here opens the door to a run towards the psychologically important 0.6000 mark.
Swiss National Bank (SNB) Chairman Thomas Jordan said on Wednesday that the Swiss franc is a safe haven, and that negative interest rate policy (NIRP) and currency interventions remain necessary for the SNB to meet its mandate on inflation. Jordan added that the SNB is ready to intervene in the currency markets when necessary and that the SNB also takes into account the higher inflation rates abroad when setting policy.
Jordan noted that the inflation rate in Switzerland will temporarily rise about the 2.0% target, but will reduce quickly, though the central bank remains ready to act if inflation strengthens. The SNB is not a hostage to other central banks, Jordan noted, stating that the bank leads its own independent monetary policy.
- USD/TRY navigates in new 2022 highs near 16.00.
- The bid bias in the dollar weighs on the EM FX space.
- Turkey’s Consumer Confidence is due on Friday.
The Turkish lira loses further ground and helps USD/TRY to clinch new YTD peaks in the area just below the 16.00 mark on Wednesday.
USD/TRY up on dollar gains
USD/TRY advances for the tenth consecutive session so far, a performance last seen back in early November 2021, when the pair posted gains from November 9 to November 23.
The resurgence of buying interest in the greenback coupled with the impasse in the risk-relief rally and geopolitical tensions continue to keep the lira under heavy pressure and bolster at the same time the relentless leg higher in the pair.
What to look for around TRY
USD/TRY keeps the upside well and sound for yet another session and seems to have shifted its focus to the 16.00 mark for the time being. So far, price action in the Turkish currency is expected to gyrate around the performance of energy prices, the broad risk appetite trends, the Fed’s rate path and the developments from the war in Ukraine. Extra risks facing TRY also come from the domestic backyard, as inflation gives no signs of abating, real interest rates remain entrenched in negative figures and the political pressure to keep the CBRT biased towards low interest rates remain omnipresent.
Key events in Turkey this week: Consumer Confidence (Friday).
Eminent issues on the back boiler: FX intervention by the CBRT. Progress (or lack of it) of the government’s new scheme oriented to support the lira via protected time deposits. Constant government pressure on the CBRT vs. bank’s credibility/independence. Bouts of geopolitical concerns. Structural reforms. Upcoming Presidential/Parliamentary elections.
USD/TRY key levels
So far, the pair is gaining 0.57% at 15.9673 and faces the next hurdle at 15.9750 (2022 high May 18) seconded by 18.2582 (all-time high December 20) and then 19.00 (round level). On the other hand, a drop below 14.6836 (monthly low May 4) would expose 14.5458 (monthly low April 12) and finally 14.5136 (weekly low March 29).
Australia is set to report its April employment figures on Thursday, May 19 at 01:30 GMT and as we get closer to the release time, here are forecasts from economists and researchers at six major banks regarding the upcoming employment data.
Australia is expected to have added 30K positions in the month, while the unemployment rate is foreseen down to 3.9% from the current 4%.
ANZ
“A move in unemployment below 4% is likely after the March data just rounded up to 4%. This will underscore how tight the labour market is, supporting our expectation that the acceleration in wages growth is really only just underway. And once higher wages growth is established, it typically takes a lot of rate hikes to bring it back down. This sets the backdrop for our continued expectation that a cash rate of 3%+ will ultimately be required.”
Westpac
“Our current forecast for employment in the April Labour Force Survey is +32K which we estimate to be a 0.3% rise in original (not seasonally adjusted) terms. We see the unemployment rate rounding down to 3.9%.”
TDS
“After the disruption from the floods, we think the April employment report is going to be robust (40K), which should reinforce our call for a 40bps hike at the June meeting.”
ING
“April unemployment in Australia is on track to reach its lowest-ever rate of 3.9%, as the number of unemployed people in the labour force is expected to dip slightly for a third consecutive month, while higher wages should also help deliver a mild uptick in total employment. This tightness in the labour market, coupled with comments from the Reserve Bank of Australia that their regional surveys are reporting higher wages growth, leads us to expect the wage price index growth rate for 1Q22 to come in close to 3% – in line with the RBA’s previous benchmark required for ‘sustained’ inflation. And that could set us up for another rate hike as soon as June.”
SocGen
“We expect the pace of increase in employment will pick up again in April, from 1.6% to 3.2% in terms of annualized growth, suggesting continued strength in the labour market recovery. We expect the unemployment rate to fall to a record-low level of below 4.0%, and we see the participation rate rising a little to reach a new record-high level, both of which would offer further proof of the extraordinary tightness of the current labour market conditions. Monthly hours worked would also rebound from the flood-driven dip in March.”
Citibank
“Australia April Labor Force Survey: Citi employment forecast; 38KK, Citi unemployment rate forecast; 3.9%, Previous; 4.0%, Citi participation rate forecast; 66.5%, Previous; 66.4%. The risk to the forecast is for a lower unemployment rate, possibly higher employment growth, and a lower participation rate than forecast. Overall, we expect this will put further pressure on the RBA to persist with its tightening cycle.”
- Silver lacked any firm directional bias and seesawed between tepid gains/minor losses.
- The technical set-up favours bearish traders and supports prospects for further downside.
- Sustained move beyond the $22.00 mark is needed to negate the near-term negative bias.
Silver struggled to gain any meaningful traction and oscillated in a narrow trading band for the second successive day on Wednesday. The XAG/USD was last seen trading around the $21.55-$21.60 region, down nearly 0.10% during the early North American session.
From a technical perspective, the recent bounce from the lowest level since July 2020 faltered near the 50% Fibonacci retracement level of the $23.24-$20.46 downfall. The subsequent slide confirmed a bearish break through the lower end of an ascending trend channel.
Given the recent slump, the aforementioned trend channel constitutes the formation of a bearish flag pattern. Moreover, oscillators on the daily chart are still holding deep in the negative territory, supporting prospects for a further near-term depreciating move.
That said, the lack of follow-through selling below the 38.2% Fibo. level warrants caution for bearish traders. Nevertheless, the XAG/USD still seems vulnerable to weakening further towards the 23.6% Fibo. level, around the $21.15 region, en-route the $21.00 mark.
On the flip side, any meaningful recovery now seems to confront stiff resistance and meet with a fresh supply near the $21.85 region, or the 50% Fibo. level. That said, some follow-through buying beyond the $22.00 mark trigger a fresh bout of a short-covering rally.
The XAG/USD might then surpass the 61.8% Fibo. level, around the $22.20 region and accelerate the momentum to the next relevant hurdle near the $22.55 area.
Silver 1-hour chart
-637884790306660654.png)
Key levels to watch
- USD/CAD has bounced from 1.2800 level to consolidate around 21DMA near 1.2830 amid broadly downbeat sentiment and crude price weakness.
- The pair only got a very short-lived boost from hotter than forecast Canadian CPI figures for April.
Hotter than anticipated headline and core Canadian Consumer Price Inflation figures for April that strongly support the case for rapid BoC tightening in the coming quarters have failed to give the loonie a lasting lift. In wake of the data, which was released at 1330BST, USD/CAD dipped towards but was unable to test the 1.2800 level and has since reversed higher into the 1.2830s, where it trades with gains on the day of about 0.2%.
A pullback in crude oil prices and downside across the global equity space as macro sentiment takes a turn for the worse is the major culprit weighing on the loonie intra-day and benefitting the safe-haven US dollar. There might also be some profit-taking in play, with USD/CAD has fallen about 1.8% in just the last three sessions alone after printing its highest levels since November 2020 last week near 1.3100.
The economic calendar is quiet for the rest of the week aside from a few tier two US data releases (like the May Philadelphia Fed manufacturing survey on Thursday). That suggests broader risk appetite and price action in crude oil markets will remain the driving forces of USD/CAD. The pair, for now, seems content to consolidate around its 21-Day Moving Average in the 1.2830 area and, if it is to break lower towards the next area of support around 1.2700, there is probably going to need to be a sustained bounce in risk appetite and crude prices.
In wake of Fed Chair Jerome Powell’s hawkish remarks on Tuesday, fears about aggressive Fed tightening at a time when global economic growth is quickly slowing may prevent any such rebound in global sentiment. As a recap, the main message from the Fed Chair (and other Fed policymakers who have spoken this week) was that the central bank remains hyper-focused on tackling sky-high inflation and will not hesitate to move rates above so-called neutral (i.e. the 2.5% area) if required.
Economist at UOB Group Ho Woei Chen, CFA, reviews the latest results from the Chinese docket.
Key Takeaways
“China’s Apr macroeconomic data weakened sharply as the COVID-19 containment measures in Shanghai were prolonged which had a wider-than-expected impact on the whole country.”
“The data came in below Bloomberg’s consensus forecasts, with industrial production, retail sales and property fixed asset investment contracting in Apr while the 31 major cities surveyed jobless rate surged to a fresh record high of 6.7% from previous peak of 6.0% in the preceding month and far exceeding the 5.9% rate recorded in May 2020 when China had its first pandemic outbreak in Wuhan.”
“Despite the slump in the economic data, including a sharp slowdown in new loans in Apr, the PBoC had maintained its 1Y MLF rate unchanged at 2.85% on Mon (16 May) and conducted CNY100 bn that matured in Apr without injecting additional liquidity. With the slew of measures including the easing in mortgage loan interest rates for first time homebuyers and guiding banks to lower their deposit rates, the benchmark LPR could still be set lower this Fri (20 May) at the monthly fixing.”
“Given the magnitude of decline in economic activities in Apr, we would expect some recovery in May as Shanghai is preparing to ease its lockdown measures. However, the extent of rebound may disappoint if normal economic operations do not resume fast enough. For now, we are retaining our full-year GDP forecast for China at 4.9% for 2022.”
Canadian CPI delivers another upside surprise in April. CAD was largely neutral following a stronger print on the underlying measures. As economists at TD Securities think nascent stability in risk is likely temporary, USD/CAD dips are expected to be short-lived.
Canadian inflation still running hot in April
“Headline CPI surprised to the upside again with a 0.6% MoM print, pushing inflation to a new high of 6.8% YoY. Strength was broad-based with a larger contribution from services (+0.9%), while core inflation surged to 4.2% YoY on average.
“The sharp increase to core inflation measures makes for a very strong report, although we do not see any major implications for the BoC's near-term outlook. Today's report is unlikely to tip the scales toward a 75bp hike, and we continue to look for 50bp moves in June/July.”
“USD/CAD might have some grace period here as we think the market is a bit exhausted from incessant selling of risk. But, a feeling persists that we may not be out of the woods yet and that still opens the risk that USD/CAD dips are temporary. 1.27/28 offer appreciable support for USD/CAD.”
- Reviving safe-haven demand benefitted the JPY and exerted pressure on USD/JPY.
- Modest USD strength, the Fed-BoJ policy divergence should help limit the downside.
- Sustained move beyond a descending trend line is needed to confirm the bullish bias.
The USD/JPY pair witnessed some selling during the early North American session and dropped to a fresh daily low, below the 129.00 round-figure mark in the last hour.
Concerns about slowing global economic growth continued weighing on investors' sentiment, which was evident from a fresh leg down in the equity markets. This, in turn, drove haven flows towards the Japanese yen and exerted some downward pressure on the USD/JPY pair.
From a technical perspective, spot prices, so far, have been struggling to find acceptance above the 100-period SMA on the 4-hour chart. Apart from this, the overnight failure near a two-week-old descending trend-line was seen as a key trigger for bearish traders.
The downside, however, seems cushioned amid modest US dollar strength, bolstered by some follow-through uptick in the US Treasury bond yields. This, along with the Fed-BoJ policy divergence, supports prospects for the emergence of some dip-buying around the USD/JPY pair.
Hence, any subsequent slide is more likely to find decent support near the 128.40 region, marking the 23.6% Fibonacci retracement level of the 131.35-127.52 recent corrective slide. Some follow-through selling would make the USD/JPY pair vulnerable to breaking below the 128.00 mark.
The downward trajectory could further get extended back towards testing last week's swing low, around the mid-127.00s. Failure to defend the latter should pave the way for a further near-term depreciation and drag spot prices to the next relevant support, around the 127.10-127.00 zone.
On the flip side, the 129.00 mark, or the 38.2% Fibo. now seems to cap the immediate upside ahead of the 129.35-129.40 region (50% Fibo. level). This is followed by the descending trend-line, near the 129.60 region and the overnight swing high, near the 129.80 area.
The latter coincides with the 61.8% Fibo. level, which if cleared decisively will negate any near-term negative bias. Some follow-through buying beyond the 130.00 psychological mark will reaffirm the bullish outlook and lift the USD/JPY pair to the 130.45-130.50 supply zone.
USD/JPY 4-hour chart
-637884774776585962.png)
Key levels to watch
Gold failed to hold the bull-market trendline near $1,830. Strategists at TD Securities see further downside potential for the yellow metal.
Fed Chair Powell offered no respite to the market
“Powell voiced a willingness to take rates beyond neutral in an effort to tame inflation, while sounding tone-deaf regarding economic worries given data is still robust for the most part.”
“With downside momentum firming among the precious metals complex, and broad macro liquidations also weighing, we continue to see further downside potential for gold.”
“ETF holdings have fallen for a ninth straight day while positioning analytics still argue for the potential of additional pain for gold bugs.”
When asked about the dollar strength, US Treasury Secretary Janet Yellen said that they were committed to market-determined exchange rates, as reported by Reuters. "Tighter US monetary policy and risk aversion are factors favoring the dollar strength," Yellen added.
Additional takeaways
"Russian central bank assets are substantial, US and others have blocked about $300 billion."
"It would not be legal now in the US for the government to seize those assets."
"There really are a number of issues, conversations are just starting on reconstruction financing."
"Inflation is a concern in the US and many other parts of the world."
"We understood that we could not shield ourselves entirely from the economic consequences of Russian sanctions."
"EU timeline for ending Russian oil imports gives ample time to ensure it is done in an orderly way."
"Shutting off oil and gas revenues for Russia, we would like to do what we could to diminish those."
Market reaction
The US Dollar Index showed no immediate reaction to these comments and was last seen rising 0.23% on a daily basis at 103.53.
- EUR/USD meets some sellers in the 1.0560 zone.
- Extra recovery should target the monthly top at 1.0641.
EUR/USD surrenders part of the recent advance after hitting new weekly peaks in the 1.0560/65 band on Wednesday.
Considering the pair’s ongoing price action, the continuation of the rebound appears likely in the very near term at least. Against that, the next hurdle emerges at the May high at 1.0641 (May 5) prior to the temporary 55-day SMA, today at 1.0809.
Below the 3-month line near 1.0880, the pair is expected to remain under pressure and vulnerable to extra losses.
EUR/USD daily chart
- A combination of factors prompted aggressive selling around GBP/USD on Wednesday.
- A goodish pickup in the USD demand was seen as a key factor behind the initial leg down.
- The UK CPI report fueled stagflation fears and weighed on the GBP amid fresh Brexit woes.
The GBP/USD pair trimmed a part of its heavy intraday losses and was last seen trading near the 1.2420 region, still down over 0.50% for the day during the early North American session.
The pair struggled to capitalize on its recent strong rebound from a two-year low touched last week and faced rejection near the 1.2500 psychological mark on Wednesday. The early downtick was sponsored by the emergence of some US dollar dip-buying, bolstered by expectations for a more aggressive policy tightening by the US central bank.
In fact, the markets seem convinced that the Fed would need to take more drastic action over the next few meetings to bring inflation under control. The bets were reaffirmed by Fed Chair Jerome Powell's hawkish comments on Tuesday, saying that he will back interest rate increases until prices start falling back toward a healthy level.
Investors also remain worried that the Russia-Ukraine war, along with the latest COVID-19 lockdowns in China, would result in tight global supply chains and push consumer prices even high. This, in turn,
lifted the yield on the benchmark 10-year US government bond back closer to the 3.0% threshold, which helped the USD to regain positive traction.
The USD maintained its bid tone following the release of the US housing market data. Housing Starts in the US fell 0.2% in April to 1.724M, below the 1.728M in the previous month and expectations for a rise to 1.765M. Meanwhile, Building Permits fell 3.2% to 1.819M in April from the 1.879M previous, though was better than a fall to 1.812 million expected.
On the other hand, the British pound was pressured by fears of stagflation and the UK-EU impasse over the Northern Ireland protocol. Given that the UK economic activity had slowed sharply during the first quarter, the latest consumer inflation figures reaffirmed the Bank of England's gloomy outlook and weighed heavily on sterling.
On the Brexit front, the UK government on Tuesday announced a bill that would effectively override parts of a Brexit deal. The European Commission had pledged to respond with all measures at its disposal if Britain moves ahead with a plan to rewrite the NI protocol. Investors now fear that the legislation could trigger a trade war and take its toll on the UK economy.
Despite the negative factors, spot prices showed resilience below the 1.2400 round figure and found a decent support near the 1.2370 region. This warrants some caution before confirming that the recent bounce from the 1.2155 region, or the lowest level since May 2020 touched last week has run its course and placing aggressive bearish bets around the GBP/USD pair.
Technical levels to watch
- Gold is trading with a negative bias on Wednesday after failing to get above its 200DMA on Tuesday.
- XAU/USD is currently in the $1810s and eyeing last week’s lows amid a buoyant buck and rising global yields.
A pick up in the US dollar as global markets adopt a slightly more risk-off tone and a Eurozone led rise in global yields is exerting pressure on spot gold (XAU/USD) prices, which recently fell back to probe the $1810 per troy ounce mark. Hawkish remarks from Fed policymakers this week (including Chairman Jerome Powell on Tuesday) have emphasised the Fed’s commitment to inflation-fighting even in the face of weaker economic growth, while the ECB policymakers have been talking up the prospect of a summer start to rate hikes and this combo is weighing on stocks/pushing up global yields.
Higher yields raise the opportunity cost of holding non-yielding commodities like precious metals, hence the negative correlation to gold. Meanwhile, a stronger US dollar makes USD-denominated commodities like XAU/USD more expensive for international buyers, also weighing on demand. Against the backdrop of a well-supported US dollar and hawkish central bank-inspired upside in global yields, many gold bears will be eyeing a test of last week's lows in the mid-$1780s. Technicians noted that Tuesday’s test and rejection of the 200-Day Moving Average in the $1830s could prove an important bearish sign going forward. For now, the precious metal is stabilising in the mid $1810s, ever so slightly in the red on the day.
Enrico Tanuwidjaja, Economist at UOB Group, comments on the recently published trade balance figures in Indonesia.
Key Takeaways
“Indonesia’s trade surplus hit all-time high in April 2022 to reach USD7.5bn vs. USD4.5bn in March 2022.”
“Mineral fuels and oils were leading the gains in overall exports’ strong surge last month, but amidst the CPO export ban on 28 Apr, we may see this sector’s shipments significantly lowered in May.”
“Indonesia’s total imports were weaker than expected, indicating that the recovery in domestic demand is not as strong as initially expected, and supporting our GDP growth forecast downgrade.”
- Housing Starts and Building Permits both fell in April.
- The US dollar did not see a lasting reaction to the data.
Housing Starts in the US fell 0.2% in April to 1.724M, below last month's 1.728M and expectations for a rise to 1.765M. Building Permits, meanwhile, fell from 1.879M in March to 1.819M in April, a drop of 3.2%. That was above the expected drop to 1.812M.
Market Reaction
The DXY did not react to the latest US housing figures and continues to trade in the mid-103.00s, below earlier session highs in the 103.75 area.
- Annual CPI was a little hotter than expected in Canada in April.
- The loonie saw some kneejerk strength but has since pulled back.
The pace of annual inflation in Canada according to the Consumer Price Index (CPI) rose to 6.8% in April, data released by Statistics Canada on Wednesday showed. That was slightly above expectations for a YoY rate of CPI to come in unchanged from March at 6.7% in April. MoM, prices rose at a pace of 0.6% according to the CPI, above the expected rise of 0.5% and down from last month's 1.4% gain.
In terms of the Core CPI, the YoY rate was hotter than the expected 5.4% at 5.7%, a surprise rise from March's 5.5% annual rate. Prices were up 0.7% MoM, above the expected rise of 0.4% but down from March's 1.0% gain.
Market Reaction
The loonie saw some kneejerk strength as a result of the hotter than forecast inflation numbers, but USD/CAD has since pulled higher to its pre-data levels in the 1.2815 area.
USD/CAD has broken the 13-day moving average (DMA) at 1.2868. Nevertheless, economists at Credit Suisse remain biased higher over the medium-term.
Decline viewed as a temporary correction only
“We expect this decline to be only a temporary weakness, leading us to remain with our broader positive view whilst above the 55-DMA average at 1.2701 and to anticipate an eventual turn back higher toward the recent high at 1.3076.”
“Resistance is seen at 1.2858 initially, next at 1.2932 and then at 1.2973/81. Above here would open the door to reach the recent high at 1.3076, with a break above here needed to reinforce the medium-term turn higher.”
GBP/USD looks likely to see a corrective recovery, in the opinion of economists at Credit Suisse. Key resistance is seen at 1.2533/43, then 1.2633/39.
Broader outlook stays bearish
“GBP/USD has rallied sharply after holding the 1.2157 low of last week and although our broader outlook stays seen negative, with daily MACD momentum having turned higher, we look for a corrective recovery/consolidation phase to now emerge.”
“We see resistance initially at 1.2518, then the 23.6% retracement of the 2022 fall at 1.2533/43. Whilst we would expect a cap here at first, above in due course would be seen to open the door to a test of the May high at 1.2633/39.”
“Support is seen at 1.2407/01 initially, with 1.2320/16 needing to hold to maintain an immediate upside bias. A break would suggest we are more likely to see a low level consolidation phase instead, with support seen next at 1.2218 and more importantly at 1.2167/57.”
EUR/USD has declined to test and successfully hold key support from the 1.0341 low of 2017. In the view of economists at Credit Suisse, a corrective recovery is likely.
Key resistance is seen at 1.0620/42
“With the market having closed above its 13-day exponential average and with daily MACD momentum holding a bullish divergence and having turned higher, we look for a recovery/consolidation phase to emerge.”
“Near-term resistance is seen at 1.0593/99, ahead of what we see as a more important test at the 23.6% retracement of the fall from February, accelerated downtrend and May high at 1.0620/42. Above here is needed to suggest a near-term base has been completed to provide the platform for a deeper recovery to the 38.2% retracement and mid-April lows at 1.0758/87. We expect a much tougher barrier here if tested.”
“Support is seen at 1.04825 initially, with 1.0432/28 needing to hold to maintain an immediate upside bias. A break can clear the way for a retest of 1.0350/41.”
- A goodish pickup in the USD demand assisted USD/CHF to regain positive traction on Wednesday.
- Aggressive Fed rate hike bets, rising US bond yields acted as a tailwind for the buck and the pair.
- A weaker risk tone underpinned the safe-haven CHF and kept a lid on any meaningful upside.
The USD/CHF pair attracted fresh buying on Wednesday and reversed a major part of the overnight slide to a four-day low. The pair maintained its bid tone heading into the North American session and was last seen trading around the 0.9970-0.9965 region, just a few pips below the daily high.
Fed Chair Jerome Powell struck a more hawkish tone on Tuesday and reaffirmed market bets for a more aggressive policy tightening by the Fed. Speaking at a Wall Street Journal event, Powell reiterated that he will back interest rate increases until prices start falling back toward a healthy level. This, in turn, pushed the yield on the benchmark 10-year US government bond closer to the 3.0% threshold, which helped revive the US dollar demand and assisted the USD/CHF pair to regain positive traction.
That said, a fresh leg down in the equity markets drove some haven flows towards the Swiss franc and held back bulls from placing aggressive bets. Concerns that the Russia-Ukraine war and the latest COVID-19 lockdowns in China would hit the global economic growth continued weighing on investors' sentiment. This makes it prudent to wait for strong follow-through buying before confirming that the recent pullback from a two-year high has run its course and placing fresh bullish bets.
Next on tap is the US housing market data - Building Permits and Housing Starts. Apart from this, the US bond yields will influence the USD price dynamics and provide some impetus to the USD/CHF pair. Traders will further take cues from the broader market risk sentiment to grab short-term opportunities.
Technical levels to watch
- EUR/USD has pulled back from an earlier test of its 21DMA in the upper-1.0500s and is pivoting the big figure.
- ECB and Fed speak have both been in focus recently, with both sounding more hawkish.
EUR/USD has pared some of Tuesday’s outsized gains, despite more rhetoric from ECB policymakers supporting the notion of a summer start to the upcoming rate hiking cycle on Wednesday. The pair has fallen back from earlier session highs in the 1.0560s where it tested its 21-Day Moving Average at around 1.0570 to pivot either side of the 1.0500 level, with final Eurozone Consumer Price Inflation figures for April seeing modest negative revision (though still remained at elevated levels).
At current levels just above the 1.0500 figure, the pair is trading about 0.4% lower on the day, with weakness likely also reflecting the hawkish tone of Fed Chair Jerome Powell on Tuesday and from other FOMC policymakers in recent days. To recap, the main message from the Fed Chair was that the central bank remains hyper-focused on tackling sky-high inflation and will not hesitate to move rates above so-called neutral (i.e. the 2.5% area) if required.
For now though, with Eurozone yields rallying on recent ECB hawkishness (recall Klass Knot flouting the possibility of a 50 bps rate hike in July on Tuesday) to a greater degree than US yields, rate differentials seem likely to keep the pair support in the 1.0500 area. Recent strong US data (Retail Sales on Tuesday beat expectations) coupled with positive China developments (big tech crackdown and Shanghai lockdown easing) is keeping risk appetite relatively well supported versus last week.
This is another factor helping to keep EUR/USD in the 1.0500s. But as was the case back in April, the 21DMA is likely to prove a formidable level of resistance. There is still plenty of worries about the Eurozone's economic outlook amid the fall-out of the war in Ukraine and the impact of sanctions on Russia. Looking ahead, there isn’t much of note on Wednesday’s calendar aside from some US housing data, so consolidation near 1.0500 may be the most likely outcome.
Canada CPI Overview
Statistics Canada will release the latest consumer inflation figures for April later during the early North American session on Wednesday, at 13:30 GMT. The headline CPI is expected to rise 0.5% during the reported month against the 1.4% increase reported in March. The yearly rate is anticipated to hold steady at 6.7%in April, marking the fastest pace since January 1991. More importantly, the Bank of Canada's Core CPI, which excludes volatile food and energy prices, is estimated to rise 0.4% MoM in April and ease to 5.4% on yearly basis from the 5.5% previous.
How Could it Affect USD/CAD?
Ahead of the key release, the emergence of some US dollar dip-buying assisted the USD/CAD pair to stage a goodish intraday bounce from sub-1.2800 levels, or a two-week low touched earlier this Wednesday. A softer reading should allow spot prices to build on the intraday positive move, through an uptick in crude oil prices could underpin the commodity-linked loonie and cap the upside.
Conversely, a surprisingly stronger Canadian CPI print would lift bets for more rate increases by the Bank of Canada and boost the domestic currency. This, in turn, suggests that the path of least resistance for the USD/CAD pair is to the downside and the attempted recovery move runs the risk of fizzling out rather quickly.
From a technical perspective, any subsequent strength is likely to meet with a fresh supply near the 1.2900 mark. This, in turn, should keep a lid on any further gains near the 1.2930 resistance zone. That said, sustained strength beyond will suggest that the corrective pullback has run its course and shift the bias back in favour of bullish traders. The USD/CAD pair could then climb back to reclaim the 1.3000 psychological mark.
On the flip side, the 1.2800 round figure now seems to protect the immediate downside, below which the USD/CAD pair could slide to the 1.2765 region. Some follow-through selling should pave the way for additional losses and drag spot prices further towards the 1.2700 mark. The latter should act as a pivotal point and help determine the next leg of a directional move for the major.
Key Notes
• USD/CAD to fall back towards the low 1.27 zone on higher than expected Canadian CPI – Scotiabank
• USD/CAD Outlook: Bulls show some resilience below 1.2800 mark ahead of Canadian CPI
• USD/CAD recovers further from two-week low, climbs to mid-1.2800s ahead of Canadian CPI
About Canadian CPI
The Consumer Price Index (CPI) released by Statistics Canada is a measure of price movements by the comparison between the retail prices of a representative shopping basket of goods and services. The purchasing power of CAD is dragged down by inflation. The Bank of Canada aims at an inflation range (1%-3%). Generally speaking, a high reading is seen as anticipatory of a rate hike and is positive (or bullish) for the CAD.
Chinese Premier Li Keqiang said on Wednesday that downward pressure on the economy is increasing, but there is still policy room to cope with challenges, reported Reuters citing China state media. China will ensure that economic operations in the first half of the year and the whole year will remain within a reasonable range, he added.
China will take effective measures to boost the confidence of private firms, and will support domestic and overseas listings of platform and digital companies, he added.
His remarks come one day after Chinese Vice Premier Lui He said that China will support the healthy development of the platform economy.
- DXY meets buying interest around the 103.20 area midweek.
- Further downside could see the 102.30 region revisited.
DXY regains the smile following three consecutive daily pullbacks.
Despite the ongoing bounce, further retracements remain well on the cards and could now target the next support at 102.35 (May 5 low), where decent contention is expected to emerge.
Looking at the broader picture, the current bullish stance in the index remains supported by the 3-month line around 100.00, while the longer-term outlook for the dollar is seen constructive while above the 200-day SMA at 96.44.
DXY daily chart
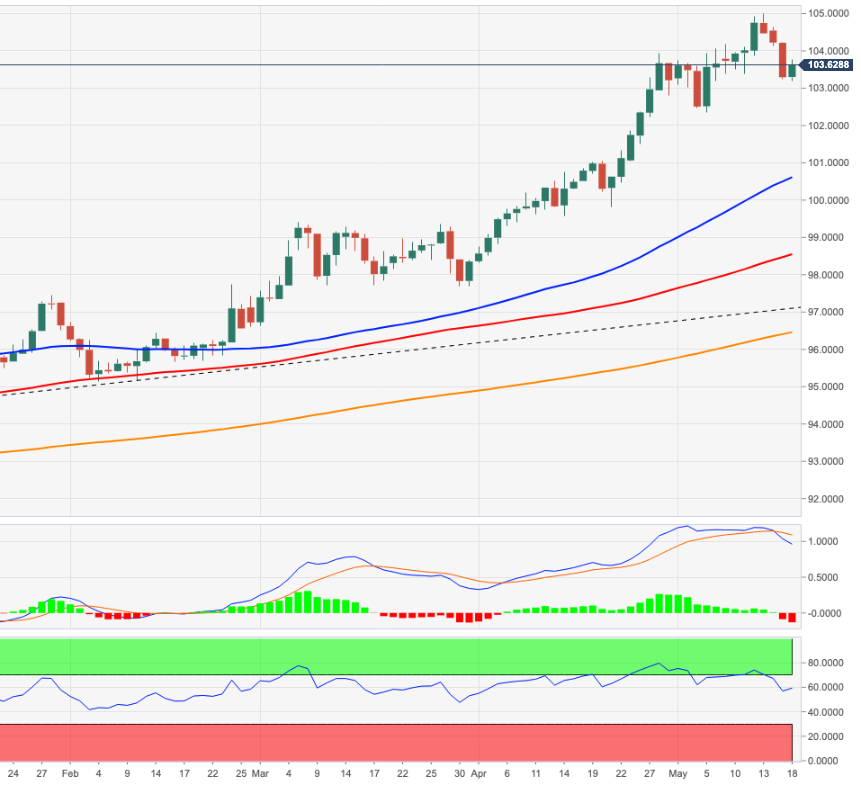
European Central Bank (ECB) policymaker Madis Muller said on Wednesday that he was in favour of a 25 basis points rate hike in July.
Muller further noted that he would not be surprised if rates raised past zero in 2022.
Earlier in the day, "it seems necessary that in our policy rates we move relatively quickly out of negative territory and continue our gradual process of monetary policy normalisation," ECB policymaker Olli Rehn told a seminar in Helsinki.
Market reaction
EUR/USD stays under modest bearish pressure in the European session and was last seen losing 0.27% on the day at 1.0518.
- AUD/USD lacked any firm direction and witnessed good two-way price moves on Wednesday.
- Aggressive Fed rate hike bets, a weaker risk tone underpinned the USD and acted as a headwind.
- Tuesday’s hawkish RBA meeting minutes extended support to the aussie and helped limit losses.
The AUD/USD pair seesawed between tepid gains/minor losses through the mid-European session and now seems to have stabilized in neutral territory, around the 0.7020 region.
Following an early uptick to a one-week high, the AUD/USD pair witnessed modest intraday pullback from the vicinity of mid-0.7000s on Wednesday amid the emergence of some US dollar dip-buying. Fed Chair Jerome Powell struck a more hawkish tone on Tuesday and said that he will back interest rate increases until prices start falling back toward a healthy level. The comments reaffirmed market bets for a more aggressive policy tightening by the Fed and assisted the USD to stall its recent sharp decline from a two-decade high.
Investors also remain worried that the Russia-Ukraine war and the latest COVID-19 lockdowns in China would hit the global economic growth. This was evident from a generally weaker tone around the equity markets, which further benefitted the safe-haven greenback and drove flows away from the perceived riskier aussie. Meanwhile, the Reserve Bank of Australia, in the minutes of its last meeting, signalled that a bigger interest rate hike is still possible in June, which, in turn, helped limit the losses for the AUD/USD pair.
Spot prices showed some resilience below the 0.7000 psychological mark. This, in turn, warrants some caution for bearish traders and before positioning for the resumption of the recent downfall witnessed
over the past one month or so. Market participants now look forward to the US housing market data - Building Permits and Housing Starts. This, along with the US bond yields and the broader market risk sentiment, will influence the USD price dynamics and allow traders to grab short-term opportunities around the AUD/USD pair.
Technical levels to watch
UOB Group’s Senior Economist Julia Goh and Economist Loke Siew Ting assess the latest GDP releases in the Malaysian economy.
Key Takeaways
“Real GDP strengthened to 5.0% y/y in 1Q22 (4Q21: +3.6%), much higher than our estimate (4.5%) and Bloomberg market consensus (4.0%). On a seasonally adjusted quarter-on-quarter basis, real GDP rose by 3.9% (4Q21: +4.6% q/q).”
“Growth was driven by expansion in services (+6.5%), manufacturing (+6.6%), and agriculture (+0.2%), cushioning the persistent weakness in construction (-6.2%) and mining (-1.1%) sectors. Domestic demand rebounded by 4.4%, led by stronger private consumption (+5.5%), an uptick in private investment (+0.4%), and higher public consumption (+6.7%). Inventory restocking added 2.2pts to overall growth, offsetting a drag from net trade (-1.5ppts).”
“With a strong start to the year and further support from reopening of international borders as well as easing of restrictions, we expect GDP growth to stay robust. Low base effects will also provide a fillip to growth. Key challenges are mainly from the external side such as broader risks related to the Russia-Ukraine crisis, effects of Fed's aggressive tightening path, extended slowdown in China's economy, global supply chain disruptions, elevated inflation pressures, and potential threat of new COVID variants. We keep our full-year growth forecast at 5.5% (2021: 3.1%, official est: 5.3%-6.3%).”
- EUR/JPY comes under some pressure and reverses the recent upside.
- No news on the topside, where the 138.30 region emerges as the next target.
EUR/JPY gives away part of the recent strong advance and revisits the sub-136.00 region on Wednesday.
If the recovery picks extra pace, then the cross could see the downside mitigated on a close above the May peak at 138.31 (May 9). The surpass of the latter should put a potential visit to the 2022 high at 140.00 (April 21) back on the radar.
In the meantime, while above the 200-day SMA at 131.11, the outlook for the cross is expected to remain constructive.
EUR/JPY daily chart
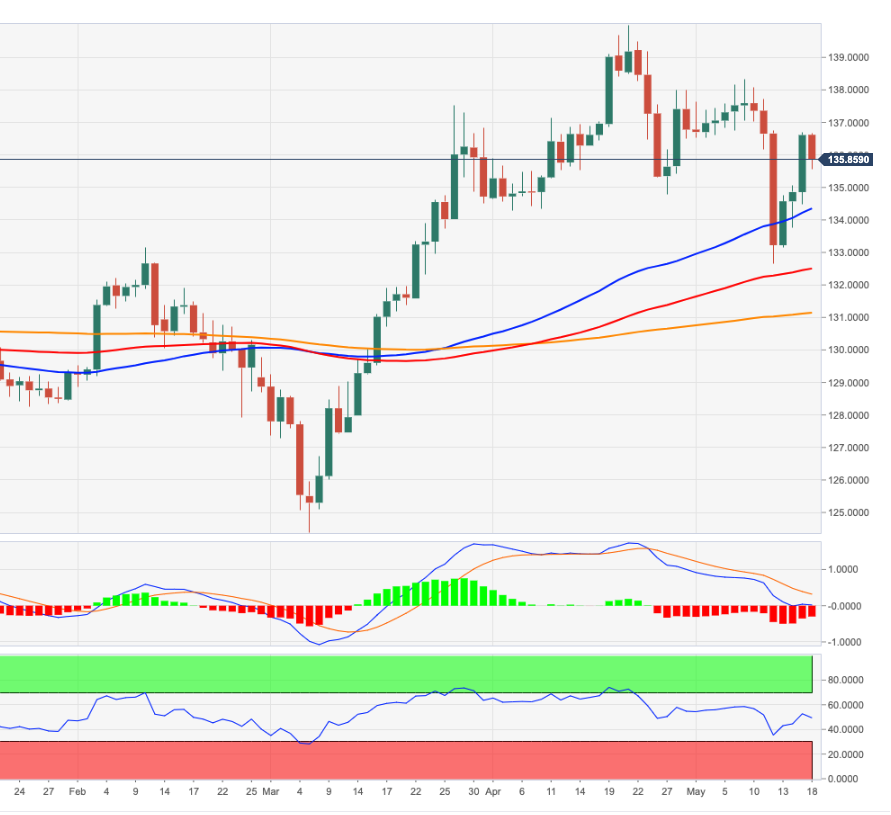
"At a particularly uncertain time, the process of raising interest rates should be gradual," European Central Bank (ECB) Governing Council member and Spanish central bank chief Pablo Hernandez de Cos said on Wednesday, per Reuters.
Additional takeaways
"A gradual withdrawal of extraordinary monetary stimulus is adequate in the current context."
"The end of the bond-buying programme should be finalised early in the third quarter, with the first interest rate hike to follow shortly afterwards."
"Further rate rises could be made in subsequent quarters if medium-term inflation outlook remains around the target."
"The build-up of price pressure in the eurozone in recent months raises the likelihood of second-round effects which have not materialised strongly."
"Signs of shifts to mid-term inflation expectations above target require monitoring."
Market reaction
The EUR/USD pair edged slightly higher following these comments and was last seen trading at 1.0525, losing 0.2% on a daily basis.
Economist at UOB Group Enrico Tanuwidjaja reviews the improvement in the consumer sentiment gauge in Indonesia.
Key Takeaways
“Indonesia’s Consumer Confidence Index increased slightly in Apr to 113.1, up by 2.1pt from March’s 111.0.”
“The Current Economic Condition Index increased slightly to 98.9 in Apr from Mar’s 93.9.”
“Consumer generally remains upbeat on the economy in the next 6 months despite a slight decline in 6-month ahead Index to 127.2 in Apr from 128.1 in Mar.”
The Kremlin said in a statement on Wednesday, “buyers will have to pay more or seek alternative suppliers” responding to the US proposal to levy tariffs on Russian oil.
more to come ...
- Gold Price remains vulnerable as the US dollar rebounds amid a damp mood.
- A retreat in the US Treasury yields helps cushion XAU/USD’s downside.
- The path of least resistance appears down for Gold Price.
Gold Price is fluctuating between gains and losses while above the $1,800 mark, licking its wounds after Tuesday’s rejection from the critical $1,836 hurdle. Gold Price faces headwinds from the resurgent haven demand for the US dollar, as investors fret over the growth and inflation concerns, in the face of the aggressive Fed rate hike expectations. On the other side, the negative shift in the market’s perception of risk has boosted the risk-off flows into the US government bonds, capping the rebound in the Treasury yields across the curve. Retreating yields are offering support to XAU/USD bulls. Looking ahead, in absence of relevant economic data from the US, Gold Price will remain at the mercy of risk sentiment and the dollar dynamics.
Also read: Gold Price Forecast: XAU/USD eyes a retest of multi-month lows below $1,800
Gold Price: Key levels to watch
The Technical Confluences Detector shows that the Gold Price is keeping its range below a dense cluster of powerful resistance stacked up around $1,817. That supply zone is the convergence of the SMA5 four-hour, Fibonacci 23.6% one-week and one-day.
The next stop for bulls is seen at $1,821, where the SMA100 one-hour and SMA10 four-hour converges with the Fibonacci 38.2% one-day.
Further up, gold buyers will have to battle out the SMA5 one-day and Fibonacci 61.8% one-day at $1,825 and $1,828 respectively.
The Fibonacci 38.2% one-week at $1,833 is the level to beat for gold bulls.
On the downside, if the selling bias picks up pace, then the previous day’s low at $1,813 will be taken out.
Gold sellers will then target $1,807 demand area, where the pivot point one-day S1 and the previous low four-hour coincide.
The previous week’s low at $1,799 will then come to the rescue of gold optimists, below which the pivot point one-month S2 at $1,797 will get challenged.
Here is how it looks on the tool
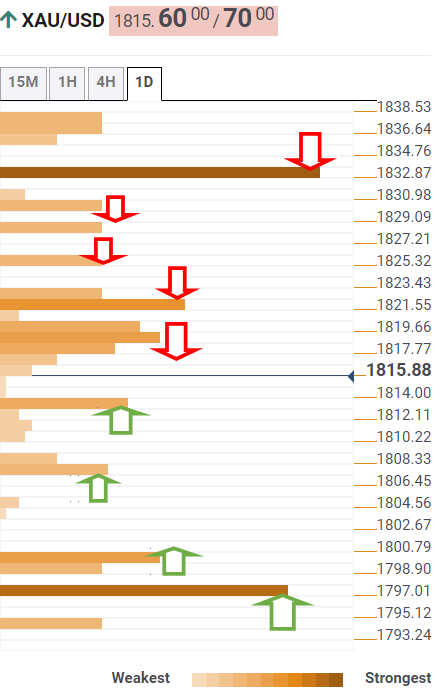
About Technical Confluences Detector
The TCD (Technical Confluences Detector) is a tool to locate and point out those price levels where there is a congestion of indicators, moving averages, Fibonacci levels, Pivot Points, etc. If you are a short-term trader, you will find entry points for counter-trend strategies and hunt a few points at a time. If you are a medium-to-long-term trader, this tool will allow you to know in advance the price levels where a medium-to-long-term trend may stop and rest, where to unwind positions, or where to increase your position size.
In view of FX Strategists at UOB Group Lee Sue Ann and Quek Ser Leang, USD/CNH could now drift lower to, initially, the 6.7000 region in the next weeks.
Key Quotes
24-hour view: “The sharp sell-off in USD that resulted in a loss of 0.81% (close at 6.7413) came as a surprise. We were expecting USD to ‘trade sideways’. The rapid drop appears to be overdone and USD is unlikely to weaken much further. For today, USD is more likely to trade between 6.7220 and 6.7620.”
Next 1-3 weeks: “Yesterday (17 May, spot at 6.4940), we noted that upward momentum is beginning to wane and we were of the view that the risk of a short-term top has increased. USD subsequently cracked our ‘strong support’ at 6.7650 as it sold off sharply to 6.7260. The break of the ‘strong support’ indicates that the month-long USD strength has run its course. We view the current movement as the early stages of a pullback. Support is at 6.7000 followed by 6.6700. Overall, only a break of 6.7950 (‘strong resistance’ level) would indicate that USD is not ready to pullback to 6.7000.”
- USD/CAD staged a goodish rebound from a two-week low touched on Wednesday amid a stronger USD.
- Aggressive Fed rate hike bets, rising US bond yields and recession fears underpinned the greenback.
- An uptick in oil prices failed to benefit the loonie or hinder the move ahead of the Canadian CPI report.
The USD/CAD pair maintained its bid tone through the first half of the European session and was last seen trading near the daily high, around the mid-1.2800s.
Having shown some resilience below the 1.2800 mark, the USD/CAD pair staged a goodish rebound from a near two-week low touched earlier this Wednesday and snapped a three-day losing streak. The uptick was sponsored by the emergence of some US dollar dip-buying and seemed rather unaffected by an uptick in crude oil prices, which tend to underpin the commodity-linked loonie.
Expectations that the Fed would need to take more drastic action to bring inflation under control assisted the USD to stall its recent corrective slide from a two-decade high. The bets were reinforced by Fed Chair Jerome Powell's remarks at a Wall Street Journal event, saying that he will back interest rate increases until prices start falling back toward a healthy level.
The prospects for a more aggressive monetary policy tightening by the Fed pushed the yield on the benchmark 10-year US government bond closer to the 3.0% threshold. This, along with concerns about softening global growth, underpinned the safe-haven buck. Apart from this, some repositioning trade ahead of the Canadian CPI report acted as a tailwind for the USD/CAD pair.
From the US, the housing market data - Building Permits and Housing Starts - might do little to provide any meaningful impetus, leaving the USD at the mercy of the US bond yields and the broader risk sentiment. Traders will further take cues from oil price dynamics to grab short-term opportunities around the USD/CAD pair.
Technical levels to watch
- Eurozone inflation arrives at 7.4% YoY in April, misses estimates.
- Monthly HICP in the bloc rises by 0.6% in April.
- EUR/USD is keeping its range around 1.0500 on the mixed Eurozone data.
Eurozone’s Inflation rose 7.4% in April, on an annualized basis, according to Eurostat’s final reading of the Eurozone Harmonised Index of Consumer Prices (HICP) report for the month.
The reading disappointed expectations of 7.5% while against the 7.5% previous. Core figures rose by 3.5%, matching the 3.5% market estimates and 3.0% last (a downward revision).
The bloc’s HICP rose by 0.6% versus 0.6% expected and 2.4% booked in March while the core HICP numbers also came in at 1.0% versus 1.1% expected and 1.1% seen previously.
Key details (via Eurostat):
“The lowest annual rates were registered in France, Malta (both 5.4%) and Finland (5.8%). The highest annual rates were recorded in Estonia (19.1%), Lithuania (16.6%) and Czechia (13.2%). Compared with March, annual inflation fell in three Member States, remained stable in two and rose in twenty-two.”
In April, the highest contribution to the annual euro area inflation rate came from energy (+3.70 percentage points, pp), followed by services (+1.38 pp), food, alcohol & tobacco (+1.35 pp) and non-energy industrial goods (+1.02 pp).
FX implications:
EUR/USD is off the lows but preserves most of its intraday losses amid a broad-based US dollar rebound.
At the press time, the pair is trading at 1.0510, lower by 0.32% on the day. Hawkish comments from the ECB policymaker Oli Rehn seem to have saved the day for EUR bulls.
European Central Bank (ECB) policymaker Olli Rehn said Wednesday, “it is necessary for rates to move relatively quickly out of the negative territory.”
Additional comments
“Need to continue a gradual process of monetary policy normalization.”
“This is also the indication given by many colleagues within the ECB.”
“Uncertainty related to future price developments has increased.”
“Uncertainty surrounding the ECB's macroeconomic projections is also currently very elevated.”
“ECB’s June GDP growth forecast likely to be closer to the adverse and severe scenario of 2% than the baseline of 3.7%.“
“We must be mindful not to let inflation expectations become unanchored, which would be very damaging to price stability.“
“Acceleration of wage inflation is now the single most critical factor in determining the course of monetary policy.“
“First ECB interest rate hike in over a decade is likely to take place in the summer.”
Market reaction
Despite the hawkish ECB-speak, EUR/USD is testing lows near 1.0505, down 0.40% so far. King dollar regains control across the board amid risk-aversion.
- GBP/USD witnessed aggressive selling on Wednesday and snapped a three-day winning streak.
- The latest UK CPI report fueled stagflation fears and weighed heavily on the British pound.
- The emergence of some USD dip-buying further contributed to the intraday selling bias.
The GBP/USD pair added to its heavy intraday losses and dropped to a fresh daily low, below the 1.2400 mark during the early part of the European session.
Having failed to conquer the 1.2500 psychological mark, the GBP/USD pair witnessed aggressive selling on Wednesday and snapped a three-day winning streak to a two-week high. The British pound weakened across the board after data released from the UK showed that the headline CPI soared to a 40-year high level of 9% in April. Given that the UK economic activity had slowed sharply during the first quarter, the data further fueled stagflation fears. Apart from this, the UK-EU impasse over the Northern Ireland protocol exerted additional downward pressure on sterling.
In the latest developments, the British government on Tuesday announced a bill that would effectively override parts of a Brexit deal. The European Commission had pledged to respond with all measures at its disposal if Britain moves ahead with a plan to rewrite the NI protocol. Investors now fear that the legislation could trigger a trade war in the middle of a surge in the cost of living, which would take its toll on the UK economy and validate the Bank of England's gloomy outlook. This, along with modest US dollar strength, contributed to the GBP/USD pair's slide.
The USD was back in demand and stalled its recent corrective slide from a two-decade high amid firming expectations for a more aggressive policy tightening by the Fed. The markets seem convinced that the US central bank would need to take more drastic action to bring inflation under control. The bets were reinforced by Fed Chair Jerome Powell's remarks at a Wall Street Journal event, saying that he will back interest rate increases until prices start falling back toward a healthy level. Apart from this, a fresh leg down in the equity markets underpinned the safe-haven buck.
With the latest leg down, the GBP/USD pair has eroded a major part of the overnight gains. That said, it will be prudent to wait for strong follow-through selling before confirming that the recent bounce from the 1.2155 region, or the lowest level since May 2020 has run its course and placing aggressive bearish bets.
Technical levels to watch
EUR/USD has reversed its direction following Tuesday's decisive rebound. As FXStreet’s Ere Sengezer notes, sellers could take action if 1.05 support fails.
1.05 aligns as key support level in the near-term
“In case Wall Street's main indexes fall sharply after the opening bell, EUR/USD could stretch its daily slide in the second half of the day.”
“In case EUR/USD starts using the 100-period SMA on the four-hour chart, which is currently located at 1.0520 as resistance, it might test 1.05 (psychological level, Fibonacci 61.8% retracement of the latest decline).”
“A four-hour close below the 1.05 level could be seen as a bearish development and open the door for additional losses toward 1.0480 (Fibonacci 50% retracement) and 1.0450 (Fibonacci 38.2% retracement).”
“On the upside, static resistance seems to have formed at 1.0550. EUR/USD needs to clear that hurdle to target the next static level at 1.0580 and 1.06 (psychological level) afterwards.”
The CAD is showing signs of life after the USD pushed above 1.30 last week to reach its highest point since Nov 2020. A hot Consumer Price Index (CPI) data from Canada could drag the USD/CAD pair down to the 1.27 zone, economists at Scotiabank report.
CAD rebound may extend on High CPI
“Canadian CPI data is perhaps an opportunity for economic data to give the CAD some positive momentum. The market consensus for Canada’s May CPI report is for headline inflation to remain unchanged at 6.7% YoY.
“Our house call is for both the Fed and BoC to raise rates 50bps over their next three policy meetings before moving to 25bps increments. Fed policymakers have rather suggested that 50bps are all but certain to be deployed over the next two meetings only, however. High Canadian inflation data may bolster market expectations that the BoC is more likely to deliver that third 50bps than the Fed.”
“Assuming USD/CAD can hold in the low 1.28s ahead of the CPI release, a higher than consensus expectations report should help push the pair back towards the low 1.27 zone (where short-term technical signals suggest USD/CAD has the potential to reach in the next few days).”
- EUR/USD falters once again around 1.0560 on Wednesday.
- EMU Final CPI for the month of April comes next in the docket.
- The dollar regains upside traction and forces the pair to give away gains.
EUR/USD loses some momentum after hitting fresh highs in the 1.0560/65 band on Wednesday.
EUR/USD trims gains on USD-buying
EUR/USD retreats moderately following three consecutive daily advances, including the breakout of key levels at 1.0400 and 1.0500 and rebounding sharply from last week’s new cycle lows near 1.0350 (May 13).
The daily decline in spot comes in contrast to the continuation of the rebound in the German 10y Bund yields, which trade at shouting distance from the 1.10% level midweek.
The better tone in the demand for the greenback weighs on the pair on Wednesday, particularly following Chair Powell’s interview late on Tuesday, when he once again left the door open to a 50 bps rate hike at the next two meetings.
In the domestic calendar, the final EMU Inflation Rate for the month of April are due later. Across the pond, MBA Mortgage Applications, Building Permits and Housing Starts are all due seconded by the speech by Philly Fed P.Harker (2023 voter, hawk).
What to look for around EUR
EUR/USD’s strong rebound met initial hurdle at the 1.0560 region so far this week. Despite the pair removed some downside pressure, the broader outlook for the single currency remains entrenched in the negative territory for the time being. As usual, price action in spot should reflect dollar dynamics, geopolitical concerns and the Fed-ECB divergence. Occasional pockets of strength in the single currency, in the meantime, should appear reinforced by firmer speculation the ECB could raise rates at some point in the summer, while higher German yields, elevated inflation and a decent pace of the economic recovery in the region are also supportive of an improvement in the mood around the euro.
Key events in the euro area this week: EMU Final Inflation Rate (Wednesday) – ECB Monetary Policy Meeting Accounts (Thursday) – Germany Producer Prices, EMU Flash Consumer Confidence (Friday).
Eminent issues on the back boiler: Speculation of the start of the hiking cycle by the ECB as soon as this summer. Asymmetric economic recovery post-pandemic in the euro area. Impact of the war in Ukraine on the region’s growth prospects.
EUR/USD levels to watch
So far, spot is down 0.25% at 1.0519 and the breach of 1.0348 (2022 low May 13) would target 1.0340 (2017 low January 3 2017) en route to 1.0300 (round level). On the other hand, the initial up barrier comes at 1.0563 (weekly high May 18) seconded by 1.0641 (weekly high May 5) and finally 1.0936 (weekly high April 21).
The US Dollar Index (DXY) closed the previous three days in negative territory and lost more than 1% during that period. Still, Tuesday's remarks by Jay Powell were a reminder of the very hawkish Fed policy. Ultimately, rate and growth differentials should curb the dollar's weakness against most peers, economists at ING report.
Aggressive Fed tightening continues to argue against a sustained bearish dollar trend
“Clearly, the monetary policy story is playing a secondary role in the market narrative at the moment, but yesterday’s comments by Fed Chair Powell were quite relevant from a signalling perspective, as he firmly reiterated the Fed’s determination to bring inflation sustainably lower, even by hiking beyond the neutral rate if necessary.”
“While the dollar momentum is set to remain weak as long as global assets stay in recovery mode, the notion of aggressive Fed tightening continues to argue against a sustained bearish dollar trend.”
“Incidentally, this week’s moves have likely placed the dollar in a less overbought condition. With this in mind, DXY should find increasing support below the 103.00 area.”
USD/CAD has broken below 1.28. In Canada, today's CPI should endorse more hikes, which are set to underpin the loonie, economists at ING report.
Inflation data unlikely to affect BoC policy expectations
“The market is expecting some signs that the headline rate has peaked (at 6.7% YoY), which would imply a monthly increase of 0.5% in April. Core measures may however continue to inch marginally higher. Barring major surprises in the data today, we suspect that the impact on the Bank of Canada's rate expectations and on the Canadian dollar will be limited.”
“USD/CAD should continue to weaken if we see further signs of stability in global sentiment today.”
“Crucially, the rate and growth differential that may curb EUR/USD don't apply to CAD vs USD given a hawkish BoC and strong growth in Canada, which means that a rally in the loonie should prove more sustainable than the EUR/USD one.”
“We continue to target sub-1.25 levels in USD/CAD by the second half of the year.”
Economists at Credit Suisse think that Chilean peso has room to perform in coming weeks – they target 800 in USD/CLP.
Valuations remains attractive
“We think that CLP has room to perform in coming weeks driven by attractive valuations, high carry and a good technical position.”
“Valuations remains attractive while from a positioning standpoint foreign investors seem to be short CLP.”
“we think the USD/CLP has the potential test again the 800 level.”
According to FX Strategists at UOB Group Lee Sue Ann and Quek Ser Leang, bets for a probable drop below 127.50 in USD/JPY keep diminishing.
Key Quotes
24-hour view: “We highlighted yesterday that ‘the price actions are likely part of a consolidation’ and we expected USD to ‘trade sideways within a range of 128.70/129.65’. USD subsequently traded between 128.81 and 129.77. Further sideways trading would not be surprising, likely between 128.80 and 129.80.”
Next 1-3 weeks: “There is not much to add to our update from yesterday (17 May, spot at 129.15). As highlighted, the chance for USD to move below 127.50 has diminished. However, only a breach of 129.90 would indicate that the downside risk has dissipated.”
EUR/USD has risen this week, breaking back above the 1.0500 level. Nonetheless, economists at ING expect the pair to run out of steam ahead of the 1.0650-1.0700 area.
Upside room starting to shrink
“Our view on the limited downside risk for the dollar beyond the very short term obviously implies that the room for appreciation in EUR/USD should also start to shrink soon.”
“We believe that markets are pricing in too much tightening by the ECB – though not by the Fed – and expect the theme of growth divergence (exacerbated by the EU-Russia standoff on commodities) to become more relevant into the summer.”
“We suspect that any further rally in EUR/USD may start to lose steam around the 1.0650-1.0700 area, with risks of a return below 1.0500 in the near term being quite material.”
USD/ TRY has been rising on a steady basis since it broke above the 15.00 mark on Monday last week. Economists at Credit Suisse think the CBRT will aim to keep USD/TRY below 16.00 in the near-term, but see risks of larger repricing beyond 16.00 as still in place.
Markets are likely to eye the 16.00 level in USD/TRY in the short run
“The central bank will aim to keep USD/TRY upside capped at the next rounded level – which is 16.00 – via FX intervention. Based on their policy response in recent months, Turkish authorities will probably also look into expanding current policies or adopting new ones in an attempt to keep USD/TRY below certain thresholds.”
“Still, persisting buying of dollars, if continued, might force the central bank to allow a larger repricing in USD/TRY (e.g. to 16.50 or even to 17.00) already in the coming weeks.”
“The combination of negative real rates and lack of sufficient inflows on the financial account side to fund the current account deficit keep the lira vulnerable.”
- DXY reverses the recent weakness and revisits 103.60.
- US yields add to the recovery along the curve post-Powell.
- Housing sector data, Fed’s Harker next on tap in the docket.
Following three sessions trading on the defensive, the greenback manages to regain the smile and advance to the 103.60 region when tracked by the US Dollar Index (DXY) on Wednesday.
US Dollar Index up post-Powell, risk-on loses traction
The index reverses three consecutive daily pullbacks and bounces off 2-week lows near 103.20 midweek on the back of the better mood around the dollar and amidst the continuation of the recovery in US yields.
Indeed, investors’ shifted their interest back to the greenback after Chief Powell reinforced late on Tuesday the case for a 50 bps hike of the Fed Funds Target Range in the next couple of meetings, at the time when he reiterated once again that the Fed will raise rates until inflation gives convincing signs of losing traction. He also suggested that the Fed will need to slow down the economic growth levels seen in 2021 and hinted at the idea that the landing could be kind of “bumpy”.
In the US cash markets, yields continue to recover along the curve, adding to Tuesday’s uptick.
Data wise in the US, MBA Mortgage Applications are due in the first turn seconded by Building Permits and Housing Starts. Later in the NA session, Philly Fed P.Harker (2023 voter, hawk) is also due to speak.
What to look for around USD
The index managed well to keep business above the 103.00 mark following the recent moderate corrective leg lower. Supporting the buck appears investors’ expectations of a tighter rate path by the Federal Reserve and its correlation to yields, the current elevated inflation narrative and the solid health of the labour market. On the negatives for the greenback turn up the incipient speculation of a “hard landing” of the US economy as a result of the Fed’s more aggressive normalization.
Key events in the US this week: MBA Mortgage Applications, Building Permits, Housing Starts (Wednesday) – Initial Claims, Philly Fed Manufacturing Index, Existing Home Sales, CB Leading Index (Thursday).
Eminent issues on the back boiler: Speculation of a “hard landing” of the US economy. Escalating geopolitical effervescence vs. Russia and China. Fed’s more aggressive rate path this year and 2023. US-China trade conflict. Future of Biden’s Build Back Better plan.
US Dollar Index relevant levels
Now, the index is up 0.28% at 103.59 and the break above 105.00 (2022 high May 13) would open the door to 105.63 (high December 11 2002) and finally 106.00 (round level). On the flip side, initial contention emerges at 103.19 (weekly low May 18) followed by 102.35 (low May 5) and then 99.81 (weekly low April 21).
- A combination of supporting factors assisted USD/JPY to reverse an early dip to sub-129.00 levels.
- Aggressive Fed rate hike bets, rising US bond yields acted as a tailwind for the USD and the major.
- A softer risk tone underpinned the safe-haven JPY and might keep a lid on any meaningful upside.
The USD/JPY pair managed to rebound a few pips from the daily low and was last seen trading with modest losses, around the 129.25 region during the early European session.
Investors remain concerned that a more aggressive move by major central banks to curb inflation, the Russia-Ukraine war and the latest COVID-19 outbreak in China could hurt the global economic growth. This, in turn, triggered a fresh leg down in the equity markets, which benefitted the safe-haven Japanese yen and exerted some downward pressure on the USD/JPY pair. That said, a combination of factors helped limit any deeper losses, at least for the time being.
The markets seem convinced that the Fed would stick to its policy tightening path over the next few months to curb soaring inflation. The bets were reaffirmed by Fed Chair Jerome Powell's hawkish remarks on Tuesday, saying that he will back interest rate increases until prices start falling back toward a healthy level. This, in turn, pushed the US Treasury bond yields higher, which revived the US dollar demand and assisted the USD/JPY to reverse the early dip to sub-129.00 levels.
In contrast, the Bank of Japan has vowed to keep its existing ultra-loose policy settings and promised to conduct unlimited bond purchase operations to defend its “near-zero” target for 10-year yields. The resultant Fed-BoJ monetary policy divergence supports prospects for a further near-term appreciating move for the USD/JPY pair. Bulls, however, seemed reluctant to place aggressive bets, suggesting that spot prices might have already formed a near-term top around the 131.35 region.
Market participants now look forward to the US housing market data - Building Permits and Housing Starts - for some impetus later during the early North American session. Apart from this, the US bond yields will influence the USD price dynamics. Traders will further take cues from the broader market risk sentiment to grab short-term opportunities around the USD/JPY pair.
Technical levels to watch
The oversold pound has faced a strong rebound this week, recouping some of its recent sharp losses as global risk appetite improved. However, economists at ING expect GBP/USD to move below the 1.25 level in the coming months.
Good GBP momentum may continue as equities find some stability in the coming days
“While the good GBP momentum may continue as equities find some stability in the coming days, the pound still faces two major downside risks in the coming months: a) a further dovish repricing of BoE rate expectations (the implied rate for end-2022 is still 2.0%); b) Brexit-related risk, as the unilateral suspension by the UK of parts of the Northern Ireland agreement would likely trigger a trade war with the EU.”
“We think cable will mostly trade below the 1.2500 mark during the summer.”
Economists at Credit Suisse raise their USD/ZAR target range to 15.50-16.50 (from 14.50-15.50 previously). What’s more, they refrain from setting the new target much above recent highs after a large rally and given that USD/ZAR no longer looks dislocated versus the broader EM FX complex.
Raise USD/ZAR target range to 15.50-16.50
“We lift our USD/ZAR target to 15.50-16.50 from 14.50-15.50 previously. Our previous target range looks too low in an environment where the USD overall remains bid.”
“We suspect that some of the latest rand-weakness and underperformance against other highyielders (namely MXN) could have been a result of re-balancing of local portfolios following a multi-month period of outperformance of local assets. These flows, to the extent that they continue, will probably prevent a major and sustained drop in USD/ZAR.”
“We deliberately refrain from setting the upper-end of our new range much above recent highs (of 16.32) because (1) the latest bottom-to-top rally in USD/ZAR (~10% since mid-April) is now only slightly short of the magnitude of two other similar episodes that unfolded in the last 12-month period and; (2) USD/ZAR does not look dislocated relative to the broader EM/FX complex like it did a few weeks ago.”
- Gold witnessed selling for the second straight day on Wednesday amid modest USD strength.
- Aggressive Fed rate hike bets, rising US bond yields helped the USD to stall its recent downfall.
- Recession fears weighed on investors’ sentiment and could lend support to the safe-haven metal.
Gold edged lower for the second successive day on Wednesday and extended the previous day's rejection slide from the very important 200-day SMA. The XAUUSD remained on the defensive through the early European session and was last seen trading around the $1,810 region, down over 0.50% for the day.
The emergence of some US dollar dip-buying - bolstered by the prospects for a more aggressive policy tightening by the Fed - turned out to be a key factor that undermined the dollar-denominated gold. In fact, the markets seem convinced that the Fed would need to take more drastic action to bring inflation under control. The bets were reinforced by upbeat US Retail Sales data and Fed Chair Jerome Powell's hawkish remarks on Tuesday.
Speaking at a Wall Street Journal event, Powell said that he will back interest rate increases until prices start falling back toward a healthy level. The markets were quick to react, which was evident from some follow-through uptick in the US Treasury bond yields. This further contributed to the offered tone surrounding the non-yielding gold, though concerns about softening global growth might help limit deeper losses, at least for now.
Investors remain worried about the potential economic fallout from the Russia-Ukraine war and the COVID-19 lockdowns in China. The mixed fundamental backdrop warrants caution for aggressive traders, though the overnight failure near a technically significant moving average supports prospects for further losses. That said, it will be prudent to wait for a break below the $1,800 mark before positioning for an extension of a one-month-old downtrend.
Market participants now look forward to the US housing market data - Building Permits and Housing Starts - for some impetus. Apart from this, the US bond yields will influence the USD price dynamics. Traders will further take cues from the broader market risk sentiment to grab short-term opportunities around gold.
Technical levels to watch
- AUD/USD fades rebound from the three-day-old bullish channel’s support.
- Sustained trading beyond 200-HMA keep buyers hopeful but horizontal area from May 06 appears tough nut to crack.
- Descending RSI, multiple failures to cross nearby horizontal resistance keep sellers hopeful.
AUD/USD drops back towards the 0.7000 threshold amid the initial European session on Wednesday.
The Aussie pair’s latest weakness could be linked to the market risk-off mood, as well as sustained trading below a horizontal area comprising multiple levels marked since May 06, around 0.7040-65.
Given the downbeat RSI adding strength to the bearish bias concerning the AUD/USD pair, sellers will be waiting for a clear downside break of the stated channel’s lower line, near 0.7000 by the press time, to retake control.
Following that, a downward trajectory towards the 200-HMA and the monthly low, respectively near 0.6965 and 0.6830, will be in focus.
Alternatively, a clear upside break of the 0.7065 hurdle will quickly trigger the pair’s run-up targeting the 0.7100 resistance confluence, including the upper line of the aforementioned channel and 61.8% Fibonacci retracement of May 04-12 downside.
In a case where AUD/USD prices rise beyond 0.7100, buyers won’t hesitate to challenge the monthly peak close to 0.7265.
AUD/USD: Hourly chart
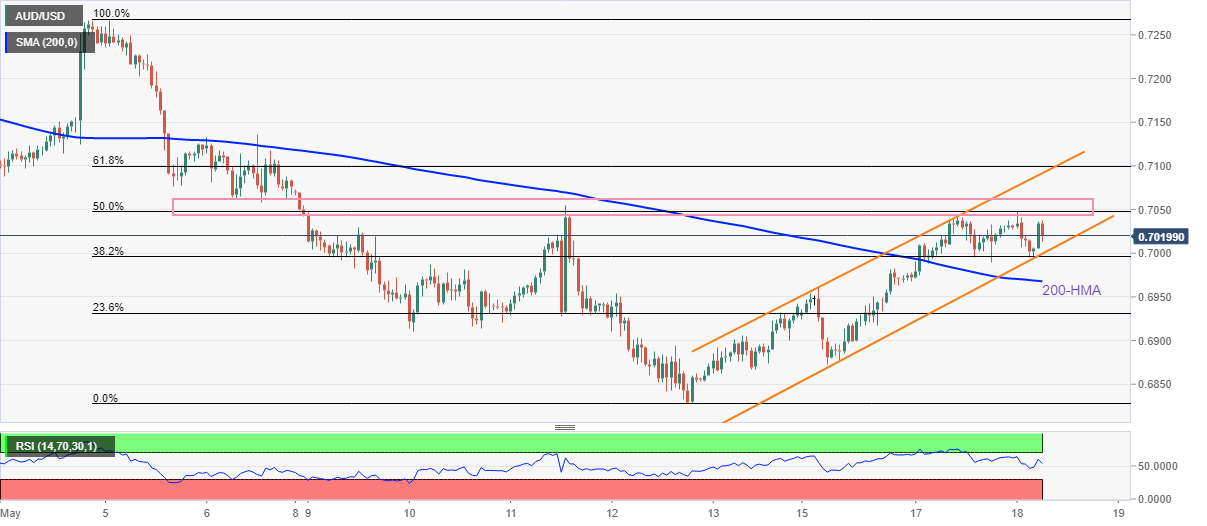
Trend: Further weakness expected
The rouble exchange rate recovered notably from its drop in March. However, economists at Commerzbank expect the rouble to trend back lower as we could be witnessing the peak of the current-account balance.
Absence of capital flows will drive the current-account gap towards closure
“Preliminary estimates suggest that the current-account surplus widened by five-fold for the month of April. This gap will fluctuate in future, not only because the oil price will fluctuate, but because the EU and other countries may begin to implement a reduction of Russian oil imports; by 2023, natural gas revenues are likely to take a hit too. Meanwhile, the import restrictions are likely to remain in place.”
“We could be witnessing the peak of the current-account balance during the early stages of the conflict.”
“In the longer-term, the absence of capital flows will drive the current-account gap towards closure (in equilibrium, they have to be equal and opposite). Since we are starting from a favourable current-account position now, the tendency for the exchange rate in the longer-term will also be to weaken.”
Although economists at Credit Suisse remain bullish on tourism recovery in Thailand, USD/THB is expected to trade with an upward trajectory in a 34.20-35.50 range as the yuan weakens.
Bearish despite optimism on global tourism
“Thailand’s tourism outlook is poised to improve for the remainder of 2022, albeit from a very low base. In our view, there is plenty of upside for further tourism growth, since March 2022 arrivals from the US and Europe were just 12- 14% of their pre-COVID (March 2019) level.
“Despite our optimism on Thai tourism, we think yuan weakness and higher US yields will lead USD/THB to rise within a range of 34.20-35.50.”
“The 35.00 level is a key barrier that could take some time to break, and the Bank of Thailand (BoT) could intervene to defend this key level in the next few weeks. However, as US yields continue to rise and the dollar strengthens against CNY and JPY, we expect BoT to relent and allow the baht to weaken past 35.00.”
Turkey is every analyst’s favourite subject because everything there is so nice and simple, in the view of economists at Commerzbank. They believe that there is no endpoint for lira depreciation.
TRY will continue to depreciate with increased speed
“If a central bank gets everything wrong, the currency will collapse. Of course, there are always TRY bulls (even at this stage?!?) who do not want to see that. However, that is the nice thing for TRY-analysts: that one is correct in the end.”
“The only issue is: there are still people who want to know how much further the TRY depreciation is going to go – despite the fact that the answer is simple: there is no limit.”
“As long as monetary policy allows inflation to simply progress inflation will continue to accelerate. And as long as that remains foreseeable the lira will continue to depreciate with increased speed. There are no ‘fair’ levels at which this process might end.”
USD/PHP has been remarkably stable despite recent Asian FX volatility. Economists at Credit Suisse expect a larger Philippine trade deficit and a weaker yuan to push USD/PHP towards 53.50.
Setting a target of 53.50 for USD/PHP
“We think the deterioration in the Philippines’ trade balance is an important factor for the Philippine peso. Wider trade deficits have historically coincided with a rising USD/PHP exchange rate.”
“Strong Philippine imports amid ongoing infrastructure buildout point to depreciation, while recent USD/PHP stability despite rising USD/CNY points to overdue ‘catch-up’ peso weakness.”
“We forecast USD/PHP to rise to 53.50 in the next three months.”
European Central Bank (ECB) Governing Council member Klaas Knot told on Tuesday that a 50 basis points rate hike should not be excluded. EUR/USD jumped with the initial reaction to these comments, economists at Commerzbank report.
Knot’s comments support the euro
“Klaas Knot yesterday introduced the possibility of 50bp steps. By making this comment Knot opens up a new line of attack for the ECB hawks. The publication of each set of high inflation data would strengthen this view and at least make such a step seem marginally more likely.”
“The FX market is not so interested in knowing how much a central bank might hike interest rates at the next meeting or the next one. What is instead decisive for the value of a currency is whether a central bank reacts sensitively to inflation.”
“The ECB initially assumed inflation was ‘transitional’ and did nothing. And now it is still waiting due to regulative considerations. In view of rapidly accelerating inflation that constitutes weak reactivity. Knot’s comments clearly differ from that. And that is why the euro was able to benefit from these comments even if nobody saw a reason to raise the ECB’s projections for the immediate future as a result of them.”
Here is what you need to know on Wednesday, May 18:
The greenback seems to have found its footing early Wednesday amid rising US Treasury bond yields. The US Dollar Index, which closed the previous three days in negative territory and lost more than 1% during that period, is moving sideways above 103.00 early. The benchmark 10-year US Treasury bond yield is moving sideways within a touching distance of 3% following a 4% increase on Tuesday. Eurostat will release the inflation (final) data for April. Later in the session, Consumer Price Index from Canada and Housing Starts from the US will be featured in the North American docket.
The risk-positive market environment made it difficult for the dollar to find demand on Tuesday. The S&P 500 Index gained more than 2% as the data from the US revealed that Retail Sales in April rose by 0.9%, compared to the market expectation of 0.7%. Additionally, investors cheered news of the city of Shanghai recording no new coronavirus cases across all districts.
Earlier in the day, citing three sources familiar with the matter, Reuters reported Shanghai city’s authorities issued a new white list containing 864 financial institutions allowed to resume work. Nevertheless, US stock index futures trade flat heading into the European session. Speaking at an event organized by the Wall Street Journal, FOMC Chairman Jerome Powell reiterated that they will not hesitate if they see the need to move the rate beyond neutral and added that there was broad support among policymakers for 50 basis points rate hikes at the next two policy meetings.
EUR/USD gained more than 100 pips on Tuesday before going into a consolidation phase early Wednesday. European Central Bank (ECB) policymaker Klaas Knot said that a 50 basis points rate hike should not be excluded if data in the next few months suggest that inflation is broadening and accumulating, providing a boost to the euro.
GBP/USD stays relatively calm below 1.2500 early Wednesday following this week's decisive rebound. The data published by the UK's Office for National Statistics revealed earlier in the session that inflation in the UK, as measured by the Consumer Price Index (CPI) jumped to 9% on a yearly basis in April. The Core CPI, which excludes volatile food and energy prices, climbed to 6.2% from 5.7% in March as expected.
Gold extended its rebound and rose above $1,830 on Tuesday but reversed its direction with rising US Treasury bond yields not allowing the yellow metal to continue to find demand. XAU/USD trades in negative territory near $1,810 in the European morning.
USD/JPY moves sideways above 129.00 for the third straight day on Wednesday. The pair managed to hold its ground despite the broad dollar weakness as the Japanese yen struggled to attract investors in the risk-positive market environment.
Bitcoin registered modest daily gains on Tuesday but failed to gather bullish momentum. As of writing, BTC/USD was down nearly 2% on the day at $29,900. Ethereum is down 2.5% on the day and trades near $2,000 following Tuesday's recovery attempt.
- GBP/JPY prints a 50-pip fall on downbeat UK inflation data.
- Risk-off mood, Brexit uncertainty also weighs on the pair prices.
- Japan Q1 2022 GDP came in firmer, yields cheer hawkish Fedspeak.
- Headlines concerning Brexit, Russia and covid will be important for near-term directions.
GBP/JPY portrays a 50-pip downside reaction to the UK inflation data heading into the London open on Wednesday. The cross-currency pair presently hovers around 161.00, after declining to 160.91, as traders digest the Consumer Price Index (CPI) figures for April.
The UK’s headline CPI refreshed its all-time high to 9.0% YoY but failed to match the 9.1% market consensus. Further, the Core CPI matched the 6.2% YoY forecast, compared to 5.7% prior. It should be observed that a downward revision in the Producer Price Index (PPI) and upbeat prints of the Retail Price Index also confuse the bulls. As a result, the GBP/JPY prices consolidate the biggest daily gains in two months.
Read: Breaking: UK annualized inflation jumps 9% in April vs. 9.1% expected
It’s worth noting that the fresh risk-aversion wave and comments from the British diplomats are extra catalysts to weigh on the GBP/JPY prices.
A fresh rise in China’s covid numbers and Shanghai’s refrain from total unlock joins while the European Union (EU) and the US preparations for more hardships for Russia, due to Moscow’s invasion of Ukraine, weigh on the market sentiment.
While portraying the risk-off mood, the US 10-year Treasury yields seesaw around 2.98% whereas the S&P 500 Futures decline 0.20% intraday even as Wall Street posted heavy gains.
On a different page, UK Foreign Minister Liz Truss said “we're facing a very difficult economic situation” whereas British Finance Minister Rishi Sunak tries to placate inflation fears while blaming the energy price cap rise in April.
Elsewhere, the European Union’s (EU) readiness to offer an olive branch to the UK, to stop the British administration from repealing the Northern Ireland Protocol (NIP), seems to have acted as a positive catalyst of late. However, Britain remains determined to alter part of the NIP, and the bloc eyes hard steps on trade deals if the UK does that, which in turn keeps the Brexit risk high.
Earlier in the day, Japan’s preliminary readings of Q1 2022 GDP rose past -0.4% expectations to -0.2% QoQ whereas the Annualized GDP improved to -1.0% versus -1.8% forecasted.
Moving on, risk catalysts are the key for GBP/JPY moves amid a light calendar for Wednesday, as well as likely Brexit headlines and European reaction to the latest downbeat sentiment.
Technical analysis
Failures to cross the 21-DMA, around 161.80 by the press time, triggered the GBP/JPY pair’s latest declines targeting the 50-DMA level surrounding 160.90. However, bears remain cautious until the quote stays above the previous resistance line from April, near 159.65 at the latest.
FX option expiries for May 18 NY cut at 10:00 Eastern Time, via DTCC, can be found below.
- EUR/USD: EUR amounts
- 1.0400 216m
- 1.0675 198m
- 1.0700 542m
- GBP/USD: GBP amounts
- 1.2525 399m
- USD/JPY: USD amounts
- 129.25 325m
- AUD/USD: AUD amounts
- 0.7300 270m
- USD/CAD: USD amounts
- 1.2700 490m
- NZD/USD: NZD amounts
- 0.6700 329m
- EUR/JPY: EUR amounts
- 136.90 300m
Economists at CreditSuisse continue to look for USD/CNH to trade in a 6.65-7.15 range over the next three months.
PBoC’s “red line” for USD/CNY is at 7.20
“For USD/CNY, we still think the PBoC’s ‘red line’ is at 7.20.”
“US 10y yields have fallen back below 3.00% since peaking at 3.20% on Monday, May 9, providing some relief to USD/CNH. Still, we expect USD/CNH to continue to rise in coming months as Fed expectations push US yields higher.”
“We reiterate our view that USD/CNH will rise within a 6.65-7.15 trading range over the next three months.”
UK Finance Minister Rishi Sunak attributes the 9% jump in the Kingdom’s annualized inflation rate to the energy price cap rise in April.
“Today’s inflation numbers are driven by energy price cap rise in April, in turn driven by higher global energy prices. We cannot protect people completely from global challenges but are providing significant support where we can and stand ready to take further action,” Sunak said.
more to come ....
Extra upside could lift AUD/USD to the area above the 0.7100 mark, commented FX Strategists at UOB Group Lee Sue Ann and Quek Ser Leang.
Key Quotes
24-hour view: “We highlighted yesterday that ‘the rebound in AUD could extend but a sustained rise above 0.7020 is unlikely’. We added, ‘the major resistance at 0.7050 is not expected to come into the picture’. Our view turned out to be correct as AUD rose to 0.7040 before closing at 0.7029 (+0.82%). While overbought, the advance in AUD could edge above 0.7055 first before easing off. The next resistance at 0.7105 is not expected to come under threat. On the downside, a breach of 0.6975 (minor support is at 0.7005) would indicate that risk for further AUD strength has dissipated.”
Next 1-3 weeks: “Yesterday (17 May, 0.6980), we highlighted that ‘the corrective rebound could extend to 0.7050’. Our view was not wrong as AUD subsequently rose to 0.7040. Upward momentum has improved further and the rebound in AUD could extend to 0.7105. The upside pressure is deemed intact as long as AUD does not move below 0.6950 (‘strong support’ level was at 0.6900 yesterday).”
- Advancing 20- and 50-period EMAs are adding to the upside filters.
- Kiwi bulls are firmer above Bullish Flag formation.
- The RSI (14) has shifted into a bullish range of 60.00-80.00
The NZD/USD pair has witnessed a rebound after hitting a low of 0.6340 in the early European session. The asset has observed a sheer upside from the last week after hitting a low of 0.6217. On a broader note, the asset is oscillating in a wide range of 0.6333-0.6376.
On an hourly scale, the asset is forming a Bullish Flag that signals a continuation of bullish momentum after a rangebound phase. Usually, a consolidation phase denotes intensive buying interest.
The 20- and 50-period Exponential Moving Averages (EMAs) at 0.6350 and 0.6330 respectively are scaling higher, which adds to the upside filters.
Meanwhile, the Relative Strength Index (RSI) (14) is oscillating majorly in a range of 60.00-80.00, which signals that bullish momentum is still intact.
A break above the May 7 high of 0.6376 will trigger the formation of the Bullish Flag chart pattern, which will drive the asset towards the round level resistance at 0.6400, followed by the May 6 high at 0.6458.
On the flip side, kiwi bulls could lose momentum if the asset drops below the 50-EMA at 0.6330. This will drag the asset towards May 10 low at 0.6276. Violation of the May 10 low will further push the asset lower to the March 12 low of 0.6217.
NZD/USD hourly chart
-637884509727623164.png)
UK Foreign Minister Liz Truss voiced her concerns over the country’s economic situation, in a statement on Wednesday.
Truss said that “we're facing a very difficult economic situation.”
Her comments come after the UK CPI reached 9% YoY in April, the highest since the modern series started in 1989.
Related reads
- UK annualized inflation jumps 9% in April vs. 9.1% expected
- GBP/USD retreats towards 1.2450 as UK inflation misses the mark
- GBP/USD takes a U-turn from intraday high after softer-than-expected British inflation data.
- UK CPI refreshes record top with 9.0% YoY figures in April but stays below 9.1% forecast.
- Market’s risk-off mood challenges the recovery moves amid lack of major data/events.
- Headlines concerning Russia, China and Fedspeak will be crucial, US housing numbers eyed too.
GBP/USD fails to cheer record high UK inflation as the figures missed market consensus. That said, the cable pair takes offers around 1.2475 after April’s Consumer Price Index (CPI) came in softer-than-expected during early Wednesday morning in Europe.
That said, the UK CPI rose to 9.0% YoY versus 9.1% expected whereas the Core CPI matched the 6.2% YoY forecast, compared to 5.7% prior.
Read: Breaking: UK annualized inflation jumps 9% in April vs. 9.1% expected
While the UK inflation numbers underpin the GBP/USD pair’s latest moves, challenges to risk appetite, Brexit moves and firmer USD are extra catalysts that challenge the upside momentum.
A fresh rise in China’s covid numbers and Shanghai’s refrain from total unlock joins while the European Union (EU) and the US preparations for more hardships for Russia, due to Moscow’s invasion of Ukraine, to weigh on the market sentiment.
Also souring the mood were comments from Chicago Fed President Charles Evans as he said, “(the Fed) Should raise rates to 2.25%-2.5% neutral range 'expeditiously'.” On Tuesday, Fed Chair Jerome Powell and a generally-hawkish St Louis Fed President James Bullard pushed for a 50 bps rate hike and weighed on the USD.
It should be noted that the European Union’s (EU) readiness to offer an olive branch to the UK, to stop the British administration from repealing the Northern Ireland Protocol (NIP), seems to have acted as a positive catalyst of late. However, Britain remains determined to alter part of the NIP and the bloc eyes hard steps on trade deals if the UK does that, which in turn keeps the Brexit risk high.
On Tuesday, the UK’s jobs report bolstered the odds of the Bank of England’s (BOE) faster/heavier rate hikes, preceded by BOE Governor Andrew Bailey’s comments suggesting more inflation fears ahead.
Against this backdrop, the US 10-year Treasury yields seesaw around 2.98% whereas the S&P 500 Futures decline 0.20% intraday even as Wall Street posted heavy gains.
Having witnessed the initial reaction to the UK inflation data, GBP/USD traders will pay attention to the Brexit headlines and other risk catalysts, as well as the US Housing Starts and Building Permits for April, for fresh impulse.
Technical analysis
Although the 20-DMA level near 1.2500 tests the GBP/USD buyers, a clear break of the one-month-old descending trend line, around 1.2250 at the latest, joins the firmer RSI line to underpin bullish bias. Additionally, two-week-old horizontal support around 1.2400 could restrict the short-term pullback.
- UK CPI rises by 9% YoY in April vs. 9.1% expected.
- Monthly UK CPI arrives at 2.5% in April vs. 2.6% expected.
- GBP/USD drops sharply to 1.2475 on downbeat UK CPIs.
The UK Consumer Prices Index (CPI) 12-month rate came in at 9% in April when compared to 7.0% registered in March while missing estimates of a 9.1% score, the UK Office for National Statistics (ONS) reported on Wednesday.
The annualized figure hit the highest since the modern series started in 1989.
Meanwhile, the core inflation gauge (excluding volatile food and energy items) rose by 6.2% YoY last month versus 5.7% booked in March, meeting the market forecast of 6.2%.
The monthly figures showed that the UK consumer prices arrived at 2.5% in April vs. 2.6% expectations and 1.1% prior.
Main points (via ONS):
“The largest upward contributions to the annual CPIH inflation rate in April 2022 came from housing and household services (2.76 percentage points, principally from electricity, gas and other fuels, and owner occupiers' housing costs) and transport (1.47 percentage points, principally from motor fuels and second-hand cars).”
“The largest upward contributions to the change in the CPIH 12-month inflation rate between March and April 2022 came from housing and household services (1.27 percentage points), restaurants and hotels (0.11 percentage points), and recreation and culture (0.10 percentage points), with the largest partially offsetting downward contribution from clothing and footwear (0.09 percentage points).”
FX implications:
In an initial reaction to the upbeat UK CPI numbers, the GBP/USD pair reversed course and fell sharply to near the 1.2475 region.
The pair was last seen trading at 1.2474, down 0.13% on the day. Sellers continue to lurk at the 1.2500 mark.
NZD/USD is a touch higher. A sustained break of 0.6365 would be a good sign technically, analysts at ANZ Bank report.
Kiwi may be running into headwinds if global sentiment sours again
“The kiwi’s bounce off lows this week has been textbook in that it bounced neatly off 0.6230 (the 61.8% Fibo of the 2020-21 rally from 0.5470 to 0.7464). But the bounce was slight and we are mindful of higher oil prices, slowing growth in China and a high degree of cross-market correlation, which all speaks to the kiwi may be running into headwinds if global sentiment sours again. We’re watching closely and keeping an open mind.”
“Support 0.6100/0.6230 Resistance 0.6365/0.6465/0.6545.”
Gold Price is extending the previous decline. XAU/USD eyes a retest of multi-month lows below $1,800, FXStreet’s Dhwani Mehta reports.
The path of least resistance appears to the downside
“The immediate support is now seen at the $1,800 mark, below which the multi-month lows of $1,787 will be probed. The last line of defense for gold buyers is seen at the 2022 lows of $1,780, reached on January 28.”
“Any recovery attempt will eye a sustained break above the falling trendline resistance at $1,821. Gold bulls will then look to challenge the 200-DMA at $1,836 once again. Recapturing the latter on a daily closing basis is critical to initiate any meaningful recovery.”
- Palladium prices reverse from weekly high, retreat inside monthly falling channel.
- Descending trend line from February lures short-term bears.
- Bulls need a clear break of 61.8% Fibonacci retracement to retake control.
- An impending bull cross on MACD teases buyers but bearish channel limits upside momentum.
Palladium (XPD/USD) takes offers to renew intraday low around $2,030, printing the first daily loss in four heading into Wednesday’s European session.
In doing so, the commodity prices fade the previous day’s 10-DMA breakout inside a one-month-old descending trend channel
It’s worth noting, however, that the looming bull cross on the MACD hints challenges the XPD/USD downside past the 10-DMA level surrounding $2,000.
Also acting as the key downside barrier is a falling trend line from February 11, near $1,875, as well as the lower line of the stated channel, near $1,815.
Alternatively, a clear upside break of the monthly channel’s resistance line, close to $2,070 by the press time, won’t be an open invitation to the palladium buyers.
The reason is the 61.8% Fibonacci retracement of the XPD/USD’s December 2021 to March 2022 upside, near $2,265.
Overall, palladium sellers seem to have run out of steam but the bulls haven’t gained conviction and hence prices remain lackluster.
Palladium: Daily chart
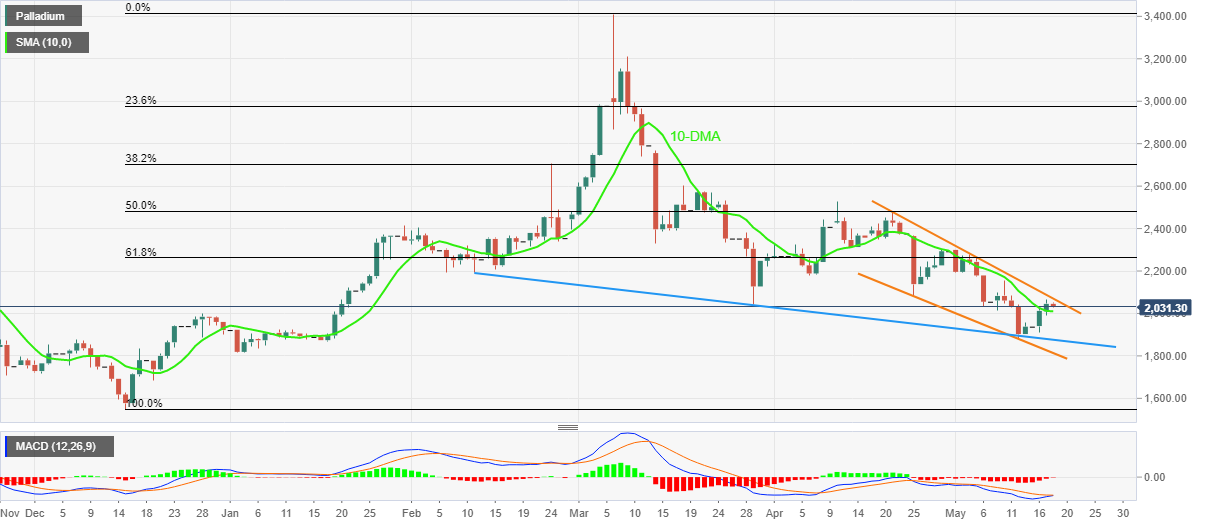
Trend: Further weakness expected
Considering advanced prints from CME Group for natural gas futures markets, open interest extended the uptrend for the fourth consecutive session on Tuesday, now by around 4.3K contracts. On the other hand, volume remained choppy and shrank by nearly 26K contracts.
Natural Gas advances firmly to $9.00
Natural Gas extended the ongoing rebound and surpassed the $8.00 mark on Tuesday amidst rising open interest. Against that, the commodity could still revisit the 2022 peak around the $9.00 mark (May 6) per MMBtu in the short-term horizon.
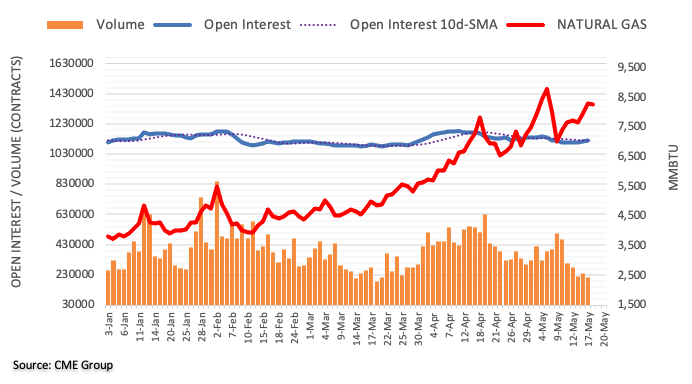
- USD/RUB takes offers to refresh intraday low, stays inside weekly trading range near two-year bottom.
- EU prepares plan to gradually overcome energy dependence, US eyes to block Russian debt payment.
- Risk-aversion, hawkish Fed joins softer oil prices to restrict downside.
- Russia’s economic resilience keeps the sellers hopeful during the second month of the war with Ukraine.
USD/RUB renews intraday low at 63.25 as bears keep reins inside a weekly trading range ahead of Wednesday’s European session.
In doing so, the Russian ruble (RUB) refrains to respect the US dollar strength while also ignoring headlines suggesting further hardships for Moscow, due to the Western dislike of its invasion of Ukraine.
That said, Reuters came out with the news earlier in Asia suggesting the European Commission’s 210 billion euro plan for how Europe can end its reliance on Russian fossil fuels by 2027. On the same line were the latest headlines saying, “The US is considering blocking Russia’s ability to pay its US bondholders by allowing a key waiver to expire next week,” per Reuters.
It’s worth noting that the hawkish Fedspeak, recently from Chicago Fed President Charles Evans, joins to market’s risk-off mood to keep the US dollar afloat after a three-day downtrend. Also likely to challenge the USD/RUB bears are the recently heavy oil prices, Russia’s key export item. That said, WTI crude oil drops back below $111.00, down 0.50% intraday near $110.50 at the latest.
Even so, the RUB remains on the front foot amid chatters of the nation’s economic resilience despite the latest sanctions and geopolitical tussles with Kyiv.
Moving on, headlines concerning the Western sanctions on Russia and Moscow’s military action in Kyiv may determine near-term USD/RUB moves. Also important will be the US Housing Starts and Building Permits for April, as well as the Fedspeak.
Technical analysis
USD/RUB remains sidelined between 62.80 and 66.50 with repeated failures to cross the 100-HMA, around 66.00 by the press time, adding strength to the bearish bias.
CME Group’s flash data for crude oil futures markets noted traders trimmed their open interest positions by around 33.2K contracts after five consecutive daily advances. Volume, instead, added around 14.7K contracts to the previous daily build.
WTI now targets the $116.60 region
Tuesday’s inconclusive price action in the WTI was in tandem with shrinking open interest and rising volume, exposing the emergence of some consolidation in the very near term. On the upside, traders remain focused on the $116.60 level per barrel (March 24 high).
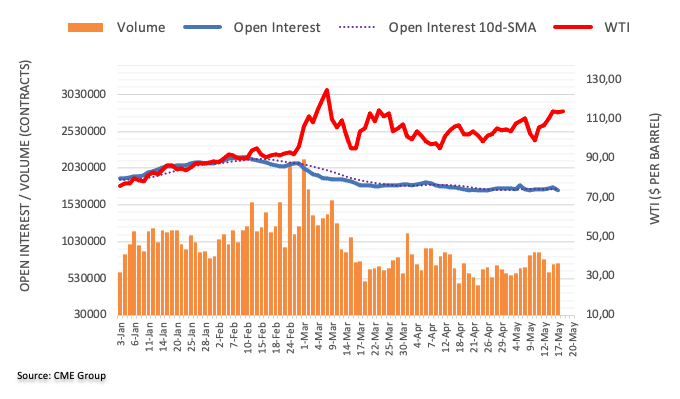
- EUR/USD stalls a three-day recovery rally as the USD springs back to life.
- ECB’s Knot fuels bullish wedge breakout but 21-DMA will be a tough nut to crack for EUR bulls.
- Immediate support is seen at 1.0488, as the focus shifts to Eurozone inflation.
EUR/USD is trading on the backfoot below 1.0550, having fresh multi-day highs at 1.0564 earlier in the Asian session.
The latest retreat in the major could be linked to the deteriorating market mood, which has revived the US dollar’s safe-haven appeal. Softer Chinese data and concerns over the aggressive Fed tightening outlook spooked investors.
On Tuesday, EUR/USD’s recovery rally found extra legs after ECB Governing Council member Klaas Knot said that a 50-basis points rate hike should not be excluded if data in the next few months suggest that inflation is broadening and accumulating.
The pair shot through the 1.0500 barrier on these above comments, as it recaptured the 1.0550 level. EUR bulls also cheered the upward revision to the Euro area GDP score, as the greenback accelerated its corrective downside.
Looking ahead, the dollar price action and the persistent market sentiment will impact the currency pair ahead of the Eurozone HICP final revision.
As observed on the daily chart, EUR/USD has stalled its recovery rally just below the bearish 21-Daily Moving Average (DMA) at 1.0575.
The 14-day Relative Strength Index (RSI) has turned flattish after the latest rebound from lower levels, justifying the renewed weakness in the main currency pair.
Should the selling pressure intensify, EUR bears could challenge the wedge resistance now turned support at 1.0488.
Further down, Tuesday’s low of 1.0428 could be retested.
EUR/USD: Daily chart
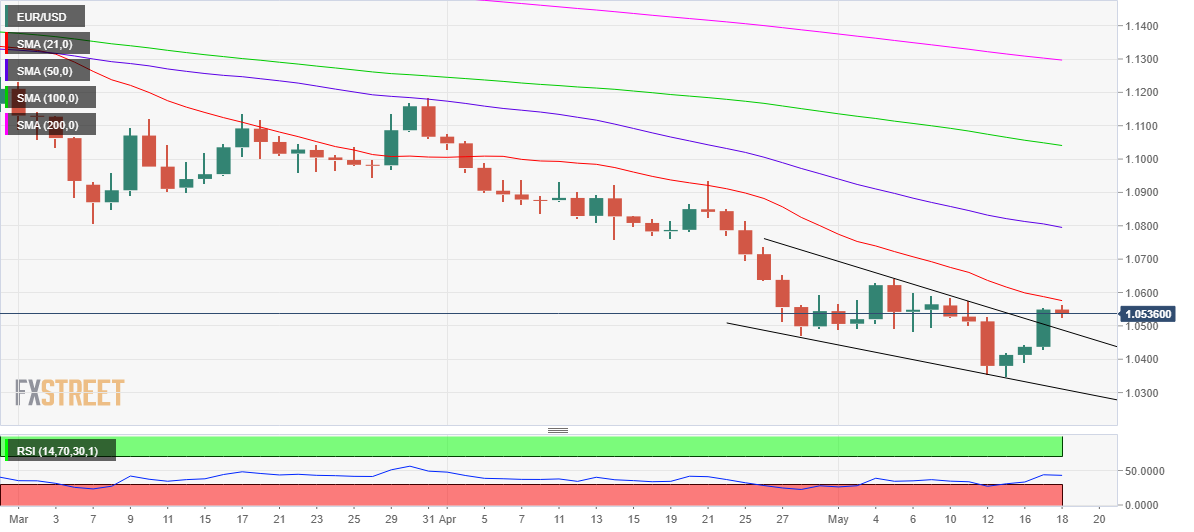
Note that Tuesday’s upsurge prompted EUR/USD to yield an upside breakout from a falling wedge formation, adding credence to the ongoing recovery from five-year lows of 1.0350.
If EUR bulls regain control, then the immediate resistance will be seen at the daily highs of 1.0564, above which the 21-DMA will get tested.
Acceptance above the latter is needed to confirm a bullish reversal in EUR/USD.
EUR/USD: Additional levels to consider
In opinion of FX Strategists at UOB Group Lee Sue Ann and Quek Ser Leang, GBP/USD could now attempt a move to the 1.2600 zone in the next weeks.
Key Quotes
24-hour view: “Yesterday, we expected GBP to ‘extend its gains’ but we were of the view that ‘the major resistance at 1.2400 is not expected come into the picture’. The anticipated GBP strength exceeded our expectations by a wide margin as GBP cracked 1.2400 and rocketed to 1.2498. The deeply overbought rally could extend further but it is unlikely able to maintain a foothold above 1.2550 (next resistance is at 1.2600). On the downside, a breach of 1.2420 (minor support is at 1.2450) would indicate that the current upward pressure has eased.”
Next 1-3 weeks: “We highlighted yesterday (17 May, spot at 1.2325) that the ‘the recent weak phase has come to an end and there is room for the current rebound to extend’. While our view for a rebound turned out to be correct, the anticipated strong resistance at 1.2400 did not materialize as GBP lifted off and rocketed by 1.42% (close of 1.2495), its biggest 1-day gain since Oct 2020. The strong boost in momentum suggests there is room for GBP to advance further to 1.2600. At this stage, it is premature to expect a break of the early May high near 1.2640. On the downside, the ‘strong support’ level at 1.2360 is unlikely to come under threat, at least within these couple of days.”
- USD/CHF is facing barricades at around 0.9950 despite Fed’s tightening bets raised.
- The DXY has failed to capitalize on upbeat Retail Sales data.
- This week, Swiss franc bulls will keep an eye on Industrial Production data.
The USD/CHF pair has witnessed a minor rebound after hitting a low of 0.9923 in the Asian session. A rangebound move observed in the asset from Tuesday post the greenback bulls found cushion around 0.9920 after a vertical fall. Considering the price action, the Swiss franc bulls are not done yet and the asset could tumble further to the psychological support of 0.9900.
The upbeat US Retail Sales, released on Tuesday, failed to provide any support to the asset. The US Census Bureau reported the monthly Retail Sales at 0.9% higher than the estimates of 0.7%.
The odds of more 50 basis points (bps) rate hike announcements by the Federal Reserve (Fed) are increasing each day. Fed chair Jerome Powell in his Q&A at Wall Street Journal (WSJ) has stated that inflationary pressures are impacting drastically on the paychecks of the households and inflation needs to be contained sooner. To bring down inflation significantly, the Fed needs to tighten the monetary policy further. The FX domain could witness more than two 50 bps interest rate hikes by the Fed in its next two monetary policy meetings.
On the Swiss franc front, the market participants are focusing on the release of the quarterly Industrial Production. The Swiss Statistics will reveal the Industrial Production later this week. The agency reported Industrial Production previously at 7.3%.
Open interest in gold futures markets shrank for the fourth consecutive session on Tuesday, this time by around 1.4K contracts according to preliminary figures from CME Group. In the same line, volume dropped for the third straight session, now by around 22.7K contracts.
Gold looks capped by the 200-day SMA
Prices of the yellow metal briefly tested the 200-day SMA past $1830 on Tuesday, just to retreat afterwards and close the session with modest losses. This move was on the back of shrinking open interest and volume and suggests that extra decline in gold now seems out of favour.
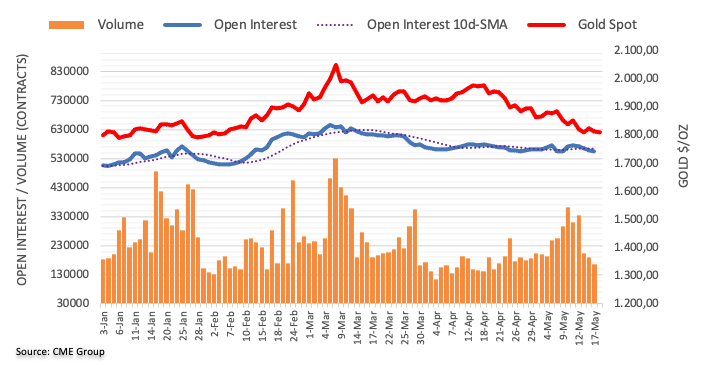
- EUR/GBP remains sidelined after refreshing two-week low the previous day.
- 200-SMA triggered the latest rebound but 100-SMA, previous support from mid-April and weekly resistance together test bulls.
- Bearish MACD signals keep sellers hopeful ahead of UK/Eurozone inflation data.
EUR/GBP treads water around 0.8445 as bears take a breather after a four-day downtrend that refreshes a fortnight low the previous day. Even so, the cross-currency pair remains below a short-term key resistance ahead of inflation data from the UK and Eurozone heading into Wednesday’s European session.
That said, a convergence of the 100-SMA, one-month-old previous support and a descending trend line from Thursday appears a tough nut to crack for the EUR/GBP bulls around 0.8475-80.
Also acting as important resistances are multiple levels surrounding 0.8530 and 0.8580, a break of which could accelerate the run-up towards the monthly high of 0.8618.
On the flip side, bearish MACD signals hint at the EUR/GBP pair’s another attempt to conquer the 200-SMA support, around 0.8405 by the press time.
Additionally challenging the pair bears is the early May swing low, near 0.8365, which holds the key to the quote’s further downside targeting late April’s low surrounding 0.8250.
Overall, the EUR/GBP pair’s latest rebound remains elusive ahead of the key UK Consumer Price Index for April and final readings of Eurozone HICP for the stated period.
EUR/GBP: Four-hour chart
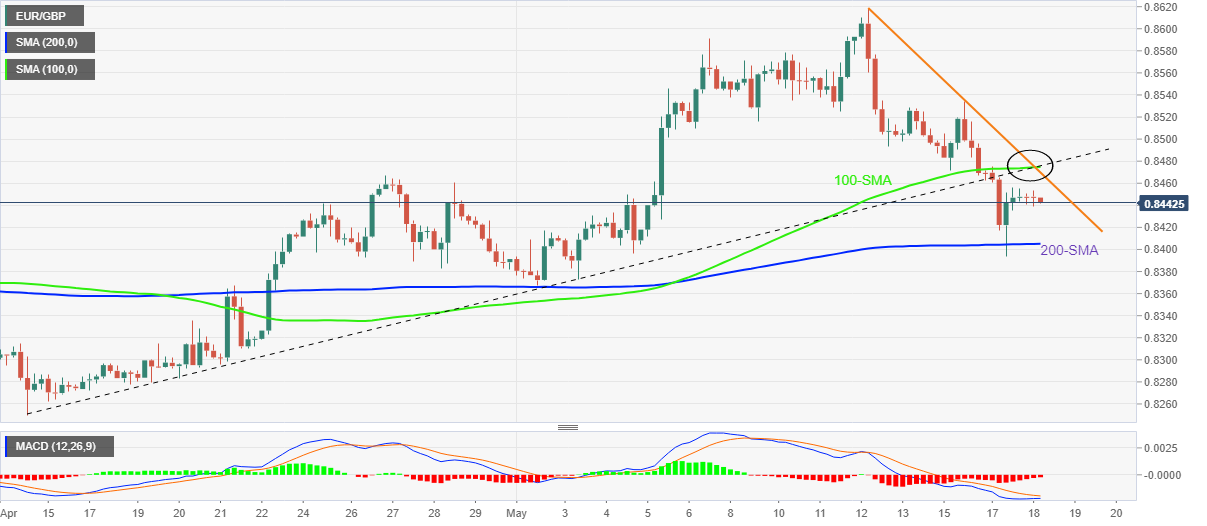
Trend: Further weakness expected
FX Strategists at UON Group Lee Sue Ann and Quek Ser Leang suggested that further upside in EUR/USD could reach the 1.0600 region in the next weeks.
Key Quotes
24-hour view: “While we expected a higher EUR yesterday, we were of the view that it ‘is unlikely to break the strong resistance at 1.0490’. However, EUR easily took out 1.0490 as it surged to a high of 1.0555. The swift build-up in momentum is likely to lead to further EUR strength. That said, a clear break of 1.0600 appears unlikely (next resistance is at 1.0640). On the downside, a breach of 1.0490 (minor support is at 1.0520) would indicate that the build-up in momentum has eased.”
Next 1-3 weeks: “We highlighted yesterday (17 May, spot at 1.0440) that downward momentum is beginning to ease but only a breach of 1.0490 would indicate that EUR is unlikely to break 1.0340. We did not expect the strong lift-off that resulted in an outsized gain as EUR closed higher by 1.11% (close of 1.0547), its largest 1-day advance in two months. The price actions appear to be part of a corrective rebound. The rebound could extend to 1.0600, possibly testing the major resistance at 1.0645. The current upward pressure is intact as long as EUR does not move below the ‘strong support’ level, currently at 1.0440.”
- The asset is experiencing volumes and wider ticks on the upside break of the Darvas Box.
- The RSI (14) near 90.00 is displaying signs of an overbought situation.
- Advancing 20- and 50-EMAs are favoring the greenback bulls.
The USD/TRY pair is hovering around 15.90 in the Asian session after a perpendicular rally. The asset has displayed a nine-day winning streak and has extended further after overstepping Tuesday’s high at 15.92.
An upside break of the Darvas Box chart pattern underpinned the greenback bulls. Usually, a break of the Darvas Box indicates volatility expansion, which results in heavy volume and wider ticks. The above-mentioned chart formation placed in a range of 14.39-15.06 on the daily scale.
The 20- and 50-period Exponential Moving Averages (EMAs) at 15.20 and 14.80 respectively are scaling higher, which adds to the upside filters. Meanwhile, the Relative Strength Index (RSI) (14) is oscillating in a bullish range of 60.00-80, which signals a continuation of bullish momentum. It is worth noting that the momentum oscillator, RSI (14), is displaying overbought signals as the oscillator is nearing 90.00, so a pullback move cannot be ruled out.
A pullback move towards the round level support at 15.50 will trigger a responsive buying action that will drive the asset towards Tuesday’s high and 20 December 2021 opening price at 15.92 and 16.60 respectively.
Alternatively, the Turkish lira could gain control if the asset drops below the 9 May low at 14.92. The occurrence of the same will drag the asset towards April 12 low at 14.55, followed by the psychological support at 14.00.
USD/TRY daily chart
-637884459131341559.png)
- USD/CAD portrays corrective pullback from a fortnight low, snaps three-day downtrend.
- Headlines from China, Fedspeak weigh on market sentiment.
- USD rebound stops oil buyers from cheering EU oil embargo fears.
- BOC Core CPI appears crucial amid talks of faster rate hikes, US housing data, risk catalysts will also entertain traders.
USD/CAD prints the first daily gains in four as it grinds near intraday top surrounding 1.2835-40 during early European morning on Wednesday. In doing so, the Loonie pair takes clues from the US dollar rebound, as well as softer oil prices, ahead of the key Consumer Price Index (CPI) data from Canada.
That said, the US Dollar Index (DXY) rises 0.11% intraday to 103.40 while bouncing off a two-week low as market sentiment sours. Also underpinning the US dollar’s recovery are the recently hawkish comments from Chicago Fed President Charles Evans.
A fresh increase in China’s covid cases and Shanghai’s refrain from total unlock joins a reduction in the foreign investment into the Chinese yuan bond seems to have triggered the latest risk-aversion. Also likely to have weighed on the market’s mood could be the headlines conveying the European Commission’s (EC) plan to move away from Russian energy imports.
Additionally, Fed’s Evans said, “(the Fed) Should raise rates to 2.25%-2.5% neutral range 'expeditiously'.” On Tuesday, Fed Chair Jerome Powell and a generally-hawkish St Louis Fed President James Bullard pushed for a 50 bps rate hike and weighed on the USD.
It should be noted that strong prints of the US Retail Sales also seem to help the US dollar regain its charm. That said, the US Retail Sales rose at a pace of 0.9% MoM in April, slightly better than the expected pace of 0.7% but softer than the upwardly revised 1.4% growth (from 0.5%).
Amid these plays, the US 10-year Treasury yields dropped 0.5 basis points (bps) to 2.966% whereas the S&P 500 Futures decline 0.40% intraday even as Wall Street posted heavy gains. Further, WTI crude oil drops back below $111.00, down 0.50% intraday near $110.50 at the latest.
Looking forward, Canada’s headline CPI is likely to ease to 0.5% MoM from 1.4% and may help the USD/CAD to remain firmer. However, major attention will be given to Bank of Canada CPI Core readings, expected 5.4% YoY versus 5.5% prior. Should the inflation data remain softer, the BOC will have less urgency towards tighter monetary policy than the Fed, which in turn could favor the USD/CAD bulls. Additionally, US Housing Starts and Building Permits for April will join Fedspeak to offer additional directives.
Technical analysis
USD/CAD remains below the upward sloping resistance line from late April, around 1.2945 by the press time, which in turn keeps the pair sellers hopeful amid bearish MACD signals and downbeat RSI (14).
Shanghai city’s authorities issued a new white list containing 864 financial institutions allowed to resume work, Reuters reports, citing three sources with direct knowledge of the matter said on Wednesday.
The report is not yet confirmed by the Shanghai government, although the move could be a part of the financial center’s plan to reopen broadly after a nearly two-month-long lockdown.
Meanwhile, the city reported a minor rise in cases to 855 on Tuesday from 823 on Monday, no infections were found outside of government quarantine for the fourth day.
On the other hand, Beijing reported 69 new cases for Tuesday, up from 52 on Monday. “Tianjin, close to the capital and where an outbreak in January disrupted global automakers Toyota Motor Corp. and Volkswagen AG, saw cases rise to 55 on Tuesday from 28 on Monday,” Bloomberg reported.
Nationwide, the case count rose for the first time in five days.
Market reaction
AUD/USD is under heavy selling pressure amid souring risk sentiment, currently battling 0.7000, down 0.41% on the day.
The S&P 500 futures snapped its uptrend to now drop 0.27% on the day.
- AUD/USD oscillates around 0.7000 as the focus shifts to aussie job data.
- The Aussie Unemployment Rate may improve to 3.9% vs. 4%, prior release.
- Inflationary pressures are compelling the Fed to announce two more 50 bps interest rate hikes in 2022.
The AUD/USD pair has experienced a correction in the early Asian session as the risk-on impulse loses strength. The major is expecting a rebound from its crucial support at 0.6990 amid a light calendar week for the greenback bulls.
The US dollar index (DXY) has witnessed a minor rebound in early Tokyo after a bearish Tuesday. The DXY has eased around 1.5% after hitting a fresh 19-year high of 105.00 last week. Vigorously advancing odds of a 50 basis point (bps) interest rate hike by the Federal Reserve (Fed) are failing to support the greenback bulls.
The Fed is focusing on bringing price stability to its economy sooner as soaring inflation is hurting the paychecks of the households. It won’t be a surprise if the Fed feature two more jumbo rate hikes in this calendar year.
On the Aussie front, investors are still in a fix of unexpected hawkish Reserve Bank of Australia (RBA). The release of the RBA minutes on Tuesday dictated that the option of elevating interest rates by 40 bps was also into consideration. This indicates that the RBA has started advancing its interest rate curve from its rock-bottom levels. This week the major event for the aussie bulls is the release of the Employment data. The Australian Bureau of Statistics is expected to report job additions in the total labor force at 30k, higher than the prior print of 17.5k. Also, the Unemployment Rate may improve to 3.9% against the former number of 4%.
The UK CPIs Overview
The cost of living in the UK as represented by the Consumer Price Index (CPI) for April month is due early on Wednesday at 06:00 GMT. Given the recently strong employment data, coupled with the increased odds of the Bank of England’s (BOE) faster/heavier rate hike trajectory, today’s data will be watched closely by the GBP/USD traders.
The headline CPI inflation is expected to refresh a 30-year high with a 9.1% YoY figure versus 7.0% prior while the Core CPI, which excludes volatile food and energy items, is likely to rise to 6.2% YoY during the stated month, from 5.7% previous readouts. Talking about the monthly figures, the CPI could increase to 2.6% versus 1.1% prior.
It’s worth noting that the recent pressure on wage prices and upbeat jobs report also highlight the Producer Price Index (PPI) as an important catalyst for the immediate GBP/USD direction. That being said, the PPI Core Output YoY may rise from 12.0% to 12.7% on a non-seasonally adjusted basis whereas the monthly prints may ease to 1.6% versus 2.0% prior. Furthermore, the Retail Price Index (RPI) is also on the table for release, expected to rise to 11.1% YoY from 9.0% prior while the MoM prints could inflate to 3.4% from 1.0% in previous readings.
In this regard, FXStreet’s Yohay Elam said,
All in all, a 9.1% annual increase in inflation is nothing to be cheerful about, and it supports further rate hikes by the Bank of England. However, policymakers have limited scope to act due to the nature of these price pressures. The old lady’s hands are tied.
Deviation impact on GBP/USD
Readers can find FXStreet's proprietary deviation impact map of the event below. As observed the reaction is likely to remain confined around 20-pips in deviations up to + or -2, although in some cases, if notable enough, a deviation can fuel movements over 60-70 pips.
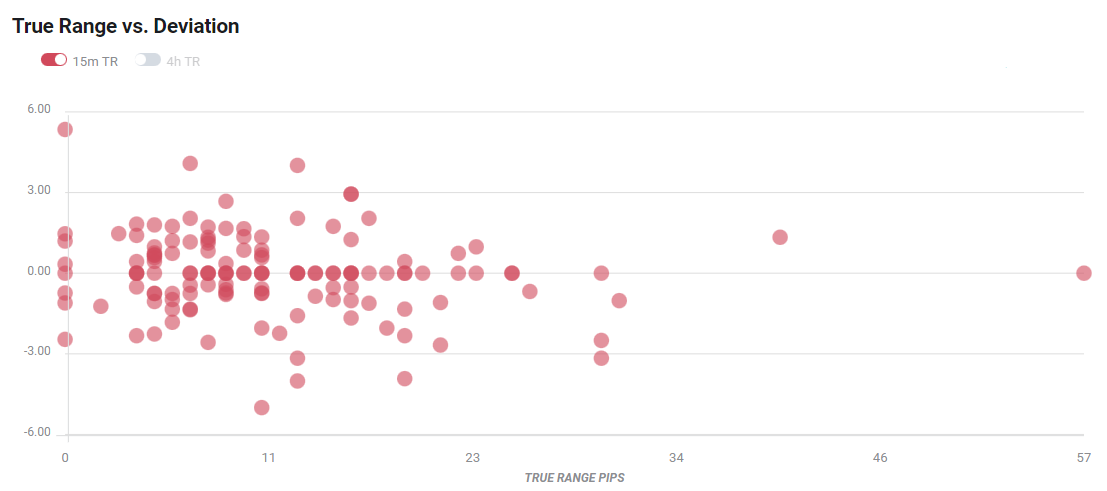
How could it affect GBP/USD?
GBP/USD remains pressured around the intraday low near 1.2470, snapping a three-day rebound from a two-year high, ahead of the key UK inflation data. The cable pair’s latest weakness could be linked to the US dollar’s rebound amid a risk-off mood and the hawkish Fedspeak. However, increasing odds of the Bank of England’s (BOE) faster/heavier rate hikes challenge the quote’s downside momentum.
That said, upbeat inflation data, which is more likely, can help the GBP/USD extend the latest advances for the time being. However, Treasury bond yields and GILTS are also likely to play an important role in determining short-term cable moves, which in turn suggests a pullback towards the recently flashed multi-month low.
Technically, the 20-DMA level near 1.2500 tests the GBP/USD buyers but a clear break of the one-month-old descending trend line, around 1.2250 at the latest, join the firmer RSI line to underpin bullish bias. Additionally, two-week-old horizontal support around 1.2400 could restrict the short-term pullback.
Key notes
UK CPI Preview: Inflation “apocalypse” priced in, GBP/USD has room to fall
GBP/USD Price Analysis: 20-DMA probes bulls near 1.2500 ahead of UK inflation
About the UK CPIs
The Consumer Price Index released by the Office for National Statistics is a measure of price movements by the comparison between the retail prices of a representative shopping basket of goods and services. The purchasing power of GBP is dragged down by inflation. The CPI is a key indicator to measure inflation and changes in purchasing trends. Generally, a high reading is seen as positive (or bullish) for the GBP, while a low reading is seen as negative (or Bearish).
- Gold takes offers to renew intraday low, extends previous day’s pullback from 200-DMA.
- Market sentiment worsens on China’s covid woes, hawkish Fedspeak.
- Second-tier data, qualitative catalysts to direct short-term moves with focus on inflation, growth and coronavirus.
- Gold Price Forecast: XAU/USD eyes a retest of multi-month lows below $1,800
Gold (XAU/USD) drops for the second consecutive day, taking offers around $1,808 to refresh the intraday low heading into Wednesday’s European session, as sour sentiment joins the firmer US dollar.
The market’s early-week optimism fades as China reports higher covid cases while the European Union (EU) and the US prepare for more hardships for Russia, due to Moscow’s invasion of Ukraine.
That said, Reuters reported an increase in Mainland China’s daily covid cases, to 1,305 from 1,100 prior while the virus-led death count also rose to three from one. Elsewhere, a third straight monthly fall in the foreign investment into the Chinese Yuan bonds also highlights the risk-off mood. Furthermore, chatters over the European Commission’s (EC) plan to move away from Russian energy imports also weigh on the sentiment.
It’s worth noting that comments from Chicago Fed President Charles Evans also seem to have weighed on the market’s mood by renewing fears of a faster rate hike as the policymaker said, “(the Fed) Should raise rates to 2.25%-2.5% neutral range 'expeditiously'.” On Tuesday, Fed Chair Jerome Powell and a generally-hawkish St Louis Fed President James Bullard pushed for a 50 bps rate hike and weighed on the USD.
Amid these plays, the US 10-year Treasury yields dropped 0.5 basis points (bps) to 2.966% whereas the S&P 500 Futures decline 0.40% intraday even as Wall Street posted heavy gains.
Looking forward, fresh catalysts defining the risk profile will be important for gold traders whereas US Housing Starts and Building Permits for April will join Fedspeak to offer extra directives.
Technical analysis
A failure to cross the May 11 swing low presently drags gold prices towards three-day-old horizontal support around $1,800.
However, RSI (14) is near the oversold territory and hence any further downside past $1,800 becomes less expected, which if happens will highlight the monthly low near $1,787 as another opportunity for buyers to sneak in.
Should the gold prices remain bearish below $1,787, the 61.8% Fibonacci Expansion (FE) of May 05-17 moves, near $1,760 will be in focus.
Alternatively, the weekly falling trend line and the latest peak restrict the XAU/USD’s short-term recovery near $1,835.
Following that, the 200-HMA level surrounding $1,842 will act as the last defense for the gold sellers.
Gold: Hourly chart
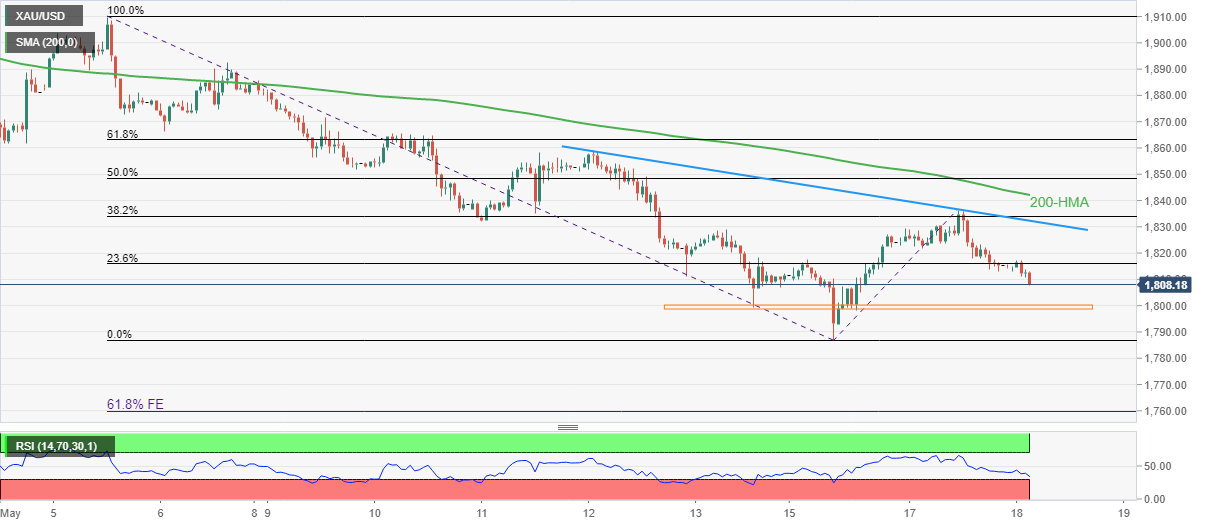
Trend: Limited downside expected
- USD/JPY takes offers to refresh intraday low, drops the most in a week.
- Descending RSI line, failures to cross immediate DMA favor sellers.
- Monthly support line adds to the downside filters, 131.30-35 appears a tough nut to crack for bulls.
USD/JPY remains on the back foot by refreshing intraday low to near 129.00, snapping three-day uptrend, while justifying the failure to cross the 10-DMA amid a softer RSI (14). That said, the yen pair prints the biggest daily loss in a week by the press time of Wednesday’s Asian session, down 0.25% around 129.10 by the press time.
While the 129.00 threshold acts as immediate support, the quote’s further downside will aim for an upward sloping trend line since late April, surrounding 127.65.
It’s worth noting that the monthly low around 127.50 and April 27 swing low near 126.95 could challenge USD/JPY bears past-127.65.
Meanwhile, a clear upside break of the 10-DMA, near 129.70 at the latest, could quickly attack the 130.00 threshold.
Though, a convergence of the previous support line from March and tops marked in April constitute strong resistance for the USD/JPY bulls to crack around 131.30-35.
Should the quote rises past 131.35, an upside rally to refresh the 20-year high near the 132.00 round figure becomes imminent.
USD/JPY: Daily chart
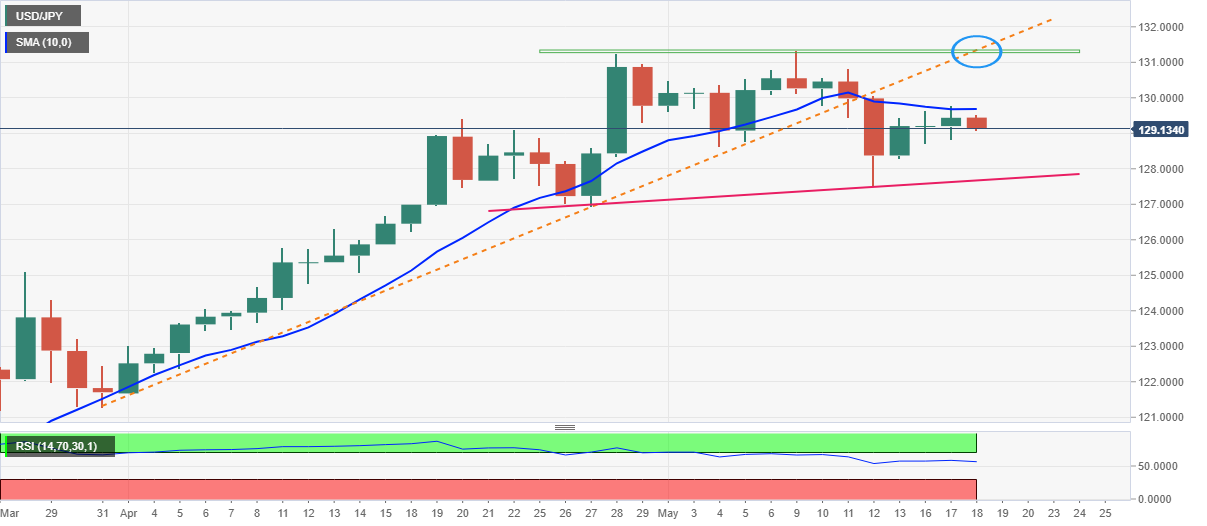
Trend: Further weakness expected
- The RSI (14) has displayed exhaustion signs in the downside momentum.
- An unchallenged 200-EMA is still favoring the greenback bulls.
- The asset is poised to record all-time highs sooner.
The USD/INR pair is expected to gauge a strong rebound after a bearish Tuesday. A risk-on impulse in Tuesday’s session strengthened the Indian rupee and the asset dragged lower to near 77.30. The greenback bulls have not surrendered their dominance yet and are likely to make a powerful comeback.
The formation of a Positive Divergence on an hourly scale is indicating a continuation of an uptrend after a healthy correction. It is worth noting on the hourly chart that the asset made a higher low and is trying to rebound while the momentum oscillator, Relative Strength Index (RSI) (14) made a lower low and tumbled below 40.00. The exhaustion in the downside risk of the asset is expected to spurt a rally in the asset prices.
A slippage below the 50-period Exponential Moving Average (EMA) at 77.53 is displaying a short-term struggle for the asset. While the 200-EMA at 77.32 has yet not been challenged, which signals that the upside is intact. The primary trendline placed from April 5 low at 75.27, adjoining May 4 low at 76.00 will continue to act as major support for the counter.
Should the asset oversteps Wednesday’s high at 77.63, an upside move towards Tuesday’s high at 78.02 will be observed. A breach of the latter will drive the asset towards an all-time high at 78.30.
Alternatively, the Indian rupee bulls could extend their control if the asset drops below the 200-EMA at 77.32 decisively. An occurrence of the same will drag the asset towards the psychological support at 77.00, followed by April 28 high at 76.79.
USD/INR hourly chart
-637884412752195931.png)
- EUR/USD is expecting an intensive buying action around 1.0550 ahead of Eurozone HICP.
- The annual Euro HICP is seen stable at 7.5%.
- Fed’s Powell has emphasized bringing price stability sooner.
The EUR/USD pair is struggling to overstep the crucial resistance of 1.0550 in the Asian session. The asset is experiencing a volatility contraction after a juggernaut upside move from a low of 1.0354 recorded last week. A rebound in the positive market sentiment on Tuesday improved the demand for the risk-perceived currencies upon which the shared currency bulls enjoyed the liquidity.
The asset is oscillating in a minor range of 1.0557-1.0533 as investors are awaiting the release of the Eurozone Harmonised Index of Consumer Prices (HICP) numbers, which are due in the European session. The annual figure is seen stable at 7.5% while the monthly figure could tumble to 0.6% against the prior print of 2.4%. The asset remained firmer on Tuesday after the Eurostat reported a tad better performance on the Gross Domestic Product (GDP) numbers front than the expectations. The yearly GDP landed at 5.1% vs. 5% while the quarterly figure printed at 0.3% vs. 0.2% as expected.
Meanwhile, the US dollar index (DXY) is holding itself above the round-level support of 103.00. The diminishing interest of investors in the safe-haven assets has brought an intense sell-off in the DXY. A fall of more than 1.5% has been recorded from its 19-year high of 105.00. The odds of more than two 50 basis points (bps) interest rate hikes in 2022 are advancing sharply. Federal Reserve (Fed) Jerome Powell has emphasized bringing the price stability sooner rather than later.
The US is considering blocking Russia’s ability to pay its US bondholders by allowing a key waiver to expire next week, Reuters reported, citing a Biden administration official late Tuesday.
Key quotes
"It's under consideration but I don't have a decision to preview at this time.”
"We are looking at all options to increase pressure on (Russian President Vladimir) Putin."
These comments come as Russia has a looming May 25 deadline when a US license allowing it to make payments is due to expire.
Market reaction
Risk sentiment is turning sour in Asia this Wednesday, in the face of hawkish Fed expectations, surging Beijing’s covid cases and Japanese GDP contraction.
The US dollar index is back on the bids, having stalled its correction, as the S&P 500 futures drop 0.15% on the day.
| Raw materials | Closed | Change, % |
|---|---|---|
| Brent | 112.52 | -1.25 |
| Silver | 21.617 | -0 |
| Gold | 1814.45 | -0.58 |
| Palladium | 2046.83 | 1.93 |
- USD/CNH rebounds from one-week low, picks up bids to refresh daily top.
- China New Home Prices drop for the first time in 2022, covid cases, virus-led deaths increase Mainland.
- Sour sentiment, hawkish Fedspeak underpins the US dollar’s corrective pullback.
- Second-tier US data, qualitative factors will be important for fresh impulse.
USD/CNH takes the bids to renew intraday high around 6.7600 as the US dollar pares recent gains during the sluggish Asian session. Also supporting the offshore Chinese yuan (CNH) pair are the recently flashed downbeat housing numbers at home, as well as hawkish comments from the US Federal Reserve (Fed) policymaker.
China House Price Index for April eased to 0.7% versus 1.5%. “China's new home prices in April fell for the first time month-on-month since December, official data showed on Wednesday, depressed by strict COVID-19 lockdowns in many cities, despite more easing steps aimed at supporting demand,” said Reuters after the data release.
Furthermore, news from Reuters that foreign investors cut holdings of Chinese Yuan bonds for third straight month in April also seems to weigh on the CNH prices.
Elsewhere, an increase in Mainland China’s daily covid cases, to 1,305 from 1,100 reported the previous day. It’s worth noting that the virus-led death count also rose to three from one, per the latest readings from Reuters.
On the other hand, comments from Chicago Fed President Charles Evans seem to have weighed on the market’s mood by renewing fears of a faster rate hike as the policymaker said, “(the Fed) Should raise rates to 2.25%-2.5% neutral range 'expeditiously'.” On Tuesday, Fed Chair Jerome Powell and a generally-hawkish St Louis Fed President James Bullard pushed for a 50 bps rate hike and weighed on the USD.
Previously, downbeat comments from the Fed policymakers and hopes of easing covid conditions in China seemed to have favored the USD/CNH bears.
Looking ahead, US Housing Starts and Building Permits for April will join Fedspeak to direct short-term USD/CNH moves. Additionally, covid headlines and news concerning Russia will also be important to watch.
Technical analysis
Although 10-day EMA triggered the USD/CNH pair’s recovery moves, around 6.7440 by the press time, the previous support line from April 19 challenges the immediate upside near 6.7920.
- AUD/USD extends pullback from weekly top, renews intraday high of late.
- Australia’s Q1 2022 Wage Price Index eased from market forecasts.
- Failures to cross 100-SMA, RSI pullback directs sellers toward 50-SMA.
- Weekly support line, one-month-old trend line resistance act as additional trading filters.
AUD/USD sellers attack 0.7000 psychological magnet as traders consolidate recent gains after downbeat Australian data during Wednesday’s Asian session.
That said, Australia’s quarterly Wage Price Index reprinted 0.7% QoQ growth, versus the 0.8% forecast, while the yearly numbers eased below 2.5% anticipated to 2.4%.
Read: Aussie wage price index miss weighs on AUD/USD
That said, the Aussie pair’s weakness to cross the short-term key moving average joins the recently easing bullish bias of the MACD and softer RSI (14) line to keep sellers hopeful.
However, the 50-SMA and the one-week-old support line, respectively around 0.6965 and 0.6930, will challenge the AUD/USD bears before activating the next round of southward trajectory.
On the contrary, a sustained break of the 100-SMA, around 0.7045 by the press time, will direct AUD/USD prices towards the one-month-old resistance line near 0.7090.
Following that, the 0.7100 threshold may act as an extra filter to test the buyers before directing them towards the monthly high surrounding 0.7265-70.
AUD/USD: Four-hour chart
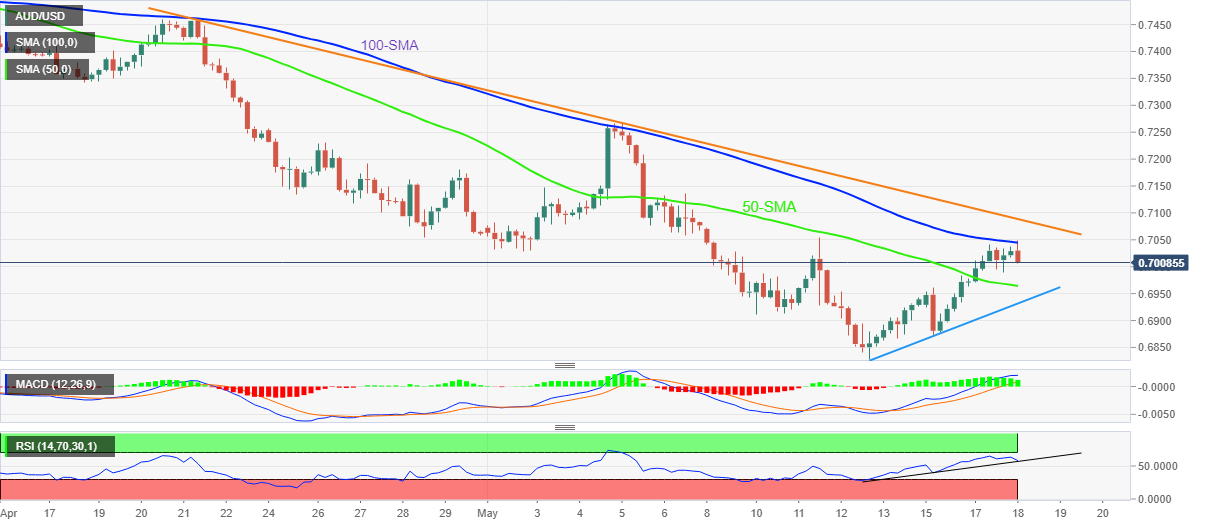
Trend: Further weakness expected
- AUD/JPY bears move in as the Aussie drops following wages miss.
- The yen is picking up a safe haven bid again.
At 90.61, AUD/JPY is down on the day so far by some 0.3% following a drop from 91.16, suffering from a weaker than expected wages report from Australia and ongoing angst over global growth.
Aussie wages
- Australia Q1 wage price index +0.7 pct QoQ, s/adj (Reuters poll +0.8 pct).
- Australia Q1 wage price index +2.4 pct YoY, s/adj (Reuters poll +2.5 pct).
There was a delayed reaction to the data with the Aussie only dropping some 15 minutes after the release as the market digested the prospects of a less hawkish central bank. The data was accompanied by poor housing data from China which could also be weighing on the Aussie. China's April house prices arrived at -0.2% MoM and +0.7% YoY, down from March.
Overall, the yen has benefitted from risk-off markets over the month and the Aussie from a softer US dollar this week as some risk appetite returned to markets.
Despite a mile recovery in stocks, there were nervy signs elsewhere as economic growth fears in the world's two largest economies have re-emerged following weak Retail Sales and factory production figures in China and disappointing US manufacturing data which can continue to benefit the yen for its safe-haven qualities.
According to the latest Reuters poll, the Bank of England (BOE) is predicted to embark upon an aggressive tightening cycle than previously expected, despite the UK economy battling the worst cost-of-living crisis in three decades.
Key findings
“Asked when the cost-of-living crisis would peak, seven of 13 respondents to an additional question in the May 12-17 poll said the fourth quarter. Three said next quarter and three said by the end of next month.”
“Participants in the poll saw little let up with inflation averaging 8.3% next quarter from 8.7 in the current one, an increase from the 7.9% and 8.4% in April’s survey.”
“Medians in the poll showed it rising again to 1.25% in June and to 1.50% next quarter before a pause ahead of an increase to 1.75% in the second quarter of 2023.”
“Fifteen saw it below 1.50%, 22 saw it at that level while 19 expected it to be higher - with the top forecasts at 2.25%.”
“The economy will grow 3.7% on average during 2022 and then expand 1.3% next year, median forecasts of nearly 70 economists showed, down from the 3.8% and 1.7% given last month.”
Chicago Fed President Charles Evans is back on the wires, via Reuters, continuing with his comments on the central bank’s monetary policy.
Key quotes
Time to adjust balance sheet back to more normal setting.
Wouldn't say that involves full round trip in its size.
Likely Fed will raise rates above neutral.
Sees slowing pace of hikes to 25bps steps before December.
Related reads
- Fed’s Evans: Should raise rates to 2.25%-2.5% neutral range 'expeditiously'
- US Dollar Index directs four-day downtrend towards 103.00 despite firmer yields
- Gold price remains sidelined after reversing from 200-DMA.
- Risk-on mood fades amid a lackluster session as Fedspeak joins with not-so-impressive data.
- Second-tier economic details, headlines concerning Russia, coronavirus will be important for fresh directions.
- Gold Price Forecast: Bears ready to jump in at higher levels
Gold (XAU/USD) prices retreat from intraday high, staying range-bound near $1,813-18, as global markets struggle for clear directions to extend the previous optimism. In doing so, the precious metal keeps the previous day’s pullback from the 200-DMA during a lackluster Asian session on Wednesday.
Market sentiment dwindles as the recent Fedspeak seems more hawkish than the earlier ones while headlines concerning the EU’s oil embargo on Russian imports, as well as China’s covid conditions, test optimists. Even so, firmer growth numbers from Japan and Eurozone, upbeat Retail Sales from the US and UK’s strong jobs report keeping traders hopeful.
Fed’s Evans seems to have weighed on the market’s mood by renewing fears of a faster rate hike as the policymaker said, “(the Fed) Should raise rates to 2.25%-2.5% neutral range 'expeditiously'.” On Tuesday, Fed Chair Jerome Powell and a generally-hawkish St Louis Fed President James Bullard pushed for a 50 bps rate hike and weighed on the USD.
Talking about the data, the preliminary Eurozone GDP for Q1 2022 rose past 5.0% YoY to 5.1% while also rising above 0.2% QoQ expectations to 0.3%. On the other hand, the US Retail Sales rose at a pace of 0.9% MoM in April, slightly better than the expected pace of 0.7% but softer than the upwardly revised 1.4% growth (from 0.5%). Recently, Japan’s preliminary readings of Q1 2022 GDP rose past -0.4% expectations to -0.2% QoQ whereas the Annualized GDP improved to -1.0% versus -1.8% forecasted.
On a different page, the Financial Times (FT) news that China diverts anti-poverty funds to covid testing as the crisis deepens joins the chatters over the European Commission’s (EC) plan to move away from Russian energy imports weighing on the market’s mood.
Against this backdrop, the US 10-year Treasury yields rose 0.5 basis points (bps) to 2.988% whereas the S&P 500 Futures struggle for clear directions even as Wall Street posted heavy gains.
That said, gold traders may witness further declines should the US Dollar Index benefits from the latest cautious optimism, currently unchanged near 103.35. In doing so, the greenback gauge may take clues from the second-tier housing numbers and qualitative factors concerning coronavirus and geopolitics.
Technical analysis
Gold prices keep the previous day’s pullback from 200-DMA despite staying inside a $5.00 trading range of late.
Given the bearish MACD signals and the metal’s failures to cross the key moving average, around $1,838 by the press time, XAU/USD may revisit a yearly horizontal support area near $1,790-85.
However, a clear downside break of the $1,800 threshold becomes necessary for the bears before aiming at the yearly support.
Alternatively, a successful run-up beyond the 200-DMA level of $1,838, won’t be an open invitation to gold buyers as a downward sloping trend line from late April and multiple resistances from January 25, respectively around $1,845 and $1,855, will probe bulls afterward.
Gold: Daily chart
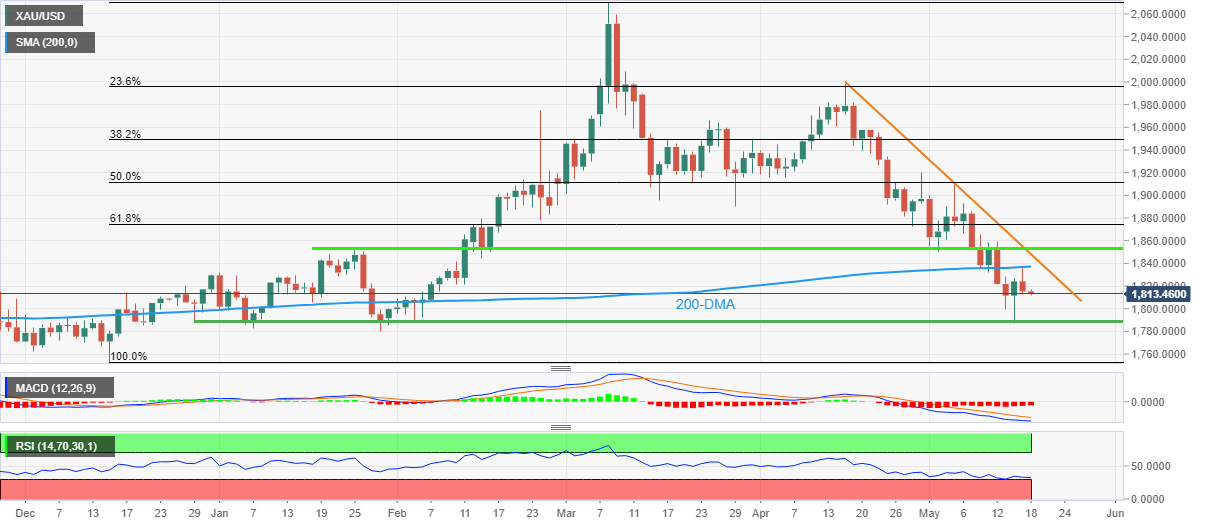
Trend: Pullback expected
AUD/USD is heavy following the miss in Australia's main wages measure that has been a focus for markets today with respect to the Reserve Bank of Australia's monetary policy.
Analysts at Westpac explained that wages are now back to a pre-Covid pace where wages were underperforming economic activity. ''If there was ever a time for wages to regain some of the relationships with broader labour market indicators, 2022 must be the year.''
''Even more important than the fall in unemployment to 4% has been the more than halving of underemployment, from a peak of 13.6% in Apr 2020 to 6.3% in Mar 2022. ''
The data has arrived as follows:
Aussie wages
- Australia Q1 wage price index +0.7 pct QoQ, s/adj (Reuters poll +0.8 pct).
- Australia Q1 wage price index +2.4 pct YoY, s/adj (Reuters poll +2.5 pct).
AUD/USD is a few pips lower.
About the Wage Price Index
The Wage Price Index released by the Australian Bureau of Statistics is an indicator of labor cost inflation and of the tightness of labor markets. The Reserve Bank of Australia pays close attention to it when setting interest rates. A high reading is positive (or bullish) for the AUD, while a low reading is seen as negative (or bearish).
In recent trade today, the People’s Bank of China (PBOC) set the yuan (CNY) at 6.7421 vs the prior fix of 6.7854 and the previous close of 6.7376.
About the fix
China maintains strict control of the yuan’s rate on the mainland.
The onshore yuan (CNY) differs from the offshore one (CNH) in trading restrictions, this last one is not as tightly controlled.
Each morning, the People’s Bank of China (PBOC) sets a so-called daily midpoint fix, based on the yuan’s previous day closing level and quotations taken from the inter-bank dealer.
- DXY renews weekly bottom during fourth consecutive day of declines.
- US Treasury yields remain firmer amid upbeat US data, mixed Fedspeak.
- Market sentiment dwindles amid a light calendar in Asia.
- Second-tier US data, Fed speakers’ comments will be important for fresh impetus.
US Dollar Index (DXY) remains on the back foot for the fourth consecutive day, refreshing a weekly low around 103.20 by the press time of Wednesday’s Asian session.
The greenback gauge’s latest weakness contrasts with the recently upbeat comments from Chicago Fed President Charles Evans. The reason could be linked to the market’s cautious optimism amid an absence of major data/events.
Fed’s Evans seems to have weighed on the market’s mood by renewing fears of a faster rate hike as the policymaker said, “(the Fed) Should raise rates to 2.25%-2.5% neutral range 'expeditiously'.” On Tuesday, Fed Chair Jerome Powell and a generally-hawkish St Louis Fed President James Bullard pushed for a 50 bps rate hike and weighed on the USD.
It’s worth observing that the previous day’s firmer US data underpinned the market’s risk-on mood as it joined multiple statistics from the UK and Eurozone to defy the growth concerns. That said, The preliminary Eurozone GDP for Q1 2022 rose past 5.0% YoY to 5.1% while also rising above 0.2% QoQ expectations to 0.3%. On the other hand, the US Retail Sales rose at a pace of 0.9% MoM in April, slightly better than the expected pace of 0.7% but softer than the upwardly revised 1.4% growth (from 0.5%). Recently, Japan’s preliminary readings of Q1 2022 GDP rose past -0.4% expectations to -0.2% QoQ whereas the Annualized GDP improved to -1.0% versus -1.8% forecasted.
Elsewhere, the Financial Times (FT) news that China diverts anti-poverty funds to covid testing as the crisis deepens joins the chatters over the European Commission’s (EC) plan to move away from Russian energy imports weighing on the market sentiment.
Amid these plays, the US 10-year Treasury yields rose 1.8 basis points (bps) to 2.988% whereas the S&P 500 Futures struggle for clear directions even as Wall Street posted heavy gains.
Looking forward, housing data from the US will join inflation numbers from Eurozone and Canada to entertain momentum traders. Though, Fedspeak and risk catalysts will be more important to follow for clear directions.
Technical analysis
A sustained break of the one-month-old rising trend line, around 104.67 by the press time, directs DXY bears towards an upward sloping support line from late March, close to 102.50.
- The oil prices have recovered sharply on rising supply worries.
- Falling oil inventories in USPR have underpinned the oil bulls.
- Oil output from Moscow has plunged 9% post its invasion of Ukraine.
West Texas Intermediate (WTI) futures on NYMEX, has rebounded sharply after testing its crucial support of $110.00 in the New York session. After a mild correction, the oil prices are set to advance further towards the round level resistance of $115.00.
The strength in the oil bulls is backed by lower oil inventories in the US Strategic Petroleum Reserve (SPR). The US SPR has fallen to 538 million barrels, the lowest since 1987, as per Reuters. Earlier, US President Joe Biden announced the highest release of oil from its US SPR to diminish the supply worries. Meanwhile, oil supply from Moscow has plunged by 9% as per Hellenic Shipping news. Russian oil output has been reported at 9.16 million barrels per day (bpd) in April, a deviation by 860,000 million bpd raises concerns over the supply issues in an already tight oil market.
On Wednesday, the European Union (EU) unveiled a 210 billion euro plan to end its dependence on oil from Russia by 2027 as per Reuters. This has elevated the oil supply worries, which will keep the bullish momentum intact
On the demand side, China has imposed more restrictive measures to curb the spread of the Covid-19. The Chinese administration is advocating a Work From Home (WFH) policy to contain the spread of the virus and remove curbs on the movement of men, materials, and machines.
- Nikkei is on the front foot in the heals of US risk appetite.
- Wall Street Journal live event were some of his most hawkish comments from the Fed so far.
Asia-Pac stock markets and risk appetite are higher on Wednesday as the region takes impetus from the gains across global peers. In Japan, the Nikkei 225 opened evenly the prior day and rose to the close, finishing up 0.4% yesterday and has started the day over 1% higher today.
A softer yen against the US dollar boosted export issues while Asian stock markets have tracked higher on the outlook that Beijing will ease both anti-pandemic lockdowns and regulations upon the nation's tech industry. Overnight, risk appetite in the US was helped by Industrial Production and Retail Sales data, leading the way for a positive start in Asia.
Overnight, the Federal Reserve Jerome Powell said that the US central bank will raise interest rates until there is “clear and convincing” evidence that inflation is in retreat. The remarks at a Wall Street Journal live event were some of his most hawkish so far yet the markets were relieved that nothing more hawkish was stated, such as the prospects of 75bps hikes in the coming meetings. If the economy performs as expected, 50bp hikes remain on the table.
Powell does see upside wage inflation risks, and he reiterated that the FOMC needs "to see inflation coming down in a clear and convincing way and we're going to keep pushing until we see that. If that involves moving past broadly understood levels of neutral we won't hesitate at all to do that."
- GBP/USD grinds higher around weekly top after rising the most since October 2020.
- Monthly resistance break, firmer RSI keep buyers hopeful.
- Previous support line from December 2021 lures buyers.
GBP/USD bulls take a breather around 1.2500, after rising the most in 19 months the previous day. That said, the cable pair battles with the 20-DMA around the weekly top by the press time of Wednesday’s Asian session, while waiting for the monthly inflation data from the UK.
Read: UK CPI Preview: Inflation “apocalypse” priced in, GBP/USD has room to fall
Although the 20-DMA level near 1.2500 tests the GBP/USD bulls, the cable pair’s ability to cross the one-month-old descending trend line, around 1.2250 at the latest, joins the firmer RSI line to underpin bullish bias.
That said, the quote presently aims for the monthly peak surrounding 1.2640 before approaching the support-turned-resistance line from late 2021, around 1.2900 by the press time.
On the contrary, two-week-old horizontal support around 1.2400 could restrict the short-term pullback of the GBP/USD prices before directing the bears toward the previous resistance line near 1.2250.
In a case where GBP/USD drops below 1.2250, a south-run towards the latest multi-month low of 1.2155 and the 1.2000 psychological magnet can’t be ruled out.
GBP/USD: Daily chart
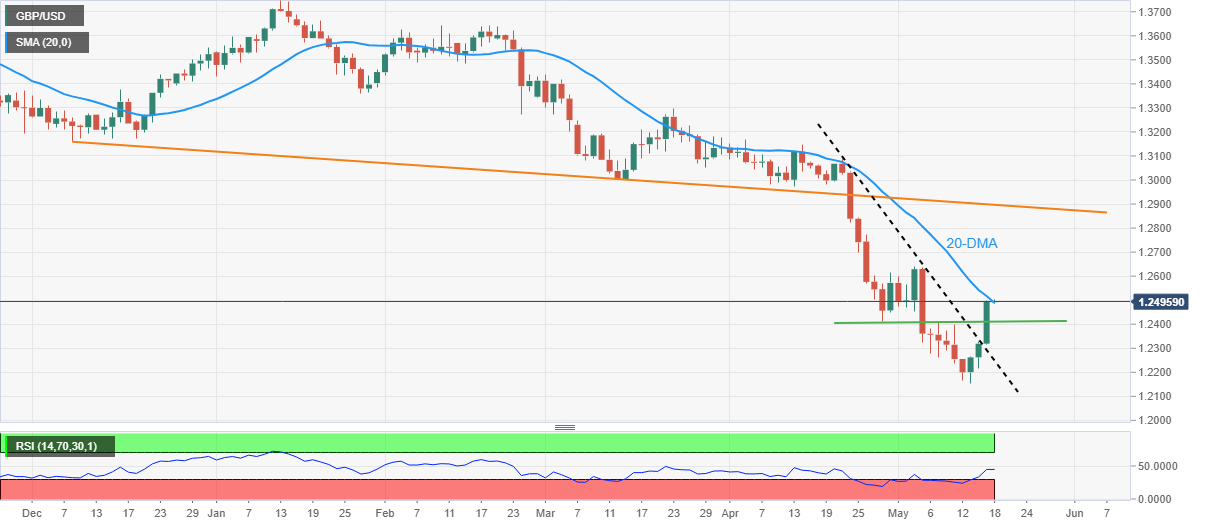
Trend: Further upside expected
- USD/CAD is in the hands of the bears that are taking out key support structures.
- Price imbalance mitigation between 1.2700 and 1.2900 would be expected to play out over the coming days.
USD/CAD is moving below critical support on the charts and the pair could be in for a deeper run towards structure lower down. The following illustrates the potential price path on various time frames for the foreseeable future.
USD/CAD daily chart
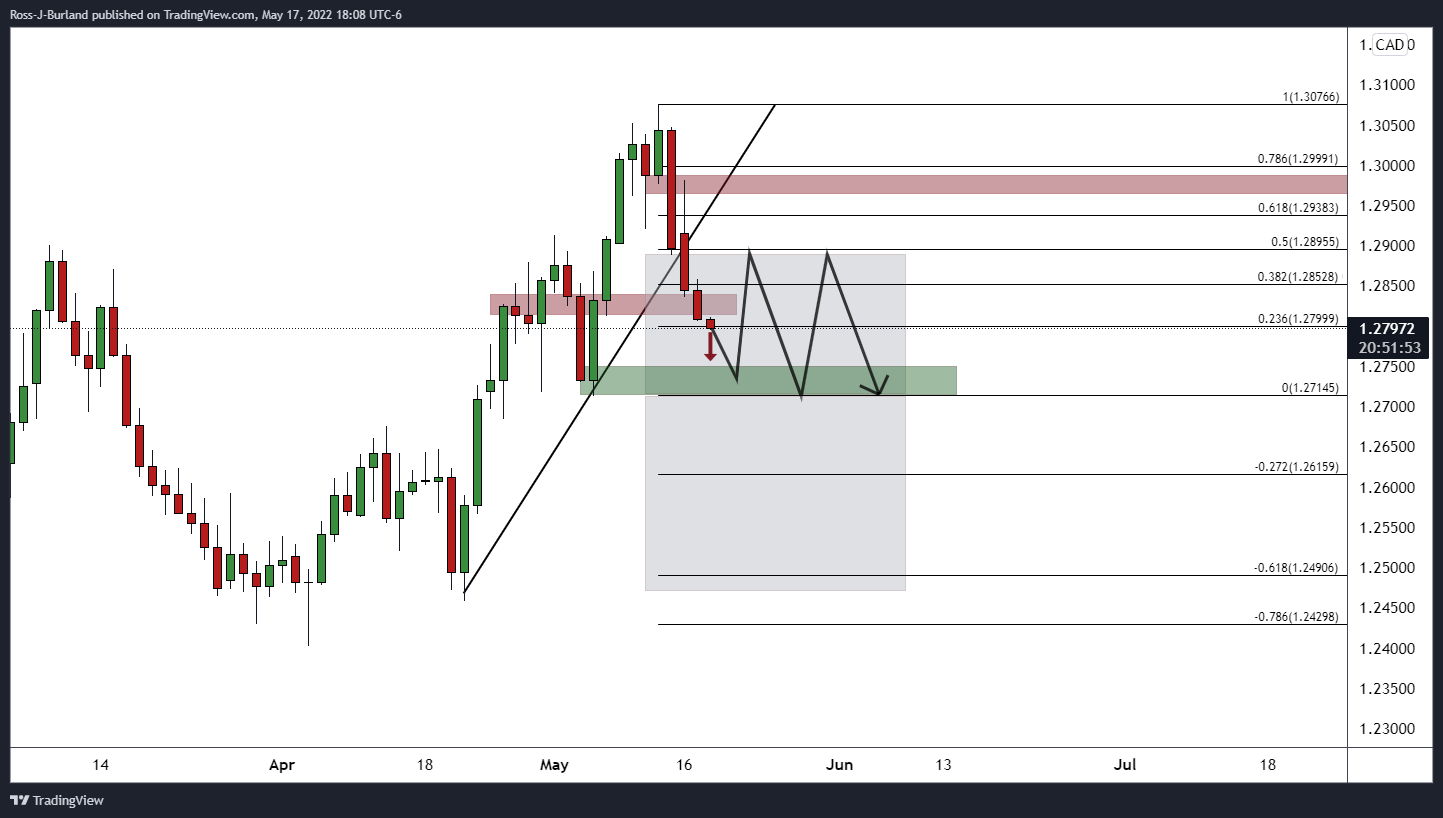
The price would be expected to meet with demand in the low 1.2700s and potentially mitigate upside territory and price imbalances over the course of the coming days between there and 1.2900 vs. the counter trendline.
USD/CAD H4 and H1 charts
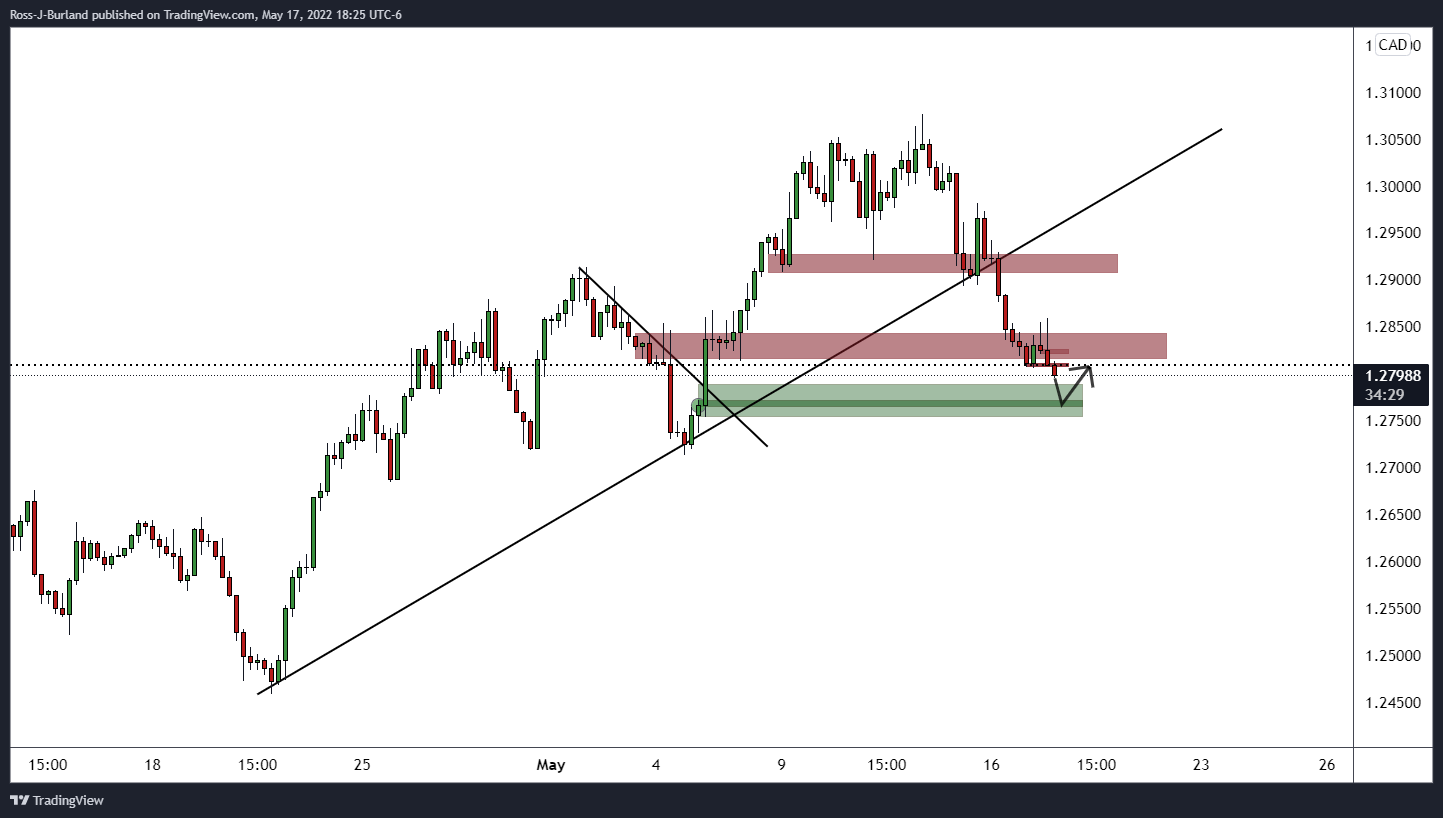
The price has melted all the way through four-hour support and is now embarking on a run even lower to test the next critical layer of support in the 1.2770s.
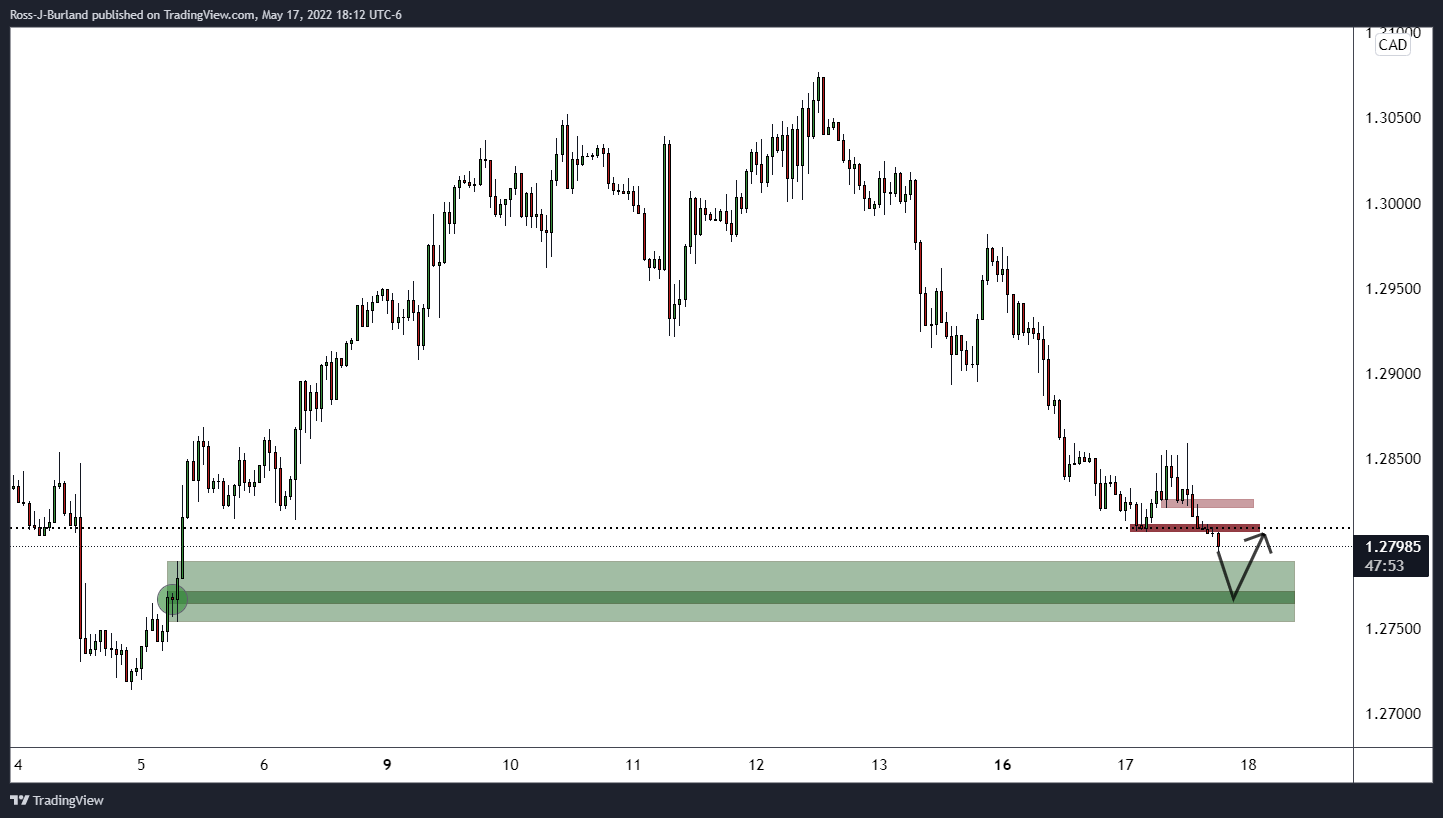
This is identified even clearer on the hourly chart.
- USD/JPY has failed to overstep 129.50 on higher-than-expected Japan’s GDP.
- Fed may feature more 50 bps rate hikes to cool off the heated inflation.
- Japan’s inflation may elevate to 1.5% vs. 1.2% this week.
The USD/JPY pair is witnessing a gradual fall in the Asian session after the Japanese Cabinet Office reported the annual Gross Domestic Product (GDP) numbers at -1% vs. the expectation of -1.8% and the prior print of 3.8%. A less negative GDP figure has supported the Japanese yen against the greenback. The quarterly GDP numbers have also outperformed after landing at -0.2% against the estimated figure of -0.4%.
Apart from the GDP numbers, the vulnerable performance of the US dollar index (DXY) is also hurting the asset. The DXY is set to display more losses as the asset has tumbled below Tuesday’s low at 103.23. An improvement in the risk appetite of the market participants has dampened the safe-haven appeal of the DXY. Meanwhile, odds of a 50 basis point (bps) rate hike by the Federal Reserve (Fed) has been bolstered as the Fed is focusing on scaling down the soaring inflation in a most ‘convincing’ way.
To cool off the heated inflation, Fed needs to feature more rate hikes sooner rather than later. Investors should brace for more than two jumbo rate hikes in the calendar year. It is worth noting that the Fed has already announced one jumbo rate hike in the first week of May.
This week, the major event will be Japan’s inflation numbers, which are due on Friday. A preliminary estimate for the annual Consumer Price Index (CPI) figure is 1.5% vs. the prior print of 1.2%. Along with this, the core CPI could drop to -0.9%, against the former figure of 0.7%.
- Global markets stabilize as risk-on mood fades amid hawkish Fedspeak, light calendar.
- Fed’s Evans pushes for faster rate hikes to reach 2.25-2.5% neutral range.
- Fed Chairman Powell, Bullard backed 50 bps but firmer data favored yields.
- China’s covid optimism, recently upbeat data across the globe underpinned positive sentiment of late.
Having witnessed an upbeat start to the week, trading sentiment eased during the mid-Asian session on Wednesday as a lack of major catalyst, as well as hawkish comments from the Fed official, challenged previous optimism.
Amid these plays, the Wall Street benchmarks closed positive even if the US 10-year Treasury yields rose nearly 10 bps to 2.99% at the latest. The S&P 500 Futures struggle, however, around 4,090 by the press time.
That said, recent comments from Chicago Fed President Charles Evans seem to have weighed on the market’s mood by renewing fears of a faster rate hike as the policymaker said, “(the Fed) Should raise rates to 2.25%-2.5% neutral range 'expeditiously'.” On Tuesday, Fed Chair Jerome Powell and a generally-hawkish St Louis Fed President James Bullard pushed for a 50 bps rate hike and weighed on the USD.
Also weighing on the market’s mood is the news, shared by Reuters, suggesting that the European Commission is up for releasing plans to escape route from Russian fossil fuels.
It’s worth noting that Shanghai’s plans for unlock, after witnessing a three-day streak of zero covid cases outside the quarantine area, joined the dragon nation’s readiness for further infrastructure spending to underpin market optimism the previous day.
On the same line were firmer Eurozone GDP and the US Retail Sales figures that shrug off growth concerns. The preliminary Eurozone GDP for Q1 2022. The bloc’s GDP rose past 5.0% YoY to 5.1% while also rising above 0.2% QoQ expectations to 0.3%. On the other hand, the US Retail Sales rose at a pace of 0.9% MoM in April, slightly better than the expected pace of 0.7% but softer than the upwardly revised 1.4% growth (from 0.5%).
Recently, Japan’s preliminary readings of Q1 2022 GDP rose past -0.4% expectations to -0.2% QoQ whereas the Annualized GDP improved to -1.0% versus -1.8% forecasted.
Moving on, headlines concerning covid, geopolitics and growth become crucial for short-term directions amid a light calendar day ahead, except for inflation numbers from Eurozone and Canada, not to forget second-tier housing data from the US.
Also read: Forex Today: Dollar extends its decline as sentiment improves
| Index | Change, points | Closed | Change, % |
|---|---|---|---|
| NIKKEI 225 | 112.7 | 26659.75 | 0.42 |
| Hang Seng | 652.31 | 20602.52 | 3.27 |
| KOSPI | 23.86 | 2620.44 | 0.92 |
| ASX 200 | 19.5 | 7112.5 | 0.27 |
| FTSE 100 | 53.55 | 7518.35 | 0.72 |
| DAX | 221.56 | 14185.94 | 1.59 |
| CAC 40 | 82.42 | 6430.19 | 1.3 |
| Dow Jones | 431.17 | 32654.59 | 1.34 |
| S&P 500 | 80.84 | 4088.85 | 2.02 |
| NASDAQ Composite | 321.73 | 11984.52 | 2.76 |
| Pare | Closed | Change, % |
|---|---|---|
| AUDUSD | 0.70285 | 0.8 |
| EURJPY | 136.474 | 1.39 |
| EURUSD | 1.05509 | 1.1 |
| GBPJPY | 161.554 | 1.65 |
| GBPUSD | 1.24889 | 1.35 |
| NZDUSD | 0.63613 | 0.81 |
| USDCAD | 1.28069 | -0.33 |
| USDCHF | 0.99291 | -0.86 |
| USDJPY | 129.362 | 0.3 |
- Silver prices struggle to extend monthly resistance breakout.
- Bearish candlestick, 10-DMA probes upside momentum.
- Impending bull cross on MACD, clear break of short-term resistance, not support, keeps buyers hopeful.
Silver (XAG/USD) steadies around $21.60, following a pullback from the weekly high, during Wednesday’s Asian session.
In doing so, the bright metal justifies Tuesday’s Gravestone Doji candlestick while also portraying failures to cross the 10-DMA, around $21.65 by the press time.
Even so, a looming bull cross of the MACD signal joins the metal’s successful break of a one-month-old resistance, now support around $21.20, to keep silver buyers hopeful.
Should the quote rises past $21.65, the $22.00 may offer an intermediate halt during the run-up to a monthly high near $23.30.
Meanwhile, a downside break of the resistance-turned-support, near $21.20, won’t hesitate to direct XAG/USD towards the multi-month low marked in May around $20.45.
Following that, the $20.00 psychological magnet will be crucial for the bears to watch.
Overall, silver remains directed towards the north but short-term hurdles test recovery moves.
Silver: Daily chart
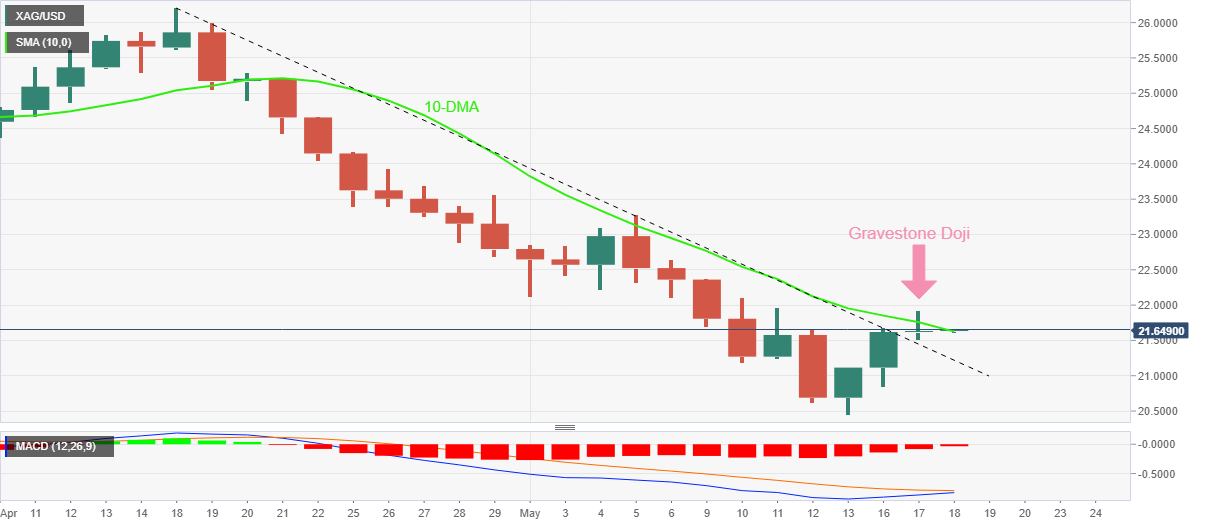
Trend: Further upside expected
- USD/CHF is auctioning below 0.9950 on positive market sentiment.
- Fed’s focus on bringing price stability will force it to announce more rate hikes.
- The Swiss franc bulls are awaiting the release of the Industrial Production, which is due on Friday.
The USD/CHF pair is struggling below 0.9950 as the risk-on market mood deepens and safe-haven appeal loses strength. The pair has remained vulnerable after surrendering the psychological cushion of 1.0000 on Tuesday and has dropped to near 0.9920.
The US dollar index (DXY) has shifted into a correction phase after remaining firmer for the past few trading weeks. The DXY has tumbled to near 103.20 and has eased 1.5% after registering a fresh 19-year high at 105.00 last week. It looks like the market participants have already discounted the interest rate hikes, which are to be announced by the Federal Reserve (Fed) this year.
The Q&A session with Fed chair Jerome Powell at Wall Street Journal (WSJ), has cleared the intentions of the Fed towards bringing price stability to the economy. Mounting inflationary pressures are hurting the paychecks of the households. To contain the soaring inflation, the Fed would resort to deploying strict quantitative measures to scale down the heated inflation.
On the Swiss franc front, investors are awaiting the release of the Industrial Production numbers, which are due on Friday. Earlier, the Swiss Statistics reported the quarterly Industrial Production at 7.3%. A higher-than-expected figure will further strengthen the Swiss franc bulls against the greenback. Alternatively, the greenback bulls could regain control if the occurrence reverses.


© 2000-2026. Sva prava zaštićena.
Sajt je vlasništvo kompanije Teletrade D.J. LLC 2351 LLC 2022 (Euro House, Richmond Hill Road, Kingstown, VC0100, St. Vincent and the Grenadines).
Svi podaci koji se nalaze na sajtu ne predstavljaju osnovu za donošenje investicionih odluka, već su informativnog karaktera.
The company does not serve or provide services to customers who are residents of the US, Canada, Iran, The Democratic People's Republic of Korea, Yemen and FATF blacklisted countries.
Izvršenje trgovinskih operacija sa finansijskim instrumentima upotrebom marginalne trgovine pruža velike mogućnosti i omogućava investitorima ostvarivanje visokih prihoda. Međutim, takav vid trgovine povezan je sa potencijalno visokim nivoom rizika od gubitka sredstava. Проведение торговых операций на финанcовых рынках c маржинальными финанcовыми инcтрументами открывает широкие возможноcти, и позволяет инвеcторам, готовым пойти на риcк, получать выcокую прибыль, но при этом неcет в cебе потенциально выcокий уровень риcка получения убытков. Iz tog razloga je pre započinjanja trgovine potrebno odlučiti o izboru odgovarajuće investicione strategije, uzimajući u obzir raspoložive resurse.
Upotreba informacija: U slučaju potpunog ili delimičnog preuzimanja i daljeg korišćenja materijala koji se nalazi na sajtu, potrebno je navesti link odgovarajuće stranice na sajtu kompanije TeleTrade-a kao izvora informacija. Upotreba materijala na internetu mora biti praćena hiper linkom do web stranice teletrade.org. Automatski uvoz materijala i informacija sa stranice je zabranjen.
Ako imate bilo kakvih pitanja, obratite nam se pr@teletrade.global.
транcфери