- Analiza
- Novosti i instrumenti
- Vesti sa tržišta
Forex-novosti i prognoze od 19-05-2022
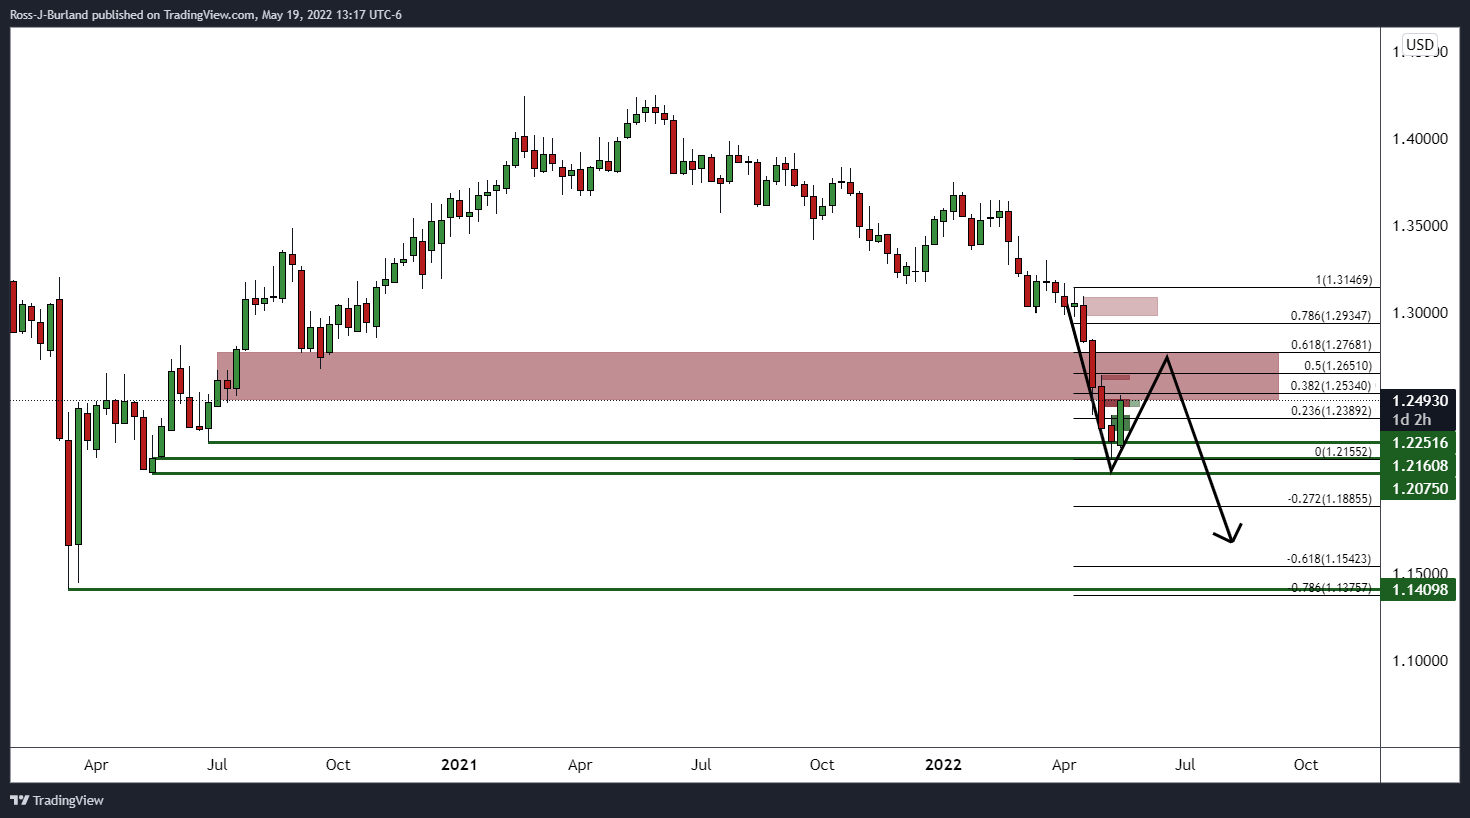
- US dollar has been in the hands of the bears despite an uber hawkish Fed.
- The four-hour chart is bullish with risk of a deeper retracement towards a 50% mean reversion towards 103.267.
At 102.868, the DXY index is down 1% and has fallen from a high of 103.877 to a low of 102.657, extending its pullback from a two-decade high on the last day of the week. The greenback has fared poorly against riskier currencies, as measured by the DXY index, which tracks the greenback against six major currencies, falling to its lowest since May 5.
The index hit a near two-decade high last week as a hawkish Federal Reserve and growing worries about the state of the global economy helped lift the greenback to score some 7.5% higher for the year so far. However, there has been a sense that the US is leading to a recession and a hard landing may not be favourable for the greenback.
Nevertheless, Fed officials remain hawkish and there has been a series of speakers this week, including the Fed chairman whose comments during an interview with the Wall Street Journal were the most hawkish yet. He said the Fed will have to slow growth to bring inflation back down to its 2% target. Raising interest rates will tighten financial conditions, which affects the economy, but he warned, “we don’t have precision tools.” “There could be some pain involved,” he said, “but we think we can maintain a strong labour market, defined as a labour market where unemployment is low and wages are moving up.” “It may not be the perfect labour market, but it will be a strong labour market,” he added.
His remarks were followed up on Wednesday by Fed's Charles Evans saying that the Fed will likely hike rates above neutral. “If we go 50 bp beyond that, if we go 75 bp beyond that, then that restrictive setting of policy should be working to bring inflation down.” Evans added that “My own assessment of ‘neutral’ is in the 2.25-2.5% range.”
Fed's Patrick Harker also commented yesterday and said “We don’t want to overdo it. But we have to act and we are acting.” He added that the US may have a few quarters of negative growth, but that is not what he is forecasting. Lastly, Harker said the Fed can engineer a “safe” if not “soft” landing for the economy.
On Thursday, Kansas City Fed’s Esther George noted that financial conditions are starting to tighten and said that it would take “something very different” to support larger rate increases. George added that she is very comfortable with 50bps rate rises.
In this regard, analysts at ANZ Bank said that while ''tighter financial conditions are of course needed to reduce demand and bring inflation down, the pace at which financial conditions have tightened may push back against a 75bps rate rise next month, unless of course the Consumer Price Index and labour market data are exceptionally strong. A key question, however, is how quickly will labour demand slow?''
Meanwhile, today's weekly initial claims were showing early signs of trending higher from their record lows in March, which analysts at ANZ Bank said ''may be a very early indication that demand for labour is beginning to ease a little. But it’s early days, and with 1.9 job openings per unemployed person, the US labour market remains extremely stretched.''
As for yields, US bond yields fell and the yield curve bull steepened, as investors continue to turn to safe assets following the equities sell-off yesterday. The 2-year government bond yields fell from 2.68% to 2.58%, and the 10's government bond yields fell from 2.90% to 2.77%.
US dollar technical analysis
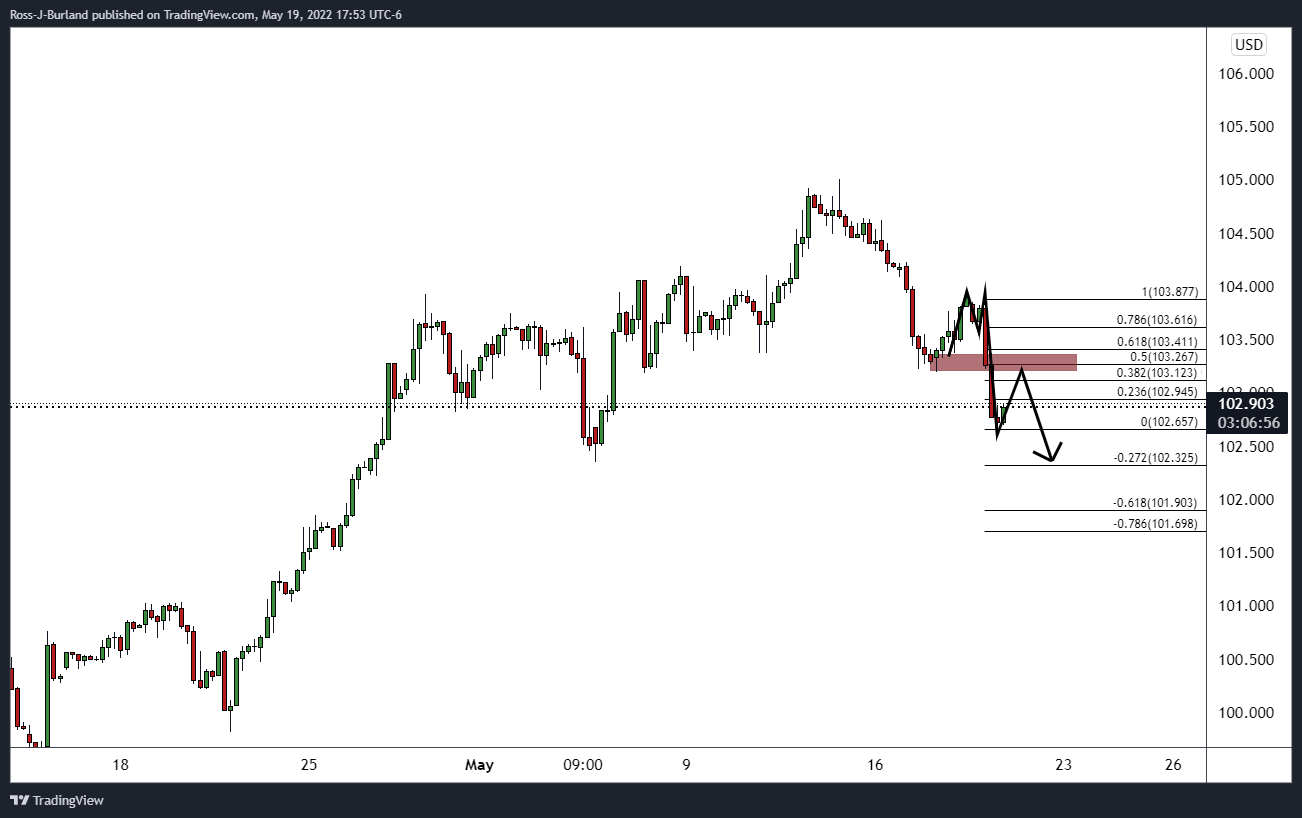
The four-hour chart is bullish while the price corrects from the lows within an overextended M-formation which opens the risk of a deeper retracement towards a 50% mean reversion towards 103.267.
- EUR/USD pares the biggest daily gains since early March during sluggish Asian session.
- Multi-day-old resistance line triggered pullback moves amid nearly overbought RSI.
- 100-SMA, weekly support trend line lure the sellers, 200-SMA adds to the upside filters.
EUR/USD eases from a two-week high as a short-term key hurdle defends sellers around 1.0580 during Friday’s Asian session.
That said, the major currency pair rallied the most since early March the previous day while refreshing the fortnight high. However, nearly overbought RSI and a downward sloping trend line from March 31 probed bulls afterward.
Considering the RSI and trend line mix that kept sellers hopeful, a pullback towards the 100-SMA and then to the weekly support line, respectively around 1.0510 and 1.0485, can’t be ruled out.
However, any further downside past 1.0485 won’t hesitate to challenge the latest multi-month low surrounding 1.0350.
Meanwhile, EUR/USD bulls need not cheer an upside break of the immediate resistance line, at 1.0600 by the press time, as the 200-SMA level of 1.0665 stands tall to challenge the recovery moves.
In a case where the pair rises past 1.0665, the odds of witnessing further upside towards the 50% Fibonacci retracement of March-May downside, near 1.0768 can’t be ruled out.
EUR/USD: Four-hour chart
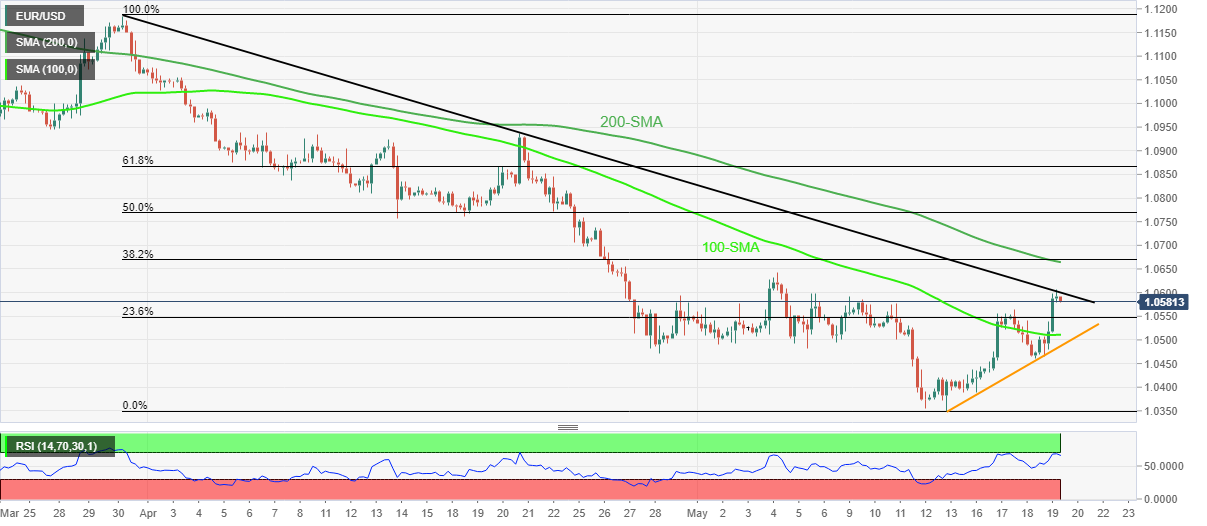
Trend: Pullback expected
- AUD/USD grinds higher around two-week top as 21-DMA, descending trend line from early April challenge bulls.
- Softer USD, upbeat headlines from China underpinned the biggest daily gains in a week.
- Aussie jobs report failed to impress traders due to mixed prints, US data were down too.
- Risk catalysts, PBOC announcements to direct short-term moves.
AUD/USD struggles for clear directions around mid-0.7000s, after refreshing a two-week high the previous day. That said, the Aussie pair pares the biggest daily gains in a week inside a 30-pip trading range, holding lower grounds near 0.7250 by the press time of Friday’s initial Asian session.
Alike other Antipodeans, AUD/USD also cheered softer US Treasury yields and the US dollar moves to print a stellar run-up the previous day. The upside momentum also gained due to improvement in China’s covid conditions and softer US data while paying a little heed to the mixed Aussie jobs report.
The US 10-year Treasury yields are likely bracing for the second weekly losses, down 1.8 basis points (bps) to 2.837% at the latest, as traders seem to have tired of the repeated Fedspeak and softer US data. The same weighed on the US Dollar Index eyes the first weekly loss in seven.
On Thursday, Kansas City Fed President and FOMC member Ester George said she is comfortable now doing half-point rate increases. However, Federal Reserve Bank of Minneapolis President Neel Kashkari mentioned the need for the Fed to be aggressive.
Also weighing on the greenback are recently downbeat US data. The latest print of the Federal Reserve Bank of Philadelphia’s Manufacturing Activity Index for May dropped to the lowest reading since May 2020, to 2.6 from 17.6 in April. Further, the Initial Jobless Claims in the week ending on 14 May rose to 218,000, the highest level since January, from 197,000 one week ago and expected a rise of 200,000.
At home, Australia’s downbeat Employment Change and Participation Rate supersede the charm of the record low Unemployment Rate.
While portraying the mood, Wall Street closed mixed and the yields were softer, taking down the USD with them, whereas the S&P 500 Futures print mild gains by the press time.
Given the lack of major data/events on the calendar, AUD/USD prices may rely on the risk catalysts for immediate moves. Also important for the Aussie pair is the People’s Bank of China’s (PBOC) Interest Rate Decision. The PBOC isn’t expected to unveil any changes to the benchmark rate as it kept the 1-year Medium-Term Lending Facility (MLF) interest rate unchanged at 2.85% earlier in the week. Should China surprise markets, the Aussie moves are bound to be witnessed due to the trade links with the dragon nation.
Technical analysis
Given the firmer RSI conditions backing the AUD/USD pair’s battle with the confluence of 21-DMA and a seven-week-old resistance line, around 0.7050, the quote is likely to overcome the immediate hurdle targeting the 0.7100 threshold. However, March’s low near 0.7165 and the monthly peak surrounding 0.7265 will challenge the pair buyers afterward.
On the contrary, pullback moves remain elusive above January’s low near 0.6965.
- Gold price is forming a Bullish Flag pattern that shouts further upside.
- Risk-off impulse has underpinned the bright metal despite the DXY.
- The lack of economic catalysts this week advocated risk sentiment to dictate the gold prices.
Gold price (XAU/USD) is consolidating below $1,850.00 in a minor range of $1,840.02-1,844.08 in the early Asian session. The precious metal has delivered a perpendicular upside move on Thursday from a low near $1,800.00 as the risk-off impulse favors the precious metal rather than underpinning the greenback.
A significant plunge in the US dollar index (DXY) despite heightened negative market sentiment in the FX domain has supported the gold prices. The DXY has surrendered more than 2.20% gains after printing a 19-year high of 105.00 last week. It worth be worth stating that extremely overbought oscillators have resulted in a meaningful correction in the asset as the solid fundamentals are still intact amid expectations of policy tightening by the Federal Reserve (Fed).
The movement in the gold prices has remained dependent on the sentiment amid a lack of important economic events this week. However, the comments from Philadelphia Fed Bank President Patrick Harker brought some loud moves in the bright metal. The Fed policymaker advocated two more 50 basis points (bps) interest rate hikes in June and July, which should be followed by the old tradition of the 25 bps rate hike spell.
Gold technical analysis
The gold prices are forming a Bullish Flag chart pattern that signals a continuation of bullish momentum after a consolidation phase. This consolidation phase denotes an inventory distribution that forces an intensive buying interest from the market participants. The 50-period Exponential Moving Average (EMA) at $1,827.68 is scaling higher, which adds to the upside filters. Adding to that, the Relative Strength Index (RSI) (14) has shifted into a bullish range of 60.00-80.00, which signals significant gains ahead.
Gold hourly chart
-637885997725478943.png)
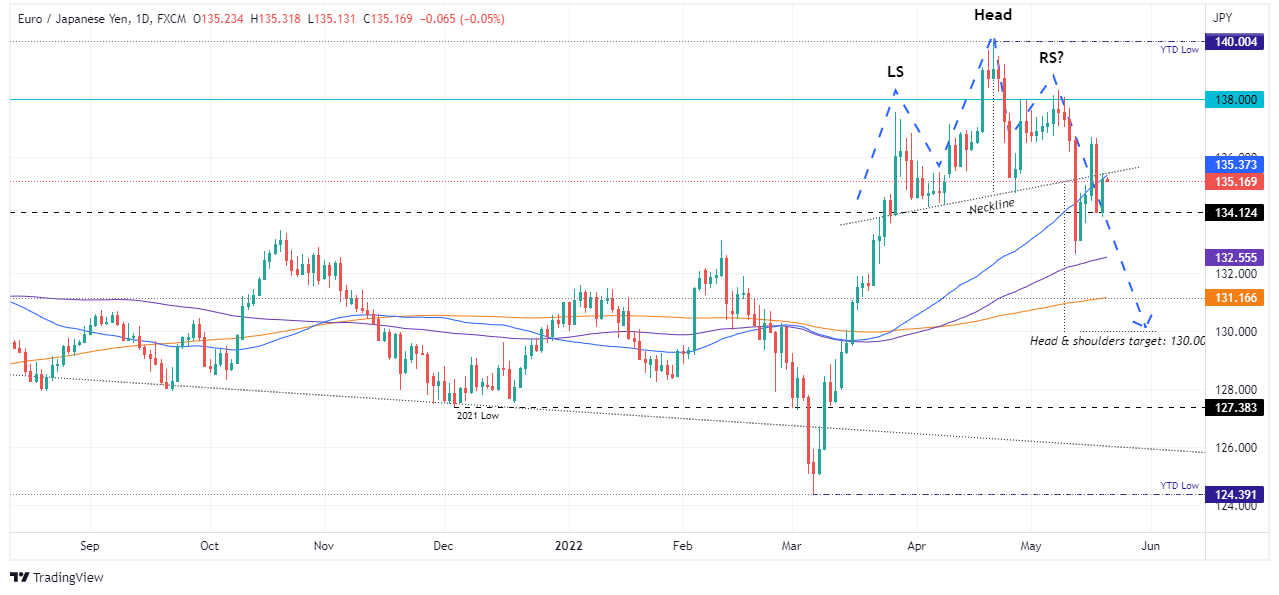
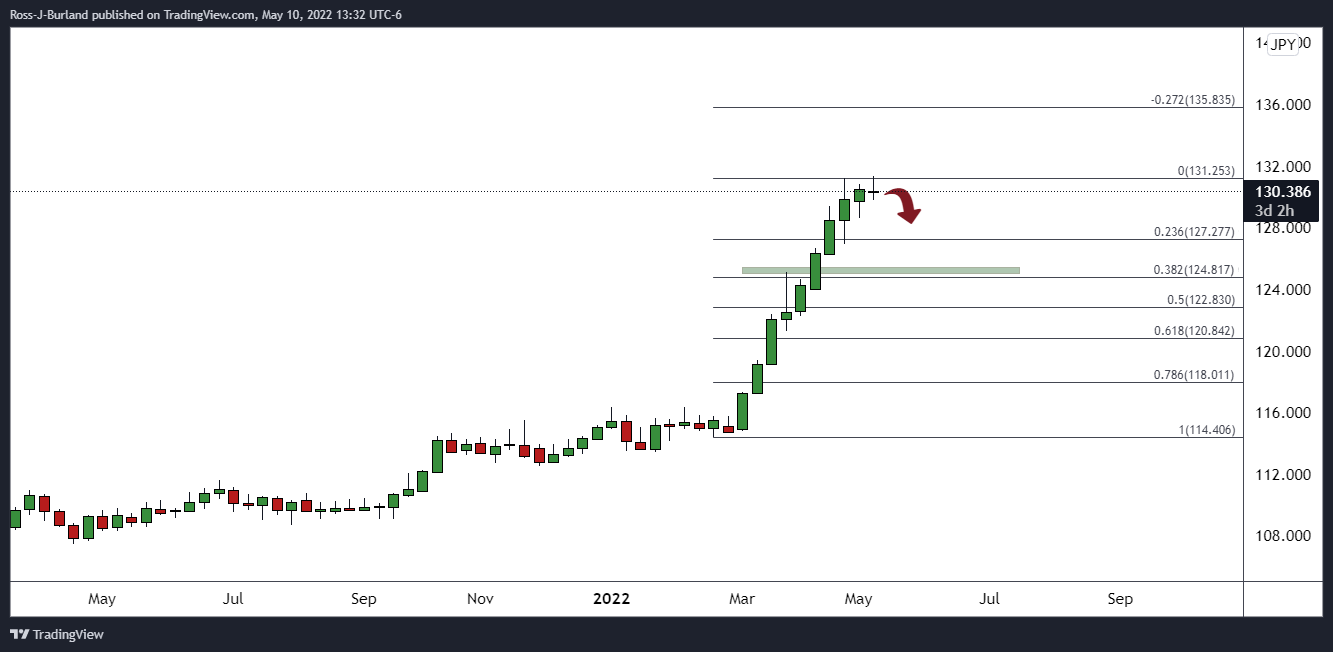
- The EUR/JPY rallies 150-pips but struggles at the head-and-shoulders neckline, at around 135.20-35.
- Risk-aversion usually benefits safe-haven peers, but the last meeting ECB’s minutes boosted the shared currency.
- EUR/JPY Price Forecast: The head-and-shoulders pattern remains in play and targets 130.00
The EUR/JPY rallied towards the head-and-shoulders neckline but lacked the strength to break above it and recorded a daily close just shy of the above-mentioned at around 135.23, which also confluences with the 50-day moving average (DMA). At the time of writing, the EUR/JPY is trading at 135.16, on the wrong foot as the Asian Pacific session starts.
Risk-aversion remains after the Wall Street close. Still, some Asian futures look towards a higher open, but most indices are trading in the red. High inflationary pressures begin to feel on significant retail stores in the US, such as Walmart and Target, which dragged US stocks on Wednesday after reporting short profit margins caused by elevated prices.
- Also read: EUR/USD surges towards 1.0580 as bulls ignore a risk-off mood, post-ECB minutes
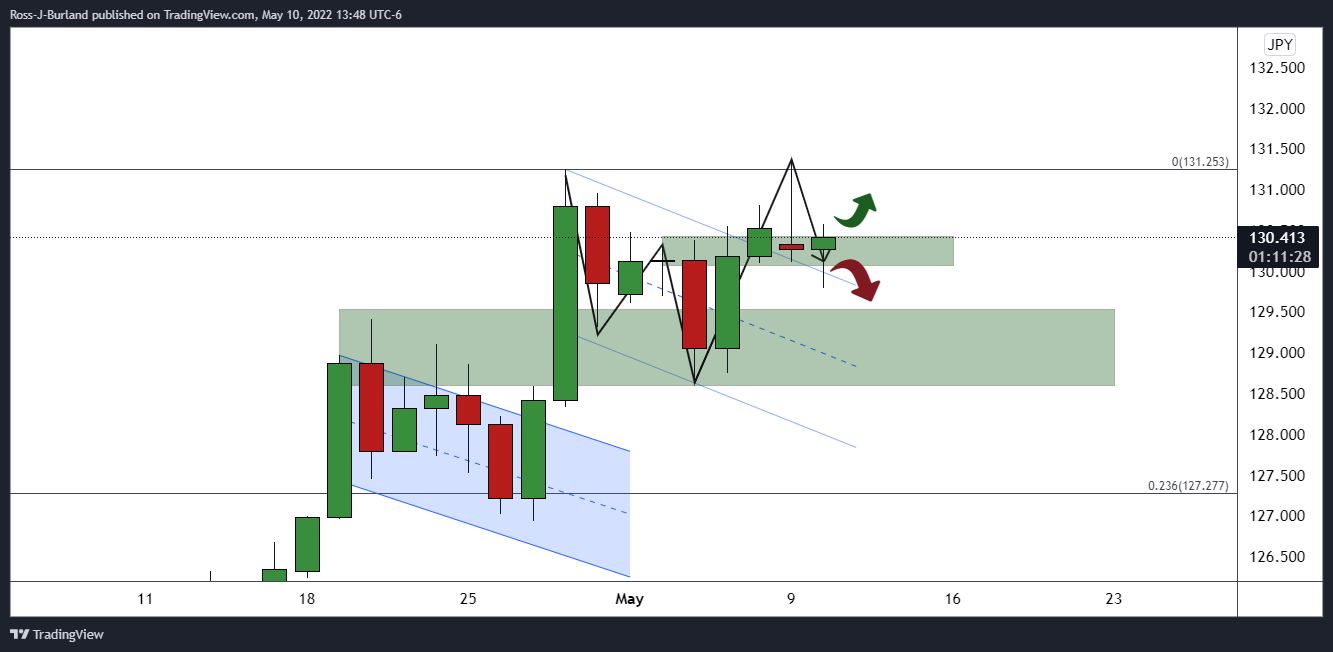
On Thursday, the EUR/JPY began the day near the session’s lows at around 134.00 and rallied towards the daily high at 135.45, just shy of the 50-hour simple moving average (SMA), retreating afterward, and seesawed around the 134.00-135.50 range.
EUR/JPY Price Forecast: Technical outlook
On Wednesday note, I wrote that it “was revenge day for EUR/JPY bears, which caused a drop of more than 220-pips during the day and kept the head-and-shoulders chart pattern in play, which was threatened by Tuesday’s price action.”
Thursday’s price action was revenge for EUR/JPY bulls but failed shortly because the daily highs were below the head-and-shoulders neckline. With that said, the cross-currency bias remains intact and is neutral downwards in the near term. Also, the head-and-shoulders chart pattern is still in play.
That said, the EUR/JPY first support would be 134.00. Break below would expose the May 16 daily low at 133.74, followed by May 13 swing low at 133.09 and then the 100-day moving average (DMA) at 132.25, before exposing the 200-DMA at 131.10.
Key Technical Levels
- NZD/USD remains sidelined after easing from two-week high, stays on the way to first weekly gain in eight.
- New Zealand Trade Balance improved but Imports, Exports eased in April.
- New Zealand Budget, China news and softer USD favored bulls earlier.
- PBOC may keep rates intact tracking the latest MLF move, covid conditions.
NZD/USD bulls take a breather around the two-week top, paying a little heed to New Zealand trade numbers for April, during Friday’s initial Asian session. In doing so, the Kiwi pair seesaws near 0.6380 after rising the most since May 04 the previous day.
That said, New Zealand’s (NZ) headline Trade Balance turned to a surplus of $584M versus the previous deficit of -581M (revised) on MoM while the YoY figures also improved to $-9.117B from a downwardly revised deficit of $9.3B. Details suggest that the Imports dropped to $5.727B from $7.06B prior whereas the Exports eased to $6.311B versus $6.4B (revised).
An improvement in risk assets and softer US Treasury yields, as well as the downbeat US dollar, underpinned the NZD/USD pair’s biggest daily gains in two weeks the previous day. Also favoring the Kiwi was the NZ government’s generous budget announcement. Additionally, improvement in China’s covid conditions and Shanghai’s plan of gradual unlock, backed by zero covid cases outside the quarantine area in recent days, offered extra strength to NZD/USD.
US Dollar Index (DXY) braces for the first weekly loss in seven as markets seem to have tired of hearing the 50 bps support from the latest Fedspeak, even if some of the policymakers do push for aggressive actions. On Thursday, Kansas City Fed President and FOMC member Ester George said she is comfortable now doing half-point rate increases. However, Federal Reserve Bank of Minneapolis President Neel Kashkari mentioned the need for the Fed to be aggressive.
Also weighing on the greenback are recently downbeat US data. The latest print of the Federal Reserve Bank of Philadelphia’s Manufacturing Activity Index for May dropped to the lowest reading since May 2020, to 2.6 from 17.6 in April. Further, the Initial Jobless Claims in the week ending on 14 May rose to 218,000, the highest level since January, from 197,000 one week ago and expected a rise of 200,000.
It’s worth noting that the NZ budget’s multiple relief measures catch a doubt in the second readings as to how the government will pay for the same. This pushes analysts at the Australia and New Zealand Banking Group (ANZ) to say, “There are some good initiatives in the Budget – but with the economy so capacity constrained, there are risks the RBNZ may need to “make room” for government spending by inflicting higher interest costs on the economy.”
Against this backdrop, Wall Street closed mixed and the yields were softer, taking down the USD with them. The S&P 500 Futures print mild gains by the press time.
Looking forward, a softer US dollar may help the NZD/USD to remain on the front foot, despite lacking further upside momentum of late. Even so, the Kiwi pair traders will pay attention to the People’s Bank of China’s (PBOC) Interest Rate Decision for immediate direction. The PBOC isn’t expected to unveil any changes to the benchmark rate as it kept the 1-year Medium-Term Lending Facility (MLF) interest rate unchanged at 2.85% earlier in the week.
Technical analysis
A clear upside break of the seven-week-old descending trend line, now support around 0.6310, keeps NZD/USD buyers hopeful of crossing the immediate hurdle, namely the 21-DMA level of 0.6415, which in turn can direct the recovery moves towards the monthly peak of 0.6568.
- A weak pullback by the USD/CHF is offering a selling opportunity for investors.
- The greenback bulls have failed to capitalize on Fed’s tightening bets.
- Also, the SNB’s intervention into the FX domain has bolstered the Swiss franc bulls.
The USD/CHF pair has witnessed a minor pullback from the crucial support of 0.9700 after a sheer downside move. A lackluster bounce after a downside move of 3.60% from its recent high of 1.0058, recorded on Monday is posing a selling opportunity for the market participants.
Despite the rising hopes of an extremely tightening monetary policy by the Federal Reserve (Fed), the greenback bulls are failing to combat the Swiss franc. Philadelphia Fed Bank President Patrick Harker dictated that the Fed is expected to feature two 50 basis points (bps) interest rate hikes in June and July’s monetary policy meetings. Later, it will stick to a traditional quarter-to-a-percent rate hike to contain the price pressures.
This has bolstered the odds of a jumbo interest rate decision announcement by the Fed in June. Also, the statement claims that the FX domain will witness at least three 50 bps interest rate hikes by the end of 2022.
Meanwhile, the speech from the Swiss National Bank (SNB)’s Thomas J. Jordan has supported the Swiss franc bulls after prolonged weakness. SNB’s Jordan dictated in his speech that the Swiss franc (CHF) is a safe-haven asset and the SNB will continue with its prudent negative monetary policy to justify the inflation parameter. The targeted inflation figure at 2% is well maintained by the SNB and any temporary rise above the targeted figure will be offset quickly due to intervention of the SNB.
- USD/CAD remains pressured around two-week low, eyes biggest weekly fall in eight.
- Boring Fedspeak joins downbeat US data to weigh on USD while Canada flashed upbeat second-tier statistics.
- Oil prices cheer softer USD, China’s covid conditions and fresh fears of supply crunch.
- The light calendar puts momentum traders at the mercy of risk catalysts.
USD/CAD struggles to defend 1.2800 threshold, despite the latest bounce off a fortnight low, as the downbeat US dollar favors commodities and Antipodeans during a sluggish Asian session on Friday. That said, the quote dribbles around 1.2825, after a stellar downside to refresh the two-week bottom the previous day.
US Dollar Index (DXY) braces for the first negative weekly loss in seven as markets seem to have tired of hearing the 50 bps support from the latest Fedspeak, even if some of the policymakers do push for aggressive actions. On Thursday, Kansas City Fed President and FOMC member Ester George said she is comfortable now doing half-point rate increases. However, Federal Reserve Bank of Minneapolis President Neel Kashkari mentioned the need for the Fed to be aggressive.
Also weighing on the greenback are recently downbeat US data. The latest print of the Federal Reserve Bank of Philadelphia’s Manufacturing Activity Index for May dropped to the lowest reading since May 2020, to 2.6 from 17.6 in April. Further, the Initial Jobless Claims in the week ending on 14 May rose to 218,000, the highest level since January, from 197,000 one week ago and expected rise of 200,000.
On the other hand, Canadian Industrial Production for April grew past 0.5% forecast to 0.8% MoM.
It’s worth noting that an improvement in China’s covid conditions and Shanghai’s plan of gradual unlock, backed by zero covid cases outside the quarantine area in recent days, keep the market sentiment positive and weigh on the US dollar’s safe-haven demand.
Elsewhere, the WTI crude oil rose more than 2.30% to near $109.00 on Thursday amid broad US dollar weakness and fears that Finland and Sweden will trigger fresh geopolitical tussles with Turkey with their push to join North Atlantic Treaty Organization (NATO). On the same line are concerns over Russia's aggressive military actions in Mariupol and global oil producers’ refrain from pumping more output.
Amid these plays, Wall Street closed mixed and the yields were softer, taking down the USD with them.
Looking forward, a lack of major data/events keeps the USD/CAD traders clueless and may push them to extend the latest weakness. However, risk catalysts will keep the driver’s seat.
Technical analysis
A clear downside break of the monthly rising channel earlier in the week joins the USD/CAD pair’s sustained trading below the 10-DMA, around 1.2920, to keep bears hopeful of revisiting the 50-DMA support, near 1.2700 at the latest.
- AUD/JPY is sustaining itself above 90.00 despite a flat jobless rate of 3.9%.
- As per the RBA minutes, a rate hike of 40 bps was also into consideration.
- Japan’s National CPI is seen higher at 1.5% against the prior print of 1.2%.
The AUD/JPY pair is sustaining above the psychological resistance of 90.00 after a modest upside move from Thursday’s low at 89.08. The risk barometer is expected to extend its gains after overstepping Friday’s high at 90.29, which will drive the asset towards the round-level resistance at 91.00.
The cross has displayed topsy-turvy moves this week despite the release of the hawkish Reserve Bank of Australia (RBA) minutes on Tuesday. As per the minutes from the RBA policy meeting in May’s first week, a rate hike of 40 basis points (bps) was also into consideration by the policymakers. Mounting inflationary pressures are diminishing the real income of the households, which forced the RBA to unexpectedly shift to a tight monetary policy rather than sticking to a prudent one.
Also, the flat Unemployment Rate at 3.9% and poor Employment Change, released on Thursday, failed to deliver any meaningful impact on the risk barometer. The Australian Bureau of Statistics reported the job additions at 4k, significantly lower than the forecast of 30k.
On the Japanese front, less negative Gross Domestic Product (GDP) numbers have kept the yen bulls on the sidelines. The annual and monthly GDP numbers landed at -1% and -0.2%, lower than the expectations of -1.8% and -0.4% respectively.
In today’s session, the focus will remain on Japan’s National Consumer Price Index (CPI) numbers. The annual CPI figure sees an improvement to 1.5% from the prior print of 1.2% while the core CPI may drop further to -0.9% against the former release of -0.7%.
- GBP/USD pares recent gains inside a bearish chart pattern.
- Pullback from resistance, RSI conditions hint at further weakness.
- Bears need validation from 200-HMA to retake control.
- UK Retail Sales hints at a contraction in April.
GBP/USD struggles to keep Thursday’s stellar gains inside a rising wedge bearish formation, despite staying on the way to post the first weekly gains in five. That said, the cable pair eases to 1.2475 while stepping back from the wedge’s upper line during the early Friday morning in Asia.
As overbought RSI conditions backed the GBP/USD pair’s latest pullback inside the wedge, further weakness in prices can’t be ruled out.
However, the 61.8% Fibonacci retracement (Fibo.) of May 04-13 downside, near 1.2450, seems to restrict the pair’s immediate declines.
It should be noted, though, that the GBP/USD weakness past 1.2450 will aim for the 1.2400 threshold before directing bears towards the stated bearish chart pattern’s support line around 1.2365.
Although a clear break of the 1.2365 will confirm the bearish formation, theoretically directing the quote towards 1.2100, sustained trading beneath the 200-HMA level of 1.2325 becomes necessary to confirm the south-run.
Meanwhile, recovery moves remain elusive until staying below the stated wedge’s resistance line, around 1.2530.
Following that, 1.2580 and the monthly high close to 1.2640 could lure the GBP/USD bulls.
GBP/USD: Hourly chart
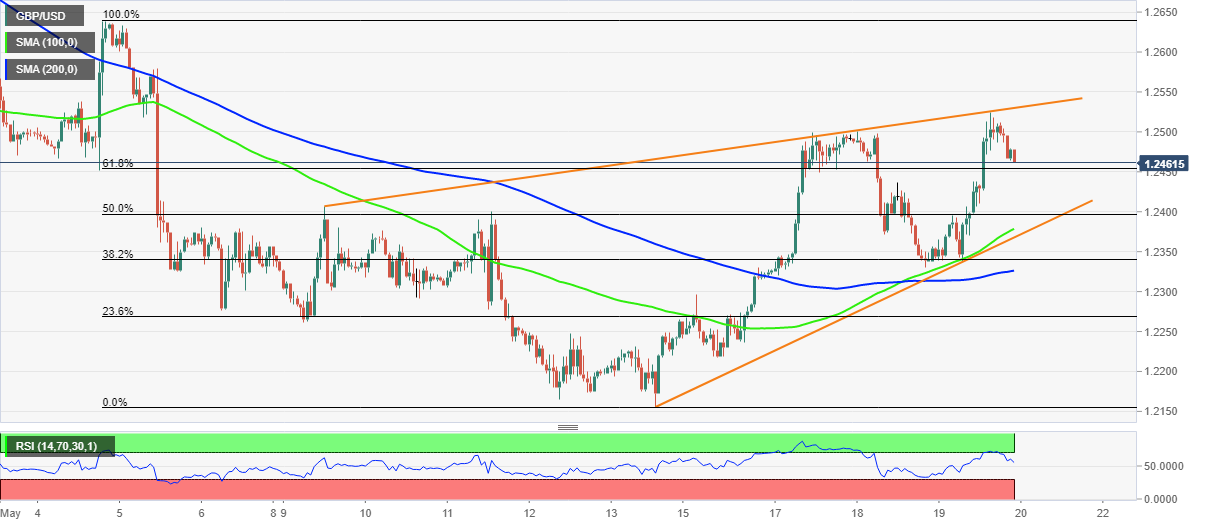
Trend: Pullback expected
- The shared currency regained some composture vs. the greenback, recording gains of almost 1%.
- Risk-aversion was not an excuse for the euro to rally as the US dollar weakened throughout the day.
- EUR/USD Price Forecast: In the near term, it could challenge the 1.0700 figure, but the broad trend remains downwards, so rallies could be opportunities for EUR bears.
The shared currency is rallying on Thursday due to a weaker US dollar, despite a risk-aversion environment that usually benefits the greenback, but not this time, as the EUR/USD rose more than 1%. At 1.0585, the EUR/USD portrays the abovementioned and weighed on the greenback, the weakest currency in the session.
Despite a downbeat sentiment, the euro rose while the greenback tumbled
Sentiment remained downbeat throughout the whole session. US equities later attempted to record gains but failed and extended their losses for the second-straight day. The US dollar remained defensive for the third day out of four in the week, recorded a considerable loss of almost 1%, and finished at 102.881.
During the North American session, US economic data came mixed, though do not dent the Federal Reserve’s prospects of hiking rates by 50-bps in the June meeting. US Initial Jobless Claims for the last week increased to 218K, 18K more than the foreseen by analysts while Continuing Claims hit its lowest level since 1969. May’s Philadelphia Fed Manufacturing Index rose by just 2.6, worst than the 16 estimated, and Fed speaking continued dominating the headlines.
On Thursday, the Kansas City Fed President Esther George said that the “rough week in the equity markets” does not alter her support of 50-bps hikes to cool inflation. She added, “right now, inflation is too high, and we will need to make a series of rate adjustments to bring that down.”
During the overnight session, in the European one, the ECB unveiled its last monetary policy minutes, in which, according to ING analysts, ECB hawks are calling the shots. They noted that “all in all, the minutes confirmed the increasingly hawkish tone of many ECB members since the April meeting. There seems to be an eerie feeling that the ECB is acting too late and quickly needs to join the bandwagon of monetary policy normalisation. This means that the question is no longer whether the ECB should hike interest rates in July but by how much.”
In the meantime, according to STIRs published by Nordea, 34.6 bps are priced in by the July meeting, and 107.4 bps for December of 2022.
EUR/USD Price Forecast: Technical outlook
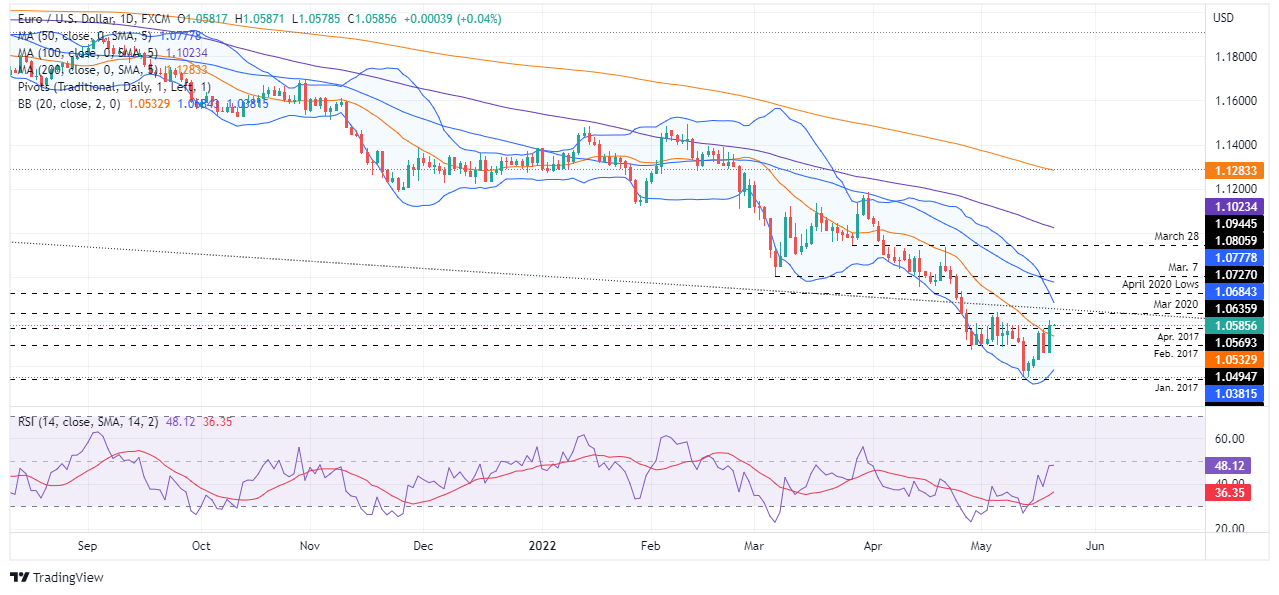
The EUR/USD finally reclaimed the 20-day moving average (DMA), a level last conquered at the beginning of April. However, the shared currency is not out of the woods yet. The Relative Strength Index (RSI), albeit aiming higher, the reading at 48 indicates stills in bearish territory, meaning that the EUR/USD could be subject to a mean reversion move. That said, the EUR/USD bias is still downwards.
If EUR/USD bulls reclaim May 5 daily high at 1.0641, that will open the door for further gains. Once that level gives way to the spot price, the top of the Bollinger band at 1.0684 would be the next resistance, immediately followed by 1.0700.
On the flip side, a slide of the EUR/USD below the 20-DMA at 1.0532 would see the 1.0500 figure as the first support. A break below might send the shared currency tumbling towards the bottom of the Bollinger bands at 1.0381, followed by the YTD low at 1.0348.
- US oil, WTI, rebounds in risk-on market settings.
- The tightness in product markets is also gathering more attention with the summer driving season.
At $111.63, West Texas Intermediate, WTI, is 2.32% higher having travelled from a low of $104.99 to a high of $112.61 on the day so far. Crude oil prices have climbed for the first time in three sessions despite slowing economic growth as interest rates rise.
The Energy Information Administration on Wednesday reported an unexpected 3.4-million-barrel drop in US oil inventories, while gasoline stocks dropped by 4.8-million barrels. That stockpile now sits below the five-year seasonal average. This comes ahead of the key driving season in the northern hemisphere, where demand hits its seasonal high. Prices have been supported by tight supplies and falling US inventories ahead of the driving season which begins on the Memorial Day weekend.
Analysts at ANZ Bank said that an explosion at a major refinery in Ulsan, South Korea, helped refocus the market on the tightness in refined fuel products. Additionally, the analysts explained that a new report from Russia’s Economy Ministry indicated Russian crude oil production will drop 10% this year and remain below 2021 levels at least until 2025. ''This could be even greater if Europe manages to approve a plant to ban Russian oil. For the moment, Hungary remains steadfast in its demand to phase-in the sanctions over an extended period.''
Meanwhile, analysts at TD Securities explained that ''the tightness in product markets is also gathering more attention with the summer driving season on the horizon, which would see crude demand robust amid record refining margins. In this context, despite macroeconomic angst, crude oil markets may be shaping up for another move higher this summer.''
- Aussie bulls are confident over the breakout of an Inverted Head and Shoulder pattern.
- A bull cross, represented by 20 and 50-EMAs adds to the upside filters.
- The RSI (14) has shifted into a 60.00-80.00 range, which signals more gains ahead.
The AUD/USD pair has witnessed a minor pullback after hitting a high of 0.7072 in the New York session. Earlier, the aussie bulls displayed a firmer rally after recording a fresh yearly low of 0.6829 last week.
A breakout of an Inverted Head and Shoulder chart pattern on an hourly scale has indicated a confident bullish reversal. The formation of the above-mentioned chart pattern denotes a prolonged inventory distribution in which the institutional investors purchase inventories from the retail participants.
A bull cross of 20- and 50-period Exponential Moving Averages (EMAs) at 0.6992 indicates a firmer rally ahead.
Also, the Relative Strength Index (RSI) (14) has shifted into a bullish range of 60.00-80.00, which signals more gains going forward.
A pullback towards the 20-EMA at 0.7030 will be a bargain buy for the market participants that will send the asset towards the round level resistance at 0.7100. The occurrence of the same will drive the asset further towards May 3 high at 0.7148.
On the flip side, the greenback bulls could regain control if the asset drops below Wednesday’s low at 0.6948. This will drag the asset towards Monday’s low at 0.6872, followed by yearly lows at 0.6829.
AUD/USD hourly chart
-637885942762385552.png)
- NZD/USD bulls are moving in on a critical daily resistance.
- The price has corrected the hourly bullish impulse to the 38.2% Fibonacci.
- There are prospects of a deeper run to test the hourly 61.8% golden ratio that aligns with prior resistance.
NZD/USD is higher entering into early Asia on Friday. There is some hesitation in the markets as to the prospects of a hard landing in the US which has stripped the US dollar of some of its appeal. Technically, the NZD is attempting to break higher:
NZD/USD prior analysis
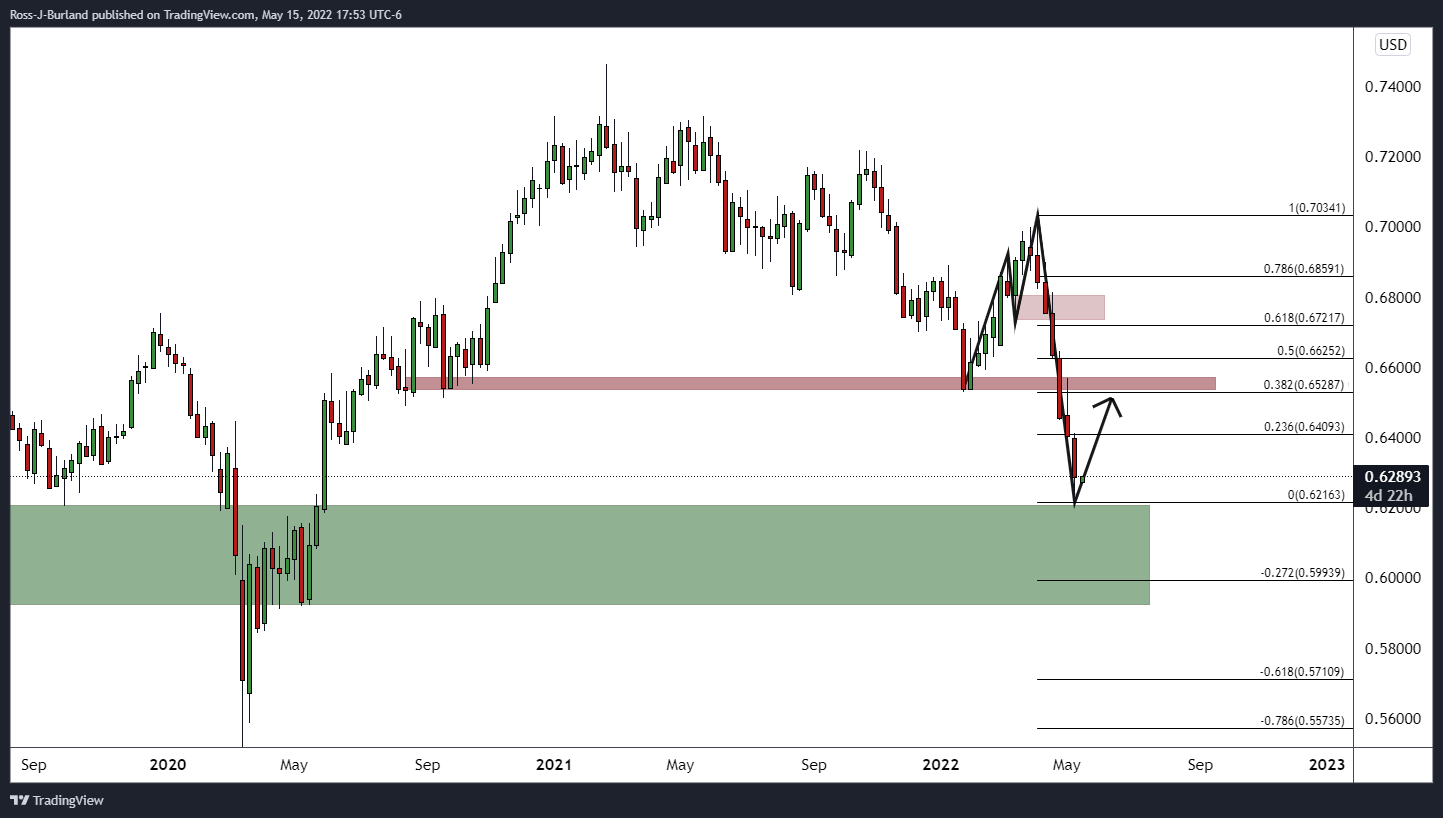
The weekly bearish impulse has been in need of a correction. The correction is underway and this could correct as far as the prior support and beyond 0.64 the figure.
The build-up of daily resistance was being challenged which supported the bullish outlook:
The price was attempting to break through the resistance, with eyes set on the 38.2% ratio at 0.6350 that guarded a 61.8% ratio where prior support near 0.6430 was eyed.
NZD/USD live market
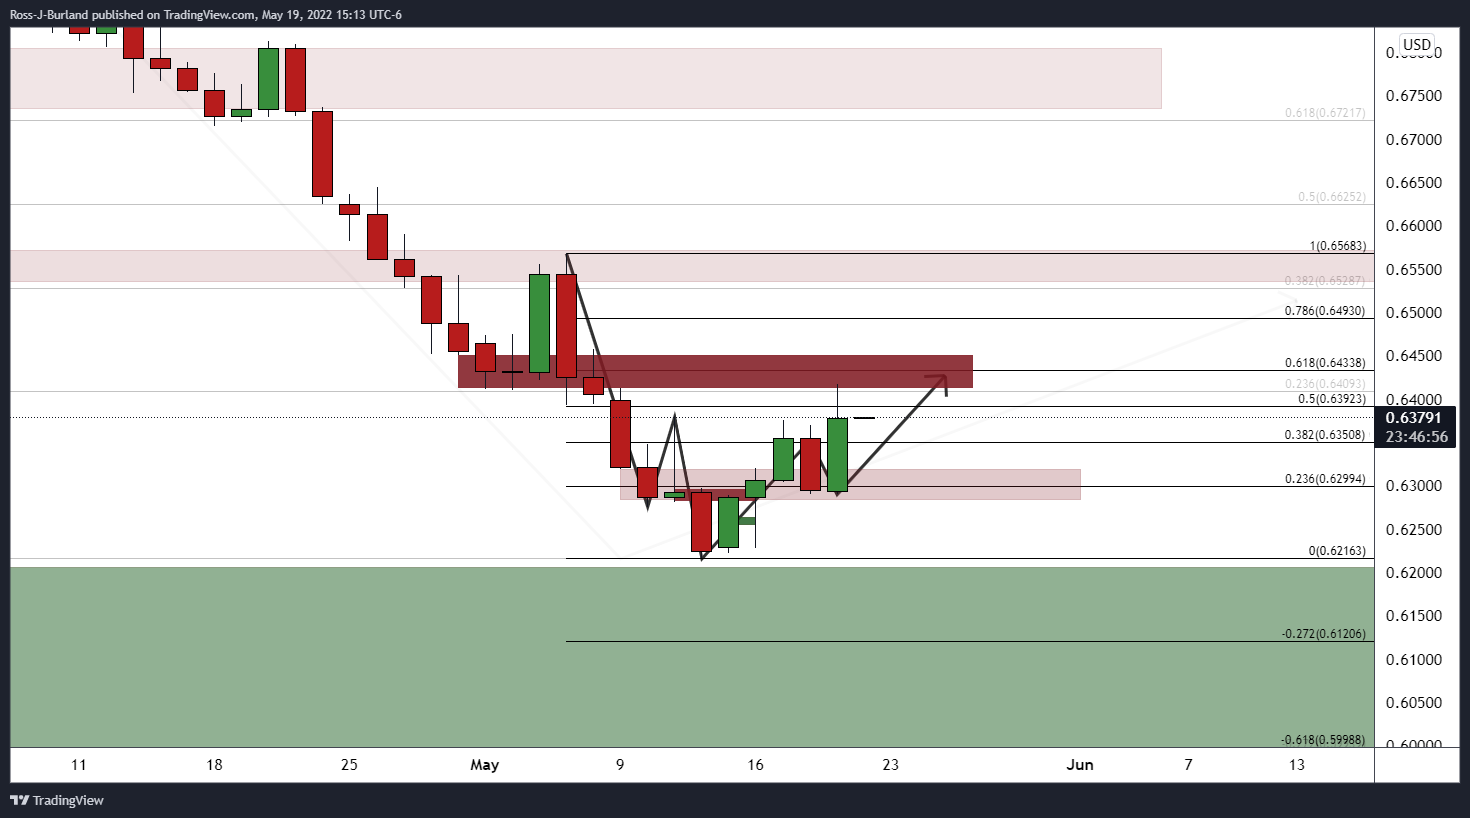
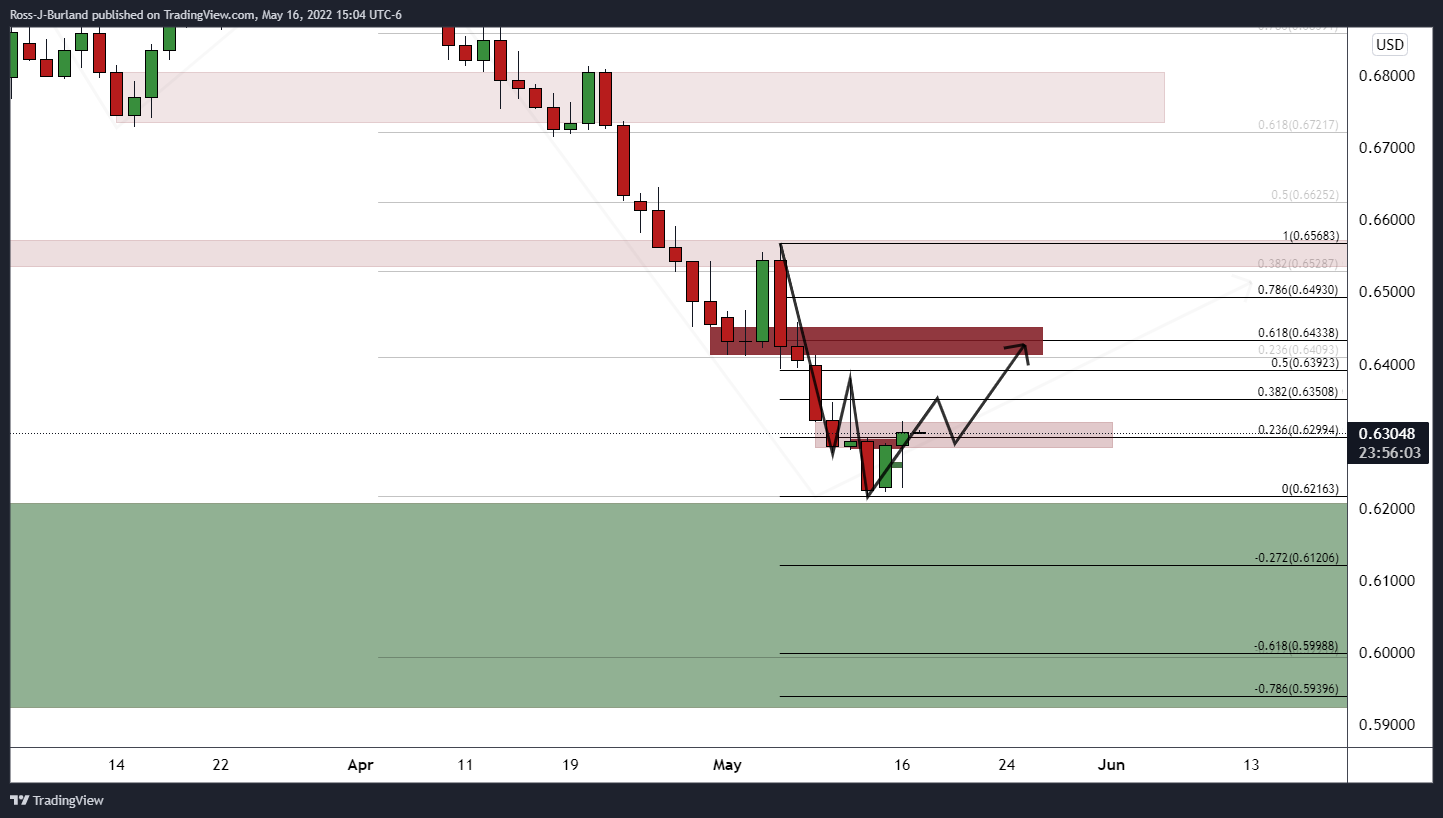
The price has moved in on the resistance as illustrated above, respecting the forecasted price trajectory along the way there. There are still prospects of a continuation to test the 61.8% fully but 0.64 the figure will need to give way as per the following analysis on the hourly time frame:
NZD/USD H1 chart
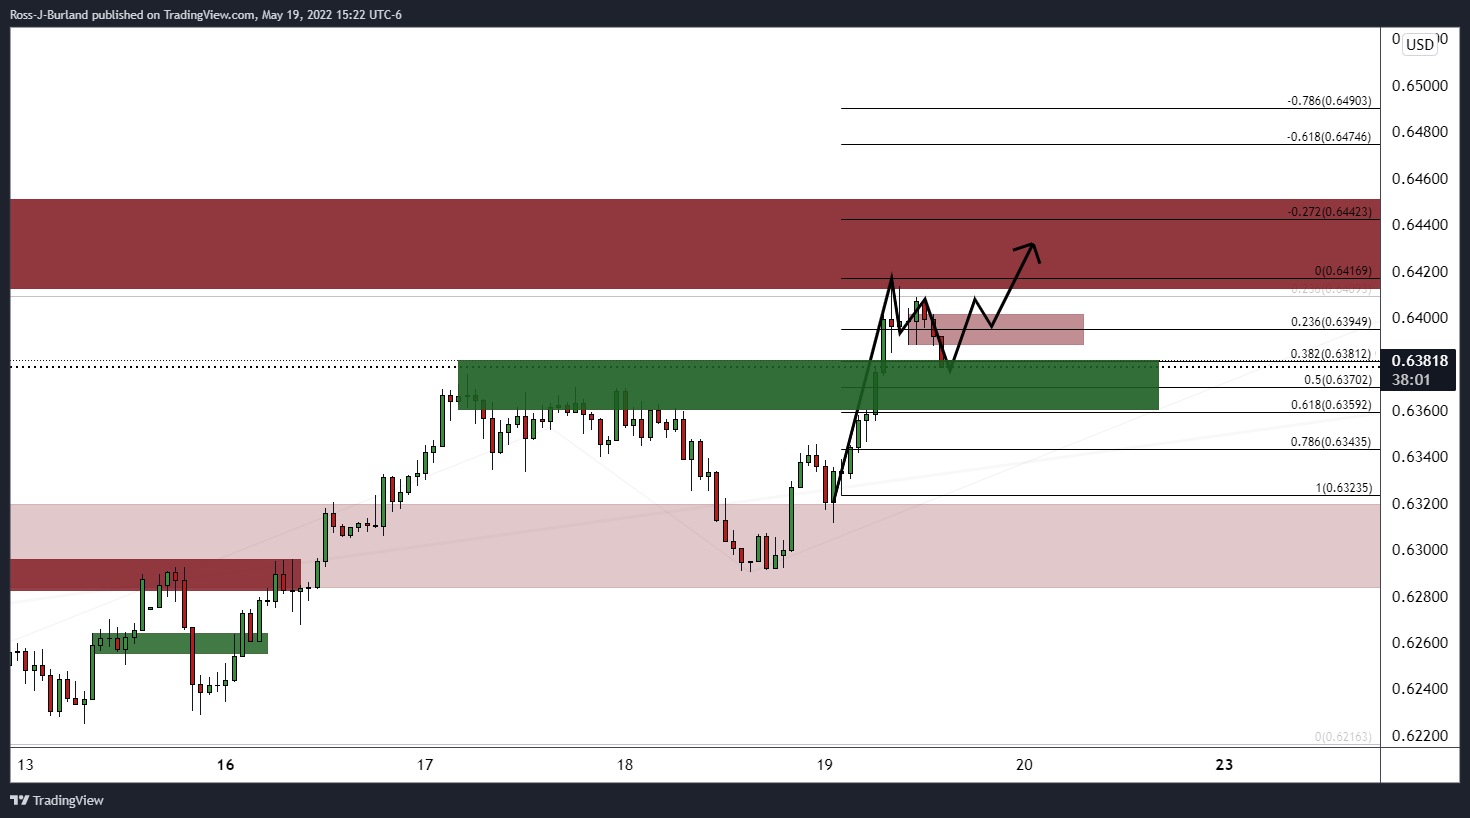
The price has corrected the bullish impulse to the 38.2% Fibonacci but the correction has strength in the price action, so there are prospects of a deeper run to test the 61.8% golden ratio that aligns with prior resistance.
Federal Reserve's Neel Kashkari, the president of the Federal Reserve Bank of Minneapolis, has crossed the wires with various comments, arguing that the fed may need to be more aggressive.
Key comments
We've done quite a bit to remove support for economy through forward guidance.
We are removing accommodation even faster than we added it at start of covid pandemic.
I don't know how high rates need to go to bring inflation down.
How much fed will need to will depend on supply side.
Labor market is not fully healed.
Labor market strong by almost any measure.
I don't know the odds of pulling off a soft landing.
I am seeing some evidence we are in a longer-term high inflation regime.
If so the fed may need to be more aggressive.
Fact that bond and stock market are adjusting means we have credibility.
Getting inflation back down is paramount.
Market implications
In the face of a steadfastly hawkish Fed, the US dollar would be expected to remain firm so long as the economy continues to grow and avoids a recession.
- Gold bulls have been taking control due to a weaker US dollar.
- The price is trapped between daily support and resistance but the W-formation could hamstring the bulls.
- If there is a break, the price imbalances to $1,883 on the upside and $1,780 to the downside could be mitigated.
At $1,842.80, the gold price is higher on Thursday by some 1.45% and the US dollar is pressured, dipping to a 2-week low, as measured by the DXY index. The greenback is extending its pullback from a two-decade high and fared poorly against riskier currencies, trading down 1.04% at 102.82, near to the lows of the day and its lowest since May 5 at 102.657.
The index hit a near two-decade high last week as a hawkish Federal Reserve and growing worries about the state of the global economy helped lift the greenback to score some 7.5% higher for the year so far. However, Fed officials remain hawkish.
Steadfastly hawkish Fed to contain gold bulls
The Fed chairman's comments during an interview with the Wall Street Journal were the most hawkish yet and these were accompanied by Fed's Charles Evans on Wednesday saying that the Fed will likely hike rates above neutral.
“If we go 50 bp beyond that, if we go 75 bp beyond that, then that restrictive setting of policy should be working to bring inflation down.” Evans added that “my own assessment of ‘neutral’ is in the 2.25-2.5% range.”
Fed's Patrick Harker also spoke this week and said, “we don’t want to overdo it. But we have to act and we are acting.” He added that the US may have a few quarters of negative growth, but that is not what he is forecasting. Lastly, Harker said the Fed can engineer a “safe” if not “soft” landing for the economy.
On Thursday, Kansas City Fed’s Esther George noted that financial conditions are starting to tighten and said that it would take “something very different” to support larger rate increases. George added that she is very comfortable with 50bps rate rises.
In this regard, analysts at ANZ Bank said that while ''tighter financial conditions are of course needed to reduce demand and bring inflation down, the pace at which financial conditions have tightened may push back against a 75bps rate rise next month, unless of course the CPI and labour market data are exceptionally strong. A key question, however, is how quickly will labour demand slow?''
Meanwhile, today's weekly initial claims were showing early signs of trending higher from their record lows in March, which analysts at ANZ Bank said ''may be a very early indication that demand for labour is beginning to ease a little. But it’s early days, and with 1.9 job openings per unemployed person, the US labour market remains extremely stretched.''
''Indeed, Fed Chair Powell's willingness to take rates beyond neutral in an effort to tame inflation, while sounding tone-deaf regarding economic worries, suggests the path of least resistance for gold is still lower,'' analysts at TD Securities argued.
''ETF holdings of gold continue to fall for a tenth straight day while positioning analytics still argue for the potential of additional pain for gold bugs. Position sizing has reverted to more normal levels, the number of traders long the yellow metal remains elevated, while the breadth of traders short has just started to rise from near-record lows. While the conclusion of CTA selling could offer gold some support at the lows, we do not anticipate the yellow metal to make another leg higher in the face of a steadfastly hawkish Fed.''
Gold technical analysis
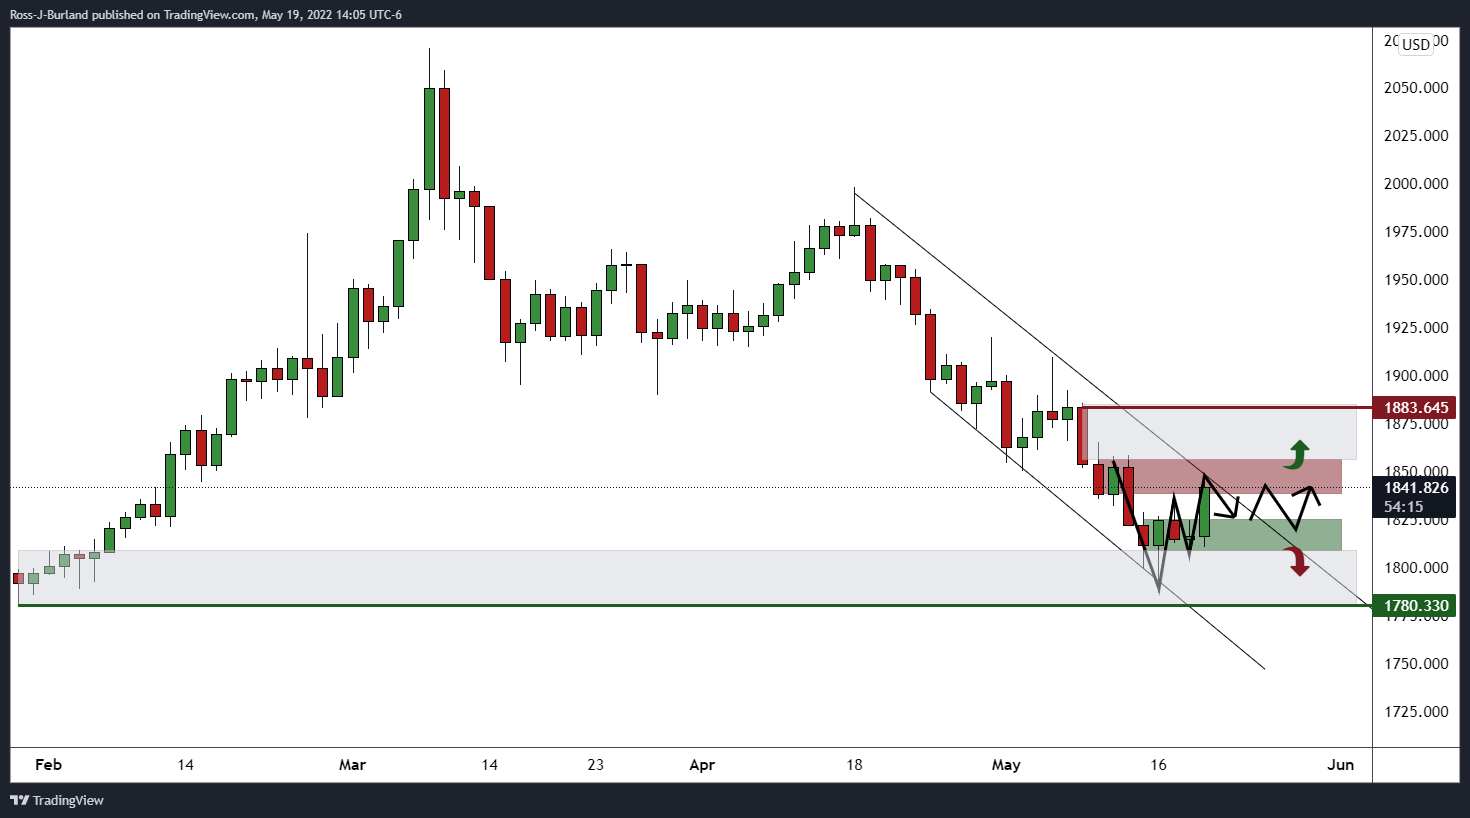
The price is trapped between daily support and resistance but the W-formation could hamstring the bulls and thus keep the price contained in a sideways channel for the days ahead. If, however, there is a break one way or the other, of the current support and resistance, then the price imbalances to $1,883 on the upside and $1,780 to the downside could be mitigated.
What you need to take care of on Friday, May 20:
Despite persistent risk-aversion, the American currency changed course on Thursday and fell across the FX board. Fears gyrated around inflationary pressures and slowing economic growth.
Stocks markets remained under pressure, with most Asian and European indexes closing in the red, although off their intraday lows. Wall Street remained under pressure, although losses were limited.
Demand for safety continued, with government bonds appreciating and yields retreating.
Turkish President Recep Tayyip Erdogan said he would oppose Finland and Sweden joining NATO, while US President Joe Biden stood at the other end of the line, saying his country would fully support it. Erdogan claims the Nordic countries serve as a refuge for terrorists of the Kurdistan Workers' Party,
Meanwhile, the UK and the EU embarked on new Brexit tensions. As the first try to modify rules agreed in the Northern Ireland Protocol, the EU ambassador to the UK said the treaty is not open for new negotiations.
The EUR/USD pair trades around 1.0590 after briefly surpassing the 1.0600 threshold. The GBP/USD holds a handful of pips below the 1.2500 threshold.
The Australian dollar was among the best performers despite tepid Australian employment data. AUD/USD holds around 0.7060, its highest for the week. The USD/CAD pair ticked lower and trades around 1.2810.
The Swiss Franc soared, with USD/CHF now trading at 0.9716, while USD/JPY is down to 127.70.
Gold neared $1,950 a troy ounce, now trading at $1,842. Crude oil prices were also up, with WTI now changing hands at $108.95 a barrel.
Top 3 Price Prediction Bitcoin, Ethereum, Ripple: Crypto bloodbath hasn’t even started yet
Like this article? Help us with some feedback by answering this survey:
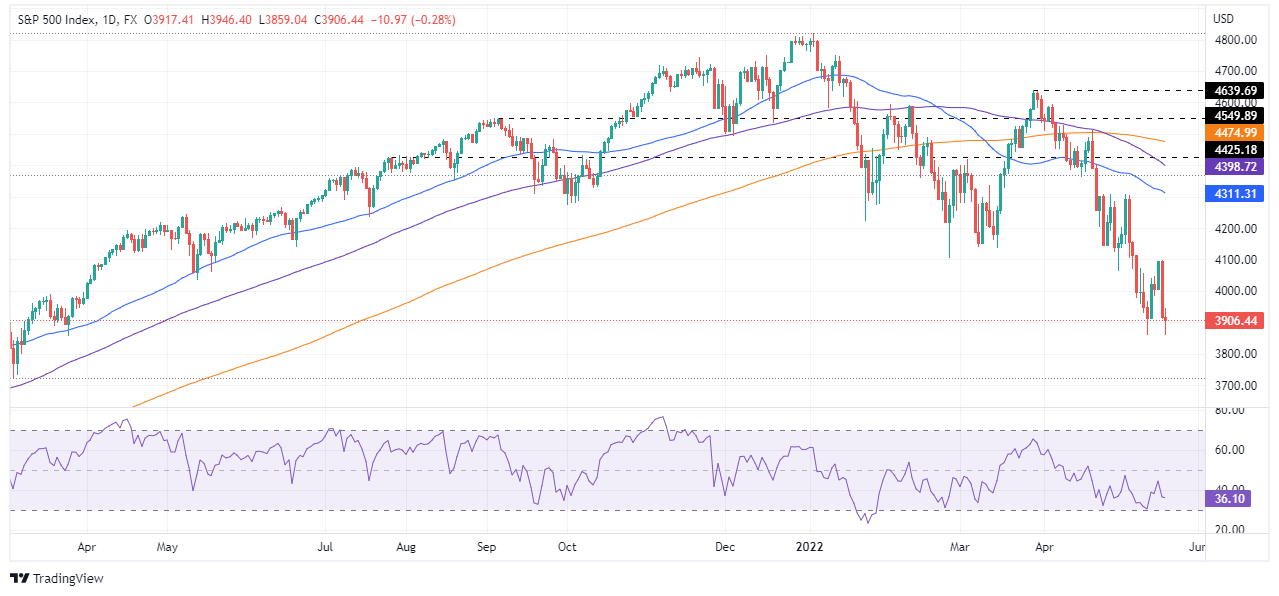
- The S&P 500, the Dow Jones, and the Nasdaq recorded losses amidst a risk-aversion environment.
- Nothing would stop the Fed from hiking as Kansas City Fed’s George said that the rough markets wouldn’t alter the rate hike plan.
- The US Dollar Index is falling more than 1.50%, dragged down by falling US Treasury yields; gold rallied.
US equities recovered some ground during the day but remain set to finish with losses, despite investors’ efforts of a last-hour rally. At the time of writing, the S&P 500, the Dow Jones Industrial, and the heavy-tech Nasdaq Composite record losses between 0.13% and 0.70% and sits at 3,904.92, 11,398.96 and 31,268.98, respectively.
Sentiment remains dismal, emphasized by the stagflation scenario surrounding the global economy. China’s coronavirus crisis continues as local outbreaks increase concerns of additional lockdowns. Also, high inflationary pressures have taken their toll on big US retailers, such as Walmart and Target, which expressed that their margins shrank due to elevated prices.
Fed officials have crossed the wires in the last couple of days, and most of them have expressed that inflation is “too high” and reiterated the posture of increasing the Federal Fund Rates (FFR) by 50-bps at the June meeting. The Kansas City Fed President Esther George said that a “rough week in the equity markets” would not change her view of hiking rates, while Philadelphia’s Fed Patrick Harker added that the US economy might have a few quarters of negative growth, but that is not what he is foreseeing.
In the meantime, the greenback is further weakening in the week, more than 1.50%. The US Dollar Index, a gauge of the buck’s value, sits at 102.751, losing 1.11% on Thursday. The US 10-year Treasury yield extended its losses in the day, four basis points down from the open and is currently at 2.850%.
Sector-wise, the gainers are Materials, Consumer Discretionary, and Energy, up 1.23%, 0.84%, and 0.69%, respectively. The worst performers are Consumer Staples, Financials, and Technology, falling 1.74%, 0.54%, and 0.50% each.
In the commodities complex, the US crude oil benchmark, WTI, is gaining 2.70%, trading at $112.00 a barrel, while precious metals like Gold (XAU/USD) is rallying 1.35%, exchanging hands at $1840.88 a troy ounce, helped by a softer US dollar.
S&P 500 Daily chart
Key Technical Levels
- GBP/USD bulls taking on bearish commitments at daily resistance.
- GBP/USD bulls are not out of the woods yet, according to the weekly chart.
At 1.2498, GBP/USD is higher by some 1.3% on the day and trading close to the highs of 1.2524. The pair has rallied from a low of 1.2334 despite growing risk-off impulses. However, cable remains close to the 2-year low touched last week as soaring inflation combined with a murky growth outlook could cap the gain as bulls challenge the bears at a critical daily resistance again.
Moreover, the Bank of England tightening expectations have stalled as the data have weakened, analysts at Brown Brothers Harriman note. ''WIRP suggests another 25 bp hike is priced in for the next meeting June 16. Looking ahead, the swaps market is pricing in 150 bp of total tightening over the next 12 months that would see the policy rate peak near 2.50%, steady from the start of last week.''
Nevertheless, the US dollar has fallen across the board on Thursday, dipping to a 2-week low, extending its pullback from a two-decade high. The greenback has fared poorly against riskier currencies, including the pound. The US dollar index (DXY), which tracks the greenback against six major currencies, was down 1.13% at 102.73, near to the lows of the day and its lowest since May 5 at 102.657. The index hit a near two-decade high last week as a hawkish Federal Reserve and growing worries about the state of the global economy helped lift the greenback to score some 7.5% higher for the year so far.
Fed officials remain hawkish with the chairman's comments during an interview with the Wall Street Journal the most hawkish yet. These were accompanied by Fed's Charles Evans on Wednesday saying that the Fed will likely hike rates above neutral. “If we go 50 bp beyond that, if we go 75 bp beyond that, then that restrictive setting of policy should be working to bring inflation down.” Evans added that “My own assessment of ‘neutral’ is in the 2.25-2.5% range.”
Fed's Patrick Harker also commented yesterday and said “We don’t want to overdo it. But we have to act and we are acting.” He added that the US may have a few quarters of negative growth, but that is not what he is forecasting. Lastly, Harker said the Fed can engineer a “safe” if not “soft” landing for the economy.
As for the bank of England, earlier this week, the Old Lady's Governor Andrew Bailey warned about the apocalyptic risks with respect to food prices. ''Clearly, the Bank has no power to improve supply-side constraints. Instead, it has a blunt set of tools which can impact demand,'' analysts at Rabobank explained.
''In order to re-set the equilibrium that is conducive to lower price pressures, the Bank is effectively working to rein in economic activity. As the bank hikes rates to rein in overall demand, the difficulties for many households in coping with higher food and energy costs will be heightened.''
The analysts said, ''Under the weight of USD strength we see risk that GBP/USD could head as low at 1.20 on a 3-month view.''
GBP/USD technical analysis
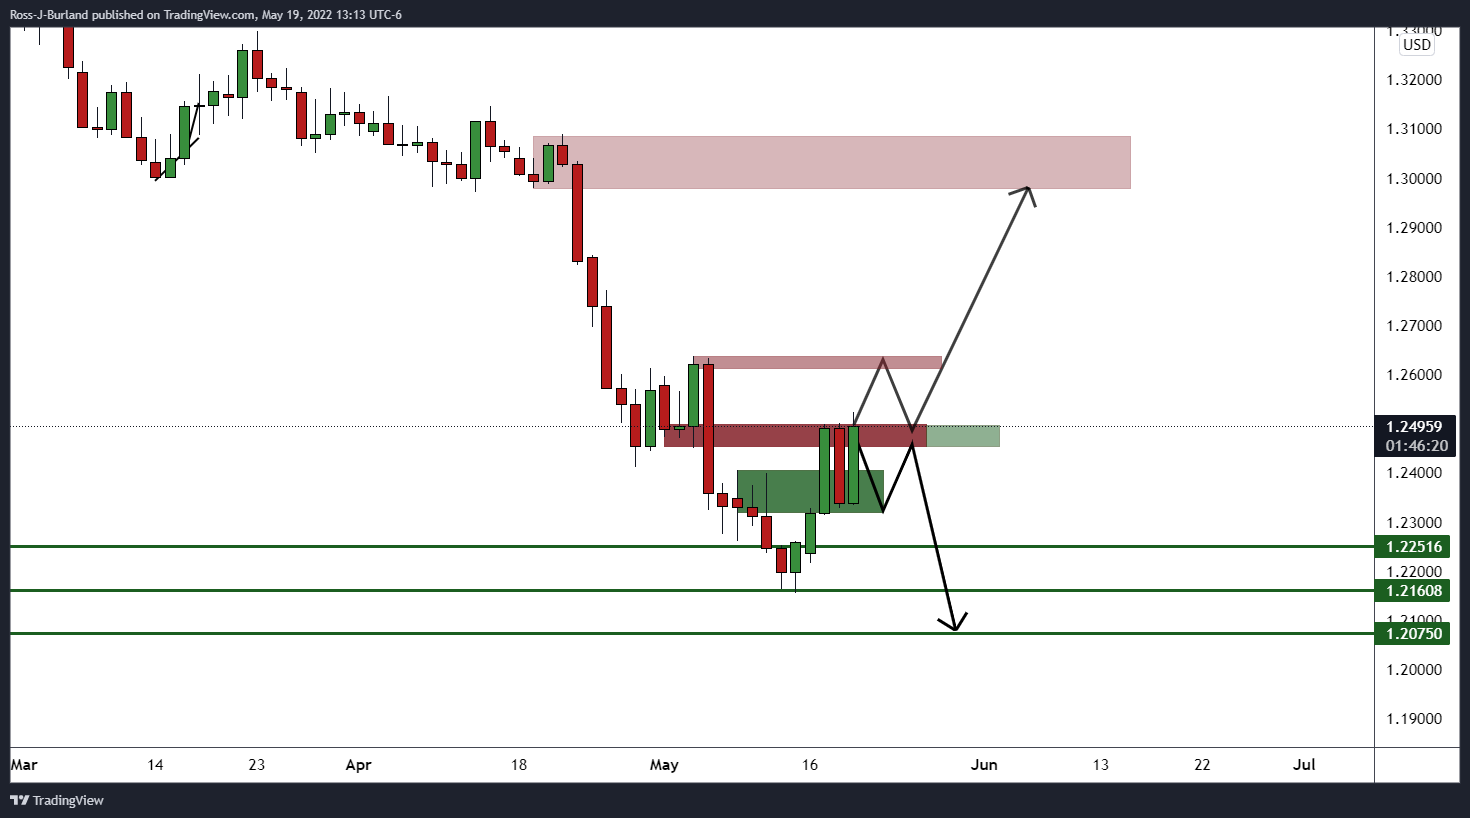
From a daily perspective, the price is testing a resistance area and should the bears commit, then this could lead to a downside continuation on a break of current support.
On the weekly outlook, while the price remains contained by resistance, the bias is to the downside. The bulls are currently moving in on the 38.2% Fibo at 1.2534 and just above the highs of the day. However, until the bulls are clear above the 61.8% ratio, they remain in the woods.
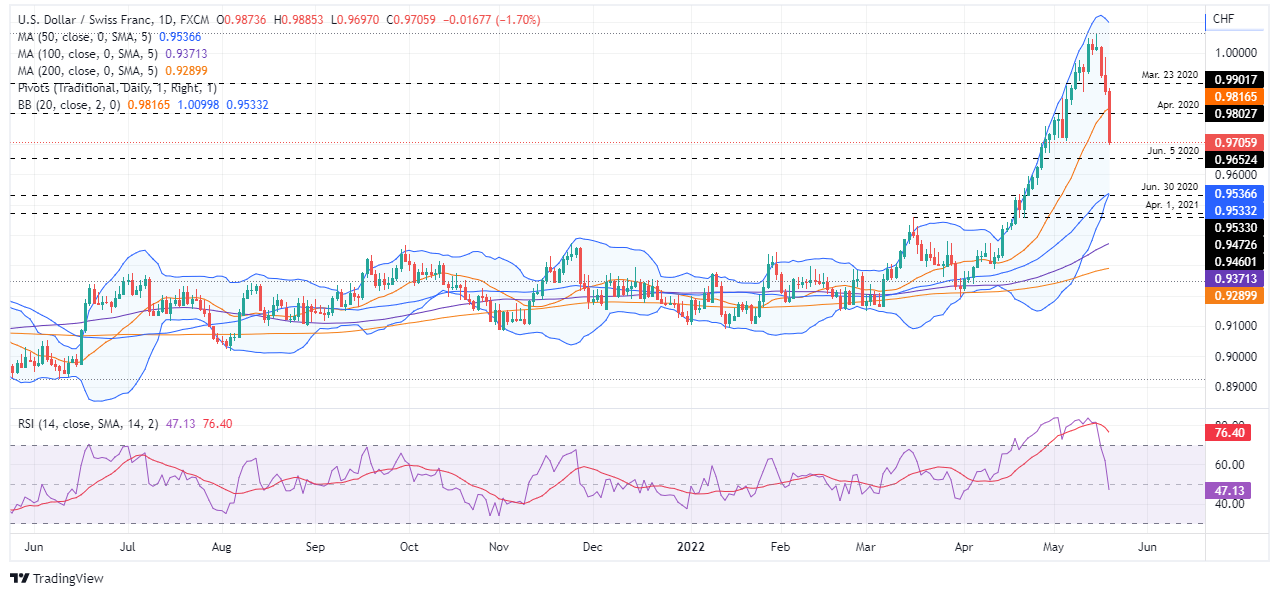
- Since Tuesday, USD/CHF has collapsed by more than 300-pips, and it is down 1.69% on Thursday.
- The US Dollar Index has fallen in the week so far by 1.68%, weighed by falling US bond yields.
- USD/CHF Price Forecast: To dip towards the 50-DMA before resuming the upward bias.
The USD/CHF plunges 100-pips and falls for the third consecutive trading day and is trading below the 20-day moving average (DMA) and 300-pips below the parity achieved on May 12. At 0.9705, the USD/CHF reflects the aforementioned, mainly attributed to US dollar weakness and falling US Treasury yields.
Investors’ mood remains negative. US equities begin to prepare for the New York close, and even though they are down less than 1%, they are set to finish Thursday’s session with losses, except for the Nasdaq 100. China’s lockdowns remain a concern for market players, as domestic Covid-19 flare-ups in other provinces threaten to trigger restrictions again.
The US Dollar Index, a gauge of the greenback’s value vs. a basket of six peers, is retreating more than 1%, sitting at 102.701, a headwind for the major. Furthermore, US Treasury yields extend their fall for the second straight session, losing three and a half basis points, down at 2.853%.
In the meantime, the Swiss National Bank (SNB) Chairman Thomas Jordan said on Thursday that the central bank is not “hostage” to other central banks and emphasized that the bank has an “autonomous monetary policy with a focus on price stability.” Furthermore, Jordan stated that “we remain ready to intervene in currency markets when necessary” and reiterated the need for an accommodative stance.
USD/CHF Price Forecast: Technical outlook
The USD/CHF daily chart depicts the pair as upward biased, despite the major tumbled below the 20-DMA at 0.9816. Supporting the previously-mentioned are the daily moving averages DMAs, sitting below the exchange rate. However, the Relative Strenght Index (RSI) at 47.20 is in bearish territory, and the speed of the downward move could find some support around the 0.9530s area, where the 50-DMA rests.
That said, the USD/CHF first support would be 0.9700. A breach of the latter would expose the June 5, 2020, daily high-turned-support at 0.9652, followed by the figure at 0.9600 and the aforementioned 50-DMA at around 0.9536.
Key Technical Levels
- USD/JPY bears are taking control and eye a run to 125 the figure for the days ahead.
- The four-hour outlook is bullish for the immediate hours as the price corrects towards a 38.2% Fibo.
As per the prior series of analyses, USD/JPY embarks on a significant correction below key daily support, and before that, USD/JPY Price Analysis: Bulls meeting tough resistance from bears despite bull flag, the price is moving in accordance with the bearish outlook and the following illustrates the before, now and possibilities for the forthcoming sessions and days ahead.
USD/JPY prior analysis
From a weekly perspective, the price was potentially overstretched and due for a correction. On the daily chart, the price had formed a W-formation which pulled in the bids and offers started to emerge:
The bull flag breakout failed:
The pair had bucked the trend last Thursday, breaking below prior support and denied the bulls that were otherwise seeking more from the bullish flag pattern on the daily chart:
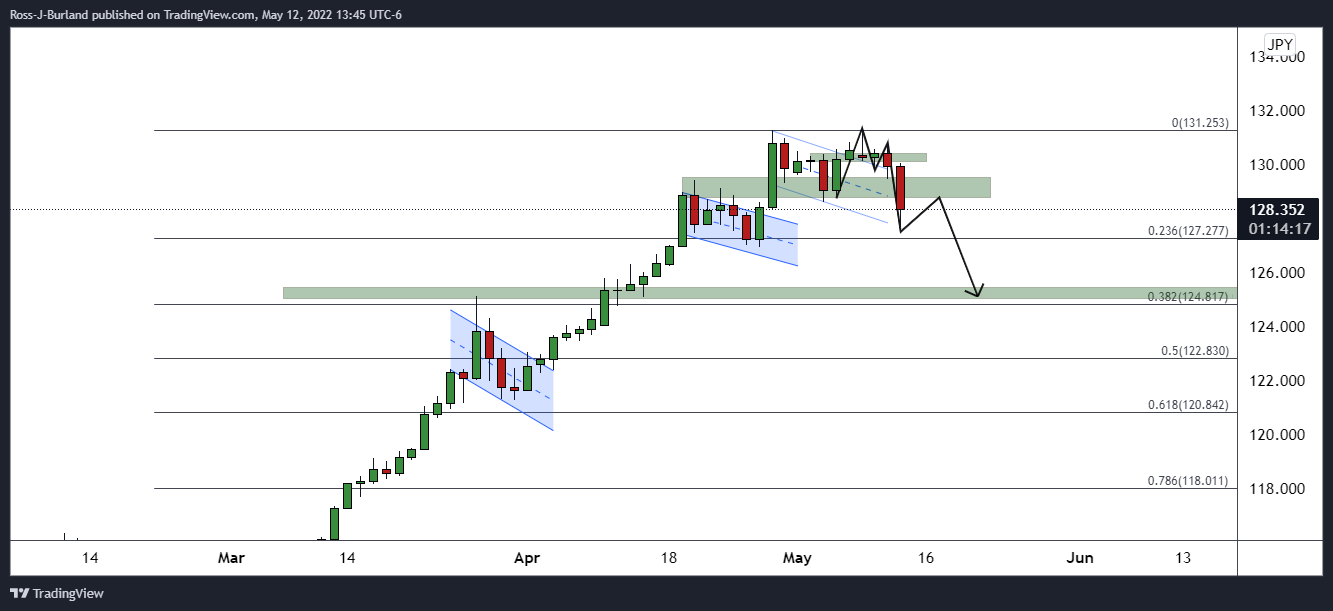
The price action had left an M-formation on the daily chart, the opposite of the prior W-formation. These patterns often see the price reverting to restest the prior lows or the neckline of the chart pattern. In this case, the neckline was near 129.80.
USD/JPY live market
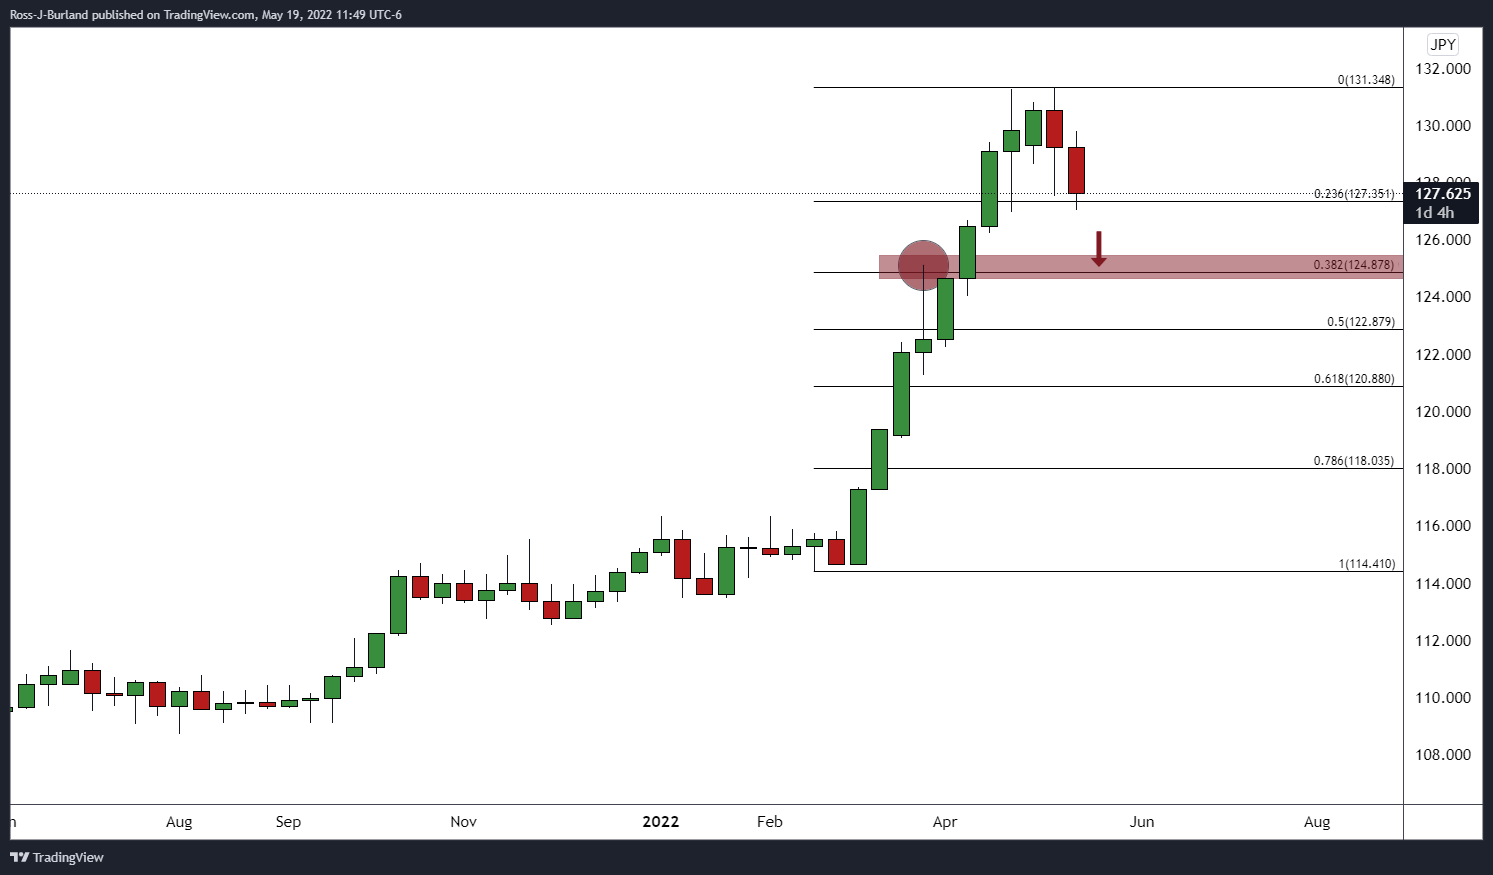
The weekly correction is well and truly underway with eyes on a break of 127 the figure and then the 38.2% Fibonacci retracement that aligns with prior highs made in Feb near 125.00.
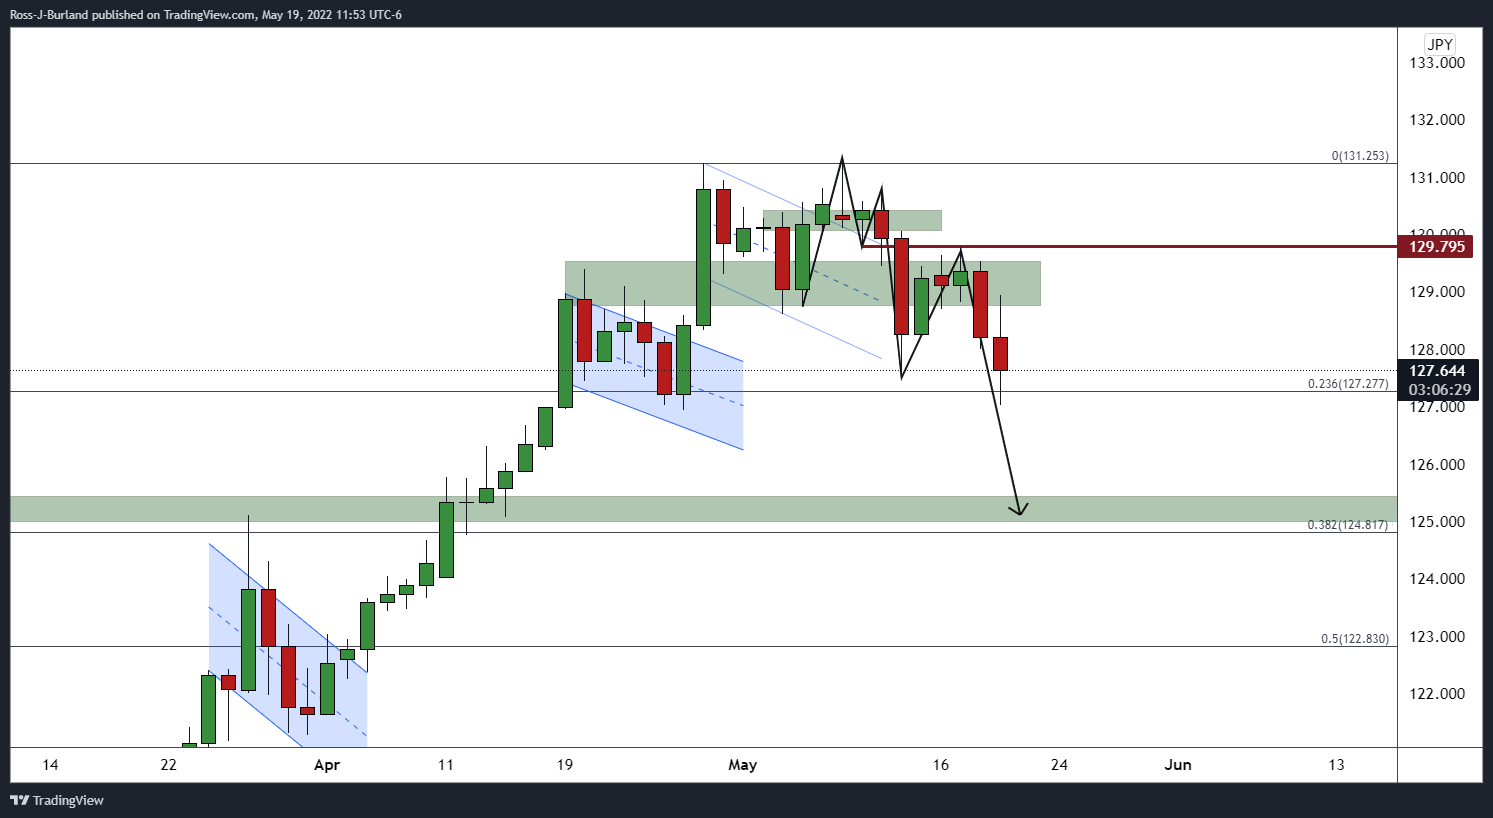
The daily chart has seen the price revert to test the neckline of the M-formation at 129.795 and has since moved lower in a downside continuation.
However, another M-formation has been left:
Whether the bears commit now on a daily basis having already forced back the bears from the neckline at 128.705, or if the price needs to close on a daily basis into the neckline, the outlook is still bearish.
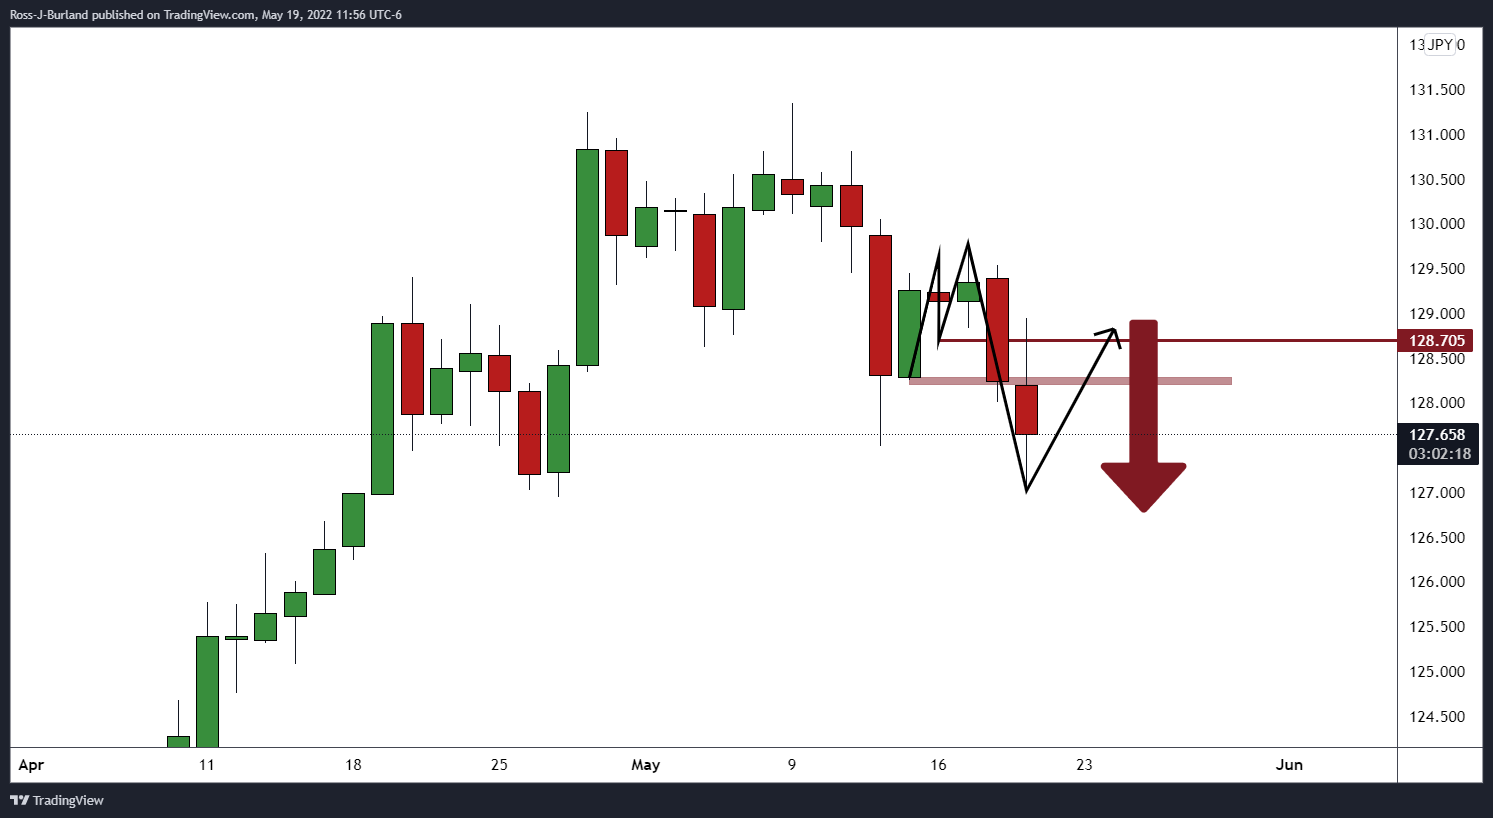
USD/JPY H4 chart
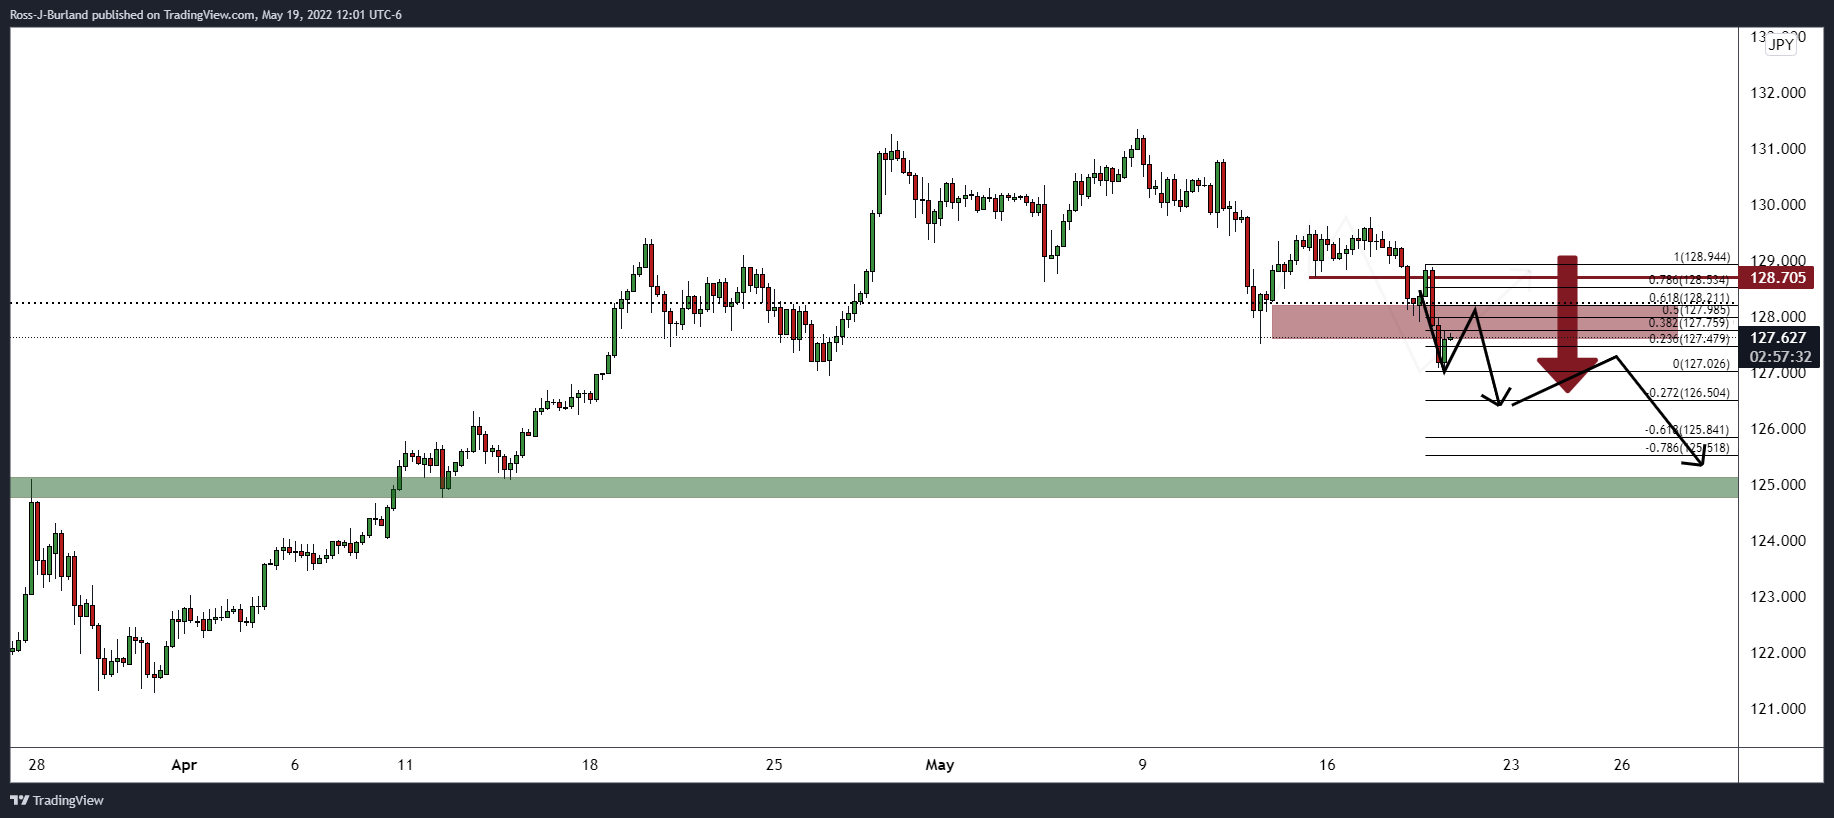
The four-hour outlook is bullish for the immediate hours as the price corrects towards a 38.2% Fibo and to test the resistance structure. If the bears commit between here and the 61.8% ratio near 128.20, then there will be scope for a downside continuation and fresh corrective low for the days ahead. A break of 126.50 will be required in order to clear the way toward the weekly 38.2% ratio target nearer 125 the figure. On the flipside, 128.705 is a key resistance that could be the ultimate defence of a bullish continuation.
- The Loonie advances benefited from a soft US dollar and high oil prices.
- Statistics Canada reported that consumer prices hit a 31-year high at 6.8%y/y.
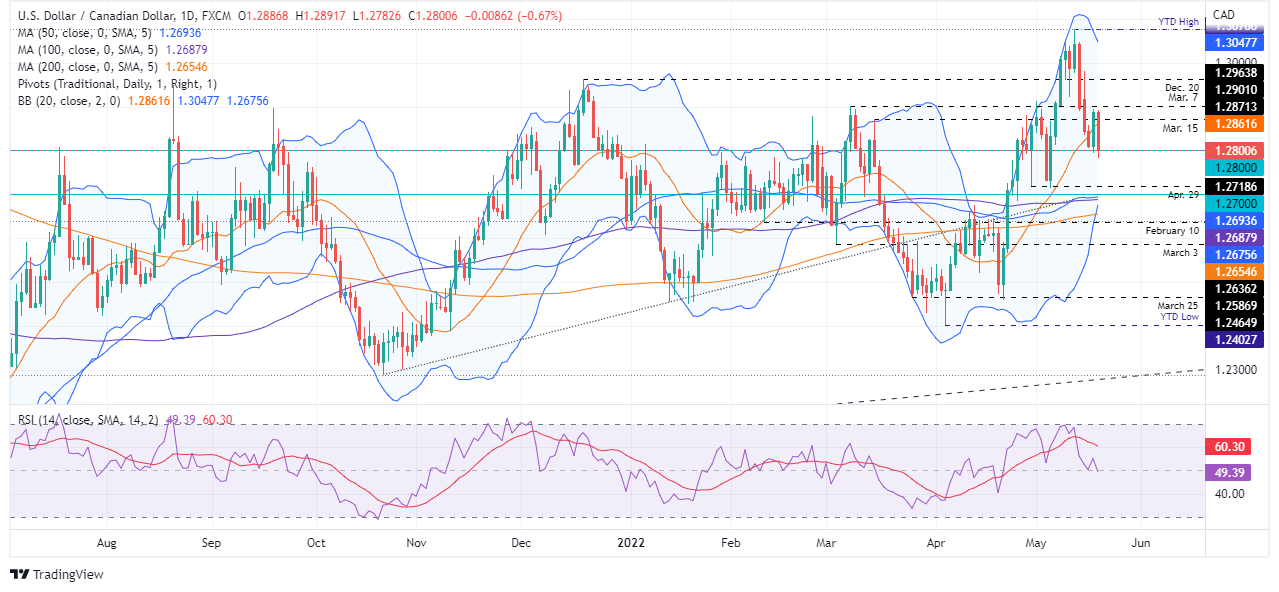
- USD/CAD Price Forecast: To reach 1.2700 once USD/CAD bears reclaim 1.2800.
The USD/CAD slides for the third day of the week and is trading back below the 1.2900 figure after two consecutive days of a busy Canadian calendar, which witnessed the release of inflationary figures, which showed that Consumer Prices rose. However, the market reacted the opposite way, sending the USD/CAD rallying above 1.2900, though Thursday’s is a different story. At 1.2801, the Loonie regained its strength, though the greenback is trading softer in the North American session.
Canadian inflation at 31-year highs
On Wednesday, Canadian data showed that inflation struck a 31-year high at a pace of 6.8% y/y, higher than the 6.7% foreseen. Analysts at TD Securities wrote in a note that the report might keep the Bank of Canada under pressure to bring policy to neutral. They added that although “The Bank has already acknowledged that additional 50bp hikes are likely, today’s report is unlikely to tip the scales towards a 75bp hike.”
“We continue to look for the Bank to hike by 50bps in June and July to bring the overnight rate to 2.00%, before switching to 25bp hikes from Sept-Jan,” TD Securities analysts noted.
Meanwhile, on Thursday, Statistics Canada reported that prices paid by producers, also known as PPI, came in line with expectations, but Raw Materials skyrocketed to 38.4% y/y, higher than the 31% estimations.
Along with a weaker US Dollar despite a risk-aversion environment, those factors are a headwind for the USD/CAD. Also, the rising US crude oil, with WTI’s gaining almost 1.50%, up at $110.79 per barrel, boosted the prospects of the Canadian dollar.
The US economic docket featured Initial Jobless Claims for the week ending on May 14, which grew by 218K, more than the 200K estimated. At the same time, the Philadelphia Fed Manufacturing Index increased to 2.6, much lower than the 17.6 estimated, following the New York Fed’s Empire State index drop, which shrank to 11.6, painting a dismal US ISM figure for June.
During the day, the Kansas City Fed President Esther George said that the “rough week in the equity markets” does not alter her support of 50-bps hikes to cool inflation. She added, “right now, inflation is too high, and we will need to make a series of rate adjustments to bring that down.”
On Wednesday, Philadelphia’s Fed President Patrick Harker stated that the Fed “doesn’t want to overdo it” and commented that the US might have a few quarters of negative growth, but that is not what he is forecasting.
USD/CAD Price Forecast: Technical outlook
The USD/CAD on Thursday tumbled below the 20-day moving average (DMA) at 1.2861, signaling that bears remain in control in the near term. Worth noting is the slope of the 50, 100, and 200-DMA, trapped in the 1.2693-54 area, almost horizontal, emphasizing the sideways price action of the major. Digging a little deep, the RSI is about to cross towards negative territory, meandering around 50, but with a downslope, opening the door for further losses.
That said, the USD/CAD first support would be 1.2800. Once cleared, the next demand zone would be the April 29 daily low at 1.2718, followed by the confluence of the 50 and 100-DMA at 1.26693 and 1.2688, respectively.
- The AUD/USD is gaining close to 1.50% on Thursday.
- The sentiment is mixed, as Asian and European bourses closed negatively, while US equities are pairing Wednesday’s losses.
- Fed’s Esther George commented that the “rough week in the equity markets” would not alter her support of 50-bps hikes.
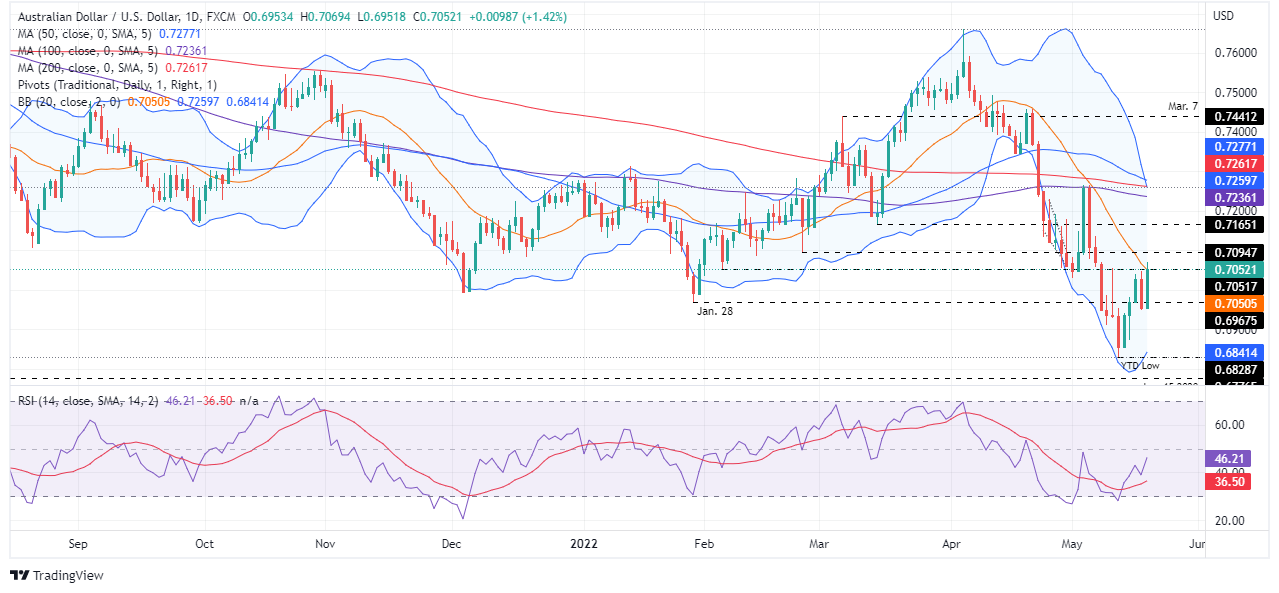
- AUD/USD Price Forecast: A daily close above 0.7050 could send the pair towards 0.7100.
The AUD/USD is paring Wednesday’s losses and is rallying sharply, more than 1.40% on Thursday, despite a risk-off market mood, which would usually be a headwind for the major. At 0.7052, the AUD/USD reflects the ongoing US dollar weakness in the North American session, influenced by mixed US economic data and falling US Treasury yields.
Sentiment fluctuates, courtesy of China’s concerns about additional lockdowns; despite that, the AUD/USD rises
The market sentiment is mixed, courtesy of weak US corporate earnings and high inflationary pressures, which affected big US retailers such as Walmart and Target, albeit US retail sales showed the resilience of consumers. Also, China is still under pressure, as provinces reported local Covid-19 flare-ups, increasing concerns of more lockdowns. Meanwhile, the Ukraine-Russia conflict looms even though it has taken the back seat.
In the Asian session, the Australian docket featured employment data, which showed that Full-Time Employment in April rose by 92.4K, beating expectations of 20K new jobs. Contrarily to that, is Part-Time figures, which collapsed -88.4K, lower than the 0.4K jobs estimated. However, compounding both statistics, the Aussie economy added 4K jobs, and it’s also worth noting that the Unemployment rate fell to 3.9% from 4.%.
Analysts at ANZ bank wrote in a note that “added to the disappointing wages data yesterday, this suggests a 25bp cash rate hike at the RBA’s June meeting is more likely than a supersized 40-50bp hike.”
The Fed parade continues on Thursday
Elsewhere, the US economic docket also unveiled data. The Department of Labour reported that Initial Jobless Claims for the week ending on May 14 unexpectedly rose to 218K, higher than the 200K foreseen. At the same time, the Philadelphia Fed Manufacturing Index grew to 2.6, much lower than the 17.6 estimated, following the New York Fed’s Empire State index drop, which shrank to 11.6, painting a dismal US ISM figure for June.
In the meantime, Fed speakers continue to dominate the headlines. Earlier today, Kansas City Fed President Esther George said that the “rough week in the equity markets” does not alter her support of 50-bps hikes to cool inflation. She added, “right now, inflation is too high, and we will need to make a series of rate adjustments to bring that down.”
On Wednesday, Philadelphia’s Fed President Patrick Harker stated that the Fed “doesn’t want to overdo it” and commented that the US might have a few quarters of negative growth, but that is not what he is forecasting.
AUD/USD Price Forecast: Technical outlook
The AUD/USD remains downward biased, despite rallying and piercing the confluence of the May 11 high and the 20-day moving average (DMA) at 0.7051. Further reinforcing the aforementioned is that the Relative Strenght Index (RSI), although pointing upwards, is in bearish territory, meaning that unless it crosses the 50-midline, that will open the door for additional buying pressure in the major.
Upwards, the AUD/USD’s first resistance would be the February 24 low-turned-resistance at 0.7094. Break above would expose May 6 daily high at 0.7135, followed by March 15 swing low at 0.7165. On the other hand, the AUD/USD’s first support would be the 20-DMA at 0.7050. A breach of the latter would expose essential support levels like the figure at 0.7000, followed by January 23 swing low at 0.6967 and then the YTD low at 0.6828.
The US dollar could remain stronger for a longer than expected period, warn analysts at Rabobank. They view the AUD/USD pair recovering to the 0.71 area in a six-month period.
Key Quotes:
“The AUD is struggling to push back above the 0.70 level against the USD. The fall in AUD/USD from highs in the 0.76 area at the start of April to a low around 0.6829 earlier this month is suggestive of a sharp fall from grace for the AUD. While we attribute much of this fall in the value of the Aussie to fears surrounding growth in China, the mightiness of the USD is also a factor.”
“The tightness of the labour market and the assumption that wages will continue to pick up have driven speculation that the RBA could up the pace of interest rate hikes. The minutes of the May RBA meeting highlight that both 15 bp and 40 bp hikes were considered this month. This raises the possibly that the Bank could opt for a 40 bps move in June.”
“Looking ahead, we see scope for the USD to remain stronger for longer based on elevated safe haven demand stemming from global growth risks and a hawkish Fed.”
“We recently revised higher our forecasts for the USD across the board and see scope for AUD/USD at 0.69 on a 1 and 3 month view recovering to the 0.71 area in 6 months. Insofar as we see recession risks for the Eurozone in late 2022/early2023 (based on the assumption the EU will announce an embargo on Russian oil) and a painful cost of living crisis in the UK, we expect both the EUR and GBP to be on the back foot in the coming months. This implies scope for the AUD to be better bid vs. European currencies in the coming months.”
- US dollar drops further amid an improvement in market sentiment.
- Nasdaq up by more than 1%, US yields off lows.
- EUR/USD rises to test the 1.0600 zone, at two-week highs.
The EUR/USD has constantly been rising since early European session and recently printed a fresh daily high at 1.0598. It remains near the daily high, on its way to the highest daily close in two weeks and the first one above the 20-day SMA since early April.
Dollar tumbles, Wall Street, attempts recovery
The US dollar was falling on Thursday and during the American session accelerated the decline as stock markets started to offer signs of life. The Dow Jones is falling “just” 0.26%, while the S&P 500 and the Nasdaq are up by 0.33% and 1.20%, respectively.
The dollar’s weakness was driver initially by lower US bond yields and, more recently, by the improvement in market sentiment. While European bonds remain relatively steady, Treasuries are higher. The US 10-year yield went from above 3% on Wednesday to 2.81% on Thursday.
Economic data from the US was mostly ignored by market participants on Thursdays. Initial Jobless Claims rose to 218K, the highest level since January, while Continuing Claims hit the lowest since 1970. The Philly Fed tumbled to 2.6 in May versus market consensus of 16. Existing Home Sales fell 2.4% in April.
Earlier, the European Central Bank released the minutes of its last meeting. Board members widely expressed concerns over high inflation. “The European Central Bank hawks are calling the shots. The minutes of the ECB’s April meeting just confirmed that the hawks increasingly have the upper hand in discussions. A rate hike in July is no longer uncertain, the only uncertainty is whether it will be 25bp or 50bp”, said Carsten Brzeski, Global Head of Macro at ING.
¿A better outlook for EUR?
The outlook for the EUR/USD is improving even with the current environment of volatility and cautious markets. If the pair manages to remain above 1.0600, it could add support for a more sustainable recovery. The next target is seen at May’s high at 1.0641. Above the next strong barrier awaits at 1.0750.
A slide back under 1.0545 (20-day Simple Moving Average) would alleviate the bullish momentum. Below, attention would turn to 1.0480 and then 1.0455 (May 18 and 19 low).
EUR/USD’s main trend is bearish but a firm recovery above 1.0650 could point to an interim bottom.
Technical levels
- The market sentiment remains negative as new China provinces have local outbreaks, so additional lockdowns loom.
- Fed’s George and Evans back 50-bps increases in the next meetings.
- Fed Harker commented that the US might have a few quarters of negative growth.
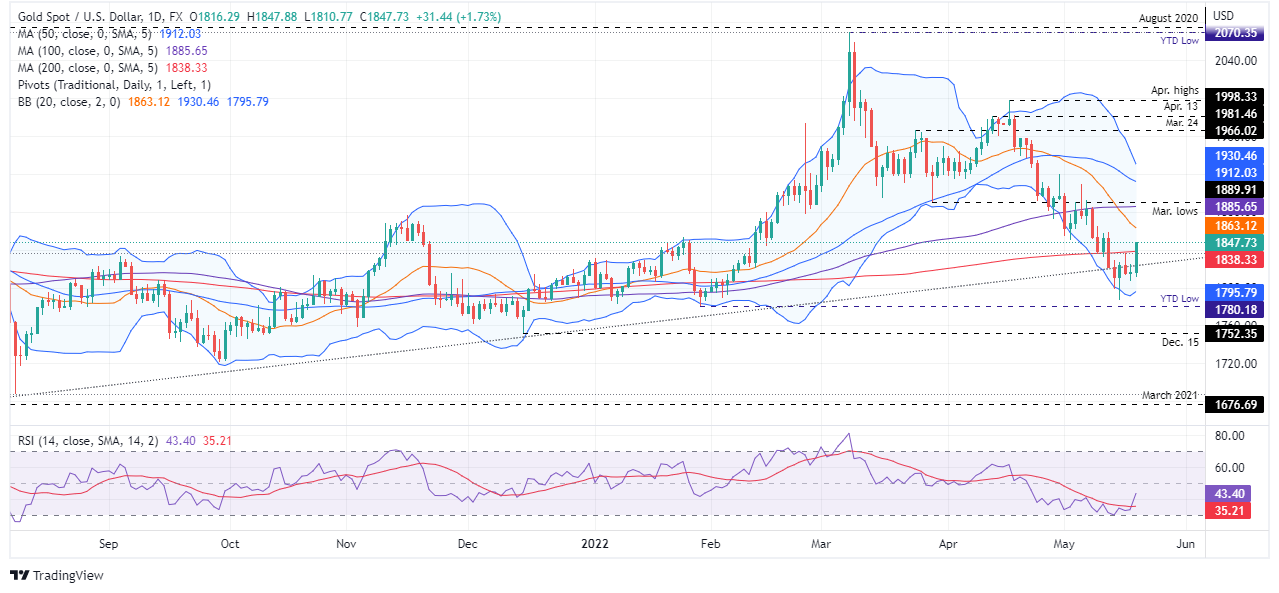
- Gold Price Forecast (XAU/USD): A daily close above the 200-DMA would shift the bias to neutral and opens the door for an upward move to $1860s.
Gold spot (XAU/USD) is rallying in the North American session, and it is above the 200-day moving average (DMA), which lies at $1838.30, threatening to shift the yellow metal negative bias to neutral as the precious metal takes advantage of lower US Treasury yields and a soft US dollar. At the time of writing, XAU/USD is trading at $1847.68 a troy ounce.
A softer US dollar and weaker US corporate earnings boost Gold’s appeal amidst a dampened sentiment
The factors above-mentioned are a tailwind for Gold. Even though Shanghai is about to reopen after dealing with Covid-19 restrictions for at least a month, other China cities with local flare-ups have increased concerns of further lockdowns. Also, the inflationary scenario started to hit the earnings of big US retailers, which lowered their growth forecasts, despite that Retail Sales, showed the resilience of consumers. That, alongside the possible scenario of stagflation around the US economy, despite Fed’s chief Powell’s confidence that the US economy is strong, boosts the prospects of Gold.
In the meantime, the greenback remains on the backfoot, a tailwind for the bright metal, weighed by falling US Treasury yields. The 10-year benchmark note is losing 7.5-bps, sitting at 2.819%, while the US Dollar Index, a gauge of the buck’s value, is losing almost 1%, retreating towards 102.981.
Meanwhile, the US economic docket has featured the Initial Jobless Claims for the week ending on May 14, which unexpectedly rose to 218K, more than the 200K estimated. Furthermore, the Philadelphia Fed Manufacturing Index rose to 2.6, worse than the 17.6 estimated, aligning with the drop of the New York Empire State index, which contracted to -11.6, starting to paint a dismal US ISM figure for the next release on the first week of June.
Elsewhere, Fed speakers continue to dominate the headlines. Earlier today, Kansas City Fed President Esther George said that the “rough week in the equity markets” does not alter her support of 50-bps hikes to cool inflation. She added, “right now, inflation is too high, and we will need to make a series of rate adjustments to bring that down.”
On Wednesday, Chicago’s Fed President Charles Evans said that the US central bank needs to hike rates above neutral. Evans added that once the neutral rate is reached, “if we go 50 bp beyond that if we go 75 bp beyond that, then that restrictive setting of policy should be working to bring inflation down.” Later on that day, Philadelphia’s Fed President Patrick Harker stated that the Fed “doesn’t want to overdo it” and commented that the US might have a few quarters of negative growth, but that is not what he is forecasting.
Gold Price Forecast (XAU/USD): Technical outlook
XAU/USD is back above a two-year-old resistance trendline and so far reclaimed the 200-DMA at $1838.31. That said, the non-yielding metal bias shifted from negative to neutral. However, a daily close above the previously-mentioned level is needed to cement the bias. Failure to do so would leave the yellow metal vulnerable to further selling pressure.
With that said, the XAU/USD’s first resistance would be May 12 daily high at $1858.67. Break above would expose the 20-DMA at $1863.06, followed by the 100-DMA at $1885.65, shy of the crucial $1889.91 March’s lows-turned-resistance area.
- US dollar extends slide, DXY drops 1% to lowest in two weeks.
- Rebound in Wall Street fades, Dow Jones falls by 1.10%.
- GBP/USD rebounds sharply, back above the 20-day SMA.
The GBP/USD is rising on Thursday, making a full recovery from Wednesday’s slide even as the stock market stays in red and under pressure. The pair rose more than 150 pips from the daily low and recently hit 1.2512, the highest level since May 5.
Weaker greenback behind cable’s rally
A broad-based dollar weakness boosted GBP/USD. The DXY is falling by 1.05%, trading at two-week lows under 102.80 even as risk-off still remains in place. The FTSE 100 dropped 2.12% and in Wall Street, the Dow Jones falls 1.00%. The Nasdaq managed to climb to positive ground and gain 0.35%.
The demand for quality assets boosted government bonds. The US 10-year yield stands at 2.81%, significantly away from the 3% it reached on Wednesday. UK yields held in the recent range (10-year around 1.85%). The slide in yields weakened the dollar that is the worst performer in the G10 space on Thursday.
Economic data from the US showed Initial Jobless claims to the highest since January at 218K while Continuing Claims hit the lowest since 1970. The Philly Fed tumbled to 2.6 in May (against market consensus of 16). Existing Home Sales fell in April 2.4%. On Friday, the April Retail Sales report is due in the UK.
GBP/USD back above the 20-SMA
The rally in GBP/USD pushed the price back above the 20-day Simple Moving Average. The pound is having difficulties staying above 1.2500. A daily close clearly above would add support for an extension of the move to the upside.
A new failure here would expose again the 1.2330 low. Before that level, the 1.2400 zone offers interim support.
Technical levels
- NZD/USD has pulled back below 0.6400 after earlier testing its 21DMA at 0.6430, but still trades substantially higher on-the-day.
- US dollar weakness after downbeat Philly Fed manufacturing data plus kiwi strength on hot PPI/positive OBEGAL revisions is helping.
NZD/USD rallied to test its 21-Day Moving Average around the 0.6430 mark on Thursday and printed near two-week highs in doing so, as the kiwi rode a wave of US dollar weakness. The buck saw some downside pressure in wake of a very weak US Philadelphia Fed Manufacturing survey for May, which sparked fresh fears about US economic weakness after downbeat Q1 earnings from major US retailers released earlier this weak triggered concerns about the health of the US consumer. At current levels in the 0.6380s, NZD/USD has pared its on-the-day gains to about 1.5%, with the pair trading about 2.5% above last week’s lows near 0.6200.
Further supporting the kiwi was a massive jump in the QoQ pace of Producer Price Inflation (PPI) according to a report released during Thursday’s Asia Pacific session. Producer input prices were up 3.6% in Q1, while output prices were up 2.6%, with the latest surge in price pressures interpreted by market participants as boosting the case for a second successive 50 bps rate hike from the RBNZ next week (rates are expected to be lifted to 2.0%).
“The RBNZ has accepted the logic that stronger action early on will reduce the need for an even more painful peak in rates in the future,” said analysts at Westpac. “We recently updated our forecasts to include four consecutive 50bp hikes in the (official cash rate) - at the May, July and August reviews, on top of the one in April”. That schedule of rate hikes should see the RBNZ maintain its substantial lead over the Fed when it comes to monetary tightening though, in recent weeks, this policy divergence has offered NZD/USD little by way of long-term support. The pair still trades over 9.0% below its early April highs above 0.7000.
Elsewhere and also perhaps lending the kiwi some support was the latest New Zealand budget announcement, which contained NZ$1B in giveaways to low- and middle-income households to help cope with the inflation surge. Importantly, New Zealand made positive revisions to its operating balance before gains and losses (OBEGAL) forecasts and now sees itself in budget surplus by 2024/25, with Finance Minister Grant Robertson expecting the economy to remain robust in the near term.
- WTI has recovered back to the $108.00 area from an earlier test of its 21 and 50DMAs around $105.
- Crude oil is being supported amid strong global demand (China lockdown easing) and ongoing supply concerns.
- Oil is holding up well despite choppy equity market conditions.
Having dipped as low as the $105 per barrel mark earlier in the session and found support at its 21 and 50-Day Moving Averages, front-month WTI futures have since rebounded to trade in the $108.00s. That still leaves prices slightly lower on the day, but will give the crude oil bulls confidence that there remains plenty of demand to buy WTI on dips.
Crude oil prices fell back sharply from earlier weekly highs in the $115s on Wednesday in tandem with a sharp deterioration in sentiment on Wall Street, which incidentally had its worst day since June 2020. Given that US equity indices appear to have picked up where they left off with things on Wednesday and are currently trading with fresh losses and eyeing a test of annual lows, traders would be forgiven for doubting WTI’s ability to recover back to recent highs on Wednesday.
Triggering the decline on Wall Street on Wednesday was more downbeat earnings from big US retailers (on Wednesday it was Target’s turn), which demonstrated that inflation is really starting to bite the consumer, raising concerns about the US economic outlook at a time when the Fed is moving to rapidly raise interest rates to tackle inflation. That’s a toxic combination for stocks, and as a risk-sensitive assets, weighed heavily on crude oil too.
However, crude oil has its own positive fundamentals to fall back on that are, at the moment, keeping WTI supported well above the $100 mark. Weekly crude oil inventory data on Wednesday showed a surprisingly large drawdown and US refiners ramping up output to keep up with rising US and global demand. The report revealed that refiners on the East and Gulf Coasts were running at 95% capacity, the highest possible run rate.
Meanwhile, in China, Shanghai is on course to see its lockdown restrictions eased from 1 June, spurring hopes for a recovery in crude oil demand there. In terms of supply-side dynamics, fears about Russian output with the EU expected to soon agree on some sort of Russian oil import ban linger whilst many smaller OPEC nations struggle to raise output in line with production quota targets.
- Silver caught aggressive bids on Thursday and surged to a one-week high.
- The lack of follow-through beyond the 50% Fibo. warrant caution for bulls.
- Break below mid-$21.00s would set the stage for further near-term losses.
Silver witnessed a dramatic intraday turnaround and rallied nearly 3% from a three-day low, around the $21.30-25 region touched earlier this Thursday. The strong momentum pushed the white metal to a one-week high during the early North American session, with bulls now awaiting sustained strength beyond the $22.00 round-figure mark.
From a technical perspective, the XAG/USD, so far, has struggled to find acceptance above the 50% Fibonacci retracement level of the $23.24-$20.46 downfall. Moreover, technical indicators on the daily chart - though have been recovering - are still holding deep in the bearish territory. This warrants caution before positioning for any further gains.
Hence, a subsequent move up is more likely to attract some selling near the 100-period SMA on the 4-hour chart, currently around the $22.10 region. This is closely followed by the 61.8% Fibo. level, around the $22.20 area, which if cleared will be seen as a fresh trigger for bulls and set the stage for an extension of the recent recovery from the YTD low.
On the flip side, any meaningful pullback now seems to find decent support near mid-$21.00s, or the 38.2% Fibo. level. Sustained breakthrough, leading to some follow-through weakness below the daily low, around the $21.30-$21.25 region, will shift the bias back in favour of bearish traders and prompt aggressive technical selling around the XAG/USD.
The downward trajectory would then drag spot prices to the 23.6% Fibo. level, around the $21.15 area, en-route the $21.00 mark. Bearish traders could eventually aim back to challenge the YTD low, around the $20.45 region touched last week.
Silver 4-hour chart
-637885657823566859.png)
Key levels to watch
- USD/TRY trades on the defensive after faltering near 16.00.
- The offered stance in the greenback gives support to the lira.
- Turkey 10y note yields rose to multi-week highs around 25%.
The renewed downside in the greenback gives extra legs to the riskier assets and motivates USD/TRY to shed some ground following recent 2022 highs in the area just below the 16.00 yardstick.
USD/TRY weaker on USD-selling
Fears of an economic slowdown and a “hard landing” of the US economy weigh on the greenback and US yields, supporting in turn the first move lower in the pair after ten consecutive daily advances on Thursday.
The better note in the lira is also accompanied by the move higher in the Turkey 10y bond yields, which climb to the 25% region for the first time since later March.
The Turkish currency, in the meantime, remains bid despite persistent geopolitical tensions in Ukraine and after President Erdogan declined to support both Finland and Sweden intentions to join the NATO.
What to look for around TRY
USD/TRY keeps the upside bias well and sound so far this week and trades at shouting distance from the 16.00 mark. So far, price action in the Turkish currency is expected to gyrate around the performance of energy prices, the broad risk appetite trends, the Fed’s rate path and the developments from the war in Ukraine. Extra risks facing TRY also come from the domestic backyard, as inflation gives no signs of abating, real interest rates remain entrenched in negative figures and the political pressure to keep the CBRT biased towards low interest rates remain omnipresent.
Key events in Turkey this week: Consumer Confidence (Friday).
Eminent issues on the back boiler: FX intervention by the CBRT. Progress (or lack of it) of the government’s new scheme oriented to support the lira via protected time deposits. Constant government pressure on the CBRT vs. bank’s credibility/independence. Bouts of geopolitical concerns. Structural reforms. Upcoming Presidential/Parliamentary elections.
USD/TRY key levels
So far, the pair is losing 0.49% at 15.8418 and a drop below 14.6836 (monthly low May 4) would expose 14.5458 (monthly low April 12) and finally 14.5136 (weekly low March 29). On the upside, the next barrier aligns at 15.9750 (2022 high May 18) seconded by 18.2582 (all-time high December 20) and then 19.00 (round level).
- A combination of factors prompted aggressive selling around USD/JPY on Thursday.
- The prevalent risk-off environment provided a strong boost to the safe-haven JPY.
- A steep fall in the US bond yields weighed on the USD and added to the selling bias.
The USD/JPY pair struggled to capitalize on its early positive move and witnessed a turnaround from the 129.00 neighbourhood on Thursday. The sharp intraday fall - marking the second successive day of a negative move - dragged spot prices to a fresh monthly low, around the 127.00 mark during the early North American session.
Growing worries about softening global economic growth continued weighing on investors' sentiment and triggered a fresh wave of a risk-aversion trade. This was evident from a sea of red across the equity markets, which boosted demand for the traditional safe-haven Japanese yen and exerted heavy downward pressure on the USD/JPY pair.
The anti-risk flow led to a steep decline in the US Treasury bond yields, which prompted aggressive US dollar selling and further contributed to the heavily offered tone around the USD/JPY pair. The downward trajectory could further be attributed to some technical selling on a sustained break below the 128.00 round-figure mark.
Subsequent weakness below the 127.50 area (previous monthly low), coinciding with the 38.2% Fibonacci retracement level of the 121.28-131.35 rally, could be seen as a fresh trigger for bearish traders. Some follow-through selling below the 127.00 round-figure mark will reaffirm the negative outlook and pave the way for further losses.
The USD/JPY pair might then accelerate the fall towards testing the next relevant support marked by the 50% Fibo. level, around the 126.25 region, before eventually dropping to the 126.00 handle. The corrective slide could further get extended towards the key 125.00 psychological mark, which should act as a near-term base for spot prices.
On the flip side, attempted recovery back above the 127.50 support breakpoint (38.2% Fibo. level) could now be seen as a selling opportunity. This, in turn, should cap the USD/JPY pair near the 128.00 mark, which is followed by resistance near the 128.30 region. A convincing breakthrough the latter should allow bulls to aim back to reclaim the 129.00 mark.
USD/JPY 4-hour chart
-637885632911470861.png)
Key levels to watch
AUD/USD has regained positive traction on Thursday. However, there are a few arguments supporting a stronger aussie, economists at Commerzbank report.
A lot depends on further developments in China
“The market expects 25bp in June and a key rate of around 2.75% by year-end. Considering a further seven RBA rate meetings until year-end that results in more than 25bp at each meeting. Hawkish comments might support AUD, but in view of the market’s rate expectations, the RBA cannot really surprise on the restrictive end.”
“There is also the risk of the parliamentary elections on Saturday. If the formation of a government were to take time that would put subliminal pressure on AUD.”
“If the covid situation in China were to improve, AUD would be able to benefit. However, whether that will be sufficient to give AUD wings seems questionable to me.”
“Restrictive comments on the part of the RBA and an improvement of the situation in China would only allow AUD/USD to stabilise in the area of 0.70, preventing further losses.”
The Reserve Bank of India (RBI) is in a race against time to get inflation back under control. Economists at Commerzbank expect further rate hikes throughout the rest of 2022 but the bias for USD/INR is still to the upside.
RBI to continue to hike for the rest of the year
“We look for 50bp and 25bp hike in June and August respectively from 4.40% currently. This will take the benchmark repo rate back to the pre-pandemic level of 5.15%. After that, we could yet see another 50bp hike in the remaining two meetings for the year, in September and December.”
“The policy direction for RBI is unambiguous. It is to anchor inflationary expectations. We could see RBI raise its inflation forecast once again at the next meeting from 5.7% currently for the current fiscal year 2022-2023.”
“In terms of implications for INR, the rate hikes should provide some support. Nevertheless, the bias for USD/INR is still to the upside, but we suspect RBI will be keen to mitigate INR’s weakness in order to contain import prices and not exacerbate the inflation picture.”
Gold is finding some respite. However, the path of least resistance for XAU/USD is still lower, economists at TD Securities report.
CTA selling flows have largely run their course
“Should prices hold the $1,830 region, CTA funds may begin to add back some length in the shiny metal. But, with downside momentum and the prevailing negative sentiment across precious metals more firmly entrenched, any such buying flows would likely face a high bar to be maintained.”
“Fed Chair Powell's willingness to take rates beyond neutral in an effort to tame inflation, while sounding tone-deaf regarding economic worries, suggests the path of least resistance for gold is still lower.”
“ETF holdings of gold continue to fall for a tenth straight day while positioning analytics still argue for the potential of additional pain for gold bugs.”
The Swiss franc (CHF) has been the strongest G10 currency over the last five days. But CHF's strength over the last 24 hours has been helped by comments from SNB president Thomas Jordan. Given the SNB's focus on a stable real exchange rate, low inflation in Switzerland points to EUR/CHF trading 4% cheaper next year, economists at ING report.
Sea change in Swiss National Bank’s FX attitude
“Central Bank Governor Jordan was quoted saying: ‘The SNB is ready to act if inflation risks materialise’. After all, the SNB has accumulated CHF500bn of FX reserves in fighting CHF strength over the last decade, so surely it would prefer a stronger EUR/CHF? Apparently not. In an important speech made on 29 April, Jordan made the revelatory point that a weaker real Swiss franc exchange rate would be inappropriate given the inflation threat in Switzerland.”
“The SNB wants at least a stable real exchange rate. Given that inflation in Switzerland is running around 4% lower than its main trading partner, the eurozone, one could roughly argue that EUR/CHF needs to be 4% lower in nominal terms over the next year to keep the real CHF stable. That would point to EUR/CHF trading under parity this time next year.”
“The prospect of the SNB outright selling EUR/CHF does seem fanciful right now. But the policy choice of a stronger nominal CHF from the SNB is starting to make the case that EUR/CHF will struggle to sustain any moves above 1.05 over the next 12 months and that our baseline EUR/CHF forecast profile must now be revised lower.”
- EUR/USD bounces off lows around 1.0480 on Thursday.
- Extra recovery should target the monthly top at 1.0641.
EUR/USD almost fully fades Wednesday’s retracement and shifts the attention to recent weekly highs near 1.0560.
Considering the pair’s ongoing price action, the continuation of the rebound appears likely in the very near term at least. Against that, the next hurdle emerges at the May high at 1.0641 (May 5) prior to the temporary 55-day SMA, today at 1.0798.
Below the 3-month line near 1.0870, the pair is expected to remain under pressure and vulnerable to extra losses.
EUR/USD daily chart
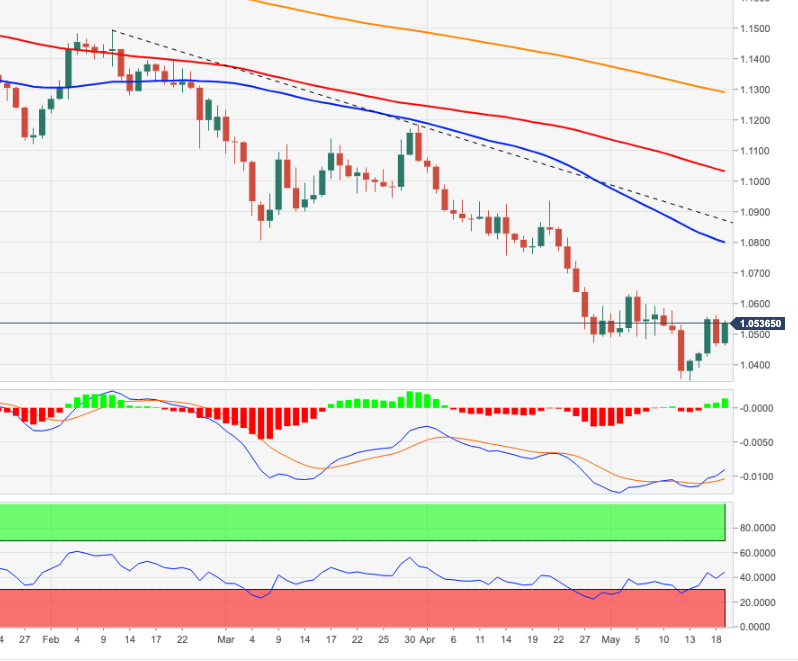
- A combination of factors dragged USD/CHF lower for the third successive day on Thursday.
- The risk-off mood benefitted the safe-haven CHF and exerted pressure amid a weaker USD.
- Disappointing US macro data did little to impress the USD bulls or lend support to the pair.
The USD/CHF pair extended this week's retracement slide from the 1.0065 area, or a two-year peak and witnessed aggressive selling for the third successive day on Thursday. The bearish pressure remained unabated through the early North American session and dragged spot prices to a two-week low, around the 0.9720-0.9715 region in the last hour.
Investors remain concerned that a more aggressive move by major central banks to constrain inflation could hit global economic growth. Adding to this, extended COVID-19 lockdowns in China and the Russia-Ukraine war have been fueling recession fears. This, in turn, took its toll on the risk sentiment and forced investors to take refuge in traditional safe-haven assets, which benefitted the Swiss franc and exerted downward pressure on the USD/CHF pair.
The anti-risk flow triggered modest pullback in the US Treasury bond yields. Moreover, the markets now seem to have fully priced in at least a 50 bps rate hike move over the next two FOMC meetings. This, in turn, prompted fresh selling around the US dollar, which further contributed to the heavily offered tone surrounding the USD/CHF pair. The USD maintained its offered tone and failed to gain any respite from disappointing US macro releases.
In fact, the Federal Reserve Bank of Philadelphia reported that the headline Manufacturing Activity Index fell slid to 2.6 in May from 17.6 last month. This was well below consensus estimates pointing to a reading of 16.0. Adding to this, the Initial Weekly Jobless Claims rose to 218K during the week ending on May 14, above the 200K expected and the 197K previous. Thursday's US economic docket also features the release of Existing Home Sales.
Nevertheless, the data might do little to impress the USD bulls or lend any support to the USD/CHF pair. With the latest leg down, spot prices have now reversed a major part of the monthly gains recorded over the past two weeks or so. Some follow-through selling below the 0.9700 mark will set the stage for a deeper corrective pullback. Bearish traders might then aim to test the next major support, just ahead of the 0.9500 psychological mark.
Technical levels to watch
The stock market is an important price signal, Kansas City Fed President and FOMC member Ester George said in an interview on CNBC on Thursday, before adding that she is not surprised to see volatility, and this is not to be dismissed, as it is a sign of tighter financial conditions. US equities had their worst day since June 2020 on Wednesday, with the S&P 500 dropping over 4.0% and Nasdaq 100 more than 5.0%.
Additional Remarks:
Fed policy is not aimed at the stock market, but the effects of policy will be felt there.
In determining when "enough is enough" in policy tightening, the chief focus is on inflation numbers.
Households have been in pretty good shape, but people do seem to be feeling trade-offs now with higher prices.
The Fed will succeed in bringing down inflation, hard to know how much tightening will be needed to make that happen.
George said she is not sure picking a number around "neutral" is of value in setting rates and that it is better to look at the effects of policy.
She would "generally expect" real interest rates to be positive.
It is too soon to pinpoint how high interest rates may need to rise, if consumption changes, for example, the Fed may not need to go as far.
She is comfortable now doing half point rate increases.
The Fed would need to see something "very different" to support larger rate increases.
European Central Bank Vice President Luis de Guindos said on Thursday that price increases across the Eurozone will most likely remain high over the coming months, reported Reuters. Medium-term inflation expectations remain anchored and close to our 2.0% target, de Guindos added. The ECB needs to move gradually and cautiously as it normalises monetary policy, he noted.
ECB meeting accounts of the bank's last policy meeting said that members widely expressed concerns over high inflation numbers. Some members viewed it as important to act without undue delay in order to demonstrate the bank's determination to achieve price stability.
- Th Philly Fed manufacturing index came in well weaker than expected at 2.6 in May.
- The US dollar saw some monetary weakness with the DXY eyeing session lows in the 103.20s.
According to a report from the Federal Reserve Bank of Philadelphia released on Thursday, the headline Manufacturing Activity Index of the Manufacturing Business Outlook Survey slid to 2.6 in May from 17.6 in March. That was well below the expected decline to 16.0 and was the lowest reading since May 2020.
Subindices:
- Six-month Business Conditions fell to 2.5 from 8.2 in April, the lowest since December 2008.
- CAPEX fell to 9.6 from 19.9, its lowest since February 2016.
- Employment fell to 25.5 from 41.4, its lowest since May 2021.
- New Orders rose to 22.1 from 17.8.
- Prices Paid fell to 78.9 from 84.60.
Market Reaction
The buck saw some very minor weakness on the report, with the DXY eyeing a test of session lows around 103.20.
- Weekly Initial Claims came in a little higher than expected, but Continued Claims were lower than expected.
- The DXY has been weakening in recent trade following bad Philly Fed manufacturing data.
There were 218,000 Initial Jobless Claims in the week ending on 14 May, a tad above the expected rise to 200,000 from 197,000 one week ago, data released by the US Department of Labour on Thursday showed. That meant the four-week average number of claims rose to 199,500 from 191,250 a week earlier.
Continued Claims fell to 1.317M in the week ending on 7 May, a tad below the expected decline to 1.32M from 1.342M a week earlier. That meant the insured unemployment rate fell to 0.9% from 1.0% a week earlier.
Market Reaction
The DXY has been seeing some weakness in recent trade, though more due to the downbeat Philly Fed manufacturing report that the weekly jobless claims data if anything.
International Monetary Fund (IMF) Managing Director Kristalina Georgieva said that G7 finance leaders need to prepare for the prospect of multiple potential inflationary shocks, reported Reuters on Thursday.
- GBP/USD has recovered much of Wednesday’s slump and is back above 1.2400 as the buck fades.
- The 21DMA once again offered strong resistance around the 1.2500 mark, which could be a key resistance area.
- UK data and its implications for the economic outlook/BoE policy remains in focus with Retail Sales data out on Friday.
After dipping more than 1.0% on Wednesday amid broad risk-off macro flows and technical selling after a rejection of the 21-Day Moving Average, GBP/USD has posted a healthy recovery on Thursday. The pair is back to trading above the 1.2400 level and currently sits around 1.2425 with on-the-day gains of about 0.7%, with cable benefitting primarily as a result of USD weakness as US yields pull lower.
Where US yields across most of the curve are trading lower on the week, UK yields continue to trade substantially higher in wake of Tuesday’s super strong UK labour market report and after data on Wednesday revealed UK Consumer Price Inflation hitting four-decade highs at 9.0% YoY. This data combo appears to have revived some bets on BoE tightening which had for the most part been easing on UK growth fears in recent weeks.
The BoE tightening discussion will remain a key driver of sterling for the rest of the week with April Retail Sales data scheduled for release on Friday. Traders will recall the ugly March report was one of the fundamental catalysts for the rapid mid-April drop in GBP/USD, given it highlighted consumer suffering as the UK passes through its worst cost of living squeeze in decades.
Thus, traders will continue to mull the BoE’s policy dilemma over how much more tightening is needed. Another ugly Retail Sales report, coupled with continued weakness in risk appetite in the coming days (Wednesday was Wall Street’s worst day since June 2020), could see GBP/USD quickly give up its weekly gains which currently stand at just over 1.0%.
Traders should bear in mind that buying USD dips has been a profitable strategy in recent months given the Fed’s hawkish shift and broad risk asset weakness. The message from Fed policymakers this week was that the bank remains resolutely focused on inflation-fighting, meaning rapid policy tightening remains on autopilot for now, with a strong chance rates are lifted above the so-called neutral level. This stance is much more hawkish relative to the BoE, suggesting that in the near-term, 1.2500 might remain a ceiling, as has been the case thus far this week.
The S&P 500 fell sharply on Wednesday. Economists at Credit Suisse look for a retest of the 3855/15 support cluster.
Break under 3855/15 to open up 3505/00
“We look for a retest of our core objective of the 3855/15 support cluster – the 38.2% retracement of the 2020/2021 uptrend, 23.6% retracement of the entire uptrend from the GFC low, 61.8% retracement of the rally from October 2020 and price support.”
“Whilst a fresh hold at 3855/15 should be allowed for, downside momentum stays seen strong and the risk of a direct break below is seen highly elevated. If seen this would suggest the downtrend is resuming quicker than expected, with the next key support level at the cluster of price lows around 3723/3694 and eventually down to 3505/00.”
“Key resistance stays at the aforementioned 4062/91 13-day exponential moving average, downtrend and recent high. A break above here would reassert thoughts for a consolidation phase, with resistance then at 4123/28.”
The CHF is likely to enjoy a residual bid following the SNB's threat to act on inflation pressures, according to economists at TD Securities. The EUR/CHF pair has broken below the key support of 1.0325, opening up additional losses.
Downside remains favored as SNB ready to intervene
“Swiss franc leads today's session following hawkish comments from SNB's Jordan on Wednesday: ‘SNB ready to act if inflation pressures continue’.”
“For EUR/CHF, 1.0325 was key support, which was broken during this morning's European session; we think a downside extension is probable (and exposing 1.00/1.02) given the resumption of traditional risk-on/risk-off dynamics in the broader FX complex.”
- USD/CAD dropped back closer to a two-week low amid the emergence of fresh USD selling.
- Retreating US bond yields weighed on the buck, though Fed rate hike bets should limit losses.
- Weaker crude oil prices could undermine the loonie and help limit deeper losses for the pair.
The USD/CAD pair came under renewed selling pressure on Thursday and reversed a major part of the overnight bounce from a two-week low. The pair maintained its offered tone through the mid-European session and was last seen trading near the lower end of its daily range, just above the 1.2800 mark.
The Canadian dollar drew support from strong domestic consumer inflation figures released on Wednesday, which showed no signs of easing and rose 6.8% YoY in April, the fastest pace since 1991. The data suggested the Bank of Canada is unlikely to slow down the pace of rate hikes amid strong labour market, which tends to put upward pressure on prices.
On the other hand, retreating US Treasury bond yields attracted fresh selling around the US dollar, which was seen as another factor exerting downward pressure on the USD/CAD pair. The combination of factors helped offset modest weakness around crude oil prices, which did little to undermine the commodity-linked loonie or lend support to the pair.
That said, the prospects for a more aggressive policy tightening by the Fed should act as a tailwind for the US bond yields. Apart from this, the prevalent risk-off environment supports prospects for the emergence of some USD dip-buying and should help limit deeper losses for the USD/CAD pair. This, in turn, warrants some caution for aggressive bearish traders.
Market participants now look forward to the US economic docket, featuring the release of the Philly Fed Manufacturing Index, the usual Weekly Initial Jobless Claims and Existing Home Sales data. This, along with the US bond yields, will influence the USD. Traders will further take cues from oil price dynamics to grab short-term opportunities around the USD/CAD pair.
Technical levels to watch
- Gold is higher amid risk-off flows, a weaker buck and lower US yields.
- XAU/USD is eyeing a test of its 200-DMA around $1,837 once again.
Spot gold (XAU/USD) prices are trading around $1,830 per troy ounce and once again eyeing a test of the 200-Day Moving Average around $1,837, having gained around $15 (or around 0.8%) thus far on the session. Risk-off flows in the global equity space have continued on Thursday after Wall Street’s worst day in nearly two years on Wednesday as investors continue to fret about softening global growth expectations at a time when major central banks (namely the Fed and to a lesser extent the BoE and ECB) appear intent on aggressive monetary tightening.
That is a toxic combination for equities and investors have begun seeking out safety in traditional safe-haven assets such as US bonds, even though US bond valuations have been hit hard in recent months by the hawkish shift in the Fed’s stance. Either way, on Thursday US yields (nominal and real) are lower and this is dampening the appeal of the US dollar as a safe-haven currency, with the likes of the Swiss franc and yen performing better.
The combination of lower yields, which reduces the “opportunity cost” of holding non-yielding gold, and a weaker US dollar, which reduces the price of USD-denominated commodities like XAU/USD for foreign buyers, is having the dual effect of supporting gold on Thursday. But whether these trends will continue, and whether XAU/USD will be able to break above its 200-DMA and out of its recent bearish trend, remains to be seen.
In recent weeks, buying USD dips and selling gold rallies has been a highly profitable strategy. As long as markets continue to believe that the Fed will follow through with as much monetary tightening as it has been promising, gold’s chances of rebounding back to the, say, upper-$1,800s look limited. Looking to the immediate future, a few tier two US data releases on Thursday in the form of the May Philadelphia Manufacturing survey, the weekly initial jobless claims report and April Existing Home Sales probably won’t move markets much. But the data will likely keep focus on the overarching themes of slowing growth, inflation and central bank tightening.
The accounts of the European Central Bank's most recent policy meeting, released on Thursday, said that members widely expressed concerns over high inflation numbers, reported Reuters. Some members viewed it as important to act without undue delay in order to demonstrate the bank's determination to achieve price stability.
Many of the upside risks to the inflation outlook that the governing council had already discussed last summer had now materialised, the minutes added, noting that members broadly agreed with the assessment of the current economic situation. The incoming data suggested that the war would slow the recovery, but not derail it.
Additional Takeaways (as summarised by Reuters):
- The argument was made that flexibility should be a permanent feature of the governing council’s toolbox.
- There were a number of factors that would make inflation more persistent than projected at present.
- The reference to rate hikes beginning "some time" after the conclusion of QE does not prevent a timely rate rise if conditions warrant it.
- Members pointed out that it was hard to imagine sustained higher inflation without an increase in wage pressures.
- ECB Chief Economist Philip Lane's proposal was seen as consistent with the possibility of deciding to end net asset purchases already at the end of the second quarter or early in the third quarter.
- It was recalled that the expected path of the nominal key ECB interest rates would approach a neutral level only at a very late stage of the policy normalisation process.
- Even relatively small steps might be sufficient to turn the current accommodative monetary policy stance into a restrictive stance.
- DXY leaves behind Wednesday’s marked gains.
- Further downside could see the 102.30 region revisited.
DXY extends the choppiness seen so far this week and reverses the previous session’s advance.
Despite the ongoing bounce, further retracements remain well on the cards and could now target the next support at 102.35 (May 5 low), where decent contention is expected to emerge.
Looking at the broader picture, the current bullish stance in the index remains supported by the 3-month line around 100.20, while the longer-term outlook for the dollar is seen constructive while above the 200-day SMA at 96.49.
DXY daily chart
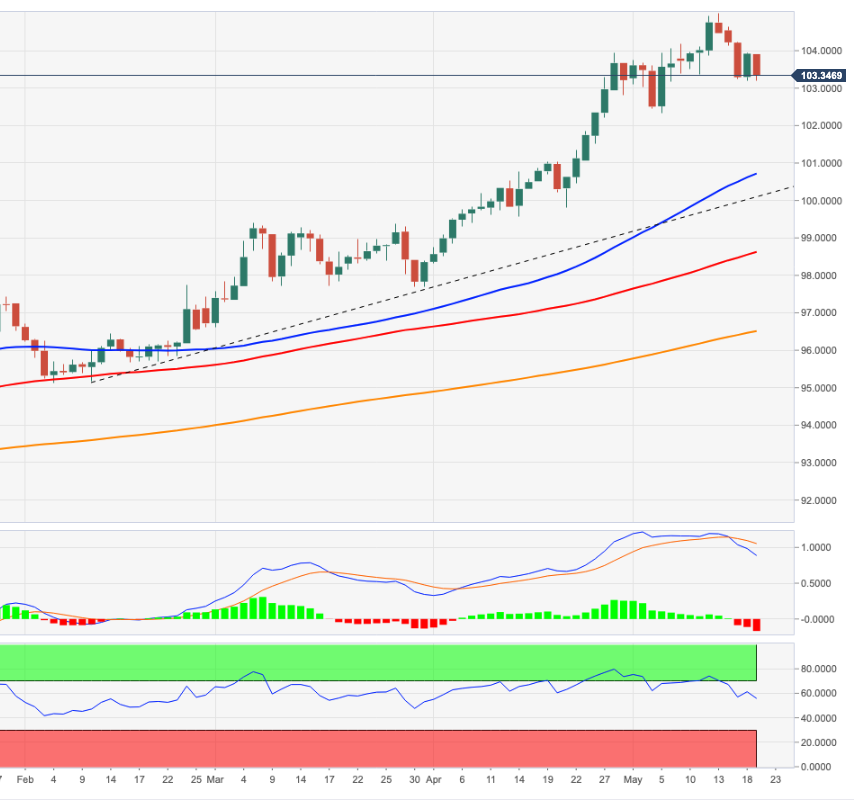
- EUR/JPY regains some ground lost following Wednesday’s drop.
- Further downside should meet contention near 132.60.
EUR/JPY advances modestly after Wednesday’s strong drop to the 134.00 neighbourhood.
Price action around the cross remains inconclusive and further decline should not be ruled out so far. That said, the May low at 132.65 (May 12) is expected to hold occasional bearish attempts in the short-term horizon prior to the temporary 100-day SMA, today at 132.50.
In the meantime, while above the 200-day SMA at 131.13, the outlook for the cross is expected to remain constructive.
EUR/JPY daily chart
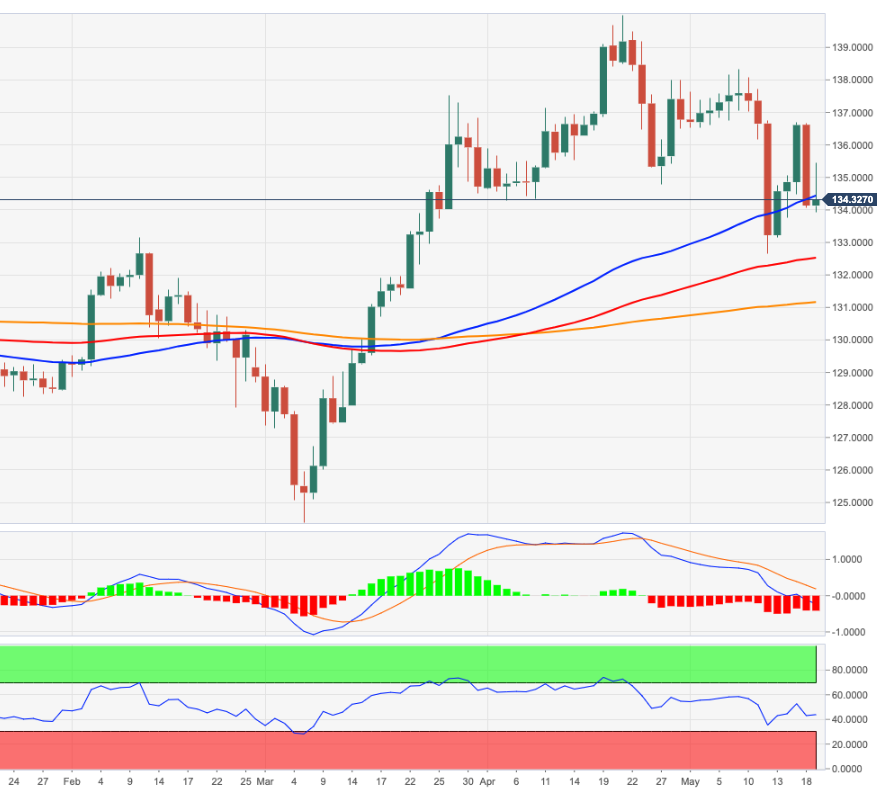
Alvin Liew, Senior Economist at UOB Group, comments on the latest GDP figures in the Japanese economy.
Key Takeaways
“Despite coming in above expectations, Japan’s 1Q GDP still contracted 1.0% q/q seasonally adjusted annualized rate, due to stalled private consumption spending, a significant drag from external demand and a persistent decline in public investment.”
“Business spending continued to grow but was below expectations, while the other positive contributor was government consumption. After accounting for the 0.2ppt increase from private inventories, overall private demand rose by 0.3% q/q. In comparison, public demand extended its fall in 1Q by -0.2% q/q.”
“We expect the Japanese economy to rebound in 2Q although the extent could be curbed by stronger inflation impacting domestic demand. Japan is also slow to re-open borders to tourism which will be another factor weighing on domestic demand recovery. Meanwhile, manufacturing sector’s recovery continues to be hampered by supply chain disruptions/logistics delays and higher commodity prices due to the on-going Russia-Ukraine conflict and China’s slowdown induced by their COVID-19 lockdowns. The weaker yen is a two-edged sword for Japan as it makes Japan’s exports more attractively priced, but it will worsen the import bill along with the surging commodity prices.”
“We expect Japan to resume its growth trajectory but at a reduced pace of 2.2% q/q SAAR in 2Q (from previous forecast of 3.9%. We now project Japan’s full-year 2022 GDP growth at 1.4% (down from previous forecast of 1.7%), a slowdown from 1.7% in 2021.”
- AUD/USD regained positive traction on Thursday and reversed a major part of the overnight fall.
- Retreating US bond yields prompted fresh selling around the USD and extended support to the pair.
- The risk-off mood kept a lid on any further gains for the perceived riskier aussie, at least for now.
The AUD/USD pair retreated a few pips from the daily high and was seen trading around the 0.7000 psychological mark during the first half of the European session, up nearly 0.60% for the day.
A combination of supporting factors assisted the AUD/USD pair to attract fresh buying near the 0.6950 area on Thursday and reverse a major part of the overnight retracement slide from a one-week high. The Australian dollar drew some support from domestic employment data, which showed that the jobless rate fell to the lowest level in almost 50 years. On the other hand, modest pullback in the US Treasury bond yields kept the US dollar bulls on the defensive and extended additional support to the major.
The AUD/USD pair, however, struggled to capitalize on the move and witnessed some selling near the 0.7025 region amid the prevalent risk-off environment. Investors seem worried that a more aggressive move by major central banks to constrain inflation could hit global economic growth. Adding to this, extended COVID-19 lockdowns in China and the Russia-Ukraine war have been fueling recession fears, which, in turn, took its toll on the global risk sentiment and capped the perceived riskier aussie.
Meanwhile, expectations that the Fed would need to take more drastic action to bring inflation under control act as a tailwind for the US bond yields and the buck. The bets were reaffirmed by Fed Chair Jerome Powell's hawkish comments on Tuesday, saying that he will back interest rate increases until prices start falling back toward a healthy level. Hence, it will be prudent to wait for strong follow-through selling before positioning for an extension of the AUD/USD pair's recovery from the YTD low.
Market participants now look forward to the US economic docket, featuring the release of the Philly Fed Manufacturing Index, the usual Weekly Initial Jobless Claims and Existing Home Sales data. Apart from this, the US bond yields, will influence the USD price dynamics and provide some impetus to the AUD/USD pair. Traders will further take cues from the broader market risk sentiment to grab short-term opportunities.
Technical levels to watch
The resumption of the selling pressure could force USD/CNH to recede to the 6.7000 region and probable 6.6700 in the next weeks, commented FX Strategists at UOB Group Lee Sue Ann and Quek Ser Leang.
Key Quotes
24-hour view: “We did not expect the strong rise in USD to a high of 6.7856 yesterday (we were expecting sideway-trading). The rapid rise appears to be running ahead of itself and USD is unlikely to advance much further. For today, USD is likely to consolidate and trade between 6.7550 and 6.7950.”
Next 1-3 weeks: “Yesterday (18 May, spot at 6.7470), we highlighted that the month-long USD strength has run its course. We were of the view that USD is in the early stages of a pullback and we indicated that support is at 6.7000 followed by 6.6700. We did not quite expect the subsequent sharp bounce to 6.7856. While the bounce has dented the downward momentum, there is no change in our view for now. Only a breach of 6.7950 (no change in ‘strong resistance’ level) that USD is likely to consolidate and trade sideways instead of staging a pullback.”
- EUR/USD fades the initial pessimism and retakes 1.0500 and above.
- ECB Accounts come next in the domestic calendar.
- Initial Claims, Philly Fed index take centre stage across the pond.
The European currency regains the smile and lifts EUR/USD back above the 1.0500 mark on Thursday.
EUR/USD propped up by USD-selling
EUR/USD fades Wednesday’s pullback and keep the upbeat note well in place despite the sentiment around the risk complex remains sour on Thursday.
Indeed, the dollar suffers some selling bias despite the broad-based mood remains tilted to the risk-off side and against the backdrop of further weakness in US yields along the curve.
On the latter, the German 10y Bund yields also add to Wednesday’s pullback and return to the 0.95% region.
In the calendar, the EMU Current Account surplus widened to €8.66B in March (from €6.5B). Later in the session, the ECB will publish its Accounts of the last meeting.
In the US data space, the usual weekly Claims are due seconded by the Philly Fed Index and the CB Leading Index and Existing Home Sales.
What to look for around EUR
EUR/USD’s strong rebound met initial hurdle at the 1.0560 region so far this week. Despite the pair removed some downside pressure, the broader outlook for the single currency remains entrenched in the negative territory for the time being. As usual, price action in spot should reflect dollar dynamics, geopolitical concerns and the Fed-ECB divergence. Occasional pockets of strength in the single currency, in the meantime, should appear reinforced by firmer speculation the ECB could raise rates at some point in the summer, while higher German yields, elevated inflation and a decent pace of the economic recovery in the region are also supportive of an improvement in the mood around the euro.
Key events in the euro area this week: ECB Monetary Policy Meeting Accounts (Thursday) – Germany Producer Prices, EMU Flash Consumer Confidence (Friday).
Eminent issues on the back boiler: Speculation of the start of the hiking cycle by the ECB as soon as this summer. Asymmetric economic recovery post-pandemic in the euro area. Impact of the war in Ukraine on the region’s growth prospects.
EUR/USD levels to watch
So far, spot is gaining 0.30% at 1.0492 and faces the initial hurdle at 1.0563 (weekly high May 18) seconded by 1.0641 (weekly high May 5) and finally 1.0936 (weekly high April 21). On the other hand, a breach of 1.0348 (2022 low May 13) would target 1.0340 (2017 low January 3 2017) en route to 1.0300 (round level).
- A combination of factors dragged USD/JPY lower for the second successive day on Thursday.
- Recession fears continued weighing on investors’ sentiment and boosted the safe-haven JPY.
- Retreating US bond yields prompted some USD selling and further contributed to the decline.
- The Fed-BoJ policy divergence warrants some caution before placing aggressive bearish bets.
The USD/JPY pair weakened further below the 128.00 mark during the first half of the European session and dropped to a one-week low in the last hour.
The pair struggled to capitalize on its early positive move, instead met with a fresh supply in the vicinity of the 129.00 round figure and turned lower for the second successive day on Thursday. The prevalent risk-off environment boosted demand for the safe-haven Japanese yen, which, along with the emergence of fresh US dollar selling exerted downward pressure on the USD/JPY pair.
The markets now seem worried that a more aggressive move by major central banks to constrain inflation could hit global economic growth. Adding to this, extended COVID-19 lockdowns in China and the Russia-Ukraine war have been fueling recession fears. This, in turn, took its toll on the risk sentiment and forced investors to take refuge in traditional safe-haven assets, including the JPY.
The anti-risk flow triggered modest pullback in the US Treasury bond yields, which prompted some US dollar selling and further contributed to the offered tone surrounding the USD/JPY pair. With the latest leg down, spot prices have now dropped back closer to the monthly low, around mid-127.00s touched last week, though the Fed-BoJ monetary policy divergence should act as a tailwind.
The Fed is widely expected to stick to its monetary policy tightening path and hike interest rates by at least 50 bps at the next two policy meetings. The bets were reaffirmed by Fed Chair Jerome Powell's comments on Tuesday, saying that he will back interest rate increases until prices start falling back toward a healthy level. This should limit the downside for the US bond yields and the buck.
In contrast, the Bank of Japan has vowed to keep its existing ultra-loose policy settings and promised to conduct unlimited bond purchase operations to defend its “near-zero” target for 10-year yields. Hence, it will be prudent to wait for some follow-through selling below the 127.50 region before confirming a fresh bearish breakdown and positioning for any further depreciating move.
Market participants now look forward to the US economic docket, featuring the release of the Philly Fed Manufacturing Index, the usual Weekly Initial Jobless Claims and Existing Home Sales data. Apart from this, the US bond yields will influence the USD and provide some impetus to the USD/JPY pair. Traders will take cues from the broader market risk sentiment to grab short-term opportunities.
Technical levels to watch
- Silver prolonged this week’s retracement slide and edged lower for the second straight day.
- The set-up favours bearish traders and supports prospects for a further depreciating move.
- Sustained move beyond the $22.00 mark is needed to negate the near-term negative bias.
Silver witnessed some selling for the second straight day on Thursday and extended this week's pullback from the 50% Fibonacci retracement level of the $23.24-$20.46 downfall. The white metal remained depressed through the first half of the European session and was last seen trading around the $21.30-$21.35 region, down nearly 0.50% for the day.
Looking at the broader picture, the overnight slide confirmed a breakdown through the lower end of an ascending trend channel, which constituted the formation of a bearish flag pattern. Subsequent weakness below the 50-period SMA on the 4-hour chart adds credence to the negative set-up and supports prospects for further losses.
Moreover, technical indicators on the daily chart are still holding deep in the negative territory and have again started gaining bearish traction on the 4-hour chart. Hence, some follow-through decline towards testing the 23.6% Fibo. level, around the $21.15 region, en-route the $21.00 mark, remains a distinct possibility.
The downward trajectory could further get extended and allow bearish traders to aim back to challenge the YTD low, around the $20.45 region touched last week.
On the flip side, the 38.2% Fibo. level, near the $21.55 area, should now act as immediate resistance. Any subsequent move up is more likely to confront resistance near the overnight swing low, around the $21.75 region. This is followed by the 50% Fibo. barrier, just ahead of the $22.00 mark, which if cleared might trigger a short-covering rally.
Silver 4-hour chart
-637885462493183171.png)
Key levels to watch
- GBP/USD regained positive traction on Thursday and recovered a part of the overnight slump.
- Retreating US bond yields kept the USD bulls on the defensive, which extended some support.
- Aggressive Fed rate hike bets, the risk-off mood should limit any meaningful slide for the buck.
- Diminishing odds for any further BoE rate hikes might also contribute to cap gains for the pair.
The GBP/USD pair maintained its bid tone through the early part of the European session and was last seen trading near the daily high, around the 1.2375-1.2380 region.
The pair attracted some buying on Thursday and recovered a part of the overnight slump, though any meaningful recovery still seems elusive. A softer tone surrounding the US Treasury bond yields kept the US dollar bulls on the defensive and extended some support to the GBP/USD pair. That said, the risk-off mood, along with the prospects for a more aggressive policy tightening by the Fed, should limit losses for the greenback and cap any further gains for the major.
On the other hand, the British pound was weighed down by looming recession risk and diminishing odds for any further interest rate hikes by the Bank of England. The latest UK consumer inflation figures released on Wednesday, along with a surprise contraction of the economy in March, fueled stagflation fears. Moreover, rising wages threaten to further exacerbate inflationary pressures and hurt consumer spending, forcing investors to scale back BoE rate hike bets.
Market players also seem worried that Britain's push to effectively override parts of the Brexit trade deal for Northern Ireland would inflame tensions with Europe and trigger a trade war in the middle of the cost-of-living crisis. This could further take its toll on the UK economy and validate the BoE's gloomy outlook, which, in turn, should keep a lid on any meaningful upside for the GBP/USD pair. Hence, any subsequent move up would still be seen as a selling opportunity.
Traders now look forward to the US economic docket, featuring the release of the Philly Fed Manufacturing Index, the usual Weekly Initial Jobless Claims and Existing Home Sales data later during the early North American session. Apart from this, the US bond yields and the broader market risk sentiment will influence the USD price dynamics. This, along with the incoming Brexit-related headlines, should provide a fresh impetus to the GBP/USD pair.
Technical levels to watch
- DXY’s upside runs out of steam near 104.00.
- Appetite for riskier assets appears firmer on Tuesday.
- Initial Claims, Philly Fed Index, housing data next on tap.
The greenback, when tracked by the US Dollar Index (DXY), returns to the negative ground after faltering just ahead of 104.00 the figure on Thursday.
US Dollar Index looks to data, Fed
The dollar’s rebound from weekly lows in the 103.20 region (May 18) appears to have lost some impulse in the area just ahead of the 104.00 neighbourhood on Thursday amidst the apparent resumption of the risk-on sentiment.
The corrective decline in the greenback comes pari passu with the equally negative performance in US yields along the curve so far, adding to the recent weakness.
In the meantime, the index paid no attention to comments by Philly Fed P.Harker (2023 voter, hawk) late on Wednesday, who also advocated for a 50 bps rate hike at both the June and July FOMC events. In addition, he hinted at the likeliness of negative growth and the probability of a “soft landing”.
In the domestic calendar, usual weekly Claims are due seconded by the always-relevant Philly Fed Manufacturing gauge, the CB Leading Index and Existing Home Sales.
What to look for around USD
The dollar’s rebound comes short of the 104.00 mark so far on Thursday. In the meantime, and supporting the buck, appears investors’ expectations of a tighter rate path by the Federal Reserve and its correlation to yields, the current elevated inflation narrative and the solid health of the labour market. On the negatives for the greenback turn up the incipient speculation of a “hard landing” of the US economy as a result of the Fed’s more aggressive normalization.
Key events in the US this week: Initial Claims, Philly Fed Manufacturing Index, Existing Home Sales, CB Leading Index (Thursday).
Eminent issues on the back boiler: Speculation of a “hard landing” of the US economy. Escalating geopolitical effervescence vs. Russia and China. Fed’s more aggressive rate path this year and 2023. US-China trade conflict. Future of Biden’s Build Back Better plan.
US Dollar Index relevant levels
Now, the index is down 0.20% at 103.69 and faces the next support at 103.19 (weekly low May 18) followed by 102.35 (low May 5) and then 99.81 (weekly low April 21). On the other hand, the break above 105.00 (2022 high May 13) would open the door to 105.63 (high December 11 2002) and finally 106.00 (round level).
AUD/CAD firmed to 11-month highs of 0.9535 in early April but has since hit the skids, trading below 0.90 into mid-May. In the view fo analysts at Westpac, the pair looks set for a more concerted push lower to the 0.87/0.88 zone.
RBA set to lag the BoC
“The BoC is set to join the 50-club, with ongoing strong jobs and wages data and stubborn 30-year highs for inflation cementing +50bp at their 1st June meeting. The RBA is not standing still either, but whereas that will take the RBA’s cash rate to 0.75%, the BoC’s will be comfortably higher after their June meeting, at 1.5%.”
“With Canada enjoying better fundamentals and the RBA set to lag the BoC, the cross looks set for a more concerted push lower, to the 0.87/0.88 zone in coming weeks.”
AUD/USD has quickly climbed back towards the 0.70 level as the Australian unemployment rate falls to record low. However, economists at MUFG Bank expect the aussie to remain under pressure amid global growth concerns.
RBA to continue tightening policy at their next meeting by 25bps
“Australia revealed that the unemployment rate fell to its lowest level since the 1970’s at 3.85% in April. It will add to the RBA’s concerns that tight labour market conditions will fuel a pick-up in wage growth and pose upside risks to the inflation outlook.”
“We expect the RBA to respond by continuing by tightening policy at their next meeting on 7th June by 25bps. The Australian rate market is already fully discounting a 25bps hike, and there is little speculation over a larger 50bps hike.”
“We don’t believe the favourable domestic developments are sufficient to outweigh building global growth concerns, and as such view risks as tilted to the downside for the aussie in the near-term.”
In the view of economists at Westpac, it is unclear whether the NZD’s decline since April has bottomed. A break below 0.6217 would open up the 0.61 level.
Yield spreads should favour NZD next week
“NZD/USD made a tentative bottom at 0.6217 on 12 May – whether it holds during the week ahead is unclear. A break below that level would then target 0.61.”
“The NZD has closely followed risk sentiment via the equity markets during the past few weeks, so much will depend on outcomes there.”
“Yield spreads should be in the NZD’s favour next week, if the RBNZ hikes by 50bp and increases its OCR track by as much as we expect.”
EUR/USD has traded below 1.05. However, European Central Bank's (ECB) more hawkish guidance and a less stringent stance on Russia energy sanctions may ease downside pressures on the euro to allow for consolidation into June, economists at Westpac report.
Flush through 1.0350 could trigger talk of testing parity
“Markets are now pricing in four ECB hikes into year-end and the more hawkish of ECB officials have opened the potential of an initial 50bps hike to move away from NIRP.”
“EC (and G7) appear to be less dogmatic on further punitive sanctions on Russia’s energy sector and could shift their focus towards tariffs. These actions may reduce the risk of a sudden cut-off of gas (IMF estimate it would knock -3% off regional activity) and so avoid regional recession.”
“Although EUR remains under severe pressure and a flush through 1.0350 could trigger talk of testing parity, prospects for some consolidation are also now more evident.”
Escalating inflation in the UK and persistent labour market tightness, at least in the near term, are shifting yield spread trends. This may suggest a pause in GBP/USD’s slide, economists at Westpac report.
UK’s inflation surge and tight labour market are shifting yield spreads
“UK household energy pricing caps drove a surge in April CPI and increase concerns of an acute cost of living crunch that may be evident in the coming week’s consumer and retail data and surveys. Although weaker consumer activity might reduce BoE’s hiking path, the tightness of the UK’s labour market was also in evidence this week.”
“Failure to curb inflation could trigger higher wage settlements and so exacerbate matters by adding second-round inflation pressures at a time when GBP depreciation may also be adding to external inflation drivers. Markets therefore sharply repriced UK rates despite BoE caution, notably lifting short-end rates.”
“Stuttering confidence in US growth has now seen US yields pull back from recent highs. The combination has at least paused if not turned recent trends in UK-US yield spreads. Even if this proves to be short-lived, such shifts may establish a period of GBP/USD range trading (1.22-1.26).”
The US Dollar Index (DXY) is consolidating Wednesday's gains near 103.80. Economists at ING expect DXY to edge higher towards the 104.10 mark.
Investors appreciate that tackling inflation is the number one priority of central banks
“The fact that expectations for Fed policy tightening remain intact is a sign that investors appreciate that tackling inflation is now the priority for central banks. This continues to favour the anti-cyclical dollar, but also now the Japanese yen.”
“DXY has seen a modest bull market correction this week, but can probably edge higher to 104.10 today.”
Economists at ING expect the rand to stay under pressure for the time being. Subsequently, USD/ZAR could reach the 17 level on a break past the stubborn resistance at 16.35.
Rising US real yields and the China slowdown weigh on emerging markets
“16.35 is big resistance for USD/ZAR, above which 17.00 beckons for later in the year.”
“Rising US real yields and the China slowdown continue to make the bear case for emerging markets.”
- Gold extended its sideways consolidative price move for the third straight day on Thursday.
- Aggressive Fed rate hike bets, elevated US bond yields acted as a headwind for the metal.
- Recession fears continued weighing on investors’ sentiment and helped limit the downside.
Gold continued with its struggle to gain any meaningful traction and extended its consolidative price move for the third successive day on Thursday. The XAUUSD remained confined in a narrow trading band through the early European session and was last seen trading just below the $1,815 level.
Fed Chair Jerome Powell's hawkish comments on Tuesday reaffirmed market expectations for a more aggressive policy tightening by the US central bank. Speaking at a Wall Street Journal event, Powell said that he will back interest rate increases until prices start falling back toward a healthy level. The Fed's determination to fight inflation remained supportive of elevated US Treasury bond yields and turned out to be a key factor that acted as a headwind for the non-yielding gold.
The downside, however, remains cushioned amid concerns about softening global economic growth, which continued weighing on investors' sentiment and should benefit the safe-haven XAUUSD. The prospects for a more aggressive policy tightening by the Fed, along with the Russia-Ukraine war and extended COVID-19 lockdowns in China, have been fueling recession fears. Apart from this, modest US dollar downtick offered additional support to the dollar-denominated gold, at least for the time being.
The mixed fundamental backdrop held back traders from placing aggressive bets around gold, which, in turn, has led to subdued price moves over the past three trading sessions. Looking at the technical picture, the recent bounce from the lowest level since late January touched earlier this week faltered near the very important 200-day SMA on Tuesday. Furthermore, the commodity's inability to attract any meaningful buyers suggests that the path of least resistance is to the downside.
Market participants now look forward to the US economic docket, featuring the release of the Philly Fed Manufacturing Index, the usual Weekly Initial Jobless Claims and Existing Home Sales data. Apart from this, the US bond yields, will influence the USD price dynamics and provide some
impetus to gold. Apart from this, traders will take cues from the broader market risk sentiment to grab short-term opportunities.
Technical levels to watch
Providing the euro a little support this week has been even more hawkish commentary from the European Central Bank. Economists at ING expect the EUR/USD pair to drift back through 1.0450/60 to 1.0400.
April ECB minutes might emphasise the more hawkish elements
“For today, look out for the minutes of the April ECB meeting, where again it might choose to emphasise the more hawkish elements.”
“EUR/USD has had its oversold bounce to 1.0550 and with the global environment remaining challenged, EUR/USD could today drift back through 1.0450/60 to 1.0400.”
Here is what you need to know on Thursday, May 19:
With Wall Street's main indexes suffering heavy losses on Wednesday, the greenback continued to gather strength against its major rivals in the second half of the day on Wednesday. Markets remain risk-averse early Thursday as investors wait for the European Central Bank (ECB) to publish the minutes of its April policy meeting. Later in the session, the weekly Jobless Claims and the Federal Reserve Bank of Philadelphia's Manufacturing Survey will be featured in the US economic docket. Minneapolis Fed President Neel Kashkasi is scheduled to deliver a speech on inflation as well.
The S&P 500 Index lost more than 4% on Wednesday and the tech-heavy Nasdaq Composite Index fell 5%. In the European morning, US stock index futures are down between 0.1% and 0.3%. The benchmark 10-year US Treasury bond yield, which lost 3.5% on Wednesday, stays relatively quiet near 2.9% and the US Dollar Index is consolidating Wednesday's gains near 103.80.
Global recession fears, the ongoing Russia-Ukraine crisis and major central banks' willingness to tighten their monetary policies remain primary factors forcing investors to stay away from risk-sensitive assets.
EUR/USD erased the majority of Tuesday's recovery gains and closed below 1.0500 on Wednesday. ECB policymaker Madis Muller said on Wednesday that he would support a 25 basis points rate hike in July and added that he wouldn't be surprised if rates are raised past zero in 2022. On a more cautious tone, ECB Governing Council member Pablo Hernandez de Cos argued that the process of raising rates should be gradual given the uncertainty surrounding the outlook.
GBP/USD lost more than 150 pips on Wednesday and staged a modest rebound during the Asian session. Nevertheless, the pair returned to mid-1.2300s heading into the European session.
USD/JPY came under strong bearish pressure on Wednesday and extended its slide below 128.00 early Thursday. The data from Japan showed that Machinery Orders increased at a stronger pace than expected in March. On the other hand, Imports and Exports both rose less than expected on a yearly basis in April.
Gold dropped below $1,810 in the early American session on Wednesday but managed to regain its traction amid retreating US yields. After having closed flat, the pair stays relatively quiet near $1,815.
Bitcoin fell more than 5% on Wednesday and broke below the key $30,000 level as its performance remains strongly correlated with the US tech stocks. Ethereum lost 8% and registered its lowest daily close since July near $1,900. ETH/USD was last seen posting small recovery gains near $1,960.
GBP/USD marches towards 1.24. However, economists at ING expect the pair to break under 1.2330 in a move back to the 1.22 lows.
EUR/GBP to continue to trade in a very wide 0.84-0.86 range
“Expect EUR/GBP to continue to trade in a very wide 0.8400-0.8600 range.”
“Cable looks one-way traffic. We have seen the bear market bounce to 1.2500 this week and the difficult external environment would favour a break of 1.2330 support in a move back to the 1.22 lows.”
European Central Bank (ECB) policymakers are prepared to back at least two 25 basis points rate hikes this year, MNI reports, citing Eurosystem sources.
The report supports comments from the ECB policymaker Klaas Knot, who floated a 50-bps rate hike this year.
“There are officials downplaying ECB policymaker Klaas Knot's idea of a 50-bps rate hike, such a possibility is also gaining traction among members of the governing council, MIN reports.
Market reaction
EUR/USD is erasing all of its early gains to now trade neutral at 1.0468, as of writing.
- Copper prices reverse the previous day’s losses amid cautious optimism in the market.
- US dollar softens amid repeated Fedspeak suggesting 50 bps rate hike, softer data.
- China’s covid numbers ease, Shanghai announced a gradual opening of the economy.
- Inflation, growth fears put a cap on the metal prices.
Copper futures improve to $4.20 on COMEX as mildly upbeat market sentiment weighs on the US dollar. Also favoring the red metal are the recent positive headlines from China, mainly concerning the coronavirus.
Prices of the metal on the London Metal Exchange (LME) also improve but those on and Shanghai Futures Exchange (SFE) remain sluggish. That said, benchmark three-month copper on the LME gains 0.4% to $9,276 a tonne, after dropping 1.4% in the previous session, whereas the most-active June copper contract on SFE drop 0.30% to 71,550 yuan ($10,586.04) a tone, per Reuters.
That said, commodity prices refreshed weekly low the previous day but prints 1.20% daily gains amid the initial hour of Thursday’s European session.
The metal gains support from the hopes of back-to-normal activities in China, after multiple days of covid-led lockdown, mainly due to the recent easing in virus numbers. China reported a drop in the daily covid cases and death tolls to 1,082 and one respectively, versus 1,305 and three in that order on Thursday. On the same line are Shanghai’s plans to unlock the economy in a phased manner after covid-led restrictions.
Elsewhere, the US Dollar Index (DXY) drops 0.17% intraday to 113.65 as greenback bulls await fresh clues after being tired of hearing 50 bps rate hike calls from various Fed policymakers, including Chairman Jerome Powell, of late. Philadelphia Federal Reserve Bank President Patrick Harker was the latest one in the line.
Amid these plays, stock futures and commodities print mild gains while the greenback bears the burden of an upbeat mood.
It’s worth noting, however, that broad fears of inflation and growth remain on the table, which in turn weigh on the red metal prices of late.
To sum up, the commodity’s latest gains appear ephemeral but the USD pullback can please intraday buyers.
Technical analysis
Copper futures on COMEX remain on a bearish trajectory until staying below the $4.50 level. However, the downside below $3.90 will make it vulnerable to testing early 2021 lows near $3.50.
FX option expiries for May 19 NY cut at 10:00 Eastern Time, via DTCC, can be found below.
- EUR/USD: EUR amounts
- 1.0325 526m
- 1.0400 537m
- 1.0415 403m
- 1.0445 1.4b
- 1.0550 580m
- GBP/USD: GBP amounts
- 1.2050 497m
- 1.2300 667m
- USD/JPY: USD amounts
- 127.60 446m
- 128.50 1.1b
- 130.00 555m
- 131.00 1b
- AUD/USD: AUD amounts
- 0.7090 370m
- 0.7150 482m
- 0.7220 232m
- USD/CAD: USD amounts
- 1.2750 683m
- NZD/USD: NZD amounts
- 0.6250 507m
- 0.6625 873m
- EUR/GBP: EUR amounts
- 0.8310 200m
- 0.8500 282m
Germany Finance Minister Christian Lindner said Thursday that the “war in Ukraine has risks for global recovery,” adding that the “G7 will look at how to avoid stagflation. “
Additional comments
“War in Ukraine will play a central role at G7 meeting; want to secure Ukrainian state's ability to act.”
“Putin will not achieve his war aims in Ukraine.”
“Ukraine needs double-digit billion euros in funding for coming months; confident G7 can agree aid.”
Market reaction
With Euro Stoxx futures down 0.70% ahead of the European open, EUR/USD is losing the early ground, now trading at 1.0480, adding 0.14% on the day.
Gold Price turns south again after a mixed trading action on Wednesday. A test of multi-month lows sub-$1,800 remains on the cards, FXStreet’s Dhwani Mehta reports.
Symmetrical triangle breakdown looks likely on XAUUSD’s 4H chart
“The dynamics of the dollar and the yields will remain the key catalyst behind gold’s valuations, as the US docket has no top-tier data to offer. The sentiment on global stocks will be also closely eyed for fresh trading opportunities in the precious metal.”
“A four-hourly candlestick closing below the rising trendline support at $1,813 is needed to validate a breakdown, opening floors for a retest of the $1,800 mark. The next critical support awaits at the multi-month lows of $1,787.”
“Recapturing the horizontal 21-Simple Moving Average (SMA) at $1,816. is critical to alleviating the bearish pressure, which could see gold bulls re-attempting the falling trendline resistance at $1,819. Acceptance above the latter will kickstart a fresh upswing towards the descending 50-SMA at $1,831. Ahead of that, Wednesday’s high of $1,825 will challenge the bearish commitments.”
Gold Price briefly fell below $1,800. Economists at ANZ Bank expect XAU/USD to stabilise near $1,820.
Upside potential for $1,950
“Aggressive monetary tightening, rising yields and a stronger dollar are key drags for the gold price.”
“Concerns about global economic growth, fuelled by sustained inflation and heightened geopolitical risks, should protect the yellow metal somewhat.”
“We expect the price to find a floor at the current level $1,820, with upside potential of $1,950.”
- Platinum extends the previous day’s losses towards refreshing fortnight low.
- Failures to rise past 50-DMA, two-month-old resistance line keep sellers hopeful amid bearish MACD signals.
- Convergence of 200-DMA, 61.8% Fibonacci retracement appears a tough nut to crack for buyers.
Platinum (XPT/USD) remains on the back foot for the second consecutive day as bears keep reins near a two-week low surrounding $930 heading into Thursday’s European session.
In doing so, the XPT/USD justifies the previous day’s U-turn from the 50-DMA, around $970 at the latest, as well as bearish MACD signals.
Also supporting the bearish bias is the commodity’s failure to rise past the two-month-old descending trend line, close to $996.
Above all, the quote’s sustained trading below the 200-DMA and 61.8% Fibonacci retracement of December 2021 to March 2022 upside, near $1004-06.00, keeps the favoring the sellers.
On the downside, April’s low around $908.00 appears immediate support to watch during the further XPT/USD declines.
However, a broad area comprising multiple levels marked since September 2021, around $907-896, will be crucial to watch during metal’s further downside.
Overall, platinum prices remain vulnerable to decline further but the downside remains limited.
Platinum: Daily chart
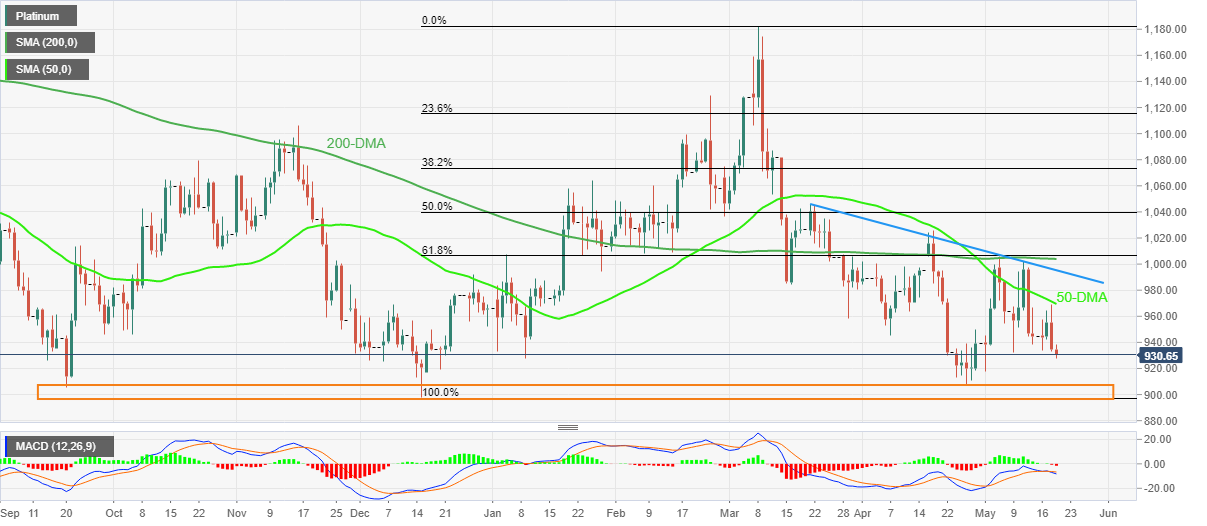
Trend: Further downside expected
Base metals have come under pressure in recent months. However, China’s credit impulse is set to support base metals demand, economists at ANZ Bank report.
Pedal to the metal
“Fiscal stimulus measures and ongoing supply-side issues should see metals markets tighten in the second half of 2022.”
“China is loosening fiscal and monetary policies. More importantly, the NDRC released the country’s latest energy system plan, which re-emphasised China’s determination to boost the development of renewable energy, which are key growth engines for metals demand.”
“Labour shortages and high energy costs will continue to weigh on growth in copper, aluminium and nickel supply. This is aside from the disruption that the Russia-Ukraine war will eventually have on Russian metals supplies. For the moment, sentiment is likely to remain weak.”
“The prospect of a rebound in demand in China, amid falling inventories, is unlikely to keep downward pressure on metals prices for long.”
USD/JPY seems to have opened the door to a probable move to the 127.50 region in the next weeks, suggested FX Strategists at UOB Group Lee Sue Ann and Quek Ser Leang.
Key Quotes
24-hour view: “Our view for USD to ‘trade sideways between 128.80 and 129.80’ yesterday was incorrect as USD plummeted to 128.00. The swift build-up in momentum is likely to lead to further USD weakness even though oversold conditions suggest that a break of the major support at 127.50 is unlikely. On the upside, a breach of 128.85 (minor resistance is at 128.55) would indicate that the current downward pressure has eased.”
Next 1-3 weeks: “Last Thursday (12 May, spot at 128.80), we highlighted that USD is likely to trade above 127.50 for a couple of days first before staging a deeper pullback. USD subsequently rebounded and in our latest narrative from Tuesday (17 May, spot at 129.15), we highlighted that the chance for USD to move below 127.50 has diminished. USD dropped sharply to 128.00 during NY session yesterday and the boost in downward momentum suggests USD could break 127.50. The next support is at 127.00. The downside risk is intact as long as USD does not move above 129.30 (‘strong resistance’ level previously at 129.90).”
- The greenback bulls are advancing to reclaim a two-decade high at 131.00.
- An Ascending Triangle formation is hinting for an inventory distribution phase.
- The RSI (14) has found a cushion of around 131.00.
The USD/JPY pair is facing barricades around 129.00 after a firmer rebound from 128.00 in the Asian session. On Wednesday, the asset witnessed a sheer downside move after failing to sustain above 129.00, which is weighing pressure on the greenback bulls.
A firmer rebound from the lower boundary of the Ascending Triangle chart formation is hoping for a bullish reversal towards the horizontal resistance at 131.35, which is also the two-decade highest auction price. The ascending trendline is plotted from April 26 low at 126.95, adjoining May 12 low at 127.52.
A sideways move is expected from the 20- and 50-period Exponential Moving Averages (EMAs), which are placed at 128.97 and 129.24 respectively.
Meanwhile, the Relative Strength Index (RSI) (14) has sensed support from 40.00 that signals the presence of a responsive buying action. A decisive move by the momentum oscillator above 60.00 will strengthen the greenback bulls.
For an upside, the greenback bulls need to overstep 20-EMA at 128.97 confidently, which will send the major towards the psychological resistance of 130.00. A breach of the latter will expose the asset to recapture its two-decade high at 131.35.
Alternatively, the yen bulls could dominate if the asset drops below May 12 low at 127.52. This will drag the asset towards April 26 low at 126.95, followed by April 13 high at 126.32.
USD/JPY four-hour chart
-637885370156167745.png)
AUD/USD retreats from intraday top but stays on the way to post the biggest weekly gains since late March as cautious optimism weighs on the US dollar of late. That said, the pair eases from the daily top of 0.7024 to the 0.7000 threshold heading into Thursday’s European session.
The Aussie pair’s upbeat performance in the weekly timeframe could be linked to the options market optimism, as known by the risk reversal (RR) data derived from the spread of calls and put options.
It’s worth noting that the one-month RR for the AUD/USD snaps a four-day downtrend to +0.362, the highest since late March, on weekly basis. The daily RR, however, rise for the second consecutive day to 0.100 at the latest.
Read: AUD/USD Price Analysis: Pierces 50- and 200-EMAs near 0.7000 decisively, 0.7200 eyed
The odds of a recession in the next year are rising. Lisa Shalett, Chief Investment Officer, Wealth Management at Morgan Stanley, lays out three reasons to heed the warning signs, and how investors can prepare.
Inflation persists
“Inflation is now broadening out, with the potential to stay higher for longer – historically, a scenario that keeps the Fed in policy-tightening mode. This likely portends additional rate hikes of a half-percentage point combined with aggressive balance-sheet reduction.”
Price pressures may lead to “demand destruction”
“Higher prices will eventually cause consumers to forgo purchases they would have otherwise made. We just cut our full-year GDP growth estimate by a full percentage point to 2.6%.”
Commodity and currency-market volatility complicates the global growth outlook
“With commodity prices still relatively high, business and financial conditions are improving for emerging markets (EM) exporters while worsening for importers. These dynamics are exacerbated by a simultaneous strengthening of the US dollar, which causes a squeeze for countries and businesses heavily leveraged to dollar-denominated debt. Shockwaves from these imbalances are increasingly reaching the broader credit market, with spreads on high-yield bonds, mortgage-backed securities and EM debt now widening – generally indicating risk aversion.”
The euro has been depreciating against the dollar since the third quarter of 2021. But why is this happening? In the opinion of economists at Natixis, it can be attributed both to the yield spread between the United States and the eurozone and to the low attractiveness of the euro-zone equity market.
Is the euro depreciating against the dollar, or is the dollar appreciating?
“In terms of the exchange rate against the dollar, the euro has depreciated less than the yen, more than the renminbi, and as much as emerging currencies other than China and the pound sterling. It is, therefore, the dollar that is appreciating, and the euro is not depreciating against the dollar any more than other currencies.”
“The recent weakening of the euro is linked to: A decline in non-residents' purchases of European bonds; Since the start of 2022, a decline in non-residents' purchases of euro-zone equities; And not other possible capital flows (resident capital, short-term capital flows).”
- USD/CHF remains depressed around two-week low after breaking 100-SMA.
- Oversold RSI conditions test bears but the downside bias remains intact.
- Previous support line from April adds to the upside filters.
USD/CHF bears struggle to keep the reins around a two-week bottom, despite breaking the key technical supports of late. That said, the Swiss currency (CHF) pair drops 0.25% intraday as sellers attack 0.9860 level by the press time.
A clear downside break of the monthly support line, now resistance around 1.0000, joins the break of the 100-SMA level of 0.9865 to keep the USD/CHF bears hopeful.
However, the oversold RSI (14) line challenges the quote’s further declines, suggesting a corrective pullback towards 0.9920 immediate hurdle ahead of challenging the support-turned-resistance line near 1.0000.
In a case where USD/CHF remains firmer past 1.000, the monthly high of 1.0065 and the 1.0100 will lure the bulls.
On the contrary, a monthly low of around 0.9710 precedes the 200-SMA level of 0.9645 to restrict the short-term downside of the USD/CHF prices.
Should CHF bulls dominate past 0.9645, the odds of a gradual south-run towards the early April peak near 0.9375 can’t be ruled out.
USD/CHF: Four-hour chart
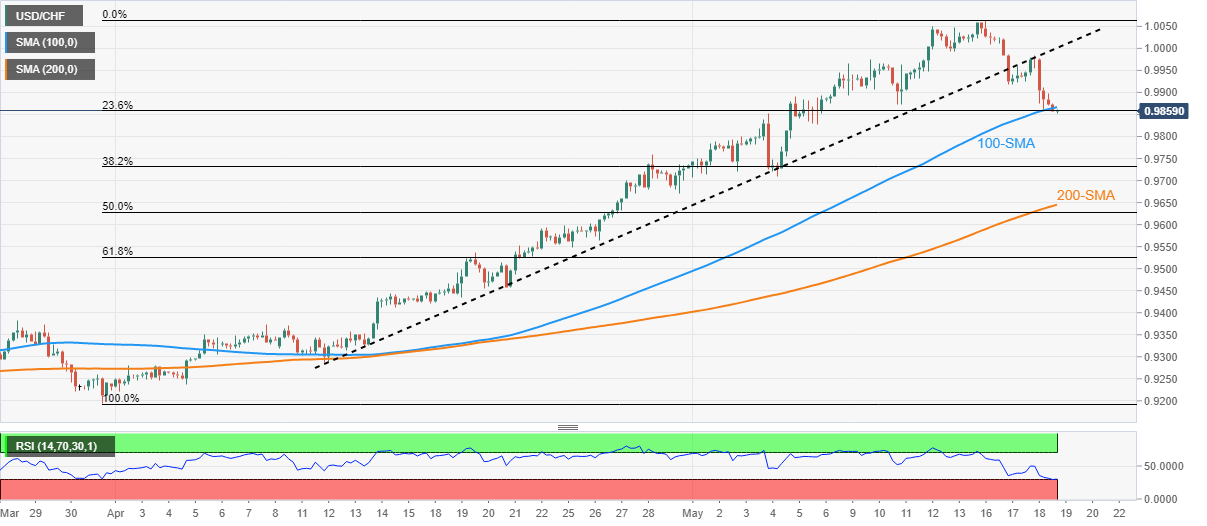
Trend: Further weakness expected
Open interest in natural gas futures markets shrank by just 122 contracts on Wednesday after four consecutive daily builds in a row, noted preliminary readings from CME Group. On the flip side, volume extended the erratic performance and went up by nearly 9K contracts.
Natural Gas: Target remains at $9.00
Prices of natural gas briefly surpassed $8.50 on Wednesday, although ended the session with modest gains. The daily uptick was on the back of a small drop in open interest, indicative that further gains could be running out of steam in the very near term. In the meantime, the big magnet for bulls remains at the 2022 peak around the $9.00 mark per MMBtu (May 6).
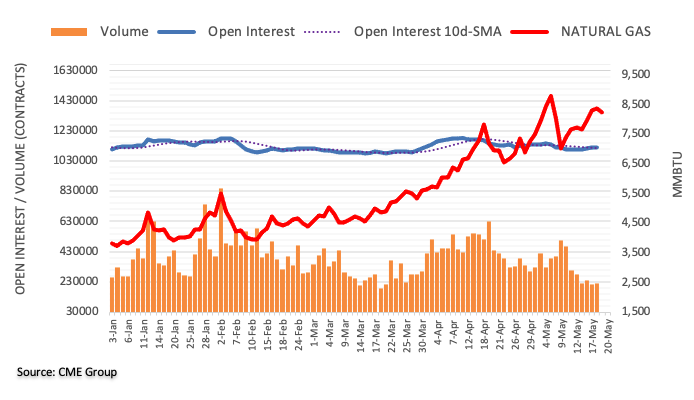
According to FX Strategists at UOB Group Lee Sue Ann and Quek Ser Leang, NZD/USD is now expected to trade within the 0.6240-0.6380 range in the next few weeks.
Key Quotes
24-hour view: “We expected NZD to ‘test 0.6380 first before easing’ yesterday. NZD subsequently rose to 0.6370 before dropping sharply to a low of 0.6292. The rapid decline appears to be running ahead of itself and NZD is unlikely to weaken much further. For today, NZD is likely to trade sideways between 0.6280 and 0.6330.”
Next 1-3 weeks: “We highlighted yesterday (18 May, spot at 0.6365) that NZD could rise to 0.6405. We did not expect the sharp decline as NZD dropped to 0.6292. The build-up in momentum fizzled out quickly and from here, NZD is likely to trade between 0.6240 and 0.6380.”
CME Group’s flash data for crude oil futures markets noted traders scaled back their open interest positions for the second session in a row, this time by around 7.5K contracts. On the other hand, volume increased for the third consecutive day, now by nearly 51K contracts.
WTI: Extra gains seen above $115.50
Wednesday’s marked decline in prices of the WTI was amidst the continuation of the downtrend in open interest, leaving the possibility of further losses somewhat diminished in the very near term. On the upside, crude oil faces the next hurdle at recent peaks in the $115.50 region per barrel (May 17,18).
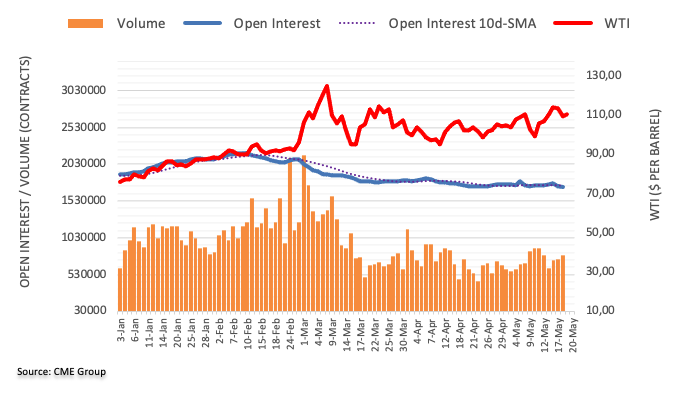
- USD/CAD is eyeing more losses as investors have underpinned risk-sensitive assets.
- Oil prices are attempting to establish themselves above $105.00.
- The BOC could elevate its interest rates further amid rising inflationary pressures.
The USD/CAD pair is juggling in a 10-pip range in the early European session as the positive market sentiment has rebounded sharply and risk-perceived assets are gaining traction. The asset is expected to tumble further, following its current bearish momentum, which was triggered after failing to breach the psychological resistance of 1.3000.
Following the footprints of the UK and Europe, Canada’s statistics agency also released an elevated figure for the Consumer Price Index (CPI) on Wednesday. Statistics Canada reported the annual CPI figure at 6.8%, higher than the forecasts and the prior print of 6.7%. While the annual core Bank of Canada (BOC) CPI that excludes foods and energy bills has landed at 5.7%, much higher than the consensus of 5.4%. It looks like the uptick in the BOC’s rate cycle has failed to weigh even a minute pressure on the price pressures.
On the oil front, the oil prices are trying to establish themselves above $105.00 despite rising demand worries. Higher inflation figures from the Western cartel is indicating a slump in the global growth forecasts. A meaningful increase in the oil prices will put more pressure on the greenback.
Meanwhile, the US dollar index (DXY) is eyeing more losses on improvement in the risk appetite of investors. The asset is performing vulnerable on Thursday and is expected to slide further to 103.40. In today’s session, US Initial Jobless Claims (IJC) will remain in focus. The weekly jobless claims are expected to land at 200k against the prior print of 203k.
- Rising concerns over inflation, growth forecasts keep Asia-Pacific equities heavy.
- Covid news from China underpins rebound in stock futures but firmer yields weigh on mood.
- NZ, Indonesia budgets fail to renew optimism, Aussie jobs report came in mixed.
Markets in Asia-Pacific see the red, despite the recent rebound, as fears of inflation and growth battle cautious optimism in China during early Thursday. While portraying the mood, MSCI’s index of Asia-Pacific shares ex-Japan dropped by around 2.0% whereas Japan’s Nikkei 225 prints a 1.72% daily loss by the press time.
Shares in China recently pare losses, despite being in the red, as a fall in China’s covid numbers joins the gradual re-opening of Shanghai.
Australia’s ASX 200 and New Zealand’s NZX 50 dropped 1.56% and 0.90% respectively even as the mixed Aussie employment report for April couldn’t please stock investors, and neither did New Zealand’s budget that tried to help citizens battle inflation woes. However, Indonesia’s energy subsidies in the annual budget proposal manage to help IDX Composite to buck the broad bearish trend with 0.35% intraday gains.
Moving on South Korea’s KOSPI and India’s BSE Sensex drop more than 1.0% as traders mull over growth fears amid higher budget deficit and energy prices, as well as inflation fears across the globe.
On a broader front, Wall Street benchmarks posted the biggest daily loss in nearly two years as major investment banks downgrade growth forecasts after the recent bout of multi-year high inflation in developed economies. It’s worth noting, however, that S&P 500 Futures print mild gains around 3,930, after a downbeat start of the day, whereas the US 10-year Treasury yields rise 2.2 basis points (bps) to 2.90% by the press time.
Moving on, a light calendar puts investors at the mercy of risk catalysts and hence chatters surrounding inflation and growth may keep equities under pressure.
Also read: Dollar gains as fall in US stocks trigger risk aversion
GBP/USD could now trade between 1.2230 and 1.2460 in the next weeks, suggested FX Strategists at UOB Group Lee Sue Ann and Quek Ser Leang.
Key Quotes
24-hour view: “Our expectations for the ‘overbought rally in GBP to extend’ were incorrect as it staged a surprisingly sharp sell-off to a low of 1.2330. The sharp decline has scope to dip below 1.2300 but is not expected to threaten the next support at 1.2230. On the upside, a breach of 1.2405 (minor resistance is at 1.2375) would indicate that the current downward pressure has eased.”
Next 1-3 weeks: “After GBP surged to a high of 1.2498, we highlighted yesterday that there is room for GBP to advance further to 1.2600. We did not expect the rapid and sharp turnaround as GBP plummeted to a low of 1.2330 during NY session. The volatile price actions have resulted in a mixed outlook and GBP could trade between 1.2230 and 1.2460 for now.”
Considering advanced prints from CME Group for gold futures markets, open interest shrank for yet another session, this time by around 4.5K contracts. Volume, instead, reversed three consecutive daily pullbacks and went up by around 26.4K contracts.
Gold remains capped by the 200-day SMA
Gold prices charted an inconclusive session on Wednesday against the backdrop of shrinking open interest. In the meantime, further consolidation in the yellow metal remains on the cards, while bullish attempts continue to be capped by the 200-day SMA around $1837.
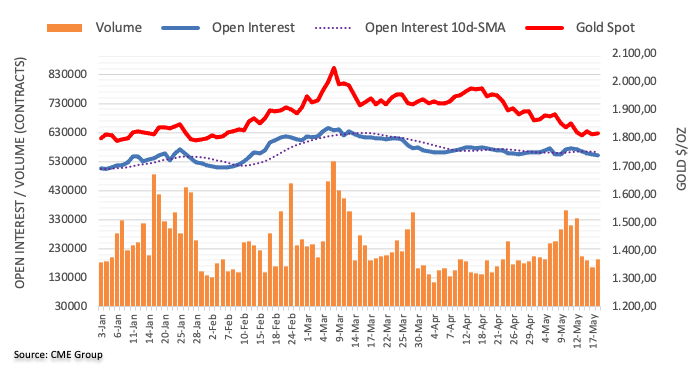
- Gold remains sidelined between the key levels, inflation/growth fears keep sellers hopeful.
- Risk appetite improves on China’s covid updates, Fedspeak amid sluggish session.
- Multiple hurdles to the north challenge gold buyers, downside appears more lucrative.
Gold Price treads water for the second consecutive day, taking rounds to $1,815, as market sentiment dwindles amid a lack of major data/events and mixed signals. The precious metal faced rejection at $1,836 earlier in the week but buyers returned from $1,807 to nullify the moves, portraying lackluster moves of late.
The bullion’s inaction could be linked to the market’s confusion as gold (XAU/USD) is perceived as hedge-against-inflation but the fears of economic growth being dampened and repeated calls for the major central bank’s faster rate hikes seems to weigh on the metal prices. The latest positive for gold prices could be linked to improvement in China’s covid conditions and softer US data relating to housing. Moving on, an absence of major data/events keeps the gold price at the mercy of the US dollar moves, which in turn highlights risk catalysts and the scheduled second-tier data for fresh impulse.
Also read: Gold Price Forecast: XAU/USD trades lackluster despite gloomy market mood, DXY below 104.00
Gold Price: Key levels to watch
The Technical Confluences Detector shows that the Gold Price stays between the $35 range above $1,800, nearing multiple resistances starting from $1,817 that encompasses the SMA5 four-hour, Fibonacci 23.6% one-week and one-day.
Following that, a convergence of the SMA100 one-hour, the SMA10 four-hour and the Fibonacci 38.2% one-day challenge XAU/USD buyers around $1,821.
In a case where gold buyers cross $1,821, SMA5 one-day and Fibonacci 61.8% one-day at $1,825 and $1,828 respectively, can test upside momentum before the key $1,834 level including Fibonacci 38.2% one-week.
Alternatively, the previous day’s low near $1,813 tests short-term sellers ahead of directing them to $1,807, encompassing one-day S1 and the previous low four-hour.
Further down, the previous week’s low at $1,799 and pivot point one-month S2 at $1,797 will be crucial to watch for gold sellers.
Here is how it looks on the tool
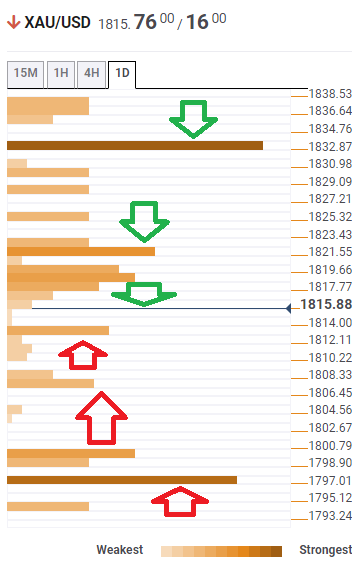
About Technical Confluences Detector
The TCD (Technical Confluences Detector) is a tool to locate and point out those price levels where there is a congestion of indicators, moving averages, Fibonacci levels, Pivot Points, etc. If you are a short-term trader, you will find entry points for counter-trend strategies and hunt a few points at a time. If you are a medium-to-long-term trader, this tool will allow you to know in advance the price levels where a medium-to-long-term trend may stop and rest, where to unwind positions, or where to increase your position size.
In opinion of FX Strategists at UOB Group Lee Sue Ann and Quek Ser Leang, EUR/USD has now likely moved into a consolidative phase.
Key Quotes
24-hour view: “We expected ‘further EUR strength’ yesterday. However, EUR plummeted to a low of 1.0458. The oversold decline has scope to extend to 1.0440 even though a sustained decline below this level is unlikely. The next support at 1.0390 is unlikely to come into the picture. Resistance is at 1.0500 followed by 1.0530.”
Next 1-3 weeks: “Yesterday (18 May, spot at 1.0545), we held the view that the corrective rebound in EUR could extend to 1.0600. We did not expect the subsequent sharp drop to a low of 1.0458 during NY session. While our ‘strong support’ level at 1.0440 is not breached, the build-up in momentum has fizzled out quickly. The sharp but short-lived swings the past couple of days have resulted in a mixed outlook and EUR could trade within a range of 1.0390/1.0560 for now.”
- The asset is expected to pause around the upper boundary of the Rising Channel formation.
- A pullback towards the five-EMA could be a bargain buy for investors.
- The RSI (14) is displaying an extremely overbought situation.
The USD/TRY pair is oscillating in a narrow range of 15.92-15.98 from the New York session. Earlier, the pair has remained in the grip of bulls after breaching the prolonged consolidation formed in a range of 14.39-15.06. The greenback bulls are outperforming against the Turkish lira amid a broader strength in the former.
On a daily scale, the asset is auctioning in a Rising Channel chart formation. The upper trendline of the above-mentioned chart pattern is placed from January 3 high at 13.94 while the lower boundary is plotted from February 1 low at 13.27.
The 20- and 50-period Exponential Moving Averages (EMAs) at 15.28 and 14.86 respectively are scaling higher, which signals a continuation of the bullish momentum.
Meanwhile, the Relative Strength Index (RSI) (14) is oscillating in the 60.00-80.00 range, which indicates the strength of the greenback bulls. Most probably, the greenback bulls will remain stronger, however, the RSI (14) is displaying an extremely overbought situation, which could bring exhaustion to the rally.
A minor pullback in the asset towards the five-period EMA at 15.80 will activate a responsive buying action, which will drive the asset towards the Rising Channel upper boundary at 16.20. A breach of the latter will expose the asset to an upside of 20 December 2021 opening price at 16.60.
On the flip side, the greenback bulls could lose their grip if the asset drops below the 9 May low at 14.92. The occurrence of the same will drag the asset towards April 12 low at 14.55, followed by the psychological support at 14.00.
USD/TRY daily chart
-637885327206345368.png)
- USD/IDR pares recent gains, stays pressured around intraday low.
- Indonesia Government announces fuel subsidy, crude price range to bring fiscal deficit to 4.3-4.5%.
- Risk-on mood, softer US dollar also underpin the pullback moves.
USD/IDR holds lower grounds near $14,700, after rising the most in two weeks, as the Indonesia Budget Office manages to incentivize Indonesia rupiah (IDR) traders during early Thursday.
That said, Indonesia Finance Minister Sri Mulyani Indrawati expects 2022 inflation close to 4% while also expecting the 2022 average rupiah exchange rate at 14,300-14,700/$.
Other details include a proposal of 234 trillion rupiah in additional fuel subsidies, a proposal to raise 2022 crude price estimate to $95-$105/barrel from $63/barrel and a target 2022 fiscal deficit estimate to 4.3-4.5% of GDP.
Elsewhere, China’s covid conditions and softer US data relating to housing, not to forget repeated calls of the Fed’s 50 bps rate hikes seem to also underpin the US dollar weakness and weigh on the USD/IDR prices.
It’s worth noting, however, that the latest risk-on mood remains doubtful amid broad fears over inflation and growth, which in turn suggests the USD/IDR weakness is illusionary.
Technical analysis
A two-week-old rising wedge bearish chart pattern, currently between $14,660 and $14,820, limits short-term USD/IDR moves.
- GBP/USD is advancing towards 1.2400 as the DXY eased intraday.
- Inflationary figures in the UK have climbed to 9%.
- The BOE is left with no other option than to hike its interest rates sooner.
The GBP/USD pair has attracted some significant bids near 1.2340 as a risk-on impulse has rebounded sharply and risk-perceived assets are gaining the limelight. The major is moving sharply higher and is expected to reach the round level resistance of 1.2400.
Earlier, the cable witnessed a sheer downside move on Wednesday after the UK’s Office for National Statistics reported the Consumer Price Index (CPI) figures. The annualized CPI figure landed at 9%, a little lower than the forecast of 9.1% but significantly higher than the previous figure of 7%. It won’t be wrong to claim that inflationary pressures are galloping and intervention of the Bank of England (BOE) is notably required to fix the inflation mess.
The core CPI that excludes food and energy prices has landed at 6.2%, similar to the consensus. Higher price pressures are dampening the real income of the households and the BOE is left with no other option than to continue interest rate elevation.
Meanwhile, the US dollar index (DXY) is going through a meaningful intraday fall after failing to cross the round level resistance of 104.00. The asset has displayed a bearish open test-drive session and is expected to record more losses. The odds of a spree of bumper rate hikes by the Federal Reserve (Fed) are rising higher. Philadelphia Fed Bank President Patrick Harker believes that the Fed should follow its tradition of elevating interest rates by 25 basis points (bps) after announcing two 50 bps rate hikes in June and July.
- USD/INR again slips after refreshing all-time high, renews daily low of late.
- Bearish RSI divergence hints at further declines but “Double Top” confirmation needed to convince sellers.
- 50-SMA, weekly support line act as extra downside filters.
USD/INR takes offers to renew intraday low around 77.65, after refreshing the all-time peak with 78.03 earlier in the day, as the US dollar struggles to keep recent gains amid cautious optimism.
In doing so, the Indian rupee (INR) pair portrays a “Double Top” bearish chart pattern on the four-hour play during early Thursday morning in Europe.
Not only the “Double Top” but bearish RSI divergence, identified when RSI prints lower-high even if prices make higher-high, also keep USD/INR bears hopeful.
However, a clear downside break of the latest low near 77.33 becomes necessary to confirm the bearish chart formation.
Ahead of that, the 50-SMA and a one-week-old rising trend line, respectively around 77.48 and 77.38, challenge the USD/INR pair sellers.
Meanwhile, recovery moves need a clear run-up beyond the 78.00 threshold, also crossing the latest high of 78.03, to reject the bearish chart formation.
It’s worth noting that the RSI should also accompany the jump in the prices to direct USD/INR bulls toward the 80.00 psychological magnet.
USD/INR: Four-hour chart
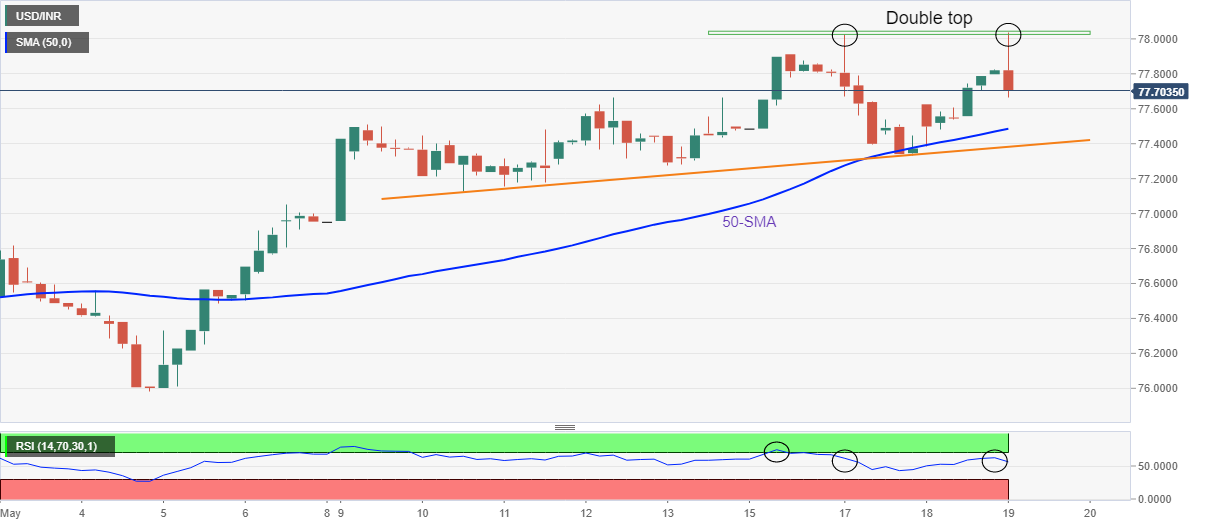
Trend: Pullback expected
- EUR/USD picks up bids to reverse pullback from the weekly top.
- US dollar remains pressured around cautious optimism, monotonous Fedspeak surrounding 50 bps.
- Eurozone inflation, hawkish ECBSpeak keeps buyers hopeful of witnessing July rate hike clues in ECB Meeting Accounts.
- US housing, manufacturing and Jobless Claims to also entertain traders moving forward.
EUR/USD adds to the intraday gains by consolidating the biggest daily loss in a week around 1.0500 during early Thursday morning in Europe. The major currency pair’s latest rebound could be linked to the broad US dollar weakness amid cautious optimism in the market, as well as the Euro traders’ hopes of July rate hikes. Though, anxiety ahead of the European Central Bank (ECB) Monetary Policy Meeting Accounts seems to restrict the quote’s upside of late.
That said, the US Dollar Index (DXY) drops 0.17% intraday to 113.65 as greenback bulls await fresh clues after being tired of hearing 50 bps rate hike calls from various Fed policymakers, including Chairman Jerome Powell, of late. Philadelphia Federal Reserve Bank President Patrick Harker was the latest one in the line.
Also weighing on the US dollar is the recent recovery in the market sentiment, mainly due to improvement in China’s covid conditions and softer US data relating to housing. China reported a drop in the daily covid cases and death tolls to 1,082 and one respectively, versus 1,305 and three in that order on Thursday. On the same line are Shanghai’s plans to unlock the economy in a phased manner after covid-led restrictions.
On the other hand, record-high Eurozone inflation, per the HICP figures, join hawkish calls from the ECB policymakers like Madis Muller and Olli Rehn, as well as Governing Council member and Spanish central bank chief Pablo Hernandez de Cos, to fuel the regional currency.
Amid these plays, US 10-year Treasury yields rose 3.6 basis points to 2.92% whereas the S&P 500 Futures reverse early Asian session losses to regain the 3,920 level of late.
Moving on, ECB Meeting Accounts will be closely observed for clear hints over the time and pace of the rate hike as markets cheer the July move, which in turn could propel the EUR/USD prices in case meeting expectations.
Other than the ECB Accounts, US Weekly Jobless Claims, Philadelphia Fed Manufacturing Survey for May and Existing Home Sales for April are some other catalysts that need the attention of the EUR/USD traders. Above all, chatters surrounding inflation and growth are crucial to forecasting short-term moves of the key currency pair.
Technical analysis
A sustained bounce off the previous resistance line from March 31, around 1.0450 by the press time, directs EUR/USD buyers towards the 21-DMA hurdle surrounding 1.0560. However, the monthly high surrounding 1.0640 will challenge the quote’s further upside.
- A responsive buying interest in the demand zone has strengthened the aussie bulls.
- The 50- and 200-EMAs are expected to display a golden cross.
- Aussie bulls may get strengthened further if the RSI (14) oversteps 60.00.
A juggernaut rebound in the AUD/USD pair after the release of the Employment data has underpinned the antipodean against the greenback. The asset has managed to overstep the psychological resistance of 0.7000 decisively and is likely to extend its upside as the risk-off impulse is losing traction.
On an hourly scale, the asset has witnessed a strong reversal from its potential demand zone, which was placed in a narrow range of 0.6950-0.6962. The asset has forcefully pierced the 50- and 200-period Exponential Moving Averages (EMAs) at 0.6989, which could mark a golden cross between the EMAs. The formation of a golden cross will add to the upside filters.
Meanwhile, the Relative Strength Index (RSI) (14) has taken support from 40.00, which signals the emergence of a responsive buying action. The RSI (14) may attempt a violation of 60.00 that will trigger a bullish setup for the counter.
A minor pullback towards the psychological support of 0.7000 should be considered as a bargain buy opportunity for the market participants, which will send the asset towards May 4 low and round level resistance at 0.7092 and 0.7200 respectively.
Alternatively, the greenback could regain control if the asset drops below the above-mentioned demand zone in a 0.6950-0.6962 range. This will drag the asset towards May 16 low at 0.6872, followed by May 12 low at 0.6828.
AUD/USD hourly chart
-637885280754194807.png)
- Gold price is oscillating in a $2 range amid a light economic calendar this week.
- Rising inflationary pressures are hurting the global growth forecasts.
- The risk-off impulse has failed to bring a power-pack action in the gold prices.
Gold price (XAU/USD) is in the doldrums despite mounting tensions in the global markets on galloping inflationary pressures. The precious metal is behaving depressed and is auctioning in an extremely tight range of $1,815.40-1,817.42 in the Asian session. The disclosure of the inflation data by Europe and the UK on Wednesday created havoc in the FX domain. The annualized Consumer Price Index (CPI) figures by the Eurozone and the UK landed at 7.5% and 9% respectively. It looks like the sky is the limit for the inflation figures.
Advancing price pressures are hurting the global growth forecasts and the expectations of the same forced the market participants to dump equities worldwide. Global sell-off in the equities heightened the appeal for the safe-haven assets, however, the gold prices failed to find any meaningful bids and are continuously displaying a lackluster performance.
Meanwhile, the US dollar index (DXY) is oscillating below the round level resistance of 104.00 in the Asian session. A bull rally in the DXY looks far from over and the asset may get empowered with intensive buying interest.
Gold technical analysis
On a four-hour scale, the 50-period Exponential Moving Average (EMA) at $1,833.47 is acting as a major barricade for the counter. A 40.00-60.00 range oscillation from the Relative Strength Index (RSI) (14) is advocating for a directionless move in the counter. The precious metal is expected to consolidate in a range of $1,807.72-1,836.45. The downward sloping trendline placed from April 18 high at $1,998.43 will act as major resistance for the asset.
Gold four-hour chart
-637885258628284173.png)
Shanghai’s Deputy Mayor Zhang Wei announced plans on Thursday to gradually reopen public transport and allow the resumption of work in zero-COVID areas, as the city prepares for the end of a six-week lockdown.
Additional takeaways
Shanghai port throughput has recovered to around 90% of levels a year ago.
Shanghai to expand work resumption in areas with no covid risk in early June.
Shanghai to require residents to show negative results for PCR tests taken within 48 hours before using public transport.
Shanghai to gradually and in orderly way increase number of trains arriving, departing from Hongqiao railway station.
Shanghai to gradually restore inter-district public transport from May 22.
Shanghai will start to restore long metro trunk lines with high connectivity first.
Shanghai to cut rents for small and medium-sized enterprises by more than 10 billion yuan.
Market reaction
Risk-off flows are gradually easing, reflective of a minor recovery in the S&P 500 futures, as China’s financial hub embarks upon the reopening path.
Although the Asian equities nurse heavy losses. USD/CNY is adding 0.10% on the day to trade at 6.7613, as the Chinese yuan fails to cheer the encouraging news.
| Raw materials | Closed | Change, % |
|---|---|---|
| Brent | 109.26 | -3.63 |
| Silver | 21.419 | -1 |
| Gold | 1817.28 | 0.15 |
| Palladium | 2011.92 | -1.67 |
- NZD/USD picks up bids to renew intraday top after New Zealand’s annual Budget Release.
- NZ FinMin Robertson sounds hopeful on economic recovery, expects OBEGAL surplus in 2024/25.
- Softer USD, easing China covid cases also underpin the corrective pullback.
- Risk-aversion keeps bears hopeful ahead of second-tier data, qualitative catalysts should be watched carefully.
NZD/USD consolidates the previous day’s losses around 0.6310, renewing intraday top after upbeat New Zealand (NZ) Budget on early Thursday. In addition to the NZ Budget, a softer USD also underpins the Kiwi pair’s corrective pullback of late.
“Economy expected to be robust in the near term,” said New Zealand Finance Minister (FinMin) Grant Robertson presents the annual budget. The office also expects “a budget deficit of NZ$18.978 billion ($11.95 billion) for the fiscal year ending June 30, narrower than a deficit of NZ$20.844 billion forecast in its half-year fiscal update in December,” per Reuters. The update also expect Operating Balance Before Gains, Losses (OBEGAL) to return to surplus in 2024-25.
Read: NZ FinMin Robertson: Economy expected to be robust in near term
Given the US dollar pullback joining the upbeat comments from NZ FinMin, NZD/USD had reasons to extend the early Asian recovery moves to refresh the intraday high. Also supporting the Kiwi pair buyers are recent China covid numbers suggesting a drop in the daily covid cases and death tolls to 1,082 and one respectively, versus 1,305 and three in that order.
That said, an absence of major data/events and repeated comments from the Fed policymakers seemed to have recently paused the risk-aversion wave.
Amid these plays, US 10-year Treasury yields regain the 2.90% level after declining 11 basis points (bps) to 2.88% the previous day. Even so, the S&P 500 Futures drop 0.50% and the US Dollar Index (DXY) dropped 0.17% intraday at the latest.
Moving on, NZD/USD traders will pay attention to the risk catalyst and second-tier housing/activity numbers from the US for fresh impulse. Overall, the bears are likely to keep the reins.
Technical analysis
NZD/USD pair’s inability to cross one-week-old horizontal resistance near 0.6375-85, as well as failure to remain well past a monthly descending trend line, close to 0.6335, keeps the pair sellers hopeful.
Alternatively, bears remain directed towards the area comprising the monthly low, also the lowest levels since 2020, around 0.6225-15.
While presenting the annual Budget on Thursday, New Zealand (NZ) Finance Minister Grant Robertson sounded optimistic on the near-term economic outlook.
Key takeaways
NZ to extend and add to support to counter high inflation hitting cost of living
A new temporary $27 a week payment for people who earned less than $70,000 last year in a $1 billion cost of living package.
Fuel tax cuts and half-price public transport extended for another two months to the end of August.
NZ sees 2021/22 operating balance before gains, losses of nz$-18.978 bln (HYEFU NZ$-20.844 bln).
NZ sees 2021/22 net debt 36.9 pct of GDP under old calculation method (HYEFU 37.6 pct).
NZ 2021/22 cash balance NZ$-31.78 bln (HYEFU NZ$-34.100 bln).
NZ sees 2022/23 GDP 4.2 pct, unemployment rate seen at 3.3%.
economy expected to be robust in near term.
NZ government forecast to return to OBEGAL surplus in 2024/25.
Market reaction
NZD/USD has recaptured 0.6300 on the NZ Budget release, currently trading at 0.6309, up 0.22% so far.
- AUD/JPY remains mildly bid after mixed prints of Australia employment data for April.
- Convergence of 21-DMA, 50-DMA appears a tough nut to crack for buyers.
- Steady RSI directs sellers towards a four-month-old support line.
AUD/JPY consolidates the biggest daily loss in a week around 89.50 after the unclear signals from the Aussie jobs report for April were released early Thursday.
That said, Australia’s headline Unemployment Rate marched 3.9% forecast while refreshing the all-time low but a fall in the Employment Change to 4K, versus the market consensus of 30K and 17.9K prior, seems to have probed AUD/JPY buyers. It’s worth noting that the softer-than-expected prints of the Aussie Wage Price Index for Q1 2022 challenged the RBA hawks the previous day.
Read: Australian labour report leavs AUD sidelined, so far
AUD/JPY pair’s reversal from the 21-DMA and 50-DMA confluence, around 91.30, joins steady RSI to keep sellers hopeful.
Even if the pair manages to cross the 91.30 hurdle, a monthly resistance line near 92.50 will be testing the AUD/JPY bulls.
On the contrary, 50% Fibonacci retracement (Fibo) of January-April upside, near 88.10, restricts the short-term downside of the pair. However, major attention will be given to an upward sloping trend line from late January, around 87.70.
Should the quote drop below 87.70, the monthly low of 87.30 may act as the last defense for the AUD/JPY buyers before directing them to the 61.8% Fibo near 86.25.
AUD/JPY: Daily chart
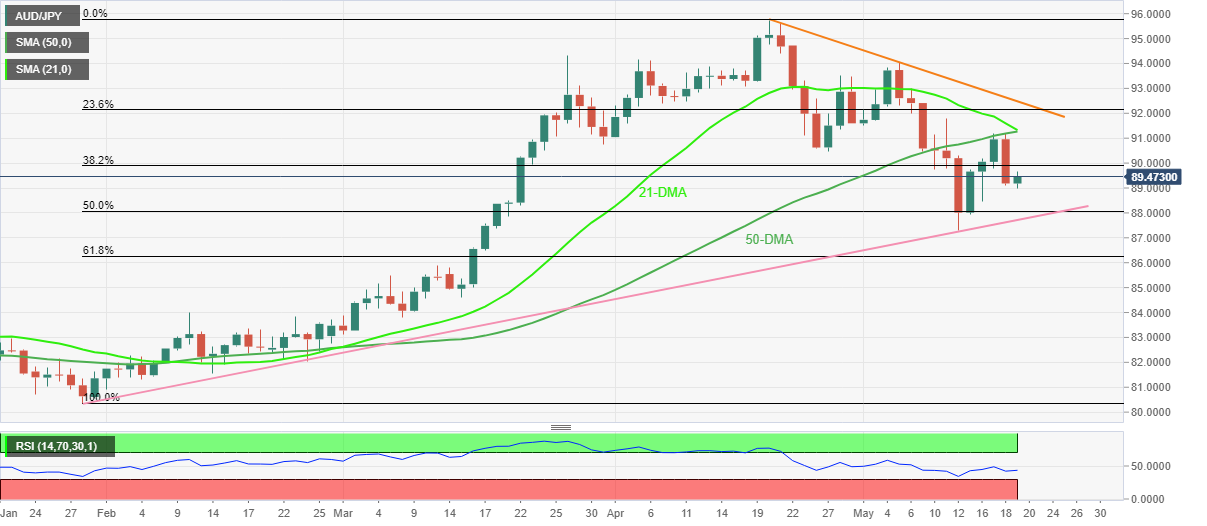
Trend: Further weakness expected
Goldman Sachs has cut its 2022 China GDP forecast to 4% from 4.5% YoY and has cut the Q2 estimate to 1.5% YoY vs. 4% previous.
Key quotes
“Full-year growth is based on the assumption that Covid will remain mostly under control and that the property market improves.”
“The government boosts infrastructure spending.”
“The Chinese government's forecast for GDP growth this year is around 5.5.'”
“It is imperative to keep Covid under control and avoid hard lockdowns of major economic centres like Shanghai going forward.”
“The government could hit its growth target if it uses “statistical smoothing.”
Revisions to previous years’ GDP or “deviations of current year’s GDP growth from alternative measures of economic activity can sometimes take place in difficult growth years.”
- AUD/USD retreats towards intraday low despite teasing the first weekly gain in five amid mixed Aussie jobs report.
- Australia Employment Change eased below forecasts and prior while Unemployment Rate refreshed record low in April.
- Repeated Fedspeak over 50 bps joins softer yields to weigh on USD amid sluggish markets.
- Risk catalysts will be crucial to watch for clear directions, US second-tier data eyed too.
AUD/USD pares intraday gains around 0.6960 as the Aussie jobs report flashed mixed reports during early Thursday. Also challenging the pair moves is a lack of major data/events elsewhere as well as a softer USD.
That said, Australia’s headline Unemployment Rate marched 3.9% forecast while refreshing the all-time low but a fall in the Employment Change to 4K, versus the market consensus of 30K and 17.9K prior, seems to have weighed on the AUD/USD prices. It’s worth noting that the softer-than-expected prints of the Aussie Wage Price Index for Q1 2022 probed the RBA hawks the previous day.
Read: Australian labour report leavs AUD sidelined, so far
Given the softer Employment Change and Wage Price Index , the RBA’s 40 bps rate hikes are questionable at the moment, which in turn probes the AUD/USD pair’s recent corrective pullback. It’s worth noting that the risk-aversion wave and downbeat conditions at the largest customer China, due to the covid resurgence, weigh on the AUD/USD prices. Recently, Shanghai’s refrain from total unlocks joined fresh virus-led activity restrictions in Tianjin, the port city near Beijing to portray COVID-19 woes.
Additionally, inflation woes in the developed nations join the geopolitical fears surrounding Russia to sour the sentiment and exert downside pressure on the AUD/USD prices.
Even so, An absence of major data/events and repeated comments from the Fed policymakers seemed to have recently paused the risk-aversion wave. That said, US 10-year Treasury yields dropped 11 basis points (bps) to 2.88% the previous day, mostly unchanged at around 2.89% by the press time of Thursday’s Asian session, whereas S&P 500 Futures drop 0.50% at the latest. It should be noted that the US Dollar Index (DXY) drop 0.14% around 103.77 by the press tie.
Having witnessed an initial reaction to the Aussie jobs report, which matched market forecasts, AUD/USD sellers are likely to return amid Wednesday’s Q1 2022 Wage Price Index and the risk-off mood. This emphasizes today’s risk catalysts and the US second-tier data relating to housing and manufacturing to forecast the pair moves.
Technical analysis
AUD/USD sellers attack short-term key support around 0.6960 as traders struggle to pare the biggest daily loss in a week.
A confluence of the 100-HMA and a weekly rising trend line, around 0.6960, restricts the immediate downside of the AUD/USD prices, a break of which will quickly direct bears towards the 0.6900 threshold ahead of highlighting the monthly low near 0.6830.
Meanwhile, recovery remains elusive until the AUD/USD prices cross a two-week-long horizontal resistance area near 0.7040-60.
The Australian jobs report has been released yet has done little to move the needle on AUD/USD.
Australian Employment report
- April Employment +4.0k s/adj (Reuters poll: +30.0k).
- April Unemployment Rate +3.9 pct, s/adj (Reuters poll: +3.9, prior 4%).
- April Full Time employment +92.4k s/adj.
- April Participation Rate +66.3 pct, s/adj (Reuters poll: +66.4 pct).
The data comes on the heels of the wage inflation numbers that were bullish for AUD, but today's labour market report is mixed. Nevertheless, the tick down in the Unemployment number is encouraging.
AUD/USD update
AUD/USD Price Analysis: Bears take charge, carving out the path to a new daily low
The price is trapped between support and resistance on the four-hour chart with a bearish tendency on the longer-term time frames:
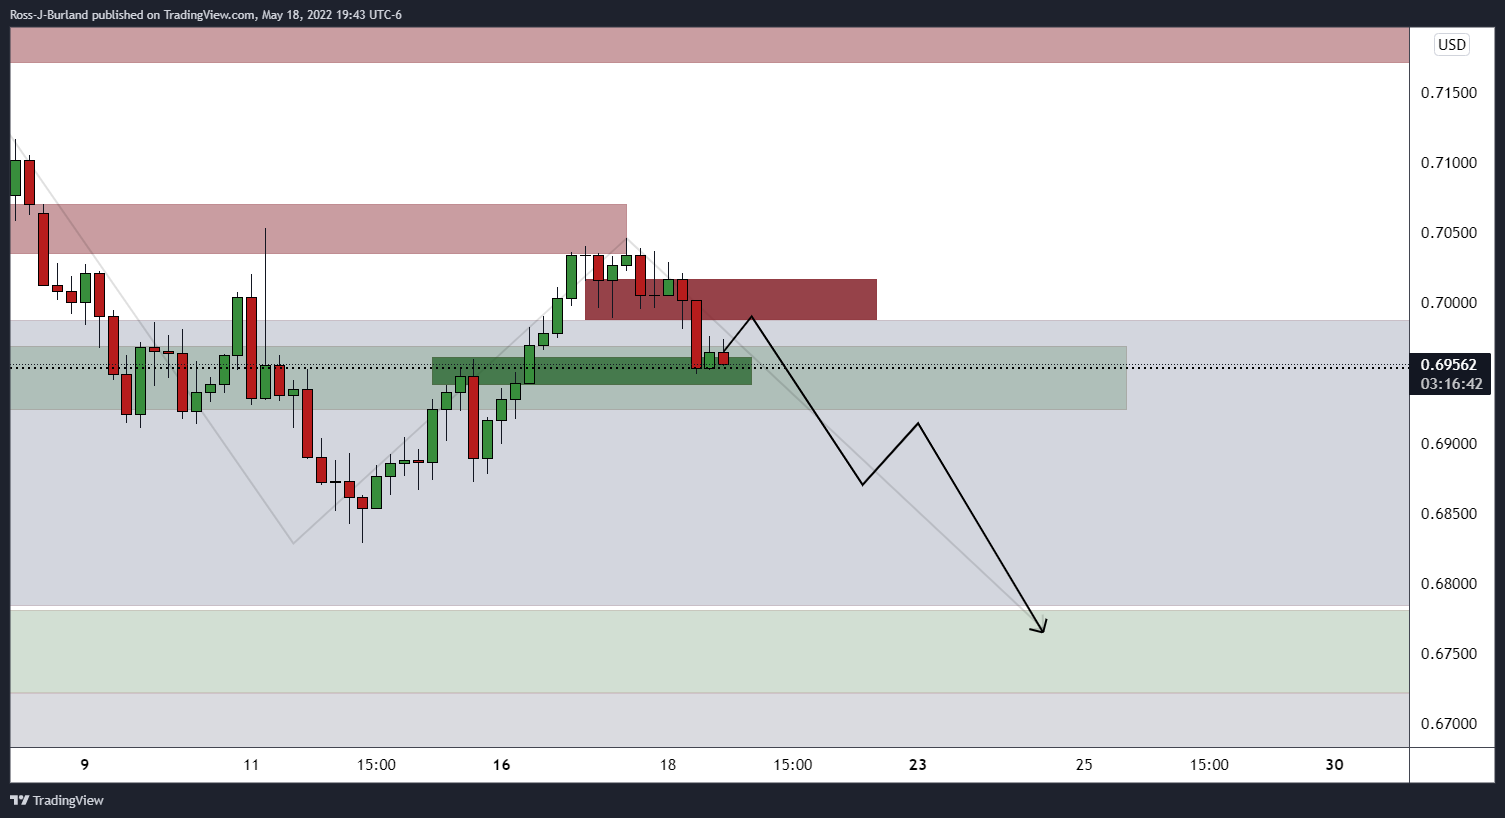
The price could be on the verge of a break to the downside in a strong US dollar environment.
About the Aussie Employment report
The Australian Bureau of Statistics (ABS) publishes an overview of trends in the Australian labour market, with the unemployment rate a closely watched indicator. It is released about 15 days after the month's end and throws light on the overall economic conditions, as it is highly correlated to consumer spending and inflation. Despite the lagging nature of the indicator, it affects the Reserve Bank of Australia’s (RBA) interest rate decisions, in turn, moving the Australian dollar. The upbeat figure tends to be AUD positive.
In recent trade today, the People’s Bank of China (PBOC) set the yuan (CNY) at 6.7524 vs. the estimate of 6.7510 and last close of 6.7530.
About the fix
China maintains strict control of the yuan’s rate on the mainland.
The onshore yuan (CNY) differs from the offshore one (CNH) in trading restrictions, this last one is not as tightly controlled.
Each morning, the People’s Bank of China (PBOC) sets a so-called daily midpoint fix, based on the yuan’s previous day closing level and quotations taken from the inter-bank dealer.
US inflation expectations, as per the 10-year breakeven inflation rate per the St. Louis Federal Reserve (FRED) data, keep the one-week-old rebound from the lowest level since late February that was tested earlier in May.
That said, the inflation gauge remains steady near 2.71% during the last two days to Wednesday.
An absence of major data/events and repeated comments from the Fed policymakers seemed to have recently paused the inflation expectations. Even so, the bond rout hints at the firmer upside pressure on the inflation, which in turn could escalate the risk-off mood. The US 10-year Treasury yields dropped 11 basis points (bps) to 2.88% the previous day, mostly unchanged at around 2.89% by the press time of Thursday’s Asian session.
Given the firmer inflation expectations backing the ongoing flight to safety, the US dollar has the further upside to track while risk assets like equities and commodities may witness extended bearish bias.
Amid these plays, the US Dollar Index (DXY) fades the previous day’s bounce off weekly low, down 0.13% intraday near 103.75, whereas S&P 500 Futures decline 0.40% intraday at the latest.
Read: Stocks sink in a vicious sea of red, gold in no man's land
- The DXY is expected to rebound despite a weak response at open amid a risk-off impulse.
- Fed policymakers see 50 bps interest rate hikes both in June and July.
- In today’s session, Jobless Claims and Home Sales data will remain in focus.
The US dollar index (DXY) is witnessing a steep fall after a flat opening. Struggling to overstep the round level resistance of 104.00 on Wednesday has weighed pressure on the asset, however, a rebound looks likely. The DXY remained firmer in the previous trading session as the risk-off impulse heightened on soaring inflation worldwide. The European nations came up with ramping up inflation figures as the UK reported a 9% annual figure while Eurozone HICP landed at 7.5%. Mounting fears of a recession in Europe amid high inflationary pressures and the inability of the corporate to generate jobs underpinned the DXY.
Philadelphia Fed Bank President Patrick Harker
Federal Reserve (Fed) policymakers are advocating a spree of 50 basis points (bps) interest rate hikes by the Fed this year. Rising inflationary pressures are compelling the Fed to do whatever it takes to bring price stability. Philadelphia Fed Bank President Patrick Harker stated that the Fed should elevate the interest rates by 50 bps in its June and July monetary policy meetings. After that, the Fed should stick to the traditional elevation of 25 bps further.
A light economic calendar this week has left the DXY at the mercy of risk sentiment. Still, the Jobless Claims and Home Sales data will keep investors busy in the New York session.
Key events next week: New Home Sales, Durable Goods Orders, FOMC minutes, Initial Jobless Claims, Gross Domestic Product (GDP), Core Personal Consumption Expenditure (PCE), and Michigan Consumer Sentiment Index (CSI).
- Silver takes a U-turn from intraday low to consolidate recent losses.
- Clear break of weekly rising channel, sustained trading below two-day-old descending trend channel favor bears.
- Bulls need to cross $22.10 to validate short-term rebounds.
Silver (XAG/USD) picks up bids to $21.40 as it pares the daily loss during Thursday’s Asian session.
In doing so, the bright metal bounces off the 100-HMA and support line of a two-day-old descending trend channel.
However, falling RSI (14) joins the successful break of the weekly rising channel to keep sellers hopeful.
That said, a fresh downside awaits a clear break of the $21.30 support confluence before targeting the $21.00 threshold.
It’s worth noting that $20.80 and the recent lows of $20.45 may entertain XAG/USD sellers past-$21.00, but before highlighting the $20.00 psychological magnet.
Meanwhile, recovery moves may initially aim for the immediate channel’s resistance, around $21.70, before targeting that two-week-long horizontal area and lower line of the broader channel near $22.10.
In a case where silver prices remain firm past $22.10, the odds of witnessing $23.00 on the chart can’t be ruled out.
Silver: Hourly chart
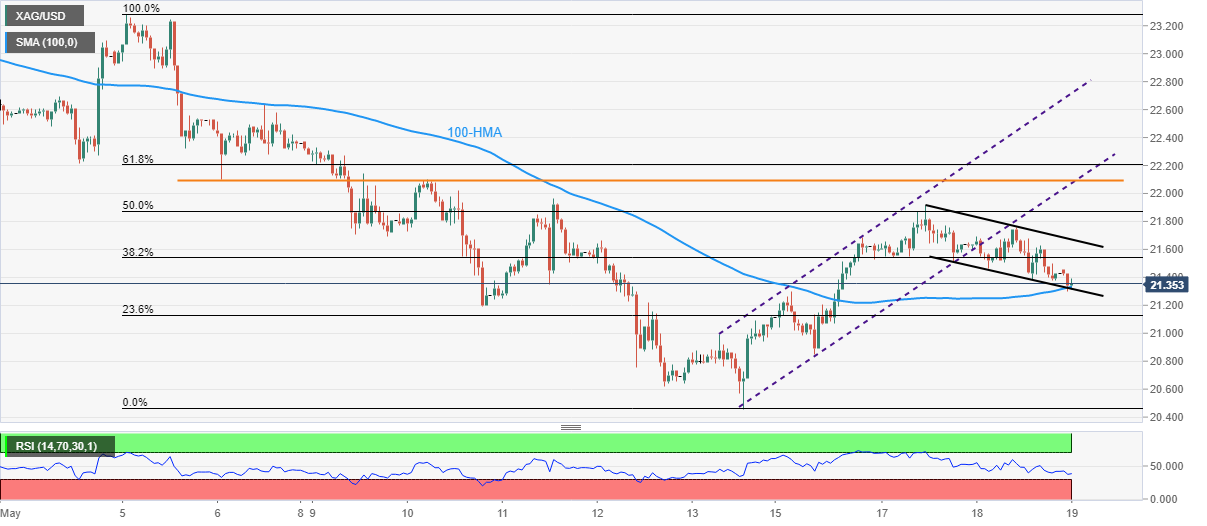
Trend: Bearish
- EUR/USD bears need to firm up at this juncture.
- Bears eye a break of 1.0430 to open the path for lower for longer.
EUR/USD has been attempting to move in on the 1.06 areas this week but the bears are putting up strong resistance on the way there. The prospects of a run to parity remain on the table in a strong US dollar environment. However, the bears need to commit to the cause at this juncture or they could face strong opposition in a period of price imbalance mitigation in the late 1.06 and early 1.07 areas. The following illustrates the market structure and price action across the time frame from a bearish bias and perspective.
EUR/USD monthly chart
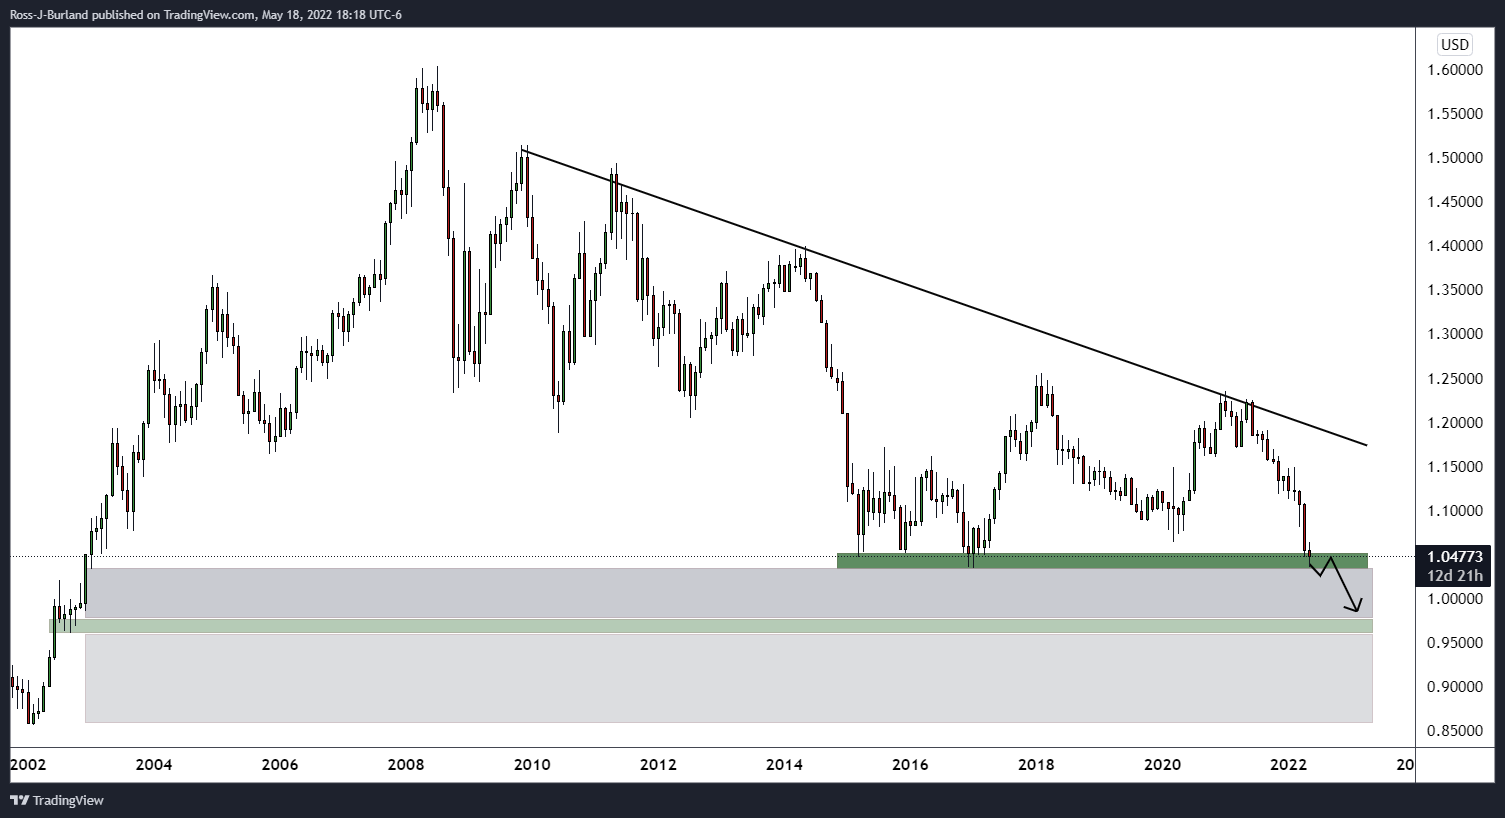
The monthly outlook sees the price testing a critical support area which gurdas a run towards parity.
EUR/USD weekly chart
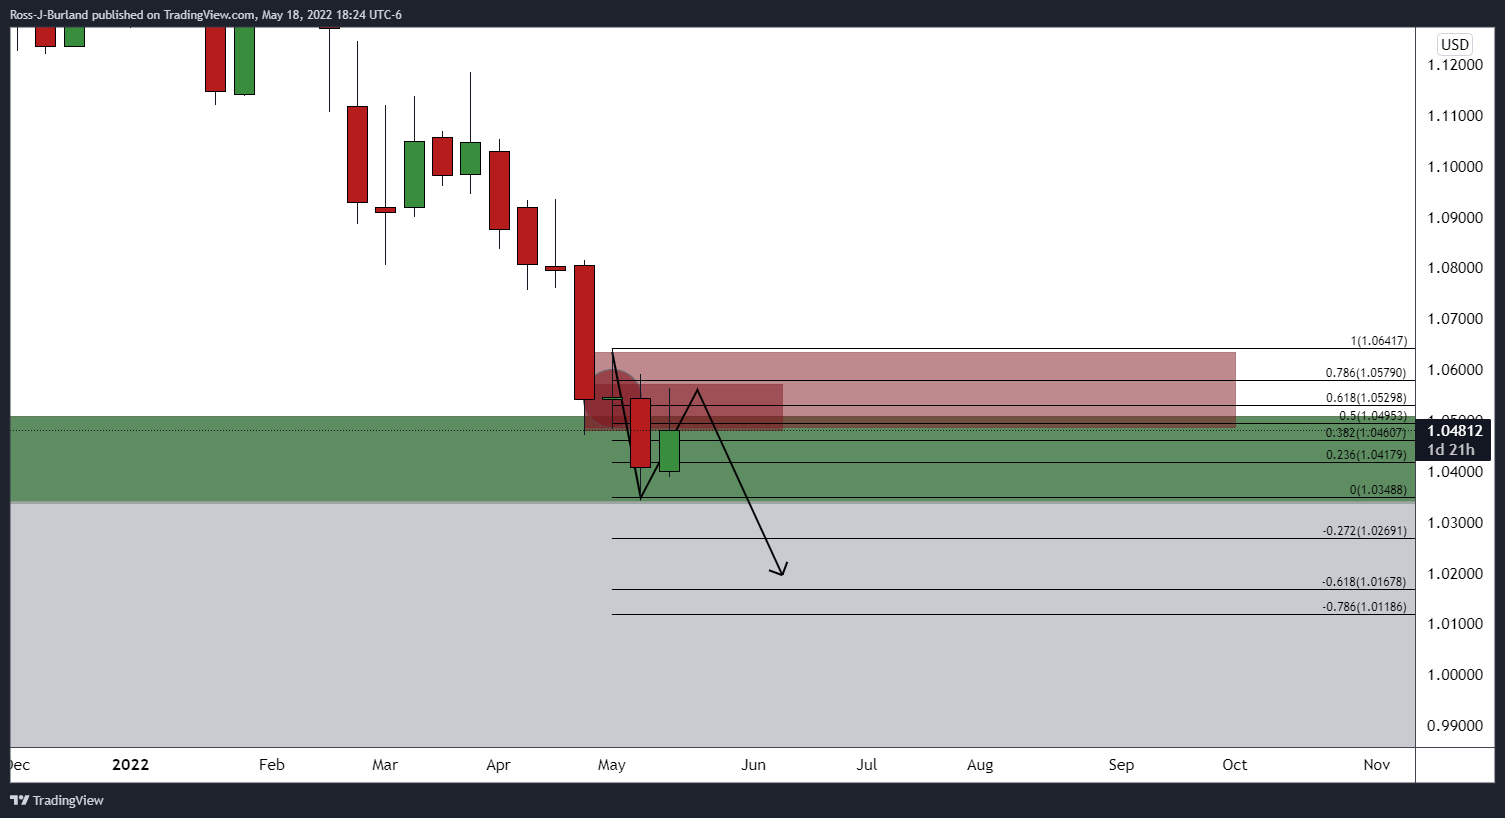
The weekly chart shows that the price is being rejected at a prior structure around a 61.8% Fibonacci area.
EUR/USD daily chart
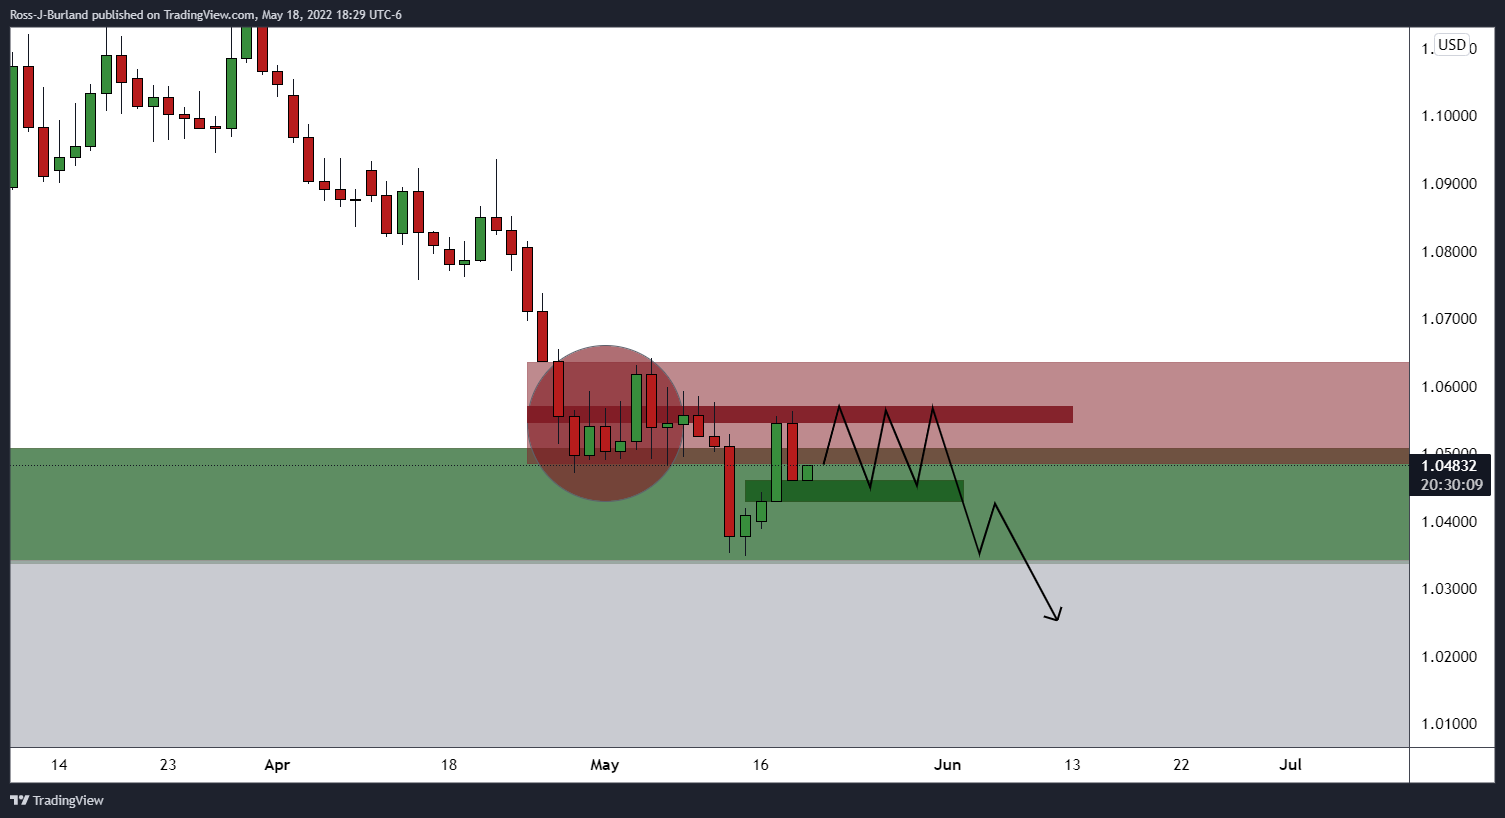
The price is bounded by support and resistance on the daily chart which could see some sideways price action in the days ahead. However, a breakout one way or another would be definitive for the foreseeable future.
EUR/USD H4 chart
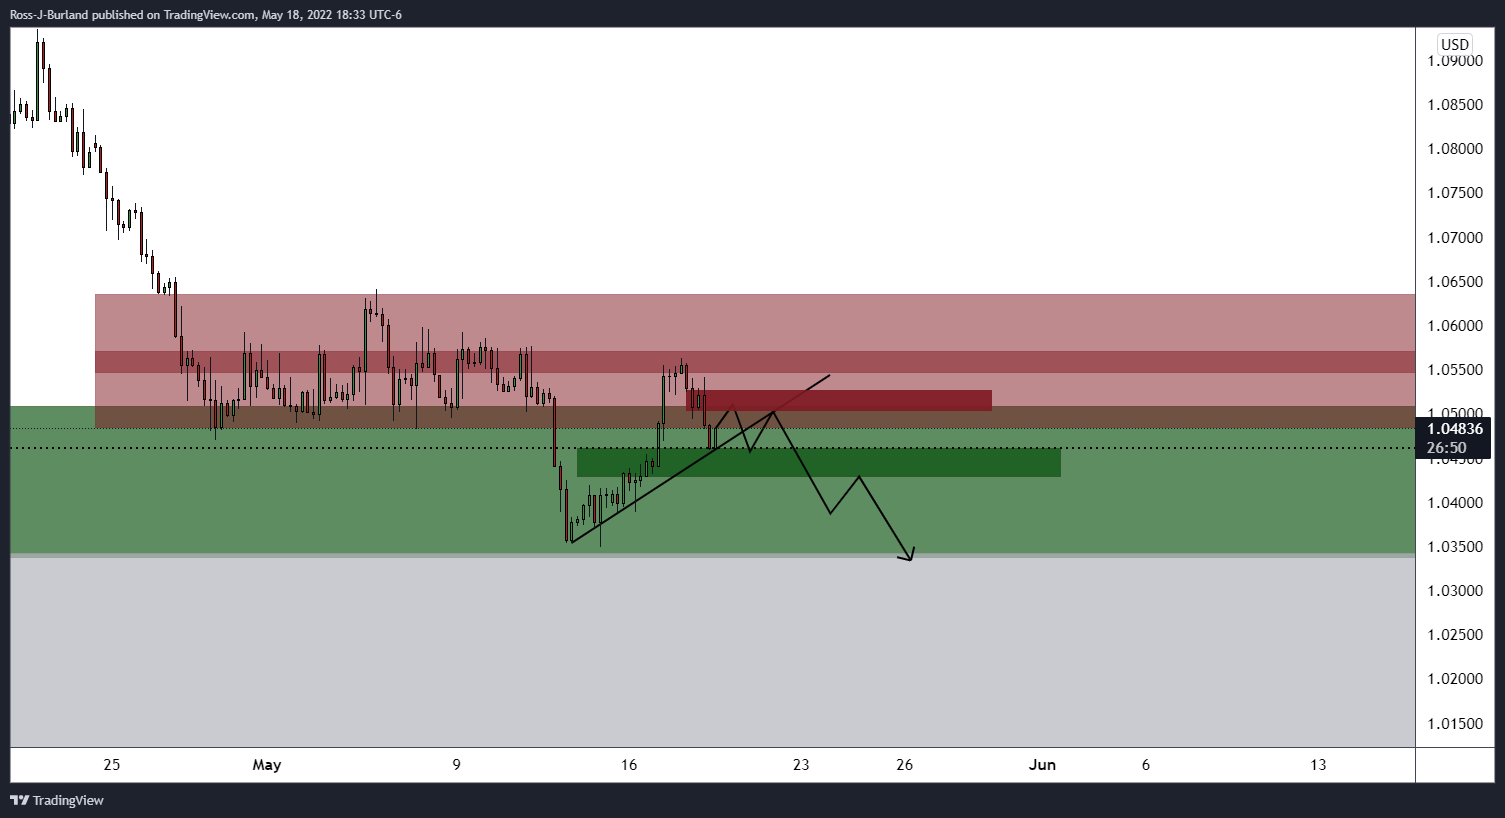
If the bears manage to break the four-hour trendline support, then this could open the barriers for a move below the 1.0430 support and on to lower lows in the bearish cycle.
April month employment statistics from the Australian Bureau of Statistics, up for publishing at 01:30 GMT on Thursday, will be the immediate catalyst for the AUD/USD pair traders.
The jobs figures have been important considering the Reserve Bank of Australia’s (RBA) hawkish stand, backed by firmer inflation data, as well as a bit softer Wage Price Index for Q1 2022.
Market consensus suggests that the headline Unemployment Rate may ease to 3.9% from 4.0% on a seasonally adjusted basis whereas Employment Change could rise from 17.9K to 30K. Further, the Participation Rate may remain unchanged at 66.4% during the stated month.
Ahead of the event, analysts at Westpac said,
Given that weekly payrolls suggest weather and holiday events dampened jobs growth in April, Westpac anticipates employment to have risen 20k (median 30k), after 18k in March. The participation rate holding flat at 66.4% should see unemployment rate tick down from 4.0% to 3.9% (consensus 3.9%). This would be the lowest rate in the monthly series which began in 1978.
ANZ also mentioned,
We expect the unemployment rate to have fallen to 3.8% in April (from 4.0% in March) on an employment gain of 30k. Last April, due to Easter being early and during the survey period, there was an exaggerated seasonal effect which saw employment drop against expectations. But given Easter started at the end of the survey period this year, it should have less of an effect. At 3.8%, the unemployment rate would be the lowest since 1974.
How could the data affect AUD/USD?
AUD/USD bear take a breather around 0.6970, printing mild gains after dropping the most in a week the previous day, as traders anticipate a record low Unemployment Rate to propel the RBA’s rate hike trajectory. However, challenges to sentiment and cautious mood, as well as disappointment from the softer Aussie Wage Price Index for Q1 2022, seem to weigh on the pair prices of late.
That said, the downbeat prints of the Wage Price Index join economic fears for the largest customer China to stop RBA from faster/heavier rate hikes, which in turn can join the risk-aversion wave to keep AUD/USD sellers hopeful. However, firmer jobs report can offer knee-jerk buying.
Technically, a confluence of the 100-HMA and a weekly rising trend line, around 0.6960, restricts immediate downside ahead of the 0.6900 threshold and the monthly low near 0.6830. Recovery remains, on the contrary, remain elusive until the AUD/USD prices cross a two-week-long horizontal resistance area near 0.7040-60.
Key Notes
Australian Employment Preview: Could strong figures aid the aussie?
AUD/USD Price Analysis: Bears jostle with 100-SMA, weekly support below 0.7000
AUD/USD braces for Australia employment data below 0.7000, risk-aversion in play
About the Employment Change
The Employment Change released by the Australian Bureau of Statistics is a measure of the change in the number of employed people in Australia. Generally speaking, a rise in this indicator has positive implications for consumer spending which stimulates economic growth. Therefore, a high reading is seen as positive (or bullish) for the AUD, while a low reading is seen as negative (or bearish).
About the Unemployment Rate
The Unemployment Rate released by the Australian Bureau of Statistics is the number of unemployed workers divided by the total civilian labor force. If the rate hikes, indicates a lack of expansion within the Australian labor market. As a result, a rise leads to weaken the Australian economy. A decrease of the figure is seen as positive (or bullish) for the AUD, while an increase is seen as negative (or bearish).
| Index | Change, points | Closed | Change, % |
|---|---|---|---|
| NIKKEI 225 | 251.45 | 26911.2 | 0.94 |
| Hang Seng | 41.76 | 20644.28 | 0.2 |
| KOSPI | 5.54 | 2625.98 | 0.21 |
| ASX 200 | 70.2 | 7182.7 | 0.99 |
| FTSE 100 | -80.31 | 7438.09 | -1.07 |
| DAX | -178.18 | 14007.76 | -1.26 |
| CAC 40 | -77.25 | 6352.94 | -1.2 |
| Dow Jones | -1164.52 | 31490.07 | -3.57 |
| S&P 500 | -165.17 | 3923.68 | -4.04 |
| NASDAQ Composite | -566.37 | 11418.15 | -4.73 |
- AUD/USD remains on the back foot despite the latest consolidation of the previous day’s losses.
- Convergence of 100-HMA, one-week-old rising support line restrict immediate downside.
- Fortnight-long horizontal area, bearish MACD signals challenge buyers.
AUD/USD sellers attack short-term key support around 0.6960 as traders struggle to pare the biggest daily loss in a week ahead of Australia’s key jobs report on Thursday.
That said, the Aussie pair presently pokes a confluence of the 100-HMA and a weekly rising trend line, around 0.6960.
Given the bearish MACD signals, coupled with the failures to rebound from the aforementioned support line, AUD/USD sellers are likely to keep reins.
However, a clear downside break of the 0.6960 support confluence becomes necessary for the bear’s return. Following that, the 0.6900 threshold and the monthly low near 0.6830 will be in focus.
Meanwhile, recovery remains elusive until the AUD/USD prices cross a two-week-long horizontal resistance area near 0.7040-60.
In a case where AUD/USD rises past 0.7060, multiple tops marked during early May near 0.7135-40 may entertain the bulls.
AUD/USD: Hourly chart
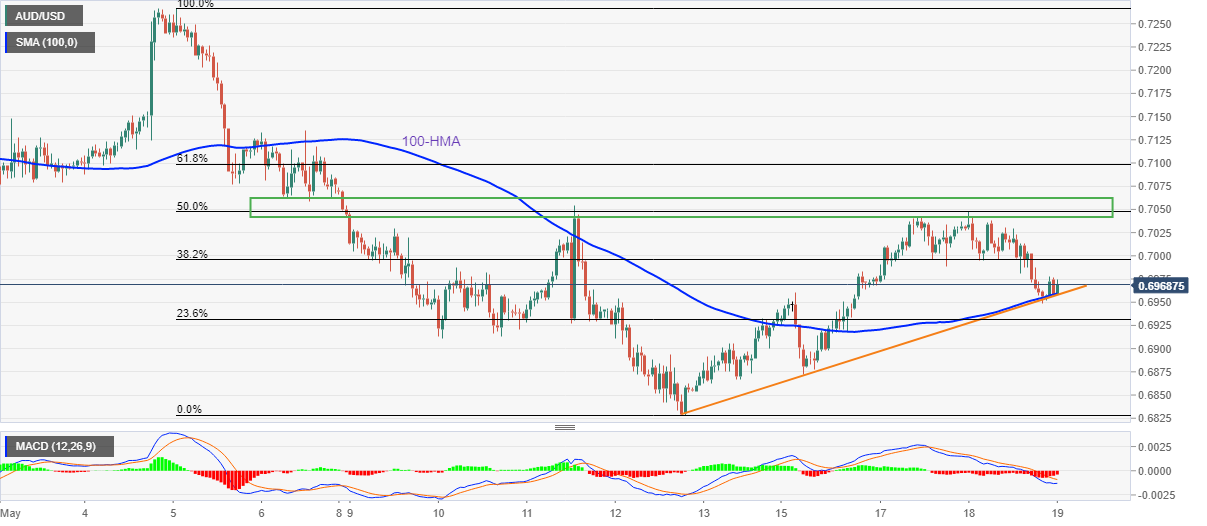
Trend: Further weakness expected
- GBP/JPY has slipped below 158.00 as inflationary pressures soar.
- The BOE looks bound to elevate interest rates vigorously on annual inflation print at 9%.
- Japan’s annual National CPI at 1.5% is well below the targeted figure of 2%.
The GBP/JPY pair is facing an intense sell-off after the release of the UK inflation on Wednesday. A broad-based weakness has been observed in the pound bulls after the UK’s Office for National Statistics reported the annual UK Consumer Price Index (CPI) at a whopping level of 9%. The asset has eased around 2.5% from its recent high of 161.85 recorded on Tuesday.
Although the UK Statistics Office has reported a minor fall in the annual figure from the consensus of 9.1%, a figure of 9% is sufficient to create havoc in the FX domain. It looks like the Bank of England (BOE) has left with no other alternative than to feature a bumper rate hike as mounting price pressures are going to worsen the situation of the real income for the households further.
The monthly figure of the UK inflation has jumped to 2.5% from the prior print of 1.1%. While the core CPI that doesn’t include food and energy prices has jumped to 6.2% but remained in line with the estimates.
On the Japanese yen front, lesser weak Gross Domestic Product (GDP) figures than the consensus have supported the yen bulls. The annualized figure for Japan’s GDP remains higher at -1% against the consensus of -1.8%. While the quarterly figure landed at -0.2% remained negative but still outperformed the forecasts of -0.4%. For further direction, investors will focus on Japan’s inflation, which is due on Friday.
A preliminary estimate for the annual Japan CPI is 1.5% while the core CPI could drop further to -0.9% from the prior print of -0.7%.
| Pare | Closed | Change, % |
|---|---|---|
| AUDUSD | 0.69544 | -1.05 |
| EURJPY | 134.217 | -1.65 |
| EURUSD | 1.04637 | -0.81 |
| GBPJPY | 158.315 | -2.02 |
| GBPUSD | 1.23406 | -1.19 |
| NZDUSD | 0.62942 | -1.03 |
| USDCAD | 1.28879 | 0.6 |
| USDCHF | 0.9874 | -0.63 |
| USDJPY | 128.299 | -0.83 |
- Gold remains sidelined as risk-off mood battles it’s traditional safe-haven status.
- Inflation woes push central banks towards tighter monetary policies, China’s covid conditions also strengthen flight to safety.
- Weekly horizontal support restricts short-term downside amid steady oscillators.
- Second-tier US data, risk catalysts are crucial for near-term directions.
Gold (XAU/USD) treads water at around $1,816 as traders remain divided over the precious metal’s outlook, due to its hedge-against-inflation status. In doing so, the commodity prices pay a little heed to the broad risk-aversion, despite being pressured during the early Asian session on Thursday.
Record high inflation in Eurozone joins a 20-year peak of the UK Consumer Price Index (CPI) and Canada’s upbeat price pressure data to propel the market woes that higher prices would weigh on growth. The same could be witnessed in the recently watered-down US Gross Domestic Product (GDP) forecasts from the leading banks.
Adding to the risk-off mood is the recent rush of the major central banks towards higher rates, led by the Fed, to ward off the negative impacts of inflation on the economy. However, doubts that the absence of easy money isn’t suitable for the time when supply chains are constrained seem to strengthen the rush to risk safety.
Also weighing on the market’s mood is Shanghai’s refrain from total unlocks and an increase in covid cases in mainland China, as well as fresh virus-led activity restrictions in Tianjin, the port city near Beijing. On the same line were headlines concerning the Russia-Ukraine crisis as the West braces for more sanctions on Moscow for invasion of Kyiv.
While portraying the mood, Wall Street benchmarks saw the red while the US 10-year Treasury yields dropped 11 basis points (bps) to 2.88% by the end of Wednesday’s North American trading session. It’s worth noting that the S&P 500 Futures drops 0.60% intraday at the latest.
Although gold traders are in dilemma over its traditional safe-haven status, a firmer US dollar exerts downside pressure on the prices. Hence, today’s second-tier US data are also important to determine short-term XAU/USD moves, in addition to the risk catalysts mentioned above.
Also read: Gold Price Forecast: Steady around $1,820 as overheating inflation spurs fears
Technical analysis
Gold prices fade bounce off one-week-old horizontal support amid receding bullish bias of the MACD, as well as steady RSI (14), which in turn highlights the $1,808-07 area for the bears. However, any further downside needs validation from the $1,800 threshold before challenging the monthly low near $1,787.
Alternatively, a two-week-old descending trend line near $1,825 restricts immediate upside ahead of the 50-SMA level surrounding $1,834.
Overall, gold prices are stuck in a range between $1,807 and $1,825 of late.
Gold: Four-hour chart
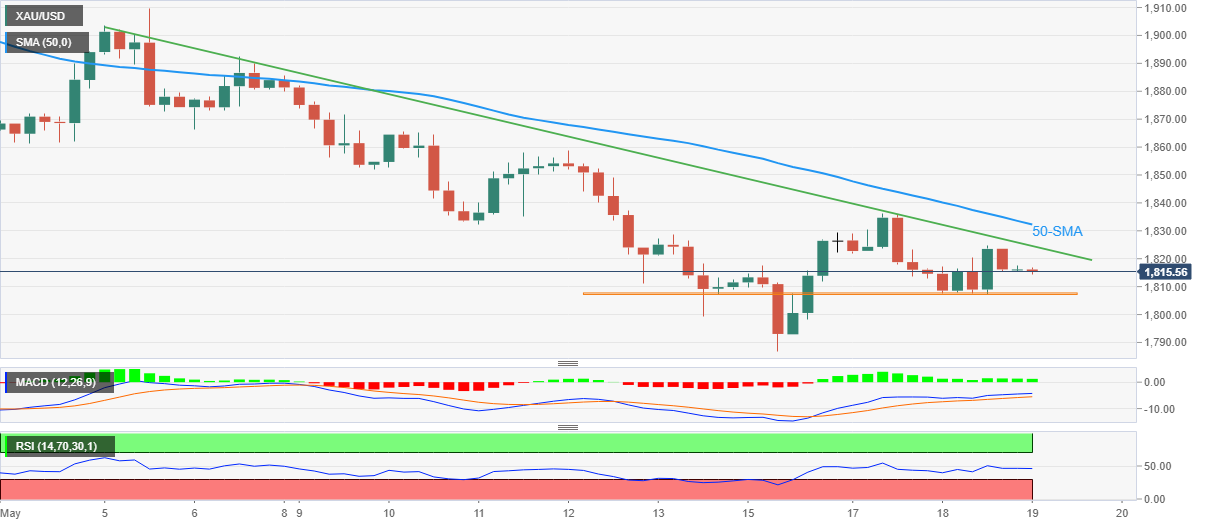
Trend: Sideways


© 2000-2026. Sva prava zaštićena.
Sajt je vlasništvo kompanije Teletrade D.J. LLC 2351 LLC 2022 (Euro House, Richmond Hill Road, Kingstown, VC0100, St. Vincent and the Grenadines).
Svi podaci koji se nalaze na sajtu ne predstavljaju osnovu za donošenje investicionih odluka, već su informativnog karaktera.
The company does not serve or provide services to customers who are residents of the US, Canada, Iran, The Democratic People's Republic of Korea, Yemen and FATF blacklisted countries.
Izvršenje trgovinskih operacija sa finansijskim instrumentima upotrebom marginalne trgovine pruža velike mogućnosti i omogućava investitorima ostvarivanje visokih prihoda. Međutim, takav vid trgovine povezan je sa potencijalno visokim nivoom rizika od gubitka sredstava. Проведение торговых операций на финанcовых рынках c маржинальными финанcовыми инcтрументами открывает широкие возможноcти, и позволяет инвеcторам, готовым пойти на риcк, получать выcокую прибыль, но при этом неcет в cебе потенциально выcокий уровень риcка получения убытков. Iz tog razloga je pre započinjanja trgovine potrebno odlučiti o izboru odgovarajuće investicione strategije, uzimajući u obzir raspoložive resurse.
Upotreba informacija: U slučaju potpunog ili delimičnog preuzimanja i daljeg korišćenja materijala koji se nalazi na sajtu, potrebno je navesti link odgovarajuće stranice na sajtu kompanije TeleTrade-a kao izvora informacija. Upotreba materijala na internetu mora biti praćena hiper linkom do web stranice teletrade.org. Automatski uvoz materijala i informacija sa stranice je zabranjen.
Ako imate bilo kakvih pitanja, obratite nam se pr@teletrade.global.
транcфери