- Analiza
- Novosti i instrumenti
- Vesti sa tržišta
Forex-novosti i prognoze od 18-08-2022
- EUR/USD holds lower ground after refreshing monthly bottom the previous day.
- ECB policymakers, German Finance Ministry’s report contribute to the economic slowdown fears.
- Fed policymakers, firmer US data adds strength to the US dollar.
- German PPI, risk catalysts to help determine short-term directions.
EUR/USD dribbles around 1.0090 during the sluggish Asian session on Friday, after crashing to refresh monthly low the previous day. The major currency pair recently bear the burden of a firmer US dollar, as well as grim economic concerns at home.
The US dollar jumped to the highest levels in one month late Thursday as price-positive numbers from Philadelphia Fed Manufacturing Survey and the weekly Initial Jobless Claims rejected the US recession fears. The activity gauge rallied to 6.2 for August versus -5 expected and -12.3 prior while the weekly jobless claims dropped to 250K, below 265K market consensus and 252K revised prior. With this, the US Dollar Index (DXY) refreshed its monthly high to 107.56, at 107.51 by the press time.
Hawkish Fedspeak and economic concerns surrounding China, as well as Europe, also contributed to the DXY strength, mainly due to the greenback’s safe-haven demand. San Francisco Fed President Mary Daly mentioned that they (Fed) will continue to raise the rates to "right-size it." The policymaker added that either 50 basis points or a 75 basis points hike would be appropriate while signaling the move for the September rate decision. However, Minneapolis Federal Reserve Neel Kashkari mentioned that, per Reuters, he does not believe the county is currently in a recession. Further, the all-time hawk St. Louis Fed President James Bullard said he is leaning towards another 75 bps rate hike in September.
Goldman Sachs and Nomura both cut the dragon nation’s growth forecasts after witnessing the latest jump in the covid numbers. Also negatively impacting the Chinese economy are the doubts over the People’s Bank of China’s (PBOC) capacity to tame recession woes. Additionally, comments from the US Trade Representative’s office stating, “Early this autumn, the US and Taiwan will begin formal negotiations on a trade initiative,” seem to renew the fears of the US-China tussle and also roil the mood.
“The economic outlook for Germany, Europe's largest economy, is gloomy due to energy price rises and supply chain disruptions,” the German Finance Ministry said in its August monthly report, per Reuters.
Elsewhere, ECB executive board member Isabel Schnabel said on Thursday, "Recession on its own would not be enough to control inflation." The policymaker also backed the regional central bank’s current policies. Following that, ECB Governing Council member Martins Kazaks said in an interview with Latvia’s TV3 on Thursday, “the ECB will continue to hike interest rates to tame inflation,” per Bloomberg.
Against this backdrop, Wall Street closed mixed and restrict the S&P 500 Futures while the US 10-year Treasury yields retreated from their monthly high to 2.875% by the press time.
Looking forward, Germany’s Producer Price Index (PPI) for July, expected 32% YoY versus 32.7% prior, will decorate the calendar. However, major attention will be given to qualitative catalysts for better trade-related decision-making.
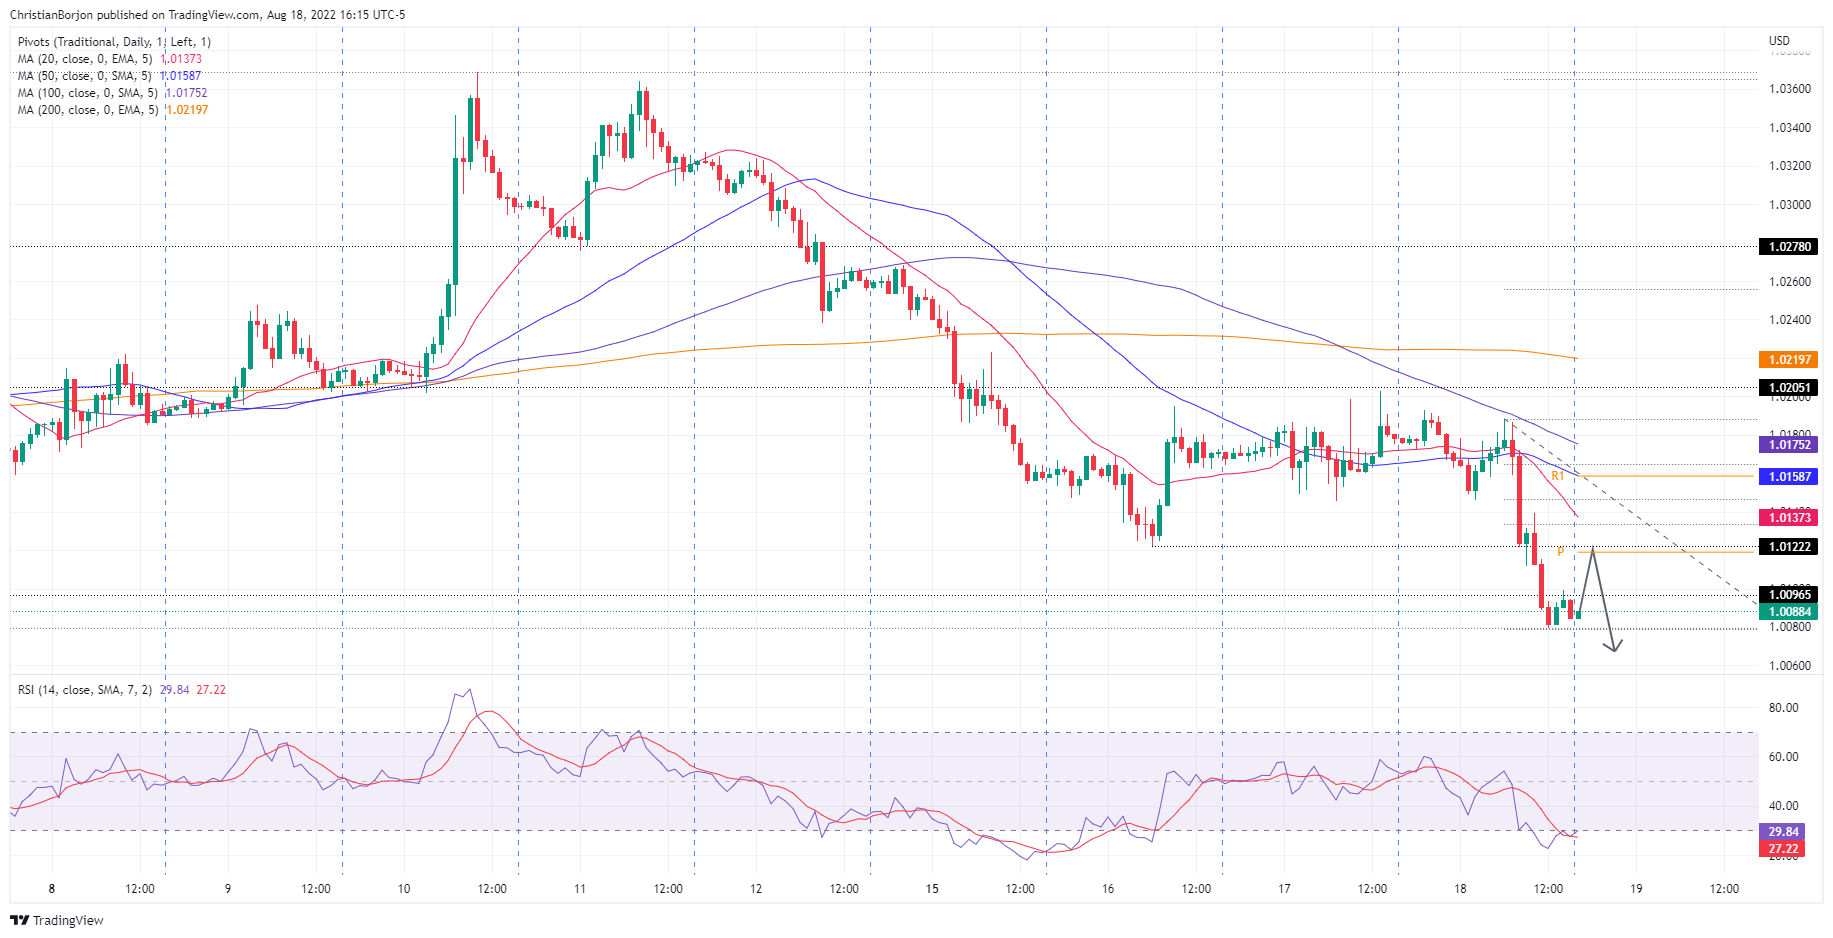
Technical analysis
A clear downside break of a three-week-old ascending trend line, around 1.0180 by the press time, keeps EUR/USD bears hopeful of revisiting the yearly low of 0.9952.
- NZD/USD bears moved in early doors, could be clearing the path for a bullish correction.
- US dollar is stalling on the bid which is bullish for commodity-fx.
NZD/USD bulls could be about to step in following an early Asian slide due to the trade deficit hitting a record high. This has seen the price take on a key support area and prior lows early doors. However, if the equities start off on the right foot in Tokyo on the heels of a positive close on Wall Street, then we could see a move higher in the kiwi. The following illustrates such prospects:
NZD/USD daily chart
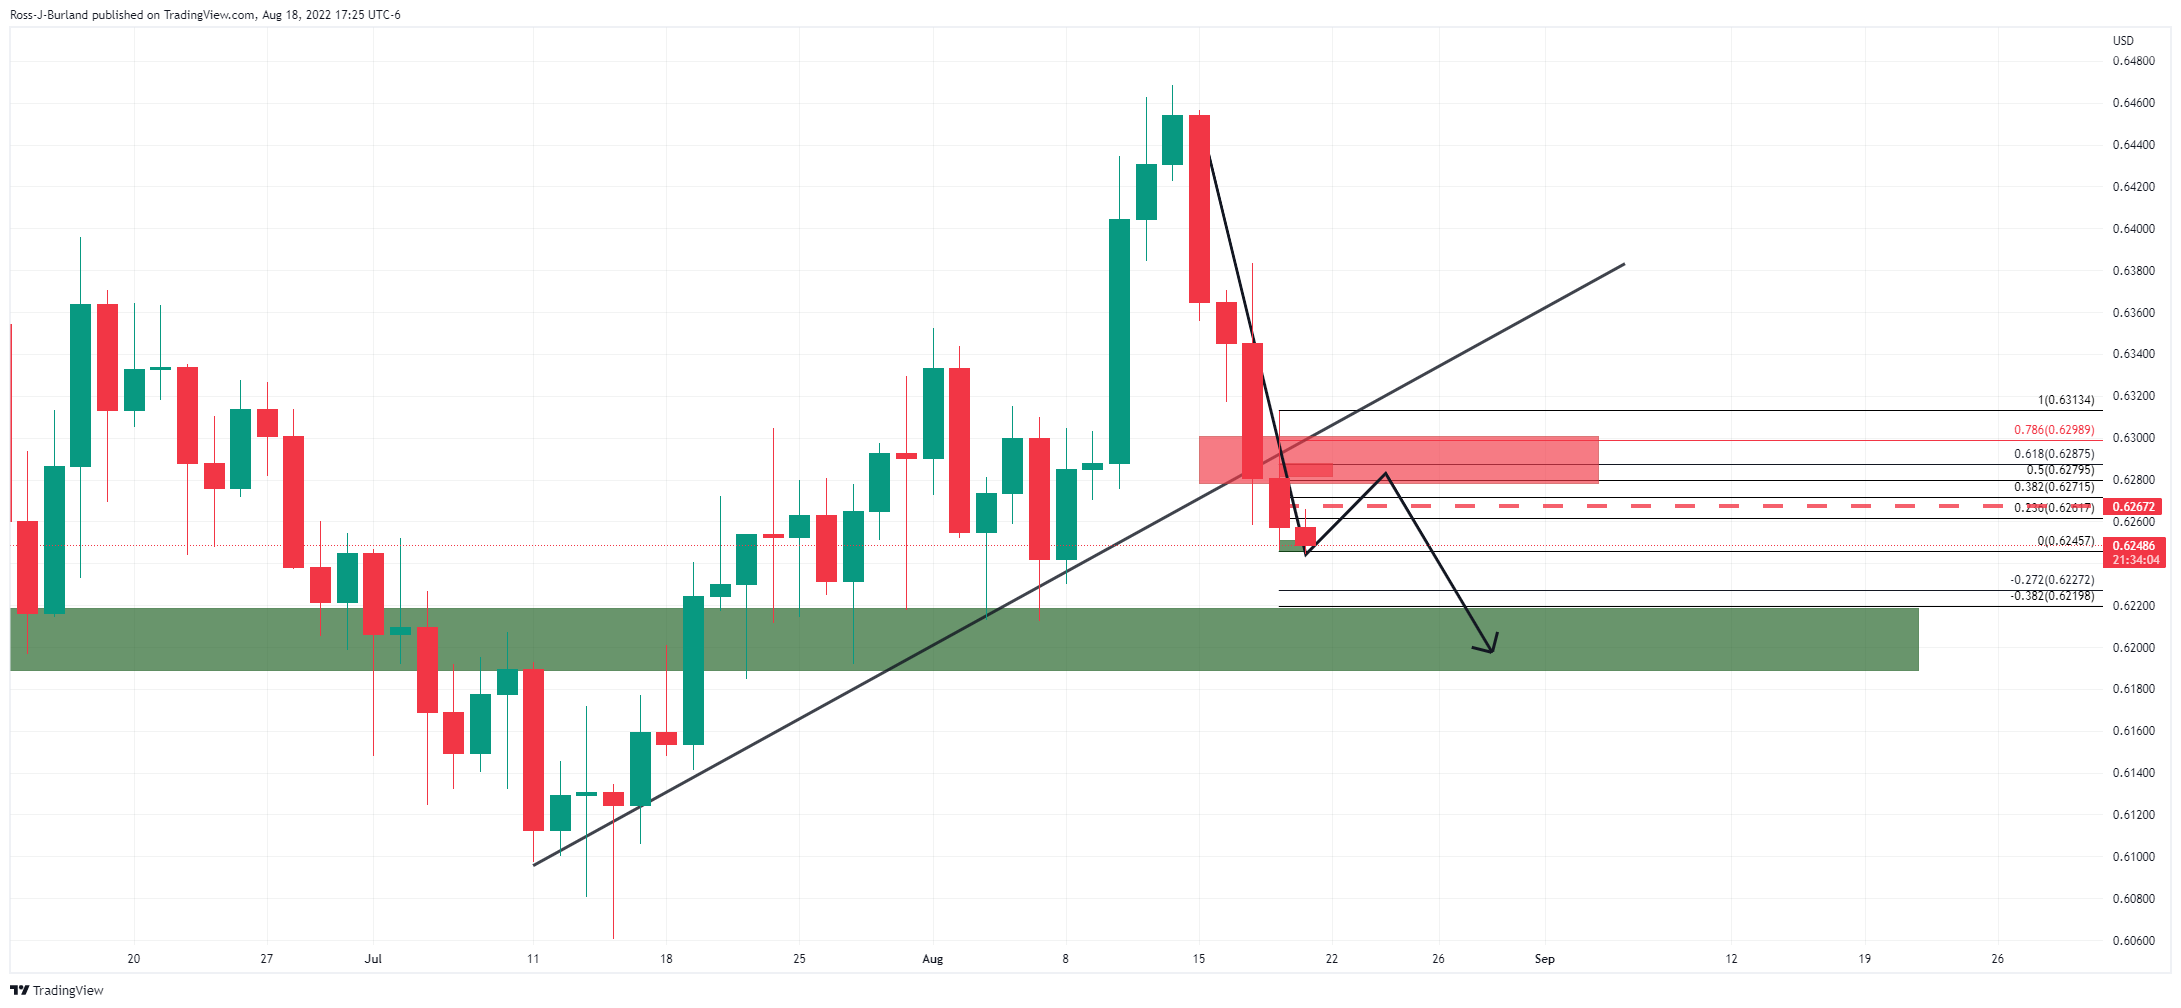
The daily chart shows that the price has broken below the trendline and a reversion could be on the cards for the day ahead. The support area, however, could be seen first given the momentum of the price. With that being said, the US dollar could be on the verge of a bearish correction:
DXY H1 chart
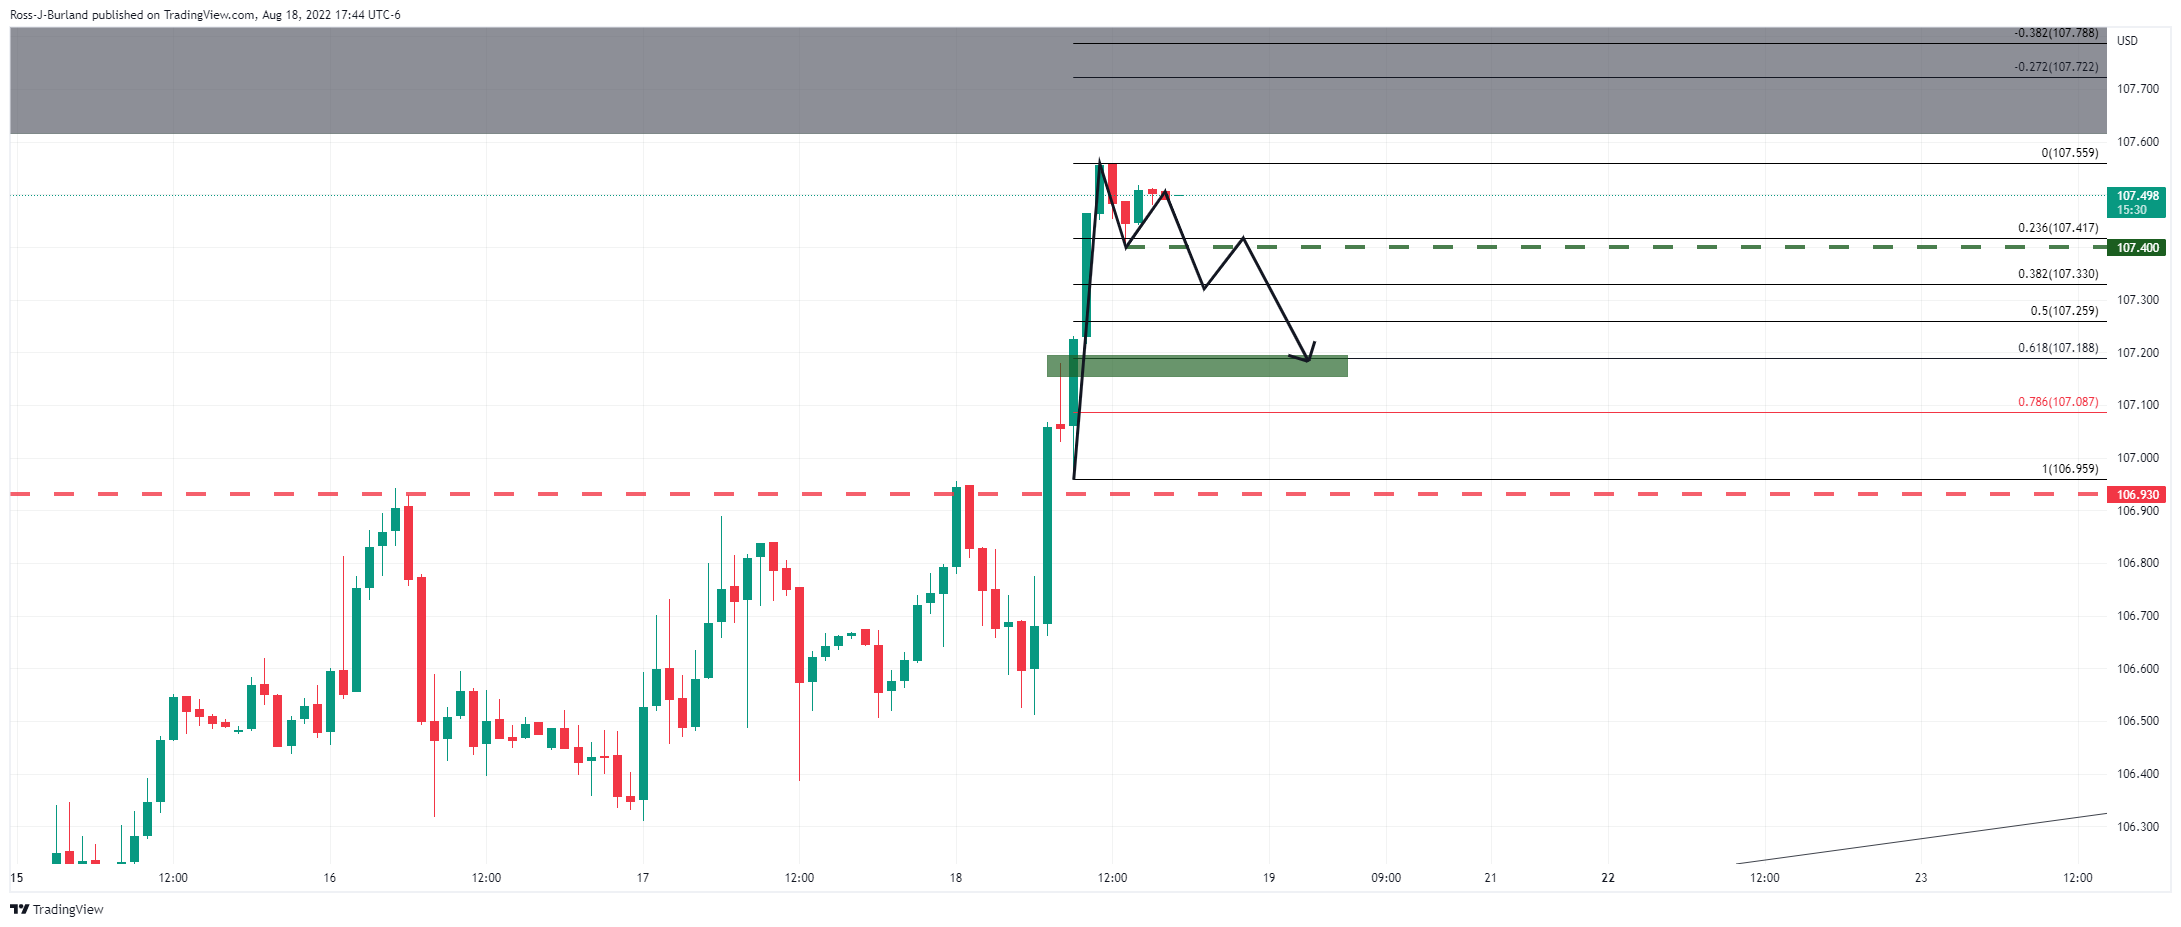
NZD/USD H1 chart
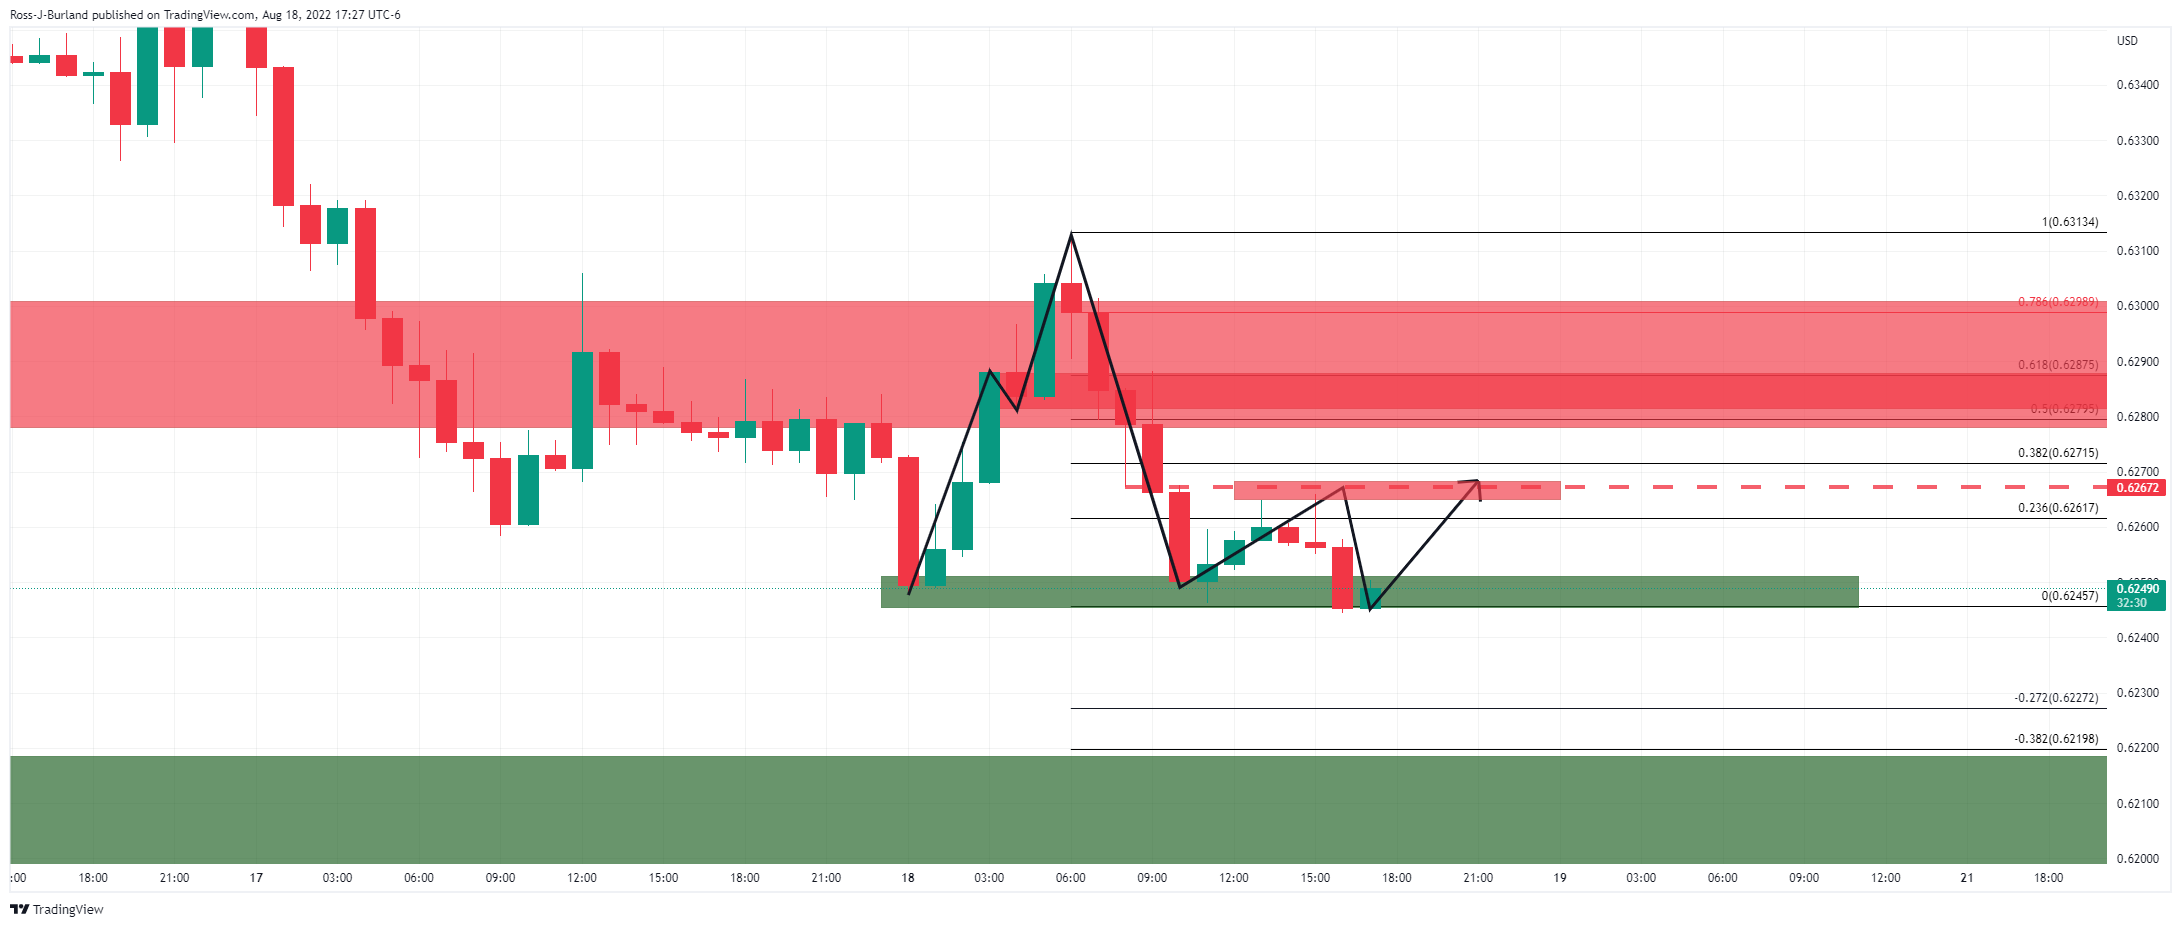
The M-formation is a reversion pattern that could see the price moved in towards the neckline, or at least for a higher correction.
NZD/USD 5-min chart
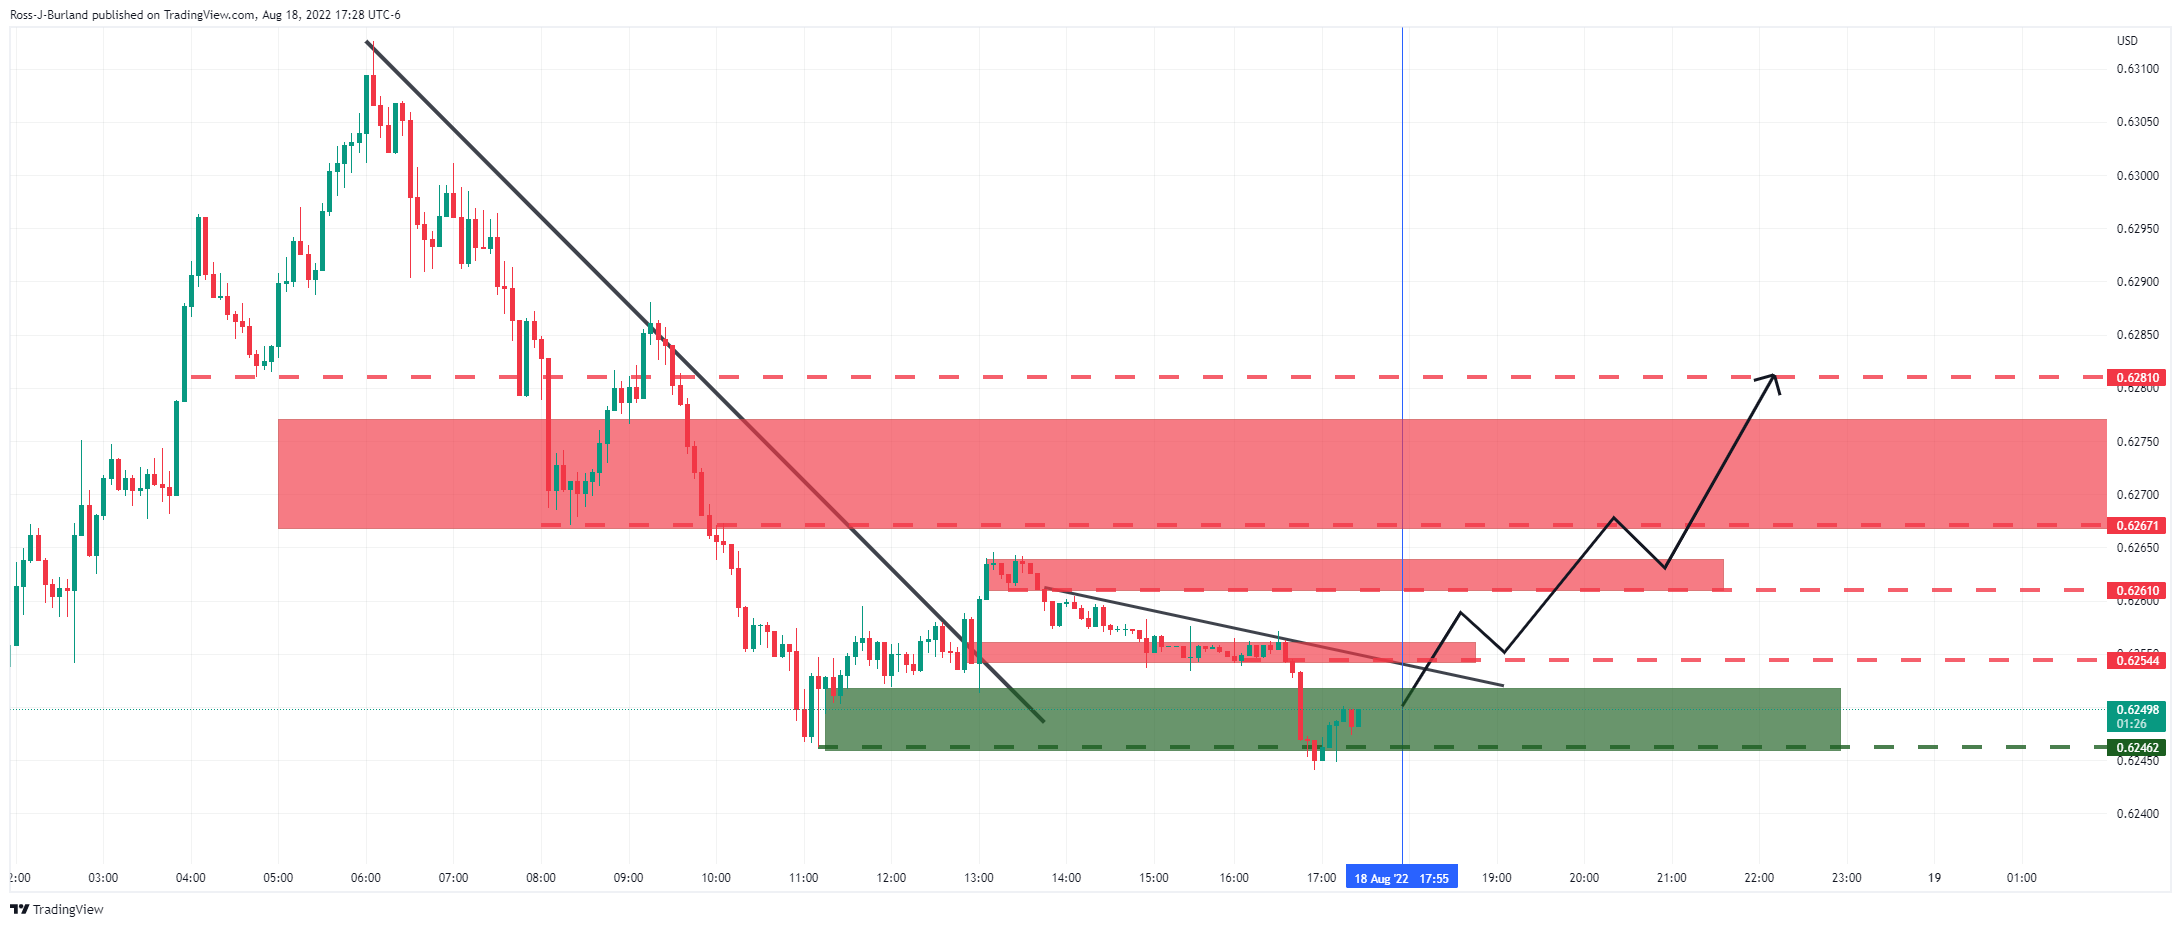
The price will not likely do anything until Tokyo and given the low volume overnight on Wall Street and the volatility, those trading the kiwi could be in for a bumpy and drawn-out ride. However, The 5-min chart's structures are illustrated above and should the bulls commit, then a correction could play out something along the lines of the above over the course of Friday.
- Silver price stumbles under the $20.00 figure, post-FOMC minutes.
- US economic data was mixed, though the labor market still signals the economy is solid.
- Fed officials remain committed to tackling inflation, though the US economic outlook remains unknown.
Silver price slides, extending its losses to five consecutive days, amidst an upbeat market mood, late in the Wall Street close, which weighed on the non-yielding metal. Additionally, broad US dollar strength kept the white metal prices pressured as a reaction to Fed officials reiterating the need to bring inflation down, while US jobs data further cemented the case for a September rate hike.
The XAG/USD is trading at $19.50, slightly down, after hitting on Thursday a daily high of $19.93.
Wall Street finished with solid gains amidst thin liquidity trading. The US Department of Labour reported that claims for unemployment in the week ending on August 13 slid less than estimations, while the housing market showed signs of cooling down. Existing Home Sales for July decreased by 5.9%, the lowest since May 2020.
Regarding Fed commentary, San Francisco’s Mary Daly said it is too early to declare victory on inflation and backed a 50 or 75 bps hike for September. Esther George of the Kansas City Fed added that core inflation is “hardly comforting” and that further rate hikes are coming.
Late in the day, the St. Louis Fed uber-hawk James Bullard commented that he’s leaning towards a 75 bps rate hike in September, while Minnesota Fed’s Neil Kashkari said there’s more work to be done while adding that he’s not sure if the Fed can avoid a recession.
Even though Kashkara acknowledged that he’s unsure about reaching the Fed’s goal without a recession, most officials remain laser-focused on tackling inflation. Meaning, that further rate hikes are expected for the rest of 2022 and probably the first half of 2023.
In the meantime, money market futures STIRs, have fully priced a 50 bps hike in September. But odds of a 75 bps increase are up at 78%, after tumbling towards 50% on Wednesday, following the release of July’s FOMC minutes.
Aside from this, the US Dolar Index, a measure of the greenback’s value against a basket of peers, reached three-week highs, gaining 0.77%, up at 107.492, a headwind for precious metals prices. On the contrary, most US Treasury bond yields, led by the 10-year benchmark note rate, edged down two basis points, at 2.886%.
That said, XAG/USD prices would remain downward pressured, due to the US Federal Reserve tightening cycle. If the US central bank can achieve a “soft” landing, silver traders should expect further selling pressure stepping in. Contrarily, if US economic growth decelerates and causes a recession, safe-haven flows could benefit the white metal.
Silver (XAG/USD) Key Technical Levels
- AUD/NZD holds onto the previous day’s bullish bias after New Zealand foreign trade numbers for July.
- Trade deficit widened on YoY but eased on MoM, Imports-Exports rose during July.
- Convergence of 100-SMA, three-week-old resistance line challenge bulls.
AUD/NZD bulls attack a short-term key hurdle surrounding 1.1070 on New Zealand’s mixed trade numbers for July, published early Friday. With this, the pair extends the previous day’s recovery moves amid a sluggish Asian session.
New Zealand Trade Balance dropped to $-11.64B YoY versus $-10.94B prior while improving on MoM to $-1092M from $-1102M previous readings. Further, Imports grew to $7.77B from $7.38B whereas Exports rose to $6.68B compared to $6.27B prior.
Technically, the pair pokes the convergence of the 100-SMA and a downward sloping resistance line from late July.
Given the recent highlight low on the RSI (14) backing the higher low on AUD/NZD prices, the quote is likely to remain firmer.
However, the weekly top surrounding 1.1085 acts as an extra upside filter for the pair buyers to watch before taking control. Following that, a run-up towards the monthly high near 1.1135 can’t be ruled out.
Alternatively, 61.8% and 78.6% Fibonacci retracement of June-July upside, respectively around 1.1040 and 1.10000, could challenge the AUD/NZD bears.
AUD/NZD: Four-hour chart
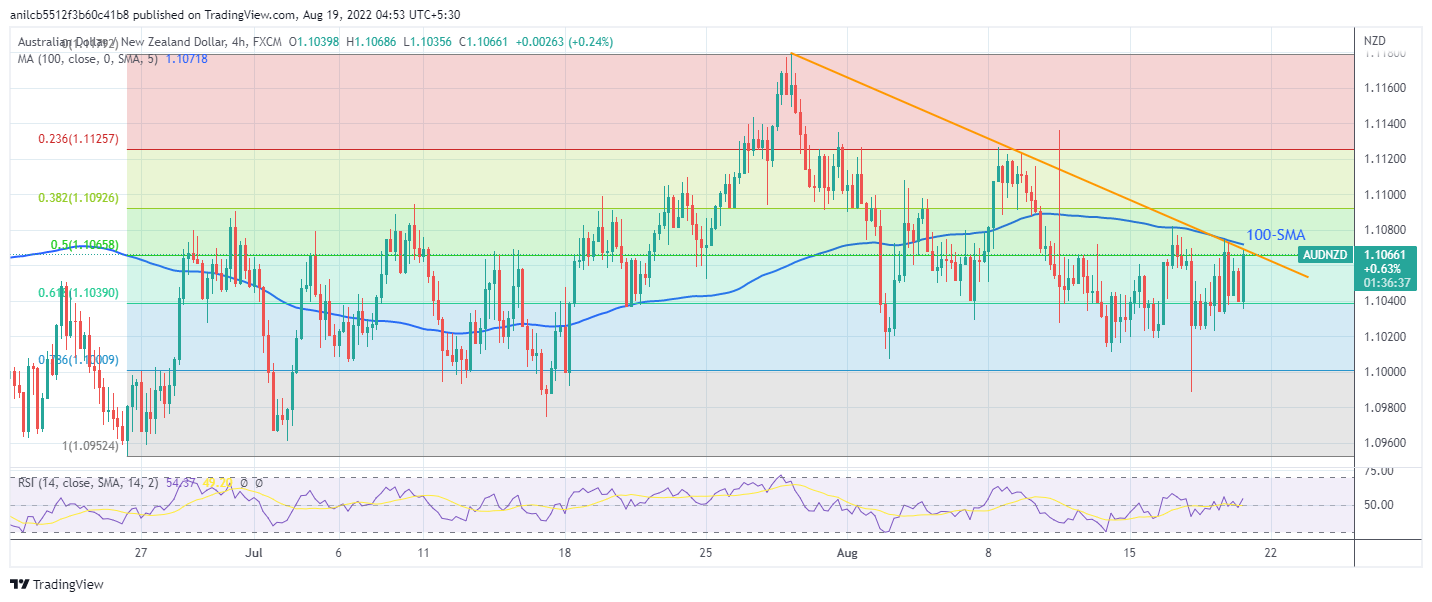
Trend: Further upside expected
- AUD/USD stays defensive around two-week low, after four-day downtrend.
- Fedspeak, firmer US data underpins DXY run-up to refresh monthly high.
- Downbeat Aussie Employment Change, fears surrounding China also favor bears.
- Light calendar at home and abroad keeps risk catalysts in the driver’s seat.
AUD/USD remains depressed at around 0.6910 during Friday’s initial Asian session, after refreshing a fortnight low during the four-day downtrend. That said, the Aussie pair’s latest weakness could be linked to the broad US dollar strength, as well as downbeat catalysts surrounding Australia and China, due to strong Aussie-China trade ties.
The greenback’s gauge versus the six major currencies, namely the US Dollar Index (DXY), rose to the highest levels in one month during the previous day as price-positive numbers from Philadelphia Fed Manufacturing Survey and the weekly Initial Jobless Claims rejected the US recession fears. The activity gauge rallied to 6.2 for August versus -5 expected and -12.3 prior while the weekly jobless claims dropped to 250K, below 265K market consensus and 252K revised prior.
In addition to the upbeat US data, hawkish Fedspeak also favored the DXY bulls. San Francisco Fed President Mary Daly mentioned that they (Fed) will continue to raise the rates to "right-size it." The policymaker added that either 50 basis points or a 75 basis points hike would be appropriate while signaling the move for the September rate decision. However, Minneapolis Federal Reserve Neel Kashkari mentioned that, per Reuters, he does not believe the county is currently in a recession. Further, the all-time hawk St. Louis Fed President James Bullard said he is leaning towards another 75 bps rate hike in September.
Elsewhere, economic fears surrounding China and Europe add strength to the US dollar’s safe-haven demand, as well as exert downside pressure on the AUD/USD prices. Goldman Sachs and Nomura both cut the dragon nation’s growth forecasts after witnessing the latest jump in the covid numbers. Also negatively impacting the Chinese economy are the doubts over the People’s Bank of China’s (PBOC) capacity to tame recession woes. Additionally, comments from the US Trade Representative’s office stating, “Early this autumn, the US and Taiwan will begin formal negotiations on a trade initiative,” seem to renew the fears of the US-China tussle and also roil the mood.
“The economic outlook for Germany, Europe's largest economy, is gloomy due to energy price rises and supply chain disruptions,” the German Finance Ministry said in its August monthly report, per Reuters.
It should be noted that Australia’s headline Employment Change surprised markets with a slump to -40.9K for July versus 25K expected and 88.4K prior while Unemployment Rate eased to 3.4% versus 3.5% expected and prior. Previously, Australia’s second quarter (Q2) Wage Price Index (Q2) also eased below market forecasts and marked downbeat real growth due to high inflation in Canberra.
Against this backdrop, Wall Street closed mixed while the US 10-year Treasury yields retreated from their monthly high.
Looking forward, AUD/USD traders should keep their eyes on the risk catalysts amid a light calendar.
Technical analysis
50-DMA joins multiple levels marked since early July to restrict AUD/USD downside around 0.6900, a break of which could extend the latest south-run towards 0.6760 before highlighting the yearly low of 0.6678 to the bears. Alternatively, corrective pullback remains elusive until crossing one-month-old previous support around 0.6890.
- Gold price stays pressured inside a bullish chart pattern after declining for four consecutive days.
- Mostly hawkish Fedspeak, fears surrounding China recession exert downside pressure.
- Firmer US data also helped XAU/USD bears to keep reins.
- A light calendar keeps risk catalysts in the driver’s seat and could help extend downside bias.
Gold price (XAU/USD) licks its wounds around a fortnight low near $1,760, flashed the previous day, as traders seek fresh clues inside a bullish chart pattern during Friday’s initial Asian session. That said, the precious metal dropped during the last four consecutive days amid the broad US dollar strength, mainly favored by the hawkish Fedspeak and the firmer US data, not to forget recession woes in China and Europe.
US Dollar Index (DXY) rose to the highest levels in one month during the previous day on price-positive numbers from Philadelphia Fed Manufacturing Survey and the weekly Initial Jobless Claims. That said, the activity gauge rallied to 6.2 for August versus -5 expected and -12.3 prior while the weekly jobless claims dropped to 250K, below 265K market consensus and 252K revised prior.
Elsewhere, San Francisco Fed President Mary Daly mentioned that they (Fed) will continue to raise the rates to "right-size it." The policymaker added that either 50 basis points or a 75 basis points hike would be appropriate, while signaling the move for the September rate decision. However, Minneapolis Federal Reserve Neel Kashkari mentioned that, per Reuters, he does not believe the county is currently in a recession. Further, the all-time hawk St. Louis Fed President James Bullard said he is leaning towards another 75 bps rate hike in September.
It should be noted that Goldman Sachs and Nomura both cut the dragon nation’s growth forecasts after witnessing the latest jump in the covid numbers. Also negatively impacting the Chinese economy are the doubts over the People’s Bank of China’s (PBOC) capacity to tame recession woes. Additionally, comments from the US Trade Representative’s office stating, “Early this autumn, the US and Taiwan will begin formal negotiations on a trade initiative,” seem to renew the fears of the US-China tussle and also roil the mood. Considering Beijing’s status as among the world’s top gold consumers, negatives for the nation weigh on the XAU/USD prices.
On a different page, "The economic outlook for Germany, Europe's largest economy, is gloomy due to energy price rises and supply chain disruptions," the German Finance Ministry said in its August monthly report, per Reuters.
Amid these plays, Wall Street closed mixed while the US 10-year Treasury yields retreated from their monthly high.
Looking forward, a lack of major data/events could help gold sellers to keep reins.
Technical analysis
Gold price holds lower ground near the support line of a one-week-old falling wedge bullish chart pattern.
Given the nearly oversold RSI conditions and the metal’s refrain to defy the wedge, by breaking below the support line figure of $1,754, XAU/USD price may remain doubtful for further declines.
Even if the quote drops below $1,754, the 200-SMA level of $1,750 could act as an extra challenge for the metal bears.
Meanwhile, upside clearance of the $1,769 will confirm the bullish chart pattern, which in turn (theoretically) suggests a run-up towards $1,820. However, the 50-SMA and the monthly high, respectively around $1,782 and $1,808, could challenge the gold buyers in between.
Gold: Four-hour chart
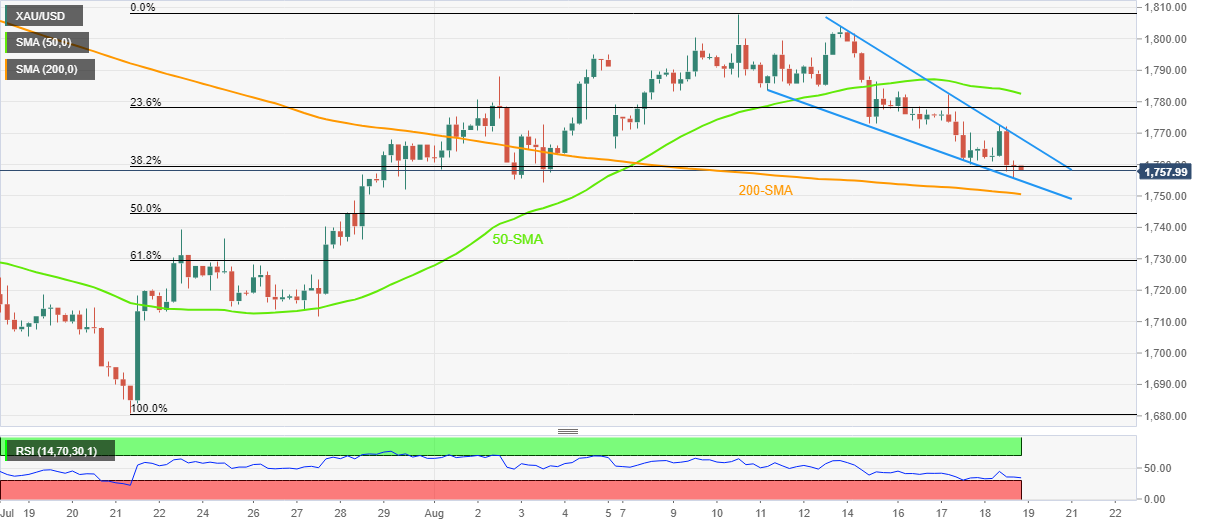
Trend: Limited downside expected
- The GBP/JPY snapped two days of losses and erased Wednesday’s gains on Thursday.
- In the near term, the GBP/JPY hourly chart formed a head-and-shoulders chart pattern, targeting 161.00.
On Thursday, the GBP/JPY finished the session in the red after hitting a daily high at 163.24 but tumbled towards the 162.10s region due to a shift in sentiment. As the Asian Pacific session begins, the GBP/JPY edges slightly up, trading at 162.10 at the time of writing.
Wall Street closed Thursday’s session in the green, erasing earlier losses. Asian equity futures are mixed, while in the FX space, the British pound is the laggard, while the yen position is slightly better than its British counterpart.
GBP/JPY Price Analysis: Technical outlook
Reviewing the daily chart, the GBP/JPY is still neutral-biased. On Thursday, the GBP/JPY failure to decisively break above the 100-day EMA exacerbated a fall from above 163.00s to current price levels, meaning sellers regained control.
If GBP/JPY sellers decisively break below August’s 18 low at 161.68, that could pave the way for further downside. On the flip side, a break above the 20-day EMA at 162.65 could send the pair rallying towards the 100-day EMA at 163.69.
Zooming into the one-hour scale, the GBP/JPY formed a head-and-shoulders chart pattern, meaning further downside pressure is expected. Nevertheless, a break above 162,37 would negate the chart pattern.
The GBP/JPY first support would be the 100-hour EMA at 161.96. A breach of the latter will expose the August 17 low at 161.68, followed by the S1 daily pivot at 161,41, before hitting the head-and-shoulders pattern at 161.00.
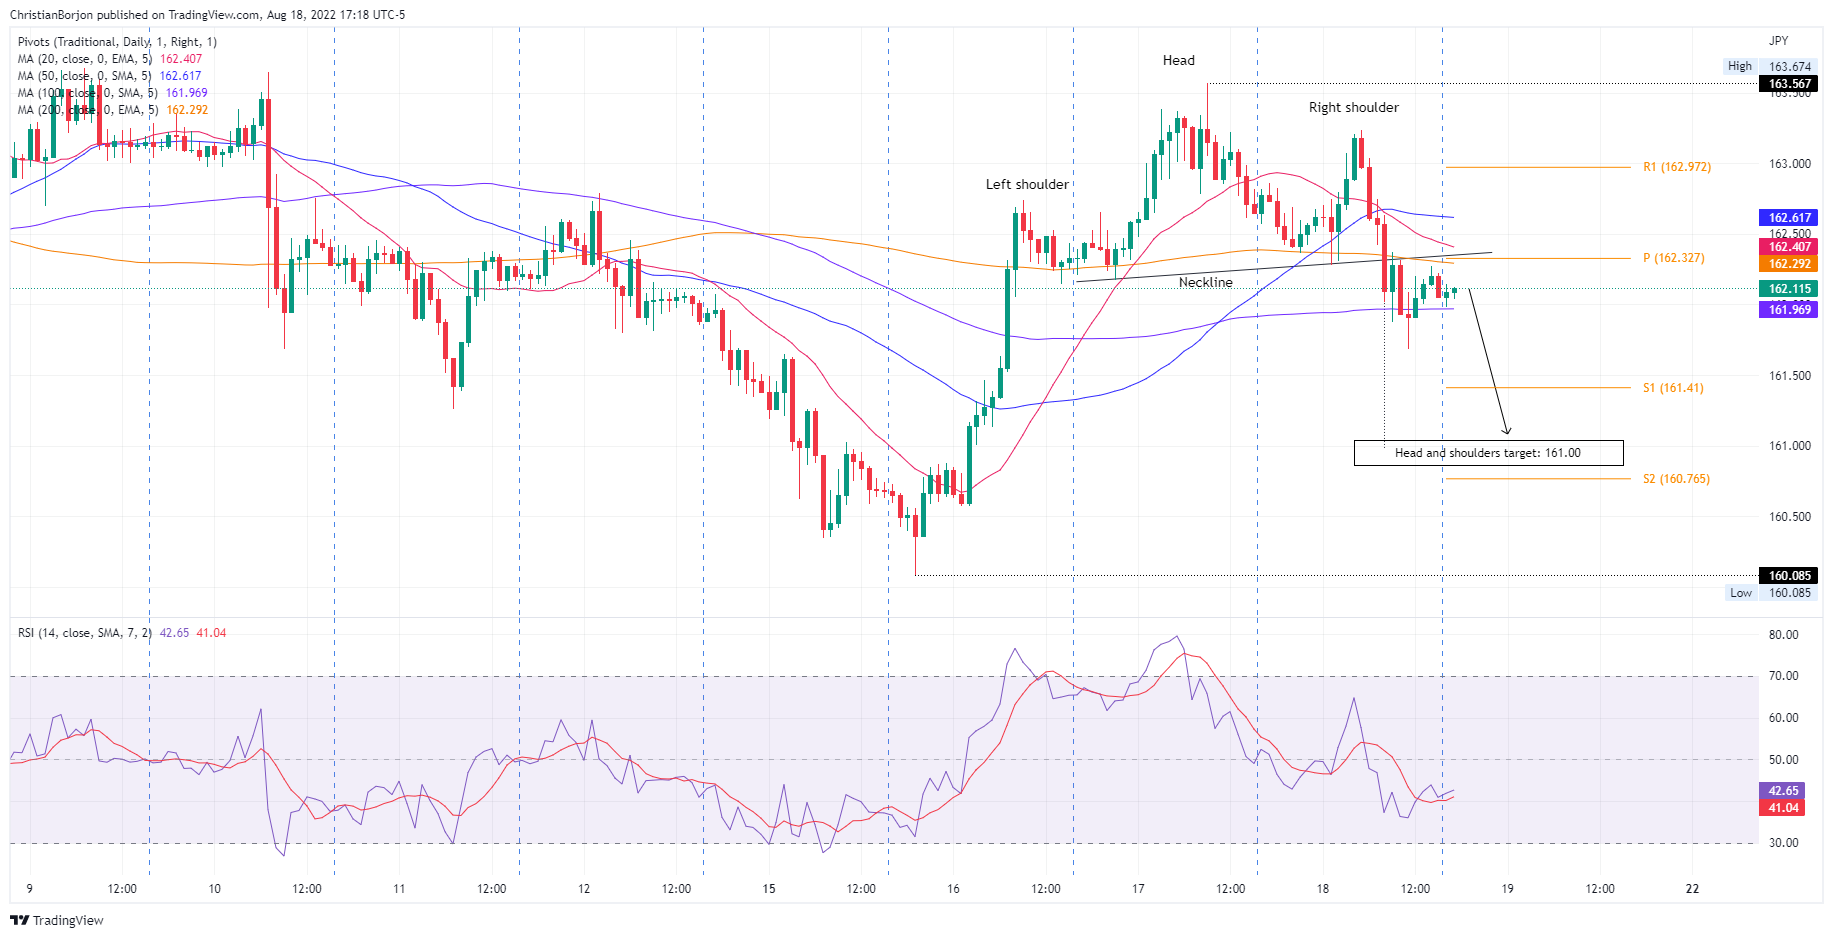
GBP/JPY Hourly chart
GBP/JPY Key Technical Levels
“Chinese banks will likely trim their benchmark loan prime rates Monday for the first time in months to help spur borrowing demand and reverse a sharp slump in consumer and business sentiment,” per Bloomberg’s latest survey published on late Thursday.
Key findings
The one-year loan prime rate -- the de facto benchmark lending rate for banks --is expected to be cut by 10 basis points to 3.6%, according to all 16 economists polled by Bloomberg. That would be the first reduction in that rate since January.
Economists are more divided on the five-year LPR, a reference for mortgage costs. The median estimate is for a 10-basis point reduction to 4.35%, though six of the 16 economists expect that rate to be trimmed by an even larger margin of 15 points. Lenders last reduced the long-term loan rate in May by 15 basis points, a record.
Some economists have warned of a 'liquidity trap' in China, where low interest rates fail to spur lending in the economy, given very weak consumer and business confidence levels.
Even with the recent policy rate cut and moves by banks to spur lending, economists have warned the country will need to do more to bolster growth in the months ahead, including boosting fiscal policy.
Economists have been downgrading their gross domestic product forecasts further below 4% as Covid Zero and the mortgage crisis batter the economy.
The economic outlook for Germany, Europe's largest economy, is gloomy due to energy price rises and supply chain disruptions, the Finance Ministry said in its August monthly report, published on Friday, reported Reuters.
Key statements
The outlook for the further development (of the economy) is currently noticeably gloomy, marked by ‘a high degree of uncertainty’.
The significantly lower gas supplies from Russia, the persistently high price increases for energy and, increasingly, other goods, as well as the longer-than-expected supply chain disruptions, also in connection with China's zero-COVID policy, are weighing heavily on the economy's development.
The government will present updated economic projections on Oct. 12.
Market reaction
Given the early Asian session’s inaction, EUR/USD fails to react to the news and was last seen around the one-month low flashed the previous day, at 1.0900 by the press time.
- The EUR/USD breached the 1.0100 mark; a daily close below 1.0096 paves the way towards parity.
- In the near term, the EUR/USD could print a leg-up towards 1.0120-30, before re-testing parity.
The EUR/USD slides below the 1.0100 figure for the first time since July 27, as EUR sellers eye a daily close below 1.0096, which could pave the way for a re-test of the pair’s parity. At the time of writing, the EUR/USD is trading at 1.0089, well below its opening price, after reaching a daily high of 1.0184.
EUR/USD Price Analysis: Technical outlook
Since the beginning of the week, the EUR/USD began its free fall, from around 1.0268, exacerbated by the release of important US economic data. That, alongside the release of the FOMC minutes, were the reasons for initial EUR weakness. Nevertheless, buyers hold the fort around 1.0100 before giving way to EUR/USD sellers.
On Thursday, the EUR/USD broke below the July 27 daily low at 1.0096, positioning sellers before launching an assault towards parity. The Relative Strength Index (RSI) at 39.65, pointing downwards, provides enough room for sellers before reaching oversold conditions.
Therefore, the EUR/USD’s next support would be July’s 8 daily low at 1.0078. Once cleared, there’s nothing in the way for a re-test of 1.0000, followed by the YTD low at 0.9952.
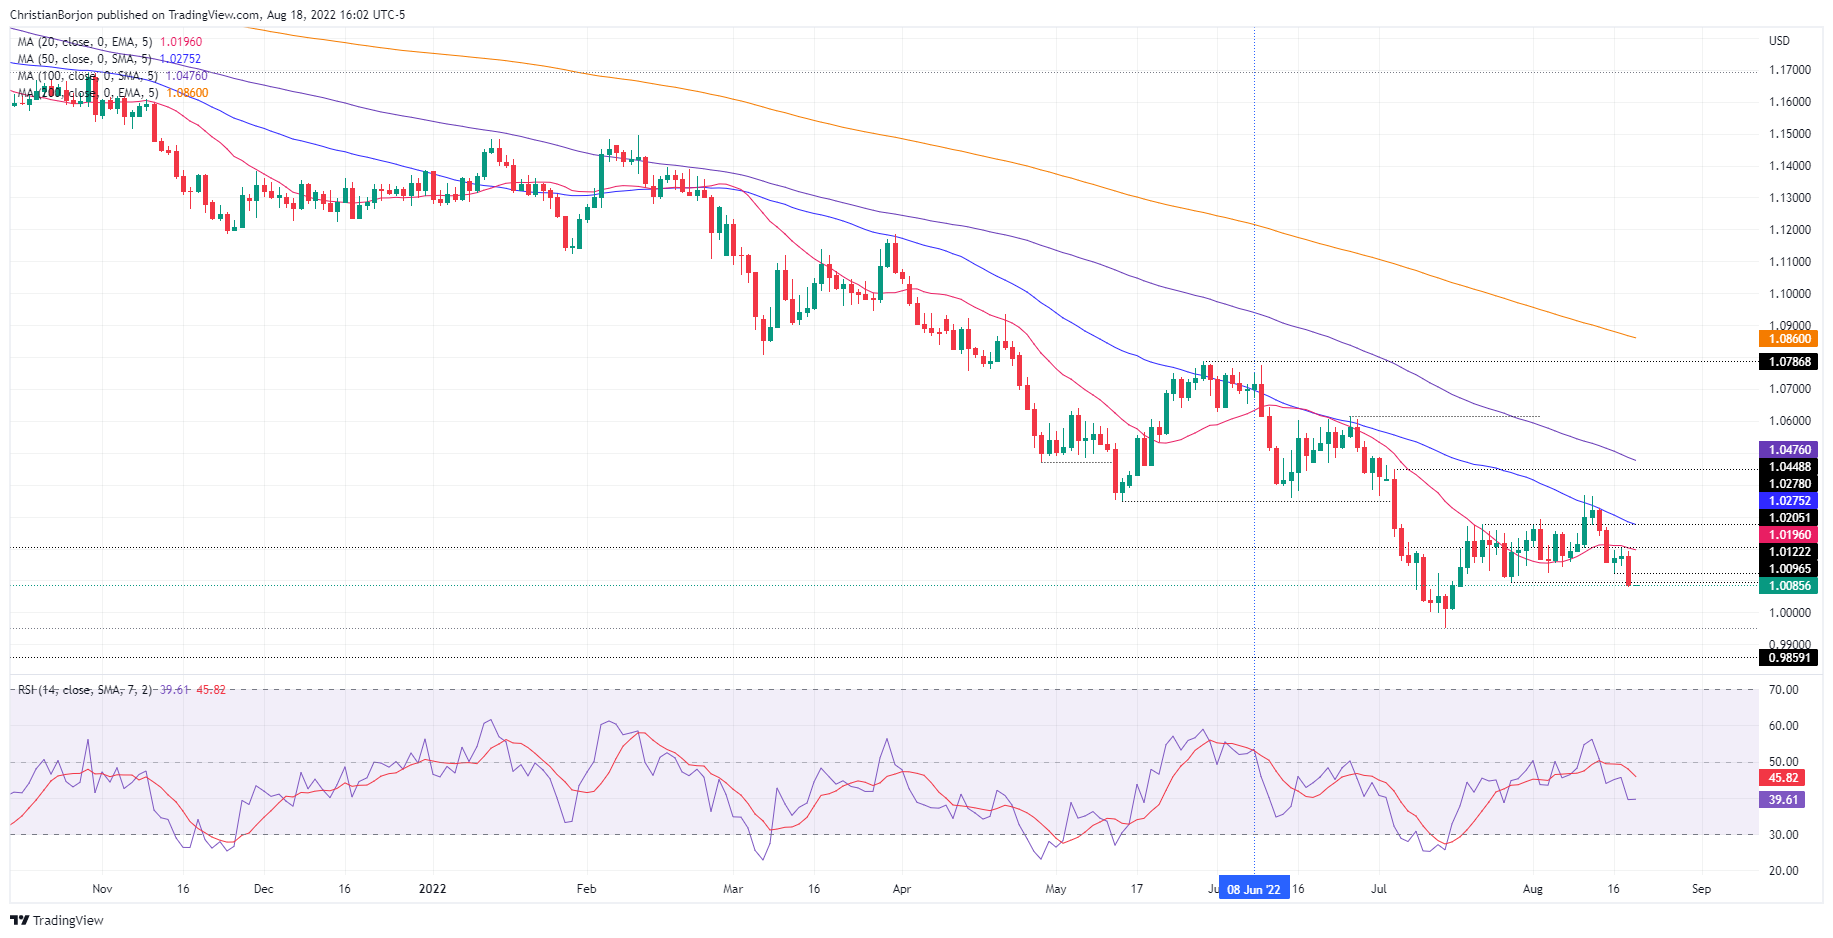 EUR/USD Daily chart
In the one-hour scale, the EUR/USD is also downward biased, but the Relative Strength Index (RSI) at oversold territory might suggest the pair can print a leg-up before resuming the downtrend. If the EUR/USD jumps above the 1.0099 intraday swing high, that could exacerbate a move towards August’s 16 low at 1.0122 or to the 50% Fibonacci retracement at 1.0133. Once that’s said and done, a fall towards 1.0000 is on the cards.
EUR/USD Hourly chart
EUR/USD Key Technical Levels
- GBP/USD short-term time frame bulls are moving in and the focus is on a bullish correction.
- The daily chart, however, offers the prospects of a lower low for the day ahead.
GBP/USD is under pressure following a resurgence in the US dollar and the following illustrates the volatility seen around the Federal Open Market Committee minutes with two-way business around the 24-hour forex session on Thursday.
In the prior analysis, GBP/USD bulls correcting the price towards 1.2050 into the FOMC minutes, it was noted that the bulls were in play with eyes on a move higher in order to restest resistance and mitigate price imbalances on the hourly and 15-min charts respectively, and as follows:
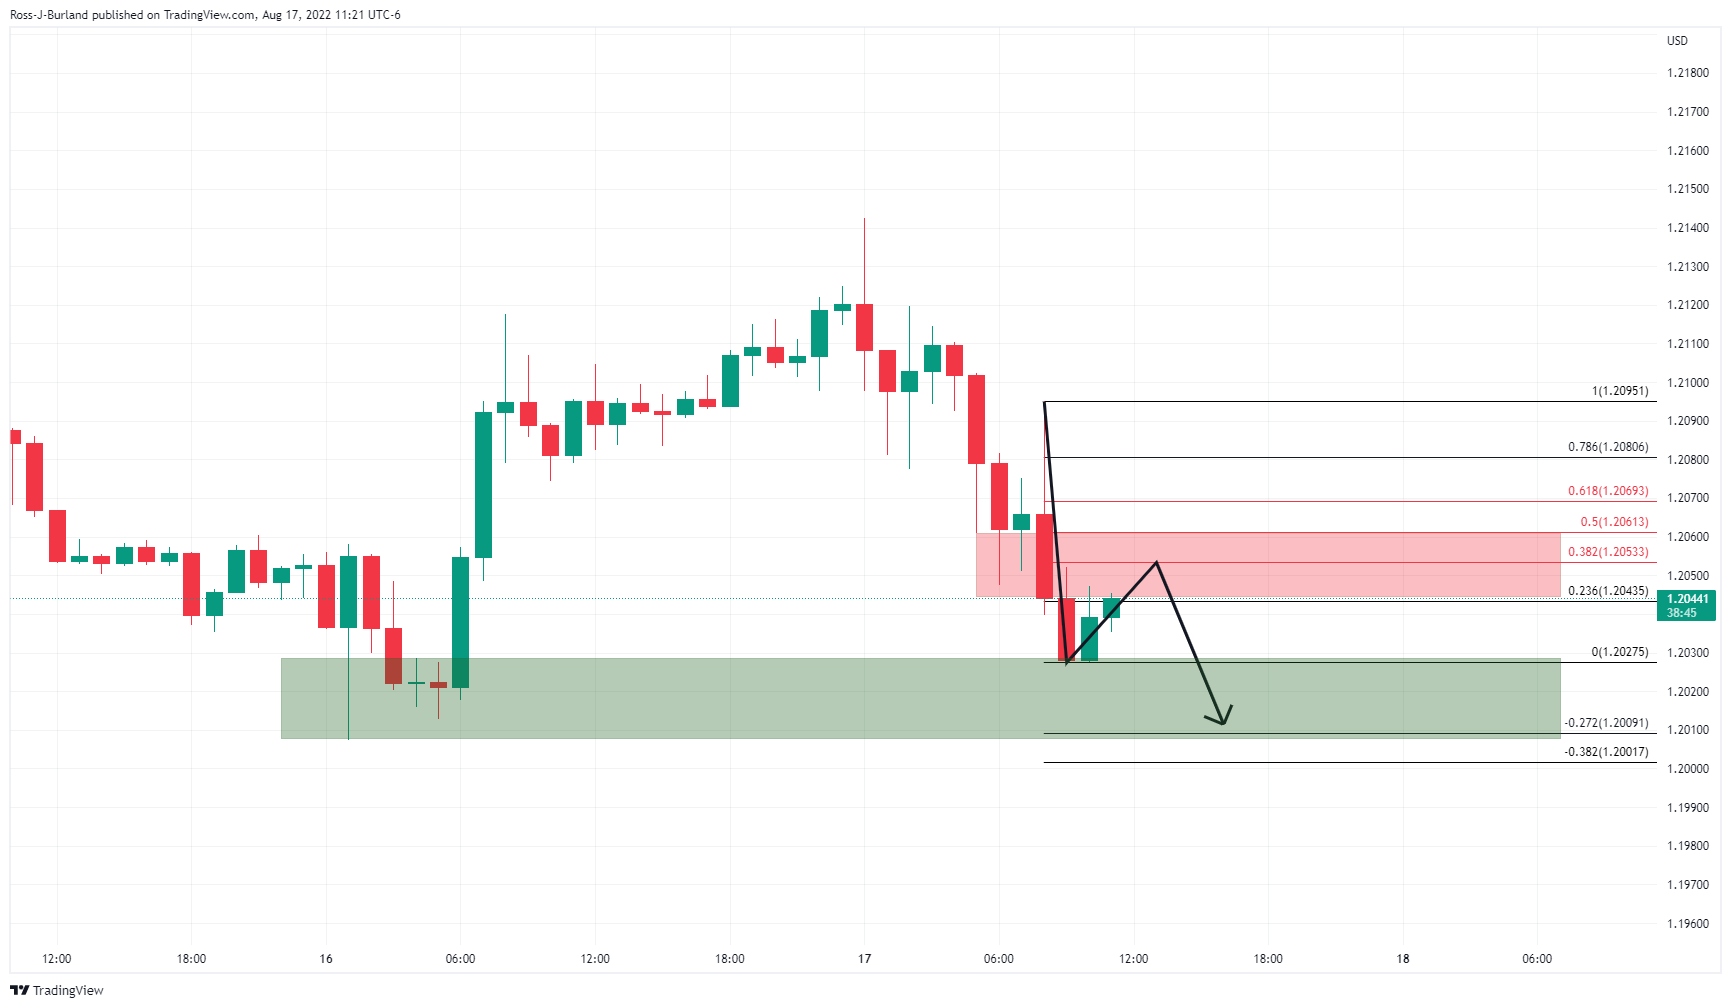
It was stated that the hourly chart, above, showed that the price could have been on the verge of a downside extension. However, it was also noted that it was in a corrective phase at the time of writing. The 15-minute charts identified areas of price imbalances, as per the greyed-out areas below:
This left a 38.2% ratio and the 50% mean reversion level vulnerable in and around the FOMC minutes.
GBP/USD live market
The price corrected higher, but the volatility and lack of structure have been a tricky one to navigate due to fake out after fakeout, at least on the hourly chart.
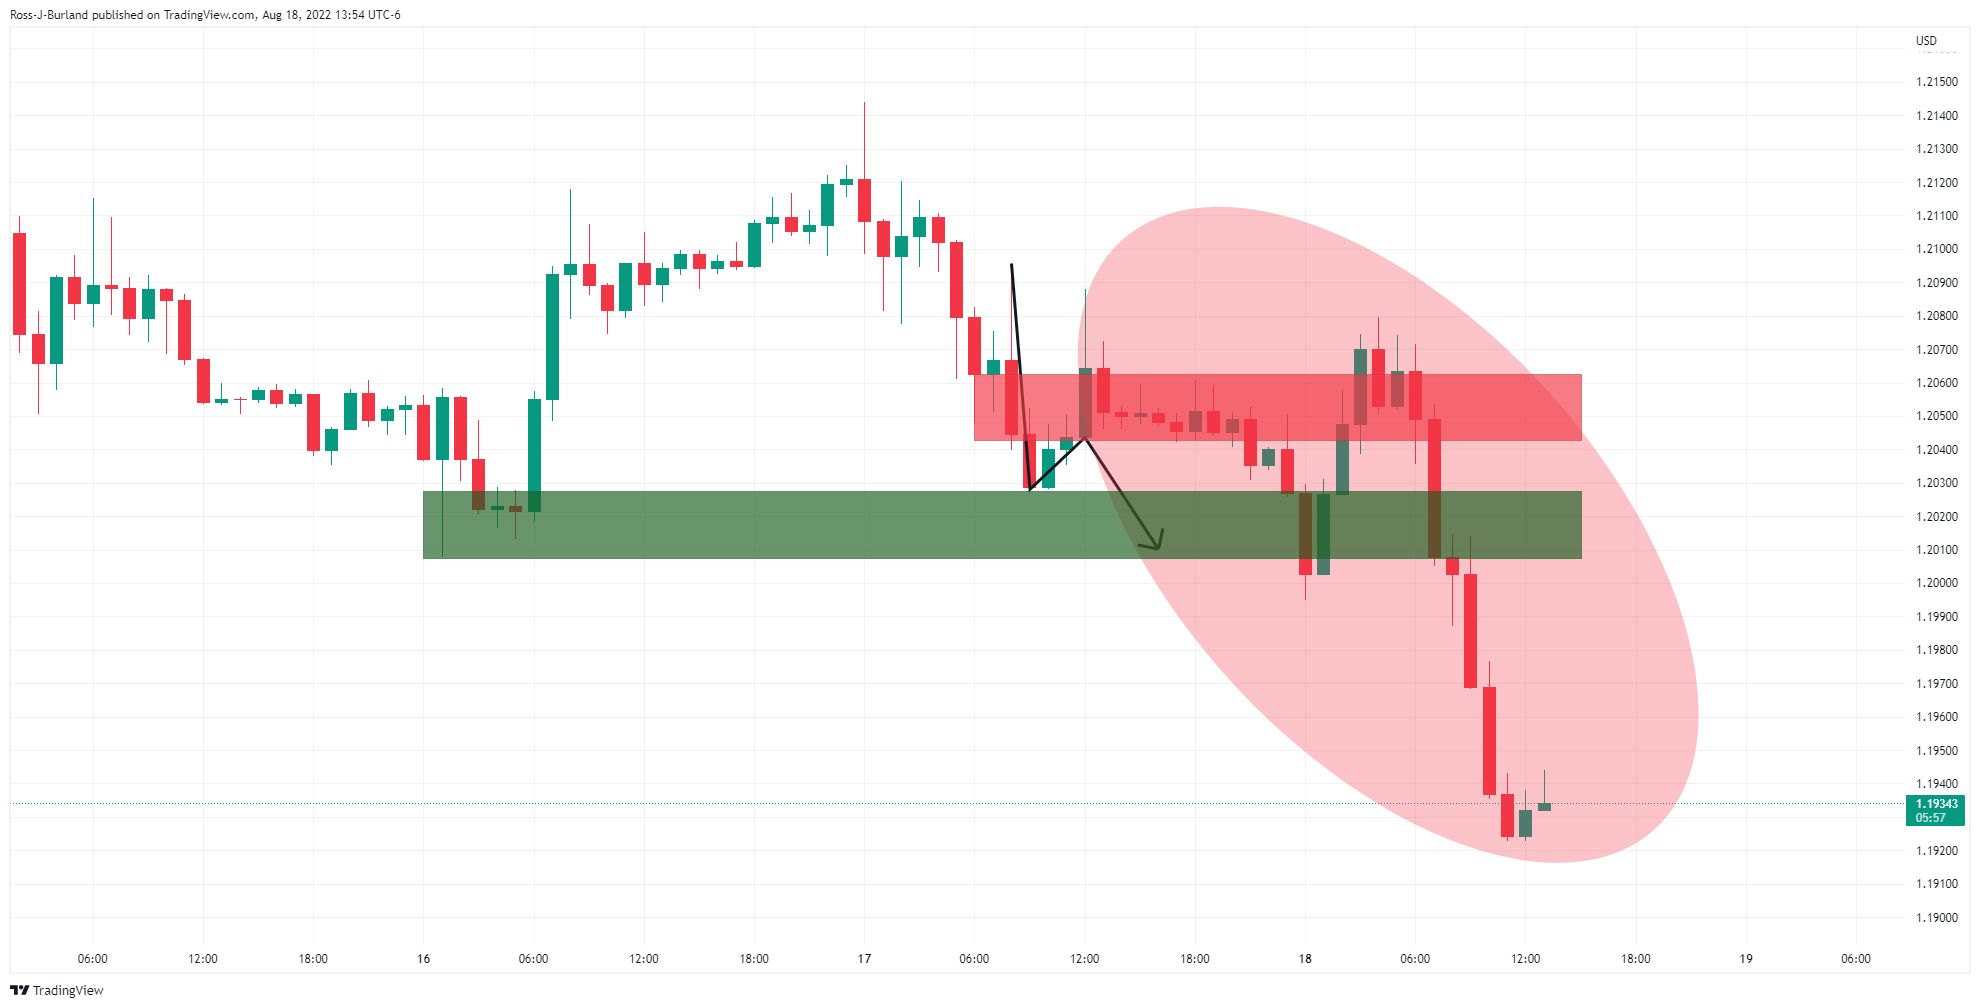
With that being said, the price is now starting to accumulate, so a potential reversion of the bearish impulse could be opening an opportunity for the day ahead. However, there is a caveat to this due to the prospects of a deeper move on the daily chart:
GBP/USD daily chart
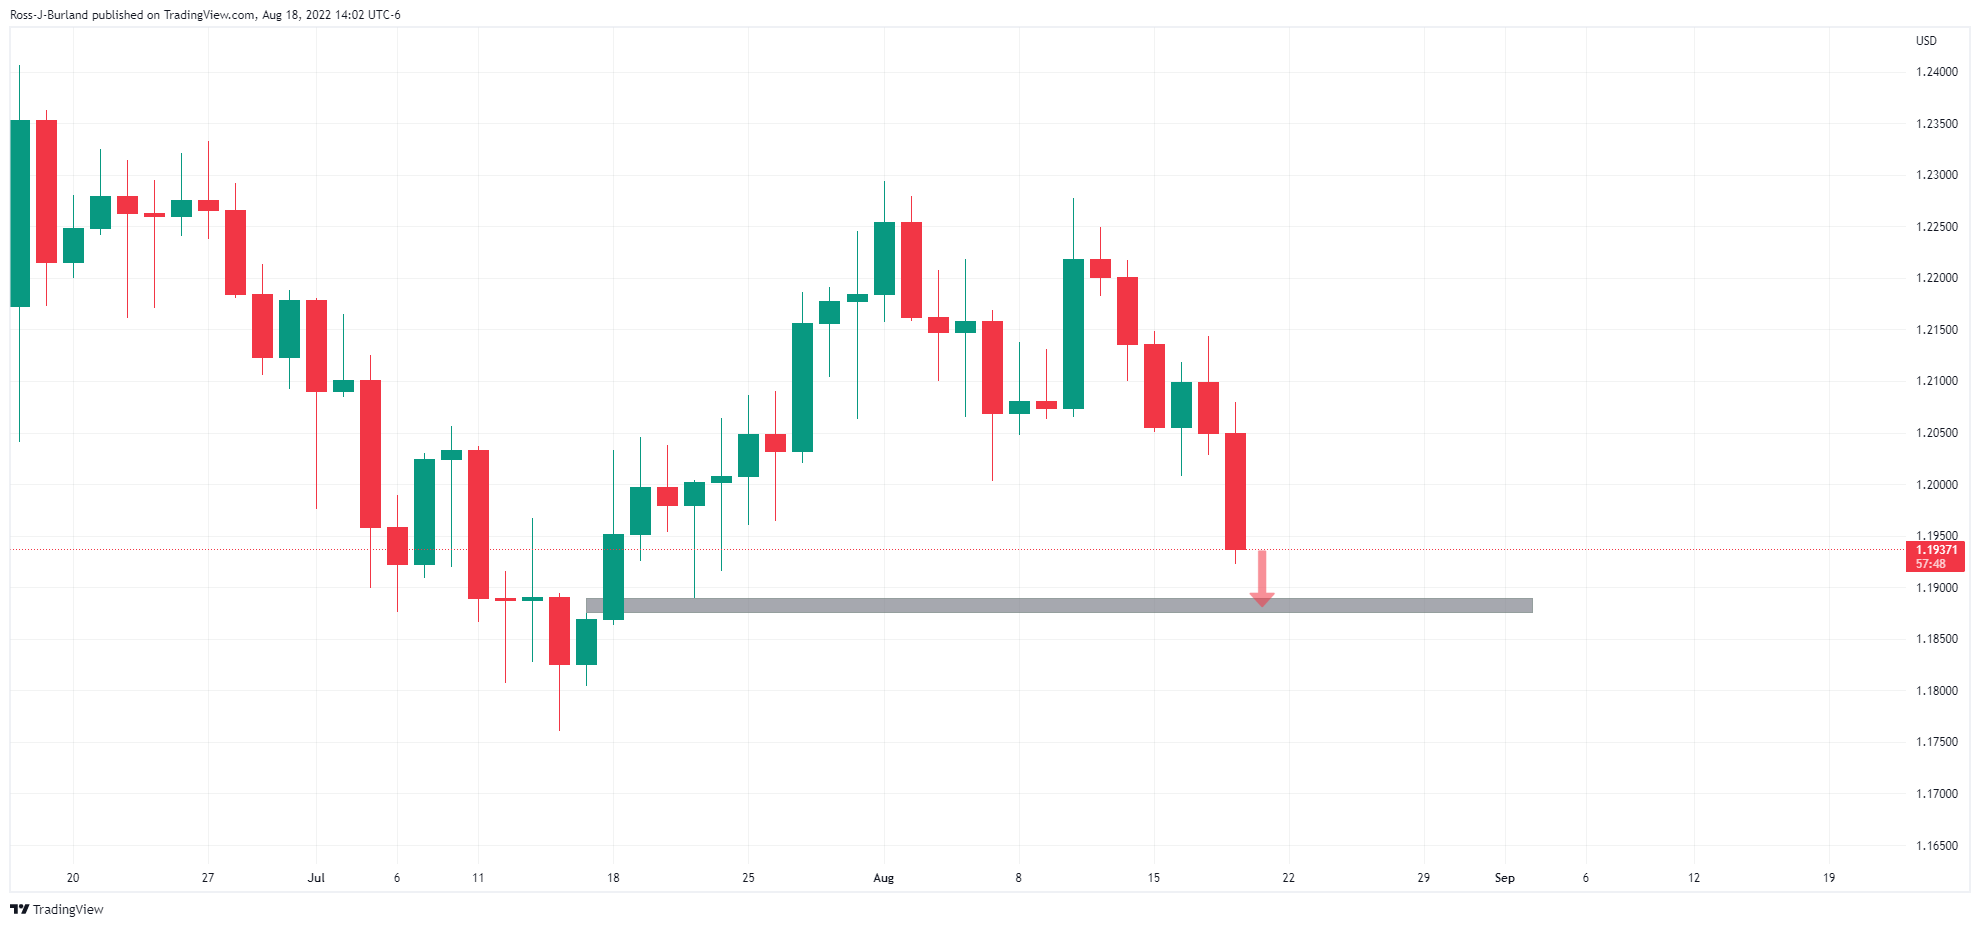
The bears could be on the verge of mitigation of the price imbalance between 1.1875 and 1.1889 which makes buying the dip on the lower time frames like trying to catch a falling knife.
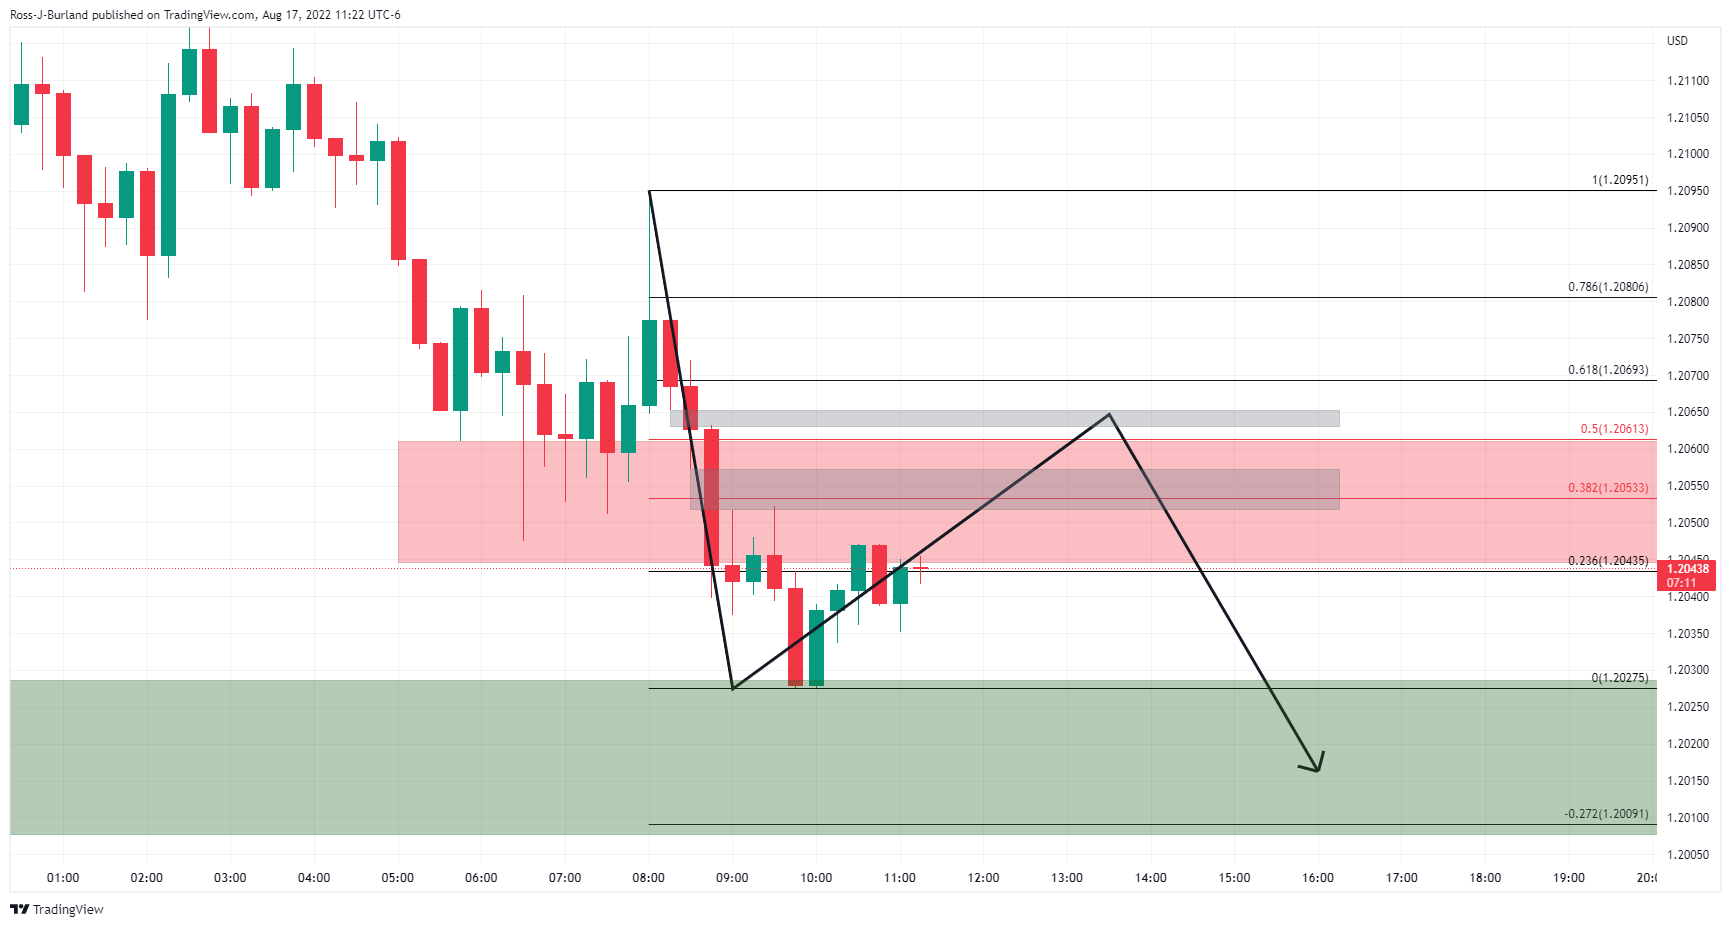
Nevertheless, should the minuite charts offer a bullish structure and opportunity, it could look something like as follows:
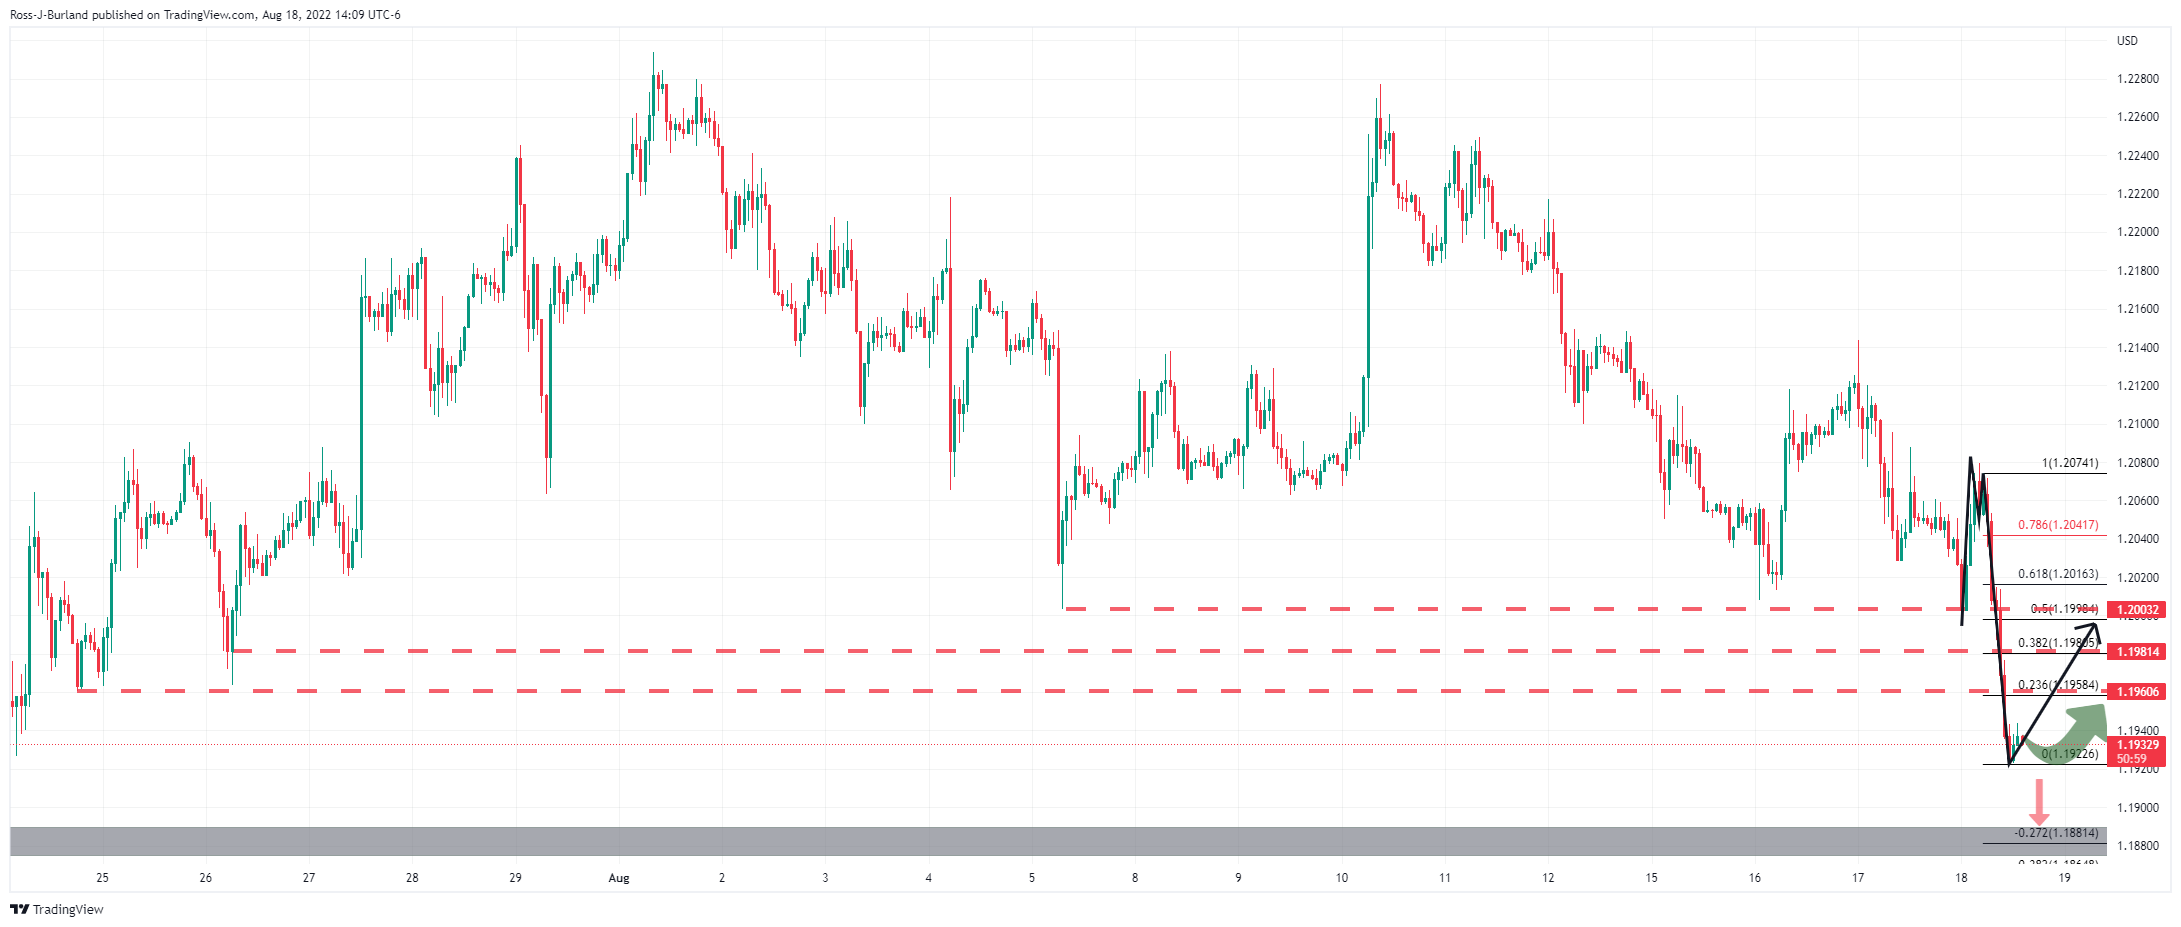
The hourly charts Fibonacci retracement scale aligns with prior structure areas as illustrated above and below, zoomed in:
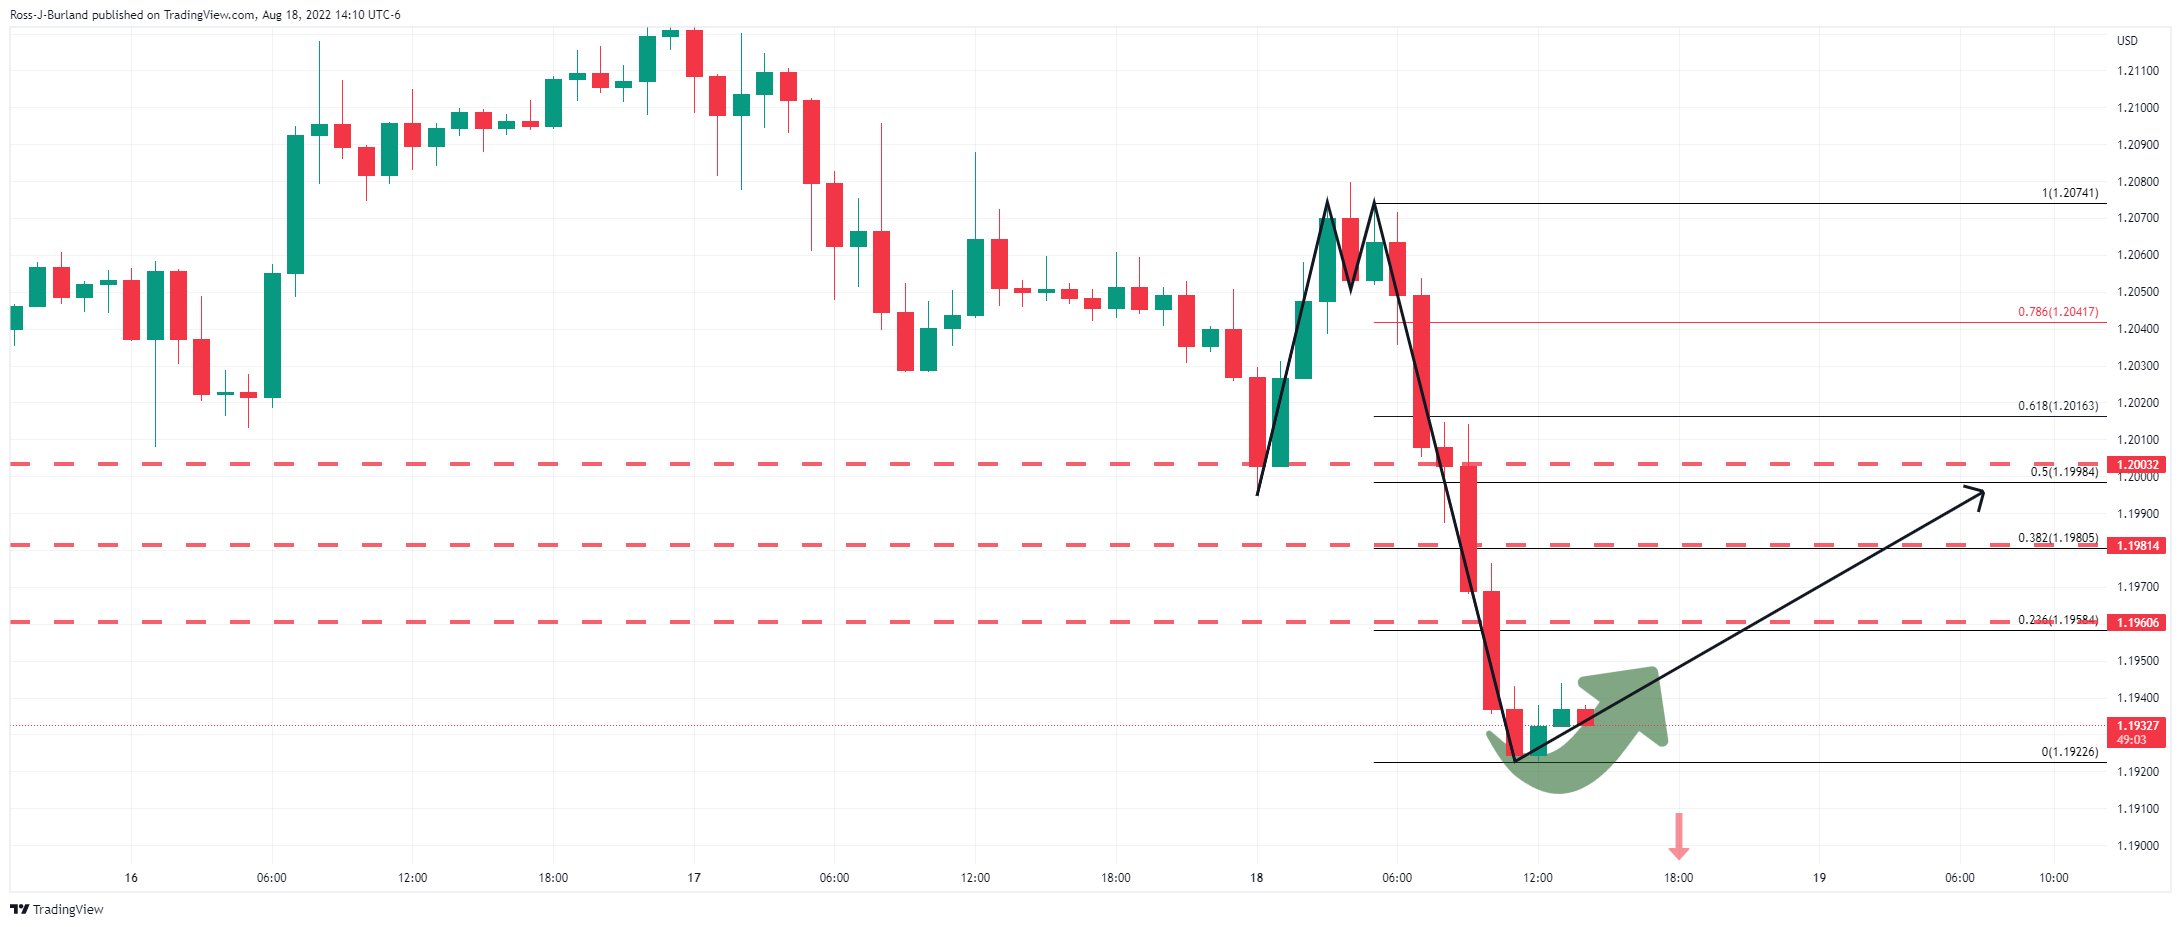
The M-formation is a reversion pattern, and the price would be expected to correct higher now that we have seen a deceleration of the supply. This gives rise to an opportunity to buy into the correction on lower time frames:
GBP/USD 15 & 5-min charts
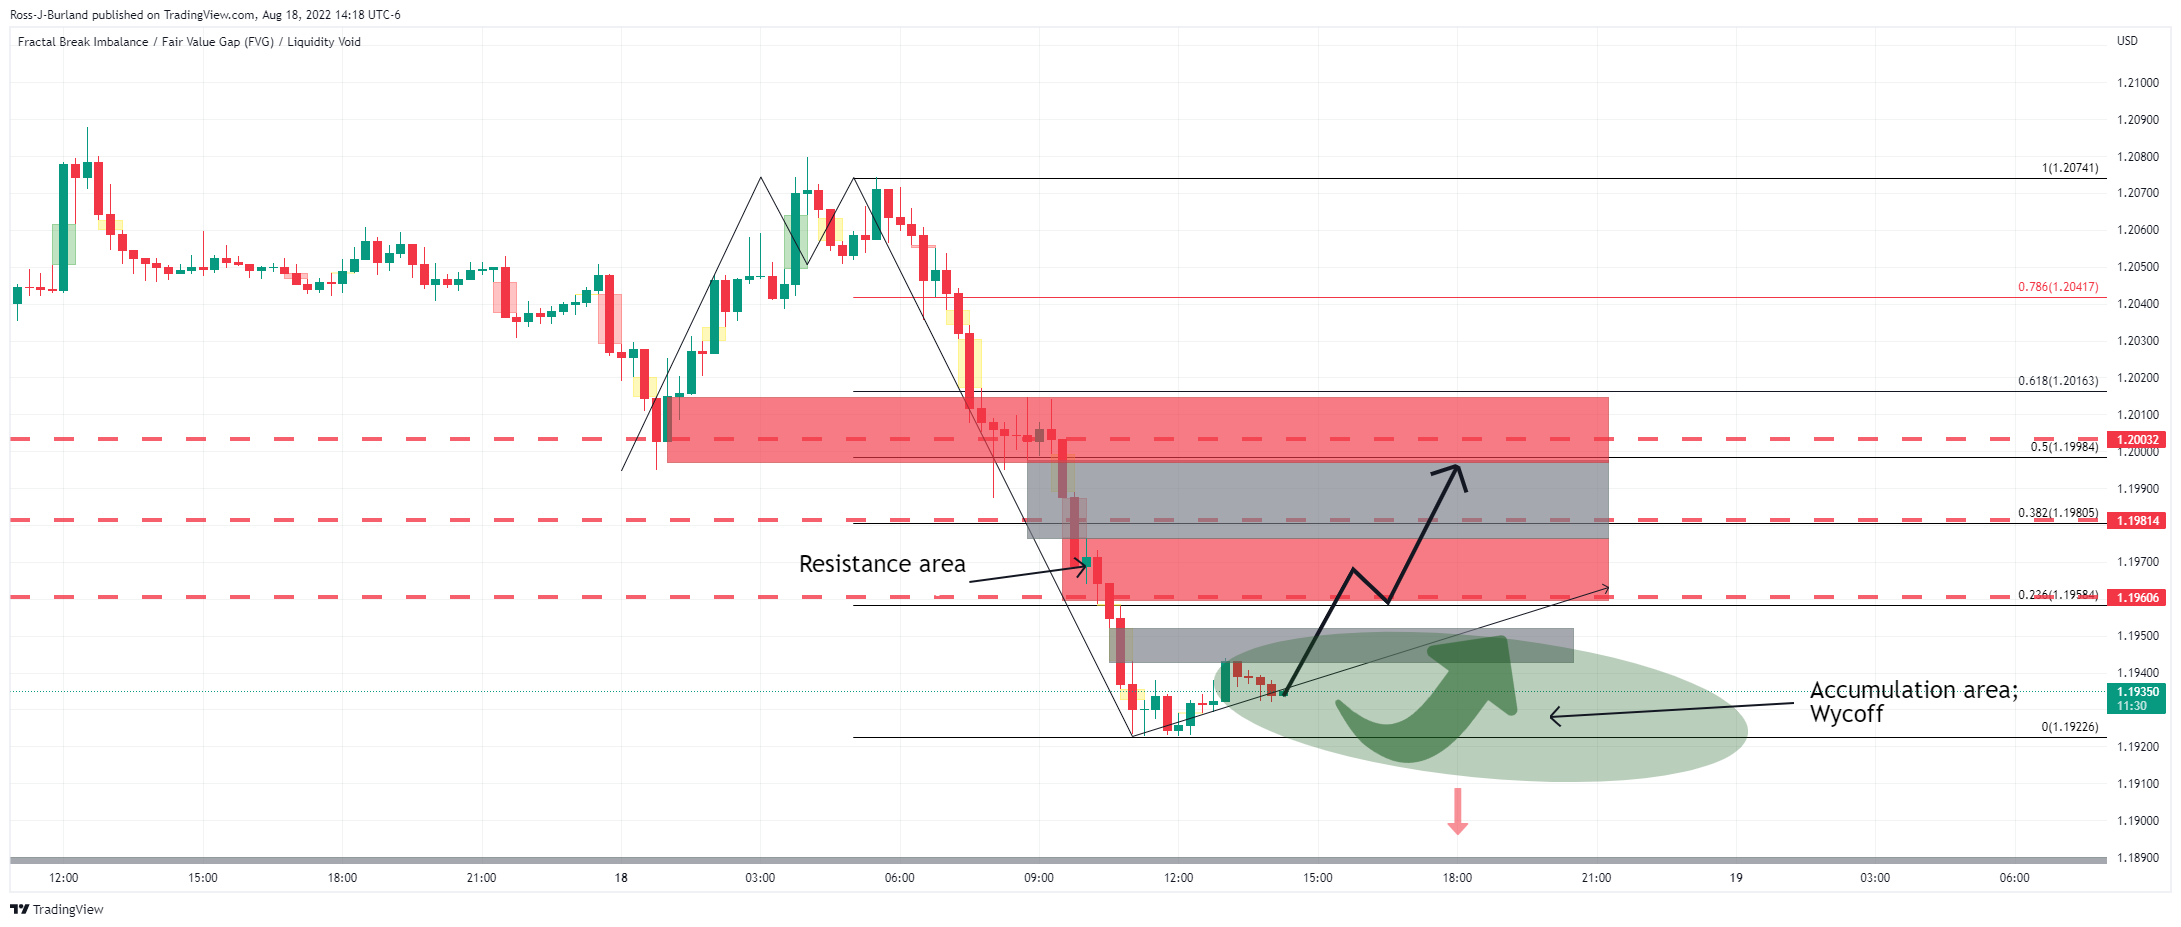
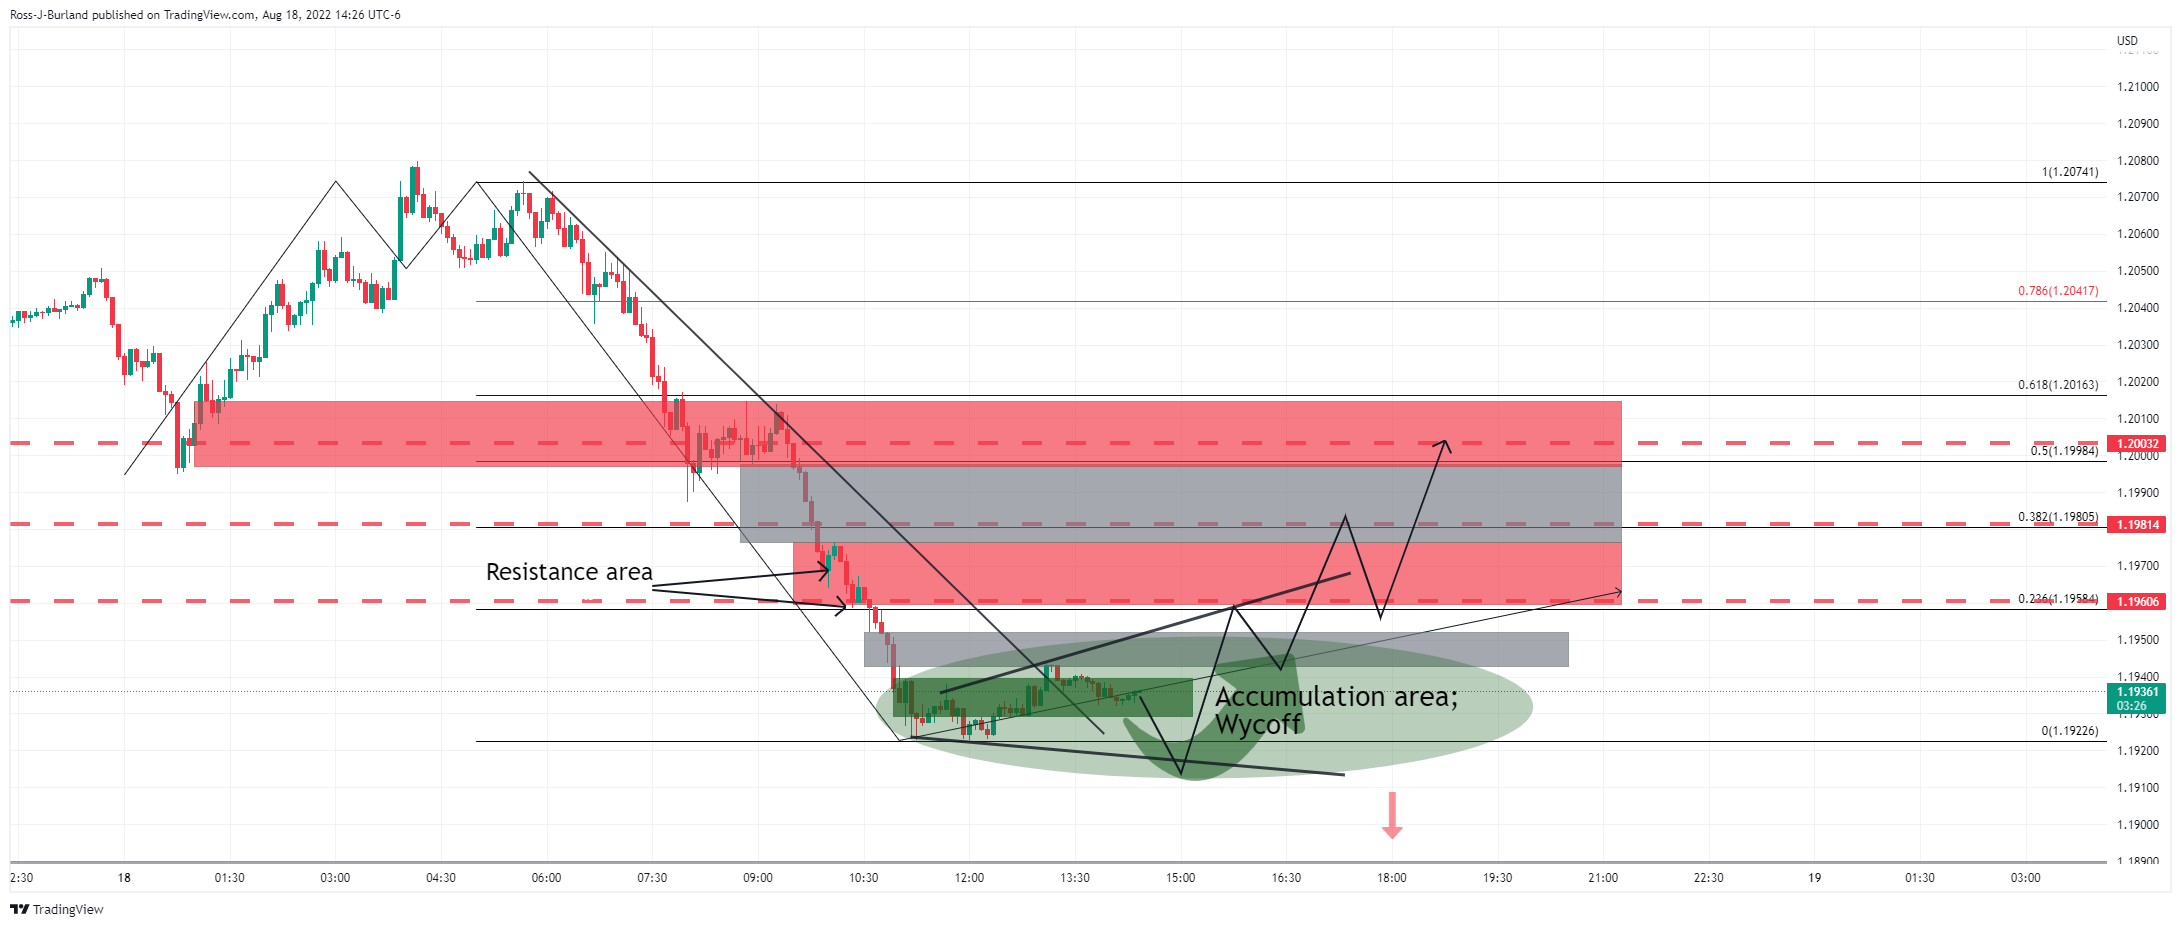
As illustrated, the price is in a phase of accumulation, moving out of the resistance trendline. Should the bulls stay in charge, then the above scenarios could play out in either an imminent breakout of the structure higher or a protracted phase of price discovery allowing for a dip lower and some sideways price action within a broadening formation and range.
What you need to take care of on Friday, August 19:
The greenback strengthened during US trading hours, soaring across the FX board. Market players assessed several encouraging US macroeconomic figures that suggest the economy has a good chance of skipping a recession, despite technically on it.
Investors changed their minds regarding the latest Federal Reserve announcement. The Minutes from the latest FOMC Meeting published on Wednesday were initially seen as dovish, particularly considering policymakers expressed their concerns about the risk of raising the rate benchmark to a level it would become more a problem than a solution.
Nevertheless, the latest US figures hint at a much better situation than initially feared. Inflation has finally begun easing while the employment sector remains solid. Additionally, other indicators related to business activity have surprised to the upside.
US Federal Reserve officials were on the wires with a mixed message. Minneapolis Federal Reserve Neel Kashkari said that if they keep raising rates, the risk of a recession could increase, although he does not believe the county is currently in a recession. On the other hand, the usual hawk, Bank of St. Louis Jim Bullard said he is leaning towards another 75 bps rate hike in September.
The EUR/USD pair plunged below the 1.0100 mark and trades near a daily low of 1.0078. GBP/USD, in the meantime, trades around 1.1930.
Safe-haven rivals are ending Thursday near their intraday lows against the dollar, with USD/CHF at around 0.9560, while USD/JPY trades at 135.95.
The AUD/USD pair trades around 0.6910/20, with the aussie additionally weighed by dismal Australian employment figures. USD/CAD stands at 1.2940, as Canadian Industrial Production unexpectedly contracted in July.
The broad dollar's strength pushed gold to a fresh weekly low of $1,755.30 a troy ounce. Crude oil prices, on the other hand, recovered their bullish poise, and the barrel of WTI currently stands at around $90.50 a barrel.
Top 3 Price Prediction Bitcoin, Ethereum, Ripple: Gepetto's Guilty Pleasure pt.2
Like this article? Help us with some feedback by answering this survey:
- Gold price stumbles below the $1760 threshold due to overall US dollar strength.
- Fed officials pushed back against a “dovish” stance by the central bank; emphasized the need to get inflation back down “urgently.”
- US labor and housing data were mixed, though mainly ignored by market participants.
Gold price retraces from daily highs reached around $1772, shy of the 50-day EMA, but stumbled below its 20-day EMA, extending its losses for the fourth consecutive trading day. Despite falling US Treasury bond yields, broad US dollar strength, bolstered by hawkish Fed commentary, weighed on the yellow metal prices.
XAU/USD is trading at $1760 a troy ounce, below its opening price, while the US Dollar Index, a gauge of the buck’s value vs. a basket of peers, rises 0.80%, sitting at 107.509. Contrarily, the US 10-year bond yield drops to 2.882% after reaching a high of 2.913%.
Fed speakers underpinned the greenback, to the detriment of gold prices
During the last few hours, Fed officials grabbed attention. Firstly was San Francisco Fed’s Mary Daly, who said that it is too early to declare victory on inflation and said that 50 or 75 bps is reasonable for the September meeting, via CNN.
Later Kansas City Fed President Esther George added that although inflation data was “encouraging” last month, it’s not time for a “victory lap.” George said that core inflation is “hardly comforting” and noted that the case for raising rates remains strong. At the same time, the St. Louis Fed’s James Bullard commented he’s leaning towards a 75 bps rate hike and foresees an 18-month process of getting inflation back to the Fed’s 2% target.
The last to hit the stand was the Minnesota Fed’s Neil Kashkari. He said that the Fed needs to get inflation down “urgently” while adding that economic fundamentals are strong and emphasized that it does not feel like a recession now.
Elsewhere, before Wall Street opened, US Initial Jobless Claims for the week ending on August 13 decelerated to 250K from 265K foreseen. At the same time, the US housing market is still cooling down due to higher interest rates. Existing Home Sales for July dropped 5.9%, at a rate of 4.8 million units in July, the lowest level since May 2020, when sales hit their lowest point during the Covid-19 lockdowns.
According to sources cited by Reuters, “Assuming the Fed will fight inflation without pushing the economy into recession, safe-haven demand will fade further, causing gold to move gradually lower on a medium to longer-term horizon.”
Gold Key Technical Levels
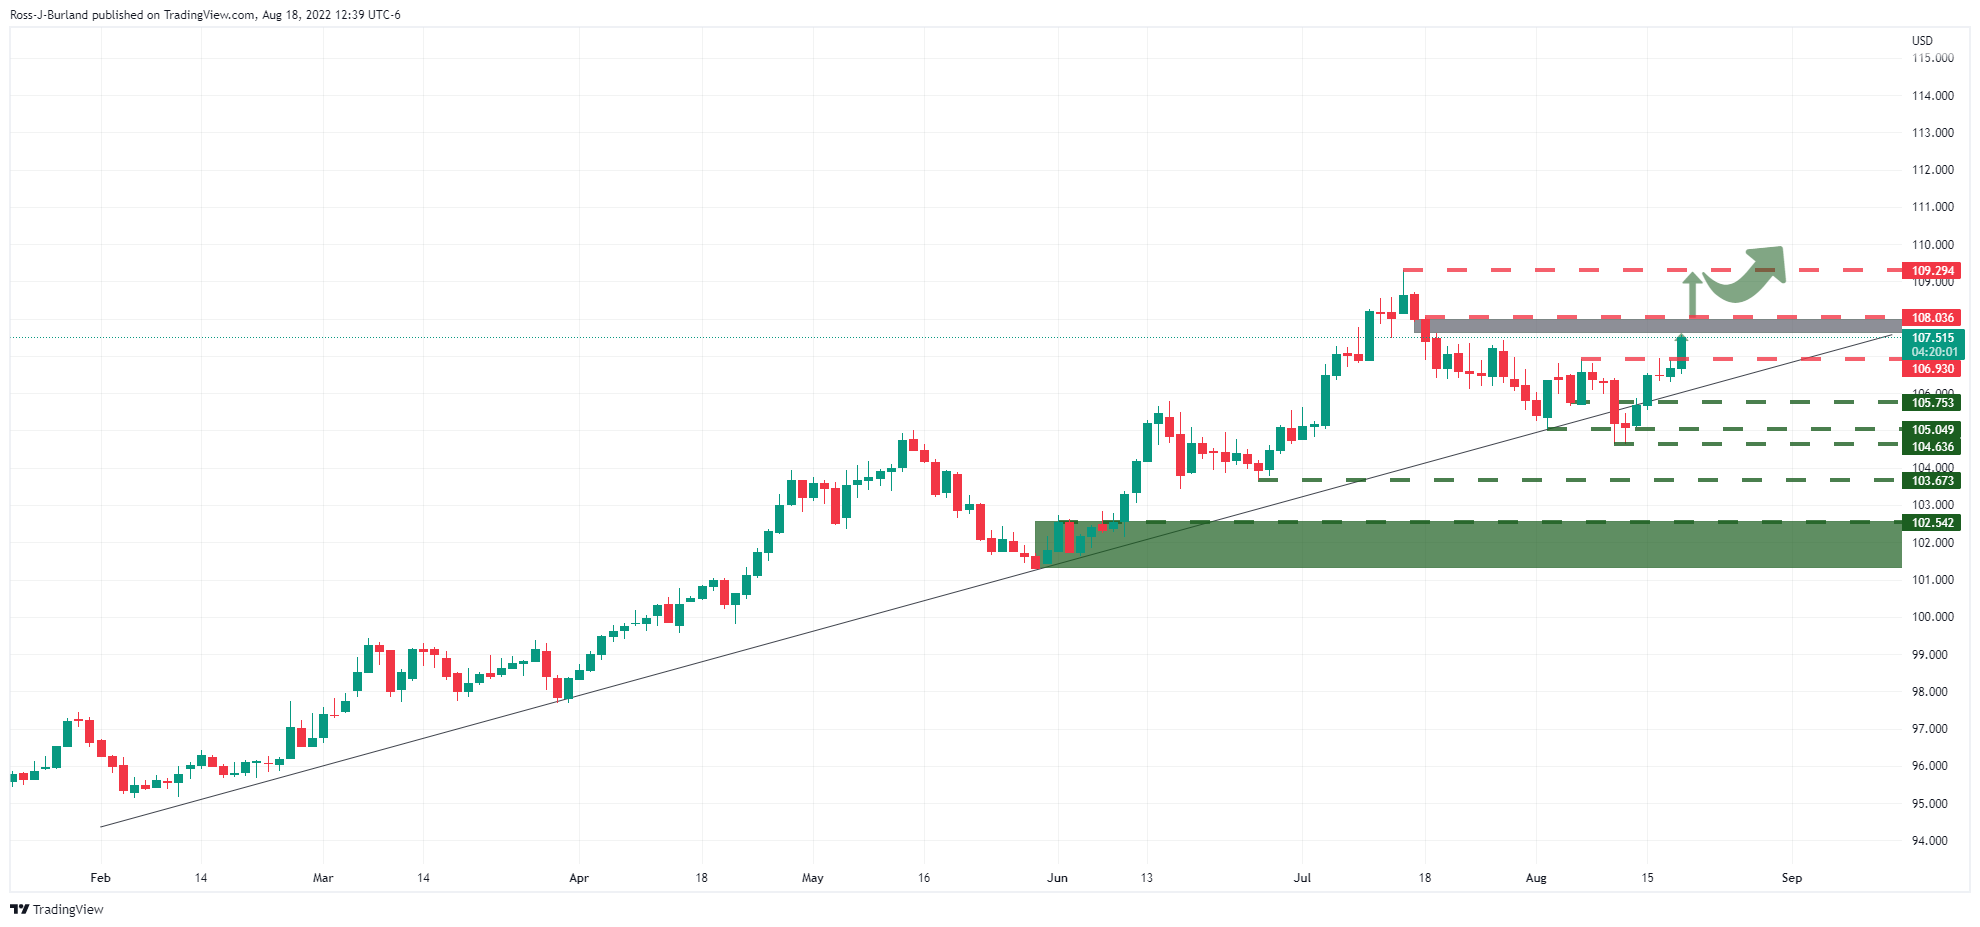
The US dollar and yields have rallied on Thursday as the hawks continue to circle above 2051 Constitution Ave. The DXY index, which measures the greenback vs. a basket of major currencies hit a three-week high on Thursday as investors reevaluated Wednesday's minutes from the Federal Reserve’s July meeting as more hawkish than originally interpreted.
Additionally, Fed speakers on Thursday, including San Francisco Federal Reserve Bank President Mary Daly, Kansas City Federal Reserve President Esther George, CEO of the Federal Reserve Bank of St. Louis Jim Bullard and finally, president of the Minneapolis Federal Reserve Neel Kashkari have all been heard signing from the same hawkish hymn sheet.
The most hawkish of the chorus of Fed officials on Thursday was Bullard who expressed a desire for a 75bp hike at September's meeting and added he isn’t ready to say the economy has seen the worst of the inflation surge.
“We should continue to move expeditiously to a level of the policy rate that will put significant downward pressure on inflation” and “I don’t really see why you want to drag out interest rate increases into next year,” Mr. Bullard said in a Wall Street Journal interview.
More recently, we have heard from Kahkari, who has turned far more hawkish in recent weeks, especially when compared to his uber dovish pre-pandemic tone, expressing his concerns for runaway inflation amongst his worries of an imminent recession.
In prior speeches, Kashkari said that he wants to raise the central bank’s benchmark interest rate to 3.9% by the end of this year, and to 4.4% by the end of 2023. That made him the most hawkish participant on the Fed’s rate-setting Federal Open Market Committee at the time, according to the so-called “dot plot” of interest-rate projections published after the central bank’s June policy meeting. On Thursday, he repeated that the Fed has more work to do to get inflation down and that the central bank needs to get inflation down urgently.
At the start of the New York session, Daly had crossed the wires and said in an interview with CNN it was way too early to declare victory on inflation and that said either a 50 basis point or a 75 basis points hike would be appropriate. This was pushing back against the market's interpretation of the minutes yesterday of just a 50bp hike where the futures markets were pricing in a 60% chance thereof. Her comments ignited the bullish tinder under the US dollar that was rising 0.12% on the day at 106.78 which has since gone on to print a 107.560 to trade some 0.8% higher.
Meanwhile, the US dollar is much higher, with the DXY approaching an area of imbalance that guards a resistance at 108.03 ahead of 109.29:
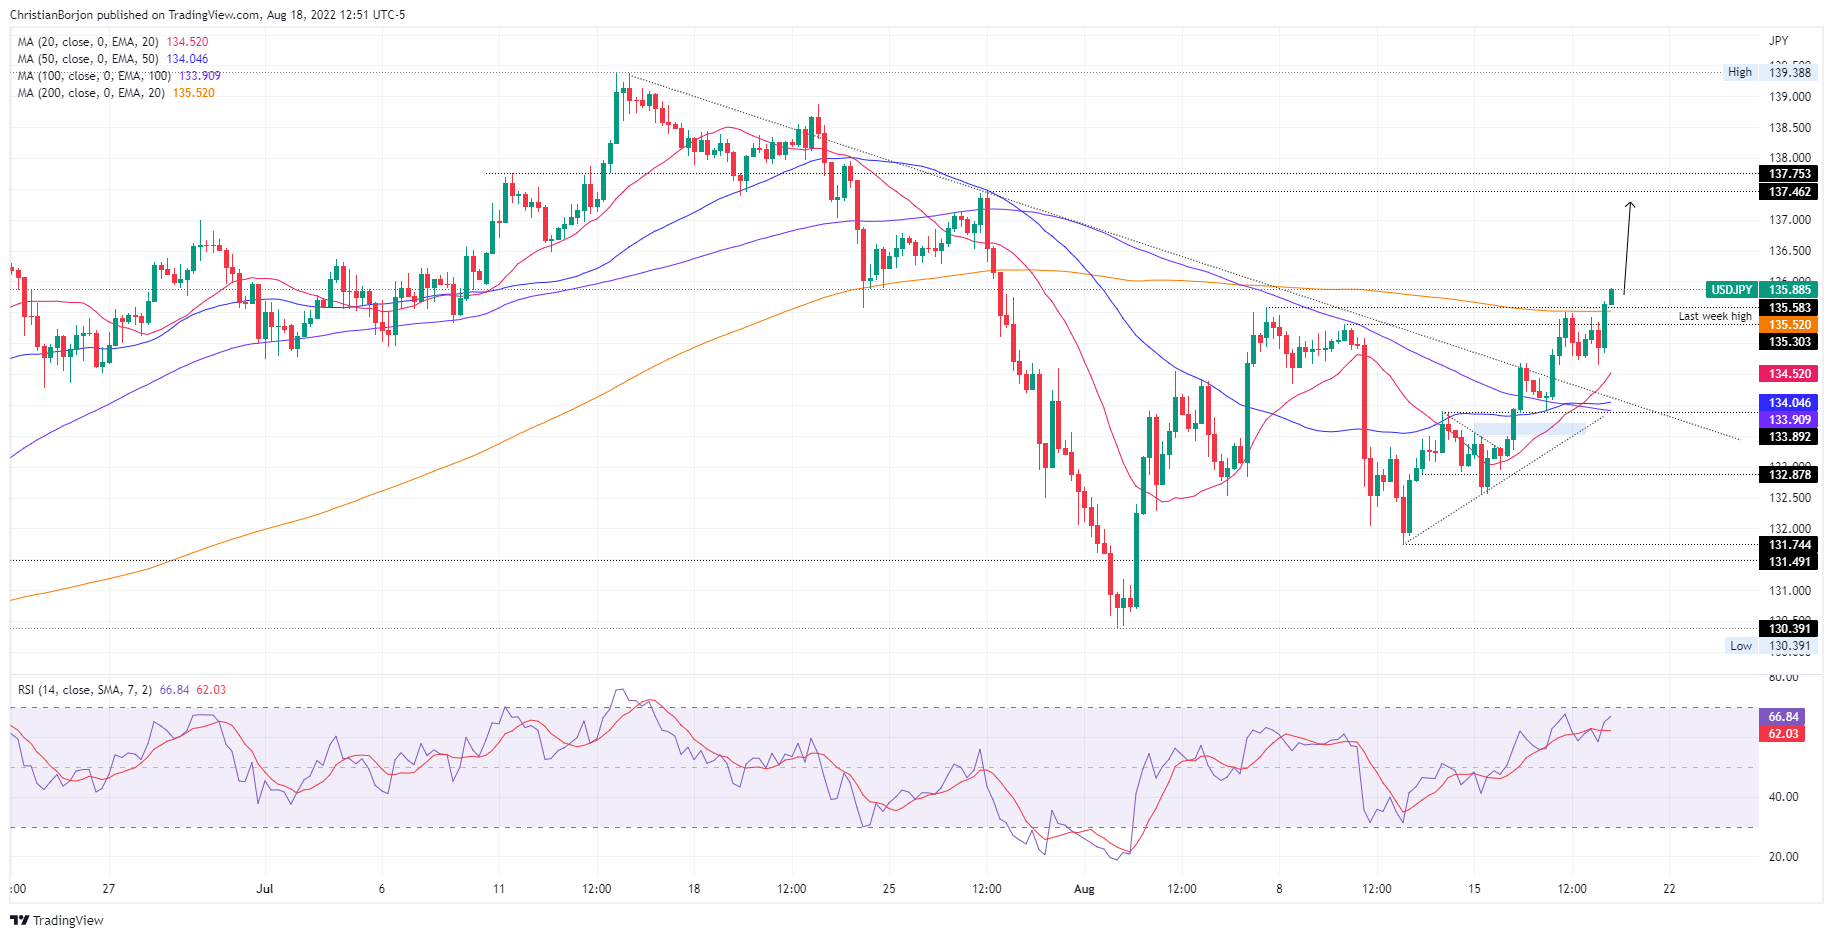
- USD/JPY rallied more than 0.60% once it broke above a one-month-old downslope trendline on Thursday.
- The 4-hour chart depicts buyers breaking above the 200-EMA, approaching the 136.00 figure.
- If the USD/JPY surpasses the 136.00 figure, a move towards 137.47 is on the cards.
The USD/JPY advances sharply in the North American session, breaking above its 50-day EMA, aiming towards the 136.00 figure, amidst a mixed market mood, with US equities fluctuating between gainers/losers. At the time of writing, the USD/JPY is trading at 135.87, above its opening price.
USD/JPY Price Analysis: Technical outlook
From a daily chart perspective, the USD/JPY is upward biased, further reinforced by buyers reclaiming the 50-day EMA at 135.40, while the Relative Strength Index (RSI) pushes towards its 60 reading, with enough room to spare, suggesting that an assault of 136.00, is on the cards.
Worth noting that on Wednesday, the USD/JPY broke above a one-month-old downslope resistance trendline, signaling that buyers are in charge.
Therefore, the USD/JPY first supply zone will be the 136.00 mark. Once cleared, the next resistance would be the 137.00 figure, followed by the July 27 daily high of 137.42.
In the near term, on the 4-hour scale, the chart illustrates the USD/JPY as upward biased. Buyers cleared the 200-EMA hurdle at 135.50, exacerbating a jump of 30-plus pips towards the USD/JPY daily highs at 135.89. Once the major clear the 136.00 figure, a rally towards 137.46 is imminent, with no supply zones on its way north.
USD/JPY 4-hour chart
USD/JPY Key Technical Levels
- AUD/USD is recording minimal losses of almost 0.20% due to a fragile market mood.
- Upbeat US jobs data, added to industrial production and retail sales, gives enough ammunition for another Fed rate hike in September.
- Australia’s employment report was softer than estimated, though the unemployment rate fell to 3.4%.
The AUD/USD trims some Wednesday losses, registering modest losses after bouncing off the 50-day EMA during the European session. Factors like Fed speakers pushing against markets expecting Fed rate cuts in 2023, alongside broad US dollar strength, keep investors’ sentiment mixed. At the time of writing, the AUD/USD is trading at 0.6917, below its opening price, after hitting a daily high at 0.6969.
AUD/USD slides on mixed data, hawkish Fed speaking
Before Wall Street opened, the US Department of Labor revealed that unemployment claims for the week ending on August 13 increased by 250K, less than the 265K estimated, while also previously week’s data was downwardly revised. That said, US economic data revealed in the week, led by industrial production, solid retail sales, and a strong labor market, would further cement the case for additional tightening by the Federal Reserve.
In the meantime, the US housing market continues deteriorating. Existing Home Sales for July dropped 5.9%, at a rate of 4.8 million units in July, the lowest level since May 2020, when sales hit their lowest point during the Covid-19 lockdowns.
Elsewhere, San Francisco Fed’s Mary Daly pushing back against a “dovish” tilt by the Fed, perceived by market participants on the release of the FOMC minutes on Wednesday, turned sentiment sour. The greenback is staying a comeback, with the US Dollar Index up 0.63%, above the 107.00 thresholds.
In the Asian session, a softer than expected Australian job report slightly weighed on the AUD/USD. The Australia Bureau of Statistics reported that the unemployment rate dropped to 3.4% from 3.5% estimates. Still, Full Employment Change slashed 40K jobs from the economy, less than a 25K increase estimated by the street.
The AUD/USD ticked lower towards 0.6927, but money market futures still price in further rate hikes by the Reserve Bank of Australia (RBA).
Further data revealed during the week showed that wage prices rose more modestly than estimated, which sent Australia’s bond yields down, dragging the AUD/USD from above the 0.7000 figure to 0.6910.
Therefore, the AUD/USD would likely remain neutral-to-downward biased due to a more aggressive than expected Federal Reserve.
AUD/USD Key Technical Levels
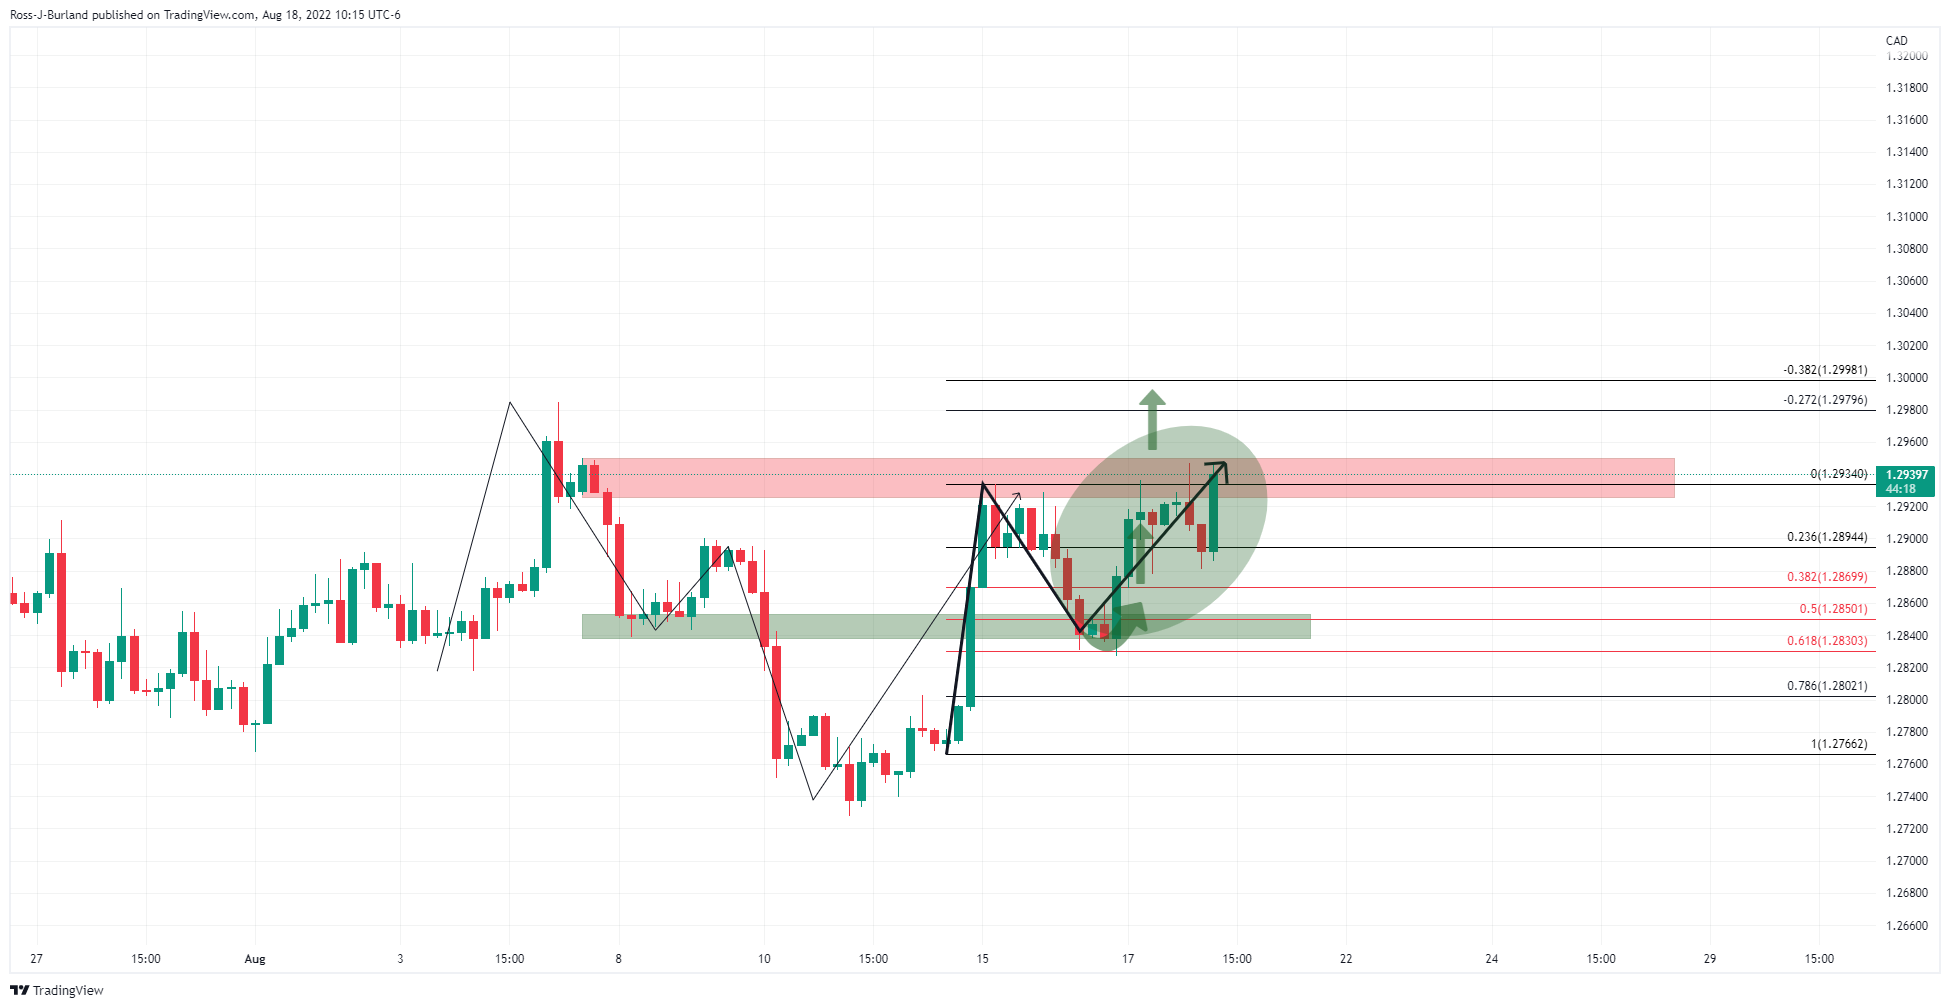
- USD/CAD is rallying as the US dollar picks up a bid again.
- Bulls eye the 1.3000s for a test of bear's final commitments.
USD/CAD is 0.26% higher at the time of writing, entering the midday session of the New York trade. The bulls have taken the price up to a key resistance area, with the price rallying from a low of 1.2880 reaching today's high so far of 1.2946.
The market has been dominated by speculation around the Federal Reserve. The US dollar index hit a three-week high on Thursday as investors reevaluated Wednesday's minutes from the July meeting as more hawkish than first interpreted. Additionally, the US data has been favourable to the bulls that will likely warrant a string of aggressive rate hikes from the central bank.
Analysts at TD Securities explained that the minutes also note ''a risk of remaining in the restrictive territory, which could imply a lean against immediate cuts even during a major slowdown.'' Jackson Hole offers a venue to explore this more deeply for which markets will be tuned into on August 27 - 29.
In addition, Federal Reserve Bank of San Francisco President Mary Daly said the central bank should raise interest rates “a little” above 3% by the end of the year to cool inflation. This is on contrary to the market's belief yesterday that officials would then reverse course.
Analysts at Rabobank argued that both Daly and the minutes of the Fed’s latest policy minutes have suggested that ''the Fed could favour a ‘raise and hold’ strategy, suggesting that rates could be higher for longer through next year and beyond relative to the levels the market has been expecting. This is not good news for equity bulls; however, it is supportive for the medium-term outlook for the USD.''
Another factor supporting the greenback for its safe haven qualities comes with the potential for more geopolitical chaos, including further weaponization of supply chains, as analysts at TD Securities noted that tests the mettle of risk seekers. ''This should reinforce nascent correlations that show G10FX very positively correlated with global equities, adding to further USD resilience that supports our EUR/USD short and bias to leg into USD/CAD topside around the Bank of Canada's decision.''
USD/CAD technical analysis
As per the prior series of technical analysis, USD/CAD Price Analysis: Bulls eye 1.3000 for the sessions ahead, the bulls move din on the resistance that is guarding the 1.3000 psychological area as the following prior analysis and update illustrates:
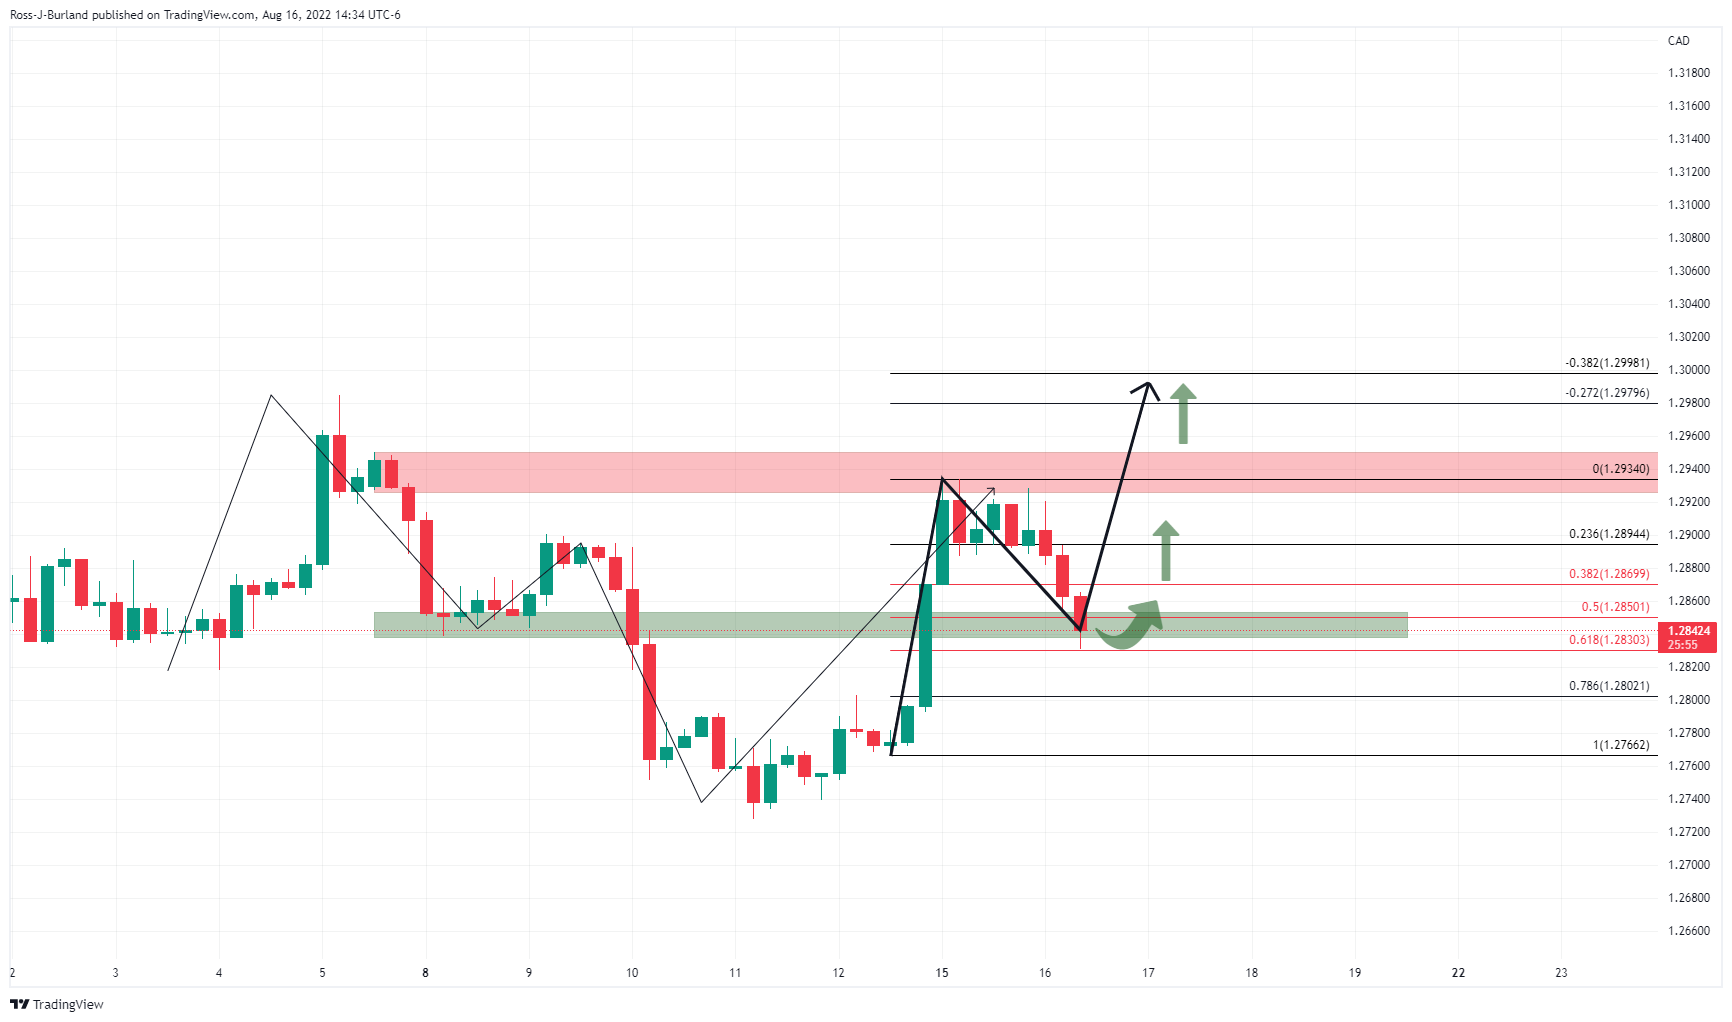
As shown, the price followed the projected price trajectory and is embarking on a break of prior highs for a path to the higher 1.3000 targets:
- US Dollar rises across the board during the American session.
- EUR/USD under pressure, testing critical support.
- Break under 1.0100 could trigger a test of parity.
The EUR/USD dropped sharply during the American session and hit at 1.0107, the lowest level since July 27. It remains near the lows, under pressure amid a stronger Us dollar across the board.
The greenback strengthened even as US yields remained steady and also as stocks in Wall Street sideways. The DXY is up 0.55%, at monthly highs near 107.30.
Regarding economic data, the weekly report showed Initial Jobless Claims declined to 250K, below market consensus; the Philly Fed jumped to 6.2 in August from -12.3, also surpassing expectations. On the negative front, Existing Home Sales tumbled to 4.81M, posting the sixth monthly decline in a row.
Short-term outlook
The EUR/SD is facing increasing bearish pressure and is near a critical support at 1.0110. A break below 1.0100 would expose the parity level, ending with weeks of a range. The bearish pressure in the short-term will likely persist while under 1.0135.
The euro needs to recover 1.0135 to avoid more losses. The next resistance stands at 1.0160 followed by the strong barrier near 1.0200.
Technical levels
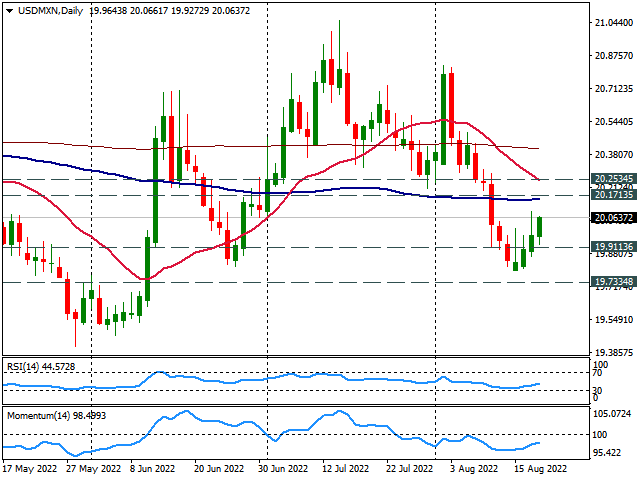
- USD/MXN rises for the third consecutive day, again above 20.00.
- The dollar needs to hold above 20.00, next resistance at 20.15/20.
- Slide under 19.90 to remove bullish bias.
The USD/MXN is rising for the third consecutive day, although so far it failed to print fresh weekly highs. The upside remains capped below 20.10. The next critical resistance area is seen around 20.15/20, an area that contains horizontal resistances and also the 100-day Simple Moving Average.
A firm break above 20.25 would open the doors more gains targeting the 20.50 area.
In the very short-tern, the bias is to the upside, with technical indicators flat to bullish. The momentum is not strong enough and appears to be fading. The bias will weaken with a decline back under 20.00. While a daily close well above 20.00 would be a positive sign for the bulls.
A key support emerges at 19.90 that if fails to hold, USD/MXN could drop further to test again the 19.80 area.
USD/MXN Daily chart
- GBP/USD sellers eye a break below 1.2000, which would pave the way towards 1.1800.
- Fed’s Daly: 50 or 75 bps hike in September is reasonable; rates will go up and remain on hold until inflation subsidies.
- US jobless claims fall; housing data continues weakening.
The GBP/USD remains defensive after tumbling below the 20 and 50-DMAs on Wednesday, extending its losses for the second straight day. Factors like San Francisco Fed’s Mary Daly pushing back against a “dovish” tilt by the Fed, perceived by market participants on the release of the FOMC minutes on Wednesday, turned sentiment sour. The greenback is staying a comeback, with the US Dollar Index up 0.48%, above the 107.00 threshold.
The GBP/USD is trading at 1.2005, below its opening price, after hitting a daily high at 1.2079 early in the European session.
GBP/USD falls on sentiment shift, with Fed speakers pushing back rate-cuts
Mary Daly, San Francisco Fed’s President, commented that it is too early to declare victory on inflation and said that 50 or 75 bps is reasonable for the September meeting, via CNN. She added that core inflation is still increasing and that the market lacks understanding, but consumers understand that rates won’t go down right after going up.
In the meantime, US Initial Jobless Claims for the week ending on August 13 dropped to 250K, less than 265K estimated by analysts, while the housing market continued to cool down due to further evidence of Federal Reserve rate hikes. Existing Home Sales for July dropped 5.9%, at a rate of 4.8 million units in July, the lowest level since May 2020, when sales hit their lowest point during the Covid-19 lockdowns.
Elsewhere, on Wednesday, the UK reported inflation in July, which cleared the 10% threshold for the first time in 40 years. The Office for National Statistics revealed that the Consumer Price Index (CPI) rose 10.1%, from a year earlier, after recording a 9.4% in June. After the report, money market futures priced in nearly 200 bps of rate hikes, in the BoE rate to 3.75%, by May of 2023.
The GBP/USD is still neutral to downward bias, but central bank monetary policy convergence could lead to range-bound trading. With rates in both countries elevating, growth differences between them will enter into play to dictate the direction of the pair.
GBP/USD Key Technical Levels
OPEC's new secretary general Haitham al-Ghais told Reuters on Thursday that he was relatively optimistic on the oil market outlook for 2023 and added that the world was dealing with economic pressures of inflation in a very good way.
"I want to be very clear about it - we could cut production if necessary, we could add production if necessary," as-Ghais further elaborated. "It all depends on how things unfold. But we are still optimistic, as I said. We do see a slowdown in 2023 in demand growth, but it should not be worse than what we've had historically."
Market reaction
Oil prices continued to rise after these comments and the barrel of West Texas Intermediate was last seen rising 3.% on a daily basis at $90.28.
Additional takeaways
"Fears of Chinese slowdown taken out of proportion."
"Oil price slide reflects fears about the economy, physical oil demand is robust."
"Premature to say what OPEC+ will do at September 5 meeting."
- Existing Home Sales in US fell for the sixth straight month in July.
- US Dollar Index holds above 107.00 despite the disappointing data.
Existing Home Sales in the US declined for the sixth straight month in July to a seasonally adjusted annual rate of 4.18 million, the National Association of Realtors reported on Thursday. Sales were down 5.9% and 20.2% on a monthly and yearly basis, respectively.
Further details of the report revealed that the median price for Existing Home Sales rose by 10.8% from one year ago to $403,800, down from $10,000 from last month's record high of $413,800.
Market reaction
With the initial reaction, the US Dollar Index edged slightly lower from the multi-week high it touched at 107.14 earlier in the day.
- Gold gains some positive traction on Thursday, albeit lacks follow-through buying.
- Retreating US bond yields, recession fears offer support to the safe-haven XAU/USD.
- Hawkish Fed expectations, a stronger USD should keep a lid on any meaningful upside.
Gold holds on to its modest intraday gains through the early North American session and is currently placed just below the $1,770 region. The attempted recovery from a two-week low touched the previous day, however, lacks bullish conviction and runs the risk of fizzling out rather quickly.
The prevalent cautious mood - as depicted by a softer tone around the equity markets - turns out to be a key factor benefitting the safe-haven gold. The anti-risk flow is reinforced by a modest pullback in the US Treasury bond yields, which offers additional support to the non-yielding yellow metal. That said, some follow-through US dollar buying should hold back bulls from placing aggressive bets around the dollar-denominated commodity and cap gains, at least for the time being.
In fact, the USD shot to a fresh monthly high amid firming expectations that the Fed would continue to tighten its monetary policy. The FOMC minutes released on Wednesday, though did not hint at a particular pace of future rate hikes, indicated that policymakers remain committed to raising interest rates to tame inflation. The bets were further reaffirmed by the incoming better-than-expected US macro data, which remain supportive of the underlying bullish sentiment surrounding the greenback.
The Philly Fed Manufacturing Index jumped to 6.2 in August, surpassing consensus estimates for an improvement to -5 from the -12.3 reported in the previous month. Separately, the US Initial Jobless Claims unexpectedly fell to 250K during the week ended August 12 from the previous week's downwardly revised reading of 252K (262K reported previously). This comes a day after upbeat US consumer spending data and reinforces hawkish Fed expectations, supporting prospects for further USD gains.
The fundamental backdrop suggests that the path of least resistance for gold is to the downside. Even from a technical perspective, the recent repeated failures to find acceptance, or build on the momentum beyond the $1,800 mark favours bearish traders. This, in turn, suggests that any further positive move might still be seen as a selling opportunity and is more likely to remain capped.
Technical levels to watch
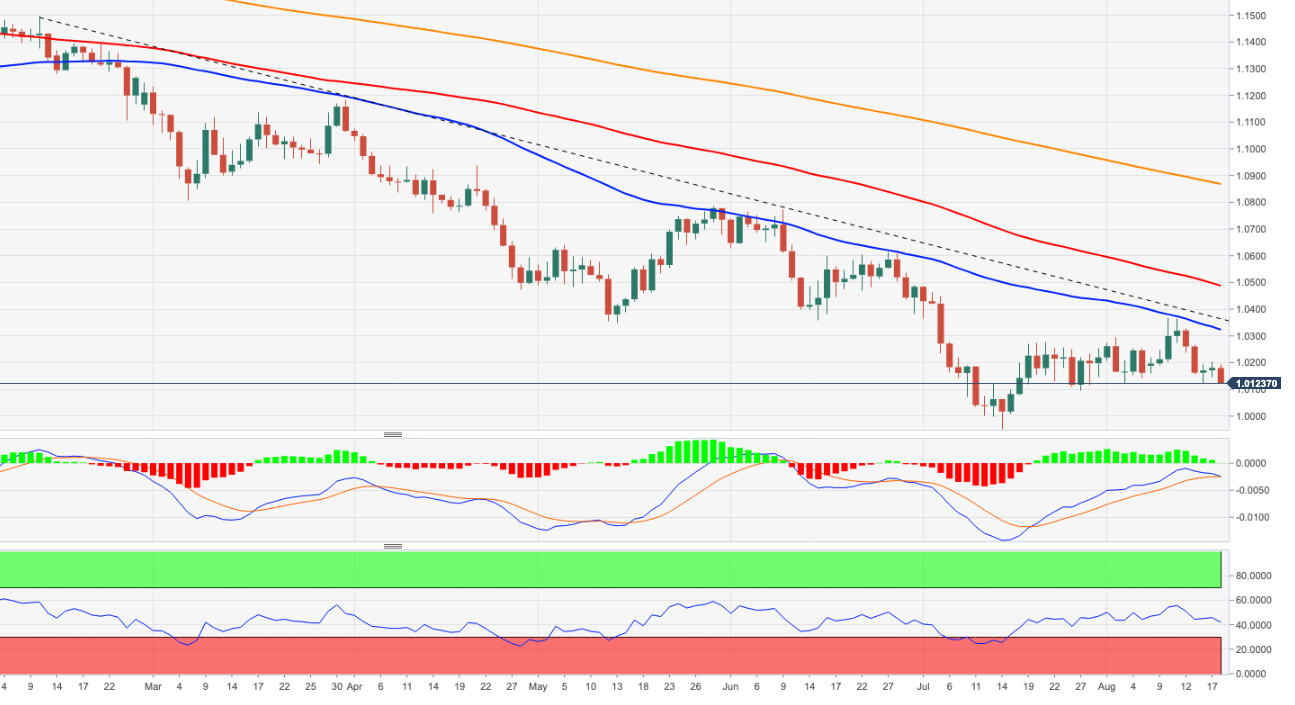
- EUR/USD reverses part of recent gains and revisits 1.0130.
- Immediately to the downside turns up the weekly low at 1.0096.
EUR/USD resumes the downside and revisits the 1.0130/25 band following two consecutive daily advances.
Further losses should meet the next support at the weekly low at 1.0096 (July 27). In case sellers push harder, then the pair could confront the psychological parity level in the not-so-distant future
In the longer run, the pair’s bearish view is expected to prevail as long as it trades below the 200-day SMA at 1.0867.
EUR/USD daily chart
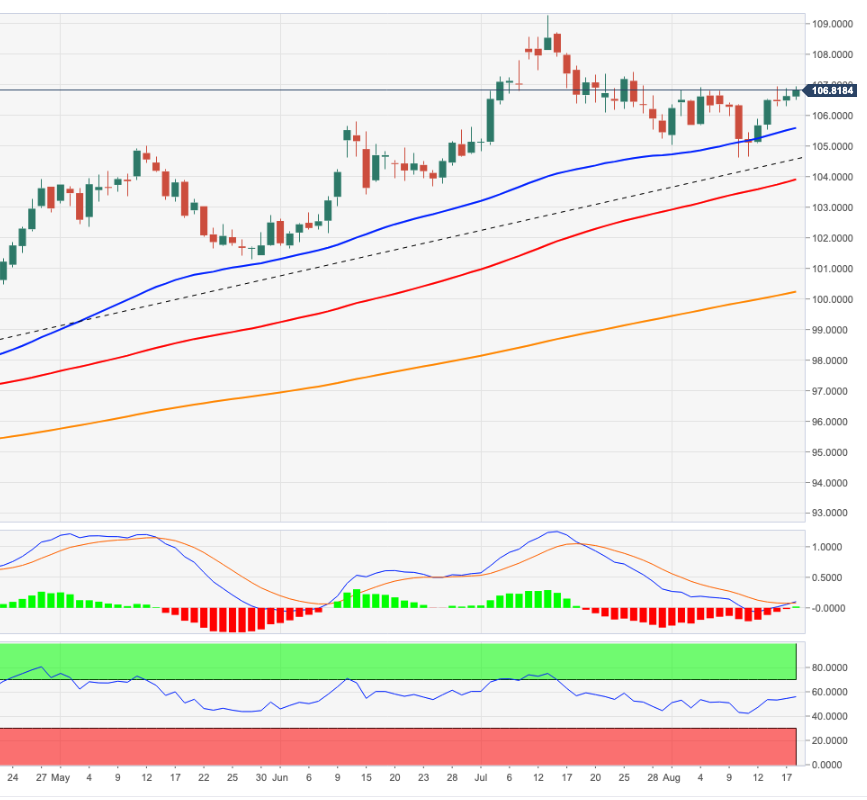
- DXY adds to Wednesday’s uptick and retargets 107.00.
- Above 107.00 the index could revisit the weekly high at 107.42.
DXY extends the upside for the second session in a row on Thursday, although another test of the 107.00 neighbourhood remains elusive for the time being.
The continuation of the upside momentum could extend to the August high near the 107.00 mark (August 5). The breakout of this level should motivate the index to challenge the post-FOMC meeting high at 107.42 (July 27).
Looking at the broader scenario, the bullish view in the dollar remains in place while above the 200-day SMA at 100.28.
DXY daily chart
In an interview with CNN on Thursday, San Francisco Fed President Mary Daly reiterated that it was way too early to declare victory on inflation, as reported by Reuters.
Daly further noted that core services inflation was still rising while adding that they will continue to raise the rates to "right-size it." Regarding the September rate decision, Daly said either a 50 basis points or a 75 basis points hike would be appropriate.
Market reaction
The US Dollar Index edged slightly higher on these comments and was last seen rising 0.12% on the day at 106.78.
Additional takeaways
"When we get closer to the meeting will make a decision on the September rate hike."
"We need to get rate a little more above 3% next year."
"We need to bridle economy a bit, slow pace of inflation."
"The markets have a lack of understanding, but consumers understand, that rates won't go down right after they go up."
"The raise and hold strategy pays off."
"A hump-shaped path for rates is not what's on my mind."
- USD/JPY seesaws between tepid gains/minor losses through the early North American session.
- The Fed-BoJ policy divergence continues to undermine the JPY and offers support to the major.
- Retreating US bond yields seem to act as a headwind for the USD and cap any meaningful gains.
The USD/JPY pair struggles to capitalize on its gains recorded over the past two sessions and meets with some supply ahead of the 135.50 area. Spot prices drop to a fresh daily low during the early North American session, albeit quickly bounce back to the 135.00 psychological mark.
A big divergence in the monetary policy stance adopted by the Bank of Japan and the Federal Reserve continues to undermine the Japanese yen, which, in turn, acts as a tailwind for the USD/JPY pair. In fact, the BoJ has repeatedly said that it would retain its ultra-easy policy settings. In contrast, the Fed is expected to stick to its policy tightening path despite signs of easing US inflation.
The bets were reaffirmed by the minutes of the July 26-27 FOMC policy meeting, which indicated that policymakers would not consider pulling back on rate hikes until inflation came down substantially. Apart from this, better-than-expected US macroeconomic releases assist the US dollar to stand tall near the monthly low. This is seen as another factor lending some support to the USD/JPY pair.
Data released this Thursday showed that the Philly Fed Manufacturing Index climbed to 6.2 in August, beating consensus estimates for an improvement to -5 from the -12.3 reported in the previous month. Separately, the US Initial Jobless Claims unexpectedly fell to 250K during the week ended August 12 from the previous week's downwardly revised reading of 252K (262K reported previously).
That said, retreating US Treasury bonds yields seem to hold back the USD bulls from placing aggressive bets and capping the upside for the USD/JPY pair, at least for the time being. Nevertheless, the fundamental backdrop supports prospects for a further near-term appreciating move for the USD/JPY pair, suggesting that any meaningful dip could be seen as a buying opportunity and remain limited.
Technical levels to watch
Germany is looking at a potential agreement with Canada on LNG deliveries in the medium term, not in the next one or two years, Reuters reported on Thursday, citing a German government source.
"Russia wanted to divide western allies with Siemens turbine debate" the government source further told Reuters and added that Russia was looking for excuses not to deliver gas.
Market reaction
This headline doesn't seem to be having a significant impact on the shared currency's performance against its rivals. As of writing, EUR/USD was down 0.2% on the day at 1.0160.
On Wednesday, gold closed the third straight day in negative territory as the FOMC minutes were a dud. Strategists at TD Securities believe that the Jackson Hole symposium next week could dent demand for the yellow metal as Fed Chair Powell may push back against market pricing for rate cuts.
Chair Powell's remarks at the Jackson Hole symposium next week will be key
“Markets are still pricing in 47% odds of a 75 bps hike in September and a 3.67% terminal rate, which is only marginally less than pre-minutes, as the dated minutes provided little additional information for markets to digest.”
“Jackson Hole could provide a platform for the Fed to push back against market pricing for rate cuts, which should sap investment appetite for gold and silver.”
“At the same time, as commodity demand continues to slide, silver markets are particularly vulnerable, given little exposure to the rise in supply risk premia that has been supporting industrial metals.”
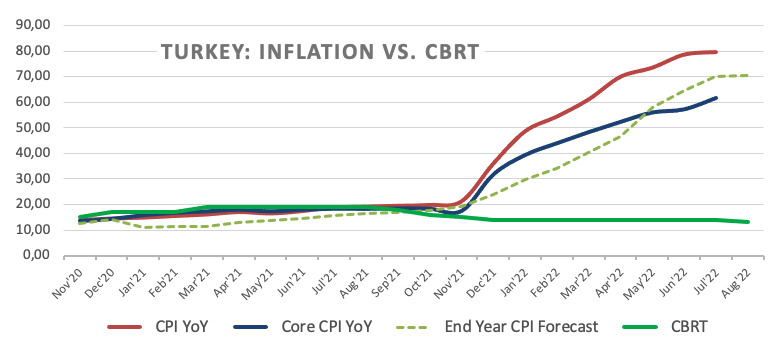
Turkey's central bank, the CBRT, surprisingly cut the benchmark one-week repo rate by 100 bps to 13%. Economists at TD Securities believe that their current USD/TRY forecast of 19.00 by the end of the quarter is a fairly optimistic one.
Lira must fall if rates are not allowed to vent in the right direction
“The CBRT surprisingly cut the repo rate by 100 bps to 13%, defying the unanimous consensus expectation and our call for a hold today.”
“With this decision, the CBRT drops any residual pretense to be targeting inflation and reveals its overarching goal of supporting growth. With inflation at 80%, however, this recipe only spells disaster.”
“We still think that rates will need to be hiked – the only question is when? In the meantime, one conclusion looks inescapable – the lira must fall.”
“We continue to forecast USD/TRY at 19.00 by end of Q3, a forecast that looks increasingly optimistic given the circumstances.”
- EUR/JPY looks offered after two daily advances in a row.
- Next on the upside appears the August top at 138.40.
EUR/JPY corrects lower after bumping into the weekly resistance just below the 1380.00 yardstick on August 17.
In case the recovery becomes more serious, then the cross should meet the next barrier at the 100-day SMA at 138.13 prior to the more relevant August high at 138.39 (August 10). The upside is expected to gather fresh steam once the latter is cleared.
While above the 200-day SMA, today at 134.01, the prospects for the pair should remain constructive.
EUR/JPY daily chart
- USD/CAD witnessed an intraday turnaround from over a one-week high touched on Thursday.
- Rebounding oil prices underpin the loonie and exert pressure amid a modest USD pullback.
- The upbeat US macro data, hawkish Fed expectations should limit the USD and lend support.
The USD/CAD pair retreats from a one-and-half-week high touched earlier this Thursday and drops to a fresh daily low during the early North American session. The pair is currently trading just below the 1.2900 mark and is pressured by a combination of factors.
Crude oil prices gain some positive traction and move away from over a six-month low set on Tuesday, which underpins the commodity-linked loonie and acts as a headwind for the USD/CAD pair. This, along with a modest US dollar pullback from a fresh monthly peak, attracts some selling at higher levels and further contributes to the intraday slide.
The overnight bullish Energy Information Administration (EIA) report, showing a steeper-than-expected drawdown in US crude stocks helps offset concerns that a global economic downturn would hit fuel demand. Furthermore, expectations that the European Union embargoes on Russian oil imports could tighten supply offer support to the black liquid.
The USD, on the other hand, fails to capitalize on its modest intraday uptick amid retreating US Treasury bond yields. Apart from this, a goodish intraday recovery in the equity markets prompts some profit-taking around the safe-haven greenback. That said, upbeat US macro releases help limit the downside for the buck and the USD/CAD pair.
In fact, the Philly Fed Manufacturing Index came in at 6.2 for August against consensus estimates for an improvement to -5 from the -12.3 reported in the previous month. Separately, the US Initial Jobless Claims unexpectedly fell to 250K during the week ended August 12 from the previous week's downwardly revised reading of 252K (262K reported previously).
This comes a day after the FOMC minutes indicated that policymakers would not consider pulling back on interest rate hikes until inflation came down substantially and reaffirmed hawkish Fed expectations. Market participants seem convinced that the Fed would stick to its policy tightening path, which supports prospects for the emergence of some USD dip-buying.
The fundamental backdrop suggests that the path of least resistance for the USD/CAD pair is to the upside, suggesting that any subsequent slide might still be seen as a buying opportunity. Hence, it would be prudent to wait for strong follow-through selling before confirming a near-term top and positioning for any meaningful decline.
Technical levels to watch
- Initial Jobless Claims fell by 2,000 in the week ending August 13.
- US Dollar Index trades flat on the day above 106.50.
There were 250,000 initial jobless claims in the week ending August 13, the weekly data published by the US Department of Labor (DOL) showed on Thursday. This print followed the previous week's print of 252,000 (revised from 262,000) and came in lower than the market expectation of 265,000.
Further details of the publication revealed that the advance seasonally adjusted insured unemployment rate was 1% and the 4-week moving average was 246,750, a decrease of 2,750 from the previous week's revised average.
"The advance number for seasonally adjusted insured unemployment during the week ending August 6 was 1,437,000, an increase of 7,000 from the previous week's revised level," the DOL further noted in its publication.
Market reaction
The US Dollar Index edged slightly higher with the initial reaction and was last seen trading flat on the day at 106.70.
- US Philly Fed Manufacturing Index recovered into positive territory in August.
- US Dollar Index continues to fluctuate in its tight daily range.
The Federal Reserve Bank of Philadelphia's Manufacturing Business Outlook Survey's diffusion index for current general activity rose to 6.2 in August from -12.3 in July. This print came in much better than the market expectation of -5.
Further details of the publication revealed that the Prices Paid Index declined to 43.6 from 52.2, the Employment Index improved to 24.1 from 19.4 and the Six-month Business Conditions Index advanced to -10.6 from -18.6.
Market reaction
The US Dollar Index is struggling to make a decisive move in either direction and was last seen posting small losses at 106.65.
- USD/TRY clinches new YTD tops beyond the 18.00 mark.
- The pair now targets the all-time top at 18.25 (December 20 2021).
- The Turkish central bank reduced the policy rate by 100 bps.
The Turkish lira debilitates to fresh lows vs. the greenback and pushes USD/TRY past the 18.00 yardstick for the first time since December 2021.
USD/TRY now targets the all-time high at 18.25
USD/TRY leaves behind the key barrier at 18.00 after the Turkish central bank (CBRT) caught the markets off guard and reduced the One-Week Repo Rate by a full point to 13.00% at its meeting earlier on Thursday. the central bank also cut the Overnight Borrowing Rate and the Overnight Lending Rate by 100 bps to 11.50% and 14.50%, respectively.
In its statement, the CBRT continues to see domestic inflation largely driven by higher energy costs exclusively on the back of geopolitical events and “effects of pricing formations that are not supported by economic fundamentals”.
Also, according to the bank’s statement, the disinflationary process is expected to start in response to measures taken… which would be…?
In line with previous meetings, the “liraization” strategy remains the way to reach a permanent fall in inflation to the bank’s 5% target, which the CBRT expects to hit at some point in H2 2023. If we consider that inflation ran at nearly 80% YoY in July and that the CBRT forecasts the CPI at 70% by year end, reaching that goal is no less than a chimera in the current context.
It is worth noting that USD/TRY closed with gains in every month of the current year. Since January 2021, the pair recorded monthly losses in only four occasions; January, July, August and December 2021.
What to look for around TRY
The upside bias in USD/TRY remains unchanged and now targets the all-time peak around 18.25 following the recent unexpected move by the CBRT.
In the meantime, the lira’s price action is expected to keep gyrating around the performance of energy and commodity prices - which are directly correlated to developments from the war in Ukraine - the broad risk appetite trends and the Fed’s rate path in the next months.
Extra risks facing the Turkish currency also come from the domestic backyard, as inflation gives no signs of abating (despite rising less than forecast in July), real interest rates remain entrenched in negative figures and the political pressure to keep the CBRT biased towards low interest rates remains omnipresent. In addition, there seems to be no Plan B to attract foreign currency in a context where the country’s FX reserves dwindle by the day.
Key events in Türkiye this week: CBRT Interest Rate Decision (Thursday).
Eminent issues on the back boiler: FX intervention by the CBRT. Progress (or lack of it) of the government’s new scheme oriented to support the lira via protected time deposits. Constant government pressure on the CBRT vs. bank’s credibility/independence. Bouts of geopolitical concerns. Structural reforms. Presidential/Parliamentary elections in June 23.
USD/TRY key levels
So far, the pair is gaining 0.81% at 18.0856 and faces the immediate target at 18.1260 (2022 high August 18) seconded by 18.2582 (all-time high December 20) and then 19.00 (round level). On the other hand, a breach of 17.1903 (weekly low July 15) would pave the way for 16.4104 (100-day SMA) and finally 16.0365 (monthly low June 27).
GBP/USD has reversed its direction after having tested 1.2000 earlier in the day. The pair could extend recovery if 1.2050 support holds, FXStreet’s Eren Sengezer reports.
GBP/USD could test 1.2000 if sellers flip 1.2050 into resistance
“In case the market mood improves and Wall Street's main indexes rise decisively following Wednesday's decline, GBP/USD could gather bullish momentum and stretch higher and vice versa.”
“GBP/USD was last seen trading above 1.2050. As long as this level holds, additional gains toward 1.2100 (Fibonacci 38.2% retracement) and 1.2130 (100-period SMA) and 1.2175 (Fibonacci 23.6% retracement) could be witnessed.”
“On the downside, GBP/USD could test 1.2000 (daily low, psychological level, Fibonacci 61.8% retracement) if sellers flip 1.2050 into resistance. Below 1.2000, 1.1940 (static level) could be seen as the next bearish target.”
Over the last month, the US dollar has dropped against most of the G10 and EM complex. This setup raises the question of whether it has peaked. In the view of economists at TD Securities, the USD turn is coming, but not yet.
A pivot will require patience and better data
“The time to see a peak in the dollar is coming, but not yet, especially as the key factor to lean against the USD rests on the global growth outlook.”
“A pullback in rates vol would match the hopes of peak terminal rate pricing, raising the carry appeal. And the USD's super-rich to stagflation risks. A pivot will require patience and better data, but this is a healthy reminder to stay nimble.”
Brent Crude Oil has fallen swiftly over recent weeks. Notwithstanding, strategists at UBS continue to see a tight oil market and retain our positive price outlook.
Oil looks set to recover after recent slide
“We continue to believe that the recent decline in oil prices does not fully account for constraints on global supply, and we expect the price to rebound to $125 a barrel by the end of the year.”
“Our $125/bbl Brent forecast through mid-2023 also supports our preference for energy stocks.”
The Central Bank of the Republic of Türkiye (CBRT) lowered its benchmark interest rate, the one-week repo rate, by 100 basis points to 13% from 14%.
Market reaction
With the initial market reaction, USD/TRY jumped to a multi-month high of 18.15 before retreating toward 18.10.
Key takeaways from policy statement
"Increase in inflation is driven by the lagged and indirect effects of rising energy costs resulting from geopolitical developments."
"Expecting disinflation process to start."
"It is important that financial conditions remain supportive to preserve the growth momentum."
"Assessed that the updated level of policy rate is adequate under the current outlook."
"Negative consequences of supply constraints in some sectors, particularly basic food, have been alleviated by the strategic solutions facilitated by Türkiye."
"Will continue to use all available instruments decisively within the framework of liraization strategy until strong indicators point to a permanent fall in inflation."
"Job creation has been stronger than peers."
"Effects of pricing formations that are not supported by economic fundamentals, strong negative supply shocks caused by the rise in global energy, food and agricultural commodity prices also push inflation higher."
"Growth dynamics are supported by structural gains."
"Stronger than expected contribution of tourism revenues to the current account balance continues."
"Leading indicators for the third quarter point to some loss of momentum in economic activity."
"Recent increase in the spread between the policy rate and the loan interest rate is considered to reduce the effectiveness of monetary transmission."
- AUD/USD stages a goodish bounce from over a one-week low touched earlier this Thursday.
- An unexpected drop in the Australian unemployment rate offers some support to the aussie.
- A modest USD pullback further provides a lift amid a goodish recovery in the risk sentiment.
The AUD/USD pair reverses an intraday dip to sub-0.6900 levels and stages a goodish bounce from a one-and-half-week low touched earlier this Thursday. The pair prolongs its recovery move through the first half of the European session and touches a fresh daily high, around the 0.6970 region in the last hour.
The Australian dollar draws some support from an unexpected fall in the domestic unemployment rate to a 48-year low level of 3.4% in July. Apart from this, a positive turnaround in the global risk sentiment triggers a modest US dollar pullback from a fresh monthly high and benefits the risk-sensitive aussie. That said, any meaningful positive move still seems elusive, warranting caution for aggressive bullish traders and positioning for any further gains.
The surprise downtick in the Australian jobless rate was sponsored by a decline in the participation rate. Moreover, the economy shed 40.9K jobs during the reported month, missing expectations for an addition of 25K by a big margin. This comes on the back of softer wage growth data on Wednesday, which could force the Reserve Bank of Australia to be more flexible in its policy tightening cycle and act as a headwind for the domestic currency.
Meanwhile, growing worries about a global economic downturn should keep a lid on any optimistic move in the markets. Furthermore, expectations that the Fed would stick to its policy tightening path support prospects for the emergence of some USD dip-buying. The bets were reaffirmed by the minutes of the July 26-27 FOMC meeting, which indicated that policymakers would not consider pulling back on interest rate hikes until inflation came down substantially.
The hawkish Fed expectations remain supportive of elevated US Treasury bond yields, which further favours the USD bulls. This, in turn, suggests that the path of least resistance for the AUD/USD pair is to the downside and any subsequent move up might still be seen as a selling opportunity. Traders now look forward to the US economic docket - featuring the Philly Fed Manufacturing Index, the usual Weekly Initial Jobless Claim and Existing Home Sales data.
Technical levels to watch
German Chancellor Olaf Scholz said on Thursday that they are planning to lower the sales tax on gas to 7% temporarily through March 2024, as reported by Reuters.
Scholz further noted that the German government agreed that consumers should not incur further costs from sales tax on gas.
Market reaction
These comments don't seem to be having a significant impact on the shared currency's performance against its rivals. As of writing, the EUR/USD pair was down 0.12% on the day at 1.0168. Meanwhile, Germany's DAX 30 Index was last seen rising 0.8% on a daily basis at 13,742.
Stocks tend to outperform after midterm elections. Will the trend hold? Liz Ann Sonders, Schwab's Chief Investment Strategist, gives her point of view.
Will midterms affect market performance?
“Post-election outperformance is often driven by the market's expectation of increased government spending from a new Congress. But an additional infusion of funds seems unlikely this year, given the government's historic levels of spending and stimulus in response to the pandemic.”
“The combination of high inflation, the war in Ukraine, and a lingering pandemic has already made this cycle unlike prior midterm years. With so many other forces at play in the market, I wouldn't put much weight in historical midterm-year performance.”
- EUR/GBP attracts fresh selling on Thursday and retreats from the vicinity of the weekly high.
- Europe's energy supply concerns, a downward revision of the monthly HICP weighs on the euro.
- Expectations for a gradual BoE rate hike, recession fears could cap sterling and limit the downside.
The EUR/GBP cross meets with a fresh supply on Thursday and retreats over 40 pips from the vicinity of the weekly high. The cross drops to a fresh daily low, around the 0.8425 region in the last hour, and reverses a part of the previous day's strong bounce from a nearly two-week low.
The shared currency continues to be undermined by mounting energy supply concerns, which could drag the Eurozone economy faster and deeper into recession. This turns out to be a key factor acting as a headwind for the EUR/GBP cross and attracting fresh sellers at higher levels. Meanwhile, the latest leg down follows a sharp downward revision of the Eurozone Harmonised Index of Consumer Prices (HICP) for July to 0.1% MoM from the 0.8% reported previously.
The British pound, on the other hand, draws some support from a modest US dollar pullback from the monthly high set earlier this Thursday. This was seen as another factor exerting additional downward pressure on the EUR/GBP cross. That said, speculations that an economic downturn might force the UK central bank to adopt a gradual approach to raising interest rates could cap any meaningful gains for sterling and lend some support to the EUR/GBP cross.
The mixed fundamental backdrop could hold back traders from placing aggressive bets and contribute to limiting the downside for the EUR/GBP cross, at least for the time being. Even from a technical perspective, the recent price action within a broader trading range witnessed over the past two weeks or so points to indecision among traders. This further makes it prudent to wait for some follow-through selling before positioning for further intraday losses.
Technical levels to watch
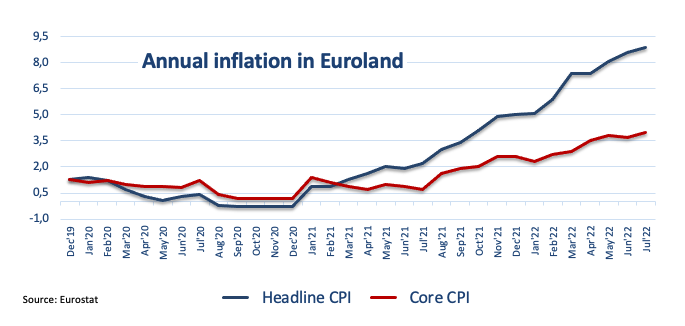
EUR/USD fluctuates in a relatively tight range above 1.0150. However, the pair is set to continue its move downward, economists at MUFG Bank note.
Short-term spreads dragging EUR/USD lower have further to run
“The reality is that the fundamental backdrop for EUR remains negative and short-term spreads dragging EUR/USD lower has further to run.”
“We view there is a much greater risk of the ECB delivering less than the current OIS pricing implies – 115 bps compared to the risk of the Fed underdelivering the 125 bps priced by year-end.”
Following the opposition from China’s Commerce Ministry, the country’s Foreign Ministry also said on Thursday that Beijing will take resolute measures to defend its territorial integrity and urges the US not to make a wrong judgment after Washington and Taipei agreed to initiate trade talks early this autumn.
This comes after Deputy United States Trade Representative (USTR) Sarah Bianchi said early Thursday, the US-Taiwan trade negotiations “will deepen our trade and investment relationship, advance mutual trade priorities based on shared values, and promote innovation and inclusive economic growth for our workers and businesses.”
“We plan to pursue an ambitious schedule for achieving high-standard commitments and meaningful outcomes covering the eleven trade areas in the negotiating mandate that will help build a fairer, more prosperous and resilient 21st-century economy,” she added.
Market reaction
Amid a rebound in risk sentiment, the aussie dollar is benefiting the most amongst the higher-yielding currencies, ignoring the US-China spat over Taiwan.
AUD/USD is trading at 0.6961, adding 0.45% on the day, at the time of writing.
EUR/USD has managed to erase a small portion of its daily losses after having tested 1.0150. But the pair is not out of the woods yet, FXStreet’s Eren Sengezer reports.
Bearish bias stays intact
“In case safe-haven flows continue to dominate the financial markets in the second half of the day, EUR/USD could have a difficult time gathering recovery momentum.”
“EUR/USD stays within a touching distance of 1.0150 support. If that level fails, interim support seems to have formed at 1.0120 ahead of 1.0100 and 1.0050.”
“On the upside, the 200-period SMA on the four-hour chart aligns as immediate resistance at 1.0180 before 1.0200 and 1.0230.”
- EUR/USD’s upside momentum falters near the 1.0200 mark.
- Final Inflation Rate in the euro area came at 8.9% in July.
- US Initial Claims, Philly Fed Index take centre stage across the pond.
The selling pressure returns to the European currency and forces EUR/USD to give away part of the recent gains and return to the mid-1.0100s.
EUR/USD weaker on USD-buying
EUR/USD fades two consecutive daily advances and comes under pressure amidst shy losses on Thursday, all against the backdrop of some unostentatious rebound in the greenback.
Indeed, not much happening in the FX universe, as market participants refocus on upcoming US data and continue to digest Wednesday’s release of the FOMC Minutes.
The move lower in the pair also comes in tandem with further recovery in the German 10y Bund yields, which so far clinch the third consecutive daily gain near the 1.15% region.
In the euro docket, final inflation figures in the euro area showed the headline CPI rose 8.9% in the year to July and 0.1% vs. the previous month.
In the US calendar, usual weekly Claims and the Philly Fed Manufacturing Index will take centre stage seconded by the CB Leading Index, Existing Home Sales and speeches by FOMC’s George and Kashkari.
What to look for around EUR
EUR/USD now appears somewhat stabilized in the 1.0150 region against the backdrop of a firm recovery in the demand for the US dollar.
Price action around the European currency, in the meantime, is expected to closely follow dollar dynamics, geopolitical concerns, fragmentation worries and the Fed-ECB divergence
On the negatives for the single currency emerge the so far increasing speculation of a potential recession in the region, which looks propped up by dwindling sentiment gauges and the incipient slowdown in some fundamentals.
Key events in the euro area this week: EMU Final Inflation Rate (Thursday).
Eminent issues on the back boiler: Continuation of the ECB hiking cycle. Italian elections in late September. Fragmentation risks amidst the ECB’s normalization of its monetary conditions. Impact of the war in Ukraine on the region’s growth prospects and inflation.
EUR/USD levels to watch
So far, spot is losing 0.14% at 1.0164 and a break below 1.0096 (weekly low July 27) would target 1.0000 (psychological level) en route to 0.9952 (2022 low July 14). On the other hand, the next up barrier comes at 1.0368 (monthly high August 10) seconded by 1.0486 (100-day SMA) and finally 1.0615 (weekly high June 27).
- Gold gains positive traction on Thursday and snaps a three-day losing streak to a two-week low.
- Recession fears weigh on investors’ sentiment and offer support to the safe-haven precious metal.
- Hawkish Fed expectations continue to underpin the USD and might cap gains for the commodity.
Gold edges higher on Thursday and snaps a three-day losing streak to the $1,760 area, or a two-week low touched the previous day. The XAU/USD holds on to its modest intraday gains through the first half of the European session and is currently placed near the daily high, just above the $1,765 level.
Growing worries about a global economic downturn continue to weigh on investors' sentiment, which is evident from a generally weaker tone around the equity markets. The anti-risk flow turns out to be a key factor offering some support to the safe-haven gold, though a combination of factors might hold back traders from placing aggressive bullish bets.
The US dollar hits a fresh monthly high and continues to draw support from hawkish Fed expectations, which, in turn, could act as a headwind for the dollar-denominate gold. Despite signs of easing inflationary pressure in the US, the recent hawkish remarks from several Fed officials suggest that US central bank would stick to its policy tightening path.
Even the minutes of the July 26-27 FOMC monetary policy meeting showed that most members supported more rate hikes until inflation came down substantially. This was consistent with the base case scenario for a 50 bps rate hike at the September meeting and remains supportive of elevated US Treasury bond yields, which should further cap the non-yielding yellow metal.
From a technical perspective, the recent repeated failures to find acceptance, or build on the momentum beyond the $1,800 mark favours bearish traders. This, in turn, suggests that the path of least resistance for gold prices is to the downside. Hence, any subsequent move up could still be seen as a selling opportunity and runs the risk of fizzling out quickly.
Market participants now look forward to the US economic docket - featuring the release of the Philly Fed Manufacturing Index, the usual Weekly Initial Jobless Claim and Existing Home Sales data. This, along with the US bond yields, might influence the USD price dynamics. Apart from this, the broader risk sentiment could provide a fresh trading impetus to gold.
Technical levels to watch
- Eurozone inflation arrives at 8.9% YoY in July, meets estimates.
- Monthly HICP in the bloc drops to 0.1% in July.
- EUR/USD holds the rebound towards 1.0200 on the mixed Eurozone data.
Eurozone’s Inflation surged 8.9% in July, on an annualized basis, according to Eurostat’s final reading of the Eurozone Harmonised Index of Consumer Prices (HICP) report for the month.
The reading matched expectations of 8.9% while against the 8.9% previous. Core figures rose by 4.0%, meeting the 4.0% market estimates and 4.0% last.
The bloc’s HICP rose by 0.1% versus 0.8% expected and 0.8% first estimate while the core HICP numbers came in at -0.2% versus -0.2% expected and -0.2% previous.
Key details (via Eurostat):
“The lowest annual rates were registered in France, Malta (both 6.8%) and Finland (8.0%). The highest annual rates were recorded in Estonia (23.2%), Latvia (21.3%) and Lithuania (20.9%).”
“Compared with June, annual inflation fell in six Member States, remained stable in three and rose in eighteen. In July, the highest contribution to the annual euro area inflation rate came from energy (+4.02 percentage points, pp), followed by food, alcohol & tobacco (+2.08 pp), services (+1.60 pp) and non-energy industrial goods (+1.16 pp).”
FX implications:
At the press time, EUR/USD is trading at 1.0166, down 0.11% on the day. The inflation data had little to no impact on the shared currency.
- GBP/USD quickly reverses an intraday dip to sub-1.2000 levels, or a fresh monthly low.
- Expectations for a gradual BoE rate hike and recession fears act as a headwind for sterling.
- The USD holds steady near the monthly peak and further contributes to capping the pair.
The GBP/USD pair shows some resilience below the 1.2000 psychological mark and stages a goodish rebound from a fresh monthly low touched earlier this Thursday. The recovery momentum pushes spot prices closer to the daily high during the first half of the European session, though lacks bullish conviction.
The US dollar sticks to its modest intraday gains and is a key factor acting as a headwind for the GBP/USD pair. Despite signs of easing US inflation, market participants seem convinced that the Fed will stick to its policy tightening path. Moreover, the minutes of the July 26-27 FOMC meeting indicated that the US central bank would not consider pulling back on interest rate hikes until inflation came down substantially. The hawkish Fed expectations remain supportive of elevated US Treasury bond yields and continue to underpin the greenback.
Apart from this, the prevalent risk-off environment offers additional support to the safe-haven buck. Growing worries about a global economic slowdown continue to weigh on investors' sentiment, which is evident from a generally weaker tone around the equity markets. The British pound, on the other hand, might struggle to gain any meaningful traction amid speculations that an economic downturn might force the UK central bank to adopt a gradual approach to raising interest rates. This was reinforced by the previous day's sharp downfall despite the hotter-than-expected UK CPI report.
The price chart also paints a bearish picture for cable, with the 50-day SMA at around 1.2095 successfully capping gains throuhgout most of the summer. On the weekly chart a bearish death cross formation is the process of completing. The 50-week SMA has now slipped below the 200 WMA and bar a reversal into the end of the week will fix and confirm the cross. This suggests further downside pressure on the horizon from bears and the potential for more losses.
The fundamental and technical backdrops thus seem tilted firmly in favour of bearish traders and support prospects for further losses. That said, repeated failures to find acceptance below the 1.2000 mark and the emergence of some dip-buying warrants caution. Hence, it would be prudent to wait for sustained weakness below the said handle before positioning for any further depreciating move. Market participants now look forward to the US economic docket - featuring the release of the Philly Fed Manufacturing Index, the usual Weekly Initial Jobless Claim and Existing Home Sales data.
Technical levels to watch
- EUR/USD rebounds from lows in the 9.8400 zone on Thursday.
- The Norges Bank hiked the policy rate by 50 bps to 1.75%.
- Mainland Norway GDP expanded 0.7% QoQ in the second quarter.
The Norwegian kroner gives away part of the earlier gains and motivates EURNOK to rebound from earlier lows near 9.8400 on Thursday.
EUR/NOK remains on the defensive post-Norges Bank decision
EUR/NOK fades pat of Wednesday’s string advance following the better tone in NOK after the Norges Bank raised the policy rate by 50 bps to 1.75% at its meeting on Thursday, matching the broad consensus.
The Nordic central bank also gave an upbeat assessment of the Scandinavian economy, highlighting the solid economic activity, low employment and the little spare capacity, all in a context where inflation keeps running higher than initially projected and well above the bank’s 2.0% goal.
The Norges Bank also left the door open to another rate hike at the September event.
Additional buying interest around the kroner comes from the so far modest gains in prices of the European benchmark Brent crude, which adds to Wednesday’s gains near the $94.00 mark per barrel.
Further data in Norway saw the Mainland GDP expand 0.7% QoQ in the April-June period.
EUR/NOK significant levels
As of writing the cross is losing 0.26% at 9.8593 and a breach of 9.7726 (monthly low August 10) would open the door to 9.7672 (monthly low May 5) and finally 9.4325 (2022 low April 8). On the upside, the next resistance emerges at 10.0194 (monthly high August 5) followed by 10.1503 (55-day SMA) and then 10.3987 (monthly high July 1).
- Silver loses ground for the fourth successive day and drops to a nearly two-week low.
- The technical set-up favours bearish traders and supports prospects for further losses.
- Attempted recoveries could now be seen as a selling opportunity and remain capped.
Silver extends its recent sharp pullback from the vicinity of the $21.00 mark, or a multi-week high and remains under some selling pressure for the fourth straight day on Thursday. The downward trajectory drags the white metal to the $19.60 area, back closer to the monthly low during the early part of the European session.
From a technical perspective, the XAG/USD earlier this week faced rejection near the 61.8% Fibonacci retracement level of the $22.52-$18.15 fall. The subsequent weakness below the 50-day SMA and the 38.2% Fibo. level could be seen as a fresh trigger for bearish traders, supporting prospects for an extension of the ongoing slide.
The negative outlook is reinforced by the fact that oscillators on the daily chart have just started drifting into bearish territory. That said, it would still be prudent to wait for some follow-through selling below the monthly low, around the $19.55 area, before positioning for any further near-term depreciating move.
The XAG/USD would then turn vulnerable and accelerate the fall towards the 23.6% Fibo. level, around the $19.20-$19.15 region, en route to the $19.00 mark. The downward trajectory could further get extended towards the $18.45-$18.40 area. Spot prices could eventually drop to the YTD low, around the $18.15 zone touched in July.
On the flip side, the 38.2% Fibo. level, around the $19.80-$19.85 region, now becomes an immediate strong barrier ahead of the $20.00 psychological mark. The latter coincides with the 50 DMA, above which the XAG/USD could climb back to the $20.35 area (50% Fibo. level). Some follow-through buying could negate the bearish outlook.
Any subsequent move up, however, might still be seen as a selling opportunity around the $20.65 horizontal zone and remain capped near the 61.8% Fibo. level, around the $20.85 region. This is closely followed by the $21.00 round figure, which if cleared decisively should pave the way for some meaningful upside for the XAG/USD.
Silver daily chart
-637964071111429103.png)
Key levels to watch
“China resolutely opposes the US and Taiwan to start trade talks under the new initiative,” the country’s Commerce Ministry said in a statement released on Thursday.
Further quotes
“China will take all necessary measures to firmly safeguard its sovereignty, security and development interests.”
“China still faces many challenges in foreign trade, as growth momentum of external demand slows.”
On the US bill to boost chips, China’s Commerce Ministry said, “some provisions restrict normal economic, trade and investment activities of relevant enterprises in China,” adding that “the bill distorts global supply chains of the semiconductor sector, china resolutely opposes it.”
“China will take forceful measures to safeguard its legitimate rights when necessary,” the Ministry said.
Market reaction
As US-Sino tensions escalate over Taiwan, the S&P 500 futures shed 0.25% on the day. Meanwhile, the AUD/USD pair nurses losses near 0.6920, down 0.17% so far.
- A combination of factors drag NZD/USD lower for the fourth successive day on Thursday.
- Hawkish Fed expectations and elevated US bond yields continue to underpin the greenback.
- Growing recession fears also benefit the safe-haven buck and weigh on the risk-sensitive kiwi.
The NZD/USD pair prolongs its recent sharp retracement slide from over a two-month high set last week and remains under heavy selling pressure for the fourth straight day on Thursday. The downward trajectory drags spot prices to a one-and-half-week low, around the 0.6250-0.6245 region during the early European session.
With the latest leg down, the NZD/USD pair has now reversed nearly 140 pips from the overnight swing high touched after the Reserve Bank of New Zealand (RBNZ) announced its policy decision. The RBNZ announced a fourth consecutive 50 bps rate hike on Wednesday and pointed to the need to bring forward the timing of further rate increases. This, however, was largely overshadowed by growing worries about a global economic downturn, which continues to act as a headwind for the risk-sensitive kiwi. Apart from this, a modest US dollar strength further contributes to the ongoing decline.
The USD hits a fresh monthly peak and remains well supported by speculations that the Fed would stick to its policy tightening path. The bets were reaffirmed by the recent hawkish remarks by several Fed officials and mostly upbeat US consumer spending data released on Wednesday. Moreover, the minutes of the July 26-27 FOMC meeting indicated that the US central bank would not consider pulling back on interest rate hikes until inflation came down substantially. The hawkish Fed expectations remain supportive of elevated US Treasury bond yields and continue to underpin the greenback.
Recession fears, meanwhile, tempers investors' appetite for perceived riskier assets. This is evident from a generally weaker tone around the equity markets, which is seen as another factor benefitting the safe-haven buck. The fundamental backdrop favours the USD bulls and supports prospects for a further near-term depreciating move for the NZD/USD pair. Traders now look forward to the US economic docket - featuring the release of the Philly Fed Manufacturing Index, Weekly Initial Jobless Claims and Existing Home Sales - for some impetus later during the early North American session.
Technical levels to watch
- The improved sentiment in the dollar lifts the index near 107.00.
- US yields remain muted following the post-Minutes advance.
- Weekly Claims, Philly Fed Index, housing data, Fedspeak all due later.
The US Dollar Index (DXY), which gauges the greenback vs. a bundle of its main rivals, adds to Wednesday’s advance and flirts with the 107.00 neighbourhood on Thursday.
US Dollar Index now looks to data
The index trades in the positive territory for the second session in a row so far on Thursday and thus extends the weekly rebound after bottoming out in the 104.60 region in the previous week.
Further recovery in the dollar continues to target the 107.00 barrier amidst the so far muted performance in US yields, as market participants keep digesting the release of the FOMC Minutes on Wednesday.
It is worth recalling that the FOMC Minutes reiterated that the Fed’s policy remains data-dependent at the time when members showed concerns that inflation could become entrenched and suggested to move into a more restrictive stance. Some participants were also worried about the effects of a probable overtightening.
Busy day in the US docket, as usual Initial Claims are due in the first turn seconded by the Philly Fed Manufacturing Index, the CB Leading Index, Existing Home Sales and speeches by Kansas City Fed E.George (voter, hawk) and Minneapolis Fed N.Kashkari (2023 voter, centrist).
What to look for around USD
The strong rebound in the dollar comes in response to some worsening conditions in the risk complex, which motivates DXY to now shift its attention to the 107.00 neighbourhood once again.
The dollar, in the meantime, is poised to suffer some extra volatility amidst investors’ repricing of the next move by the Federal Reserve, namely a 50 bps or 75 bps hike in September.
Looking at the macro scenario, the dollar appears propped up by the Fed’s divergence vs. most of its G10 peers (especially the ECB) in combination with bouts of geopolitical effervescence and occasional re-emergence of risk aversion.
Key events in the US this week: Initial Claims, Philly Fed Manufacturing Index, CB Leading Index, Existing Home Sales (Thursday).
Eminent issues on the back boiler: Hard/soft/softish? landing of the US economy. Escalating geopolitical effervescence vs. Russia and China. Fed’s more aggressive rate path this year and 2023. US-China trade conflict.
US Dollar Index relevant levels
Now, the index is gaining 0.25% at 106.93 and a breakout of 107.42 (weekly high post-FOMC July 27) would expose 109.29 (2022 high July 15) and then 109.77 (monthly high September 2002). On the other hand, immediate support comes at 104.63 (monthly low August 10) seconded by 103.98 (100-day SMA) and finally 103.67 (weekly low June 27).
Reading through the FOMC minutes last night, economists at ING took away three key points for the FX market. These should contribute to the dollar staying bid.
Three FX takeaways from the FOMC minutes
“The Fed felt that the appreciation of the dollar was helpful in suppressing import prices and contributing to the Fed's objective of bringing inflation back to its 2% target. In other words, the Fed seems to welcome dollar strength and there were no linkages of dollar strength depressing any sectors in the US economy.”
“The Fed noted that the dollar had continued to strengthen in the inter-meeting period, especially against the euro. The Fed blamed the move on wider interest rate differentials. We see these interest rate differentials (two-year swap differentials) widening further into year-end and keeping EUR/USD pinned down near these 1.00/1.02 levels.”
“The Fed acknowledged the risk of tightening more than necessary. Within FX markets, selective high-beta, risk-sensitive currencies may perform a little better on the view that the Fed is shifting away from the period of more forceful adjustments in the policy rates.”
- EUR/GBP takes the bids to refresh intraday high.
- Bulls piece seven-week-old descending trend line, 200-SMA amid firmer oscillators.
- Monthly horizontal support restricts immediate downside, 61.8% Fibonacci retracement adds to the upside filters.
EUR/GBP bulls pierce the 0.8460 resistance confluence while extending the previous day’s rebound during early Thursday morning in Europe.
That said, a convergence of the 200-SMA and a downward sloping trend line from July 01 highlights the 0.8460 level as the key hurdle for buyers.
Given the bullish MACD signals and recently firmer RSI, coupled with the sustained trading beyond the monthly horizontal support area near the 0.8400 round figure, the EUR/GBP buyers are likely to keep the reins.
With this, the upside momentum currently aims for the monthly high, marked in the last week at around 0.8495.
Following that, the 61.8% Fibonacci retracement of the July-August downside, around 0.8550, could act as an intermediate halt during the likely run-up towards the July 21 peak of 0.8585.
On the flip side, pullback moves remain elusive until staying beyond the aforementioned horizontal support near 0.8400.
Even if the EUR/GBP/ bears manage to conquer the 0.8400 support, multiple levels surrounding 0.8345-40 could challenge the quote’s further downside before directing the prices towards the 0.8300 round figure.
EUR/GBP: Four-hour chart
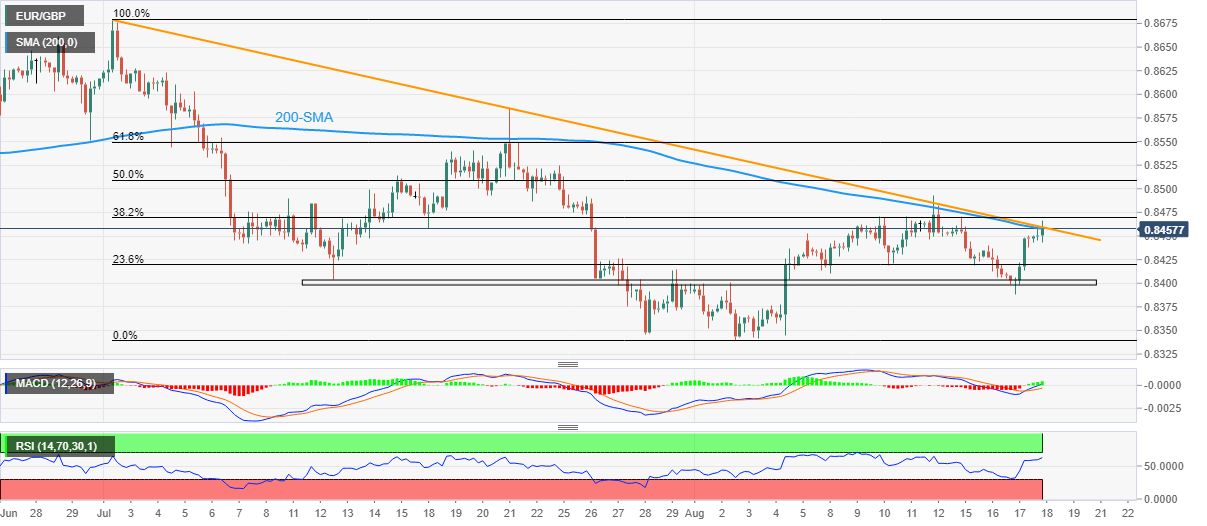
Trend: Further upside expected
There is plenty of speculation about the potential for a further devaluation in the Egyptian pound (EGP) following a 17% devaluation in March. In the view of economists at ING, Egyptian pound could devalue again at any time.
Central bank governor resigned on Wednesday
“The central bank governor resigned yesterday ahead of today’s policy meeting. Consensus expectations are for a 50 bps hike and it may be a good time to announce an FX devaluation, too.”
“The strain this year has come from a weakening current account, along with foreign investor outflows from local T-bills.”
“Pressure on the EGP is being witnessed through the Non-Deliverable Forwards market, where 3m implied yields for EGP are now 45%, pencilling in outright levels for USD/EGP over 21 in three months’ time.”
Economists at Danske Bank expect oil prices to trade above $100 throughout the rest of 2022 and then slide to $95 in 2023.
Oil to remain resilient over coming months
“We stick our view that oil price will stay above $100/bbl the rest of the year and then drop to $95/bbl next year.”
“A stronger USD, weaker global economy and potential for new suppliers to come to the market and reap the benefit from higher oil prices are the main factors behind our projection.”
- USD/CAD scales higher for the second straight day and climbs to over a one-week high.
- The USD stands firm near the monthly peak and continues to act as a tailwind for the pair.
- The recent slump in oil prices undermines the loonie and remains supportive of the move.
The USD/CAD pair gains traction for the second successive day on Wednesday and climbs to a one-and-half-week high during the early European session. The pair is currently placed just below mid-1.2900s and is now looking to build on its recent bounce from a two-month low touched last week.
The US dollar stands tall near the monthly peak and turns out to be a key factor acting as a tailwind for the USD/CAD pair. Despite signs of easing US inflation, investors seem convinced that the Fed would stick to its policy tightening path. The bets were reaffirmed by Wednesday's release of mostly upbeat consumer spending data from the US. Furthermore, the minutes of the July 26-27 FOMC meeting indicated that the US central bank would not consider pulling back on interest rate hikes until inflation came down substantially.
Hawkish Fed expectations remain supportive of elevated US Treasury bond yields. Apart from this, a softer risk tone and growing recession fear further offer support to the safe-haven buck. Meanwhile, concerns that a global economic downturn could hurt fuel demand dragged crude oil prices to a six-month low earlier this week. This continues to undermine the commodity-linked loonie and provides an additional lift to the USD/CAD pair. The fundamental backdrop favours bullish traders and supports prospects for additional gains.
Even from a technical perspective, sustained strength and acceptance above the 1.2900 round-figure mark add credence to the constructive outlook. Hence, a subsequent move back towards the monthly swing high, around the 1.2985 region, aen route to the 1.3000 psychological mark, now looks like a distinct possibility. Traders now look forward to the US economic docket - featuring the release of the Philly Fed Manufacturing Index, the usual Weekly Initial Jobless Claims and Existing Home Sales data - for short-term opportunities.
Technical levels to watch
The British pound briefly rallied on the rise in money market rates but ended the day net weaker. Economists at ING believe that the EUR/GBP pair could move back lower to 0.84.
No real signs of fiscal risk in sterling
“We were wondering whether fears over the spending plans of prospective Tory PM – Liz Truss – were driving Gilts and effectively putting a fiscal risk premium into sterling. But the UK's five-year sovereign credit default swap continues to trade at a very narrow 17 bps – suggesting these fiscal concerns may be overplayed.”
“We are more in the camp that BoE rate hikes can see sterling confound some of the more dire predictions about its path ahead. And EUR/GBP could again return to the 0.8400 area.”
The Norges Bank meets today. Markets expect a 50 basis points (bps) hike. But in the event of a 25 bps hike, the EUR/NOK is unlikely to break the 10 barrier, economists at ING report.
A 25 bps move could still be on the table
“Consensus has shifted towards a 50 bps hike – taking the policy rate to 1.75%. Though we think a 25 bps move could still be on the table.”
“A 25 bps would disappoint markets now, though we expect any correction in EUR/NOK to 10.00 will meet good selling interest.”
See – Norges Bank Preview: Forecasts from six major banks, high inflation forces to hike 50 bps
FX option expiries for August 18 NY cut at 10:00 Eastern Time, via DTCC, can be found below.
- EUR/USD: EUR amounts
- 1.0145-55 1.61b
- 1.0165-75 1.61b
- 1.0185 265m
- 1.0200-05 1.81b
- 1.0215-25 1.82b
- 1.0230-40 557m
- 1.0245-50 943m
- GBP/USD: GBP amounts
- 1.2000 532m
- 1.2025-35 798m
- 1.2050 279m
- 1.2105 388m
- USD/JPY: USD amounts
- 132.00 1.37b
- 133.90-00 1.02b
- 134.25 385m
- 134.50-55 915m
- 135.00 253m
USD/CHF: USD amounts
- 0.9600 630m
- AUD/USD: AUD amounts
- 0.6830 416m
- 0.6975 822m
- USD/CAD: USD amounts
- 1.2765 402m
- 1.2825-30 400m
- EUR/GBP: EUR amounts
- 0.8530 577m
- EUR/CHF: EUR amounts
- 0.9775 1.18b
Here is what you need to know on Thursday, August 18:
The US Dollar Index (DXY) registered its highest daily close in three weeks on Wednesday and continued to edge higher during the Asian reading hours on Thursday. With the market mood remaining cautious, the dollar continues to outperform its rivals. In the European session, Eurostat will release the final version of the July inflation data, which is not expected to show any changes to the flash estimate of the annual HICP of 8.9%. In the second half of the day, July Existing Home Sales and the weekly Initial Jobless Claims data will be featured in the US economic docket.
Late Wednesday, the Federal Reserve's July policy meeting minutes revealed that all participants agreed that a 75-basis-point interest rate hike was appropriate. "Participants concurred that future rate hikes would depend on incoming information and judged that at some point it would be appropriate to slow the pace of increases," the publication further read and failed to trigger a noticeable market reaction.
During the Asian session, the Australian Bureau of Statistics reported that Unemployment Rate edged lower to 3.4% in July. On a negative note, Employment Change arrived at -40.9K, missing the market expectation for an increase of 25K by a wide margin. Following Wednesday's steep decline, AUD/USD stays under bearish pressure and continues to push lower toward 0.6900.
EUR/USD fluctuates in a relatively tight range above 1.0150 after having closed the previous day virtually unchanged. Earlier in the day, European Central Bank (ECB) executive board member Isabel Schnabel said that a technical recession in the euro area was possible.
GBP/USD came under renewed bearish pressure in the early European session on Thursday and started to decline toward 1.2000.
USD/JPY capitalized on rising US Treasury bond yield and climbed above 135.00. At the time of press, the pair was up 0.2% on the day at 135.30.
With the 10-year US Treasury bond yield rising more than 3% on Wednesday, gold closed the third straight day in negative territory and was last seen moving sideways at around $1,760.
Bitcoin lost more than 2% before going into a consolidation phase below $23,500. Ethereum registered losses for the fourth straight day on Wednesday and was last seen consolidating its latest decline near $1,850.
EUR/USD failed to find any positives from last night's FOMC Minutes. Economists at ING expect the to move below the 1.02 mark.
Staying offered
“The unrelenting negatives emerging from the gas crisis no doubt continue to weigh on the euro and suggest EUR/USD may struggle to hold gains over 1.02 today.”
“Fund managers continue to believe the euro is undervalued - but they have been saying that since 2018. And we think the gas crisis and terms of trade shock have driven a lower fundamental value for EUR/USD.”
EUR/PLN has caught up with Danske Bank’s 12M forecast of 4.74. Their economists have revised the near-term outlook for the pair slightly to the downside.
A bit bearish on the zloty
“We continue to remain a bit bearish on the PLN on a combination of softer NBP stance, global and Polish recession fears and weaker EUR.”
“We revise our near-term outlook path for EUR/PLN down to 4.72 (from 4.80) in 1M, 4.74 in 3M (from 4.78), 4.76 in 6M and 4.76 in 12M (from 4.74).”
The recent easing in global financial conditions due to rising recession risks has provided moderate support for the Australian dollar. Nevertheless, economists at Danske Bank expect the AUD/USD pair to move downward over the next months.
Relative rates unlikely to provide much support for AUD/USD
“While we expect the Reserve Bank of Australia to continue hiking rates after the 50 bps hike in the August meeting, the weakening economic growth forces it to take a more meeting-by-meeting approach going forward. Market is already aggressively priced, and thus we do not expect relative rates to provide much support for AUD/USD.”
“We believe Fed will have to continue hiking rates aggressively, which will ultimately weigh on global growth. Environment of tightening financial conditions and slowing growth is negative for commodity currencies, and we maintain a downward-sloping forecast profile for AUD/USD.”
“Forecast: 0.69 (1M), 0.68 (3M), 0.67 (6M), 0.65 (12M).”
- EUR/USD takes offers to refresh intraday low, snaps two-day rebound.
- ECB’s Schnabel, Kazaks signal economic woes in the bloc but back the central bank’s current monetary policy.
- Fed Minutes raised economic concerns and signaled the policymakers’ readiness to go slow on rate hikes before long.
- Final versus Eurozone inflation, second-tier US data can entertain traders.
EUR/USD bears attack the short-term support line as policymakers from the European Central Bank (ECB) follow their US counterpart to highlight recession woes. Also exerting downside pressure on the major currency pair could be the risk-averse catalysts from China, That said, the quote drops to 1.0160 while snapping a two-day uptrend during Thursday’s initial European morning.
ECB executive board member Isabel Schnabel said on Thursday, "Recession on its own would not be enough to control inflation." The policymaker also backed the regional central bank’s current policies. Following that, ECB Governing Council member Martins Kazaks said in an interview with Latvia’s TV3 on Thursday, “the ECB will continue to hike interest rates to tame inflation,” per Bloomberg.
On the other hand, the Minutes of the latest Federal Open Market Committee (FOMC) showed, per Reuters, that officials were ready to slow the pace of interest rate hikes in tandem with signals of a slowdown in inflation. The news also added, “In their July meeting minutes released on Wednesday, Fed officials said the pace of future rate hikes would depend on incoming economic data, as well as assessments of how the economy was adapting to the higher rates already approved.”
After the Fed Minutes’ release, the US 10-year Treasury yields retreated from the weekly top surrounding 2.90%, down two basis points (bp) to 2.89% by the press time. That said, Wall Street registered losses and weighed down the stocks in Asia-Pacific, as well as the stock futures of late.
Elsewhere, concerns surrounding China, as well as the chatters that the dragon nation braces for more stimulus, seem to underpin the US dollar’s demand. Goldman Sachs and Nomura both cut Beijing’s growth forecasts after witnessing the latest jump in the covid numbers. Also negatively impacting the Chinese economy are the doubts over the People’s Bank of China’s (PBOC) capacity to tame recession woes, as conveyed by Reuters. Additionally, comments from the US Trade Representative’s office stating, “Early this autumn, the US and Taiwan will begin formal negotiations on a trade initiative,” seem to renew the fears of the US-China tussle and also roil the mood.
Looking forward, the final readings of the Eurozone inflation gauge for July, namely the HICP, likely to confirm the 8.9%, could offer immediate directions. Following that, weekly prints of the US Initial Jobless Claims and Philadelphia Fed Manufacturing Survey for August should entertain EUR/USD traders.
Technical analysis
An impending bear cross on the MACD, as well as the 21-DMA surrounding 1.0210 questions the major currency pair’s immediate upside. Alternatively, pullback moves need to break the support line from July 27, close to 1.0165 at the latest, to convince the EUR/USD bears.
Economists at Commerzbank expect the USD/CN pair to edge higher. However, the People’s Bank of China is set to prevent a substantial fall in the yuan.
PBoC is cognizant of the risks of a precipitous decline in CNY
“A pro-growth, easier monetary and fiscal policy stance would normally entail a weaker CNY. As such, our bias is still to the upside for USD/CNY i.e. a weaker CNY. However, PBoC is also cognizant of the risks of a precipitous decline in CNY. As such, any CNY weakness is likely to be managed and PBoC is still expected to maintain a strong oversight.”
“The latest data showed that China reduced its US Treasury holdings for the seventh consecutive month in June. This could be due to political reasons as China seeks to diversify away from USD assets but also indicative of PBoC intervention to support CNY amid the strong USD backdrop. It should be a reminder of PBoC’s ammunition to support CNY to prevent excessive and undesired volatility.”
The relief rally in risky assets and the setback to the greenback over the last month have weighed on USD/CAD. Still, economists at Danske Bank expect the pair to trend higher over the next months.
An important risk factor lies in oil prices
“We are not convinced that we are yet at the pivot-stage and still pencil in a more aggressive tightening stance from the Fed than currently priced. This is likely to weigh on financial conditions in the coming quarters and we, therefore, maintain an upward sloping profile for USD/CAD.
“An important risk factor lies in oil prices and any news on both supply (e.g. Iran nuclear deal) and demand. An improved growth outlook and/or more dovish central banks mark the biggest risk factor to our forecast.”
“We now have USD/CAD at 1.30 in 1M (from 1.31), 1.33 in 3M (from 1.33), 1.34 in 6M (1.34) and 1.34 in 12M (1.34).”
GBP/USD holds lower ground around 1.2030. Economists at Commerzbank expect the pair to slide below 1.20 again.
Bank of England seems rather behind the curve in terms of fighting inflation
“The BoE seems rather behind the curve in terms of fighting inflation, although it is ready to tighten further despite the expected recession.”
“I fear that it will not be possible for the pound to regain ground in this situation for the time being. It will be especially difficult against the dollar. Hence, I think it is quite likely that cable will fall below 1.20 again.”
European Central Bank (ECB) Governing Council member Martins Kazaks said in an interview with Latvia’s TV3 on Thursday, the ECB will continue to hike interest rates to tame inflation, per Bloomberg.
Additional quotes
“At the moment what we see is that that inflation is unacceptably high, in Latvia above 20%.”
“Monetary policy already from last December became more restrictive: In the beginning, we were decreasing support programs and in the past few months also significantly increasing interest rates and we will continue to increase interest rates with the goal not to allow inflation” to become entrenched.”
“To fight inflation you need also fiscal policy and structural policy.”
Market reaction
Despite the hawkish remarks from the ECB policymakers, the shared currency remains uninspired. The EUR/USD pair is trading at 1.0162, down 0.17% on the day, as the press time.
Considering flash prints from CME Group for natural gas futures markets, open interest extended the uptrend on Wednesday, now by around 2.1K contracts. Volume, instead, dropped by around 46.4K contracts after two straight daily builds.
Natural Gas still targets the 2022 high at $9.75
Prices of natural gas rose to fresh monthly highs near $9.70 on Wednesday before ending the session with tolerable losses. The downtick, however, was amidst rising open interest and suggests that a potential correction lies ahead, although the broader positive stance keeps the door open to a test of the 2022 peak at $9.75 (July 26) sooner rather than later.
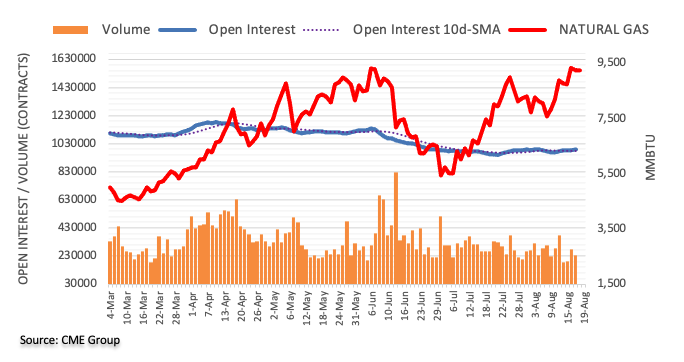
- USD/JPY prints three-day uptrend, firmer around weekly top.
- Sustained break of monthly resistance line, bullish MACD signal favor buyers.
- Bears should wait for a confluence of ascending triangle for conviction.
USD/JPY picks up bids to refresh intraday high around 135.20 during early Thursday morning in Europe.
In doing so, the yen pair rises for the third consecutive day while justifying the previous day’s upside break of the descending resistance line from mid-July, now support around 134.00.
Also keeping the buyers hopeful is the strongest bullish signal since late June.
However, the 50-DMA and a horizontal area comprising multiple levels marked since July 22, respectively around 135.40 and 135.50-55, appear tough nut to crack for the USD/JPY buyers.
Following that, a north-run towards June’s monthly high near 137.00 becomes imminent.
If at all the USD/JPY prices remain firmer past 137.00, the yearly top marked in July, around 139.40, will be in focus.
Alternatively, pullback moves remain unimpressive until staying beyond the resistance-turned-resistance line, at 134.00.
Even so, a convergence of the two-week-old ascending trend line and 50% Fibonacci retracement level of May-July upside, near 132.90-85, becomes crucial support to watch as a break of which will confirm the ascending triangle bearish chart pattern.
USD/JPY: Daily Chart
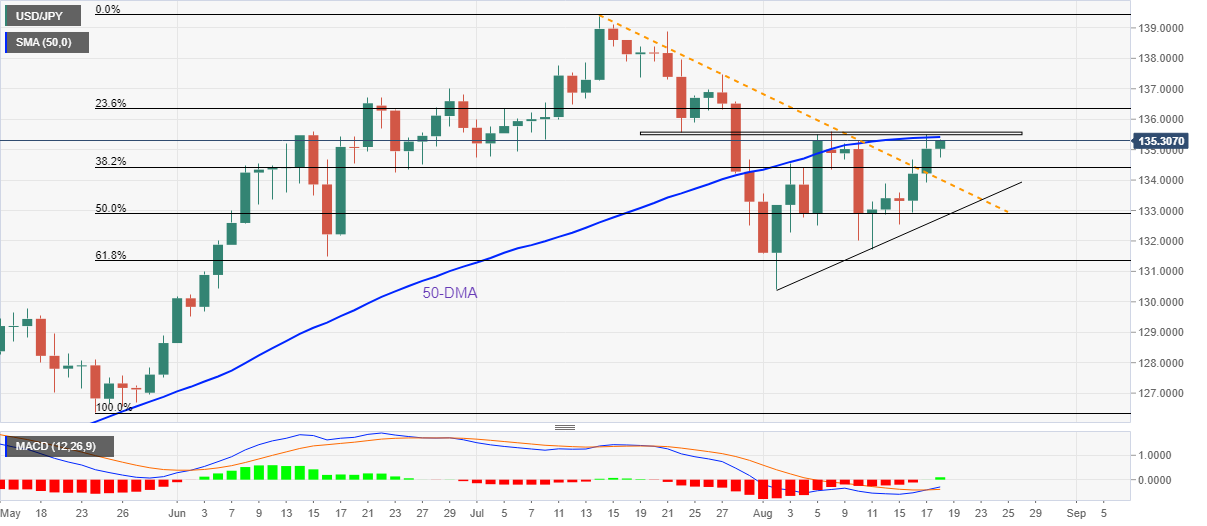
Trend: Further upside expected
Economists are turning even more bearish on China’s growth outlook, cutting their 2022 GDP forecasts and moving far away from the government’s original target of around 5.5% set for the year, per Bloomberg.
Key takeaways
“Goldman Sachs Group Inc lowered its projection for gross domestic product growth to 3% from 3.3% while Nomura Holdings Inc slashed its forecast to 2.8% from 3.3%.”
Nomura economists said, “China’s growth in the second half is likely to be significantly hampered by the Covid Zero policy, as well as a deteriorating property sector, local governments’ worsening fiscal conditions, and a likely slowdown in export growth.”
Related reads
- USD/CNH snaps two-day downtrend near 6.7950 amid concerns over PBOC, Taiwan
- PBOC has limited room to ease amid inflation, capital flight concerns – Reuters
Economists at Danske Bank expect rising concerns for global recession, a crackled housing market and a murkier Swedish growth outlook to weigh on the SEK over the coming 6-12 months forecasting EUR/SEK at 11.00.
Dropping the case for emergency hikes
“We expect the Riksbank to hike 75 bps in both September and November before they go on hold at 2.25%. While this represents frontloaded tightening, it is slightly below market pricing and as such, at least on the margin, SEK negative.”
“Rising concerns for global recession remains a medium-term headwind for the SEK alongside a crackled housing market and with that a murkier Swedish growth outlook which at the end of the day will cap interest rates.”
“Forecast: 10.50 (1M), 10.60 (3M), 10.80 (6M), 11.00 (12M).”
CME Group’s advanced figures for crude oil futures markets noted traders scaled back their open interest positions for the third consecutive session on Wednesday, this time by nearly 22K contracts. Volume followed suit and shrank by around 214.5K contracts, offsetting two daily builds in a row.
WTI risks further pullbacks
Wednesday’s inconclusive price action and marginal gains in the WTI were amidst declining open interest and volume, which could point to further lack of direction in the very near term and even the continuation of the downtrend. That said, the next support of note now emerges at the round level at the $80.00 mark per barrel.
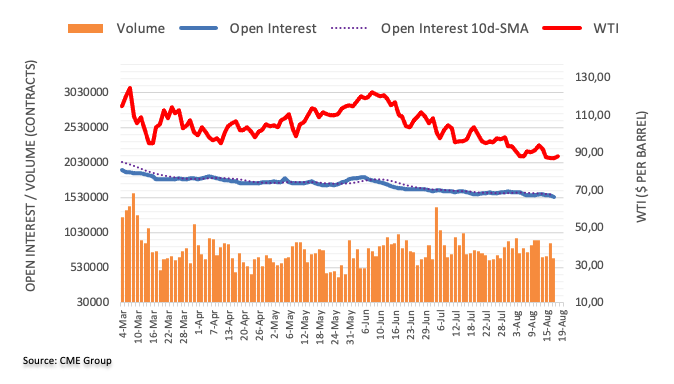
Economists at Danske Bank pencil in a rise in EUR/NOK over the coming one-three months on rising global recession risks but forecast a secular weakening trend amid the outlook for elevated inflation and commodity prices in the years ahead.
NOK forecast lowered but keeping a similar profile
“While we have embedded a NOK rebound into our forecast for some time we are not convinced that the latest NOK strengthening marks a sustainable turning point. As a trigger, we look for central banks globally to pivot into a more dovish stance and we are not yet convinced we are at this stage yet.”
“We forecast EUR/NOK at 10.00 in 1M (from 10.50), 10.40 in 3M (from 10.60), 10.20 in 6M (from 10.40) and 9.80 in 12M (from 10.00).”
- Gold price portrays corrective pullback amid sluggish Asian session.
- Fears of economic slowdown in China, firmer yields exert downside pressure on XAU/USD.
- Fed Minutes failed to impress DXY bulls amid mixed US data.
- Second-tier US data, risk catalysts could entertain gold traders.
Gold price (XAU/USD) prints mild gains during the sluggish trading session amid early Thursday morning in Europe. In doing so, the bright metal snaps a four-day downtrend while bouncing off the weekly low, up 0.15% intraday near $1,764 by the press time.
The bullion’s latest rebound pays a little heed to the market’s risk-off mood, as well as the US Dollar Index (DXY) strength. The reason could be linked to the recession woes in the US and the firmer Treasury yields, which in turn drive the rush towards a traditional haven.
Also weighing on the market sentiment are the concerns surrounding China, as well as the chatters that the dragon nation braces for more stimulus. Goldman Sachs and Nomura both cut Beijing’s growth forecasts after witnessing the latest jump in the covid numbers. Also negatively impacting the Chinese economy are the doubts over the People’s Bank of China’s (PBOC) capacity to tame recession woes, as conveyed by Reuters. Additionally, comments from the US Trade Representative’s office stating, “Early this autumn, the US and Taiwan will begin formal negotiations on a trade initiative,” seem to renew the fears of the US-China tussle and also roil the mood.
On Wednesday, the Minutes of the latest Federal Open Market Committee (FOMC) showed, per Reuters, that officials were ready to slow the pace of interest rate hikes in tandem with signals of a slowdown in inflation. The news also added, “In their July meeting minutes released on Wednesday, Fed officials said the pace of future rate hikes would depend on incoming economic data, as well as assessments of how the economy was adapting to the higher rates already approved.”
After the Fed Minutes’ release, the US 10-year Treasury yields retreated from the weekly top surrounding 2.90%, down two basis points (bp) to 2.89% by the press time. That said, Wall Street registered losses and weighed down the stocks in Asia-Pacific, as well as the stock futures of late.
Given the doubts over the XAU/USD pair’s rebound, the second-tier US data, like, the weekly prints of the US Initial Jobless Claims and Philadelphia Fed Manufacturing Survey for August, will be closely watched. Above all, recession fears and Fed concerns will be crucial to watch for fresh impulse.
Technical analysis
Despite the latest corrective pullback from the weekly low, mainly backed by the oversold RSI (14), the gold price is likely to remain weak until the quote crosses the one-week-old resistance line, at $1,775 by the press time.
Even if the XAU/USD rises past $1,775, the 50-SMA on the four-hour chart and the weekly peak, respectively around $1,785 and $1,804, appear the last defense of the XAU/USD sellers.
On the contrary, a convergence of the 200-SMA and the previous resistance line from June 17, close to $1,751, appears a tough nut to crack for gold sellers.
Should the gold bears manage to conquer the $1,751 support convergence, the metal could fall to late July swing high near $1,740 before directing the sellers towards the yearly low of near $1,680.
Gold: Four-hour chart
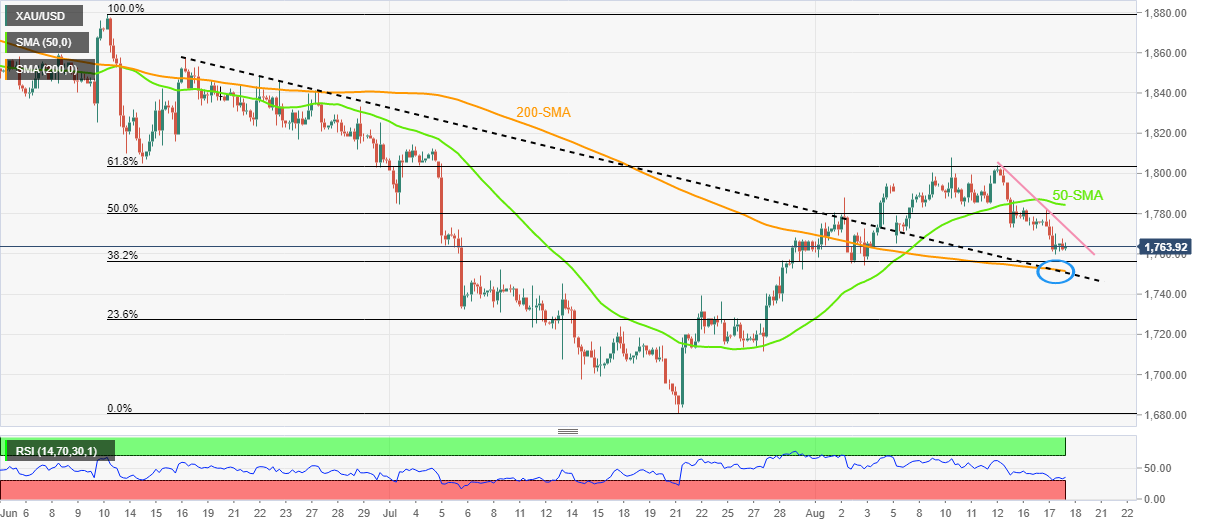
Trend: Further weakness expected
Gold price clings to 21-Daily Moving Average (DMA) at $1,764. A daily close below here would clear the way for further downside, FXStreet’s Dhwani Mehta reports.
The path of least resistance is south
“In Thursday’s trading so far, the price has breached the 21 DMA, now at $1,764, eyeing deeper declines. The immediate cushion is placed at the August 3 low of $1,754, below which the $1,750 psychological level will be tested.”
“Recapturing 21 DMA will be critical for bulls to hold ground. The next significant hurdle for buyers is aligned at the bearish 50 DMA at $1,777. Further, the wedge support-turned-resistance at $1,789 will come into play for the recovery to extend towards the $1,800 threshold.”
European Central Bank (ECB) executive board member Isabel Schnabel said on Thursday, “the outlook for the ECB has not changed.”
Additional quotes
"Inflation concerns before the July rate hike have not been alleviated."
"Growth is going to slow."
"Technical recession in the euro area is possible."
"Inflation could still accelerate in the short term."
Market reaction
As of writing, EUR/USD trades within a close proximity to the daily lows near 1.0165, down 0.10% on the day.
Open interest in gold futures markets rose by around 2.5K contracts on Wednesday following two daily drops in a row according to preliminary readings from CME Group. In the same line, volume increased by around 44.3K contracts, reversing the previous pullback.
Gold now targets the August low at $1,754
Gold prices extended the weekly leg lower on Wednesday amidst rising open interest and volume. That said, further weakness appears on the cards in the very near term and with the immediate support at the August low at $1,754 per ounce troy (August 3).
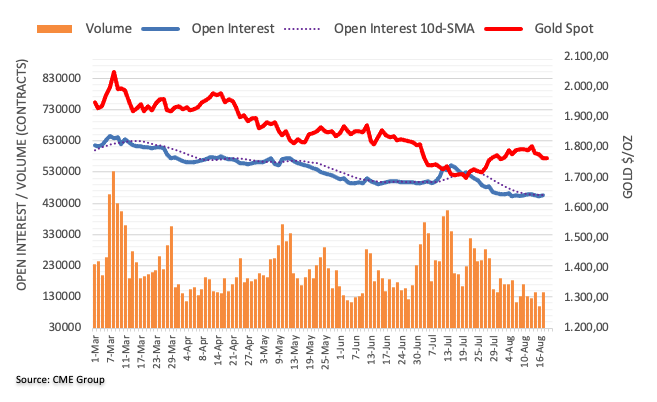
- USD/TRY remains sidelined as traders await CBRT’s verdict.
- Sluggish US dollar, market’s inaction also restrict the pair’s moves.
- Turkish central bank is expected to keep rates steady at 14% despite record inflation.
- Second-tier US data, risk catalysts could also entertain traders.
USD/TRY treads water around 17.95, marking one more day of indecision below the 18.00 threshold heading into Thursday’s European session. The Turkish lira (TRY) pair’s latest inaction could be linked to the mixed plays surrounding the global economy and the nation’s ability to keep rates on hold despite witnessing record-high inflation.
It’s worth noting that the latest Reuters poll suggests inaction by the Central Bank of the Republic of Türkiye (CBRT). Turkey's central bank is expected to hold its policy rate unchanged at 14% for an eighth meeting next week, a Reuters poll showed on Friday, in the face of a global tightening cycle and rampant inflation at nearly 80% that shows no signs of falling.
On the other hand, the Minutes of the latest Federal Open Market Committee (FOMC) showed, per Reuters, that officials were ready to slow the pace of interest rate hikes in tandem with signals of a slowdown in inflation. The news also added, “In their July meeting minutes released on Wednesday, Fed officials said the pace of future rate hikes would depend on incoming economic data, as well as assessments of how the economy was adapting to the higher rates already approved.”
After the Fed Minutes’ release, the US 10-year Treasury yields retreated from the weekly top surrounding 2.90%, down two basis points (bp) to 2.89% by the press time.
Elsewhere, the latest jump in China’s covid numbers and the doubts over the People’s Bank of China’s (PBOC) capacity to tame recession woes also weigh on the market sentiment, which in turn underpin the US dollar’s haven demand.
Additionally, comments from the US Trade Representative’s office stating, “Early this autumn, the US and Taiwan will begin formal negotiations on a trade initiative,” seem to renew the fears of the US-China tussle and also roil the mood.
Looking forward, the CBRT verdict is less likely to impact the USD/TRY prices unless providing any surprises. Following that, the weekly prints of the US Initial Jobless Claims and Philadelphia Fed Manufacturing Survey for August could entertain the pair traders. Above all, recession fears and Fed concerns will be crucial to watch for fresh impulse.
Technical analysis
RSI (14) conditions hint that the buyers are running out of steam as they’ve been failing to cross the 18.00 hurdle. However, higher lows in recent days join bullish MACD signals to keep buyers hopeful until the quote stays beyond the monthly support line near 17.75.
- AUD/USD keeps its range close to weekly lows above 0.6900.
- USD trades firmer amid risk-off mood, Australian jobs weigh on the aussie.
- The aussie could see a dead cat bounce but 50 DMA remains at risk.
AUD/USD is off the lows but remains in the red, as bears lick their wounds following the downside surprise in the Australian headline Employment Change data.
The Australian Employment Change arrived at -40.9K in July vs. 25K expected and 88.4K previous. The country’s participation rate dropped to 66.4% vs. a steady reading of 66.8% expected.
The jobs data combined with Wednesday’s downbeat Wage Price Index could likely dissuade the RBA to go aggressive on its policy tightening path. Additionally, the US-China trade risks over Taiwan and recession fears also add to the pain in the higher-yielding aussie dollar.
The renewed strength in the US dollar amid risk-aversion and cautious Fed minutes will also keep AU/USD on a slippery slope ahead of the Jobless Claims and Fedspeak.
From a short-term technical perspective, the pair failed to find acceptance above the mildly bullish 21-Daily Moving Average (DMA) at 0.6979.
Since then, sellers have flexed their muscles, putting the critical 50 DMA support of 0.6896 at risk. Bears need to crack the recent range lows near 0.6910 to take on the latter.
The 14-day Relative Strength Index (RSI) is trading flatlined, having cut the midline for the downside on Wednesday, indicating that more losses could be in the offing.
Therefore, it could be safe to say that the sell-off triggered following a rejection at a critical horizontal 200-Daily Moving Average (DMA) at 0.7120 may be facing exhaustion.
AUD/USD: Daily chart
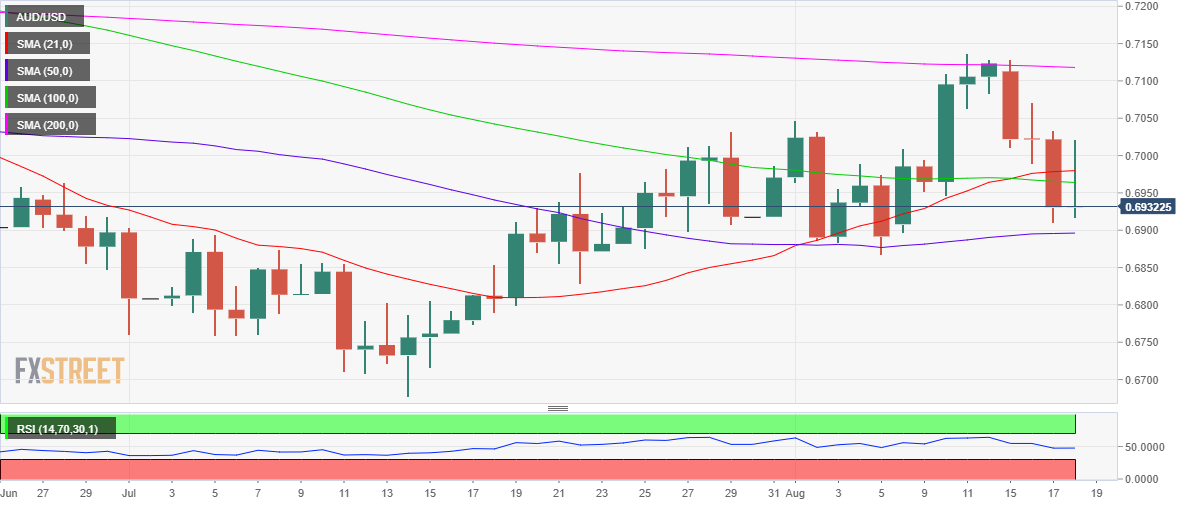
On the flip side, the immediate resistance is seen at the 0.6950 psychological level, above which the horizontal 100 DMA at 0.6963 will be challenged.
Further up, the upward-sloping 21 DMA at 0.6979 will then test the bearish commitments.
AUD/USD: Additional levels to consider
- WTI grinds higher around intraday top, keeps the previous day’s bounce off six-month low.
- Confirmation bullish chart pattern joins bullish MACD signals to keep oil buyers hopeful.
- 200-HMA, a fortnight-old resistance line can test the upside momentum.
- Sellers have a bumpy road to the south to witness.
WTI crude oil remains firmer around $87.65, up nearly 1.0% heading into Thursday’s European session, as the black gold buyers cheer the confirmation of the bullish chart pattern.
In addition to the falling wedge breakout, bullish MACD signals also keep the WTI buyers hopeful of poking the 200-HMA hurdle of $89.50.
During the quote’s run-up beyond $89.50, the $90.00 threshold and a downward sloping resistance line from August 03, near $93.10, will be on the buyer’s radar.
It’s worth mentioning that the quote’s successful upside past $93.10 needs validation from the previous Thursday’s peak near $94.35 to convince the bulls.
Meanwhile, pullback moves remain elusive until staying beyond the weekly falling wedge’s upper line, at $87.00 by the press time.
Even if the energy benchmark drop below $87.00, the recent multi-month low of $85.39 and the lower line of the wedge, close to $84.80 at the latest, could also challenge the bears.
Above all, the WTI bears should wait for a clear downside break of the October 2021 peak surrounding $84.90 to tighten the grip.
WTI: Hourly chart
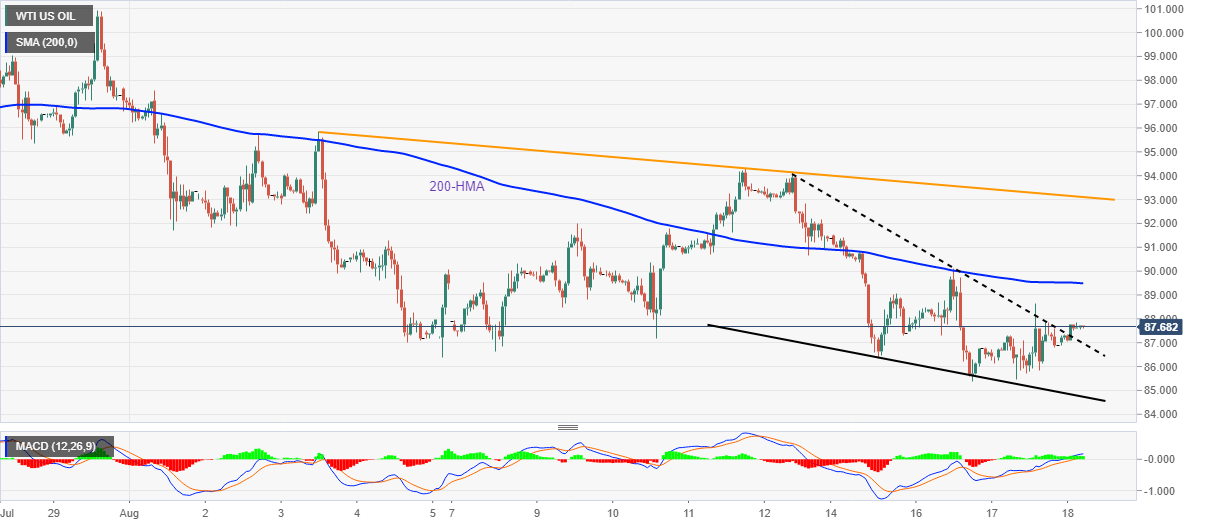
Trend: Further upside expected
- Asian equities remain on the back foot as their Western counterparts.
- China’s heatwave, covid conditions renew recession fears, Fed Minutes also weighed on sentiment.
- Downbeat Australia data, RBNZ’s Orr offered extra catalysts to please bears in Asia-Pacific.
Shares in the Asia-Pacific region track their global counterpart, pushed more by the China-linked headlines, as recession woes dilute sentiment during early Thursday in Europe.
Also keeping the equity traders worried were downbeat figures of Aussie employment data and downbeat comments from the Reserve Bank of New Zealand (RBNZ) Governor Adrian Orr. Above all, the Federal Open Market Committee (FOMC) meeting minutes amplified the economic slowdown concerns and weigh on the risk appetite.
That said, the MSCI’s index of Asia-Pacific shares ex-Japan drops 0.60% intraday while Japan’s Nikkei 225 prints 0.85% intraday losses by the press time.
It’s worth noting that the US 10-year Treasury yields retreat from the weekly top surrounding 2.90% to 2.88% down two basis points (bp) by the press time. That said, the yields jumped heavily the previous day before retreating after the Fed Minutes. Further, the S&P 500 Futures print mild losses after reversing from a four-month high the previous day.
Talking about China, Goldman Sachs and Nomura both cut the dragon nation’s growth forecasts after witnessing the latest jump in the covid numbers. Also negatively impacting the Chinese economy are the doubts over the People’s Bank of China’s (PBOC) capacity to tame recession woes. Additionally, comments from the US Trade Representative’s office stating, “Early this autumn, the US and Taiwan will begin formal negotiations on a trade initiative,” seem to renew the fears of the US-China tussle and also roil the mood.
Amid these plays, stocks in China and New Zealand lead the bears whereas India and Indonesia appear to lack momentum as policymakers try to spread optimism, despite the macro woes.
Elsewhere, the US Dollar Index (DXY) stays firmer and the prices of gold print mild gains. However, oil remains the biggest gainer, with a nearly 1.0% upside, amid fears of supply crunch.
Moving on, a light calendar requires the risk catalysts to keep the driver’s seat.
- GBP/USD extends the previous day’s pullback from 21-DMA as MACD teases bears.
- Weekly low holds the key to further downside towards May’s bottom.
- Previous resistance line from April appears a tough nut to crack for bears.
- Two-month-old resistance line, 100-DMA adds to the upside filters.
GBP/USD holds lower ground near 1.2030, flirting with the intraday bottom, as bears seek fresh clues. Even so, the bearish MACD signals joins the cable pair’s failure to cross the 21-DMA hurdle to favor the downside momentum during Thursday’s European session.
That said, the weekly low around the 1.2000 round figure appears an immediate challenge for the sellers to tackle. Following that, a south-run towards May’s monthly low near 1.1930 can’t be ruled out.
It’s worth noting, however, that the quote’s weakness past 1.1930 seems to have limited downside room as the resistance-turned-support from April, at 1.1880 by the press time, will challenge the GBP/USD bears.
Should the quote drops below 1.1880, the odds of witnessing the fresh yearly low, currently around 1.1760, can’t be ruled out.
Alternatively, recovery remains elusive below the 21-DMA level of 1.2110. Even so, a two-month-old resistance line near 1.2260 could challenge the GBP/USD bulls.
If at all the Cable pair crosses the 1.2260 hurdle, the 100-DMA level of 1.2382 will be the last defense for the bears.
GBP/USD: Daily chart
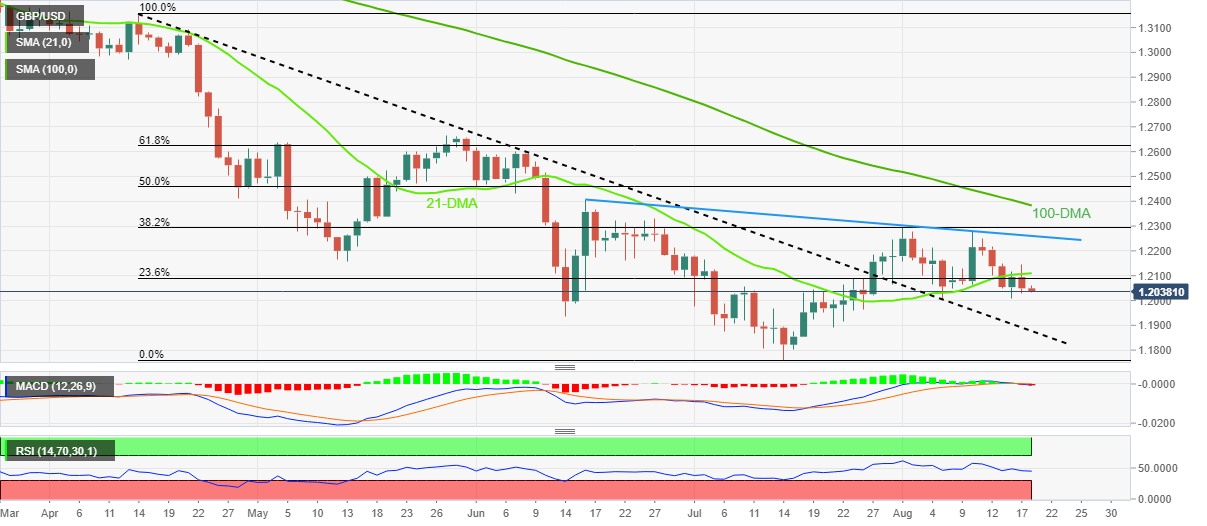
Trend: Further weakness expected
- Steel price drops to the lowest levels in more than two weeks amid demand, profit concerns.
- Rationing of electricity due to heat wave restricts profit concerns and disappoints steel makers.
- Doubts over PBOC’s ability to revive economy, the jump in coronavirus cases exert downside pressure on the metal price.
Steel price stands on the slippery ground as bears cheer grim concerns surrounding the largest metal user China during early Thursday in Europe. Also keeping the steel bears hopeful is the lack of major data/events that allowed the traders to finally consolidate the metal’s recent gains after holding it tight for multiple days.
That said, Steel Rebar futures on the Shanghai Futures Exchange (SFE) fell 2.1% whereas the hot-rolled coil slumped 2.6%. Further, stainless steel loses around 3.4% to revisit the monthly low.
A forced stop in steel manufacturing, amid heat wave in China, joins the pre-established emission-linked limited to reduce the profit motive of the steel manufacturers, which in turn dashed optimism surrounding the metal. Further, rising steel scrap prices and supply crunch could also be added to the list of catalysts negatively affecting metal prices.
“A record-breaking heat wave gripping several regions in top steel producer China since mid-July has caused power shortages, forcing authorities to ration electricity with residential use prioritized over industrial consumption,” said Reuters.
Also, covid conditions recently worsened in China, renewing fears of another round of virus-led lockdowns, which in turn weigh on the metal prices. “China’s Covid cases surged to a three-month high, driven by a worsening outbreak in the tropical Hainan province that has become the country’s biggest since Shanghai was shut down in the spring,” said Bloomberg.
Elsewhere, headlines surrounding the People’s Bank of China (PBOC) and Taiwan also raise fears concerning China and lured steel bears. “PBOC has limited room to ease due to concerns over inflation and capital flight,” Reuters reported late Wednesday, citing PBOC insiders. The news also mentioned that the economic recovery looking increasingly shaky.
The latest comments from the US Trade Representative’s office stating, “Early this autumn, the US and Taiwan will begin formal negotiations on a trade initiative,” seem to renew the fears of the US-China tussle and favor the USD/CNH buyers.
Furthermore, the statements from a top US diplomat for East Asia Kritenbrink also add to the woes of the Sino-American tension over Taiwan. The diplomat said, “The US is committed to maintaining peace and stability across the Taiwan Strait.”
Alternatively, China Securities News mentioned, “China may issue 1.5 trillion yuan in additional debt as part of an investment push.” The news, however, failed to improve market sentiment and dragged the steel prices towards the south.
- USD/INR extends the previous day’s rebound, approaches top of fortnight-old trading range.
- 50-DMA adds strength to the range support, descending resistance line from late July adds to the upside filter.
- Sluggish MACD, RSI hints at further grinding of the pair.
USD/INR picks up bids to 79.65 during the initial Indian session on Thursday, up for the second consecutive day. Even so, the rupee (INR) pair remains inside a fortnight-long trading range between 79.00 and 79.70.
That said, the USD/INR pair’s latest run-up approaches the stated range’s upper line, at 79.70. However, sluggish MACD and RSI hint at a lack of further upside momentum.
Even if the quote rises past 79.70, a downward sloping resistance line from July 28, at 79.85, will challenge the USD/INR bulls.
In a case where the pair remains firmer past 79.70, it can aim for the 80.00 threshold, as well as the recent high surrounding 80.20.
Alternatively, the pullback could retest the 79.50 level before revisiting the 50-DMA support around 79.10.
However, the USD/INR pair’s further weakness will be challenged by the stated channel’s lower line, at 79.00. Following that, the monthly low near 78.40 could lure the pair sellers.
In a case where the USD/INR prices remain weak past 78.40, the bears could gain control.
USD/INR: Daily chart
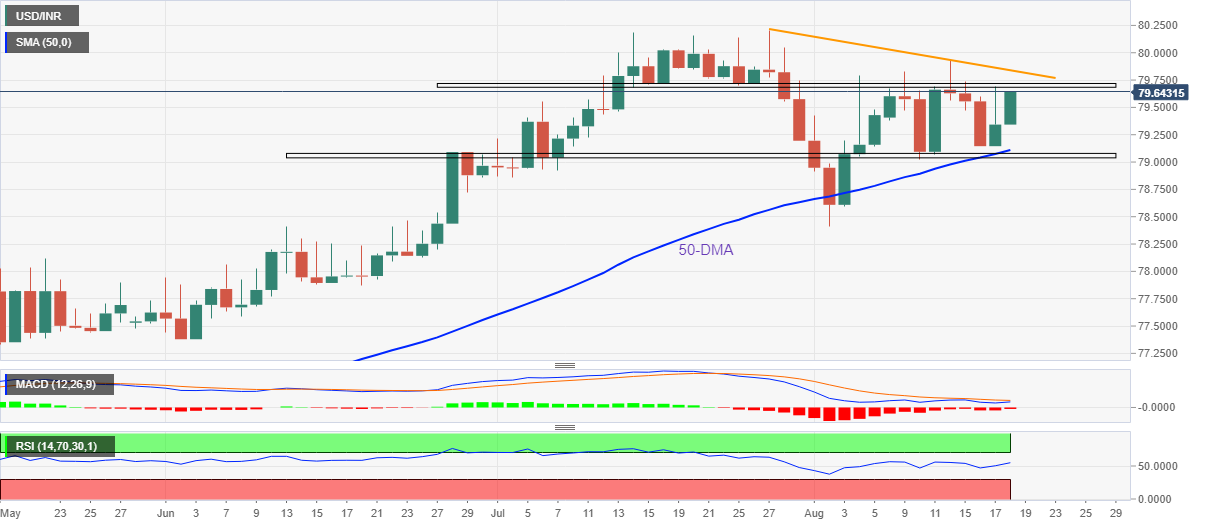
Trend: Limited upside expected
- EUR/USD turns south after rejection at 1.0200 as risk-off flows dominate.
- US dollar finds demand, despite weaker yields and cautious Fed minutes.
- The euro looks vulnerable amid the deepening EU energy crisis and growth risks.
EUR/USD is heading towards 1.0150, on the defensive amid a risk-averse environment in Thursday’s trading so far.
The US dollar Is finding renewed safe-haven bids, courtesy of brewing geopolitical tensions between the US and China after the former announced formal trade negotiations with Taiwan early this autumn. Additionally, investors assess the Fed July meeting minutes, which revealed that the world’s most powerful central bank is now facing a dilemma in taming inflation while averting recession.
On Wednesday, the dollar reversed gains, in an immediate reaction to a cautious shift in the Fed’s tone on policy guidance. The minutes hinted at a likely slow down in the pace of tightening amid mounting risks to economic growth. The US Treasury yields extended their previous advance amid recession fears while Wall Street indices tumbled.
Meanwhile, the euro bore the brunt of the downward revision to the Eurozone Q2 GDP print, which came in at 0.6% vs. 0.7% booked in the first estimate. Additionally, the deepening energy crisis in the old continent, thanks to the Russia-Ukraine war and excessive heatwave that has dried up the Rhine river in Germany.
The cargoes carrying coal, food supplies, etc. have been cut down ever since the water level in the Rhine fell below the critical 40 cm level. Markets are expecting the water level to rise above that level during the weekend, which could bring some relief to the shared currency.
Looking ahead, the Eurozone final inflation, US weekly Jobless claims and the speeches by the Fed and ECB policymakers will be closely followed for fresh trading impetus in the main currency pair.
EUR/USD: Technical outlook
“In the 4-hour chart, the risk remains skewed to the downside. The pair is developing below all of its moving averages, with the 20 SMA heading firmly south and crossing below the longer ones. Technical indicators, in the meantime, recovered from their intraday lows but remain below their midlines. Support levels: 1.0150 1.0105 1.0070. Resistance levels: 1.0205 1.0240 1.0280,” FXStreet’s Chief Analyst Valeria Bednarik explains.
EUR/USD: Additional technical levels to watch
- Gold price sees a dead cat bounce as the tide turns against bulls.
- Fed minutes, US-Taiwan geopolitical news and Chinese stimulus hopes lend support.
- XAU/USD bears need to crack the critical $1,755 level to extend the downside.
Gold price is seeing a relief rally on Thursday, as bears take a breather after the three-day sell-off. The renewed uptick in the bright metal draws support from Wednesday’s Fed minutes, which signaled that a dovish shift could be soon on the cards. The Fed minutes revealed that “as the stance of monetary policy tightened further, it likely would become appropriate at some point to slow the pace of policy rate increases while assessing the effects of cumulative policy adjustments on economic activity and inflation.” Further, concerns that a potential US-Taiwan trade agreement could re-kindle geopolitical tensions with China, revived the safe-haven demand for the precious metal. The bullion also finds comfort from increased expectations of more Chinese stimulus, as they seek to boost growth. Although the recent strength in the US dollar could regain traction amid risk aversion, which may hinder the recovery in XAU/USD price.
Also read: Gold Price Forecast: Bears pressuring a critical Fibonacci support
Gold Price: Key levels to watch
The Technical Confluence Detector shows that the gold price is battling strong support around $1,764, which is the convergence of the Fibonacci 23.6% one-day, Bollinger Band one-day Middle and Fibonacci 61.8% one-month.
The next support awaits at the previous day’s low of $1,762, below which sellers will aim for the pivot point one-week S2.
A breach of the pivot point one-day S1 at $1,755 will expose the critical $1,750 psychological cap.
Alternatively, the Fibonacci 38.2% one-day at $1,768 will offer immediate resistance, followed by the previous week’s low of $1,771.
The next significant upside barriers for the yellow metal are aligned at the Fibonacci 61.8% one-day at $1,775 and the SMA 50 one-day at $1,777.
Here is how it looks on the tool
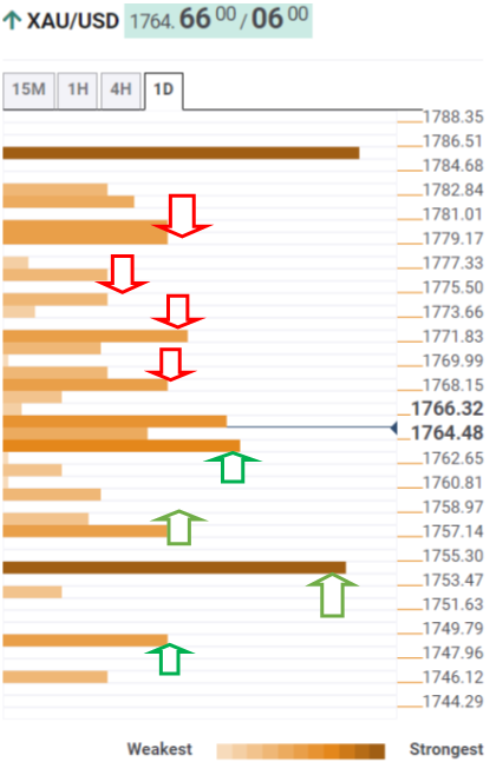
About Technical Confluences Detector
The TCD (Technical Confluences Detector) is a tool to locate and point out those price levels where there is a congestion of indicators, moving averages, Fibonacci levels, Pivot Points, etc. If you are a short-term trader, you will find entry points for counter-trend strategies and hunt a few points at a time. If you are a medium-to-long-term trader, this tool will allow you to know in advance the price levels where a medium-to-long-term trend may stop and rest, where to unwind positions, or where to increase your position size.
- NZD/USD holds lower ground during the four-day downtrend, fades initial corrective pullback.
- Nearly oversold RSI, multiple supports to challenge bears.
- Bulls have a bumpy road to return unless crossing 0.6335-40 area.
NZD/USD remains on the back foot, despite marking a corrective pullback after the Fed Minutes, as it prints the four-day downtrend. In doing so, the Kiwi pair seesaws around the lowest levels in eight days, recently easing to 0.6275 during Thursday’s Asian session.
The kiwi pair’s latest weakness could be linked to the quote’s failure to cross the previous support line from mid-July, around 0.6290 by the press time. However, nearly oversold RSI (14) challenges the NZD/USD bears of late.
With this, the 200-SMA and a four-week-old support line, respectively near 0.6250 and 0.6235, gain the NZD/USD seller’s attention.
Following that, a downward trajectory towards a late July swing low near 0.6190 can’t be ruled out.
Alternatively, the support-turned-resistance near 0.6290 guards the Kiwi pair’s immediate upside.
Also acting as a short-term upside hurdle is the convergence of the 100-SMA and 38.2% Fibonacci retracement level, around 0.6315.
It should be noted that a downward sloping resistance line from August 12, close to 0.6335-40, appears the last defense of the NZD/USD bears.
NZD/USD: Four-hour chart
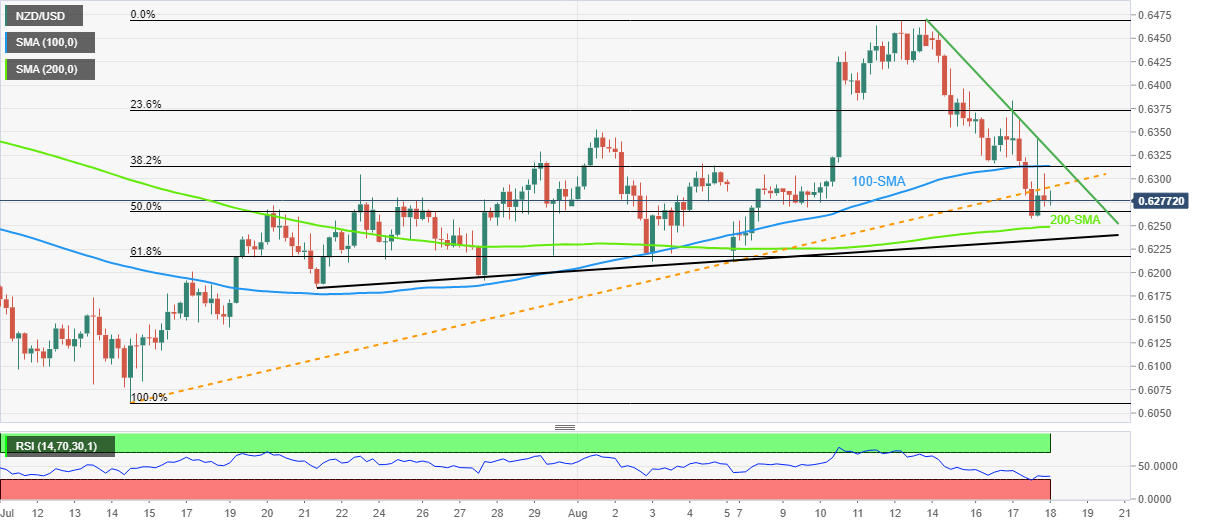
Trend: Further weakness expected
| Raw materials | Closed | Change, % |
|---|---|---|
| Silver | 19.8 | -1.76 |
| Gold | 1762.25 | -0.76 |
| Palladium | 2133.93 | -0.99 |
- USD/CNH picks up bids to mark the first daily gains in three.
- Doubt’s over PBOC’s capacity raise concern about 1.5 trillion yuan stimulus.
- US braces for stronger trade ties with Taiwan but doesn’t undermine the “One China” policy.
- Yields decline as Fed Minutes signaled easing hawkish bias among policymakers.
USD/CNH prints the first daily gains in three around mid-6.7900s as the offshore Chinese yuan (CNH) eases amid mixed concerns during Thursday’s Asian session. Among them, headlines surrounding the People’s Bank of China (PBOC) are the important ones.
“PBOC has limited room to ease due to concerns over inflation and capital flight,” Reuters reported late Wednesday, citing PBOC insiders. The news also mentioned that the economic recovery looking increasingly shaky.
Elsewhere, China Securities News mentioned, “China may issue 1.5 trillion yuan in additional debt as part of an investment push.”
The latest comments from the US Trade Representative’s office stating, “Early this autumn, the US and Taiwan will begin formal negotiations on a trade initiative,” seem to renew the fears of the US-China tussle and favor the USD/CNH buyers.
Furthermore, the statements from a top US diplomat for East Asia Kritenbrink also add to the woes of the Sino-American tension over Taiwan. The diplomat said, “The US is committed to maintaining peace and stability across the Taiwan Strait.”
On the other hand, the Fed Minutes probed the US dollar bulls the previous day as it said, per Reuters, that officials were ready to slow the pace of interest rate hikes in tandem with signals of a slowdown in inflation. However, firmer US Retail Sales for July seemed to have kept the US dollar bulls hopeful.
Against this backdrop, the US 10-year Treasury yields retreat from the weekly top surrounding 2.90% to 2.88% down two basis points (bp) by the press time. Further, the S&P 500 Futures print mild losses after reversing from a four-month high the previous day.
Moving on, USD/CNH pair traders should watch for risk catalysts for fresh directions ahead of the weekly prints of the US Initial Jobless Claims and Philadelphia Fed Manufacturing Survey for August.
Technical analysis
A failure to stay beyond the two-month-old resistance line, around 6.8000 by the press time, signals the USD/CNH pair’s declines towards the 21-DMA support of 6.7633.
The People’s Bank of China (PBOC) has limited room to ease due to concerns over inflation and capital flight, Reuters reported late Wednesday, citing PBOC insiders.
Additional takeaways
Economic recovery looking increasingly shaky.
PBOC seen easing further in response.
PBOC likely to lower the key lending rate next week to spur demand.
Imminent RRR cut seen unlikely due to ample cash in the economy.
Related reads
- USTR: To begin formal negotiations on a trade initiative with Taiwan in early autumn
- AUD/USD slides towards 0.6900 on surprise fall in Australia’s Employment Change
- AUD/JPY sellers attack a two-week-old support line on downbeat Australia employment data.
- Australia’s Employment Change marked surprise slump in July, Unemployment Rate eased.
- MACD, RSI suggest sluggish conditions, which in turn challenge bears.
- 200-HMA, previous support line restricts immediate upside.
AUD/JPY remains pressured near 93.50 as sellers attack a fortnight-long support line during Thursday’s Asian session. In doing so, the cross-currency pair holds onto the previous day’s losses but maintains the weekly negative by the press time.
Australia’s headline Employment Change dropped to -40.9K versus 25K expected and 88.4K prior while Unemployment Rate eased to 3.4% versus 3.5% expected and prior. Also, the Participation Rate declined to 66.4% versus 66.8% market forecasts and previous readings.
That said, the sluggish MACD and RSI (14) also challenge the AUD/JPY sellers, in addition to the two-week-old support line near 93.50.
If the quote drops below 93.50, the odds of its slump towards the 61.8% Fibonacci retracement level of August 02-12, around 92.30, can’t be ruled out.
It’s worth noting that the AUD/JPY pair’s weakness past 92.30 makes it vulnerable to testing the 90.00 threshold, with the monthly low near 90.50 likely acting as an intermediate halt.
Alternatively, a convergence of the 200-HMA and 23.56% Fibonacci retracement level, around 94.10, guards the quote’s immediate upside.
Following that, the previous support line from August 03, around 95.00, precedes the monthly peak of 95.10, to challenge the AUD/JPY pair’s further advances.
Overall, AUD/JPY is likely to remain firmer but the upside room appears limited.
AUD/JPY: Hourly chart
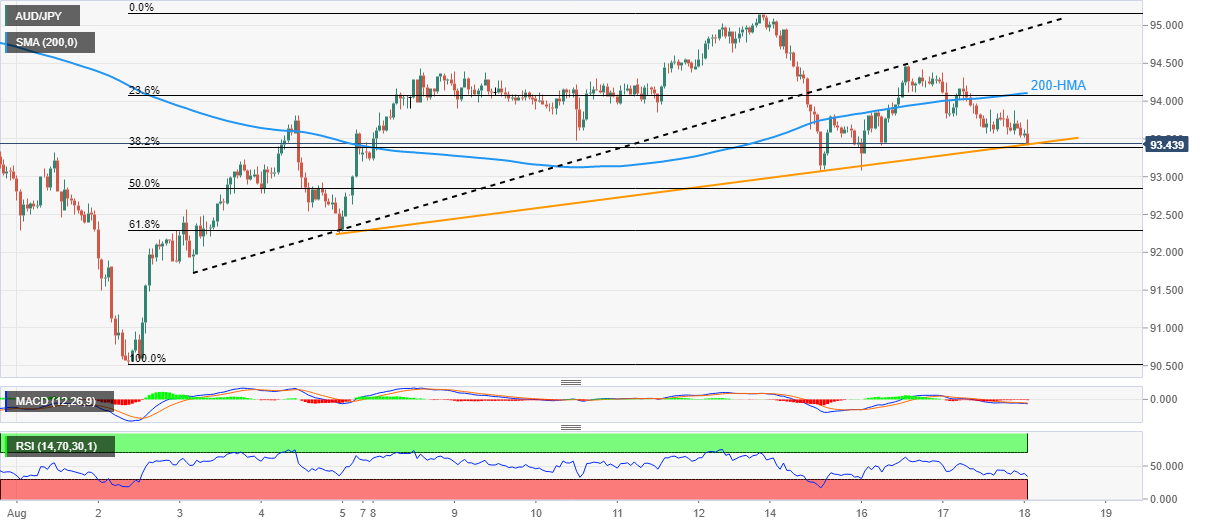
Trend: Further weakness expected
- AUD/USD takes offers to refresh intraday low, stays pressured around weekly bottom.
- Australia’s Employment Change marked -40.9K figure, Unemployment Rate eased to 3.4% in July.
- Market sentiment remains divided amid softer yields, mixed equities.
- Headlines surrounding China, Taiwan joined slightly dovish Fed Minutes to test bears earlier.
AUD/USD bears the burden of another downbeat job number during Thursday’s Asian session, not to forget the fresh concerns surrounding Taiwan. That said, the Aussie pair remains pressured around 0.6935, after refreshing the daily low to 0.6924, by the press time.
Australia’s headline Employment Change dropped to -40.9K versus 25K expected and 88.4K prior while Unemployment Rate eased to 3.4% versus 3.5% expected and prior. Also, the Participation Rate declined to 66.4% versus 66.8% market forecasts and previous readings.
Also read: Breaking: Aussie jobs data was dismal in whole and a weight on AUD/USD
It’s worth noting that Aussie Wage Price Index for the second quarter (Q2) exerted downside pressure on the AUD/USD prices the previous day. That said, the data flashed 0.7% QoQ growth in Q2 to mark the fastest pace of growth since September 2014. However, the figures remain dismal when compared to the inflation numbers, which in turn justify the Reserve Bank of Australia’s (RBA) recently cautious comments.
Other than the Aussie employment data, mixed concerns surrounding China also favor AUD/USD sellers.
Earlier in the day, China Securities News mentioned, “China may issue 1.5 trillion yuan in additional debt as part of an investment push.”
On the contrary, the latest comments from the US Trade Representative’s office stating, “Early this autumn, the US and Taiwan will begin formal negotiations on a trade initiative,” seem to renew the fears of the US-China tussle and weigh on the sentiment.
On the same line were the statements from a top US diplomat for East Asia Kritenbrink who said, “The US is committed to maintaining peace and stability across the Taiwan strait.”
It should be noted that the Fed Minutes probed the US dollar bulls the previous day as it said, per Reuters, that officials were ready to slow the pace of interest rate hikes in tandem with signals of a slowdown in inflation. However, firmer US Retail Sales for July seemed to have exerted downside pressure on the AUD/USD prices.
Amid these plays, the US 10-year Treasury yields retreated from the weekly top surrounding 2.90%, down one basis point (bp) to 2.89% by the press time. Further, the S&P 500 Futures print mild losses after reversing from a four-month high the previous day.
Moving on, the weekly prints of the US Initial Jobless Claims and Philadelphia Fed Manufacturing Survey for August could entertain the DXY traders. Above all, recession fears and Fed concerns will be crucial to watch for fresh impulse.
Technical analysis
The strongest bearish MACD signals since late June join a clear downside break of the one-month-old bullish channel to keep AUD/USD bears hopeful of revisiting the yearly low of 0.6678. However, 50-DMA and May’s low, respectively around 0.6900 and 0.6825, could act as buffers to the south. Meanwhile, recovery remains elusive until the quote stays below the 200-DMA level around 0.7120. That said, the stated channel’s support line appears immediate resistance around 0.6990.
The Australian Bureau of Statistics (ABS) has published an overview of trends in the Australian labour market, with the Unemployment Rate a closely watched indicator. However, the miss in the headline is shocking and will hurt the Aussie for the day(s) ahead.
The data has arrived as follows:
- Australian Employment Change July: -40.9K (est 25.0K; prev 88.4K).
- Unemployment Rate July: 3.4% (est 3.5%; prev 3.5%). This is a slight positive in an otherwise poor outcome.
- Participation Rate July: 66.4% (est 66.8%; prev 66.8%). This could be a lifeline to the Aussie bulls.
AUD/USD is being pressured heavily by the dismal results in the data, losing some 20 pips on the knee jerk to test 0.6925. The market is now pricing in an 80% chance RBA will cut 25bpss in September.
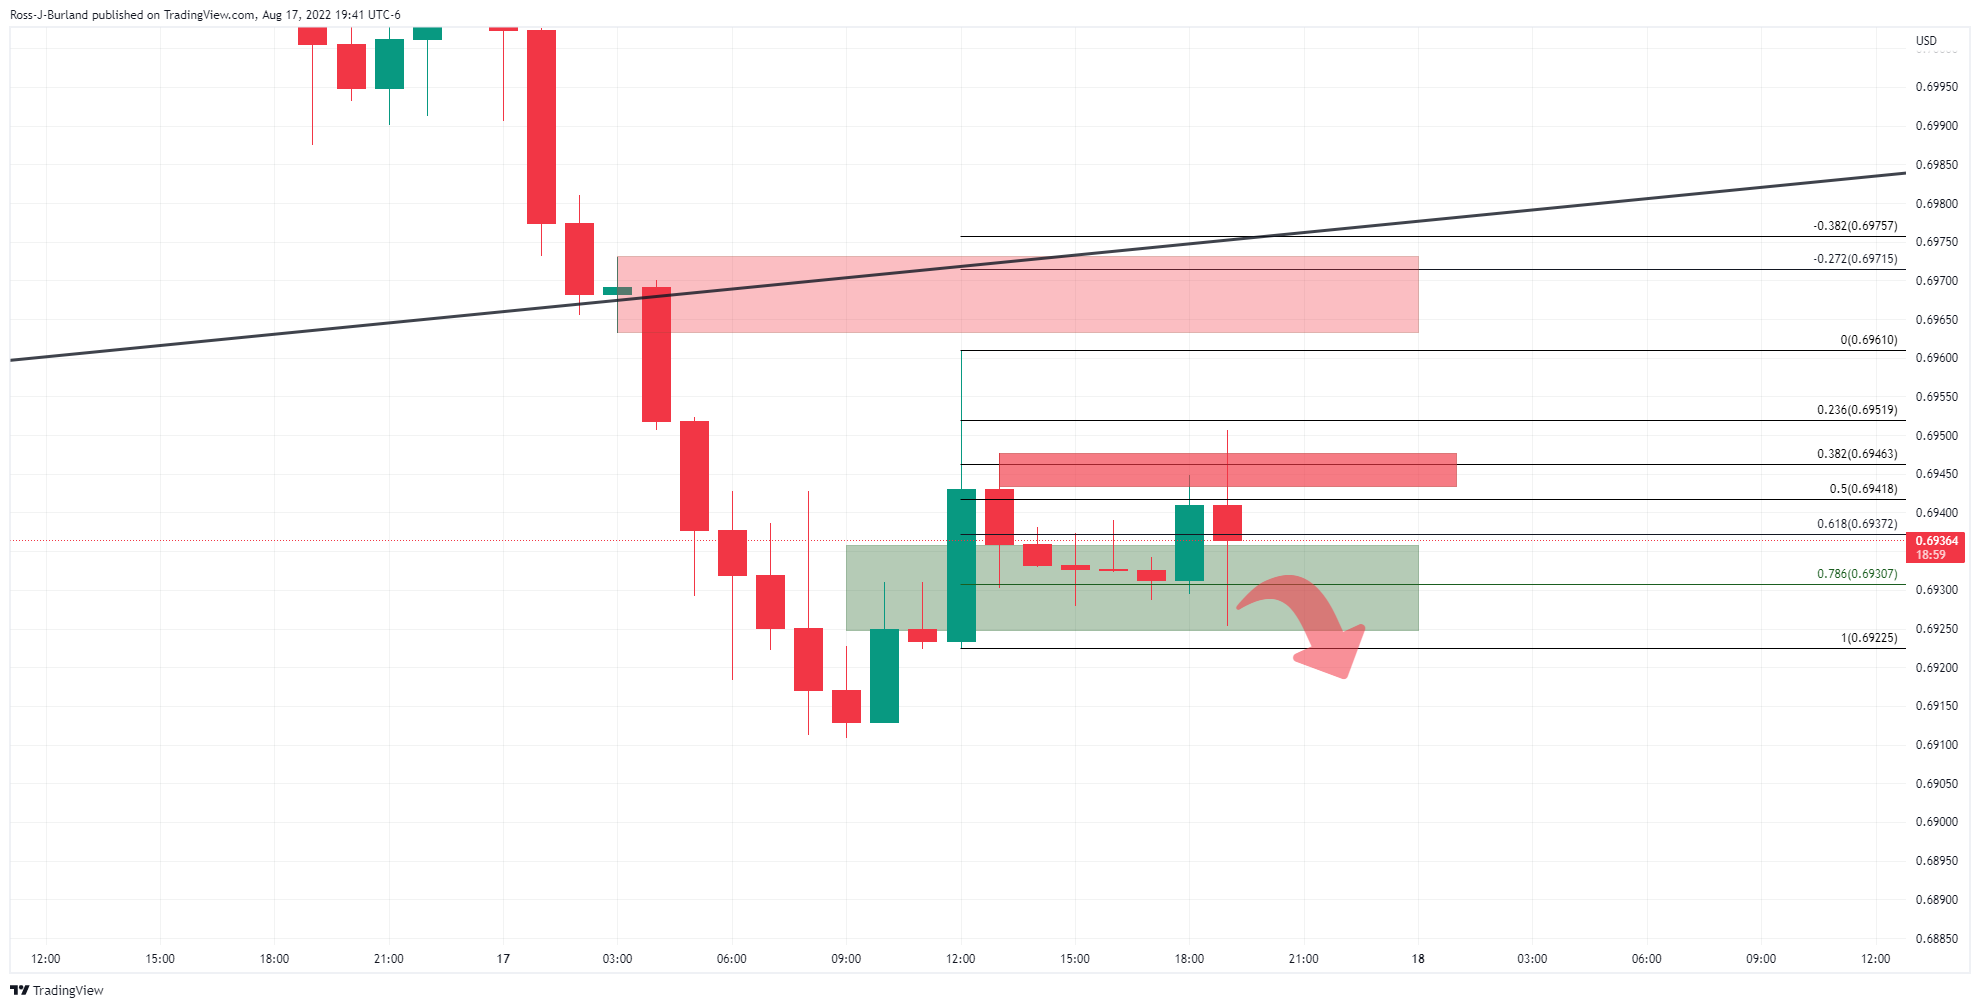
The hourly chart is pressured below the resistance and on the lower time frames, there is a bearish bias as follows:
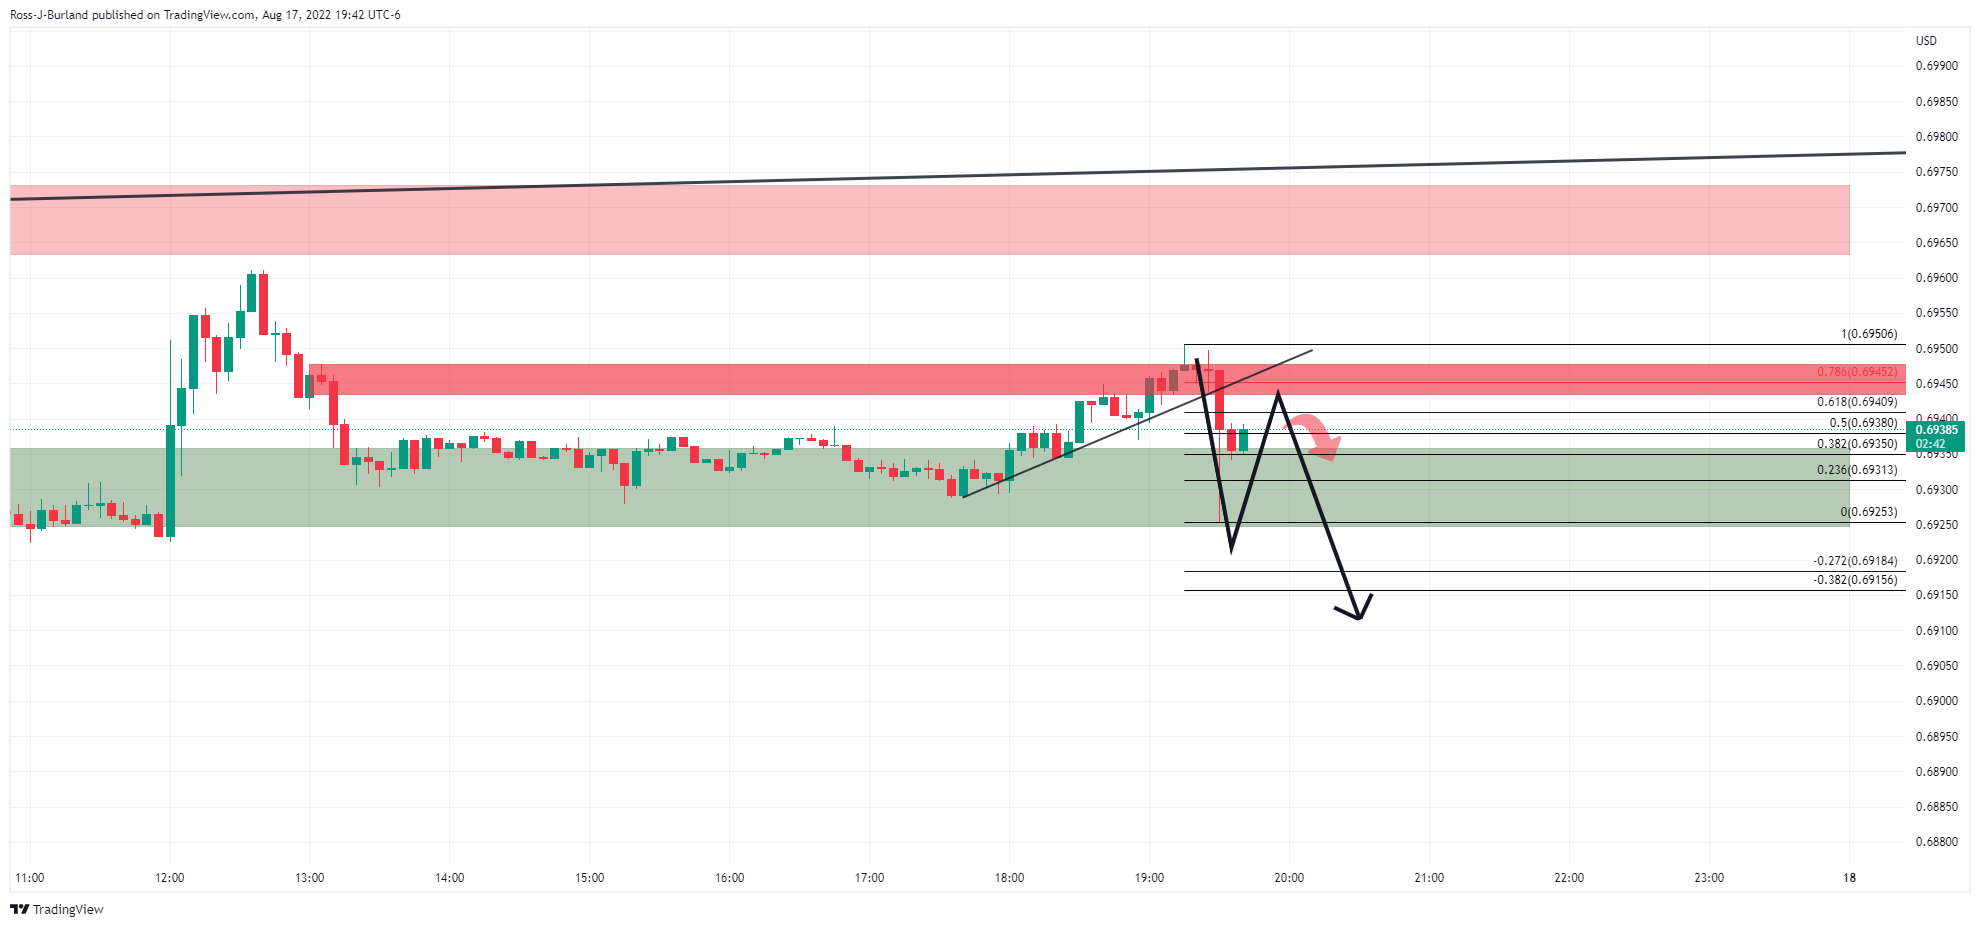
The 5-min chart is correcting the initial knee-jerk but should the bulls fail to break above the counter trendline resistance, then the most probable scenario is a downside extension below support for the session ahead.
About the jobs data
It is released about 15 days after the month's end and throws light on the overall economic conditions, as it is highly correlated to consumer spending and inflation. Despite the lagging nature of the indicator, it affects the Reserve Bank of Australia’s (RBA) interest rate decisions, in turn, moving the Australian dollar. The upbeat figure tends to be AUD positive.
The Unemployment Rate released by the Australian Bureau of Statistics is the number of unemployed workers divided by the total civilian labour force. If the rate hikes indicate a lack of expansion within the Australian labour market. As a result, a rise leads to a weakening of the Australian economy. A decrease in the figure is seen as positive (or bullish) for the AUD, while an increase is seen as negative (or bearish).
US Trade Representative Office said in a statement on Thursday that “early this autumn, the US and Taiwan will begin formal negotiations on a trade initiative.”
Separately, a top US diplomat for East Asia Kritenbrink said that “China has used House Rep. Speaker Pelosi's visit to Taiwan to try to change the status quo.”
Additional quotes
We are sticking to our one-China policy, the us policy toward Taiwan has remained consistent.
Taiwan's independence is not supported by the US.
We intend to strengthen our ties with Taiwan.
The US is committed to maintaining peace and stability across the Taiwan strait.
developing story ....
In recent trade today, the People’s Bank of China (PBOC) set the yuan (CNY) at 6.7802 vs. the estimate of 6.7789 and the previous 6.7863.
About the fix
China maintains strict control of the yuan’s rate on the mainland.
The onshore yuan (CNY) differs from the offshore one (CNH) in trading restrictions, this last one is not as tightly controlled.
Each morning, the People’s Bank of China (PBOC) sets a so-called daily midpoint fix, based on the yuan’s previous day's closing level and quotations taken from the inter-bank dealer.
- Silver price holds onto to recovery moves from weekly low amid oversold RSI.
- 100-SMA, four-day-old descending trend line challenge immediate run-up.
- $19.50 appears a tough nut to crack for XAG/USD bears.
Silver price (XAG/USD) prints a corrective pullback around $19.85, snapping a three-day downtrend. In doing so, the bright metal rebounds from a two-week low during Thursday’s Asian session.
The metal’s rebound seems to take clues from the nearly oversold RSI conditions.
That said, the XAG/USD buyers presently aim for the convergence of the 100-SMA and the weekly resistance line, around $20.00.
However, the 23.6% Fibonacci retracement of July-August upside and early August swing high, respectively near $20.25 and $20.50, could challenge the metal buyers afterward.
In a case where the XAG/USD prices remain firmer past $20.50, the odds of witnessing the fresh monthly high, currently around $20.90, can’t be ruled out.
On the contrary, multiple levels marked since early July joins the 200-SMA and 50% Fibonacci retracement level to highlight $19.50 as strong support. Following that, $18.90 and July’s low of $18.14 could lure the bullion bears.
Overall, silver prices are likely to witness a short-term upside but the bullish trend is far.
Silver: Four-hour chart
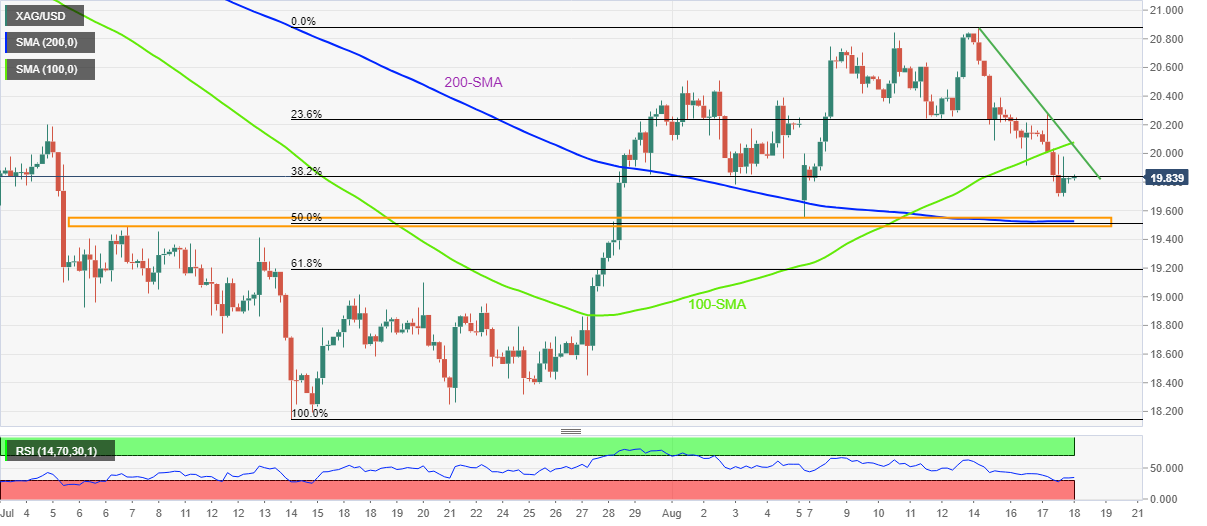
Trend: Limited upside expected
- US Dollar Index takes offers to refresh intraday low, pares Wednesday’s gains.
- Fed Minutes suggested a slowdown in the rate hike pace before long.
- Firmer US data, fears of recession keep buyers hopeful even as yields ease from weekly top.
US Dollar Index (DXY) renews intraday low around 106.50 as it consolidates weekly gains during Thursday’s Asian session. The greenback’s gauge rose notably on Monday and Wednesday amid fears of recession and firmer yields before the Fed Minutes triggered the latest pullback.
Minutes of the latest Federal Open Market Committee (FOMC) showed, per Reuters, that officials were ready to slow the pace of interest rate hikes in tandem with signals of a slowdown in inflation. The news also added, “In their July meeting minutes released on Wednesday, Fed officials said the pace of future rate hikes would depend on incoming economic data, as well as assessments of how the economy was adapting to the higher rates already approved.”
After the Fed Minutes’ release, the US 10-year Treasury yields retreated from the weekly top surrounding 2.90%, down one basis point (bp) to 2.89% by the press time.
In addition to the FOMC Minutes, the hopes of more stimulus from China also seemed to have exerted downside pressure on the US bond coupons, by way of a reduction in the haven demand. “China may issue 1.5 trillion yuan in additional debt as part of an investment push,” mentioned china securities news. However, doubts over China’s ability to overcome recession fears, especially after the covid woes and heat wave, seem to keep the risk aversion on the table.
Also contributing to the sour sentiment could be the latest comments from the US Trade Representative’s office stating that early this autumn, the US and Taiwan will begin formal negotiations on a trade initiative.
The bond coupons earlier rose after the US Retail Sales marked a mostly upbeat figure for July. US Retail Sales flashed 0.0% growth during July, versus 0.1% expected and a downwardly revised 0.8% prior. The Retail Sales Control Group figures, however, rose to 0.8% compared to 0.6% market consensus and 0.7% prior (revised from 0.8%).
On the same line were comments from Federal Reserve Governor Michelle Bowman who mentioned, “High inflation and strong employment will likely create some pressure on labor and employment.”
Looking forward, the weekly prints of the US Initial Jobless Claims and Philadelphia Fed Manufacturing Survey for August could entertain the DXY traders. Above all, recession fears and Fed concerns will be crucial to watch for fresh impulse.
Technical analysis
The double tops around 106.95 direct DXY bears toward retesting the 21-DMA support of 106.20.
- AUD/NZD hourly chart bears are lurking near a 78.6% Fibonacci as a potential last defence.
- The price action will likely occur around critical Aussie data today.
Australian labour market data will be key today but the technicals for AUD/NZD are mixed heading into the data. From a daily perspective, there appears to be a bullish bias considering the wick highlighted below and a subsequent follow-through by the bulls into the day's price action above horizontal support:
AUD/NZD daily chart
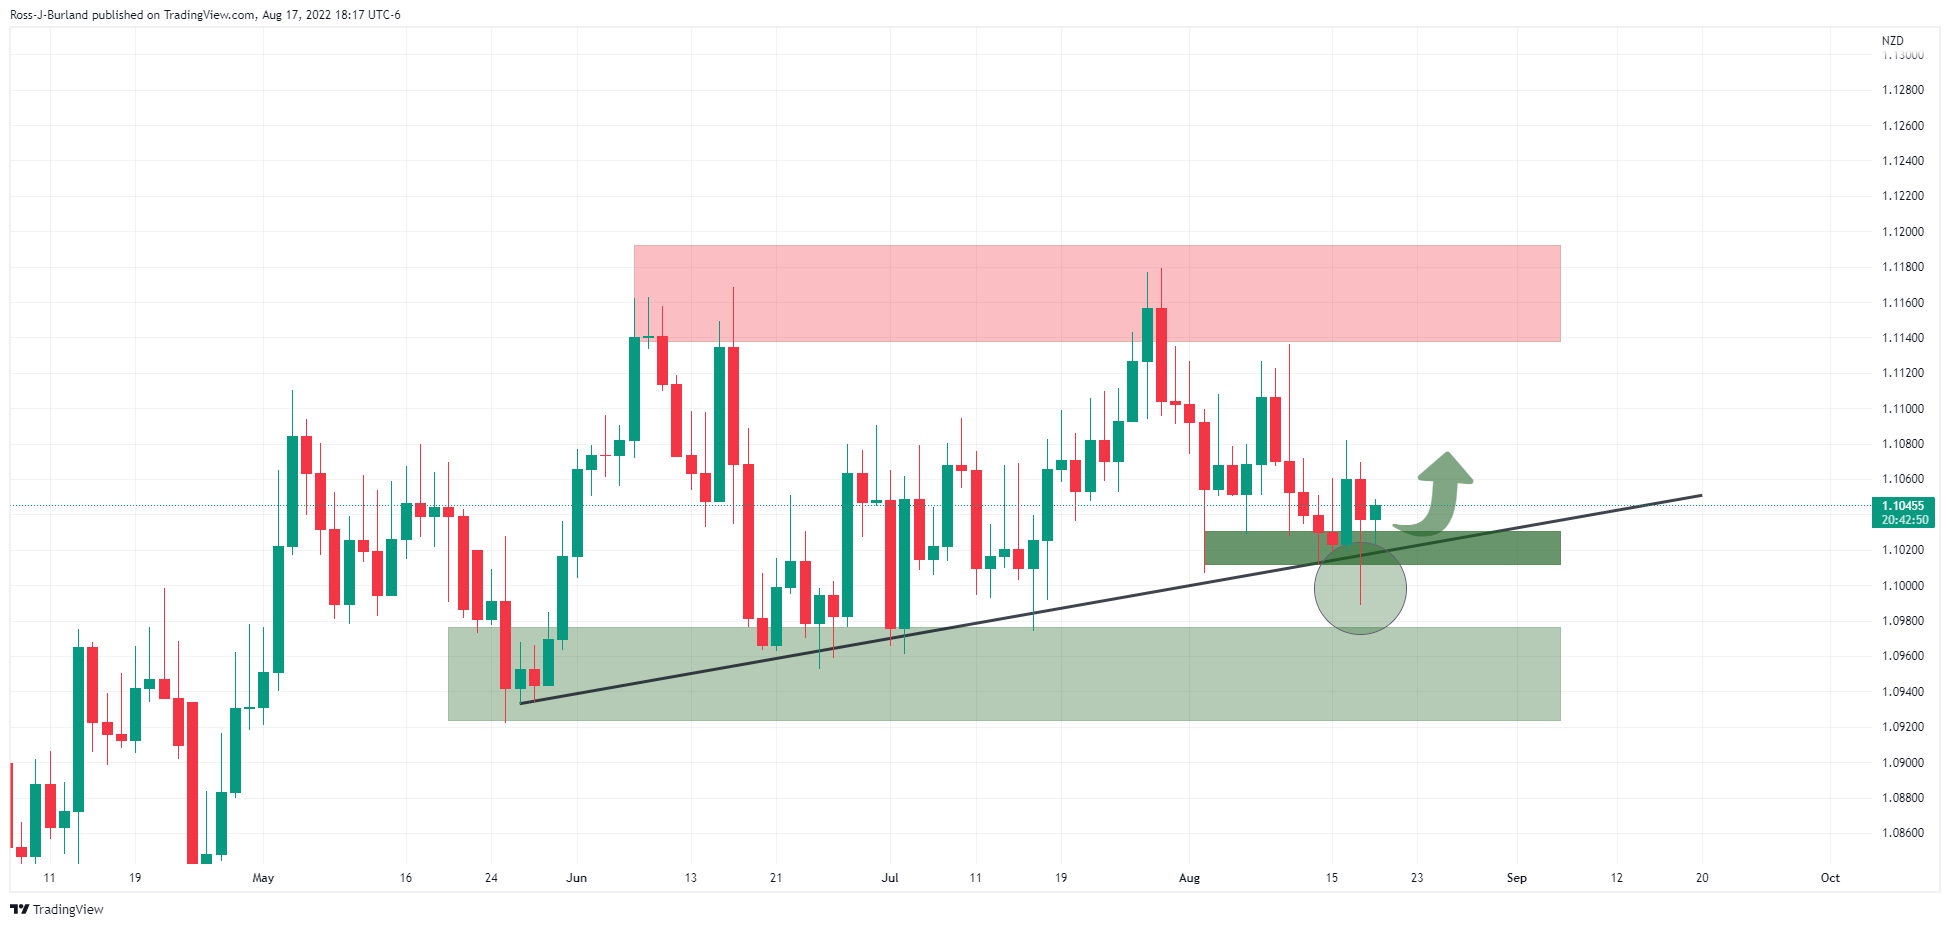
The 4-hour aligns with the daily chart as follows:
AUD/NZD H4 chart
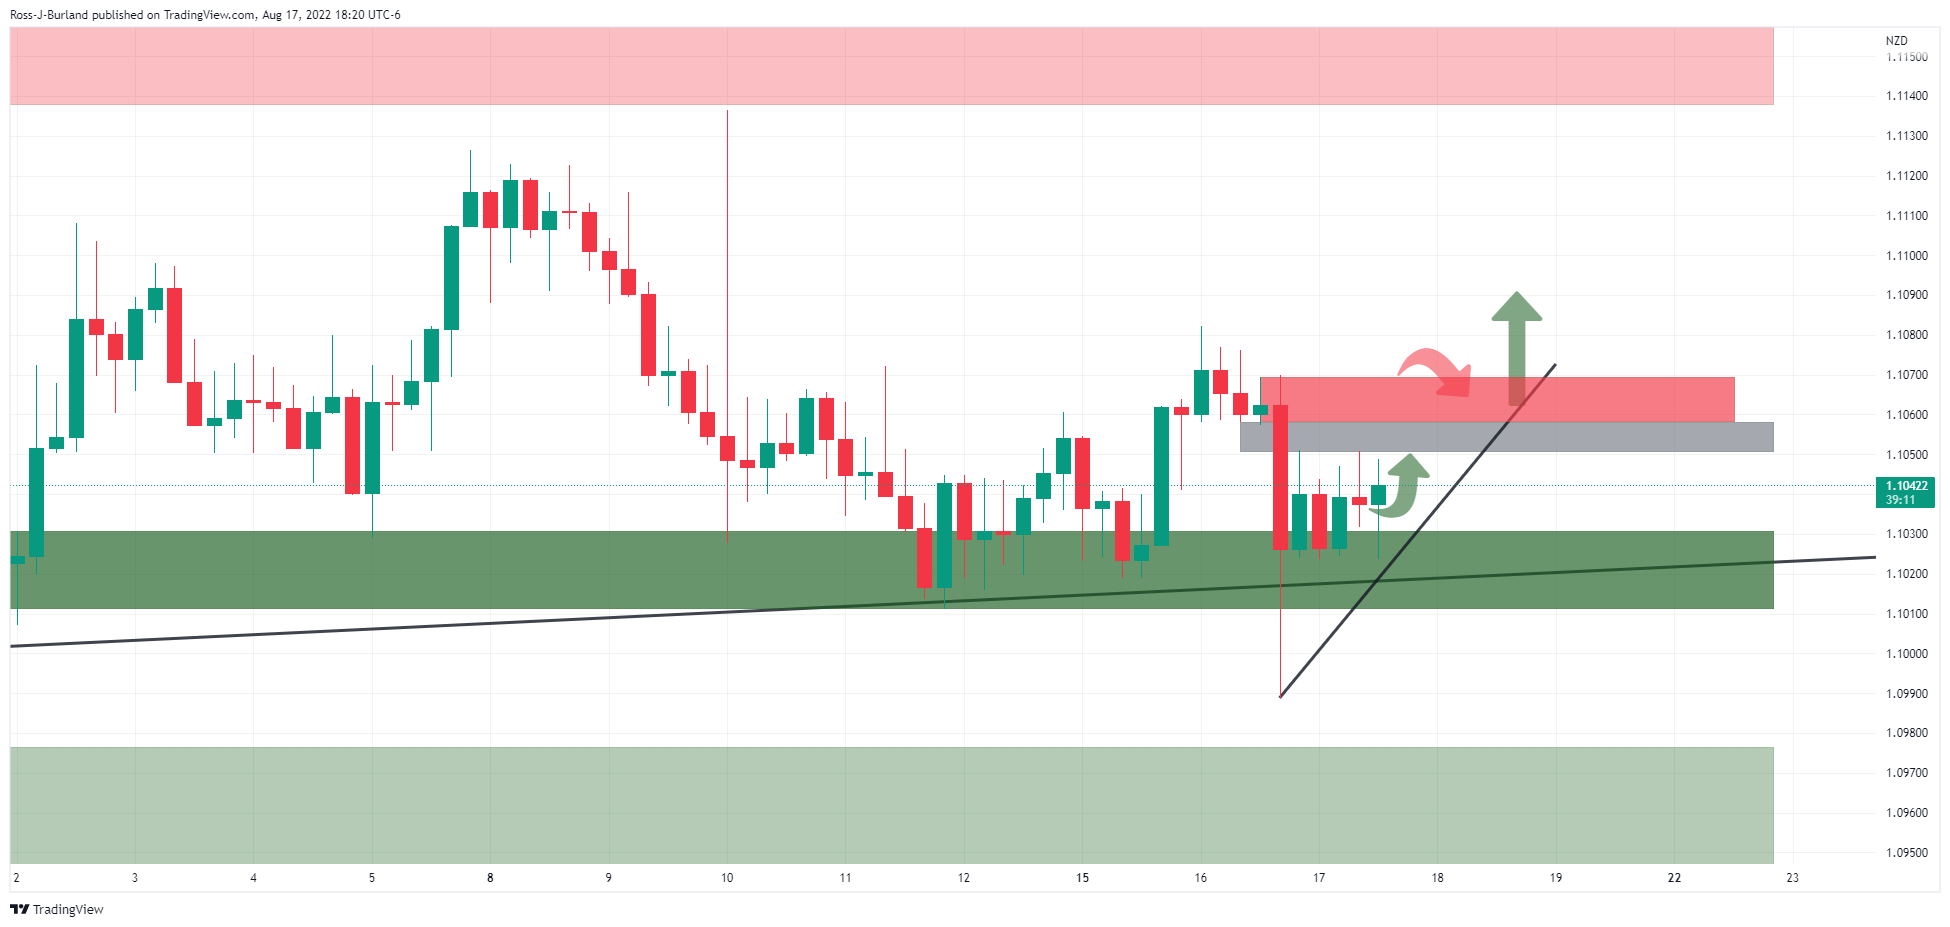
However, the hourly chart shows the price coiled towards an area of imbalance. In mitigating this area, the price will be testing the 78.6% Fibonacci as a potential last defence that could see the price pull back and fall out of the rising support as illustrated below:
AUD/NZD H1 chart
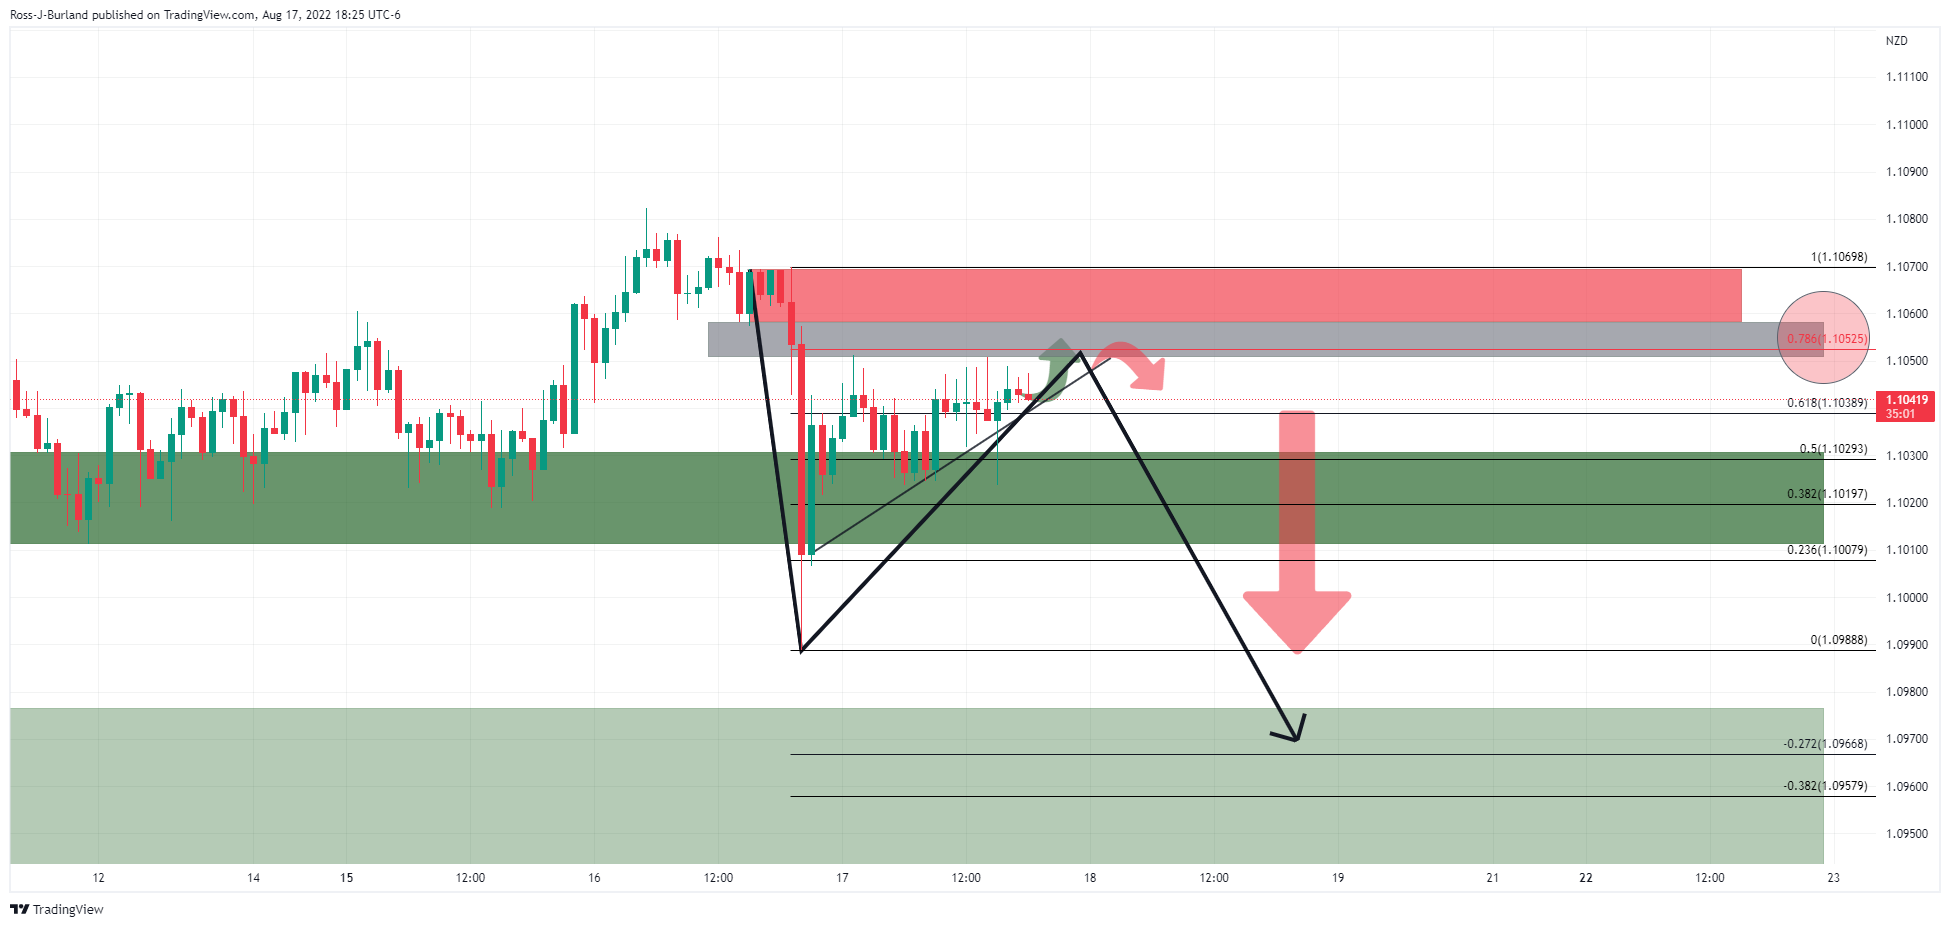
July month employment statistics from the Australian Bureau of Statistics, up for publishing at 01:30 GMT on Thursday, will be the immediate catalyst for the AUD/USD pair traders.
Market consensus suggests that the headline Unemployment Rate may remain unchanged at 3.5% on a seasonally adjusted basis whereas Employment Change could ease to 25K from 88.4K. Further, the Participation Rate may remain intact at 66.8%.
Considering the Reserve Bank of Australia’s (RBA) recently cautious comments, coupled with the trouble in China and softer-than-expected Wage Price Index at home, today’s Aussie jobs report become crucial as the AUD/USD breaks monthly bullish chart formation.
Ahead of the event, analysts at Westpac said,
Given the solid demand for labor as evinced by job vacancies and consumer/business surveys, Westpac anticipates employment to lift at an around trend pace of 50k in June (market f/c: 25k). With only a small increase in participation, the unemployment rate should tick downwards from 3.5% to 3.4%.
How could the data affect AUD/USD?
AUD/USD bears lick their wound at one week long, taking rounds to 0.6930 by the press time, as traders seek fresh clues amid the market’s indecision after the Fed Minutes and the recent Aussie Wage Price Index for the second quarter (Q2).
That said, hopes of an upbeat Aussie jobs report could propel the AUD/USD are fewer amid the broad pessimism surrounding economic slowdown and 75 bps Fed rate hike in September. However, strong prints of the Employment Change and softer Unemployment Rate won’t go unnoticed and hence can provide a kneejerk upside to the quote.
Considering this, FXStreet’s Valeria Bednarik says
A solid Australian employment report would be cheered by market players but also have limited positive effects on the Aussie, particularly if the market sentiment remains on the back foot. A dismal report, on the other hand, should exacerbate the dominant trend and push the AUD further down across the FX board.
Technically, a clear downside break of the one-month-old bullish channel directs AUD/USD prices towards the yearly low of 0.6678. However, 50-DMA and May’s low, respectively around 0.6900 and 0.6825, could act as buffers to the south. Meanwhile, recovery remains elusive until the quote stays below the 200-DMA level around 0.7120.
Key Notes
AUD/USD approaches 0.6900 with bears in control ahead of Australia Employment data
Australian Employment Preview: No surprises on solid job creation
About the Employment Change
The Employment Change released by the Australian Bureau of Statistics is a measure of the change in the number of employed people in Australia. Generally speaking, a rise in this indicator has positive implications for consumer spending which stimulates economic growth. Therefore, a high reading is seen as positive (or bullish) for the AUD, while a low reading is seen as negative (or bearish).
About the Unemployment Rate
The Unemployment Rate released by the Australian Bureau of Statistics is the number of unemployed workers divided by the total civilian labor force. If the rate hikes, indicates a lack of expansion within the Australian labor market. As a result, a rise leads to weaken the Australian economy. A decrease of the figure is seen as positive (or bullish) for the AUD, while an increase is seen as negative (or bearish).
| Index | Change, points | Closed | Change, % |
|---|---|---|---|
| NIKKEI 225 | 353.86 | 29222.77 | 1.23 |
| Hang Seng | 91.93 | 19922.45 | 0.46 |
| KOSPI | -17.05 | 2516.47 | -0.67 |
| ASX 200 | 22.3 | 7127.7 | 0.31 |
| FTSE 100 | -20.35 | 7515.75 | -0.27 |
| DAX | -283.41 | 13626.71 | -2.04 |
| CAC 40 | -64.26 | 6528.32 | -0.97 |
| Dow Jones | -171.69 | 33980.32 | -0.5 |
| S&P 500 | -31.16 | 4274.04 | -0.72 |
| NASDAQ Composite | -164.43 | 12938.12 | -1.25 |
- USD/JPY snaps two-day uptrend as it eases from weekly top.
- Reuters poll suggests Japanese firms increasing wages amid a labor shortage.
- Yield eased after Fed Minutes but firmer US data keeps buyers hopeful.
- Second-tier US data could entertain traders but risk catalysts are the key.
USD/JPY takes offers to renew intraday low near 134.90 as it consolidates weekly gains on Thursday’s Tokyo open. The yen pair’s latest weakness could be linked to the chatters surrounding the Japan-China ties and employment conditions in the Asian major. Also favoring the bears could be the latest Fed Minutes. However, fears of recession favor the pair bulls amid a sluggish session.
Earlier in the Asian session, Japan’s local media Jiji mentioned that Japan's National Security advisor Takeo Akiba and China's Foreign Minister Yang Jiechi agreed to continue talks in order to establish a positive and stable relationship.
Elsewhere, More large Japanese companies are now raising wages to attract workers and cope with chronic staff shortages, a monthly Reuters poll showed on Thursday, a tentative sign Japan Inc may be slowly addressing pay that has been flat for decades.
It should be noted that the US 10-year Treasury yields retreat from the weekly top surrounding 2.90% to 2.89% by the press time. The benchmark bond coupons ignored downbeat Federal Open Market Committee (FOMC) meeting Minutes, while also ignoring risk-positive news from China Securities. The Fed Minutes stated that the policymakers strongly supported the 75 bps rate increase in August while seeing a slowing pace of hikes at some point. The Minutes also signaled that Fed officials saw the hazard the Fed could tighten more than necessary.
On the other hand, “China may issue 1.5 trillion yuan in additional debt as part of an investment push,” mentioned China Securities news.
Amid these plays, the S&P 500 Futures drop 0.25% while tracking the downbeat performance of Wall Street whereas Japan’s Nikkei 225 prints near 1.0% daily loss at the latest.
Looking forward, the weekly prints of the US Initial Jobless Claims and Philadelphia Fed Manufacturing Survey for August could entertain the pair traders amid a lack of major data/events.
Technical analysis
USD/JPY bulls need to cross the 50-DMA hurdle surrounding 135.40 to tighten the grip. Until then, the risk of witnessing a pullback towards the 21-DMA support around 134.50 can’t be ruled out.
| Pare | Closed | Change, % |
|---|---|---|
| AUDUSD | 0.69354 | -1.23 |
| EURJPY | 137.494 | 0.7 |
| EURUSD | 1.0177 | 0.07 |
| GBPJPY | 162.768 | 0.23 |
| GBPUSD | 1.20482 | -0.4 |
| NZDUSD | 0.62775 | -1.05 |
| USDCAD | 1.29129 | 0.5 |
| USDCHF | 0.95118 | 0.17 |
| USDJPY | 135.095 | 0.62 |
- USD/CAD grinds higher around weekly top, flirts with short-term resistance line.
- 200-HMA, 100-HMA join one-week-old ascending trend line to restrict the immediate downside.
- Bulls approach 1.2935-40 horizontal hudle, MACD teases bears.
USD/CAD remains on the bull’s radar as it edges higher around 1.2920 during Thursday’s Asian session. In doing so, the Loonie pair seesaws near a downward sloping resistance line from Monday amid an impending bear cross on the MACD.
Even so, sustained trading beyond the convergence of the 100-HMA, 200-HMA and a one-week-long ascending trend line, around 1.2850, keeps the USD/CAD buyers hopeful.
As a result, the quote appears on the way to the weekly horizontal resistance around 1.2935-40.
Following that, the monthly high around 1.2985 and the 1.3000 psychological magnet will be in focus.
On the contrary, pullback moves become elusive beyond the 1.2850 support confluence.
Also acting as a downside filter is the weekly bottom surrounding 1.2825 and the 1.2800 round figure.
In a case where the USD/CAD prices stay weak past 1.2800, the odds of witnessing a south-run towards the monthly low near 1.2725 can’t be ruled out.
To sum up, USD/CAD is on the bull’s radar but with limited upside room.
USD/CAD: Hourly chart
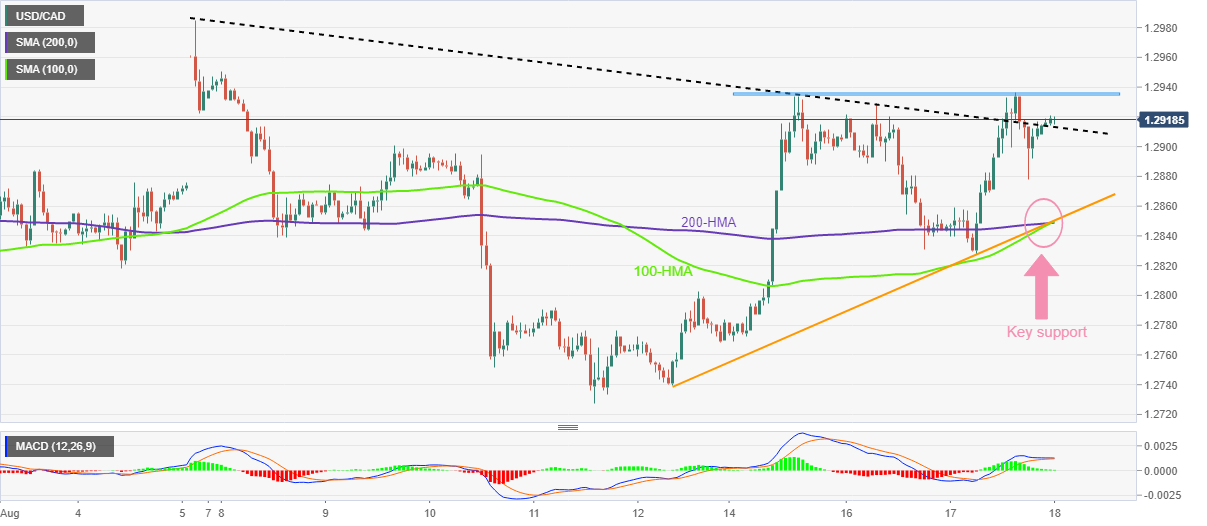
Trend: Further upside expected


© 2000-2026. Sva prava zaštićena.
Sajt je vlasništvo kompanije Teletrade D.J. LLC 2351 LLC 2022 (Euro House, Richmond Hill Road, Kingstown, VC0100, St. Vincent and the Grenadines).
Svi podaci koji se nalaze na sajtu ne predstavljaju osnovu za donošenje investicionih odluka, već su informativnog karaktera.
The company does not serve or provide services to customers who are residents of the US, Canada, Iran, The Democratic People's Republic of Korea, Yemen and FATF blacklisted countries.
Izvršenje trgovinskih operacija sa finansijskim instrumentima upotrebom marginalne trgovine pruža velike mogućnosti i omogućava investitorima ostvarivanje visokih prihoda. Međutim, takav vid trgovine povezan je sa potencijalno visokim nivoom rizika od gubitka sredstava. Проведение торговых операций на финанcовых рынках c маржинальными финанcовыми инcтрументами открывает широкие возможноcти, и позволяет инвеcторам, готовым пойти на риcк, получать выcокую прибыль, но при этом неcет в cебе потенциально выcокий уровень риcка получения убытков. Iz tog razloga je pre započinjanja trgovine potrebno odlučiti o izboru odgovarajuće investicione strategije, uzimajući u obzir raspoložive resurse.
Upotreba informacija: U slučaju potpunog ili delimičnog preuzimanja i daljeg korišćenja materijala koji se nalazi na sajtu, potrebno je navesti link odgovarajuće stranice na sajtu kompanije TeleTrade-a kao izvora informacija. Upotreba materijala na internetu mora biti praćena hiper linkom do web stranice teletrade.org. Automatski uvoz materijala i informacija sa stranice je zabranjen.
Ako imate bilo kakvih pitanja, obratite nam se pr@teletrade.global.
транcфери