- Analiza
- Novosti i instrumenti
- Vesti sa tržišta
Forex-novosti i prognoze od 17-08-2022
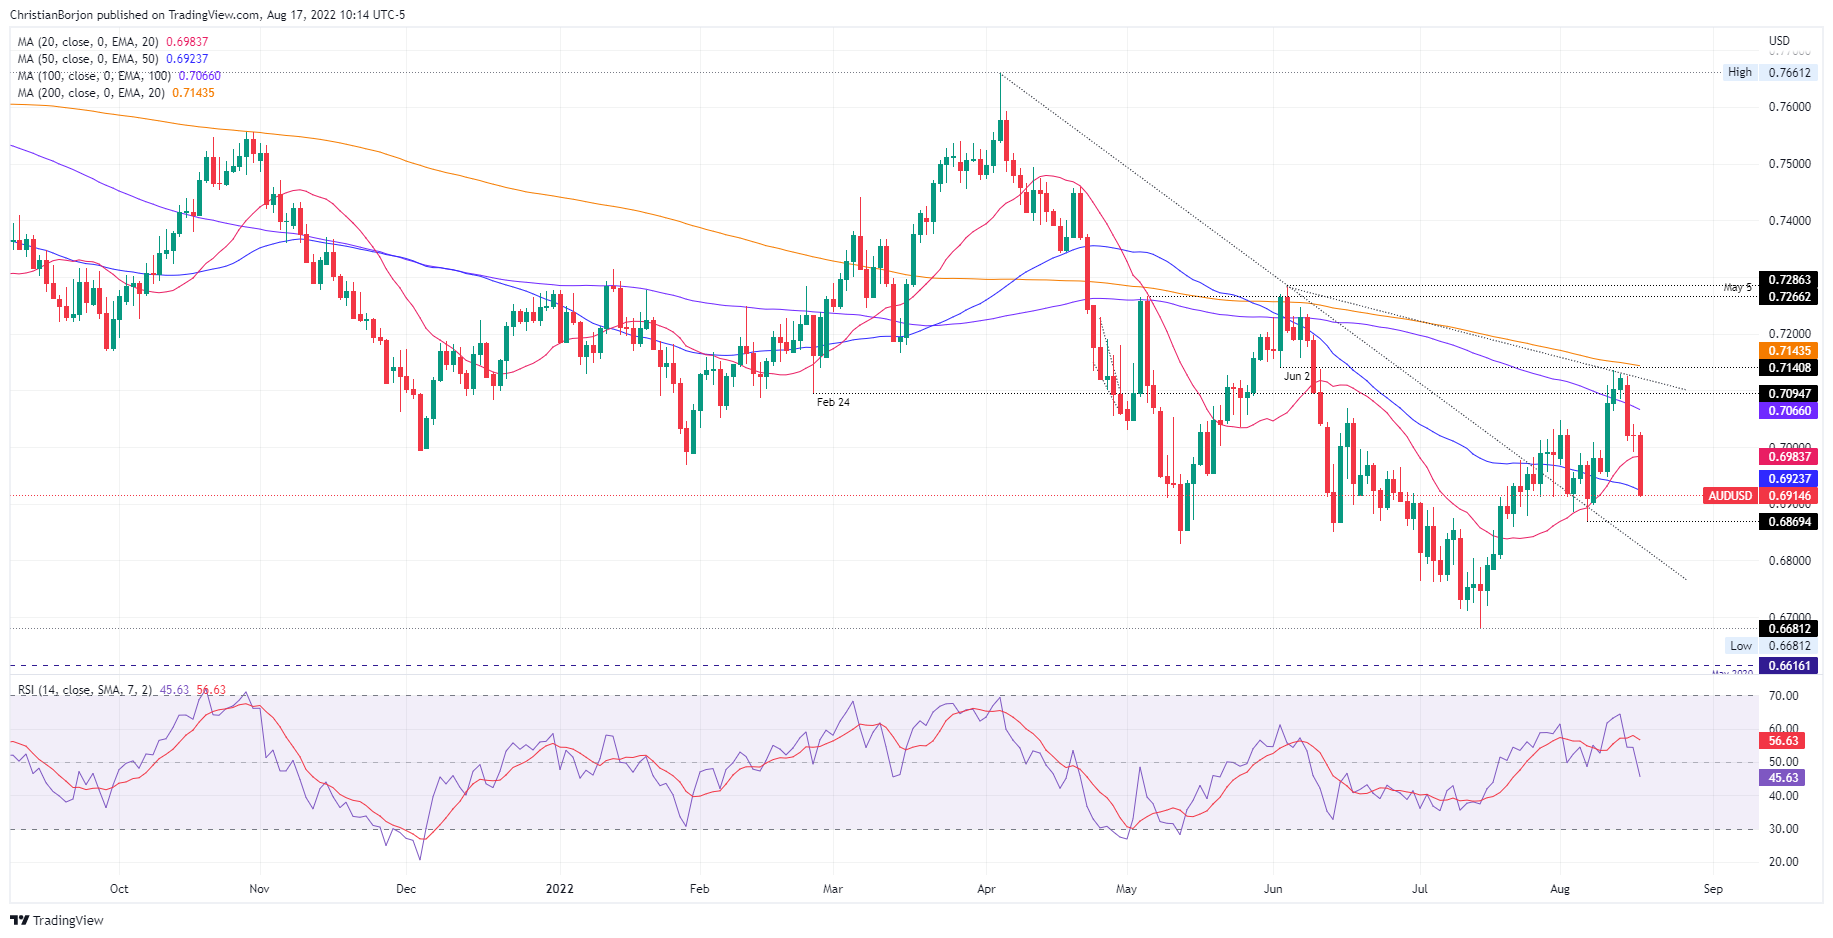
- AUD/USD remains pressured around weekly low after breaking one-month-old bullish channel to the south.
- Sour sentiment, China-linked fears and downbeat Aussie Wage Price Index have already put a floor for bears.
- Fed Minutes failed to impress USD bears amid recession woes.
- Australia employment numbers for July, and second-tier US data will be important for fresh impulse.
AUD/USD holds lower grounds near 0.6930, after falling to the weekly low, as traders await Australia’s monthly employment data during Thursday’s Asian session. In doing so, the Aussie pair portrays the market’s risk-off mood, as well as justifies the previous day’s downbeat wage numbers.
Market sentiment soured after the US 10-year Treasury yields rose the most in a week while refreshing the monthly high near 2.90%. In doing so, the benchmark bond coupons ignored downbeat Federal Open Market Committee (FOMC) meeting Minutes, while also ignoring risk-positive news from China Securities.
The Fed Minutes stated that the policymakers strongly supported the 75 bps rate increase in August while seeing a slowing pace of hikes at some point. The Minutes also signaled that Fed officials saw the hazard the Fed could tighten more than necessary.
On the other hand, “China may issue 1.5trln yuan in additional debt as part of an investment push,” mentioned china securities news.
It should be noted that the softer-than-expected Aussie Wage Price Index for the second quarter (Q2) also exerted downside pressure on the AUD/USD prices the previous day. That said, Aussie wages grew 0.7% QoQ in Q2 to mark the faster pace of growth since September 2014. However, the figures remain dismal when compared to the inflation data and the Reserve Bank of Australia’s (RBA) economic fears.
In the case of the US, Retail Sales flashed 0.0% growth during July, versus 0.1% expected and a downwardly revised 0.8% prior. The Retail Sales Control Group figures, however, rose to 0.8% compared to 0.6% market consensus and 0.7% prior (revised from 0.8%).
Following the mixed data and Fed Minutes, Federal Reserve Governor Michelle Bowman mentioned, “High inflation and strong employment will likely create some pressure on labor and employment.”
Moving on, AUD/USD traders should pay close attention to the Aussie jobs report for July amid recent challenges for the Reserve Bank of Australia’s (RBA) further rate hikes. That said, the headline Employment Change is likely to register 25K figure versus 88.4K prior while the Unemployment Rate is expected to remain unchanged at 3.5%. Following that, the weekly prints of the US Initial Jobless Claims and Philadelphia Fed Manufacturing Survey for August could entertain the pair traders.
Also read: Australian Employment Preview: No surprises on solid job creation
Technical analysis
A clear downside break of the one-month-old bullish channel, directs AUD/USD prices towards the yearly low of 0.6678. However, 50-DMA and May’s low, respectively around 0.6900 and 0.6825, could act as buffers to the south. Meanwhile, recovery remains elusive until the quote stays below the 200-DMA level around 0.7120.
- NZD/USD remains under pressure despite a phase of consolidaiton.
- The bulls are making hard work of a bid through 0.6300.
NZD/USD is trading at 0.6276 and flat for the day having ranged between 0.6274 and 0.6282 so far following some comments from the Reserve Bank of New Zealand's governor, Adrian Orr.
Reserve Bank of New Zealand Governor Adrian Orr answered questions from members of the New Zealand parliamentary Finance and Expenditure Committee. He said that the central bank was confident domestic inflation was now tracking lower.
"We are at the low end globally and we are tracking in the right direction."
On Wednesday, the RBNZ increased the cash rate by 50 basis points to 3.0% as it seeks to get inflation under control. New Zealand inflation is currently at three-decade highs having hit 7.3% in the second quarter.
Nevertheless, as analysts at ANZ Bank noted, ''FX markets have been quick to move on from local themes in favour of global ones. That’s been the case over the past 24hrs. So, we’re back to watching what’s happening offshore, which is mixed, with stocks lower but bond yields higher after a double-digit UK Consumer Price Index print.''
Meanwhile, the release of the Federal Open Market Committee (FOMC) policy decision that took place over the July 26-27 policy meeting sparked a little bit of a flurry in the markets, albeit short-lived.
''The post-minutes reaction was likely driven by 'many FOMC members' flagging that 'it likely would become appropriate at some point to slow the pace of policy rate increases while assessing the effects of cumulative policy adjustments on economic activity and inflation,'''analysts at TD Securities explained.
''This suggested to investors that the pace of rate hikes should slow, which pushed the pricing for a 75bp hike in September from 58% prior to the minutes to 47% and the terminal rate to 3.69% from 3.73% prior to the minutes,'' analysts added.
As a consequence, the DXY dropped 37 points to 106.385. The 10-year yield was under pressure, dropping 0.8% to 2.888% and well off the 2.919% highs for the day. The 2-year yield dropped by nearly 1.4%. This all enabled the Aussie to rally initially, however, as analysts at TD Securities argued, who believe the dovish reaction to the dated minutes may be unwarranted, ''markets should be taking their cue from hawkish Fed rhetoric in recent weeks rather than the minutes.''
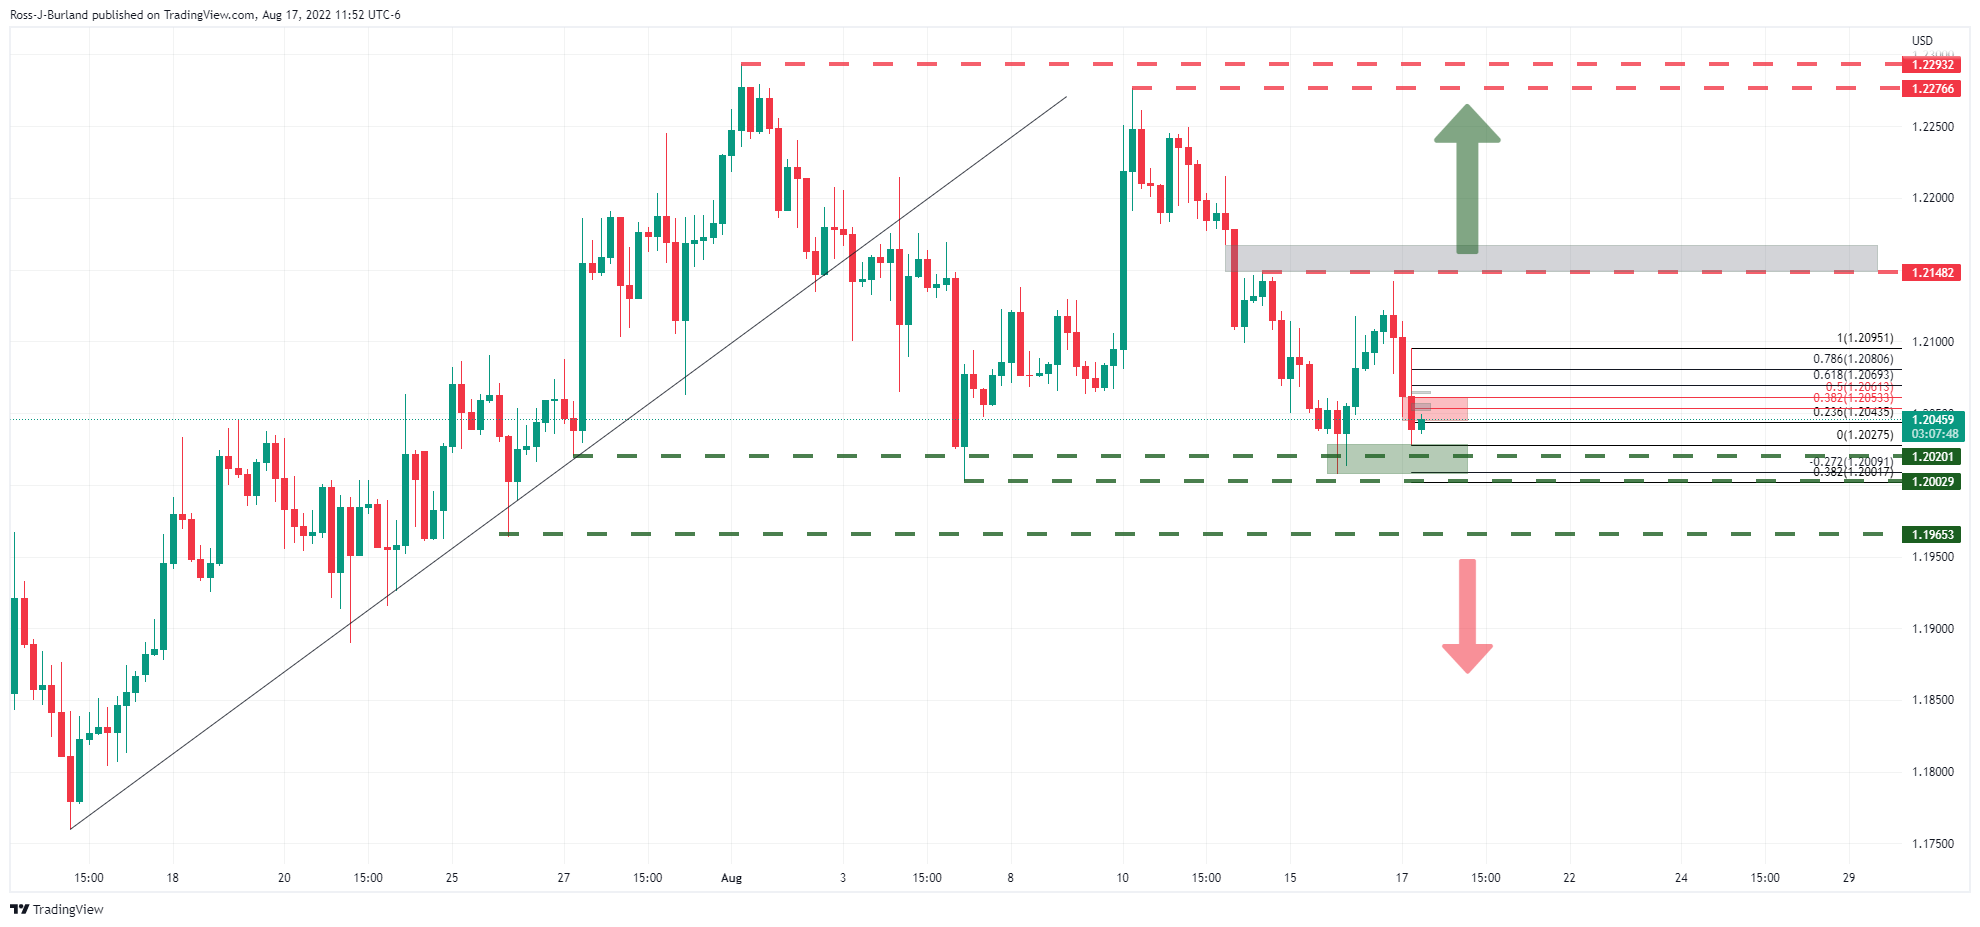
- GBP/USD holds lower grounds after a volatile day that ended on a negative note.
- UK’s 40-year high inflation propelled recession woes, yields.
- Hopes of BOE’s aggression fail to impress buyers.
- Second-tier US data can entertain traders ahead of UK Retail Sales for July.
GBP/USD bears flex muscles around 1.0250, after retaking control following a brief bounce after the Fed Minutes. That said, the cable pair’s inaction could be attributed to the lack of major data/events during Thursday’s initial Asian session. It’s worth noting that the quote poked weekly top after the UK inflation data but failed to remain firmer amid fears that higher price pressure could lead to recession.
The Federal Open Market Committee (FOMC) meeting Minutes mentioned that the policymakers strongly supported the 75 bps rate increase in August while seeing a slowing pace of hikes at some point. The Minutes also signaled that Fed officials saw the hazard the Fed could tighten more than necessary.
On the other hand, fears of economic slowdown escalated after the UK inflation jumped to a 40-year high. The economic fears fuelled the rush towards risk safety, which in turn fuelled the UK 2-year Treasury yields to the highest since October 2008.
It should be noted that the firmer inflation also pushes the Bank of England (BOE) towards faster rate hikes but the market’s lack of confidence over the “Old Lady”, as it is informally called, seem to exert downside pressure on the GBP/USD prices. “The potential loss of independence by the BoE could also hurt sterling with Foreign Secretary Liz Truss, poll leader in the Tory leadership contest promising to review the BoE's remit,” said Reuters.
That said, UK Consumer Price Index (CPI) rose to 10.1% YoY in July versus 9.8% expected and 9.4% previous readings while the Core CPI, which excludes volatile food and energy items, rose to 6.2% versus 5.9% market consensus and 5.8% previous readouts.
Elsewhere, US Retail Sales flashed 0.0% growth during July, versus 0.1% expected and a downwardly revised 0.8% prior. The Retail Sales Control Group figures, however, rose to 0.8% compared to 0.6% market consensus and 0.7% prior (revised from 0.8%).
The firmer US data and the Fed Minutes’ inability to please bears seem to have helped Federal Reserve Governor Michelle Bowman to mention, per Reuters, “High inflation and strong employment will likely create some pressure on labor and employment.”
Amid these plays, the US 10-year Treasury yields rose the most in a week while refreshing the monthly high near 2.90%, which in turn weighed on the Wall Street benchmarks and helped the US dollar to reverse the fall marked after the Federal Open Market Committee (FOMC) meeting minutes.
Given the fears of economic slowdown in the UK, GBP/USD is likely to remain pressured ahead of Friday’s Retail Sales for July, the key component of the British Gross Domestic Product (GDP), expected -3.3% YoY versus -5.8% prior.
Technical analysis
GBP/USD remains on the way to June’s low around 1.1930 unless crossing a two-month-ols downward sloping resistance line, at 1.2260 at the press time. It’s worth noting that the 21-DMA and 100-DMA, respectively near 1.2110 and 1.2385, are extra filters to the north.
- The AUD/JPY moderately advances as the Asian session begins.
- From a daily chart perspective, the pair is neutral biased, but the 4-hour chart portrays an upward bias.
- AUD/JPY Price Analysis: Break above 94.47 clears the way toward 96.00; otherwise, it could fall to 93.00.
The AUD/JPY crept lower on Wednesday session spurred by a risk-off impulse on worries of China’s economic slowdown. In the meantime, US Retail Sales showed consumers resilience, while “dovish” FOMC minutes put into play a possible Fed “put” in the scene. At the time of writing, the AUD/JPY is trading at 93.67.
AUD/JPY Price Analysis: Technical outlook
The AUD/JPY is in a consolidation phase, unable to crack the top/bottom of the 93.08-94.47 range for the last few days. It is worth noting that the 20, 50, and 100-day EMAs hover around that area, while the Relative Strength Index (RSI) at 48.98 is almost flat. Therefore, the AUD/JPY is neutral biased.
In the near term, the AUD/JPY 4-hour chart illustrates the cross-currency pair as upward biased, trading within the boundaries of an ascending channel. AUD/JPY buyers reclaimed the 200-EMA and reached a daily high at 94.47 on Wednesday. However, solid resistance at the 20-EMA, sliding towards the confluence of the 100 and 200-EMAs, around 93.65-68. If AUD/JPY sellers clear the latter, then a fall towards the confluence of the S1 daily pivot and the bottom of the ascending channel, around 93.50-60, is on the cards.
If that scenario plays out, the AUD/JPY’s next support will be the August 15 low at 93.07. Once cleared, it will expose the August 4 low at 92.25 and 92.00. However, if AUD/JPY buyers remain in control, a break above the August 17 high at 94.47 to open the door for further gains. Hence, the first resistance would be the top of descending channel at 94.97. Once cleared, the next supply zone will be the July 27 daily high at 95.69, followed by the 96.00 figure.
 AUD/JPY 4-hour chart
AUD/JPY Key Technical Levels
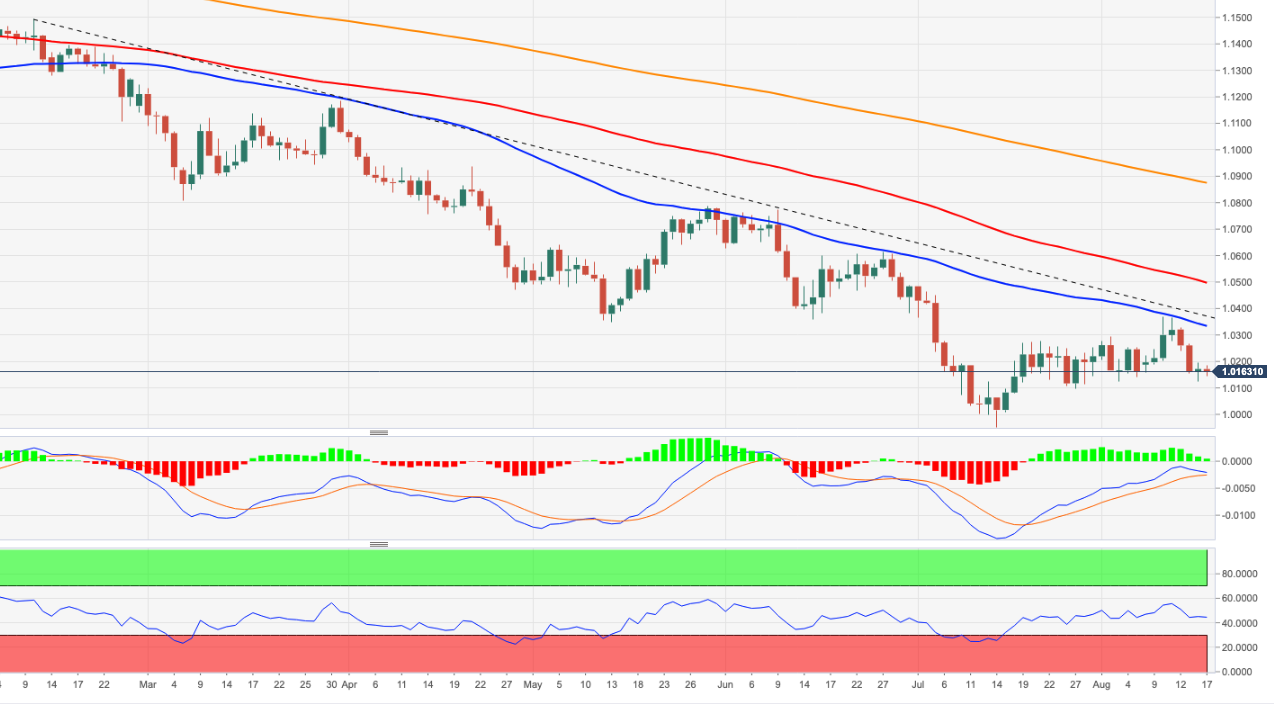
- EUR/USD struggles to extend corrective pullback from monthly low.
- Three-week-old support line restricts immediate downside amid steady RSI.
- Previous support line, 50-DMA adds to the upside filters.
- MACD teases bear cross, buyers to remain cautious below 1.0370.
EUR/USD recovery remains sluggish at around 1.0180 as bulls approach the short-term key hurdles during Thursday’s Asian session. Even so, steady RSI and an upward sloping support line from late July challenge the bears.
That said, an impending bear cross on the MACD, as well as the 21-DMA surrounding 1.0210 questions the major currency pair’s immediate upside.
Following that, the support-turned-resistance from mid-July and the 50-DMA, respectively near 1.0260 and 1.0290, will act as extra hurdles for the EUR/USD bulls to cross.
It’s worth noting that the pair buyers remain unconvinced below the upward sloping resistance line from mid-May, around 1.0370 by the press time.
Alternatively, pullback moves need to break the aforementioned support line from July 27, close to 1.0165 at the latest, to recall the EUR/USD bears.
In that case, the south-run could quickly poke the 1.0100 and parity levels before challenging the yearly bottom surrounding 0.9950.
Overall, the EUR/USD pair’s run-up remains elusive even as the bears are likely losing their grip of late.
EUR/USD: Daily chart
-637963736779472434.png)
Trend: Limited upside expected
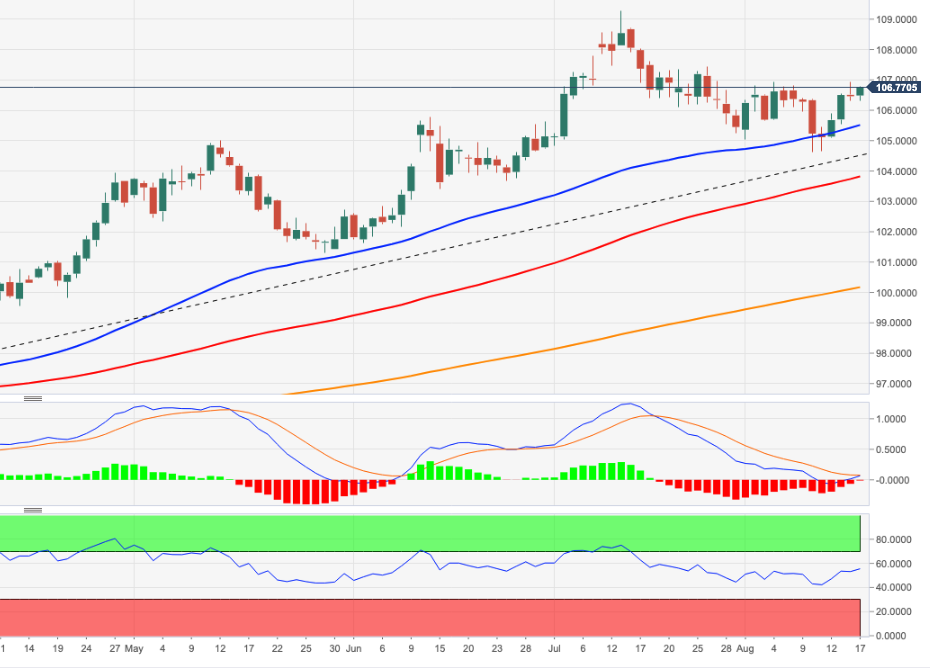
- Gold remains pressured around two-week low, down for the fourth consecutive day.
- Fed Minutes signalled policymakers’ support for restrictive rates despite suggesting a retreat from faster rate hike before long.
- US data, economic fears added to the market’s favor for the US dollar, weighing on XAU/USD.
Gold price (XAU/USD) remains on the back foot around a two-week low, taking rounds to $,1761 at the start of Thursday’s Asian session. The precious metal’s latest inaction could be linked to a lack of major data/events. However, mixed US data and rejection of Fed Minutes, after a brief dovish play, join the broad pessimism surrounding the US economy and Fed moves to weigh on the XAU/USD prices, not to forget strong yields and geopolitical fears.
US 10-year Treasury yields rose the most in a week while refreshing the monthly high near 2.90%, which in turn weighed on the Wall Street benchmarks and helped the US dollar to reverse the fall marked after the Federal Open Market Committee (FOMC) meeting minutes. That said, the US Dollar Index (DXY) ended Wednesday’s North American trading session with 0.18% daily gains around 106.70.
The Fed Minutes mentioned that the policymakers strongly supported the 75 bps rate increase in August while seeing a slowing pace of hikes at some point. The Minutes also signaled that Fed officials saw the hazard the Fed could tighten more than necessary.
Elsewhere, US Retail Sales flashed 0.0% growth during July, versus 0.1% expected and a downwardly revised 0.8% prior. The Retail Sales Control Group figures, however, rose to 0.8% compared to 0.6% market consensus and 0.7% prior (revised from 0.8%).
It should be noted that Federal Reserve Governor Michelle Bowman recently mentioned, “High inflation and strong employment will likely create some pressure on labor and employment.”
Elsewhere, China’s Premier Li Keqiang recently crossed wires, via the Communist Party’s flagship newspaper People’s Daily, while urging local officials from six key provinces that account for about 40% of the country’s economy to bolster pro-growth measures. Previously, President Xi Jinping and state planner National Development and Reform Commission (NDRC) showed readiness for more measures to combat the recession fears.
Moving on, second-tier US data may entertain XAU/USD traders with eyes on the central banks and growth concerns, not to forget China.
Technical analysis
Confirmation of the rising wedge bearish chart pattern precedes the yellow metal’s sustained trading below the 50-DMA and 21-DMA to direct XAU/USD bears towards the previous resistance line from April 18, around $1,735 by the press time.
However, a clear downside break of $1,735 won’t hesitate to refresh the yearly low surrounding $1,680 by the press time.
Alternatively, 21-DMA and 50-DMA guard the quote’s immediate upside around $1,765 and $1,776 in that order. Following that the aforementioned wedge’s lower line, near $1,809 at the latest, appears the last defense of the XAU/USD bears.
Gold: daily chart
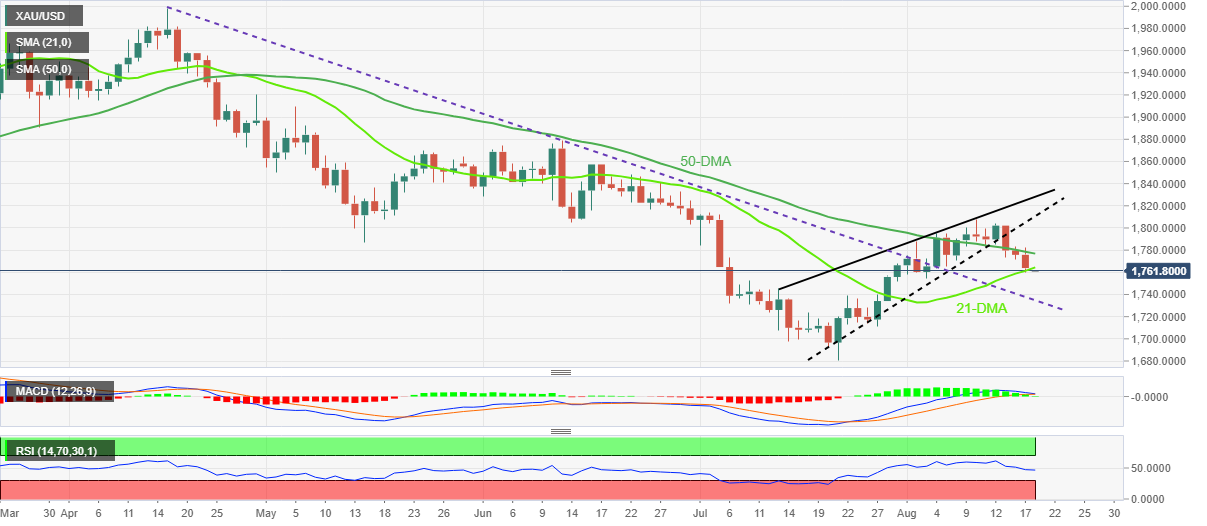
Trend: Further downside expected
“(We are) At low end globally of inflation level, tracking in the right direction,” said Reserve Bank of New Zealand Governor Adrian Orr to New Zealand (NZ) Parliament's Finance and Expenditure Select Committee.
Additional comments
Labor constraint key reason to “consciously” slow demand to match supply capacity.
There is and will be financial stress in many households.
At times monetary policy was overly loose.
Market reaction
NZD/USD traces RBNZ Governor’s attempt to justify the latest moves, while also matching the previous cautious remarks, as the quote drops back to 0.6275 by the press time.
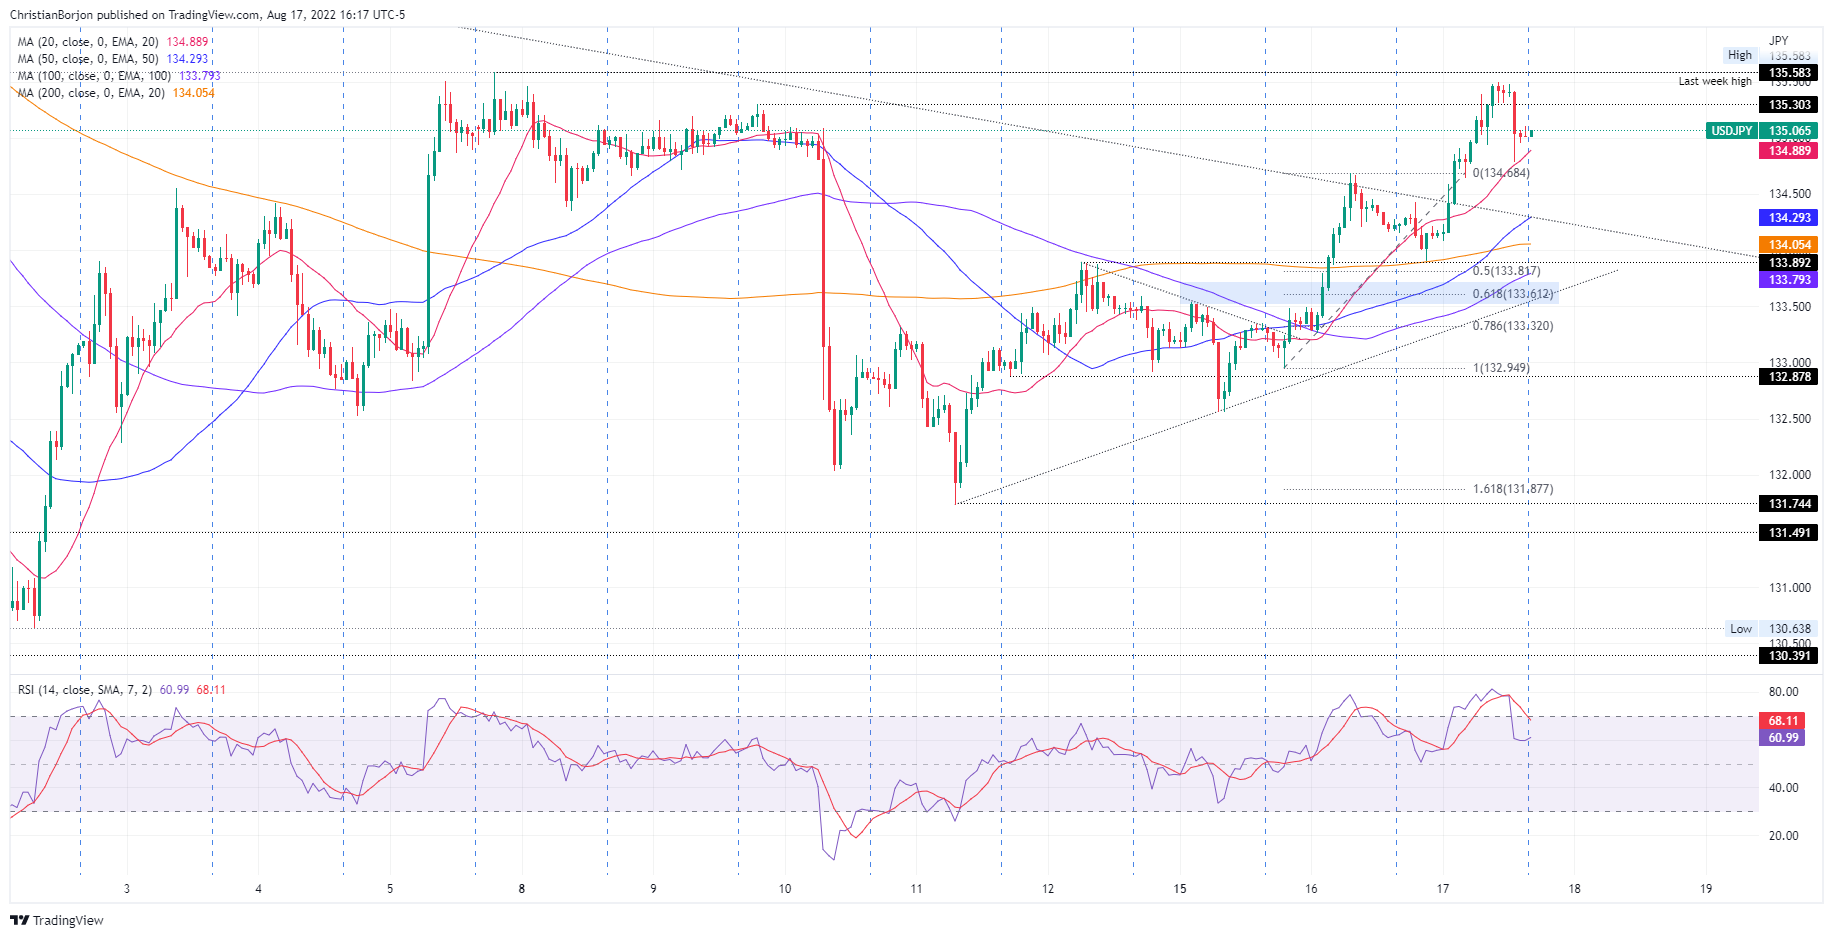
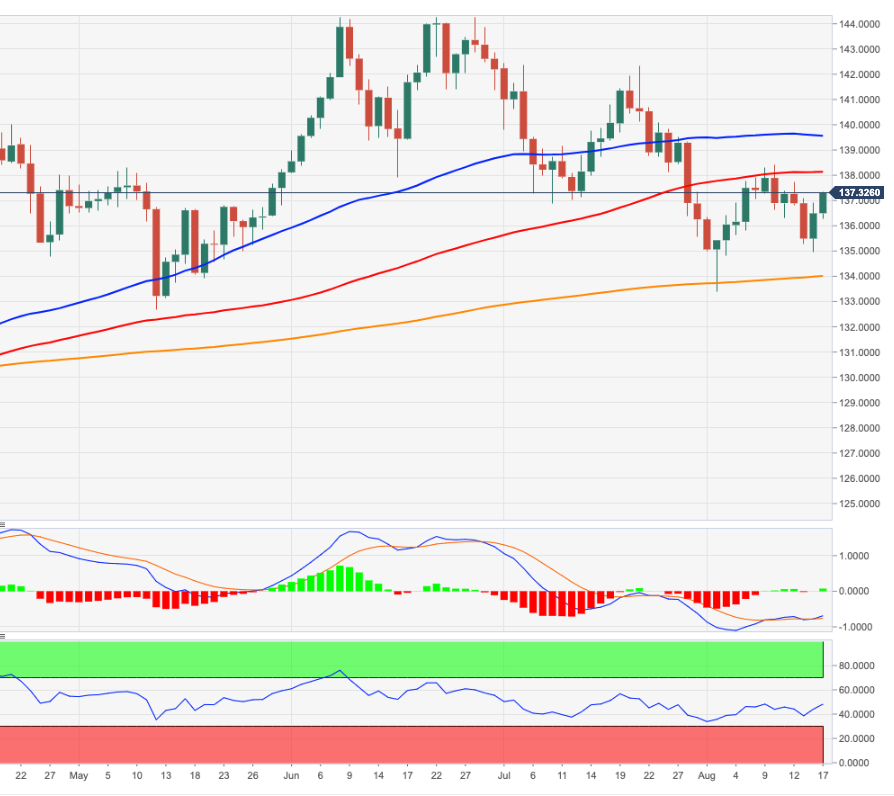
- USD/JPY is advancing some 0.03% as the Asian session begins on cooler-than-estimated FOMC minutes.
- The USD/JPY retraced towards the 50% Fibonacci retracement, before
- The major might extend its uptrend once buyers reclaim 135.50.
The USD/JPY grinds high as Wall Street closes, though retraced from weekly highs reached just above the 50-day EMA, at around 135.49, but FOMC’s minutes tumbled the pair towards the 135.00 figure before the NY close. At the time of writing, the USD/JPY is trading at 135.06.
US equities were lower on Wednesday, portraying risk aversion. The greenback weakened but held to gains against its counterpart’s safe-haven peers, and per the US Dollar Index, recorded modest gains of 0.16%, at 106.645.
Also read: FOMC minutes: Rate would have to reach a ‘sufficiently restrictive’ level to control inflation
USD/JPY Price Analysis: Technical outlook
The USD/JPY remains upward biased, despite retracing from daily highs. The break above the confluence of a downslope-trendline and the 20-day EMA opened the door for additional gains, further reinforced by the Relative Strength Index (RSI) just crossing above 50, a bullish signal. A decisive break above the 50-day EMA at 135.38 would open the door for further upside, being the first target, the July 27 daily high at 137.46.
In the shorter time-frame, as I wrote in yesterday’s article, “ … the major might print a leg down before resuming the higher-time frame uptrend towards 135.00 and beyond.” On Wednesday, the USD/JPY printed a leg down, towards the 200-hour EMA, just above the 50% Fibonacci retracement around 133.90, and resumed the uptrend. However, it faced sold resistance at 135.49 and consequently fell towards the 135.00 figure, ahead of Thursday’s Asian session open.
However, the USD/JPY is neutral-to-upward biased, and the first resistance will be the August 17 high at 135.49. Break above will expose 136.00, followed by the July daily high at 136.57.
USD/JPY Hourly chart
Also read: USD/JPY Price Analysis: Soars and reclaims 134.00, eyeing 135.00
USD/JPY Key Technical Levels
- AUD/USD came under pressure again despite benign FOMC minutes.
- There could be some sideways action ahead of Thursday's Aussie jobs data.
- 0.6980 eyed as a resistance area and 0.7020 thereafter. Bears will need to break 0.6910 daily lows ahead of 0.6870.
AUD/USD is trading down 1.2% on the day despite a benign set of minutes of the Federal Open Market Committee (FOMC) policy decision that took place over the July 26-27 policy meeting. There was a knee-jerk reaction to the minutes that took the value of the US dollar lower but the dip was bought back shortly afterwards resulting in a turnover in the commodity-fx arena.
At the time of writing, AUD/USD is trading around 0.6937 and has travelled within a 0.6910 and 0.7026 range on the day so far. There was not an explicit message that rate hikes will be as aggressive in Sepement. ''The post-minutes reaction was likely driven by 'many FOMC members' flagging that 'it likely would become appropriate at some point to slow the pace of policy rate increases while assessing the effects of cumulative policy adjustments on economic activity and inflation,''' analysts at TD Securities explained.
''This suggested to investors that the pace of rate hikes should slow, which pushed the pricing for a 75bp hike in September from 58% prior to the minutes to 47% and the terminal rate to 3.69% from 3.73% prior to the minutes,'' analysts explained. For that reason, US futures are pricing in a higher probability of a 50 bps hike for Sep after these minutes to around a 60% chance.
As a consequence, the DXY dropped 37 points to 106.385. The 10-year yield was under pressure, dropping 0.8% to 2.888% and well off the 2.919% highs for the day. The 2-year yield dropped by nearly 1.4%. This all enabled the Aussie to rally initially, however, as analysts at TD Securities argued, who believe the dovish reaction to the dated minutes may be unwarranted, ''markets should be taking their cue from hawkish Fed rhetoric in recent weeks rather than the minutes.''
The analysts explained that the Fed also discussed its desire to tighten financial conditions and the tightening that has occurred so far. ''However, financial conditions have recently eased and data has remained strong.''
Meanwhile for the day ahead, Aussie jobs data will be a critical feature of the Asian session. ''July is a seasonally strong month for job gains and we look for the unemployment rate to trend lower. Another strong labour print should give the RBA the assurance that the economy can withstand a cash rate of 3% by end-2022,'' the analysts at TDS said ahead of the data on Thursday.
AUD/USD technical analysis
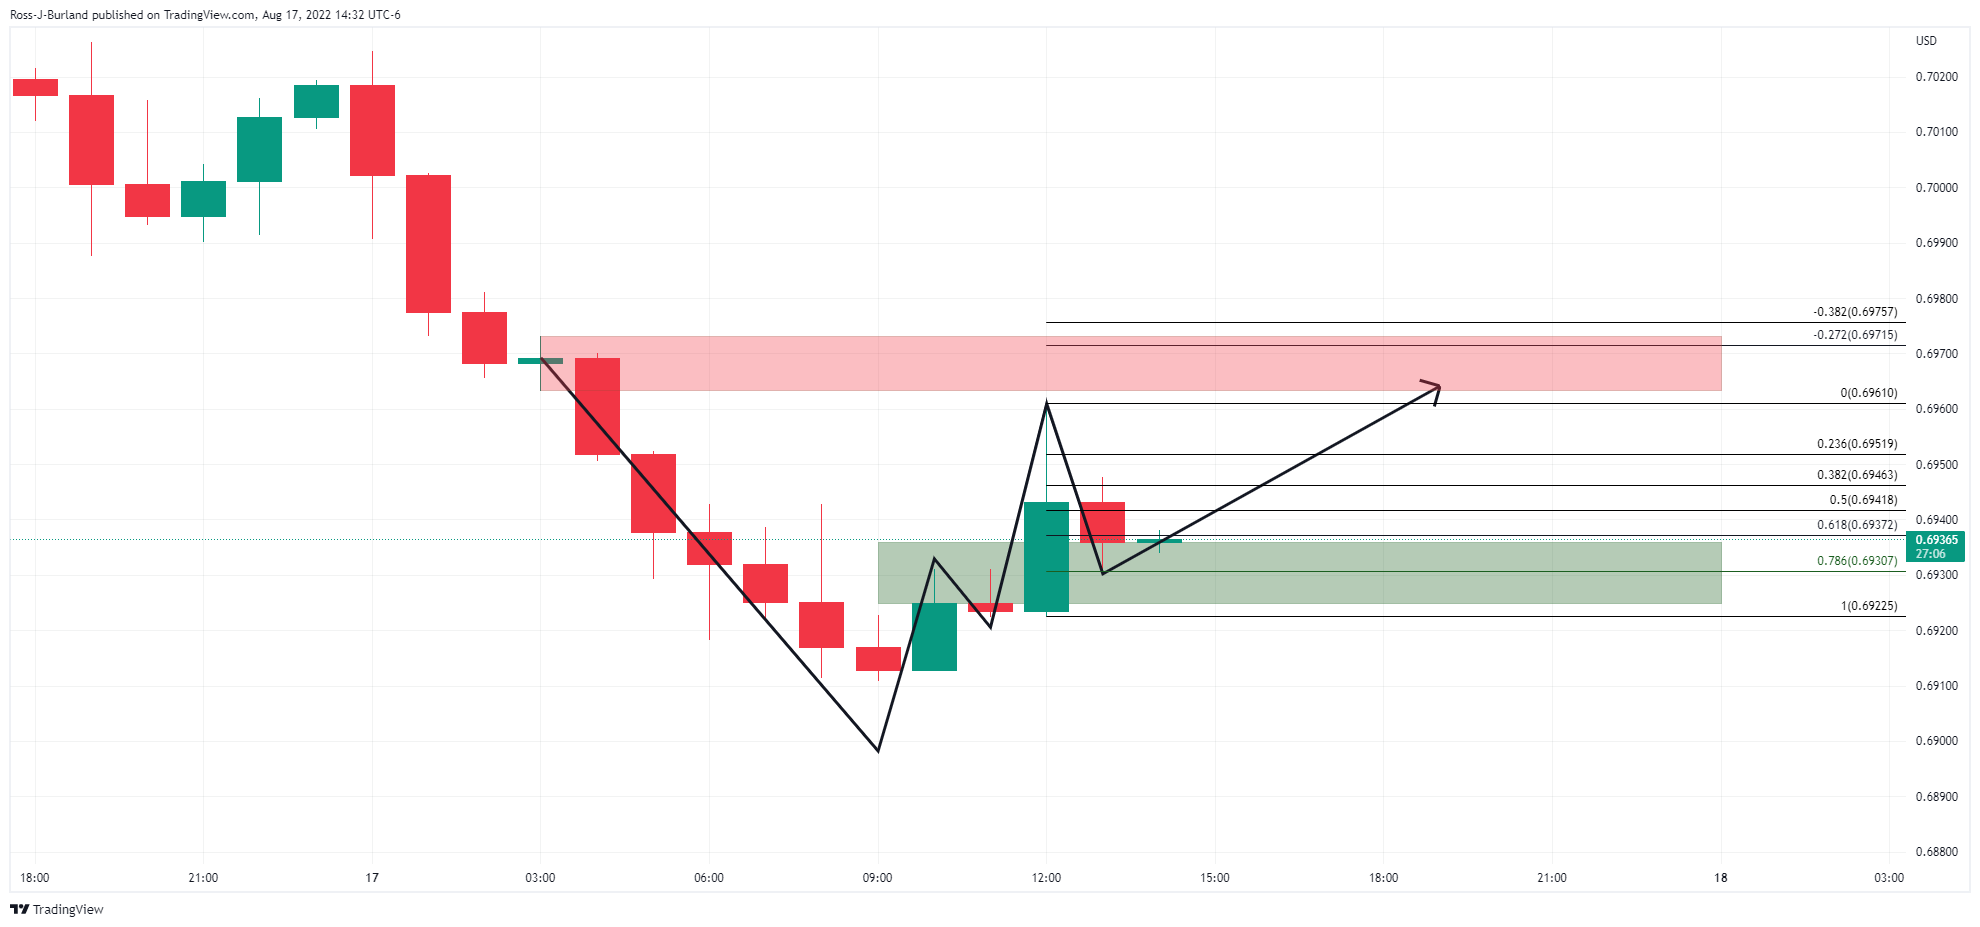
AUD/USD came under pressure again and met the neckline on the W-formation on the hourly chart. This is holding as a support so far with a perfect touch of the 78.6% Fibonacci level. Should this continue to hold, there could be some sideways action ahead of Thursday's data with 0.6980 eyed as a resistance area and 0.7020 thereafter. Bears will need to break 0.6910 daily lows ahead of 0.6870.
What you need to take care of on Thursday, August 18:
The American dollar finished Wednesday higher against most major rivals on Wednesday, despite suffering a near-term setback following the release of the FOMC Meeting Minutes.
The greenback suffered a short-lived setback following the release of the Federal Reserve document, which showed that US policymakers unanimously agreed to hike rates by 75 bps, seeing a slowing pace of hikes at some point. It also read that many Fed officials saw the hazard the Fed could tighten more than necessary. Furthermore, some participants said the policy rate would have to reach a “sufficiently restrictive” level to control inflation and remain there “for some time.”
The EUR/USD pair managed to post modest intraday gains and settled around 1.0180, although the local GDP was downwardly revised. The GBP/USD pair, on the other hand, remained under pressure and finished the day at around 1.2050.
Commodity-linked currencies were among the weakest, with AUD/USD now trading around 0.9630 and USD/CAD just above 1.2900. The NZD/USD is down to 0.6270, as the New Zealand dollar retained its strength despite RBNZ Governor Orr saying they did not consider a 75 bps rate hike and lifted the main rate by 50 bps.
The greenback posted modest advances against safe-haven currencies, with USD/CHF trading around 0.9510 and USD/JPY at 135.00.
Gold trades at $1,765 a troy ounce, extending its weekly slide, while crude oil prices spent the day consolidating losses. WTI is changing hands at $87.60 a barrel.
Australia employment data coming up next.
Dogecoin Price Prediction: A $0.02 DOGE by 2023
Like this article? Help us with some feedback by answering this survey:
- Gold has spiked on the back of the FOMC minutes.
- Bears, however, have moved in fading the kneee-jerk reaction.
- The Jackson Hole symposium presents an additional avenue for the Fed to push back against the dovish narrative.
The gold price has rallied on the minutes from the Federal Reserve's July 26-27 policy meeting that, while not shedding much light on just how aggressive they expect to be, there was not an explicit message that rate hikes will be as aggressive in Sepement. For that reason alone, US futures are pricing in a higher probability of a 50 bps hike for Sep after these minutes to around a 60% chance.
The US dollar was lower as a consequence with the DXY dropping 37 points to 106.385. The 10-year yield was under pressure, dropping 0.8% to 2.888% and well off the 2.919% highs for the day. The 2-year yield dropped by nearly 1.4%. This enabled the yellow metal to recover some ground in a knee-jerk reaction.
Key notes from the Fed minutes
- Fed minutes: All participants at July 26-27 policy meeting agreed 75-basis-point interest rate hike was appropriate.
- Some participants said the policy rate would have to reach a 'sufficiently restrictive' level to control inflation and remain there 'for some time.
- Participants 'concurred' that future rate hikes would depend on incoming information, and judged that 'at some point' it would be appropriate to slow the pace of increases.
- Participants agreed there was 'little evidence inflation pressures were subsiding and that it would take a considerable time for the situation to be resolved.
- Participants 'emphasized' that slowdown in demand would 'play an important role in reducing inflation.
- Participants noted recent readings on inflation expectations were 'consistent' with long-run expectations anchored at 2%.
- Participants said the strength of the labour market suggests economic activity is stronger than implied by weak Q2, raising the possibility of upward GDP revision.
Is this the start of the pain trade in gold?
Analysts at TD Securities explained that ''while money manager length in gold hovering near multi-year lows, we are still anticipating a capitulation event in gold driven by the unwind of a massively bloated position held by a few proprietary trading shops and family offices.''
''A small breadth of these traders is holding nearly twice their average position size, accumulated during the pandemic, which does not appear to be associated with a Fed narrative or a recessionary view. As gold prices trade towards their pandemic-era entry levels, this complacent length is increasingly at risk for capitulation.''
''The Jackson Hole symposium presents an additional avenue for the Fed to push back against the dovish narrative.''
Gold technical analysis
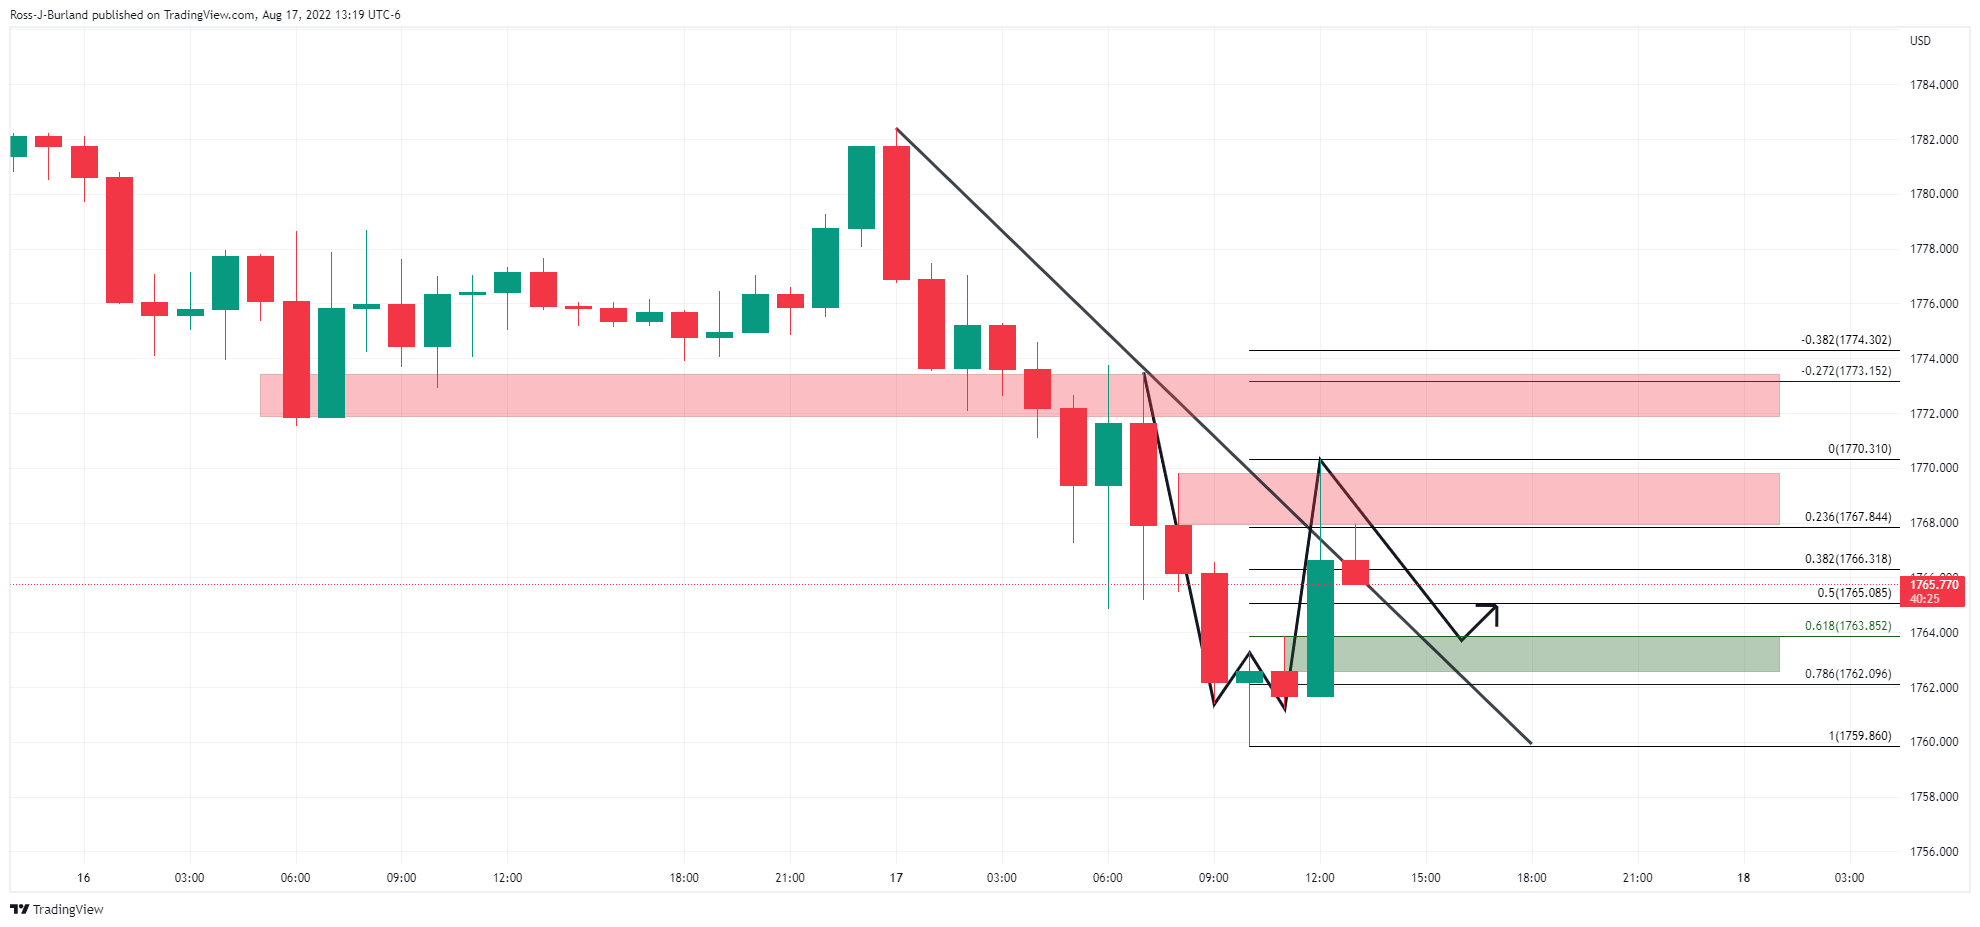
Gold is retracing some of the rally in the aftermath of the minutes. It has broken the trendline resistance but a retest of the neckline of the W-formation is a high probability for traders fading the rally on lower time frames such as the 5 and 1 minute charts. The neckline aligns with the 61.8% Fibonacci retracement level of the hourly spike.
- The EUR/USD rallied close to 50 pips after the release of the July minutes.
- All Fed members agreed to hike 75 bps in the July meeting.
- Fed members acknowledge they would slow the pace of tightening at “some point.”
The EUR/USD jumped during the last hour due to the release of July’s Federal Reserve Open Market Committee (FOMC) minutes, which lifted the shared currency near the highs of the day, reached earlier, at 1.0198, though stabilized around the highs 1.0180s. At the time of writing, the EUR/USD is trading at 1.0190.
Summary of the FOMC minutes
The US Federal Reserve revealed in its minutes that all the participants agreed to hike rates by 75 bps, while many of them saw the Fed could tighten more if necessary. Fed officials added that future hikes would depend on incoming data while acknowledging that it would be appropriate to slow the pace of increases at some point.
Regarding inflation, Fed members said that there was “little evidence” of inflation subsiding and recognized it would take “considerable” time for the situation to be resolved. Concerning economic conditions, policymakers expressed that a strong labor market suggests economic activity is stronger than implied by the weak Q2 reading, raising the possibility of an upward GDP revision.
EUR/USD reaction
The EUR/USD rallied sharply, as shown by the 5-minute chart below. Even though the pair dipped towards 1.0185, buying pressure lifted the pair towards the daily high at 1.0202. Market participants’ interpretation of the minutes is perceived as dovish, despite pushing back efforts by Fed speakers in the last couple of weeks.
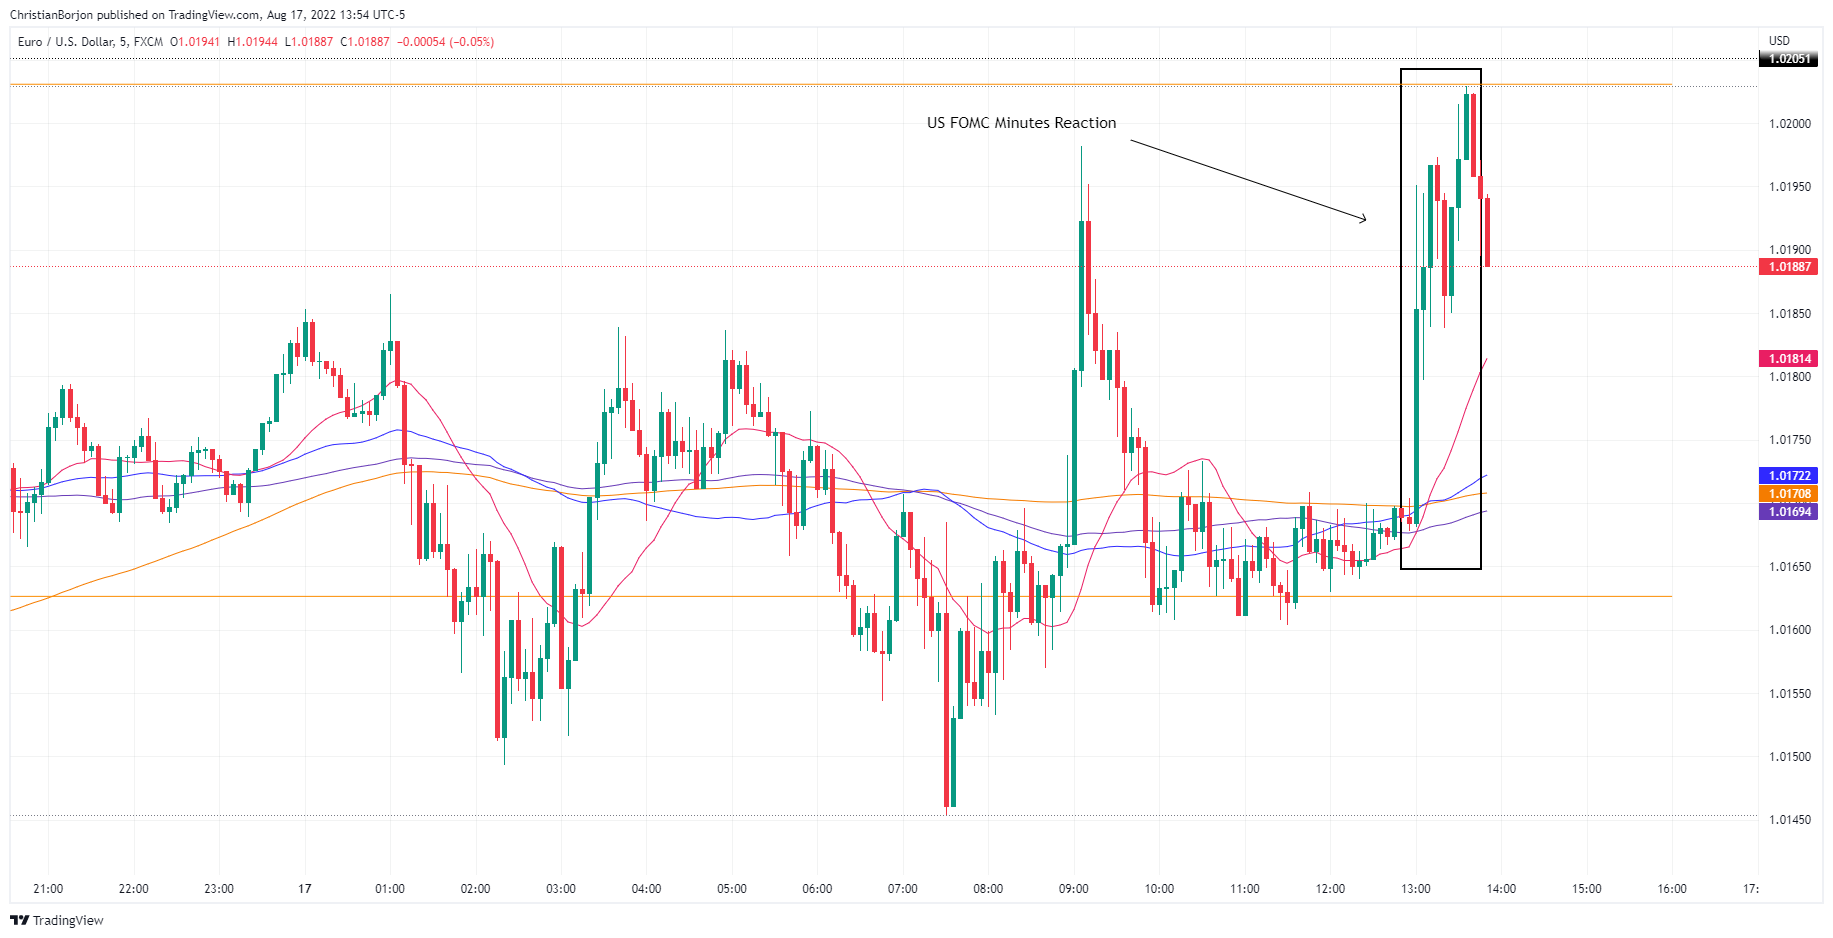 EUR/USD 5-minute chart
In the meantime, the US Dollar Index trimmed earlier gains and edged up 0.02% at 106.511, while the US 10-year bond yield rose seven bps at 2.884%, following the release of the minutes.
Aside from this, earlier US data revealed by the Department of Commerce reported that Retail sales for July increased by 10.3% YoY, exceeding forecasts of 8.3%, while the monthly reading was unchanged, missing expectations. Excluding autos and gasoline, sales jumped 0.4% YoY, vs. -0.1%.
EUR/USD Key Technical Levels
Reuters reports Federal Reserve Governor Michelle Bowman saying on Wednesday that a strong US labour market, the recovery of the service sector, and more fully open schools and childcare centres will likely bring more women back to the workforce.
"We continue to see strong employment gains and low unemployment rates—the kind of labour market that historically has pulled in more workers," Bowman said in remarks prepared for delivery to the Arkansas Women's Commission in Russellville, Arkansas.
"There are still plenty of jobs available even if we see the number of job openings reduced."
Key quotes
- Fed's Bowman: Labour market continues to be strong.
- Fed's Bowman: Future of labor supply is uncertain.
- Fed's Bowman: Some retirees may feel compelled to return to work due to inflation.
- Fed's Bowman says he sees potential for greater job opportunities for women in the future.
- Fed's Bowman: High inflation and strong employment will likely create some pressure on labour and employment.
Meanwhile, US futures are pricing in a higher probability of a 50 bps hike for Sep after the release of the FOMC minutes to around a 60% chance.
As a consequence, the US dollar is lower. The DXY index, that measure the greenback vs. a basket of currencies fell 30 points to 106.44. The 10-year yield is under pressure, dropping 0.8% to 2.888% and well off the 2.919% highs for the day. The 2-year yield dropped by nearly 1.4%.
- EUR/JPY rallies as buyers eye a break above the 100-day EMA at 138.10.
- A risk-off impulse was no excuse for EUR buyers to propel the shared currency higher.
- EUR/JPY buyers faltering to crack the 138.39 level would expose the pair to selling pressure.
The EUR/JPY climbs towards solid resistance around the 100-day EMA at 138.10 after clearing the 20-day EMA at 137.29, despite a risk-off impulse, which usually benefits safe-haven peers. Nevertheless, in the FX space, the only safe haven up in the day are the greenback and the Swiss franc. At the time of writing, the EUR/JPY is trading at 137.51, registering gains of 0.72%.
EUR/JPY Price Analysis: Technical outlook
The EUR/JPY daily chart portrays the pair as neutral-to-upward biased, further cemented by the Relative Strength Index (RSI) pushing above the 50-midline, signaling buyers are gaining impulse. However, unless they break above the August 10 daily high at 138.39, risks of sellers stepping in remain. If EUR/JPY reclaims the latter, the first resistance would be the 139.00 figure, followed by the50-day EMA at 139.36 and a downslope trendline drawn from the YTD highs around 144.00.
On the flip side, the EUR/JPY first support would be the August 16 high previous resistance-turned-support at 136.91. Once cleared, the next support will be the August 17 low at 136.26, followed by the August 16 daily low at 134.94.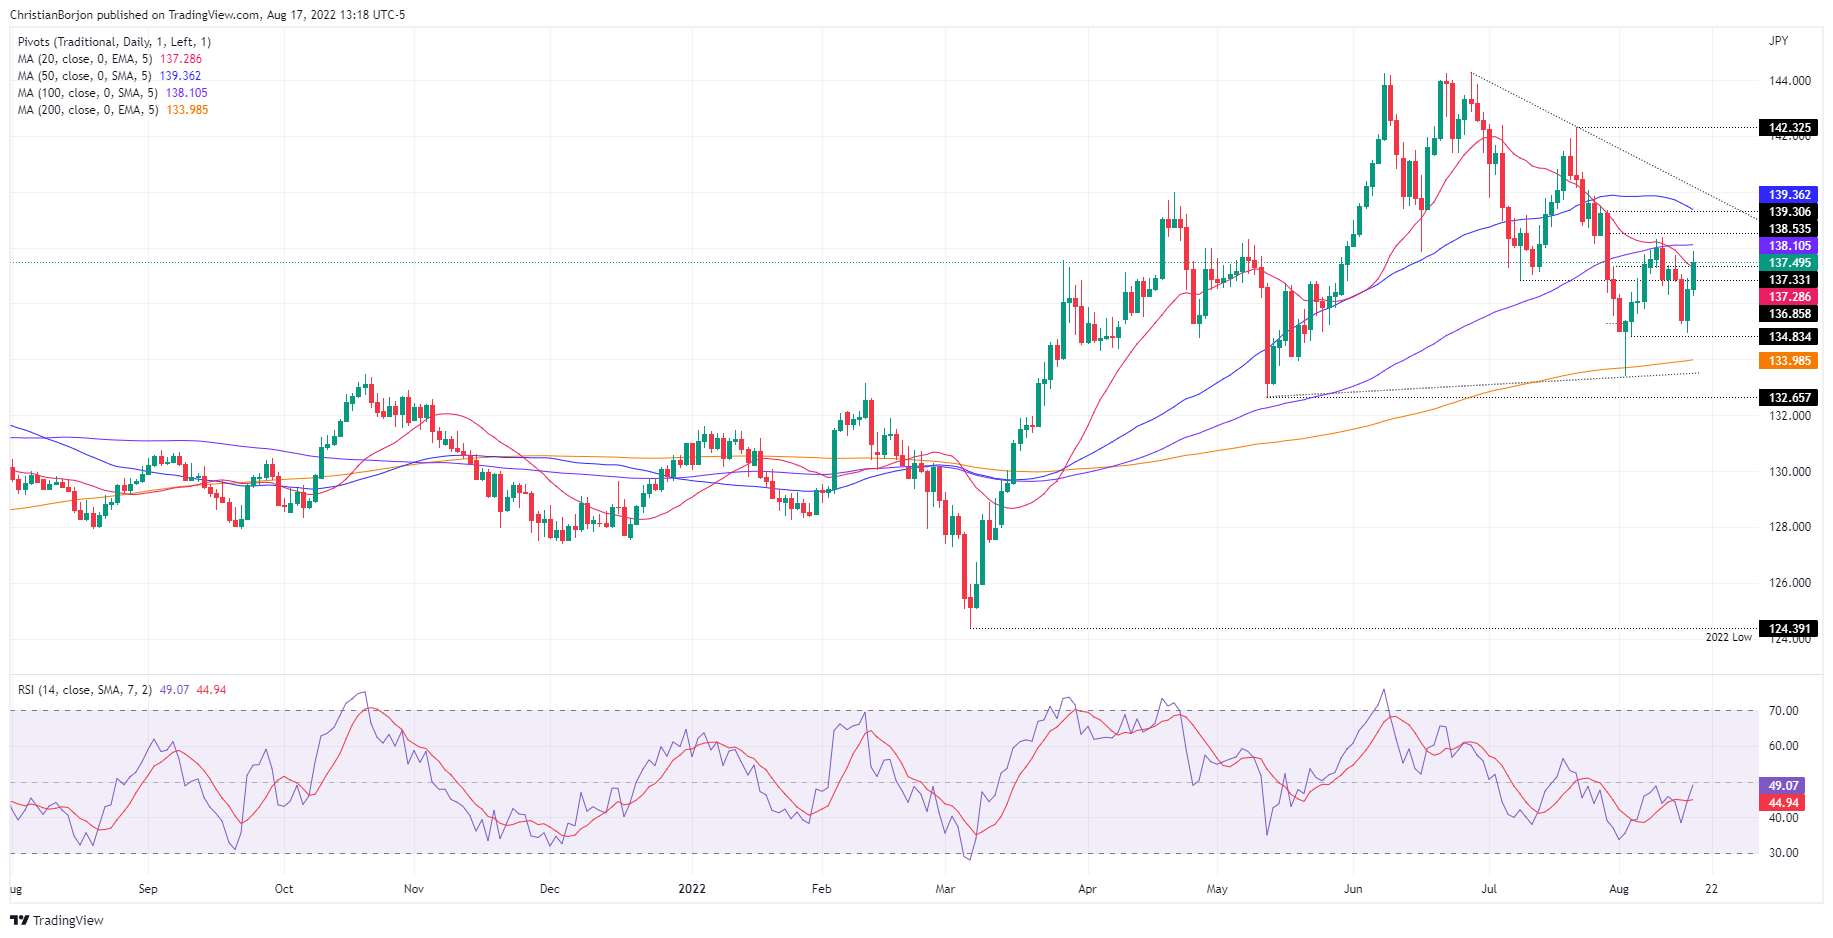 EUR/JPY Daily chart
EUR/JPY Key Technical Levels
The Minutes of the Federal Open Market Committee (FOMC) policy decision that took place over the July 26-27 policy meeting that may shed light on just how aggressive they expect to be have been released as follows:
- Fed minutes: All participants at July 26-27 policy meeting agreed 75-basis-point interest rate hike was appropriate.
- Some participants said the policy rate would have to reach a 'sufficiently restrictive' level to control inflation and remain there 'for some time.
- Participants 'concurred' that future rate hikes would depend on incoming information, and judged that 'at some point' it would be appropriate to slow the pace of increases.
- Participants agreed there was 'little evidence inflation pressures were subsiding and that it would take a considerable time for the situation to be resolved.
- Participants 'emphasized' that slowdown in demand would 'play an important role in reducing inflation.
- Participants noted recent readings on inflation expectations were 'consistent' with long-run expectations anchored at 2%.
- Participants said the strength of the labour market suggests economic activity is stronger than implied by weak Q2, raising the possibility of upward GDP revision.
Market reaction
US futures are pricing in a higher probability of a 50 bps hike for Sep after these minutes to around a 60% chance. The US dollar is lower as a consequence with the DXY dropping 25 points to 106.48. The 10-year yield is under pressure, dropping 0.8% to 2.888% and well off the 2.919% highs for the day. The 2-year yield dropped by nearly 1.4%.
About the FOMC minutes
Investors look for clues regarding the policy outlook in this publication alongside the vote split. A bullish tone would be expected to provide a boost to the greenback while a dovish stance would be seen as USD-negative. It needs to be noted that the market reaction to FOMC Minutes could be delayed as news outlets don’t have access to the publication before the release, unlike the FOMC’s Policy Statement.
FOMC stands for The Federal Open Market Committee organizes 8 meetings in a year and reviews economic and financial conditions, determines the appropriate stance of monetary policy and assesses the risks to its long-run goals of price stability and sustainable economic growth. FOMC Minutes are released by the Board of Governors of the Federal Reserve and are a clear guide to the future US interest rate policy.
- GBP/USD bulls are stepping in ahead of the FOMC minutes.
- This leaves a 38.2% ratio and the 50% mean reversion level vulnerable for the immediate future.
- On the 4-hour chart, the key structure on the upside is around 1.2150, 1.2280 and to the downside, around 1.2020 and then 1.1965.
GBP/USD is under pressure in midday New York trade. Cable was last down 0.39% on the day at 1.2046 and has fallen from a high of 1.2142 and met a low of 1.2027 from where it is correcting currently.
Markets have been digesting plenty of data this week in the build-up to the Federal Reserve's minutes from its July meeting. The Us dollar had been under demand following data that showed US consumer spending was steady in July. US Retail Sales were unchanged due to declining gasoline prices that weighed on receipts at service stations but, overall, consumer spending appeared to hold up. This was seen to assuage fears that the US economy was already in recession.
However, the Fed is expected to continue to hike rates aggressively to battle inflation although softer-than-expected inflation in July had eased some concerns. On the other hand, looser financial conditions as benchmark 10-year Treasury yields hold below 3% has also increased the probability that the Fed may need to be more aggressive in hiking rates to make an impact. In any case, the release of the minutes from the Fed's July 26-27 policy meeting may shed light on just how aggressive they expect to be. Fed funds futures traders are currently pricing in a 48% chance of a 50 basis points increase and a 52% probability of a 75 basis points hike.
As for domestic inflation, the UK's July Consumer Price Index data came in hot. The headline came in at 10.1% YoY vs. 9.8% expected and 9.4% in June, core came in at 6.2% YoY vs. 5.9% expected and 5.8% in June, and CPIH came in at 8.8% YoY vs. 8.6% expected and 8.2% in June.
Analysts at Brown Brothers Harriman explained that, of note, ''the Bank of England sees headline inflation peaking near 13% in October. Market expectations have risen sharply on the realization that the bank is set to continue tightening as inflation spirals ever higher.''
''WIRP suggests a 50 bp hike on September 15 is fully priced in, with 25% odds now seen of a larger 75 bp move. The swaps market is now pricing in 200 bp of tightening over the next 12 months which would see the policy rate peak near 3.75% vs. 3.25-3.50% at the start of this week and 3.0-3.25% at the start of last week.''
GBP/USD technical analysis
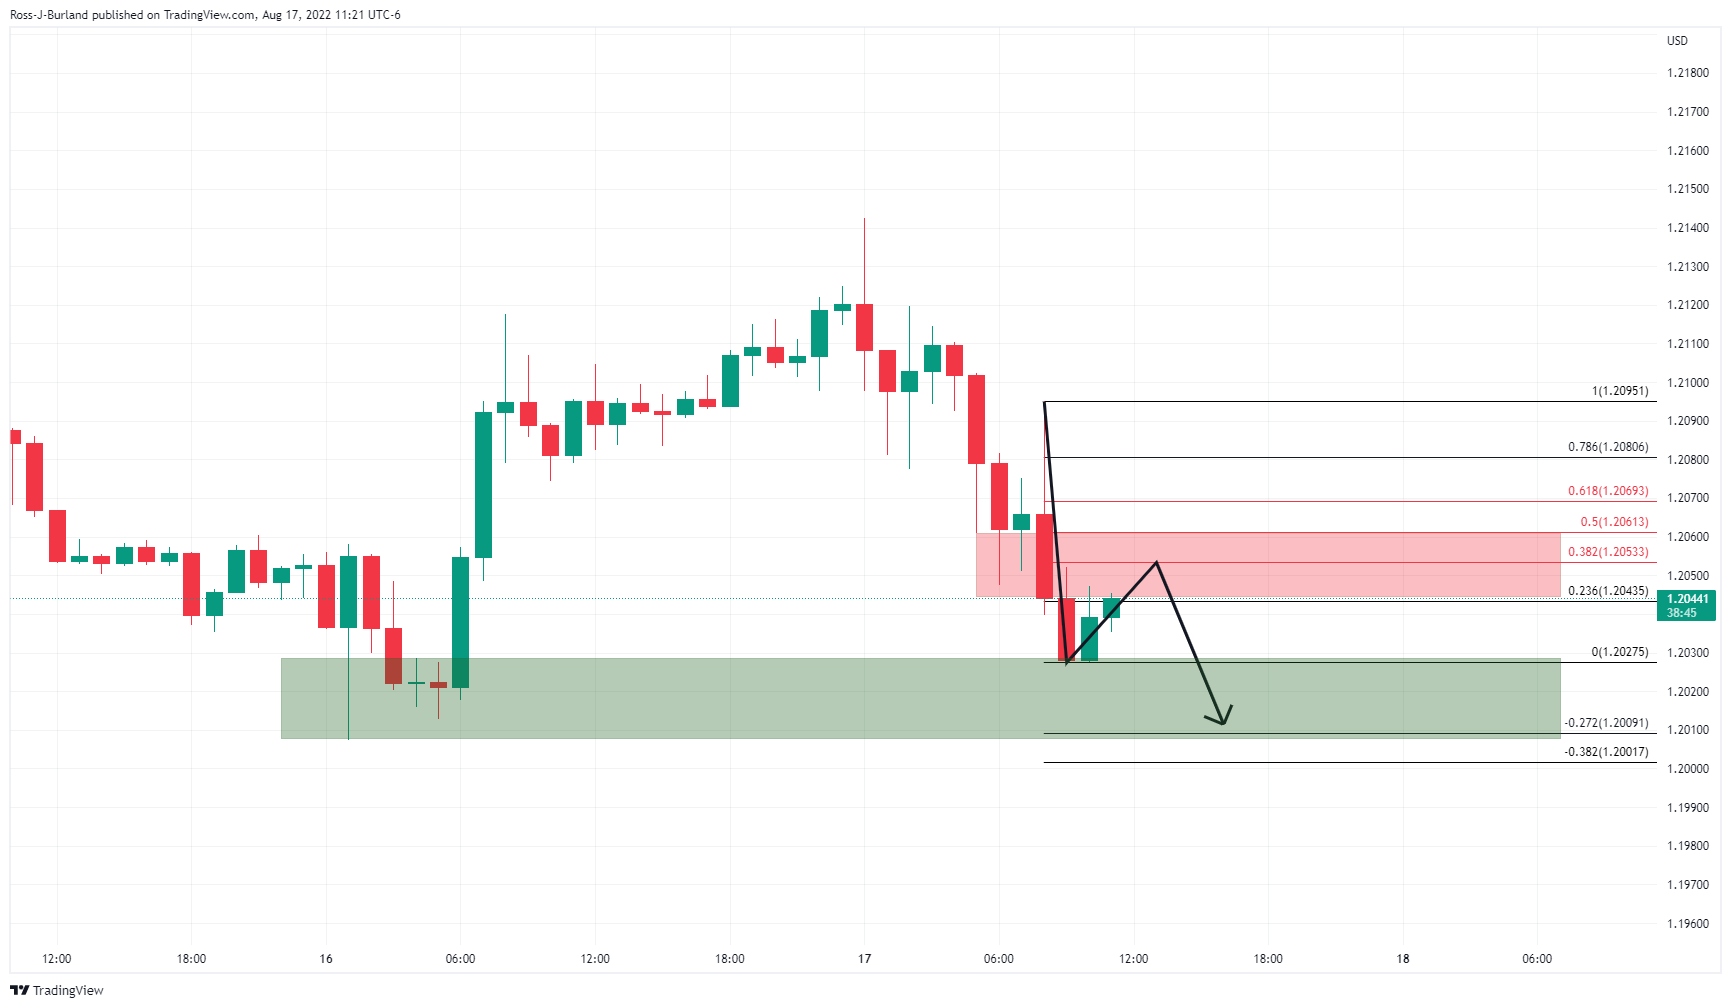
The hourly chart, above, shows that the price could be on the verge of a downside extension. However, it is in a corrective phase currently. The 15-minute charts identify areas of price imbalance, as per the greyed-out areas below:
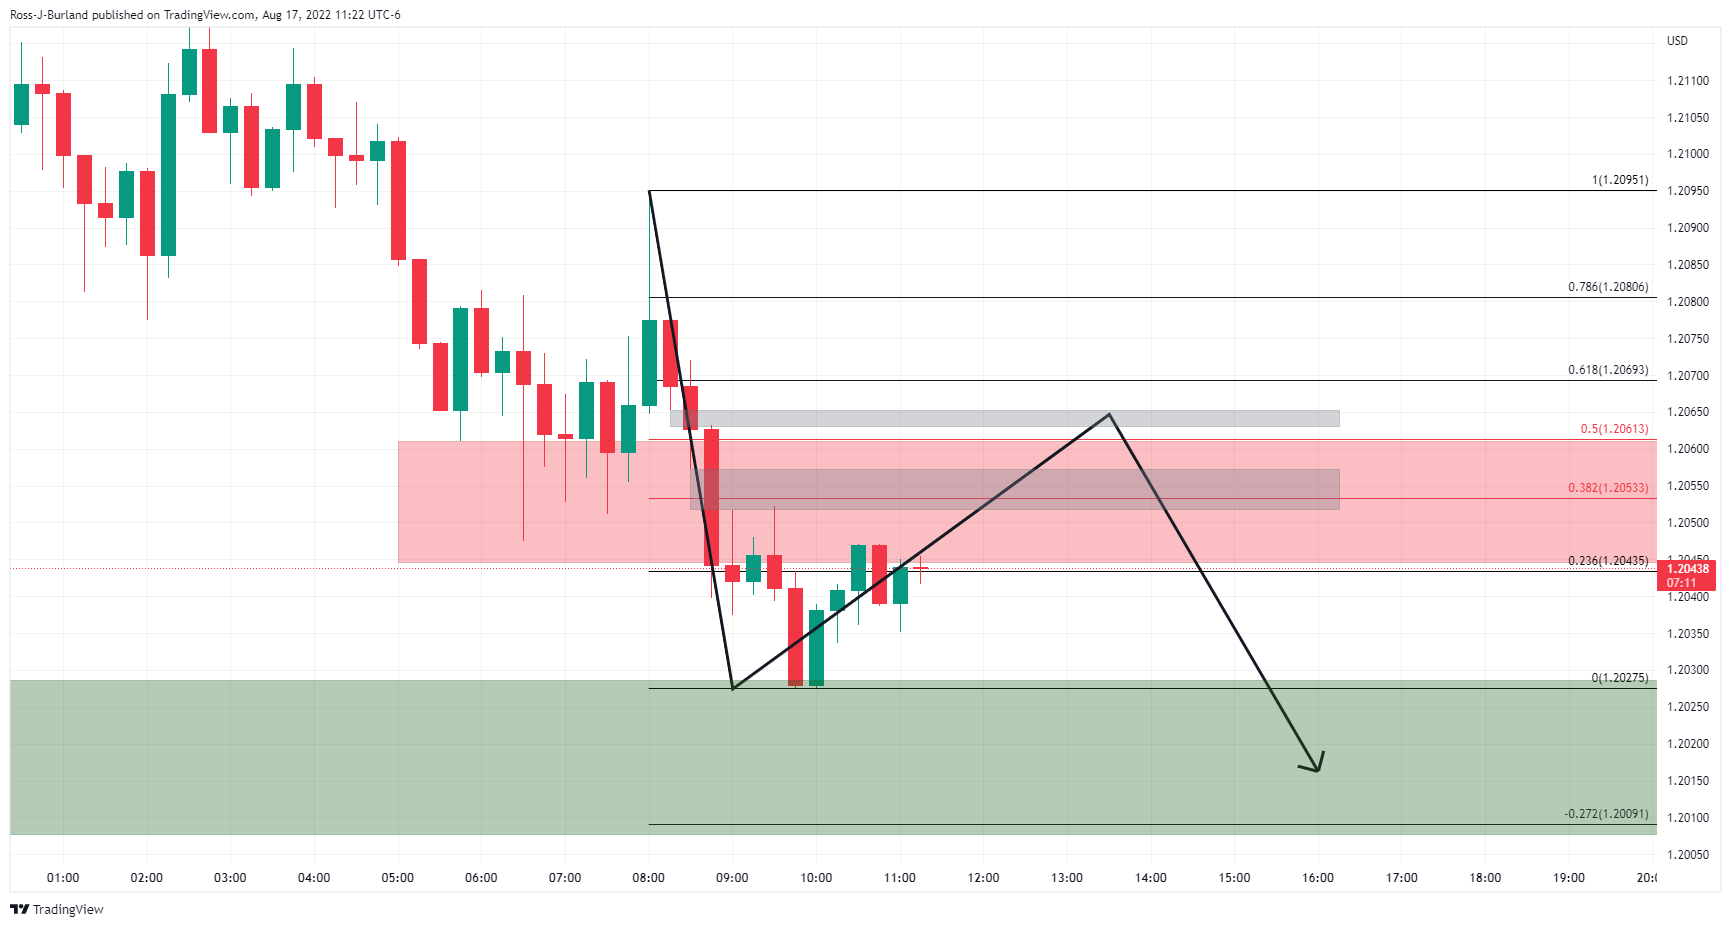
This leaves a 38.2% ratio and the 50% mean reversion level vulnerable for the immediate future.
On the 4-hour chart, the key structure on the upside is around 1.2150, 1.2280 and to the downside, around 1.2020 and then 1.1965:
- WTI is trimming some of its Tuesday’s losses, up by 0.80% in the North American session
- US EIA stockpiles shed 7.06 million barrels last week, spurring a jump in oil prices.
- China’s slower-than-expected growth pace, and Iran’s nuclear deal agreement, put a lid on higher oil prices.
Western Texas Intermediate (WTI) prices seesaw in a thin trading session after a US stockpile inventory spurred an uptick in oil prices when the US EIA revealed its weekly report illustrating that demand remains strong. At the same time, the US assesses Iran’s proposals for a nuclear deal.
In the meantime, WTI is trading at $87.84 PB, above its opening price, registering gains of 0.85% after hitting a daily low of $85.90.
WTI rises on lower US stockpiles
Sentiment deteriorated since the beginning of the European session. European bourses ended in the red, while US equities are dropping. The greenback rises, underpinned by Investors’ appetite for safe-haven assets, with the US Dollar Index hitting fresh three-week highs around 106.943, but at the time of writing, is at 106.752, up 0.27%.
The US EIA report showed that inventories fell by 7.06 million last week, while exports increased due to European buyers replacing Russia’s oil. Meanwhile, the Organization of the Petroleum Exporting Countries (OPEC) new Secretary Haitham Al Ghais said that he was confident that global oil demand would increase by almost 3 million barrels a day, in 2022, via Bloomberg.
Aside from this, worries that China’s economy might grow at a slower pace keep oil participants uneasy. China’s Premier Li Kequiang demanded local officials, that account for 40% of China’s economy, to bolster growth measures following softer-than-expected Industrial Production and Retail sales.
Therefore, the WTI outlook is slightly tilted to the downside, as further news points to lower demand but increasing offers, exacerbating downward pressure on oil prices.
WTI Key Technical Levels
- USD/CAD climbs above the 20/50-DMA, up by 0.64% in the day.
- US Retail Sales beat estimations but were ignored by market players focused on FOMC minutes.
- According to TDS analysts, a cooler-than-expected Canadian inflation report would not deter the Bank of Canada (BoC) of hiking 75 bps.
USD/CAD breaks above the 20 and 50-day EMAs, refreshing weekly highs around 1.2936 in the North American session, triggered by modestly positive US Retail Sales data, while a risk-off impulse in the markets added to overall US dollar strength, to the detriment of the Canadian dollar.
The USD/CAD is trading above its opening price at 1.2916 after reaching a daily low of 1.2827 during the European session.
The US Department of Commerce reported that Retail sales for July rose by 10.3% YoY, beating estimates of 8.3%, while the monthly reading was unchanged, missing expectations. Excluding autos and gasoline, sales jumped 0.4% YoY, vs. -0.1%. Albeit the report was positive, market participants’ focus is still on the July Federal Reserve Open Market Committee (FOMC) minutes.
In the meantime, the US Dollar Index, rises 0.33%, at 106.825, while US crude oil prices, also known as WTI, is slightly down, trading at $87.01 PB, down 0.07%. The previously mentioned factors exerted upward pressure on the USD/CAD, with buyers reclaiming the 1.2900 figure.
On the Canadian side, on Tuesday, inflation figures for July were mixed, with the plain vanilla Consumer Price Index at 7.6% YoY, unchanged. Still, core figures were skewed to the upside, mainly CPI Trimmed-mean and CPI Median, at 5.4% and 5% year-over-year, respectively.
Analysts at TDS commented, “With core inflation averaging 5.3% y/y and CPI-common sitting at 5.5%, we do not expect the Bank of Canada to draw much comfort from the moderation in headline CPI and continue to look for a 75bp hike in September.”
All that said, the USD/CAD inched higher, boosted by expectations that US FOMC minutes would be leaning towards the hawkish side, consequently bolstering US bond yields, which may underpin the US dollar.
What to watch
The US economic docket will feature Fed Governor Michelle Bowman’s speech, alongside July’s FOMC minutes. The Canadian economic calendar will reveal the Producer Price Index (PPI) for July, alongside Retail Sales.
USD/CAD Key Technical Level
According to analysts from Danske Bank, dollar weakness is likely to be transitory. They forecast EUR/USD at 0.99 in one month, 0.98 in three months and at 0.95 in twelve months.
Key Quotes:
“The large negative terms-of-trade shock to Europe vs US, a further cyclical weakening among trading partners, the coordinated tightening of global financial conditions, broadening USD strength and downside risk to the euro area makes us keep our focus on EUR/USD moving still lower (targeting 0.95) – a view not shared by the consensus.”
“The key risk to shift EUR/USD towards 1.15 is seeing global inflation pressures fade and industrial production increase. However, ‘transitory’ has substantially lost credibility and European industrial production continues to be weak. This will continue as manufacturing PMIs heads below 50. The upside risk also include a renewed focus on easing Chinese credit policy and a global capex uptick but neither appear to be materialising, at present.”
Retail sales were flat in July (against expectations of a 0.1% increase), but after adjusting for sharply lower prices of some goods, particularly gasoline, real retail sales actually rose 0.6%, the first volume gain in three months, point out analysts at Wells Fargo. They expect the staying power of the consumer to last into August before a sharp spending retrenchment takes hold this autumn.
Key Quotes:
“Amid constant headlines about the highest inflation in 40 years, there is an overlooked and counterintuitive fact that puts the July retail sales report into context: goods prices were actually down 0.5% in July, according to the already-released CPI report. Today, we learned that July retail sales were flat for the month, but the fact that goods prices were down means people actually got a little more for their money in July. By our accounting, real retail sales were actually up 0.6%.”
“We forecast real personal consumption expenditures to rise at a 2.0% annualized pace in the third quarter before contracting 0.5% in the fourth. This retail sales report does not change that expectation. But with notable crosscurrents beneath the surface, the trajectory for spending may be a bit bumpier in the second half of the year than we presently expect.”
“Supply chains are thawing, which may finally give way to some normalization in the auto sector specifically. Consumers are transitioning away from goods purchases to services, but this is happening at a very gradual pace. The staying power of consumers has been quite robust, but it's showing signs of running out. How these factors evolve from here will determine the trajectory for spending, and thereby the overall economy.”
The Swiss National Bank will likely raise the key rate by 05 basis points again in September and December according to analysts at Danske Bank. They see the EUR/CHF cross at 0.96 in one month, at 0.95 in three months and at 0.93 in twelve months.
Key Quotes:
“EUR/CHF has moved sharply lower and is currently trading around 0.96. This comes after a month of global yields moving lower and consequently rising recession fears."
“We expect the SNB to hike by 50bp again in September and December to curtail underlying inflation pressures bringing the policy rate to 0.75%. With the SNB broadly following the ECB, we see relative rates as an inferior driver for the cross. We continue to forecast the cross to move lower on the back of fundamentals and a tighter global investment environment. We thus lower our overall forecast profile and now forecast EUR/CHF at 0.93 in 12M.”
“The key upside risks to our forecast are global yield curves steepening amid a shift in the global investment environment and/or the SNB falling behind the curve.”
Analysts at Danske Bank expected the pressure on the Japanese yen will wear off but not in the short term. They forecast the USD/JPY pair at 134 (1M), 134 (3M), 133 (6M) and 125 (12M).
Key Quotes:
“With the economic recovery in Japan still hampered by COVID, domestic price pressures are likely to remain modest. Thus, the key driver of USD/JPY remains the outlook for the global economy and the energy crunch. With the US labour market still in top shape, we are not convinced global inflation pressures are yet turning and expensive natural gas over the winter will keep JPY headwinds in place.”
“Upside risks to USD/JPY come from a new surge in commodities and energy prices driving inflation and global yields higher. If global slowdown turns into a real recession, flatter yield curves and cheaper energy will drive USD/JPY lower. The risk of Tokyo intervening in FX markets has declined as JPY pressures have eased and BoJ has demonstrated a strong will to keep aiming for the inflation target without politicians interfering.”
- EUR/USD spikes to 1.0198 and quickly pulls back to 1.0160.
- US dollar and euro among top performers on Wednesday.
- Market participants await FOMC minutes.
The EUR/USD continues to move sideways on Wednesday around 1.0160/70 ahead of the release of the FOMC minutes. The pair made a run to 1.0198, hitting the highest level in two days but it quickly pulled back toward 1.0160.Economic data released in the US showed retail sales stagnated in July, against expectations of a 0.1% increase. The details of the report were above market consensus. Later on Wednesday, the Federal Reserve will release the minutes of its latest meeting when it raised the Fed Funds rate by 75 basis points. Market participants will look for clues about the next steps of the central bank.
Analysts at Brown Brothers Harriman expect the minutes to come in very hawkish. “It wasn’t until Chair Powell’s post-decision press conference that markets saw what they believed was a dovish pivot, when he acknowledged the pace of future rate hikes will depend on incoming data (…) Because the Fed has embarked on a corrective communication effort since that meeting, the minutes should reveal more about the Fed’s hawkish thinking then”. Such a scenario could be bullish for the US dollar.
The DXY is up by 0.22% on Wednesday, supported by higher yields and risk aversion. The euro is also gaining ground. EUR/CHF is up sharply for the second day in a row, recovering almost a hundred pips from record lows, approaching 0.9700. EUR/GBP is at two-day highs near 0.8450 despite higher-than-expected UK inflation data.
Short-term outlook
The EUR/USD continues to move sideways under the 20-day Simple Moving Average, today at 1.0210 and also still looking at the 1.0100/10 critical support. A break under 1.0100 should clear the way to more weakness. On the flip side above 1.0210, the euro could strengthen. Still a consolidation above 10.270 is needed for a test of the 55-day SMA that capped the rally last week, currently at 1.0335.
Technical levels
- AUD/USD slides more than 1.40% on Wednesday due to cooler-than-expected Australia’s Wage Price Index (WPI).
- Risk aversion keeps investors leaning towards safe-haven assets, bolstering the greenback.
- AUD/USD Price Analysis: Break below 0.6900 to extend losses towards 0.6869 before clearing the way towards 0.6681.
AUD/USD tumbles below the 20/50-day EMA on Wednesday, on a risk-off impulse spurred by recession fears lingering on investors’ minds, while US Retail Sales crushed expectations on a yearly basis, ahead of the release of July’s FOMC monetary policy minutes. At the time of writing, the AUD/USD is trading at 0.6915.
Global bourses reflect a deterioration in sentiment. A report by the US Department of Commerce revealed that Retail Sales on a monthly basis for July finished flat at 0%, missing estimates of 0.1%, undermined by declines in auto purchases and gas prices. Compared to one year before, sales rose by 10.3%, higher than the 8.3% estimates.
Even though the news was positive, traders’ reaction was muted, as they remained focused on the July FOMC minutes.
Additional factors weighing on the AUD/USD are the greenback, with the US Dollar Index, a gauge of the buck’s value against a basket of six peers, advancing 0.22% at 106.708. Further, Iron Ore prices drop 1.73% to $105.51 a ton, down from the August peak at $114.31.
Meanwhile, in the Asian session, the Australia Wage Price Index increased less than estimations, so traders priced in less aggressive rate hikes by the RBA, a headwind for the Aussie, which tumbled from 0.7026 daily highs below the 0.7000 figure. The quarter-on-quarter figure rose 0.7%, less than 0.8% expected, while on a yearly basis, it jumped 2.6%, lower than 2.7%.
What to watch
The US economic docket will feature the FOMC minutes release alongside Fed’s Governor Michell Bowman, crossing newswires on Wednesday. In the Australian calendar, traders will get cues from employment data.
Also read: Australian Employment Preview: Forecasts from four major banks, solid job creation
AUD/USD Price Analysis: Technical outlook
In the last three days, AUD/USD’s price action witnessed a fall of almost 3%, from monthly highs reached at 0.7136. Losses extended below the 100, 50, and 20-day EMAs, with sellers aggressively in charge. Further confirmation of the previously mentioned is the Relative Strength Index (RSI) with a steeper fall from 64.39, below the 50-midline, but with enough room to spare before reaching oversold conditions. Therefore, the AUD/USD next support will be the 0.6900 figure. Once cleared, it will expose crucial support levels, at 0.6869 August 5 low, followed by the YTD low at 0.6681.
Australia is set to report its July employment figures on Thursday, August 19 at 01:30 GMT and as we get closer to the release time, here are forecasts from economists and researchers at four major banks regarding the upcoming employment data.
Australia is expected to have added 25K positions in the month, while the Unemployment Rate is set to remain at the current 3.5%. Additionally, the Participation Rate is also seen as stable, at 66.8%.
ANZ
“For July, we expect another solid rise in employment of 40K which should see the unemployment rate edging down to 3.4%, even with a small rise in participation, on its way to sub-3%.”
Westpac
“We have an around trend forecast of 50K. We look for a further 0.1% increase in participation to 66.9% limiting the fall in unemployment to 0.1ppt to 3.4%.”
TDS
“July is a seasonally strong month for job gains and we look for the unemployment rate to trend lower. Another strong labour print (we forecast 50K) should give the RBA the assurance that the economy can withstand a cash rate of 3% by end-2022.”
NAB
“We look for employment growth of 20K and for the unemployment rate to be unchanged at 3.5%.”
- Gold turns lower for the third straight day and drops to over a one-week low on Wednesday.
- Hawkish Fed expectations, rising US bond yields underpin the USD and exert some pressure.
- The risk-off mood fails to lend support to the safe-haven XAU/USD ahead of FOMC minutes.
Gold attracts fresh selling near the $1,782 region on Wednesday and turns lower for the third straight day. The intraday selling bias remains unabated through the early North American session and drags the XAU/USD to a one-and-half-week low, around the $1,765-$1,764 area in the last hour.
The US dollar ticks higher, back closer to the monthly top touched the previous day, which turns out to be a key factor denting demand for the dollar-denominated gold. Despite signs of easing US inflation, investors seem convinced that the Fed would stick to its policy tightening path. Wednesday's mostly upbeat US Retail Sales data reaffirms market bets and continues to act as a tailwind for the buck.
Hawkish Fed expectations, meanwhile, trigger a fresh leg up in the US Treasury bond yields. This offers additional support to the greenback and further contributes to driving flows away from the non-yielding yellow metal. That said, growing recession fears, along with the risk-off impulse, could extend some support to the safe-haven gold and help limit any further losses, at least for the time being.
Worries about a global economic downturn temper investors' appetite for perceived riskier assets, which is evident from a generally weaker tone around the equity markets. This might hold back bearish traders to place aggressive bets ahead of the FOMC meeting minutes, scheduled for release later during the US session. Market players will look for clues about the possibility of a 75 bps rate hike in September.
The Fed's policy outlook would play a key role in influencing the near-term USD price dynamics and provide a fresh directional impetus to gold. From a technical perspective, the recent repeated failures to find acceptance, or build on the momentum beyond the $1,800 mark supports prospects for a further near-term depreciating move. Hence, any attempted recovery could still be seen as a selling opportunity.
Technical levels to watch
- EUR/USD comes under pressure once again near 1.0150.
- The 1.0370/80 band caps the upside for the time being.
EUR/USD returns to the lower end of the weekly range near 1.0150 and fades at the same time Tuesday’s shy advance.
While below the 1.0370/80 band, a region where the August high and the 6-month resistance line converge, the pair is expected to remain under downside pressure. That said, the lower end of the recent range in the 1.0100 zone should hold the downside ahead of a potential challenge of the psychological parity level.
In the longer run, the pair’s bearish view is expected to prevail as long as it trades below the 200-day SMA at 1.0873.
EUR/USD daily chart
- GBP/USD witnesses an intraday turnaround and retreats nearly 100 pips from the daily high.
- The USD stands tall near the monthly peak and turns out to be a key factor exerting pressure.
- The US Retail Sales fail to provide any impetus as the focus remains on the FOMC minutes.
The GBP/USD pair extends its intraday retracement slide from the vicinity of mid-1.2100s and continues losing ground through the early North American session. Spot prices drop to the 1.2050-1.2045 region, or a fresh daily low in the last hour, reversing a major part of the overnight recovery gains from the monthly low.
The US dollar regains some positive traction and inches back closer to its highest level since late July touched the previous day. This overshadows hotter-than-expected UK consumer inflation figures and attracts fresh selling around the GBP/USD pair. Expectations that the Fed would stick to its policy tightening path, along with a fresh leg up in the US Treasury bond yields and the risk-off impulse, continue to underpin the safe-haven buck.
The USD holds on to its modest intraday gains after the US Census Bureau reported that US Retail Sales remained flat in July, missing expectations for a modest 0.1% increase. A slight disappointment, however, was largely offset by unexpected growth in sales excluding autos, which rose 0.4% during the reported month. Adding to this, Control Group sales climbed 0.8% during the reported month against consensus estimates pointing to a 0.6% rise.
The data might have lifted bets for a larger Fed rate hike move at the September meeting, which remains supportive of elevated US Treasury bond yields. That said, traders seem reluctant to place aggressive bets and prefer to wait for the FOMC meeting minutes, due for release later during the US session. This, in turn, suggests that the GBP/USD pair is more likely to find decent support and stall the intraday slide near the 1.2000 pivotal support.
Technical levels to watch
Is this the start of the pain trade in gold? As gold prices trade towards their pandemic-era entry levels, some traders’ complacent length is increasingly at risk for capitulation, economists at TD Securities report.
FOMC minutes to reinforce a hawkish stance
“While money manager length in gold hovering near multi-year lows, we are still anticipating a capitulation event in gold driven by the unwind of a massively bloated position held by a few proprietary trading shops and family offices.”
“The FOMC minutes today are likely to reinforce a hawkish stance, and considering the strength in financial conditions observed over the past weeks, the Jackson Hole symposium presents an additional avenue for the Fed to push back against the dovish narrative.”
“The margin of safety for trend follower short covering is rising, while Shanghai traders are also likely to join in on the offer after having accumulated nearly 14 tonnes of gold ahead amid Taiwan tensions with lockdowns and a depreciating CNY denting Chinese demand.”
- USD/JPY gains strong follow-through traction for the second successive day on Wednesday.
- Hawkish Fed expectations, rising US bond yields underpin the USD and remain supportive.
- The markets react little to the US Retail Sales figures as the focus remains on FOMC minutes.
The USD/JPY pair prolongs its one-week-old ascending trend and gains traction for the second straight day on Wednesday. The pair maintains its strong bid tone through the early North American session and is currently placed just below mid-135.00s, or over a one-week high.
The US dollar regains positive traction and inches back closer to the monthly peak touched the previous day, which turns out to be a key factor acting as a tailwind for the USD/JPY pair higher. The recent hawkish remarks by several Fed officials fueled speculations that the Fed would stick to its policy tightening path. This, along with a fresh leg up in the US Treasury bond yields, continues to underpin the buck.
The USD holds steady after the US Census Bureau reported that the US Retail Sales remained flat MoM in July, missing estimates for a modest 0.1% increase. The slight disappointment, however, was largely offset by unexpected growth in sales excluding autos, which rose 0.4% during the reported month. Adding to this, Control Group sales climbed 0.8% during the reported month against market expectations for a 0.6% rise.
The data reaffirms hawkish Fed expectations and remains supportive of elevated US bond yields, widening the US-Japan rate differential. This, in turn, weighs on the Japanese yen and pushes the USD/JPY pair higher. That said, the risk-off impulse, as depicted by a generally weaker tone around the equity markets, seems to offer some support to the JPY and might keep a lid on any meaningful upside for the pair, at least for now.
Traders might also refrain from placing aggressive bets and prefer to wait on the sidelines ahead of the FOMC meeting minutes, due later during the US session. Investors will look for clues about the possibility of a larger 75 bps Fed rate hike move in September, which would play a key role in influencing the near-term USD price dynamics. This, in turn, should help determine the next leg of a directional move for the USD/JPY pair.
Technical levels to watch
- Retail Sales in the US stayed unchanged on a monthly basis in July.
- US Dollar Index continues to push higher toward 107.00.
Retail Sales in the US stayed virtually unchanged at $682.8 billion in July, the data published by the US Census Bureau showed on Wednesday. This reading followed June's increase of 0.8% and came in slightly weaker than the market expectation of +0.1%.
"Total sales for the May 2022 through July 2022 period were up 9.2% from the same period a year ago," the publication further read. "The May 2022 to June 2022 percent change was revised from up 1.0% to up 0.8%."
Market reaction
The greenback continues to outperform its rivals after this data with the US Dollar Index rising nearly 0.4% on the day at 106.87.
- DXY keeps the weekly bounce well in place near 106.80.
- Extra upside appears likely once 107.00 is surpassed.
DXY quickly fades Tuesday inconclusive price action and resumes the upside to the upper end of the recent range near 106.80.
The continuation of the upside momentum could extend to the August high near the 107.00 mark (August 5). The breakout of this level should motivate the index to challenge the post-FOMC meeting high at 107.42 (July 27).
Looking at the broader scenario, the bullish view in the dollar remains in place while above the 200-day SMA at 100.22.
DXY daily chart
- EUR/JPY extends further north of 137.00 its weekly recovery.
- Immediately to the upside comes the August high at 138.40.
EUR/JPY adds to Tuesday’s gains and reclaims the area beyond the 137.00 yardstick on Wednesday.
In case the recovery becomes more serious, then the cross should meet the next barrier at the 100-day SMA at 138.10 ahead of the more relevant August high at 138.39 (August 10).
While above the 200-day SMA, today at 133.98, the prospects for the pair should remain constructive.
EUR/JPY daily chart
Trend signals in gold have deteriorated further. As strategists at TD Securities note, the downtrend in gold is still gaining steam.
Gold distrusts Fed pivot
“Trend signals in the yellow metal are pointing to a strengthening downtrend, which clashes against market hopes of a Fed pivot amid cooling inflation.”
“As long as gold remains below $1,890 before year-end, participants should distrust a regime change in gold prices associated with a pivot in Fed policy.”
Economists at Commerzbank have significantly lowered their EUR/USD forecast. The reason is that the euro is likely to continue to suffer from the risk of a halt to Russian gas supplies and from the relatively hesitant European Central Bank (ECB) monetary policy.
A recession in the euro area will increase pressure on EUR/USD
“We now expect a recession for the euro area, triggered by high energy prices, in turn, a consequence of reduced gas supplies from Russia.”
“For 2023, we expect a partial recovery of EUR/USD when it becomes clear that Europe can meet its energy needs without Russian gas, when energy prices settle down again and when it becomes clear that the ECB resumes its rate hike cycle.”
“EUR/USD: Sep-22 1.00 Dec-22 0.98 Mar-23 0.98 Jun-23 1.02 Sep-23 1.06.”
US Monthly Retail Sales Overview
Wednesday's US economic docket highlights the release of monthly Retail Sales figures for July, due later during the early North American session at 12:30 GMT. The headline sales are estimated to register a modest 0.1% growth during the reported month, down sharply from the 1% increase in June. Excluding autos, core retail sales probably shrunk by 0.1% in July against the 1% rise in the previous month.
Analysts at ING offer a brief preview of the report and explain: “Retail sales at the headline level will be modestly depressed (0.3%) due to falling gasoline prices weighing on gas station sales as it is a nominal dollar figure. However, this frees up cash to spend on other goods and services so the ‘core’ rate of retail sales growth should rebound and help to translate into rising real consumer spending.”
How Could it Affect EUR/USD?
Ahead of the key release, the US dollar stands tall near the monthly peak touched the previous day and continues to draw support from hawkish Fed expectations. A surprisingly stronger consumer spending data would reaffirm speculations that the Fed would stick to its aggressive policy tightening path and lift the greenback. Conversely, a weaker-than-expected report could prompt some USD selling and lend support to the EUR/USD pair. That said, any immediate market reaction is more likely to be short-lived ahead of the FOMC meeting minutes, scheduled to be released later during the US session.
Eren Sengezer, Editor at FXStreet, offers a brief technical outlook and writes: “EUR/USD faces strong resistance in the 1.0200/1.020 area, where the 100-period and the 200-period SMAs on the four-hour chart are located. Unless buyers reclaim that level, the bearish bias should stay intact. Meanwhile, the Relative Strength Index (RSI) indicator stays below 50 and the 20-period SMA crossed below the 50-period and 100-period SMAs, supporting the view that sellers look to dominate the pair's action.”
Eren also outlines important technical levels to trade the EUR/USD pair: “On the downside, 1.0150 (static level) aligns as first support. Although the pair dropped below that level on Tuesday, it managed to rise back above it. If this level is confirmed as resistance, additional losses toward 1.0100 (static level, psychological level) and 1.0050 (static level) could be witnessed.”
“Above 1.0200, resistance are located at 1.0230 (Fibonacci 38.2% retracement, 50-period SMA) and 1.0300 (Fibonacci 50% retracement),” Eren adds further.
Key Notes
• US Retail Sales Preview: Forecasts from six major banks, losing speed in July
• EUR/USD Forecast: Euro could test 1.0100 with key resistances staying intact
• EUR/USD: Break below support at 1.01 to open up a move towards parity – ING
About US Retail Sales
The Retail Sales released by the US Census Bureau measures the total receipts of retail stores. Monthly per cent changes reflect the rate of changes in such sales. Changes in Retail Sales are widely followed as an indicator of consumer spending. Generally speaking, a high reading is seen as positive (or bullish) for the USD, while a low reading is seen as negative (or bearish).
In the view of economists at Scotiabank, the USD/CNH pair is set to trade within a 6.70-6.80 range in the weeks ahead.
China’s economy to revive further in the second half
“We expect China’s economy to revive further in the second half with more fiscal stimulus to be rolled out.”
“We believe China’s central bank will not flood the economy with excessive liquidity and a weaker yuan that makes imports into China more expensive is not in the monetary authority’s interest at this stage.”
“USD/CNH is expected to trade between 6.70 and 6.80 with downside potential in the weeks ahead.”
The S&P 500 Index now face a key test of technical resistance at the 200-day moving average (DMA), potential downtrend and 61.8% retracement at 4327/70, with Credit Suisse’s bias for a potentially important top here.
Weekly MACD momentum maintains its bullish cross
“Although weekly MACD momentum has crossed higher, we continue to look for a potentially important top at the falling 200-DMA, potential downtrend from the beginning of the year and 61.8% retracement of the 2022 fall at 4327/70.”
“Near-term support is seen at 4177, with a break below 4117/07 seen as needed to add weight to our view for a fall back to the 63-day average, now at 3974.”
“A close above 4370 would suggest strength can extend further, with resistance seen next at 4513, then the 78.6% retracement of the 2022 fall at 4566.”
Norges Bank meets on Thursday, August 18 at 08:00 GMT and as we get closer to the release time, here are the expectations forecast by the economists and researchers of six major banks regarding the upcoming central bank's Interest Rate Decision.
Markets are pricing in a 50 basis points (bps) rate hike to 1.75%. Furthermore, investors will be even more focused on the wording of the statement and on the press conference by Norges Bank Governor Ida Wolden Bache.
Danske Bank
“We now expect NB to hike policy rates by 50 bps instead of 25 bps after the recent high inflation numbers. However, there will be no press briefing as this is an intermediary meeting. We still believe that the policy rate will peak in December this year at 2.25% by hiking 50 bps this week, 25 bps in September, and 25 bps in December. If we are right in our call on NB, NOK FX is not expected to be much affected.”
TDS
“We look for a 50 bps hike from Norges Bank, in line with market pricing and the consensus, and despite the Norges Bank's most recent forecast of a 25 bps hike at this meeting. Inflation has been much stronger than expected, with headline and underlying inflation running 1.7ppts and 1.3ppts above the Bank's latest forecasts, respectively.”
ING
“Having hiked rates by 50 bps in June, on paper there are good reasons for Norway’s central bank to do the same again. Crucially the latest inflation readings have come in above the bank’s forecasts again. While the bank will be nervous about inflation, its models will also be acknowledging the fact that global market rates have fallen since June, which in isolation would be interpreted as a dovish factor. Bottom line: it’s a close call, though we narrowly favour a 25 bps move. As other central banks have found in recent weeks, Norges Bank faces a choice between sticking to its ‘forward guidance’, or adapting to the latest economic data.”
Commerzbank
“The fact that Norges Bank will raise the policy rate by 50 bps to 1.75% is likely to be largely priced in. Inflation is higher than expected by Norges Bank in June. It will therefore in all likelihood have to adjust its inflation forecasts upward again in the new monetary policy report in September. As a result, the basis for Wednesday’s interest rate hike is likely to be higher-than-expected inflation. I see a good chance that, on the basis of new, higher inflation forecasts that will be published in September with the new monetary policy report, it will then also raise the policy rate by another 50 bps and adjust the interest rate path accordingly. Hence, if Norges Bank plans to raise the policy rate by 50 bps in September also, it will in any case have to adjust the interest rate path upward once again. It would at least have to hint at that. What does that mean for the NOK? If the Norges Bank sounds restrictive and signals another juicy move for September, the NOK should be able to appreciate against the euro.”
Credit Suisse
“We anticipate nuance from the Norges Bank, where a 50 bps hike might still not be seen as a clearly hawkish development.”
Swedbank
“We expect Norges Bank to hike by 50 bps at the upcoming August meeting and in September, followed by 25 bps in both November and December. This should leave the policy rate at 2.75% by year-end, which we deem to be the peak.”
- Silver witnesses some selling for the third successive day on Wednesday.
- Acceptance below the 50 DMA supports prospects for additional losses.
- Any attempted recovery move might now be seen as a selling opportunity.
Silver struggles to capitalize on the previous day's late rebound and meets with a fresh supply near the $20.25-$20.30 region on Wednesday. The white metal remains depressed for the third straight day and slips back below the $20.00 psychological mark during the first half of the European session.
The XAG/USD is currently hovering around over a one-week low touched on Tuesday and now seems to have found acceptance below the 50-day SMA. Bulls now look to the 38.2% Fibonacci retracement level of the $22.52-$18.15 downfall, near the $19.80 region, to offer some support. A convincing break below would expose the next relevant support near the $19.55 area (last week's swing low).
The latter should now act as a key pivotal point, which if broken decisively would be seen as a fresh trigger for bearish traders and make the XAG/USD vulnerable. Spot prices could then accelerate the fall towards the 23.6% Fibo. level, around the $19.20-$19.15 region, en route to the $19.00 mark. The downward trajectory could further get extended towards the $18.45-$18.40 area.
On the flip side, the 50% Fibo. level, around the $20.35 region, now becomes an immediate strong hurdle. Any subsequent move up could be seen as a selling opportunity near the $20.65 horizontal zone and remain capped near the 61.8% Fibo. level, around the $20.85 region. That said, some follow-through buying beyond the $21.00 mark could negate the negative outlook for the XAG/USD.
Silver daily chart
-637963279129018048.png)
Key levels to watch
Gold remains in a range. However, a major “double top” continues to threaten, as strategists at Credit Suisse note.
Sustained break above 55 DMA to confirm further ranging
“A convincing break above the 55-day average, currently seen at $1,786, would confirm further ranging in the two-year range, with next resistance then seen at the even more important 200-day average, currently at $1,842.”
“We continue to stress that a closing break below $1,691/77 would be sufficient to complete a large ‘double top’, which would turn the risks lower over at least the next one-three months. We note that the next support should this top be triggered is seen at $1,618/16, then $1,560.”
- EUR/GBP bounces off earlier lows near 0.8380.
- UK CPI rose 10.1% YoY in July, 0.6% MoM.
- EMU advanced Q2 GDP is seen expanding 3.9% YoY.
Following a knee-jerk to the vicinity o 0.8380, EUR/GBP regains some composure and now manages to retake the 0.8400 barrier and beyond on Wednesday.
EUR/GBP remains supported by the 0.8350 region
EUR/GBP so far leaves behind three consecutive daily retracements, including a monthly peak just shy of 0.8500 the figure on August 12, although the breach of the key 200-day SMA – today at 0.8430 – has opened the door to fresh weakness in the upcoming periods.
The cross thus reverses the initial knee-jerk to the 0.8385/80 band following the bout of strength in the British pound in the wake of the release of UK inflation figures for the month of July.
According to the latter, headline inflation rose 10.1% in the year to July and 0.6% from a month earlier, while the Core CPI also rose above expectations 6.2% over the last twelve months.
The initial reaction post-CPI release saw investors penciling in further (and larger?) rate hikes by the BoE in its next meetings, which in turned morphed into further legs for the quid. However, the latest dovish tilt at the BoE event and the prospects of a 15-month recession in the UK economy warns against sustainable strength in the sterling ahead.
Closer to home, another revision of the EMU Q2 GDP now sees the region’s economy expanding 3.9% YoY.
EUR/GBP key levels
The cross is gaining 0.03% at 0.8409 and faces the next hurdle at 0.8434 (200-day SMA) followed by 0.8492 (monthly high August 12) and then 0.8584 (weekly high July 21). On the flip side, a breach of 0.8386 (weekly low August 17) would expose 0.8339 (monthly low August 2) and finally 0.8249 (monthly low April 14).
In the view of Kit Juckes, Chief Global FX Strategist at Société Générale, EUR/USD is unlikely to break below 0.95. Nonetheless, the pair is set to trade under parity in the coming weeks.
Europe has tapped into global LNG supplies
“The good news, that Europe has tapped into global LNG supplies and is doing a better job of weaning itself off Russian gas, is enough to provide some kind of a cushion for EUR/USD and makes a break below 0.95 less likely now unless the conflict with Russia escalates dramatically.”
“However, the drag of higher prices on European growth seems sure to get EUR/USD below parity for a while in the coming weeks.”
Haitham Al Ghais, the new Secretary-General of the Organization of the Petroleum Exporting Countries (OPEC), said on Wednesday that he doesn't see a major global recession.
Additional quotes
Open to dialogue with the US.
Spare capacity about 2m-3m bpd, running on thin ice.
It is too early to call the outcome of the September 5 meeting.
See the likelihood of an oil-supply squeeze this year.
Market reaction
The WTI recovery from six-month lows of $85.47 gains momentum on these above comments. The US oil erases losses to trade flat at $86.65, as of writing.
- USD/CAD remains supported by USD rebound and falling WTI prices.
- Recession fears continue to dent the market sentiment.
- Bulls look to recapture 50 DMA ahead of the FOMC minutes.
USD/CAD is heading back towards the critical 50-Daily Moving Average (DMA) at 1.2901, having found buyers once again near the 1.2830 region.
In doing so, the major is capitalizing on the renewed weakness in WTI prices amid recession fears, which has dragged the black gold to fresh six-month lows near $85.50.
Additionally, risk-aversion-driven safe-haven flows into the US dollar have also aided the rebound in the major. On Tuesday, USD/CAD incurred sizeable losses after softer Canadian inflation data failed to dissuade the Bank of Canada’s (BOC) commitment to combat inflation. BOC Governor Tiff Macklem said, “our job is not done yet,” adding that “we're determined to eliminate high inflation and return to our 2% target.”
Will the Fed minutes throw a dovish surprise? Investors are eagerly awaiting the Fed July meeting minutes to gain fresh insight on the size of the rate increments in the coming months. The US dollar could potentially see a fresh leg up if the world’s most powerful central bank maintains its hawkish rhetoric in its fight against inflation.
From a short-term technical perspective, USD/CAD is looking to retest the 100 DMA barrier but acceptance above the latter is crucial to initiate a meaningful recovery towards the monthly highs of 1.2985.
Ahead of that bulls will be probed by the 1.2950 psychological hurdle.
The 14-day Relative Strength Index (RSI) is edging higher gradually above the midline, supporting the case for the bullish potential.
USD/CAD: Daily chart
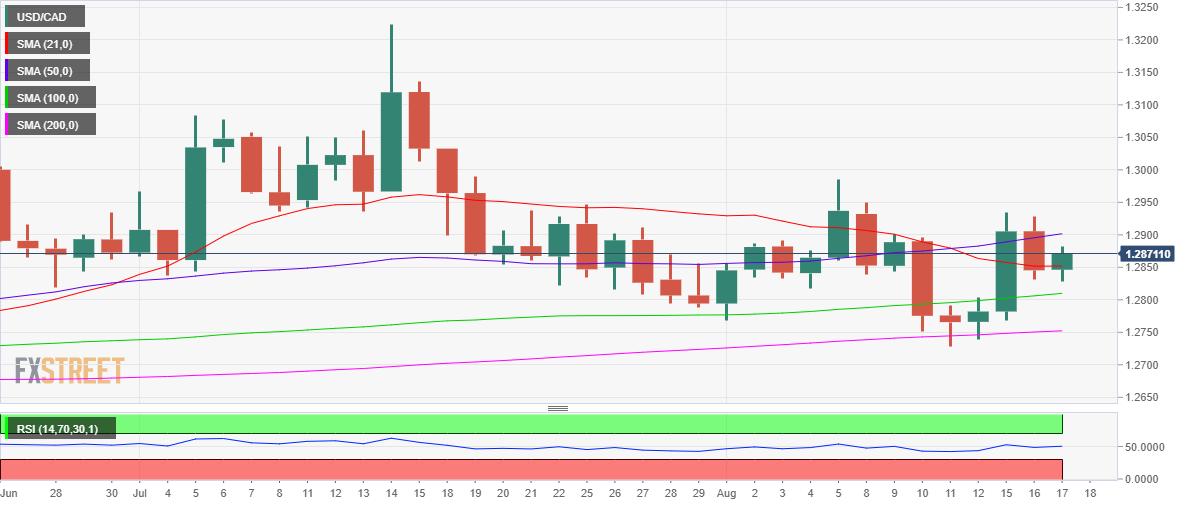
On the flip side, the immediate support of the previous resistance at the horizontal 21 DMA of 1.2852 will be tested should sellers fight back control.
The next line of defense for buyers is seen at the mildly bullish 100 DMA at 1.2809, below which the 200 DMA at 1.2752 will come to the rescue.
USD/CAD: Additional levels to consider
EUR/USD has failed to reclaim 1.0200 following the latest recovery attempt. The pair could test 1.0100 with key resistances staying intact, FXStreet’s Eren Sengezer reports.
Additional losses are likely in the near term
“EUR/USD faces strong resistance in the 1.0200/1.020 area, where the 100-period and the 200-period SMAs on the four-hour chart are located. Unless buyers reclaim that level, the bearish bias should stay intact.”
“On the downside, 1.0150 aligns as first support. If this level is confirmed as resistance, additional losses toward 1.0100 and 1.0050 could be witnessed.”
“Above 1.0200, resistance are located at 1.0230 and 1.0300.”
The Mexican peso is currently holding a small gain versus the US dollar in year-to-date terms. Sharp rises in domestic interest rates have supported the MXN and economists at Scotiabank expect policymakers to tighten rates further, holding USD/MXN within recent ranges.
Peso supported by tighter monetary policy
“Banxico’s proactive rate hikes are arguably the major factor behind the peso’s strength, and we anticipate that for the near term, we will continue to see its rate hikes matching the pace set by the Federal Reserve, keeping the interest rate spread between the two countries near 600 bps.”
“There are some risks looming on the horizon, such as the USMCA arbitrage against Mexico by Canada and the US due to energy policy, inflation risks to what are so far resilient remittance flows, as well as continued weak foreign investment, but we don’t see these being a major headwind for MXN during this calendar year.”
- GBP/USD struggles to capitalize on hotter-than-expected UK CPI-led modest intraday gains.
- Hawkish Fed expectations continue to act as a tailwind for the USD and act as a headwind.
- The downside seems cushioned as traders seem reluctant ahead of the key FOMC minutes.
The GBP/USD pair retreats a few pips from the early European session high and is currently placed near the lower end of its daily trading range, just below the 1.2100 mark.
The British pound did get a minor boost after the UK Office for National Statistics reported that the headline CPI accelerated to the highest level since 1982 and rose 10.1% YoY in July. The reading was well above the 9.4% recorded in June and 9.8% estimated, lifting bets for another rate hike by the Bank of England. The GBP/USD pair, however, struggles to capitalize on the modest intraday uptick and meets with some selling in the vicinity of the 1.2200 round figure.
Growing recession fears might force the UK central bank to adopt a gradual approach to raising interest rates. This, along with the underlying bullish tone surrounding the US dollar, acts as a headwind for the GBP/USD pair. The USD stands tall near the monthly peak touched the previous day and continues to draw support from expectations that the Fed would stick to its policy tightening path. Apart from this, the cautious market mood further underpins the safe-haven buck.
That said, the USD bulls might refrain from placing aggressive bets and prefer to wait on the sidelines ahead of the highly-anticipated FOMC minutes, due later during the US session. Investors would look for clues about the possibility of a 75 bps Fed rate hike move at the September policy meeting. This should influence the USD and provide a fresh directional impetus to the GBP/USD pair. In the meantime, the US Retail Sales figures might allow traders to grab short-term opportunities.
Hence, it would be prudent to wait for follow-through selling before confirming that the previous day's bounce from the 1.2000 psychological mark or the monthly low has run out of steam. That said, bulls are likely to wait for sustained strength beyond the 1.2200 round-figure mark before positioning for any further near-term appreciating move for the GBP/USD pair.
Technical levels to watch
Economist at UOB Group Lee Sue Ann notes the BoK could hike rates by 25 bps at its next meetings in August, October and November.
Key Quotes
“On the assumption that inflation will peak in 2H22, we maintain our forecast for the BoK to revert to 25bps hike for the remaining meetings this year in Aug, Oct and Nov to bring the benchmark base rate to 3.00% by year-end.”
“With an expected moderation in inflation rate next year, the BOK is likely to stay on hold thereafter, or even begin to trim interest rate should growth risks mount.”
- NZD/USD fails to capitalize on the post-RBNZ gains and turns lower for the third successive day.
- Recession fears continue to act as a headwind for the risk-sensitive kiwi amid fresh USD buying.
- Hawkish Fed expectations, elevated US bond yields underpin the buck ahead of FOMC minutes.
The NZD/USD pair witnesses an intraday turnaround from the 0.6385 area, or the daily high touched after the Reserve Bank of New Zealand (RBNZ) policy decision. Spot prices turn lower for the third successive day on Wednesday and drop to a one-week low, around the 0.6300 mark during the early European session.
The RBNZ announced a fourth consecutive 50 bps rate hike on Wednesday and pointed to the need to bring forward the timing of further rate increases. The initial market reaction, however, fizzles out rather quickly amid the prevalent cautious mood, which continues to act as a headwind for the risk-sensitive kiwi.
The market sentiment remains fragile amid worries about a global economic downturn, further fueled by the disappointing Chinese macro data released on Tuesday. Apart from this, the underlying bullish tone surrounding the US dollar prompts fresh selling around the NZD/USD pair and contributes to the intraday decline.
The USD stands tall near the monthly peak touched the previous day amid firming expectations that the Fed would stick to its aggressive policy tightening path. The bets were lifted by hawkish remarks by several Fed officials, stressing that it is too soon to declare a victory on inflation despite the softer US CPI report.
This, in turn, remains supportive of elevated US Treasury bond yields and underpins the buck. Traders, however, seem reluctant and prefer to move on the sidelines ahead of the FOMC meeting minutes, which would be looked upon for clues about the possibility of a larger 75 bps Fed rate hike move at the September meeting.
In the meantime, the US monthly Retail Sales figures, due for release later during the early North American session, might influence the USD price dynamics. Apart from this, traders would take cues from the broader market risk sentiment to grab short-term opportunities around the NZD/USD pair.
Technical levels to watch
The Eurozone economy expanded by 0.6% QoQ in the second quarter of this year, missing 0.7% expected and down from the 0.7% first reading, the second estimate showed on Wednesday.
On an annualized basis, the bloc’s GDP rate rose by 3.9% in Q2 vs. the preliminary figure of 4.0% while falling short of 4.0% expectations.
The Preliminary Employment Change in the old continent for Q2 arrived at 0.3% QoQ and 2.4% YoY.
Market reaction
EUR/USD was last seen trading at 1.0168, almost unchanged on the day. The pair failed to sustain gains once again, as risk-off flows dominate in the European session this Wednesday.
About Eurozone Preliminary GDP
The Gross Domestic Product released by Eurostat is a measure of the total value of all goods and services produced by the Eurozone. The GDP is considered a broad measure of the Eurozone's economic activity and health. Usually, a rising trend has a positive effect on the EUR, while a falling trend is seen as negative (or bearish).
The Bank Indonesia (BI) would likely hike its policy rate by 25 bps at its event next week, notes UOB Group’s Economist Lee Sue Ann.
Key Quotes
“BI is of the view that higher inflation is mainly driven by the supply-side disruptions and although it will reach beyond its upper target range of 2%-4% in 2022, core inflation is not under significant upward pressure.”
“Nevertheless, we expect inflation expectation to continue building up, and look for BI to hike its benchmark interest rates as early as Aug. Our forecast is for two 25bps hikes in 3Q 2022 to 4.00%, followed by another two 25bps hikes in 4Q 2022 to 4.50%.”
- EUR/USD fades Tuesday’s small uptick and refocuses on the 1.150 area.
- Another revision of the EMU Q2 GDP is due later in the region.
- In the NA session, the FOMC Minutes and Retail Sales are in the limelight.
The selling bias returns to the single currency and drags EUR/USD back to the 1.0150 zone on Wednesday.
EUR/USD now looks to the domestic, US calendar
EUR/USD keeps navigating the lower end of the recent range amidst some modest losses, although it has put some distance from weekly lows in the 1.0120 region recorded on Tuesday.
The re-emergence of the demand for the US dollar put the risk complex once again under pressure on Wednesday amidst the broad-based recovery in yields in the global cash markets.
Later in the session, another estimate of the GDP in the euro area during the April-June period is due, while Retail Sales and the release of the FOMC Minutes will be in the centre of the debate later in the NA session.
What to look for around EUR
EUR/USD now appears somewhat stabilized in the low-1.0100s against the backdrop of a firm recovery in the demand for the US dollar.
Price action around the European currency, in the meantime, is expected to closely follow dollar dynamics, geopolitical concerns, fragmentation worries and the Fed-ECB divergence.
On the negatives for the single currency emerge the so far increasing speculation of a potential recession in the region, which looks propped up by dwindling sentiment gauges and the incipient slowdown in some fundamentals.
Key events in the euro area this week: EMU GDP Growth Rate (Wednesday) – EMU Final Inflation Rate (Thursday).
Eminent issues on the back boiler: Continuation of the ECB hiking cycle. Italian elections in late September. Fragmentation risks amidst the ECB’s normalization of its monetary conditions. Impact of the war in Ukraine on the region’s growth prospects and inflation.
EUR/USD levels to watch
So far, spot is losing 0.08% at 1.0162 and a break below 1.0096 (weekly low July 27) would target 1.0000 (psychological level) en route to 0.9952 (2022 low July 14). On the other hand, the next up barrier comes at 1.0368 (monthly high August 10) seconded by 1.0495 (100-day SMA) and finally 1.0615 (weekly high June 27).
- Gold turns lower for the third successive day amid the emergence of fresh USD buying.
- Hawkish Fed expectations, rising US bond yields continue to underpin the greenback.
- Recession fears could limit losses for the XAU/USD ahead of the key FOMC minutes.
Gold continues with its struggle to gain any meaningful traction and meets with a fresh supply near the $1,782 region on Wednesday. The XAU/USD drifts in negative territory for the third successive day and drops to the $1,772 area during the early European session, back closer to over a one-week low touched the previous day.
The US dollar attracts some dip-buying and stands tall near the monthly peak, which turns out to be a key factor exerting downward pressure on the dollar-denominated gold. Despite last week's softer US CPI report, the recent hawkish remarks by Fed officials suggest that the US central bank would stick to its policy tightening path. This, along with a fresh leg up in US Treasury bond yields, underpins the USD and further contributes to driving flows away from the non-yielding yellow metal.
The downside, however, seems cushioned, at least for the time being, amid the prevalent cautious mood, which tends to benefit the safe-haven gold. The market sentiment remains fragile amid growing worries over a global economic downturn, which were further fueled by the disappointing Chinese data released on Tuesday. Investors also seem reluctant from placing aggressive bets and might prefer to move on the sidelines ahead of the FOMC minutes, due later during the US session this Wednesday.
The markets are currently pricing in a greater chance of at least a 50 bps rate hike at the September FOMC meeting. Hence, the minutes would be looked upon for clues about the possibility for a larger 75 bps move. This would play a key role in influencing the near-term USD price dynamics and determining the next leg of a directional move for gold. In the meantime, traders are likely to take cues from the US Retail Sales figures for short-term opportunities during the early North American session.
Technical levels to watch
Lee Sue Ann, Economist at UOB Group, suggests the BSP would continue hiking rates in the next periods.
Key Quotes
“The latest large off-cycle rate hike will not mark the end of the BSP’s monetary policy normalisation as yet. In fact, we see more interest rate rises ahead, depending on the incoming domestic inflation and GDP data as well as global and regional central banks’ rate decision in the near term.”
“We now bring forward our BSP rate hike projections for 1H23 to this year, taking the RRP rate back to the pre-pandemic level of 4.00% by the end of 2022.”
Here is what you need to know on Wednesday, August 17:
Following Tuesday's choppy action, the US Dollar Index regained its traction early Wednesday and climbed above 106.60 with investors turning cautious. The Gross Domestic Product data for the second quarter will be featured in the European economic docket. Later in the day, July Retail Sales data from the US will be looked upon for fresh impetus before the FOMC published the minutes of its July meeting at 1800 GMT. Reflecting the souring market mood, US stock index futures are down between 0.2% and 0.4% in the early European session.
FOMC July Minutes Preview: Can it influence September Fed rate hike expectations?
During the Asian trading hours, the Reserve Bank of New Zealand announced that it hiked its policy rate by 50 basis points to 3% as expected. Speaking on the economic outlook, RBNZ Governor Adrian Orr said that although they were not forecasting a recession, they were expecting growth to be sub-par. With the initial reaction, NZD/USD climbed toward 0.6400 but ended up reversing its direction with the dollar gathering strength during the European trading hours. As of writing, the pair was down 0.4% on the day at 0.6318.
The UK's Office for National Statistics reported on Wednesday that inflation in the UK, as measured by the Consumer Price (CPI), climbed to 10.1% in July from 9.4% in June. In the same period, the Core CPI edged higher to 6.2% from 5.8%, surpassing the market expectation of 5.9%. With the immediate reaction, GBP/USD spiked above 1.2140 before erasing its gains and returning below 1.2100.
With the greenback keeping its footing mid-week, EUR/USD continues to fluctuate in a relatively tight range below 1.0200.
USD/JPY built on Tuesday gains and rose toward 135.00 on Wednesday. The benchmark 10-year US Treasury bond yield is up more than 2% on the day, fueling the pair's advance.
After having recovered above $1,780 during the Asian trading hours, gold turned south and was last seen trading in negative territory slightly above $1,770.
Bitcoin is struggling to stage a convincing rebound amid risk aversion and trades in negative territory below $24,000 after having posted losses in the previous three days. Following a recovery attempt, Ethereum lost its momentum and erased a large portion of its daily gains. As of writing, ETH/USD was clinging to small daily gains at $1,890.
- AUD/USD meets with a fresh supply on Wednesday after a softer Australian Wage Price Index.
- The cautious mood and weaker commodity prices further weigh on the resources-linked aussie.
- The USD hovers near the monthly high and adds to the selling bias ahead of the FOMC minutes.
The AUD/USD pair struggles to capitalize on the overnight late rebound and meets with a fresh supply on Wednesday. The pair remains on the defensive through the early European session and is currently placed near a one-week low, just below the 0.7000 psychological mark.
The Australian dollar weakened after data released by the Australian Bureau of Statistics showed that Wage Price Index fell short of market expectations and rose 0.7% during the second quarter. The softer data dampens prospects for a 50 bps rate hike by the Reserve Bank of Australia in September. This, along with weaker commodity prices, exerts some downward pressure on the resources-linked aussie.
The US dollar, on the other hand, stands tall near the monthly peak and continues to draw support from hawkish Fed expectations. Despite last week's softer US CPI report, the recent comments by several Fed officials suggest that the US central bank would stick to its policy tightening path. Apart from this, a softer risk tone further underpins the safe-haven buck and weighs on the risk-sensitive aussie.
The market sentiment remains fragile amid growing worries about a global economic downturn, fueled by the disappointing Chinese macro data on Tuesday. The fundamental backdrop supports prospects for an extension of the depreciating move for the AUD/USD pair. That said, traders might refrain from placing aggressive bets ahead of the FOMC meeting minutes, due for release later during the US session.
The markets are currently pricing in at least a 50 bps rate hike at the September FOMC meeting. Hence, the minutes would be looked for clues about the possibility for a 75 bps move. This would influence the USD and determine the next leg of a directional move for the AUD/USD pair. In the meantime, the US Retail Sales figures might provide some impetus later during the early North American session.
Technical levels to watch
The US dollar withstood a second, successive negative GDP print in Q2, which is typically shorthand for a recession. Economists at Scotiabank think the USD bull cycle is looking very extended but USD bears will have to remain patient.
Dollar poised to remain firm amid few alternatives
“Despite the US economy falling into a ‘technical recession’, investors continue to feel that there is no viable alternative to the USD as the Fed pushes ahead with tighter monetary policy.”
“We expect the USD to remain firm in the next few months but significant or sustained gains may be hampered by stretched valuation (the DXY is trading one standard deviation above its 10Y moving average) and stretched USD-bullish positioning among investors.”
“A lot of good news is already priced into the USD and the currency is starting to look overvalued.”
- The index resumes the upside around the 106.70 zone.
- The US 2y-10y yield curve adds to Tuesday’s advance.
- The FOMC Minutes, Retail Sales will take centre stage later.
Following Tuesday’s inconclusive price action, the US Dollar Index (DXY) regains the smile and advances to the 106.70 region, or daily highs, on Wednesday.
US Dollar Index now looks to the docket
Bulls seem to have returned to the dollar on Wednesday. Indeed, the index picks up further pace and revisits the 106.70 zone, as the recent improvement in the risk complex seems to lack follow through.
The move higher in the dollar appears propped up by the equally firm tone in US yields, particularly in the short term and the belly of the curve, which manage to extend Tuesday’s advance.
Later in the US docket weekly MBA Mortgage Applications are due in the first turn seconded by Retail Sales, Business Inventories and the publication of the FOMC Minutes of the July 27 meeting.
What to look for around USD
The strong rebound in the dollar comes in response to some worsening conditions in the risk complex, which motivates DXY to now shift its attention to the 107.00 neighbourhood once again.
The dollar, in the meantime, is poised to suffer some extra volatility amidst investors’ repricing of the next move by the Federal Reserve, namely a 50 bps or 75 bps hike in September.
Looking at the macro scenario, the dollar appears propped up by the Fed’s divergence vs. most of its G10 peers (especially the ECB) in combination with bouts of geopolitical effervescence and occasional re-emergence of risk aversion.
Key events in the US this week: MBA Mortgage Applications, Retail Sales, Business Inventories, FOMC Minutes (Wednesday) – Initial Claims, Philly Fed Manufacturing Index, CB Leading Index, Existing Home Sales (Thursday).
Eminent issues on the back boiler: Hard/soft/softish? landing of the US economy. Escalating geopolitical effervescence vs. Russia and China. Fed’s more aggressive rate path this year and 2023. US-China trade conflict.
US Dollar Index relevant levels
Now, the index is gaining 0.05% at 106.52 and a breakout of 107.42 (weekly high post-FOMC July 27) would expose 109.29 (2022 high July 15) and then 109.77 (monthly high September 2002). On the other hand, immediate support comes at 104.63 (monthly low August 10) seconded by 103.89 (100-day SMA) and finally 103.67 (weekly low June 27).
USD/JPY extends its consolidation phase following strength to just shy of the psychological 140.00 barrier. In the opinion of economists at Credit Suisse, the pair is expected to consolidate for a lengthier period of time.
Break above 135.56/59 to suggest the risk may be turning higher again
“We look for this corrective phase to extend further and potentially for a lengthy period of time.”
“Support is seen at 132.52 initially, below which would warn of a fall back to 130.40, then the 38.2% retracement of the 2022 rally at 129.50.”
“We would not rule out a test of the ‘neckline’ to the multi-year base at 127.40, but our bias remains to look for an important floor in this 129.50/127.40 zone.”
“Above 135.56/59 is needed to suggest the risk may already be turning higher again for a retest of 139.40/140.00.”
The AUD/USD recovery has been rejected at the 200-day moving average (DMA) at 0.7146. In the view of analysts at Credit Suisse, a break below 0.6868 is needed to support a move to the YTD low at 0.6680 initially and then to the 61.8% retracement of the 2020/21 uptrend at 0.6461.
Break above the 200-DMA at 0.7146 to signal further advance
“We look for further weakness to unfold, with a break below 0.6868 needed to support a move to the YTD low at 0.6680 initially and then to the 61.8% retracement of the 2020/21 uptrend at 0.6461.”
“A break above the 200-DMA at 0.7146 would signal further advance to the June high at 0.7282, which would need to hold to prevent a deeper upmove to the late April high and the potential downtrend from 2021 at 0.7457/7547.”
The Canadian dollar (CAD) remains the best-performing G10 currency – outside of the USD – so far this year. Economists at Scotiabank expect the USD/CAD pair to end the year trading around the 1.27 level.
Outlook revised but positives remain
“We have relented on our bullish prognosis for the CAD in H2 2022 and now look for USD/CAD to hold near current levels over the balance of the year (ending 2022 at 1.27).”
“We continue to believe that our underlying fundamental story – we are forecasting relatively higher growth and tighter monetary policy in Canada over the US this year and next as well as relatively firm commodity prices – merits a stronger CAD forecast, however.”
“We target USD/CAD declining to 1.23 into the end of 2023.”
- USD/CHF picks up bids to refresh weekly top amid broad US dollar weakness.
- Traders brace for hawkish Fed signals from FOMC Minutes.
- Yields rebound but USD bulls stay alarmed with eyes on US Retail Sales, FOMC Minutes.
USD/CHF renews its weekly high to 0.9515 as the US dollar buyers return to the table, after a brief absence the previous day. In doing so, the Swiss currency (CHF) pair rises for the third consecutive day by the press time of early European morning on Wednesday.
US Dollar Index (DXY) refreshed its three-week high before reversing from 106.94, up 0.10% near the intraday high of 106.60 at the latest. The DXY rebound could be linked to the market’s preparations for today’s US Retail Sales for July, expected 0.1% versus 1.0% prior, as well as the Fed minutes.
Additionally favoring the USD/CHF buyers could the latest bounce in the US Treasury yields, as well as fears of hawkish Fed bets.
That said, the US 10-year Treasury yields defend the previous day’s rebound at 2.835%, up one basis points (bps), whereas S&P 500 Futures seesaw near a four-month high.
Recently firmer US Industrial Production, up 0.6% in July versus 0.3% expected and upwardly revised 0.0% prior, joins mixed housing data to underpin the US dollar’s safe-haven demand. Also, China’s Premier Li Keqiang recently crossed wires, via the Communist Party’s flagship newspaper People’s Daily, while urging local officials from six key provinces that account for about 40% of the country’s economy to bolster pro-growth measures. On Wednesday, President Xi Jinping and state planner National Development and Reform Commission (NDRC) showed readiness for more measures to combat the recession fears.
It’s worth noting, however, that the USD/CHF run-up needs validation from the Fed Minutes to remain on the cards.
Technical analysis
The USD/CHF pair’s recovery beyond the 200-DMA, around 0.9440 by the press time, keeps the buyers hopeful of crossing the immediate resistance line stretched from mid-July, close to 0.9535 at the latest.
The dollar goes into today’s release of the 27 July FOMC minutes about 2% off the highs of the year. In the view of economists at ING, FOMC minutes as a communication tool against easing expectations should keep the US dollar supported.
Dollar to stay supported into FOMC minutes
“The question is whether the Fed wants to use these minutes as a communication tool to push back against the view of a 2023 easing cycle. Post-meeting rhetoric from the Fed suggests that this is more likely to be the case – especially since the Fed funds futures price the policy rate being cut from 3.60% to 3.20% in the second half of next year. A further rejection of this market pricing should help the dollar.”
“Favour DXY pushing up the 107.00 area.”
- EUR/GBP drifts lower for the fourth straight day and drops to a nearly two-week low.
- Hotter-than-expected UK CPI boosts the British pound and exerts downward pressure.
- Energy supply concerns, recession fears undermine the euro and favour bearish traders.
The EUR/GBP cross prolongs its recent sharp pullback from the vicinity of the 0.8500 mark and continues losing ground for the fourth successive day on Wednesday. The cross remains depressed following the release of hotter-than-expected UK consumer inflation figures and is currently placed just below the 0.8400 mark, or a nearly two-week low.
The British pound edges higher after the UK Office for National Statistics reported that the headline CPI accelerated to the highest level since 1982 and rose 10.1% YoY in July. The reading was well above the 9.4% seen in June and 9.8% estimates, lifting bets for another rate hike by the Bank of England. This turns out to be a key factor exerting some downward pressure on the EUR/GBP cross.
That said, concerns about an economic downturn might force the UK central bank to adopt a gradual approach to raising interest rates. It is worth recalling that the BoE had warned earlier this month that a prolonged recession would start in the fourth quarter. This, in turn, held back traders from placing aggressive bullish bets around sterling and helped limit losses for the EUR/GBP cross.
The shared currency, on the other hand, remains depressed amid mounting energy supply concerns, which could drag the Eurozone economy faster and deeper into recession. This, in turn, favours bearish traders and supports prospects for a further near-term depreciating move for the EUR/GBP cross. Traders now look forward to the release of the flash (second estimate) Eurozone GDP print for a fresh impetus.
Technical levels to watch
The US Dollar Index (DXY) has rebounded sharply from key flagged support from the May high, 55-day moving average and retracement support at 105.05/104.55. Analysts at Credit Suisse look for a potential resumption of the core uptrend.
The setback since July is corrective
“We look for a break above 107.43 to further reinforce our view that the setback has been corrective only for a retest of our target of major resistance at 109.25/110.25. An eventual break above here can expose the 121.02 high of 2001.”
“A close below 104.55 would warn of a deeper but still corrective setback with support seen next at 103.67 and with strong support expected at 101.62/30.”
Sterling strikes back at the euro, backed by a hawkish Bank of England (BoE). Economists at ING expect the EUR/GBP to move back lower towards 0.8350.
Sterling enjoys the BoE re-pricing
“Look at OIS pricing for the BoE policy rate in March 2023, market pricing has shifted from 2.72% in late July to close to 3.40% yesterday. And on top of that, UK inflation quickened to 10.1% year-on-year in July, faster than expected and a new 40-year high.”
“Any further extension in the gas price surge could send EUR/GBP all the way back to 0.8350. As an exporter of natural gas, the US does not face these challenges and our bias in GBP/USD remains sub 1.20.”
In the opinion of economists at Scotiabank, the Swiss franc (CHF) is poised to stay relatively firm, particularly as the Swiss National Bank (SNB) may tolerate a stronger exchange rate to combat sticky domestic inflation.
Persistent CHF strength on sticky inflation
“The SNB’s June decision to raise interest rates and allow the CHF to appreciate reflects the central bank’s concern that inflationary pressures, while low by international standards, are proving harder than expected to control.”
“An ‘active’ approach to CHF management now allows the SNB to support the CHF if it weakens too far as well as curb strength.”
“The SNB policy rate is likely to rise a little more in the coming weeks and we look for the CHF to strengthen modestly against the EUR to 0.96 into Q4 as policy makers leverage the exchange rate to curb domestic prices.”
Economists at Commerzbank believe that the Swedish krona’s upside potential is exhausted. Therefore, the EUR/SEK pair is set to hold above the 10.30 mark.
Limited upside potential for the SEK
“Compared to the ECB, the Riksbank remains more active in the fight against inflation, which should in principle give the SEK an advantage over the euro. However, the SEK can also always come under pressure during periods of heightened uncertainty in the market.”
“Since little more monetary tightening is likely to be priced in for this year, the SEK's upside potential is largely exhausted, which is why I do not see EUR/SEK falling below 10.30 on a sustained basis this year.”
The euro is consolidating near the lows. Economists at ING expect the EUR/USD pair to drop under support at 1.01, triggering a move to parity.
German recession is becoming inevitable
“The gas crisis and what it means for eurozone growth prospects this winter is clearly taking a toll on the euro.”
“A German recession is almost inevitable in the second half of the year.”
“After a month of consolidation, EUR/USD does not look particularly oversold on technical indicators, and we continue to favour support at 1.0100 giving way to a move to parity.”
Norges Bank is set to raise the policy rate by 50 basis points to 1.75% on Wednesday. Economists at Commerzbank expect the Norwegian krone to strengthen against the euro on a restrictive central bank.
How restrictive is Norges Bank?
“If the Norges Bank sounds restrictive and signals another juicy move for September, the NOK should be able to appreciate against the euro. After all, it is becoming increasingly clear that the Norges Bank is taking a firm stance against inflation, while the ECB is acting hesitantly, which is weighing on the euro.”
“The more active central bank is Norges Bank, and the market should reward that with NOK strength, notwithstanding possible phases of increased risk aversion.”
In the UK, the cost-of-living crisis and sluggish growth may impede the Bank of England’s ability to confront soaring inflation and satisfy market expectations for tighter policy. This will weigh on the pound broadly, in the view of economists at Scotiabank.
Negative outlook on surging inflation
“Sterling’s outlook is negative and sentiment and positioning remain appropriately bearish.”
“The BoE is likely to tighten policy again in September (50 bps) to curb surging inflation but weak growth prospects and the growing cost-of-living crisis as UK households face further, significant increases in energy costs in the coming months, suggest that there is only so much the economy can bear.”
“We expect cable to trade below 1.20 into year-end.”
USD/CNY has helped to reinforce the broader USD rally and has moved higher following weak Chinese data and a surprise People’s Bank of China (PBoC) cut, with the pair close to confirming a bullish continuation pattern, analysts at Credit Suisse report.
Break above the 6.8110 high to confirm a move to 6.8475
“USD/CNY has edged higher over the past few weeks and the market looks close to completing a bullish ‘triangle’ continuation pattern following the weak Chinese data and surprise PBoC cut.”
“Above the 6.8110 high should confirm a move to the 61.8% retracement of the 2020/21 decline at 6.8475. A sustained break above here would see resistance next at the 78.6% retracement at 6.9957.”
- GBP/JPY extends the previous day’s rebound from a fortnight low on upbeat UK inflation data.
- Convergence of 21-DMA, 100-DMA challenges buyers at the weekly top.
- Clear break of three-week-old resistance line, impending bull cross on MACD also suggests further upside.
GBP/JPY takes the bids to refresh the weekly top near 163.00 as bulls cheer strong UK inflation data during early Wednesday morning in Europe. In doing so, the cross-currency pair pokes the 21-DMA and 100-DMA confluence while extending the previous day’s upside break of the three-week-old resistance line, now support around 162.20.
UK Consumer Price Index (CPI) rose to 10.1% YoY versus 9.8% expected and 9.4% previous readings while the Core CPI, which excludes volatile food and energy items, rose to 6.2% versus 5.9% market consensus and 5.8% previous readouts.
It’s worth noting that the quote’s rebound from the 61.8% Fibonacci retracement of the May-June upside, as well as a looming bull cross of the MACD line, also signal the GBP/JPY pair’s further upside.
Hence, buyers are all set to cross the 163.10 hurdle, which in turn could propel the prices towards July’s peak of around 166.35. However, the 38.2% Fibonacci retracement level near 163.75 could act as an extra filter to the north.
Meanwhile, pullback remains elusive until the quote stays beyond the previous resistance line, now support near 162.20.
Even so, a daily closing beneath the 61.8% Fibonacci retracement level of 160.60 appears necessary for the GBP/JPY bears to keep reins.
GBP/JPY: Daily chart
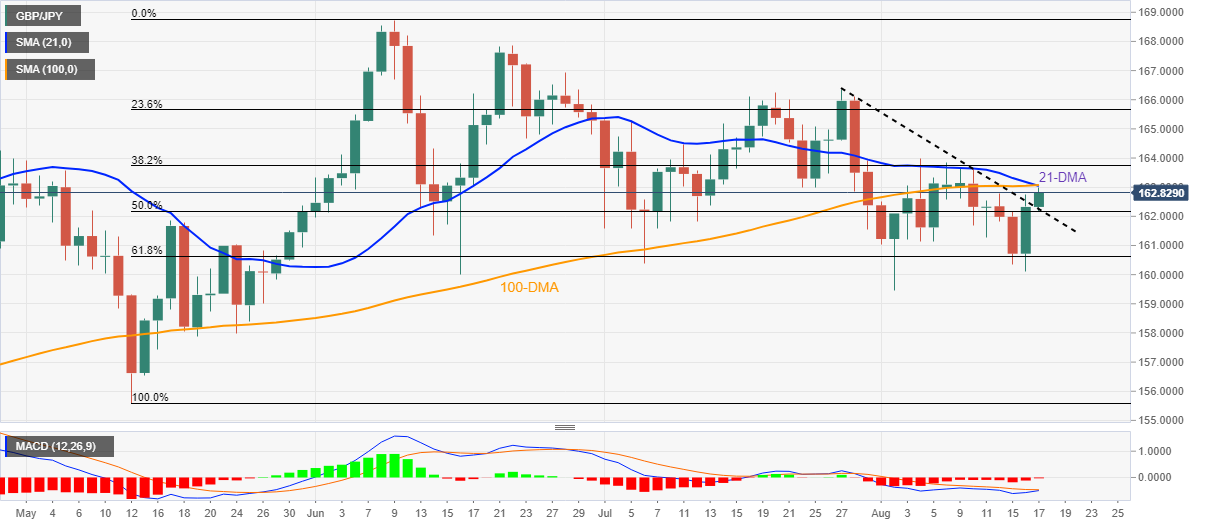
Trend: Further upside expected
EUR/USD is currently trading within a 1.00-1.04 range. If there is a trigger that catapults the pair out of the range, this breakout will most likely happen to the downside, in the view of economists at Commerzbank.
Few reasons why EUR/USD should break out of its current 1.00-1.04 range
“There are currently few reasons why EUR/USD should break out of its current 1.00-1.04 range, as there is no fundamentally new information at the moment that is likely to lead to a significant change in the Fed's or ECB's monetary policy course. At the same time, however, the risks for the euro are to the downside.”
“If the purchasing managers' indices show sharp declines in the next publications, which increases the probability of a recession in the eurozone, the market might quickly drop the euro like a hot potato and push EUR/USD below parity.”
FX option expiries for August 17 NY cut at 10:00 Eastern Time, via DTCC, can be found below.
- EUR/USD: EUR amounts
- 1.0075 297m
- 1.0100-10 1.13b
- 1.0115-20 336m
- 1.0150 394m
- 1.0175 367m
- 1.0190-00 727m
- 1.0270 254m
- GBP/USD: GBP amounts
- 1.2050 441m
- USD/JPY: USD amounts
- 133.00 228m
- 133.50 210m
- USD/CHF: USD amounts
- 0.9380 315m
- AUD/USD: AUD amounts
- 0.7025-30 556m
- 0.7040 280m
- 0.7065-70 284m
- 0.7165 254m
- USD/CAD: USD amounts
- 1.2595 330m
- 1.2855 515m
Despite the JPY’s rebound against the USD since mid-July, analysts at Scotiabank see little reason for optimism on the near-term outlook. They forecast the USD/JPY at 140 by the end of the year.
USD/JPY gains towards the 140 area in H2 may represent a high-water mark
“Wide US-Japan yield differentials will keep the JPY soft for the foreseeable future while high commodity prices represent another, negative impulse on the currency (via a negative terms of trade shock).”
“We expect USD/JPY to remain around the 140 level through year-end.”
As was universally expected, the Reserve Bank of New Zealand (RBNZ) increased the OCR by a further 50 basis points to 3%. Most of the uptick in NZD/USD eased quickly after the meeting. The tone of the Statement was hawkish while acknowledging both domestic and global downside risks to growth, economists at Danske Bank report.
Hiking cycle could be extended into 2023
“Despite the weakening global growth outlook and lower oil prices, RBNZ remains worried that the persistently tight labour market will continue to support the underlying inflation pressures.”
“The policy rate path was lifted from the May meeting, now signaling that the hiking cycle could be extended into 2023 and the policy rate is also seen remaining at the high terminal level well into 2024. Consequently, the GDP forecast was lowered and unemployment rate is seen rising higher than previously.”
“The overall tone of the decision was clearly hawkish, RBNZ remains committed to bringing inflation back to target even if it will weigh on local economic growth over the coming years.”
UK Finance Minister Nadhim Zahawi is offering his take on the country’s inflation, which surged to a new four-decade high of 10.1% in July.
Key quotes
“Getting inflation under control is my top priority.”
“We are taking action through strong, independent monetary policy, responsible tax and spending decisions, and reforms.”
Related reads
- GBP/USD renews daily top above 1.2100 on firmer UK Inflation, focus on Fed Minutes
- UK annualized inflation leaps to 10.1% in July vs. 9.8% expected
The euro failed to benefit from the European Central Bank’s (ECB) surprise 50 bps hike in July. Negative growth surprises or energy supply disruption would risk pushing the EUR/USD below parity, economists at Scotiabank believe.
Downside risks remain amid uncertainties
“Economic prospects remain questionable, given the risk of high energy prices disrupting discretionary spending or, worse, curtailed natural gas supplies from Russia.”
“In the event of severe energy supply disruption, EUR losses are likely to extend below parity.”
“About the only thing in the EUR’s favour is that markets are already aggressively short the currency.”
- GBP/USD spiked up to refresh daily top after upbeat UK inflation data for July.
- UK CPI rose past market expectations and prior to 10.1% for July.
- US dollar pullback, softer yields also underpin bullish bias ahead of US Retail Sales, FOMC Minutes.
GBP/USD picks up bids to refresh intraday high around 1.2145 after the UK released headline inflation numbers for July. In doing s, the Cable pair extends the previous day’s recovery from the weekly low.
UK Consumer Price Index (CPI) rose to 10.1% YoY versus 9.8% expected and 9.4% previous readings while the Core CPI, which excludes volatile food and energy items, rose to 6.2% versus 5.9% market consensus and 5.8% previous readouts.
Also read: Breaking: UK annualized inflation leaps to 10.1% in July vs. 9.8% expected
Not only CPI, but upbeat prints of the Retail Price Index, to 12.3% YoY compared to 12.0% expected and 11.8% prior, also favored the GBP/USD buyers as the Bank of England (BOE) has long been criticized for undertaking a softer attack on inflation mainly by the current UK PM front runner Liz Truss and her team.
In addition to the firmer UK inflation figures, the US dollar’s pullback ahead of the key Federal Open Market Committee (FOMC) meeting minutes also favors the GBP/USD bulls. That said, the US Dollar Index (DXY) refreshed its three-week high before reversing from 106.94, down 0.10% near the intraday low of 106.35 at the latest. The DXY losses could be linked to the market’s preparations for the key data/events amid increasing hawkish Fed bets.
“Investors now see a 41% chance of a third successive 75 bps rate hike at the Fed's next meeting in September, up from 39% the previous day. Minutes from the previous meeting will be released later today,” said Reuters.
Against this backdrop, US 10-year Treasury yields fade the previous day’s rebound while S&P 500 Futures seesaw near a four-month high.
Having witnessed the initial reaction to the UK inflation data, the US Retail Sales for July, expected 0.1% versus 1.0% prior, will precede the FOMC meeting minutes will be crucial for the GBP/USD pair traders amid recently increasing hawkish bets on the Fed.
Technical analysis
GBP/USD approaches a one-week-old resistance line while portraying the third bounce off the 50% Fibonacci retracement level of July-August advances.
In addition to the sustained rebound from the key Fibonacci support, steady RSI and a looming bull cross of the MACD also keep the GBP/USD buyers hopeful of overcoming the 1.2110 immediate hurdle.
Alternatively, pullback moves may initially test the 200-SMA, around 1.2045 at the latest, before revisiting the 50% Fibonacci retracement level of 1.2030.
CME Group’s flash data for natural gas futures markets showed open interest increased for the fourth consecutive session on Tuesday, this time by around 5.2K contracts. Volume followed suit and clinched the second build in a row, now by more than 89K contracts.
Natural Gas remains focused on $9.75
Tuesday’s strong advance in prices of natural gas past the $9.00 mark per MMBtu was accompanied by increasing open interest and volume, which remains supportive of further gains in the very near term. Against that, it only seems a matter of time before the commodity challenges the 2022 peak around $9.75 (July 26).
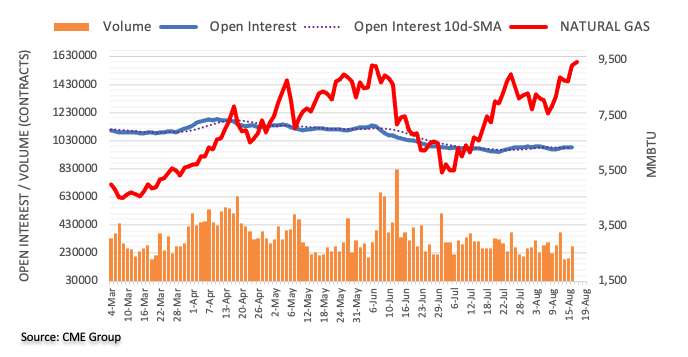
- UK CPI rises by 10.1% YoY in July vs. 9.8% expected.
- Monthly UK CPI arrives at 0.6% in July vs. 0.4% expected.
- GBP/USD jumps towards 1.2150 on hotter UK CPIs.
The UK Consumer Prices Index (CPI) 12-month rate came in at 10.1% in July when compared to 9.4% seen in June while beating estimates of a 9.8% score, the UK Office for National Statistics (ONS) reported on Wednesday. The index hit the highest level since 1982.
Meanwhile, the core inflation gauge (excluding volatile food and energy items) rose to 6.2% YoY last month versus 5.8% booked in May, outpacing the market consensus of 5.9%.
The monthly figures showed that the UK consumer prices climbed by 0.6% in July vs. 0.4% expectations and 0.8% previous.
The UK Retail Price Index for July arrived at 0.9% MoM and 12.3% YoY, beating estimates across the time horizon.
FX implications:
In an initial reaction to the UK CPI numbers, the GBP/USD pair jumped 20 pips to daily highs near 1.2145.
The pair was last seen trading at 1.2126, up 0.27% on the day. The US dollar retreats amid a better mood, underpinning the pair ahead of the Fed minutes.
Why UK inflation matters to traders?
The Bank of England (BOE) is tasked with keeping inflation, as measured by the headline Consumer Price Index (CPI) at around 2%, giving the monthly release its importance. An increase in inflation implies a quicker and sooner increase of interest rates or the reduction of bond-buying by the BOE, which means squeezing the supply of pounds. Conversely, a drop in the pace of price rises indicates looser monetary policy. A higher-than-expected result tends to be GBP bullish.
The Australian dollar (AUD) has given back around half of the rebound made in the wake of the March 2020 pandemic low. Analysts at Scotiabank expect the AUD/USD to tumble towards 0.65 in the fourth quarter.
RBA key rate to reach 2.50% by year-end
“We see the Reserve Bank of Australia (RBA) key rate reaching 2.50% by year-end (from 1.85% currently) whereas swaps are pricing in the policy rate near 3.25%.”
“We see some downside risk in the AUD outlook over the balance of the year and forecast 0.65 for Q4.”
- EUR/USD grinds higher around daily top, keeps Tuesday’s bounce off three-week low.
- Softer yields, hopes of firmer EU data favor corrective pullback.
- 21-DMA guards immediate upside amid impending bear cross on MACD.
- Fed Minutes need to confirm 0.75% rate hike for September and do more to keep bears hopeful.
EUR/USD remains mildly bid around the intraday high, keeping the previous day’s corrective pullback from a three-week low, as bulls and bears jostle ahead of the key data from Eurozone and the US. That said, the major currency pair seesaws around 1.080 heading into Wednesday’s European session.
The major currency pair’s latest strength could be linked to the US dollar’s weakness, as well as cautious optimism in the market. That said, the US Dollar Index (DXY) refreshed its three-week high before reversing from 106.94, down 0.10% near the intraday low of 106.35 at the latest. The DXY losses could be linked to the market’s preparations for today’s US Retail Sales for July, expected 0.1% versus 1.0% prior, as well as the Fed minutes.
“Investors now see a 41% chance of a third successive 75 bps rate hike at the Fed's next meeting in September, up from 39% the previous day. Minutes from the previous meeting will be released later today,” said Reuters ahead of the Fed Minutes.
Elsewhere, Europe’s signals to renew the nuclear deal with Iran, as well as pushing back plans for the closure of Germany’s last three nuclear power plants, also appeared to have favored the EUR/USD bulls of late. It’s worth noting that downbeat US housing numbers and mixed German ZEW figures seemed to have failed in directing short-term pair moves.
Amid these plays, US 10-year Treasury yields fade the previous day’s rebound while S&P 500 Futures seesaw near a four-month high.
Moving on, EUR/USD traders should pay close attention to the second readings of the Eurozone Gross Domestic Product (GDP), expected to confirm the 0.7% QoQ forecasts, ahead of preliminary readings of Eurozone Employment Change for the second quarter (Q2), expected 2.5% versus 2.9% prior. Also crucial will be the US Retail Sales for July, expected 0.1% versus 1.0% prior. Above all, the Federal Open Market Committee (FOMC) meeting minutes will be crucial as markets renew hawkish bets on the Fed.
Also read: FOMC July Minutes Preview: Can it influence September Fed rate hike expectations?
Technical analysis
With the retreat of the MACD line, the impending bear cross of the EUR/USD pair teases the sellers even if the quote approaches the 21-DMA hurdle surrounding 1.0210. Also acting as an upside filter is the previous support line from mid-July, close to 1.0245.
Alternatively, the 1.0120 and 1.0100 mark could try to defend buyers before the EUR/USD bears aim for the fresh yearly low, currently around 0.9950.
Considering advanced prints from CME Group for crude oil futures markets, traders trimmed their open interest positions by around 6.7K contracts on Tuesday, adding to the previous pullback. Volume, instead, rose for the second straight session, this time by around 183.3K contracts.
WTI stays capped by the 200-day SMA
Prices of the barrel of WTI dropped to new multi-month lows near the $85.00 mark on Tuesday. The continuation of the leg lower was in tandem with shrinking open interest, which could be indicative of a near-term pause in the downside. Against that, the 200-day SMA above the $95.00 mark per barrel continues to limit any occasional bullish attempts in prices.
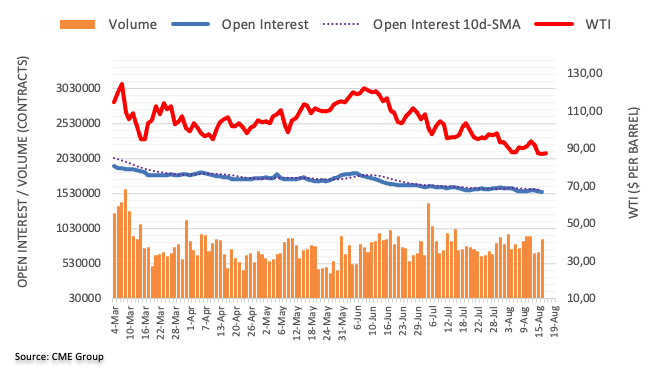
Gold price is advancing for the first time so far this week. However, it remains to be seen whether the renewed upside in XAU/USD price will sustain, as all eyes turn toward the FOMC July meeting minutes, FXStreet’s Dhwani Mehta reports.
XAU/USD’s battle with 50 DMA extends ahead of Fed minutes
“The minutes will likely confirm the Fed remains on track on its aggressive tightening path to tame inflation, although hints on the size of the future rate increases will hold the key for the continuation of the recent uptrend in the US dollar, which will potentially have a significant impact on the bright metal.”
“Gold price is looking to recover ground once again above the bearish 50-Daily Moving Average (DMA), now at $1,779. A sustained break above the latter is needed to revive a recovery towards the $1,800 threshold. The monthly high of $1,808 will then appear on buyers’ radars.”
“Failure to find acceptance above the 50 DMA barrier will kickstart a fresh downtrend towards the upward-pointing 21 DMA at $1,762. Ahead of that sellers will challenge the $1,770 round figure once again. Should the selling pressure accelerate, a test of the August 3 low of $1,754 will be on the table.”
India’s inflation appears to have peaked. Therefore, the Indian rupee could be ready to race higher, according to economists at Scotiabank.
Relief from falling commodity prices
“We believe falling commodity prices could improve the nation’s external balance while bringing the nation’s inflation under control.”
“The INR will rally in a sustainable way when foreign investors shift their focus to India’s growth prospect from the nation’s inflation outlook.”
“USD/INR will likely trade between 79 and 80 with downside risks.”
The US Census Bureau will release the July Retail Sales report on Wednesday, August 17 at 12:30 GMT and as we get closer to the release time, here are the forecasts of economists and researchers of six major banks regarding the upcoming data.
Retail Sales are forecast to decline to 0.1% in June with the ex-autos to -0.1% and control to 0.6%.
Commerzbank
“We expect only a small increase in retail sales of 0.2% due to falling gasoline prices. Such a figure would prove that the US economy has not yet slipped into a real recession, even though it contracted in the first half of the year.”
TDS
“We look for retail sales to lose speed in July (0.1%), following a notable 1% MoM jump in June. Spending was likely dented by a sharp drop in gasoline station sales, which should have been offset by a strong showing in control group sales (0.8%) – supported by Amazon's Prime Day. Sales ex-auto & gas should have also advanced by a solid 0.6% m/m. We also look for a new gain in the eating/drinking segment as consumers continue to transition away from goods.”
ING
“Retail sales at the headline level will be modestly depressed (0.3%) due to falling gasoline prices weighing on gas station sales as it is a nominal dollar figure. However, this frees up cash to spend on other goods and services so the ‘core’ rate of retail sales growth should rebound and help to translate into rising real consumer spending.”
NBF
“Car dealers likely contributed positively to the headline number, as auto sales increased during the month. Gasoline station receipts, for their part, may have decreased judging from a drop in pump prices. All told, headline sales could have advanced 0.7% MoM. Spending on items other than vehicles may have been a tad weaker, rising 0.5%.”
CIBC
“Total retail sales growth appears to have weakened in July as prices at the pump eased, while building material sales likely fell further along with the cooling in housing market activity. With some offset from higher unit vehicle sales and restaurant receipts, total retail sales likely eked out a 0.2% advance. The 0.5% growth expected in the control group (ex. gasoline, building materials, autos, and restaurants) will largely reflect higher prices, with sales volumes limited by consumer resistance to higher prices and the erosion in real incomes, consistent with reports from some major retailers lately.”
Citibank
“US July Retail Sales – Citi: 0.0%, prior: 1.1%, Retail Sales ex Auto – Citi: -0.3%, prior: 1.0%, Retail Sales ex Auto, Gas – Citi: 0.3%, prior: 0.7%, Retail Sales Control Group – Citi: 0.3%, prior: 0.8%. We expect control group retail sales to increase by 0.3% MoM due to modest increases in most categories. That said, goods demand is expected to continue waning, which is likely to be reflected in weaker retail prints in real terms in the coming months.”
FX Strategist at UOB Group’s Global Economics & Markets Research Quek Ser Leang comments on the prospects for USD/CNH.
Key Quotes
“About two months ago on 17 Jun 2022, when USD/CNH was trading at 6.7100, we noted in our Global Quarterly Outlook that ‘daily MACD is not strong’. We highlighted that ‘the overall price actions appear to be part of a consolidation phase’ and we expected USD/CNH to ‘trade sideways between 6.5930 and 6.8400 in 3Q22’.”
“USD/CNH subsequently traded sideways, albeit within a narrower range than expected. Yesterday (15 Aug 2022), USD/CNH jumped to 6.8200 before closing higher by a whopping 1.16% (NY close of 6.8135), its largest 1-day gain since Mar 2020. Despite the large rise, daily MACD is only beginning to turn positive. In order to maintain the build-up in momentum, USD/CNH has to break and maintain a foothold above the year-to-date high near 6.8400 before a sustained advance is likely. To look at it another way, only a clear break of 6.8400 would indicate that the consolidation phase has come to an end.”
“The chance for USD/CNH to break clearly above 6.8390 would remain intact as long as it does not move below the top of the daily Ichimoku cloud, currently near 6.7330. The top of the cloud support is close to another key support, the 55-day exponential moving average. Looking ahead, if USD/CNH can break and maintain a foothold above 6.8390, it could possibly trigger a move to 6.9000.”
Open interest in gold futures markets dropped for the second session in a row on Tuesday, this time by around 1.6K contracts according to preliminary readings from CME Group. In the same line, volume resumed the downtrend and shrank by around 46.4K contracts.
Gold shifts the attention to $1,800
Gold prices extended the negative start of the week on Tuesday amidst diminishing open interest and volume, thus leaving the door open for a potential rebound in the very near term. That said, further recovery in the precious metals continues to target the key $1,800 mark per ounce troy.
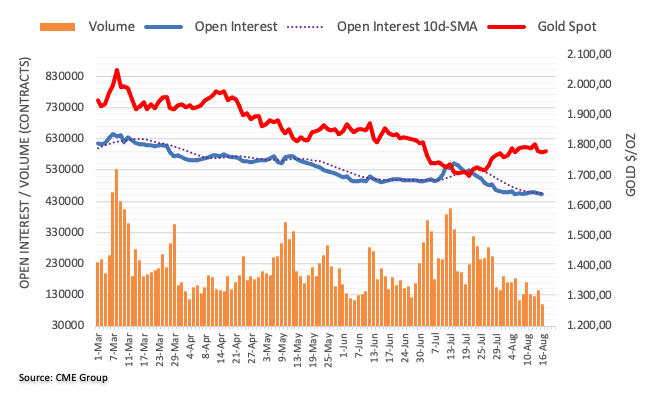
- Gold price remains firmer after confirming a bullish chart pattern.
- Softer US dollar, yields also underpin XAU/USD rebound from a one-week low.
- US Retail Sales, headlines concerning China will also be important for fresh impulse.
Gold price consolidates weekly losses around $1,778 amid broad US dollar weakness heading into Wednesday’s European session. In doing so, the XAU/USD traders also portray the cautious mood of the Federal Open Market Committee (FOMC) meeting minutes.
That said, the US Dollar Index (DXY) refreshed its three-week high before reversing from 106.94, down 0.10% near the intraday low of 106.35 at the latest. The DXY losses could be linked to the market’s preparations for today’s US Retail Sales for July, expected 0.1% versus 1.0% prior, as well as the Fed minutes. It’s worth noting that the recent weakness in the US data challenges the hawkish hopes from the Fed, which in turn exert downside pressure on the US dollar and favor gold buyers.
Elsewhere, China’s Premier Li Keqiang recently crossed wires, via the Communist Party’s flagship newspaper People’s Daily, while urging local officials from six key provinces that account for about 40% of the country’s economy to bolster pro-growth measures. On Wednesday, President Xi Jinping and state planner National Development and Reform Commission (NDRC) showed readiness for more measures to combat the recession fears.
Given the dragon nation’s status of being the world’s biggest commodity user, any negatives for Beijing weigh on the gold prices. However, the latest rebound in XAU/USD could well be linked to the thinking that the hopes of more stimulus could push for more metal demand from China.
While portraying the sentiment, US 10-year Treasury yields fade the previous day’s rebound while S&P 500 Futures retreat from a four-month high.
Looking forward, US data and Fed Minutes could direct XAU/USD moves while the headlines concerning China and the recession will also be important for clear directions.
Technical analysis
A clear upside break of the weekly resistance line confirms the short-term falling wedge bullish chart pattern, which in turn directs gold price towards Friday’s peak of $1,805.
However, the 200-HMA hurdle near $1,787 could challenge the XAU/USD bulls. Also acting as an upward resistance is the monthly peak surrounding $1,808.
Alternatively, the resistance-turned-support near $1,777 precedes the stated wedge’s support, close to $1,770 by the press time, to restrict the short-term XAU/USD downside.
Following that, the $1,765 and the monthly low of $1,754 will gain the gold sellers’ attention.
Gold: Hourly chart
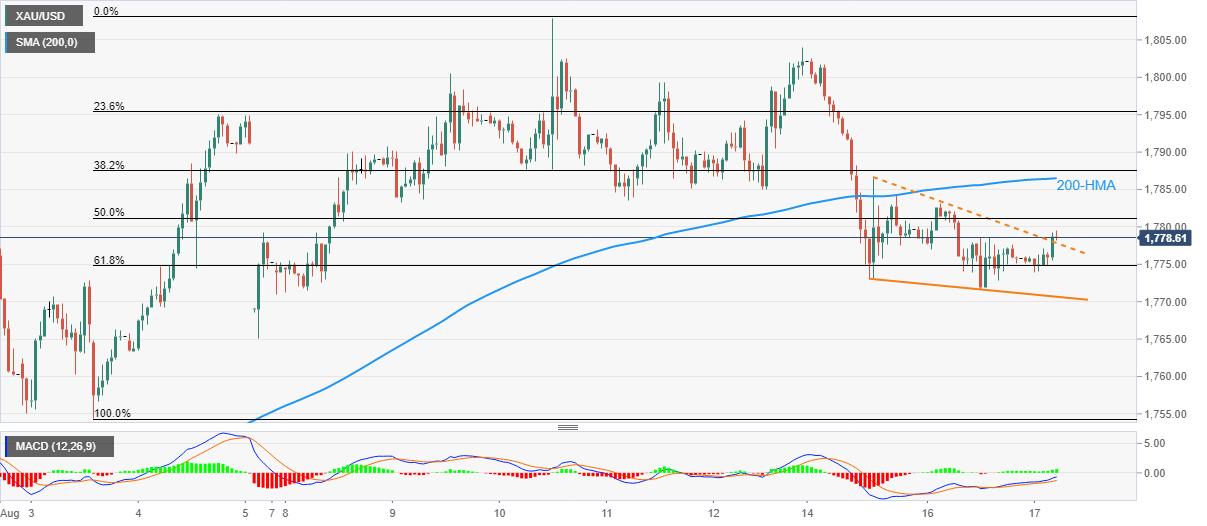
Trend: Further upside expected
The UK CPIs Overview
The cost of living in the UK as represented by the Consumer Price Index (CPI) for July month is due early on Wednesday at 06:00 GMT.
Given the recently released unimpressive employment data, coupled with the allegations of the Bank of England’s (BOE) inaction, today’s data will be watched closely by the GBP/USD traders.
The headline CPI inflation is expected to refresh a 30-year high with a 9.8% YoY figure versus 9.4% prior while the Core CPI, which excludes volatile food and energy items, is likely to rise to 5.9% YoY during the stated month, from 5.8% previous readouts. Talking about the monthly figures, the CPI could ease to 0.4% versus 0.8% prior.
It’s worth noting that the recent pressure on wage prices and upbeat jobs report also highlight the Producer Price Index (PPI) as an important catalyst for the immediate GBP/USD direction.
That being said, the PPI Core Output YoY may rise from 15.2% to 15.9% on a non-seasonally adjusted basis whereas the monthly prints may ease to 0.0% versus 0.8% prior. Furthermore, the Retail Price Index (RPI) is also on the table for release, expected to rise to 12.0% YoY from 11.8% prior while the MoM prints could ease to 0.6% from 0.9% in previous readings.
In this regard, Westpac said,
Annual inflation in the UK is expected to rise again in July as energy inflation pressures remain. Consensus is 0.4%mth; 9.8%yr, with core inflation ticking up to 5.9%yr. With another wave of retail energy prices looming in Q4, the Bank of England forecasts headline CPI to reach a staggering 13%yr before year-end.
Deviation impact on GBP/USD
Readers can find FXStreet's proprietary deviation impact map of the event below. As observed the reaction is likely to remain confined around 20-pips in deviations up to + or -2, although in some cases, if notable enough, a deviation can fuel movements over 30-40 pips.
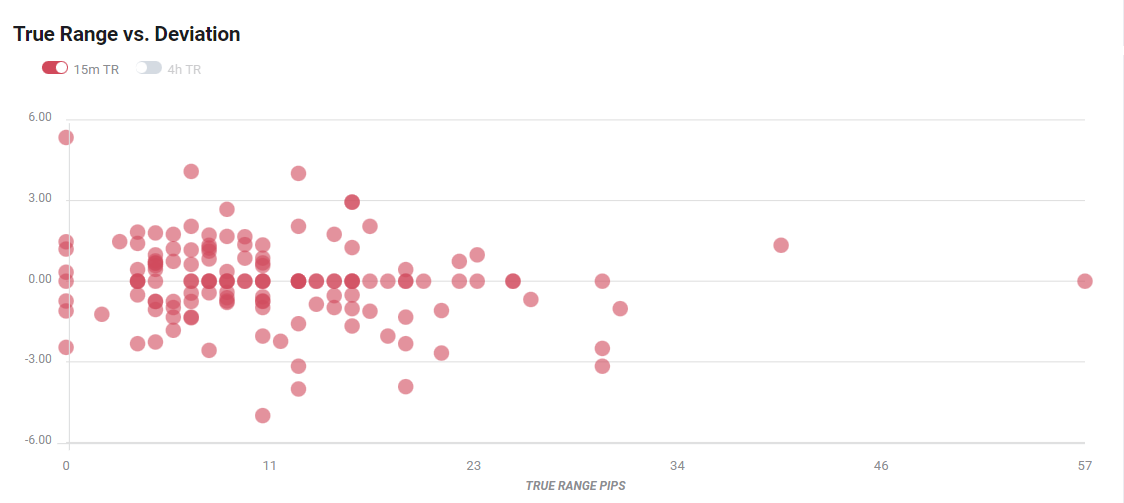
How could it affect GBP/USD?
GBP/USD cheers the broad US dollar weakness while picking up bids to refresh the intraday high around 1.2115 ahead of the UK inflation releases.
The BOE has long been criticized for undertaking a softer attack on inflation mainly by the current UK PM front runner Liz Truss and her team. While identifying the same, BOE Governor Andrew Bailey mentioned that he is “open for review”, which in turn highlights today’s CPI data for the GBP/USD traders.
Should the inflation numbers manage to stay firmer on the MoM, in addition to posting the multi-year high YoY numbers, GBP/USD is likely to extend the latest recovery. Alternatively, pullback moves may have another chance of reversing as the Federal Open Market Committee (FOMC) meeting minutes loom.
Technically, the 20-DMA level, near 1.2500, tests the short-term GBP/USD upside. However, the cable pair’s ability to cross the one-month-old descending trend line, around 1.2250 at the latest, joins the firmer RSI line to underpin bullish bias.
Key notes
GBP/USD Price Analysis: Pokes weekly resistance line around 1.2100
Technical view ahead of UK inflation data
About the UK CPIs
The Consumer Price Index released by the Office for National Statistics is a measure of price movements by the comparison between the retail prices of a representative shopping basket of goods and services. The purchasing power of GBP is dragged down by inflation. The CPI is a key indicator to measure inflation and changes in purchasing trends. Generally, a high reading is seen as positive (or bullish) for the GBP, while a low reading is seen as negative (or Bearish).
- USD/CAD picks up bids to consolidate Tuesday’s losses amid sluggish session.
- Impending bear cross on MACD keeps sellers hopeful.
- Four-day-old support line adds to the downside filter.
USD/CAD struggles to defend the corrective pullback from the key moving averages as the quote retreats to 1.2850 during early Wednesday morning in Europe.
In doing so, the Loonie pair drops back to the upward sloping support line from August 12 as the MACD teases sellers.
Considering the quote’s failure to keep the bounce off the 100-SMA and 50-SMA, as well as the bearish MACD signals, the USD/CAD prices are likely to remain soft.
However, a clear downside break of the stated support line and the SMA confluence, around 1.2845-40, becomes necessary for the pair bears to retake control.
Following that, a slump towards the 23.6% Fibonacci retracement level of August 05-11, near 1.2790, can’t be ruled out.
Meanwhile, recovery moves need to cross the 61.8% Fibonacci retracement level of 1.2890 to convince buyers.
Even so, a downward sloping resistance line from August 05, close to 1.2920, could act as the last defense of the USD/CAD bears.
Overall, USD/CAD is likely to remain sidelined, weak for the short-term, as traders await the key Fed Minutes.
USD/CAD: Four-hour chart
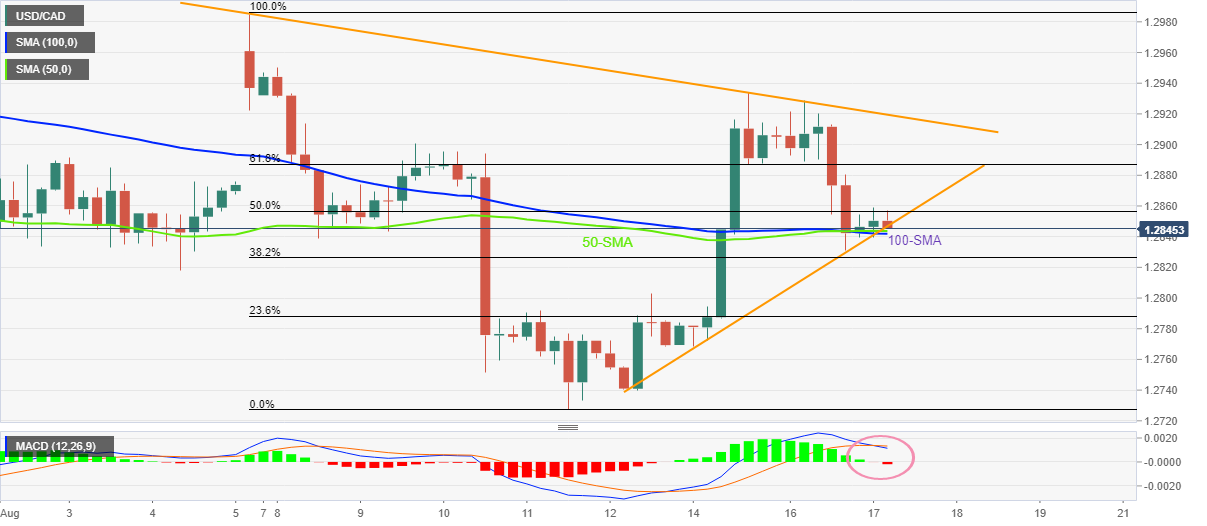
Trend: Further weakness expected
- AUD/USD off lows but struggles around 0.7000 amid dismal Aussie wage data.
- US dollar remains in a consolidative mode ahead of the Fed minutes.
- Bears test bulls’ commitments at critical 21 DMA, with Australian jobs next of note.
AUD/USD is resuming the downtrend seen so far this week, following Tuesday’s brief reprieve, as bears cheer the downbeat Australian Wage Price Index.
The miss on the Australian wage data suggests that the RBA could slow down its tightening path amid the first signs of inflation cooling off. Thursday’s employment data will, therefore, hold the key for the RBA’s future policy guidance.
Although the downside in the spot remains limited, courtesy of the hawkish rate hike by the RBNZ and a broad US dollar consolidation, as attention shifts towards the Fed July meeting minutes. The US dollar index is trading at 106.42, down 0.07% on the day.
From a short-term technical perspective, the pair is drawing temporary support from the upward-pointing 21-Daily Moving Average (DMA) at 0.6981.
A breach of the latter will bring the horizontal 100 DMA at 0.6966 in play. A sharp drop towards the mildly bullish 50 DMA at 0.6896 could be in the offing if bears take out the 100 DMA.
Therefore, it could be safe to say that the sell-off triggered following a rejection at a critical horizontal 200-Daily Moving Average (DMA) at 0.7120 may be facing exhaustion.
Buyers need to crack the daily high of 0.7070, above which is the 0.7100 round figure.
On the flip side, the immediate downside cap aligns at 0.7000, below which sellers will look to challenge the 0.6970 demand area, where the 21 and 100 DMAs hang around.
AUD/USD: Daily chart
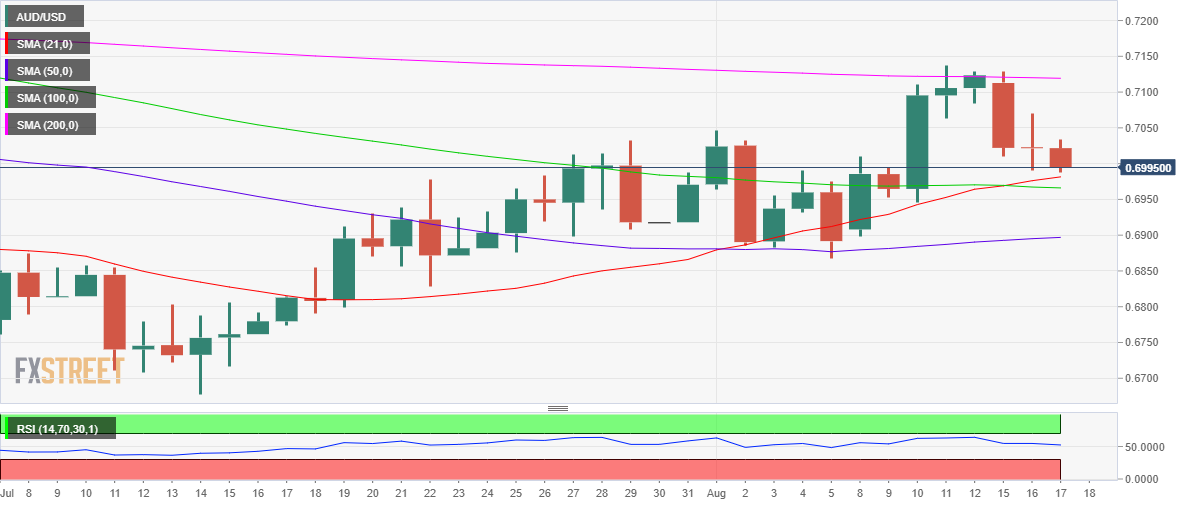
However, with the 14-day Relative Strength Index (RSI) still holding above the midline, the ‘buy the dips’ trade could be seen in the aussie.
Bulls need to crack the daily highs of 0.7033 in order to test the 0.7050 psychological level.
The 21 and 100 DMA bullish crossover continues to keep the 200 DMA at 0.7120 on buyers’ radars.
AUD/USD: Additional levels to consider
- USD/INR bounces off weekly low but stays below support-turned-resistance.
- Softer oil prices, hopes of easing inflation in India favor pair sellers.
- Recession concerns, anxiety ahead of the FOMC Minutes add strength to the bullish bias.
USD/INR bounces off the weekly low to approach the previous support during early Wednesday, at 79.30 by the press time. In doing so, the Indian rupee (INR) pair consolidates the recent losses as the US dollar regains acceptance ahead of the Federal Open Market Committee (FOMC) meeting minutes.
In addition to the US dollar’s corrective pullback and the pre-event anxiety, risk-negative headlines surrounding China and the recent improvement in oil prices also seems to have triggered the USD/INR rebound.
WTI crude oil licks its wounds around the lowest levels since late January as it picks up bids to $86.70 by the press time. India’s reliance on energy imports and a record high trade deficit keeps the INR vulnerable to oil price moves.
China’s Premier Li Keqiang recently crossed wires, via the Communist Party’s flagship newspaper People’s Daily, while urging local officials from six key provinces that account for about 40% of the country’s economy to bolster pro-growth measures. On Wednesday, President Xi Jinping and state planner National Development and Reform Commission (NDRC) showed readiness for more measures to combat the recession fears.
It’s worth noting that the recently easing inflation numbers from India and the WTI crude oil’s three-day downtrend to refresh the multi-month low seemed to have favored the USD/INR bears earlier.
That said, US 10-year Treasury yields fade the previous day’s rebound while S&P 500 Futures retreat from a four-month high.
Looking forward, the US Retail Sales for July, expected 0.1% versus 1.0% prior, as well as the FOMC meeting minutes, for clear directions. Also important will be the headlines concerning China and the recession.
Technical analysis
A convergence of the 21-DMA and a two-week-old ascending trend line, around 79.45, appears strong intraday hurdle for the USD/INR buyers to cross to retake control.
On the contrary, a horizontal area comprising multiple levels marked since late June, around 79.10, restricts the pair’s immediate downside ahead of directing the bears towards the monthly low near 78.40.
USD/INR: Daily chart
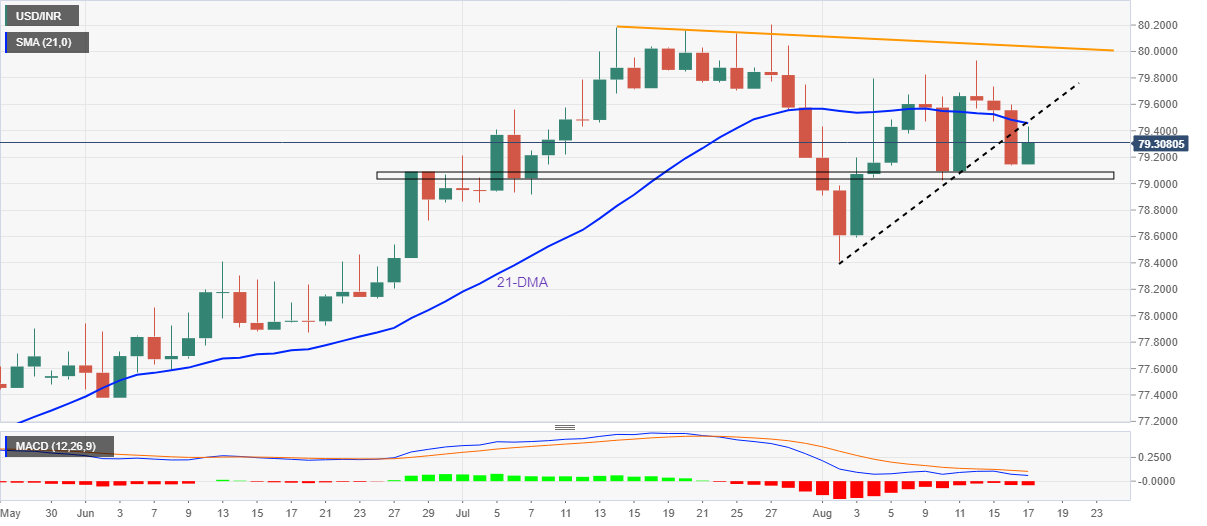
Trend: Pulback expected
- NZD/USD reverses post-RBNZ gains as RBNZ Governor Orr hints at sub-par growth, rules out 0.75% rate hike.
- Convergence of 100-SMA, 38.2% Fibonacci retracement restricts short-term downside.
- One-week-old horizontal resistance adds to the upside filters.
NZD/USD takes offers to reverse the latest gains inspired by the Reserve Bank of New Zealand’s (RBNZ) rate hike as Governor Adrian Orr seems cautiously optimistic during the press conference after the interest rate announcement on Wednesday. That said, the Kiwi pair drops to 0.6340, extending the pullback from 0.6383, by the press time.
Also read: RBNZ’s Orr: Not forecasting recession but do see sub-par growth
In addition to RBNZ’s Orr, the quote’s failure to defend the early day’s upside break of the 50-SMA, as well as the cross the one-week-old horizontal resistance, also lured the NZD/USD bears of late.
It’s worth noting that the RSI (14) holds lower ground, suggesting a lack of momentum support.
With this, the Kiwi pair remains vulnerable to testing the 0.6315-10 support confluence including the 100-SMA and 38.2% Fibonacci retracement level of the July-August upside.
However, the NZD/USD weakness past 0.6310 will be questioned by the 0.6300 and an upward sloping support line from mid-July, at 0.6281 by the press time.
Meanwhile, the 50-SMA and the aforementioned horizontal hurdle, respectively around 0.6350 and 0.6385, guard the quote’s recovery moves.
Following that, multiple levels around 0.6420 could test the NZD/USD bulls ahead of directing them to the monthly peak of 0.6468.
NZD/USD: Four-hour chart
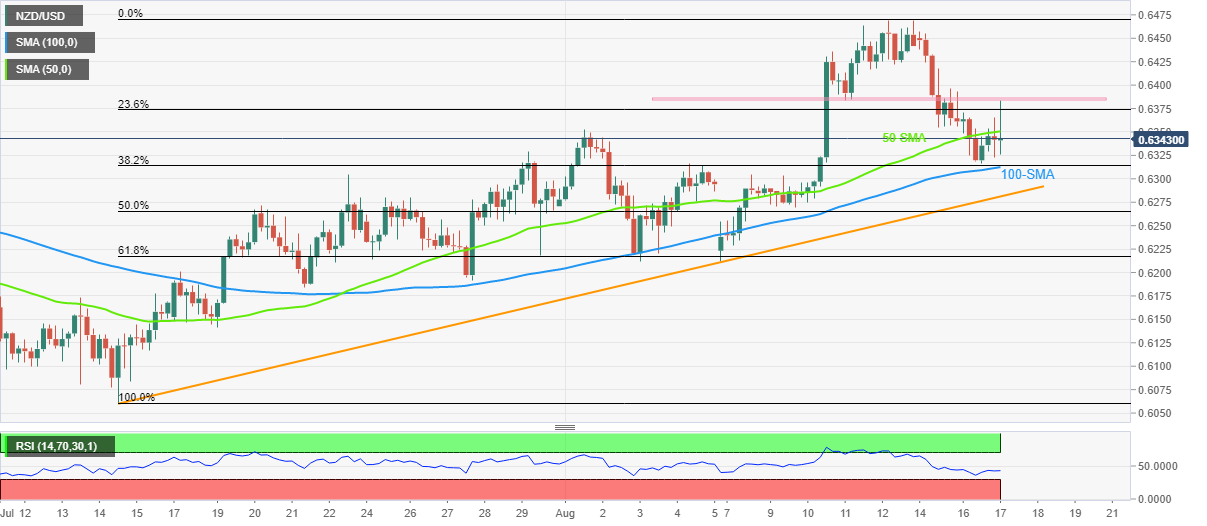
Trend: Further weakness expected
- EUR/USD consolidates the previous rebound amid a cautiously optimistic mood.
- US dollar takes a breather ahead of Fed minutes, the euro awaits Eurozone GDP.
- The shared currency remains weighed down by recession fears and gas crises.
EUR/USD is trading modestly flat above 1.0150, as the US dollar bulls take a breather following a sharp pullback from three-week highs.
Investors turn cautious and refrain from placing any big bets on the main currency pair ahead of the preliminary Eurozone Q2 GDP and the Fed July meeting minutes.
The Eurozone Q2 GDP may revive stagflation concerns amidst record-high inflation rate and the deepening energy crisis in the old continent. Meanwhile, the Fed minutes could offer insights on the size of the rate hike in the upcoming meetings. For September, markets are pricing roughly a 58% chance of a half percentage point Fed rate hike.
Looking at EUR/USD’s daily chart, sellers remain hopeful so long as the price holds below the horizontal 21-Daily Moving Average (DMA) at 1.0208.
Therefore, the 1.0100 support level remains in sight, despite Tuesday’s rebound from almost three-week lows of 1.0122.
The 14-day Relative Strength Index (RSI) has turned flattish but stays beneath the midline, suggesting that any uptick is likely to be sold into.
A sustained move above the 21 DMA will negate the near-term bearish momentum, opening doors for a fresh advance towards the bearish 50 DMA at 1.0295.
On a breach of 1.0100, selling pressure will intensify, as a retest of the parity will be inevitable. Although the 1.0050 psychological level could come to the rescue of EUR bulls.
EUR/USD: Daily chart
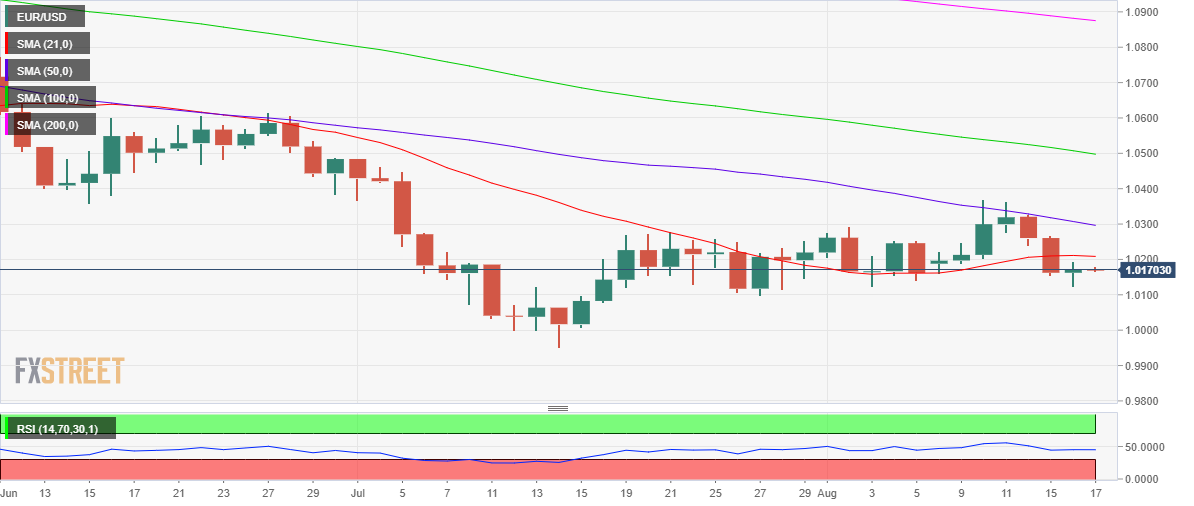
EUR/USD: Additional levels to consider
Reserve Bank of New Zealand (RBNZ) Governor Adrian Orr is speaking at the August post-monetary policy meeting press conference on Wednesday, affirming the central bank’s hawkish policy tightening stance.
Key quotes
Not forecasting recession but do see sub-par growth.
New Zealand spending is underpinned by employment.
In a very strong position to get on top of inflation.
Household balance sheets still in good shape.
The neutral rate is a great unknown.
Did not consider 75 bps rate hike today.
50 bps moves have been orderly and sufficient.
House prices are now far closer to levels that would be sustainable.
Getting rates to 4% would buy comfort for policy committee.
Market reaction
NZD/USD is keeping its range above 0.6350 on these above comments, adding 0.27% on the day.
- Gold is under pressure on the daily chart, flat in Asia ahead of the FOMC minutes.
- The price would be expected to move below daily support so long as the resistance holds near the 50% mean reversion around $1,785.
Gold is flat on the day trading at around $1,776.50 and sticking to a tight range of between $1,773.91 to a high of $1,776.85. The yellow metal fell due to rising Treasury yields weighed on investor appetite. A slightly stronger US dollar was also a headwind for investor demand. The greenback is currently steady as investors await the release of the minutes of the Federal Open Market Committee issues minutes from its meeting of July 26-27.
The US central bank raised its benchmark overnight interest rate by 225 basis points to tame high inflation. The minutes could offer clues on further interest rate hikes. The Fed is expected to raise its policy rate by another 50 or 75 basis points at its next meeting on Sept. 20-21. US Treasury yields have been firm as a consequence and also due to the recession worries and despite nascent signs of a slowdown in inflation.
Several Fed policymakers have spoken of the need for continued rate hikes despite the lower-than-expected outcome of last week's Consumer Price Index. "Fed officials have no choice but to sound tough in the face of a very, very tight labour market and far too high inflation," Kit Juckes, the head of FX strategy at Societe Generale argued. "It's hard to build a compelling case to sell the dollar in that world."
Meanwhile, ''odds of a short squeeze in gold are notably declining,'' the analysts at TD Securities argued. ''However, our CTA positioning estimates suggest that a trend followers buying program contributed to lower rates over the past month, as algos were forced to cover shorts. While this supported higher prices in gold, the bar is razor thin for algorithmic trend followers to add to selling pressures in US10y Treasuries once more,'' the analysts said.
''This should further sap appetite to buy the yellow metal, while the bar for additional short covering rises further. Meanwhile, Shanghai traders are also likely to appear on the offer, particularly amid a weakening CNY. Gold prices are vulnerable, considering we see signs that gold sellers are lurking. Ultimately, prop traders are still holding a massive amount of complacent length, suggesting we have yet to see capitulation in gold, which argues that the pain trade remains to the downside.''
Gold technical analysis
Gold is carving out a bearish case below the counter trendline on the daily chart as follows:
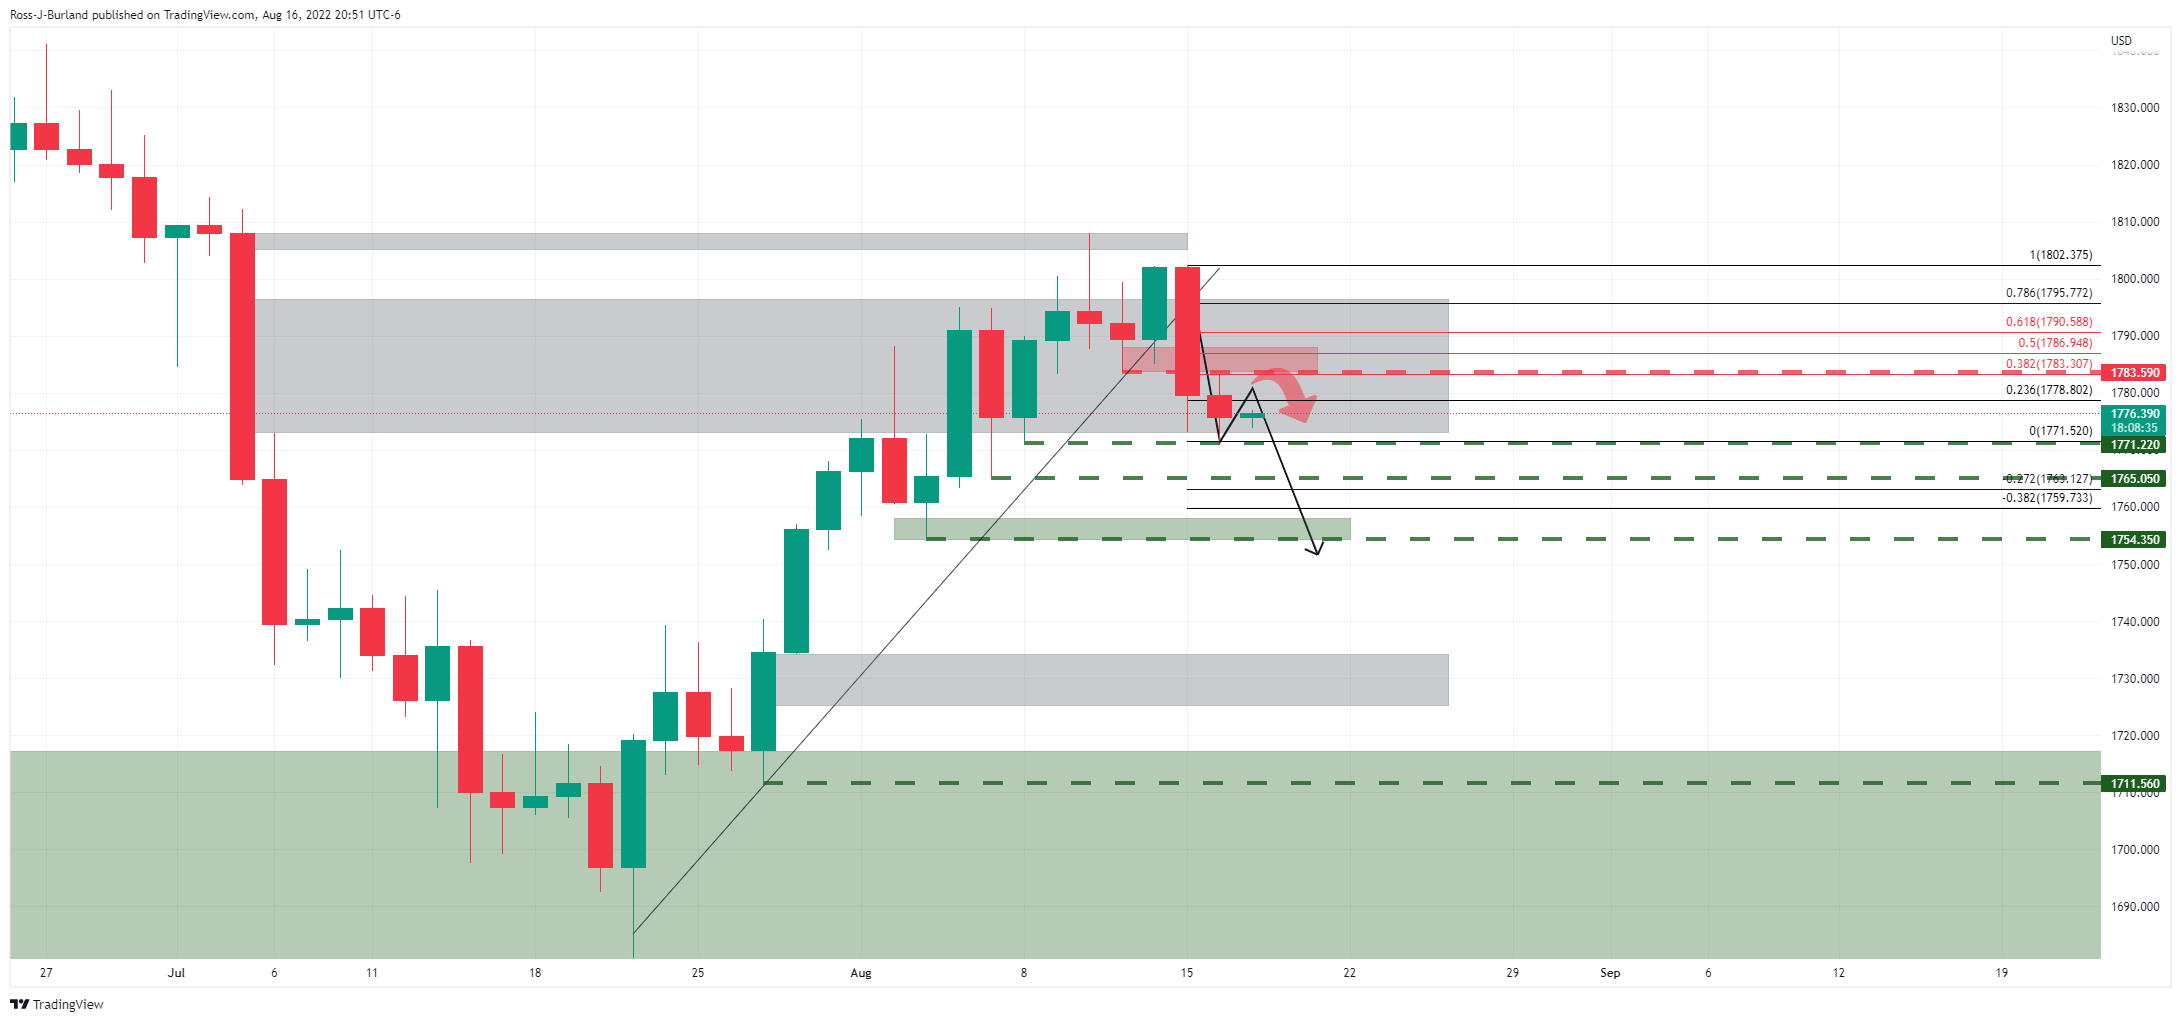
The price has stalled at a prior support level but would be expected to move below it so long as the resistance holds near the 50% mean reversion around $1,785.
| Raw materials | Closed | Change, % |
|---|---|---|
| Silver | 20.139 | -0.77 |
| Gold | 1775.81 | -0.2 |
| Palladium | 2155.32 | 0.58 |
- AUD/NZD takes offers to refresh monthly low after RBNZ’s 50 bps rate lift.
- Clear break of 100-DMA, ascending trend line from late May favor sellers.
- Bulls need validation from a fortnight-long resistance line to retake control.
AUD/NZD stands on slippery ground after the Reserve Bank of New Zealand (RBNZ) announced 50 basis points (bps) rate hike during Wednesday’s Asian session. That said, the cross-currency pair takes offers to refresh the monthly low near 1.09888 by the press time.
The RBNZ matched expectations of a 50 bps rate hike, to 3.0%, but optimism from the quarterly Monetary Policy Statement seemed to have favored the AUD/NZD bears afterward.
Also read:
In addition to the RBNZ-led moves, the quote’s latest weakness could also be linked to the clear downside break of 1.1000 support confluence, now resistance, which comprises the 100-DMA and an upward sloping trend line from late May.
With this, the AUD/NZD price becomes vulnerable to testing May’s low around 1.0920. However, 38.2% Fibonacci retracement of March-August upside, near 1.0965, could offer immediate direction to the quote.
Meanwhile, recovery remains elusive until successfully trading beyond the 1.1000 mark. Even so, the downward sloping resistance line from late July, at 1.1080 by the press time, could challenge the AUD/NZD bulls.
In a case where the pair prices remain firmer past 1.1080, the odds of witnessing a run-up towards the monthly high surrounding 1.1180 can’t be ruled out.
AUD/NZD: Daily chart
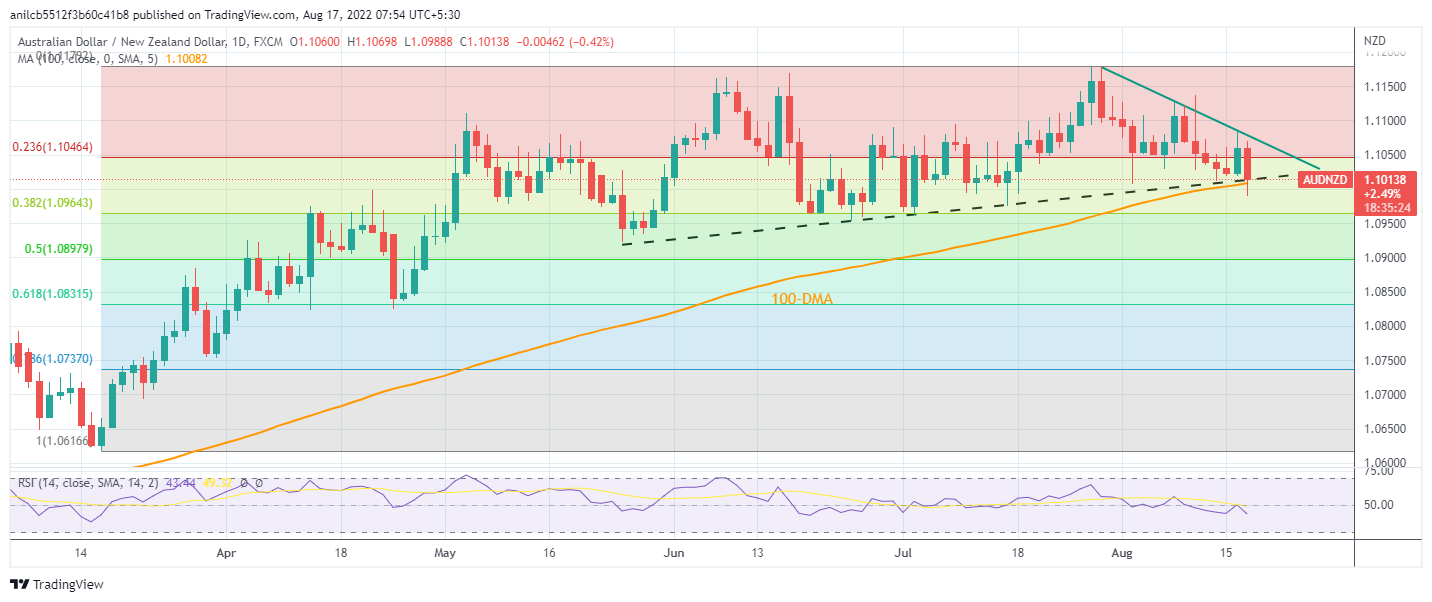
Trend: Further weakness expected
- NZD/USD spikes up to refresh intraday high after RBNZ rate lift.
- RBNZ matches market forecasts of 50 bps rate hike, signals suitability for further tightening.
- Resumption of downside in the US Treasury yields, mildly offered stock futures to exert downside pressure on Antipodeans.
- Comments from China’s Xi, softer NZ PPI teased Kiwi sellers earlier.
NZD/USD takes the bids to refresh intraday high near 0.6365 as bulls cheer the Reserve Bank of New Zealand’s (RBNZ) 50 basis points (bps) rate hike during Wednesday’s Asian session.
Although the RBNZ matched expectations of a 50 bps rate hike, to 3.0%, optimism from the quarterly Monetary Policy Statement seemed to have favored the NZD/USD bulls of late.
Also read: Breaking: RBNZ Raises OCR By 50bp to 3.00% as expected, kiwi pops to 0.6365
However, fears surrounding China, Europe, as well as a cautious mood ahead of the key data/events, challenge the Kiwi pair buyers of late.
China’s Premier Li Keqiang recently crossed wires, via the Communist Party’s flagship newspaper People’s Daily, while urging local officials from six key provinces that account for about 40% of the country’s economy to bolster pro-growth measures. On Wednesday, President Xi Jinping and state planner National Development and Reform Commission (NDRC) showed readiness for more measures to combat the recession fears.
Given the dragon nation’s trade ties with the Pacific, as well as the status of being the world’s biggest commodity user, any negatives for Beijing weigh on the Antipodeans like NZD/USD.
While portraying the sentiment, US 10-year Treasury yields fade the previous day’s rebound while S&P 500 Futures retreat from a four-month high.
Having witnessed the initial reaction to the RBNZ’s moves, the NZD/USD pair traders will pay attention to comments from Governor Adrian Orr for fresh impulse. Following that, the US Retail Sales for July, expected 0.1% versus 1.0% prior, as well as the Federal Open Market Committee (FOMC) meeting minutes, for clear directions. Also important will be the headlines concerning China and the recession.
Technical analysis
Unless providing a daily closing below the monthly support line, around 0.6260 by the press time, NZD/USD buyers remain hopeful. However, a downward sloping trend line resistance, close to 0.6460 at the latest, challenges the upside momentum.
As expected, the RBNZ lifted the Official Cash Rate by 50bp from 2.5% to 3.0% and the statement is signalling further tightening ahead.
NZD/USD has rallied by some 35 pips to a session high of 0.6365.
RBNZ quarterly statement
- Conditions need to continue to tighten.
- Sees OCR at 3.69% in December this year (up from its previous projection at 3.41%).
- Sees OCR at 4.1 in September 2023 (from 3.95%).
- Sees OCR at 4.1% in December 2023 (from 3.95%).
- Sees OCR at 3.65% in September 2025.
- Core consumer price inflation remains too high and labour resources remain scarce.
- Range of indicators highlight broad-based domestic pricing pressures.
- Agreed that further increases in the ocr were required in order to meet their remit objectives.
- Committee agreed that maintaining the recent pace of tightening remains the best means.
- Agreed that domestic inflationary pressures had increased since may and to further bring forward the timing of ocr increases.
- Resolute in its commitment to ensure consumer price inflation returns to within the 1 to 3 percent target range.
- House prices have steadily dropped from high levels since November last year, and are expected to keep falling over the coming year towards more sustainable levels.
Markets will be tuning into Governor Adrian Orr’s press conference later in the day.
About the RBNZ interest rate decision
RBNZ Interest Rate Decision is announced by the Reserve Bank of New Zealand. If the RBNZ is hawkish about the inflationary outlook of the economy and rises the interest rates it is positive, or bullish, for the NZD.
- Australia’s benchmark Treasury bond yields print four-day downtrend, renews intraday low after Aussie data.
- Australia Wage Price Index missed upbeat forecast on YoY, repeats QoQ readings in Q2.
- Fears in the Australia’s equity market, China-linked pessimism also weigh on the Aussie bond coupons.
The rush towards Australia’s Treasury bonds escalated after the nation published a downbeat Wage Price Index for the second quarter (Q2). The yields also take clues from the fears prevailing in Aussie equity markets. That said, the benchmark 10-year Treasury yields take offers to refresh the intraday low near 3.276% during Wednesday’s Asian session.
Aussie Q2 Wage Price Index reprinted 0.7% QoQ growth while missing 0.8% expectations. Further, the YoY figures also eased below market forecasts of 2.7% to 2.6%, versus 2.4% YoY prior.
On the other hand, gains in mining shares should have favored the Aussie equity traders even as a sharp drop in biomedical giant CSL Ltd. challenges the bulls.
On Tuesday, the RBA Minutes mentioned that the board expects to take further steps in the process of normalizing monetary conditions over the months ahead, but it is not on a pre-set path, per Reuters.
It’s worth noting that China’s readiness for multiple measures to tame recession woes fail to convince the markets that the dragon nation could avoid economic slowdown. Also fueling the flight to safety is Europe’s signals to renew the nuclear deal with Iran while pushing back plans for the closure of Germany’s last three nuclear power plants. On the same line was the Washington Post (WaPo) news that mentioned that Chinese authorities ordered factories to suspend production in several major manufacturing regions to preserve electricity, as the country face the worst heat wave in six decades.
On a broader front, the cautious mood ahead of US Retail Sales for July, expected 0.1% versus 1.0% prior, as well as the Federal Open Market Committee (FOMC) meeting minutes, also weigh on the market sentiment and the Aussie Treasury bond yields.
While portraying the sentiment, US 10-year Treasury yields fade the previous day’s rebound while S&P 500 Futures retreat from a four-month high. Further, Australia’s benchmark equity index ASX 200 prints mild losses at around 7,098 by the press time.
Moving on, headlines concerning China and the recession will be important for the AUD/USD traders ahead of Thursday’s Aussie jobs report.
Also read: AUD/USD slides beneath 0.7000 threshold on softer Australia wage data
- AUD/JPY drops following key wage data miss.
- AUD/JPY's M-formation could lead to a downside continuation towards 92.50 in the near term.
AUD/JPY dropped on the back of a miss in the Wage Price Index and is now down 0.5% on the day. The pair fell from 94.15 to a low of 93.76. The data arrived as follows:
- Australia Wage Price Index (QoQ) Q2: 0.7% (est 0.8%; prev 0.7%) .
- Wage Price Index (YoY) Q2: 2.6% (est 2.7%; prev 2.4%).
Meanwhile, fears of a significant slowdown of the Chinese economy have weighed on the Australian dollar this week due to lower demand for iron ore and other assets from China. Figures for Industrial Production, Retail Sales and fixed asset investments, as released by the National Bureau of Statistics, missed expectations in July.
Additionally, worries about a more pronounced cooling rose from a surprising rate cut by the Chinese central bank PBoC. Investors figured that the PBoC is alarmed about the extent of economic weakening as it tries to revive credit demand to support the COVID-hit economy after a string of weak economic data releases for July.
Looking ahead, the labour data is coming up. ''July is a seasonally strong month for job gains and we look for the unemployment rate to trend lower. Another strong labour print should give the RBA the assurance that the economy can withstand a cash rate of 3% by end-2022,'' analysts at TD Securities explained.
AUD/JPY technical analysis
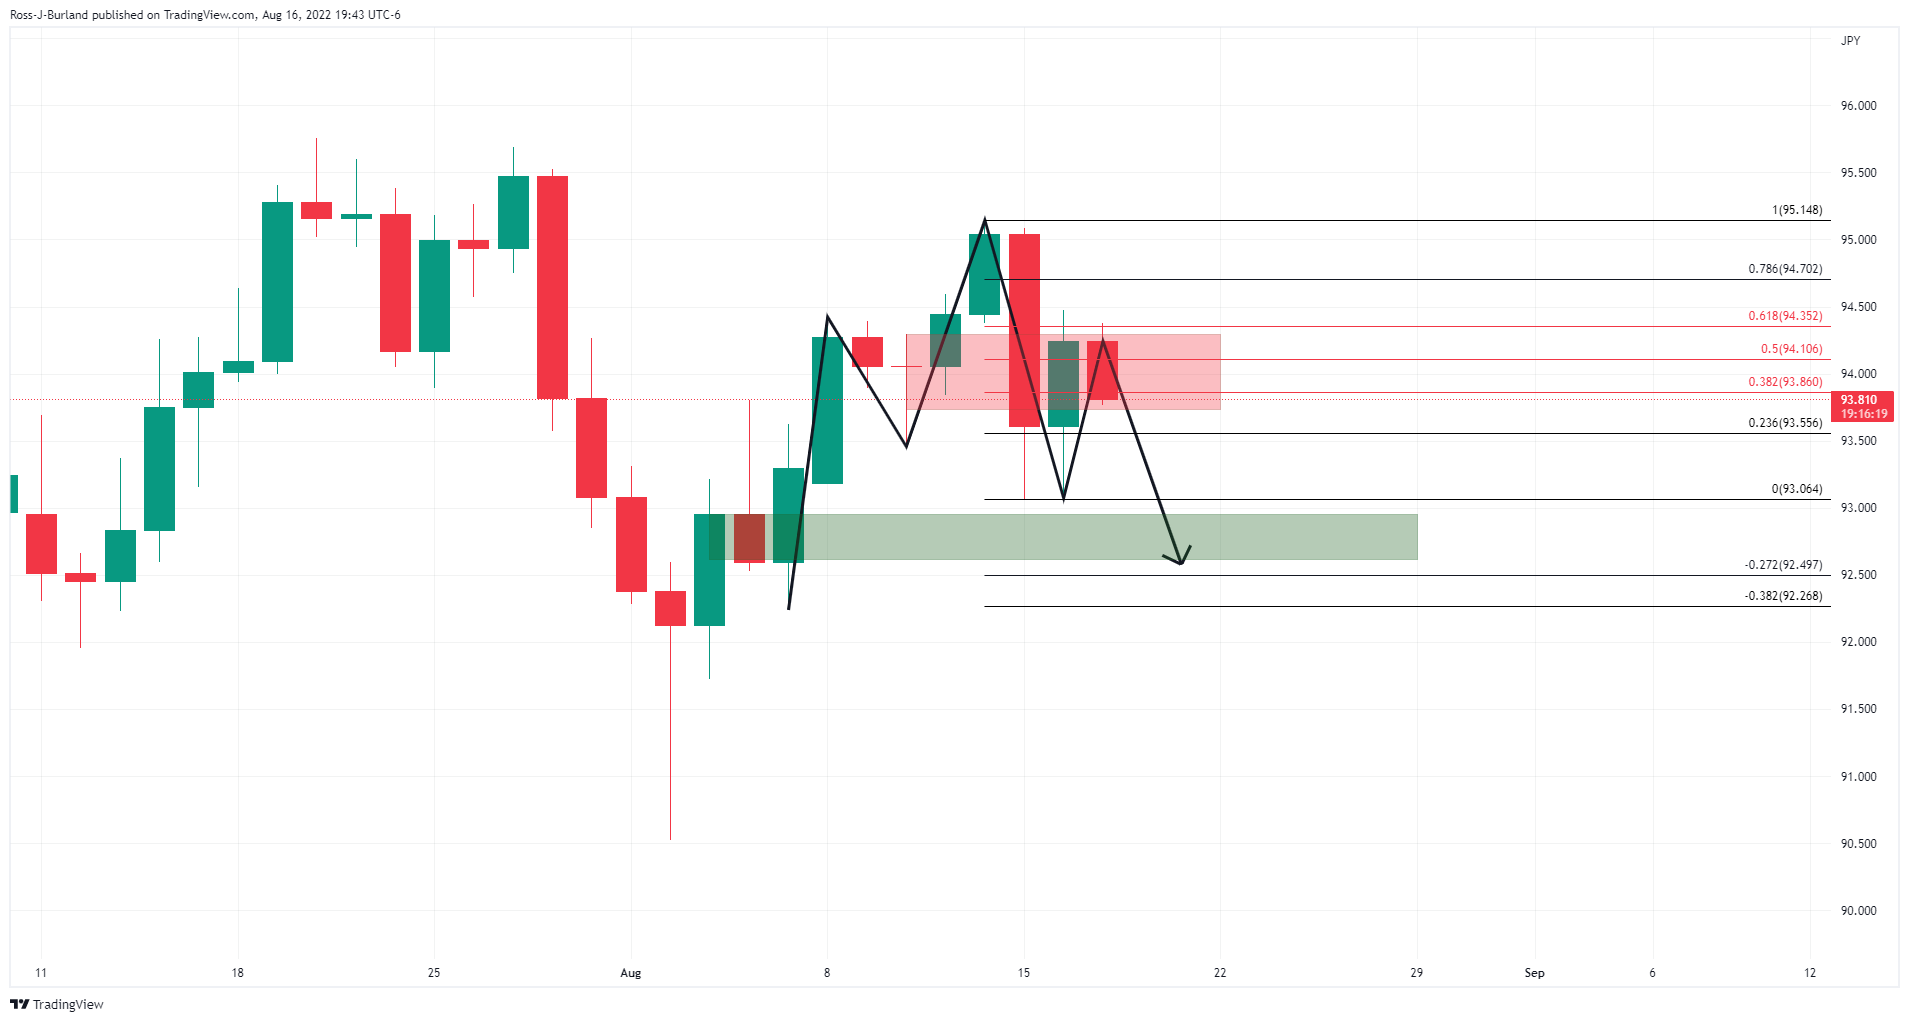
AUD/JPY's M-formation could lead to a downside continuation towards 92.50 in the near term with the price being resisted near the 61.8% Fibonacci.
Citing China’s Premier Li Keqiang, the People’s Daily, the flagship newspaper of the Communist Party, reported that Li urged local officials from six key provinces that account for about 40% of the country’s economy to bolster pro-growth measures.
Key quotes
Officials at a meeting should take the lead in helping boost consumption and offer more fiscal support via government bond issuance for investments.
Vow to “reasonably” step up policy support to stabilize employment, prices and ensure economic growth.
Only when the main entities of the market are stable can the economy and employment be stable.
Only by development shall we solve all problems.
Opening up is the only way to make full use of the two markets and resources and improve international competitiveness.
Related reads
- AUD/USD slides beneath 0.7000 threshold on softer Australia wage data
- USD/CNY fix: 6.7863 vs. est 6.7876 and previous 6.7730
- AUD/USD takes offers to refresh intraday low after downbeat Australia Wage Price Index.
- Aussie Wage Price Index missed strong market expectations in Q2.
- US dollar pullback ahead of Fed Minutes adds strength to the upside momentum.
- US Retail Sales, risk catalysts are also important for clear directions.
AUD/USD fails to justify the previous day’s bullish Doji as it renews intraday low near 0.6990 after Australia’s Wage Price Index for the second quarter (Q2). Also exerting downside pressure on the Aussie pair is the mixed sentiment ahead of the US Retail Sales and Fed Minutes.
That said, Aussie Q2 Wage Price Index reprinted 0.7% QoQ growth while missing 0.8% expectations. Further, the YoY figures also eased below market forecasts of 2.7% to 2.6%, versus 2.4% YoY prior.
While tracking the Aussie data and the market’s indecision, the AUD/USD pair ignores the US dollar moves.
That said, the US Dollar Index (DXY) refreshed its three-week high before reversing from 106.94, down 0.05% near the intraday low of 106.40 at the latest. The DXY losses could be linked to the market’s preparations for today’s US Retail Sales for July, expected 0.1% versus 1.0% prior, as well as the Federal Open Market Committee (FOMC) meeting minutes. It’s worth noting that the recent weakness in the US data challenges the hawkish hopes from the Fed, the same highlights today’s Fed Minutes.
Also read: Australian Wage Price Index: +0.7% vs. expected +0.8%, AUD/USD drops 20 pips
Elsewhere, gains in mining shares should have favored the Aussie equity traders even as a sharp drop in biomedical giant CSL Ltd. challenges the bulls. On the same line could be China’s readiness for multiple measures to tame recession woes, even if the markets have little belief that the dragon nation could avoid economic slowdown.
Amid these plays, S&P 500 Futures struggle for clear directions near a four-month high while the US 10-year Treasury yields seesaw around 2.82% after snapping a two-day downtrend the previous day.
Looking forward, headlines concerning China and recession will be important for the AUD/USD traders ahead of Thursday’s Aussie jobs report, not to forget the FOMC Minutes and US Retail Sales.
Technical analysis
Sustained recovery from a four-month-old previous resistance line, at 0.6990 by the press time, keeps AUD/USD buyers hopeful to mark another battle with the 200-DMA hurdle surrounding 0.7120.
The Australian Wage Price Index released by the Australian Bureau of Statistics is out as follows:
- +0.7% vs. expected +0.8%
The data has weighed on the price of AUD. AUD/USD is losing 20 pips on the release to 0.6998 the low of the session so far.
About the Wage Price Index
The Wage Price Index released by the Australian Bureau of Statistics is an indicator of labor cost inflation and of the tightness of labor markets. The Reserve Bank of Australia pays close attention to it when setting interest rates. A high reading is positive (or bullish) for the AUD, while a low reading is seen as negative (or bearish).
- NZD/USD on the 4-hour chart will need to overcome the resistance near 0.6350,
- Bears will be looking for a move to test 0.63 the figure.
The Kiwi is little changed from yesterday after bouncing as the USD DXY came off highs. The focus is now on today’s Reserve Bank of New Zealand MPS and the kiwi is treading water in the lead-up. The following illustrates the prospect of a move higher from a key area of support on the charts.
NZD/USD daily chart
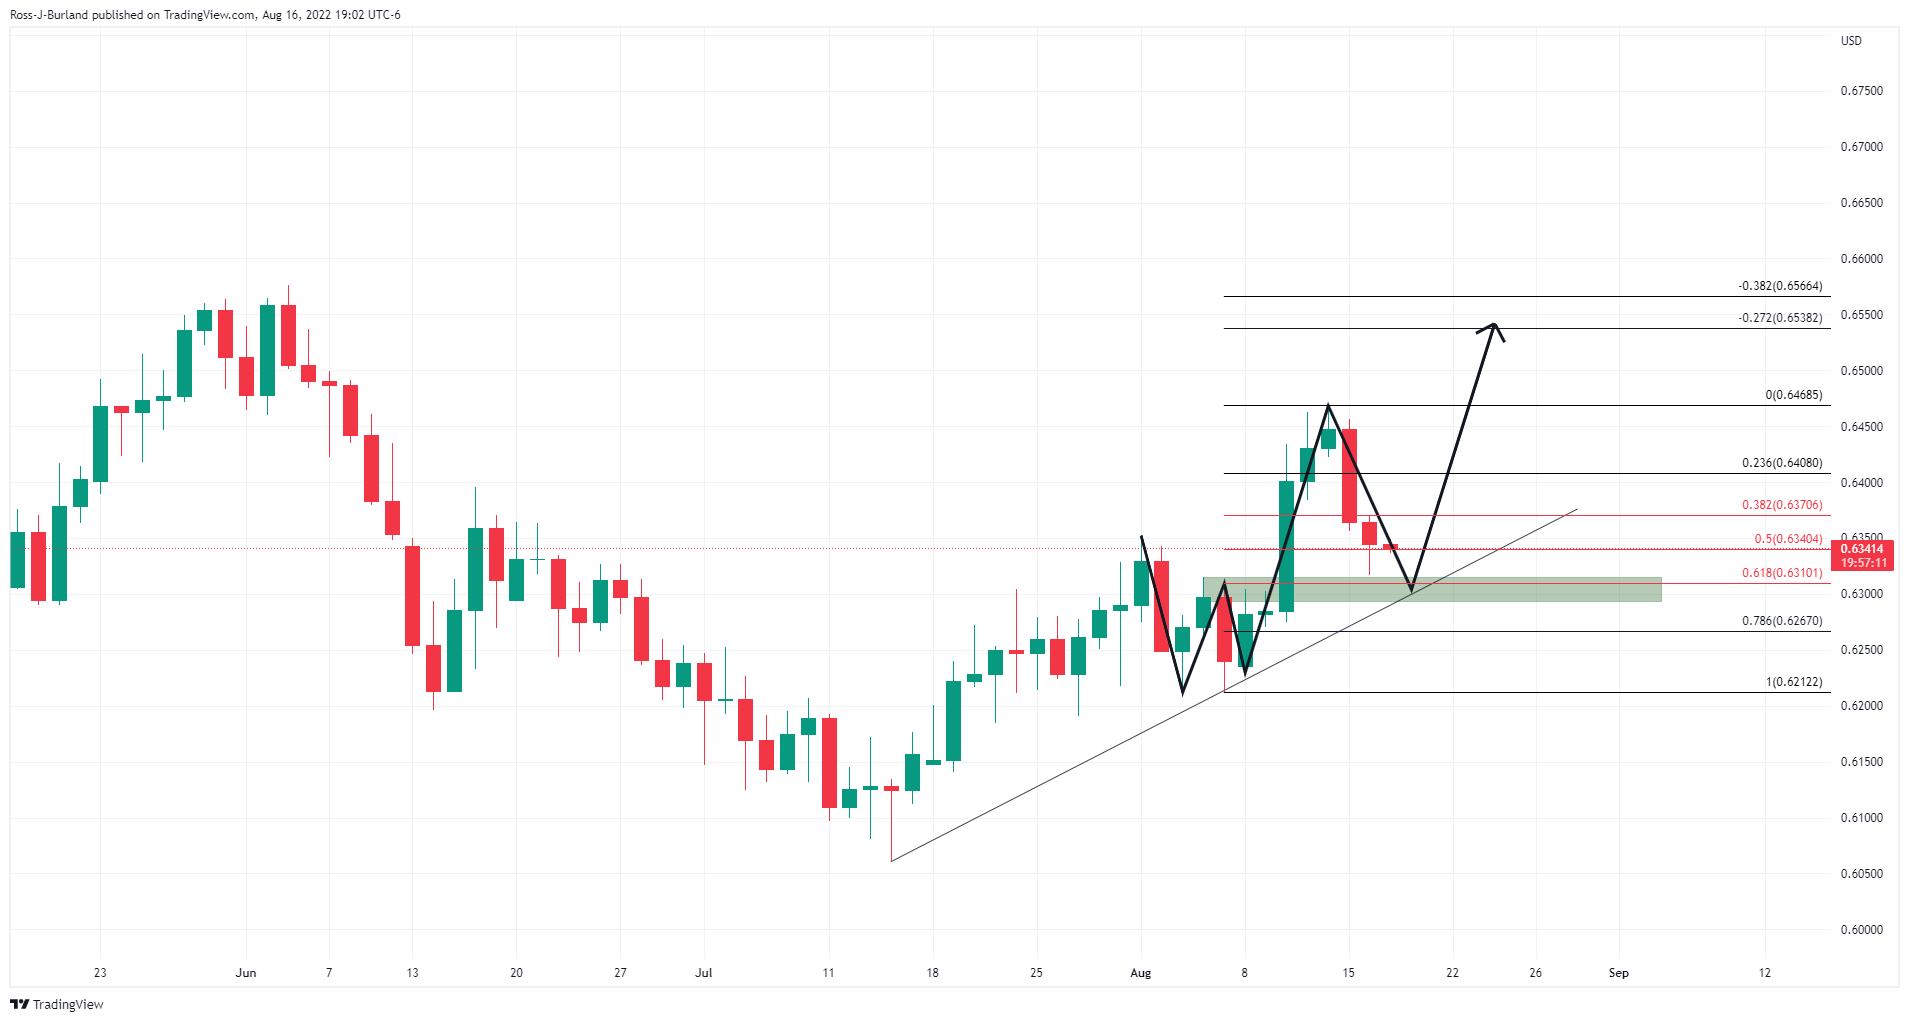
The price fell to a 61.8% Fibonacci retracement on the daily chart where it meets the neckline of the W-formation as illustrated above. On the other hand, a break of the trendline support will open risks of a significant move lower:
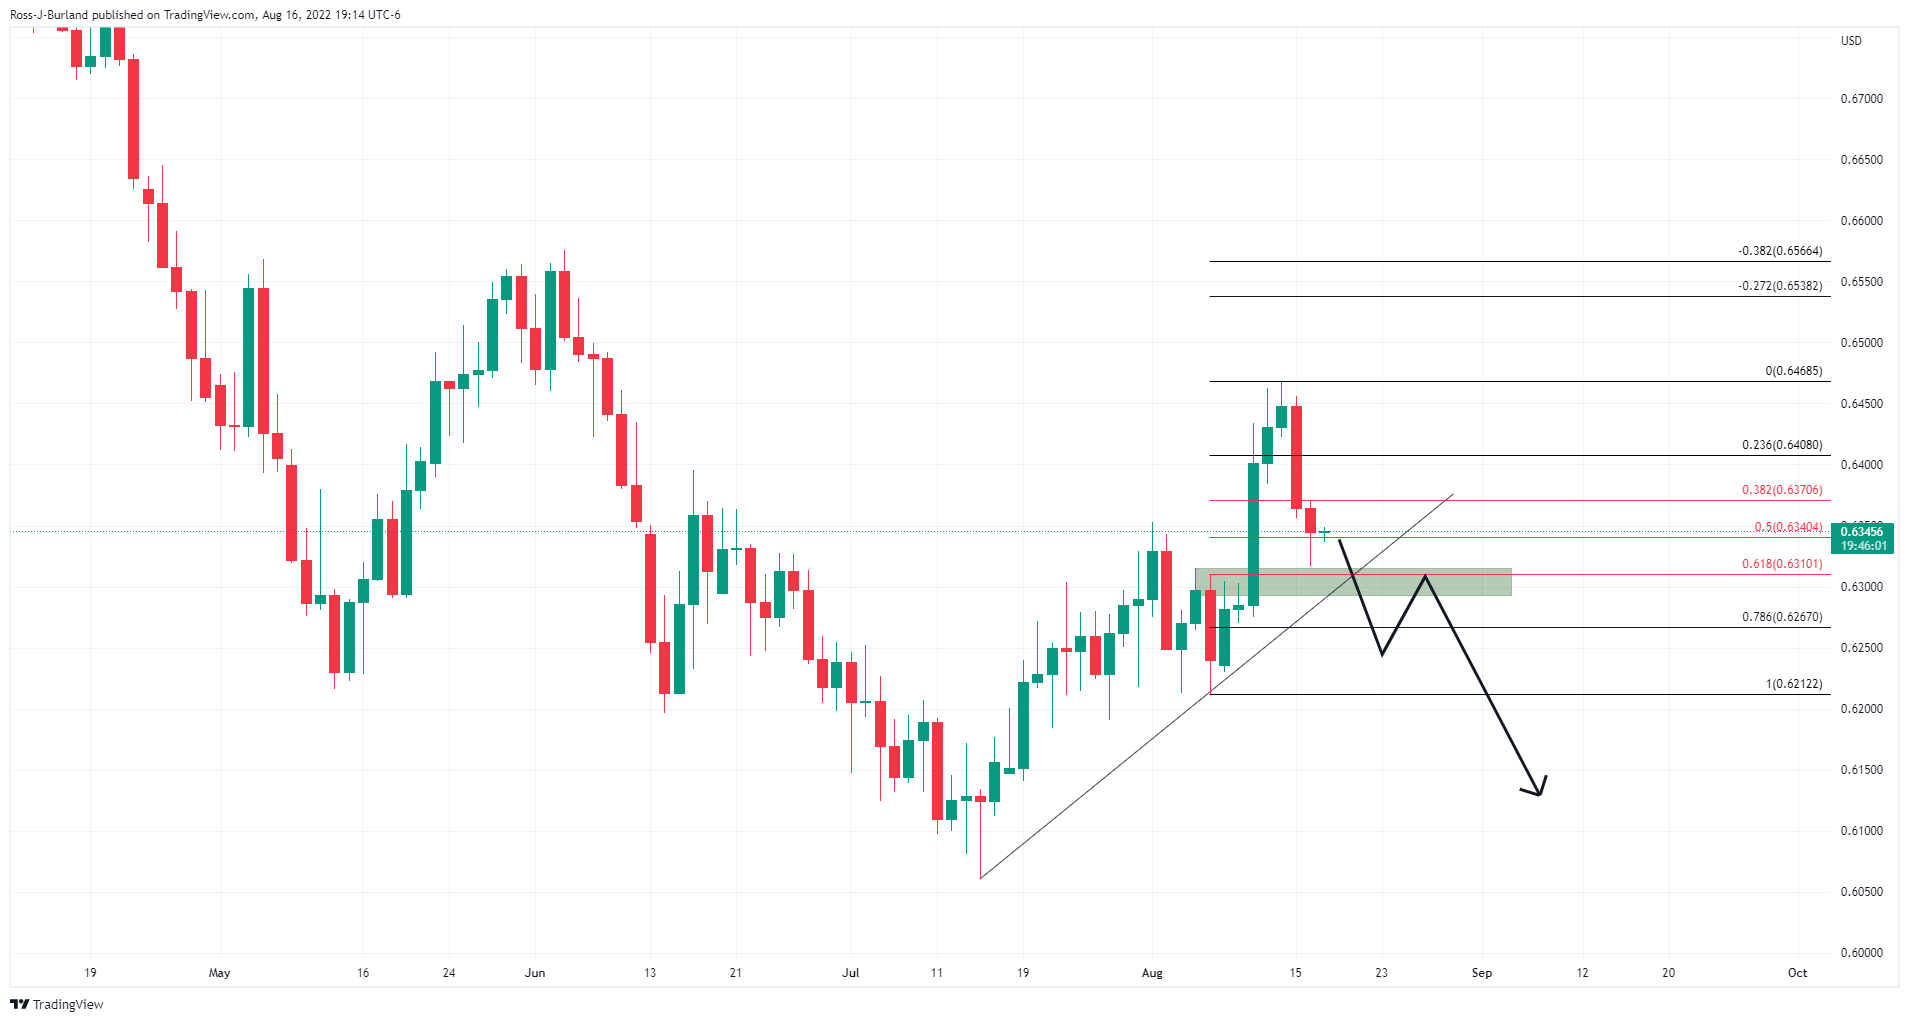
NZD/USD H4 chart
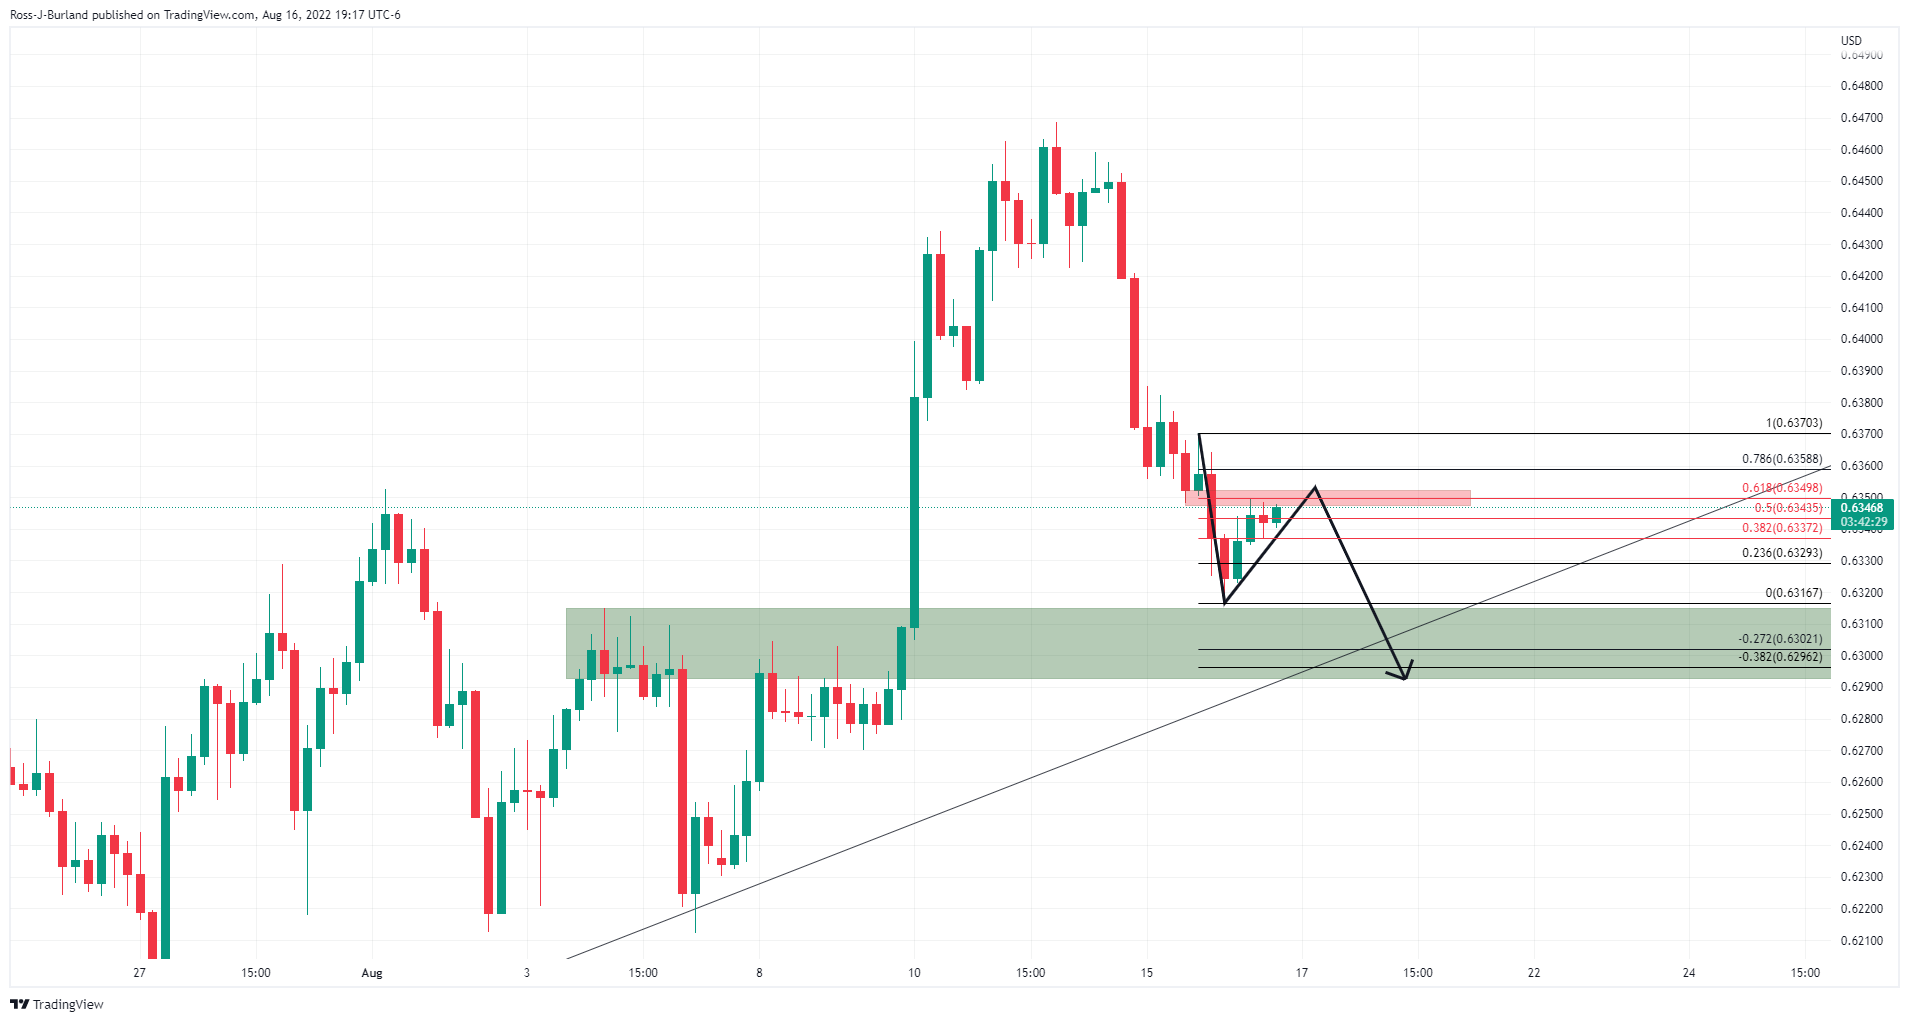
NZD/USD on the 4-hour chart will need to overcome the resistance near 0.6350 or face the prospects of a bearish continuation into 0.63 the figure.
In recent trade today, the People’s Bank of China (PBOC) set the yuan (CNY) at 6.7863 vs.the estimated at 6.7876 and the previous 6.7730.
About the fix
China maintains strict control of the yuan’s rate on the mainland.
The onshore yuan (CNY) differs from the offshore one (CNH) in trading restrictions, this last one is not as tightly controlled.
Each morning, the People’s Bank of China (PBOC) sets a so-called daily midpoint fix, based on the yuan’s previous day's closing level and quotations taken from the inter-bank dealer.
- WTI remains pressured around the lowest levels since late January.
- Clear U-turn from 200-DMA, downside break of 61.8% Fibonacci retracement level favor bears.
- Monthly support line challenges further downside as RSI approaches oversold territory.
WTI crude oil prices fade the corrective pullback from a nearly seven-month low, marked the previous day, as the bears keep reins for the third consecutive day. That said, the quote recently dropped to $86.25 during Wednesday’s Asian session.
The black gold’s latest weakness could be linked to its reversal from the $94.55 resistance confluence including the 200-DMA and 50% Fibonacci retracement (Fibo.) of December 2021 to March 2022 upside. Also keeping the commodity bears hopeful is the latest downside break of the 61.8% Fibo.
However, nearly oversold RSI (14) joins the monthly support line, at $85.30 by the press time, to challenge the WTI bears.
Also acting as a downside filter is the yearly low near $81.70, a break of which could make the quote vulnerable to a slump towards the early December 2021 high near $73.20.
Alternatively, recovery moves need to cross the 61.8% Fibonacci retracement level of $86.80 to convince WTI buyers.
Even so, the convergence of the 200-DMA and the 50% Fibo. near $94.55, appears a tough nut to crack for the bulls.
If at all the quote rises past $94.55, the odds of its run-up to the monthly high surrounding $101.00 can’t be ruled out.
WTI: Daily chart
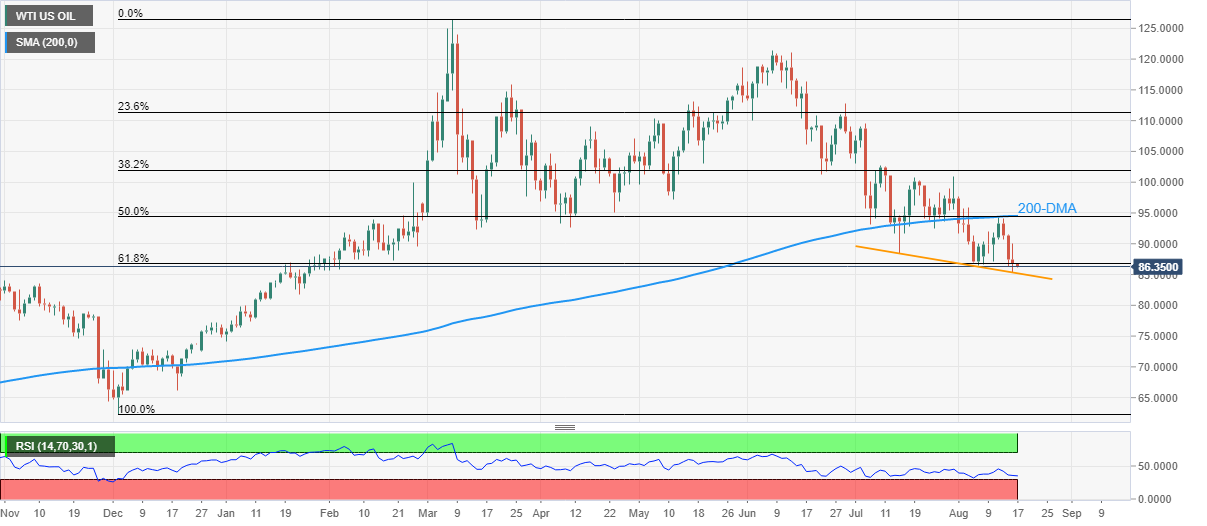
Trend: Limited downside expected
Early Wednesday at 02:00 GMT market sees the key monetary policy decision by the Reserve Bank of New Zealand (RBNZ) amid hopes of another hawkish play by the New Zealand central bank.
RBNZ is expected to announce the seventh back-to-back increase in its benchmark interest rate, from 2.5% to 3.0%, not to forget a fourth straight 50 basis points (bps) rate hike.
Although the rate hike is mostly priced in, the quarterly Monetary Policy Statement and the press conference by RBNZ Governor Adrian Orr make the event crucial for NZD/USD traders, especially when the global inflation fears abate.
Ahead of the event, Australia and New Zealand Banking Group (ANZ) said,
We are expecting a hawkish tone today as the RBNZ tries to reiterate the battle to bring down surging inflation is far from over. Upside surprises in domestic inflation and wage growth, along with the recent falls in domestic mortgage rates given the Monetary Policy Committee little choice but to send a clear message.
On the same line, analysts at Westpac said,
The RBNZ is widely expected to lift the Official Cash Rate by 50bp from 2.5% to 3.0% and to continue signaling further tightening ahead. There will be plenty to absorb in the quarterly statement, followed by Governor Orr’s press conference an hour later.
Considering the market consensus, FXStreet’s Dhwani Mehta said,
Wednesday’s RBNZ announcement could fail to offer any reprieve to NZD bulls if the bank delivers the expected 50 bps rate hike but underscores growth concerns and hints at a potential easing in its rate-hike track.
How could it affect NZD/USD?
NZD/USD remains pressured towards 0.6300 during the three-day downtrend, down 0.15% intraday at 0.6335 by the press time, as Kiwi buyers brace for the 0.50% rate hike amid a sluggish Asian session on Wednesday. The quote’s latest weakness could be linked to the market’s anxiety ahead of the key RBNZ verdict. The same pay less attention to the recent pullback in the US dollar as the greenback traders prepare for the Federal Open Market Committee (FOMC) meeting minutes.
That said, the RBNZ’s fourth rate hike worth 50 bps is widely discussed and seemed to have been capitalized by the bulls between mid-July and early August. Hence, an increase in the benchmark rate worth the estimations won’t make any major difference to the Kiwi pair trader until the accompanying rate statements and Governor Orr’s press conference hint at a further increase in the Official Cash Rate (OCR).
Even so, a knee-jerk rise on the 50 bps rate hike can’t be ruled out. On the contrary, a disappointment from the RBNZ, either via a softer rate hike or cautious comments, should be considered heavily negative for the NZD/USD prices. However, it also depends upon the Fed Minutes as to how low the Kiwi pair can fall.
Technically, NZD/USD recently bounced off the 100-DMA support around 0.6320 amid bullish RSI divergence. The recovery moves, however, need validation from a downward sloping resistance line from late April, close to 0.6460 by the press time.
Keynotes
NZD/USD pauses two-day downtrend around 0.6350 with eyes on RBNZ, Fed Minutes
Reserve Bank of New Zealand Preview: Growth fears could temper hawkish rhetoric
About the RBNZ interest rate decision and rate statement
The RBNZ interest rate decision is announced by the Reserve Bank of New Zealand. If the RBNZ is hawkish about the inflationary outlook of the economy and raises the interest rates it is positive, or bullish, for the NZD. The RBNZ rate statement contains the explanations of their decision on interest rates and commentary about the economic conditions that influenced their decision.
- USD/CAD has been pressured in a resurgence in the commodity currency.
- CAD strengthens despite a drop in oil prices.
The Canadian dollar USD/CAD was flat at 1.2846 to the greenback, but the loonie managed to regain some of the previous day's sharp decline as investors raised bets on another oversized interest rate hike by the Bank of Canada. Data has shown rising underlying inflation pressures.
Canada's annual inflation rate slowed to 7.6% in July as gasoline prices eased, but that was still far above the Bank of Canada's 2% target. Canadian inflation may have peaked, but it remains far too high, BoC Governor Tiff Macklem said in a newspaper op-ed. In July, the BoC hiked by a full percentage point. Money markets have been pricing in 59 basis points of tightening by the central bank at its next policy announcement on Sept. 7, up from 53 basis points before the data. Canadian government bond yields jumped across a flatter curve.
Meanwhile, the move higher for the Canadian dollar happened despite pressure on the price of oil. The prospect of an Iran nuclear deal continued to weigh on crude oil prices, analysts at ANZ Bank explained. US crude oil futures CL1! settled 3.2% lower at $86.53 a barrel, their lowest since before Russia's invasion of Ukraine, as economic data spurred concerns about a potential global recession.''
Brent futures fell 3.2% as talks between Iran and European Union negotiators signalled progress on a renewal of the 2015 agreement. EU mediators had circulated a final proposal last week. It has been reported that Iran’s response was constructive, and they are now consulting with the US on a way ahead for the protracted talks,'' analysts at ANZ Bank explained.
USD/CAD H4 chart
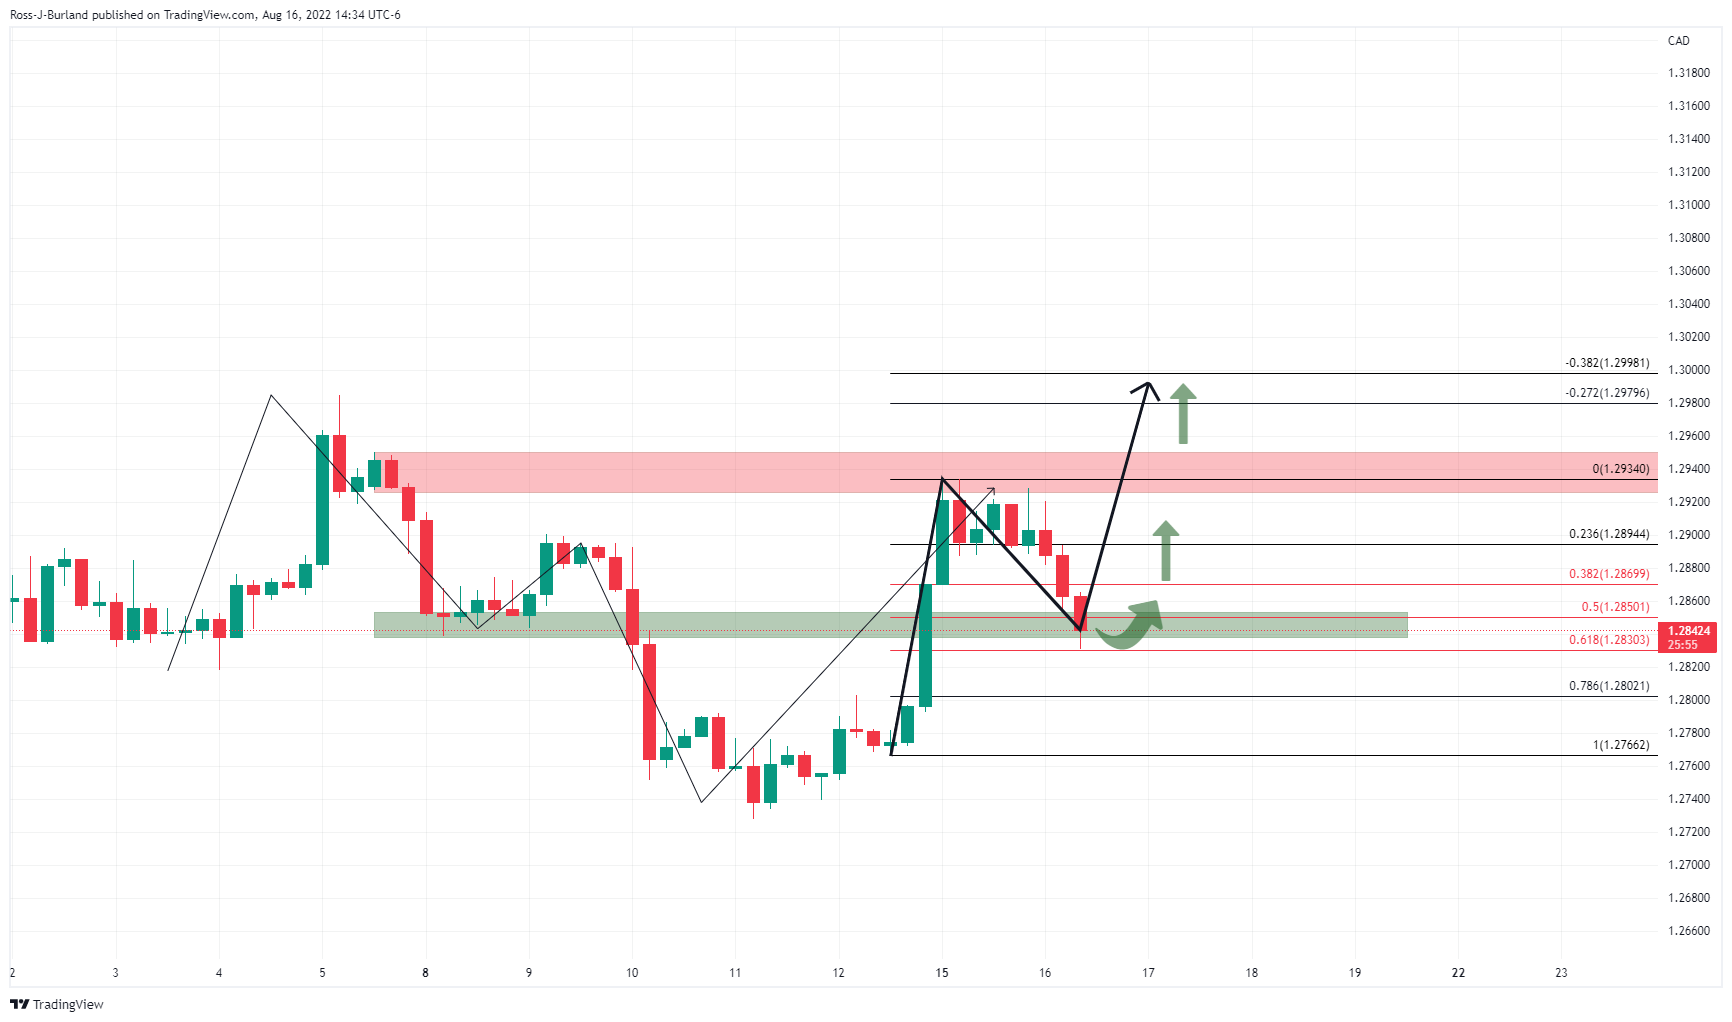
On the charts, a break of the 61.8% ratio to the downside would be a significant move but while it holds, the bias is to the upside as per the chart above.
- US Dollar Index struggles to defend buyers after reversing from three-week top.
- Dicey markets ahead of the key data/events keep traders on their toes.
- Recession woes, geopolitical tussles challenge optimists amid mixed data.
- FOMC Minutes will be watched closely to confirm 0.75% rate hike in September.
US Dollar Index (DXY) treads water around 106.50 amid cautious sentiment ahead of crucial data/events. That said, the greenback’s gauge versus the six major currencies refreshed its three-week high before reversing from 106.94 the previous day.
Economic concerns surrounding China and Europe should have joined geopolitical fears and recently increasing hawkish Fed bets to underpin the DXY run-up. However, firmer equities and a retreat of the bond buyers appeared to have tamed the greenback bulls of late.
China’s readiness for multiple measures to tame recession woes joined Europe’s signals to renew the nuclear deal with Iran while pushing back plans for the closure of Germany’s last three nuclear power plants. On the same line was the Washington Post (WaPo) news that mentioned that Chinese authorities ordered factories to suspend production in several major manufacturing regions to preserve electricity, as the country face the worst heat wave in six decades.
Further, the latest news from Tokyo media suggesting Russian alerts to Japanese companies about the Sakhalin-2 transfer plan, as well as high-level talks between Japan and China, highlight the geopolitical fears and favor the US dollar’s haven demand.
On the other hand, US Industrial Production grew 0.6% in July versus 0.3% expected and upwardly revised 0.0% prior whereas Building Permits also increased to 1.674M MoM during the stated month versus 1.656 market expectations and 1.696M previous readings. Additionally, the Housing Starts dropped to 1.446M from 1.599M prior and 1.54M expected.
While portraying the mood, Wall Street managed to close on the positive side, despite retreating by the end of the day. That said, the US 10-year Treasury yields snapped a two-day downtrend by regaining 2.80% at the latest. It should be noted that the US 10-year Treasury yields keep the previous day’s rebound at 2.82% while the S&P 500 Futures print mild losses at the latest.
Moving on, risk catalysts may direct immediate DXY moves ahead of US Retail Sales for July, expected 0.1% versus 1.0% prior, as well as the Federal Open Market Committee (FOMC) meeting minutes.
Given the looming doubts over the Fed’s hawkish play, softer US data and signals of no more 0.75% rate hikes could drown on the DXY.
Technical analysis
Although the 107.00 hurdle challenge DXY bulls, a sustained break of the two-week-old descending trend line, at 106.30 by the press time, keeps the buyers hopeful.
| Index | Change, points | Closed | Change, % |
|---|---|---|---|
| NIKKEI 225 | -2.87 | 28868.91 | -0.01 |
| Hang Seng | -210.34 | 19830.52 | -1.05 |
| KOSPI | 5.58 | 2533.52 | 0.22 |
| ASX 200 | 41.1 | 7105.4 | 0.58 |
| FTSE 100 | 26.86 | 7536.06 | 0.36 |
| DAX | 93.51 | 13910.12 | 0.68 |
| CAC 40 | 22.63 | 6592.58 | 0.34 |
| Dow Jones | 239.57 | 34152.01 | 0.71 |
| S&P 500 | 8.06 | 4305.2 | 0.19 |
| NASDAQ Composite | -25.5 | 13102.55 | -0.19 |
- USD/JPY extends the previous day’s run-up at weekly top.
- Japan’s trade numbers, Tankan sentiment data came in firmer but Machinery Orders eased.
- Yields stay firmer even as fears of economic slowdown, geopolitical tussles escalate.
- US Retail Sales, FOMC Meeting Minutes will be important for fresh impulse.
USD/JPY holds onto the latest bullish bias while picking up bids to refresh the intraday high near 134.40 as Tokyo opens on Wednesday. The yen pair’s latest run-up could be linked to the firmer yields.
In doing so, the quote ignores the US dollar pullback while trying to justify the mixed data at home and abroad.
That said, Japan’s Merchandise Trade Balance dropped to ¥-1,436.8B in July versus ¥-1,405B expected and the previous reading of ¥-1,383.8B. Further details suggest an improvement in Exports and Imports during the stated month. Also positive were the Tankan Manufacturing Survey results for August. “Japanese manufacturers' business confidence improved in August after last month's stall, while service-sector firms' mood rose for a second month to the highest point in nearly three years, the Reuters Tankan poll showed,” per Reuters.
Additionally, Japan's core machinery orders rose 0.9% in June from the previous month, government data showed on Wednesday, lower than a 1.3% increase expected by economists in a Reuters poll.
On the other hand, US Industrial Production grew 0.6% in July versus 0.3% expected and upwardly revised 0.0% prior whereas Building Permits also increased to 1.674M MoM during the stated month versus 1.656 market expectations and 1.696M previous readings. It should be noted that the Housing Starts dropped to 1.446M from 1.599M prior and 1.54M expected.
It should be noted that US Dollar Index (DXY) refreshed its three-week high before reversing from 106.94. The greenback’s gauge versus six major currencies previously benefited from the flight to safety as China’s readiness for multiple measures to tame recession woes joined Europe’s signals to renew the nuclear deal with Iran while pushing back plans for the closure of Germany’s last three nuclear power plants. On the same line was the Washington Post (WaPo) news that mentioned that Chinese authorities ordered factories to suspend production in several major manufacturing regions to preserve electricity, as the country face the worst heat wave in six decades.
On the same line was the latest news from Japanese media suggesting Russian alerts to Japanese companies about the Sakhalin-2 transfer plan, as well as high-level talks between Japan and China.
Against this backdrop, Wall Street managed to close on the positive side, despite retreating by the end of the day. That said, the US 10-year Treasury yields snapped a two-day downtrend by regaining 2.80% at the latest. It should be noted that the US 10-year Treasury yields keep the previous day’s rebound at 2.82% while the S&P 500 Futures print mild losses at the latest.
Looking forward, US Retail Sales for July, expected 0.1% versus 1.0% prior, will entertain USD/JPY traders ahead of the Federal Open Market Committee (FOMC) meeting minutes, which will be eyed for the clues of the 0.75% rate hike in September.
Also read: FOMC July Minutes Preview: Can it influence September Fed rate hike expectations?
Technical analysis
A daily closing beyond the monthly resistance line, now support around 134.20, directs USD/JPY towards the 50-DMA hurdle surrounding 135.40.
| Pare | Closed | Change, % |
|---|---|---|
| AUDUSD | 0.70197 | -0.03 |
| EURJPY | 136.469 | 0.8 |
| EURUSD | 1.01673 | 0.06 |
| GBPJPY | 162.291 | 1.05 |
| GBPUSD | 1.20913 | 0.3 |
| NZDUSD | 0.6343 | -0.34 |
| USDCAD | 1.28448 | -0.43 |
| USDCHF | 0.94913 | 0.33 |
| USDJPY | 134.232 | 0.75 |
- Silver price remains pressured around one-week low, sidelined after two-day downtrend.
- 50-DMA challenges sellers after confirmation of the bearish chart pattern.
- Recovery remains elusive until the quote stays below 100-DMA.
Silver price (XAG/USD) stays defensive around $20.10-15 as bears take a breather after a two-day downtrend near the weekly low. In doing so, the bright metal flirts with the 50-DMA support during Wednesday’s Asian session.
Even so, the early-week confirmation of the rising wedge and the RSI retreat keeps sellers hopeful.
That said, the $20.00 threshold appears to be the immediate support for the XAG/USD bears to watch to retake control.
Following that, the mid-July low near $19.40 could probe silver’s downside before challenging the yearly low near $18.15.
Alternatively, a corrective pullback may aim for the support line of the stated wedge, at $20.65 by the press time, ahead of directing the XAG/USD buyers towards the latest swing high near $20.85.
It’s worth noting, however, that a convergence of the 100-DMA and the wedge’s upper line, close to $21.50-60, appears a tough nut to crack for the silver buyers to cross afterward.
In a case where the quote remains firmer past $21.60, the odds of its run-up towards June’s peak of $22.50 can’t be ruled out.
Silver: Daily chart
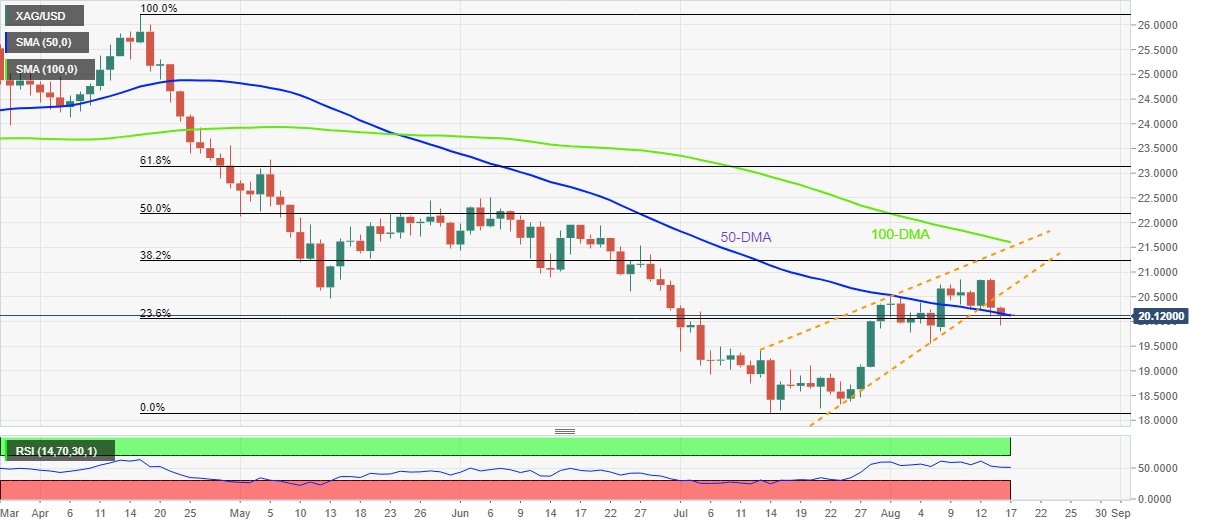
Trend: Further weakness expected


© 2000-2026. Sva prava zaštićena.
Sajt je vlasništvo kompanije Teletrade D.J. LLC 2351 LLC 2022 (Euro House, Richmond Hill Road, Kingstown, VC0100, St. Vincent and the Grenadines).
Svi podaci koji se nalaze na sajtu ne predstavljaju osnovu za donošenje investicionih odluka, već su informativnog karaktera.
The company does not serve or provide services to customers who are residents of the US, Canada, Iran, The Democratic People's Republic of Korea, Yemen and FATF blacklisted countries.
Izvršenje trgovinskih operacija sa finansijskim instrumentima upotrebom marginalne trgovine pruža velike mogućnosti i omogućava investitorima ostvarivanje visokih prihoda. Međutim, takav vid trgovine povezan je sa potencijalno visokim nivoom rizika od gubitka sredstava. Проведение торговых операций на финанcовых рынках c маржинальными финанcовыми инcтрументами открывает широкие возможноcти, и позволяет инвеcторам, готовым пойти на риcк, получать выcокую прибыль, но при этом неcет в cебе потенциально выcокий уровень риcка получения убытков. Iz tog razloga je pre započinjanja trgovine potrebno odlučiti o izboru odgovarajuće investicione strategije, uzimajući u obzir raspoložive resurse.
Upotreba informacija: U slučaju potpunog ili delimičnog preuzimanja i daljeg korišćenja materijala koji se nalazi na sajtu, potrebno je navesti link odgovarajuće stranice na sajtu kompanije TeleTrade-a kao izvora informacija. Upotreba materijala na internetu mora biti praćena hiper linkom do web stranice teletrade.org. Automatski uvoz materijala i informacija sa stranice je zabranjen.
Ako imate bilo kakvih pitanja, obratite nam se pr@teletrade.global.
транcфери