“Xi Jinping will come. President Putin has also told me he will come,” Jokowi, as the president is known, said in an interview with Bloomberg News Editor-in-Chief John Micklethwait on Thursday. It was the first time the leader of the world’s fourth-most populous nation confirmed both of them were planning to show up at the November summit.
- Analiza
- Novosti i instrumenti
- Vesti sa tržišta
Forex-novosti i prognoze od 19-08-2022
UPOZORENJE: Materijal koji se nalazi u odeljku novosti i analitika se obnavlja automatski, pa ponovno učitavanje stranice može usporiti proces pojave novog materijala. Sa tim u vezi, predlažemo da stranicu sa novostima držite stalno otvorenom, kako biste nove materijala primili bez zastoja.
Filtriraj po valutnom paru
19.08.2022
21:18
AUD/USD Price Analysis: Bearish-biased as sellers reclaimed the 100/50/20-DMAs, eyeing 0.6700
- AUD/USD plunged more than 0.50% on Friday amidst a buoyant greenback.
- The major slid in each day of the week; losing between Monday-Wednesday almost 3%.
- A break below 0.6869 clears the path towards 0.6800, followed by 0.6718.
The AUD/USD refreshed four-week lows preparing to finish the week with hefty losses, equal to 3.50%. The Aussie tumbled in each day of the week, breaching dynamic resistances, like the 20 and 50-day EMA, on its way down. At the time of writing, the AUD/USD is trading at 0.6874, down 0.57%.
AUD/USD Price Analysis: Technical outlook
The AUD/USD shifted from neutral-upwards to downward-biased throughout the week. Worth noting that the major began the week above the 20, 50, and 100-DMAs. However, it tumbled courtesy of buyers unable to crack the 200-day EMA around 0.7130s despite the market’s “dovish” FOMC minutes reaction, which set the Aussie’s faith.
On Monday, the major plummeted below the 100-day EMA; by Wednesday, the AUD/USD was already 200-pips (2.99%) down in the week. Furthermore, as the downtrend gathered momentum, the Relative Strength Index (RSI) plunged from readings nearby 55 to 46, meaning sellers were in charge.
Therefore, the AUD/USD first support will be August low at 0.6869. Once cleared, the next demand zone will be the July 19 daily low at 0.6802, followed by the July 15 low at 0.6718.
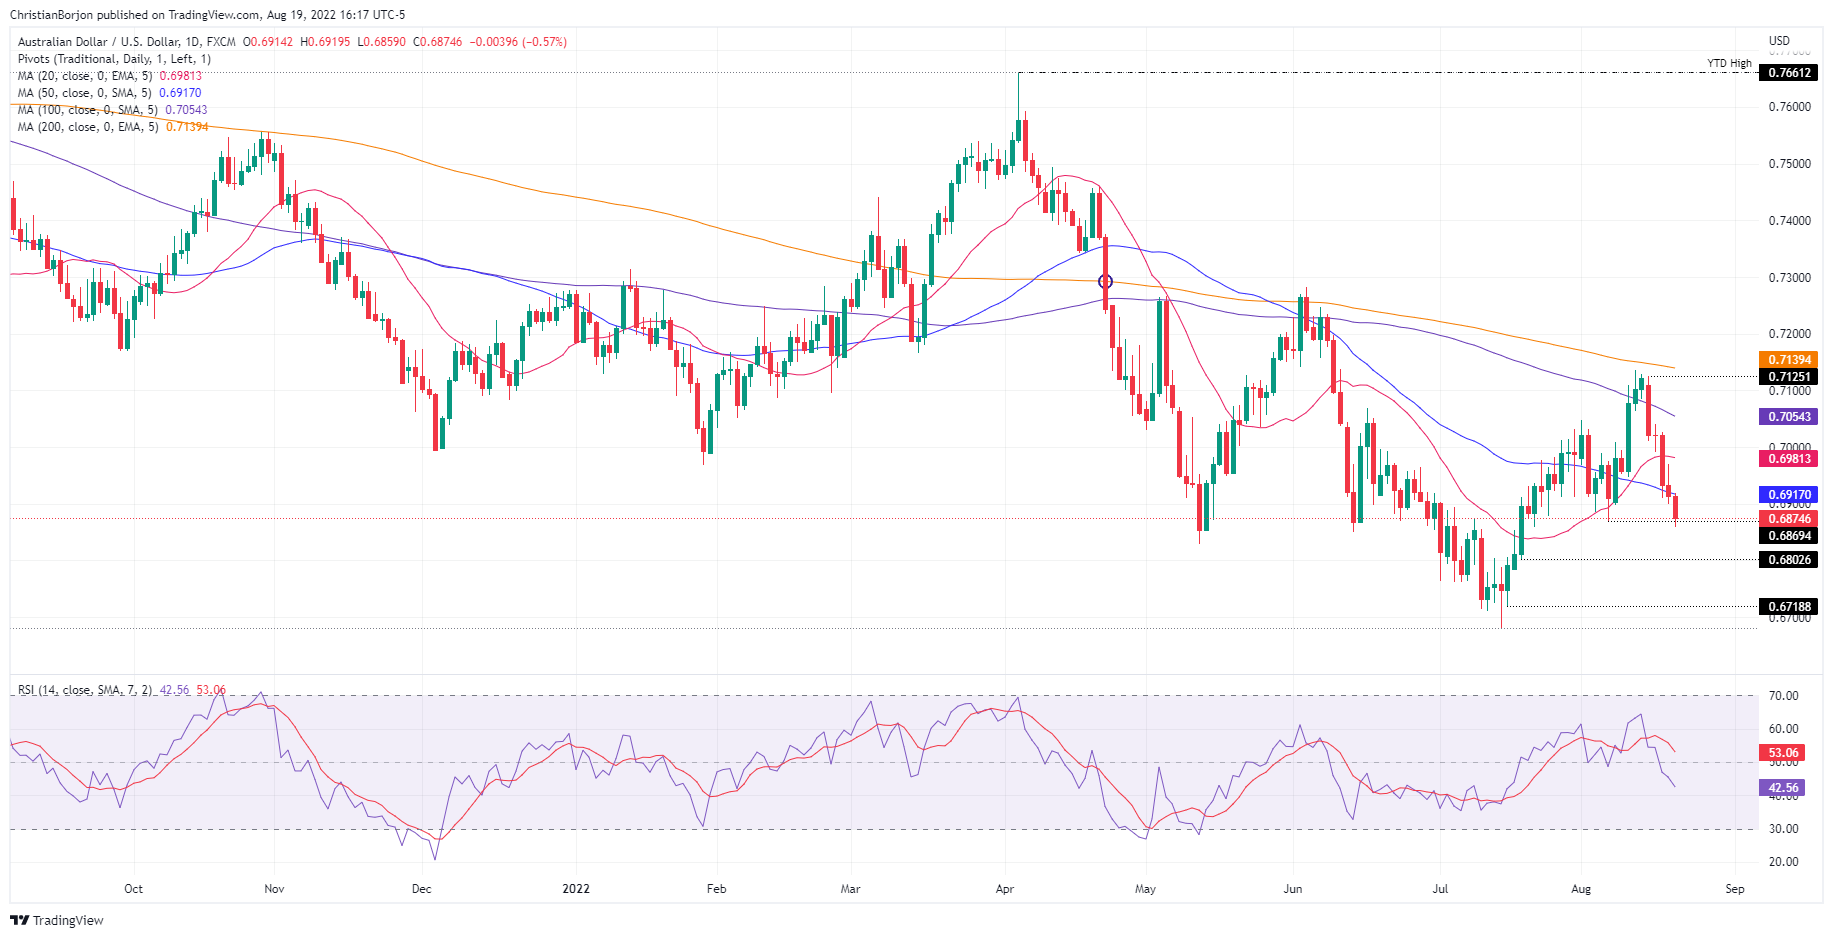 AUD/USD Daily chart
AUD/USD Key Technical Levels
20:42
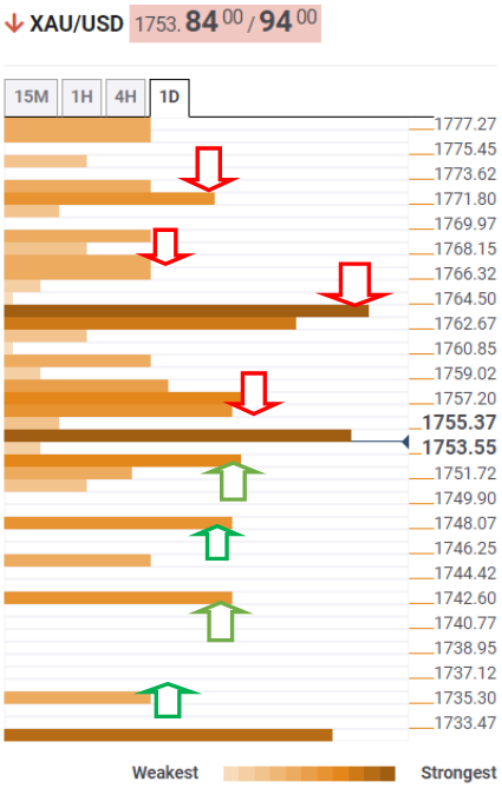
Gold Price Forecast: XAU/USD extended losses beyond $1750 as Jackson Hole looms
- The gold price plunged 3% in the week, despite investors' perceived dovishness of July’s FOMC minutes.
- US central bank policymakers continued their campaign against inflation, even though they acknowledged downside risks to growth.
- Gold Price Analysis (XAU/USD): Break below $1750 opened the door towards the $1711-$1739 range.
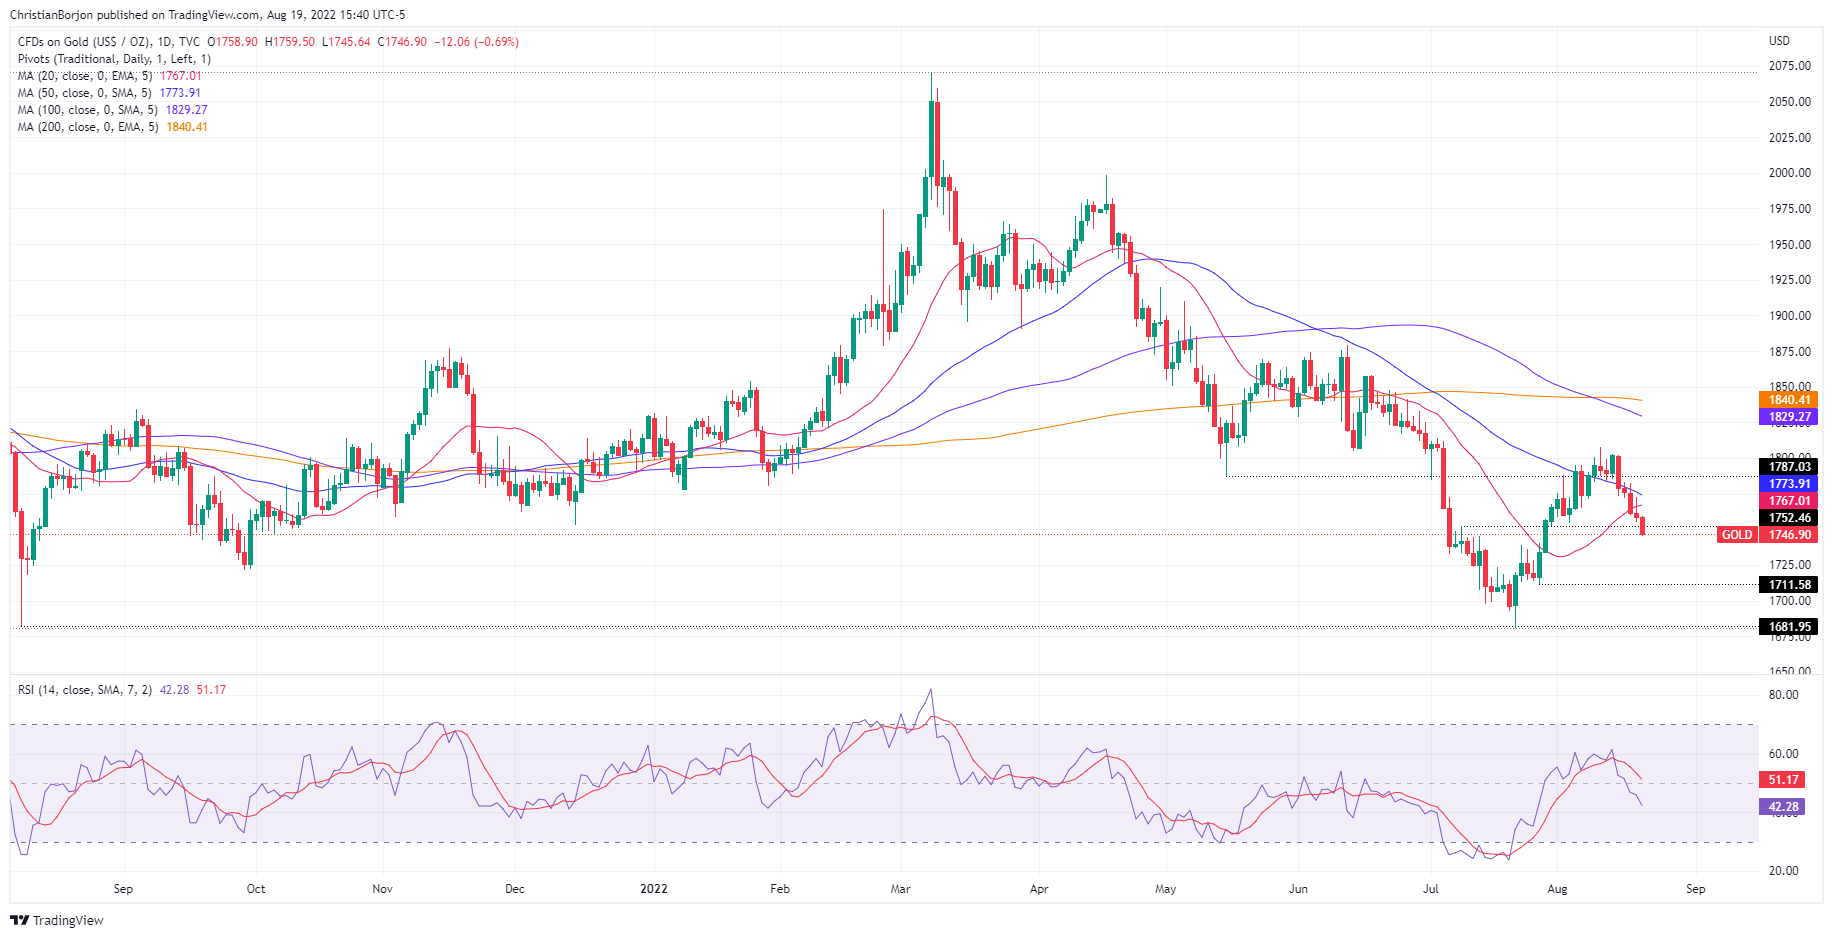
Gold price drops for the fifth-consecutive day, set to finish the week down by 3%, triggered by sentiment shifting sour, while the US dollar reaches a five-week high against a basket of currencies. At the time of writing, XAU/USD is trading at $1746.34 a troy ounce.
Gold price dropped on Fed aggression expectations
Wall Street is set to finish the week with losses. US Federal Reserve speakers throughout the week reiterated that inflation in the US is “too high,” despite acknowledging that July’s data was “encouraging.” However, even one of the most dovish, Kansas City Fed President Esther George, mentioned that further rate increases are needed, though the size of it is open to discussion.
It’s worth noting that XAU/USD prices could not rally, despite traders’ perception of “dovish” tilted FOMC minutes. However, since the last monetary policy meeting, Fed officials reiterated that bringing inflation down is the primary goal, despite worries about growth expressed by Minnesota’s Fed President Neil Kashkari. He commented that he’s unsure that the Fed could reach price stability’s goal without tapping the US economy into a recession.
In the meantime, the US Dollar Index finished the week up by 2.27%, at 108.078, a headwind for the yellow-metal dollar-denominated asset. Another factor that weighed on the gold price was US Treasury yields, led by the 10-year benchmark note rate, which added eight bps, finishing the week at 2.974%.
Back towards XAU/USD price action, spot prices tumbled since Wednesday, when the Fed released the FOMC’s minutes below the 20-day EMA at $1763.92, exacerbating the $14 fall below the $1750 mark by the end of the week.
Gold traders should be aware of critical economic data next week. The US economic docket will feature August’s S&P Global PMIs, Initial Jobless Claims for the week ending on August 19, the Fed’s favorite inflation gauge, PCE for July, and the Fed Jackson Hole Economic Symposium, where Fed Chair Jerome Powell will speak.
Gold Price Analysis (XAU/USD): Technical outlook
Gold price (XAU/USD) is downward biased. The break below July’s 8 high-turned-support at $1752.46 opened the door towards July’s 27 lows at $1711.58 as sellers prepare to attack the $1700 area. However, essential levels to the downside need to be broken by XAU/USD sellers, beginning with the top of a four-day trading range of $1739, followed by the bottom at $1711.58. Once both levels are cleared, a fall towards $1700 is on the cards.
19:03
United States Baker Hughes US Oil Rig Count remains unchanged at 601
19:01
EUR/GBP Price Analysis: Probing the 50-DMA at 0.8500 after a three-day rally
- EUR/GBP is set to finish the week with gains of 0.49%.
- Euro buyers stepped in around weekly lows below 0.8400, under the 20, 50, and 200-DMAs.
- A daily close above 0.8500 might open the door for a re-test of 0.8600.
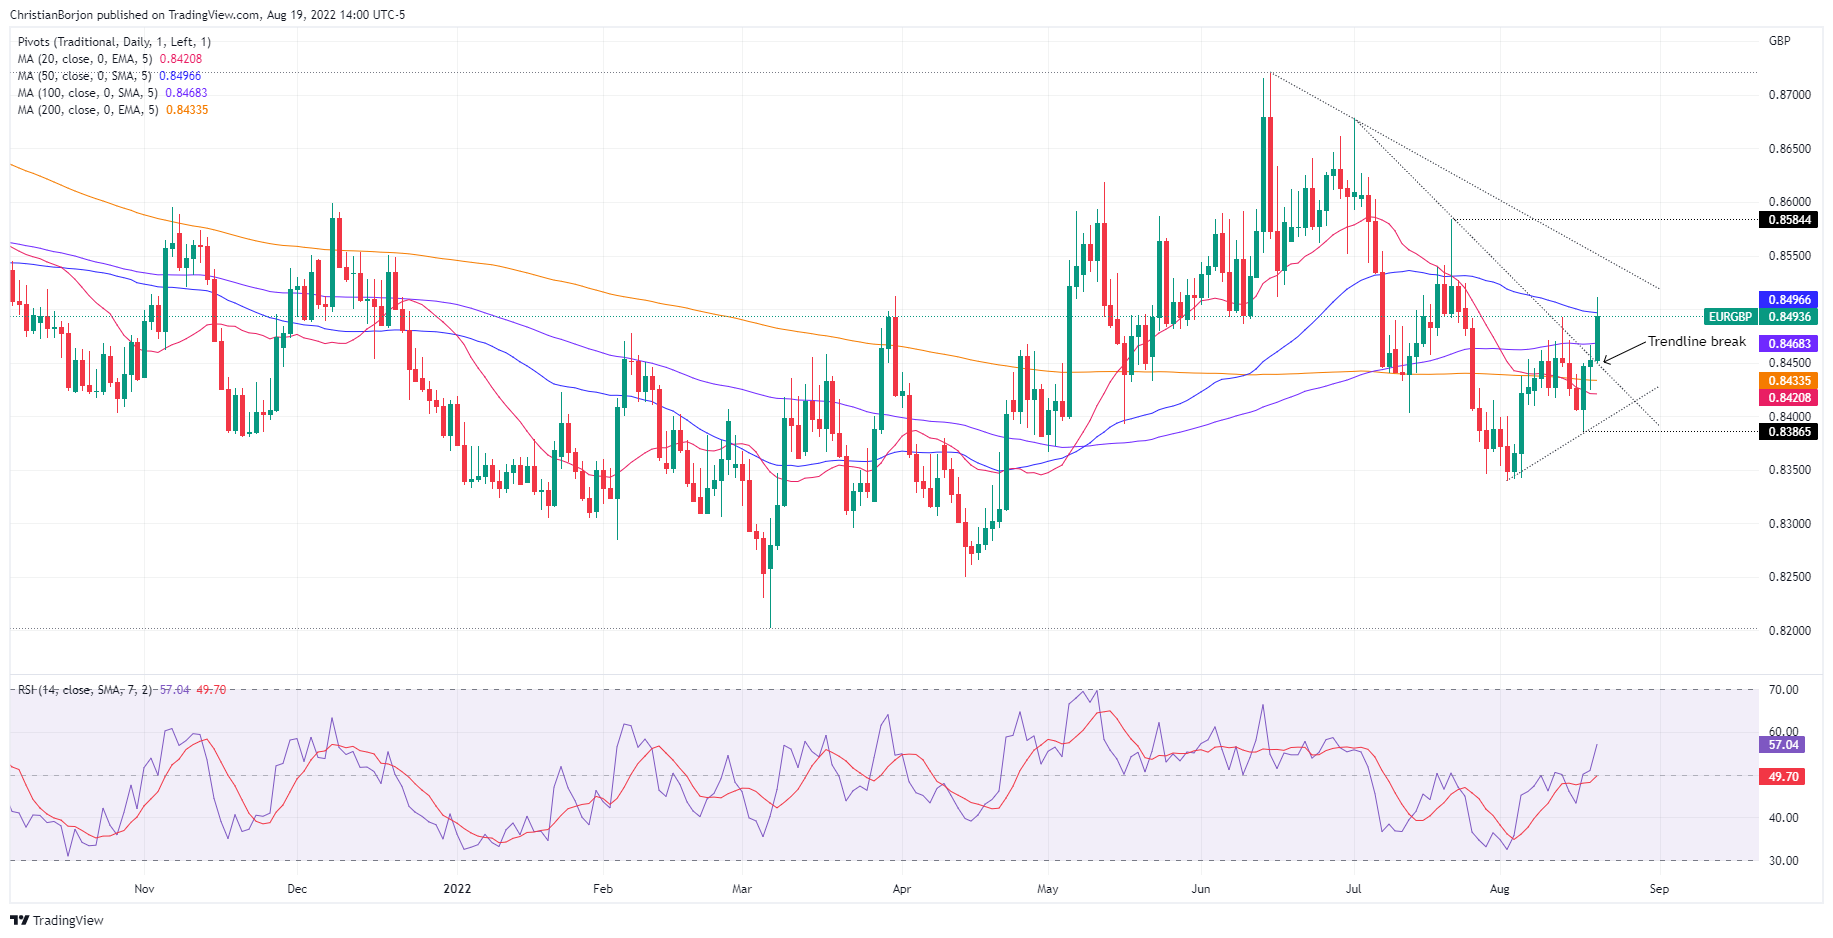
The EUR/GBP extended its rally to three consecutive days, breaking on its way north the 100-day EMA, though it struggled to get above the 50-day EMA after reaching a daily high at 0.8511. At the time of writing, the EUR/GBP is trading at 0.8493, above its opening price by 0.50%.
EUR/GBP Price Analysis: Technical outlook
From a daily chart perspective, the EUR/GBP shifted from neutral-downwards to neutral. In the last week, broad euro weakness tumbled the pair from current price levels towards 0.8400. However, EUR buyers stepped in around weekly lows at around 0.8386 and sent the cross-currency rallying toward the 0.8500 figure.
Worth noting that during the last three days, the EUR/GBP rally sparked a jump in the Relative Strength Index (RSI), a sign that momentum is on the side of buyers. Additionally, the break of a one-month-old downslope trendline around 0.8450 exacerbated a rally towards today’s high at 0.8511. So a break above the 0.8500 mark is on the cards.
Therefore, the EUR/GBP first resistance will be the confluence of the 50-day EMA at 0.8499 and the 0.8500 figure. Once cleared, the next stop will be Friday’s high at 0.8511, which, once broken, would aim towards a two-month-old downslope trendline around 0.8550 before climbing to the July 21 high at 0.8584.
 EUR/GBP Daily chart
EUR/GBP Key Technical Levels
18:27
USD/CHF Price Analysis: Climbs to fresh eight-day-highs, near 0.9600
USDCHF
- USD/CHF is registering a weekly gain of 1.86%, the biggest since June 2022.
- A break above 0.9600 could pave the way towards 0.9700.
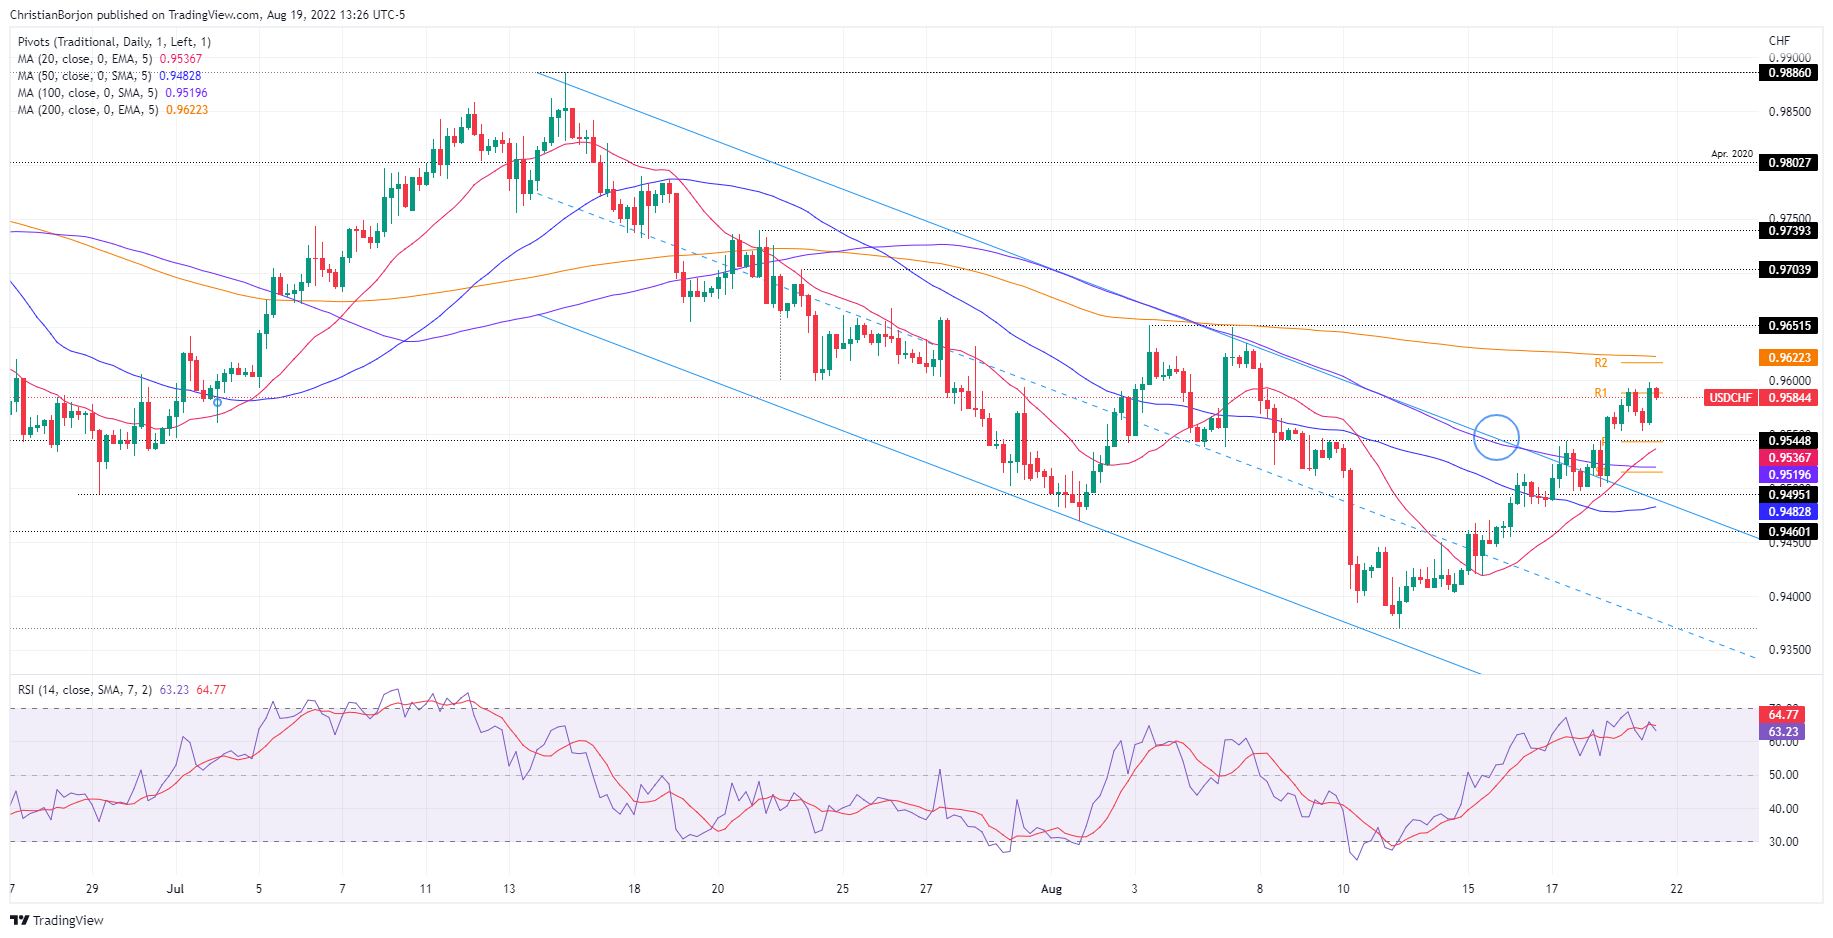
The USD/CHF advances for the six-straight day, on broad US dollar strength across the board, after breaking above the 20-day EMA at 0.9532 on Thursday. During the day, the USD/CHF hit a daily low at 0.9553, before climbing towards its daily high, shy of the 0.9600 figure, before settling at current exchange rates. At the time of writing, the USD/CHF is trading at 0.9587, up by 0.29%.
USD/CHF Price Analysis: Technical outlook
From a daily chart perspective, the USD/CHF is neutral-to-upward biased. Thursday’s break above a descending channel opened the door for a move to the confluence of the 50/100-day EMAs around 0.9635-41, but firstly USD/CHF buyers will need to reclaim the 0.9600 figure on their way north.
The four-hour scale shows the USD/CHF faced solid resistance at the R1 daily pivot nearby the 0.9600 figure before dipping towards 0.9553. However, buyers re-emerged at the latter, pushing prices higher, but as the end of the week looms, a break above 0.9600 is almost impossible to achieve.
If the above scenario plays out, the USD/CHF first supply zone would be the 200-EMA at 0..9622, followed by the August monthly high at 0.9651, followed by the July 22 high at 0.9704. On the flip side, the USD/CHF first support will be 0.9551. Break below will expose the 20-EMA at 0.9537, followed by the 100-EMA at 0.9515.
 USD/CHF 4-Hour chart
USD/CHF Key Technical Levels
17:10
EUR/USD grinds lower on a firm US dollar, risk-off impulse
EURUSD
- EUR/USD prepares to finish the week with hefty losses above 2%.
- Fed officials insist it’s not time to declare “victory” while adding that further rate hikes are coming.
- ECB Schnabel and Kazaks expect another rate hike in September.
The EUR/USD slides for the second consecutive day due to broad US dollar strength, courtesy of a dampened market mood spurred by Fed officials’ commentary, while US Treasury bond yield rise. At the time of writing, the EUR/USD is trading at 1.0035 below its opening price after hitting a daily high at 1.0095.
The EUR/USD reached a daily low at 1.0032, approaching parity again. The US Dollar Index, a gauge of the buck’s value vs. six peers, edges up almost 0.60%, sitting at 108.129, at six-week highs, while the US 10-year T-bond yields are up eight bps, at 2.978%.
EUR/USD drops on hawkish commentary
Fed officials are to blame for recent US dollar strength. On Friday, Richmond’s Fed Thomas Barkin said there’s a lot of time to decide on the size of the September meeting rate hike, adding that the Fed needs to move to restrictive territory. Barkin’s comments echoed Kansas City Fed George, who said that although July CPI data was “encouraging,” the case for further tightening remains strong,
Meanwhile, on the hawkish side, San Francisco’s Fed President Daly said that a 50 or 75 bps would be appropriate in the next meeting while pushing back against rate cuts in 2023. In the meantime, the St. Louis Fed James Bullard said the leans toward a 75 bps increase next month and stressed that it’s too soon to say inflation has peaked.
Minnesota’s Fed Neil Kashkari said that the Fed is committed to getting inflation under control, even though he’s unsure that the Fed can lower inflation without triggering a recession.
In the meantime, on the Eurozone side, the lack of economic releases on Friday left EUR/USD traders leaning towards ECB’s commentary, led by Schnabel. In an interview with Reuters, she said that “any decision is going to be taken on the basis of incoming data. If I look at the most recent data, I would say that the concerns we had in July have not been alleviated.” Echoing Schnabel's comments was ECB’s Kazaks, noting that “we will continue to increase rates” so as to prevent inflation from becoming entrenched.
Elsewhere, money market futures have fully priced a 50 bps Fed rate hike, while odds of a 75 bps lie at 82%. Across the pond, STIRs markets have been fully priced a 50 bps by the ECB.
What to watch
The Eurozone economic calendar will feature French and German S&P Global PMIs, and German IFOs report, which are expected soft. On the US front, the docket will feature S&P Global PMIs for August, claims for unemployment, the Fed Jackson Hole Economic Symposium, where Fed Chair Jerome Powell will speak, and the Fed’s favorite gauge of inflation, PCE for PCE July,
EUR/USD Key Technical Levels
16:25
USD/CAD: Despite CAD resilience this week, further weakness likely – Rabobank
USDCAD
The USD/CAD pair is about the end the week with a gain of more than 200 pips. Still, the loonie managed to rise sharply versus NZD and AUD. Analysts at MUFG Bank still see the USD/CAD moving further to the upside, on the back of a stronger US dollar. They have a target of 1.3420 and a stop-loss of 1.2600.
Key Quotes:
“Part of the resilience for CAD this week in depreciating less than the rest of G10 was due to the stronger underlying measures of inflation that helped fuel some increased pricing for rate hikes by the BoC.”
“The near-term outlook for crude oil remains poor with the slowdown in global growth weighing more heavily on the price of oil. In addition, there have been numerous reports indicating Russia ability to remain a key supplier of crude oil which has left the supply-demand balance globally less supportive for crude oil prices.”
“We also are wary of the impact of rate hikes becoming more evident in Canada more quickly given the leverage in Canada housing is higher.”
“The risk to this trade is a further rally in equity markets given the strong correlation between CAD and global equity market performance. While we do not expect a sharp reversal in equity markets over the short-term, but the general diminished optimism over inflation coming down suggests risks to the downside for equities are building.”
16:06
EUR/USD: Break below parity is likely, could trigger a plunge to 0.95 on a 1 to 3M view – Rabobank
EURUSD
The decline in EUR/USD during the current week has been a function of broad-based dollar strength, point out analysts at Rabobank. They see the euro vulnerable to increased concerns over energy supplies.
Key Quotes:
“We continue to see downside potential in EUR/USD as linked to distinct bullish USD and bearish EUR factors. The outlook for the Eurozone economy over the winter is undeniably linked to energy supply. It has been our central view for some months that the Eurozone economy will suffer a mild recession over the coming winter. This assumes some continuation of gas supply to end-users in the region. An outright energy shortage would clearly make the situation worse and at the same time could enhance the inflationary risks for the ECB. This is no longer a far-fetched prospect and is a scenario which would likely enhance downside pressure on EUR/USD.”
“More headwinds for this sector would clearly further worsen the outlook for growth. At the same time higher input prices could underpin inflationary pressures in the region. While this could result in a more hawkish-for-longer ECB, we would not expect this to be a supportive environment for the EUR.”
“Both Daly and the minutes of the Fed’s latest policy minutes have suggested that the Fed could favour a ‘raise and hold’ strategy, suggesting that rates could be higher for
longer through next year and beyond relative to the levels the market has been expecting. This is not good news for equity bulls; however, it is supportive for the medium-term outlook for the USD. We retain of the view that the USD will remain well supported against a broad base of currencies on a 6 month view. We see risk that a move below EUR/USD near-term could spark a plunge to 0.95.”
15:55
Canada: Retail sales remain resilient in June, weaker in July – CIBC
Data released on Friday showed retail sales in June rose surpassing expectations in Canada, although the preliminary data points to a decline in July. Analysts at CIBC continue to see the Bank of Canada rising rates by 75 basis points at the next meeting in September.
Key Quotes:
“With inflation running at a heady pace, nominal retail sales were once again stronger than expected in June, with headline sales growing 1.1%, much above the consensus expectations for a 0.4% gain. May was also revised up a tick. The advance largely reflected growth in gasoline prices, and the increase of 0.2% in volume terms looks far less impressive, though the positive growth is better than anticipated.”
“The advance estimate for July suggests a significant pull back of 2%, likely largely due to the drop in gasoline prices, a sign that if inflation does abate, Canadians might be looking to pocket some of that money rather than accelerate their purchase volumes. Still, for the second quarter, a healthy job market and return to greater activity outside the home meant that retail sales were up 13.6% quarter-over quarter annualized, or 3.5% in volume terms, providing a key source of support for GDP.”
“Retail sales remain more resilient than would have been expected given high inflation, rising interest rates and a shift to service consumption. With the June data, the second quarter as a whole posted strong growth in volume terms which supports our call for robust consumption growth in the quarter. The advance estimate for a decline in July provides some evidence that the expected shift away from goods consumption might finally materialize more meaningfully. The Bank of Canada should nevertheless remain on track for a 75 bps increase in September.”
15:46
GBP/USD nosedives towards 1.1810s on risk-off and buoyant US dollar
GBPUSD
- GBP/USD collapses to fresh six-week lows reached at 1.1791.
- Sentiment shifted sour as traders assessed recent Fed hawkish commentary.
- UK’s released data was mixed, with GfK consumer sentiment plunging, whereas Retail sales beat expectations.
The GBP/USD plunges in the North American session due to sentiment turning sour as traders reassess their reading of recent Fed hawkish commentary. Reflecting the previously mentioned, US bond Treasury yields are rising, the greenback is on its path to closing at a six-week high, and global equities are tumbling.
The GBP/USD is trading at 1.1812, after hitting a daily high at 1.1935 before plummeting towards the daily lows at 1.1791, though it remains trading below its opening price.
As previously mentioned, the British pound extends its losses, while the US Dollar Index, a gauge of the buck’s value vs. its counterparts, rallies 0.67%, up at 108.211. At the same time, the US 10-year bond yield climbs ten bps to 2.994%.
The lack of US economic data released on Friday keeps market players digesting Fed commentary. July’s FOMC monetary policy minutes were initially misread by traders, which sent US equities rallying sharply, even though Fed officials reiterated on several occasions that “inflation is too high” and that it’s premature to declare “victory.”
Richmond’s Fed Thomas Barkin said that reduction of the balance sheet should add to tighter financial conditions. He commented that data on the economy has been robust, and the job market seems healthy as it does core retail sales and industrial production.
On Thursday, San Francisco’s Fed President Daly said that a 50 or 75 bps would be appropriate in the next meeting while adding, “I really think of the raise-and-hold strategy as one that has historically paid off for us,” pushing back against rate cuts in 2023. Meanwhile, Kansas Citi Fed George said that although July CPI data was “encouraging,” the case for further tightening remains strong.
Later the St. Louis Fed James Bullard said the leans toward a 75 bps increase next month and stressed that it’s too soon to say inflation has peaked; while Minnesota’s Fed Neil Kashkari said that the Fed is committed to getting inflation under control, even though he’s unsure that the Fed can lower inflation without triggering a recession.
On the UK side, economic data was mixed. UK Retail sales surprised to the upside, up in July by 0.3% MoM, contrary to expectations for a 0.2% drop. However, over three months to July, sales fell 1.2% and, annually, dropped 3.4%.
Earlier, the GfK Consumer confidence printed a dismal reading for July at -44 vs. estimations of -42, as UK’s citizens have to cope living with household energy bills twice as higher than the last year, which will increase in October.
What to watch
Next week, the UK calendar will unveil August’s S&P Global/CIPS PMIs. On the US front, the economic docket will feature S&P Global PMIs for August, claims for unemployment, the Fed Jackson Hole Economic Symposium, where Fed Chair Jerome Powell will speak, and the Fed’s favorite gauge of inflation, PCE for July,
GBP/USD Key Technical Levels
15:41
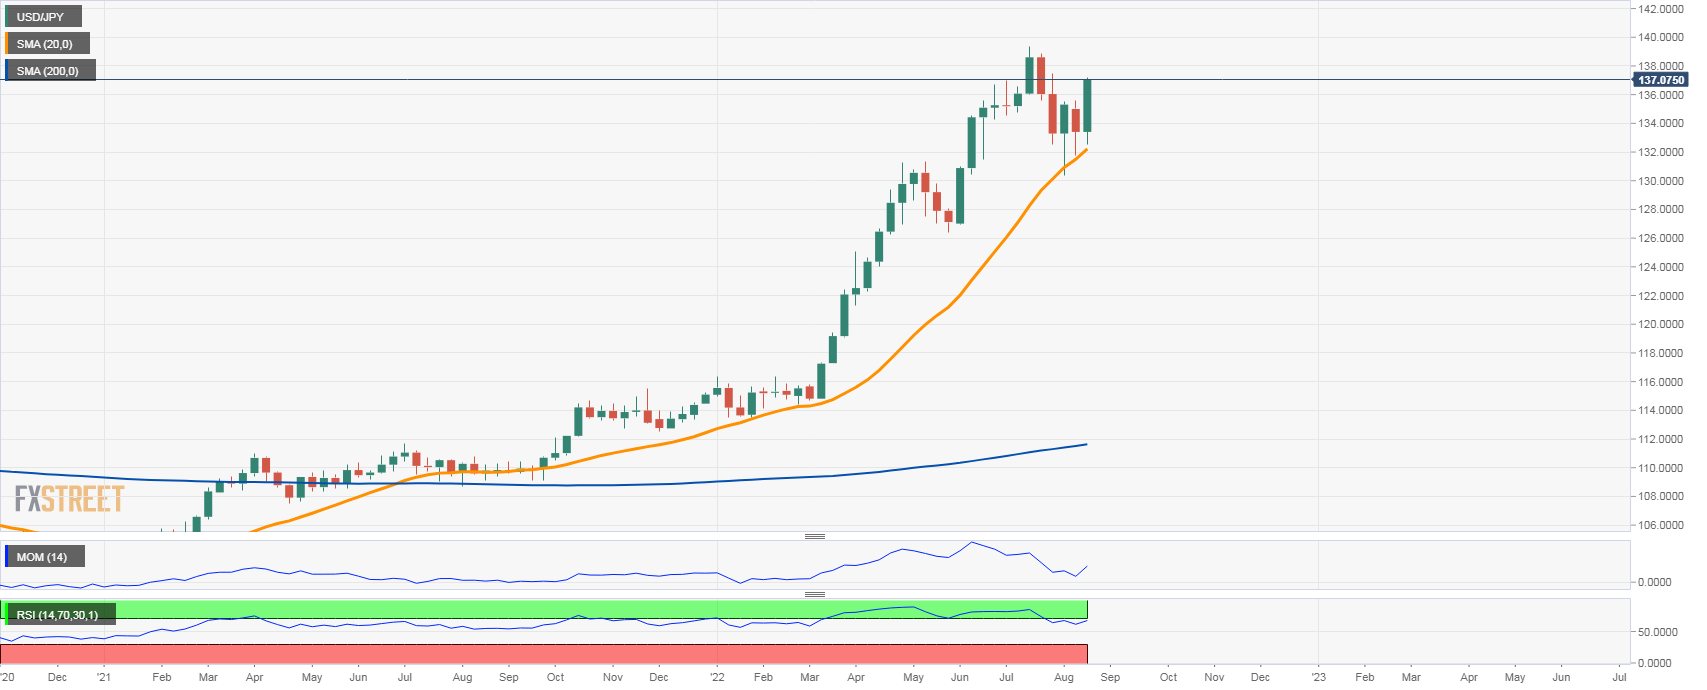
USD/JPY hits three-week highs above 137.00, extends weekly gains to more than 350 pips
- Japanese yen is among the worst performers on Friday amid high yields.
- US dollar holds onto strong weekly gains amid Fed exceptions.
- USD/JPY heads for the second highest weekly close in decades.
The USD/JPY rose further during the American session and climbed to 137.23, reaching the highest level in three weeks. The pair remains near the highs holding onto strong weekly gains.
The Japanese yen is falling across the board on Friday while the US dollar is stronger. Higher yields weighed on JPY that failed to benefit from risk aversion. The Dow Jones is falling 0.88% and the Nasdaq 2.09%.
The greenback, measured by the DXY trades at one-month highs above 108.00, up 0.56% for the day supported by expectations about the Federal Reserve. Market participants continue to see more rate hikes after the latest round of economic data and following the FOMC minutes.
Uptrend intact
From a week ago, USD/JPY is up by more than 350 pips. It is about to post the second highest close in decades. The bullish long-term trend stays intact. The next resistance is seen at 137.80 followed by 138.80, the multi-year high at 139.40 and then attention would turn to 140.00.
The weekly chart shows the pair found support above the 20-week Simple Moving Average, currently at 132.00. A close below should point to a weaker dollar. While above, the bias is to the upside.
USD/JPY weekly chart
15:22
Fed's Barkin: A lot of time still before deciding on size of September rate hike
Richmond Federal Reserve Bank President Thomas Barkin said on Friday that FOMC policymakers had "a lot of times still" before they decide on the size of the September rate increase, as reported by Reuters.
Additional takeaways
"Fed will need to move rates to restrictive territory but will take signal from the economy on how high that needs to be."
"At this point, underlying demand seems stronger than it did as of the last Fed meeting."
"A lot of the recent decline in core inflation was due to volatile items."
"Expect poor productivity results to change through revisions to GDP, jobs."
Fed is now balancing urge to get where it needs to go on rates against uncertainty over the impact on the economy."
Market reaction
The dollar rally continues after these comments and the US Dollar Index was last seen rising 0.7% on the day at 108.20.
15:00
Brent Oil forecasts revised lower to $100 by Q3 and $97 by Q4 – ING
Sticky Russian oil output requires a crude rethink. Strategists at ING have revised their forecasts lower.
Oil prices will remain elevated
“Stubborn Russian oil output and weaker than expected demand growth mean the oil market is likely to remain in surplus for the remainder of this year and into early next year, which should limit the upside in oil prices.”
“Limited OPEC spare capacity and uncertainty over how Russian flows will evolve once the EU ban comes into full force should also limit downside in the medium-term.”
“We have lowered our Q322 and Q422 Brent forecasts from $118/bbl and $125/bbl to $100/bbl and $97/bbl respectively. Our full year 2023 Brent forecast has been revised down from $99/bl to $97/bbl.”
13:59
Gold Price Forecast: XAU/USD seems vulnerable near three-week low amid rising USD, bond yields
- Gold continues losing ground for the fifth successive day and drops to a multi-week low.
- Hawkish Fed expectations, surging US bond yields, sustained USD buying exert pressure.
- Recession fears, the risk-off impulse fail to impress bulls or lend any support to the metal.
Gold prolongs this week's bearish trend for the fifth successive day and drops to a three-week low on Friday. The XAU/USD remains depressed through the early North American session and is currently placed near the $1,750 level, down nearly 0.40% for the day.
Worries about a global economic downturn triggered a fresh wave of the global risk-aversion trade on the last day of the week. This is evident from a generally weaker tone around the equity markets, which turns out to be a key factor that offers some support to the safe-haven precious metal. That said, an extension of the recent US dollar rally keeps a lid on the attempted intraday recovery for the dollar-denominated gold.
In fact, the USD Index (DXY), which tracks the greenback's performance against a basket of currencies, shot to a one-month high amid hawkish Fed expectations. The FOMC minutes released on Wednesday indicated that policymakers remain committed to raising interest rates to tame inflation. Furthermore, the recent comments by several Fed officials suggested that the US central bank would stick to its policy tightening path.
Adding to this, the incoming better-than-expected US macroeconomic data reaffirmed markets, which, in turn, leads to a further rise in the US Treasury bond yields. In fact, the yield on the benchmark 10-year US government bond climbs back closer to the 3.0% threshold. This, in turn, continues to underpin the greenback and further contributes to driving flows away from the non-yielding yellow metal, favouring bearish traders.
Even from a technical perspective, the recent repeated failures near the $1,800 mark and a subsequent fall below the previous monthly low, around the $1,754 area adds credence to the negative outlook. This, in turn, suggest that the path of least resistance for gold is to the downside. Nevertheless, the metal remains on track to register heavy weekly losses and snap a four-week winning streak to over a one-month high.
Technical levels to watch
13:30
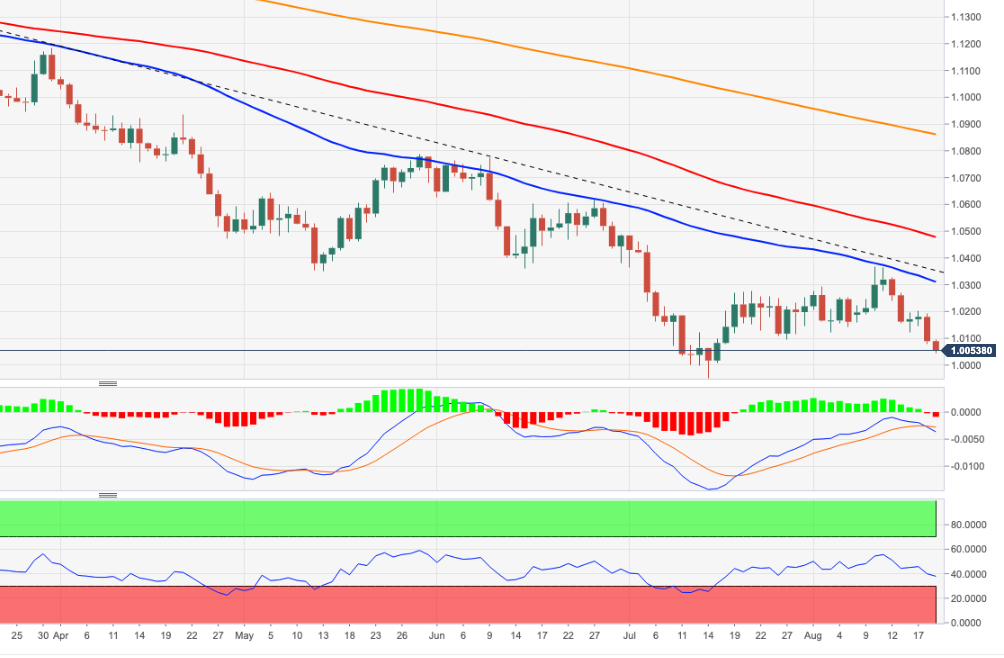
EUR/USD Price Analysis: A drop to the parity level emerges on the horizon
EURUSD
- EUR/USD extends the decline to the 1.0050/45 band.
- Next on the downside appears a potential test of the parity zone.
EUR/USD adds to the recent weakness and extends the breach of the 1.0100 level at the end of the week.
Further losses appear on the cards as well as a probable visit to the parity level in the short-term horizon. The loss of this key support zone could expose a deeper retracement to the YTD low at 0.9952 (July 14).
In the longer run, the pair’s bearish view is expected to prevail as long as it trades below the 200-day SMA at 1.0859.
EUR/USD daily chart
13:22
Fed's Barkin: Fed will do what it takes to return inflation to target
Richmond Fed President Thomas Barkin reiterated on Friday that the Fed will do what it takes to return inflation target but acknowledged that this will not happen immediately, as reported by Reuters.
"We are starting to see some precautionary softening in business investment," Barkin added. "Returning to normal does not require a calamitous drop in economic activity."
Market reaction
The US Dollar Index edged higher on these comments and was last seen rising 0.45% on a daily basis at 107.97.
13:19
USD/CAD Price Analysis: Faces rejection near 1.3000 mark, bullish potential intact
USDCAD
- USD/CAD eases from a one-month high following the release of upbeat Canadian Retail Sales.
- Weaker crude oil prices could undermine the loonie and offer support amid a stronger greenback.
- The technical set-up favours bullish traders and supports prospects for further near-term gains.
The USD/CAD pair climbs to a one-month high during the early North American session, albeit struggles to capitalize on the move beyond the 1.3000 psychological mark. The pair trims a part of its intraday gains and is currently placed around the 1.2980-1.2975 region, still up over 0.20% for the day.
The upbeat Canadian Retail Sales figures for June offer some support to the domestic currency and act as a headwind for spot prices. That said, a weaker tone around crude oil prices should keep a lid on any meaningful upside for the commodity-linked loonie. Apart from this, the ongoing US dollar rally to its highest level since mid-July favours bullish traders and supports prospects for a further appreciating move for the USD/CAD pair.
From a technical perspective, the overnight move beyond the 1.2980-1.2985 hurdle, which coincided with the 50% Fibonacci retracement level of the July-August downfall, adds credence to the positive outlook. Furthermore, oscillators on the daily chart have just started moving into bullish territory. This, in turn, suggests that the path of least resistance for the USD/CAD pair is to the upside and dips are likely to get bought into.
Traders, however, might now wait for sustained strength beyond the 1.3000 mark before placing fresh bullish bets. The USD/CAD pair could then climb to the 61.8% Fibo. level, around the 1.3035 zone and extend the momentum further towards the next relevant hurdle near the 1.3080 area. Some follow-through buying, leading to a subsequent move above the 1.3100 mark, would mark a fresh breakout and pave the way for additional gains.
On the flip side, the 1.2930-1.2920 resistance breakpoint (38.2% Fibo. level) now seems to protect the immediate downside ahead of the 1.2900 round-figure mark. Any further decline is more likely to find decent support and remain limited near the 23.6% Fibo. level, around the 1.2845-1.2840 region. Failure to defend the said support level would negate any near-term positive bias and turn the USD/CAD pair vulnerable to slide further.
The downward trajectory could then drag spot prices to the 1.2800 round-figure mark en route to the very important 200 DMA support, currently near the 1.2755 region. This is followed by the monthly low, around the 1.2730-1.2725 region, which should act as a pivotal point. A convincing break below would be seen as a fresh trigger for bears.
USD/CAD daily chart
-637965118347899022.png)
Key levels to watch
13:11
Gold Price Forecast: Appetite in XAU/SUD to dry up as expectations for rate cuts subside – TDS
Gold price is consolidating the downside. Re-pricing of Fed expectations are set to drive the market, with eyes on Jackson Hole Symposium scheduled next week, economists at TD Securities report.
All eyes are on the Jackson Hole symposium
“Chair Powell's remarks next week could be a key avenue for the Fed to push back against the notable easing in financial conditions sparked by his last remarks, which has seen markets price-in rate cuts immediately following the rate hiking cycle, and is likely to be inconsistent with the Fed's inflation mandate.”
“As market expectations for rate cuts subside, speculative appetite in precious metals should dry up even further.”
12:58
US Dollar Index Price Analysis: Rising bets for a test of 2022 highs
- DXY clinches new highs just above the 108.00 mark.
- There is now scope for a move to the 2022 high past 109.00.
DXY is up for the third session in a row and prints new multi-week tops just north of the 108.00 hurdle on Friday.
The continuation of the upside momentum is now expected to target the YTD high at 109.29 (July 14) ahead of the September 2002 high at 109.77. Up from here emerges the round level at 110.00.
In the meantime, the 6-month support line continues hold the upside around 104.90. Above this zone, the index is expected to keep the short-term positive stance.
Looking at the long-term scenario, the bullish view in the dollar remains in place while above the 200-day SMA at 100.35.
DXY daily chart
12:40
AUD/USD Price Analysis: Bears have the upper hand below 0.6900 mark/50% Fibo.
AUDUSD
- AUD/USD drops to a two-week low on Friday amid strong follow-through USD buying.
- The risk-off impulse exerts additional downward pressure on the risk-sensitive aussie.
- Bearish traders now await weakness below the monthly low before placing fresh bets.
The AUD/USD pair extends its recent sharp rejection slide from a technically significant 200-day SMA and drifts lower for the fifth successive day on Friday. The downward trajectory drags spot prices to a two-week low, around the 0.6875 region during the mid-European session.
The US dollar prolongs its bullish trend witnessed over the past one-and-a-half week or so and climbs to a one-month high on the last day of the week. This turns out to be a key factor that continues to exert downward pressure on the AUD/USD pair. Adding to this, recession fears trigger a fresh wave of the global risk-aversion trade and further contribute to driving flows away from the perceived riskier aussie.
From a technical perspective, acceptance below the 50% Fibonacci retracement level of the July-August recovery move from over two-year low favour bearish traders. The negative outlook is reinforced by bearish oscillators on the daily chart, which are still far from being in the oversold territory. That said, failure to find acceptance below the 50-day SMA warrants some caution before positioning for a further slide.
Hence, some follow-through selling below the monthly swing low, around the 0.6870-0.6865 region, which coincides with the 61.8% Fibo. level, is needed to confirm a fresh bearish breakdown. The AUD/USD pair might then test the 0.6800 mark and eventually drop to the 0.6765 horizontal zone. The bearish trend could extend towards the 0.6700 round figure en-route the YTD low, around the 0.6680 region touched on July 14.
On the flip side, any meaningful recovery above the 50% Fibo. level could now be seen as a selling opportunity and remain capped near the overnight swing high, around the 0.6970 area. The latter coincides with the 38.2% Fibo. level and is followed by the 0.7000 psychological mark. A convincing break through the said barriers would negate the near-term negative outlook and trigger a short-covering move.
AUD/USD daily chart
-637965094149259894.png)
Key levels to watch
12:36
Canada: Retail Sales rise by 1.1% in May vs. 0.3% expected
- Retail Sales in Canada grew at a stronger pace than expected in June.
- USD/CAD trades in the positive territory slightly below 1.3000.
Retail Sales in Canada rose by 1.1% on a monthly basis in June following May's increase of 2.3% (revised from 2.2%), the data published by Statistics Canada revealed on Friday. This reading came in better than the market expectation for a growth of 0.3%.
Further detail of the publication revealed that Retail Sales in July are expected to decline by 0.2%.
Market reaction
With the initial reaction, USD/CAD edged slightly lower from the monthly high it touched at 1.3004 earlier in the day. As of writing, the pair was still up 0.3% on the day at 1.2985.
12:30
Canada Retail Sales ex Autos (MoM) came in at 0.8%, below expectations (0.9%) in June
12:30
Canada Retail Sales (MoM) registered at 1.1% above expectations (0.3%) in June
12:28
Sterling likely to fall further – SocGen
GBP/USD has neared the 1.18 level while EUR/GBP has hit 0.85. Kit Juckes, Chief Global FX Strategist at Société Générale, believes that the British pound is set to sustain further losses.
Tighten too much, or watch the pound fall?
“Sterling’s likely to fall further as growth slows, even if rates rise more than they ought to. Tightening less would weaken the currency further.”
“The only way of keeping inflation expectations firmly anchored might be to force central banks who miss their targets to lose their jobs. But that would simply reinforce the tendency to go on tightening too far into the cycle and ensure that it ends with recession rather than soft landing. Maybe the only answer is to teach the public about the importance of lags…”
12:14
USD/TRY to advance well beyond the 18 mark – SocGen
On Thursday, the Central Bank of the Republic of Turkey (CBRT) cut rates from 14% to 13%. USD/TRY is trading above the 18 level and Kit Juckes, Chief Global FX Strategist at Société Générale, expects the pair to enjoy further gains.
Higher inflation
“With inflation just below 80%, it’s no surprise that USD/TRY is above 18 this morning and we expect it to go higher still. Which will help keep inflation up...”
“The CBRT’s problem is that with no credibility, their agreements may be right, but the lira’s fall will make a nonsense of them anyway.”
12:08
Oil: Renewal of the nuclear agreement argues against a noticeable recovery – Commerzbank
Brent Oil has dropped to a six-month low this week. Any recovery in oil prices is unlikely, in the opinion of economists at Commerzbank.
Oil prices should see their downward trend flatten out
“For one thing, fears of recession in the industrialised countries have been joined by serious concerns about China’s economy. And for another, a renewal of the nuclear agreement with Iran, which would involve sanctions being lifted, has probably never been within such tangible reach before.”
“Though oil prices should see their downward trend flatten out, a noticeable price recovery would probably only be triggered if the US were to reject a renewal of the nuclear agreement.”
12:00
Gold Price Forecast: XAU/USD is not exactly shining at the moment – Commerzbank
Gold price has dropped back to $1,750, its lowest level since the end of July. Strategists at Commerzbank highlight the issues of the yellow metal to see gains.
Gold fails to profit from robust demand
“The pronounced fall in the gold price during the course of the month is likely to have generated additional buying interest. Furthermore, stocks need to be replenished following months of subdued imports. It is doubtful whether the gold price will be able to capitalise on this, however.”
“The Chinese purchases are being offset by persistent outflows from the gold ETFs.”
“The prospect of further tightening of monetary policy and a firmer US dollar until at least the end of the year continues to weigh on the gold price trend.”
11:31
India FX Reserves, USD dipped from previous $572.98B to $570.74B in August 12
11:20
EUR/JPY Price Analysis: Further upside could retest the 55-day SMA
EURJPY
- EUR/JPY looks offered after two daily advances in a row.
- Next on the upside appears the August top at 138.40.
EUR/JPY extends the weekly recovery and already flirts with the 138.00 neighbourhood on Friday.
If the cross clears the so far August high at 138.39 (August 10) it should allow for gains to accelerate further and revisit the temporary barrier at the 55-day SMA, today at 139.44.
While above the 200-day SMA at 134.05, the prospects for the pair should remain constructive.
EUR/JPY daily chart
11:00
Mexico Retail Sales (YoY) below expectations (5%) in June: Actual (4%)
11:00
Mexico Retail Sales (MoM) registered at -0.3% above expectations (-1.1%) in June
10:59
When is Canadian monthly Retail Sales report and how could the data affect USD/CAD?
Canadian Retail Sales Overview
Statistics Canada is scheduled to publish the monthly Retail Sales figures for June later this Friday at 12:30 GMT. The headline sales are estimated to register a modest rise of 0.3% during the reported month, down sharply from the 2.2% growth recorded in May. Excluding autos, core retail sales probably climbed by 0.9% in June against the 1.9% increase in the previous month.
According to Jing Ren, Analyst Orbex, Canada's figures aren't adjusted for inflation and the expected fall would reflect the improving inflation situation. “Annual retail sales are expected to have grown 9% compared to 14.1% in the prior report. Again, the annual comparables likely due more to covid effects last year, than the current situation,” Jing explains further.
How Could it Affect USD/CAD?
Ahead of the key release, a fresh leg down in crude oil prices undermined the commodity-linked loonie. This, along with sustained US dollar buying, lifts the USD/CAD pair to a one-month high, closer to the 1.3000 psychological mark. The data, meanwhile, might do little to provide any respite to the Canadian dollar, though a significant divergence from the expected readings could still infuse some volatility.
Disappointing domestic data would be enough to exert additional pressure on the Canadian dollar and lift the USD/CAD pair towards the next relevant hurdle near the 1.3035 zone. The momentum could further get extended to the 1.3080 horizontal level en route to the 1.3100 round-figure and the recent daily closing highs, around the 1.3115 region.
Conversely, a stronger reading could offer some support to the CAD, though the immediate reaction is likely to be short-lived amid the underlying bearish sentiment around crude oil prices. Hence, any meaningful pullback is more likely to find decent support near the 1.2935-1.2925 strong resistance breakpoint. Some follow-through selling could drag the USD/CAD pair further below the 1.2900 mark, though the downside is likely to remain limited near the 1.2845-1.2840 zone.
Key Notes
• USD/CAD marches towards 1.3000 as yields propel DXY, oil eases ahead of Canada Retail Sales
• USD/CAD Forecast: Bulls look to seize control near 50% Fibo., move beyond monthly peak awaited
• USD/CAD Price Analysis: Further upside hinges on 1.2980 breakout
About Canadian Retail Sales
The Retail Sales released by the Statistics Canada is a monthly data that shows all goods sold by retailers based on a sampling of retail stores of different types and sizes. The retail sales index is often taken as an indicator of consumer confidence. It shows the performance of the retail sector in the short term. Generally speaking, the positive economic growth anticipates bullish movements for the CAD.
10:21
NZD/USD dives to 0.6200 neighbourhood, fresh monthly low amid stronger USD/risk-off
- NZD/USD continues losing ground for the fifth straight day and drops closer to the monthly low.
- Hawkish Fed expectations, rising US bond yields underpin the USD and exert pressure on the pair.
- Recession fears also benefit the safe-haven buck and drive flows away from the risk-sensitive kiwi.
The NZD/USD pair remains under heavy selling pressure for the fifth successive day on Friday and drops to a fresh monthly low during the first half of the European session. The pair has now retreated over 250 pips from a two-month high touched last week and is currently placed just above the 0.6200 round-figure mark.
The US dollar buying remains unabated on the last day of the week and turns out to be a key factor that continues to exert downward pressure on the NZD/USD pair. In fact, the USD Index (DXY), which tracks the greenback against a basket of six other currencies, climbs to a one-month high amid expectations that the Fed would stick to its policy tightening path.
The bets were reaffirmed by the recent hawkish comments by Fed officials and the incoming positive US macroeconomic releases. This, in turn, remains supportive of a further rise in the US Treasury bond yields. Apart from this, the risk-off impulse - amid growing recession fears, is underpinning the safe-haven buck and driving flows away from the risk-sensitive kiwi.
The combination of the aforementioned factors offset the Reserve Bank of New Zealand's fourth 50 bps rate hike on Wednesday and the outlook to bring forward the timing of further rate increases. Even hawkish remarks by RBBZ Governor Adrian Orr fail to impress bulls or ease the bearish pressure, suggesting that the path of least resistance for the NZD/USD pair is to the downside.
There isn't any major market-moving economic data due for release from the US on Friday, leaving the USD at the mercy of the US bond yields. Apart from this, the broader risk sentiment would be looked upon to grab short-term opportunities around the NZD/USD pair. Nevertheless, spot prices remain on track to register heavy weekly losses and seem vulnerable to decline further.
Technical levels to watch
10:19
Portugal Current Account Balance: €-4.08B (June) vs previous €-3.996B
09:48
USD/CHF eases from two-week high, fails ahead of 0.9600 mark amid risk-off mood
- USD/CHF gains traction for the fifth straight day and climbs to a nearly two-week high.
- Hawkish Fed expectations, rising US bond yields boost the USD and remain supportive.
- The risk-off mood underpins the safe-haven CHF and cap gains, only for the time being.
The USD/CHF pair extends this week's positive move for the fifth successive day and climbs to a nearly two-week high during the first half of the European session. The intraday positive move, however, stalls just ahead of the 0.9600 mark amid the prevalent risk-off mood, which tends to benefit the safe-haven Swiss franc.
Growing worries about a global economic downturn continue to weigh on investors' sentiment, which is evident from a generally weaker tone around the equity markets. This, in turn, drives some haven flows towards the CHF and acts as a headwind for the USD/CHF pair. That said, haven flows also support the US dollar and sustained buying favours bullish traders.
In fact, the USD Index (DXY), which tracks the greenback's performance against a basket of currencies, climbs to its highest level since July 18 and remains well supported by hawkish Fed expectations. The markets seem convinced that the Fed will stick to its policy tightening cycle. The recent comments by several Fed officials and the incoming positive US macro data reaffirm market bets.
This, in turn, pushes the yield on the benchmark 10-year US government bond back closer to the 3.0% threshold and should continue to act as a tailwind for the greenback. The fundamental backdrop suggests that the path of least resistance for the USD/CHF pair is to the upside. Hence, any meaningful pullback could be seen as a buying opportunity and remain limited.
In the absence of any major market moving economic releases from the US, the US bond yields will drive the USD demand. Apart from this, the broader risk sentiment could produce some trading opportunities around the USD/CHF pair. Nevertheless, spot prices remain on track to register strong weekly gains and reverse a major part of last week's slide to a four-month low.
Technical levels to watch
09:21
Gold Price Forecast: XAU/USD eyes additional declines towards $1,735 – Confluence Detector
- Gold price is consolidating the downside before resuming the next downswing.
- The US dollar remains favored amid hawkish Fedspeak, firmer yields and risk-aversion.
- XAU/USD bears keep their sight on $1,735 below a sustained break of the $1,750 mark.
Gold price remains exposed to further downside risks amid notable US dollar demand so far this Friday. The greenback continues to build onto its recovery rally, helped by risk-averse market conditions amid mounting recession fears. The global bond market sell-off extends, as the central banks are likely to stick to their tightening path, in the face of raging inflation. The resultant spike in the Treasury yields is also boding well for the greenback while weighing down on the non-interest-bearing gold. The recent uptick in the buck has been triggered by the hawkish Fed commentary, as they continue to back a restrictive monetary policy until they are convinced that inflation has come down. Looking ahead, in absence of any top-tier US economic events, the repricing of Fed expectations and the end-of-the-week flows will play a pivotal role in the XAU/USD price action. All eyes now turn towards the Fed’s Jackson Hole Symposium next week.
Also read: Gold Price Forecast: XAU/USD bears aiming for $1,700, as focus shifts to Jackson Hole
Gold Price: Key levels to watch
The Technical Confluence Detector shows that the gold price is yearning for a big break below the crucial support at around $1,750. At that level, the pivot point one-day S1, SMA200 four hour and the Bollinger Band four-hour Lower converge.
The further downside will open up towards the Fibonacci 161.8% one-week at $1,748. The next key support will be seen at the pivot point one-week S3 of $1,743.
A sustained move below the latter is critical to initiating a fresh decline towards $1,735, the pivot point one-day S3.
On the flip side, bulls need to clear the immediate resistance around $1,754-$1,755, where the previous day’s low meets with the pivot point one-week S2 and the SMA5 four-hour.
The next powerful upside hurdle is aligned at $1,763, the confluence of the Fibonacci 38.2% one-day, Fibonacci 61.8% one-month and SMA50 one-hour.
Further up, the Bollinger Band one-day Middle at $1,767 will challenge bearish commitments. The previous week’s low at $1,771 will be the last line of defense for XAU sellers.
Here is how it looks on the tool
About Technical Confluences Detector
The TCD (Technical Confluences Detector) is a tool to locate and point out those price levels where there is a congestion of indicators, moving averages, Fibonacci levels, Pivot Points, etc. If you are a short-term trader, you will find entry points for counter-trend strategies and hunt a few points at a time. If you are a medium-to-long-term trader, this tool will allow you to know in advance the price levels where a medium-to-long-term trend may stop and rest, where to unwind positions, or where to increase your position size.
09:06
EUR/USD: Bears keep the pressure around 1.0070/80
EURUSD
- EUR/USD struggles for direction in the 1.0070/80 band.
- The greenback advances to fresh multi-week highs near 107.70.
- Germany Producer Prices surprised to the upside in July.
Price action around the single currency remains subdued and motivates EUR/USD to keep business in the lower end of the recent range in the 1.0070/80 band on Friday.
EUR/USD offered on USD-strength
EUR/USD remains unable to gather some upside traction and wobbles in the lower end of the weekly range following Thursday’s sharp pullback, always against the backdrop of the firm sentiment surrounding the US dollar.
Also collaborating with the dollar’s upbeat mood, US yields manage to resume the uptrend across the curve, reinforced at the same time recent hawkish comments from Fed speakers.
In line with the rest of the global money markets, German 10yBund yields trade in multi-week highs and approach the 1.20% region.
Minor results in the euro area saw German Producer Prices rise 5.3% MoM in July and 37.2% over the last twelve months. In the broader Euroland, the Current Account surplus came at €3.24B in June.
There will be no data releases or events in the US docket other than the speech by Richmond Fed T.Barkin.
What to look for around EUR
EUR/USD now appears to have met some support near 1.0070 in the wake of the intense weekly pullback.
Price action around the European currency, in the meantime, is expected to closely follow dollar dynamics, geopolitical concerns, fragmentation worries and the Fed-ECB divergence.
On the negatives for the single currency emerge the so far increasing speculation of a potential recession in the region, which looks propped up by dwindling sentiment gauges and the incipient slowdown in some fundamentals.
Eminent issues on the back boiler: Continuation of the ECB hiking cycle. Italian elections in late September. Fragmentation risks amidst the ECB’s normalization of its monetary conditions. Impact of the war in Ukraine on the region’s growth prospects and inflation.
EUR/USD levels to watch
So far, spot is gaining 0.03% at 1.0087 and faces the next hurdle at 1.0309 (55-day SMA) seconded by 1.0368 (monthly high August 10) and finally 1.0476 (100-day SMA). On the other hand, a break below 1.0069 (monthly low August 19) would target 1.0000 (psychological level) en route to 0.9952 (2022 low July 14).
09:03
GBP/USD slides below 1.1900 mark, hits one-month low amid broad-based USD strength
- GBP/USD witnesses heavy selling for the third successive day and drops to a one-month low.
- Hawkish Fed expectations, recession fears underpin the USD and exert downward pressure.
- The fundamental backdrop favours bearish traders and supports prospects for further losses.
The GBP/USD pair prolongs a one-and-half-week-old bearish trend and continues losing ground for the third successive day on Friday. This also marks the sixth day of a negative move in the previous seven and drags spot prices below the 1.1900 mark, or a one-month low during the first half of the European session.
The US dollar buying remains unabated on the last day of the week and turns out to be a key factor that continues to exert downward pressure on the GBP/USD pair. In fact, the USD Index (DXY), which tracks the greenback against a basket of six other currencies, shot to its highest level since July 18 and remains well supported by hawkish Fed expectations.
The recent comments by several Fed officials suggest that the US central bank will stick to its policy tightening path to tame inflation. The prospects for a further rate increase by the Fed push the yield on the benchmark 10-year US government bond back closer to the 3.0% threshold. This, along with the prevalent risk-off mood, underpins the safe-haven buck.
The British pound, on the other hand, struggles to find buyers despite better-than-expected UK Retail Sales, which recorded the first increase in three months and rose 0.3% in July. The Bank of England's bleak outlook, warning that a prolonged recession would start in the fourth quarter, continues to weigh on sterling and contributes to the GBP/USD pair's decline.
From a technical perspective, acceptance below the 1.1900 mark could be seen as a fresh trigger for bears and supports prospects for a further near-term depreciating move for the GBP/USD pair. Hence, a subsequent fall towards the next relevant support, around the 1.1820 region, remains a distinct possibility amid absent relevant economic data from the US.
Technical levels to watch
08:43
EUR/USD could find it difficult to attract buyers unless it manages to reclaim 1.0100
EUR/USD has gone into a consolidation phase following Thursday's steep drop. The pair needs to reclaim 1.0100 to stage a correction, FXStreet’s Eren Sengezer reports.
1.0050 aligns as next support
“In order for the pair to stage an upward correction, it needs to make a four-hour close above 1.0100. If that happens, 1.0150 (Fibonacci 23.6% retracement of the latest downtrend) and 1.0180 (200-period SMA on the four-hour chart) could be seen as the next recovery targets.”
“On the downside, 1.0050 (static level) aligns as next support ahead of 1.0000 (psychological level) and 0.9950 (July 14 low).”
08:41
A higher interest rate for longer looks to be the way forward for Fed – Danske Bank
Economists at Danske Bank find reasonable for the market to pull back on expectations for interest rate cuts next year. In their view, Federal Reserve needs to increase the real interest rate another 125 bps over the coming months.
Higher for longer
“A higher interest rate for longer looks to be the way forward for Federal Reserve. We expect it to hike Fed Funds rate at least another 125 bps and keep it here.”
“The market agrees and discounts another 121 bps hikes this year and now only discounts 14 bps of interest cuts next year from 50 bps in July.”
“The US output gap turned positive and the economy needs a period of restrictive monetary policy to return to equilibrium.”
08:28
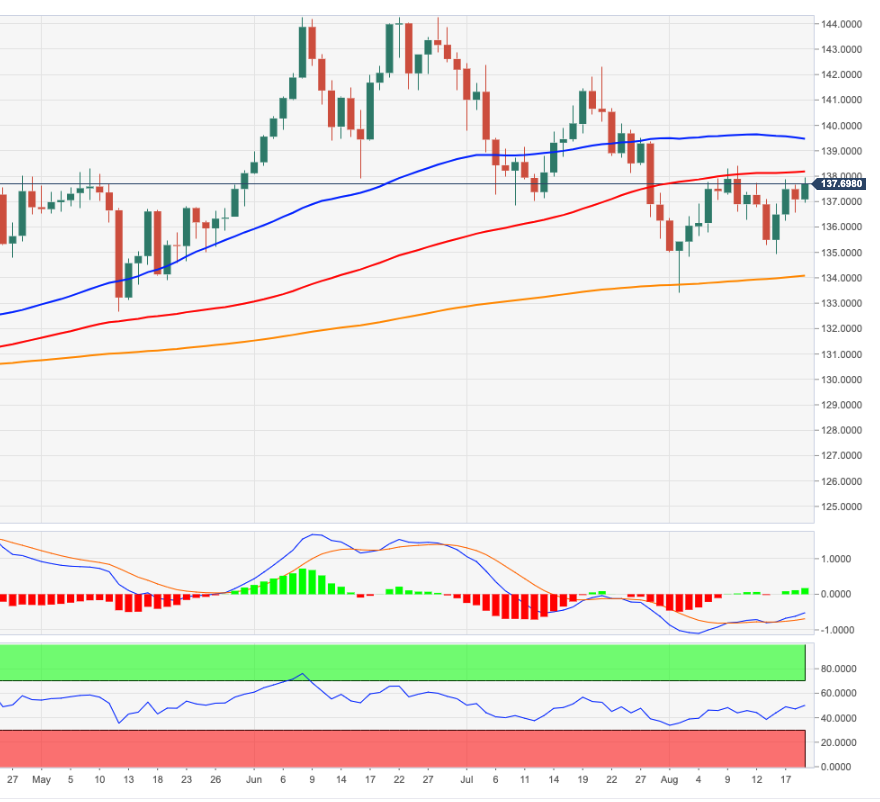
USD/JPY jumps to fresh monthly peak, seems poised to prolong the appreciating move
- USD/JPY gains traction for the fourth straight day and jumps to over a three-week high.
- Hawkish Fed expectations, rising US bond yields underpin the USD and remain supportive.
- The Fed-BoJ policy divergence supports prospects for an extension of the strong move up.
The USD/JPY pair builds on the overnight bullish breakout momentum through the 50-day SMA resistance and gains traction for the fourth successive day on Friday. The upward trajectory prolongs through the early part of the European session and pushes spot prices to over a three-week high, around the 136.75 region.
The US dollar adds to its weekly gains climbs to a one-month high on the last day of the week, which turns out to be a key factor boosting the USD/JPY pair. Despite signs of easing inflationary pressures in the US, the recent hawkish remarks by several Fed officials suggest that the US central bank would stick to its policy tightening path. A further rise in the US Treasury bond yields reaffirms hawkish Fed expectations and continues to act as a tailwind for the greenback.
In fact, the yield on the benchmark 10-year US government bond shot back closer to the 3.0% threshold. In contrast, Japanese government bond yields remain static amid expectations that the Bank of Japan would retain its ultra-easy monetary policy stance despite rising inflation. Data released this Friday showed that core CPI in Japan rose 2.4% YoY in July, or the highest level since December 2014, and remains above the BoJ's 2% target for the fourth straight month.
The divergent Fed-BoJ monetary policy stance continues to weigh on the Japanese yen and provides an additional lift to the USD/JPY pair. Apart from this, the ongoing positive move could further be attributed to some technical buying above the 50 DMA hurdle, around the 135.50 area, which coincided with the previous monthly swing high. That said, a generally weaker tone around the equity markets could lend support to the safe-haven JPY and cap any further gains for the major.
Nevertheless, the fundamental backdrop and the technical setup favour bullish traders, supporting prospects for an extension of the ongoing appreciating move. There isn't any major market-moving economic data due for release from the US on Friday. Hence, the US bond yields would influence the USD price dynamics and provide some impetus to the USD/JPY pair. Apart from this, the broader risk sentiment would also be looked upon for short-term trading opportunities.
Technical levels to watch
08:01
European Monetary Union Current Account n.s.a increased to €3.24B in June from previous €-15.4B
08:01
USD/TRY to hit 20.00 by Q1 2023 – MUFG
The Central Bank of the Republic of Turkey (CBRT) MPC delivered a surprise 100 bps rate cut taking the official policy rate to 13.00% which has led to only a relatively modest weakness of TRY with USD/TRY advancing by around 0.5% on Thursday. Economists at MUFG forecast the USD/TRY pair at 20 by the first quarter of 2023.
CBRT surprises with rate cut
“The limited degree of USD/TRY fallout in part reflects the fact that the statement from the MPC suggested this could be more of a one-off’. The timing probably also reflects the fact that more recently long-term yields in Europe and the US have declined by between 50-60 bps. That said it might not take long to see bigger moves higher in USD/TRY if long-term yields elsewhere creep further higher.”
“The TRY will continue to weaken going forward. Coupled with the huge and increasingly negative real yield, Turkey’s current account deficit is widening. Moody’s expects the budget deficit to worsen also, to around 4.5% of GDP with the FX deposit-protection scheme becoming increasingly expensive. That is estimated to cost 2.2% of GDP, a cost that will increase as USD/TRY rises.”
“We currently forecast USD/TRY to hit 20.00 by Q1 2023 – an 8% increase. But we are leaning toward a broader upgrade of our USD forecasts which would open up the probability of that level being hit sooner.”
08:00
European Monetary Union Current Account s.a climbed from previous €-4.49B to €4.24B in June
08:00
Greece Current Account (YoY) climbed from previous €-2.004B to €-0.723B in June
07:56
GBP/USD to extend further to the downside over the coming weeks – MUFG
GBPUSD
The GBP/USD rate has broken back below the 1.2000 level. In the view of economists at MUFG Bank, GBP downside risks persist despite better sales data.
Downside risks persist
“A recent build-up of long GBP positioning by Leveraged Funds could be vulnerable to liquidation propelling GBP/USD lower still.”
“Instead of the expected modest MoM declines, overall sales increased 0.3% and excluding auto fuel gained 0.4%. The data doesn’t change the overall picture of weak consumer spending. The ex-auto sales print gained 0.2% in June as well but these modest gains were preceded by seven consecutive declines and the record temperatures in the UK in July were very likely a driver of increased sales.”
“We doubt the retail sales data will change the dial on investors’ expectations of the outlook for the UK economy and see this break lower in GBP/USD extending further to the downside over the coming weeks.”
07:45
US Dollar Index looks firmer and advances to 4-week highs near 107.70
- The index adds to the sharp recovery and approaches 108.00.
- Hawkish Fedspeak bolstered the recent upside in the dollar.
- Yields resume the uptrend across the curve and support the greenback.
The greenback, in terms of the US Dollar Index (DXY), climbs further and reaches multi-week tops around 107.70 at the end of the week.
US Dollar Index now re-focuses on 108.00
The index advances for the third consecutive session amidst the renewed and intense buying interest in the dollar. It is worth noting that DXY posted gains in five out of the last seven sessions so far on Friday.
Further improvement in the buck comes in tandem with the continuation of the uptrend in US yields across the curve, where the belly and the long end already navigate in monthly peaks around 2.95% and 3.20%, respectively.
In the meantime, the resumption of the solid demand for the dollar appears propped up by recent hawkish comments from Fed’s rate-setters: M.Daly (hawk) leant for a 50 bps or a 75 bps at the September meeting, J.Bullard (hawk) defended a 75 bps raise and said he expects rates to be in the 3.75%-4.00% region by year end. E.George (hawk) suggested that economic growth will suffer, while N.Kashkari (centrist) added to that view and said he is not sure the Fed can reduce inflation without triggering a recession.
There are no data rereleases in the US calendar on Friday other than the speech by Richmond Fed T.Barkin (2024 voter, centrist).
What to look for around USD
The strong rebound in the dollar comes in response to some worsening conditions in the risk complex, which motivates DXY to reclaim the upper 107.00s, or multi-week peaks.
The dollar, in the meantime, is poised to suffer some extra volatility amidst investors’ repricing of the next move by the Federal Reserve, namely a 50 bps or 75 bps hike in September.
Looking at the macro scenario, the dollar appears propped up by the Fed’s divergence vs. most of its G10 peers (especially the ECB) in combination with bouts of geopolitical effervescence and occasional re-emergence of risk aversion.
Eminent issues on the back boiler: Hard/soft/softish? landing of the US economy. Escalating geopolitical effervescence vs. Russia and China. Fed’s more aggressive rate path this year and 2023. US-China trade conflict.
US Dollar Index relevant levels
Now, the index is gaining 0.11% at 107.60 and a breakout of 107.72 (monthly high August 19) would expose 109.29 (2022 high July 15) and then 109.77 (monthly high September 2002). On the other hand, immediate support comes at 104.63 (monthly low August 10) seconded by 104.07 (100-day SMA) and finally 103.67 (weekly low June 27).
07:37
AUD/USD bounces off two-week low, lacks follow-through amid risk-off/sustained USD buying
- AUD/USD reverses an intraday dip to a two-week low, though lacks follow-through.
- Hawkish Fed expectations, recession fears underpin the USD and should cap gains.
- Acceptance below the 50 DMA supports prospects for a further depreciating move.
The AUD/USD pair stages a modest bounce from a two-week low touched earlier this Friday and moves back above the 0.6900 mark during the early European session. The pair is currently placed near the top end of its daily trading range, though any meaningful upside seems elusive and the attempted recovery runs the risk of fizzling out rather quickly.
Growing worries about a global economic downturn continue exerting downward pressure on commodity prices, which, along with a softer risk tone, might act as a headwind for the risk-sensitive aussie. Apart from this, the prevalent bullish sentiment surrounding the US dollar, bolstered by hawkish Fed expectations, should further contribute to keeping a lid on the AUD/USD pair.
The recent hawkish remarks by several Fed officials and the incoming positive economic data reaffirm market speculations that the US central bank would stick to its policy tightening path. This, in turn, pushes the yield on the benchmark 10-year US government bond back closer to the 3.0% threshold and remains supportive of the ongoing USD positive move to a one-month high.
The fundamental backdrop suggests that the path of least resistance for the AUD/USD pair is to the downside. Even from a technical perspective, the overnight break below the 50-day SMA could be seen as a fresh trigger for bearish traders. Hence, any subsequent strength might still be seen as a selling opportunity amid absent relevant market-moving economic releases from the US.
Nevertheless, the AUD/USD pair remains on track to register heavy weekly losses. Bearish traders, however, might wait for some follow-through selling below the monthly low, around the 0.6870 region, before positioning for any further losses.
Technical levels to watch
07:07
NZD to weaken against the USD over the short to medium-term – HSBC
The Reserve Bank of New Zealand (RBNZ) raised its policy rate by 50 bps to 3.00% and signalled further rate hikes over the near term. NZD/USD jumped as much as 0.8% to 0.6383 after the release of the monetary policy statement. However, the knee-jerk move was partly erased by the end of the press conference. Economists at HSBC expect the NZD to weaken against the USD.
RBNZ to shift to 25 bps hikes soon
“We see further downside risk in the NZD for several reasons: i) growing domestic headwinds pose downside risk to the projected OCR path, ii) the NZD stands to benefit less from a hawkish RBNZ as the OCR moves further into restrictive territory and weighs on the economy, and iii) New Zealand is exposed to the risk of an underfunded current account deficit amid a global growth downtrend.”
“At the RBNZ’s next meeting in six weeks (5 October 2022), we expect another rate hike. However, if there are clear signs inflation has peaked and continued downside to the growth outlook, our economists expect the shifting balance of risks to be enough to see a pivot back to normal-sized 25 bps hikes.”
07:03
EUR/PLN has room for further gains towards the 4.735/40 zone – ING
The sell-off in Central and Eastern Europe continues. Economists at ING think the Polish zloty is the next victim, which will not be helped by domestic data.
Polish data will not improve the zloty's mood
“Food news is unlikely to come. Industrial production is expected to fall further in month-on-month terms, and we expect wage growth to be lower than market expectations. PPI should be lower than market expectations as well but still above a strong 20% year-on-year.”
“The Polish zloty finally broke above 4.720 EUR/PLN and we think it has room for further losses towards the 4.735-4.740 range if EUR/USD does not erase its losses.”
07:00
US Dollar Index to face stubborn resistance at the 108 level – ING
The dollar continues to retrace the mid-July to mid-August sell-off. But the US Dollar Index (DXY) is set to struggle to surpass the 108 barrier, economists at ING report.
USD to consolidate near the recent highs
“Barring some very poor pieces of US data (next week’s data calendar looks second-tier) or some surprising recovery stories overseas, we would expect the dollar to consolidate near the recent highs.”
“DXY broke the 107.50 level, however, getting to 108.00 should be significantly more difficult.”
06:59
USD/CAD marches towards 1.3000 as yields propel DXY, oil eases ahead of Canada Retail Sales
- USD/CAD takes the bids to renew two-week high, up for the third consecutive day.
- US 10-year Treasury yields rise to fresh one-month peak on hawkish Fed bets, recession woes.
- Fears of less energy demand, firmer US dollar weigh on the oil prices.
- Canada Retail Sales for July can favor buyers ahead of next week’s Jackson Hole Symposium.
USD/CAD buyers approach the monthly high while refreshing the daily peak around 1.2970 during the initial hour of Friday’s European trading session. In doing so, the Loonie pair takes clues from the firmer US dollar, as well as softer prices of Canada’s main export item, namely WTI crude oil.
That said, the US Dollar Index (DXY) run up towards refreshing the monthly top near 107.70 as the market’s fears of economic slowdown in China and Europe, the Sino-American tussles, as well as hawkish Fedspeak. While underpinning the greenback’s gauge, the US 10-year Treasury yields reverse the previous day’s retreat from the monthly high to 2.928% by the press time, renewing a one-month high.
Elsewhere, WTI crude oil remains pressured around the intraday low of $89.30 as fears of economic slowdown weigh on the energy benchmark. Also exerting downside pressure on the black gold is the firmer US dollar and hopes that the Organization of the Petroleum Exporting Countries (OPEC) and allies, collectively known as OPEC+, could ease the output crunch, as recently signaled by Saudi Arabia.
On Thursday, Philadelphia Fed Manufacturing Survey rallied to 6.2 for August versus -5 expected and -12.3 prior while the weekly Initial Jobless Claims dropped to 250K, below 265K market consensus and 252K revised prior.
Following the data, San Francisco Fed President Mary Daly backed either 50 basis points or a 75 basis points hike while signaling the move for the September rate decision whereas Minneapolis Federal Reserve Neel Kashkari mentioned that, per Reuters, he does not believe the county is currently in a recession. Further, the all-time hawk St. Louis Fed President James Bullard said he is leaning towards another 75 bps rate hike in September.
Looking forward, Canadian Retail Sales for July, expected 0.3% MoM versus 2.2% prior, will be important for intraday USD/CAD traders. However, the market’s anxiety ahead of next week’s Fed Chair Jerome Powell’s speech at the Jackson Hole Symposium could keep the Loonie pair directed towards the north.
Technical analysis
The firmer RSI (14) and the bullish MACD signals join the pair’s successful trading above the 21-DMA level of 1.2860, as well as the one-week-old support line near 1.2880, to keep USD/CAD bulls hopeful. That said, a downward sloping resistance line from July 19, close to 1.2980-85 challenges the intraday buyers ahead of the 1.3000 psychological magnet.
06:59
Forex Today: Dollar consolidates gains following Thursday's impressive rally
Here is what you need to know on Friday, August 19:
The US Dollar Index (DXY), which tracks the dollar's performance against a basket of six major currencies, gathered bullish momentum in the second half of the day on Thursday and climbed to its highest level in a month above 107.50. In the absence of high-tier macroeconomic data releases, the DXY stays in a consolidation phase early Friday. Meanwhile, the 10-year US Treasury bond yield holds above 2.9% and US stock index futures are down between 0.25% and 0.45%, helping the greenback stay resilient against its major rivals.
Hawkish comments from Fed officials helped the dollar outperform its rivals. In an interview with CNN on Thursday, "the markets have a lack of understanding but consumers understand that rates won't go down right after they go up," San Francisco Fed President Mary Daly said. Regarding the September rate decision, Daly said either a 50 basis points (bps) or a 75 bps hike would be appropriate. On the same note, St. Louis Federal Reserve Bank President James Bullard noted that he was leaning toward a 75 bps hike at the next meeting.
Earlier in the day, the data from Germany revealed that the Producer Price Index (PPI) jumped to 37.2% on a yearly basis in July from 32.7% in June. This print came in much higher than the market expectation of 32%. EUR/USD, which slumped to its lowest level since mid-July below 1.0100, showed no immediate reaction to this data and was last seen trading flat on the day at 1.0085.
The UK's Office for National Statistics reported that Retail Sales rose by 0.3% on a monthly basis in July following June's contraction of 0.2%. Although this print came in better than the market forecast for a decrease of 0.2%, it failed to help the British pound find demand. GBP/USD trades in negative territory slightly above 1.1900 following Thursday's sharp decline.
USD/JPY extended its rally and closed the third straight day in positive territory on Thursday. At the time of press, the pair was up 0.3% on the day at 136.30, trading at its highest level since July 28.
Gold dropped below $1,760 on Thursday and struggled to stage a rebound. With US T-bond yields edging higher, XAU/USD stays on the back foot near $1,755 in the early European session.
Bitcoin came under heavy pressure and declined below $22,000 on Friday. After having registered small losses on Thursday, Ethereum turned south and was last seen losing more than 5% on a daily basis at around $1,750.
06:57
GBP/USD: Sterling remains fragile – ING
GBP/USD retreats towards 1.1900 on mixed UK Retail Sales. Economists at ING note that the British pound remains vulnerable.
Retail challenges
“Consumer confidence in the UK has fallen to a record low. At least July retail sales brought a glimmer of hope. But it is still not helping to change the cost-of-living crisis narrative. It looks unlikely to dent expectations that the Bank of England will be hiking 50 bps on 15 September.”
“It is fair to say sterling remains fragile. However, it looks more vulnerable versus the dollar, where GBP/USD can trade down to the 1.1935/50 area.”
06:54
EUR/GBP flirts with weekly high around 0.8470 area, upside potential seems limited
EURGBP
- EUR/GBP gains traction for the third straight day and climbs back closer to the weekly high.
- Stagflation fears continue to weigh on the British pound and remain supportive of the move.
- Energy supply concerns in Europe undermine the euro and warrant caution for bullish traders.
The EUR/GBP cross builds on this week's goodish rebound from sub-0.8400 levels and gains traction for the third successive day on Friday. The momentum lifts spot prices back closer to the weekly high, around the 0.8470 region during the early European session.
The British pound continues with its relative underperformance amid mounting stagflation fears and turns out to be a key factor acting as a tailwind for the EUR/GBP cross. Last week, the UK GDP report indicated that the economy contracted in the three months through June. Furthermore, the UK CPI report released on Wednesday showed that consumer prices accelerated to the highest level since 1982.
This comes on the back of the Bank of England's bleak economic outlook, which, along with Friday's mixed UK Retail Sales data, weighs on sterling and extends support to the EUR/GBP cross. The UK Office for National Statistics reported that retail sales plunged -by 3.4% YoY in July and core retail sales fell by 3.0% during the reported month. This, to a larger extent, overshadows positive monthly figures.
The shared currency, on the other hand, remains depressed amid concerns that an energy-supply crunch in the Eurozone could drag the economy faster and deeper into recession. Furthermore, the recent rise in European gas prices to fresh record highs worsens an already dire inflation outlook. This could make it a tough balancing act for the European Central Bank and weigh on the euro, capping the EUR/GBP cross.
The fundamental backdrop warrants some caution for aggressive bullish traders and makes it prudent to wait for strong follow-through buying before positioning for any further gains. Nevertheless, the EUR/GBP cross remains on track to record gains for the third successive week, though remains below the monthly swing high, just ahead of the 0.8500 psychological mark, touched on August 12.
Technical levels to watch
06:51
EUR/USD to stay offered in a 1.01-1.02 range – ING
EURUSD
EUR/USD is stretching to the lowest levels since mid-July, not far from parity, which will not please the European Central Bank (ECB). Economists at ING expect the pair to stay offered on a quiet Friday.
ECB does have a problem with the weaker euro
“It seems that the ECB does have a problem with the weaker euro – judging by Isabel Schnabel’s interview with Reuters yesterday. But to drive EUR/USD higher – the most relevant euro pair in an energy crisis – the ECB is going to have to turn a lot more hawkish. That is a tough job with a recession around the corner.”
“Expect EUR/USD to stay offered in a 1.0100-1.0200 range on a quiet Friday.”
06:44
NZD/USD to see more range-trading and the potential for a flare-up in volatility – ANZ
The kiwi is lower again. Economists at ANZ Bank believe that the NZD/USD pair is set to experience more range-trading and possibly a spike in volatility.
USD continues to be well supported
“The USD continues to be well supported despite market participants’ hankering for the global recession narrative. In the context of a safe-haven or ‘risk-off’ vibe, further USD strength can’t be ruled out, despite higher rates here and the RBNZ being well positioned to tackle inflation.”
“It’s hard to take a high-conviction view on NZD direction; instead we think it makes sense to expect more range-trading and the potential for a flare-up in volatility.”
06:40
Gold Price Forecast: XAU/USD to find solid support at $1,700 – ANZ
Gold slipped as rising US Treasury yields weighed on investor appetite, and a slightly stronger US dollar was a headwind for investor demand. Economists at ANZ Bank expect the yellow metal to find a floor at the $1,700 level.
Growing recession fears should see some haven flows
“Aggressive Fed rate hikes and stronger USD are holding down the gold price. While growing recession fears, due to rising rates against sticky inflation, should see some haven flows.”
“Central bank purchases are likely to be strong as currencies depreciate and geopolitical risks rise. This should help mitigate weaker physical demand.”
“We expect gold to find its floor near $1,700.”
06:40
FX option expiries for August 19 NY cut
FX option expiries for August 19 NY cut at 10:00 Eastern Time, via DTCC, can be found below.
- EUR/USD: EUR amounts
- 1.0065-70 265m
- 1.0100 715m
- 1.0125 367m
- 1.0150 316m
- 1.0175-80 746m
- 1.0190 244m
- 1.0250 495m
- GBP/USD: GBP amounts
- 1.2100 578m
- USD/JPY: USD amounts
- 135.00 390m
- 136.00 805m
- AUD/USD: AUD amounts
- 0.6900 255m
- 0.6950 302m
- 0.6995-00 431m
- USD/CAD: USD amounts
- 1.2750-60 1.61b
- 1.2875-85 924m
- 1.2900 261m
- 1.2915 348m
- EUR/GBP: EUR amounts
- 0.8460 501m
06:36
Norges Bank delivers the correct decision, well done – Commerzbank
As expected, Norges Bank (NB) hiked rates by 50 basis points to 1.75%. The Norwegian krone was also able to appreciate following the announcement. This is the right move, in the opinion of economists at Commerzbank.
Well done, Norges Bank
“NB raised the key interest rate by 50 bps to 1.75% due to the inflation developments and signaled a further increase in September.
“It also logically indicated that the path will most likely be raised in September. However, NB also acknowledges that the outlook is highly uncertain. On the one hand, price inflation could accelerate further, and on the other, there could be a sharper slowdown in global growth. However, all central banks ultimately face this problem.”
“My conclusion on Norges Bank: You couldn't ask for more from it at this point. Well done.”
06:35
Natural Gas Futures: Further consolidation near term
Preliminary readings from CME Group for natural gas futures markets showed open interest drop by around 3.3K contracts after five consecutive daily builds on Thursday. On the other hand, volume resumed the uptrend and increased by around 42.3K contracts.
Natural Gas keeps targeting $9.75
Prices of natural gas charted an inconclusive session on Thursday amidst shrinking open interest and rising volume. That said, the commodity could attempt some consolidation in the very near term ahead of the potential continuation of the recent uptrend. On this, the immediate target remains at the 2022 high at $9.75 per MMBtu (July 26).
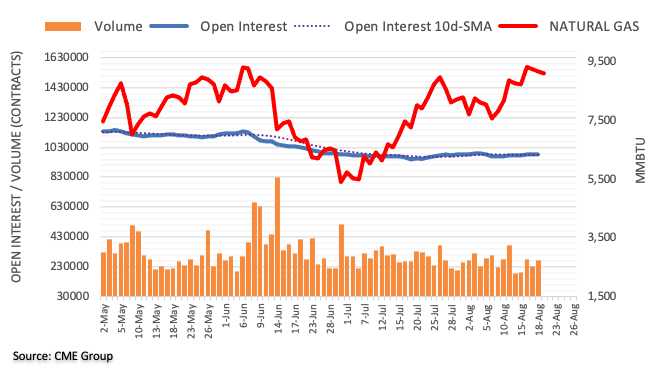
06:33
GBP/JPY Price Analysis: Dribbles above 162.00 inside bearish channel after UK Retail Sales
- GBP/JPY pares intraday gains after mixed UK Retail Sales for July.
- RSI (14) also justifies a pullback towards 100-HMA but bullish MACD signals challenge further downside view.
- Bulls need to defy the three-day-old descending trend channel to retake control.
GBP/JPY consolidates daily gains around 162.30 after the UK’s Retail Sales probed Sterling Pound buyers during the early Friday morning in Europe. In doing so, the cross-currency pair remains inside an immediate bearish trend channel.
That said, UK’s Retail Sales for July dropped to -3.4% YoY versus -3.3% expected and downwardly revised -6.1% prior. However, the details appeared to be promising but failed to favor the GBP/JPY rebound.
Also read:
It’s worth noting, however, that the 100-HMA joins the bullish MACD signals to defend GBP/JPY buyers around the 162.00 threshold inside a bearish chart pattern.
Following that, the stated channel’s support line near 161.50 could gain the market’s attention.
In a case where GBP/JPY defies the channel formation by declining below 161.50, a downward trajectory towards the monthly low near 159.45 can’t be ruled out.
Alternatively, recovery moves become interesting on crossing the channel’s upper line, at 163.00 by the press time, while targeting the monthly peak near 164.00.
GBP/JPY: Hourly chart
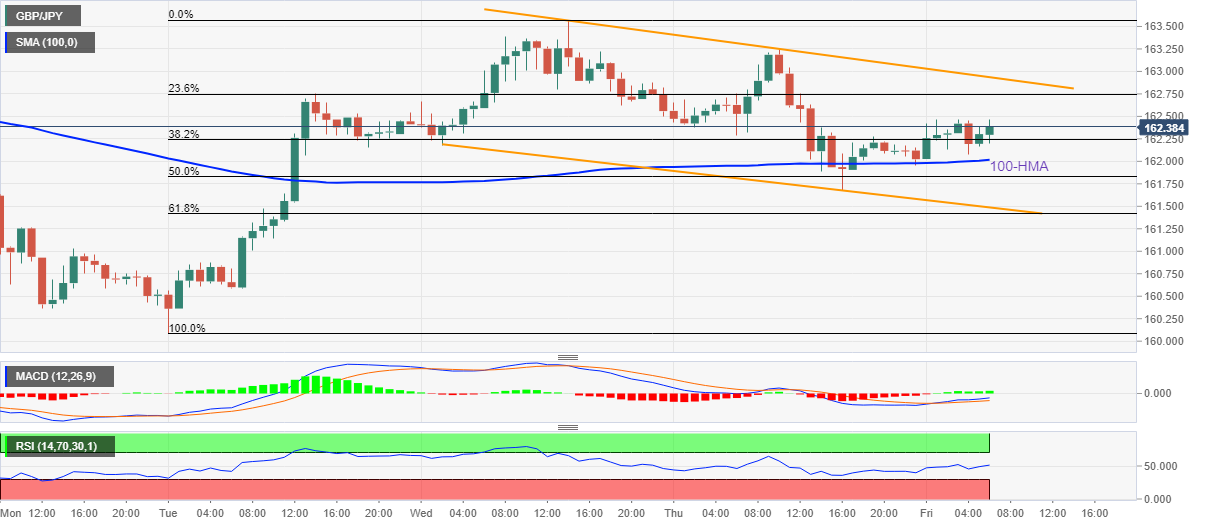
Trend: Limited downside expected
06:33
EUR/USD to edge lower as the ECB is in danger of falling further behind other central banks – Commerzbank
EUR/USD pushed lower again on Thursday. Economists at Commerzbank expect the shared currency to remain under downside pressure as the European Central Bank (ECB) is lagging behind the Federal Reserve but also the Bank of England (BoE), economists at Commerzbank report.
The headwinds for the eurozone economy will increase into the winter
“Discussions about whether the ECB will raise its key rate by 25 or 50 basis points in September only underscore how clearly the ECB is lagging behind the Fed but also the BoE. And this is becoming more of a problem for the euro as the growth outlook becomes increasingly gloomy.”
“The headwinds for the eurozone economy will increase into the winter. In particular, a continuing threat of gas shortages, and high energy prices are weighing on the growth outlook. This is weighing on demand and is also likely to dampen price pressure.”
“The ECB is in danger of falling further behind other central banks. For the time being, this does not bode well for the euro.”
06:30
Switzerland Industrial Production (YoY) declined to 5.1% in 2Q from previous 7.9%
06:25
Next big move in lira exchange rate may be just around the corner ragardless rate cut – Commerzbank
The Turkish central bank cut rates on Thursday by 1% despite recording an almost 70% inflation rate. The lira exchange rate sold off immediately after the announcement but did not proceed to weaken by much, instead re-gaining some ground soon. Economists at Commerzbank still believe that the next big move in the TRY may be just around the corner.
Turkey defies the unanimous consensus expectation
“Turkey's central bank (CBT) surprised the market by cutting interest rates again – on this occasion by 100 bps from 14% to 13% – even while inflation has accelerated to 80% and inflation expectations have accelerated to 70% (they have fully un-anchored).”
“There was hardly any surprise at the fundamental level. So, the 'surprise' was only relative to some simple double-guessing by the financial market, without reference to deeper fundamentals, that CBT would ‘stay put’ on the day.”
“Our view remains unchanged that the next big move in the lira exchange rate may be just around the corner. Whether yesterday's rate decision will end up playing some role in that or not remains to be seen.”
06:15
Well-supported dollar to drag EUR/USD below parity – Rabobank
EURUSD
In recent sessions, the USD Dollar Index has crept higher. Economists at Rabobank continue to expect the USD to remain well supported against a broad basket of currencies in the next months.
GBP/USD to tumble towards 1.15
“The hawkishness of the Fed is not the only driver of the USD. It remains our view that the greenback will remain well supported in the coming months due to safe-haven demand.”
“We see risk of another move below parity for EUR/USD in the coming months and see risk of cable moving towards 1.15.”
06:12
GBP/USD fades bounce off monthly low near 1.1900 on mixed UK Retail Sales
- GBP/USD reverses the corrective pullback as firmer USD joins softer UK data.
- UK Retail Sales dropped more than expected on YoY, details suggest positive prints.
- A record low of the UK consumer sentiment gauge, political jitters also weigh on Cable prices.
- US Treasury yields underpin US dollar’s demand amid recession woes, hawkish Fedspeak.
GBP/USD retreats towards 1.1900 after the UK’s Retail Sales data failed to impress bulls during early Friday morning in Europe. The bearish bias also takes clues from the broad US dollar amid recession woes and hawkish Fed bets.
That said, UK’s Retail Sales for July dropped to -3.4% YoY versus -3.3% expected and downwardly revised -6.1% prior. However, the details appeared to be promising but failed to underpin the GBP/USD rebound.
Also read: UK Retail Sales rebound 0.3% MoM in July vs. -0.2% expected
Previously, the UK’s GfK Consumer Sentiment Index refreshed a record-low to -44 in August from July's reading of -41. “British households are feeling "a sense of exasperation" about the surging cost of living which has pushed consumer sentiment to its lowest since at least 1974, according to the country's longest-running survey of household finances,” Reuters mentioned following the data release.
Elsewhere, the frontrunner for the UK Prime Minister’s (PM) post Liz Truss also tried to impress voters by stating that her government's defining mission would be to revive the economy, per Reuters. However, the present pessimism surrounding the UK’s economic crisis and Brexit woes push market players to ignore Truss’ optimism.
It should be noted that the US Dollar Index (DXY) run-up towards refreshing the monthly peak near 107.70 also exerts downside pressure on the GBP/USD prices. The greenback gains on all fronts recently. The Sino-American tussles, fears of economic slowdown in China and Europe, as well as hawkish Fedspeak, are among the key catalysts favoring the greenback.
Amid these plays, Wall Street closed mixed and exert down pressure on the S&P 500 Futures, down 0.17% intraday at the latest. Further, the US 10-year Treasury yields reverse the previous day’s retreat from the monthly high to 2.891% by the press time.
Having witnessed the initial market reaction to the UK’s key component of the Gross Domestic Product (GDP), namely the Retail Sales for July, GBP/USD traders may witness inaction amid a light calendar. However, the market’s anxiety ahead of next week’s Fed Chair Jerome Powell’s speech at the Jackson Hole Symposium could keep the Cable pair directed towards the south.
Technical analysis
GBP/USD bears approach a downward sloping support line from July 29, around 1.1880, before targeting 2022 low, currently around 1.1760. Recovery moves, however, remain elusive unless crossing the 21-DMA hurdle surrounding 1.2100.
06:10
Gold Price Forecast: XAU/USD to added credence to bearish potential on a drop under $1,750
Gold price is meandering near three-week lows. There is more for sellers to flex their muscles, FXStreet’s Dhwani Mehta reports.
Downside open for gold bears
“A sustained move below the $1,750 psychological level will be on their radars to aim for the next downside target near the $1,730 region.”
“Acceptance above the 21-Daily Moving Average (DMA), now at $1,766, is crucial to initiate any meaningful recovery. However, the bearish 50 DMA at $1,774 will be a tough nut to crack for bulls. Fresh buying opportunities above the latter could warrant a retest of Wednesday’s high at $1,782.”
06:02
United Kingdom Retail Sales ex-Fuel (YoY) above expectations (-3.1%) in July: Actual (-3%)
06:02
Crude Oil Futures: Recovery appears unconvincing
Considering advanced prints from CME Group for crude oil futures markets, traders scaled back their open interest positions by around 1.7K contracts on Thursday, recording at the same time the fourth daily drop in a row. Volume followed suit and added to the previous pullback, this time shrinking by around 5.6K contracts.
WTI remains capped by the 200-day SMA
Thursday’s decent uptick in prices of the WTI was fuelled by short covering, as noted by declining open interest and volume. Against that, further upside looks not favoured in the very near term and another test of recent lows near $87.70 (August 16) should not be ruled out.
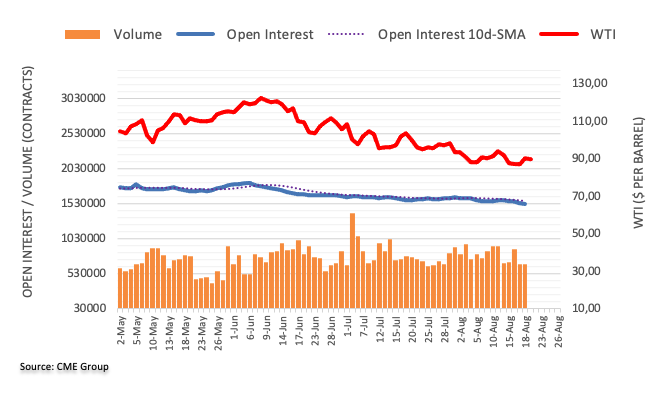
06:01
UK Retail Sales rebound 0.3% MoM in July vs. -0.2% expected
- The UK Retail Sales came in at 0.3% MoM in July, a positive surprise.
- Core Retail Sales for the UK jumped by 0.4% MoM in July.
- The cable remains in the red above 1.1900 on the mixed UK data.
The UK retail sales arrived at 0.3% over the month in July vs. -0.2% expected and -0.1% previous. The core retail sales, stripping the auto motor fuel sales, jumped 0.4% MoM vs. -0.2% expected and 0.4% previous.
On an annualized basis, the UK retail sales plunged -3.4% in July versus -3.3% expected and -6.1% prior while the core retail sales fell by 3.0% in the reported month versus -3.1% expectations and -6.2% previous.
Main points (via ONS)
Non-store retailing (predominantly online retailers) sales volumes rose by 4.8% in July 2022; feedback from online retailers suggested that a range of promotions in July 2022 boosted sales.
Automotive fuel sales volumes fell by 0.9% in July 2022, with anecdotal evidence that the heatwave across parts of the UK may have reduced travel and sales.
Non-food stores sales volumes fell by 0.7% over the month because of falls in other non-food stores (negative 1.5%), and clothing stores (negative 1.2%).
Food store sales volumes rose by 0.1% in July 2022; sales volumes were 0.1% below their February 2020 levels.
FX implications
GBP/USD is holding the lower ground on mixed UK Retail Sales data. The spot was last seen trading at 1.1911, down 0.17% on the day.
more to come ....
06:01
United Kingdom Retail Sales ex-Fuel (YoY) below expectations (-3.1%) in July: Actual (-33%)
06:01
United Kingdom Retail Sales (YoY) came in at -3.4%, below expectations (-3.3%) in July
06:01
United Kingdom Retail Sales ex-Fuel (MoM) above expectations (-0.2%) in July: Actual (0.4%)
06:01
United Kingdom Public Sector Net Borrowing below forecasts (£11.763B) in July: Actual (£4.18B)
06:00
United Kingdom Retail Sales (MoM) registered at 0.3% above expectations (-0.2%) in July
06:00
Germany Producer Price Index (YoY) above expectations (32%) in July: Actual (37.2%)
06:00
Germany Producer Price Index (MoM) above expectations (0.6%) in July: Actual (5.3%)
05:52
USD/TRY Price Analysis: Bulls keep post-CBRT gains with eyes on record high above 18.00
- USD/TRY stays mildly bid at yearly peak, prints three-day uptrend.
- Upside break of 12-day-old resistance favor buyers to aim for the late 2021 peak.
- Two-month-old ascending resistance line restricts immediate upside.
- Overbought RSI, sluggish MACD suggests a bumpy road for the bulls.
USD/TRY remains firmer around 18.10 during early Friday morning in Europe. In doing so, the Turkish lira (TRY) pair keeps the previous day’s upside momentum around the yearly top.
It’s worth noting that the quote crossed a two-week-old resistance after the Central Bank of the Republic of Türkiye (CBRT) surprised markets by announcing 100 basis points (bps) of a rate cut.
Technically, a clear upside break of the aforementioned horizontal resistance and higher low formation on USD/TRY daily closings keep the pair buyers hopeful of refreshing the all-time high marked in late 2021 at around 18.25.
However, an upward sloping resistance line from June, near 18.27 by the press time, could join the overbought RSI (14) and sluggish MACD to challenge the pair buyers afterward.
In a case where USD/TRY stays firmer past 18.27, the odds of witnessing a gradual run-up towards the 20.00 psychological magnet can’t be ruled out.
Alternatively, the resistance-turned-support around 18.00 restricts the immediate downside of the USD/TRY prices.
Following that, the 21-DMA support of 17.93 could test the bears before giving them control.
USD/TRY: Daily chart
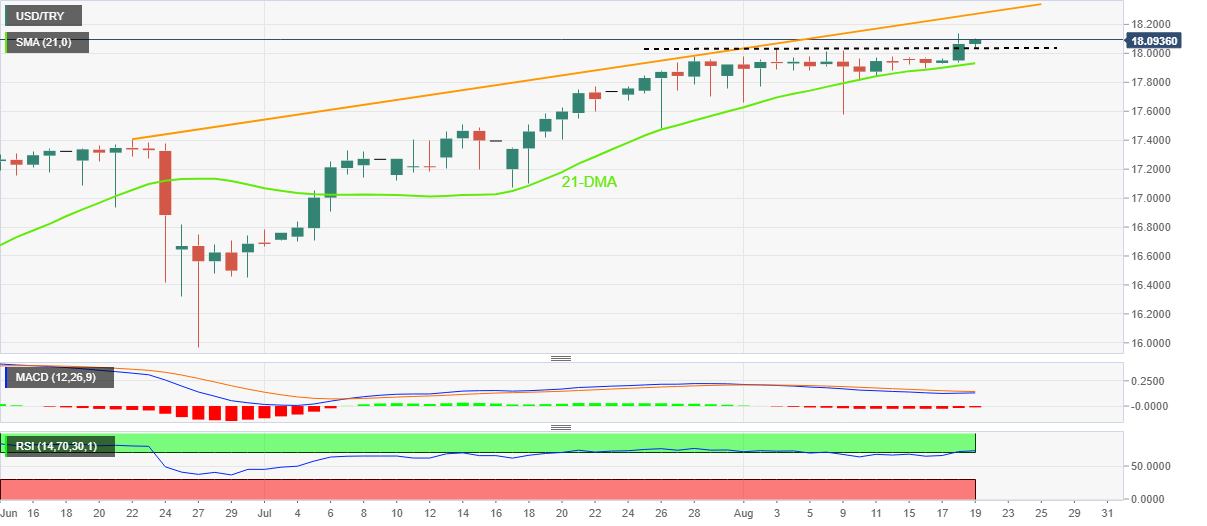
Trend: Limited upside expected
05:47
Gold Futures: Room for further downside
Open interest in gold futures markets rose for the second session in a row on Thursday, although this time by just 481 contracts according to CME Group’s flash data. Volume, instead, remained choppy and shrank by around 14.1K contracts, partially reversing the previous daily build.
Gold: Next support comes at $1,711
Gold prices extended the bearish move on Thursday amidst a small uptick in open interest. That said, further decline still appears on the cards with the next target emerging at the weekly low at $1,711 per ounce troy (July 27).
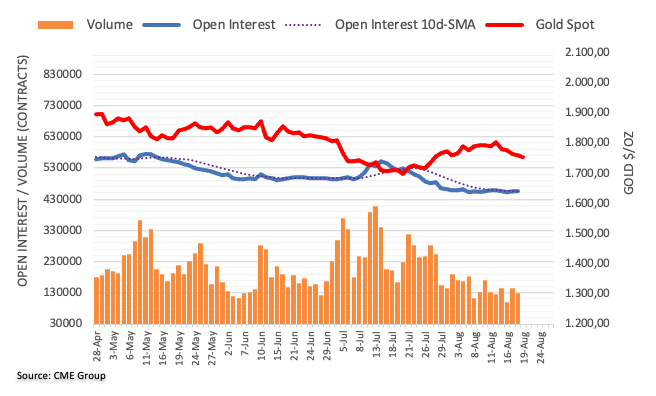
05:35
EUR/USD slides towards parity amid German recession woes, hawkish Fed bets
EURUSD
- EUR/USD remains pressured around five-week low, extends the previous day’s losses.
- Fed policymakers talk down recession, favor aggressive rate hikes.
- German Finance Ministry highlights gloomy economic scenario.
- Yields poke monthly high as traders rush to safe-haven amid recession woes.
EUR/USD holds lower ground near the monthly bottom of 1.0070 as US dollar strength pleases the pair bears amid a sluggish European morning on Friday. That said, fears of German recession and geopolitical concerns join the risk-aversion wave, as well as the hawkish Fedspeak, to weigh on the major currency pair.
That said, the US Dollar Index (DXY) rises to a four-week high of 107.72, up for the third consecutive day, around 107.68 by the press time, amid multiple catalysts ranging from hawkish comments from the Fed policymakers to upbeat data at home, as well as geopolitical fears surrounding China and Europe.
Recently, Bloomberg came out with the news that Chinese President Xi Jinping and Russian President Vladimir Putin plan to attend a Group of 20 Summit to be held in Bali later this year, Indonesian President Joko Widodo said in an interview. The news also mentioned that it was the first time the leader of the world’s fourth-most populous nation confirmed both of them were planning to show up at the November summit. The news adds to the market’s anxiety and fears of more drama, which in turn contributed to the flight to safety and helped the DXY to refresh the monthly high after the release.
Previously, San Francisco Fed President Mary Daly backed either 50 basis points or a 75 basis points hike while signaling the move for the September rate decision whereas Minneapolis Federal Reserve Neel Kashkari mentioned that, per Reuters, he does not believe the county is currently in a recession. Further, the all-time hawk St. Louis Fed President James Bullard said he is leaning towards another 75 bps rate hike in September.
Elsewhere, hopes that Iran nuclear deal with get the much-desired outcome tries to keep the EUR/USD prices in check. Also restricting the EUR/USD downside are comments from Reuters stating that the Eurozone inflation reached a new record high of 8.9% year-on-year in July and a nasty feedback loop is opening up as the current account deficit weighs on the euro and import bills swell for raw materials from gas to metals.
Wall Street closed mixed and exert down pressure on the S&P 500 Futures, down 0.17% intraday at the latest. Further, the US 10-year Treasury yields reverse the previous day’s retreat from the monthly high to 2.891% by the press time.
Germany’s Producer Price Index (PPI) for July, expected 32% YoY versus 32.7% prior, will provide immediate directions to EUR/USD. However, next week’s Fed Chair Jerome Powell’s speech at the Jackson Hole Symposium will be a crucial catalyst for clear directions.
Technical analysis
EUR/USD bears cheer a clear downside break of a three-week-old ascending trend line, around 1.0180 by the press time, to aim for the parity level of 1.0000. However, the RSI conditions challenge the quote’s further weakness past the yearly low of 0.9952.
05:10
Gold Price Forecast: Firmer DXY directs XAU/USD bears towards $1,730
- Gold price remains pressured at monthly low, down for the fifth consecutive day.
- Recession fears, hawkish Fedspeak underpin US dollar strength amid sluggish session.
- Anxiety ahead of Jackson Hole, G20 chatters also weigh on XAU/USD prices.
Gold price (XAU/USD) takes offers to renew monthly low near $1,750 during early Friday morning in Europe. In doing so, the bullion prices register the five-day downtrend as the US dollar bulls cheer recession woes, as well as firmer US data and hopes of the Fed’s aggression vis-à-vis rate hikes.
US Dollar Index (DXY) rises to a four-week high of 107.72, up for the third consecutive day, around 107.68 by the press time, amid multiple catalysts ranging from hawkish comments from the Fed policymakers to upbeat data at home, as well as geopolitical fears surrounding China and Europe.
Recently, Bloomberg came out with the news that Chinese President Xi Jinping and Russian President Vladimir Putin plan to attend a Group of 20 Summit to be held in Bali later this year, Indonesian President Joko Widodo said in an interview. The news also mentioned that it was the first time the leader of the world’s fourth-most populous nation confirmed both of them were planning to show up at the November summit. The news adds to the market’s anxiety and fears of more drama, which in turn contributed to the flight to safety and helped the DXY to refresh the monthly high after the release.
Previously, San Francisco Fed President Mary Daly backed either 50 basis points or a 75 basis points hike while signaling the move for the September rate decision whereas Minneapolis Federal Reserve Neel Kashkari mentioned that, per Reuters, he does not believe the county is currently in a recession.
Elsewhere, the all-time hawk St. Louis Fed President James Bullard said he is leaning towards another 75 bps rate hike in September. “Trading in futures contracts tied to the Fed's policy rate suggested investors see that rate rising to a range of 3.50%-3.75% by March of next year, but then starting to fall a few months later,” said Reuters. That said, the current range of the Fed’s benchmark rates is 2.25-2.50%.
The hawkish Fedspeak seems to have taken clues from the upbeat US Philadelphia Fed Manufacturing Survey and softer prints of the weekly Initial Jobless Claims of late.
Amid these plays, Wall Street closed mixed and exert down pressure on the S&P 500 Futures, down 0.17% intraday at the latest. Further, the US 10-year Treasury yields reverse the previous day’s retreat from the monthly high to 2.891% by the press time.
Looking forward, a light calendar can restrict XAU/USD moves but market fears and a firmer US dollar may keep bears happy ahead of the next week’s Fed Chair Jerome Powell’s speech at the Jackson Hole Symposium.
Technical analysis
A sustained downside trading below the 50-DMA and 21-DMA joins the first bearish MACD signals in a month to keep gold sellers hopeful of witnessing further declines in the XAU/USD.
However, the previous resistance line from April, around $1,731 by the press time, appears a tough nut to crack for the metal sellers.
Also acting as a downside filter is the $1,700 threshold and the yearly bottom surrounding $1,680.
Alternatively, recovery moves need to cross the aforementioned moving averages to regain the buyer’s confidence. That said, the 21-DMA hurdle of $1,765 restricts immediate upside ahead of the 50-DMA level near $1,775.
Following that, the $1,800 round figure and the monthly peak of $1,807 will be crucial for the gold buyers to retake control.
Gold: Daily chart
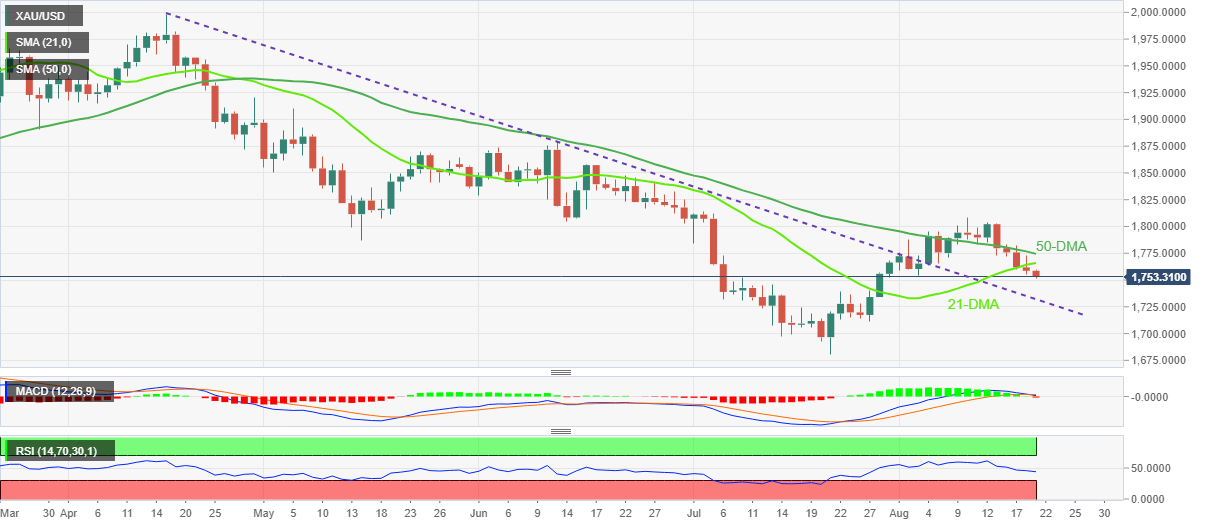
Trend: Further downside expected
04:45
Asian Stock Market: NZX 50 drops 1.0% amid mixed markets, firmer yields
- Asian stocks trade mixed outside New Zealand as traders await more clues from China, trace Wall Street’s inaction.
- US 10-year Treasury yields poke monthly high amid recession fears, hawkish Fedspeak.
- RBNZ’s Orr, mixed trade numbers for July weigh on NZX 50.
Markets in the Asia-Pacific region trade mixed, except for New Zealand, as traders await more clues to dissent the latest recession woes. Also keeping traders on sidelined are the chatters over China’s upcoming stimulus and softer oil prices.
That said, the MSCI’s index of Asia-Pacific shares outside Japan drops 0.05% at the latest while Japan’s Nikkei 225 remains indecisive around 28,945 level. It’s worth noting that New Zealand’s benchmark NZX 50 drops near 1.0% as the Reserve Bank of New Zealand (RBNZ) Governor hints at more rate hikes while the trade numbers for July failed to impress buyers.
Further, the WTI crude oil remains pressured around the intraday low of $89.60 as fears of economic slowdown weigh on the energy benchmark. Also exerting downside pressure on the black gold is the firmer US dollar.
Elsewhere, Wall Street closed mixed and weighed on the S&P 500 Futures, down 0.17% intraday at the latest. Further, the US 10-year Treasury yields reverse the previous day’s retreat from the monthly high to 2.91% by the press time, up three basis points (bps) by the press time.
While portraying the broad market performance, Reuters mentioned that Chinese blue chips were flat, while South Korea lost 0.5%. “The threat of higher borrowing costs hung over markets as no less than four U.S. Federal Reserve officials signaled there was more work to do on interest rates, with the only difference being on how fast and high to go,” the news also mentioned.
It’s worth noting that a lack of major data/events also seems to limit the Asia-Pacific share traders’ capacity to move the markets. Further, the investors wait for the People’s Bank of China’s (PBOC) more action and the next week’s Jackson Hole meeting also challenges the investors of late.
04:21
USD/JPY Price Analysis: Bulls eye 137.00 amid four-day uptrend
USDJPY
- USD/JPY takes the bids to renew monthly high, up for the fourth consecutive day.
- Clear upside break of 50-DMA, one-month-old horizontal hurdle keeps buyers hopeful.
- RSI conditions signal limited upside room, highlighting seven-week-old horizontal resistance area.
USD/JPY prints a four-day uptrend as it refreshes the monthly peak around 136.40 during early Friday morning in Europe. In doing so, the yen pair justifies the previous day’s upside clearance of the one-month-old horizontal area, as well as the 50-DMA.
In addition to the breakout of previously key hurdles, bullish MACD signals also keep USD/JPY buyers from refreshing the monthly peak. However, the RSI approaches overbought territory and suggests limited room to the north.
As a result, a broad horizontal area comprising multiple levels marked since June 29, between 137.00 and 137.45, becomes should gain the market’s attention.
However, a clear upside break of the 137.45 mark won’t hesitate to refresh the yearly top marked in July around 139.40.
On the contrary, the resistance-turned-support area near 135.60 precedes the 50-DMA support of 135.45 to restrict the short-term USD/JPY downside.
Following that, an upward sloping support line from August 11, close to 134.15, will be in focus.
Should the USD/JPY bears manage to conquer the 134.15 support, the 134.00 round figure may act as a validation point for the south-run targeting the August 11 low near 131.75.
USD/JPY: Daily chart
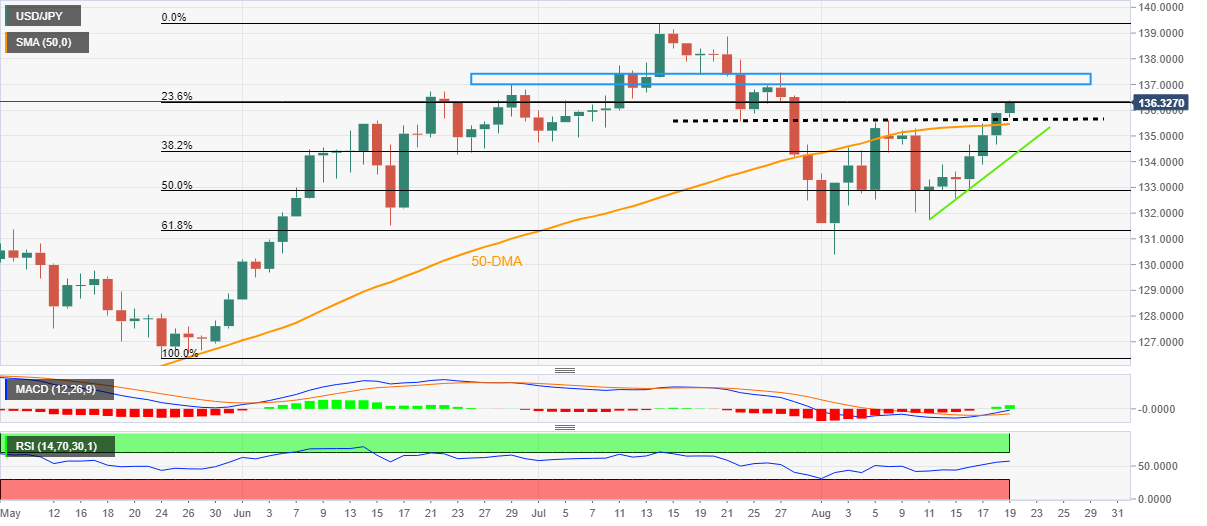
Trend: Limited upside expected
03:58
GBP/USD Price Analysis: Remains vulnerable near 1.1900 ahead of UK Retail Sales
- GBP/USD is off the lows but remains weak amid broad USD strength.
- The US dollar cheers upbeat economic data and hawkish Fedspeak.
- Technical indicators remain in favor of bears, with eyes on 1.1850.
GBP/USD is trading close to fresh monthly lows near 1.1900, as bears gather strength for the next push lower.
The US dollar is preserving the ongoing rally, backed by hawkish Fed commentary and upbeat Jobless Claims and Philly Fed Manufacturing guage, exerting beairsh pressures on the pair.
Meanwhile, markets remain cautious amid looming US-China risks and reports that Chinese President Xi Jinping and Russian President Vladimir Putin plan to attend a Group of 20 Summit to be held in Bali later this year.
Meanwhile, the British pound bears the brunt of the slump in the UK Consumer Sentiment, which hit a record low in August. The UK’s dire economic outlook and rampant inflation is likely to accentuate concerns surrounding the BOE’s next policy move.
The immediate focus now remains on UK Retail Sales, with consumer spending likely to show yet another drop in the month of July,
As observed on cable’s daily chart, the triangle breakdown has opened floors towards the 1.1850 psychological level should the 1.1900 level cave in.
The 21-Daily Moving Average (DMA) and 50 DMA bearish crossover also add credence to the additional declines in the near term.
The 14-day Relative Strength Index (RSI) is trading flat but remains below the midline, keeping sellers hopeful.
GBP/USD: Daily chart
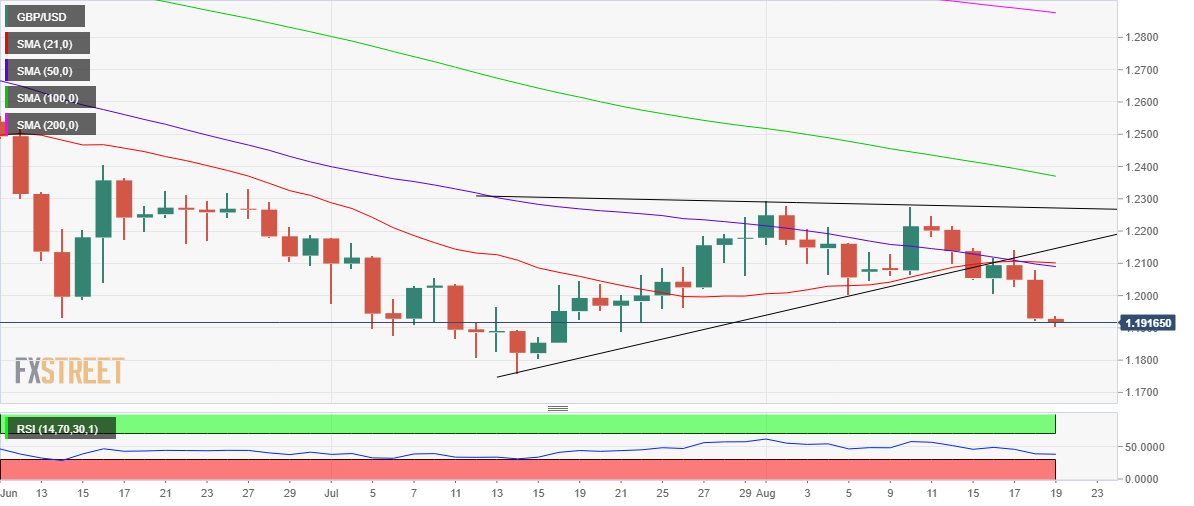
If buyers manage to hold onto the 1.1900 round figure, a tepid rebound towards 1.1950 could be in the offing.
Recapturing 1.2000 is critical to unleashing a sustained recovery from monthly troughs.
GBP/USD: Additional technical levels
03:58
Steel price snaps four-week uptrend as recession woes mount
- Steel prices drop for the second consecutive day, remains pressured around monthly low.
- Fears that China’s heatwave and covid conditions will weigh on profits from steel manufacturing challenge the buyers.
- Recession woes, higher prices of ingredients also test the metal buyers.
Steel price extends the previous day’s pullback from the weekly top, as bears attack the monthly low, amid a cluster of catalysts weighing on the quote during Friday’s Asian session. With this, the industrial metal is up for the first weekly loss in five.
Steel rebar futures on the Shanghai Futures Exchange (SFE) slipped 0.3% while hot-rolled steel coil shed 0.6% by the press time. Further, Stainless steel dropped the most with 1.2% daily loss at the latest.
China’s electricity rationing, due to a heatwave in the top steel-producing region, has forced some mills to halt operations. The same joins the recent increase in the dragon nation’s coronavirus count to add to hardships for the metal traders. Also, the US dollar strength and fears of global recession, not to forget the Sino-American tension over Taiwan, are extra catalysts that exert downside pressure on the steel price.
That said, Bloomberg came out with the news that Chinese President Xi Jinping and Russian President Vladimir Putin plan to attend a Group of 20 Summit to be held in Bali later this year, Indonesian President Joko Widodo said in an interview. The news also mentioned that it was the first time the leader of the world’s fourth-most populous nation confirmed both of them were planning to show up at the November summit. The news adds to the market’s anxiety and fears of more drama, which in turn contributed to the flight to safety and helped the US dollar to refresh the monthly high after the release.
The greenback’s latest gains could also be linked to the upbeat data and hawkish Fedspeak. Philadelphia Fed Manufacturing Survey rallied to 6.2 for August versus -5 expected and -12.3 prior while the weekly Initial Jobless Claims dropped to 250K, below 265K market consensus and 252K revised prior. Following the upbeat data, San Francisco Fed President Mary Daly mentioned that the (Fed) will continue to raise the rates to "right-size it." The policymaker added that either 50 basis points or a 75 basis points hike would be appropriate while signaling the move for the September rate decision. However, Minneapolis Federal Reserve Neel Kashkari mentioned that, per Reuters, he does not believe the county is currently in a recession. Further, the all-time hawk St. Louis Fed President James Bullard said he is leaning towards another 75 bps rate hike in September.
“Trading in futures contracts tied to the Fed's policy rate suggested investors see that rate rising to a range of 3.50%-3.75% by March of next year, but then starting to fall a few months later,” said Reuters. That said, the current range of the Fed’s benchmark rates is 2.25-2.50%.
To sum up, the recent jump in hawkish Fed bets joins the pessimism surrounding China to challenge steel traders.
03:43
USD/INR Price News: Indian rupee battles strong DXY near 80.00 as RBI teases policy response
- USD/INR struggles to defend bulls as it retreats after refreshing monthly high.
- RBI Bulletin hints that inflation numbers warrant policy response.
- Pullback in oil prices also challenges pair buyers.
- US dollar crosses key hurdle to refresh four-week top amid firmer US data, hawkish Fedspeak and risk-aversion.
USD/INR extends pullback from a three-week high as it takes offers to refresh intraday low near 79.70 during the initial Asian session. In doing so, the Indian rupee (INR) pair cheers softer oil prices and the latest hawkish signals from the Reserve Bank of India (RBI) while ignoring the firmer US dollar amid a broad risk-off mood.
“Inflation in India may still require a monetary policy response going forward as it remains above the target range even though it has eased in recent months, the Reserve Bank of India said in its monthly bulletin on Thursday,” per Reuters. The news also mentioned that India's consumer inflation dipped to 6.71% in July, easing for the third month in a row and helped by a slower increase in food and fuel prices but it remained above the RBI's 2% to 6% tolerance band for a seventh straight month.
That said, the WTI crude oil remains pressured around the intraday low of $89.60 as fears of economic slowdown weigh on the energy benchmark. Also exerting downside pressure on the black gold is the firmer US dollar. India’s reliance on energy imports and a record high trade deficit keeps the INR vulnerable to oil price moves.
Further, the US Dollar Index (DXY) begins Friday on a firmer footing as it refreshes the monthly high around 107.70, up for the third consecutive day. Recently, Bloomberg came out with the news that Chinese President Xi Jinping and Russian President Vladimir Putin plan to attend a Group of 20 Summit to be held in Bali later this year, Indonesian President Joko Widodo said in an interview. The news also mentioned that it was the first time the leader of the world’s fourth-most populous nation confirmed both of them were planning to show up at the November summit. The news adds to the market’s anxiety and fears of more drama, which in turn contributed to the flight to safety and helped the DXY to refresh the monthly high after the release.
Elsewhere, San Francisco Fed President Mary Daly mentioned that the (Fed) will continue to raise the rates to "right-size it." The policymaker added that either 50 basis points or a 75 basis points hike would be appropriate while signaling the move for the September rate decision. However, Minneapolis Federal Reserve Neel Kashkari mentioned that, per Reuters, he does not believe the county is currently in a recession. Further, the all-time hawk St. Louis Fed President James Bullard said he is leaning towards another 75 bps rate hike in September. “Trading in futures contracts tied to the Fed's policy rate suggested investors see that rate rising to a range of 3.50%-3.75% by March of next year, but then starting to fall a few months later,” said Reuters. That said, the current range of the Fed’s benchmark rates is 2.25-2.50%.
Amid the risk-off mood, Wall Street closed mixed but the S&P 500 Futures dropped 0.15% intraday at the latest. Further, the US 10-year Treasury yields reverse the previous day’s retreat from the monthly high to 2.90% by the press time.
Looking forward, USD/INR traders have little on the economic calendar to watch, which in turn highlights risk catalysts for fresh impulse.
Technical analysis
Unless providing a daily closing beyond the three-week-old ascending resistance line, around 79.88 by the press time, overbought RSI favors USD/INR sellers targeting the 50-DMA support, close to 79.15 at the latest.
02:54
EUR/USD bulls move in on a correction of the US dollar's parabolic rally
EURUSD
- EUR/USD bulls step in and give some much-needed stability to an otherwise sinking ship.
- The US dollar has been lit up by the Fed's hawkish narrative at the end of the week.
EUR/USD is attempting to correct from the lows of the day so far and is back to a flat position in the third hour of Tokyo's session. The single currency has travelled between a range of 1.0069 and 1.0092 so far for the final day of the week.
In Tokyo's open the greenback was lit up by news that President Xi Jinping and Russian leader Vladimir Putin are planning to attend a Group of 20 summit in the resort island of Bali later this year, according to Indonesian President Joko Widodo. This was reported by Bloomberg:
“Xi Jinping will come. President Putin has also told me he will come,” Jokowi, as the president is known, said in an interview with Bloomberg News Editor-in-Chief John Micklethwait on Thursday. It was the first time the leader of the world’s fourth-most populous nation confirmed both of them were planning to show up at the November summit.
02:39
Gold Price Forecast: XAU/USD bears step on the gas as the US dollar runs higher
- Gold is under pressure as the US dollar goes parabolic into the final day of the week.
- The bears are fuelled by prospects of geopolitical angst as well as the ongoing hawkish narrative at the Fed.
Gold prices have been under pressure at the start of Friday, hitting a three-week low and as Reuters reports, the yellow metal is heading for its first weekly decline in five. At the time of writing, gold is trading at $1,755 while the greenback consolidates after a parabolic move due to prospects of more rate hikes by the U.S. Federal Reserve and the return of geopolitical angst. Spot gold The precious metal was down 0.2% after falling to its lowest since July 29 at $1,753.68 in early Asian trading. For the week so far, the metal is down 2.5%.
There was an article that did the rounds by Bloomberg as the Tokyo session opened that sent the US dollar bid and risk-off. The article reported on President Xi Jinping's and Russian leader Vladimir Putin's plans to attend a Group of 20 summit on the resort island of Bali later this year, Indonesian President Joko Widodo said.
“Xi Jinping will come. President Putin has also told me he will come,” Jokowi, as the president is known, said in an interview with Bloomberg News Editor-in-Chief John Micklethwait on Thursday. It was the first time the leader of the world’s fourth-most populous nation confirmed both of them were planning to show up at the November summit.
02:32
USD/CHF leans bullish towards 0.9600 on upbeat options market signals
USDCHF
USD/CHF rises to the fresh high in two weeks as broad US dollar strength joins firmer upbeat options market signals during Friday’s Asian session. That said, the Swiss currency (CHF) pair prints a five-day uptrend to refresh a fortnight’s peak around 0.9585, at 0.9575 by the press time.
One-month risk reversal (RR), the difference between the call options and put options, jumps to the highest since August 04 as the daily figure marks 0.070 level by the end of Thursday’s North American session. In doing so, the options market indicator rises for the third consecutive day.
It’s worth noting that the weekly RR also reverses the previous losses and adds some more gains as it rises to 0.170 by the press time, versus the -0.15.
Elsewhere, the US Dollar Index (DXY) begins Friday on a firmer footing as it refreshes the monthly high around 107.70, up for the third consecutive day. While seeking catalysts for the latest DXY strength, firmer US data, hawkish Fedspeak and geopolitical/economic risks gain major attention.
Moving on, Swiss Industrial Production for the second quarter (Q2), prior 7.9%, will be important for USD/CHF pair traders to watch for clear directions. However, major attention should be given to qualitative factors for precision.
Also read: Forex Today: Dollar soars on hopes the US could avoid recession despite the aggressive Fed
02:30
Commodities. Daily history for Thursday, August 18, 2022
| Raw materials | Closed | Change, % |
|---|---|---|
| Silver | 19.542 | -1.32 |
| Gold | 1758.65 | -0.22 |
| Palladium | 2151.2 | 0.78 |
02:22
USD/CNH Price Analysis: Bulls attack yearly high above 6.8200, bumpy road ahead
- USD/CNH refreshes four-month high as it crosses ascending resistance line from late May.
- Yearly peak, January 2020 swing low could challenge bulls as RSI approaches overbought territory.
- Bears remain cautious until witnessing a break of 2.5-month-old support line.
USD/CNH refreshed its five-month high with 6.8292 before retreating to 6.8185 during Friday’s Asian session.
In doing so, the offshore Chinese yuan (CNH) justifies the second break of an upward sloping resistance line from late May but struggles to gain acceptance amid buyer's fears of the bumpy road ahead, especially when the RSI (14) approaches overbought territory.
An area comprising a yearly top surrounding 6.8325-75 appears the first major hurdle for the USD/CNH bulls to tackle to keep control.
Following that, January 2020 low near 6.8455-60 could challenge the upside momentum.
In a case where the USD/CNH prices remain firmer past 6.8460, the 61.8% Fibonacci Expansion (FE) of April-June moves, near 6.9210, will be in focus.
Alternatively, pullback moves may retest the resistance-turned-support, close to 6.8000 by the press time.
However, the USD/CNH pair’s downside remains elusive until the quote stays beyond an ascending support line from early June, close to 6.7300 at the latest.
USD/CNH: Daily chart
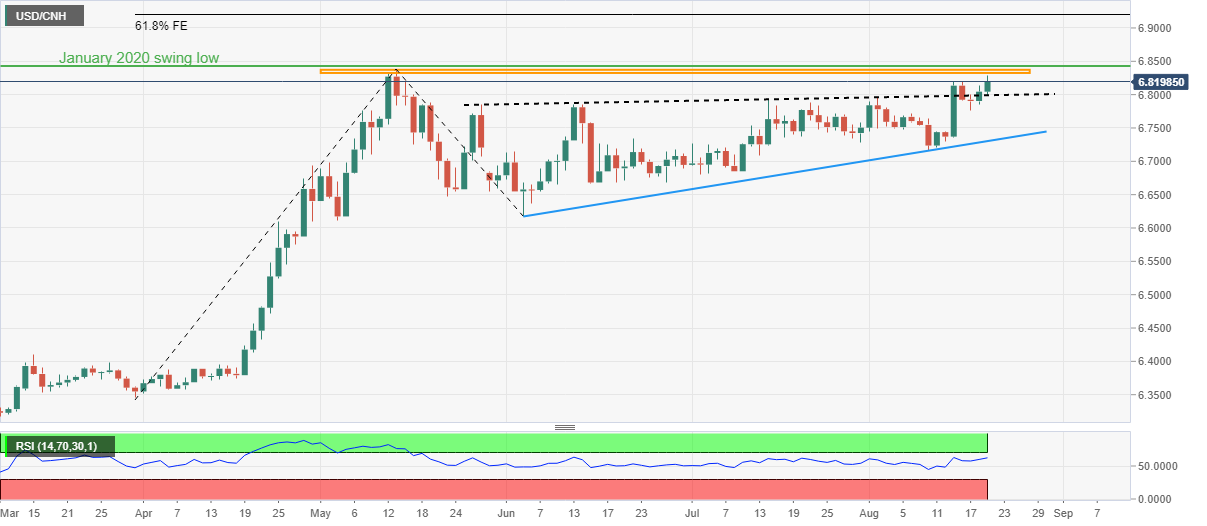
Trend: Limited upside expected
01:58
NZD/USD bears on roll towards 0.6200, ignore RBNZ’s Orr, mixed NZ trade data
- NZD/USD prints five-day downtrend to refresh two-week low.
- RBNZ’s Orr shows readiness to go beyond “neutral rate” if needed.
- New Zealand's trade deficit widened on YoY but eased on MoM, Imports-Exports rose during July.
- Risk-aversion, hawkish Fedspeak favor US dollar amid a light calendar.
NZD/USD stands on slippery grounds during the five-day downtrend, refreshing a two-week low to 0.6225 during Friday’s Asian session. In doing so, the Kiwi pair fails to cheer hawkish comments from the Reserve Bank of New Zealand (RBNZ) Governor Adrian Orr, as well as mixed trade numbers for New Zealand (NZ). The reason could be linked to broad US dollar strength amid firmer US data, hawkish Fedspeak and geopolitical/economic risks.
Early on Friday morning, RBNZ Governor Orr said that he wants the OCR unambiguously above neutral. The policymaker also stated that the domestic demand is running too fast, as well as labor resources are acutely scarce.
Elsewhere, New Zealand Trade Balance dropped to $-11.64B YoY versus $-10.94B prior while improving on MoM to $-1092M from $-1102M previous readings. Further, Imports grew to $7.77B from $7.38B whereas Exports rose to $6.68B compared to $6.27B prior.
On the other hand, the US Dollar Index (DXY) begins Friday on a firmer footing as it refreshes the monthly high around 107.70, up for the third consecutive day. Recently, Bloomberg came out with the news that Chinese President Xi Jinping and Russian President Vladimir Putin plan to attend a Group of 20 Summit to be held in Bali later this year, Indonesian President Joko Widodo said in an interview. The news also mentioned that it was the first time the leader of the world’s fourth-most populous nation confirmed both of them were planning to show up at the November summit. The news adds to the market’s anxiety and fears of more drama, which in turn contributed to the flight to safety and helped the DXY to refresh the monthly high after the release.
Talking about data, Philadelphia Fed Manufacturing Survey rallied to 6.2 for August versus -5 expected and -12.3 prior while the weekly Initial Jobless Claims dropped to 250K, below 265K market consensus and 252K revised prior.
That said, San Francisco Fed President Mary Daly mentioned that the (Fed) will continue to raise the rates to "right-size it." The policymaker added that either 50 basis points or a 75 basis points hike would be appropriate while signaling the move for the September rate decision. However, Minneapolis Federal Reserve Neel Kashkari mentioned that, per Reuters, he does not believe the county is currently in a recession. Further, the all-time hawk St. Louis Fed President James Bullard said he is leaning towards another 75 bps rate hike in September. “Trading in futures contracts tied to the Fed's policy rate suggested investors see that rate rising to a range of 3.50%-3.75% by March of next year, but then starting to fall a few months later,” said Reuters. That said, the current range of the Fed’s benchmark rates is 2.25-2.50%.
Additionally, pessimism surrounding China, as mentioned by Goldman Sachs and Nomura, joins the doubts over the People’s Bank of China’s (PBOC) capacity to tame recession woes to weigh on the Antipodeans.
Against this backdrop, Wall Street closed mixed and exert down pressure on the S&P 500 Futures, down 0.17% intraday at the latest. Further, the US 10-year Treasury yields reverse the previous day’s retreat from the monthly high to 2.891% by the press time.
Moving on, NZD/USD traders have little on the economic calendar to watch. However, risk catalysts will be crucial and can keep the Kiwi pair directed towards the monthly low.
Technical analysis
A daily closing below the one-month-old ascending support line, now resistance around 0.6280, directs AUD/USD bears towards the monthly low of 0.6195.
01:29
AUD/USD Price Analysis: Slides towards monthly support line near 0.6880
AUDUSD
- AUD/USD sellers keep reins during five-day downtrend to refresh fortnight low.
- Clear downside break of 200-SMA, bearish MACD signals direct sellers towards the key support line.
- Weekly resistance line adds to the upside filters, 61.8% Fibonacci retracement level becomes additional support.
AUD/USD remains on the back foot as sellers attack the 0.6900 threshold while poking the two-week low during Friday’s Asian session. In doing so, the Aussie pair drops for the fifth consecutive day while recently breaking the 200-SMA to the downside.
In addition to the downside break of the 200-SMA, bearish MACD signals also favor AUD/USD downside towards an upward sloping support line from July 21, at 0.6880 by the press time.
It’s worth noting, however, that the RSI (14) is approaching the oversold territory and may become a reason for the Aussie pair to bounce off the stated support line.
Even if the quote remains weak past 0.6880, the 61.8% Fibonacci retracement of July-August upside around 0.6850 could become an additional challenge for the AUD/USD bears before targeting the July 13 swing high near the 0.6800 round figure.
Alternatively, the 200-SMA and one-week-old descending resistance line, respectively near 0.6915 and 0.6935, could challenge intraday buyers of the AUD/USD pair.
Following that, a two-week-old horizontal resistance area near the 0.7000 psychological magnet will be crucial for the pair buyers to cross to retake control.
Overall, AUD/USD remains on the bear’s radar but the downside room appears limited.
AUD/USD: Four-hour chart
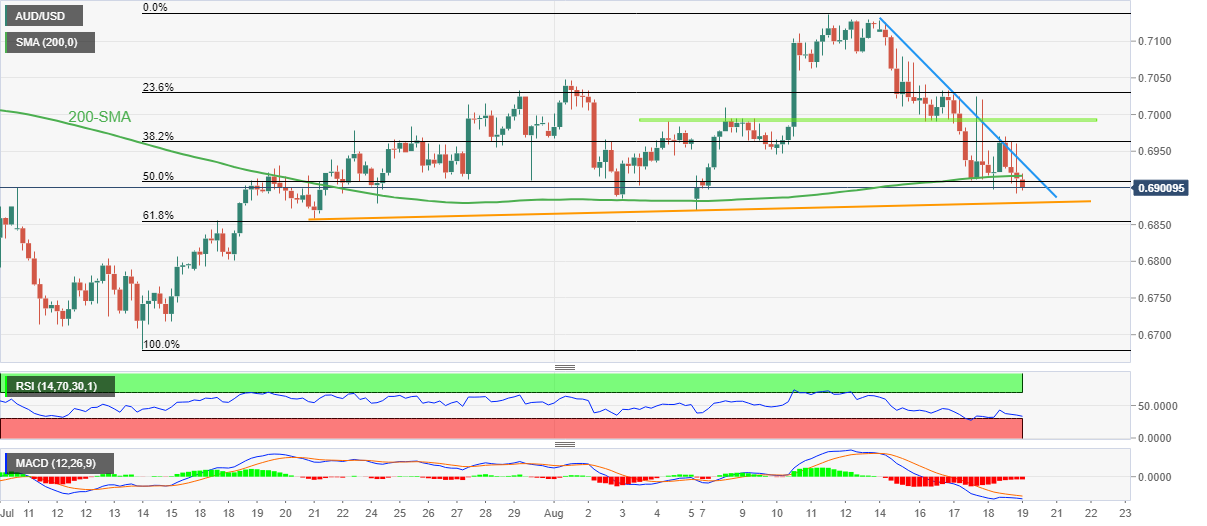
Trend: Further weakness expected
01:29
RBNZ governor Orr: Want the OCR unambiguously above neutral
The Reserve Bank of New Zealand's governor Adrian Orr is crossing the wires and has said that he wants the OCR unambiguously above neutral.
Key comments
Domestic demand is running too fast.
Labour resources are acutely scarce.
More to come...
01:24
USD/CNY fix: 6.8065 vs. est 6.8097
In recent trade today, the People’s Bank of China (PBOC) set the yuan (CNY) at 6.8065 vs. the estimated 6.8097 and prior 6.7802.
About the fix
China maintains strict control of the yuan’s rate on the mainland.
The onshore yuan (CNY) differs from the offshore one (CNH) in trading restrictions, this last one is not as tightly controlled.
Each morning, the People’s Bank of China (PBOC) sets a so-called daily midpoint fix, based on the yuan’s previous day's closing level and quotations taken from the inter-bank dealer.
01:18
USD/JPY has rallied to fresh highs on parabolic US dollar rally
USDJPY
- USD/JPY bulls have moved in on geopolitical angst and the hawkish Fed narrative.
- Bears are lurking in resistance that could lead to a significant correction.
USD/JPY has rallied to fresh session highs on Friday in the Tokyo open as news dropped that could stir a geopolitical risk-off scene among financial markets in the days ahead. At the time of writing, USD/JPY is trading 0.11% higher with the price reaching a fresh 107.687 high, rallying from 107.467.
Bloomberg's article circulated the wires as the Tokyo session opened that reported on President Xi Jinping's and Russian leader Vladimir Putin's plans to attend a Group of 20 summit in the resort island of Bali later this year, Indonesian President Joko Widodo said.
01:12
GBP/USD refreshes monthly low around 1.1900 ahead of UK Retail Sales
- GBP/USD drops to the fresh low in one month during three-day downtrend.
- UK Consumer Sentiment slumped to the record low in August.
- US dollar cheers rush to risk safety, firmer data and Fedspeak to refresh monthly peak.
- UK Retail Sales for July will be eyed closely after recently downbeat British data.
GBP/USD takes offers to renew its monthly low at 1.1905 during Friday’s Asian session, down for the third consecutive day amid pessimism concerning the UK’s economy, as well as hawkish Fedspeak and upbeat US data.
That said, the market’s latest move in favor of the US dollar could be linked to the increased anxiety over the Russia-Ukraine and the US-China tension as Bloomberg reported that Chinese President Xi Jinping and Russian President Vladimir Putin plan to attend a Group of 20 Summit to be held in Bali later this year, per Indonesian President Joko Widodo. The news also mentioned that it was the first time the leader of the world’s fourth-most populous nation confirmed both of them were planning to show up at the November summit.
Elsewhere, the UK’s GfK Consumer Sentiment Index refreshed a record-low to -44 in August from July's reading of -41. “British households are feeling "a sense of exasperation" about the surging cost of living which has pushed consumer sentiment to its lowest since at least 1974, according to the country's longest-running survey of household finances,” Reuters mentioned following the data release.
Earlier in the week, Britain reported unimpressive job numbers and firmer inflation data but couldn’t help the GBP/USD amid strong US economics and hawkish Fedspeak favored the pair bears.
That said, Philadelphia Fed Manufacturing Survey rallied to 6.2 for August versus -5 expected and -12.3 prior while the weekly Initial Jobless Claims dropped to 250K, below 265K market consensus and 252K revised prior.
Following the upbeat data, San Francisco Fed President Mary Daly mentioned that the (Fed) will continue to raise the rates to "right-size it." The policymaker added that either 50 basis points or a 75 basis points hike would be appropriate while signaling the move for the September rate decision. However, Minneapolis Federal Reserve Neel Kashkari mentioned that, per Reuters, he does not believe the county is currently in a recession. Further, the all-time hawk St. Louis Fed President James Bullard said he is leaning towards another 75 bps rate hike in September. “Trading in futures contracts tied to the Fed's policy rate suggested investors see that rate rising to a range of 3.50%-3.75% by March of next year, but then starting to fall a few months later,” said Reuters. That said, the current range of the Fed’s benchmark rates is 2.25-2.50%.
Against this backdrop, Wall Street closed mixed and exert down pressure on the S&P 500 Futures while the US 10-year Treasury yields reverse the previous day’s retreat from the monthly high to 2.891% by the press time.
Looking forward, UK Retail Sales for August, expected -3.3% YoY versus -5.8% prior, will be important for GBP/USD traders to watch for fresh directions.
Technical analysis
A downward sloping trend line from July 29, around 1.1880, could act as the last defense of the GBP/USD buyers, a break of which could renew the 2022 low, currently around 1.1760.
00:53
USD/CAD Price Analysis: Further upside hinges on 1.2980 breakout
- USD/CAD bulls keep reins around weekly high, up for the third consecutive day.
- One-month-old descending resistance line challenges immediate upside.
- RSI, MACD signals back buyers while sellers need validation from weekly support line, 21-DMA.
USD/CAD remains firmer for the third consecutive day, around 1.2960 during Friday’s Asian session after rising to the fresh high in two weeks the previous day. Even so, the Loonie pair is yet to cross the key resistance line from July 19.
It’s worth noting, however, that the firmer RSI (14) and the bullish MACD signals join the pair’s successful trading above the 21-DMA, as well as the one-week-old support line, to keep USD/CAD bulls hopeful of overcoming the immediate hurdle surrounding 1.2980.
Also acting as an upside filter is the 1.3000 psychological magnet, a break of which could give a free hand to the buyers during their run-up to June’s peak of 1.3078.
Alternatively, pullback moves remain elusive unless staying beyond the aforementioned support line near 1.2880, as well as the 21-DMA support of 1.2860.
Following that, the 50% Fibonacci retracement of the April-July upside and the monthly low, close to 1.2810 and 1.2725 in that order, will be important for the USD/CAD bears to watch.
Overall, USD/CAD prices are likely to remain firmer and can overcome the nearby resistance.
USD/CAD: Daily chart
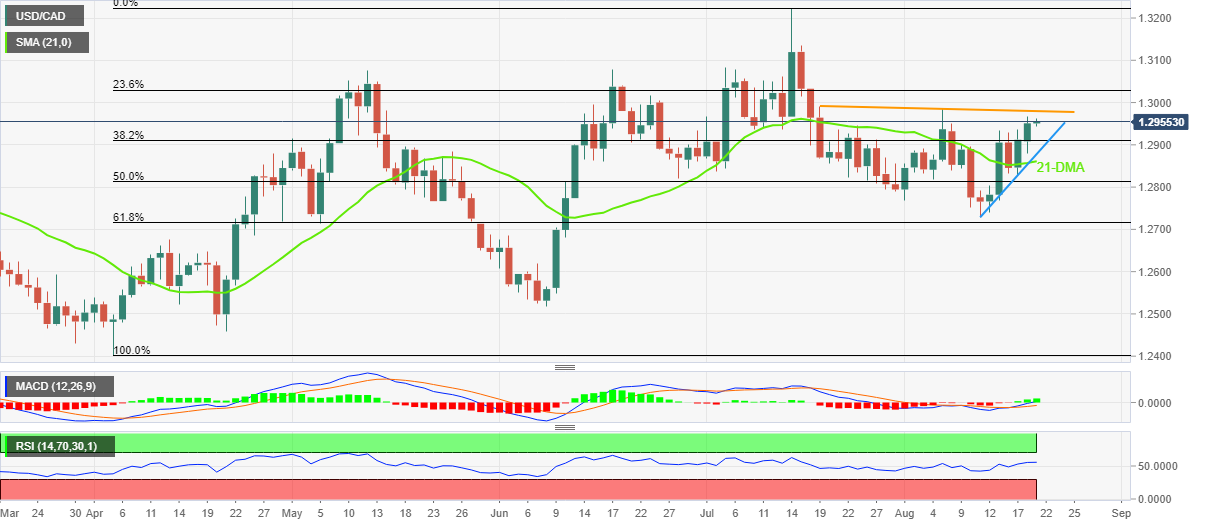
Trend: Further upside expected
00:34
US Dollar Index renews monthly high near 107.70 on Fed, economic concerns
- US Dollar Index prints three-day uptrend as buyers attack one-month high.
- US data, Fedspeak convince greenback buyers amid recession fears elsewhere.
- Talks surrounding G20 adds to the market’s anxiety and the US dollar strength.
- Yields regain upside momentum amid hawkish Fed bets.
US Dollar Index (DXY) begins Friday on a firmer footing as it refreshes the monthly high around 107.60, up for the third consecutive day, amid rush to risk safety. Also favoring the DXY bulls were recently firmer US data and hawkish comments from the Fed policymakers. Further, economic fears concerning Europe and China, as well as chatters over the next meeting of the leaders of the Group of Twenty (G20) key economies, also underpin the greenback’s demand.
Recently, Bloomberg came out with the news that Chinese President Xi Jinping and Russian President Vladimir Putin plan to attend a Group of 20 Summit to be held in Bali later this year, Indonesian President Joko Widodo said in an interview. The news also mentioned that it was the first time the leader of the world’s fourth-most populous nation confirmed both of them were planning to show up at the November summit. The news adds to the market’s anxiety and fears of more drama, which in turn contributed to the flight to safety and helped the DXY to refresh the monthly high after the release.
On a different page, Philadelphia Fed Manufacturing Survey rallied to 6.2 for August versus -5 expected and -12.3 prior while the weekly Initial Jobless Claims dropped to 250K, below 265K market consensus and 252K revised prior.
Following the upbeat data, San Francisco Fed President Mary Daly mentioned that the (Fed) will continue to raise the rates to "right-size it." The policymaker added that either 50 basis points or a 75 basis points hike would be appropriate while signaling the move for the September rate decision. However, Minneapolis Federal Reserve Neel Kashkari mentioned that, per Reuters, he does not believe the county is currently in a recession. Further, the all-time hawk St. Louis Fed President James Bullard said he is leaning towards another 75 bps rate hike in September. “Trading in futures contracts tied to the Fed's policy rate suggested investors see that rate rising to a range of 3.50%-3.75% by March of next year, but then starting to fall a few months later,” said Reuters. That said, the current range of the Fed’s benchmark rates is 2.25-2.50%.
Elsewhere, Goldman Sachs and Nomura both cut the dragon nation’s growth forecasts after witnessing the latest jump in the covid numbers. Also negatively impacting the Chinese economy are the doubts over the People’s Bank of China’s (PBOC) capacity to tame recession woes. Additionally, comments from the US Trade Representative’s office stating, “Early this autumn, the US and Taiwan will begin formal negotiations on a trade initiative,” seem to renew the fears of the US-China tussle and also roil the mood.
“The economic outlook for Germany, Europe's largest economy, is gloomy due to energy price rises and supply chain disruptions,” the German Finance Ministry said in its August monthly report, per Reuters.
Amid these plays, Wall Street closed mixed and exert down pressure on the S&P 500 Futures while the US 10-year Treasury yields reverse the previous day’s retreat from the monthly high to 2.891% by the press time.
Moving on, a light calendar could challenge momentum traders but risk catalysts are the key to watch.
Technical analysis
A daily closing beyond the five-week-old horizontal resistance, now support around 107.48-43, favors the US Dollar Index bulls to aim for the yearly high near 109.30.
00:32
Chinese President Xi and Russian President Putin to attend G20 in Indonesia
Bloomberg has reported that President Xi Jinping and Russian leader Vladimir Putin are both planning to attend a Group of 20 summit in the resort island of Bali later this year, Indonesian President Joko Widodo said.
“Xi Jinping will come. President Putin has also told me he will come,” Jokowi, as the president is known, said in an interview with Bloomberg News Editor-in-Chief John Micklethwait on Thursday. It was the first time the leader of the world’s fourth-most populous nation confirmed both of them were planning to show up at the November summit.
00:30
Stocks. Daily history for Thursday, August 18, 2022
| Index | Change, points | Closed | Change, % |
|---|---|---|---|
| NIKKEI 225 | -280.63 | 28942.14 | -0.96 |
| Hang Seng | -158.54 | 19763.91 | -0.8 |
| KOSPI | -8.42 | 2508.05 | -0.33 |
| ASX 200 | -14.9 | 7112.8 | -0.21 |
| FTSE 100 | 26.05 | 7541.85 | 0.35 |
| DAX | 70.7 | 13697.41 | 0.52 |
| CAC 40 | 29.08 | 6557.4 | 0.45 |
| Dow Jones | 18.72 | 33999.04 | 0.06 |
| S&P 500 | 9.7 | 4283.74 | 0.23 |
| NASDAQ Composite | 27.22 | 12965.34 | 0.21 |
00:15
Currencies. Daily history for Thursday, August 18, 2022
| Pare | Closed | Change, % |
|---|---|---|
| AUDUSD | 0.6912 | -0.31 |
| EURJPY | 137.074 | -0.31 |
| EURUSD | 1.00883 | -0.87 |
| GBPJPY | 162.095 | -0.4 |
| GBPUSD | 1.19302 | -0.97 |
| NZDUSD | 0.62552 | -0.3 |
| USDCAD | 1.29428 | 0.19 |
| USDCHF | 0.95618 | 0.49 |
| USDJPY | 135.875 | 0.57 |
00:07
WTI Price Analysis: Bulls approach $92.00 resistance confluence
- WTI crude oil prices remain firmer after bouncing off the key Fibonacci retracement support.
- 21-DMA, two-month-old descending trend line challenge upside momentum.
- Sluggish MACD, RSI rebound adds to the trading filters.
The price of WTI crude oil remains firmer around the weekly top, picking up bids to $90.30 during Friday’s Asian session.
That said, the black gold portrayed the biggest daily gains in a month the previous day while bouncing off the 61.8% Fibonacci retracement level of December 2021 to March 2022 upside, around $86.85 by the press time.
It’s worth noting, however, that the quote remains below a convergence of the 21-DMA and a downward sloping resistance line from mid-June, around $92.00. Also portraying the lack of upside momentum is the recently steady RSI and sluggish MACD signals.
Hence, the crude oil buyers should wait for a daily closing beyond $92.00 before lauding the latest success. Following that, a run-up towards the latest July swing high near $101.00 can’t be ruled out.
On the contrary, the aforementioned key Fibonacci retracement level surrounding $86.85 precedes the recent multi-month low, marked on Tuesday around $85.40, to restrict the short-term WTI downside.
In a case where energy bears keep reins below $85.40, the late January 2022 high near $81.70 may act as an intermediate halt before directing the prices towards the $80.00 threshold.
WTI: Daily chart
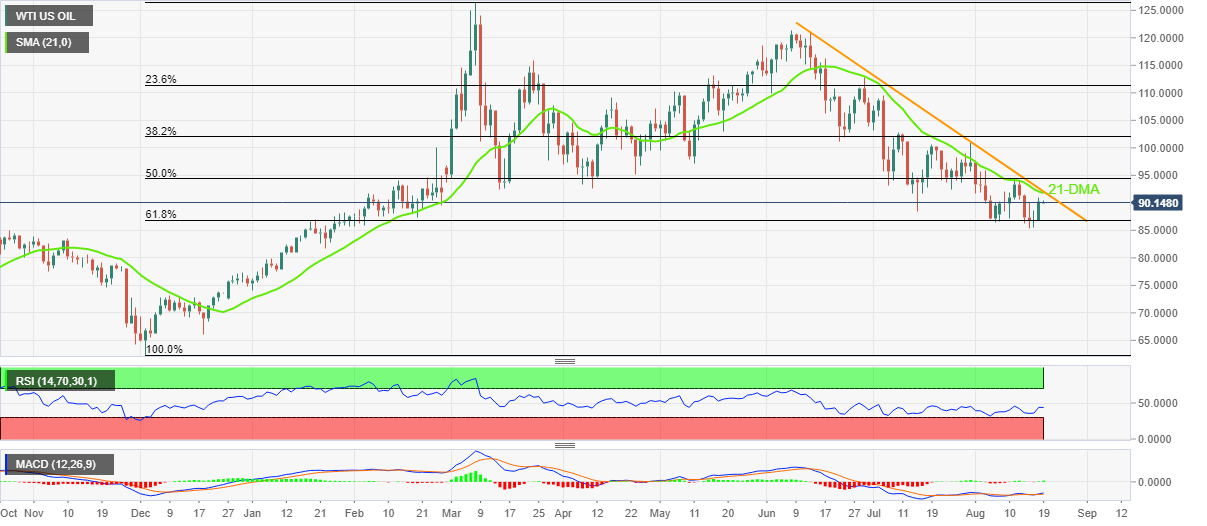
Trend: Further upside expected
Izaberi lokaciju / jezik


Unesite vaš zahtev
© 2000-2026. Sva prava zaštićena.
Sajt je vlasništvo kompanije Teletrade D.J. LLC 2351 LLC 2022 (Euro House, Richmond Hill Road, Kingstown, VC0100, St. Vincent and the Grenadines).
Svi podaci koji se nalaze na sajtu ne predstavljaju osnovu za donošenje investicionih odluka, već su informativnog karaktera.
The company does not serve or provide services to customers who are residents of the US, Canada, Iran, The Democratic People's Republic of Korea, Yemen and FATF blacklisted countries.
Izvršenje trgovinskih operacija sa finansijskim instrumentima upotrebom marginalne trgovine pruža velike mogućnosti i omogućava investitorima ostvarivanje visokih prihoda. Međutim, takav vid trgovine povezan je sa potencijalno visokim nivoom rizika od gubitka sredstava. Проведение торговых операций на финанcовых рынках c маржинальными финанcовыми инcтрументами открывает широкие возможноcти, и позволяет инвеcторам, готовым пойти на риcк, получать выcокую прибыль, но при этом неcет в cебе потенциально выcокий уровень риcка получения убытков. Iz tog razloga je pre započinjanja trgovine potrebno odlučiti o izboru odgovarajuće investicione strategije, uzimajući u obzir raspoložive resurse.
Upotreba informacija: U slučaju potpunog ili delimičnog preuzimanja i daljeg korišćenja materijala koji se nalazi na sajtu, potrebno je navesti link odgovarajuće stranice na sajtu kompanije TeleTrade-a kao izvora informacija. Upotreba materijala na internetu mora biti praćena hiper linkom do web stranice teletrade.org. Automatski uvoz materijala i informacija sa stranice je zabranjen.
Ako imate bilo kakvih pitanja, obratite nam se pr@teletrade.global.
транcфери