- Analiza
- Novosti i instrumenti
- Vesti sa tržišta
Forex-novosti i prognoze od 25-05-2023
- The oil price has faced selling interest after a recovery move to near $72.00 as OPEC is not expected to cut its overall output ahead.
- Continuous negotiations over US debt-ceiling issues indicate that a bipartisan will be there before the US Treasury meeting default.
- The oil price is at a make or a break level near the upward-sloping trendline plotted from May 04 low at $67.47.s
West Texas Intermediate (WTI), futures on NYMEX, have faced tough barricades after a recovery attempt to near $72.00 in the early Asian session. The oil price is anticipated to resume its downside journey further as OPEC is not expected to cut its overall output further in its next meeting on June 04.
Russian Deputy Prime Minister Alexander Novak said he expected no new steps from OPEC+ at its meeting on June 4. Contrary to that, Saudi Energy Minister Abdulaziz bin Salman had hinted at the possibility of another round of production cuts at the meeting.
The US Dollar Index (DXY) has corrected to near 104.21 as continuous negotiations between the White House and Republican leaders are indicating that a bipartisan will be there before the US Treasury meeting deadline of default.
A responsive selling action dragged the oil price sharply after it failed to sustain above the 50% Fibonacci retracement (plotted from April 12 high at $83.40 to May 03 low at $64.31) at $73.94 on a four-hour scale. Also, the 200-period Exponential Moving Average (EMA) at $73.72 acted as a barrier for the oil bulls.
The oil price is at a make or a break level near the upward-sloping trendline plotted from May 04 low at $67.47.
A slippage into the bearish range of 20.00-40.00 by the Relative Strength Index (RSI) (14) will trigger the downside momentum.
Going forward, a downside move below May 25 low at $71.03 will weigh heavily on the oil price and will drag it toward the crucial support at $70.00 followed by the 23.6% Fibo retracement at $68.88.
In an alternate scenario, a solid recovery above the 50% Fibo retracement at $73.94 will drive the asset toward a 61.8% Fibo retracement at $$76.16. Further recovery above the latter would expose the oil price to April 26 high at $77.86.
WTI four-hour chart
-638206552483363499.png)
- USD/JPY bounces off intraday low after retreating from six-month high.
- Tokyo Consumer Price Index eases to 3.2% YoY in May versus 3.9% expected, 3.5% prior.
- Hawkish BoJ signals, upbeat Japan economics lure Yen buyers.
- Risk aversion, strong US data puts a floor under the prices.
USD/JPY pares intraday losses around the 140.00 round figure, bouncing off the daily low, as it jumps back towards the Year-To-Date (YTD) high marked the previous day. That said, the Yen pair picks up bids after Japan’s inflation gauge eased during early Friday.
Tokyo Consumer Price Index (CPI) eased to 3.2% YoY from 3.5% previous readings and 3.9% market forecasts. On the same line is the Tokyo CPI ex Fresh Food while the Tokyo CPI ex Food, Energy edged higher but stays below the market forecasts for the said month.
Given the downbeat Japanese inflation, the Bank of Japan (BoJ) policymakers’ defense of easy money policies remains valid and favors the Yen pair buyers. On Thursday, Bank of Japan (BoJ) Governor Kazuo Ueda said that they could tweak the Yield Curve Control (YCC) strategy if the balance between the benefit and the cost of the policy were to shift, as reported by Reuters.
In addition to the BoJ concerns, strong Treasury bond yields and upbeat US data also underpin the USD/JPY pair’s strength as it remains near the highest levels since November 2022. On Thursday, the second estimation of the US Annualized Gross Domestic Product (GDP) for Q1 2023 was revised up to 1.3% versus 1.0% first forecasts. Further, the Chicago Fed National Activity Index for April improved to 0.07 from -0.37 prior and -0.02 market estimations. On the same line, Kansad Fed Manufacturing Activity improved to -2 for May compared to -21 previous readings and analysts’ estimations of -11. It’s worth noting that the US Pending Home Sales for April improved on YoY but eased on MoM whereas Core Personal Consumption Expenditures also rose to 5.0% during the preliminary readings versus 4.9% prior.
It should be noted that Japan’s economic optimism and looming fears of US debt ceiling expiration are extra catalysts that define the USD/JPY pair’s current status. Japanese Cabinet Office released the monthly assessment report on Thursday and raised the overall economic view for the first time since July 2022 in May. The government report also noted that the economy is 'recovering moderately'.
Against this backdrop, the US Dollar Index (DXY) rose to the highest levels in 10 weeks, to 104.20 at the latest, whereas the US 10-year and two-year Treasury bond yields rose to the early March highs of around 3.82% and 4.54% in that order. That said, Wall Street closed mixed but S&P500 Futures is mildly offered at the latest.
Having witnessed the initial reaction to Japan’s inflation numbers, the USD/JPY sellers may find it difficult to keep the reins amid the market’s risk-off mood and upbeat US data favoring the US Dollar, not to forget the upbeat yields. With this, the updates surrounding the US debt ceiling negotiations and a slew of the US data will be eyed for clear directions.
Technical analysis
Despite the latest pullback, a two-week-old ascending support line and the resistance-turned-support line stretched from mid-December 2022, respectively near 139.55 and 137.70, restrict short-term downside of the USD/JPY pair.
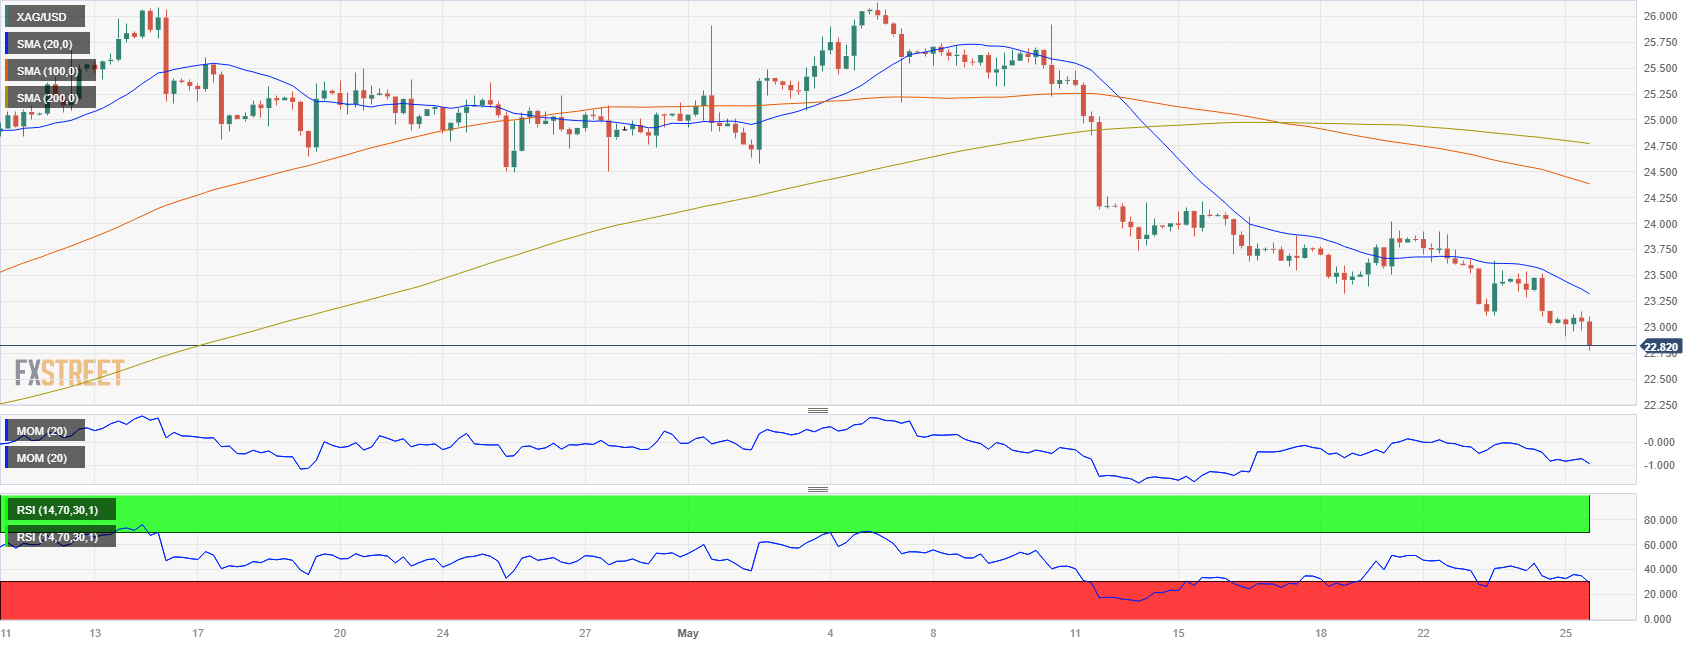
- Silver Price remains pressured at two-month low after four-day losing streak.
- Clear downside break of 200-day EMA, bearish MACD signals favor XAG/USD sellers.
- Oversold RSI (14) prods further downside of bullion.
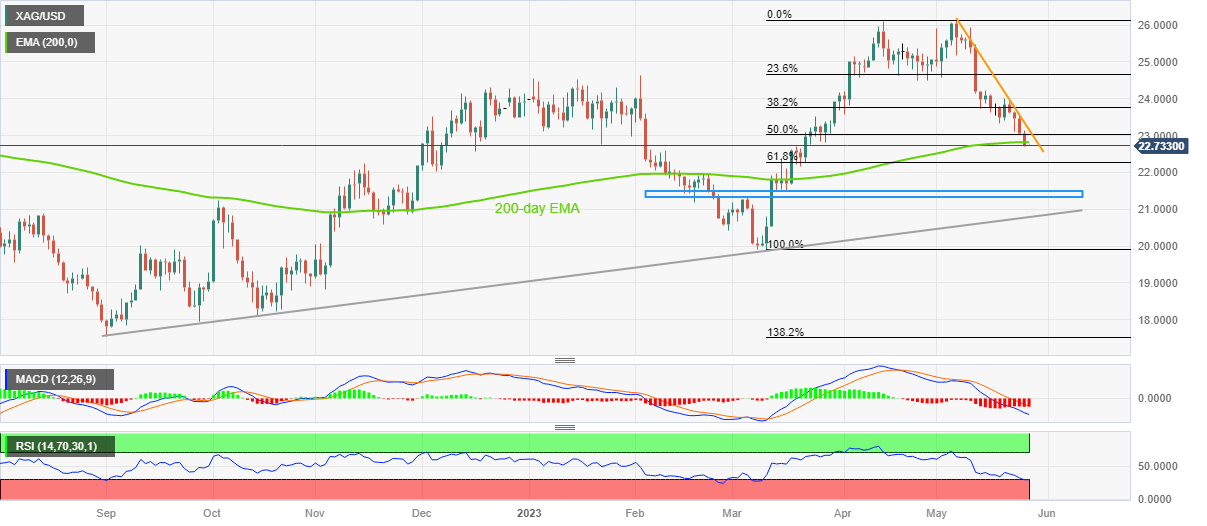
Silver Price (XAG/USD) stays on the back foot at around $22.75 after falling to the lowest levels since late March the previous day. That said, the precious metal declined in the last four consecutive days before licking its wounds on early Friday.
The XAG/USD’s latest fall broke the key 200-day Exponential Moving Average (EMA) support, now immediate resistance near $22.85, which in turn joins the bearish MACD signals to keep the Silver sellers hopeful. However, the oversold conditions of the RSI (14) line prod the metal’s further downside.
As a result, the quote is likely to decline towards the 61.8% Fibonacci retracement of its March-May upside around $22.30. However, the Silver Price weakness past the key Fibonacci retracement, also known as the golden Fibonacci ratio, appears difficult.
Even if the quote breaks the $22.30 Fibonacci ratio, a broad horizontal area comprising multiple levels marked since mid-February, near $21.50-30, could challenge the XAG/USD bears.
Following that, an upward-sloping support line from late 2022, around $20.80, will be in the spotlight.
On the contrary, the XAG/USD rebound past the 200-day EMA level of around $22.85 isn’t an open invitation to the Silver buyers as a convergence of the three-week-old descending trend line and 50% Fibonacci retracement, near $23.05, will check the metal’s further upside.
Silver Price: Daily chart
Trend: Limited downside expected
- USD/CHF is displaying a sideways performance above 0.9050 ahead of US Durable Goods Orders data.
- Weekly Fed emergency lending to banks fell to its lowest level since the banking sector ran into trouble in March.
- The overall market mood is still cautious as investors are worried that the US economy could announce a default
The USD/CHF pair is demonstrating topsy-turvy moves above 0.9050 in the early Tokyo session. The Swiss Franc asset is expected to remain sideways as investors have shifted their focus toward the release of the United States Durable Goods Orders data.
S&P500 futures have displayed some losses in early Asia after a solid recovery on Thursday. The overall market mood is still cautious as investors are worried that the United States economy could announce a default in making obligated payments due to diverged proposals from the White House and Republican leaders.
Meanwhile, House of Representatives Kevin McCarthy said it's difficult to reach an agreement after diverged opinions on budget’s spending but we're working and will keep working till we finish.
The US Dollar Index (DXY) has shown some exhaustion in the upside momentum after printing a fresh two-month high of 104.31 as the resilience in the United States economy is releasing heat.
Weekly Federal Reserve (Fed) emergency lending to banks fell to its lowest level since the banking sector ran into trouble in March, as reported by Reuters. Tighter credit conditions and bleak economic outlook have forced firms to operate with their ploughed-back profits and that too at reduced operating capacity. This could result in easing labor market conditions which would allow the Fed to remain neutral on interest rates in June’s monetary policy meeting.
Going forward, US Durable Goods Orders data (April) will remain in focus. The economic data is seen contracting by 1.0% against an expansion of 3.2% reported earlier.
On the Swiss Franc front, Q1 Employment Level data will be keenly watched. As per the preliminary report, the Swiss labor market has added fresh 35K employees in the first quarter.
- The US Dollar Index continues its climb, currently trading above 104.000, driven by robust US Treasury bond yields.
- A third consecutive daily close above the 200-day EMA could solidify a bullish outlook, putting 105.000 within reach.
- Downside risks persist, with a potential fall towards 103.000 if the DXY drops below the 200-day EMA.
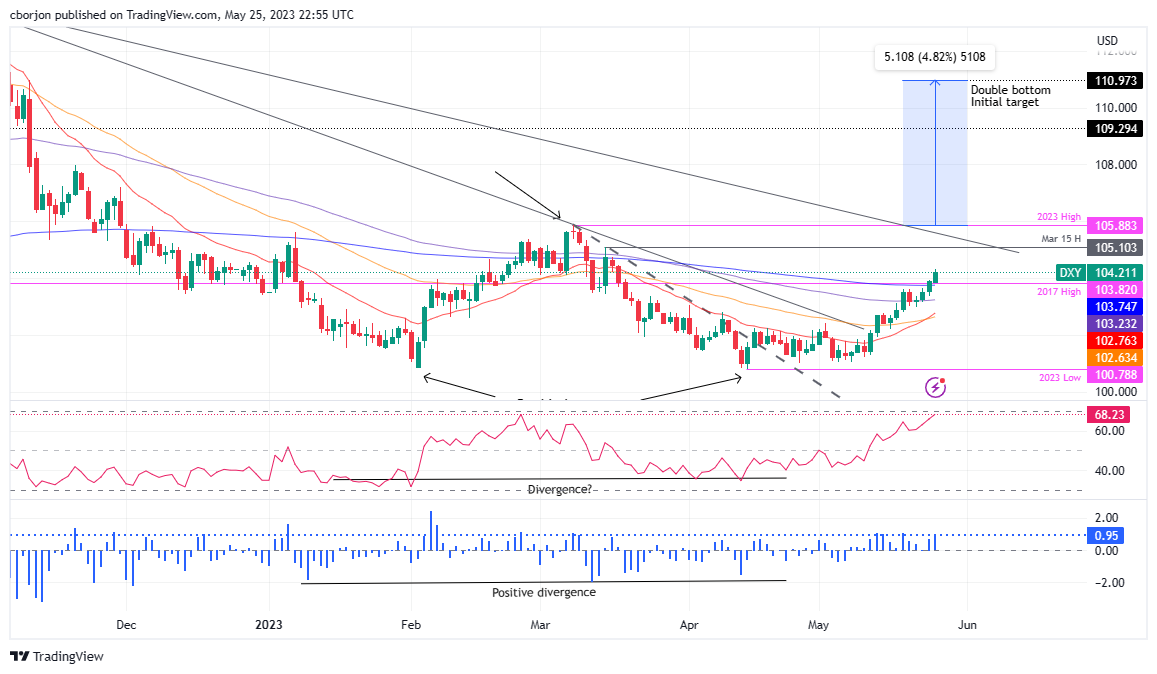
The US Dollar Index (DXY), which measures a basket of six currencies against the US Dollar (USD), extended its rally to four consecutive days, distances from the 200-day Exponential Moving Average (EMA) at 103.743, claimed on May 24, underpinned by high US Treasury bond yields. At the time of writing, the DXY is trading hands at 104.211, gaining 0.31%, with bulls eyeing the 105.000 mark.
US Dollar Index Price Analysis: Technical outlook
On Wednesday, I wrote, “The US Dollar Index is neutral to bullish biased, but it could cement its bias as bullish once the DXY achieves a decisive break above the 200-day EMA.” For two consecutive days, the DXY stays above the latter suggesting that bulls are gathering momentum. Nevertheless, a third daily close above the 200-day EMA could cement the bias as bullish, and with the double-bottom in play, the 105.000 is up for grabs.
Must read:
- US Dollar Index: Could a double bottom at the weekly chart drive the DXY to 111.000?
- US Dollar Index: Reclaims 200-day EMA, surpasses 2017 yearly high, as bulls stepped in eyeing 104.000
If the US Dollar Index claims the year-to-date (YTD) high of 105.883, that will validate the double-bottom chart pattern, but the buck must surpass crucial resistance levels on its uptrend. Meanwhile, the Relative Strength Index (RSI) indicator is in bullish territory, with some room before hitting overbought levels, while the 3-day Rate of Change (RoC) suggests that buyers are in charge.
If the DXY reclaims 104.000, the next resistance level to test would be the March 15 daily high of 105.103. Break above, and the DXY will have a clear run toward testing an eight-month-old resistance trendline around the 105.300-600 area, ahead of piercing the YTD high at 105.883
Downside risks for the DXY remain below the 200-day EMA, which could send the greenback sliding towards the 100-day EMA at 103.212. A clear break will send the DXY toward the May 22 swing low of 102.964, slightly below the 103.000 mark.
US Dollar Index Price Action – Daily chart
- NZD/USD fades bounce off the lowest levels in six months.
- RBNZ’s Deputy Governor Christian Hawkesby confirms easing of LVR restrictions, NZ Consumer Confidence stays flat in May.
- Firmer US data, fears of US default underpin US Dollar demand.
- Slew of US statistics ahead to entertain Kiwi pair traders, US debt ceiling headlines are the key.
NZD/USD licks its wounds at the lowest levels since November as the Reserve Bank of New Zealand (RBNZ) announces easing of lending restrictions on early Friday. Also exerting downside pressure on the Kiwi pair is the broadly firmer US Dollar and flat New Zealand Consumer Confidence. That said, the quote seesaws around 0.6060 by the press time after falling in the last three consecutive days to refresh the Year-To-Date (YTD) low.
"The risks to financial stability posed by high-LVR lending have reduced to a level where we believe the current restrictions may be unnecessarily reducing efficiency," said RBNZ Deputy Governor Christian Hawkesby while announcing the easing on the Loan-to-Value Restrictions (LVR).
On the other hand, New Zealand’s Consumer Confidence gauge slightly fell to 79.2 in May from April's 79.3, per the ANZ-Roy Morgan survey for May. "While the labour market remains tight, conferring both a high degree of job security and strong wage growth, ongoing cost of living increases, including higher mortgage rates for the 38% of households who have a mortgage, continue to bite," ANZ Chief Economist Sharon Zollner said in a statement, reported Reuters.
Elsewhere, the second estimation of the US Annualized Gross Domestic Product (GDP) for Q1 2023 was revised up to 1.3% versus 1.0% first forecasts. Further, the Chicago Fed National Activity Index for April improved to 0.07 from -0.37 prior and -0.02 market estimations. On the same line, Kansad Fed Manufacturing Activity improved to -2 for May compared to -21 previous readings and analysts’ estimations of -11. It’s worth noting that the US Pending Home Sales for April improved on YoY but eased on MoM whereas Core Personal Consumption Expenditures also rose to 5.0% during the preliminary readings versus 4.9% prior.
Apart from the upbeat US data, looming fears of the US default also allow the US Dollar to dominate. Recent, US House Speaker Kevin McCarthy announced no agreement on the debt deal, as well as continuation of talks by saying, “It’s hard. But we’re working and we’re going to continue to work until we get this done.”
Amid these plays, the US Dollar Index (DXY) rose to the highest levels in 10 weeks, to 104.20 at the latest, whereas the US 10-year and two-year Treasury bond yields rose to the early March highs of around 3.82% and 4.54% in that order. That said, Wall Street closed mixed but S&P500 Futures is mildly offered at the latest.
Moving on, multiple US data stand tall to direct the NZD/USD moves, apart from the US debt ceiling negotiations. . Among them, the US Durable Goods Orders for April and the Core Personal Consumption Expenditure (PCE) Price Index for the said month, known as the Fed’s preferred inflation gauge, will be crucial to watch.
Technical analysis
A daily closing below an upward-sloping support line from mid-November, now immediate resistance around 0.6100, keeps the NZD/USD bears hopeful.
- USD/CAD is eyeing a break above the immediate resistance of 1.3640 amid broader strength in the US Dollar.
- Oil prices tumbled after Russian Novak said he expected no new steps from OPEC+ at its meeting on June 4.
- The US Dollar bulls have got strength after climbing above the downward-sloping trendline plotted from 1.3862.
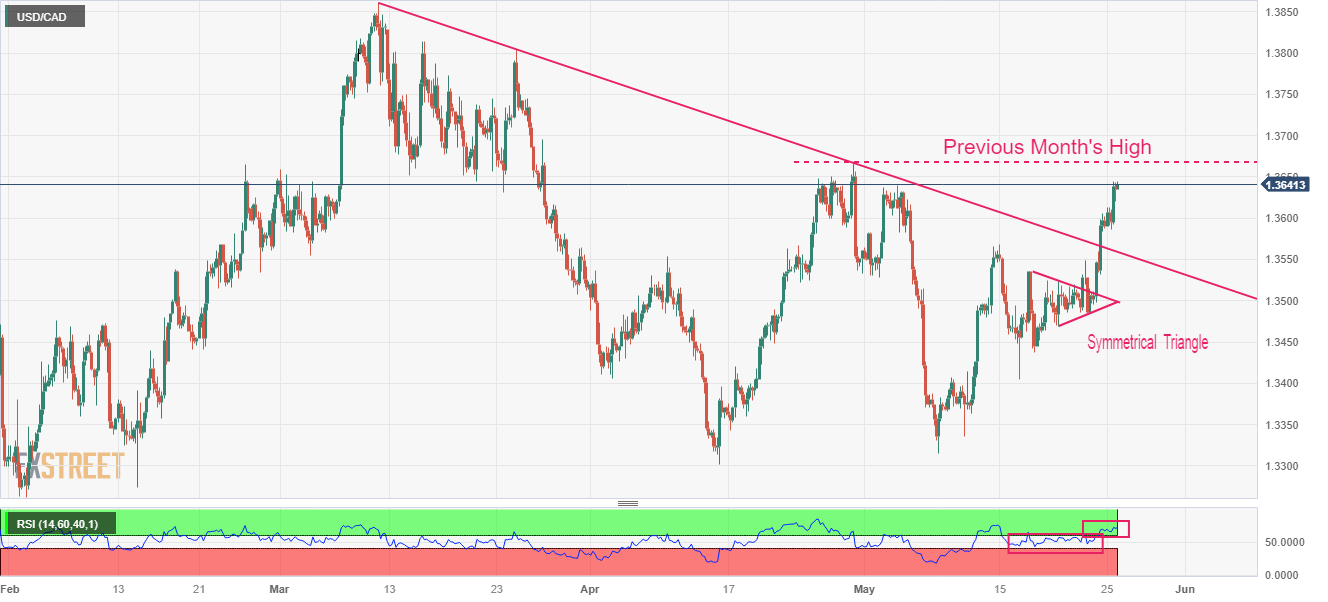
The USD/CAD pair is gathering strength for a break above the immediate resistance of 1.3640 in the early Asian session. The Loonie asset remained in bullish territory amid strength in the US Dollar Index (DXY) and a weakness in the oil price.
Oil prices tumbled after Russian Deputy Prime Minister Alexander Novak said he expected no new steps from OPEC+ at its meeting on June 4. At the press time, the oil price has shown some recovery, however, the downside bias is still solid. It is worth noting that Canada is the leading exporter of oil to the United States and lower oil prices impact the Canadian Dollar significantly.
The US Dollar Index (DXY) has corrected marginally after a solid upside after the White House Communications Director said we are getting closer to a deal on the debt ceiling. Going forward, US Durable Goods orders data (April) will remain in the spotlight.
USD/CAD has shown a stellar upside action after a breakout of the Symmetrical Triangle formed on a four-hour scale. The US Dollar bulls have got strength after climbing above the downward-sloping trendline plotted from March 10 high at 1.3862. The Loonie asset is approaching the previous month’s high at 1.3668.
A range shift move by the Relative Strength Index (RSI) (14) into the 60.00-80.00 territory from the 40.00-60.00 zone indicates that the upside momentum has been triggered.
Investors should wait for a marginal correction to near the immediate support of 1.3610 for a fresh buy, which will deliver gains till the previous month’s high at 1.3668 followed by the round-level resistance at 1.3700.
On the flip side, a break below May 23 high at 1.3550 will drag the asset toward the psychological support at 1.3500. A breakdown below the latter will expose the Loonie asset to April 20 low at 1.3448.
USD/CAD four-hour chart
"Negotiators will continue working to get a deal on the debt ceiling," U.S. House Speaker Kevin McCarthy said on Thursday as Republicans and Democrats race to secure an agreement and avoid default.
More to come
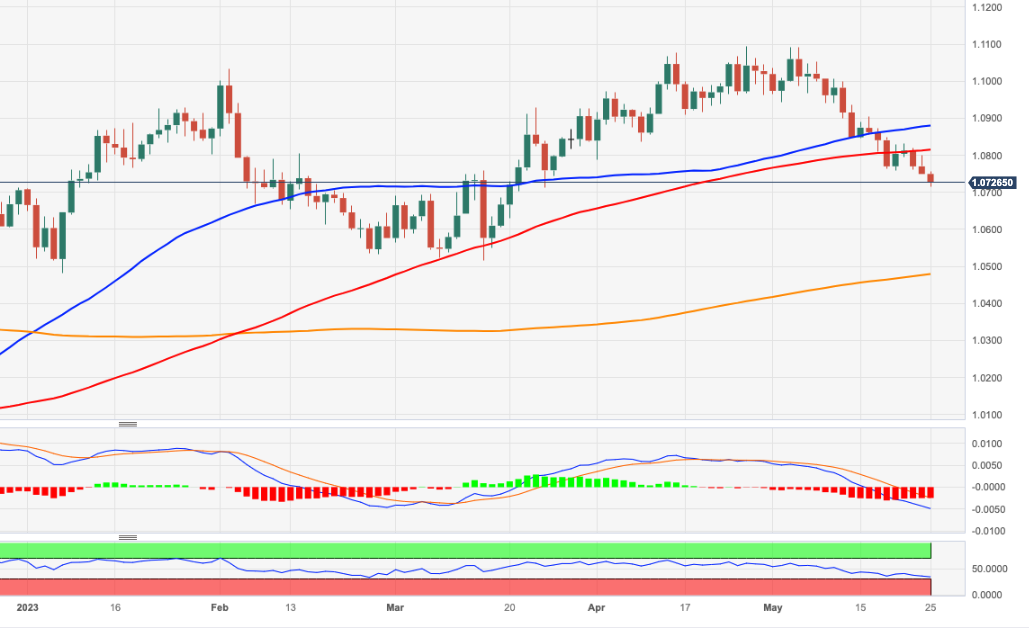
- EUR/USD dips to 1.0707 amidst soaring US Treasury bond yields, but mixed market sentiment prevents a steeper fall.
- The pair could witness further losses if sellers successfully reclaim the 1.0700 mark, shifting the bias downward.
- Staying above 1.0700 could lead to a EUR/USD comeback, with 1.0900 in sight if key resistance levels are broken.
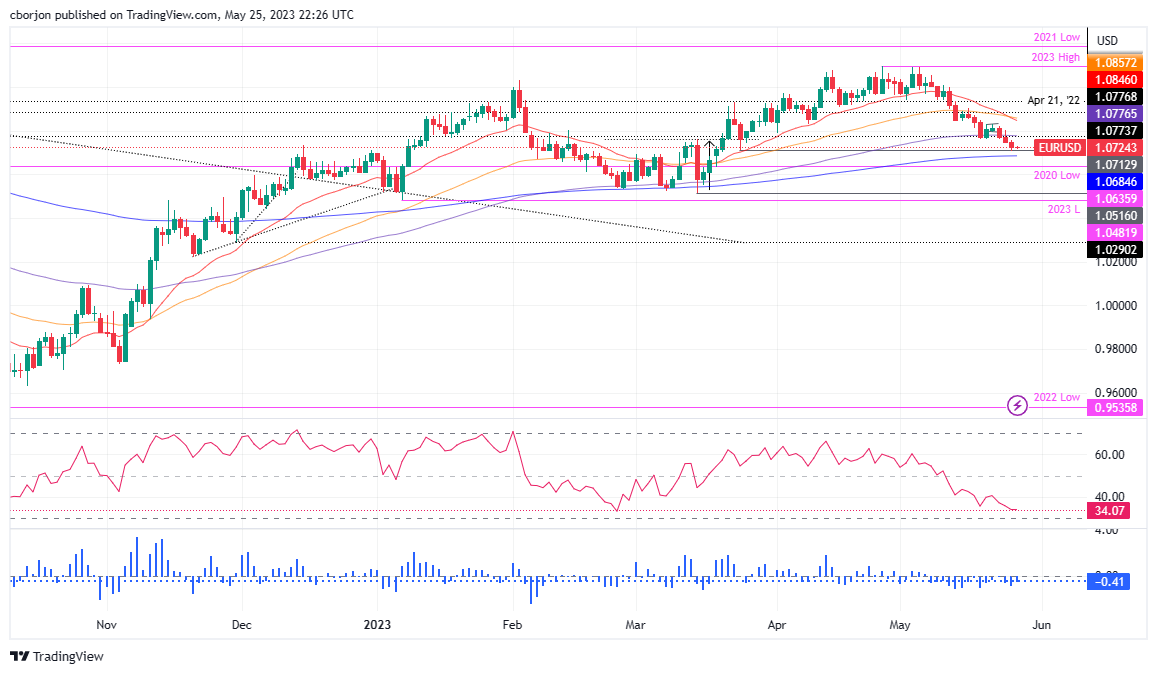
EUR/USD hit a new two-month low at around 1.0707, though it remains neutral to downward biased unless the pair suffers more weakness, which could send the EUR/USD sinking below the 1.0700 mark toward the 200-day Exponential Moving Average (EMA) at 1.0684. Nevertheless, a mixed market sentiment capped the Euro{s (EUR) fall, even though US Treasury bond yields skyrocketed, underpinning the US Dollar (USD). As the Asian session begins, the EUR/USD trades at 1.0727, up 0.02%.
EUR/USD Price Analysis: Technical outlook
Two days ago, the EUR/USD slumped below the 100-day Exponential Moving Average (EMA) at 1.0776, with sellers taking advantage of it, as the EUR/USD registered three straight sessions of losses. Although the pair will likely print additional losses, sellers must reclaim the 1.0700. That would leave the pair exposed, and once the EUR/USD dives below the 200-day EMA, that would shift the pair bias downwards.
That said, the EUR/USD first support would be the 2020 yearly low of 1.0636, ahead of falling to 1.0600. Break below will expose the March 15 daily low of 1.0516 before dropping to the year-to-date (YTD) low of 1.0482.
Conversely, if EUR/USD stays afloat above 1.0700, the EUR/USD could stage a comeback, initially to the 100-day EMA at 1.0776. A breach of the letter will expose 1.0800 before the EUR/USD threatens the confluence of technical indicators, like the 50 and 20-day EMAs, at around 1.0845-1.0857. Once the intersection gives way, 1.0900 is on the cards.
EUR/USD Price Action – Daily chart
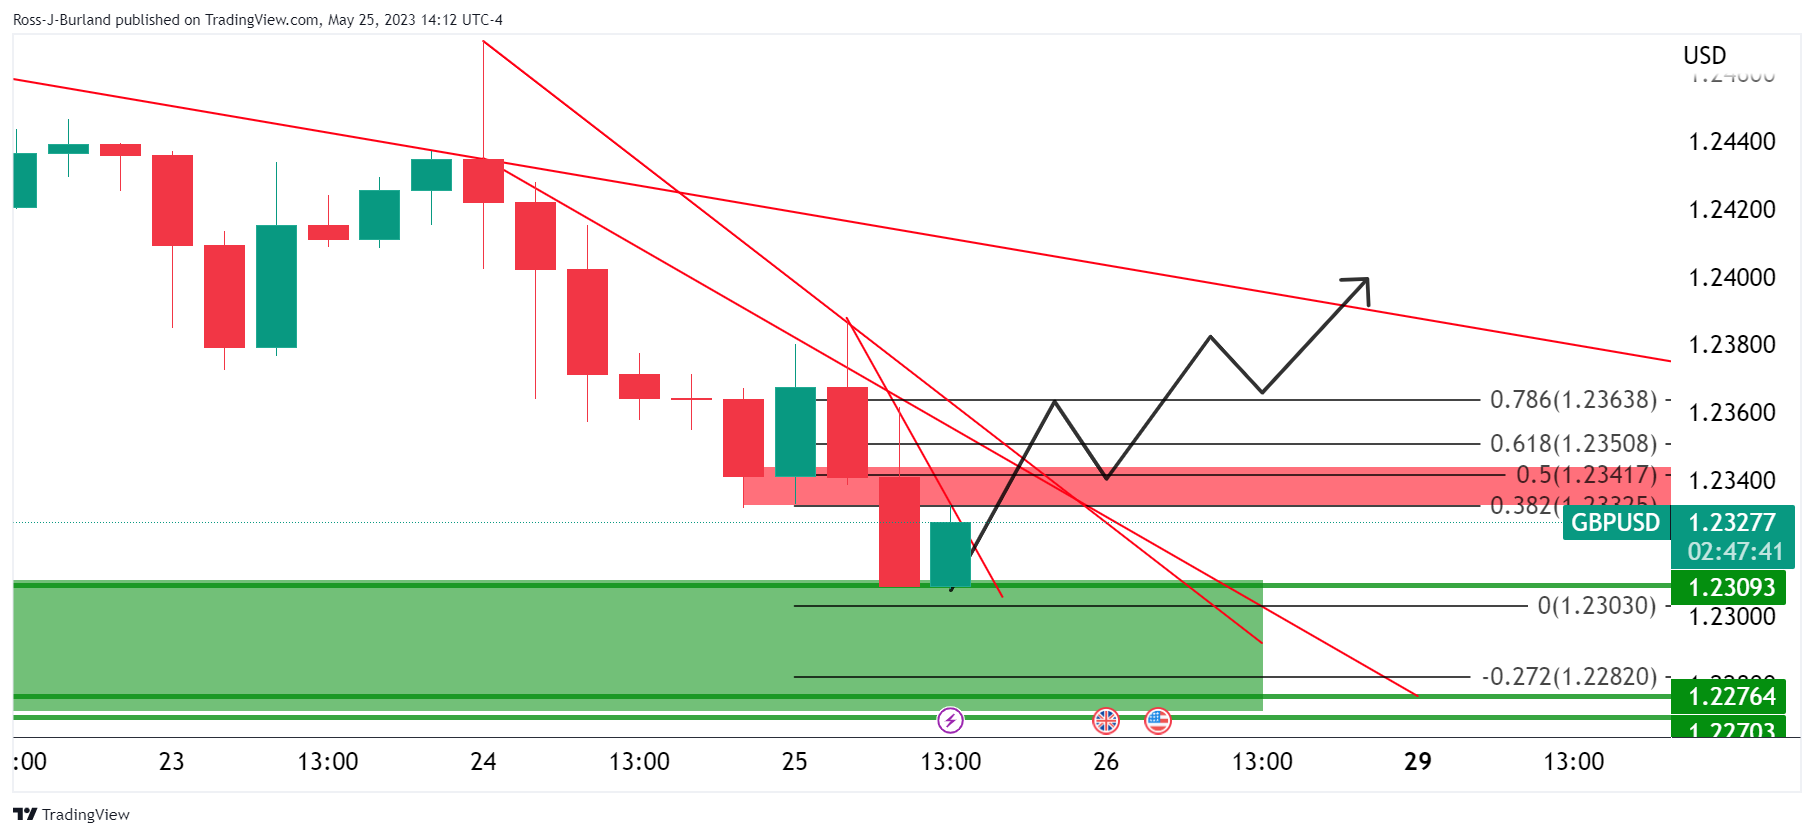
- GBP/USD stays depressed at the lowest levels in seven week after falling in the last four consecutive days.
- Broad US Dollar strength amid cautious markets, hawkish Fed talks and firmer US data weigh on Pound Sterling.
- US debt ceiling negotiations remain dicey, the latest easing of differences appears promising.
- UK Retail Sales, US Durable Goods Orders and PCE Price Index will be important to watch on the calendar.
GBP/USD bears take a breather at the lowest levels since early April, making rounds to 1.2320-25 after falling in the last four consecutive days. In doing so, the Cable pair bears the burden of the upbeat US data, hawkish Federal Reserve bets and the market’s rush towards US Dollar amid the looming US default. That said, the hawkish comments from the Bank of England (BoE) officials fail to inspire the Cable pair buyers ahead of today’s UK Retail Sales and a slew of the US data.
On Thursday, the second estimation of the US Annualized Gross Domestic Product (GDP) for Q1 2023 was revised up to 1.3% versus 1.0% first forecasts. Further, the Chicago Fed National Activity Index for April improved to 0.07 from -0.37 prior and -0.02 market estimations. On the same line, Kansad Fed Manufacturing Activity improved to -2 for May compared to -21 previous readings and analysts’ estimations of -11. It’s worth noting that the US Pending Home Sales for April improved on YoY but eased on MoM whereas Core Personal Consumption Expenditures also rose to 5.0% during the preliminary readings versus 4.9% prior.
At home, the UK energy regulator, Ofgem, announced a reduction in its price cap on household energy bills from July to an annual level of GBP2,074 ($2,617.60) for a typical dual-fuel household. The same could help the UK to ease inflation and could provide headwinds to the GBP/USD pair.
That said, Bank of England (BoE) policymaker Jonathan Haskel recently said, “Further increases in bank rates cannot be ruled out.” On the contrary, Richmond Fed President Thomas Barkin said, “Fed is in a test and learn situation to determine how slowing demand lowers inflation.” On the different front, Boston Federal Reserve President Susan Collins said on Thursday that the Fed "may be at or near" the time to pause interest rate increases, as reported by Reuters.
It’s worth noting that the market’s recent disbelief in the BoE officials’ hawkish comments and ignorance of the upbeat British data keeps the Pound Sterling on the bear’s radar, especially amid firmer US data and the calls for further rate hikes from the Federal Reserve.
Additionally, the concerns about US policymakers’ inability to clinch a deal on the US debt ceiling extension, as well as the latest chatters suggesting a $70.0 gap left to be filled by the negotiators to get the much-awaited deal also weigh on the XAU/USD prices, via the firmer US Dollar and yields.
That said, the US Dollar Index (DXY) rose to the highest levels in 10 weeks, to 104.20 at the latest, whereas the US 10-year and two-year Treasury bond yields rose to the early March highs of around 3.82% and 4.54% in that order.
Looking ahead, the UK Retail Sales for April, expected 0.3% MoM versus -0.9% prior, will precede a slew of the US data to direct intraday moves of the GBP/USD pair. Among them, the US Durable Goods Orders for April and the Core Personal Consumption Expenditure (PCE) Price Index for the said month, known as the Fed’s preferred inflation gauge, will be crucial to watch. Above all, US debt ceiling negotiations should be traced for clear directions.
Technical analysis
With a clear downside break of the 50-DMA and the Cable pair’s sustained observance of a two-week-old resistance line, respectively near 1.2435 and 1.2370, the GBP/USD pair remains all set to prod the 100-DMA support of around 1.2285.
- AUD/USD is expected to continue its three-day losing streak after dropping below 0.6500.
- The USD index showed a marginal correction as the White House and Republican leaders met virtually on Thursday.
- Australian Retail Sales are seen expanding by 0.2%, lower than the prior expansion of 0.4%.
The AUD/USD pair has found an intermediate cushion near the round-level support of 0.6500 in the early Asian session. The Aussie asset has registered a three-day losing streak and is expected to continue the downside spell after dropping below the aforementioned support. A cautious market mood has trimmed the appeal for risk-perceived currencies sharply.
S&P500 delivered a decent recovery on Friday as the Federal Reserve (Fed) is expected to pause its rate-hiking regime in June’s monetary policy meeting. Gains in the 500-US stocks basket were supported by a solid recovery in technology and financial stocks.
The US Dollar Index (DXY) remained super solid on Thursday and refreshed a two-month high at 104.31 amid an absence of further development in US debt-ceiling issues. In the late New York session, the USD index showed a marginal correction after Reuters reported that the White House and Republican leaders met virtually on Thursday and are near cracking bipartisan, which inculcates large spending cuts and a raise of the government’s $31.4 trillion debt-ceiling.
Going forward, the United States Durable Goods Orders (April) data will be of utmost importance. The economic data is seen contracting by 1.0% against an expansion of 3.2% reported earlier.
On the Australian Dollar front, investors are keeping an eye on monthly Retail Sales data (April). As per the consensus, households’ demand is seen expanding by 0.2%, lower than the prior expansion of 0.4%. Declining retail demand would allow the Reserve Bank of Australia (RBA) to keep interest rates steady ahead.
- Gold Price appears well set for third consecutive weekly loss.
- Strong United States data, hawkish Federal Reserve talks favor US Dollar, weighs on XAU/USD.
- Escalating fears of US debt ceiling expiration also favor Gold bears as policymakers struggle for a deal.
- Multiple US statistics lined up to direct intraday Gold Price, risk catalysts are the key.
Gold Price (XAU/USD) remains on the back foot at the two-month low surrounding $1,941 amid early Friday morning in Asia and remains pressured around the lowest levels since late March after falling in the last two consecutive days. The yellow metal’s weakness could be linked to the market’s risk-off mood and upbeat United States data ahead of a slew of the US statistics, which in turn favor the US Dollar's strength.
Gold Price drops as firmer US data, risk-aversion underpins US Dollar, yields
Gold Price witnesses heavy downside pressure as it braces for the third consecutive weekly loss amid broadly firmer United States statistics and fears of the US default. In doing so, the XAU/USD justifies firmer US Dollar and Treasury bond yields.
Talking about the United States statistics, the second estimation of the US Annualized Gross Domestic Product (GDP) for Q1 2023 was revised up to 1.3% versus 1.0% first forecasts. Further, the Chicago Fed National Activity Index for April improved to 0.07 from -0.37 prior and -0.02 market estimations. On the same line, Kansad Fed Manufacturing Activity improved to -2 for May compared to -21 previous readings and analysts’ estimations of -11. It’s worth noting that the US Pending Home Sales for April improved on YoY but eased on MoM whereas Core Personal Consumption Expenditures also rose to 5.0% during the preliminary readings versus 4.9% prior.
Following the data, Richmond Fed President Thomas Barkin said, “Fed is in a test and learn situation to determine how slowing demand lowers inflation.” On the different front, Boston Federal Reserve President Susan Collins said on Thursday that the Fed "may be at or near" the time to pause interest rate increases, as reported by Reuters.
Given the firmer US data and mostly hawkish Federal Reserve (Fed) comments, the US Dollar and Treasury bond yields grind higher, which in turn weighs on the Gold Price ahead of a slew of the US statistics relating to the activity and inflation.
Apart from the US data and Fed talks, the concerns about USpolicymakers’ inability to clinch a deal on the US debt ceiling extension, as well as the latest chatters suggesting a $70.0 gap left to be filled by the negotiators to get the much-awaited deal also weigh on the XAU/USD prices, via the firmer US Dollar and yields.
That said, the US Dollar Index (DXY) rose to the highest levels in 10 weeks, to 104.20 at the latest, whereas the US 10-year and two-year Treasury bond yields rose to the early March highs of around 3.82% and 4.54% in that order.
Moving on, the Gold price remains vulnerable to the further downside amid the market’s rush for the haven demand and hawkish Federal Reserve bets, backed by upbeat US data and US debt ceiling talks. Talking about the data, US Durable Goods Orders for April and the Core Personal Consumption Expenditure (PCE) Price Index for the said month, known as the Fed’s preferred inflation gauge, will also be important to watch for clear directions. Above all, risk catalysts are the key.
Gold Price technical analysis
Gold price prods two-month low on breaking the key support line stretched from early April, now immediate resistance around $1,956.
Adding strength to the XAU/USD downside bias are the bearish signals from the Moving Average Convergence and Divergence (MACD) indicator and the metal’s sustained trading below the 50-SMA, as well as the monthly resistance line, currently joining around $1,975.
It’s worth noting, however, that the oversold conditions of the Relative Strength Index (RSI) line, placed at 14, allow the Gold price to rebound from the 61.8% Fibonacci retracement of its February-May upside, near $1,909.
Following that, the mid-March swing low of near $1,85 can act as the last defense of the Gold buyers.
On the contrary, the aforementioned resistances around $19,56 and $1,975 may prod the XAU/USD bulls before giving them control.
Even so, the 200-SMA near the $2,000 psychological magnet and the previous monthly high surrounding $2,050 can challenge the upside momentum of the Gold price before directing it to the record high of $2,080.
Overall, the Gold price is likely to drop further but the road towards the south appears bumpy.
Gold Price: Four-hour chart
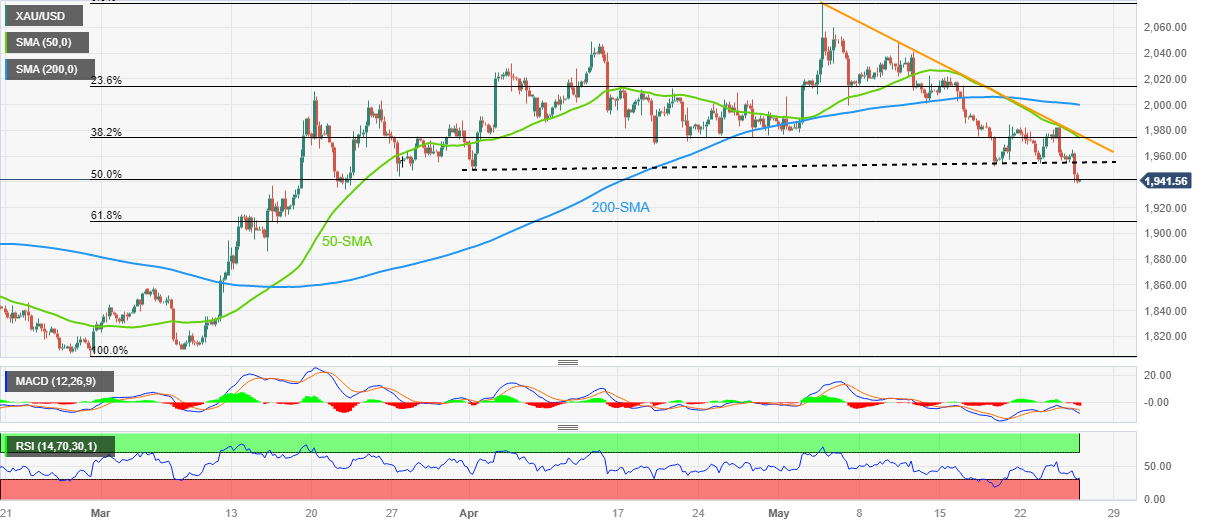
Trend: Further downside expected
- Tech stock advancement creates mixed investor sentiment, allowing GBP/JPY to sustain gains.
- GBP/JPY upward trend continues, eyeing potential reversal upon Bank of Japan's policy shifts.
- In case of a dip below 172.00, GBP/JPY could test the two-week low of 171.19 and further the 170.00 mark.
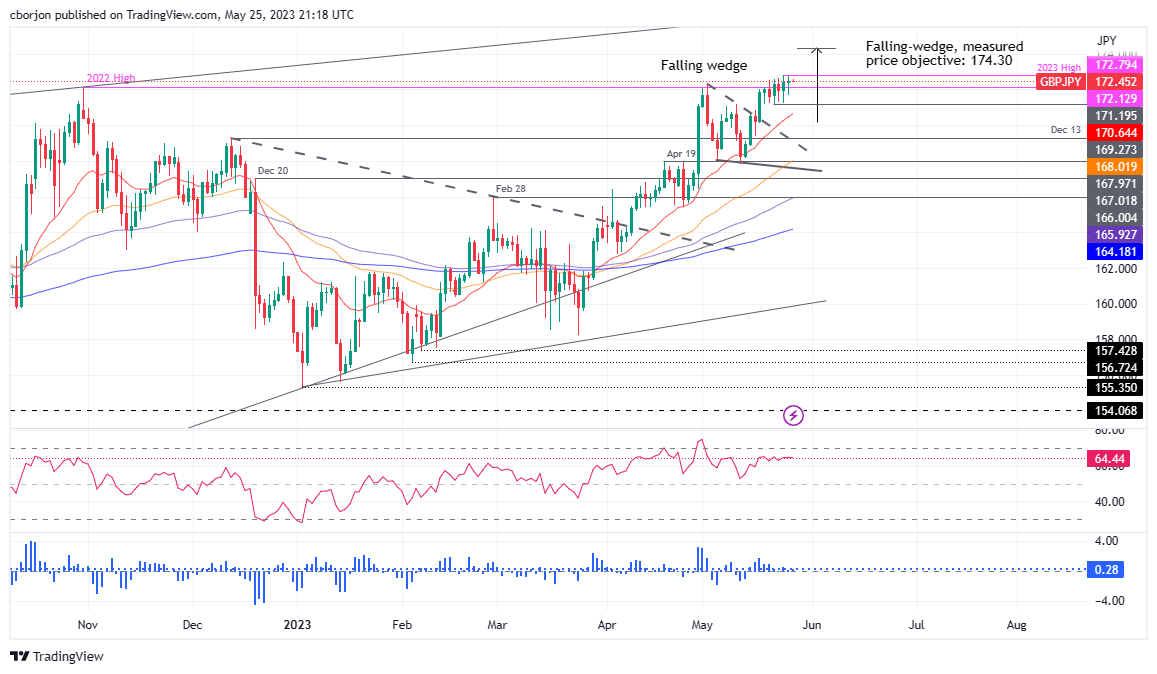
GBP/JPY edges high but fell shy of reaching a new year-to-date (YTD) high above 172.79 and remains in positive territory, albeit a mixed sentiment amongst investors, as tech stocks advance. Consequently, safe-haven peers like the Japanese Yen (JPY) retraced some of their earlier gains sustained in the Asian session. At the same time, inflation data from the United Kingdom (UK) justifies the need for further tightening, underpinning Sterling (GBP). At the time of writing, the GBP/JPY is trading at 172.46.
GBP/JPY Price Analysis: Technical outlook
From a daily chart perspective, the GBP/JPY uptrend would continue before fundamental reasons change, like the Bank of Japan (BoJ) shifting its monetary policy, could open the door for a good reversal. Nevertheless, once the GBP/JPY falling wedge was broken to the upside, and Cable regained momentum above the May 2 high of 172.33, that opened the door for further gains. Since then, the GBP/JPY consolidated at 171.20-172.79 as buyers prepared to launch an assault and hit the falling-wedge measured target at 174.30.
Hence, the GBP/JPY path of least resistance is upwards. The first line of defense for GBP/JPY sellers would be the YTD high of 172.79, which is broken; the pair will move upwards and test 173.00. A breach of the latter will expose the 174.00 figure, ahead of the falling-wedge objective at 174.30.
On the flip side, if GBP/JPY slips below 172.00, that could pave the way to test the latest two-week low of 171.19 before testing the 170.00 mark. If GBP/JPY dives below that level, the 20-day Exponential Moving Average (EMA) could cap the downfall at around 170.65.
GBP/JPY Price Action – Daily chart
Here is what you need to know on Friday, May 26:
The US Dollar strengthened yet again on Thursday for the fourth consecutive day of trade vs. a basket of currencies as per the DXY index. DXY rallied from a low of 103.84 to a high of 104.312.
US data pointed to a resilient economy while progress on US debt ceiling talks remained elusive, helping Treasury yields higher and the US Dollar to score its highest level in over two months. Traders were wary of a possible default in early June while US President Joe Biden and top congressional Republican Kevin McCarthy were still not able to put a deal together. However, the two sides are now just $70 billion apart on a deal according to market chatter.
As for data, the number of Americans filing new claims for unemployment benefits rose modestly last week, and the prior week's data was revised sharply lower, the Labor Department said. US Jobless Claims in the week to 20 May came in at 229k, slightly above the previous week but lower than expected. Elsewhere, it was shown that the US economy is growing quicker than expected with real Q1 Gross Domestic Product up 1.3% QoQ.
As for the Federal Reserve speak, Boston Fed President Susan Collins said on Thursday the time may be at hand for the Fed to push the pause button on its interest-rate-hiking campaign to assess the impact of past tightening.
In forex, EUR/USD was down 0.31% to 1.0715. The Japanese yen fell 0.52% versus the greenback to 140.16 per US Dollar as investors wait for Tokyo Consumer Price Index on Friday. GBP/USD fell to a low of 1.2309. AUD was under pressure as was the Kiwi ahead of Aussie Retail Sales today with AUD/USD hitting a fresh cycle low below 0.6500. Gold sank to its lowest level in two months on Thursday and Oil prices dropped by $3 a barrel after Russian Deputy Prime Minister Alexander Novak played down the prospect of further OPEC+ production cuts at its meeting next week. BTC rallied from the day´s lows in midday trade and traveled between a low of 25,878 and 26,611.
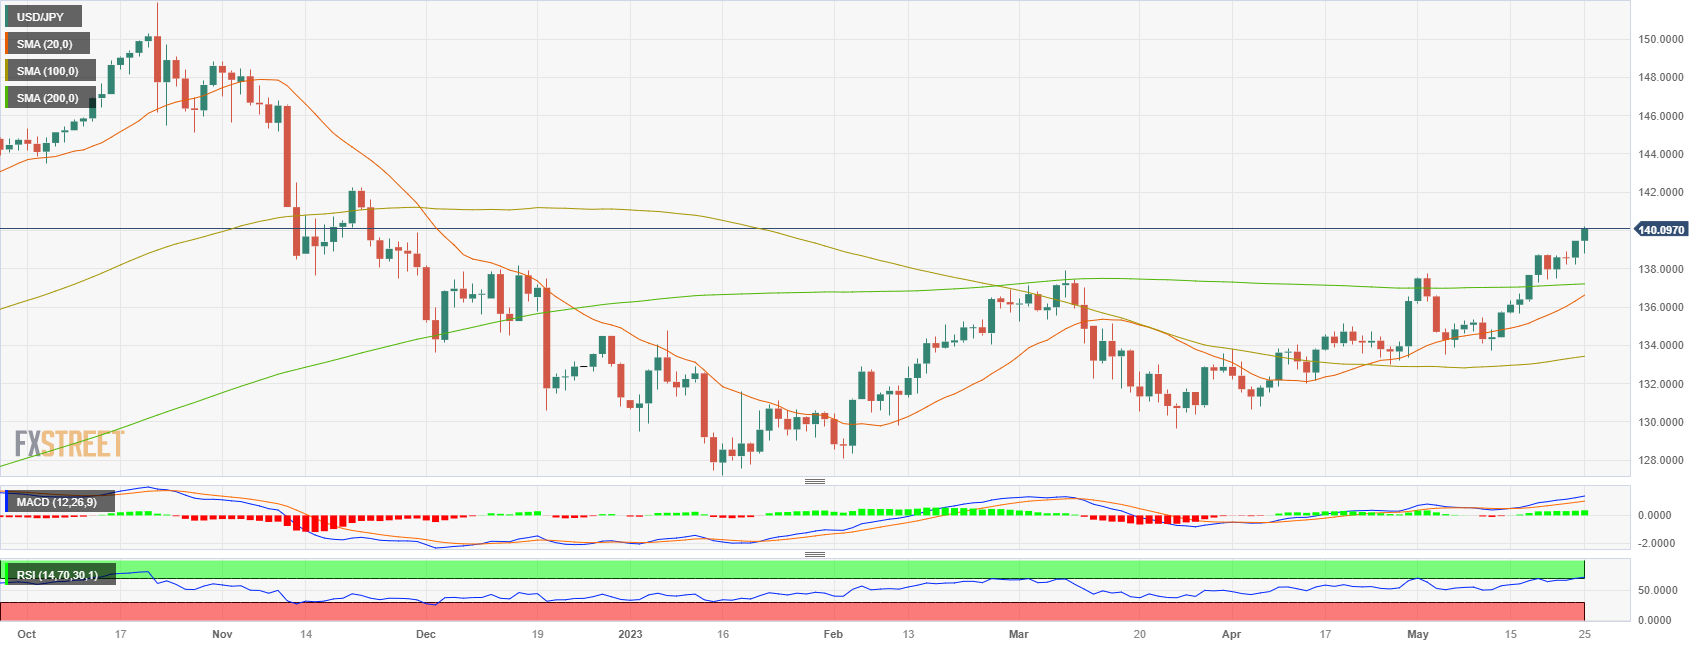
- USD/JPY reaches yearly highs and positions near the 140.00 level.
- US Q1 GDP grew by 1.3%, surpassing expectations, while Jobless Claims exceeded estimates. Core PCE inflation rose 5% in Q1.
- Investors are eagerly anticipating today's release of the May Tokyo Consumer Price Index.
The Ninja continue edging higher on Thursday, maintaining yearly highs and approaching the key level of 140.00. This surge comes amidst positive economic developments, with the US Q1 GDP growth surpassing expectations and Jobless Claims exceeding estimates. Additionally, core PCE inflation rose by 5% in the first quarter. In that sense, the positive economic data from the United States, coupled with the rise in US bond yields due to the increased likelihood of a Fed adjustment, further favored the US Dollar.
On the other hand, investors will closely monitor the May Tokyo Consumer Price Index, which is expected to further impact the USD/JPY pair.
US economic data came in above expectations
The US Bureau of Economic Analysis recently announced that the United States experienced a 1.3% quarter-on-quarter expansion in Gross Domestic Product (GDP) during Q1 of 2023, surpassing the initial estimate of 1.1%. Additionally, Jobless Claims for the week ending on May 19 came in at 229k, lower than the expected consensus of 245k. Furthermore, Core PCE inflation rose to 5% in Q1, exceeding the projected rate of 4.9%.
In response to concerns expressed by the Federal Open Market Committee (FOMC) regarding economic activity, the CME FedWatch Tool now indicates a higher probability of a 25 bps interest rate increase. This development has fueled an increase in US bond yields, with the 10-year yield reaching 3.79%, reflecting a 3.22% rise in a single day. Additionally, the 2-year yield currently stands at 4.46%, representing a gain of 2.61%, while the 5-year yield sits at 3.87%, showing a 3.22% increase. These movements in bond yields provide further support to the US Dollar.
Levels to watch
Based on the daily chart analysis, the USD/JPY exhibits a bullish outlook in the short term. The Relative Strength Index (RSI) and Moving Average Convergence Divergence (MACD) indicators indicate the dominance of buyers while the pair remains above its key moving averages.
If the USD/JPY continues to gather momentum, it is likely to encounter resistance at the 140.00 level, followed by the 140.50 zone and the psychological level of 141.00. Conversely, on the downside, important support levels to monitor include the 139.50 zone, the 139.00 level, and the weekly low at 138.50.
- WTI bulls are in and have broken a 50% mean reversion level.
- If the bears were to commit, then there will be prospects of a move into $70.50s.
West Texas Intermediate, WTI, is currently trading at $71.93 and has traveled between a low of $71.03 and $74.33. Meanwhile, comments from Russia's oil minister, who said next month's OPEC+ meeting was unlikely to end with further cuts to production, have weighed on the black gold.
Reuters reported Russian oil minister Alexander Novak said further cuts from OPEC+ were unlikely following more than one-million barrels per day of voluntary cuts that took effect at the start of May.
´´The likelihood of OPEC cutting further only a month later is low. Signs of stronger demand should provide some comfort to bullish speculator,´´ analysts at ANZ Bank said. ´´Chinese demand is growing strongly as restrictions on international travel into China are eased. The rise in gasoline demand in the US comes ahead of the US holiday weekend.´´
Meanwhile, analysts at TD Securities explained that´´Saudi Arabia's warning shot to short sellers managed to squeeze CTA trend follower shorts, but only for a single trading session. WTI crude and Brent crude prices are now catching up with the ongoing deterioration in commodity demand trends, after a large-scale short covering program from algorithmic trend followers provided a sufficiently large offset for prices to buck the trend.´´
´´With price action already turning over, CTAs are likely to aggressively add back some shorts. In fact, we estimate that algos are set to add a whopping -21% of max size to their net short in WTI crude, along with -11% in Brent. This flow will help give credence to the slumping demand narrative, as China continues to battle with a surge in Covid-19 infections,´´ the analysts explained further.
WTI technical analysis

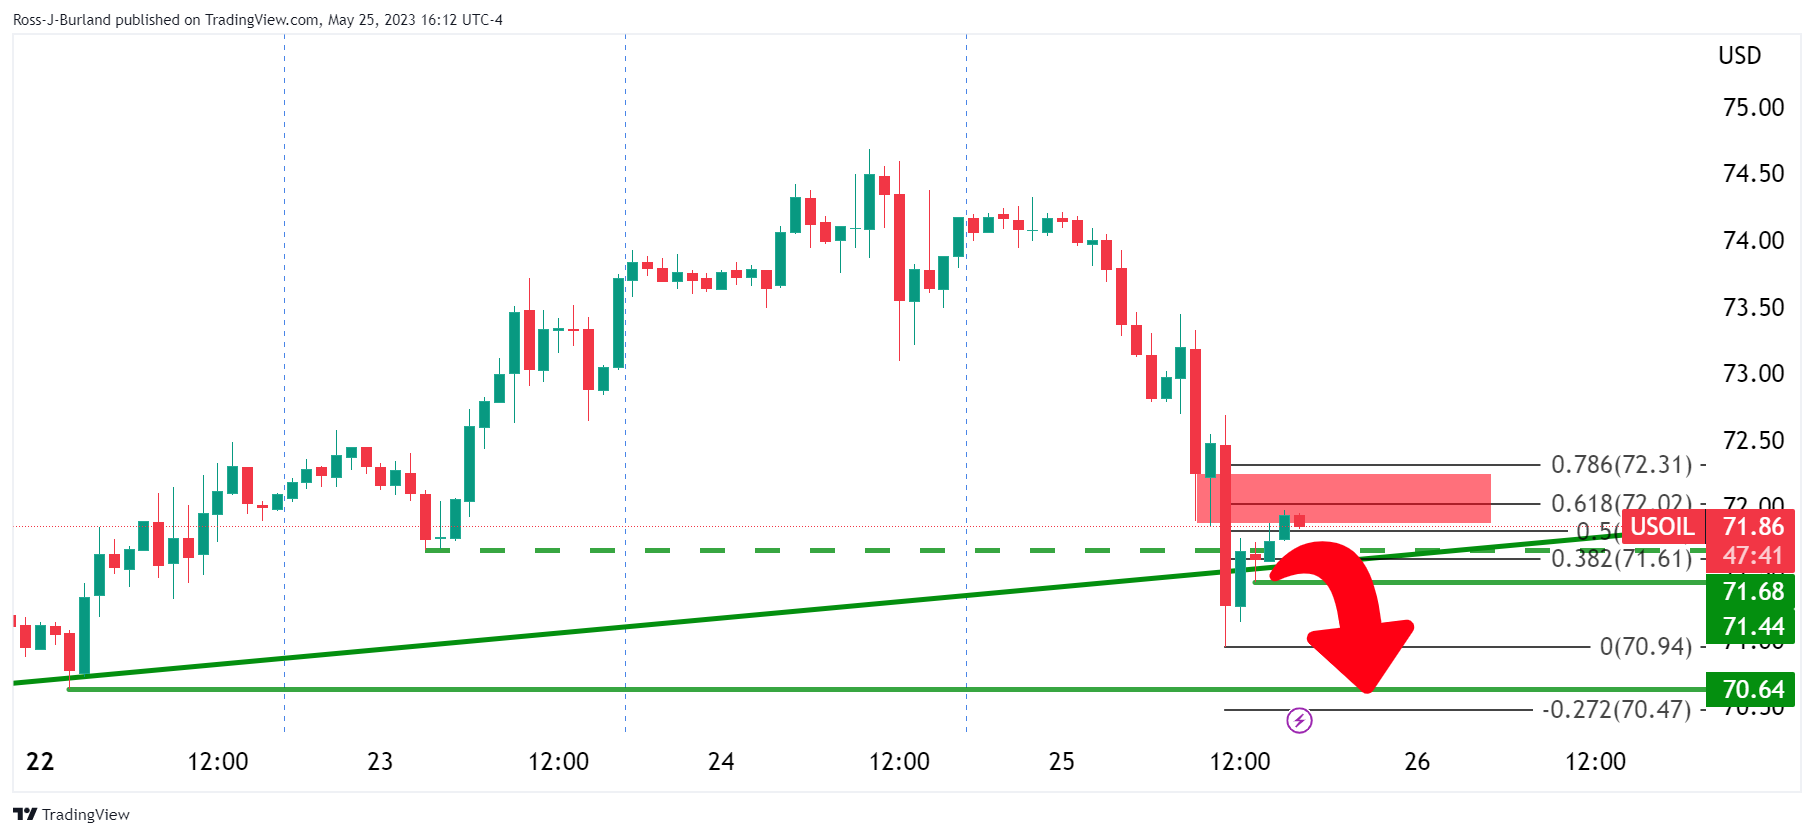
The bulls have moved in and are reaching a resistance area, breaking a 50% mean reversion level. If the bears were to commit, then there will be prospects of a move into $70.50s.
- USD/MXN rebounds to around 17.8040 after a more than 2000-pip dip.
- Robust US labor market data and Q1 growth revision boost the USD/MXN from 17.7000 to a daily high of 17.8785.
- Upcoming data: Mexico’s Q1 GDP, US Durable Good Orders, and Consumer Sentiment reports are set to sway the USD/MXN exchange rate.
USD/MXN stages recovery after diving more than 2000 pips, below the 20-day Exponential Moving Avera(EMA), which, acting as a solid support price level, capped the USD/MXN pair losses amidst a risk-off impulse. US political developments about raising the debt ceiling, and upbeat economic data amidst political uncertainty in Mexico, were the main drivers of USD/MXN price action. At the time of writing, the USD/MXN climbs and trades at around 17.8040.
Political uncertainty in Mexico and robust US data drive USD/MXN recovery; upcoming economic readings to impact the exchange rate
Discussion in Washington shows signs of moving forwards, according to US President Joe Biden, while Kevin McCarthy, the US House Speakers added that not “everybody is going to be happy at the end of the day” regarding making some concessions as Democrats and Republicans try to agree on a deal.
Aside from hits, the economy of the United States continues to grow, as shown by solid labor market data and a revision of growth figures for Q1 2023. Initial Jobless Claims for the week ending on May 20 rose by 229K less than the 245K expected by analysts, while the Q1 Gross Domestic Product (GDP) on its second estimate jumped to 1.3%, from 1.1% in the advanced and estimated data.
Once the US data crossed the wires, the USD/MXN increased from around the daily low of 17.7000 to the daily high of 17.8785. Notably, the US Dollar Index (DXY), a gauge that measures the buck’s value against a basket of six currencies, is trading nearby two-month highs reached during the day at 104.312, putting some ground between the 200-day EMA at 103.748 and the current price.
Across the border, the Mexican economic agenda revealed the Trade Balance of Mexico, which printed a deficit of $2,965 billion in April when adjusted for seasonal swings, INEGI reported.
During the week, the USD/MXN traded with gains of 0.30% after achieving two successive weeks of losses, dragging the pair to multi-year new lows at around 17.4238. However, the USD/MXN has been recovering more than 2.50% since the last week, as the USD/MXN pair is approaching the psychological 18.0000 figure.
Upcoming events
The Mexican economic agenda will feature final readings for Q1 Gross Domestic Product (GDP), expected at 1% in QoQ readings, while compared to the last year, the Mexican economy is estimated to grow by 3.9%. Worse than predicted figures, the Bank of Mexico (Banxico) pausing rates could trigger flows toward the safe-haven US Dollar, sending the USD/MXN pair toward the 18.00 handle. On the US front, Durable Good Orders, Consumer Sentiment, and the University of Michigan Consumer Sentiment are expected to rock the boat in the USD/MXN exchange rate.
USD/MXN Technical Levels
- EUR/JPY bulls ahve run into test the 150s.
- Resistance could prove tough and lead to a retest of trendline support.
EUR/JPY is currently trading at 150.10 and has traveled between a low of 149.37 and a high of 150.15 so far on the day. The following illustrates the market that is attempting to break into the resistance area although shows prospects of a meanwhile correction into trendline support.
EUR/JPY daily chart
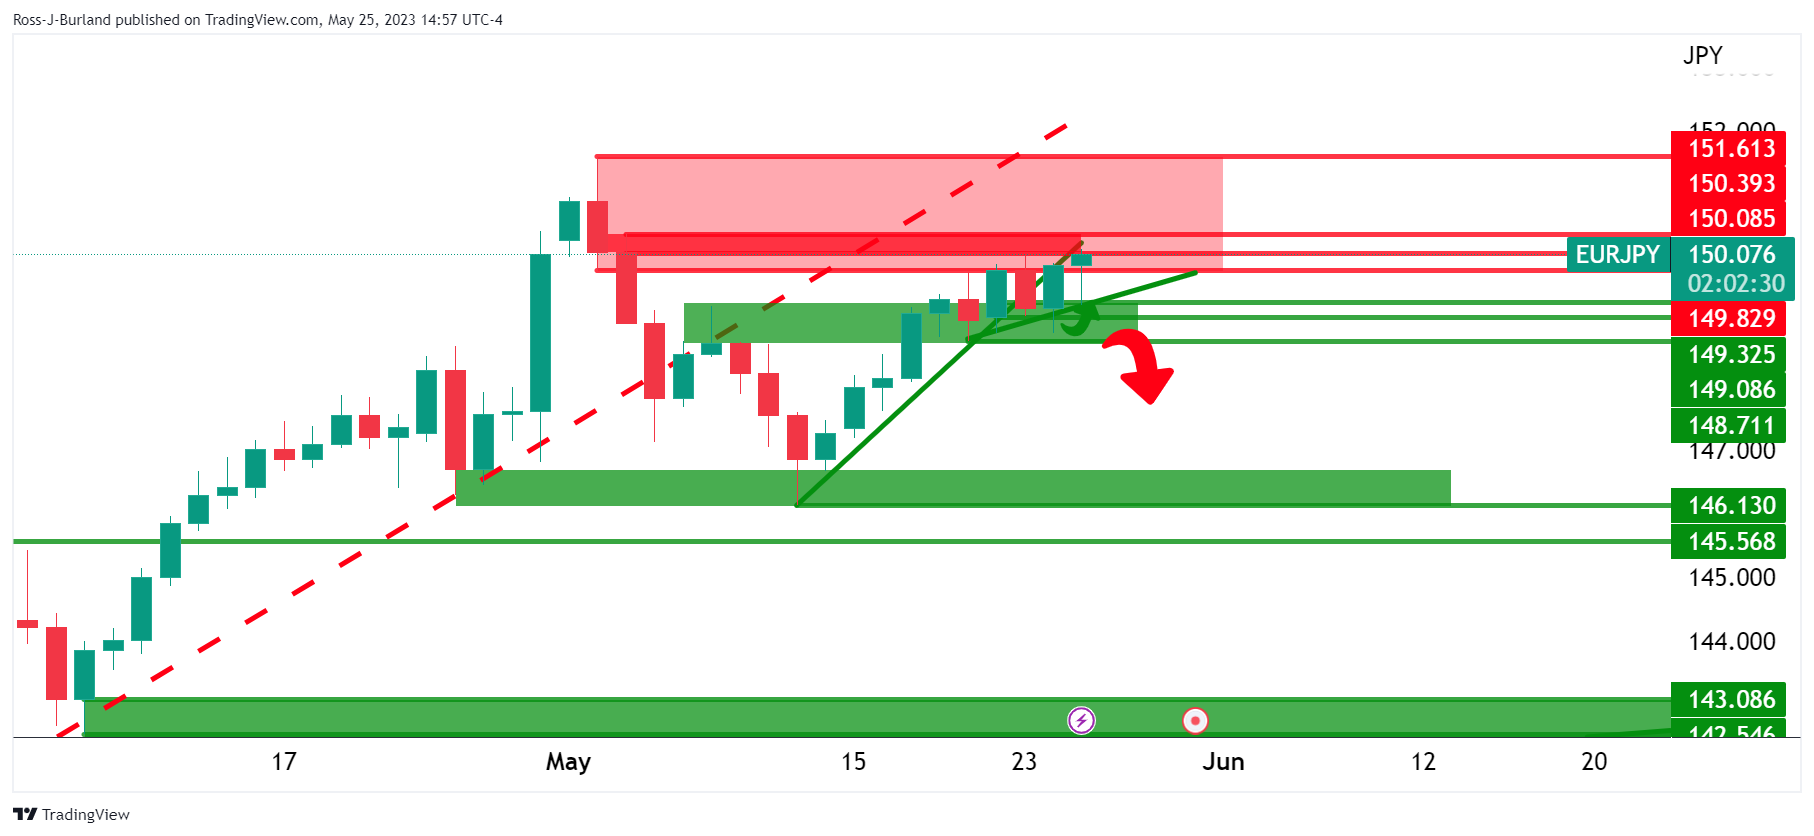
EUR/JPY is testing resistance and has been supported along the way in the late 148s and the 149s so far.
EUR/JPY H1 chart
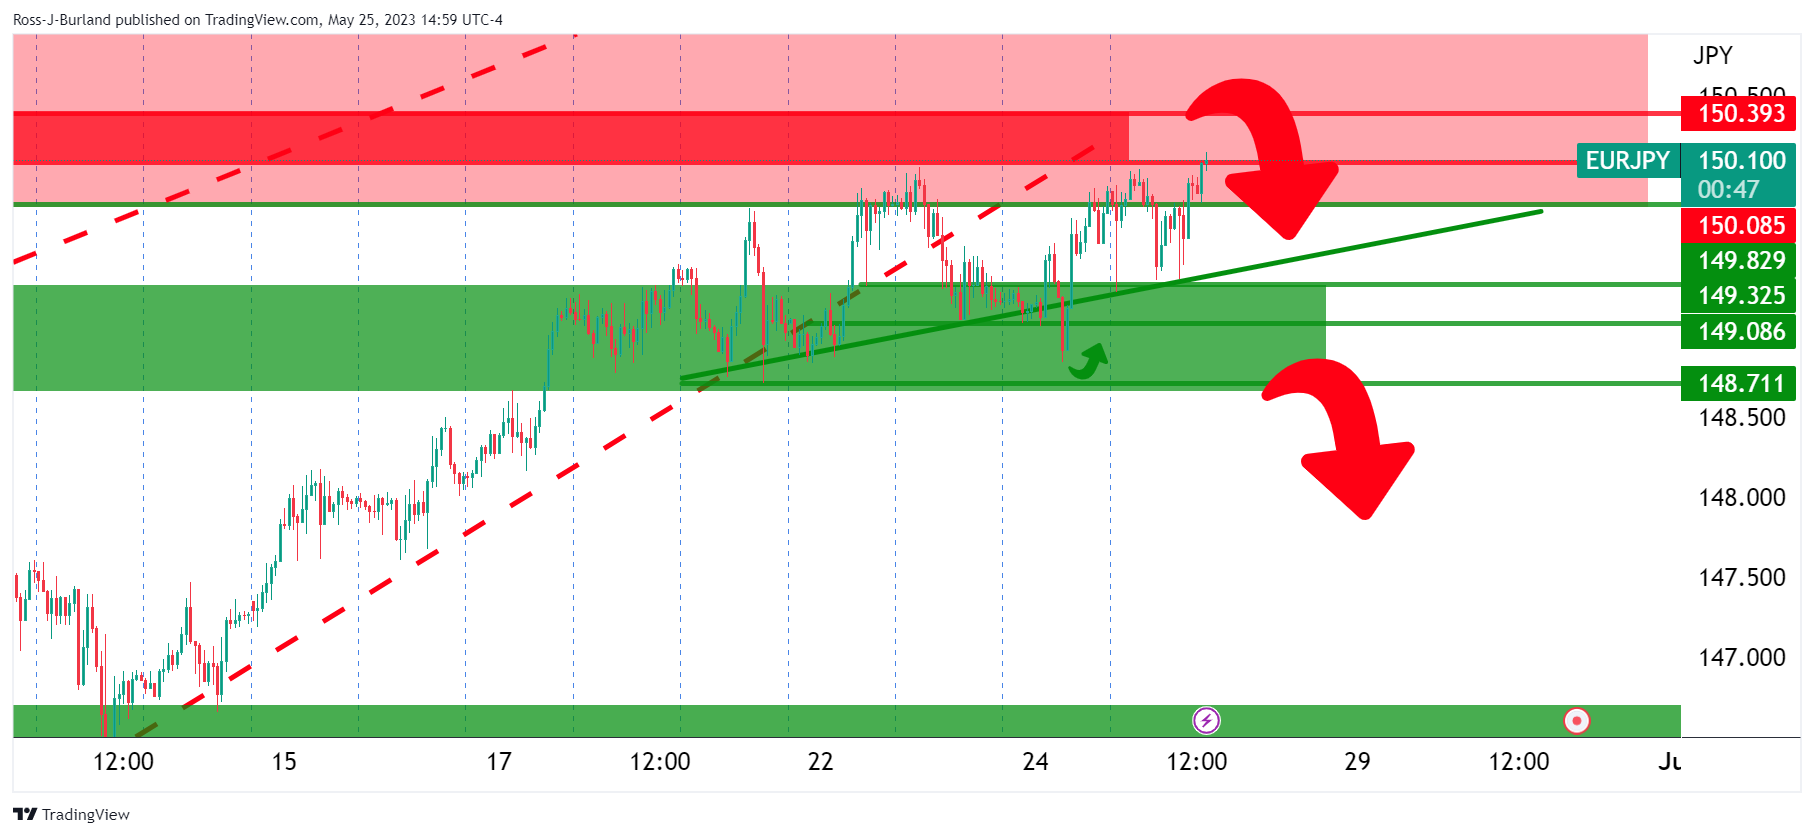
From an hourly perspective, we have the price climbing the trendline support and now moving steeply away from it to test the 150s. However, resistance here could prove fatal for the bulls. If the bears get below the trendline support, 148.70s will start to look vulnerable.
- XAU/USD falls to $1,940.00, during the American session.
- US GDP is revised up to 1.3% in the first quarter of the year (Q1), while Jobless Claims come in below expectations.
- Core PCE inflation rises by 5% in Q1.
The XAU/USD drops to its lowest level since March 22 due to strong economic data and a high Personal Consumption Expenditures (PCE) inflation. This leads investors to place higher bets on a 25 basis points interest rate hike by the Federal Reserve (Fed) in the upcoming June meeting. Consequently, US bond yields increase, exerting pressure on Gold prices and favoring the US Dollar.
The Gold price, as of the time of writing, is trading at $1,943.62, which is 0.7% below its opening price. Meanwhile, the US Dollar Index (DXY) Index is currently at the 104.22 level, showing a gain of 0.32% today.
The US reports strong economic activity data.
The US Bureau of Economic Analysis has reported that the Gross Domestic Product (GDP) of the United States expanded by 1.3% quarter-on-quarter in the first quarter of 2023, surpassing the preliminary estimate of 1.1% which was expected to remain unchanged. In contrast, Jobless Claims for the week ending on May 19 came in at 229k, lower than the consensus of 245k. Additionally, Core PCE inflation increased to 5% quarter-on-quarter in Q1, exceeding the expected rate of 4.9%.
After the Federal Open Market Committee (FOMC) expressed concerns about economic activity, positive US data has led investors to believe that there may be more room for another interest rate hike in the upcoming decision in June. As a result, the CME FedWatch Tool now places a 49.3% probability of a 25 basis points hike, compared to yesterday's odds of around 36%.
As a reaction, US bond yields are experiencing gains across the curve. The 10-year bond yield rose to 3.79%, marking a 3.22% increase on the day. Similarly, the 2-year yield stands at 4.46%, showing a gain of 2.61%, while the 5-year yield is at 3.87%, reflecting a gain of 3.22%. These increases in bond yields are further pressuring the price of Gold.
Levels to watch
According to the daily chart, Gold has a bearish outlook for the short term, as indicated by the Relative Strength Index (RSI) and Moving Average Convergence Divergence (MACD), both of which are pointing down in line with price and suggesting that sellers have control.
Immediate support for Gold is observed at the $1,940.00 level, followed by the 100-day Simple Moving Average at $1,930.00 and the $1,920.00 zone. Moreover, if the precious metal gains momentum, the following resistance levels are seen at the psychological mark of $1,950.00, followed by the $1,970 zone and the 20-day Simple Moving Average at $2,000.00.
-638206364828364836.png)
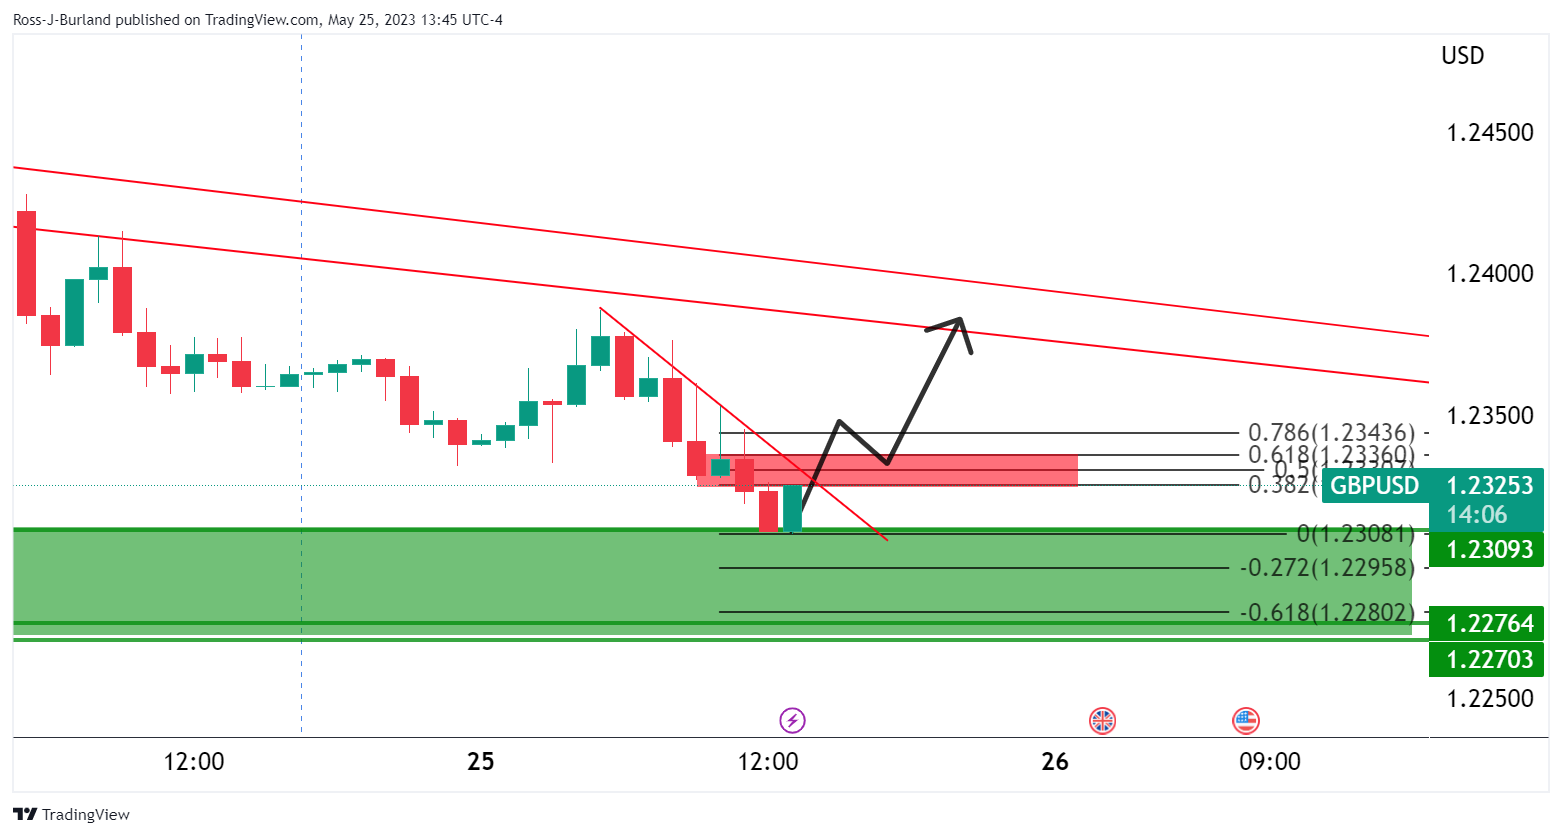
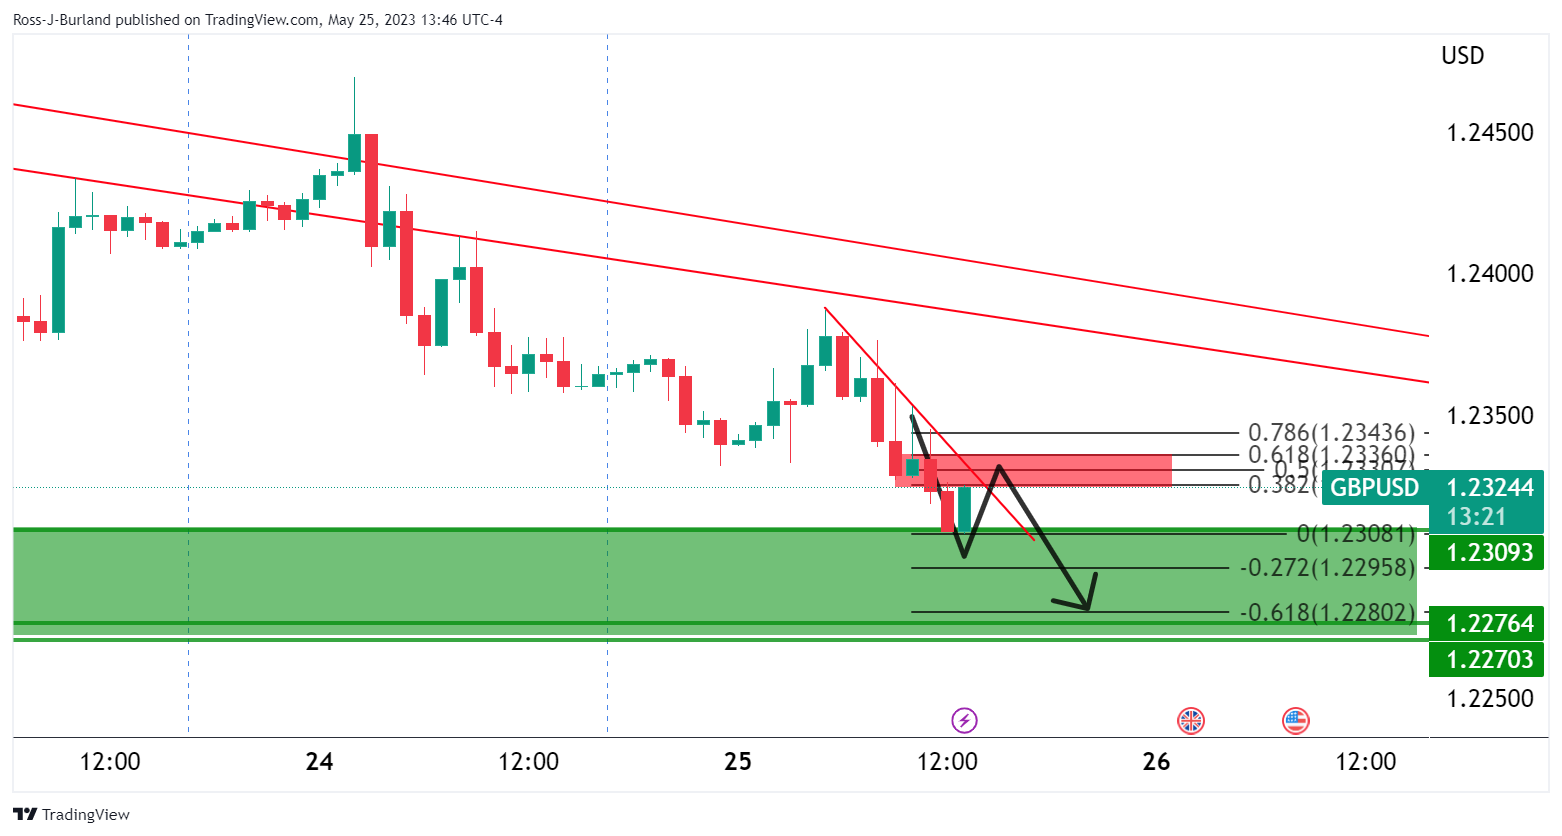
- GBP/USD bulls comer up for air at key demand area.
- Bears need to stay committed on the front side of dynamic resistance.
GBP/USD is down on the day and trading at 1.2330 currently. The pair has traveled from a high of 1.2387 to a low of 1.2308 so far. The price is moving into an area of potential support but while on the front side of the bearish trend, the bears are in control and there are prospects of a downside continuation if the bears commit. The following illustrates a couple of scenarios that respect the dynamic resistance lines and also the horizontal support area:
GBP/USD H4 chart
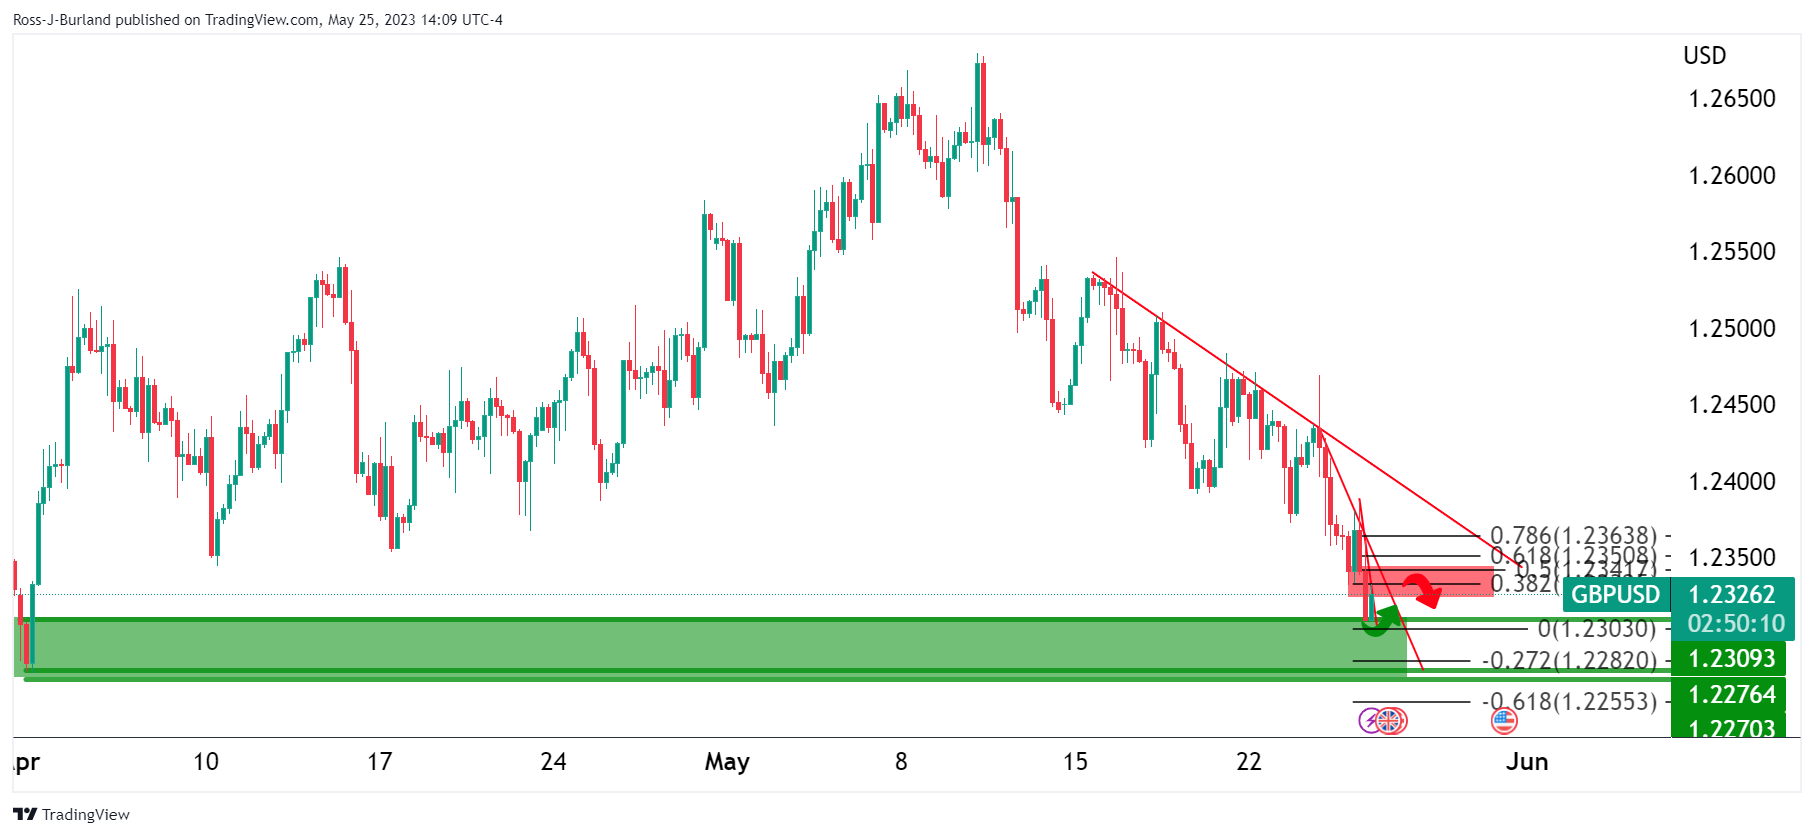
The market has corrected and the question is whether the bears are going to stay committed.
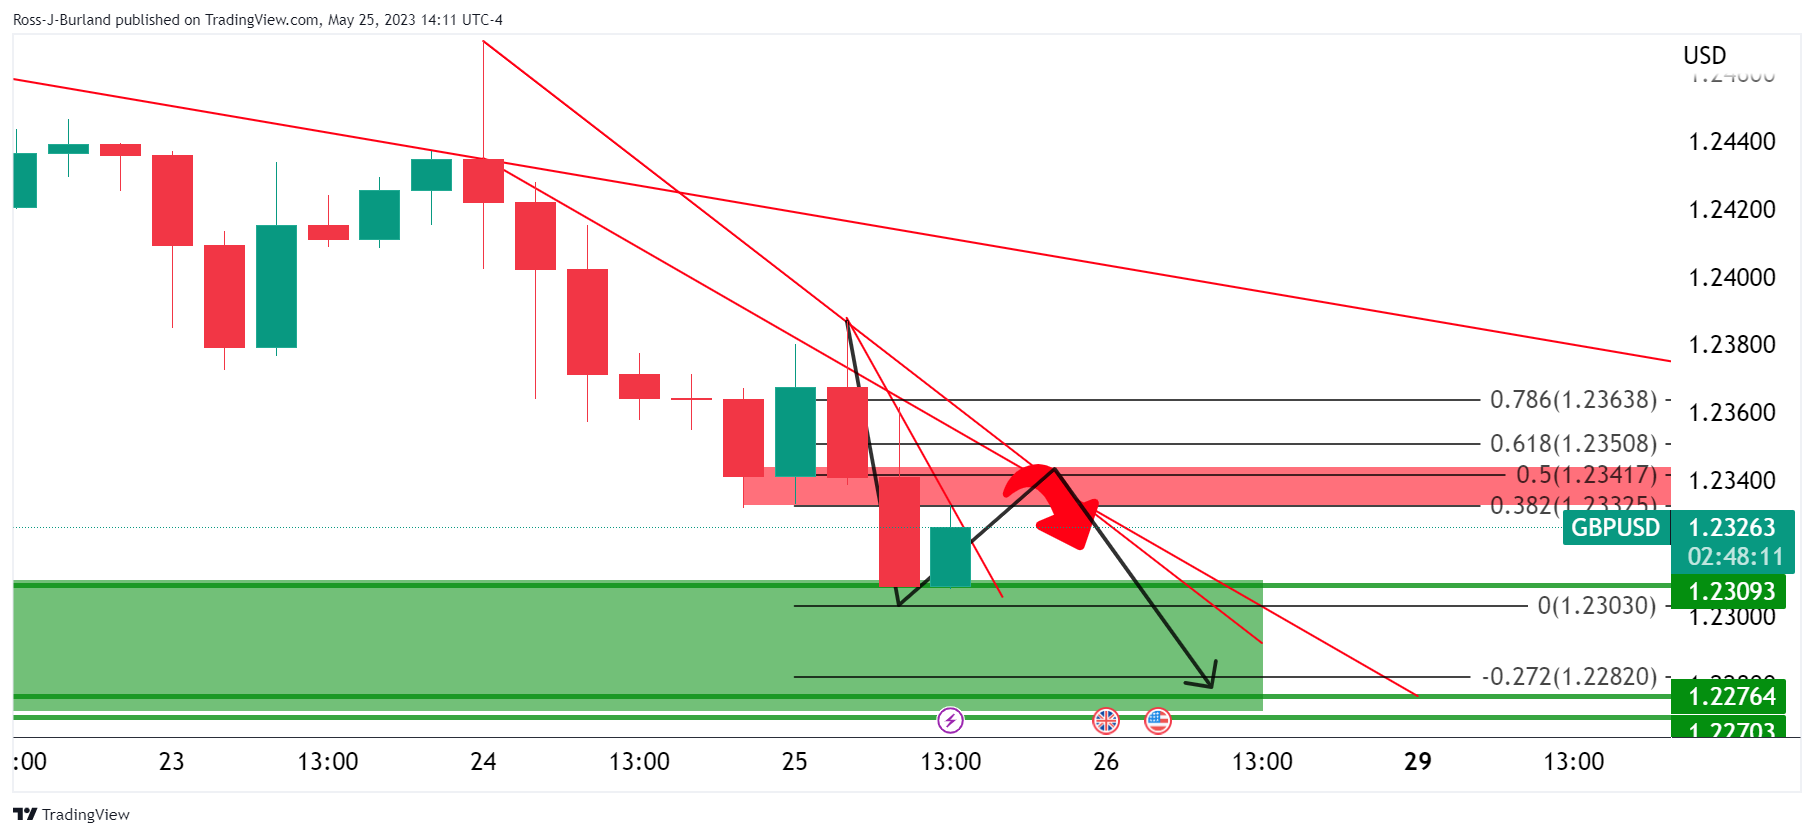
If the bears engage again, we have the 38.2% Fibonacci and the 50% mean reversion resistance area that they could lean against.
On the flip side, if this area were to break, then the bulls will be taking over and the bullish schematic could unfold with the trendline resistance looking vulnerable.
- EUR/USD hits a two-month low amidst US debt-ceiling uncertainty and positive US economic data.
- Fitch places US “AAA” debt rating on negative watch despite lower unemployment claims and a rise in Q1 GDP.
- Germany’s Q1 GDP plunge puts additional pressure on the Euro, with central bank commentary stirring markets.
EUR/USD continued to fall for three straight days and reached a new two-month low of 1.0707, as the greenback remains strengthening across the FX board. Uncertainty around the US debt-ceiling discussions and upbeat US economic data bolstered the US Dollar (USD). Therefore, the EUR/USD is trading at 1.0725 after hitting a high of 1.0756.
German recession adds weight to falling Euro, as central bank comments stir sentiment
US debt-ceiling discussions resumed on Wednesday, with US GOP House Speaker Kevin McCarthy saying that he does not expect an agreement today, tough added there has been “some progress” between both parties. Woes of a potential US default bolstered the US Dollar, though Fitch Ratings warned that US “AAA” debt ratings were put on negative watch.
On another front, data from the US Bureau of Labor Statistics (BLS) revealed that unemployment claims for the last week rose by 229K below estimates of 245K, signaling a solid labor market. At the same time, growth in the US for the first quarter was upwardly revised, revealing the BLS. Gross Domestic Product (GDP) rose by 1.3%, against the preliminary 1.1% figure, portraying a solid economy.
On the Eurozone (EU) front, the largest economy of the bloc, Germany, was in recession in Q1 as GDP plunged 0.3%, weighing on the Euro (EUR), which extended its losses from 1.0740 toward the 1.0710 area.
In the meantime, central bank speakers crossed the wires on both sides of the Atlantic. On the US front, Boston Fed President Susan Collins commented that the time to pause its tightening cycle is getting closer. On Wednesday, the Fed revealed its May minutes, showing policymakers are leaning towards pausing hikes, though officials did not commit to writing off interest rate increases.
Across the pond, the European Central Bank (ECB) member Klass Know said that “at least” two more rate hikes of 25 bps are needed in the Euro Area and stressed the need to stay put for a significant time.
EUR/USD Technical Levels
Bank of England interest rate-setter Jonathan Haskel has crossed the wires again today by saying, ´´if we do see evidence of more inflation persistence, we will tighten policy.´´
Additional comments
I decline to comment on market pricing but cannot rule out further rate rises.
We are monitoring inflation persistence very closely.
Earlier, the Monetary Policy Committee member Haskel said that the Bank of England needs to lean against the risk of persistent momentum in inflation, and may need to raise interest rates further.
"I prefer to lean against the risks of inflation momentum. As difficult as our current circumstances are, embedded inflation would be worse," Haskel said in a speech at the Peterson Institute of International Economics in Washington.
"Further increases in Bank rate cannot be ruled out," he added.
GBP/USD update
GBP/USD is at a key area of support and this could lead to a move back toward trendline resistance or, if bears commit, then we could see a sell-off towards 1.2270.
In an interview with Italy's Corriere della Sera, European Central Bank (ECB) policymaker Klaas Knot said that the ECB needs to raise the policy rate at least two more times, as reported by Reuters.
Knot further argued that rates should stay put for a significant period of time following these increases.
Additional takeaways
"Headline inflation peak behind us but not sure if at peak of underlying inflation."
Most of impact of ECB's monetary tightening is still in the pipeline."
"Next two ECB hikes should be 25 bps each."
"I am totally open-minded on what happens with rates after the summer."
"Market pricing of rate cuts is overly optimistic."
Market reaction
These comments failed to help the Euro gather strength against its rivals. As of writing, EUR/USD was down 0.35% on a daily basis at 1.0712.
- US bond yields climb amid debt ceiling uncertainty, with the 10-year rate reaching 3.789%, a high since the Silicon Valley Bank collapse.
- US economy displays recovery signs with lower-than-expected jobless claims and an upwardly revised Q1 GDP, while the Fed hints at a pause in rate hikes.
- Canadian Manufacturing Sales declined by 0.2% in April, highlighting the economic contrast between the US and Canada.
USD/CAD reclaims the 1.3600 figure after hitting a daily low of 1.3586, climbs for two consecutive days toward the April 28 swing high at 1.3667, on mixed market sentiment, as the Nasdaq rises. The financial markets narrative remains the same, with Republicans and Democrats unable to reach an agreement despite Fitch Ratings threatening to review the US qualification. The USD-CAD is trading at 1.3639.
US economy bounces back amidst debt ceiling stalemate; Canadian Manufacturing Sales stumble
US House Speaker Kevin McCarthy said that both sides made some progress but that “There are still outstanding issues. I’ve directed our team to work 24/7 to solve this problem.” Uncertainty around the negotiations keeps US Treasury bond yields climbing, with the US 10-year benchmark note rate at 3.789%, its highest level since the Silicon Valley Bank (SVB) collapse on March 10.
Meanwhile, US Treasury Secretary Janet Yellen continued her campaign putting pressure on the US Congress, stating the US would run out of cash by June 1. Some consequences of the political drama in Washington triggered a reaction by Fitch Rating, warning that the US AAA rating is under threat.
Consequently, the US Dollar Index (DXY), which measures the performance of a basket of six currencies vs. the greenback, trades at 104.266, gains 0.36%. Therefore, the USD/CAD climbs on a strong US Dollar (USD), and weaker oil prices, as WTI tmbles more than 3%.
Aside from geopolitical jittery, US economic data shows the economy regaining momentum, as the Initial Jobless Claims for the week ending on May 20 expanded by 229K below expectations of 245K, as revealed by the US Bureau of Labor Statistics (BLS). In another report, the second estimate of the US Gross Domestic Product (GDP) for Q1 was revised from 1.1% to 1.3%.
On Wednesday, the US Federal Reserve revealed the May meeting minutes, which showed that the US central bank is open to pause rates at the upcoming meetings, though emphasized that some flexibility is needed in the case of needing higher rates. Furthermore, participants commented the current monetary policy is impacting the economy as bank credit tightened, that no rate cuts are expected in 2023, and that the Fed will be data-dependent.
On the Canadian front, Manufacturing Sales plunged -0.2% in April, below March’s 0.7% increase.
USD/CAD Technical Levels
- Silver price is on a 4-day losing streak.
- Bears running out of steam near overbought RSI.
- 100 and 200-day SMAs could serve as support and resistance levels in sideways trading period.
Silver price (XAG/USD) trades with 0.57% losses at $22.93 at the time of writing, after bottoming at a low of $22.75 during the early Asian session. The precious metal price is trading in the red for a fourth consecutive day, and buyers should not ignore that technical indicator on the daily chart are approaching oversold conditions.
That being said, the Relative Strength Index (RSI) is just above the overbought threshold while the Moving Average Convergence Divergence (MACD) has been standing in negative territory since mid-April, suggesting that a technical correction may be on the horizon.
In addition, XAG/USD lost the 100-day Simple Moving Average (SMA) for the first time since March and now has its last support at the 200-day SMA at $22.01. So, considering the possibility of an upwards correction, the price can use the mentioned moving averages as support and resistances for consolidating the losses and then entering a period of sideways trading.
- The AUD/USD takes a hit, trading at around 0.6505, as US debt ceiling discussions fail to conclude and tech stocks gain momentum due to rising interest in AI.
- The US economy demonstrates resilience with robust Retail Sales, Industrial Production, and a firm labor market, countering rising Initial Jobless Claims.
- Debt ceiling deadlock stirs fears over US AAA rating; Yellen warns of potential cash crunch by June.
AUD/USD tanks as Thursday’s North American session begins, amidst mixed market sentiment, with US debt ceiling discussions being the center stage, while the AI frenzy has taken tech stocks higher. In the meantime, the United States (US) economy is proving resilient amidst the recent data released. At the time of writing, the AUD/USD is trading at around 0.6511 after hitting a six-month low of 0.6503.
US economy shows resilience with the improved job market and GDP growth; the Australian economy faces pressure
US economic data showed that Initial Jobless Claims for the week ending on May 20 rose by 229K below estimates of 245K, according to data from the US Department of Labor. The US economy has gained momentum as Retail Sales, Industrial Production, business activity, and a “tight” labor market underpinned the US Dollar (USD). In a separate report, the US Bureau of Labor Statistics (BLS) showed that the second estimate of Gross Domestic Product (GDP) for Q1 was revised from 1.1% to 1.3%.
In the meantime, the US Dollar Index, which measures the buck’s performance against a basket of six currencies, rises for four consecutive trading days, up 0.21%, at 104.103. It should be said that a double-bottom chart pattern looms, and with an upside break above 105.883, that will validate the pattern.
Must read: US Dollar Index: Reclaims 200-day EMA, surpasses 2017 yearly high, as bulls stepped in eyeing 104.000
US debt ceiling talks hit an impasse as the White House (WH) and the US Congress, led by US House Speaker Kevin McCarthy, failed to seal an agreement that could lift the US ceiling so that the country can pay its obligations, which, according to US Treasury Secretary Janet Yellen, saying the US would run out of cash by June 1. Some consequences of the political drama in Washington triggered a reaction by Fitch Rating, warning that the US AAA rating is under threat.
The AUD/USD continues to be pressured amidst the lack of a catalyst on the Australian front. The Reserve Bank of Australia’s (RBA) minutes showed the central bank’s beliefs that higher rates, inflation, and income tax would contribute to a slowdown in consumer spending.
Additionally, China’s economy losing momentum would likely keep the AUD/USD tilted to the downside. According to Bloomberg, “Recent data suggest gross domestic product growth this year will be closer to the government’s target of about 5%, contrary to expectations of a large overshoot formed earlier in the year.”
AUD/USD Price Analysis: Technical outlook
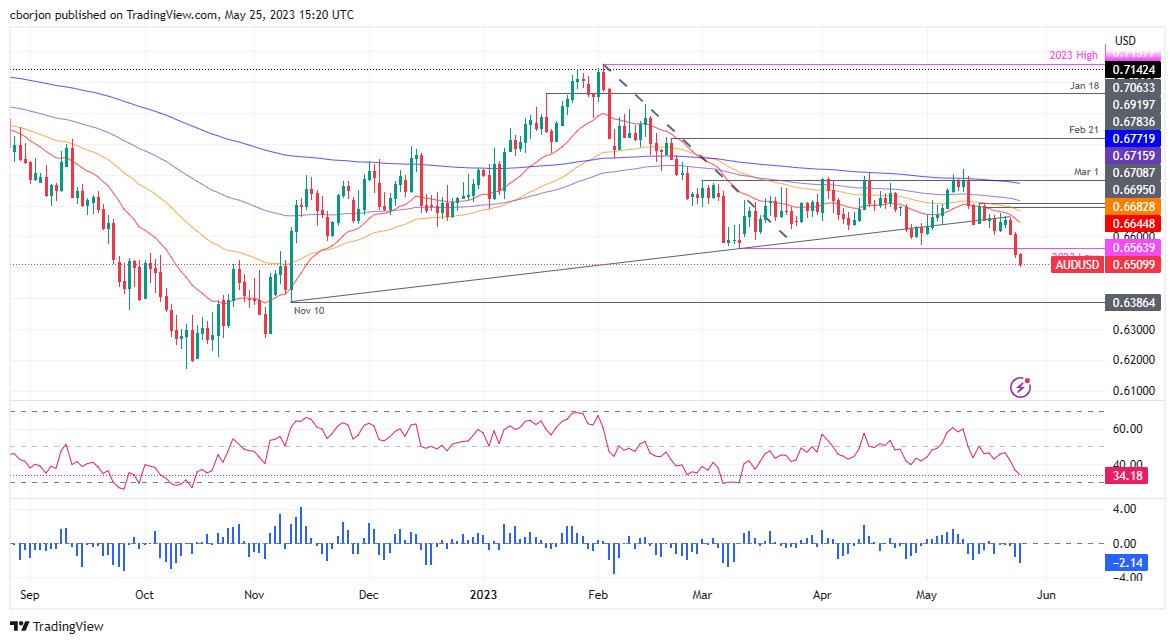
From a daily chart perspective, the AUD/USD is neutral to downward biased, with a clear path of challenging the November 10 daily low of 0.6386, but firstly, the AUD/USD pair must fall below crucial support levels. The first one would be 0.6500. A decisive break will expose the 0.6400 figure before testing the abovementioned area at the 0.6200 handle. Otherwise, if AUD/USD stays above 0.6500, the 0.6600 psychological figure is up for grabs.
The USD rallied across the board last week. Economists at TD Securities discuss greenback outlook.
Near-term outlook has turned less USD bearish
“The USD has further upside to start the summer simply just to work off legacy shorts that were built up before the implosion of China and European data surprises.”
“However, while the near-term outlook has turned less USD bearish, we still forecast a weaker USD through H2.”
See: Outside chance that the Fed will implement another step is positive for the USD – Commerzbank
Thomas Barkin, president of the Federal Reserve Bank of Richmond, said on Thursday that the US labor market remains tight and added noted that some business are still saying that they need to raise prices, per Reuters.
Additional takeaways
"Demand is definitely cooling, in part because it was overstimulated during the pandemic."
"Fed rate hikes are also helping reduce demand, as is credit tightening due to bank failures."
"Data on productivity has been moving the wrong way but much is unknown about COVID impacts on hiring, labor force."
"Fed is in a test and learn situation to determine how slowing demand lowers inflation."
Market reaction
The US Dollar Index clings to modest daily gains above 104.00 after these comments.
Boston Federal Reserve President Susan Collins said on Thursday that the Fed "may be at or near" the time to pause interest rate increases, as reported by Reuters.
"While inflation is still too high, there are some promising signs of moderation," Collins further elaborated.
"I also believe it is important to make each policy decision based on a holistic assessment of information available at the time - and the next policy meeting will be in mid-June," she added and reiterated that they will continue to monitor a wide range of data to evaluate how the economy is doing.
Market reaction
The US Dollar Index retreated modestly from daily highs following these comments and was last seen gaining 0.2% on the day at 104.10.
Europe managed to escape severe shortages in Gas amid mild temperatures and plentiful LNG supply. However, we cannot rule out another energy crisis next winter, in the opinion of strategists at ANZ Bank.
Prices to remain volatile
“Our base case scenario is that Europe will get through another winter without any significant disruptions to energy supply. However, we think there is a 30% chance of the worst-case scenario playing out, a risk we feel the market is underestimating.”
“The uncertainty around the energy market’s outlook is expected to increase volatility in European Gas prices. Any signs that our worst-case scenario may be unfolding will likely see a re-rating by the market, leading to further upside in prices.”
The Mexican central bank has ended its cycle of interest rate hikes but continues to signal attractive real interest rates. This supports the Peso, although downside risks emanate from US economic developments, economists at Commerzbank report.
An important risk factor for the MXN remains developments in the US
“If inflation falls as expected, we see room for rate cuts towards the end of this year or early in 2024. However, we do not expect the Peso to depreciate significantly against the USD as any rate cuts are likely to be in line with the Fed's own easing efforts.”
“If the US economy cools down more than expected, this would also weigh on the Mexican outlook. This would likely limit upside risks to inflation and could imply a sharper cut in Mexican interest rates and a correspondingly less attractive real interest rate outlook, which would weigh on the Peso.”
“In our baseline scenario, however, we expect solid domestic demand and Banxico's vigilance to continue to support the Peso in the face of a still uncertain inflation outlook.”

Source: Commerzbank Research
- USD/JPY regained its traction and climbed above 139.50.
- US Dollar benefits from upbeat macroeconomic data releases from the US.
- BoJ's Ueda hinted at a possible tweak to YCC strategy.
USD/JPY reversed its direction and advanced beyond 139.50 in the American session following a decline to the 139.20 area in the European session. At the time of press, the pair was up 0.12% on the day at 139.63.
USD regathers strength after latest data
Earlier in the day, Bank of Japan (BoJ) Governor Kazuo Ueda said that they could tweak the Yield Curve Control (YCC) strategy if the balance between the benefit and the cost of the policy were to shift. "It is possible to keep 5-year bond yield stable and low even by targeting 10-year yield, as long as the shape of yield curve is an upward slope," Ueda added and helped the Japanese Yen stay resilient against its rivals.
In the second half of the day, the US Dollar (USD) capitalized on strong data releases and caused USD/JPY to turn north. Annualized first-quarter Gross Domestic Product (GDP) growth got revised higher to 1.3% from 1.1% and the weekly Initial Jobless Claims came in at 229,000, mush lower than the market expectation of 245,000.
Nevertheless, the positive opening in Wall Street seems to be limiting the USD's gains for the time being and capping USD/JPY's upside. The S&P 500 and the Nasdaq Composite indexes were last seen rising 0.4% and 1.9% on a daily basis, respectively.
Market participants will pay close attention to comments from Federal Reserve (Fed) officials in the American session. According to the CME Group FedWatch Tool, the probability of the Fed leaving its policy rate declined below 55% from nearly 70% on Wednesday.
Technical levels to watch for
- GBP/USD drops to the 1.2330 region earlier on Thursday.
- Persistent buying pressure in the greenback keeps the pound depressed.
- UK CBI Distributive Trades dropped to -10 for the current month.
Further strength in the greenback weighs on the risk complex and drags GBP/USD to revisit the area of multi-week lows near 1.2330 on Thursday.
GBP/USD faces the next support near 1.2270
GBP/USD retreats for the fourth session in a row and extends further the rejection from 2023 peaks near 1.2680 (May 10), an area also coincident with the 2021-2023 resistance line and the 100-week SMA.
In the meantime, recession concerns in the UK economy appears to have been reignited following sticky inflation figures in the UK during April ([published on May 24), which in turn seem to have reinforced the idea of extra tightening by the BoE in the upcoming MPC meetings.
In the United Kingdom, Car Production increased 9.9% year-on-year to April, while the CBI Distributive Trades fell to -10 for the current month (from 5).
GBP/USD levels to consider
As of writing, the pair is losing 0.21% at 1.2338 and faces the next support at 1.2283 (100-day SMA) seconded by 1.2274 (monthly low April 3) and finally 1.2010 (weekly low March 15). On the other hand, the surpass of 1.2668 (2023 high May 8) would open the door to 1.2864 (200-week SMA) and then 1.3000 (psychological level).
Economists at Rabobank discuss GBP outlook and share their GBP/USD and EUR/GBP forecasts.
EUR/GBP to trade in a choppy range in the coming weeks
“The government’s position has altered significantly since September, but many of the underlying weakness in UK fundamentals remain.”
“Positioning suggests that both the Pound and the EUR are ill-equipped to face disappointing economic data currently and we expect EUR/GBP to trade in a choppy range in the coming weeks. That said, we see scope for cable to drop to 1.22 on a three-month view.”
- Gold price came under renewed bearish pressure on Thursday.
- First-quarter US GDP growth revised higher to 1.3%.
- 10-year US Treasury bond yield is up more than 1% near 3.8%.
Gold price turned south and dropped to its weakest level since late March slightly below $1,945 on Thursday before staging a modest rebound. As of writing, XAU/USD was down 0.55% on the day at $1,945.
US yields rise on strong data
The US Bureau of Economic Analysis announced that it revised the annualized Gross Domestic Product (GDP) growth for the first quarter to 1.3% from the advance estimate of 1.1%. Additionally, the US Department of Labor's weekly report revealed that there were 229,000 initial claims for unemployment benefits in the week ending May 20, much lower than the market expectation of 245,000.
Boosted by the upbeat macroeconomic data releases, the benchmark 10-year US Treasury bond yield gained nearly 1% and reached 3.8% for the first time since the second week of March, weighing on the inversely-correlated XAU/USD.
According to the CME Group FedWatch Tool, markets are currently pricing in a less than 60% probability of the US Federal Reserve leaving its policy rate unchanged in June, compared to nearly 80% earlier this week.
Later in the session, April Pending Home Sales and Kansas Fed Manufacturing Activity data for May will be featured in the US economic docket. Investors will continue to pay close attention to fresh developments surrounding the debt-limit negotiations as well.
Technical levels to watch for
Economists at Commerzbank discuss whether further rate hikes are possible and their implications for the US Dollar.
Number of FOMC members over the past days in favor of ‘skipping’ the June meeting
“We had a number of FOMC members over the past days who were in favor of ‘skipping’ the June meeting (so no rate hike), but who do not want this to be understood as the end of the rate cycle. Governor Christopher Waller was the last to do so yesterday. Of course, the market had doubted the story spread by the Fed officials for some time. So there might have been a number of market participants who heard the comments but did not believe them.”
“It is nonetheless positive for the Dollar that there is still an outside chance that the Fed will implement another step. And that skipping a meeting in June does not mean that this opportunity will not arise.”
- Initial Jobless Claims in the US decreased by 4,000 in the week ending May 20.
- US Dollar Index clings to daily gains above 104.00.
There were 229,000 initial jobless claims in the week ending May 20, the weekly data published by the US Department of Labor (DOL) showed on Thursday. This print followed the previous week's print of 225,000 (revised from 242,000) and came in better than the market expectation of 245,000.
Further details of the publication revealed that the advance seasonally adjusted insured unemployment rate was 1.2% and the 4-week moving average was 231,750, unchanged from the previous week's revised average.
"The advance number for seasonally adjusted insured unemployment during the week ending May 13 was 1,794,000, a decrease of 5,000 from the previous week's unrevised level of 1,799,000," the DOL further added in its press release.
Market reaction
The US Dollar continues to outperform its rivals after this data and the US Dollar Index was last seen rising 0.25% on the day at 104.15.
- The US BEA revised Q1 GDP higher to 1.3% from 1.1%.
- US Dollar Index stays in positive territory above 104.00.
The real Gross Domestic Product (GDP) of the US expanded at an annualized rate of 1.3% in the first quarter, the US Bureau of Economic Analysis' (BEA) second estimate showed on Thursday. This reading came in above the advance estimate and the market expectation of 1.1%.
"The increase in real GDP reflected increases in consumer spending, exports, federal government spending, state and local government spending, and nonresidential fixed investment that were partly offset by decreases in private inventory investment and residential fixed investment. Imports, which are a subtraction in the calculation of GDP, increased," the BEA explained in its publication.
Market reaction
The US Dollar preserves its strength after this report and the US Dollar Index was last seen gaining 0.22% on the day at 104.12.
- EUR/USD retreats to fresh monthly lows near 1.0715.
- The loss of the 1.0700 region exposes a deeper decline.
EUR/USD maintains the bearish note well in place and revisits the vicinity of 1.0700, or monthly lows, on Thursday.
In the meantime, the ongoing bearish development could force the pair to extend the move to the March low of 1.0516 (March 15) in case the 1.0700 region is cleared in a sustainable fashion.
Looking at the longer run, the constructive view remains unchanged while above the 200-day SMA, today at 1.0477.
EUR/USD daily chart
- Oil price declines as traders take profit and the debt-ceiling impasse continues without a deal in sight.
- Set against, however, Oil is supported by EIA inventory data, showing a steep drawdown in the prior week, reflecting rising demand.
- Comments by the Saudi Oil Minister warning short-sellers and the start of the US driving season are bullish factors.
Oil price rolls over and heads south on Thursday due to continued unease around the debt ceiling and traders booking profits from the recent rally. Crude is mainly priced in the US Dollar and this is getting stronger, putting further pressure on the Oil price. The Dollar Index (DXY) has broken above the 104.00 psychological level on safe-haven flows.
At the time of writing, WTI Oil is trading in the upper $72s and Brent Crude Oil in the upper $76s. A bullish right-angled triangle has completed on the 4-hour chart, posing a challenge to the overall bear trend.
Oil news and market movers
- A lack of traction in US debt-ceiling talks weighs on the Oil price as it raises the specter of the US defaulting and triggering a global recession.
- The US Dollar catches a bid from a combination of safety flows and greater expectations the Federal Reserve (Fed) will continue to hike rates. US macro data remains supportive.
- Energy Information Administration (EIA) inventory data released on Wednesday showed a much larger-than-expected 12.5 million barrel drawdown, indicating robust demand. Analysts’ expectations had been for a 775,000 rise.
- Oil was supported by comments from Saudi Oil Minister, Prince Abdulaziz bin Salman, who warned Oil speculators to "watch out" and that they might suffer as they did "in April".
- His comments have been taken as warning to short-sellers that the Oil price might rise.
- Abdulaziz defended OPEC and its decision to cut production by 2 million barrels per day (bpd) at its meeting in October 2022. Given the Oil price is at similar levels to October, it may suggest there is a risk the cartel will announce another supply cut in June.
- The US Memorial Day weekend kicks off on May 27 and marks the beginning of the US summer driving season, which will provide a seasonal lift to demand, supporting Oil prices.
Crude Oil Technical Analysis: Triangle in downtrend
WTI Oil is in a long-term downtrend from a technical perspective, making successive lower lows. Given the old adage that the trend is your friend, this favors short positions over long positions. WTI Oil is trading below all the major daily Simple Moving Averages (SMA) and all the weekly SMAs except the 200-week, which is at $66.89.
-638206144141310735.png)
WTI US Oil: Daily Chart
A right-angled triangle has formed since price recovered from the May 4 YTD lows, as shown by the dotted lines. The initial rebound off the May 4 lows could be a Wave A, with Wave B descending between May 8-15. Wave C rose in the week that followed, before pulling back in a Wave D. The recovery this week is probably a Wave E. Since most triangles are only composed of five waves it is now likely complete. It could break out at any moment.
There is a chance the triangle might break in either direction, but it is biased to break higher because the top border is flat (it is right-angled). A breakout higher could see price rise in a volatile rally to a potential target in the $79.70s, calculated by using the usual technical method, which is to take 61.8% of the height of the triangle and extrapolate it from the breakout point higher. Oil price could even go as far as a 100% extrapolation in bullish cases, however, the 61.8% level roughly coincides with the 200-day SMA and the main trendline for the bear market, heightening its importance as a key resistance level.
Assuming Oil price reaches its target, a bullish break would mean price moving above the $76.85 lower high of April 28, thereby, bringing the dominant bear trend into doubt.
The three green bars in a row that represent the rally this week (Wave E) and the tentative breakout that accompanied Wednesday’s rally, are a strong bullish sign. Price could still recover despite the bearish action on Thursday, and eventually continue higher.
As well as the triangle, the long hammer Japanese candlestick pattern that formed at the May 4 (and year-to-date) lows is a sign that it could be a key strategic bottom.
Further, the mild bullish convergence between price and the Relative Strength Index (RSI) at the March and May 2023 lows – with price making a lower low in May that is not matched by a lower low in RSI – is a sign that bearish pressure is easing.
Given the downtrend is dominant, however, there is still also a possibility WTI Oil price could break lower, with a decisive break below the triangle’s lower border, likewise required, and a target at $67.27. This is just above where the 200-week SMA is located and likely to offer support. Traders might even wish to wait for a break below the lows of Wave B at $69.40 for added confirmation.
-638206144608419505.png)
WTI US Oil: Weekly Chart
A break below the year-to-date (YTD) lows of $64.31 would be required to re-ignite the downtrend, with the next target at around $62.00 where trough lows from 2021 will come into play, followed by support at $57.50.
WTI Oil FAQs
What is WTI Oil?
WTI Oil is a type of Crude Oil sold on international markets. The WTI stands for West Texas Intermediate, one of three major types including Brent and Dubai Crude. WTI is also referred to as “light” and “sweet” because of its relatively low gravity and sulfur content respectively. It is considered a high quality Oil that is easily refined. It is sourced in the United States and distributed via the Cushing hub, which is considered “The Pipeline Crossroads of the World”. It is a benchmark for the Oil market and WTI price is frequently quoted in the media.
What factors drive the price of WTI Oil?
Like all assets, supply and demand are the key drivers of WTI Oil price. As such, global growth can be a driver of increased demand and vice versa for weak global growth. Political instability, wars, and sanctions can disrupt supply and impact prices. The decisions of OPEC, a group of major Oil-producing countries, is another key driver of price. The value of the US Dollar influences the price of WTI Crude Oil, since Oil is predominantly traded in US Dollars, thus a weaker US Dollar can make Oil more affordable and vice versa.
How does inventory data impact the price of WTI Oil
The weekly Oil inventory reports published by the American Petroleum Institute (API) and the Energy Information Agency (EIA) impact the price of WTI Oil. Changes in inventories reflect fluctuating supply and demand. If the data shows a drop in inventories it can indicate increased demand, pushing up Oil price. Higher inventories can reflect increased supply, pushing down prices. API’s report is published every Tuesday and EIA’s the day after. Their results are usually similar, falling within 1% of each other 75% of the time. The EIA data is considered more reliable, since it is a government agency.
How does OPEC influence the price of WTI Oil?
OPEC (Organization of the Petroleum Exporting Countries) is a group of 13 Oil-producing nations who collectively decide production quotas for member countries at twice-yearly meetings. Their decisions often impact WTI Oil prices. When OPEC decides to lower quotas, it can tighten supply, pushing up Oil prices. When OPEC increases production, it has the opposite effect. OPEC+ refers to an expanded group that includes ten extra non-OPEC members, the most notable of which is Russia.
Bank of Japan (BoJ) Governor Kazuo Ueda said on Thursday that they could tweak the Yield Curve Control (YCC) strategy if the balance between the benefit and the cost of the policy were to shift, as reported by Reuters.
Additional takeaways
"Shortening the duration of bond yield BoJ targets to 5-year zone from current 10-year would be among options if we were to tweak YCC in the future."
"It is possible to keep 5-year bond yield stable and low even by targeting 10-year yield, as long as the shape of yield curve is an upward slope."
"BoJ must avoid tightening monetary policy prematurely."
"Japan's consumer inflation likely to slow ahead but if this projection proves wrong, we will act swiftly."
"BoJ will conduct various surveys, hearings and workshops inviting academics in review of past monetary policy moves."
"BoJ should stick to its 2% inflation target."
Market reaction
USD/JPY edged lower with the initial reaction to these remarks and was last seen losing 0.1% on the day at 139.32.
Economists at MUFG Bank expect a sharper growth slowdown to drag down US yields and the greenback.
Mild recession to start later this year, followed by a moderately paced recovery
“The economic forecast prepared by the Fed staff for the May FOMC meeting continued to assume that ‘the effects of the expected further tightening in bank credit conditions, amid already tight financial conditions, would lead to a mild recession starting later this year, followed by a moderately paced recovery. Real GDP was projected to decelerate over the next two quarters before declining modestly in both the fourth quarter of this year and the first quarter of next year’.”
“We share the Fed staff’s outlook for a shaper growth slowdown which we believe will bring US yields and the US Dollar back down.”
Losses in the Krona over the past week have exceeded those of any other G10 currencies. Economists at ING note that SEK recovery path remains very narrow, and almost fully dependent on market dynamics.
It is up to the market to turn the tide for the Krona
“The near-term outlook remains grim and it will almost entirely be up to market dynamics to change the tide for the Krona.”
“We think EUR/SEK could trade within a volatile 11.40/11.60 range into and shortly after the 29 June Riksbank meeting.”
“The best news for SEK would probably be an upside surprise in May inflation numbers, that could help the Riksbank sound more hawkish.”
Kit Juckes, Chief Global FX Strategist at Société Générale, expects the EUR/USD pair to nosedive a move below the 1.07 level.
USD/JPY could spike higher if breaks 140
“EUR/USD could spike sharply lower if we break 1.07 and USD/JPY could spike higher if we break 140.”
“Short EUR/JPY remains an easier trade than trying to guess where the other pairs turn around.”
“As long as the market has concerns about Chinese data and USD/CNH is trundling higher, CAD, AUD and NZD will also remain under pressure, and CAD is the only one I’m even slightly tempted to buy.”
- DXY advances to new monthly peaks past the 104.00 yardstick.
- The continuation of the upside could revisit the 200-day SMA.
DXY clinches fresh tops in levels last seen in mid-March past the 104.00 hurdle on Thursday.
Further upside appears on the cards in the near term. That said, the next resistance level of note is expected at the key 200-day SMA, today at 105.71, prior to the 2023 peak of 105.88 (March 8).
Looking at the broader picture, while below the 200-day SMA the outlook for the index is expected to remain negative.
DXY daily chart
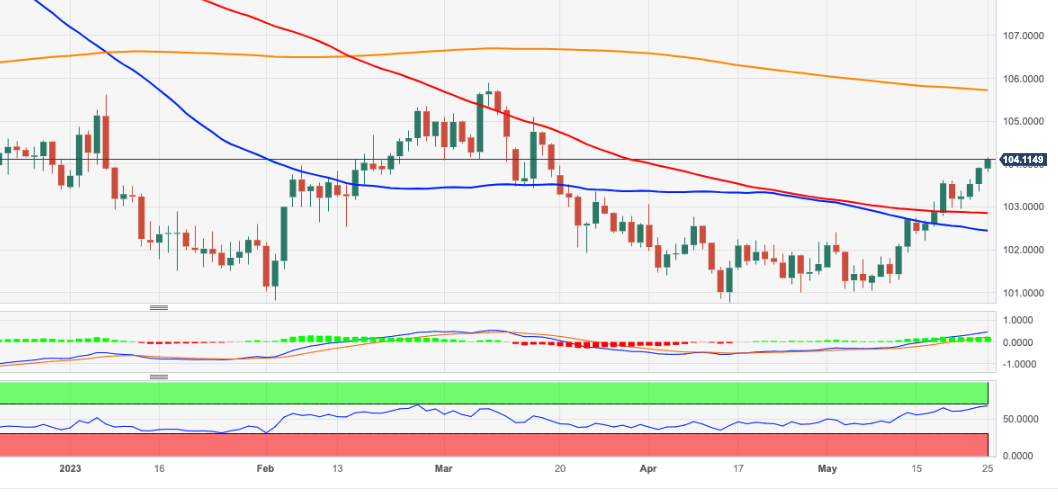
UOB Group’s Economist Lee Sue Ann reviews the latest interest rate decision by the RBNZ.
Key Takeaways
“The Reserve Bank of New Zealand (RBNZ) decided to raise its official cash rate (OCR) by 25bps to 5.50%. Updated forecasts by the RBNZ show the OCR peaking at 5.5%. The central bank now expects inflation to return to its target band in 3Q24. Its forecasts show the economy will not slow as much as it previously expected, with a very mild recession projected for the second and third quarters of this year.”
“The RBNZ noted that the surge in immigration is expected to bolster growth and add to inflation pressure, but said it expects the pace of the migrant inflow to ease over coming quarters. It also downplayed concerns about fiscal policy boosting demand.”
“Overall, we expect the RBNZ to retain a tightening bias, keeping the door open for a further rate hike if needed. At this juncture, we are keeping our OCR forecast at 5.50% for the rest of this year, while bearing in mind that the next monetary policy meeting will be on 12 Jul, and a lot can still change from now till then.”
- EUR/JPY pierces the key barrier at 150.00 on Thursday.
- Further north emerges the 2023 peak near 151.60.
EUR/JPY fades part of Wednesday’s marked uptick and keeps the trade close to the key hurdle at 150.00 on Thursday.
While the likeliness of further consolidation appears a plausible near-term scenario, a convincing breakout of the key round level at 150.00 could encourage the cross to dispute the 2023 top at 151.61 (May 2) in the not-so-distant future.
So far, further upside looks favoured while the cross trades above the 200-day SMA, today at 143.55.
EUR/JPY daily chart
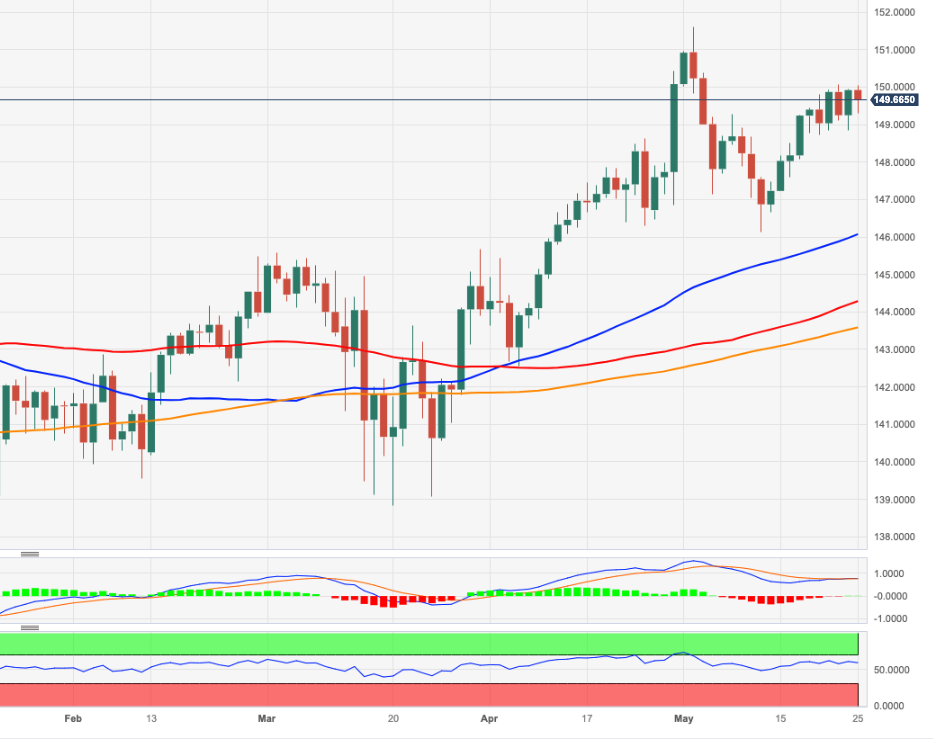
Given USD overnight rates now at 5%, shorting Dollars is an expensive proposition, economists at ING report.
5% USD deposit rates are hard to fight
“For today, we will see revisions to first quarter US GDP and the weekly initial claims data. With overnight USD deposit rates now a very dear 5.00%, the burden of proof for Dollar bears will have to be very high – and there is not just enough of it at present.”
“Above 104.00/104.20, there is an outside risk that DXY needs to trade all the way back to the 105.88 high seen in early March.”
According to Economist Lee Sue Ann and Markets Strategist Que Ser Leang at UOB Group, extra gains in USD/CNH could retest the 7.1200 region in the short-term horizon.
Key Quotes
24-hour view: “Yesterday, we held the view that USD might break above the major resistance at 7.0960. We indicated, ‘Support is at 7.0600, followed by 7.0450’. Our expectations did not materialize as USD rose briefly to 7.0809, dropped to 7.0461 before closing little changed at 7.0645 (-0.02%). We continue to see chance of USD breaking above 7.0960 today. However, it might not be able to hold above this level. Support is at 7.0600, followed by 7.0480.”
Next 1-3 weeks: “Our update from yesterday (24 May, spot at 7.0780) is still valid. As highlighted, the boost in momentum suggests USD is likely to break above 7.0960. A breach of this level will shift the focus to 7.1200. On the downside, a break of the ‘strong support’ level at 7.0280 (no change in level) would indicate the USD strength that started about 2 weeks ago has come to an end.”
Economists at TD Securities discuss the Oil market outlook.
Risks of renewed Oil weakness are not fundamentally caused
“While the risks of renewed Oil price weakness are very real, they are increasingly becoming speculative investor driven, and not fundamentally caused. A drop in liquidity associated with a lack of a solution on the US debt ceiling front renewed hawkish talk from the Fed, or increasing concern surrounding growing Covid cases in China could well see spec knee-jerk selling and another test of recent lows again. However, we don’t view this as likely, or very durable should it occur.”
“We see Crude trading in the $90/bbl range in the second half, driven by still strong demand growth this year, OPEC+ commitment to tighten markets and continued demand recovery in China due to post-COVID normalization.”
- US Dollar books gains against most of its peers as the Greenback retains safe haven status.
- US debt-ceiling talks linger on while Fitch issues a negative outlook for the US credit rating.
- US Dollar Index breaks 104 and jumps higher, next level on the upside is at 105.
The US Dollar (USD) is heading higher in what looks to become a rally for this week with a four-day winning streak. Comments overnight from US Treasury Secretary Janet Yellen and the FOMC Minutes only confirmed that the current play with the USD as safe haven is still very much valid. Meanwhile US debt-ceiling talks ended again unresolved but with good progress according to US House Speaker Kevin McCarthy.
On the macroeconomic data front, traders can look at the second estimate of US Gross Domestic Product (GDP) numbers for the 1st quarter at 12:30 GMT. Initial Jobless Claims at that same time will show a glimpse of how the employment market is doing. Throughout the day it will be worth wild to keep an eye on 1-year US Treasury Bills (T-bills) as they have been soaring to 7% on Wednesday, with US Credit Default Swaps (CDS) back at the highs. Fed officials are set to speak with Thomas Barkin talking at 13:30 GMT at an Economic Forum and then Susan Collins at 14:30 GMT.
Daily digest: US Dollar the place to be
- US Treasury Secretary Yellen reiterated that the US government may run out of cash as of June 1st and that some obligations will be unable to be paid after that day. Some stress in financial markets currently at hand might substantially escalate further if a deal is not found.
- Kevin McCarthy concluded the talks on Wednesday with no deal, but good progress.
- FOMC Minutes underlined again that the Fed remains data-dependent with cuts unlikely while inflation is still unacceptably high.
- Fitch issued a negative outlook for its AAAu credit rating of the United States.
- US Credit Default Swaps (CDS) jumped higher for a third day in a row and are nearing the peak of last Wednesday.
- US equity futures are mixed with Nvidia (NVDA) keeping the Nasdaq in the green.
- The CME Group FedWatch Tool shows that markets are pricing in a 50% chance of rate hike for July after hawkish comments from Federal Reserve officials Jim Bullard and Neal Kashkari. Rate cuts have moved down the line to as early as November 2023.
- The benchmark 10-year US Treasury bond yield trades at 3.75% and flirts with another two-month high after as it is set to take out the high of Tuesday.
US Dollar Index technical analysis: Hiccup in Washington pauses uptrend
The US Dollar Index (DXY) has taken out both the 55-day and the 100-day Simple Moving Averages (SMA), respectively, at 102.43 and 102.85 on the upside. The safe haven status keeps seeing bids for the DXY with 104 having been broken early on Thursday, during the European trading session. The next target becomes 105.
On the upside, 105.74 (200-day SMA) still acts as long-term price target to hit, as the next upside key level for the US Dollar Index is at 104.00 (psychological, static level), and acts as an intermediary element to cross the open space.
On the downside, 102.85 (100-day SMA) aligns as the first support level to confirm a change of trend. In the case that breaks down, watch how the DXY reacts at the 55-day SMA at 102.48 in order to assess any further downturn or upturn.
US Dollar FAQs
What is the US Dollar?
The US Dollar (USD) is the official currency of the United States of America, and the 'de facto' currency of a significant number of other countries where it is found in circulation alongside local notes. It is the most heavily traded currency in the world, accounting for over 88% of all global foreign exchange turnover, or an average of $6.6 trillion in transactions per day, according to data from 2022.
Following the second world war, the USD took over from the British Pound as the world's reserve currency. For most of its history, the US Dollar was backed by Gold, until the Bretton Woods Agreement in 1971 when the Gold Standard went away.
How do the decisions of the Federal Reserve impact the US Dollar?
The most important single factor impacting on the value of the US Dollar is monetary policy, which is shaped by the Federal Reserve (Fed). The Fed has two mandates: to achieve price stability (control inflation) and foster full employment. Its primary tool to achieve these two goals is by adjusting interest rates.
When prices are rising too quickly and inflation is above the Fed's 2% target, the Fed will raise rates, which helps the USD value. When inflation falls below 2% or the Unemployment Rate is too high, the Fed may lower interest rates, which weighs on the Greenback.
What is Quantitative Easing and how does it influence the US Dollar?
In extreme situations, the Federal Reserve can also print more Dollars and enact quantitative easing (QE). QE is the process by which the Fed substantially increases the flow of credit in a stuck financial system.
It is a non-standard policy measure used when credit has dried up because banks will not lend to each other (out of the fear of counterparty default). It is a last resort when simply lowering interest rates is unlikely to achieve the necessary result. It was the Fed's weapon of choice to combat the credit crunch that occurred during the Great Financial Crisis in 2008. It involves the Fed printing more Dollars and using them to buy US government bonds predominantly from financial institutions. QE usually leads to a weaker US Dollar.
What is Quantitative Tightening and how does it influence the US Dollar?
Quantitative tightening (QT) is the reverse process whereby the Federal Reserve stops buying bonds from financial institutions and does not reinvest the principal from the bonds it holds maturing in new purchases. It is usually positive for the US Dollar.
Economists at ING discuss EUR/GBP and GBP/USD outlook.
EUR/GBP bias is probably now for a retest of the 0.8650 area
“The EUR/GBP bias is probably now for a retest of the 0.8650 area, and we'll definitely have to see some softer wage/price data over the coming weeks for the Bank of England to be diverted from what looks like another 25 bps hike on June 22nd.”
“For GBP/USD, the 1.2340/50 area seems decent support below which the downside could open up to the 1.2200 area.”
Economists at Société Générale analyze USD/KRW technical outlook.
Short-term price action could remain in a range defined by limits at 1,304 and 1,342
“USD/KRW up move has stalled after failure to overcome 1,342 on second attempt earlier this month. In recent pullback, it has successfully defended interim support zone near previous bullish gap at 1,304/1,295. Only if this gets violated would there be risk of a deeper decline.”
“Short-term price action could remain in a range defined by limits roughly at 1,304 and recent high of 1,342. Once this hurdle is overcome, the phase of rebound is likely to extend towards 1,357, the 61.8% retracement from last October and 1,376.”
European Central Bank (ECB) Vice President Luis de Guindos said in a scheduled speech on Thursday, “one important factor for the future inflation outlook is the behavior of fiscal policy.”
Additional comments
“As the energy crisis fades, governments should roll back the related support measures promptly and in a concerted manner.”
“Downside inflation risks include banking tensions.”
Related reads
- EUR/USD Forecast: Euro needs risk mood to improve for a rebound
- Germany’s Lindner: GDP data have shown surprisingly negative signals
In its monthly assessment report, the Japanese Cabinet Office raised the overall economic view for the first time since July 2022 in May, noting that the economy is 'recovering moderately'.
Additional takeaways
Japan upgrades view on consumer spending for 1st time since July 2022, says it is 'picking up'.
Japan says exports showing 'solid movement', upgrading view for 1st time since Dec 2020.
Japan upgrades view on factory output for 1st time since Aug 2022, says showing 'signs of picking up'.
Market reaction
USD/JPY is holding steady, consolidating the retreat from six-month highs of 139.71. At the press time, the pair is trading at 139.51.
German Finance Minister Christian Lindner said on Thursday, “GDP data have shown surprisingly negative signals.”
“Weak economic dynamics are a task for politicians,” he added.
Also read: German final Gross Domestic Product revised down to 0.3% contraction QoQ in Q1
Market reaction
The Euro is struggling near monthly troughs following the discouraging German data. The EUR/USD pair is losing 0.26% on the day to trade at 1.0723, as of writing.
The South African central bank (SARB) meets today. Economists at Commerzbank analyze how the monetary policy decision could impact the Rand (ZAR).
If SARB does not meet expectations, the ZAR might face further losses
“The Rand is suffering in a risk-averse environment, currently dominated by the US debt debate, and from persistent home-grown problems. The list of those is long and includes the energy crisis, a poor growth outlook and high unemployment as well as questionable foreign policy decisions. This is the government’s responsibility.”
“If the SARB today hikes the key rate to 8.25% as widely expected and keeps the door open for further rate hikes in a hawkish-sounding statement the Rand is likely to benefit only short term at best. A lot seems to have been priced in already. If it does not meet these expectations the ZAR might face further losses in our view, which the SARB is unlikely to risk though.”
EUR/USD continues to edge lower. Economists at ING note that a break below the 1.0715/25 area could trigger a substantial decline.
Re-pricing of China's growth prospects is not helping the EUR
“Doubts over Chinese growth prospects and growing views that there remains unfinished business in the Fed's tightening cycle are weighing on EUR/USD.”
“The pair has some decent support around the 1.0715/25 area, below which there is not much support until 1.0500/0515. That is the risk unless tomorrow's US April core PCE deflator shows a sizable fall.”
In light of the ongoing price action, USD/JPY could attempt a move to the key 140.00 region in the next few weeks, comment Economist Lee Sue Ann and Markets Strategist Que Ser Leang at UOB Group.
Key Quotes
24-hour view: “We did not anticipate USD rising to a high of 139.47 yesterday (we were expecting it trade in a range). While there is no significant increase in momentum, USD could break above the major resistance at 139.60. The next resistance at 140.00 could be out of reach today. Support is at 139.00, followed by 138.65.”
Next 1-3 weeks: “Two days ago (23 May, spot at 138.55), we highlighted that short-term upward momentum appears to be building again and the odds of USD breaking clearly above 139.00 have increased. We added, ‘the next level to focus on is 139.60’. Yesterday (24 May, spot at 138.55), USD took out 139.00 and rose to 139.47. We continue to expect USD to strengthen, albeit likely at a slower pace. Resistance levels are at 139.60 and 140.00. On the downside, a breach of 138.10 (‘strong support’ level previously at 137.55) would indicate that the USD strength that started early last week has ended. Looking ahead, if USD breaks above 140.00, the focus will shift to 140.50.”
Here is what you need to know on Thursday, May 25:
The US Dollar (USD) continues to gather strength against its major rivals on Thursday and the US Dollar Index trades at its strongest level since mid-March above 104.00. In the second half of the day, the US Bureau of Economic Analysis will release the first revision to the first-quarter Gross Domestic Product (GDP) growth. The US economic docket will also feature weekly Initial Jobless Claims and Pending Home Sales data for April.
The risk-averse market environment amid the uncertainty surrounding the outcome of the US debt-limit negotiations helped the USD outperform its rivals mid-week. US House Speaker Kevin McCarthy reassured on Wednesday that the US would avoid a default but noted that they had still a difference over spending.
Hawkish comments from Fed Governor Christopher Waller, who said that he would not support stopping rate hikes unless there was clear evidence that inflation was moving down towards the 2% objective, provided an additional boost to the currency. In the late American session, the minutes of the Fed's May policy meeting revealed that policymakers were split on the support for more interest rate increases but this publication failed to trigger a noticeable market reaction.
Early Thursday, US stock index futures trade mixed with the Dow Futures losing nearly 0.5% and the technology-heavy Nasdaq Futures adding more than 1%. Meanwhile, the benchmark 10-year US Treasury bond yield stays flat near 3.75% following Wednesday's rally.
EUR/USD stays under persistent bearish pressure and trades at its lowest level in over two months below 1.0750 early Wednesday. Earlier in the day, the data from Germany revealed that the GDP contracted at an annualized rate of 0.5% in the first quarter, compared to the initial estimate of 0.1%.
Despite stronger-than-expected Consumer Price Index (CPI) figures, Pound Sterling failed to hold its ground against the USD and GBP/USD registered its lowest daily close since late March below 1.2400 on Wednesday. The pair stays relatively quiet early Thursday and consolidates its weekly losses slightly above 1.2350.
Fuelled by rising US T-bond yields, USD/JPY advanced toward 140.00 and reached its highest level since November. The pair stages a technical correction in the European morning and trades modestly lower on the day below 139.50.
Pressured by the broad USD strength and the decisive rebound seen in the benchmark 10-year US Treasury bond yield, Gold price suffered large losses on Wednesday. XAU/USD struggles to gain traction and trades at around $1,960 early Thursday.
Bitcoin fell more than 3% on Wednesday and continued to stretch lower in the Asian session on Thursday. After having dropped below $26,000 earlier, however, BTC/USD erased a portion of its daily losses and was last seen trading near $26,200. Similarly, Ethereum fell 3% on Wednesday and broke below $1,800.
- The selling momentum in EUR/USD appears unabated so far.
- The greenback trades in multi-week peaks vs. its main rivals.
- Final GDP Growth Rate in Germany disappointed investors.
The sell-off in the European currency remains well and sound for yet another session and drags EUR/USD to new 2-month lows around 1.0715 on Thursday.
EUR/USD weaker on USD-buying, debt ceiling
EUR/USD loses ground for the third session in a row and trades in the low-1.0700s for the first time since mid-March on Thursday, always following the relentless march north in the greenback, which in turns appears underpinned by the equally strong rebound in US yields across the curve.
In fact, the still unresolved debt ceiling issue continues to put the risk complex under increasing pressure and lends extra wings to the buck, lifting at the same time the USD Index (DXY) to the area of multi-week tops. In this context, the speaker of the House of Representatives, McCarthy, expressed optimism that an agreement could be reached before June, although the rating agency Fitch put the country's credit rating AAA on "watch" late Wednesday, adding to the fears.
Also weighing on the mood around the euro emerged the disheartening prints from the final German GDP figures, which saw the economy contract 0.5% YoY in Q1 and 0.3% vs. the previous quarter. In addition, the Consumer Confidence gauged by the GfK improved marginally to -24.2 for the month of June.
In the US docket, Initial Claims are due along with another revision of the Q1 GDP Growth Rate, Pending Home Sales and the Chicago Fed National Activity Index.
What to look for around EUR
EUR/USD’s sell-off gathers traction and threatens to challenge the key support at 1.0700 the figure so far on Thursday.
The movement of the euro's value is expected to closely mirror the behaviour of the US Dollar and will likely be impacted by any differences in approach between the Fed and the ECB with regards to their plans for adjusting interest rates.
Moving forward, hawkish ECB-speak continue to favour further rate hikes, although this view appears in contrast to some loss of momentum in economic fundamentals in the region.
Key events in the euro area this week: Germany Final Q1 GDP Growth Rate, GfK Consumer Confidence (Thursday) – Italy, France Consumer Confidence (Friday).
Eminent issues on the back boiler: Continuation of the ECB hiking cycle in June and July (and September?). Impact of the Russia-Ukraine war on the growth prospects and inflation outlook in the region. Risks of inflation becoming entrenched.
EUR/USD levels to watch
So far, the pair is losing 0.23% at 1.0724 and faces immediate contention at 1.0714 (monthly low May 19) seconded by 1.0712 (low March 24) and finally 1.0516 (low March 15). On the other hand, a break above 1.0878 (55-day SMA) would target 1.1000 (round level) en route to 1.1095 (2023 high April 26).
CME Group’s flash data for natural gas futures markets noted traders added around 3.5K contracts to their open interest positions on Wednesday, reversing at the same time three consecutive daily pullbacks. On the other hand, volume declined for the fourth straight day, now by around 54.5K contracts.
Natural Gas faces the next up-barrier at $2.70
Wednesday’s decent gains in prices of the natural gas were on the back of increasing open interest, allowing for extra gains in the very near term. Another drop in volume, in addition, is expected to keep the consolidative mood unchanged for the time being.
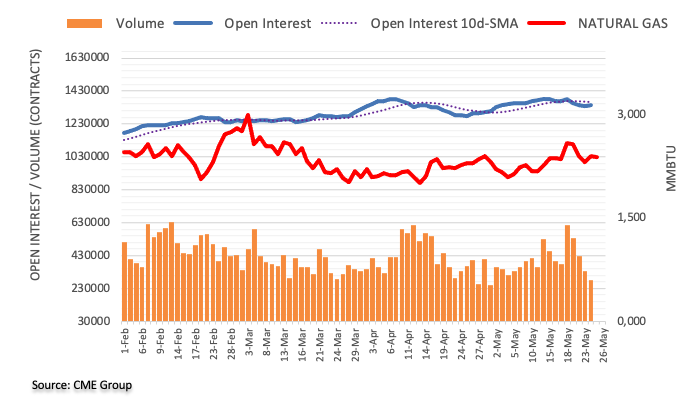
USD/INR has held mostly within the 81.00-83.00 this year, within a narrow 2.5% range. Economists at Commerzbank note that the Reserve Bank of India (RBI) seems content to adopt a stable INR policy.
It is too early to discuss rate cuts by RBI
“The economy is expected to moderate this year, from an estimated 7% for the previous fiscal year 2022-2023 to around 6.4%. This is still respectable growth and will be driven by the strong performance in the domestic sector, particularly the services sector.”
“The good news for RBI is that inflation is also showing signs of peaking, with headline inflation dipping back to the 2-6% target range in April. This provides RBI scope to stay on hold for the foreseeable future. At the same time, it is too early to discuss rate cuts by RBI.”
“We expect RBI to keep rates on hold at 6.50% for the foreseeable future. This should provide some support for INR.”
Further decline could motivate NZD/USD to revisit the 0.6045 region in the near term, according to Economist Lee Sue Ann and Markets Strategist Que Ser Leang at UOB Group.
Key Quotes
24-hour view: “We held view yesterday that NZD ‘could decline further but it is unlikely to break the major support at 0.6135’. While NZD weakened as expected, it cracked 0.6135 and nosedived to 0.6094. Impulsive momentum suggests it could break below the year’s low of 0.6085. Severely oversold conditions suggest NZD might not be able to maintain a foothold below this level and is unlikely to threaten the next support at 0.6045. Resistance is at 0.6125, followed by 0.6145.”
Next 1-3 weeks: “Yesterday (24 May, spot at 0.6185), we indicated that ‘The rapid increase in downward momentum is likely to lead to further NZD weakness. but it is worth noting 0.6135 is a rather strong support level’. We are surprised by how easily NZD took out 0.6135 as it plunged and closed lower by a whopping 2.22% (0.6109), its biggest 1-day drop in more than three months. NZD is likely to weaken further. A break below the year’s low of 0.6085 will shift the focus to 0.6045. The downside risk is intact as long as NZD stays below 0.6185 (‘strong resistance’ level was at 0.6270 yesterday).”
Considering advanced prints from CME Group for crude oil futures markets, open interest increased for the third session in a row on Wednesday, now by nearly 18K contracts. Volume followed suit and added around 158.3K contracts to the previous daily build.
WTI: Interim hurdle now lies at the 100-day SMA
Prices of WTI extended the multi-session advance past the $74.00 mark per barrel on Wednesday. The uptick was on the back of rising open interest and volume and exposes the continuation of the rebound in the very near term. Against that, the next hurdle comes at the provisional 100-day SMA near $76.00 per barrel.
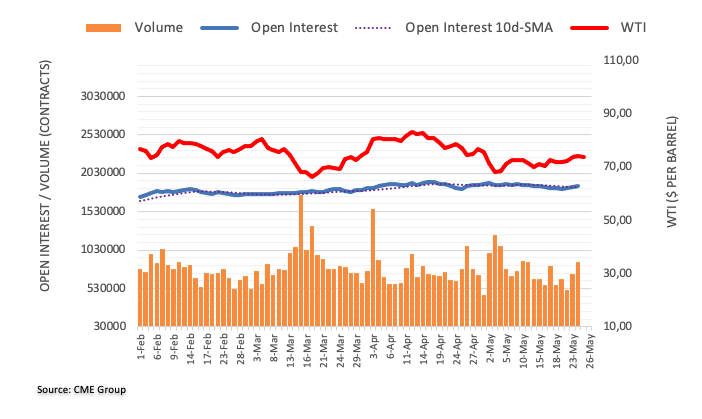
Open interest in gold futures markets dropped once again on Wednesday, this time by around 2.3K contracts according to preliminary readings from CME Group. Volume, instead, increased for the second session in a row, now by around 29.6K contracts.
Gold: Next on the downside emerges $1950
Wednesday’s marked pullback in gold prices was on the back of shrinking open interest, which hints at the idea that a sustained drop seems not favoured for the time being. On the downside, in the meantime, there is decent contention around the $1950 region per ounce troy.
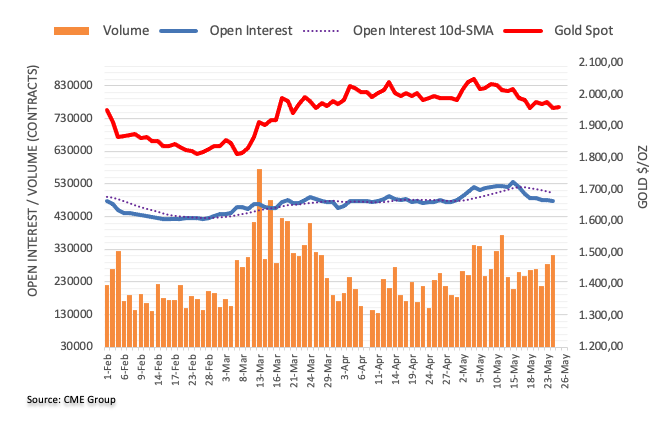
In the view of Economist Lee Sue Ann and Markets Strategist Que Ser Leang at UOB Group, GBP/USD still risks extra declines in the next few weeks.
Key Quotes
24-hour view: “We expected GBP to trade in a range between 1.2385 and 1.2465 yesterday. In London trade, GBP popped briefly to 1.2470 and then plummeted to end the day at 1.2366 (-0.40%). While the rapid drop appears to be oversold, GBP could drop below 1.2350. That said, the next major support at 1.2300 is unlikely to come into view today. The downside risk is intact as long as GBP stays below 1.2435 (minor resistance is at 1.2400).”
Next 1-3 weeks: “We turned negative in GBP about two weeks ago on 12 May, when GBP was trading at 1.2515. Yesterday (24 May, spot at 1.2420), we indicated that ‘the downside risk in GBP is intact as long as it does not break above 1.2500’. In NY trade, GBP dropped to a low of 1.2358, not far above our target of 1.2350. The price actions continue to suggest downside risk in GBP. A clear break below 1.2350 will shift the focus to 1.2300. On the upside, a breach of 1.2470 (‘strong resistance’ level previously at 1.2500) would indicate that GBP is not weakening further.”
NZD/USD got belted yesterday but it is still the best carry in the G10, and it is the only major currency that carries positively against the USD, so it could recover once the dust settles, in the view of analysts at ANZ Bank.
RBNZ feels it has done enough to tame inflation
“The Kiwi remains on the back foot after getting slaughtered in the wake of the extraordinary dovish RBNZ MPS, which suggests, on the face of it that the RBNZ feels it has done enough to tame inflation. While markets were taken aback, they haven’t fully bought into it, with the risk of another hike still priced in, but it’s forced a complete re-think for the Kiwi.”
“On the one hand, the decision took away about 40bp of carry we thought we’d get (markets were pricing in a 5.9% peak in the OCR and the RBNZ is at 5.5%), but on the other, the NZD is still the only G10 currency that offers carry vs the USD, and that won’t be missed by anyone who wants to short the USD. So, even though the Kiwi’s pride has taken a hit, it’s still #1 in the carry stakes. That’s a positive.”
- USD/JPY eases from the highest levels in six months as Yen bears take a breather.
- BoJ’s Kuroda cites welcome signs of economic development but defends easy money policy.
- Mixed Fed talks, FOMC Minutes and anxiety about US debt ceiling issue keep Yen pair traders on a dicey floor.
- Risk catalysts, bond market moves are the key for clear directions.
USD/JPY bulls take a breather after refreshing the Year-To-Date (YTD) high, declining to 139.50 amid early hours of Thursday’s European session. In doing so, the Yen pair reveres the intraday gains but remains dismal amid mixed markets.
That said, Bank of Japan (BoJ) Governor Kazuo Ueda recently crossed wires, via Reuters, as he said that they are beginning to see good signs in the economy but still some distance to stably, sustainably hitting the inflation target. The policymaker also stated, “BoJ will patiently sustain the easy monetary policy.”
On the other hand, US Treasury bond yields remain firmer at the highest levels since mid-March and put a floor under the USD/JPY prices. Recently, a downward revision in Germany’s Q1 GDP renews recession fears in the European powerhouse and hence allowed the US Dollar to remain firmer, as well as back the bond coupons at the multi-day high.
While BoJ’s Ueda defends easy money policy, the Minutes of the latest Federal Open Market Committee (FOMC) Meeting, the policymakers are divided about the latest 0.25% rate hike from the US central bank. The same doubts the market’s bets on another such move in June even if Atlanta Fed President Raphael Bostic and Federal Reserve Governor Christopher Waller prod the hawkish Fed concerns.
Above all, the US policymakers’ inability to deliver a debt ceiling extension deal and the looming long weekend for the House Representatives contrasts with the negotiators’ view that they see progress in the latest rounds of talks. Even so, global rating agencies like Fitch and Moody’s turned cautious about the US credit rating status while the US Treasury Department accepted their fears. With this, the market’s rush towards risk safety gains momentum and propels the US Dollar, as well as the yields.
Amid these plays, the US stock futures lick its wounds while the US Treasury bond yields remain firmer at the highest levels since mid-March.
While the USD/JPY buyers take a breather, they’re not off the table amid fears surrounding the US default and divergence between the Fed and BoJ policies. Apart from these catalysts, the US weekly Jobless Claims, the Chicago Fed National Activity Index and Pending Home Sales should also be eyed for clear directions.
Technical analysis
USD/JPY prods the 50% Fibonacci retracement level of its October 2022 to January 2023 downside amid overbought conditions of the RSI (14) line. Apart from the 50% Fibonacci retracement level surrounding 139.60, the late November 2022 peak of around 139.90, quickly followed by the 140.00 round figure, also challenge the Yen pair sellers.
Meanwhile, the previous resistance line stretched from December 2022, close to 137.80 at the latest, restricts the immediate downside of the USD/JPY pair.
Economists at Goldman Sachs discuss EUR/USD outlook.
Total Dollar depreciation for the year to be more constrained than commonly anticipated
“Unless there is more evidence of divergence in favor of the Euro-area, it is unlikely that the EUR/USD will break the recent range towards the topside.”
“We have maintained a year-end target of 1.10 throughout the year, a level that has already been tested twice but has retracted both times as the market reassessed the relative policy path. We expect this oscillation to persist. Our global forecasts imply there is likely more room for Dollar strength in the near term than what the market is currently pricing in, and we believe the total Dollar depreciation for the year will be more constrained than commonly anticipated.”
- AUD/USD refreshes yearly bottom as traders rush to US Dollar amid market’s indecision.
- Fears of US default contrast with policymakers’ optimism to keep trouble traders.
- RBA vs. Fed divergence regain attention after RBNZ’s dovish hike.
- Risk catalysts, second-tier data can entertain intraday Aussie pair traders.
AUD/USD takes offers to renew the lowest levels in six months around 0.6520 heading into Thursday’s European session. In doing so, the Aussie pair justifies the market’s US Dollar demand amid indecision surrounding the US debt ceiling extension and the Fed concerns.
Following the Reserve Bank of New Zealand’s (RBNZ) dovish hike, the market participants expect the Reserve Bank of Australia (RBA) policymakers to follow the neighbor’s steps and amplify the RBA versus Fed divergence. The same joins this week’s FOMC Minutes and the Fed talks to weigh on the Australian Dollar (AUD).
As per the Minutes of the latest Federal Open Market Committee (FOMC) Meeting, the policymakers are divided about the latest 0.25% rate hike from the US central bank. The same doubts the market’s bets on another such move in June even if Atlanta Fed President Raphael Bostic and Federal Reserve Governor Christopher Waller prod the hawkish Fed concerns.
Elsewhere, US policymakers’ inability to deliver a debt ceiling extension deal and the looming long weekend for the House Representatives contrasts with the negotiators’ view that they see progress in the latest rounds of talks. Even so, global rating agencies like Fitch and Moody’s turned cautious about the US credit rating status while the US Treasury Department accepted their fears.
Against this backdrop, the US stock futures lick its wounds while the US Treasury bond yields remain firmer at the highest levels since mid-March.
Looking ahead, the US weekly Jobless Claims, the Chicago Fed National Activity Index and Pending Home Sales will decorate the calendar but the debt ceiling talks will be crucial to watch for clear directions.
Technical analysis
AUD/USD pair’s sustained downside break of an 11-week-old support-turned-resistance and the 61.8% Fibonacci retracement of the quote’s October 2022 to February 2023 upside, respectively near 0.6620 and 0.6550, keeps bears hopeful. That said, the 61.8% Fibonacci Extension (FE) of its February-May moves, near 0.6445, lures the pair sellers.
The NOK is the worst-performing G10 currency this year. But Norway falling inflation expectations can help the Krone, economists at Société Générale report.
Falling inflation expectations could allow Norges Bank to hike further
“In the medium term, we observe that the EUR/NOK direction tends to follow relative consumer confidence between the Euro-area and Norway. In the current economic context, this indicator is linked to inflation pessimism, and the recent positive inflection in Norway could signal the end of FX losses. In a survey published this week, households in Norway now expect inflation at 4% in one year, from 6% one quarter ago.”
“Falling inflation expectations could allow Norges Bank to hike further, and importantly, the revival of consumer confidence could eventually help NOK to recover.”
- German economy tipped into a technical recession in the first quarter of 2023.
- EUR/USD keeps losses near 1.0730 on the downbeat German GDP data.
The German economy entered a technical recession in the first quarter of 2023, according to the final data published by Germany's Destatis confirmed on Thursday.
The euro area’s economic powerhouse contracted by 0.3% in the first quarter of this year. The preliminary figure showed no growth for Germany in the reported period. The market consensus was for a 0% clip.
Germany’s annualized Gross Domestic Product shrank 0.5%, down sharply from -0.1% recorded in the first estimate and missed the market expectation of -0.1% by a wide margin.
Market reaction
The Euro is feeling the pull of gravity on the discouraging German data, with EUR/USD losing 0.14% on the day near monthly lows of 1.0728.
On Thursday, the UK energy regulator, Ofgem, announced a reduction in its price cap on household energy bills from July to an annual level of GBP2,074 ($2,617.60) for a typical dual-fuel household.
The lowering of the price caps will reflect a decline in wholesale energy prices, the British regulator said.
Russian Deputy Prime Minister Alexander Novak said on Thursday, “I do not see new steps at the June 4th OPEC+ meeting.”
“I see Brent above $80/bbl by year-end,” Novak added.
Market reaction
WTI is extending its retreat from three-week highs of $74.36 on the above comments. The US oil is losing 0.45% on the day to trade at $73.86, as of writing.
- EUR/USD grinds at the lowest levels in two months.
- Oversold RSI conditions, key Fibonacci ratio challenges Euro sellers amid sluggish session.
- 21-EMA, previous support line from March restrict short-term rebound.
EUR/USD licks its wounds at the lowest levels since late March amid lackluster markets heading into Thursday’s European session, mildly offered near 1.0735 by the press time.
In doing so, the Euro pair justifies the previous day’s clear downside break of 10-week-old horizontal support, now immediate resistance near 1.0760.
However, the oversold RSI (14) line joins the 61.8% Fibonacci retracement of the pair’s March-April upside, near 1.0735, to challenge the EUR/USD bears.
In a case where the Euro sellers manage to conquer the key Fibonacci retracement, also known as the golden Fibonacci ratio, the odds of witnessing a slump toward the mid-March swing low of around 1.0516 can’t be ruled out. It should be observed that the 1.0700 and 1.0600 round figures may act as intermediate halts during the likely fall.
On the contrary, EUR/USD recovery can initially aim for the previous support line from mid-March, close to 1.0760, before challenging the 21-bar Exponential Moving Average (EMA) hurdle of around 1.0780.
Following that, an upward-sloping trend line from March 21, previous support near 1.0840, may act as the last defense of the EUR/USD bears.
Overall, EUR/USD is likely to remain pressured but the bears need a pause to gather strength.
EUR/USD: Four-hour chart
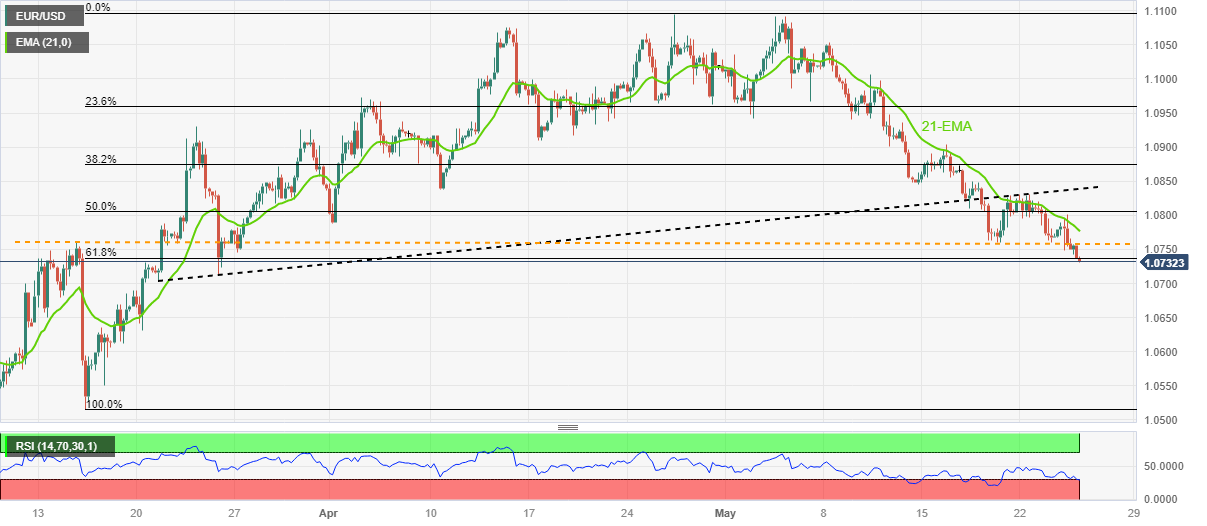
Trend: Corrective bounce expected
In an interview with Slovenia’s Delo newspaper early Thursday, European Central Bank (ECB) Governing Council member, Bostjan Vasle, said that the central bank must continue raising interest rates further to bring inflation down to its target.
Key quotes
“Further interest-rate increases will be needed.”
“But they’ll be smaller than they were in the past. We’re approaching the level of rates that’s restrictive enough to bring inflation back toward 2%.”
“Fiscal — including wage policy — and monetary policies will have to be linked to a greater extent than in the past.”
Market reaction
The Euro is a little impressed by the hawkish comments from Vasle, leaving EUR/USD in monthly lows near 1.0735, at the time of writing. The pair is losing 0.17% so far.
Bank of Japan (BoJ) Governor Kazuo Ueda is delivering some comments on the central bank’s balance sheet on Thursday.
Key quotes
Don't think BoJ current balance sheet, which consists of massive JGBs and ETFs, is a normal one for a central bank.
The BoJ must maintain current balance sheet composition until inflation stably, sustainably hits its 2% target.
Market reaction
On the above comments, USD/JPY is defending minor bids near 139.50, having retreated from six-month highs of 139.71 reached earlier in the Asian session.
- The index advances to multi-week highs north of 104.00.
- Concerns around the debt ceiling remain on the rise.
- Flash Q! GDP, weekly Claims, housing data take centre stage later.
The greenback, in terms of the USD Index (DXY), extends the upside beyond the 104.00 hurdle for the first time since mid-March.
USD Index looks at debt ceiling, data
The index advances for the fourth session in a row and keeps the positive streak for the third consecutive week on the back of rising concerns over the US debt ceiling issue.
On this, House Speaker McCarthy showed some optimism that a deal could be reached before June, although ratings agency Fitch placed the country’s AAA credit rating on watch late on Wednesday, magnifying fears at the same time.
In the US data space, usual weekly Initial Claims are due seconded by another revision of the Q1 GDP Growth Rate, Pending Home Sales and the Chicago Fed National Activity Index.
What to look for around USD
The index keeps the relentless march north unabated and surpasses the 104.00 hurdle on Thursday, or new multi-week peaks.
In the meantime, diminishing bets that the Fed will probably pause its normalization process in June appear underpinned by the steady resilience of key US fundamentals (employment and prices mainly) amidst the ongoing rally in US yields and the DXY.
Favouring a pause by the Fed, instead, appears the extra tightening of credit conditions in response to uncertainty surrounding the US banking sector.
Key events in the US this week: Initial Jobless Claims, Chicago Fed National Activity Index, Pending Home Sales, Advanced Q1 GDP Growth Rate (Thursday) – PCE/Core PCE, Durable Goods Orders, Flash Goods Trade Balance, Personal Income/Spending, Final Michigan Consumer Sentiment (Friday).
Eminent issues on the back boiler: Persistent debate over a soft/hard landing of the US economy. Terminal Interest rate near the peak vs. speculation of rate cuts in late 2023/early 2024. Fed’s pivot. Geopolitical effervescence vs. Russia and China. US-China trade conflict.
USD Index relevant levels
Now, the index is up 0.17% at 104.05 and a break above 105.00 (round level) could open the door to 105.71 (200-day SMA) and then 105.88 (2023 high March 8). On the other hand, the next support emerges at the 100-day SMA at 102.85 seconded by the 55-day SMA at 102.44 and finally 101.01 (weekly low April 26).
- USD/TRY grinds near all-time high as markets wait for CBRT Interest Rate Decision.
- Political turmoil in Turkiye, CBRT’s hesitance to raise rates despite inflation fears propel USD/TRY price.
- US debt ceiling woes, hawkish Fed concerns also keep Turkish Lira on bear’s radar.
USD/TRY seesaws around 19.90 as traders await the Central Bank of the Republic of Turkiye's (CBRT) Interest Rate Decision early Thursday. Also keeping the Turkish Lira (TRY) traders on their toes are the concerns about the US debt ceiling expiry and the market’s anxiety ahead of a slew of the US data.
Recently improved Turkish Business Confidence and easing inflation numbers seem to favor the CBRT’s likely defense of the current benchmark monetary policy rate of 8.5%. The same diverges from the US Federal Reserve (Fed) and allows the USD/TRY to remain firmer despite political uncertainty in Turkiye.
That said, the Minutes of the latest Federal Open Market Committee (FOMC) Meeting suggested that the policymakers are divided about the latest 0.25% rate hike from the US central bank. The same doubts the market’s bets on another such move in June.
Elsewhere, the global markets turn inactive during early Thursday, following a day full of risk aversion, amid mixed catalysts surrounding the US default fears. That said, US policymakers’ inability to deliver a debt ceiling extension deal and the looming long weekend for the House Representatives contrasts with the negotiators’ view that they see progress in the latest rounds of talks. Even so, global rating agencies like Fitch and Moody’s turned cautious about the US credit rating status while the US Treasury Department accepted their fears.
While depicting the market sentiment, the S&P500 Futures snap a two-day downtrend by bouncing off a two-week low to 4,138 by the press time, up 0.39% intraday at the latest. On the other hand, the US 10-year and two-year Treasury bond yields remain firmer at the highest levels since mid-March, close to 3.75% and 4.40% as we write.
Looking forward, the CBRT is likely to keep its currency Interest Rate unchanged at 8.5% and may become a non-event unless providing any surprises. However, the same can keep the USD/TRY buyers hopeful amid broad US Dollar strength and the Fed vs. CBRT divergence.
Technical analysis
A daily closing beyond an eight-month-old rising trend line, around the 20.00 round figure by the press time, becomes necessary for the USD/TRY bulls to refresh the record top. Alternatively, the 50-DMA support of 19.40 becomes crucial for the Turkish Lira bears to retake control.
FX option expiries for May 25 NY cut at 10:00 Eastern Time, via DTCC, can be found below.
- EUR/USD: EUR amounts
- 1.0765 986m
- GBP/USD: GBP amounts
- 1.2300 380m
- USD/JPY: USD amounts
- 138.10 838m
- 138.55 420m
- 139.50 850m
- USD/CHF: USD amounts
- 0.8925 300m
- 0.8950 680m
- 0.9030 465m
- 0.9105 350m
- USD/CAD: USD amounts
- 1.3600 815m
- EUR/GBP: EUR amounts
- 0.8700 475m
Economist Lee Sue Ann and Markets Strategist Que Ser Leang at UOB Group suggest further weakness remains likely in EUR/USD while below the 1.0820 level.
Key Quotes
24-hour view: “We highlighted yesterday that EUR ‘has to break clearly below the major support at 1.0750 before a sustained decline is likely’. We added, ‘The risk of EUR breaking clearly below 1.0750 will remain intact as long as it stays below 1.0805’. While EUR broke below 1.0750 as expected, it did not make further headway (low of 1.0746) as it rebounded to 1.0801 and then fell back to end the day on a soft note at 1.0748 (-0.19%). The price actions have resulted in an increase in downward momentum even though EUR is unlikely to threaten the next major support at 1.0700 today. On the upside, a breach of 1.0800 (minor resistance is at 1.0780) would indicate that EUR is not weakening further.”
Next 1-3 weeks: “Yesterday (24 May, spot at 1.0770), we indicated that EUR ‘has to crack 1.0750 in these 1 to 2 days for it to drop further to 1.0700’. In London trade, EUR broke below 1.0750 and dropped to 1.0746. Downward momentum has increased, albeit not much. From here, as long as 1.0820 (‘strong resistance level previously at 1.0835) is not breached, there is room for EUR to weaken further to 1.0700. If EUR breaks above 1.0820, it would indicate that the downward pressure that started two weeks ago has faded.”
- Gold Price holds lower ground as it prods bottom of short-term key trading range.
- Firmer US Treasury bond yields, US Dollar cap XAU/USD’s haven demand amid dicey markets.
- Mixed feelings about US debt ceiling deal, Federal Reserve restrict the Gold Price moves.
- US data, risk catalysts eyed for clear directions as US negotiators brace for long weekend.
Gold Price (XAU/USD) struggles for clear directions as bulls and bears jostle around a short-term key support line nearing $1,955 heading into Thursday’s European session. In doing so, the yellow metal portrays the market’s indecision amid mixed signals surrounding the US debt limit extension talks and the US Federal Reserve (Fed). Also likely to prod the XAU/USD traders is the cautious mood ahead of a slew of mid-tier data from the US.
The US policymakers’ inability to deliver a debt ceiling extension deal and the looming long weekend for the House Representatives amplifies the US default fears even if the negotiators see progress in the latest rounds of talks. With this, global rating agencies like Fitch and Moody’s turned cautious about the US credit rating status while the US Treasury Department accepted their fears.
Elsewhere, the Minutes of the latest Federal Open Market Committee (FOMC) Meeting suggested that the policymakers are divided about the latest 0.25% rate hike from the US central bank. The same doubts the market’s bets on another such move in June. Even so, Atlanta Fed President Raphael Bostic said, “‘We’re right at the beginning of the hard part’ of taming inflation.” On the same line, Federal Reserve Governor Christopher Waller mentioned that he doesn’t support stopping rate hikes unless getting clear evidence that inflation is moving down toward the 2% objective.
On the other hand, the market’s expectations of more easing from China, amid record-high interbank Repo turnover, contrasts with the geopolitical fears to challenge the Gold price moves.
While portraying the mood, the S&P500 Futures snap a two-day downtrend by bouncing off a two-week low to 4,138 by the press time, up 0.39% intraday at the latest. On the other hand, the US 10-year and two-year Treasury bond yields remain firmer at the highest levels since mid-March, close to 3.75% and 4.40% as we write.
Moving on, the US weekly Jobless Claims, the Chicago Fed National Activity Index and Pending Home Sales will decorate the calendar but the debt ceiling talks will be crucial to watch for clear directions.
Gold price technical analysis
Gold price prods a one-week-old ascending support line surrounding $1,955 while staying within a short-term trading range established since May 16, currently between $1,985 and $1,951.
That said, the impending bull cross on the MACD and the below 50 conditions of the RSI (14) line defends the XAU/USD buyers.
However, a fortnight-long falling trend line and the 200-Hour Moving Average (HMA), respectively near $1,977 and $1,981, can restrict immediate upside moves of the Gold price.
It’s worth noting that the late March swing low of around $1,934 and the $2,000 psychological magnet are extra filters for the Gold price.
Overall, Gold prices consolidate recent gains amid sluggish markets but bears remain hopeful.
Gold price: Hourly chart
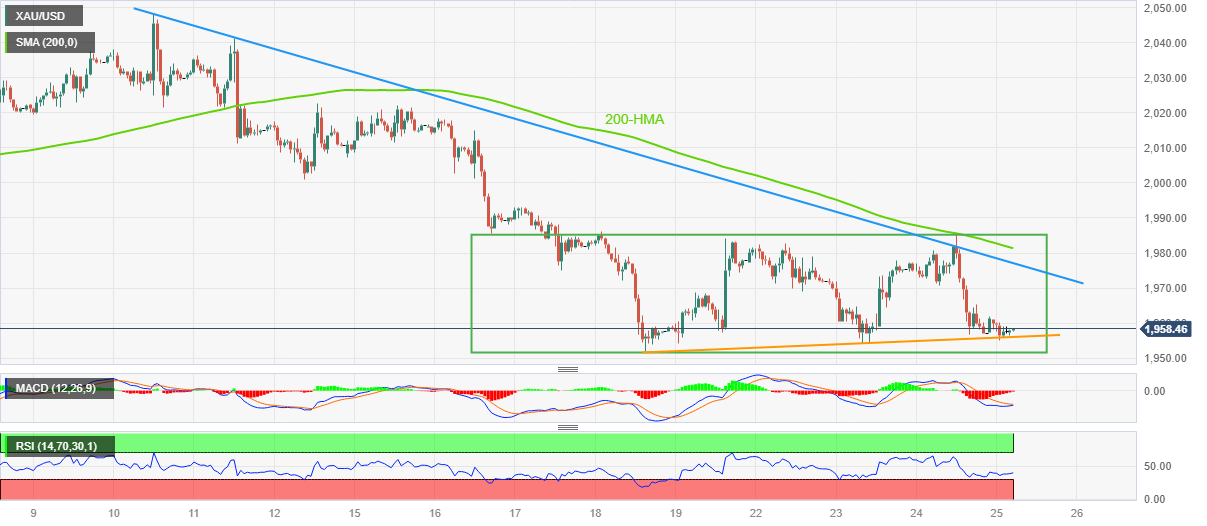
Trend: Further downside expected
- GBP/USD has shown recovery from 1.2330 however, the downside bias seems solid.
- Investors are entirely focusing on the US debt-ceiling issues rather than dovish cues From FOMC minutes.
- UK Hunt remained confident that inflation will get halved by the year-end.
The GBP/USD pair has shown some recovery after printing a fresh six-week low at 1.2332 in the early European session. The Cable is expected to resume its downside journey after a less-confident pullback as investors have underpinned the risk-aversion theme due to the pending US debt-ceiling raise.
S&P500 futures have trimmed some gains added in early Asia as investors are getting cautious that the United States economy could announce a default in obligated payments if the US borrowing cap doesn’t get raised before June 01.
The US Dollar Index (DXY) is looking to extend its upside further after refreshing its two-week high at 104.06. It seems that investors are entirely focusing on the US debt-ceiling issues rather than dovish cues for interest rate guidance in the Federal Open Market Committee (FOMC) minutes. Several Federal Reserve (Fed) policymakers see interest rate hikes in June’s monetary policy less certain amid US banking turmoil.
Meanwhile, Atlanta Federal Reserve (Fed) President Raphael Bostic has advocated that the central bank should remain data-specific for June’s monetary policy meeting. He further added that no consideration of an interest rate cut well in 2024 would be the best-case scenario.
On the Pound Sterling front, United Kingdom inflationary pressures remained mixed on Wednesday as the headline Consumer Price Index (CPI) softened but remained well above consensus while core inflation escalates further. This might force the Bank of England (BoE) to announce more interest rates ahead.
However, UK FM Jeremy Hunt remained confident that inflation will get halved by the year-end. And tax cuts could be announced only in an inflation-supportive environment.
- USD/INR picks up bids to pare the previous day’s heavy losses, bounces off important support confluence.
- Convergence of 50-SMA, 13-day-old rising trend line puts a floor under Indian Rupee pair’s price.
- 21-SMA, one-week-long horizontal resistance zone challenge buyers amid bearish MACD signals.
USD/INR renews its intraday high near 82.75 as it extends late Wednesday’s rebound from a short-term key support confluence to early Thursday in Europe. In doing so, the Indian Rupee (INR) consolidates the biggest daily loss in a month.
50-SMA and an upward-sloping trend line from May 08 together restrict short-term USD/INR downside near 82.60.
The recovery moves, however, appear elusive unless crossing the 21-SMA hurdle of around 82.75.
It’s worth noting that the bearish MACD signals challenge the USD/INR pair buyers as the key jostle with the 21-SMA resistance, a break of which could propel prices towards a one-week-old horizontal resistance zone surrounding 82.95-97.
Following that, the 83.00 rounds figure can act as the last defense of the USD/INR pair bears before pushing the quote towards the record high of around 83.40 marked the last year.
On the flip side, the USD/INR pair’s break of the 82.60 support confluence could quickly drag it toward the 100-SMA level of near 82.25. Though, a horizontal area comprising multiple lows marked since May 09, near 82.15 can challenge the Indian Rupee pair’s further downside.
Overall, USD/INR remains on the bull’s radar but the upside past 83.00 appears doubtful.
USD/INR Price: Four-hour chart
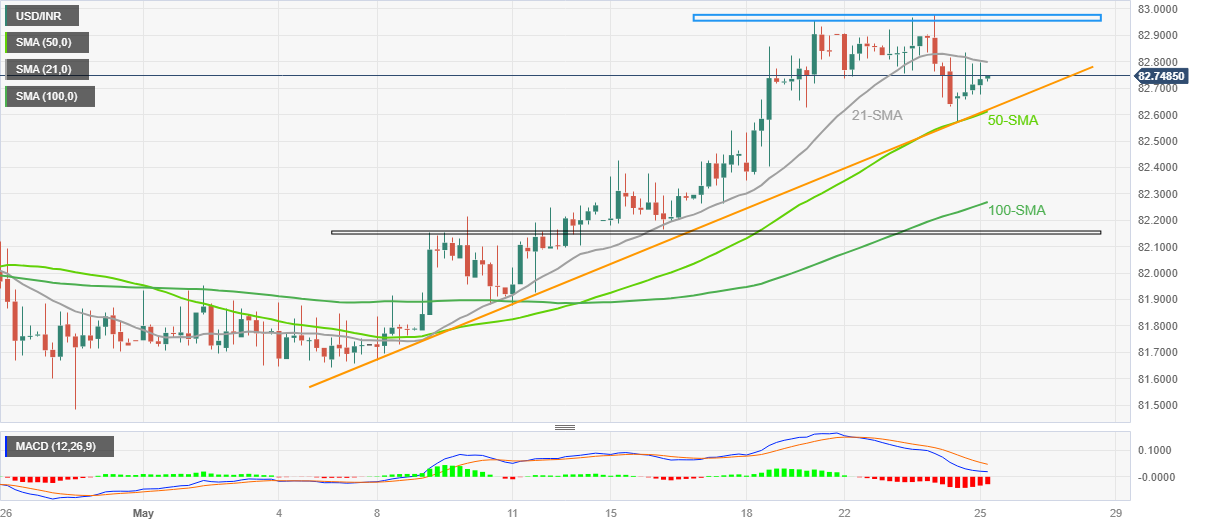
Trend: Further upside expected
- USD/ZAR picks up bids to refresh intraday high, extends previous day’s rebound towards record high.
- Fears of US default, mixed Fed concerns favor US Dollar bulls.
- SARB is expected to announce 0.25% rate hike, recently easy South African inflation teases Rand sellers.
- Multiple US data, risk catalysts eyed for clear directions as ZAR braces for fresh all-time low.
USD/ZAR renews its intraday high near 19.30 as it rises for the second consecutive day amid broad US Dollar strength on early Thursday. In doing so, the South African Rand (ZAR) pair prepares for today’s South African Reserve Bank (SARB) Interest Rate Announcements amid recent easy prints of the inflation at home.
On Wednesday, South Africa’s Consumer Price Index (CPI) for April eased to 6.8% YoY and 0.4% MoM versus 7.1% and 1.0% respective priors. The same challenges the SARB from being hawkish in today’s monetary policy announcements even if the South African central bank is all set for a 0.25% rate hike.
Even so, Goldman Sachs’ Andrew Matheny said, per Reuters, “The April CPI print was considerably more benign than in recent months. However, we think that the downside surprise is unlikely to have much bearing on the MPC decision tomorrow... given that, in our view, the SARB is mostly reacting to exchange rate weakness.”
On the other hand, the US Dollar Index (DXY) rises to a fresh high in seven weeks, to 104.05 by the press time, amid the US policymaker’s inability to deliver a debt ceiling extension deal and the looming long weekend for the House Representatives. With this, global rating agencies like Fitch and Moody’s turn cautious about the US credit rating status. Recently, the US Treasury Department accepted the rating agencies’ fears.
It should be noted that the Minutes of the latest Federal Open Market Committee (FOMC) Meeting suggested that the policymakers aren’t on the same table. Even so, Atlanta Fed President Raphael Bostic said, “‘We’re right at the beginning of the hard part’ of taming inflation.” On the same line, Federal Reserve Governor Christopher Waller mentioned that he doesn’t support stopping rate hikes unless getting clear evidence that inflation is moving down toward the 2% objective.
Amid these plays, the S&P500 Futures snap a two-day downtrend by bouncing off a two-week low to 4,138 by the press time, up 0.39% intraday at the latest. On the other hand, the US 10-year and two-year Treasury bond yields remain firmer at the highest levels since mid-March, close to 3.75% and 4.40% as we write.
Looking forward, the SARB Interest Rate Decision is the key for the USD/ZAR pair and can allow the buyers to challenge the all-time high marked the last week if offering a dovish hike. Following that, the US weekly Jobless Claims, the Chicago Fed National Activity Index and Pending Home Sales will decorate the calendar but the debt ceiling talks will be crucial to watch for clear directions.
Technical analysis
A two-week-old ascending triangle formation restricts immediate USD/ZAR moves between 19.53 and 19.15.
- Natural Gas prices are going through a corrective move after failing to sustain above $2.58.
- The US EIA is expected to report a build-up of inventory by 119 bcf for the week ending May 19.
- Natural Gas prices resumed their upside journey after a bullish Hidden Divergence.
Natural Gas futures are going through a corrective move after failing to sustain above $2.58 in the Tokyo session. The gas price is expected to remain on tenterhooks as investors are awaiting the release of the weekly gas inventory data.
According to the estimates, the United States Energy Information Administration (EIA) is expected to report a build-up of inventory by 119 billion cubic feet (bcf) for the week ending May 19.
Meanwhile, the US Dollar Index (DXY) has refreshed its two-month high at 104.06 as US debt-ceiling issues have escalated anxiety among investors.
Natural Gas prices resumed their upside journey after a bullish Hidden Divergence on a four-hour scale. The asset formed a higher low while the Relative Strength Index (RSI) (14) formed a lower high, which indicated that the momentum oscillator got oversold in an uptrend and produced a bargain buy opportunity for the market participants.
Upward-sloping 50-and 200-period Exponential Moving Averages (EMAs) at $2.51 and $2.41 respectively, indicates more upside ahead.
A break into the bullish range of 60.00-80.00 by the Relative Strength Index (RSI) (14) will strengthen Natural Gas futures further.
Should the asset break above the immediate resistance of $2.60, NG bulls will march firmly towards May 22 high at $2.69 followed by March 02 high at $2.88.
On the flip side, a break below May 17 low at $2.43 will expose the asset to April 20 low at $2.28. A break below the latter will further drag the asset toward May 05 low at $2.09.
Natural Gas four-hour chart
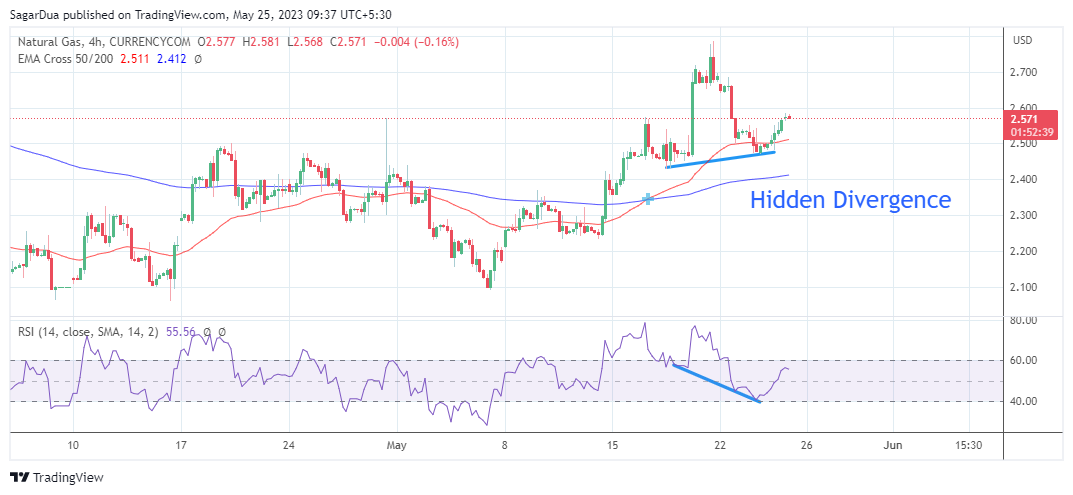
- EUR/USD has refreshed its four-week low at 1.0740 as the USD Index has shown significant strength amid a cautious market mood.
- Federal Reserve policymakers advocated that the interest rate hike in May’s meeting should be followed by a pause due to banking turmoil.
- Higher interest rates by the European Central Bank in Eurozone are having catastrophic effects on its economic prospects.
- EUR/USD has kissed the 61.8% Fibonacci retracement at 1.0738.
EUR/USD has printed a fresh four-week low at 1.0740 in the Asian session. The major currency pair has faced immense selling pressure as the market mood has remained cautious. Market sentiment has turned negative as investors are worried that if the delay in US debt-ceiling issues keeps going like this, the United States economy would be forced to default on obligated payments.
S&P500 futures are holding significant gains generated in early Tokyo led by dovish Federal Open Market Committee (FOMC) minutes. The majority of Federal Reserve (Fed) policymakers are expecting a temporary pause in the policy-tightening spell due to tight credit conditions by the US regional banks. However, the overall market mood would remain risk-averse till the White House and Republican leader don’t reach a bipartisan.
The US Dollar Index (DXY) has swiftly climbed above 104.00 and has refreshed its two-month high amid improvement in its appeal as a default by the US economy due to non-agreement for raising US debt-ceiling would have catastrophic effects. Meanwhile, fears of a US default have further weakened the demand for US government bonds. This has led to a significant jump in 10-year US Treasury yields above 3.74%.
No rate hike in June by Federal Reserve appears certain
After 10 consecutive sprees of interest rate hikes by the Federal Reserve, chances of a pause in the rate-hiking spell have soared. The release of the FOMC minutes late Wednesday indicated that several Federal Reserve policymakers advocated that the interest rate hike in May’s meeting should be followed by a pause due to banking turmoil.
Bankruptcy declared by various US banks forced regional banks to tighten their credit conditions significantly for avoiding a build-up of Non-Performing Assets (NPAs). This has led to a serious decline in credit disbursements to households and firms. Last week, Federal Reserve chair Jerome Powell in his speech also advocated for a pause in the rate hikes as an increase in filters for credit distribution by banks are significantly weighing on inflationary pressures.
US Durable Goods Orders come in spotlight
After the release of dovish DOMC minutes, investors are shifting their focus towards the release of the United States Durable Goods Orders data, which will release on Friday. As per the preliminary report, April’s Durable Goods Orders are seen contracting by 1.0% vs. an expansion of 3.2%. A contraction in the economic data indicates poor demand, which would have a ripple effect on US Consumer Price Index (CPI).
Investors should note that the US economy is facing issues of persistence in core inflation more than the headline price index. A contraction in durable goods demand would release some heat from core inflation and would be more relieving factor for the Federal Reserve.
Eurozone approaching stagnation due to higher interest rates
Higher interest rates by the European Central Bank (ECB) in Eurozone are having catastrophic effects on its economic prospects. The manufacturing sector is facing extreme heat and is showing severe contraction. Analysts at Commerzbank cited “The PMIs are already suggesting that the European Central Bank’s rate hikes will hit the Eurozone economy at some point. That means that the doves on the European Central Bank board might gain the upper hand at some stage, at which point the Euro would lose important support.”
Also, Economist Klaus Wohlrabe at the German IFO Business Survey said that the “German economy heading towards stagnation in Q2 as higher interest rates are dampening overall demand.
EUR/USD technical outlook
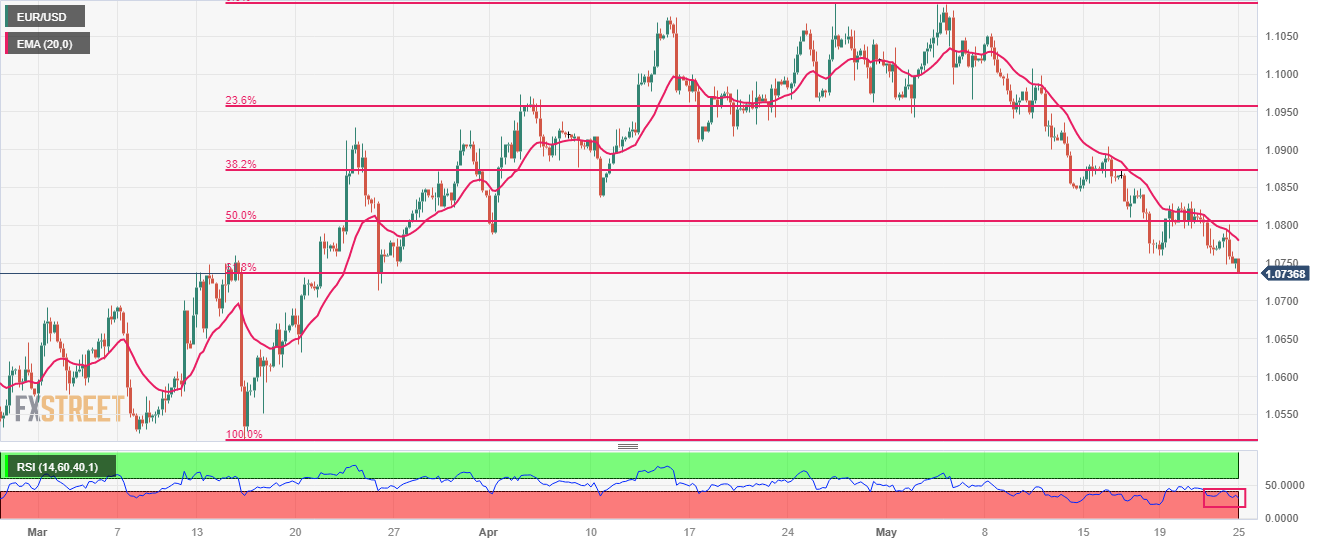
EUR/USD has kissed the 61.8% Fibonacci retracements (plotted from March 15 low at 1.0516 to April 26 high at 1.1095) at 1.0738 on a four-hour scale. The 20-period Exponential Moving Average (EMA) at 1.0780 is acting as a strong barrier for the Euro bulls.
The Relative Strength Index (RSI) (14) is oscillating in the bearish range of 20.00-40.00, indicating the continuation of the bearish momentum.
- USD/CAD renews three-week high but stays sidelined of late.
- Traders rush to US Dollar in search of risk safety amid anxiety about US debt ceiling extension talks.
- Oil price struggles to justify surprise draw in inventories, fears of less supplies amid firmer USD.
- Risk catalysts, second-tier data may entertain Loonie traders amid cautious markets.
USD/CAD seesaws at the highest levels in three weeks, marked recently, as bulls prod the 1.3600 mark during early Thursday amid broad US Dollar strength. In doing so, the Loonie pair pays little attention to the mildly bid WTI crude oil price, Canada’s key export item.
That said, the US Dollar Index (DXY) rises to a fresh high in seven weeks, to 104.00 amid fears of the US default as the US policymaker’s inability to deliver a debt ceiling extension deal and the looming long weekend for the House Representatives, the fears of US default push global rating agencies like Fitch and Moody’s to turn cautious about the US credit rating status. Late on Wednesday, Moody’s warned about the US outlook change while Fitch put US’ AAA on Rating Watch Negative status.
Recently, the White House responded to the rating institutes’ pessimism by saying that brinkmanship over the debt limit does serious harm to businesses and American families, raises short-term borrowing costs for taxpayers, and threatens the credit rating of the US. “Tonight’s warning underscores the need for swift bipartisan action by Congress to raise or suspend the debt limit and avoid a manufactured crisis for our economy,” adds the White House.
Apart from the US default fears, mixed Fed concerns also allow the US Dollar to remain firmer. That said, the Minutes of the latest Federal Open Market Committee (FOMC) Meeting suggested that the policymakers aren’t on the same table as some suggest it is appropriate to hike the rates while others advocate for a policy pivot. Following that, Atlanta Fed President Raphael Bostic said, “‘We’re right at the beginning of the hard part’ of taming inflation.” On the same line, Federal Reserve Governor Christopher Waller mentioned that he doesn’t support stopping rate hikes unless getting clear evidence that inflation is moving down toward the 2% objective.
Elsewhere, WTI crude oil stays defensive above $74.00 even after the Energy Information Institute (EIA) reported a massive draw in the weekly inventory levels. That said, the EIA Crude Oil Stocks Change came in at -12.456M versus 0.775M market forecasts and 5.04M previous readings. Apart from the EIA inventories, a warning from Saudi Arabia also fuelled the WTI prices toward a refreshing three-week high previously. That said, Saudi Arabia's energy minister said short-sellers betting oil prices will fall should "watch out" for pain.
Against this backdrop, the S&P500 Futures snap a two-day downtrend by portraying a corrective bounce from the two-week low to 4,138 by the press time, up 0.35% intraday at the latest. On the other hand, the US 10-year and two-year Treasury bond yields remain firmer at the highest levels since mid-March, close to 3.75% and 4.40% as we write.
Looking ahead, a slew of the US data including weekly Jobless Claims, the Chicago Fed National Activity Index and Pending Home Sales will decorate the calendar and entertain USD/CAD traders. Though, major attention will be given to the US debt ceiling talks as negotiators brace for a long weekend.
Technical analysis
A daily closing beyond an 11-week-old descending resistance line, now immediate support around 1.3560, keeps the USD/CAD buyers hopeful.
- USD/JPY buyers struggle to extend latest run-up at the highest levels in six months.
- Key Fibonacci retracement level, late November 2022 peak prod Yen pair buyers.
- Multi-day-old previous resistance line, 200-DMA challenges USD/JPY bears amid bullish MACD signals.
USD/JPY edges higher as it renews the yearly top around 139.65-70 during early Thursday. In doing so, the Yen pair prods the 50% Fibonacci retracement level of its October 2022 to January 2023 downside amid overbought conditions of the RSI (14) line.
Apart from the 50% Fibonacci retracement level surrounding 139.60, the late November 2022 peak of around 139.90, quickly followed by the 140.00 round figure, also challenge the USD/JPY bulls.
In a case where the USD/JPY pair remains firmer past 140.00, the quote’s run-up towards the late November swing high of around 142.25 can’t be ruled out.
Though, the 61.8% Fibonacci retracement level near 142.50, also known as the golden Fibonacci ratio, could challenge the Yen pair buyers afterward.
Meanwhile, USD/JPY pair’s retreat remains elusive unless it breaks the previous resistance line stretched from December 2022, close to 137.80 at the latest.
Following that, the 200-DMA of around 137.20 can challenge the Yen pair sellers before giving them control.
Even so, a two-month-old ascending support line at 134.90 can prod the USD/JPY bears afterward.
Overall, USD/JPY remains on the bull’s radar even if the price is likely to witness a pullback.
USD/JPY: Daily chart
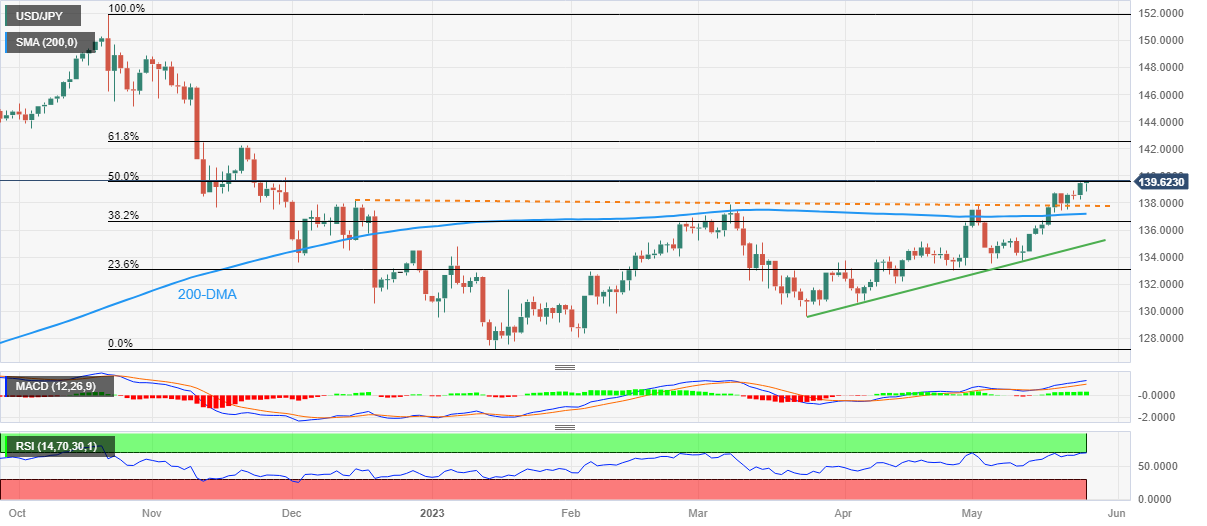
Trend: Limited upside expected
| Raw materials | Closed | Change, % |
|---|---|---|
| Silver | 23.056 | -1.69 |
| Gold | 1957.67 | -0.95 |
| Palladium | 1414.01 | -2.88 |
- Market sentiment remains dicey as US policymakers struggle to deliver debt limit extension deal.
- Top-tier rating agencies convey challenges to US rating status on default drama.
- S&P500 Futures portray corrective bounce from fortnight low, yields grind near the highest levels since March.
- A slew of US data on the table but risk catalysts are the key for clear directions.
Market sentiment stays sluggish, mostly downbeat, despite the latest improvement in the S&P500 Futures as fears of the US default fuel the Treasury bond yields during early Thursday. Also challenging the risk profile are the mixed comments from the Federal Reserve (Fed) officials and clumsy details of the FOMC Minutes.
That said, the S&P500 Futures snap a two-day downtrend by portraying a corrective bounce from the two-week low to 4,138 by the press time, up 0.35% intraday at the latest. On the other hand, the US 10-year and two-year Treasury bond yields remain firmer at the highest levels since mid-March, close to 3.75% and 4.40% as we write.
It should be noted that the US Dollar Index (DXY) rises to a fresh high in seven weeks, to 104.00, whereas prices of the Gold and WTI crude oil remain depressed near $1,975 and $74.00 respectively by the press time.
Given the US policymaker’s inability to deliver a debt ceiling extension deal and the looming long weekend for the House Representatives, the fears of US default push global rating agencies like Fitch and Moody’s to turn cautious about the US credit rating status. Late on Wednesday, Moody’s warned about the US outlook change while Fitch put US’ AAA on Rating Watch Negative status.
Elsewhere, Atlanta Fed President Raphael Bostic said, “‘We’re right at the beginning of the hard part’ of taming inflation.” On the same line, Federal Reserve Governor Christopher Waller mentioned that he doesn’t support stopping rate hikes unless getting clear evidence that inflation is moving down toward the 2% objective. However, the Minutes of the latest Federal Open Market Committee (FOMC) Meeting suggested that the policymakers aren’t on the same table as some suggest it is appropriate to hike the rates while others advocate for a policy pivot.
It should be noted that the lack of major data/events in Asia and the cautious mood ahead of a slew of mid-tier data from the US and Germany keeps the traders on their toes despite the latest rebound in the US stock futures. That said, the second readings of the US and German Q1 GDP will join the US weekly Jobless Claims, the Chicago Fed National Activity Index and Pending Home Sales to decorate the economic calendar. However, major attention will be given to the US debt ceiling talks.
Also read: Forex Today: Dollar strengthens further, Kiwi tumbles
- GBP/JPY bulls are pressing up against counter-trendline resistance.
- A break of there would open risk to 175.00.
GBP/JPY is trading around 172.40 at the time of writing with the price moving up from a low of 171.68 to a high of 172.45 so far. GBPJPY is testing the top of the box, as illustrated below. There are prospects of a breakout of the zone, one way or the other, with the upside bias currently in play.
GBP/JPY H4 chart
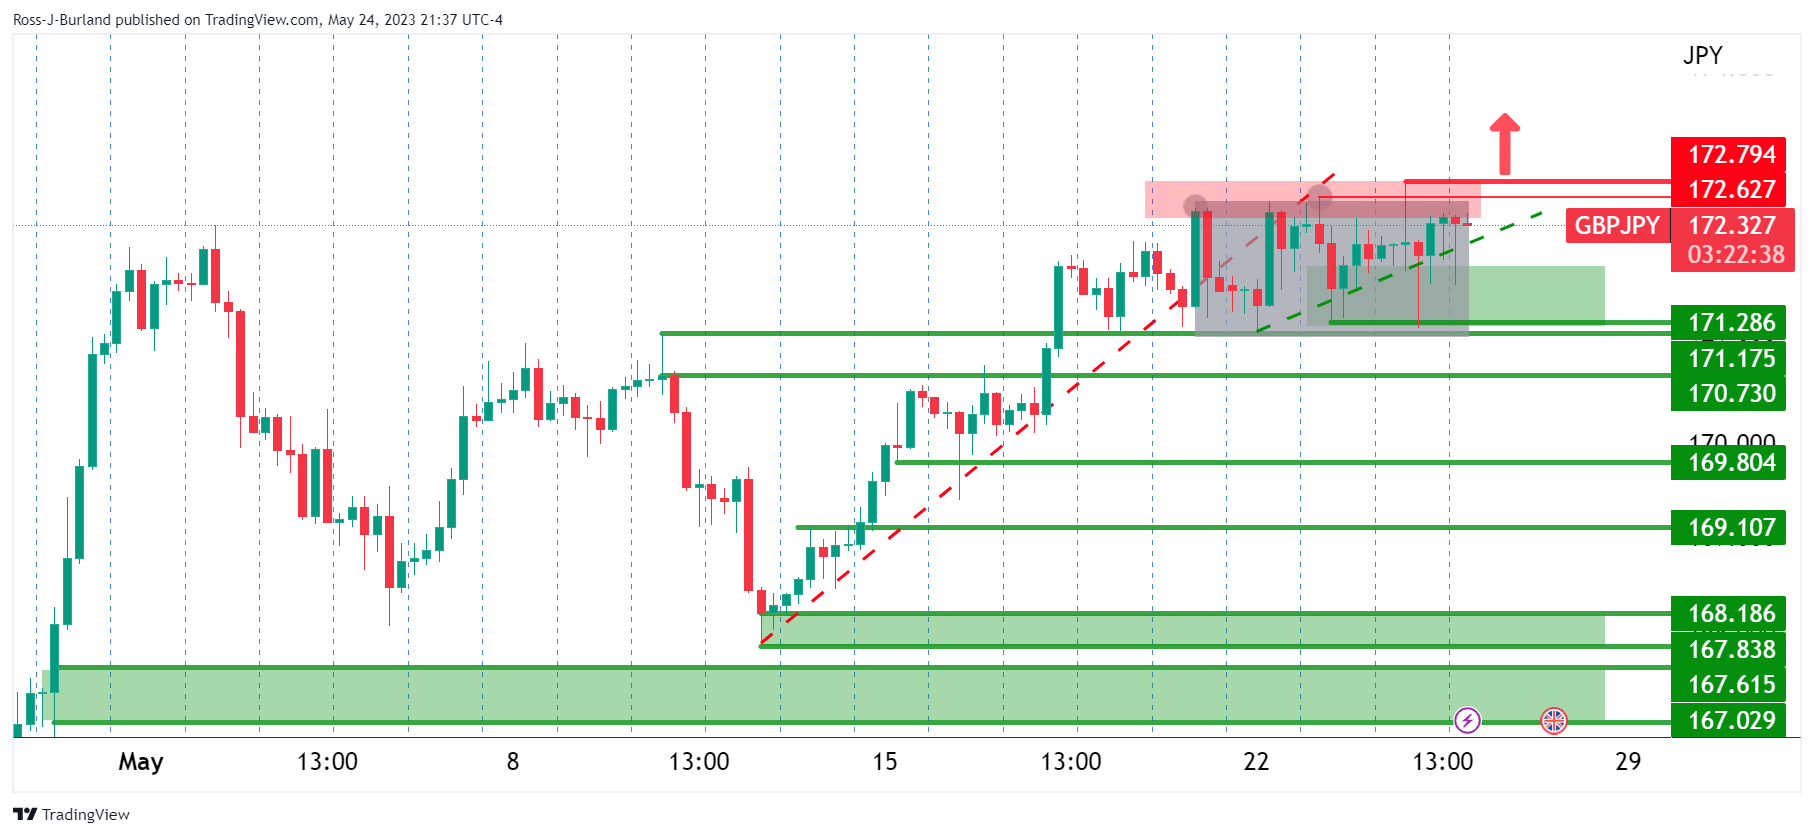
A break of 172.80 opens the risk of an upside continuation:
GBP/JPY weekly charts
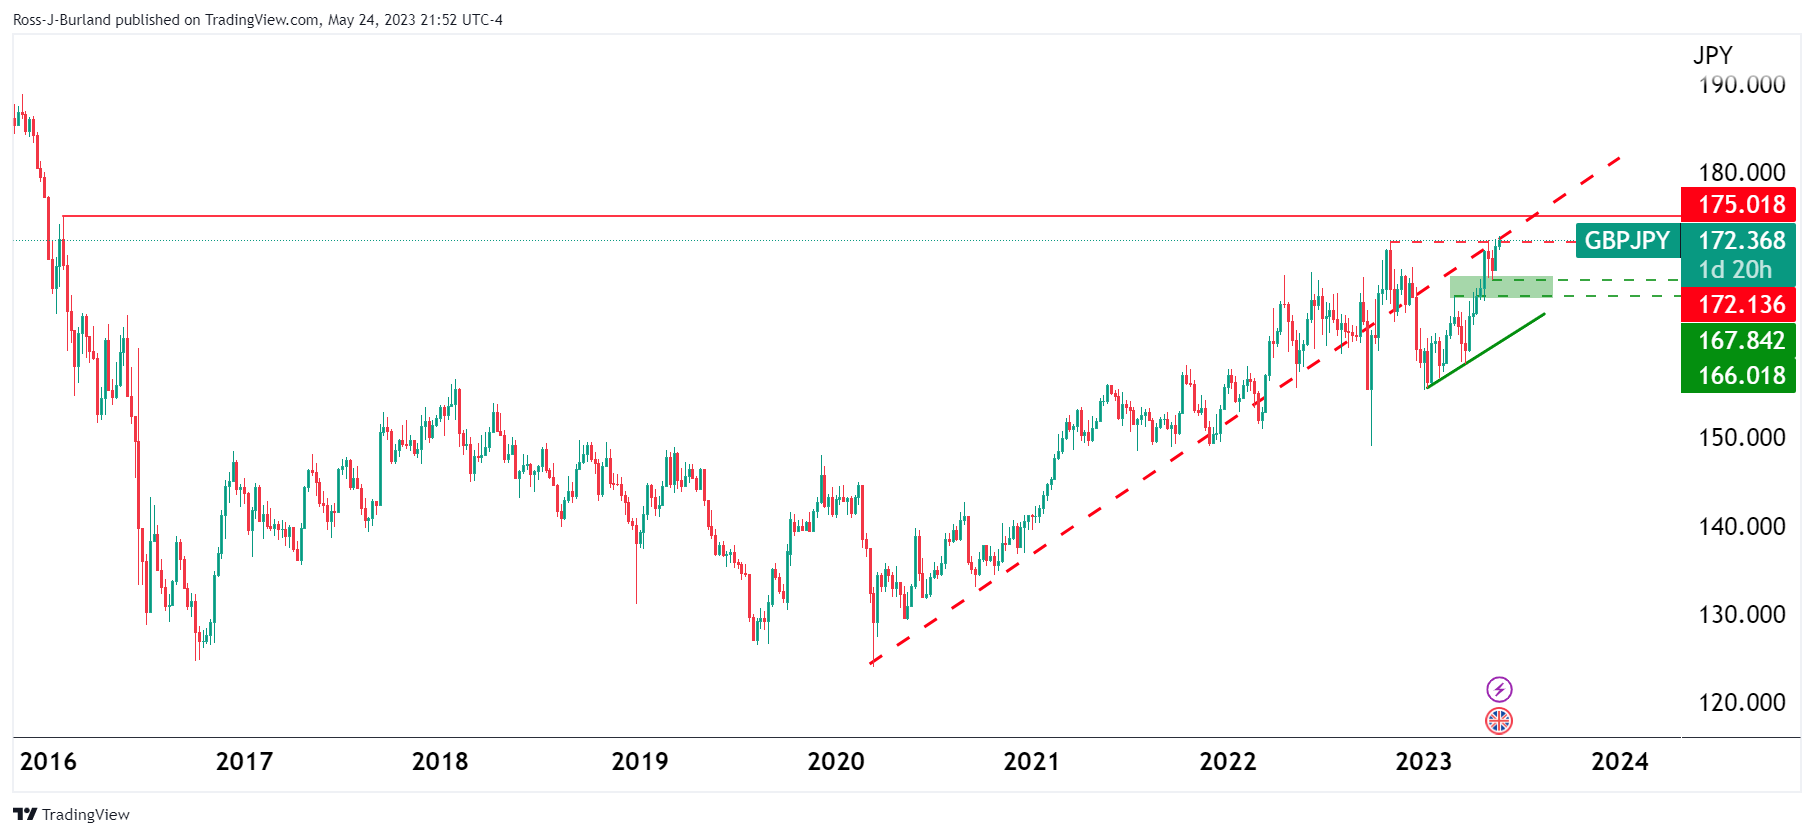
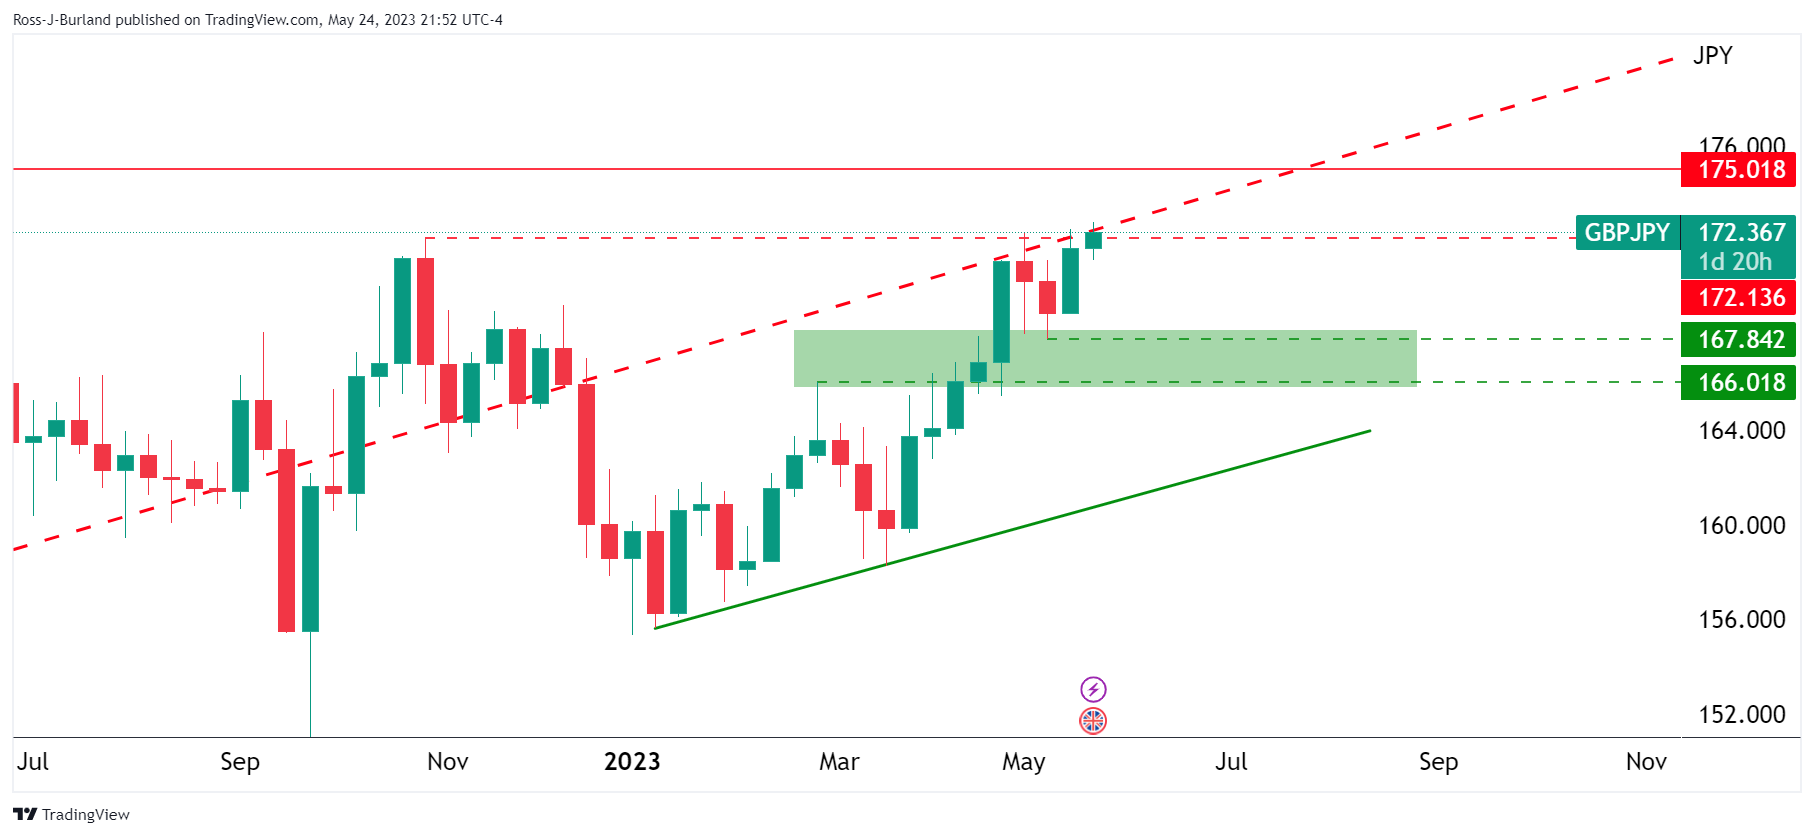
However, the upside could be limited to the counter-trendline resistance. On the other hand, a break of here would open risk to 175.00.
- NZD/USD has dropped sharply below 0.6100 as the RBNZ to pause further rate hikes sooner.
- The US Dollar Index has printed a fresh 10-week high at 103.99 amid a delay in US debt-ceiling issues.
- The RBNZ believes that it has moved the interest rate needle beyond its prior peak consideration.
The NZD/USD pair has slipped sharply below the round-level support of 0.6100 in the Tokyo session. The Kiwi asset has faced immense selling pressure after Reserve Bank of New Zealand (RBNZ) Governor Adrian Orr commented on the drawbacks of pushing interest rates well above what was previously considered neutral.
S&P500 futures have trimmed some gains posted in early Asia. The overall market mood is cautious as the United States economy is swiftly approaching a default situation. US Treasury Secretary Janet Yellen is consistently warning the White House that it will be out of funds by June 01 if the borrowing limit remained stagnant.
The US Dollar Index (DXY) has printed a fresh 10-week high at 103.99 amid a delay in US debt-ceiling issues. US President Joe Biden and other congressional leaders are not ready to accept partisan terms from Republicans, which include the removal of additional tax on the Wealthy community and higher spending proposed in the budget.
Meanwhile, the weak certainty of an interest rate hike in June by the Federal Reserve (Fed) has failed to make any impact on the USD Index. Fed policymakers are favoring a hold in the rate-hiking spell for June as tight credit conditions by US regional banks are weighing on inflationary pressures.
On Wednesday, the RBNZ hiked its Official Cash Rate (OCR) by 25 basis points (bps) to 5.50%. RBNZ Orr believes that the central bank has gone beyond what was previously considered neutral. He further added, there were risks that the central bank would need to raise rates due to sticky inflation expectations and continued government spending. If the RBNZ believes that it has moved above its prior peak consideration, room for further rate hikes is extremely less.
- AUD/USD takes offers to refresh yearly low, down for the third consecutive day.
- Clear downside break of previously key support line, Fibonacci retracement level favor Aussie bears.
- RSI conditions suggest limited downside room, highlights 61.8% FE.
- Convergence of 10-DMA, fortnight-old resistance line limits immediate upside.
AUD/USD occupies the bear’s table as it drops for the third consecutive day to refresh a six-month low around 0.6530 during early Thursday.
In doing so, the Aussie pair justifies the previous day’s downside break of an 11-week-old support-turned-resistance, as well as a downside beak of the 61.8% Fibonacci retracement of the quote’s October 2022 to February 2023 upside, respectively near 0.6620 and 0.6550.
Not only the downside breaks of the previous key supports but the bearish MACD signals also weigh on the AUD/USD price.
However, the nearly oversold RSI (14) conditions suggest that the AUD/USD bears may take a breather at the 61.8% Fibonacci Extension (FE) of its February-May moves, near 0.6445.
In a case where the Aussie pair remains bearish past 0.6445, the November 11 low of 0.6385 will be in the spotlight.
Alternatively, the aforementioned Fibonacci retracement level and previous support line, close to 0.6550 and 0.6620 in that order, restrict the short-term recovery of the AUD/USD pair.
Though, AUD/USD bulls should remain cautious unless witnessing a clear break of the 0.6230 resistance confluence comprising the 10-DMA and a two-week-old descending trend line.
Overall, AUD/USD is likely to decline further but the room towards the south appears limited.
AUD/USD: Daily chart
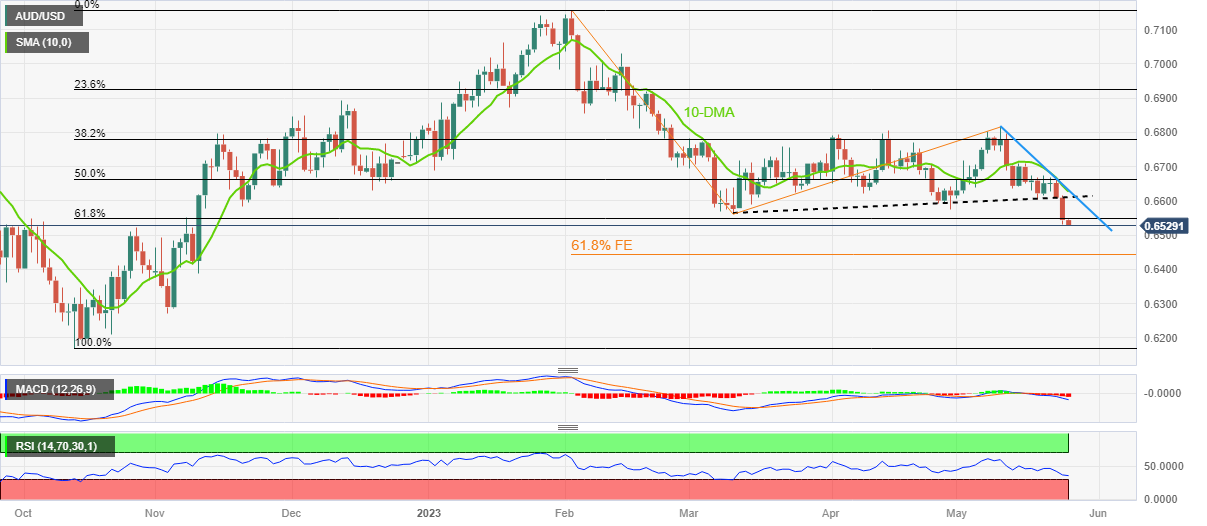
Trend: Further downside expected
Bloomberg News reported that ´´the Bank of Korea left its policy rate unchanged for a third straight meeting and lowered its growth forecast for this year, as officials wait for a sustained cooling of inflation amid increasing signs of slower-than-expected recovery.´
´´The central bank kept its seven-day repurchase rate at 3.5% on Thursday as predicted by all 17 economists surveyed by Bloomberg News. South Korea was among the first central banks globally to pause interest rate hikes three months ago,´´ the news agency said.
Meanwhile, USD/KRW has rallied:
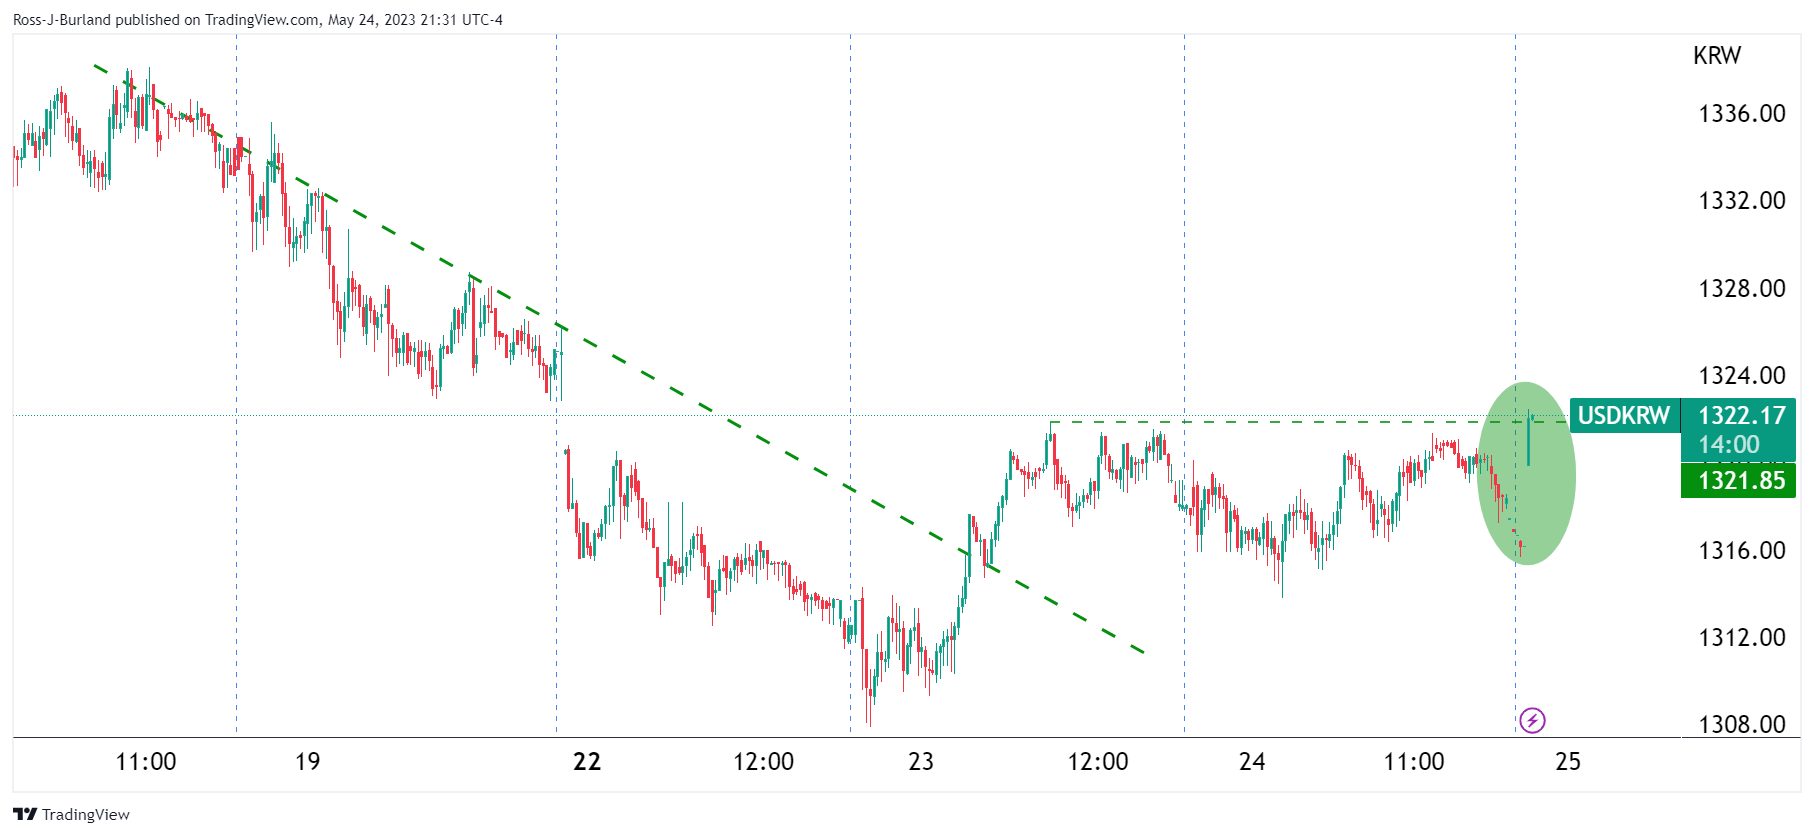
South Korea’s Kospi was also up, marginally, and the Kosdaq gained 0.27%.
In recent trade today, the People’s Bank of China (PBOC) set the yuan at 7.0529 vs. the last close of 7.0605.
About the fix
China maintains strict control of the yuan’s rate on the mainland.
The onshore yuan (CNY) differs from the offshore one (CNH) in trading restrictions, this last one is not as tightly controlled.
Each morning, the People’s Bank of China (PBOC) sets a so-called daily midpoint fix, based on the yuan’s previous day's closing level and quotations taken from the inter-bank dealer.
- Gold price has shifted its auction below $1,960.00 amid sheer strength in the USD Index.
- Fed policymakers believe that further rate hike in June is ‘less certain’ due to the banking fiasco.
- Gold price is forming an Inverted Flag pattern, which is a trend continuation pattern in which a long consolidation is followed by a breakdown.
Gold price (XAU/USD) has shifted its placement below $1,960.00 in the Asian session. The precious metal is looking to deliver more downside as the US Dollar Index (DXY) is looking to refresh its 10-week high to 104.00 ahead. The USD Index has shown immense strength as US debt-ceiling issues are not resolved despite long negotiations among the White House and Republican leaders.
S&P500 futures are holding significant gains in the Asian session. US equities have not carry-forwarded weak cues witnessed on Wednesday. The US Dollar Index (DXY) has refreshed its day’s high at 103.92 as uncertainty for US borrowing cap issues is escalating.
US House of Representatives Kevin McCarthy refused to support additional taxes for the Wealthy community and higher budget spending, which has delayed issues further, however, he remained confident that a bipartisan will be reached.
Gold price has failed to capitalize on dovish cues for interest rate guidance in the Federal Open Market Committee (FOMC) minutes. Federal Reserve (Fed) policymakers believe that further rate hike in June is ‘less certain’ due to a potential banking fiasco.
Later this week, US Durable Goods Orders data will be keenly watched. The economic data is seen contracting by 1.0% vs. an expansion of 3.2%.
Gold technical analysis
Gold price is forming an Inverted Flag chart pattern on a four-hour scale, which is a trend continuation pattern in which a long consolidation is followed by a breakdown. The Gold price is hovering above the horizontal support plotted from April 03 low at $1,949.83.
The 20-period Exponential Moving Average (EMA) at $1,969.26 is barricading the Gold price from any rally.
Meanwhile, the Relative Strength Index (RSI) (14) has slipped below 40.00, which indicates that the downside momentum is warranted.
Gold four-hour chart
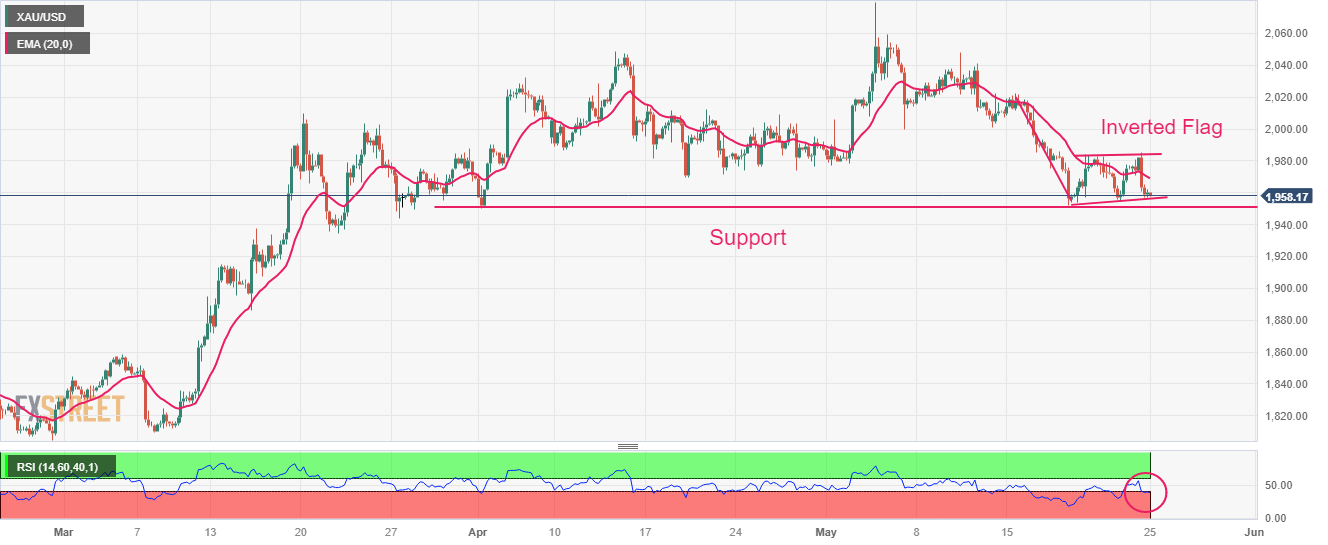
- GBP/USD seesaws at the lowest levels since mid-April, sidelined of late.
- UK inflation, BoE’s Bailey could defend Pound Sterling buyers for short-term before risk aversion fuelled US Dollar.
- No deal on how to avoid US default with nearness to US debt ceiling expiry, long weekend favor Cable sellers.
- Second-tier US data can offer intermediate moves, risk catalysts are the key.
GBP/USD licks its wounds at the 1.5-month low as it makes rounds to 1.2350 during early Thursday, after recently refreshing the multi-day bottom.
The Cable pair’s latest inaction could be linked to the sluggish markets. However, the fears of the US default and the UK inflation numbers’ inability to keep the bulls on the table for long weigh on the Pound Sterling price.
On Wednesday, the UK’s inflation, per the Consumer Price Index (CPI) gauge, rose 8.7% YoY in April compared to 10.1% marked in the last month and 8.2% forecasts. UK Finance Minister Jeremy Hunt said on Wednesday, they “must get inflation down so we could safely cut taxes.” On the same line, Bank of England (BoE) Governor Andrew Bailey previously defended the hawkish bias of the “Old Lady”, as the BoE is informally known.
Even so, the US Dollar strength and risk-off mood weighed on the Cable pair. That said, the US Dollar Index (DXY) seesaws around a nine-week high by tracing firmer Treasury bond yields. However, the latest improvement in the S&P500 Futures, despite a downbeat Wall Street close, puts a floor under the EUR/USD prices.
US House Speaker Kevin McCarthy said that they are sending their negotiators to the White House to try and finish up debt-limit talks. However, reports took rounds that the US House members will go back to their homes after Thursday, to cheer the long weekend, before resuming the debt ceiling negotiations, which in turn escalates the fears of no deal before late May.
Given the escalating fears of the US default, push global rating agencies like Fitch and Moody’sto turn cautious about the US credit rating status. Late on Wednesday, Moody’s warned about the US outlook change while Fitch put US’ AAA on Rating Watch Negative status.
It’s worth mentioning that the Minutes of the latest Federal Open Market Committee (FOMC) Meeting highlighted the policymakers’ division as some suggest it is appropriate to hike the rates while others advocate for a policy pivot. That said, Atlanta Fed President Raphael Bostic said, “‘We’re right at the beginning of the hard part’ of taming inflation.” Additionally, Federal Reserve Governor Christopher Waller mentioned that he doesn’t support stopping rate hikes unless getting clear evidence that inflation is moving down toward the 2% objective.
Against this backdrop, the S&P500 Futures rise half a percent despite Wall Street’s downbeat closing whereas the US Treasury bond yields struggle to extend the latest recovery at the multi-day tops.
Looking forward, the progress on the US debt ceiling talks will be crucial to watch for the GBP/USD pair traders for clear directions as the policymakers are set to go on holiday after Thursday. Hence, a lack of deal before the end of today can only save the pair from the bear’s attack. Apart from the risk catalysts, the second readings of the US Q1 GDP will join the US weekly Jobless Claims, the Chicago Fed National Activity Index and Pending Home Sales to direct Cable prices.
Technical analysis
A daily closing below a six-week-old ascending support line, now immediate resistance near 1.2400, keeps GBP/USD on the bear’s radar.
- EUR/USD licks its wounds at the lowest levels in two month.
- Fears of US default amplify even as policymakers cite progress in debt ceiling extension talks.
- FOMC Minutes came in mixed but Fed policymakers appear hawkish enough to propel US Dollar, yields.
- Revisions of German, US Q1 GDP, other second-tier data can also entertain Euro traders.
EUR/USD remains on the back foot around mid-1.0750s as Euro bears take a breather at the lowest levels since late March during the mid-Asian session on Thursday.
In doing so, the Euro pair prods a two-day downtrend amid cautious markets. It’s worth noting, though, that the recently escalating fears of the US default on its debt payments looming in early June challenge the market’s sentiment and weigh on the EUR/USD. Even so, the policymakers’ optimism of getting the debt ceiling extension deal and mixed Fed comments allow the US dollar to stabilize at a multi-month high.
That said, the US Dollar Index (DXY) seesaws around a nine-week high by tracing firmer Treasury bond yields. However, the latest improvement in the S&P500 Futures, despite a downbeat Wall Street close, puts a floor under the EUR/USD prices.
On Wednesday, US House Speaker Kevin McCarthy said that they are sending their negotiators to the White House to try and finish up debt-limit talks. However, reports took rounds that the US House members will go back to their homes after Thursday, to cheer the long weekend, before resuming the debt ceiling negotiations, which in turn escalates the fears of no deal before late May.
The fears of US default push global rating agencies like Fitch and Moody’s to turn cautious about the US credit rating status. Late on Wednesday, Moody’s warned about the US outlook change while Fitch put US’ AAA on Rating Watch Negative status.
On the other hand, the Minutes of the latest Federal Open Market Committee (FOMC) Meeting suggested that the policymakers aren’t on the same table as some suggest it is appropriate to hike the rates while others advocate for a policy pivot. Though, Atlanta Fed President Raphael Bostic said, “‘We’re right at the beginning of the hard part’ of taming inflation.” On the same line, Federal Reserve Governor Christopher Waller mentioned that he doesn’t support stopping rate hikes unless getting clear evidence that inflation is moving down toward the 2% objective.
At home, the German IFO Business Climate Index eased to 91.7 in May from 93.4 in April, versus the market expectation of 93. Following the release of the German IFO Business Survey, the institute’s Economist Klaus Wohlrabe said that the “German economy heading towards stagnation in Q2.”
Moving on, the second readings of the US and German Q1 GDP will join the US weekly Jobless Claims, the Chicago Fed National Activity Index and Pending Home Sales to decorate the economic calendar. However, major attention will be given to the US debt ceiling talks.
Technical analysis
An upward-sloping support line from late November 2022, close to 1.0690 by the pres time, could challenge EUR/USD bears amid nearly oversold RSI (14) conditions.
- USD/CAD bulls eye a continuation for the sessions ahead.
- However, the USD/CAD bears could be about to make a move.
USD/CAD has taken off and broken prior highs in a run to test the 1.36 area on the charts. As the following illustrates, while there are prospects of higher to come, the price is building higher highs within a rising wedge.
USD/CAD daily chart
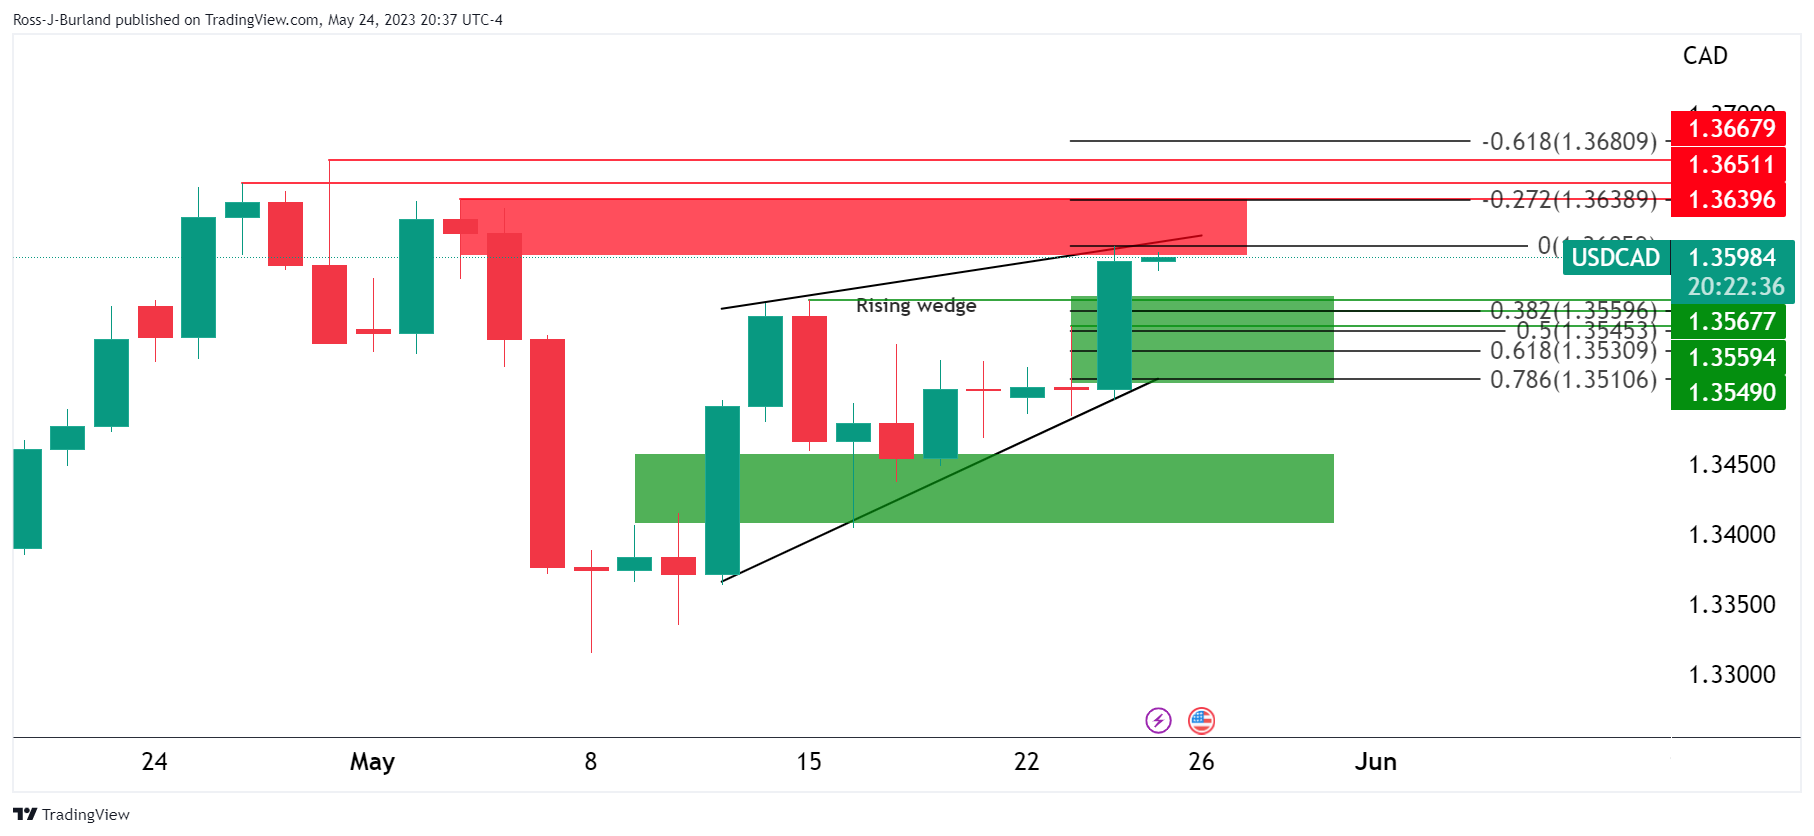
The bulls have shot up to test the 1.36s and there are eyes on 1.3650 and then 1.3670.
USD/CAD H1 chart
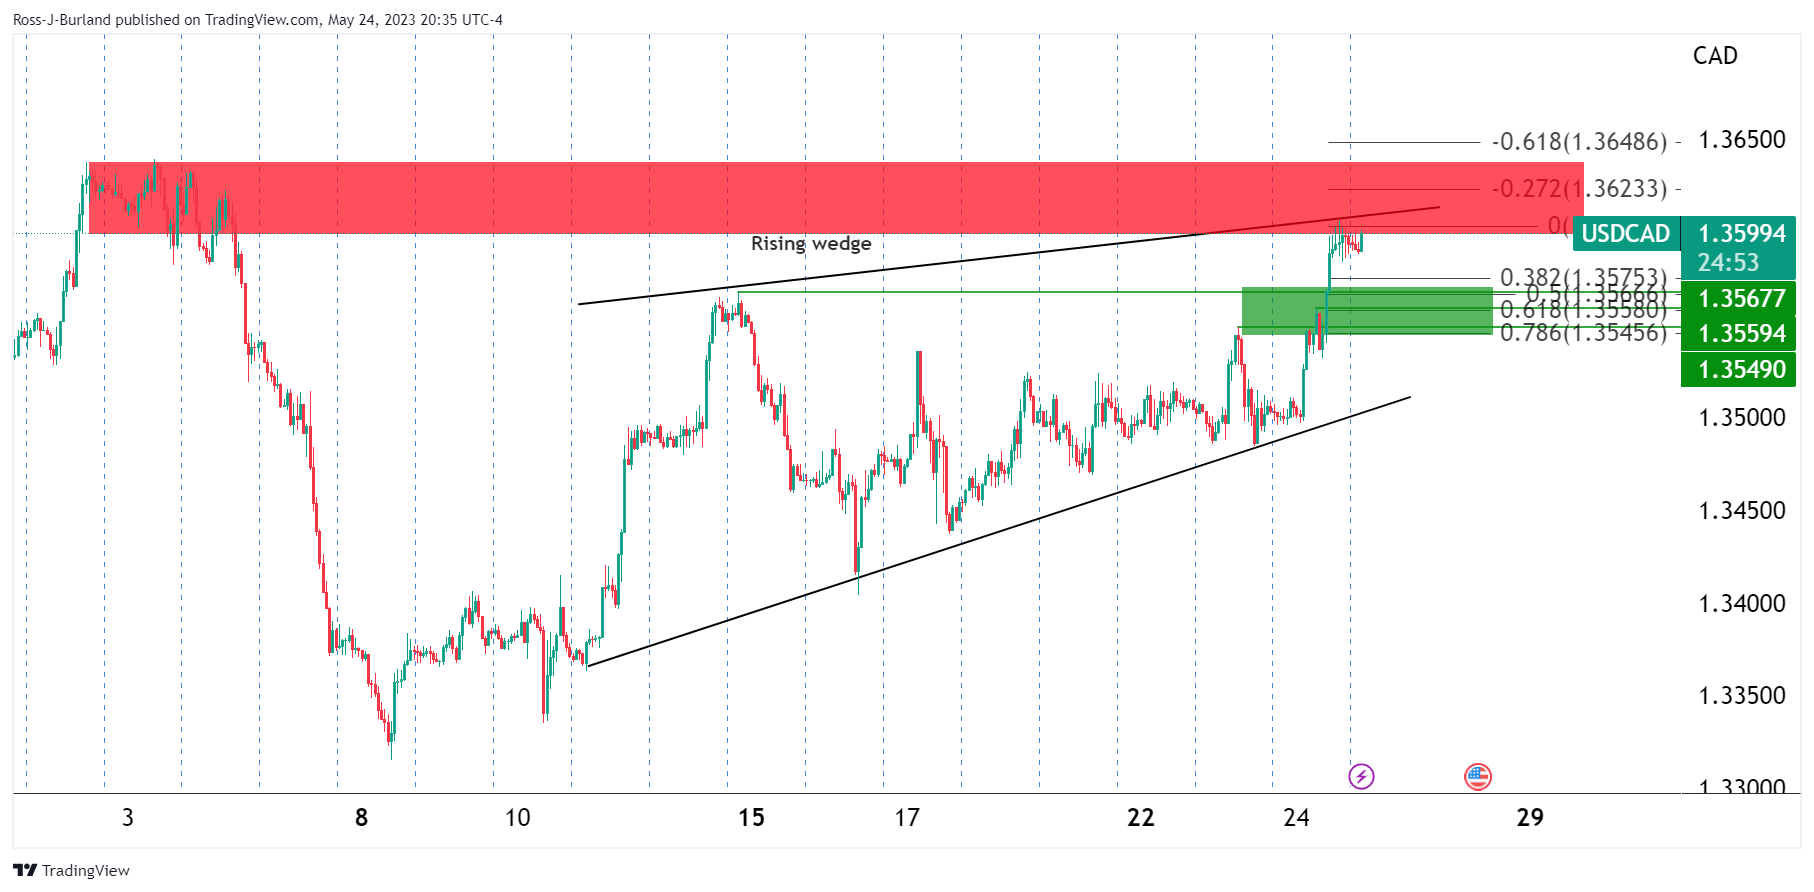
However, if the bulls don´t commit immediately, there will be prospects of a slide into the rally in a correction that could target the old highs in a 38.2% Fibonacci retracement:
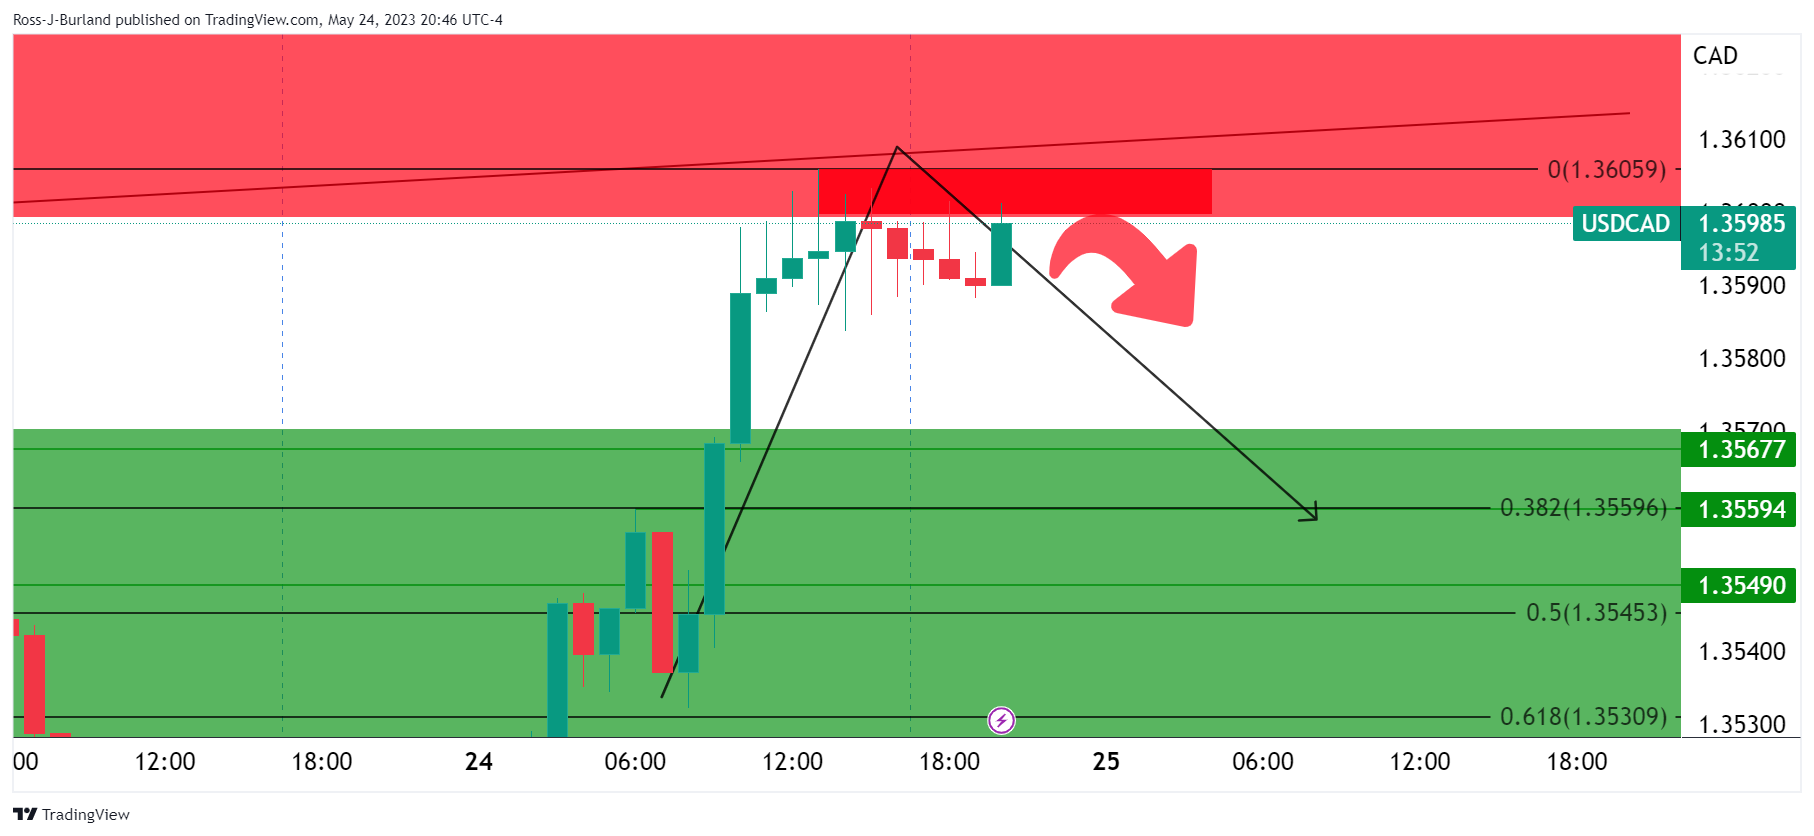
| Index | Change, points | Closed | Change, % |
|---|---|---|---|
| NIKKEI 225 | -275.09 | 30682.68 | -0.89 |
| Hang Seng | -315.32 | 19115.93 | -1.62 |
| KOSPI | -0.1 | 2567.45 | -0 |
| ASX 200 | -46.1 | 7213.8 | -0.63 |
| DAX | -310.73 | 15842.13 | -1.92 |
| CAC 40 | -125.25 | 7253.46 | -1.7 |
| Dow Jones | -255.59 | 32799.92 | -0.77 |
| S&P 500 | -30.34 | 4115.24 | -0.73 |
| NASDAQ Composite | -76.09 | 12484.16 | -0.61 |
- Silver price remains sidelined after refreshing two-month low.
- XAG/USD eyes short-covering as convergence of 200-day EMA, 38.2% Fibonacci retracement joins oversold RSI (14) line.
- 100-day EMA, multi-day-old horizontal resistance can challenge Silver buyers amid bearish MACD signals.
Silver Price (XAG/USD) sellers take a breather at the lowest levels in four weeks, making rounds to $23.00 amid early Thursday in Asia.
In doing so, the bright metal seesaws around the monthly low after falling in the last three consecutive days. That said, the oversold RSI (14) line challenges the XAG/USD’s further downside.
As a result, a convergence of the 200-day Exponential Moving Average (EMA) and 38.2% Fibonacci retracement of the metal’s upside from September 2022 to May 2023, near $22.80, becomes crucial for Silver sellers to watch.
Should the XAG/USD traders ignore the oversold RSI and break the $22.80 support confluence, a quick fall to the 50% Fibonacci retracement level of around $21.80 and then to an upward-sloping support line from September 2022, near $20.90, can’t be ruled out.
On the flip side, a daily closing beyond the 100-day EMA level of $23.50 becomes necessary to expect the Silver Price recovery.
Even so, a horizontal area comprising multiple levels marked since early 2023, near $24.55-65, will be the key to challenging the XAG/USD buyers before giving them control.
Overall, Silver price is likely to witness a corrective bounce from the aforementioned support but the upside room appears limited.
Silver Price: Daily chart
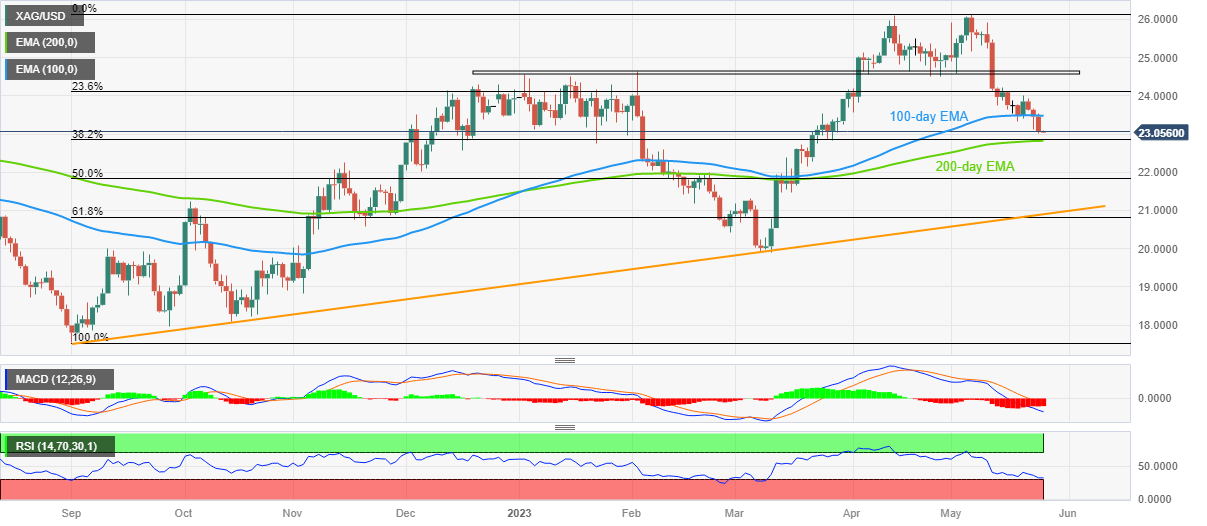
Trend: Short-term rebound expected
- EUR/GBP is looking to shift its auction profile above 0.8700 as UK Inflation is expected to be halved by the end of CY2023.
- UK inflation for April softened but remained well-above estimates.
- A Eurozone economic slowdown could force the ECB for early consideration of interest rate cuts.
The EUR/GBP pair is displaying topsy-turvy moves after failing to sustain above the round-level resistance of 0.8700 in the Tokyo session. The upside in the cross seems favored despite the United Kingdom’s inflation failing to match expectations.
On Wednesday, UK inflation for April softened but remained well-above estimates. Headline UK Consumer Price Index (CPI) softens sharply to 8.7% and ditched placement in the double-digit territory but remained above the estimates of 8.2%. The decline in headline inflation was due to lower gas prices. However, core CPI that excludes oil and food prices jumped to 6.8% vs. the estimates of 6.2%.
The street is criticizing Bank of England (BoE) policymakers for failing to bring down stubborn inflation. Higher-than-anticipated UK inflation might force BoE Governor Andrew Bailey to announce more interest rates ahead. Considering the persistence in the UK inflation, it seems that promise made by UK PM Rishi Sunak of halving inflation by the end of the year would get missed.
Meanwhile, UK Finance Minister Jeremy Hunt remained confident that the target of halving inflation this year is absolutely deliverable. He further added that inflation must come down for cutting taxes safely.
On the Eurozone front, weak economic prospects are favoring less room for further interest rate hikes by the European Central Bank (ECB). Analysts at Commerzbank cited “The PMIs are already suggesting that the ECB’s rate hikes will hit the Eurozone economy at some point. That means that the doves on the ECB board might gain the upper hand at some stage, at which point the Euro would lose important support.”
Also, a Eurozone economic slowdown could force ECB President Christine Lagarde for early consideration of interest rate cuts.
| Pare | Closed | Change, % |
|---|---|---|
| AUDUSD | 0.65445 | -1.01 |
| EURJPY | 149.888 | 0.41 |
| EURUSD | 1.07497 | -0.21 |
| GBPJPY | 172.297 | 0.14 |
| GBPUSD | 1.23644 | -0.43 |
| NZDUSD | 0.61086 | -2.22 |
| USDCAD | 1.35914 | 0.67 |
| USDCHF | 0.90494 | 0.41 |
| USDJPY | 139.36 | 0.58 |
- USD/JPY retreats from refresh six-month high despite broad US Dollar strength, sturdy yields.
- No major progress on negotiations to avoid US debt ceiling expiry alerts global rating agencies for the US’ AAA status.
- Reuters cites Japanese firms’ worries over falling birth rate, FOMC Minutes show policymakers’ division.
- Multiple second-tier US data to entertain Yen pair traders but risk catalysts are the key.
USD/JPY remains on the front foot, despite the latest pullback from the Year-To-Date (YTD) high of near 139.50 as Tokyo opens for Thursday’s trading. In doing so, the Yen pair justifies the market’s rush towards risk safety that propels the US Dollar and the Treasury bond yields. Additionally, fears surrounding the fall in Japan’s birth rate and its economic consequences also weigh on the Japanese Yen (JPY) and fuel the pair prices.
Market sentiment worsens as US policymakers struggle to break the deadlock in the US debt ceiling extension talks despite nearing the anticipated expiry of early June. Recently, US House Speaker Kevin McCarthy said that they are sending their negotiators to the White House to try and finish up debt-limit talks. However, reports took rounds that the US House members will go back to their homes after Thursday, to cheer the long weekend, before resuming the debt ceiling negotiations, which in turn escalates the fears of no deal before late May.
As a result, global rating agencies like Fitch and Moody’s turn cautious about the US credit rating status. Late on Wednesday, Moody’s warned about the US outlook change while Fitch put US’ AAA on Rating Watch Negative status.
It should be noted that the Minutes of the latest Federal Open Market Committee (FOMC) Meeting suggested that the policymakers aren’t on the same table as some suggest it is appropriate to hike the rates while others advocate for a policy pivot.
At home, Reuters cites a survey conducted on more than 500 Japanese firms to highlight the fears of a falling birth rate in the Asian major, which in turn could push the government and the Bank of Japan (BoJ) to push for more easy-money measures. “More than nine out of 10 Japanese firms feel a sense of crisis about the country's accelerating birthrate decline, with few hopeful that Prime Minister Fumio Kishida's government can arrest the fall,” according to a Reuters monthly poll.
Against this backdrop, S&P500 Futures print mild gains despite downbeat Wall Street performance whereas the yields seesaw near the highest levels since mid-March. That said, the US 10-year and two-year Treasury bond yields make rounds to 3.74% and 4.38% by the press time.
Looking ahead, USD/JPY pair traders should keep their eyes on the risk catalysts for clear directions. Additionally important will be the US weekly Jobless Claims, the second reading of the Q1 GDP estimate, the Chicago Fed National Activity Index and Pending Home Sales.
Technical analysis
USD/JPY bulls need validation from the late November swing high of around 139.90, as well as from the 140.00 round figure, to keep the reins.


© 2000-2026. Sva prava zaštićena.
Sajt je vlasništvo kompanije Teletrade D.J. LLC 2351 LLC 2022 (Euro House, Richmond Hill Road, Kingstown, VC0100, St. Vincent and the Grenadines).
Svi podaci koji se nalaze na sajtu ne predstavljaju osnovu za donošenje investicionih odluka, već su informativnog karaktera.
The company does not serve or provide services to customers who are residents of the US, Canada, Iran, The Democratic People's Republic of Korea, Yemen and FATF blacklisted countries.
Izvršenje trgovinskih operacija sa finansijskim instrumentima upotrebom marginalne trgovine pruža velike mogućnosti i omogućava investitorima ostvarivanje visokih prihoda. Međutim, takav vid trgovine povezan je sa potencijalno visokim nivoom rizika od gubitka sredstava. Проведение торговых операций на финанcовых рынках c маржинальными финанcовыми инcтрументами открывает широкие возможноcти, и позволяет инвеcторам, готовым пойти на риcк, получать выcокую прибыль, но при этом неcет в cебе потенциально выcокий уровень риcка получения убытков. Iz tog razloga je pre započinjanja trgovine potrebno odlučiti o izboru odgovarajuće investicione strategije, uzimajući u obzir raspoložive resurse.
Upotreba informacija: U slučaju potpunog ili delimičnog preuzimanja i daljeg korišćenja materijala koji se nalazi na sajtu, potrebno je navesti link odgovarajuće stranice na sajtu kompanije TeleTrade-a kao izvora informacija. Upotreba materijala na internetu mora biti praćena hiper linkom do web stranice teletrade.org. Automatski uvoz materijala i informacija sa stranice je zabranjen.
Ako imate bilo kakvih pitanja, obratite nam se pr@teletrade.global.
транcфери