- Analiza
- Novosti i instrumenti
- Vesti sa tržišta
Forex-novosti i prognoze od 23-05-2023
- USD/CAD is oscillating in a narrow range around 1.3500 ahead of FOMC minutes.
- Republicans are not agreeing on levying extra taxes on the Wealthy community or supporting higher spending initiatives.
- The oil price has printed a fresh three-week high around $74.00 as global central banks are reaching the terminal rate.
The USD/CAD pair is demonstrating topsy-turvy moves near the psychological figure of 1.3500 in the early Asian session. The Loonie asset is expected to remain sideways ahead of the release of the Federal Open Market Committee (FOMC) minutes for May’s monetary policy meeting.
S&P500 futures have added some gains in early Tokyo after a bearish Tuesday. The overall market mood is still risk-off amid deepening issues associated with US debt-ceiling case. US House Speaker Kevin McCarthy told House Republicans during a closed GOP meeting on Tuesday that “I need you all to hang with me on the debt limit, we are nowhere near a deal yet,”
Uncertainty about US borrowing cap issue soars after US President Joe Biden called partisan terms proposed by Speak McCarthy ‘extreme’. The latter is not agreed on levying extra taxes on the Wealthy community nor is he supporting higher spending initiatives.
The US Dollar Index (DXY) is showing signs of volatility contraction after reaching near the previous week’s high above 103.62. More gains are in the pipeline ahead of the FOMC minutes, which will provide a detailed explanation behind the 25 basis points (bps) interest rate hike by the Federal Reserve (Fed). Also, it will report current economic prospects and would deliver guidance on interest rates.
Meanwhile, the oil price has printed a fresh three-week high around $74.00 as investors seem confident that the US economy will not default and would find a bipartisan deal with Republicans. Also, other central banks are reaching the terminal rate, which is easing fears of a further slowdown.
It is worth noting that Canada is the leading exporter of oil to the United States and higher oil prices will support the Canadian Dollar.
- US Dollar Index remains sidelined after refreshing two-month high.
- Hawkish Fed bets, risk-off mood allows DXY to remain firmer despite pullback in yields.
- Upbeat US PMIs, concerns about Fed’s next move highlight today’s Minutes.
- US policymakers struggle to overcome the deadlock in debt ceiling talks ahead of early June expiry.
US Dollar Index (DXY) bulls take a breather at a nine-week high, making rounds to 103.50 as traders await the latest Federal Open Market Committee (FOMC) Meeting Minutes. Also challenging the greenback’s gauge versus six major currencies are the fears of the US default. However, hawkish Federal Reserve (Fed) concerns and upbeat US data put a floor under the DXY price during early Wednesday.
A lack of progress in the talks to avoid the US debt ceiling expiration and fears that the US may mark the ‘catastrophic’ default weighed on the market sentiment of late. Recently, US House Speaker Kevin McCarthy crossed wires, via Reuters, while suggesting no deal on the debt ceiling extension today but repeating previous optimism that they will get an agreement before June 01. Previously, Washington rolled out news stating the US Treasury has asked multiple agencies if they can delay the payment demands.
Talking about the data, preliminary figures of the May monthly PMIs signaled that the US Services sector keeps outgrowing the manufacturing ones and fuelled the Composite PMI figure to the highest levels in a year. That said, the US S&P Global Manufacturing PMI eased to 48.5 from 50.2 versus 50.0 market forecasts whereas Sevices PMI rose to 55.1 compared to 52.6 expected and 53.6. With this, the Composite PMI marked 54.5 figures versus the analysts’ expectations of 50.0 and 53.4.
On the other hand, the latest comments from Atlanta Fed President Raphael Bostic, Richmond Fed President Thomas Barkin and San Francisco President Mary C Daly who backed the calls for higher Fed rates while citing the inflation woes, which in turn propelled the betts on the Fed rate increase in June. The same push back the Fed rate cut and allows the US Dollar to remain firmer despite a retreat in the US Treasury bond yields. It should be noted that the US 10-year and two-year Treasury bond yields retreated from the highest levels since early March the previous day.
With this, the Wall Street benchmarks saw the red but the S&P 500 Futures seem to struggle for clear directions, marking mild gains of late.
Looking ahead, the qualitative factors affecting the market sentiment, like US debt ceiling talks, US-China tension and Fed commentary, are the key catalysts to direct short-term US Dollar Index moves ahead of the Fed Minutes.
Also read: FOMC Minutes Preview: The complicated task of searching for clues
Technical analysis
Unless providing a daily close below the 100-DMA, around 102.85 by the press time, US Dollar Index remains on the buyer’s radar.
- EUR/USD pares the biggest daily loss in a week amid cautious markets.
- Comparatively upbeat US PMIs jostle with the hawkish ECB talks and pre-event anxiety to prod Euro traders.
- US policymakers’ inability to strike debt ceiling deal weighs on sentiment, EUR/USD price.
- Fed Minutes, headlines about US default will be the key to watch for immediate directions.
EUR/USD bears take a breather around 1.0770 during early Wednesday in Asia, after posting the biggest daily loss in a week. That said, escalating fears of the US default, hawkish Fed bets and anxiety ahead of the Fed Minutes seem to contribute the maximum in the latest sour sentiment, as well as to the EUR/USD weakness. Additionally weighing on the Euro price is the US-China tension and the West versus Russian jitters.
No progress in the talks to avoid the US debt ceiling expiration and fears that the US may mark the ‘catastrophic’ default weighed on the market sentiment of late. Recently, US House Speaker Kevin McCarthy crossed wires, via Reuters, while suggesting no deal on the debt ceiling extension today but repeating previous optimism that they will get an agreement before June 01. Previously, Washington rolled out news stating the US Treasury has asked multiple agencies if they can delay the payment demands.
On Tuesday, preliminary figures of the May monthly PMIs signaled that the US Services sector keeps outgrowing the manufacturing ones and fuelled the Composite PMI figure to the highest levels in a year. That said, the US S&P Global Manufacturing PMI eased to 48.5 from 50.2 versus 50.0 market forecasts whereas Sevices PMI rose to 55.1 compared to 52.6 expected and 53.6. With this, the Composite PMI marked 54.5 figures versus the analysts’ expectations of 50.0 and 53.4.
On the other hand, the first readings of Eurozone HCOB monthly PMIs for May came in a little interesting despite an upbeat 55.9 number for the Services activity gauge.
Apart from the data, the latest comments from Atlanta Fed President Raphael Bostic, Richmond Fed President Thomas Barkin and San Francisco President Mary C Daly who backed the calls for higher Fed rates while citing the inflation woes, which in turn propelled the betts on the Fed rate increase in June. The same push back the Fed rate cut and allows the US Dollar to remain firmer despite a retreat in the US Treasury bond yields.
At home, European Central Bank (ECB) Vice President Luis de Guindos and policymaker Joachim Nagel ruled out policy pivot talks while citing the higher inflation to defend the rate hike bias.
Against this backdrop, Wall Street closed in the red and helped the US Dollar despite downbeat yields.
Looking ahead, the Eurozone calendar remains empty and may add strength to the latest EUR/USD inaction. However, risk catalysts and the latest Federal Open Market Committee (FOMC) Meeting Minutes will be crucial to watch for clear directions.
Also read: FOMC Minutes Preview: The complicated task of searching for clues
Technical analysis
EUR/USD remains bearish between a three-week-old descending resistance line and an upward-sloping trend line support stretched from late November 2022, respectively between 1.0805 and 1.0745.
- AUD/NZD has displayed a decent recovery after a sheer contraction in NZ Q1 Retail Sales to 1.4%.
- The RBNZ is expected to raise interest rates further by 25 bps to 5.50%.
- Australian Employment has been hit hard amid a slowdown in the economy due to higher interest rates.
The AUD/NZD pair has shown a solid recovery above 1.0580 as Statz New Zealand has reported downbeat Q1 Retail Sales data. The economic data has contracted by 1.4% while the street was anticipating a contraction of 0.4%. NZ Retail Sales contracted by 0.6% in the last quarter of CY2022. A spree of a decline in retail demand would weigh heavily on inflationary pressures ahead.
Later on Wednesday, the interest rate decision by the Reserve Bank of New Zealand (RBNZ) will be of utmost importance. Analysts at ING stated “Markets are pricing in a peak at around 5.80%, but we think the RBNZ can deliver an extra bit of hawkishness and signal tightening until the 6.00% mark as it hikes by 25 bps this week. That would have positive implications for NZD in the near term.”
Investors should note that RBNZ Governor Adrian Orr hiked its Official Cash Rate (OCR) surprisingly by 50 basis points (bps) to 5.25% in April’s monetary policy meeting as inflationary pressures remained sticky. New Zealand’s inflation softened to 6.7% in the first quarter of CY2023 from the former release of 7.2% but is still far from the desired rate.
On the Australian Dollar front, the Reserve Bank of Australia (RBA) is expected to remain steady in June as Australian Employment has hit hard amid a slowdown in the economy due to higher interest rates. RBA policymakers already hinted that a sharp slowdown could affect the economy and inflation would remain under pressure. This may allow RBA Governor Philip Lowe to keep rates steady and further assess the impact of current interest rate hikes ahead.
“Business sentiment at big Japanese manufacturers turned positive for the first time this year and service-sector morale hit a five-month high, providing more evidence of an economy on the mend after a COVID-led recession,” per the monthly results of the Reuters Tankan survey.
Key findings
Manufacturers' mood is expected to rise further over the coming three months, while the service-sector morale slid only slightly.
The sentiment index for big manufacturers stood at +6, up from April, the according to the survey of 493 firms, of which 241 responded during May 10-19.
It was the first positive reading this year and is expected to rise further in August.
The service-sector index grew a tad from the previous month to 25, led by retailers and real estate/construction firms. The index hit its highest this year.
USD/JPY dribbles
The data fails to inspire USD/JPY bears as the Yen pair remains sidelined around 138.50, waiting for Tokyo open.
- NZD/USD holds lower grounds as New Zealand’s Q1 Retail Sales growth disappoints ahead of RBNZ.
- Fears of US default weigh on market sentiment, as well as on Kiwi prices, amid lackluster debt ceiling talks.
- Hopes of witnessing one last rate hike from RBNZ keeps NZD/USD bears on the lookout for dovish signs.
- Fed Minutes, risk catalysts can entertain traders past RBNZ.
NZD/USD fades bounce off intraday low on downbeat New Zealand Retail Sales, as well as the risk-off mood, to around 0.6250 during early Wednesday. In doing so, the Kiwi pair portrays the market’s hesitance in reacting to the key NZ data as traders await the Reserve Bank of New Zealand (RBNZ) Monetary Policy Decision.
Also read: RBNZ Interest Rate Decision Preview: Kiwi set to fly on a hawkish rate hike
New Zealand’s first quarter (Q1) Retail Sales marked a contraction of 1.4% QoQ versus -0.4% expected and -0.6% prior while the YoY figures dropped to -4.1% versus -4.0% previous readings.
Apart from the downbeat NZ data, the market’s risk aversion also weighs on the NZD/USD price. That said, escalating fears of the US default and anxiety ahead of the RBNZ interest rate decision seems to contribute the maximum in the latest sour sentiment. Furthermore, the US-China tension and the West versus Russian jitters are also on the table to challenges the mood, as well as the Kiwi pair price.
That said, no progress in the talks to avoid the US debt ceiling expiration and fears that the US may actually mark the ‘catastrophic’ default weighed on the market sentiment of late. Recently, US House Speaker Kevin McCarthy crossed wires, via Reuters, while suggesting no deal on the debt ceiling extension today but repeating previous optimism that they will get agreement before June 01. Previously, Washington rolled out news stating the US Treasury has asked multiple agencies if they can delay the payment demands.
On the other hand, hawkish Fed bets increased after preliminary figures of the May monthly PMIs signaled that the US Services sector keeps outgrowing the manufacturing ones and fuelled the Composite PMI figure to the highest levels in a year. That said, the US S&P Global Manufacturing PMI eased to 48.5 from 50.2 versus 50.0 market forecasts whereas Sevices PMI rose to 55.1 compared to 52.6 expected and 53.6. With this, the Composite PMI marked 54.5 figures versus the analysts’ expectations of 50.0 and 53.4.
Additionally fueling the hawkish Fed concerns are the latest comments from Atlanta Fed President Raphael Bostic, Richmond Fed President Thomas Barkin and San Francisco President Mary C Daly who backed the calls for higher Fed rates while citing the inflation woes, which in turn propelled the betts on the Fed rate increase in June. The same pushes back the Fed rate cut and allows the US Dollar to remain firmer despite a retreat in the US Treasury bond yields.
Moving on, the Reserve Bank of New Zealand’s (RBNZ) Monetary Policy Meeting and risk catalysts can entertain the NZD/USD pair during the early part of the day. Following that, the latest Federal Open Market Committee (FOMC) Meeting Minutes will be crucial to watch. That said, the RBNZ is expected to announce 0.25% rate hike but the future guidance for the rates will be the key to watch.
Ahead of the RBNZ, Analysts at the ANZ said, “We expect a 25bp hike but wouldn’t at all be surprised to see 50bp. But what we think matters most given the focus on carry is where the OCR peaks in the RBNZ’s projections. Anything with a 6-handle is likely to be NZD-supportive, global issues notwithstanding.”
Technical analysis
A fortnight-old symmetrical triangle restricts immediate moves of the NZD/USD between 0.6225 and 0.6270 as RSI, as well as the MACD, teases bears.
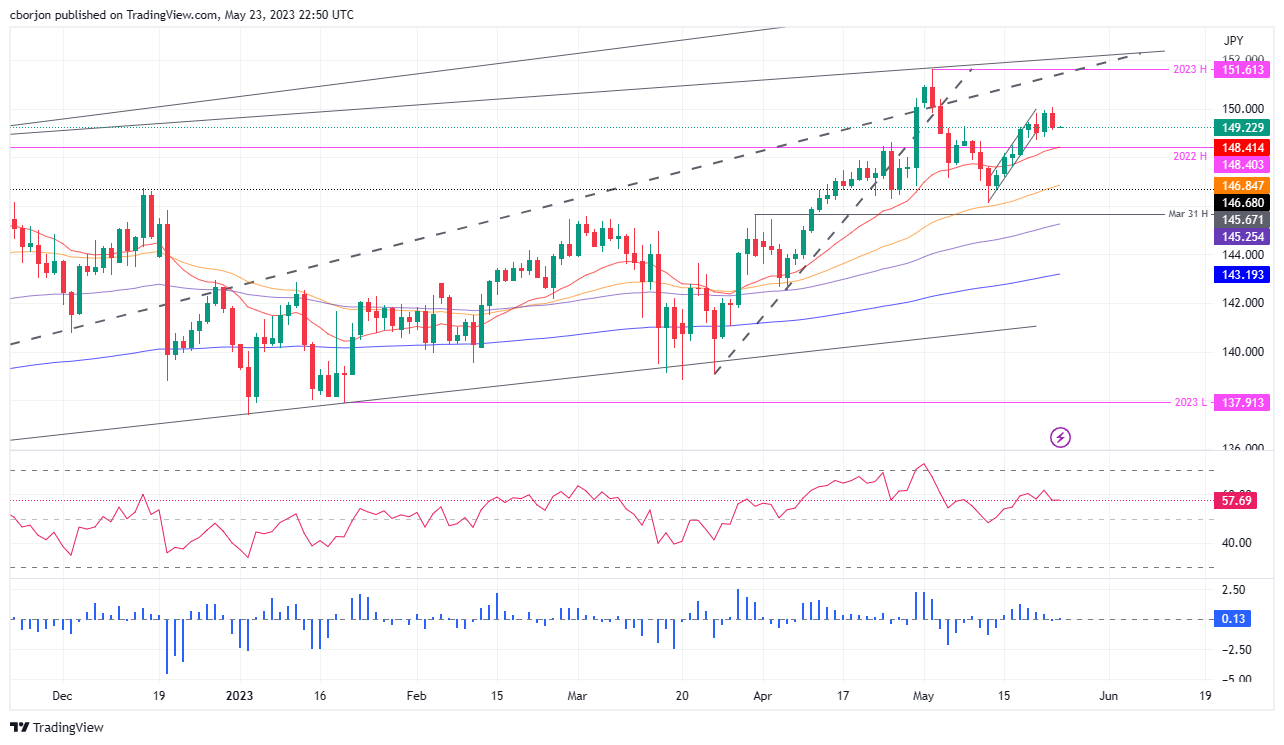
- After achieving a weekly high of 150.05, EUR/JPY retreats to 149.24 amid souring sentiment.
- The failure to surpass the 150.00 threshold and harmful Eurozone data create downward pressure.
- Market players eye crucial cues from upcoming ECB speakers and Japanese inflation figures.
Following Tuesday’s session, EUR/JPY floats at around 149.24, which witnessed the EUR/JPY pair hitting a new weekly high of 150.05, before the cross tumbled as sentiment deteriorated, finishing Tuesday’s session with losses of 0.40%.
EUR/JPY Price Analysis: Technical outlook
The EUR/JPY daily chart suggests the pair remains neutral but slightly downward biased, as it remains below the year-to-date (YTD) high of 151.61. in the last three trading days, the EUR/JPY failed to conquer the 150.00 figure, and bad Eurozone (EU) economic data on Tuesday exposed the pair to selling pressure. That would likely keep the EUR/JPY trapped within the 149.00-150.00 area unless fundamental catalysts like European Central Bank (ECB) speakers or Japanese inflation figures give some cues about the EUR/JPY’s trend direction.
On the upside, the EUR/JPY first resistance is 150.00. A breach of it, and the cross could rally toward 151.00, ahead of the YTD high of 151.61. Conversely, the EUR/JPY first support is 149.00. A successful move below this resistance will pave the way for a pullback toward the 20-day Exponential Moving Average (EMA) at 148.42 before dipping toward the 148.00 figure. The next stop would be the 59-day EMA at 146.85.
The Relative Strength Index (RSI) indicator is stills in bullish territory but turned flat, suggesting that buyers are taking a respite, while the 3-day Rate of Change (RoC) shifts neutral.
EUR/JPY Price Action – Daily chart
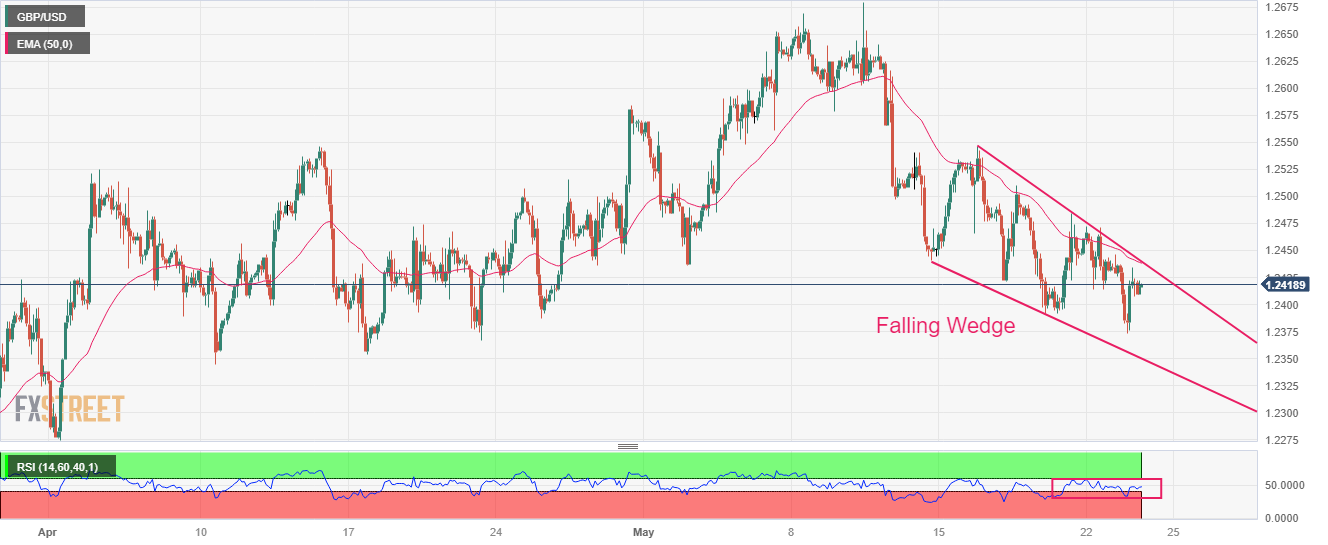
- GBP/USD is displaying a sideways auction as the focus has shifted to UK Inflation.
- BoE Bailey reiterated that they must use the tool of interest rate rises carefully.
- GBP/USD is auctioning in a Falling Wedge pattern in which each pullback is considered as a selling opportunity.
The GBP/USD pair is displaying a back-and-forth action around 1.2420 in the early Tokyo session. Earlier, the Cable showed significant recovery after defending the downside near 1.2380. A power-pack action is anticipated from the Pound Sterling ahead of the United Kingdom’s Consumer Price Index (CPI) data (April).
Headline inflation is seen softening sharply to 8.2% from the former release of 10.1%. The core CPI is expected to remain steady at 6.2%. On Tuesday, Bank of England (BoE) Governor Andrew Bailey said "I think we are nearer to the peak than we were” and reiterated that they must use the tool of interest rate rises carefully.
The US Dollar Index (DXY) is looking to surpass the crucial resistance of 103.62 amid US debt-ceiling issues. International Monetary Fund (IMF) Managing Director Kristalina Georgieva cited on Tuesday that "A lack of solution would have a detrimental impact on the US and world economy,” "Hopefully we won't have to wait to the 11th hour for a solution on the US debt-ceiling."
GBP/USD is auctioning in a Falling Wedge chart pattern on a two-hour scale in which each pullback is considered a selling opportunity by the market participants. Also, the chances of a bullish reversal remain higher. The 50-period Exponential Moving Average (EMA) at 1.2440 is acting as a barrier for the Pound Sterling bulls.
Meanwhile, a 40.00-60.00 range oscillation by the Relative Strength Index (RSI) (14) will get a decisive move after the release of the UK Inflation.
Should the asset decline below May 19 low at 1.2390, US Dollar bulls will get strengthened further and will drag the Cable toward April 10 low at 1.2344 followed by April 03 low at 1.2275.
On the flip side, a recovery move above May 09 high at 1.2640 will drive the major toward the round-level resistance at 1.2700 and 26 April 2022 high at 1.2772.
GBP/USD two-hour chart
- AUD/USD holds lower grounds at weekly bottom after posting the biggest daily loss in a week.
- Risk appetite weakens after chatters that US Treasury requested agencies to delay payment while policymakers appear less optimistic of late.
- Fed Minutes, US default talks will be the key catalysts to watch for clear directions.
AUD/USD remains pressured around 0.6600 as market sentiment worsens on early Wednesday in Asia, amid fears of the US default, as well as hawkish Federal Reserve (Fed) concerns ahead of the Fed Minutes. Also challenging the Aussie pair is the mixed prints of Aussie data versus comparatively stronger US PMIs. However, hopes that the US policymakers will be able to avoid US default seem to put a floor under the Aussie pair prices.
Recently, US House Speaker Kevin McCarthy crossed wires, via Reuters, while suggesting no deal on the debt ceiling extension today but before June 01. Previously, Washington rolled out news stating the US Treasury has asked multiple agencies if they can delay the payment demands.
Elsewhere, the preliminary figures of the May monthly PMIs suggest that the US Services sector keeps outgrowing the manufacturing ones and fuelled the Composite PMI figure to the highest levels in a year. On the contrary, the Aussie activity numbers for the said month were less impressive. The same joins the latest divergence in the market’s bets on the Federal Reserve (Fed) versus the Reserve Bank of Australia (RBA) to exert downside pressure on the AUD/USD prices.
Apart from the US default fears and Fed concerns, the US-China tussles are also luring the Aussie pair bears, due to the Australia-China ties. Recently, Russia flaunts its ties with Beijing and that strengthens the global dislike for the dragon nation. Additionally, the US-China trade tussle continues, becoming an additional reason supporting the risk-off mood.
Amid these plays, Wall Street closed in the red and helped the US Dollar despite downbeat yields.
Moving on, there are no major data/events from Australia but the Reserve Bank of New Zealand’s (RBNZ) Monetary Policy Meeting and risk catalysts can entertain the risk-barometer pair during the early part of the day. Following that, the latest Federal Open Market Committee (FOMC) Meeting Minutes will be crucial to watch.
Technical analysis
A daily closing below one-month-old previous support, now resistance around 0.6625, directs AUD/USD towards the yearly low of around 0.6575.
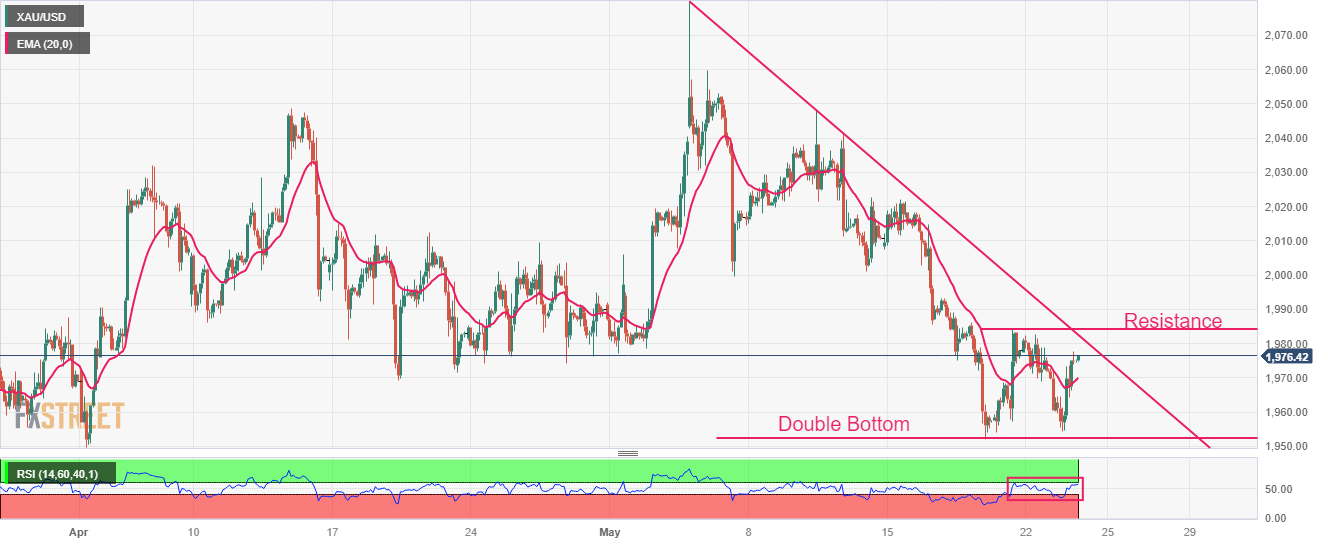
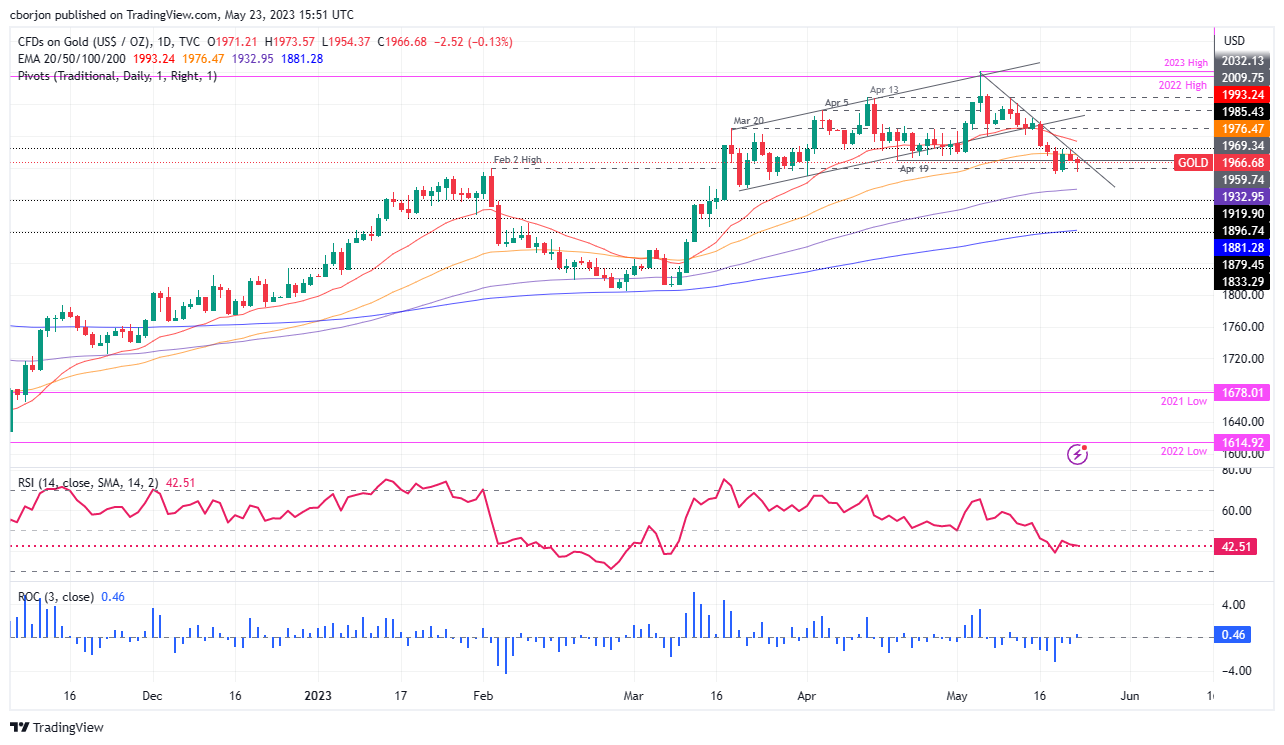
- Gold price has shifted comfortably above $1,970.00 ahead of FOMC minutes.
- The release of May’s FOMC minutes will provide a detailed explanation behind 25 bps interest rate hike by the Fed.
- Mixed preliminary S&P PMI data (May) weighed on US Treasury yields.
Gold price (XAU/USD) has shifted its auction comfortably above the crucial resistance of $1,970.00 in the Asian session. The precious metal is expected to extend its rally further ahead of the release of the Federal Open Market Committee (FOMC) minutes for May’s monetary policy meeting on Wednesday.
S&P500 futures witnessed a steep fall on Tuesday, dragged by a sell-off in technology stocks. The market mood remained negative as the United States economy is getting closer to a situation of default as the Federal government will be out of funds by June 01. An absence of positive development in raising the US debt-ceiling is terrifying investors as a default by the US economy could result in chaos in global financial markets and a spike in interest rates.
The US Dollar Index (DXY) is showing signs of volatility contraction after gaining to near the previous week’s high above 103.60. Going forward, the release of May’s FOMC minutes will provide a detailed explanation behind the 25 basis points (bps) interest rate hike by the Federal Reserve (Fed). Also, it will provide cues about upcoming policy action.
Meanwhile, the release of the mixed preliminary S&P PMI data (May) weighed on US Treasury yields. The Yields offered on 10-year US government bonds dropped below 3.70%.
Gold technical analysis
Gold price has shown a stellar recovery after a Double Bottom formation plotted from May 18 low at $1,952.01, which indicates a bullish reversal. Gold bulls will get further strength after breaking above the immediate resistance placed from March 19 high at $1,984.25. The downward-sloping trendline market from all-time highs at $2,079.76 will act as a major barrier for the Gold price.
The yellow metal has climbed above the 20-period Exponential Moving Average (EMA) at $1,970.00, which indicates that the short-term trend has turned positive.
Meanwhile, the Relative Strength Index (RSI) (14) has shifted into the 40.00-60.00 range from the bearish range of 20.00-40.00, which signals that the downside momentum has faded.
Gold hourly chart
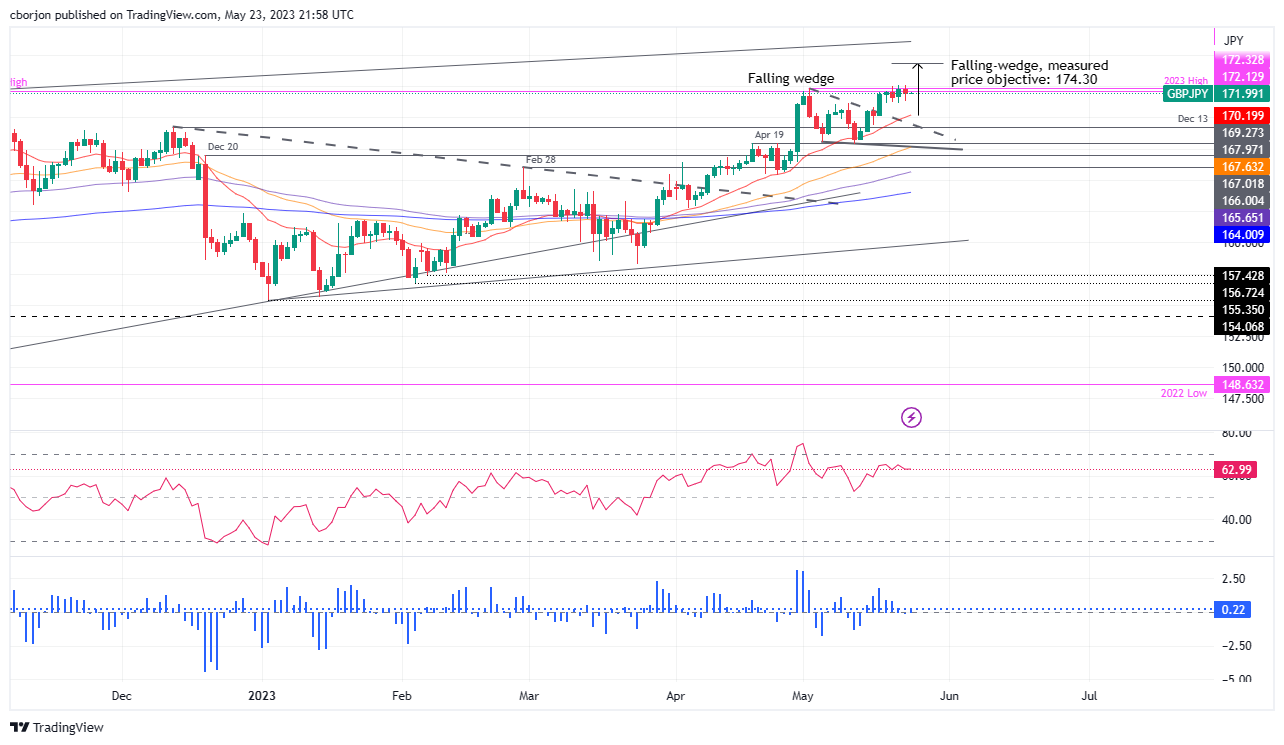
- GBP/JPY is trading almost flat near the 172.00 mark as market sentiment dips due to a lack of agreement between the White House and the US Congress.
- GBP/JPY maintains an upward bias despite the stall in its rally towards the falling-wedge measured objective of 174.30.
- Clearing the 173.00 area could pave the way toward the 174.00 figure.
- Negative divergence between GBP/JPY price action and the RSI signals a pullback.
GBP/JPY retraces from around the 172.60 area and hovers nearby the 172.00 figure as market sentiment deteriorates. Failure to reach an agreement between the White House (WH) and the US Congress dampened investors’ mood as the June 1 deadline approached. As the Asian session begins, the GBP/JPY is trading at 172.01, almost flat.
GBP/JPY Price Analysis: Technical outlook
The GBP/JPY is still upward biased, but since the break of a falling wedge, the pair’s rally towards the measured objective at 174.30 stalled. In three consecutive sessions, the GBP/JPY failed to reach the 173.00 area, which, once cleared, could pave the way towards the 174.00 figure, ahead of getting the measured objective of the falling wedge.
Nevertheless, as the GBP/JPY price action achieved successive higher highs, the Relative Strength Index (RSI) indicator prints lower peaks. That means a negative divergence between price action and the RSI could open the door for a pullback.
Hence, the GBP/JPY first support is the 172.00 mark. A break below and the GBP/JPY will get to the 20-day Exponential Moving Average (EMA) at 170.20, with the 170.00 figure up for grabs.
GBP/JPY Price Action – Daily chart
- NZD/USD bears are testing key support.
- RBNZ is the focus with rate rises on the way.
NZD/USD is trading around 0.6240 in a phase of consolidation but under pressure. Global equities slid on Tuesday as talks over the US debt ceiling continued without resolution. We also have yields on one-month US Treasury bills running into a record high. Rising yields and a stronger US Dollar pressured the high beta NZD.
´´The Kiwi is lower this morning, having followed equities down overnight, with newswires attributing the equity rout to a lack of progress on the US debt ceiling and the US Treasury asking agencies if they have capacity to delay payments (demonstrating how down to the wire it is),´´ analysts at ANZ Bank explained.
´´The US does benefit from safe-haven buying in such instances, and that makes sense, recalling that other than the NZD, no other currency has a higher cash rate. So, expect volatility as this issue percolates, the analysts added.
RBNZ in focus
´´Today is of course all about the RBNZ. We expect a 25bp hike but wouldn’t at all be surprised to see 50bp. But what we think matters most given the focus on carry is where the OCR peaks in the RBNZ’s projections. Anything with a 6-handle is likely to be NZD-supportive, global issues notwithstanding,´´ the analysts explained.
The key event during the Asian session will be the Reserve Bank of New Zealand meeting. Additionally, retail sales data is due in New Zealand. Later in Europe, focus will shift to UK inflation data. During the American session, the Federal Reserve will release the FOMC minutes.
Here is what you need to know on Wednesday, May 24:
The US Dollar strengthened on Tuesday amid risk aversion, while both the Nasdaq and the S&P 500 experienced declines of over 1%. Although US yields dropped, the US Dollar Index (DXY) rose, reaching two-month highs before retracing to 103.50.
The debt-ceiling drama remains unresolved as negotiations continued on Tuesday following a "positive" meeting between President Biden and House Speaker McCarthy. In terms of economic data, the US S&P Global PMI showed mixed results, while New Home Sales exceeded expectations. On Wednesday, the Federal Reserve (Fed) will release the minutes of its latest meeting.
EUR/USD weakened and fell toward weekly lows, nearing 1.0750. The Euro underperformed following data indicating a further contraction in the Eurozone manufacturing sector in May. On Wednesday, the German IFO Survey will be released.
GBP/USD dropped on Tuesday but closed far from the lows. The pair bottomed at 1.2367, the lowest level in a month and then rebounded back above 1.2400. EUR/GBP fell to test April lows under 0.8680. On Wednesday, the UK will report April inflation.
USD/JPY hit fresh six-month highs near 139.00. It is currently hovering around 138.50/60 as the Japanese yen stabilizes amid a decline in Treasury yields.
AUD/USD posted its lowest daily close since late April, although it managed to hold above the key level of 0.6600. The deterioration in market sentiment weighed on the Australian dollar, which failed to capitalize on a rebound in commodity prices.
NZD/USD suffered its worst day in a week, falling from 0.6300 to 0.6240. The Reserve Bank of New Zealand (RBNZ) will announce its decision on Wednesday. Also, Retail Sales data is due.
Analysts at TD Securities wrote:
We expect the Bank to deliver a 50bps hike this week and lift our estimate of RBNZ terminal from 5.50% to 6%. Upside to inflation from budget stimulus and higher net migration raise the risk that inflation does not return to within the 1-3% band by the end of next year as the RBNZ assumed in its Feb MPS. Elevated twin deficits (significant forecast deterioration in budget deficits implied in last week's Budget and the record current account deficit) also warrant more aggressive RBNZ action.
The USD/CAD pair finished the session flat around 1.3500 after failing to hold on to earlier gains. The pair surged to a one-week high of 1.3546, but later pulled back as the Canadian dollar outperformed, boosted by rising crude oil prices and higher-than-expected wholesale inflation data from Canada.
Gold finished modestly higher, trading above the $1,970 level after a $20 rally during the American session. Silver, on the other hand, dropped again but finished far from its daily low, hovering around $23.40.
RBNZ Interest Rate Decision Preview: Kiwi set to fly on a hawkish rate hike
Like this article? Help us with some feedback by answering this survey:
- EUR/USD bears eye a run towards 1.0750.
- Bulls need to get over the trendline resistances.
EUR/USD eyes a 50% mean reversion and resistance near 1.0790. However, the bears are in the market and the bias remains to the downside while on the front side of the bearish trendlines. A move to test the depths of the 1.07s as illustrated above could be on the cards.
EUR/USD technical analysis
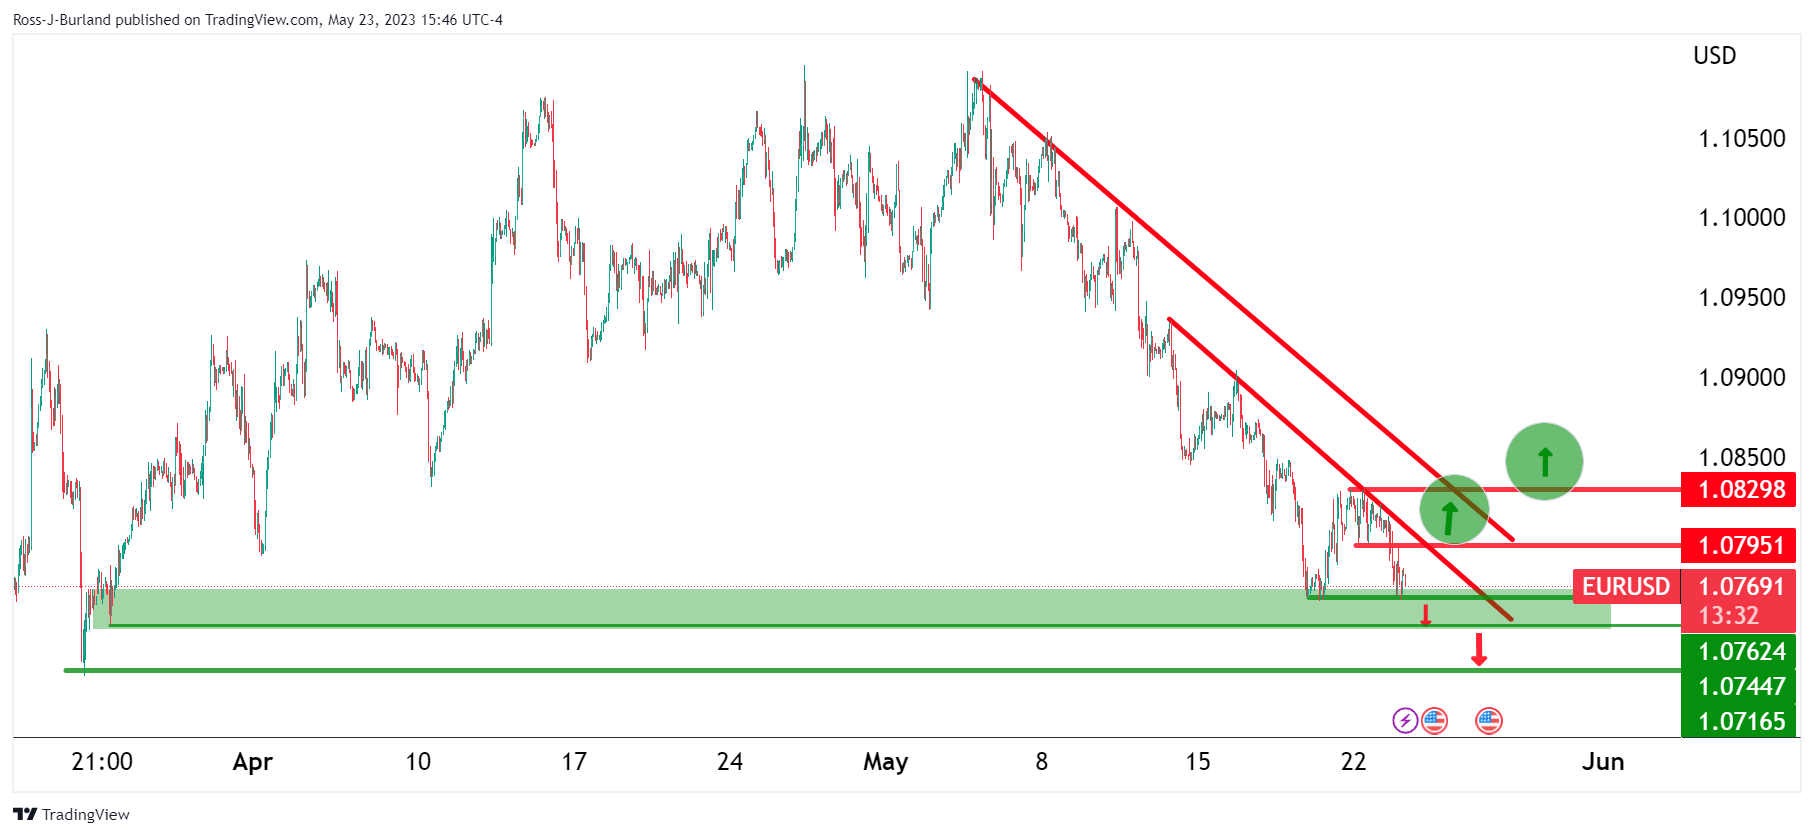
EUR/USD bears are in the market with the price on the front side of the trendline resistances. The bears are targeting the potential supporting areas as marked up on the chart above.
EUR/USD H4 charts
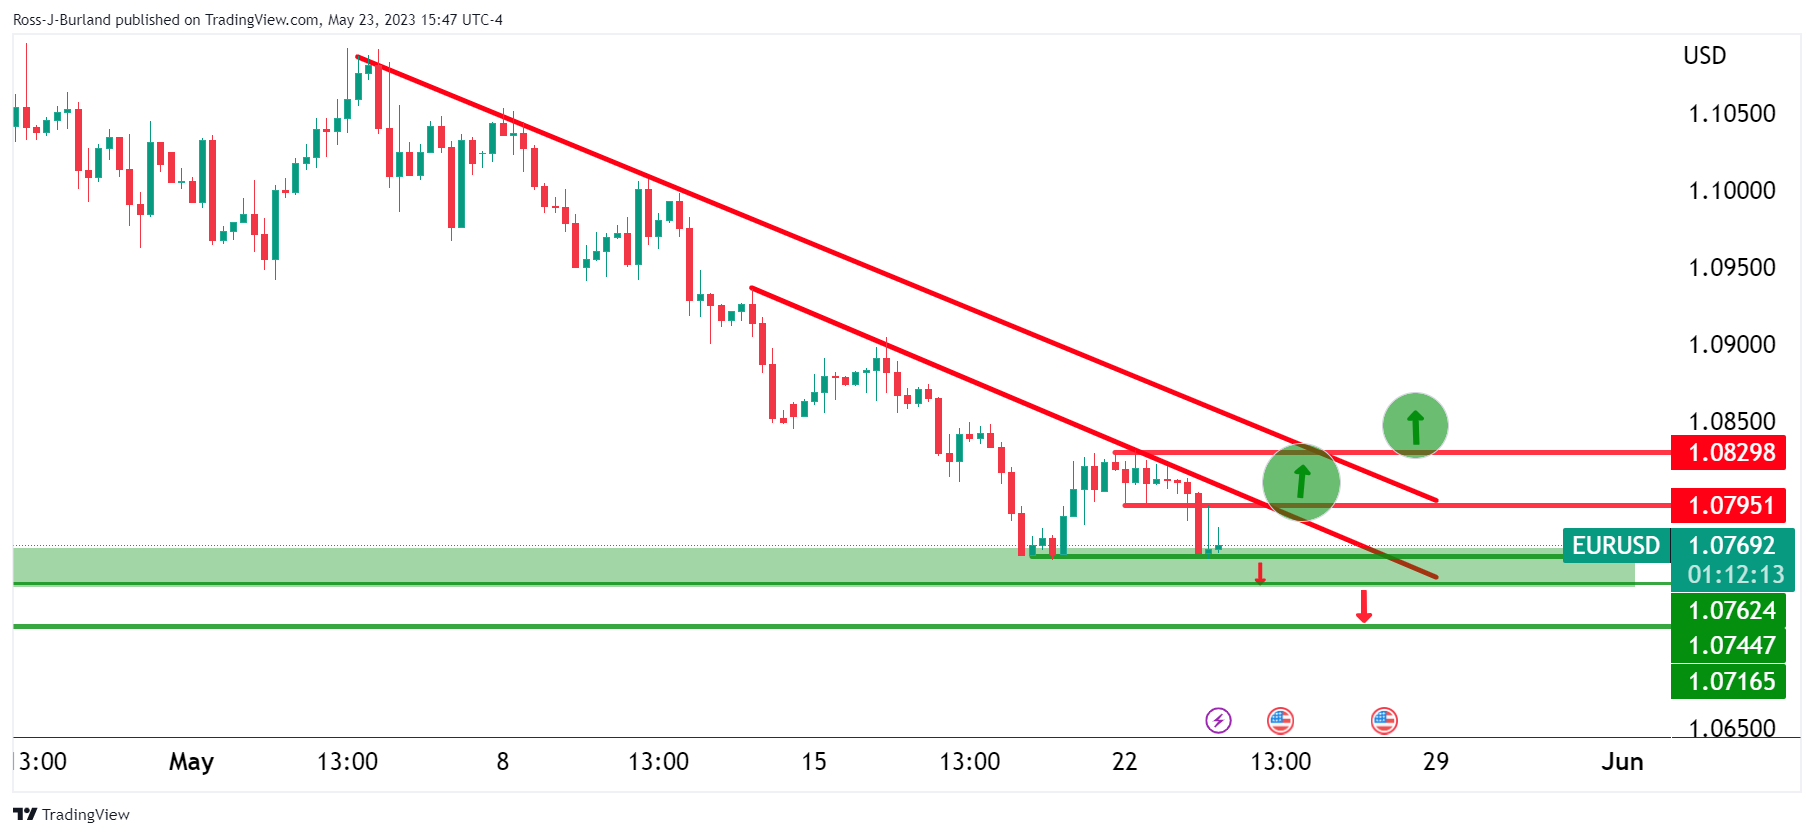
Zooming down to the 4-hour charts, the bulls are engaged at support. A bullish scenario would see the price break resistances and move in on 1.0850 and 1.0900.
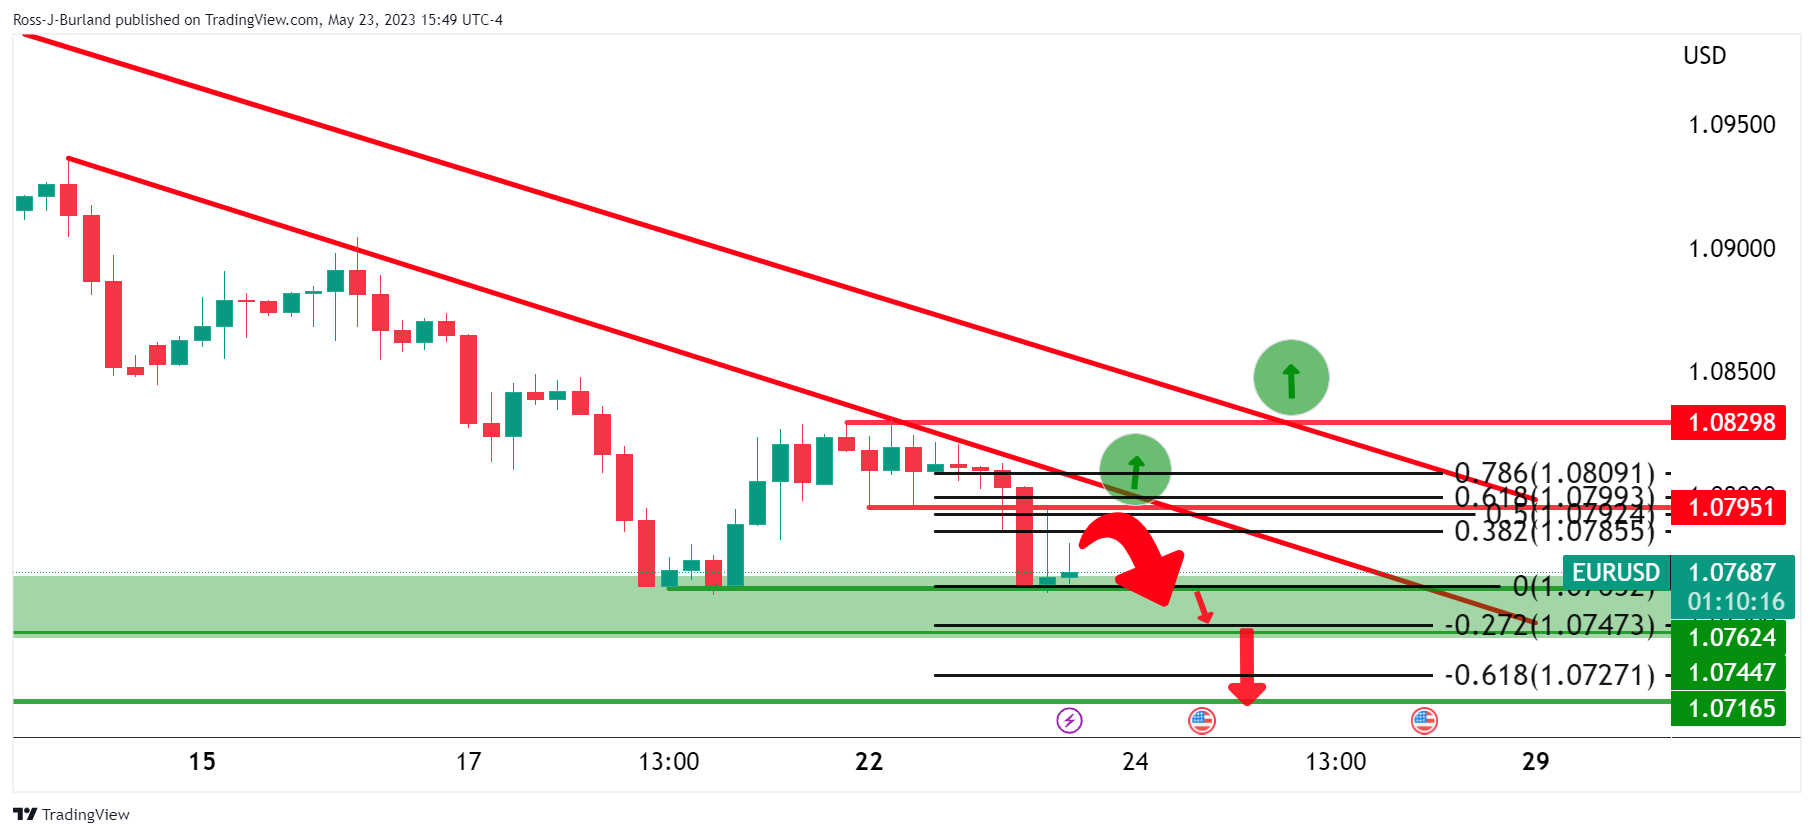
A 50% mean reversion aligns with the trendline resistance near 1.0790. If bears commit, then we could see a move to test the depths of the 1.07s as illustrated above.
- The USD/ZAR is correcting lower after hitting record highs last week.
- The US Dollar rises on Tuesday across the board amid risk aversion, limiting the downside in the pair.
- Key events ahead: South African inflation, FOMC minutes and SARB interest rate decision.
Despite a prevailing negative market outlook and a stronger US Dollar, the South African Rand (ZAR) has exhibited resilience by maintaining its position, supported by expectations of interest rate hikes by the South African Central Bank. The USD/ZAR pair declined to 19.16, reaching its lowest level since the previous Wednesday, before bouncing back to 19.20.
US economic data showed mixed results
The US S&P Global/CIPS Manufacturing Purchasing Managers' Index (PMI) unexpectedly contracted in May, dropping to 48.5, while market expectations were for a reading of 50. Conversely, the Services index surpassed predictions, rising to 55.1 compared to the anticipated 52.6.
The S&P 500 index (SPX) and the Nasdaq Composite both closed with declines of over 1%. The risk aversion sentiment bolstered the US Dollar, leading to a 0.30% climb in the DXY as it tested weekly highs.
South Africa: inflation data and SARB
On Wednesday, inflation data will be released in South Africa. Market consensus is for a modest slide in the annual inflation rate from 7.1% to 7.0% and the Core Consumer Price Index to rise from 5.2% to 5.3%.
The South African Reserve Bank (SARB) will announce its monetary policy decision on Thursday. There is an expectation of a 25 basis points rate hike, raising the interest rate from 7.75% to 8.00%. However, there are also risks of a larger rate increase, which has supported the Rand.
USD/ZAR outlook
After surging to 19.51 on Friday, the USD/ZAR started to correct lower. The correction found support above 19.15. On the 4-hour chart, the pair remains below a bearish 20-period Simple Moving Average, currently at 19.30. If it rises above this level, it could potentially test 19.50 again.
On the flip side, below Tuesday's low at 19.15, the next support level is seen at 19.10, followed by 18.99 (May 15, 16 low).
Technical levels
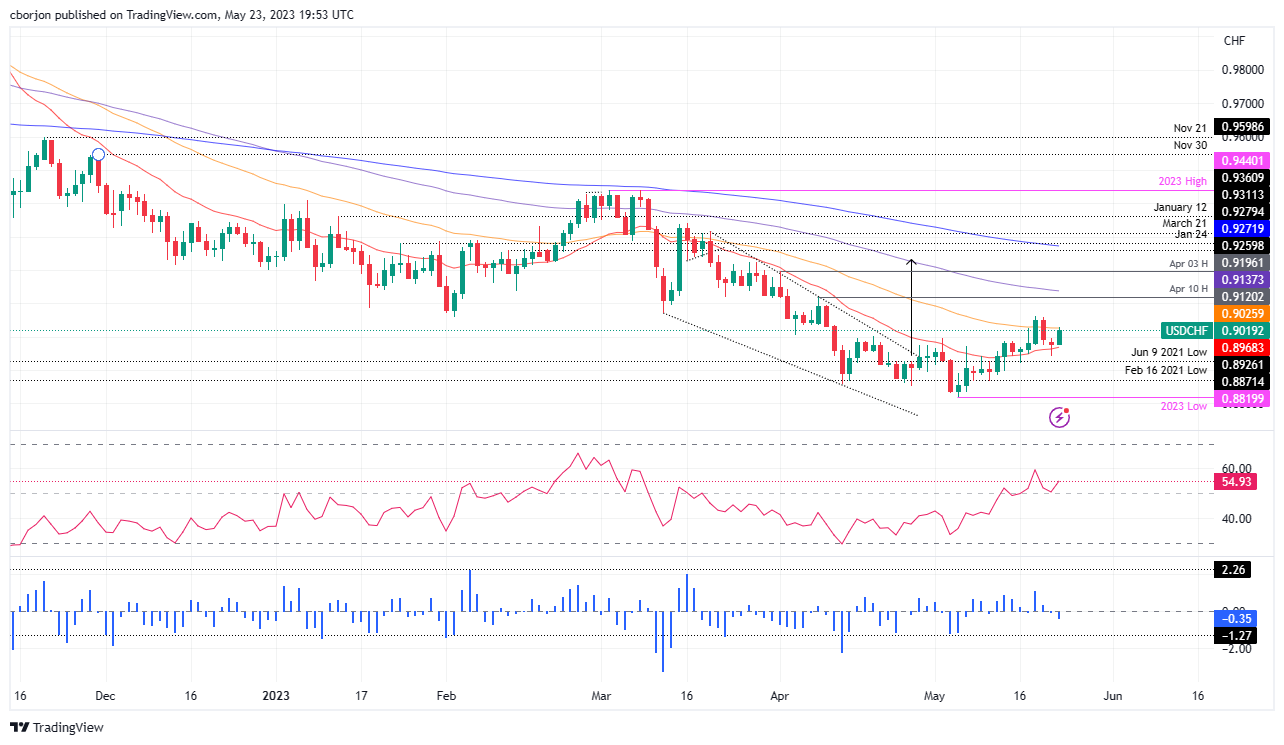
- USD/CHF pair surges past the 0.9000 figure, aiming for a 50-day EMA test at 0.9025 after printing a bullish hammer on the daily chart, turning bias to neutral upwards.
- USD/CHF rally could challenge the 100-day EMA at 0.9137 if the 50-day EMA is breached, setting sights on the April 3 daily high of 0.9196.
- Despite a neutral 3-day RoC, RSI indicates a bullish turn, suggesting USD/CHF bulls are gathering momentum.
USD/CHF climbs above the 0.9000 figure, eyeing a 50-day Exponential Moving Average (EMA) test at 0.9025 after printing a bullish hammer in the daily chart. The USD/CHF is trading at 0.9015, after hitting a daily low of 0.8975, trades above its opening price by 0.42%.
USD/CHF Price Analysis: Technical outlook
The USD/CHF pair is neutral to downward biased unless it claims the 50-day EMA at 0.9025, which would turn the bias to neutral upwards. It should be said the USD/CHF printed a new daily high, above the May 2 high of 0.8995, opening the door for further upside. If USD/CHF cracks the 50-day EMA, the pair will test last week's high of 0.9063 before rallying toward the 0.9100 mark. That would further cement a bullish bias, with the USD/CHF about to challenge the 100-day EMA at 0.9137, on its way to the April 3 daily high of 0.9196.
Notably, the Relative Strength Index (RSI) indicator turned bullish and just bounced off the 50-midline, a sign of USD/CHF bulls gathering momentum; while the 3-day Rate of Change (RoC) remains neutrally biased.
Therefore, the USD/CHF trend would likely continue upward. On the downside, the USD/CHF's first support would be the 0.9000 figure, which, once cleared, the pair would dip to the 20-day EMA At 0.8968.
USD/CHF Price Action – Daily chart
- USD/CAD bulls are giving way to the bears.
- USD/CAD bears are breaking the trendline support.
USD/CAD has ranged between a low of 1.3484 and a high of 1.3548 on the day. The bears are in the market and attempting to break down the bullish trend that has been building since the start of May. The following illustrates two scenarios, bullish and bearish, on the hourly chart.
USD/CAD H1 charts
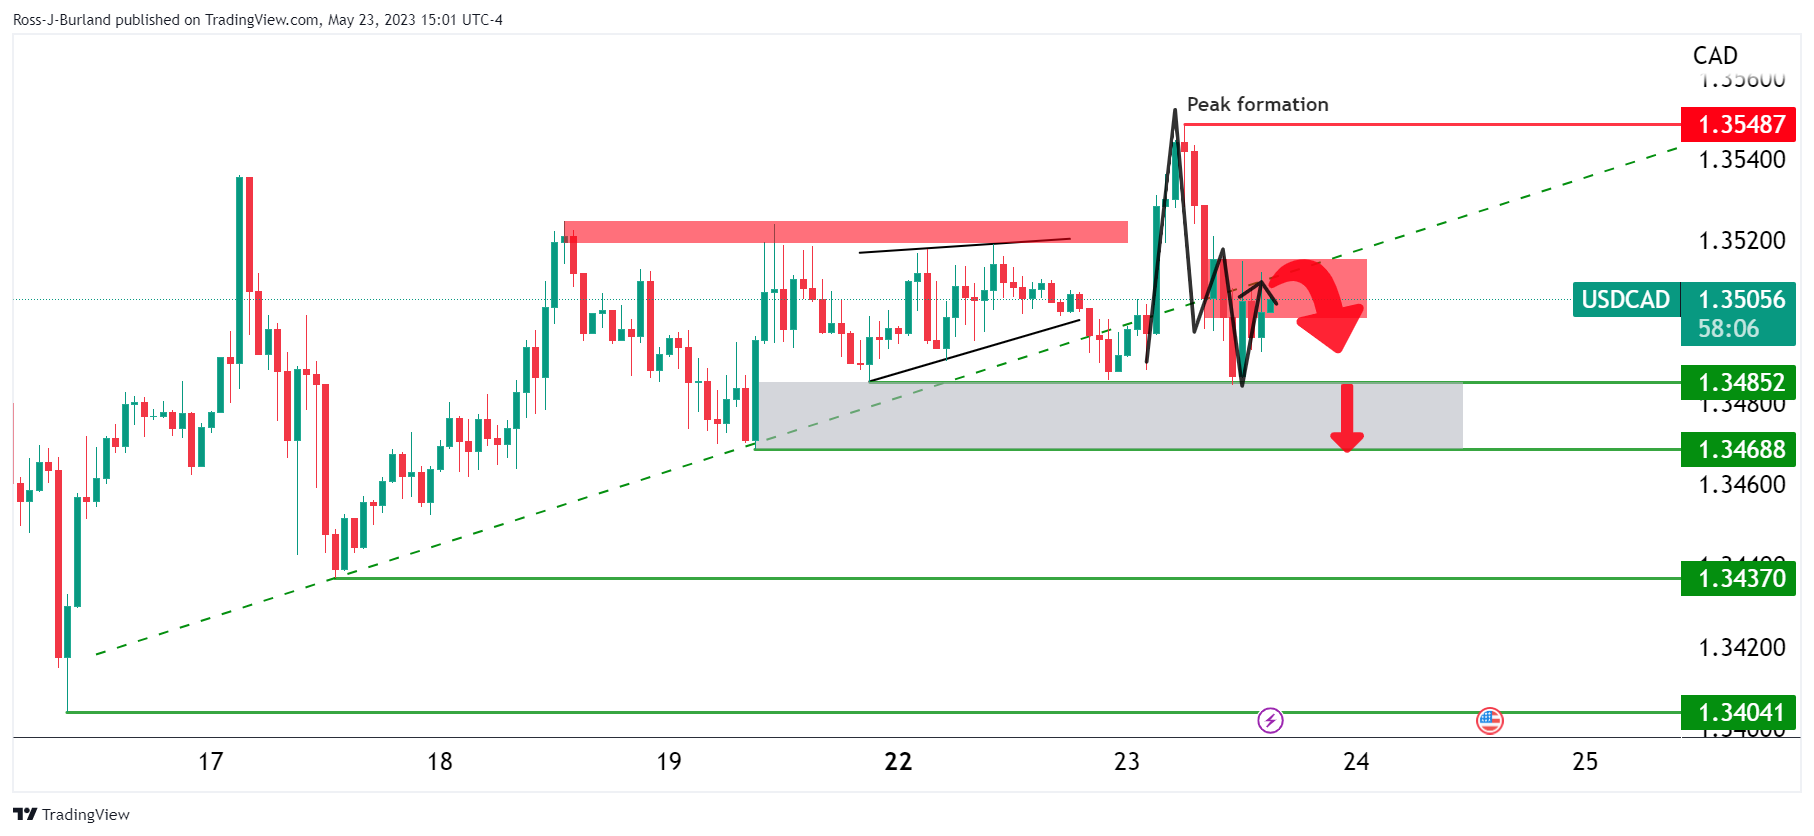
The bullish scenario above sees the price testing counter-trendline resistance and the M-formation´s neckline. If the bears engage fully, then we could see the makings of a downside continuation into the 1.3470s.
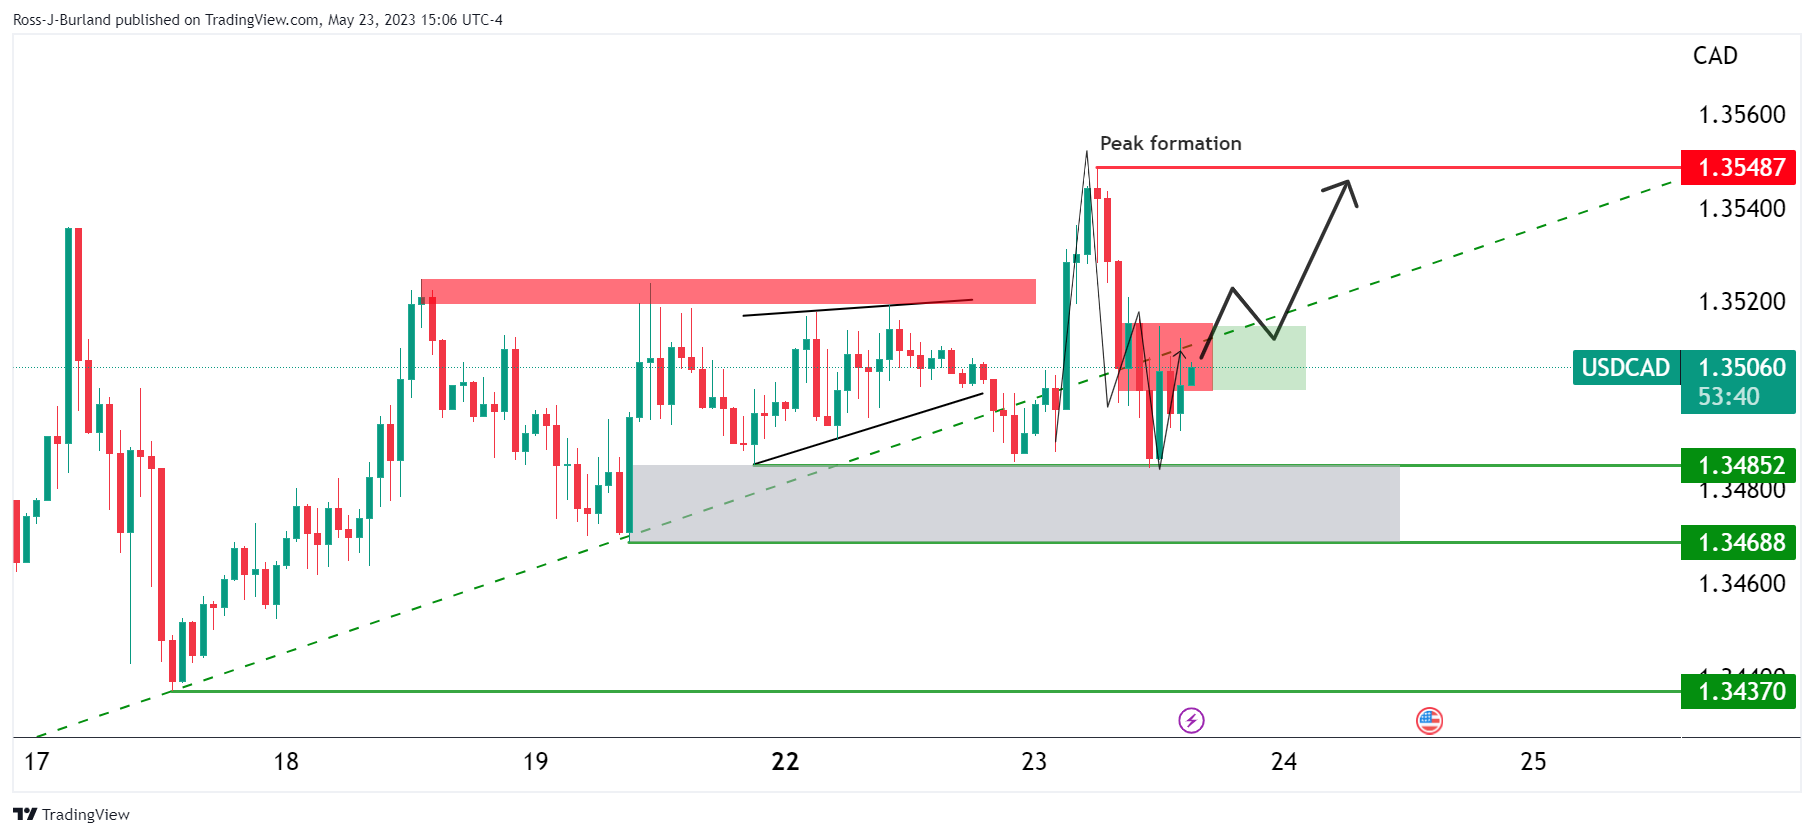
A bullish scenario would see a break of the resistance and move into the shorts from the peak formation, moving back onto the front side of the bullish trendline.
- USD/MXN reaches a three-week high amid actions by the Mexican Government, stirring uncertainty in the business community and resulting in outflows from the Mexican Peso.
- Despite positive talks between President Biden and House Speaker McCarthy, US debt-ceiling agreement remains elusive, casting a shadow over US economic data and causing a downturn in US equities.
- Mexico’s recent nationalization actions generated concerns among the business community and negatively impacted USD/MXN recovery.
USD/MXN reached a new three-week high at the brisk of the psychological 18.0000 barrier, at around 17.9976, sponsored by several factors. Firstly, the discussion of the US debt ceiling keeps investors on their toes, spurring a flight to a safe haven. Also, uncertainty in the business community in Mexico, as the Government commenced to seize private lands and railroads, triggered outflows from the emerging market currency. At the time of writing, the USD/MXN is trading at 17.9489, up 0.34%.
Flight to safety bolstered the USD/MXN, as US bond yield rise, Mexico’s Government actions stirred uncertainty amongst the national and international business community
US equities continued to trend downward as the US debt-ceiling discussions have overshadowed US economic data. The prevailing concern over raising the national debt ceiling has cast a long shadow over other discussions, despite positive assertions by US President Joe Biden and House Speaker Kevin McCarthy that their Monday talks were fruitful. However, the path to a definitive agreement still seems winding and far off.
Reflections of the uncertain political environment in the US are underpinning the US Dollar (USD) as yields on US Treasury bonds continue to climb, with the 10-year bond yield hitting 3.726%. This creates an adverse environment for the recovery of USD/MXN, which remains under pressure amidst domestic issues in Mexico.
Over the weekend, news headlines said that the Mexican Government headed by President Andres Manuel Lopez Obrador, known as AMLO, “nationalized” a section of track in the state of Veracruz, operated by Grupo Mexico, a private company. That weighed on the company’s stock, as its main shareholder German Larrea, one of the bidders for Citigroup’s retail branch in Mexico, said that he would withdraw from the bid, saying that “I’m not going to pay 7,000 million dollars for something they can take away from me tomorrow,” according to a Tweet from Dario Celis, a Mexican reporter from El Financiero.
In the meantime, on Monday, AMLO expropriated privately-owned land in the state of Mexico to build a commuter train three days after the seizure of a part of a rail line owned by German Larrea’s Grupo Mexico. AMLO’s recent decisions are generating worries amongst the business community in Mexico, as AMLO is contradicting campaign promises that he would not expropriate private property.
Given the backdrop, the USD/MXN had weakened more than 3% since last Tuesday, when the pair printed a new multi-year low of 17.4038. The USD/MXN, on its rally, reclaimed the 20-day EMA at 17.8007 and is closing to challenge the 18.0000 psychological figure.
Turning to the data front in the United States, final readings for S&P Global PMIs for May are of particular interest. A surprising dip in the Manufacturing Index to 48.5, contrary to estimates and the previous reading of over 50, is offset by a rise in the Services Index to 55.1. The Composite Index landed at 54.5, and the surge in services slowed its advance.
US New Home Sales have soared to a level unseen in 13 months. With a 4.1% rise or 683K units in April, it marked the most substantial figure since March of the previous year, as the US Commerce Department reported.
Aside from this, USD/MXN traders will remain focused on upcoming events, like the Mid-month inflation report from Mexico, with core CPI estimated to ease from 7.75% YoY May 2022 to 7.49%, as projected by analysts. Regarding the US, the minutes of the May meeting of the Federal Reserve (Fed) will be revealed.
USD/MXN Price Analysis: Technical outlook
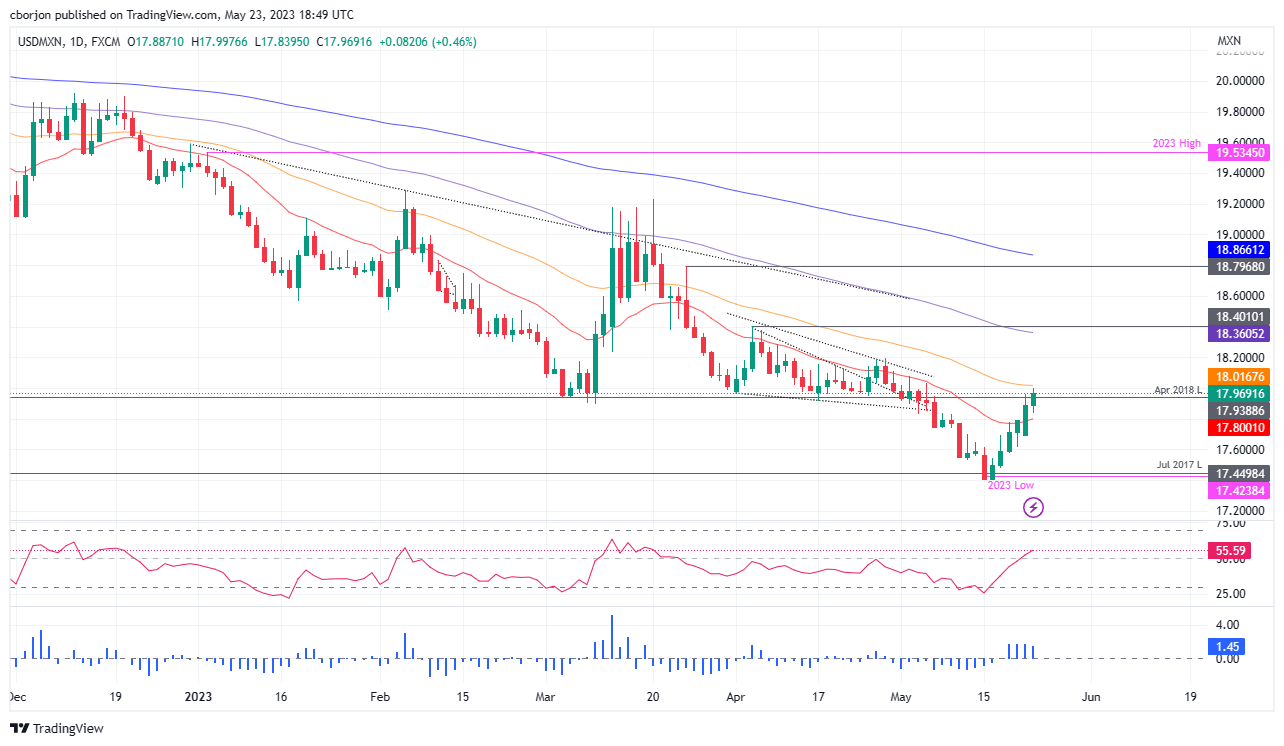
USD/MXN has shifted neutrally biased, as the Mexican Peso (MXN) has weakened for six days in a row. Upside risks lie at the 50-day EMA at 18.0167, a tick above the psychological 18.0000 figure; once cleared, that would open the way for further gains. The USD/MXN first resistance level would be the April 27 high at 18.1968, followed by the confluence of April 5 and the 100-day EMA at around the 18.3604-18.4010 area. Conversely, if USD/MXN drops below 17.7994, where the 20-day EMA lies, a re-test of the YTD low of 17.4038 is on the cards.
- USD/JPY is in the hands of the bears that eye a break of trendline support.
- Below trendline support, the 138.20s and then the 137.70s will be exposed.
USD/JPY touched a six-month high of 139 in the Asian session on Tuesday whereby talks over a debt-ceiling deal in the US risk running into a brick wall while investors get set for key economic events this week. At the time of writing, USD/JPY is flat at 0% with the price traveling between 138.23 and a high of 138.91.
Global equities slid on Tuesday as talks over the US debt ceiling continued without resolution. We also have yields on one-month US Treasury bills running into a record high. Rising yields and a stronger US Dollar pressured the Yen that has been pressured by the Bank of Japan's ongoing reluctance to tighten monetary policy further.
Meanwhile, President Joe Biden and House Speaker Kevin McCarthy could not reach an agreement on Monday over the debt ceiling with just 10 days before a possible default. President Biden prefers a clean raise of the debt limit, one without cuts. Republicans want to cut spending now.
On the preferred approach to raising the debt ceiling, three-quarters of Democrats want the limit raised first without cuts. On the other hand, two-thirds of Republicans said they want cuts tied to it. Independents were split, but a slight plurality – 48% to 45% – said they want to see cuts. Nevertheless, both sides stressed the need to avoid default with a bipartisan deal and said they would continue to talk.
As for the Federal Reserve, on Wednesday, the Federal Reserve Open Market Committee will publish its minutes from the central bankers’ meeting three weeks ago. The market will expect that the Fed has dropped hints over the timeline of rate increases.
Just this week, Minneapolis Federal Reserve President Neel Kashkari said on Monday that it was a "close call" as to whether he would vote to hike again or pause at next month's meeting, and St. Louis Fed President James Bullard said another 50 basis points of hikes might be required. Consequently, there are fewer expectations for US rate cuts from July towards November or December, sending ten-year and two-year US yields to highs not seen since March and weighing on the Yen. Besides the minutes, the Fed’s preferred inflation measure, personal-consumption expenditure index (PCE) will also be released on Friday where markets are expècting a 4.6% year-over-year increase, while the Fed is looking to bring that figure below its target of 2%.
USDJPY H1 chart
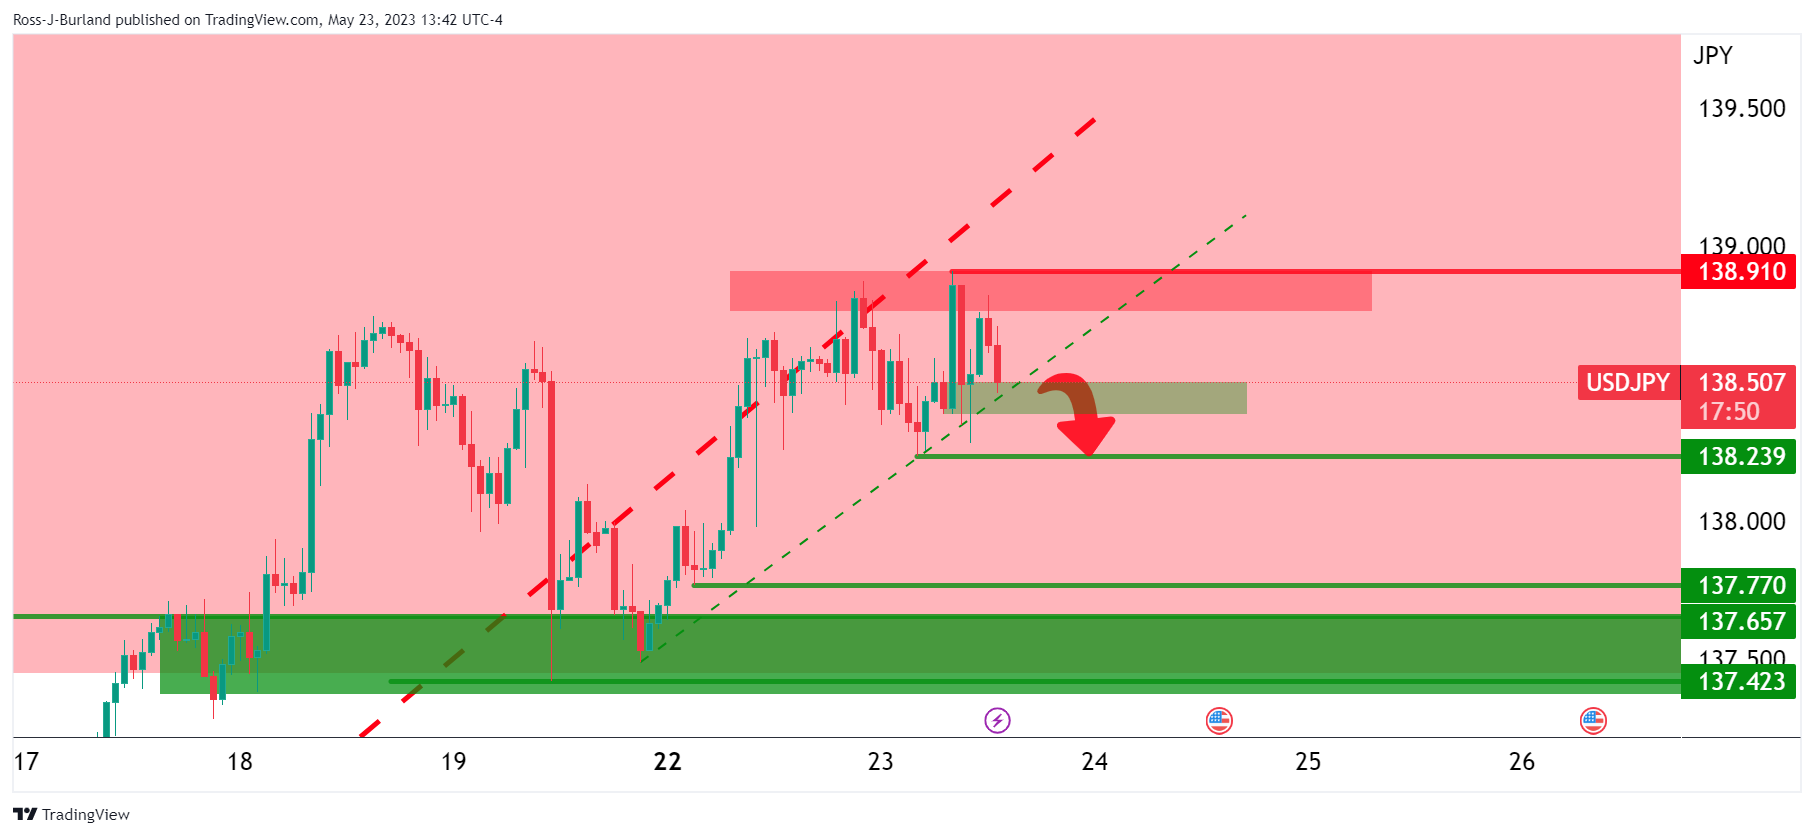
USD/JPY is testing the trendline support that guards the 138.20s and then the 137.70s.
- GBP/USD fell further due to uncertainty surrounding US debt-ceiling negotiations and mixed US economic data, with investors flocking to the perceived safety of the US Dollar.
- Despite discussions between President Biden and House Speaker McCarthy, US debt-ceiling deadlock persists; Treasury Secretary Yellen warns of cash crunch by June 1.
- Final readings of the S&P Global PMIs for May reveal contrasting trends; New Home Sales record a 13-month high despite a gloomy sentiment on Wall Street.
GBP/USD drops extending its losses past the 20-day Exponential Moving Average (EMA), as a risk-off impulse triggered a flight to safety, favoring the US Dollar (USD) to the detriment of the Pound Sterling (GBP). Uncertainty about the debt-ceiling negotiations in the United States (US), and mixed US economic data bolstered the US Dollar. The GBP/USD is trading at 1.2414, below its opening price by almost 0.20%.
GBP/USD dips below 20-day EMA amid US debt-ceiling disarray, mixed data, and risk-off impulse
The prevailing mood on Wall Street is decidedly gloomy as stocks tread downward. Ongoing debates concerning the increase of the US debt ceiling are eclipsing the latest economic figures from the United States. Even though President Joe Biden and House Speaker Kevin McCarthy declared their Monday discussions productive, they are yet to resolve. Meanwhile, Treasury Secretary Janet Yellen emphasizes the imminent cash crunch in the US, anticipated by June 1.
Amid these circumstances, yields on US Treasury bonds have seen an uptick. The yield on the 10-year bond has risen to 3.726%, bolstering the greenback. The US Dollar Index (DXY), a gauge of the buck’s value against a basket of six currencies, advances 0.33%, up at 103.564.
On the data front, the final readings of the S&P Global PMIs for May were revealed. The Manufacturing Index took a steep fall, hitting 48.5, disappointing forecasts, and falling short of the previous reading above 50. In contrast, the Services Index climbed to 55.1. Consequently, the Composite Index settled at 54.5, pulled up by the buoyant services sector.
New Home Sales have soared to their highest level in 13 months, having grown by 4.1% or 683K units in April. According to the US Commerce Department, this is the most significant increase recorded since March 2022. Given these indications of a revival in the US housing market, Federal Reserve (Fed) officials’ divergent views on adjusting or maintaining rates at the forthcoming June meeting will be interesting.
Recently, there has been a steep drop in the Richmond Fed’s Manufacturing and Services Index readings. Manufacturing is currently at -15, lower than the predicted -8, whereas Services have shown some improvement, increasing to -10 from April’s -29.
Across the pond, the United Kingdom (UK) calendar featured the S&P Global PMIs for May, which showed that business activity came beneath expectations, weighing on the GBP/USD, sending the Sterling towards a new one-month low of 1.2373. That happened despite the International Monetary Fund (IMF) improving the economic outlook of the UK, saying that it no longer expects a recession in the country.
Bank of England (BoE) policymakers led by Governor Andrew Baily appeared before the parliament. Bailey said that “I can’t tell you whether we’re near to the peak, I can’t tell you whether we are at the peak. I think we are nearer to the peak than we were,” as GBP/USD traders brace for Wednesday’s release of the UK’s Consumer Price Index (CPI).
GBP/USD Price Analysis: Technical outlook
After dropping to a fresh one-month low of 1.2373, Cable has recovered some ground above the 1.2400 figure, claiming on its way north of the 50-day Exponential Moving Average (EMA) at 1.2408. Nevertheless, the GBP/USD failed to rally toward the 20-day EMA at 1.2478, exposing the pair to sellers. The Relative Strength Index (RSI) indicator shifted bearish, suggesting that further downward action is expected. A breach below the 50-day EMA will pave the way to 1.2400. Once broken, the GBP/USD can fall toward the 1.2300 figure before testing the 100-day EMA At 1.2291. Conversely, if GBP/USD rallies past the 20-day EMA, it could challenge the 1.2500 figure.
- Gold price dips slightly as uncertainty around US debt-ceiling discussions causes US Treasury bond yields to rise, negatively impacting XAU/USD’s recovery.
- Despite productive talks between President Biden and House Speaker Kevin McCarthy, an agreement on raising the debt ceiling is yet to be reached.
- US is set to run out of cash by June 1, according to Treasury Secretary Yellen.
Gold price is trimming some of its earlier losses, though stills trading negative in the day, down 0.06%, as US Treasury bond yields rise due to uncertainty around US debt-ceiling discussions. Hence, US Treasury bond yields rise, underpinning the US Dollar (USD), a headwind for XAU/USD’s prices. At the time of writing, the XAU/USD is trading at $1968.28, below its opening price.
US Treasury bond yields rise amid tense debt-ceiling discussions, dampening XAU/USD’s recovery
Wall Street portrays a sour sentiment, with equities trading lower. The economic data revealed in the United States (US) is overshadowed by discussions about raising the debt ceiling in the US. Although US President Joe Biden and US House Speaker Kevin McCarthy called Monday’s talks productive, an agreement remains far from being done. In the meantime, US Treasury Secretary Janet Yellen continued to pressure that the US will run out of cash by June 1.
Given the backdrop, US Treasury bond yields extended its gains, with the 10-year bond yielding 3.726%, a headwind for XAU/USD’s recovery. Therefore, US real yields, calculated using the nominal yield minus inflation expectations, taken from Treasury Inflation-Protected Securities (TIPS), sit at 1.49%, about to cross above 1.50%.
Data-wise, the US economic agenda features S&P Global PMIs for May on their final readings. The Manufacturing Index plunged to 48.5 below estimates and the prior reading above 50, while the Services Index rose to 55.1. The Composite Index stood at 54.5, dragged by the rise in services.
US New Home Sales rose to a 13-month high, expanded by 4.1% or 683K units in April, the highest figure reported since March 2022, according to the US Commerce Department. Given that housing data from the United States showed signs of a recovery, it should be interesting to hear from US Federal Reserve (Fed) officials, who remain split between skipping or lifting rates at the upcoming June meeting.
Recently, Richmond’s Fed Index for Manufacturing and Services readings dropped sharply, with manufacturing at -15 vs. -8 expected. Services improved to -10 from -29 in April.
Upcoming events
The US Federal Reserve Open Market Committee (FOMC) May minutes on Wednesday, followed by Initial Jobless Claims, Gross Domestic Product (GDP) on Thursday, and inflation and consumer sentiment on Friday.
XAU/USD Price Analysis: Technical outlook
From a daily chart perspective, the XAU/USD is still neutral to upward biased. The yellow metal dip below the 50-day Exponential Moving Average (EMA) at $1976.52, opening the door to register a weekly low of $S1954.37 before finding bids that lifted Gold toward the current spot price. Nevertheless, the Relative Strength Index (RSI) indicator is still in bearish territory, suggesting that sellers remain in charge, so the jump in XAU/USD price, could pave the way for better entry prices. The first support would be the weekly low of $1954.37 before testing $1950, ahead of reaching the 100-day EMA of 1932.97. Conversely, reclaiming the 50-day EMA will expose the 20-day EMA At $1993.31 before reaching $2000.
Gold price slumped significantly last week. However, the growing risk of a US default is set to underpin the yellow metal, economists at Commerzbank report.
Both the Fed and the SNB would have considerable scope to lower interest rates in the event of a crisis
“Gold price is likely to profit more than any other investments if the US defaults. After all, one reason why Gold is suitable as a safe haven is the fact that it does not yield any interest itself and thus suffers no disadvantage in an environment in which monetary policy will in all likelihood be loosened and yields will fall accordingly. This gives Gold an advantage over other conventional safe havens such as the US Dollar, the Swiss Franc and the Japanese Yen – especially just now.”
“Both the Fed and the Swiss National Bank, following their recent rate hikes, would have considerable scope to lower interest rates in the event of a crisis – such as that which a US default could trigger.”
“The Bank of Japan, which was one of the few central banks to tighten its monetary policy hardly at all in response to the significantly increased inflation and is therefore still pursuing an ultra-expansionary monetary policy, is not very likely to loosen its monetary policy any further, however, it cannot be ruled out entirely either, which tends to put the Yen too at a disadvantage as compared to Gold, albeit to a lesser extent than the Dollar and the Franc.”
“I need you all to hang with me on the debt limit, we are nowhere near a deal yet,” US House Speaker Kevin McCarthy told House Republicans during a closed GOP meeting on Tuesday, Punchbowl News reporter Jake Sherman tweeted out.
On a similar note, Republican debt ceiling negotiator Garret Graves reportedly said that things were not going well over debt-ceiling talks.
Market reaction
Markets remain cautious following these headlines. As of writing, the S&P 500 Index was down 0.35% on a daily basis.
- New Home Sales in the US continued to rise in April.
- US Dollar Index stays in positive territory above 103.00.
Sales of new single‐family houses rose 4.1% in April to a seasonally adjusted annual rate of 683,000, the data published jointly by the US Census Bureau and the Department of Housing and Urban Development showed on Tuesday.
This reading followed the 4% growth (revised from +9.6%) recorded in March and came in slightly better than the market expectation for an increase of 3.3%.
Market reaction
The US Dollar Index showed no reaction to this report and was last seen rising 0.2% on the day at 103.43.
Expectations of global economic stagnation could boost the US Dollar, according to economists at Crédit Agricole.
US debt-ceiling resolution could result in the USD rising further
“Global economic stagnation, even a potential recession, might be the dominant narrative for the rest of 2023 given recent disappointing economic data and the uncertain US economic outlook due to monetary and credit tightening, as well as debt ceiling fears. This backdrop, coupled with a sluggish recovery in China, and cyclical headwinds keeping commodity prices in check, has led many FX clients to prepare for stagnation or a downturn. Historically, such periods often lead to underperformance in pro-cyclical currencies (like those of commodity and manufacturing exporters) and better performance of safe-haven currencies like the USD.”
“The USD has already seen gains due to increasing hopes that a debt ceiling crisis will be averted ahead of the 1st June soft X-date. A resolution could result in the USD rising further, especially against G10 smaller currencies, in line with past debt ceiling episodes. This could occur due to a potential ramp-up in US Treasury issuance and the paring back of Fed rate cut expectations in the rates markets, boosting the rate appeal of the USD.”
Economists at Rabobank discuss AUD/NZD outlook ahead of the Reserve Bank of New Zealand (RBNZ) meeting.
AUD/NZD to turn higher over the medium-term
“Hawkish commentary from the RBNZ this week could encourage a move in the AUD/NZD pair towards the 1.05 area near-term. That said, we favour Australia’s fundamentals over those of New Zealand and expect AUD/NZD to turn higher over the medium-term.”
“We maintain our 12-month forecast of AUD/NZD 1.13.”
See – Reserve Bank of New Zealand: Banks Preview, more surprises in store?
UK inflation will be in focus this week and MUFG Bank’s GBP bias has turned more neutral too given scope for lower inflation than the BoE expects.
UK inflation should now start offering BoE scope for pause
“The OIS market indicates two 25 bps hikes remain nearly fully priced. Our view is for only one further hike suggesting scope for yields to adjust lower.”
“We have held a bullish GBP bias since the start of the year but with inflation potentially now about to start undershooting BoE forecasts, our bias is now turning more neutral. The BoE may turn to faster balance sheet shrinkage as an offset as they move to a pause on lifting rates.”
“GBP direction will continue to be dictated by policy divergence expectations and that could see GBP/USD underperforming further over the short-term.”
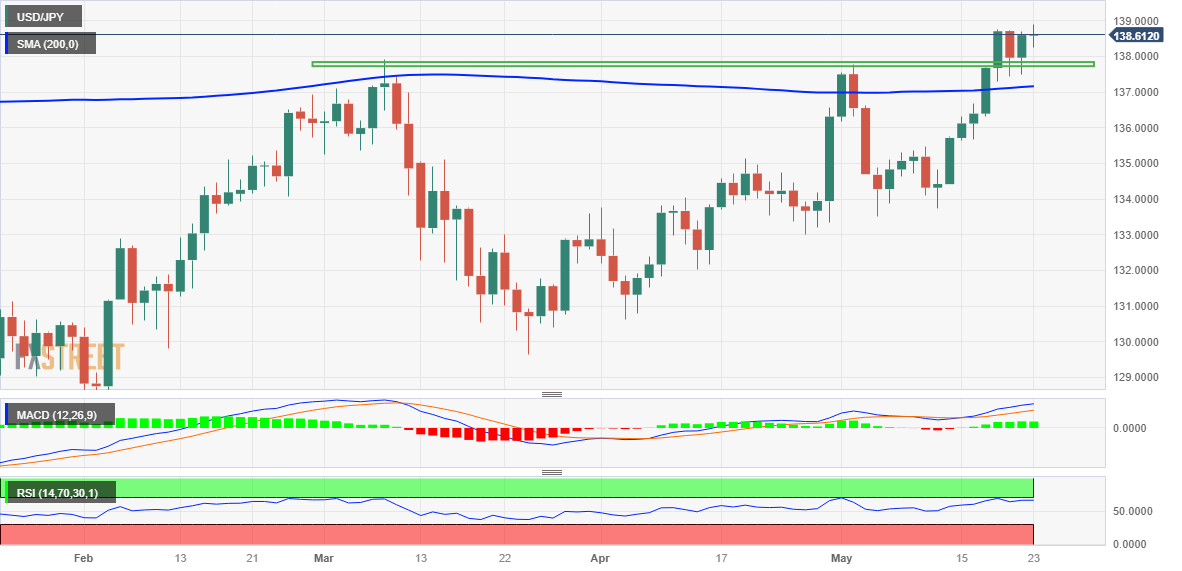
- USD/JPY remains confined in a range just below a fresh YTD peak touched this Tuesday.
- The fundamental/technical backdrop favours bulls and supports prospects for further gains.
- Any meaningful slide is likely to get bought into and remain limited near the 200-day SMA.
The USD/JPY pair consolidates its recent strong gains to the 139.00 neighbourhood, or a fresh YTD peak touched this Tuesday and seesaws between tepid gains/minor losses through the early North American session. The pair is currently placed just below mid-138.00s, down less than 0.15% for the day, though any meaningful retracement slide still seems elusive.
A combination of supporting factors pushes the US Dollar (USD) to a fresh two-months, which, in turn, is seen acting as a tailwind for the USD/JPY pair. The overnight hawkish remarks by a slew of Federal Reserve (Fed) officials reaffirmed expectations that the US central bank will keep interest rates higher for longer. This, along with hopes that US politicians can come together on a debt ceiling deal, remains supportive of elevated US Treasury bond yields and continues to benefit the Greenback.
A further rise in the US bond yields, meanwhile, widens the US-Japan rate differential and drives flow away from the Japanese Yen (JPY). Apart from this, a more dovish stance adopted by the Bank of Japan (BoJ) undermines the JPY and adds credence to the near-term positive outlook for the USD/JPY pair. That said, a softer risk tone - amid worries about slowing global economic growth - lends some support to the safe-haven JPY and keeps a lid on any further gains for the USD/JPY pair.
Even from a technical perspective, the recent breakout through the very important 200-day Simple Moving Average (SMA) and a subsequent move beyond the previous YTD peak favour bullish traders. The constructive setup is reinforced by the fact that oscillators on the daily chart are holding in the positive territory and are still far from being in the overbought zone. This, in turn, suggests that the path of least resistance for the USD/JPY pair is to the upside and any downtick is likely to get bought into.
Spot prices seem poised to surpass the 139.00 round-figure mark and test the next relevant hurdle near the 139.55-139.60 region. The upward trajectory could get extended further and allow the USD/JPY pair to reclaim the 140.00 psychological mark for the first time since November 2022.
On the flip side, the 138.00 round figure is likely to protect the immediate downside ahead of the 137.55-137.50 horizontal resistance breakpoint. Any further decline is likely to attract fresh buyers and remain limited near the 137.00 mark. The said handle coincides with the 200-day SMA and should act as a strong base for the USD/JPY pair. A convincing break below might prompt some technical selling and pave the way for some meaningful near-term corrective decline.
USD/JPY daily chart
Key levels to watch
- EUR/USD accelerates losses and revisits monthly lows near 1.0760.
- US debt ceiling talks continue to drive the mood among traders.
- US flash PMIs also came mixed for the current month.
EUR/USD loses further ground and slips back to the area of monthly lows around 1.0760 on Tuesday.
EUR/USD pokes with May lows near 1.0760
EUR/USD maintains its bearish tone on Tuesday, seeing its decline accelerate to the 1.0760 area as the dollar continues to face upward pressure, while unease over the US debt ceiling continues to weigh on sentiment.
Meanwhile, talks over the US debt ceiling are expected to continue to drive sentiment in global markets in the near term, while speculation of further rate hikes by the ECB at its June and July meetings, and likely in September, continues to grow.
In the US, advanced Manufacturing PMI is seen deflating to 48.5 in May and the Services PMI is expected to improve to 55.1.
Later in the session, US New Home Sales are also due.
What to look for around EUR
EUR/USD loses the grip and flirts with the monthly lows around 1.0760 on Tuesday.
The movement of the euro's value is expected to closely mirror the behaviour of the US Dollar and will likely be impacted by any differences in approach between the Fed and the ECB with regards to their plans for adjusting interest rates.
Moving forward, hawkish ECB-speak continue to favour further rate hikes, although this view appears in contrast to some loss of momentum in economic fundamentals in the region.
Key events in the euro area this week: Germany, EMU Advanced Manufacturing/Services PMI (Tuesday) – Germany IFO Business Climate (Wednesday) – Germany Final Q1 GDP Growth Rate, GfK Consumer Confidence (Thursday) – Italy, France Consumer Confidence (Friday).
Eminent issues on the back boiler: Continuation of the ECB hiking cycle in June and July (and September?). Impact of the Russia-Ukraine war on the growth prospects and inflation outlook in the region. Risks of inflation becoming entrenched.
EUR/USD levels to watch
So far, the pair is losing 0.31% at 1.0778 and faces immediate contention at 1.0759 (monthly low May 19) seconded by 1.0712 (low March 24) and finally 1.0516 (low March 15). On the upside, a break above 1.0872 (55-day SMA) would target 1.1000 (round level) en route to 1.1095 (2023 high April 26).
- US S&P Global Manufacturing PMI dropped below 50 in May.
- US Dollar Index clings to modest daily gains near 103.50.
The business activity in the US private sector expanded at a strengthening pace in early May with the S&P Global's Composite PMI rising to 54.5 from 53.4 in April.
In the same period, S&P Global Manufacturing PMI declined to 48.5 from 50.2, revealing a contraction in the manufacturing sector's activity. On the other hand, the Services PMI rose to 55.1 from 53.6, surpassing the market expectation of 52.6.
Commenting on the data, “the US economic expansion gathered further momentum in May, but an increasing dichotomy is evident," said Chris Williamson, Chief Business Economist at S&P Global Market Intelligence."
"While service sector companies are enjoying a surge in post-pandemic demand, especially for travel and leisure, manufacturers are struggling with over-filled warehouses and a dearth of new orders as spending is diverted from goods to services," Williamson added. “Jobs growth has accelerated as service providers companies seek to meet demand, but this tightening labour market amid strong demand will be a concern as a fuel of further inflationary pressures.”
Market reaction
These data don't seem to be having a noticeable impact on the US Dollar's performance against its major rivals. As of writing, the US Dollar Index was up 0.25% on the day at 103.50.
The Reserve Bank of New Zealand (RBNZ) will announce its monetary policy decision on Wednesday, May 24 at 02:00 GMT and as we get closer to the release time, here are the expectations as forecast by the economists and researchers of six major banks.
The RBNZ is expected to raise the key Official Cash Rate (OCR) by 25 basis points (bps) in May. All eyes remain on the updated projection for OCR peak and Governor Orr’s presser.
ANZ
“We expect the RBNZ will raise the OCR 25 bps to 5.50%. We see a 20% chance of a 50 bps hike and a 5% chance of a pause. Either could backfire by driving down future OCR expectations. We are building one more 25 bps hike in July into our own OCR forecast, which would take the OCR to 5.75%. The (relatively) happy place to sit and ‘watch, worry and wait’ keeps inching just out of reach. We expect a relatively firm tone from the RBNZ, but also words that leave all doors open depending on how the data evolves from here, which could be up, down or sideways relative to their expectations.”
TDS
“We lift our estimate of RBNZ terminal from 5.50% to 6% and expect the Bank to deliver a 50 bps hike this week. The RBNZ's net migration forecasts and fiscal stimulus assumptions will likely be revised higher. Both add upside risks to domestic inflation. There is also no evidence that offshore Central Banks are making progress on bringing down core inflation. However, the risk to our 50 bps call is the Bank viewing monetary policy as sufficiently restrictive. Given monetary policy is contractionary, the Bank may opt for a 25 bps hike.”
Danske Bank
“We expect the RBNZ to hike the cash rate by 25 bps to 5.50%.”
ING
“Markets are pricing in a peak at around 5.80%, but we think the RBNZ can deliver an extra bit of hawkishness and signal tightening until the 6.00% mark as it hikes by 25 bps this week. That would have positive implications for NZD in the near term.”
Citi
“The RBNZ is expected to increase the OCR by 25 bps. The step down to 25 bps is largely expected on the back of a slowdown in domestic activity, yet inflation still remains higher than the central bank’s target. The recent deceleration in inflation expectations would also help steer the hawkish RBNZ towards a lower quantum of rate hikes. We expect this to be the last rate hike the Bank delivers, which is also in-line with the Bank’s guidance. However, given the NZ Budget last week and substantial amount of rebuilding expected in H2’23, there are hawkish risks which could see the RBNZ continue to signal more rate hikes could be needed. Forecasts in the MPS are unlikely to change materially, although there might be some upgrade to growth estimates in H2 because of reconstruction post-Cyclone. The RBNZ though, is likely to continue to suggest that inflation risks remain skewed to the upside and is unlikely to turn dovish anytime soon with rate cuts also unlikely in 2023.”
Wells Fargo
“We fully expect the RBNZ to hike rates 25 bps. Moreover, while we believe that will be the peak for the current cycle, we will be scrutinizing the central bank's updated economic projections for any insight into whether policy rates might still need to be raised further.”
Lower volatility is favouring the carry trade, where currencies in Latin America and Central and Eastern Europe offer the highest risk-adjusted yields, economists at ING report.
Dollar does ok in a carry trade world
“The stand-out is the lower levels of traded FX volatility around the world – both in the developed and emerging FX space. Lower levels of volatility go hand-in-hand with a slightly more constructive risk environment, where the MSCI World equity index is edging up to the highs of the year.”
“The currencies of Latin America (especially the Mexican Peso) and Central and Eastern Europe (especially the Hungarian Forint) offer the best risk-adjusted return. These have been the outperformers this year and could continue to do well unless US debt ceiling negotiations take a turn for the worse.”
“Expect the Dollar to stay slightly bid in this rangy FX environment until there are much clearer signs of US disinflation and a slowing activity – which we have argued is more a story for the third quarter.”
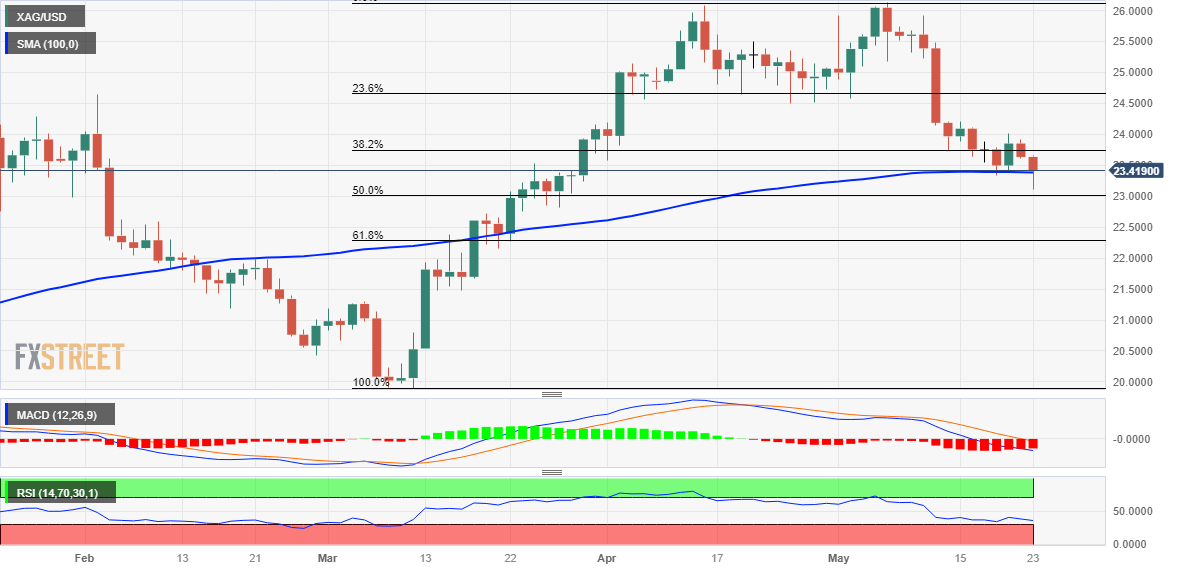
- Silver breaks through the 100-day SMA support and drops to a nearly two-month low.
- The technical setup favours bearish traders and supports prospects for further losses.
- A sustained strength beyond the $24.00 mark is needed to negate the bearish outlook.
Silver continues losing ground for the second successive day on Tuesday and confirms a fresh bearish breakdown through the 100-day Simple Moving Average (SMA). The white metal maintains its heavily offered tone through the early North American session and currently trades around the $23.25-$23.30 region, just above a nearly two-month low.
The recent repeated failures near the $24.00 round-figure mark and the subsequent slide below a technically significant moving average could be seen as a fresh trigger for bearish traders. Moreover, oscillators on the daily chart are holding deep in the negative territory and are still far from being in the oversold zone. This, in turn, supports prospects for an extension of the recent retracement slide from over a one-year top, around the $26.15 region touched earlier this month.
Some follow-through selling below the $23.00 mark, which coincides with the 50% Fibonacci retracement level of the March-May rally, will reaffirm the negative outlook. The XAG/USD might then accelerate the fall towards intermediate support near the $22.60-$22.55 region before eventually dropping to the 61.8% Fibo. level, around the $22.25-$22.20 region. This is followed by the $22.00 mark, which if broken decisively will set the stage for a further near-term depreciating move.
On the flip side, attempted recovery back above the 100-day SMA, currently around the $23.35 region, is more likely to attract fresh sellers near the 38.2% Fibo. level, around the $23.75 area. This, in turn, should cap the upside for the XAG/USD near the $24.00 round-figure mark. Some follow-through buying beyond the $24.20-$24.25 region, however, might negate the near-term bearish outlook and prompt an aggressive short-covering rally towards the $25.00 psychological mark.
Silver daily chart
Key levels to watch
EUR/USD is at potential support zone of 1.0730/1.0710. A break below here could open up further losses, analysts at Société Générale report.
High formed last week at 1.0910 is likely to cap
“EUR/USD is challenging the 100-DMA; it is worth noting that this MA had cushioned downside in March.”
“The pair is close to potential support of 1.0730/1.0710 representing the 23.6% retracement from last year. An initial bounce is not ruled out however the high formed last week at 1.0910 is likely to cap.”
“Failure to defend 1.0730/1.0710 can extend the decline towards 1.0650 and perhaps even towards March low of 1.0510.”
- Oil price continues sluggish recovery on budding optimism US lawmakers will reach agreement to raise US debt ceiling.
- A bullish triangle price pattern forms on the 4-hour chart increasing the evidence the bearish trend may be reversing.
- API inventory data to be released later on Tuesday could inject some volatility into Crude Oil price action.
Oil price trades marginally higher on Tuesday, continuing its recovery from the poor open at the start of the week. Financial markets in general suffer a lack of volatility due to uncertainty over the United States debt ceiling. In the event of a default, US demand would plummet, resulting in lower Oil prices. Optimism after talks on Monday raises hopes, with history showing a last-minute deal is the norm.
At the time of writing, WTI Oil is trading in the mid $72s and Brent Crude Oil in the lower $76s. A bullish right-angled triangle has formed on the 4-hour chart, challenging the overall bear trend.
Oil news and market movers
- Oil rises marginally on Tuesday as United States lawmakers continue negotiations to raise the debt ceiling and avoid a US default.
- Republican House Leader Kevin McCarthy expresses optimism after Monday’s talks, saying, “I believe we can still get there. I believe we can get it done.” Adding that he thought the talks were the most productive so far.
- Oil price opened substantially lower at the beginning of the week, partly as a result of global trade concerns after major economies clashed at the G7 summit in Japan.
- China further provoked the US by banning imports of memory chips from US manufacturer Micron, citing security risks.
- The US Dollar catches a bid on Tuesday as Federal Reserve (Fed) officials continue to talk about the possibility of more rate hikes, providing a headwind for Oil, which is priced in USD.
- API inventory data out at 20:30 GMT will provide an indication of demand and supply dynamics in the crude market and could impact Oil prices if it comes out substantially higher or lower than last week’s 3.69 million barrels figure.
- A higher result would signal increasing supply and weigh on Oil prices and vice versa for a lower data point.
- S&P Global PMI data at 13:45 GMT could also impact Oil prices via the US Dollar – if it beats expectations it is likely to support USD and weigh on Oil and vice versa if lower.
Crude Oil Technical Analysis: Downtrend increasingly compromised
WTI Oil is in a long-term downtrend, making successive lower lows. Given the old adage that the trend is your friend, this favors short positions over long positions. WTI Oil is trading below all the major daily Simple Moving Averages (SMA) and all the weekly SMAs except the 200-week which is at $66.89.
-638204433309415027.png)
WTI US Oil: Daily Chart
A break below the year-to-date (YTD) lows of $64.31, however, would be required to re-ignite the downtrend, with the next target at around $62.00 where trough lows from 2021 will come into play, followed by support at $57.50.
Despite the bearish trend dominating, there are growing signs pointing to a possible conclusion and reversal. The mild bullish convergence between price and the Relative Strength Index (RSI) at the March and May 2023 lows – with price making a lower low in May that is not matched by a lower low in RSI – is a sign that bearish pressure is easing.
The long hammer Japanese candlestick pattern that formed at the May 4 (and year-to-date) lows is a sign that it could be a key strategic bottom.
Further, a right-angled triangle can also be seen forming on the 4-hour chart below, which because of its shape is biased to breakout higher.
-638204433755452264.png)
WTI US Oil: 4-hour Chart
The triangle could have formed after price recovered from the May 4 YTD lows. The initial rebound off the May 4 lows could be seen as a Wave A, with B descending between May 8-15. Wave C then probably rose in the week that followed before the market turned again at the start of this week, in what might be a Wave D. The recovery currently underway could be Wave E. Since most triangles are only composed of five waves this would be the last wave before the pattern breaks out.
There is a chance the triangle might break in either direction, but it is biased to break higher. This is because the top border is flat (it is right angled). Such a move would see price rise in a volatile rally to a potential target of $79.75, calculated by taking 61.8% the height of the triangle and extrapolating it higher. This is also at the level of the 200-day SMA which is likely to provide tough resistance to any further gains.
Such a break would probably mean price breaking above the $76.85 lower high of April 28, thereby, bringing the dominant bear trend into doubt.
False breaks are common with this pattern, however, and traders should ideally wait for a ‘decisive’ break. Such a break is characterized by a longer-than-average bullish green bar which pierces completely through the upper borderline of the triangle and closes near the 4-hour period’s highs, or alternatively three green bars in a row that also pierce above the borderline.
Given the downtrend is dominant, however, there is still also a possibility WTI Oil price could break lower, with a decisive break below the lower border, likewise required, and a target at $67.27. This is just above where the 200-week SMA is located and likely to offer support. Traders might even wish to wait for a break below the lows of Wave B at $69.40 for added confirmation.
WTI Oil FAQs
What is WTI Oil?
WTI Oil is a type of Crude Oil sold on international markets. The WTI stands for West Texas Intermediate, one of three major types including Brent and Dubai Crude. WTI is also referred to as “light” and “sweet” because of its relatively low gravity and sulfur content respectively. It is considered a high quality Oil that is easily refined. It is sourced in the United States and distributed via the Cushing hub, which is considered “The Pipeline Crossroads of the World”. It is a benchmark for the Oil market and WTI price is frequently quoted in the media.
What factors drive the price of WTI Oil?
Like all assets, supply and demand are the key drivers of WTI Oil price. As such, global growth can be a driver of increased demand and vice versa for weak global growth. Political instability, wars, and sanctions can disrupt supply and impact prices. The decisions of OPEC, a group of major Oil-producing countries, is another key driver of price. The value of the US Dollar influences the price of WTI Crude Oil, since Oil is predominantly traded in US Dollars, thus a weaker US Dollar can make Oil more affordable and vice versa.
How does inventory data impact the price of WTI Oil
The weekly Oil inventory reports published by the American Petroleum Institute (API) and the Energy Information Agency (EIA) impact the price of WTI Oil. Changes in inventories reflect fluctuating supply and demand. If the data shows a drop in inventories it can indicate increased demand, pushing up Oil price. Higher inventories can reflect increased supply, pushing down prices. API’s report is published every Tuesday and EIA’s the day after. Their results are usually similar, falling within 1% of each other 75% of the time. The EIA data is considered more reliable, since it is a government agency.
How does OPEC influence the price of WTI Oil?
OPEC (Organization of the Petroleum Exporting Countries) is a group of 13 Oil-producing nations who collectively decide production quotas for member countries at twice-yearly meetings. Their decisions often impact WTI Oil prices. When OPEC decides to lower quotas, it can tighten supply, pushing up Oil prices. When OPEC increases production, it has the opposite effect. OPEC+ refers to an expanded group that includes ten extra non-OPEC members, the most notable of which is Russia.
- USD/CAD gains some positive traction and climbs to over a one-week high on Tuesday.
- A combination of factors continues to push the USD higher and lend support to the pair.
- An intraday rise in Crude Oil prices underpins the Loonie and caps any meaningful gains.
The USD/CAD pair struggles to capitalize on its intraday positive move and retreats a few pips from the vicinity of mid-1.3500s, or over a one-week high touched earlier this Tuesday. The pair trades with a mild positive bias heading into the North American session and is currently placed just above the 1.3500 psychological mark.
Crude Oil prices rally over 1% amid hopes for an improvement in US fuel demand and disruptions in Canadian supply due to wildfires in the oil-rich Alberta province. This, in turn, underpins the commodity-linked Loonie and turns out to be a key factor acting as a headwind for the USD/CAD pair, though resurgent US Dollar (USD) demand should help limit the downside, at least for the time being. In fact, the USD Index (DXY), which tracks the Greenback against a basket of currencies, climbs to a fresh two-month high and draws support from a combination of factors.
The overnight hawkish remarks by a slew of influential Federal Reserve (Fed) officials lifted market bets that the US central bank will keep interest rates higher for longer. This, along with hopes that US politicians can come together on a debt ceiling deal, keeps the US Treasury bond yields elevated and continues to benefit the Greenback. Apart from this, worries over slowing global growth, particularly in China, further benefit the Greenback's relative safe-haven status and contribute to limiting any meaningful pullback for the USD/CAD pair, at least for the time being.
Market participants now look forward to the US economic docket, featuring the flash PMI prints, New Home Sales data and the Richmond Manufacturing Index. This, along with the debt ceiling talks and the US bond yields, will influence the USD demand and provide some impetus to the USD/CAD pair. Traders will further take cues from Oil price dynamics to grab short-term opportunities. Meanwhile, the aforementioned mixed fundamental backdrop and the recent range-bound price action witnessed over the past week or so warrant some caution before placing directional bets.
Technical levels to watch
- EUR/USD fails to extend the breakout of 1.0800 on Tuesday.
- The corrective decline could revisit monthly lows near 1.0760.
EUR/USD faces some downside pressure and breaches the key support of 1.0800 the figure on Tuesday.
The loss of upside traction could now force the pair to put the May low near 1.0760 to the test in the short-term horizon. Extra pullbacks could see the minor support level at 1.0712 (March 24) retested.
A deeper decline to the March bottom of 1.0516 (March 15), in the meantime, is not favoured for the time being.
Looking at the longer run, the constructive view remains unchanged while above the 200-day SMA, today at 1.0471.
EUR/USD daily chart
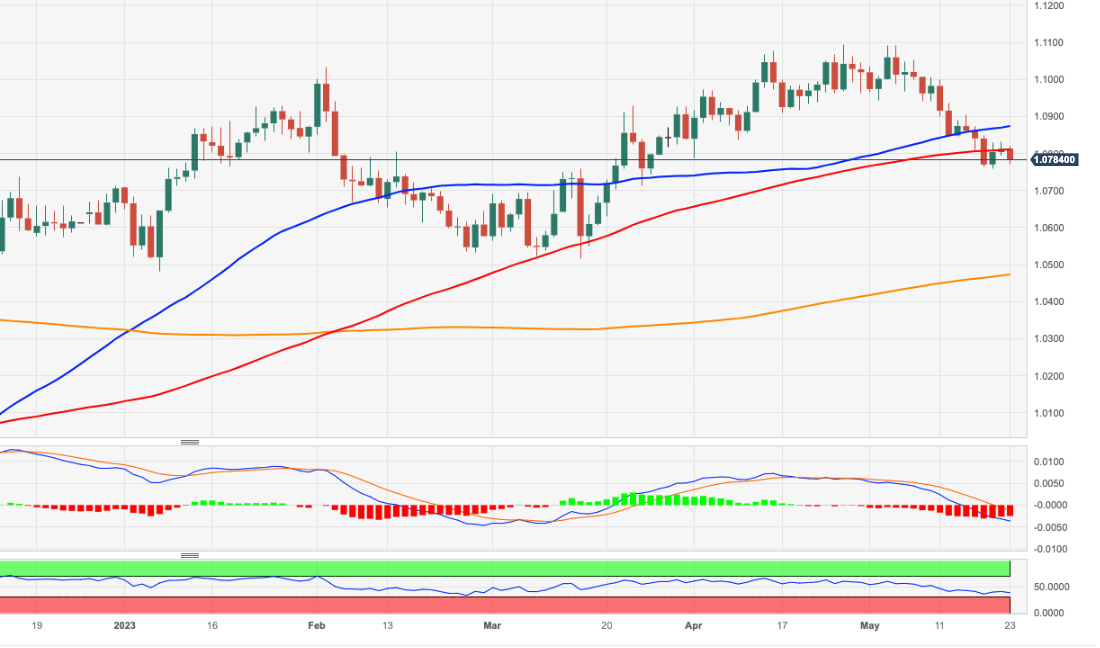
Economists at UBS discuss the equities outlook.
Higher volatility expected in the months ahead
“Given a rally driven by only a handful of names, relatively expensive valuations in large-cap growth and technology stocks, and the negative impact of credit tightening on company earnings, we expect higher volatility in the months ahead, and see the S&P 500 at around 3,800 by December.”
“We prefer emerging market stocks, which should benefit from peaking US rates, higher commodity prices, a weaker US Dollar, and China’s recovery.”
"I can't tell you whether we're near to the peak, I can't tell you whether we are at the peak," Bank of England (BoE) Governor Andrew Bailey told the UK parliament's Treasury Select Committee (TSC) on Tuesday.
"I think we are nearer to the peak than we were," Bailey concluded and reiterated that they must use the tool of interest rate rises carefully.
Market reaction
These comments don't seem to be having a significant impact on Pound Sterling's valuation. As of writing, GBP/USD was down 0.4% on the day at 1.2388.
- DXY adds to Monday’s advance and retests the 103.60 zone.
- Extra gains from here target the key 200-day SMA near 105.70.
DXY extends Monday’s auspicious start of the week and challenges recent peaks in the 103.60/65 band on Tuesday.
In case bulls regain the upper hand, a convincing move past 103.60/65 could pave the way for a potential challenge of the key 200-day SMA, today at 105.74 prior to the 2023 high of 105.88 (March 8).
Looking at the broader picture, while below the 200-day SMA the outlook for the index is expected to remain negative.
DXY daily chart
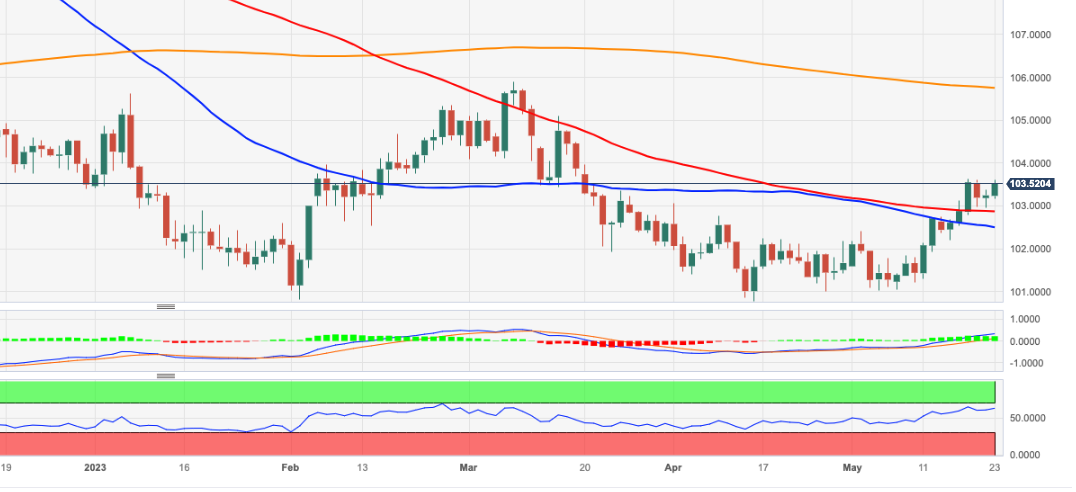
Japan-German relative manufacturing PMIs suggest EUR/JPY is way too high, Kit Juckes, Chief Global FX Strategist at Société Générale, reports.
EUR/JPY is simply in the wrong place
“Perhaps the biggest contrast in manufacturing PMI trends, is between Germany and Japan. I’ve plotted the difference between the two, which is at its lowest level since the Japanese series started, against EUR/JPY, which is at its highest level since the financial crisis.”
“CFTC data show a growing Yen short as well as a huge and growing Euro long, so the EUR/JPY pair may have lots of room to fall if it can find a catalyst to get the ball rolling.”
- EUR/JPY retests once again the key barrier around 150.00.
- Further up emerges the 2023 high around 151.60.
EUR/JPY comes under fresh downside pressure soon after hitting the 150.00 region on Tuesday.
A convincing breakout of the key round level at 150.00 could encourage the cross to dispute the 2023 top at 151.61 (May 2) in the short-term horizon.
So far, further upside looks favoured while the cross trades above the 200-day SMA, today at 143.43.
EUR/JPY daily chart
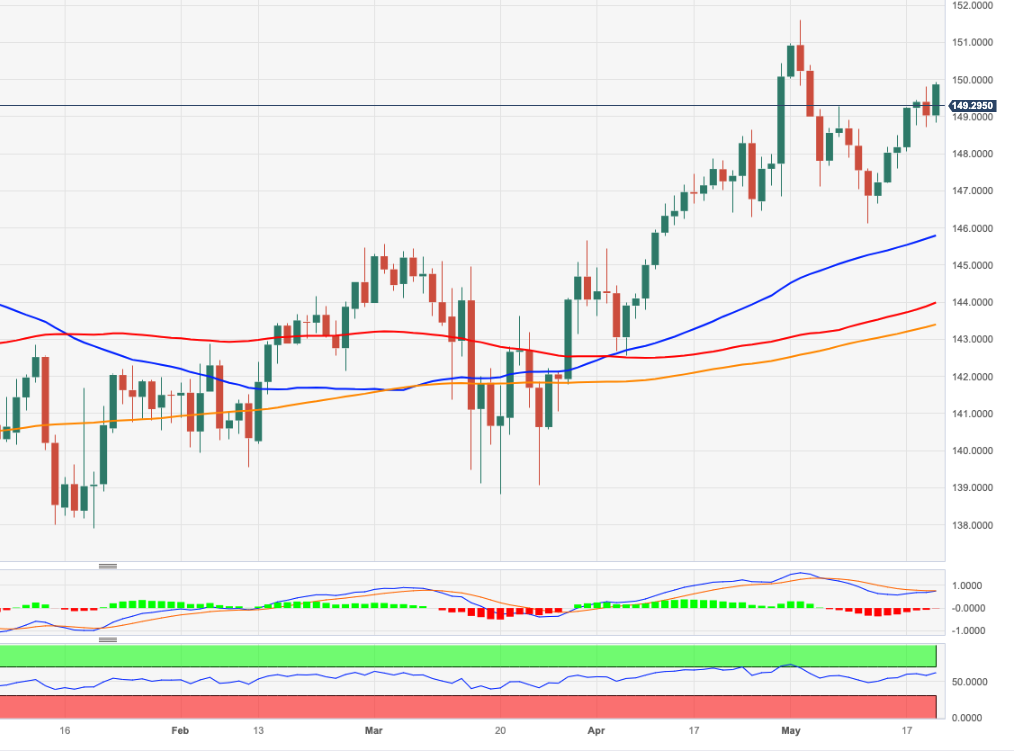
International Monetary Fund (IMF) Managing Director Kristalina Georgieva noted on Tuesday that discussions on the US debt-ceiling have always been quite tense but resulted in a solution, as reported by Reuters.
"A lack of solution would have detrimental impact on the US and world economy," Georgieva added. "Hopefully we won't have to wait to the 11th hour for a solution on the US debt-ceiling."
Market reaction
These comments don't seem to be having a noticeable impact on the market mood. As of writing, US stock index futures were down between 0.1% and 0.2%.
- AUD/USD meets with a fresh supply on Tuesday and is pressured by broad-based USD strength.
- Elevated US bond yields and looming recession risks lift the safe-haven USD to a two-month high.
- The fundamental backdrop favours bearish traders and supports prospects for a further decline.
The AUD/USD pair comes under heavy selling pressure on Tuesday and continues losing ground through the first half of the European session. Spot prices drop back closer to the monthly low touched last week, with bears now awaiting a sustained beak below the 0.6600 round-figure mark before placing fresh bets.
A combination of supporting factors lifts the US Dollar (USD) to its highest level since March 20, which, in turn, is seen weighing on the AUD/USD pair. The overnight hawkish remarks by a slew of influential Federal Reserve (Fed) officials lifted market bets that the US central bank will keep interest rates higher for longer. In fact, the markets are pricing in a small chance of another 25 bps lift-off at the June FOMC meeting. This, along with hopes that US politicians can come together on a debt ceiling deal, keeps the US Treasury bond yields elevated and continues to benefit the Greenback.
In fact, the yield on the benchmark 10-year US government bond rise for a seventh straight day on Monday and register its longest winning streak since April 2022. Apart from this, worries over slowing global growth, particularly in China, further benefit the safe-haven buck. It is worth recalling that data from China last week showed that the world's second-largest economy underperformed in April. This, along with expectations that the Reserve Bank of Australia (RBA) might refrain from hiking in June, contributes to the offered tone surrounding the AUD/USD pair.
The aforementioned fundamental backdrop suggests that the path of least resistance for spot prices is to the downside. Some follow-through selling below the 0.6600 mark will reaffirm the negative bias and make the AUD/USD pair vulnerable to challenge the YTD low, around the 0.6565 region touched in March. Traders now look to the US economic docket, featuring the flash PMI prints, New Home Sales data and the Richmond Manufacturing Index. This, along with the debt ceiling talks, might influence the USD and produce short-term trading opportunities around the major.
Technical levels to watch
Economists at ING discuss the Reserve Bank of New Zealand (RBNZ) meeting and its implications for the NZD.
Fiscal spending argues for a hawkish 25 bps hike
“Last week, New Zealand’s government announced large spending plans and a set of more encouraging economic forecasts. All this has radically changed the picture for the Reserve Bank, which should hike by 25 bps to 5.50% this week and may revise its peak rate projections to 6.00% given new inflationary risks.”
“AUD/NZD has been on a descending pattern over the past week and we could see the 1.0485 December lows being tested on the back of RBA-RBNZ divergence.”
Bank of England (BoE) Governor Andrew Bailey responds to questions from the UK parliament's Treasury Select Committee (TSC) about the central bank's May Monetary Policy Report.
Key takeaways
"Fiercely committed to not having group-think on MPC."
"Gas prices already 10% lower than factored into May forecasts."
"We do have a challenge in how we communicate."
"Private sector wages are not growing faster than we thought."
"At top level, no sign of profiteering in food sector."
Market reaction
GBP/USD stays on the back foot following these comments and was last seen losing 0.5% on a daily basis at 1.2376.
Economists at Commerzbank expect GBP to come under depreciation pressure as the market’s rate hike expectations have gone too far.
Expectations for rate hikes are quite high
“The large majority of market participants expect a further 25 bps rate hike in June and with a likelihood of 50%, it projects one further rate hike at the following meeting. That might support Sterling for now.”
“However, we see little scope for further Sterling appreciation as we consider intensifying rate hike expectations, which would presumably be necessary for this, to be less likely.”
“The situation on the labour market is likely to ease further, with inflation falling. We therefore mainly see the risk that the market’s rate hike expectations have gone too far and that it will have to lower these, which would probably weigh on Sterling.”
- GBP/USD drops to over a one-month low on Tuesday and is pressured by modest USD strength.
- A combination of factors remains supportive of elevated US bond yields and underpins the USD.
- Bets for fewer BoE rate hikes, weaker UK PMIs weigh on the GBP and contribute to the decline.
The GBP/USD pair comes under some renewed selling pressure on Tuesday and drops to over a one-month low during the first half of the European session. The pair is currently placed just below the 1.2400 round-figure mark, down around 0.35% for the day, confirming a fresh breakdown through the 50-day Simple Moving Average (SMA).
A combination of factors lifts the US Dollar (USD) back closer to its highest level since March 20 touched last Friday, which, in turn, is seen dragging the GBP/USD pair lower. The overnight hawkish remarks by a slew of influential Federal Reserve (Fed) officials reaffirmed expectations that the US central bank will keep interest rates higher for longer. In fact, the markets are now pricing in a small chance of another 25 bps lift-off at the June FOMC meeting. Moreover, investors have been scaling back their bets for interest rate cuts later this year. This, along with hopes that US politicians can come together on a debt ceiling deal, keeps the US Treasury bond yields elevated and continues to benefit the Greenback.
In fact, the yield on the benchmark 10-year US government bond rise for a seventh straight day on Monday and register its longest winning streak since April 2022. Apart from this, worries over slowing global growth, particularly in China, further benefit the safe-haven buck. The British Pound (GBP), on the other hand, is undermined by expectations that fewer rate increases by the Bank of England (BoE) will be needed in the coming months to bring down inflation. The bets were lifted by rather unimpressive UK jobs data released last Tuesday and BoE Governor Andrew Bailey's comments, saying that inflation has turned the corner and there are some signs that the labour market is loosening a little.
Apart from this, the disappointing release of the flash UK PMI prints for May further contributes to the offered tone around the GBP/USD pair. The S&P Global/CIPS reported this Tuesday that the UK Manufacturing Purchasing Managers’ Index (PMI) fell to 46.9 in May versus 48.0 expected and, April’s final reading of 47.8. Furthermore, the Preliminary UK Services Business Activity Index for May slipped to 55.1, compared with a 55.9 final print for April and 55.5 expected. This, in turn, favours bearish traders and supports prospects for a further intraday depreciating move for the major.
Market participants now look forward to the US economic docket, featuring the flash PMI prints, New Home Sales data and the Richmond Manufacturing Index. due for release later during the early North American session. This, along with the US debt ceiling talks and the US bond yields, will influence the USD price dynamics and provide some impetus to the GBP/USD pair. Apart from this, traders will take cues from the broader risk sentiment to grab short-term opportunities.
Technical levels to watch
- US Dollar gains some ground as Asian currencies take a step back.
- US debt-ceiling talks and geopolitical tensions triggered by Chinese ban on Micron lead the market action.
- US Dollar Index pairs back incurred losses from Monday.
The US Dollar (USD) is clawing its way back after a dismal session at the start of the week. The US Dollar Index (DXY) is showing signs of consolidation above a crucial support level, while tail risk is being priced in after US chip-manufacturer Micron got barred from China, with Japan and South-Korea eager to take over the business. A mild positive tone was the summary at the end of the first day of negotiations about the US debt ceiling this week, with a deal still possible.
On the macroeconomic data front, traders will be glued to their screens for the services numbers coming from the Purchase Managers Index (PMI) in the United States at 13:45 GMT. Add the Richmond Fed Manufacturing Index number for May briefly after that (14:00 GMT) and traders will have a good metric point in order to assess where to take the US Dollar next. On the other hand, a much lighter Fed speaker agenda on Tuesday with only Fed’s Logan giving welcome remarks at a conference on technology-enabled disruption.
Daily digest: US Dollar back in the green
- US Dollar printed a new monthly high against Chinese Yuan at 7.0671.
- US President Joe Biden confirmed after talks with US House Speaker Kevin McCarthy that a default is off the table.
- McCarthy came out and said talks were productive, but no deal yet. The tone of discussion was better than before.
- The United States is working with allies like South Korea and Japan to circumvent any chip supply disruptions after US chip-manufacturer Micron got barred in China.
- Next to Neal Kashkari, Fed’s Jim Bullard came out in support for at least one, preferably two rate hikes on Monday.
- Markets were briefly rattled on Monday by comments from Kashkari that the Fed will not bail out the US economy if a debt default occurs.
- The CME Group FedWatch Tool shows that markets are flip-flopping again after comments from Fed Chair Jerome Powell on Friday, have priced out again a rate hike for June, while an initial rate cut has been delayed until September instead of July before.
- The benchmark 10-year US Treasury bond yield trades at 3.72% and prints a new high for the past week. This could allow to pusht the US Dollar higher and the DXY further in the green.
US Dollar Index technical analysis: Can the uptrend continue?
The US Dollar Index (DXY) has taken out both the 55-day and the 100-day Simple Moving Averages (SMA), respectively, at 102.52 and 102.87 on the upside. Support held on Monday and is confirming continuation to the upside in order to challenge 103.61, the high of past Thursday.
On the upside, 105.76 (200-day SMA) still acts as the big target to hit, as the next upside target at 104.00 (psychological level, static level) acts as an intermediary element to cross the open space.
On the downside, 102.86 (100-day SMA) aligns as the first support level to make sure that . In the case that breaks down, watch how the DXY reacts at the 55-day SMA at 102.48 in order to assess any further downturn or upturn.
US Dollar FAQs
What is the US Dollar?
The US Dollar (USD) is the official currency of the United States of America, and the 'de facto' currency of a significant number of other countries where it is found in circulation alongside local notes. It is the most heavily traded currency in the world, accounting for over 88% of all global foreign exchange turnover, or an average of $6.6 trillion in transactions per day, according to data from 2022.
Following the second world war, the USD took over from the British Pound as the world's reserve currency. For most of its history, the US Dollar was backed by Gold, until the Bretton Woods Agreement in 1971 when the Gold Standard went away.
How do the decisions of the Federal Reserve impact the US Dollar?
The most important single factor impacting on the value of the US Dollar is monetary policy, which is shaped by the Federal Reserve (Fed). The Fed has two mandates: to achieve price stability (control inflation) and foster full employment. Its primary tool to achieve these two goals is by adjusting interest rates.
When prices are rising too quickly and inflation is above the Fed's 2% target, the Fed will raise rates, which helps the USD value. When inflation falls below 2% or the Unemployment Rate is too high, the Fed may lower interest rates, which weighs on the Greenback.
What is Quantitative Easing and how does it influence the US Dollar?
In extreme situations, the Federal Reserve can also print more Dollars and enact quantitative easing (QE). QE is the process by which the Fed substantially increases the flow of credit in a stuck financial system.
It is a non-standard policy measure used when credit has dried up because banks will not lend to each other (out of the fear of counterparty default). It is a last resort when simply lowering interest rates is unlikely to achieve the necessary result. It was the Fed's weapon of choice to combat the credit crunch that occurred during the Great Financial Crisis in 2008. It involves the Fed printing more Dollars and using them to buy US government bonds predominantly from financial institutions. QE usually leads to a weaker US Dollar.
What is Quantitative Tightening and how does it influence the US Dollar?
Quantitative tightening (QT) is the reverse process whereby the Federal Reserve stops buying bonds from financial institutions and does not reinvest the principal from the bonds it holds maturing in new purchases. It is usually positive for the US Dollar.
Kit Juckes, Chief Global FX Strategist at Société Générale, expects the EUR/USD pair to remain under downside pressure as activity in manufacturing declines.
US curve continues to cut back its H2 rate cut expectations
“The Euro needed the recent weakness in manufacturing industry to show signs of turning itself around if the euro were to find a base and a bid. That didn’t happen to put it mildly. The headline composite PMI, at 53.3, is OK and close enough to expectations of 53.5, but manufacturing was weak again, at 44.6. That’s the lowest figure since May 2020.”
“EUR/USD has slipped below 1.08 and for now, the correction continues as Treasury yields move higher and the US curve continues to cut back its H2 rate cut expectations.”
Bank of England (BoE) Governor Andrew Bailey faces questions by the UK parliament's Treasury Select Committee (TSC) about the central bank's May Monetary Policy Report.
Key quotes
There are risks of inflation persistence and we have to respond.
Global supply chain shock did prove to be largely transient but was swamped by the Ukraine invasion effect.
Market reaction
At the time of writing, GBP/USD is holding lower ground near monthly lows of 1.2383 on the above comments, losing 0.40% so far.
Bank of England (BoE) Chief Economist Huw Pill testifies before the UK parliament's Treasury Select Committee (TSC) about the central bank's May Monetary Policy Report.
Key quotes
We are trying to understand why we have made errors in inflation forecasts.
Longer-term inflation expectations have not drifted away from target.
Related reads
- BoE’s Bailey: Inflation has turned the corner
-
UK Preliminary Services PMI edges lower to 55.1 in May vs. 55.5 expected
Business confidence in the euro area still seems to be defying economic headwinds, economists at Commerzbank report.
Euro area PMIs continue to send conflicting signals
“The Purchasing Managers' Index for the services sector, the most reliable economic barometer for the euro area, fell only slightly by 0.3 points in May to a still high 55.9. The manufacturing PMI, on the other hand, slipped even deeper into recessionary territory at 44.6.”
“In contrast to the majority of economists, we continue to expect a slight decline in real GDP in the second half of the year.”
- EUR/USD fades Monday’s uptick and revisits levels below 1.0800.
- EMU, Germany flash PMIs come in a mixed note in May.
- Housing data, advanced PMIs also in the limelight in the US docket.
The single currency now loses some momentum and forces EUR/USD to recede to the sub-1.0800 region, or 2-day lows, on turnaround Tuesday.
EUR/USD weaker post-PMIs, USD-buying
EUR/USD now leaves behind two consecutive sessions with gains and refocuses on the downside on the back of mixed results from advanced PMIs in both Germany and the broader Euroland for the month of May.
On the latter, and while the manufacturing sector remained weak, the services industry maintained its healthy momentum and is expected to have improved further during this month.
In the meantime, US debt ceiling talks are predicted to keep ruling the sentiment in the global markets in the very near term, while speculation of further rate hikes by the ECB at its meetings in June and July and probably September remain on the rise.
Across the pond, flash Manufacturing and Services PMIs for the month of May are also due along with New Home Sales and the speech by Dallas Fed L. Logan.
What to look for around EUR
EUR/USD struggles to reclaim further ground and trades in a vacillating fashion around the key 1.0800 zone.
The movement of the euro's value is expected to closely mirror the behaviour of the US Dollar and will likely be impacted by any differences in approach between the Fed and the ECB with regards to their plans for adjusting interest rates.
Moving forward, hawkish ECB-speak continue to favour further rate hikes, although this view appears in contrast to some loss of momentum in economic fundamentals in the region.
Key events in the euro area this week: Germany, EMU Advanced Manufacturing/Services PMI (Tuesday) – Germany IFO Business Climate (Wednesday) – Germany Final Q1 GDP Growth Rate, GfK Consumer Confidence (Thursday) – Italy, France Consumer Confidence (Friday).
Eminent issues on the back boiler: Continuation of the ECB hiking cycle in June and July (and September?). Impact of the Russia-Ukraine war on the growth prospects and inflation outlook in the region. Risks of inflation becoming entrenched.
EUR/USD levels to watch
So far, the pair is losing 0.20% at 1.0791 and faces immediate contention at 1.0759 (monthly low May 19) seconded by 1.0712 (low March 24) and finally 1.0516 (low March 15). On the upside, a break above 1.0872 (55-day SMA) would target 1.1000 (round level) en route to 1.1095 (2023 high April 26).
Economists at ING discuss EUR/USD outlook.
Positioning still seems quite long
“Despite the correction in EUR/USD from nearly 1.11 to 1.08, net speculative long Euro positioning still seems quite stretched, and presents an outside risk in EUR/USD to the 1.05 area should conditions drive it there. Such conditions could include serious speculation over another couple of Fed rate hikes (only another 10 bps of hikes is currently priced) or severe dislocation in US money markets if the US Treasury gets very close to an unthinkable default on its debt. Neither of those is our baseline view and instead EUR/USD probably hangs around this 1.08 area for a while.”
“We think the third quarter will be the period when clear signs of US disinflation and weaker activity data drive a much more obvious Dollar bear trend.”
Bank of England (BoE) Governor Andrew Bailey faces questions by the UK parliament's Treasury Select Committee (TSC) about the central bank's May Monetary Policy Report.
Key quotes
Inflation has turned the corner.
Services inflation is tracking more or less as we thought in Feb.
MPC will adjust bank rate as necessary to return inflation to target sustainably in the medium term.
If evidence of more persistent pressures, then further tightening in monetary policy would be required.
There are some signs that the labour market is loosening a little.
We have underestimated food price inflation.
more to come ...
Market reaction
Bailey’s words fail to move the needle around the Pound Sterling, with GBP/USD currently trading at 1.2394, down 0.35% on the day.
- Gold price drops closer to its lowest level since early April amid modest US Dollar strength.
- A combination of factors keeps the US bond yields elevated and underpins the Greenback.
- Looming recession risks could lend support to the safe-haven XAU/USD and help limit losses.
Gold price remains under some selling pressure for the second successive day on Tuesday and drops back closer to its lowest level since early April during the early European session. The XAU/USD currently trades around the $1,960 area, down over 0.60% for the day, and is pressured by a modest US Dollar (USD) strength.
Modest US Dollar strength weighs on Gold price
In fact, the USD Index (DXY), which tracks the Greenback against a basket of currencies, holds steady just below a two-month high touched last week and is seen driving flows away from the US Dollar-denominated Gold price. The overnight hawkish remarks by several Federal Reserve (Fed) officials reaffirmed market expectations that the US central bank will continue hiking interest rates. St. Louis Fed President James Bullard said on Monday that the Fed may still need to raise its benchmark interest rate by another half-point this year. Furthermore, Minneapolis Fed President Neel Kashkari also said it was a close call whether he would vote to raise interest rates or to pause the central bank's tightening cycle when it meets next month.
Elevated US bond yields further undermine Gold price
Separately, Atlanta Fed President Raphael Bostic said he was comfortable waiting a little bit before deciding on any further moves. Meanwhile, Richmond Fed President Thomas Barkin said he was still looking to be convinced that inflation is in a steady decline. Nevertheless, the outlook lifts bets that the Fed will keep interest rates higher for longer. This, along with hopes that politicians in the United States (US) can come together on a debt ceiling deal and keeps the US Treasury bond yields elevated. In fact, US President Joe Biden and House Speaker Kevin McCarthy ended discussions on Monday with no agreement on how to raise the US government's $31.4 trillion debt ceiling but will keep talking just 10 days before a possible default.
Looming recession risks could limit losses for XAU/USD
The optimism, meanwhile, allowed the yield on the benchmark 10-year US government bond to rise for a seventh straight day on Monday and register its longest winning streak since April 2022. This, in turn, lends additional support to the Greenback and further contributes to the offered tone surrounding the non-yielding Gold price. That said, worries over slowing global growth, particularly in China, continue to weigh on investors' sentiment. It is worth recalling that data from China last week showed that the world's second-largest economy underperformed in April. Adding to this, mostly disappointing manufacturing PMI prints from the Eurozone further fuel recession fears and could lend some support to the safe-haven XAU/USD, at least for the time being.
Traders now look to US economic data for fresh impetus
Market participants now look forward to the US economic docket, featuring the flash PMI print, New Home Sales data and the Richmond Manufacturing Index, due for release later during the early North American session. This, along with the US debt ceiling talks and the US bond yields, will influence the USD price dynamics and provide some impetus to Gold price. Apart from this, traders will take cues from the broader risk sentiment to grab short-term opportunities around the safe-haven precious metal. Nevertheless, the aforementioned fundamental backdrop seems tilted in favour of bearish traders and supports prospects for a further near-term depreciating move.
Gold price technical outlook
From a technical perspective, some follow-through selling below the $1,950 region will be seen as a fresh trigger for bearish traders and expose the 100-day Simple Moving Average (SMA), currently pegged near the $1,931 zone. Failure to defend the said support will make the Gold price vulnerable to accelerate the slide further towards testing the $1,900 round-figure mark.
On the flip side, the ongoing recovery back above the $1,970 horizontal support breakpoint is more likely to attract fresh sellers near the $1,982-$1,984 region. This, in turn, should cap Gold price near the $2,000 psychological mark. That said, a sustained strength beyond could lift the XAU/USD towards the next relevant hurdle near the $2,011-$2,012 region.
Key levels to watch
The likelihood of a probable test of 7.0960 in USD/CNH now appears somewhat dwindled according to Economist Lee Sue Ann and Markets Strategist Quek Ser Leang at UOB Group.
Key Quotes
24-hour view: “Yesterday, we expected USD to ‘trade in a lower range of 7.0080/7.0400’. However, USD rose to a high of 7.0530. Despite the advance, upward momentum has not improved much. That said, there is room for USD to edge higher today even though it is unlikely to challenge last Friday’s high of 7.0750 (there is another resistance at 7.0600). Support is at 7.0350, followed by 7.0230.”
Next 1-3 weeks: “Our update from yesterday (22 May, spot at 7.0215) is still valid. As highlighted, short-term upward momentum is beginning to fade and the chance of USD rising to 7.0960 this time around has diminished. However, only a break of 7.0000 (no change in ‘strong support’ level) would indicate the USD strength that started more than a week ago has ended.”
SNB is likely to be quite pleased about the strong Franc for the time being, economists at Commerzbank report.
Too early for significantly higher EUR/CHF levels
“If it is possible to solve the row about the debt ceiling, the Franc might lose some ground again. However, the SNB is unlikely to accept a strong depreciation and in doubt would probably intervene on the FX market again. That means it is probably still too early for significantly higher EUR/CHF levels.”
“Only once the price pressure in Switzerland eases significantly over the course of the year, is the SNB likely to tolerate a slightly weaker CHF.”
- UK Manufacturing PMI contracts further to 46.9 in May, a downside surprise.
- Services PMI in the UK comes in at 55.1 in May, misses expectations.
- GBP/USD challenges monthly lows near 1.2385 on disappointing UK business PMIs.
The seasonally adjusted S&P Global/CIPS UK Manufacturing Purchasing Managers’ Index (PMI) fell to 46.9 in May versus 48.0 expected and, 47.8 - April’s final readout.
Meanwhile, the Preliminary UK Services Business Activity Index for May slipped to 55.1, compared with a 55.9 final print for April and 55.5 expected.
FX implications
GBP/USD is testing monthly lows near 1.2385 on the downbeat UK Manufacturing and Services PMI data. The currency pair is losing 0.38% on the day to trade at 1.2389, at the press time.
Economists at Goldman Sachs expect US Dollar strength to continue in the near term.
There will likely only be a ‘bumpy deceleration’ for the Dollar
“The foreign exchange (FX) markets have been pricing too much divergence, but recent data showing better-than-feared credit conditions in the US and easing cost pressures have resulted in a rally in the broad Dollar. Concurrently, economic growth in Europe, China, and Japan has not met robust expectations, and policymakers in these regions have displayed increased caution, supporting the strength of the USD against major currencies.”
“Despite these developments, there will likely only be a ‘bumpy deceleration’ for the Dollar. This is because slack in the US economy remains limited and robust global activity usually accompanies Dollar depreciation, not US underperformance. We expect these factors to contribute to further Dollar strength in the near term.”
The International Monetary Fund (IMF) is out with its latest outlook on the UK economy, projecting a slowdown in growth for this year.
Key takeaways
UK economy is expected to avoid a recession and maintain positive growth in 2023.
UK inflation remains stubbornly high following the severe terms-of-trade shock due to Russia’s war in Ukraine.
UK monetary policy will need to remain tight in order to keep inflation expectations well-anchored.
Fiscal policy should continue to be aligned with monetary policy in the fight against inflation, while protecting key public services and the vulnerable.
Realizing the UK’s full growth potential will require addressing the post-pandemic rise in labor inactivity, mainly due to long-term illness.
IMF staff forecasts UK GDP growth to slow to 0.4 percent in 2023.
This latest forecast represents a 0.7 percentage point upgrade to the IMF’s April forecast.
Growth is projected to rise gradually to 1 percent in 2024, and to average around 2 percent in 2025 and 2026.
Growth is projected to settle at 1.5 percent, staff estimate of trend growth.
Declining energy prices and widening economic slack expected to substantially reduce inflation to around 5 percent by end-2023.
Expects UK inflation below the BoE’s 2 percent target by mid-2025.
Major near-to medium-term risk is greater-than-anticipated persistence in price- and wage-setting.
Downside risks also include a further tightening in global financial conditions.
Market reaction
Despite the IMF’s positive outlook on the British economy, GBP/USD is extending losses below 1.2400. The pair is losing 0.32% on the day to trade at 1.2395, as of writing.
- Eurozone Manufacturing PMI arrives at 44.6 in May vs. 46.2 expected.
- Bloc’s Services PMI drops to 55.9 in May vs. 55.6 expected.
- EUR/USD stays depressed around 1.0800 amid mixed German and Eurozone PMIs.
The Eurozone manufacturing sector contraction deepened in May, the latest manufacturing activity survey from the HCOB showed on Tuesday.
The Eurozone Manufacturing Purchasing Managers Index (PMI) arrived at 44.6 in May vs. 46.2 expected and 45.8 previous. The index reached a three-year low.
The bloc’s Services PMI dropped to 55.9 in May vs. 55.6 consensus and April’s 56.2, hitting a 2-month low.
The HCOB Eurozone PMI Composite fell to 53.3 in May vs. 53.7 expected and 54.1 previous. The measure dipped to a three-month low.
FX implications
EUR/USD keeps losses near 1.0800 following the release of the mixed Eurozone PMIs. The spot is down 0.16% on the day.
Considering advanced figures from CME Group for natural gas futures markets, open interest retreated for the second session in a row on Monday, this time by nearly 12K contracts. Same path followed volume, which added almost 112K contracts to the previous daily drop.
Natural Gas: Upside looks limited around $2.70
Prices of the natural gas started the new trading week with a marked pullback amidst shrinking open interest and volume. Against that, the likeliness of a sustained decline in the very near term appears unconvincing for the time being. On the flip side, bouts of strength should meet a tough barrier around the $2.70 region per MMBtu.
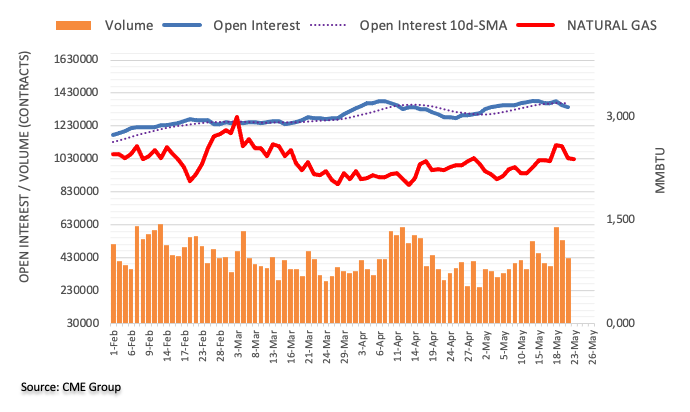
- NZD/USD comes under some selling pressure after facing rejection near the 0.6300 mark on Tuesday.
- The USD stands tall near a two-month high and turns out to be a key factor dragging the pair lower.
- Traders now look to the US PMIs for some impetus ahead of the RBNZ policy meeting on Wednesday.
The NZD/USD pair continues with its struggle to find acceptance or build on its modest intraday gains beyond the 0.6300 mark and meets with a fresh supply on Tuesday. The selling picks up pace during the early European session and drags spot prices to a fresh daily low, around the 0.6265 region in the last hour.
A combination of factors push the US Dollar (USD) higher for the second straight day, back closer to a two-month high touched last Friday, which, in turn, is seen exerting some downward pressure on the NZD/USD pair. Despite the less hawkish remarks by Federal Reserve (Fed) Chair Jerome Powell, investors seem convinced that the US central bank is likely to continue hiking interest rates. The bets were lifted by the overnight comments by a slew of influential FOMC members, indicating that the US central bank will keep interest rates higher for longer. This, along with hopes that US politicians can come together on a debt ceiling deal, keeps the US Treasury bond yields elevated and continues to benefit the Greenback.
In fact, US President Joe Biden and House Speaker Kevin McCarthy ended discussions on Monday with no agreement on how to raise the US government's $31.4 trillion debt ceiling and will keep talking just 10 days before a possible default. This, in turn, allowed the yield on the benchmark 10-year US government bond to rise for a seventh straight day on Monday and register its longest winning streak since April 2022. Apart from this, worries over slowing global growth, particularly in China, further benefit the safe-haven buck and weigh on antipodean currencies, including the New Zealand Dollar (NZD). It is worth recalling that data released from China last week showed that the world's second-largest economy underperformed in April.
The NZD/USD pair, however, finds some support near the 200-hour Simple Moving Average (SMA), at least for the time being, as traders seem reluctant to place aggressive bets ahead of the Reserve Bank of New Zealand (RBNZ) meeting on Wednesday. The recent survey showed that inflation expectations for the first quarter eased to 2.79% from 3.30% and forced investors to scale back their bets for further rate hikes. This might have set the stage for a dovish shift and favour bearish traders. Heading into the key central bank event risk, traders on Tuesday will take cues from the flash US PMI prints.
The US economic docket also features the release of New Home Sales data and the Richmond Manufacturing Index, due later during the early North American session. This, along with the US bond yields, the US debt ceiling talks and the broader risk sentiment, might influence the USD price dynamics and provide some impetus to the NZD/USD pair.
Technical levels to watch
European Central Bank (ECB) Vice President Luis de Guindos said on Tuesday, “the non-bank financial sector has remained largely stable in recent months, despite the stress in the banking sector that emerged in March.”
Additional comments
“Structural vulnerabilities from liquidity mismatches and leverage remain elevated.”
“More afraid of conflict between monetary and fiscal policy than about financial instability.”
-
Forex Today: Markets eye PMIs and US debt-ceiling negotiations
Economists at ING discuss the next UK data due to be released this week and its implication for the BoE policy and Sterling.
Services PMI in focus
“In the past, the release of services PMI data has been a driver of Sterling given the large representation of the services sector in the UK economy. Another positive reading is expected today in the 55 area. Such an outcome would unlikely dent the market's current pricing of an 84% probability that the Bank of England hikes by 25 bps on 22 June. Far more important to that debate will be the UK April CPI data released tomorrow.”
“0.8660-0.8735 is the clear EUR/GBP range and it will probably be tomorrow's CPI figures which pose the best chance of a range break-out.”
Here is what you need to know on Tuesday, May 23:
Following Monday's choppy action, financial markets stay relatively quiet early Tuesday as investors await S&P Global PMI surveys for the Eurozone, the UK and the US. Market participants will continue to keep a close eye on headlines surrounding the debt-limit talks and comments from central bank officials.
US President Joe Biden and House Speaker Kevin McCarthy failed to reach an agreement on raising the government's $31.4 trillion debt ceiling ahead of the estimated June 1 deadline. In a statement released following the meeting, "we reiterated once again that default is off the table and the only way to move forward is in good faith toward a bipartisan agreement," Biden said. The sides are expected to continue talks over the phone throughout this week.
US stock index futures trade virtually unchanged on the day and the benchmark 10-year US Treasury bond yield holds steady above 3.7%. In the meantime, the US Dollar Index (DXY) fluctuates in a tight channel slightly below 130.50. In addition to S&P Global PMIs, the US economic docket will also feature April New Home Sales and Richmond Fed Manufacturing Index for May.
EUR/USD struggles to stage a recovery and continues to trade at around 1.0800 early Tuesday. The data from Germany showed in the European morning that the HCOB Manufacturing PMI dropped to 42.9 in May from 44.5 in April, revealing that the business activity in the manufacturing sector continued to contract at an accelerating pace.
GBP/USD stays under modest bearish pressure and edges lower toward 1.2400. Bank of England Governor (BoE) Andrew Bailey and other policymakers will be testifying before the UK Treasury Select Committee from 0915 GMT.
USD/JPY climbed toward 139.00 and touched its highest level since November during the Asian trading hours on Tuesday before staging a downward correction. As of writing, USD/JPY was trading flat on the day near 138.50. Earlier in the day, the data from Japan revealed that Jibun Bank Manufacturing PMI and Jibun Bank Services PMI improved to 50.8 and 56.3 in May, respectively.
Gold price turned south amid rising US Treasury bond yields and closed the day in negative territory. XAU/USD continues to stretch lower early Tuesday and was last seen losing nearly 1% on a daily basis below $1,960.
Following Monday's indecisive action, Bitcoin gained traction early Tuesday and climbed toward $27,300. Ethereum broke out of its two-week old horizontal channel and was last seen rising 2% on the day at $1,850.
A potential move in USD/JPY beyond the 139.00 barrier seems to have gathered steam as of late, comment Economist Lee Sue Ann and Markets Strategist Quek Ser Leang at UOB Group.
Key Quotes
24-hour view: “We did not anticipate the advance in USD to a high of 138.69 (we were expecting USD to trade in a range). While there is room for USD to advance further, it remains to be seen if it has enough momentum to break clearly above the major resistance at 139.00 today. Support is at 138.10, followed by 137.65.”
Next 1-3 weeks: “Last Friday (22 May, spot at 138.40), we highlighted that ‘while we continue to expect USD to strengthen further, overbought short-term conditions could lead to a couple of days of consolidation before USD resumes its rally (albeit likely at a slower pace)’. Yesterday, USD rose to a high of 138.69. Short-term upward momentum appears to be building again and the odds of USD breaking clearly above 139.00 have increased. The next level to focus on is 139.60. On the downside, a breach of 137.30 (‘strong support’ previously at 136.80) would indicate that the USD strength that started early last week has ended.”
CME Group’s flash data for crude oil futures markets noted traders added nearly 11K contracts to their open interest positions at the beginning of the week. Volume, instead, reversed the previous daily builds and went down by more than 151K contracts.
WTI faces extra consolidation around $72.00
Monday’s inconclusive price action left in WTI with humble gains near the $72.00 mark per barrel. The move was amidst rising open interest and declining volume, opening the door some near-term consolidation around current levels.
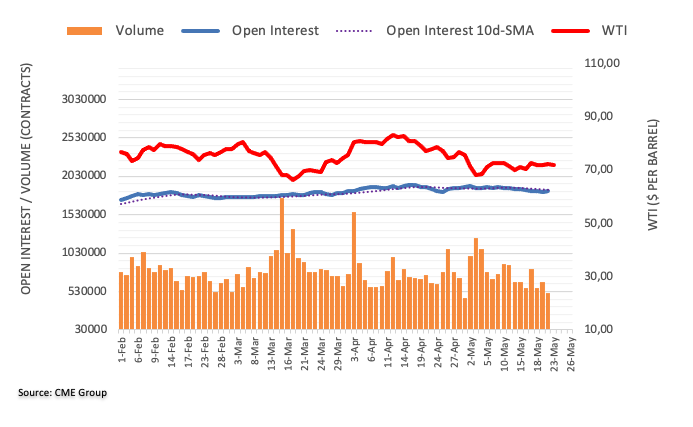
NZD/USD has now likely moved into a consolidative phase, note Economist Lee Sue Ann and Markets Strategist Quek Ser Leang at UOB Group.
Key Quotes
24-hour view: “After NZD rose to 0.6304, we highlighted yesterday that ‘the rapid advance appears to be overdone and NZD is unlikely to strengthen much further’. We expected NZD to consolidate between 0.6255 and 0.6305. In line with our expectations, NZD consolidated, albeit in a narrower range of 0.6262/0.6291. The price actions offer no fresh clues and we continue to expect NZD to consolidate between 0.6255 and 0.6305.”
Next 1-3 weeks: “There is not much to add to our update from yesterday (22 May, spot at 0.6285). As highlighted, NZD appears to have entered a consolidation phase and it is likely to trade between 0.6225 and 0.6335 for the time being.”
- German Manufacturing PMI arrives at 42.9 in May vs. 45.0 expected.
- Services PMI in Germany rises to 57.8 in May vs. 55.5 expected.
- EUR/USD extends losses below 1.0800 on mixed German PMIs.
The German manufacturing sector activity runs deeper into contraction in May while the services sector continues to showcase strength, the preliminary business activity report from the HCOB survey showed this Tuesday.
The Manufacturing PMI in Eurozone’s economic powerhouse came in at 42.9 this month, compared with 45.0 expected and 44.5 previous figure. The index hit a 36-month low.
Meanwhile, Services PMI rose from 56.0 in April to 57.8 in May as against the 55.5 print expected. The PMI reached the highest level in 21 months.
The HCOB Preliminary Germany Composite Output Index arrived at 54.3 in May vs. 53.5 expected and April’s 54.2. The gauge registered a 13-month top.
FX implications
EUR/USD is extending losses below 1.0800 on the mixed German data. The pair is trading 0.15% lower at 1.0795, at the time of writing.
The ECB's interest rate hikes so far are likely to be increasingly felt in the economy and are slowly being reflected in economic releases. But for now, the hawks have the upper hand – which is supporting the Euro, economists at Commerzbank report.
Hawkish doves
“Comments from ECB Governing Council members continue to be quite hawkish, even from the doves. However, if the upcoming data releases increasingly show that the Eurozone economy is cooling down, the doves in the Council might change their minds and push for a less restrictive stance by the ECB. But clearly, all this remains to be seen.”
“Today's data are unlikely to provide clear signals of an economic downturn yet. We will therefore probably hear more hawkish tones from the ECB's ranks for the time being, which should tend to support the EUR.”
- USD/JPY pulls back after touching a fresh YTD peak on Tuesday, albeit lacks follow-through.
- Elevated US bond yields continue to underpin the USD and act as a tailwind for the major.
- The Fed-BoJ policy divergence supports prospects for a further near-term appreciating move.
The USD/JPY pair eases from the vicinity of the 139.00 mark, or a fresh YTD peak touched earlier this Tuesday and remains on the defensive heading into the European session. The pair currently trades with a mild negative bias, around the 138.50-138.45 region, though any meaningful pullback still seems elusive.
The US Dollar (USD) holds steady just below a two-month high touched last Friday amid growing acceptance that the Federal Reserve (Fed) is likely to continue hiking interest rates, which, in turn, should act as a tailwind for the USD/JPY pair. In fact, a slew of influential FOMC members on Monday reaffirmed market bets that the US central bank will keep interest rates higher for longer. This, along with hopes that US politicians can come together on a debt ceiling deal, keeps the US Treasury bond yields elevated and continues to benefit the Greenback.
In fact, the yield on the benchmark 10-year US government bond rose for a seventh day in a row on Monday and registered its longest winning streak since April 2022. The resultant widening of the US-Japan rate differential, along with a more dovish stance adopted by the Bank of Japan (BoJ), undermine the Japanese Yen (JPY) and support prospects for the emergence of some dip-buying around the USD/JPY pair, warranting caution for bearish traders. In fact, BoJ Governor Kazuo Ueda said on Friday the central bank will continue easing with yield curve control.
The aforementioned supportive fundamental backdrop suggests that the path of least resistance for the USD/JPY pair is to the upside. Hence, any subsequent downtick is more likely to get bought into and remain limited ahead of Tuesday's release of the flash US PMI prints, due later during the early North American session. The US economic docket also features New Home Sales data and the Richmond Manufacturing Index. This, along with the US bond yields and the US debt ceiling talks, should influence the USD price dynamics and provide some impetus to the pair.
Technical levels to watch
- USD/ZAR steadies above short-term moving average, pauses the previous pullback from all-time high.
- RSI conditions suggest pullback in prices but previous resistance line from October 2022 holds gate for South African Rand buyers.
- Week-long resistance line restricts USD/ZAR run-up towards 20.00.
USD/ZAR picks up bids to reverse the previous day’s pullback from the all-time high as buyers prod the 19.26 level heading into Tuesday’s European session.
In doing so, the South African Rand (ZAR) reverses from the 10-DMA. Given the bullish MACD signals the pair is likely to extend the latest recovery towards an upward-sloping resistance line connecting the latest peaks, which are also the record high, close to 19.53.
However, the nearly overbought RSI conditions, as well as the oscillator’s inability to march the higher-high in prices, signals another pullback from the stated resistance line.
Failing to do so can gradually propel the USD/ZAR prices toward the 20.00 round figure.
On the contrary, a downside break of the 10-DMA level of around 19.20 can quickly drag the South African Rand price to the 19.00 round figure.
Though, an upward-sloping previous resistance line from October 2022, now the key support near 18.80, holds the gate for the ZAR bulls afterward.
Overall, USD/ZAR remains on the bull’s radar but the upside room appears limited.
USD/ZAR: Daily chart
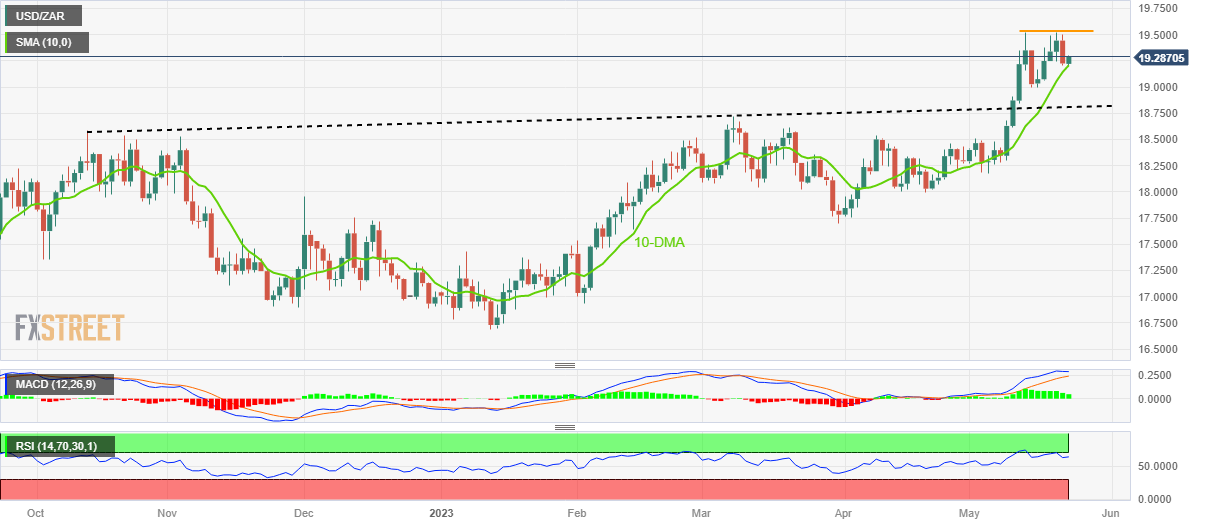
Trend: Further upside expected
NZD/USD is treading water ahead of tomorrow’s Reserve Bank of New Zealand (RBNZ). The outlook for carry is the key focus, economists at ANZ Bank report.
Most are calling for a higher OCR
“Kiwi seems to be mostly about carry now that some short-end rates are around 6%, which is world-beating.”
“With genuinely expansionary forces (migration/fiscal) behind the reasons most are calling for a higher OCR, higher rates should be NZD-beneficial, twin deficits (fiscal/trade) cast a dark shadow over the background.”
“Support 0.5750/0.5900/0.6085 Resistance 0.6365/0.6540”
- Silver price prints two-day downtrend, reverses Friday’s corrective bounce.
- Looming bear cross on MACD, sustained trading below 50-SMA keeps XAG/USD sellers hopeful.
- Silver sellers can keep 61.8% Fibonacci retracement on radar unless breaking $24.55 resistance.
Silver Price (XAG/USD) remains on the back foot around the intraday low of $23.45 heading into Tuesday’s European session.
In doing so, the bright metal drops for the second consecutive day while extending the U-turn from the 50-SMA, as well as staying below a one-week-old descending resistance line. Additionally favoring the bright metal sellers is the impending bear cross on the MACD indicator.
With this, the Silver price appears vulnerable to retesting the monthly low of nearly $23.30 marked on Friday. Also on the XAG/USD bear’s radar is the 61.8% Fibonacci retracement level of March-May upside, near $23.25.
In a case where the Silver price remains bearish past $23.25, the $23.00 could act as the last defense of the buyers.
On the flip side, the 50-SMA and one-week-old descending resistance line, close to near $23.85 and $23.90 in that order, restrict short-term recovery of the Silver price.
Even if the bright metal remains firmer past $23.90, the $24.00 round figure and a seven-week-old horizontal resistance area around $24.50-55 will be in the spotlight.
Overall, the Silver price remains on the bear’s table unless crossing $24.55.
Silver Price: Four-hour chart
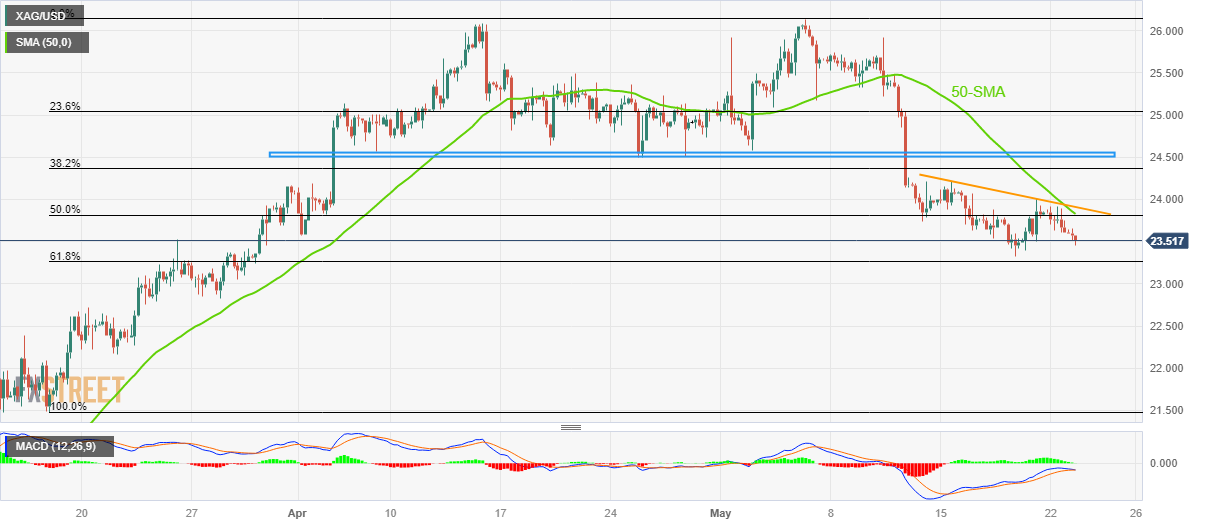
Trend: Further downside expected
Economists at Rabobank expect inflation differentials between Eurozone member states to remain substantial.
Inflation differentials likely to stick around
“Despite some convergence since the summer of 2022, inflation differentials between Eurozone member states remain substantial. Moving forward, further convergence is to be expected as energy price swings weaken, energy price passthrough fades, and the effect of government support measures falls away. The larger-than-usual disparities in core inflation, however, will likely take longer to resolve.”
“Because of the large variety in inflation rates across the block, a one-size-fits-all monetary policy is even less likely to fit everyone than in 'normal' times. So in due time, the ECB could have more to worry about than the historically high inflation itself.”
Open interest in gold futures markets extended the downtrend for yet another session on Monday, this time by around 6.1K contracts according to preliminary readings from CME Group. Volume followed suit and shrank by around 51.2K contracts after two consecutive daily drops.
Gold: The $1950 region emerges as a decent support
Gold started the week in a negative fashion amidst shrinking open interest and volume. That said, a deeper pullback seems out of favour in the very near term, while the $1950 region remains an initial and decent contention zone.
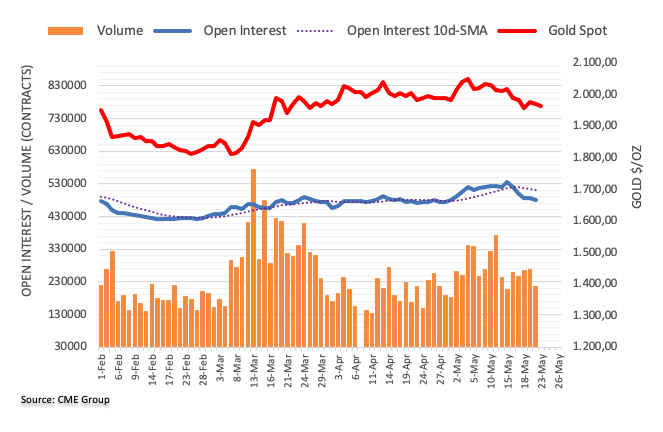
- GBP/USD is expected to display more weakness below 1.2420 as the focus shifts to BoE Bailey’s speech.
- The USD Index is facing barricades above 103.30 as the upside is capped due to further delay in US debt-ceiling issues.
- UK’s inflation is seen declining due to a fall in the oil price.
The GBP/USD pair looks vulnerable above the immediate support of 1.2420 in the early European session. The Cable is struggling in defending the nearest cushion as investors are awaiting the speech from Bank of England (BoE) Governor Andrew Bailey.
S&P500 futures are holding half of the gains added in Asia, portraying a mildly positive market mood. The US Dollar Index (DXY) is facing barricades above 103.30 as the upside is capped due to further delay in US debt-ceiling issues and the downside is being supported by hawkish commentary from Federal Reserve (Fed) policymakers.
The US Dollar Index (DXY) is expected to remain on the tenterhooks ahead of the preliminary S&P PMI figures (May). Manufacturing PMI is seen softening to 50.0 from the former release of 50.2. While Services PMI is expected to remain steady at 53.6. A second consecutive release of Manufacturing PMI above 50.0 would indicate that the manufacturing sector is coming out of the contraction phase.
On the Pound Sterling front, investors are awaiting the release of the United Kingdom’s Consumer Price Index (CPI) data. As per the preliminary report, the headline UK Consumer Price Index is seen at 8.3%, significantly lower than the prior release of 10.1% annually. Monthly headline CPI has shown a steady growth at 0.8%. Core CPI that excludes the impact of oil and food prices is expected to remain stable at 6.2%.
Going forward, the speech from BoE Andrew Bailey will remain in action. The speech from BoE’s Bailey is expected to provide the interest rate guidance for the monetary policy scheduled for June.
- USD/CAD picks up bids to recover from intraday low, remains sluggish for third consecutive day.
- Oil price retreat recently weighs on Loonie pair even as US Dollar grinds higher.
- May’s monthly PMIs for US, Oil inventory data eyed for clear directions.
USD/CAD recovers from the intraday low of 1.3485 as US Dollar rebound joins downbeat Oil prices early Tuesday in Europe. That said, the Loonie pair remains indecisive around 1.3500 by the press time.
US Dollar Index (DXY) grinds higher around 103.30 during the two-day uptrend by the press time. With this, the USD/CAD pair bears the burden of the firmer US Dollar amid hopes of avoiding the US default, despite US President Joe Biden and House Speaker Kevin McCarthy’s failure to offer a deal to avoid the debt ceiling expiry during the latest negotiations.
Apart from the US debt ceiling concerns, the recent run-up in the odds favoring the Federal Reserve’s (Fed) 0.25% rate hike in June, as well as no rate cuts in 2023, versus the Bank of Canada’s (BoC) dovish hike, also keeps the USD/CAD bulls hopeful.
On the other hand, the WTI crude oil price retreats to $72.00, reversing the week-start gains amid a firmer US Dollar and expectations that the geopolitical tensions surrounding Russia and China, coupled with the hawkish central bank's expectations may weigh on the economic transition and the energy demand. It should be noted, however, that the black gold’s weakness appears limited amid the International Energy Agency’s (IEA) expectations suggesting a fall in the Oil supplies by almost 2 million barrels per day (bpd) in the second half (H2) of the year.
While portraying the mood, S&P500 Futures remain mildly bid near 4,210, up for the second consecutive day as it reverses Friday’s pullback from a nine-month high. With the upbeat US stock Futures, as well as the mildly positive performance of Wall Street, the benchmark 10-year and two-year US Treasury bond yields pause a five-day uptrend at the highest levels in two months.
Looking forward, the US S&P Global PMIs for May and Canadian Industrial Production for April may entertain the USD/CAD traders as the full markets return. Also important to watch will be the weekly Oil inventories and updates surrounding the US debt ceiling.
Technical analysis
Back-to-back Doji candlesticks on the daily chart of the USD/CAD join steady RSI (14) to portray the latest indecision among the Loonie pair traders.
In the opinion of Economist Lee Sue Ann and Markets Strategist Quek Ser Leang at UOB Group, further downward bias in GBP/USD seems to be running out of steam.
Key Quotes
24-hour view: “Yesterday, we expected GBP to trade sideways in a range of 1.2420/1.2500. GBP then traded between 1.2414 and 1.2471 before closing largely unchanged at 1.2437 (-0.07%). Further sideways trading would not be surprising, likely between 1.2400 and 1.2480.”
Next 1-3 weeks: “We continue to hold the same view as yesterday (22 May, spot at 1.2460). As highlighted, downward momentum has slowed but only a clear break above 1.2500 (no change in ‘strong resistance’ level) would indicate that the GBP weakness that started more than a week ago (see annotations in the chart below) has come to an end. Looking ahead, if GBP breaks below 1.2390 in the next couple of days, the next level to watch is 1.2350.”
FX option expiries for May 23 NY cut at 10:00 Eastern Time, via DTCC, can be found below.
- EUR/USD: EUR amounts
- 1.0800 307m
- 1.0900 434m
- 1.0950 471m
- USD/JPY: USD amounts
- 136.50 540m
- 138.00 759m
- USD/CHF: USD amounts
- 0.8850 840m
- 0.8975 1.3b
- USD/CAD: USD amounts
- 1.3400 475m
- 1.3525 464m
- 1.3600 1.1b
- NZD/USD: NZD amounts
- 0.6300 430m
- The index alternates gains with losses around 103.30.
- No deal emerges from the Biden-McCarthy debt discussions.
- Housing data, flash PMIs next of note in the US calendar.
The greenback trades without a clear direction around the 103.30 region when gauged by the USD Index (DXY) on Tuesday.
USD Index looks at debt ceiling, data
The index looks to extend the auspicious start of the week and maintains the trade above the key barrier at 103.00 the figure amidst steady cautiousness in light of the relentless negotiations to clinch a deal around the US debt ceiling.
On the latter, an agreement was still elusive following the meeting between President Biden and House Speaker McCarthy on Monday despite news cited the productive tone surrounding the negotiations and the promise of further talks to avoid a default that could come as soon as early June according to Treasury Secretary Janet Yellen.
In the US data space, flash Manufacturing and Services PMIs are due along with New Home Sales and the speech by Dallas Fed L. Logan (voter, hawk).
What to look for around USD
The index advances gradually past the 103.00 mark against a prudent backdrop dominated by the debt ceiling negotiations.
In the meantime, monthly highs in the 103.60/65 band emerge as immediate targets for bulls amidst diminishing signals that the Fed will probably pause its normalization process in the near future, all in response to the steady resilience of key US fundamentals (employment and prices mainly).
Favouring a pause by the Fed, instead, appears the extra tightening of credit conditions in response to uncertainty surrounding the US banking sector.
Key events in the US this week: Flash Manufacturing/Services PMI, New Home Sales (Tuesday) – MBA Mortgage Applications, FOMC Minutes (Wednesday) – Initial Jobless Claims, Chicago Fed National Activity Index, Pending Home Sales, Advanced Q1 GDP Growth Rate (Thursday) – PCE/Core PCE, Durable Goods Orders, Flash Goods Trade Balance, Personal Income/Spending, Final Michigan Consumer Sentiment (Friday).
Eminent issues on the back boiler: Persistent debate over a soft/hard landing of the US economy. Terminal Interest rate near the peak vs. speculation of rate cuts in late 2023/early 2024. Fed’s pivot. Geopolitical effervescence vs. Russia and China. US-China trade conflict.
USD Index relevant levels
Now, the index is up 0.10% at 103.33 and the break above 103.62 (monthly high May 18) could open the door to 105.74 (200-day SMA) and then 105.88 (2023 high March 8). On the other hand, the next support emerges at the 55-day SMA at 102.49 seconded by 101.01 (weekly low April 26) and finally 100.78 (2023 low April 14).
- Asian markets are cautious as US debt-ceiling negotiations ended without any agreement.
- The USD Index has turned sideways around 103.30 as investors are confused about further action in the FX domain.
- Japanese equities have failed to capitalize on strong May PMI numbers.
Markets in the Asian domain are cautious as US debt-ceiling negotiations ended without any agreement that has pushed the United States economy further towards a default situation. The street was anticipating a decisive outcome of US Biden-McCarthy talks as the US borrowing cap issues have reached do-or-die time.
At the press time, Japan’s Nikkei 225 dropped 0.55%, ChinaA50 tumbled 0.88%, Hang Seng slipped 0.45%, and Nifty50 gained 0.47%.
The US Dollar Index has turned sideways around 103.30 as investors are confused about further action in the FX domain. The street is baffled about whether to support the USD index after hawkish commentaries from Federal Reserve (Fed) policymakers or to punish it due to further delay in US borrowing cap issues. An absence of selling action in the USD Index indicates that investors are confident that the US debt-ceiling will get raised ahead.
Japanese equities have failed to capitalize on strong PMI numbers. Manufacturing PMI jumped to 50.8 vs. the estimates of 49.5 while Services PMI soared to 56.3 against the estimates of 55.2. The Japanese economy is showing resilience as PMI numbers have soared after a significant expansion in Q1 Gross Domestic Product (GDP).
Chinese stocks are facing heat despite positive development in US-China trade relations. China's Commerce Minister Wang Wentao hosts a seminar for US firms investing in China on Monday and promised to provide accurate and efficient service guarantees for foreign-funded enterprises.
On the oil front, the oil price is facing barricades around $72.50 amid a further delay in US dent-ceiling negotiations.
- AUD/USD fades bounce off intraday low, turns bearish after sluggish week-start.
- Mixed prints of Aussie PMIs, hawkish Fed concerns join hopes of no US default to weigh on AUD/USD.
- Cautious optimism in the markets, sluggish yields fail to lure bulls.
AUD/USD portrays a downbeat performance on early Tuesday, following a sluggish start of the week, as it takes offers to reverse the mid-Asian session rebound from intraday low to print mild losses around 0.6650 by the press time.
In doing so, the Aussie pair bears the burden of the firmer US Dollar amid hopes of avoiding the US default, despite US President Joe Biden and House Speaker Kevin McCarthy’s failure to offer a deal to avoid the debt ceiling expiry during the latest negotiations. That said, US Dollar Index (DXY) grinds higher around 103.30 during the two-day uptrend by the press time.
On the other hand, the preliminary readings of Australia’s S&P Global PMIs for May came mixed as the Manufacturing gauge reprints 48.0 figures versus 47.3 expected whereas the Services PMI eased to 51.8 from 53.7 previous readings and 48.9 market forecasts. Further, the Composite PMI came in at 51.2 compared to 53.0 marked in April.
Elsewhere, the challenges to sentiment due to the latest West versus Russia tension and the G7 versus China tussles also weigh on the Aussie pair. Recently, Russia flaunts its ties with China and said the trade turnover may reach $200 billion, which in turn makes China more despicable to the West. Considering Australia’s ties with China, such developments keep AUD/USD grounded.
Furthermore, the recent run-up in the odds favoring the Federal Reserve’s (Fed) 0.25% rate hike in June, as well as no rate cuts in 2023, versus the Reserve Bank of Australia’s (RBA) dovish hike, also keeps the AUD/USD bears hopeful.
Against this backdrop, S&P500 Futures remain mildly bid near 4,220, up for the second consecutive day as it reverses Friday’s pullback from a nine-month high. With the upbeat US stock Futures, as well as the mildly positive performance of Wall Street, the benchmark 10-year and two-year US Treasury bond yields pause a five-day uptrend at the highest levels in two months.
Looking ahead, the US first readings of S&P Global Purchasing Managers Indexes (PMIs) for May will be important for the AUD/USD traders to watch for clear directions. Also important will be the US debt ceiling negotiations and the Fed talks.
Technical analysis
Given the AUD/USD pair’s Doji candlestick printed on Monday, as well as the pair’s sustained trading below the 21-DMA, close to 0.6675 by the press time, the bears are likely to approach a one-month-old ascending support line, around 0.6610 at the latest.
Economist Lee Sue Ann and Markets Strategist Quek Ser Leang at UOB Group suggest the likelihood of EUR/USD breaking below 1.0750 on a sustainable fashion has lost some momentum.
Key Quotes
24-hour view: “We indicated yesterday that ‘the current price movements are likely part of a consolidation phase’ and we expected EUR to trade sideways between 1.0785 and 1.0845. Our view of sideways trading was correct even though EUR traded in a narrower range than expected (1.0794/1.0831). The price movements offer no fresh clues and we continue to expect EUR to trade sideways between 1.0785 and 1.0845.”
Next 1-3 weeks: “Our update from yesterday (22 May, spot at 1.0820) still stands. As highlighted, the likelihood of EUR breaking clearly below 1.0750 has diminished. However, only a break above 1.0860 (no change in ‘strong resistance’ level) would indicate the EUR weakness that started more than a week ago has stabilized. In order not to lose further momentum, EUR has to break and stay below 1.0785 in the next 1-2 days or a breach of the ‘strong resistance’ at 1.0860 will not be surprising.”
- EUR/USD is oscillating above 1.0800 as investors are confused over further action after Monday’s US debt-ceiling meet ended without agreement.
- Federal Reserve policymakers delivered mixed responses on interest rate guidance as June’s monetary policy is approaching faster.
- European Central Bank has already warned that more than one interest rate hike is appropriate to bring down sticky inflation.
- EUR/USD is making efforts for shifting comfortably above the 50% Fibonacci retracement at 1.0806.
EUR/USD is continuously auctioning in a narrow range above the round-level support of 1.0800 in the Asian session. The major currency pair is struggling to deliver a decisive move as investors have got confused after Monday’s meeting between US Biden and House of Representatives Kevin McCarthy concluded without an agreement but remained constructive at best.
S&P500 futures have surrendered some gains added in Asia as investors are getting worried due to continuous warnings from US Treasury Secretary Janet Yellen that the United States Federal will be out of funds by June 1 in addressing its obligated payments. The risk appetite theme is fading gradually but is not outside the overall picture.
The US Dollar Index (DXY) has sensed barricades around 103.30 after a solid recovery move. The street is confused whether the US Dollar should be pushed into a positive trajectory due to hawkish commentaries from Federal Reserve (Fed) policymakers or to punish the same as fears of a default by the United States are skyrocketing.
Biden-McCarthy meeting ends without an outcome
Investors were keenly focusing on Monday’s US President Joe Biden-House of Speaker Kevin McCarthy face-to-face negotiations for raising the US debt-ceiling limit. However, the two-hour-long meeting ended without an agreement. US Biden has called partisan terms from Republicans as ‘extreme’ as the latter is not allowing extra taxes on the Wealthy community despite Democrats getting ready for some spending cuts. Republican McCarthy wants an 8% cut in overall spending in the budget for CY2024. Republicans want Democrats to return to the CY2022 budget scheme to avoid a further budget deficit.
Meanwhile, US Treasury Secretary Janet Yellen is constantly reminding related authorities that the United States economy is moving towards a default swiftly as June 01 is the deadline for addressing obligated payments.
Federal Reserve sees more rate hikes by year end
Various Federal Reserve policymakers delivered their responses on interest rate guidance on Monday as June’s monetary policy is approaching faster. The street is getting mixed views as Minneapolis Fed Bank President Neel Kashkari cited that he would support the Fed for holding interest rates in June. On Monday, he told Reuters that it may appear like the worst period of the banking turmoil is over but history showed more trouble can't be ruled out.
On the contrary, St. Louis Fed Bank President James Bullard said on Monday that the Fed wants to fight inflation amid a strong labor market. He further added that the policy rate will have to go higher this year, perhaps by 50 basis points (bps).
European Central Bank to remain hawkish due to stubborn Eurozone Inflation
In Eurozone, inflationary pressures are extremely stubborn as a decline in food prices has been offset by labor shortages, which have resulted in wage growth. European Central Bank (ECB) President Christine Lagarde has already warned that more than one interest rate hike is appropriate to bring down sticky inflation.
On Monday, European Central Bank policymaker Francois Villeroy de Galhau said "I expect today that we will be at the terminal rate not later than by summer," He further added, "Deceleration in rate increases from 50 bp to 25 bp was wise and cautious." This has allowed the ECB to push its interest rate cycle longer and has safeguarded the economy from any interest rate shocks.
EUR/USD technical outlook
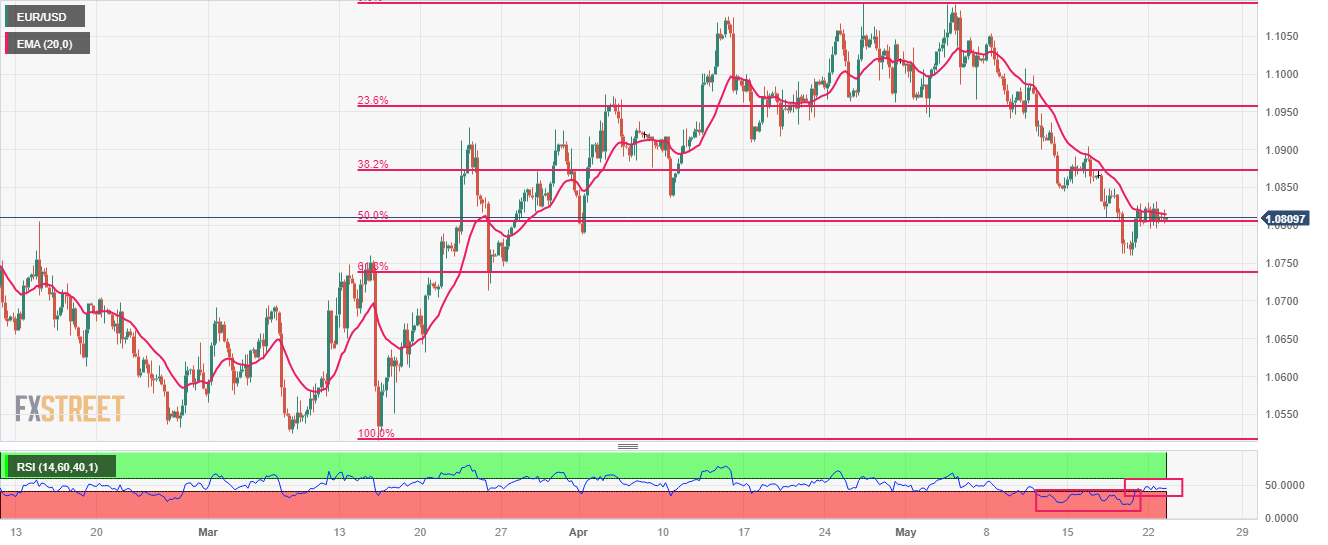
EUR/USD is making efforts for shifting comfortably above the 50% Fibonacci retracement (plotted from March 15 low at 1.0516 to April 26 high at 1.1095) at 1.0806 on a four-hour scale. The 20-period Exponential Moving Average (EMA) at 1.0813 is acting as a strong barrier for the Euro bulls.
A range shift move by the Relative Strength Index (RSI) (14) into the 40.00-60.00 zone from the bearish territory of 20.00-40.00 indicates that the downside momentum has faded for now.
- WTI crude oil fades week-start rebound amid inverse correlation with US Dollar.
- IEA warns about Oil supply shortage in H2 2023, output from Canada, OPEC+ also drop.
- US Dollar cheers hawkish Fed bets, optimism about debt ceiling despite no deal in sight.
- API’s weekly inventory data, risk catalysts and monthly PMIs eyed for clear directions.
WTI sellers approach intraday low as a firmer US Dollar joins mixed sentiment in the Oil market to weigh on the quote amid early Tuesday. In doing so, the black gold price reverses from an intraday high to $72.15 by the press time.
It’s worth noting that the black gold previously cheered hopes of a reduction in the Oil price output in the second half (H2) of the year, backed by statements from the International Energy Administration (IEA). “The International Energy Agency (IEA), meanwhile, warned of a looming oil shortage in the second half of the year when demand is expected to eclipse supply by almost 2 million barrels per day (bpd), the Paris-based agency said in its latest monthly report,” per Reuters.
Also likely to have favored the Oil price could be the wildfires in Canada and geopolitical tension between the West and Russia, not to forget the OPEC+ output cut accord. Reuters said, “Total exports of crude and oil products from OPEC+ plunged by 1.7 million bpd by May 16, JP Morgan said, adding that Russian oil exports will likely fall by late May.”
Elsewhere, China faced the heat of the Group of Seven Nations (G7) summit in Hiroshima as the global leaders discussed ‘de-risking’, or weaning themselves off an over-reliance on Chinese imports at the summit. On the same line, Russia is also at the loggerheads with the West due to its war with Ukraine and hence challenges the energy market.
Alternatively, the firmer US Dollar and hawkish hopes from the Federal Reserve, as well as economic fears surrounding China, weigh on the Oil price of late. US Dollar Index (DXY) grinds higher around 103.30 during the two-day uptrend even as US President Joe Biden and House Speaker Kevin McCarthy failed to offer a deal to avoid the debt ceiling expiry during the latest negotiations. The reason for the greenback’s run-up could be linked to the policymakers’ optimism of reaching an agreement to avoid the US default.
On the other hand, the recent run-up in the odds favoring the Federal Reserve’s (Fed) 0.25% rate hike in June, as well as no rate cuts in 2023, also underpin the US Dollar’s latest run-up and weigh on the WTI crude oil.
While the firmer US Dollar challenges the demand-supply matrix and weighs on the Oil price, today’s PMIs from the key global economies and weekly industry inventory report for the black gold, namely from the American Petroleum Institute (API) will be crucial for clear directions.
Also read: US S&P Global PMIs Preview: Dollar set to rise on a slip in the services sector
Technical analysis
Failure to cross the 21-DMA joins a downside break of a two-week-old ascending support line, close to $72.55 at the latest, to keep the WTI crude oil bears hopeful.
- USD/INR is oscillating in a narrow range above 82.80 as investors are confused due to a further delay in US debt-ceiling issues.
- The USD Index is approaching the 103.50 resistance as Fed policymakers are confident of more rate hikes this year.
- The Indian economy is going through the buzz of a ban on Rs. 2000 notes by the Reserve Bank of India.
The USD/INR pair is displaying a back-and-forth action above 82.80 in the Asian session. The major is struggling to find direction as the US Dollar Index (DXY) remained choppy overnight amid a lack of clarity over the US debt-ceiling issues.
S&P500 futures have trimmed some losses generated in early Tokyo, however, the risk impulse is still solid. The US Dollar Index has turned sideways after a solid recovery from 103.16. The USD Index is approaching the 103.50 resistance as Federal Reserve (Fed) policymakers are confident that the policy-tightening spell by the central bank could pause in June but a finale is far from over.
St. Louis Fed Bank President James Bullard said on Monday that the Fed wants to fight inflation amid a strong labor market. He further added that the policy rate will have to go higher this year, perhaps by 50 basis points (bps). No doubt, the US labor market is showing resilience as job postings have not dropped dramatically despite higher interest rates and tight credit conditions by the US regional banks.
The USD Index is also showing resilience despite a further delay in US debt-ceiling issues. Monday’s meeting remained undecided as US President Joe Biden called the proposal from Republicans ‘extreme’. House of Representatives Kevin McCarthy denied the approval of higher taxes for the Wealthy community. While Democrats are not ready to cut budget spending wrath by 8%.
Meanwhile, the Indian economy is going through the buzz of a ban on Rs. 2000 notes by the Reserve Bank of India (RBI). The deadline for returning bigger-denomination notes is scheduled for September end.
Upside in the oil price seems restricted around $72.50 as investors are worried that US Treasury could announce a default by June 01 amid the absence of a raise in the US borrowing limit. It is worth noting that India is one of the leading importers of oil in the world and the India Rupee is silent due to sideways oil price.
- Gold price takes offers to extend week-start retreat towards seven-week low marked the last Thursday.
- US Dollar ignores sluggish yields, no deal on debt ceiling.
- Hopes that US policymakers will be able to avoid default, hawkish Fed talks underpin US Dollar Index, weigh on XAU/USD.
- Monthly PMIs can entertain Gold traders but major attention will be on the risk catalysts.
Gold Price (XAU/USD) remains on the back foot around the intraday low of near $1,961 as it drops for the second consecutive day while reversing Friday’s corrective bounce amid early Tuesday in Europe. In doing so, the precious metal bears the burden of the firmer US Dollar ahead of the first readings of Purchasing Managers Indexes (PMI) for May from the leading economies including the US.
That said, US Dollar Index (DXY) grinds higher around 103.30 during the two-day uptrend even as US President Joe Biden and House Speaker Kevin McCarthy failed to offer a deal to avoid the debt ceiling expiry during the latest negotiations. The reason for the greenback’s run-up could be linked to the policymakers’ optimism of reaching an agreement to avoid the US default. “I just concluded a productive meeting with Speaker McCarthy about the need to prevent default,” said US President Biden per the White House announcements shared by Reuters late Monday. On the other hand, US House Speaker McCarthy said that meeting with Biden was productive but no debt ceiling deal.
Additionally, the recent run-up in the odds favoring the Federal Reserve’s (Fed) 0.25% rate hike in June, as well as no rate cuts in 2023, also underpin the US Dollar’s latest run-up, which in turn exerts downside pressure on the Gold price.
It’s worth noting that the fears of the US-China tension and doubts about China’s economic transition add a burden to the XAU/USD. China is one of the world’s largest Gold consumers and hence any negatives for the dragon nation can weigh on the bullion price.
Amid these plays, S&P500 Futures remain mildly bid near 4,220, up for the second consecutive day as it reverses Friday’s pullback from a nine-month high. With the upbeat US stock Futures, as well as the mildly positive performance of Wall Street, the benchmark 10-year and two-year US Treasury bond yields pause a five-day uptrend at the highest levels in two months.
Given the cautious optimism in the market, as well as the firmer US Dollar, the Gold price may witness further downside. However, the monthly PMIs and the US debt ceiling negotiations, as well as the Fed talks, should support the bearish bias.
Technical analysis
A clear downside break of a three-day-old ascending support line, now immediate resistance near $1,965, suggests further downside of the Gold price. Adding strength to the downside bias are the bearish MACD signals. However, the monthly low of around $1,950 may prod the bears as RSI appears oversold.
In a case where the Gold price remains bearish past $1,950, the late March swing low near $1,935 may lure the XAU/USD sellers.
Meanwhile, an upside break of the immediate support-turned-resistance line of near $1,965 isn’t an open ticket for the Gold buyers as the 100-HMA hurdle of near $1,974 and a downward-sloping resistance line from May 11, close to $1,977 at the latest, can challenge the XAU/USD upside.
Following that, a three-week-old descending resistance line near $1,989 will act as the last defense of the Gold Bears.
Overall, the Gold price is likely to witness further downside but the road towards the $1,900 threshold appears long and bumpy.
Gold price: Hourly chart
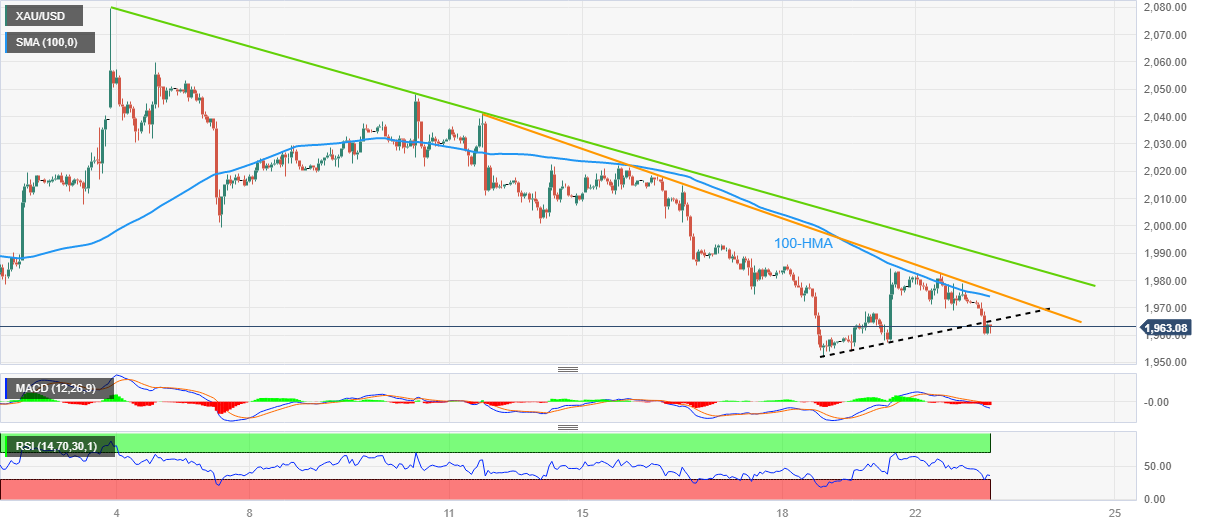
Trend: Further downside expected
- USD/CNH is marching towards a five-month high at 7.0750 amid strength in the USD Index.
- The USD Index has shown resilience despite a further delay in US debt-ceiling raise.
- USD/CNH has comfortably shifted above the horizontal resistance plotted from at 7.0157.
The USD/CNH pair has turned sideways after a decent upside move above 7.0620 in the Asian session. The asset is looking to recapture a five-month high at 7.0748 as the US Dollar Index (DXY) has defended the downside bias. The USD Index is approaching the crucial resistance of 103.50 despite the further delay in US debt-ceiling raise as Monday’s face-to-face meeting between US President Joe Biden and House of Representatives Kevin McCarthy ended without a decision.
S&P500 futures are holding gains generated in early Asia amid positive development in the United States-China relationship. China's Commerce Minister Wang Wentao hosts a seminar for US firms investing in China on Monday and promised to provide accurate and efficient service guarantees for foreign-funded enterprises.
On Tuesday, preliminary US S&P PMI (May) data will remain in the spotlight. Manufacturing PMI is seen softening to 50.0 from the former release of 50.2. While Services PMI is expected to remain steady at 53.6.
USD/CNH has comfortably shifted above the horizontal resistance plotted from 22 December 2022 high at 7.0157, which has turned into a cushion for the US Dollar bulls. The asset is expected to discover upside move ahead. A potential resistance is placed from 22 November 2022 low at 7.1316.
The 10-period Exponential Moving Average (EMA) at 7.0121 is providing support to the US Dollar bulls.
Meanwhile, the Relative Strength Index (RSI) (14) is oscillating in the bullish range of 60.00-80.00, showing no signs of divergence and an oversold situation.
For further upside, a decisive break above May 19 high at 7.0750 will drive the asset toward the round-level resistance at 7.1000 followed by 22 November 2022 low at 7.1316.
On the flip side, a downside move below May 17 low at 6.9925 would fade the upside bias and will drag the asset toward May 16 low at 6.9554 and March 30 high at 6.9123.
USD/CNH daily chart
-638204099052344733.png)
- GBP/USD struggles to defend the bounce off short-term moving average ahead of US, UK PMI numbers for May.
- Bearish MACD signals, steady RSI suggests further downside toward February’s high.
- Ascending support line from October 2022 appears a tough nut to crack for Pound Sterling bears.
- Cable buyers need validation from seven-week-old previous support line.
GBP/USD aptly portrays the pre-data anxiety as it dribbles around 1.2430 during early Tuesday morning in London. In doing so, the Cable pair marks the traders’ cautious mood ahead of the first readings of the UK’s S&P Global/CIPS PMI for May, as well as the US S&P Global PMIs for the said month.
Also read: GBP/USD recovers to 1.2450 amid US debt ceiling struggle, US/UK PMIs eyed
It’s worth noting that the quote’s downside break of a nearly two-month-old ascending trend line, marked in the last week, joins the bearish MACD signals to keep the GBP/USD sellers hopeful.
However, the steady RSI (14) line near the 50.0 level and the 50-DMA support surrounding 1.2420, quickly followed by the 1.2400 round figures, challenge the GBP/USD bears.
Following that, a quick fall towards February’s high of near 1.2270 can’t be ruled out. Though, an upward-sloping support line from October 2022, close to 1.2255 by the press time, appears a tough nut to crack for the bears.
Meanwhile, the GBP/USD pair’s recovery needs to cross the support-turned-resistance line of around 1.2500, to recall the Pound Sterling buyers.
Should the Cable price remains firmer past 1.2500, backed by upbeat UK data, the odds of witnessing a run-up toward the yearly high of 1.2680 can’t be ruled out.
GBP/USD: Daily chart
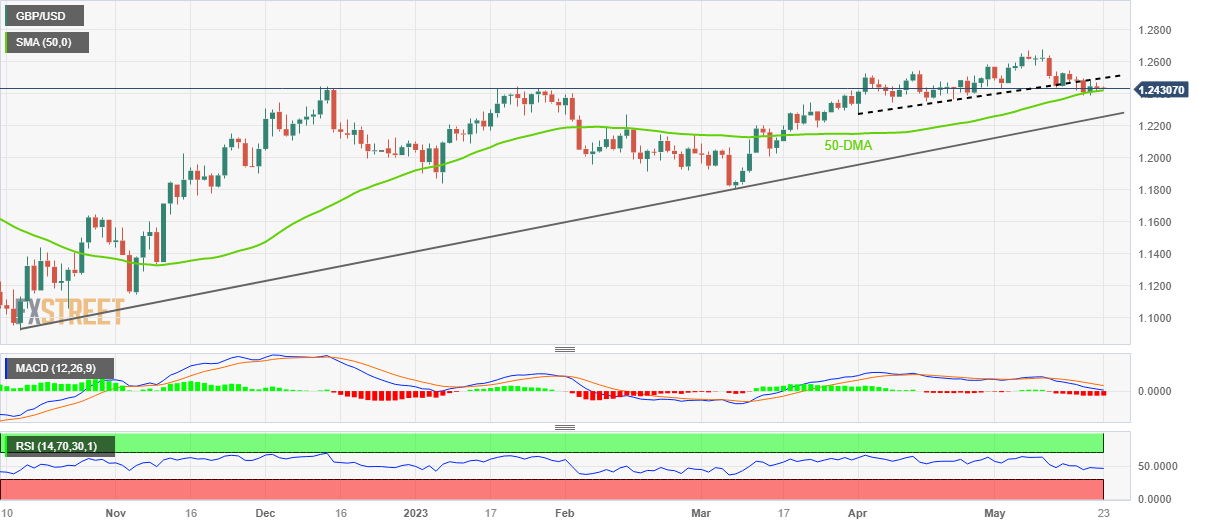
Trend: Further downside expected
- USD/JPY extends the previous day’s recovery to refresh multi-day top.
- Three-week-old ascending resistance line can join overbought RSI (14) to challenge Yen pair buyers.
- Ascending triangle restricts immediate moves, bears stay off the table unless witnessing break of two-month-long support line.
USD/JPY rises to the highest levels since the last November as it cheers the broad US Dollar strength while extending Monday’s rebound amid early Tuesday in Europe. With this, the Yen pair prints mild gains around 138.80 by the press time.
In doing so, the USD/JPY remains firmer inside a three-week-old ascending triangle, approaching the top line of the chart pattern of late. It’s worth noting, however, that the overbought RSI (14) could join the stated immediate hurdle near 139.00 to challenge the Yen pair buyers.
Even if the quote manages to cross the 139.00 hurdle, the November 30, 2022, peak of around 139.90 and the 140.00 round figure may act as additional upside filters to challenge the bulls before giving them control. Following that, the September 2022 low of 140.35 may act as the last defense of the USD/JPY bears.
On the other hand, the USD/JPY pair’s pullback remains elusive unless the quote stays beyond the aforementioned triangle’s lower line, close to the 138.00 threshold.
In a case where the Yen pair breaks the 138.00 support, one-week-old horizontal support near the mid-135.00s and the 200-SMA level of near 134.90 can challenge the bears.
It should be observed that the USD/JPY sellers need validation from an upward-sloping support line from late March, close to 134.65 at the latest, to retake control.
Overall, USD/JPY is likely to remain firmer but the road towards the north is long and bumpy.
USD/JPY: Four-hour chart
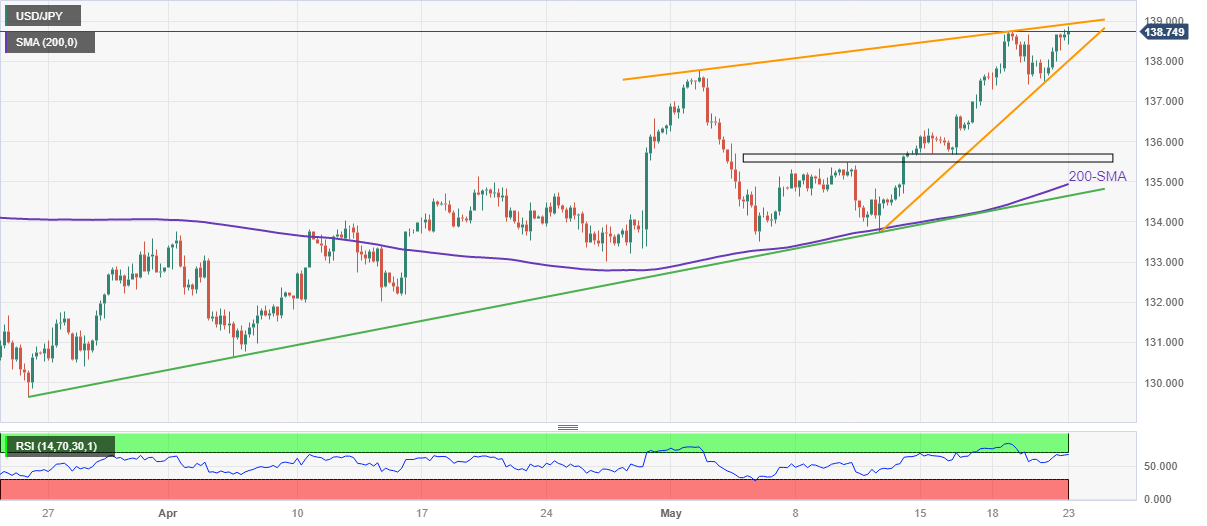
Trend: Limited upside expected
| Raw materials | Closed | Change, % |
|---|---|---|
| Silver | 23.619 | -0.93 |
| Gold | 1971.73 | -0.32 |
| Palladium | 1486.59 | -1.74 |
- USD/CHF picks up bids to refresh intraday high during the first positive day in three.
- US Dollar benefits from policymakers’ hopes of avoiding default, hawkish Fed bets, ignores immediate failure to seal debt-ceiling deal.
- Risk catalysts will be the key for directions, US PMIs can also entertain traders.
USD/CHF bulls return to the table after a two-day absence as the US Dollar ignores deadlock in debt ceiling talks to remain firmer. That said, the Swiss Franc (CHF) pair prints mild gains around 0.8990 by the press time.
US Dollar Index (DXY) grinds higher past 103.00 during the two-day uptrend, close to 103.30 at the latest, even as US President Joe Biden and House Speaker Kevin McCarthy failed to offer a deal to avoid the debt ceiling expiry during the latest negotiations.
The reason for the DXY’s rebound could be linked to the policymakers’ optimism of reaching an agreement to avoid the US default. “I just concluded a productive meeting with Speaker McCarthy about the need to prevent default,” said US President Biden per the White House announcements shared by Reuters late Monday. On the other hand, US House Speaker McCarthy said that meeting with Biden was productive but no debt ceiling deal.
Apart from the US default concerns, the hawkish Federal Reserve (Fed) bias also underpins the US Dollar’s strength and propels the USD/CHF price of late. On Monday, Minneapolis Federal Reserve President Neel Kashkari favored the rate hike trajectory while citing the fears of the US default and banking crisis, which in turn allowed the US Dollar to remain firmer. On the same line, St. Louis Federal Reserve President James Bullard ruled out the recession concerns on Monday while saying that He sees two more rate hikes this year before reaching the base rate. Furthermore, Atlanta Fed President Raphael Bostic, Richmond Fed President Thomas Barkin and San Francisco President Mary C Daly recently backed the calls for higher rates.
On a different page, downbeat prints of the Swiss Industrial Production for the first quarter (Q1) join the previously firmer US data to also favor the USD/CHF buyers.
It’s worth noting that the mildly bid S&P500 Futures prod the US bond sellers and hence challenge the USD/CHF buyers amid a sluggish Asian session.
To overcome the dull trading, the USD/CHF traders should pay attention to the US first readings of S&P Global Purchasing Managers Indexes (PMIs) for May. Should the activity data arrives firmer and suggests inflation fears, the Swiss Franc pair will have further upside to trace.
Also read: US S&P Global PMIs Preview: Dollar set to rise on a slip in the services sector
Technical analysis
USD/CHF rebounds from a two-week-old ascending support line, close to 0.8980 by the press time, backed by the price-positive oscillators. The recovery, however, remains elusive unless the quote provides a clear break of the 50-DMA, around 0.9030 at the latest.
- EUR/USD bears are in the market, testing 1.0800.
- The Fed and US debt ceiling remains the key focus.
EUR/USD fell at the start of the week and remained on the back foot on Monday with the price testing the 1.08 level within a phase of consolidation for the main part. EUR/USD is down nearly 2% for the month reversing two straight months of gain while the US Dollar stays firm on the expectations grew that US rates will remain higher for longer.
The focus was on a chorus of Federal Reserve speakers at the start of the week with some hinting that the central bank still has more to go in tightening monetary policy. Firstly, Minneapolis Fed President Neel Kashkari argued that US rates may have to go "north of 6%" and St. Louis Fed President James Bullard said that the central bank may still need to raise by 0.5%.
The US Dollar is solid as money markets are pricing in a roughly 26% chance that the Fed will deliver another 25-basis-point rate hike next month. Also, expectations of interest rate cuts later this year have also been scaled back, with rates seen holding at around 4.7% by December.
Elsewhere, the debt ceiling deadline in the United States remains a concern. President Joe Biden and House Speaker Kevin McCarthy ended discussions on Monday with no headway made on how to raise the U.S. government's $31.4 trillion debt ceiling and will keep talking with just 10 days before a possible default. ´´With the June 1 x-date rapidly approaching, markets will look for signs of progress on a debt ceiling deal,´´ analysts at TD Securities said.
While there have been positive overtures from both sides, the work is not yet complete. markets appear to be assuming that negotiations are a done deal, suggesting that any souring in tone as negotiations play out could upset risk sentiment,´´ the analysts added.
- Natural Gas price prints the first daily gains in three as it bounces off a 12-day-old ascending support line.
- Bullish MACD signals, steady RSI line joins sustained break of 50-day EMA to favor the XNG/USD bulls.
- Key Fibonacci retracement levels, 100-day EMA challenge further upside.
Natural Gas Price (XNG/USD) remains mildly bid around $2.56 during early Tuesday as the energy instrument bounces off the short-term ascending support line.
In addition to the XNG/USD rebound from a two-week-old rising support line, the bullish MACD signals and the mostly steady RSI (14) line also keep the commodity buyers hopeful.
Adding strength to the bullish bias could be the quote’s successful trading above the 50-day Exponential Moving Average (EMA).
Hence, the Natural Gas Price is likely to extend the latest recovery, which in turn highlights the 50.0% and 61.8% Fibonacci retracements of its March-April fall, respectively near $2.60 and $2.71, as the nearby important resistances.
It’s worth noting, however, that the XNG/USD bulls remain cautious unless the quote provides a daily closing beyond March’s peak of around $3.08.
That said, the $3.00 round figure and the 100-day EMA level of around $3.04 may act as extra checks for the Natural Gas price upside.
Meanwhile, a downside break of the aforementioned support line, close to $2.54 by the press time, isn’t welcome for the Natural Gas bears as the 50-day EMA level surrounding $2.50 may act as an extra filter towards the south.
Should the quote drops below $2.50, the odds of witnessing the Natural Gas Price’s gradual southward trajectory toward the monthly low of around $2.14 can’t be ruled out.
Natural Gas Price: Daily chart
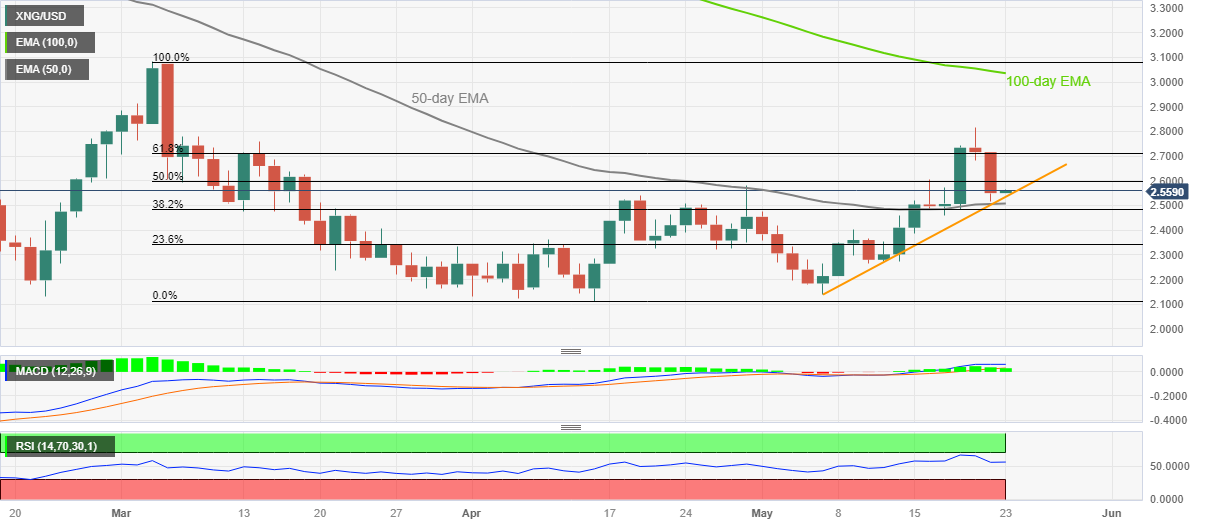
Trend: Further upside expected
- AUD/USD has shown some resilience above 0.6650 after the release of better-than-projected Aussie PMI data.
- The USD Index has recovered its entire losses posted in early Asia despite the further delay in US debt-ceiling raise.
- AUD/USD has formed an Inverted Head and Shoulder pattern, which advocates a bullish reversal after a long consolidation.
The AUD/USD pair has shown a recovery move after correcting to near 0.6650 in the Tokyo session. The Aussie asset has gained some strength despite a solid recovery in the US Dollar Index (DXY). In spite of a further delay in the US debt-ceiling negotiations, as a meeting between US President Joe Biden and House of Speaker Kevin McCarthy ended without an agreement, the USD Index has gained traction.
The release of the upbeat preliminary Australian S&P PMI (May) has infused some strength in the Australian Dollar. Manufacturing PMI has jumped to 48.0 from the expectations of 47.3 but remained in line with the former release. Also, Services PMI outperformed estimates, landed at 51.3.
The USD Index has recovered its entire losses posted in early Asia but is facing barricades in extending its rally further.
AUD/USD has formed an Inverted Head and Shoulder chart pattern on an hourly scale, which advocates a bullish reversal after a long consolidation. The Aussie asset is expected to witness a significant upside after a breakout of the neckline plotted from May 17 high at 0.6690.
The 20-period Exponential Moving Average (EMA) at 0.6650 is providing support to the Aussie bulls.
Also, the Relative Strength Index (RSI) (14) is making efforts for shifting into the bullish range of 60.00-80.00 after which a bullish momentum will get triggered.
A confident acceptance above the neckline plotted from May 17 high at 0.6690 will send the Aussie bulls firmly toward the round-level resistance at 0.6800 followed by February 06 low at 0.6855.
In an alternate scenario, US Dollar bulls will flex their muscles if the Aussie asset will drop below March 15 low at 0.6590. An occurrence of the same will expose the asset to March 08 low at 0.6568 followed by 02 November 2022 high around 0.6500.
AUD/USD hourly chart
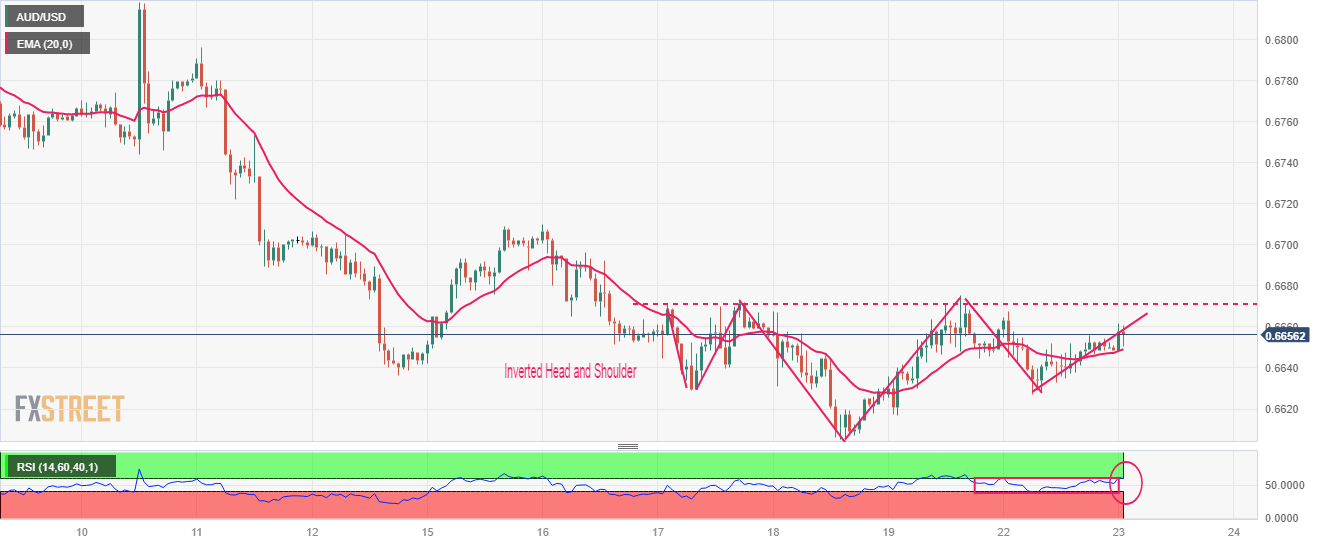
- Market sentiment remains cautiously optimistic as US policymakers fail to offer debt ceiling deal but stay hopeful of avoiding default.
- Hawkish Fed bets, Sino-American jitters are extra filters for trading amid a sluggish session.
- First readings of May’s PMIs, risk catalysts will be crucial for clear directions.
Risk profile remains dicey during early Tuesday even as the US policymakers fail to agree on pushing back to looming debt ceiling expiration in their latest round of negotiations ended before a few hours. The reason could be linked to their hopes of avoiding the US default, as well as the market’s anxiety ahead of the preliminary readings of the May month activity data for the key economies.
While portraying the mood, S&P500 Futures remain mildly bid near 4,220, up for the second consecutive day as it reverses Friday’s pullback from a nine-month high. With the upbeat US stock Futures, the benchmark 10-year and two-year US Treasury bond yields pause a five-day uptrend at the highest levels in two months whereas the US Dollar Index (DXY) grinds higher past 103.00 during the two-day uptrend, close to 103.30 by the press time.
US President Joe Biden and House Speaker Kevin McCarthy failed to offer a deal to avoid the debt ceiling expiry during the latest negotiations but the policymakers remain hopeful of reaching an agreement to avoid the US default. “I just concluded a productive meeting with Speaker McCarthy about the need to prevent default,” said US President Joe Biden per the White House announcements shared by Reuters late Monday. On the other hand, US House Speaker McCarthy said that meeting with Biden was productive but no debt ceiling deal.
On the other hand, Federal Reserve (Fed) Officials highlight inflation woes to defend the rate hike trajectory and push back the policy pivot talks. That said Minneapolis Federal Reserve President Neel Kashkari favored the rate hike trajectory while citing the fears of the US default and banking crisis, which in turn allowed the US Dollar to remain firmer. On the same line, St. Louis Federal Reserve President James Bullard ruled out the recession concerns on Monday while saying that He sees two more rate hikes this year before reaching the base rate. Furthermore, Atlanta Fed President Raphael Bostic, Richmond Fed President Thomas Barkin and San Francisco President Mary C Daly recently backed the calls for higher rates.
Elsewhere, US officials recently mentioned that they’re working directly with China on the Micron issue. Beijing banned chips from US manufacturer Micron, after terming them a security threat, which in turn gave rise to a situation where Washington and Beijing exchanged harsh words.
While the mixed sentiment and cautious optimism allow the market players to remain hopeful, the first readings of Purchasing Managers Indexes for May for the UK, Euro, Japan, Australia and the US will be crucial to watch for intraday direction. Given the upbeat PMIs, the US Dollar may witness further upside and can challenge the commodities and Antipodeans.
Also read: US S&P Global PMIs Preview: Dollar set to rise on a slip in the services sector
- USD/CAD bulls are tiring and a double top is being formed.
- The market is consolidating a symmetrical triangle.
As per a prior analysis whereby we had, USD/CAD bulls moving in to test above 1.3500, the market had moved in on the area and bulls have remained in control, as per the previous article, USD/CAD Price Analysis: 1.3550 is eyed on the new impulse.
USD/CAD prior analyses
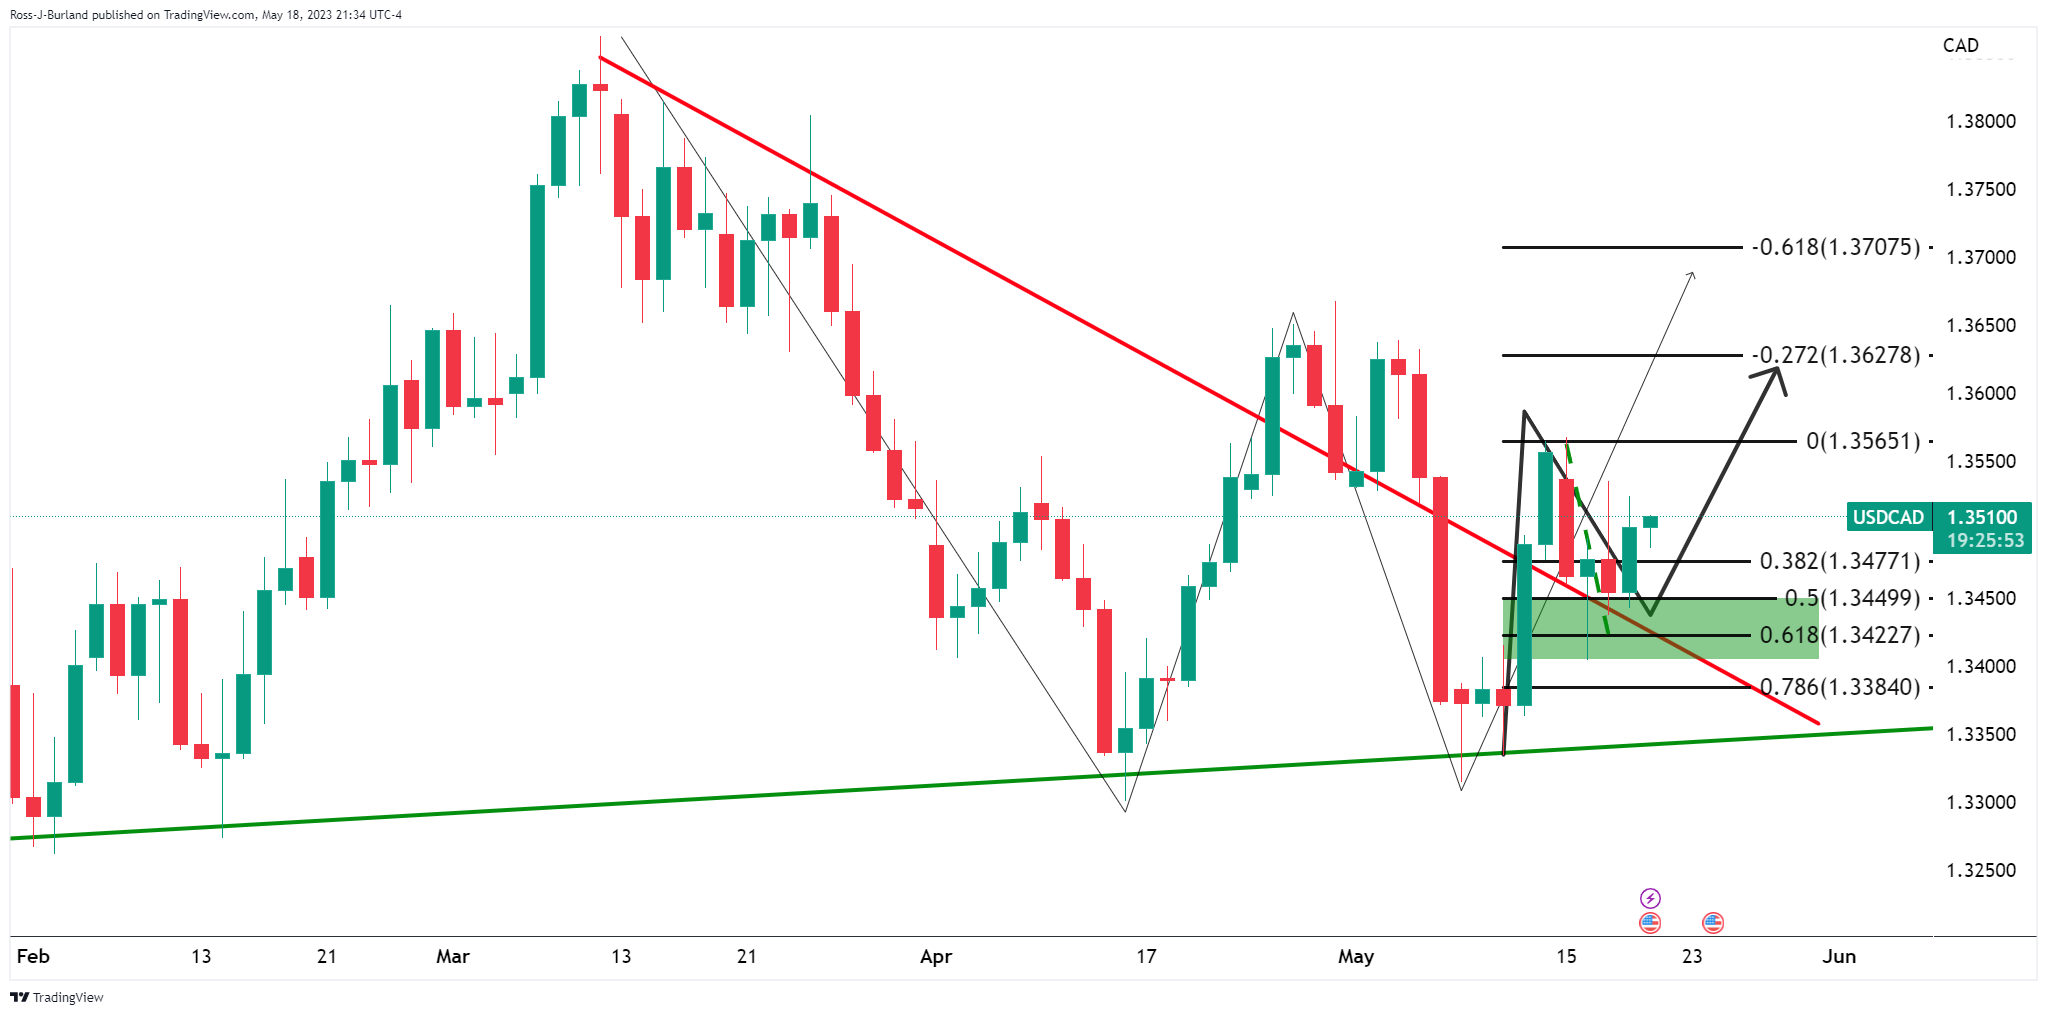
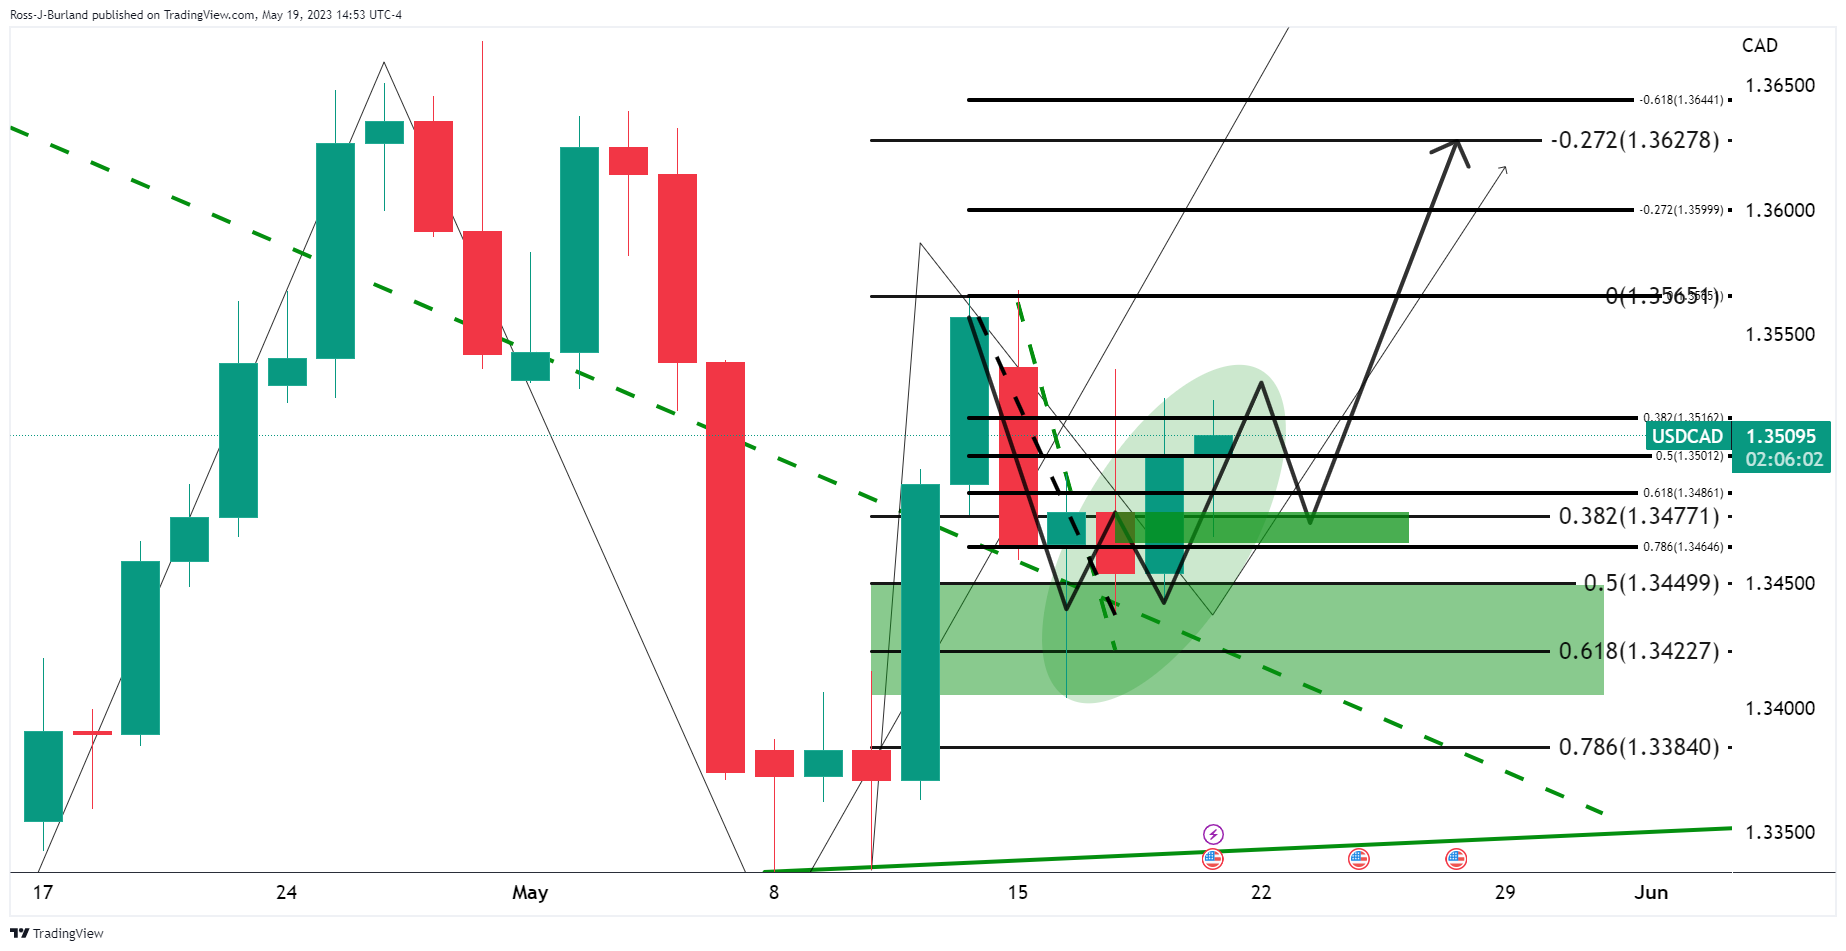
The W-formation was a reversion pattern whereby the current rally will be monitored for deceleration on the lower time frames for a bearish structure.
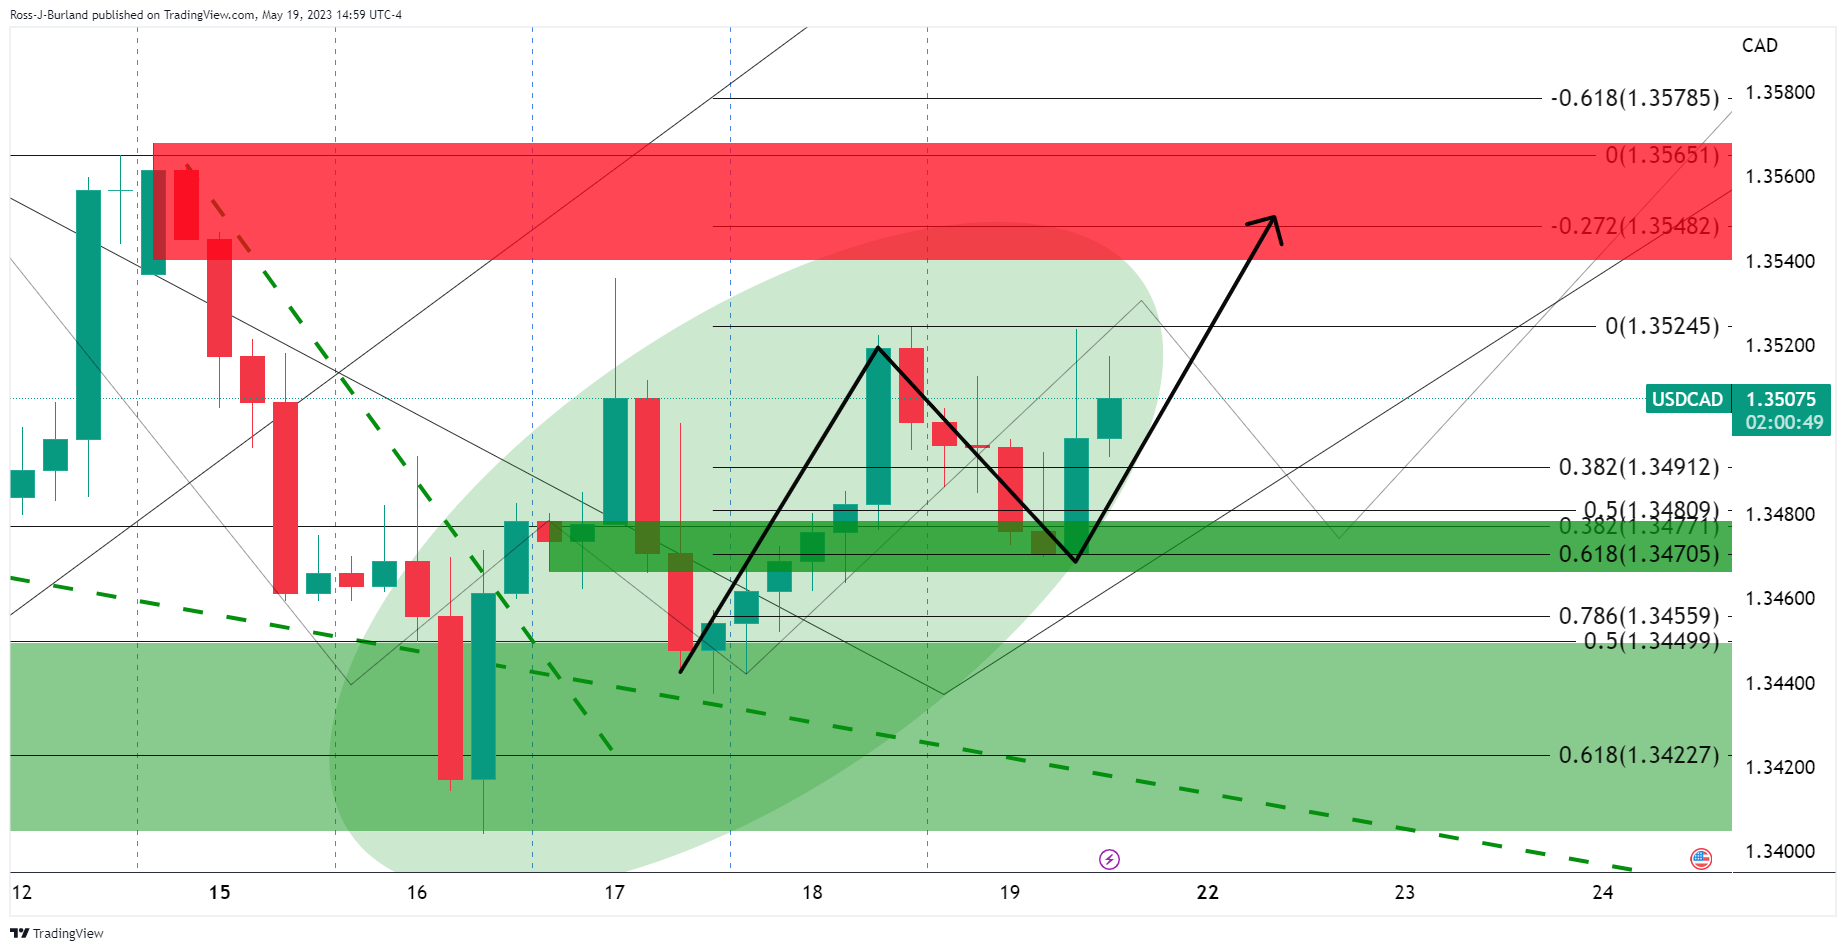
On the 4-hour chart above, the bulls were in the driver´s seat and there was a thesis that there could be a bullish continuation towards 1.3550.
USD/CAD H4 chart, live update
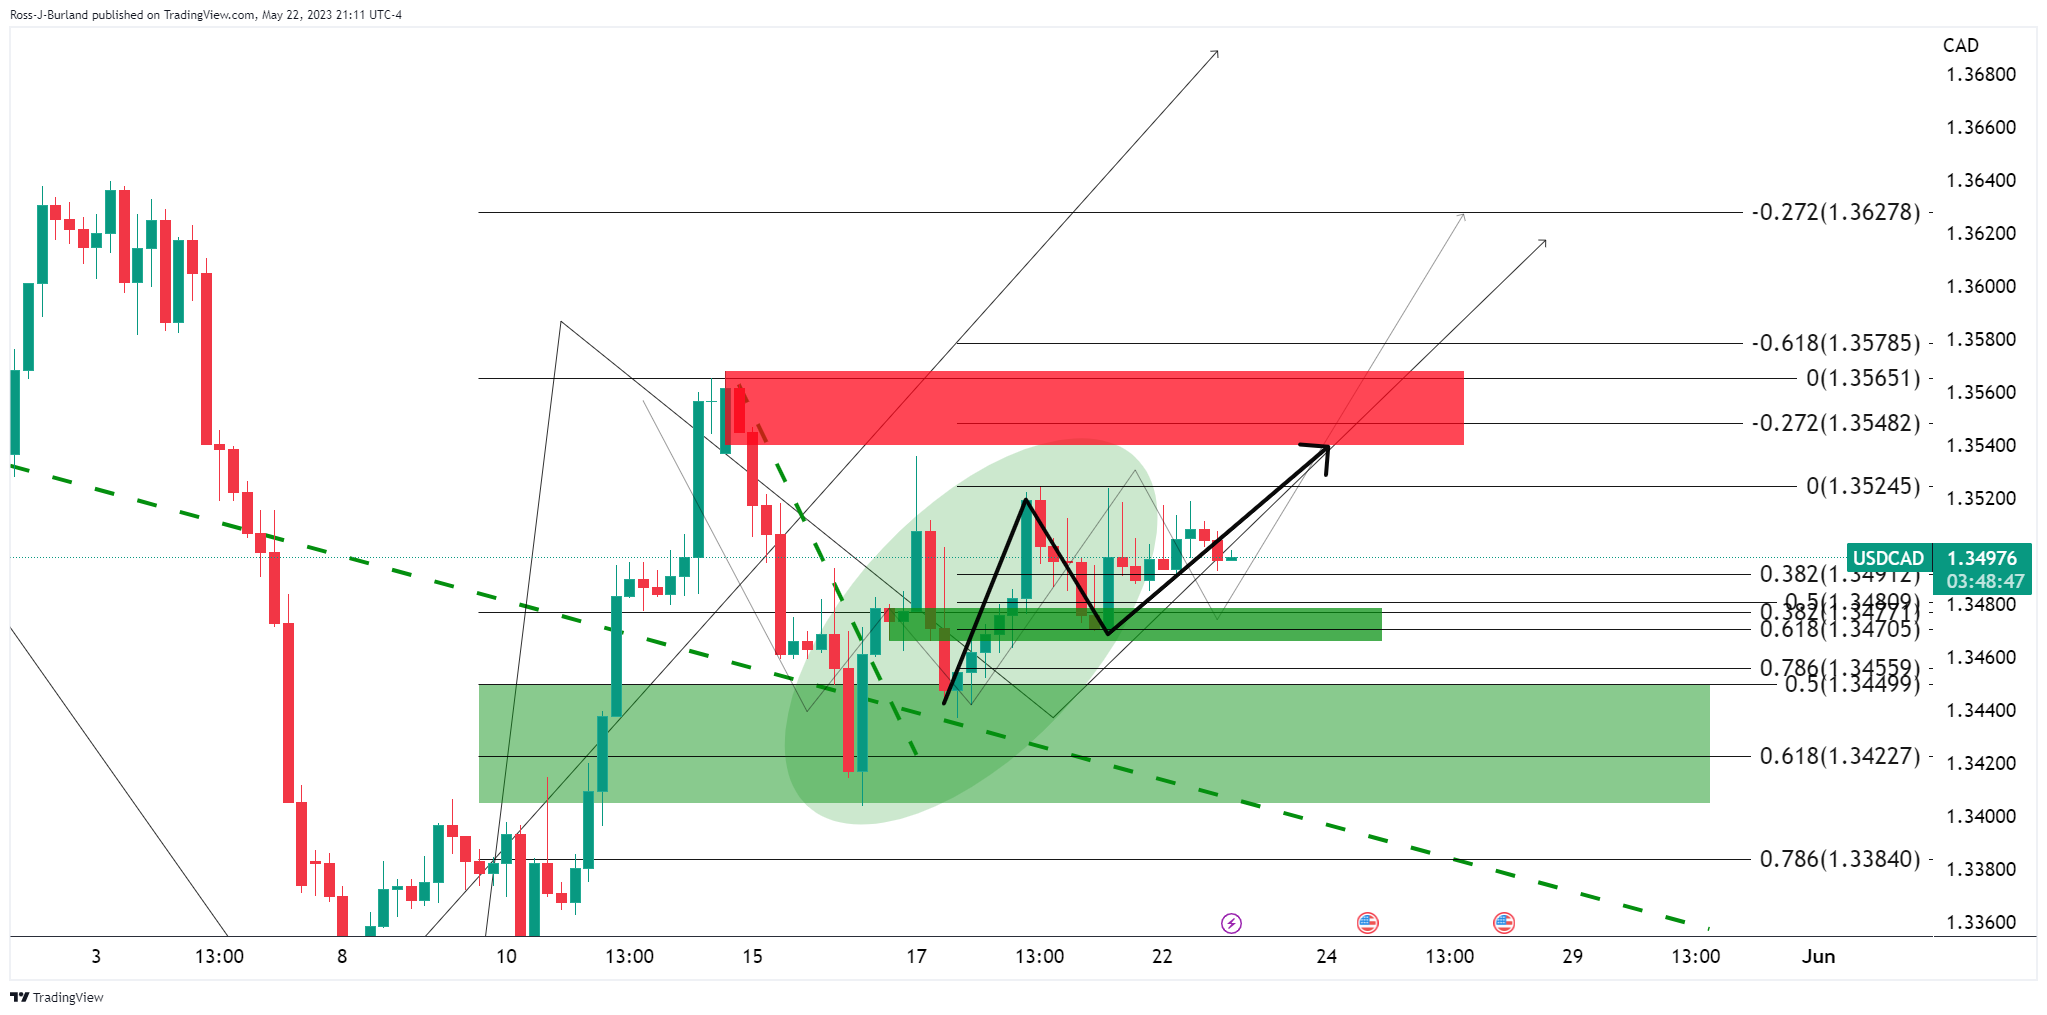
While the market is tracking higher, it is making slow progress. The concerning feature on the charts is how wicky the tops are and we could be in for a double top:
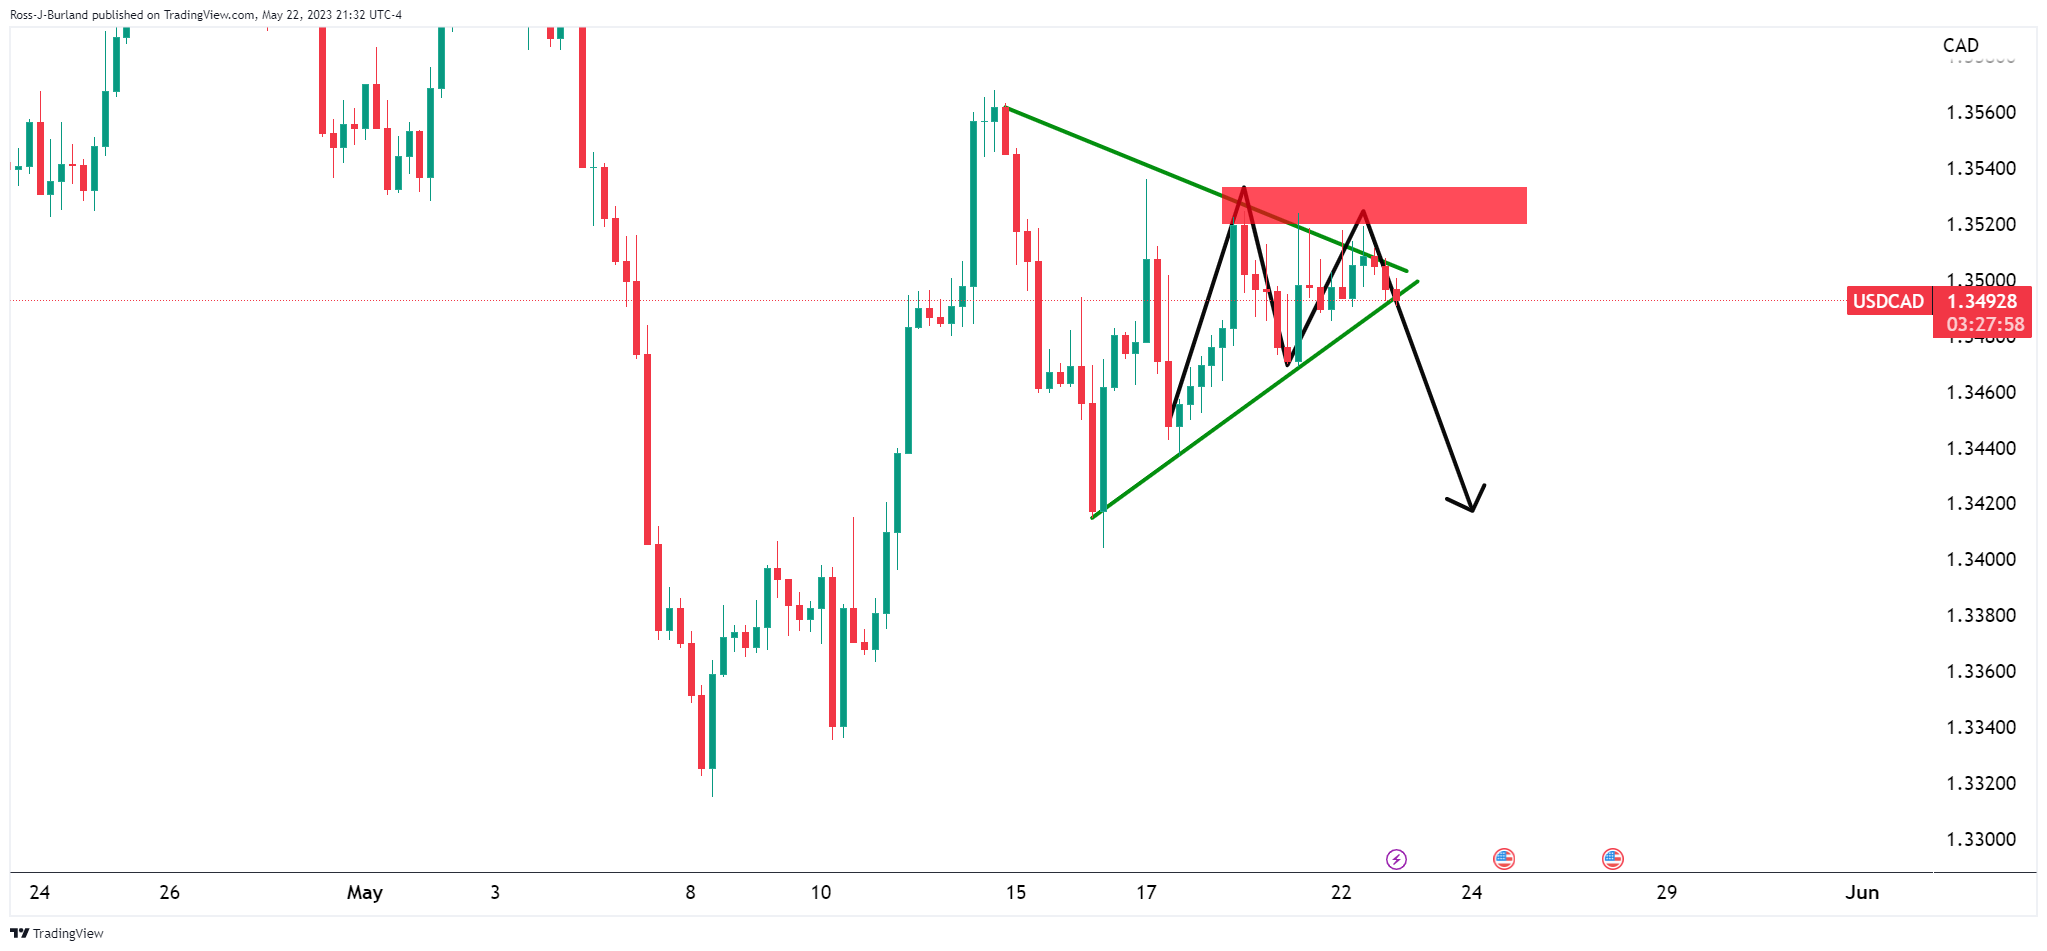
In recent trade today, the People’s Bank of China (PBOC) set the yuan at 7.0326 vs. the closing price of 7.0308.
About the fix
China maintains strict control of the yuan’s rate on the mainland.
The onshore yuan (CNY) differs from the offshore one (CNH) in trading restrictions, this last one is not as tightly controlled.
Each morning, the People’s Bank of China (PBOC) sets a so-called daily midpoint fix, based on the yuan’s previous day's closing level and quotations taken from the inter-bank dealer.
- Gold price has slipped sharply below $1,970.00 as the Fed's policy-tightening intension could delay but is far from over.
- Monday’s Biden-McCarthy meeting concluded without an agreement but remained constructive at best.
- Gold price is anticipated to deliver a sheer downside after a breakdown below the demand zone placed in a range of $1,950-1,970.
Gold price (XAU/USD) has failed in defending its immediate support of $1,970.00 in the Asian session. The precious metal has dropped firmly as the Federal Reserve (Fed) policymakers are confident that more interest rate hikes by the central bank are in the pipeline in the fight against stubborn United States inflation.
S&P500 futures have added more gains in the Asian session, portraying a strong recovery in the risk appetite. It seems that investors are confident that US President Joe Biden will get the US debt-ceiling increase ahead. However, Monday’s meeting between US Biden and House of Representatives Kevin McCarthy concluded without an agreement but remained constructive at best.
US Biden has called partisan terms from Republicans as ‘extreme’ as the latter is not allowing extra taxes on the Wealthy community despite Democrats getting ready for some spending cuts. Meanwhile, US Treasury Secretary Janet Yellen is constantly reminding related authorities that the United States economy is moving towards a default swiftly as June 01 is the deadline for addressing obligated payments.
Meanwhile, St. Louis Fed Bank President James Bullard said on Monday that the Fed wants to fight inflation amid a strong labor market. He further added that the policy rate will have to go higher this year, perhaps by 50 basis points (bps).
Gold technical analysis
Gold price is anticipated to deliver a sheer downside after a breakdown below the demand zone placed in a range of $1,950-1,970 on a four-hour scale. The 20-period Exponential Moving Average (EMA) at $1,975.54 is acting as a barricade for the Gold bulls.
The Relative Strength Index (RSI) (14) has slipped back into the bearish range of 20.00-40.00, which signals that the downside momentum has been triggered again.
Gold four-hour chart
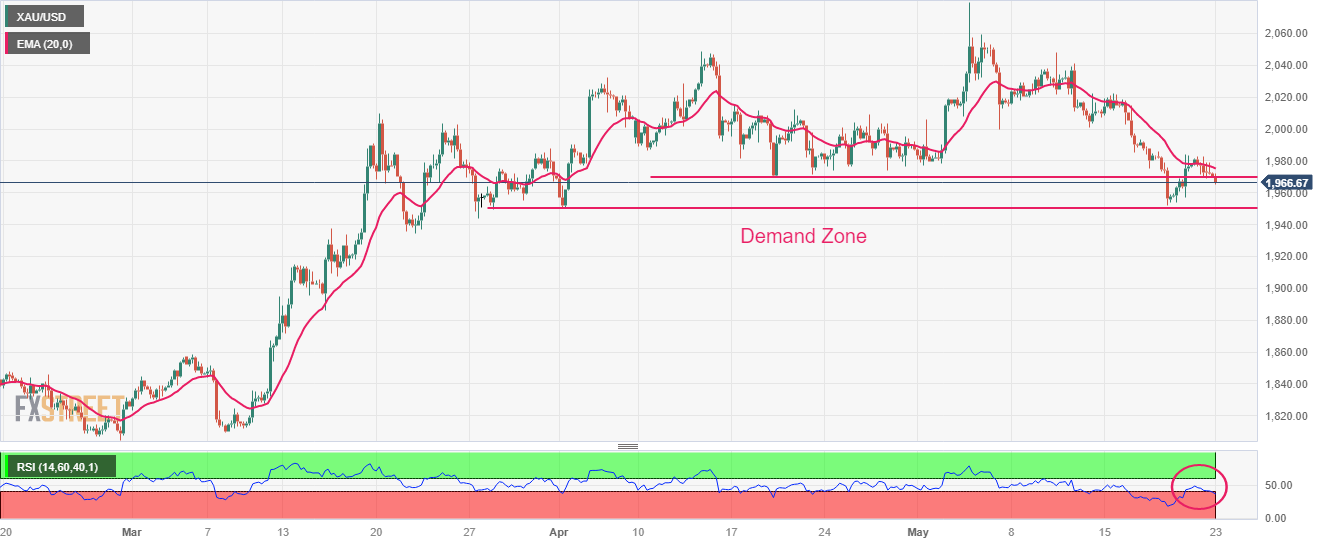
- USD/MXN snaps five-day uptrend by printing mild losses at two-week high.
- Upbeat oscillators, sustained break of 21-DMA favor Mexican Peso sellers.
- Seven-week-old descending trend line guards immediate upside ahead of the key DMAs.
USD/MXN bulls ease control after a five-day uptrend as the Mexican Peso (MXN) pair retreats from a 13-day-high to 17.89 amid early Tuesday.
Even so, the USD/MXN buyers remain hopeful amid a successful break of the 21-DMA, around 17.80 by the press time. Adding strength to the upside bias for the pair are the bullish MACD signals and the firmer RSI (14) line.
As a result, the USD/MXN bulls keep the reins despite the latest retreat. However, the buyers need conviction from a downward-sloping resistance line from early April, close to 18.00, to convince the pair buyers.
Following that, the 50-DMA and 100-DMA, respectively near 18.10 and 18.35, could test the USD/MXN bulls before giving them control. Above all, a downward-sloping resistance line from December 2022, close to 18.75 at the latest, becomes the key hurdle for the pair to cross to aim for the highs marked in March and February, close to 19.25 and 19.30.
On the flip side, a daily closing below the 21-DMA support of 17.80 could recall the Mexican Peso buyers who target 17.50 support.
Should the USD/MXN remains bearish past 17.50, the yearly low marked during mid-May around 17.40 can act as the last defense of the Mexican Peso sellers.
USD/MXN: Daily chart
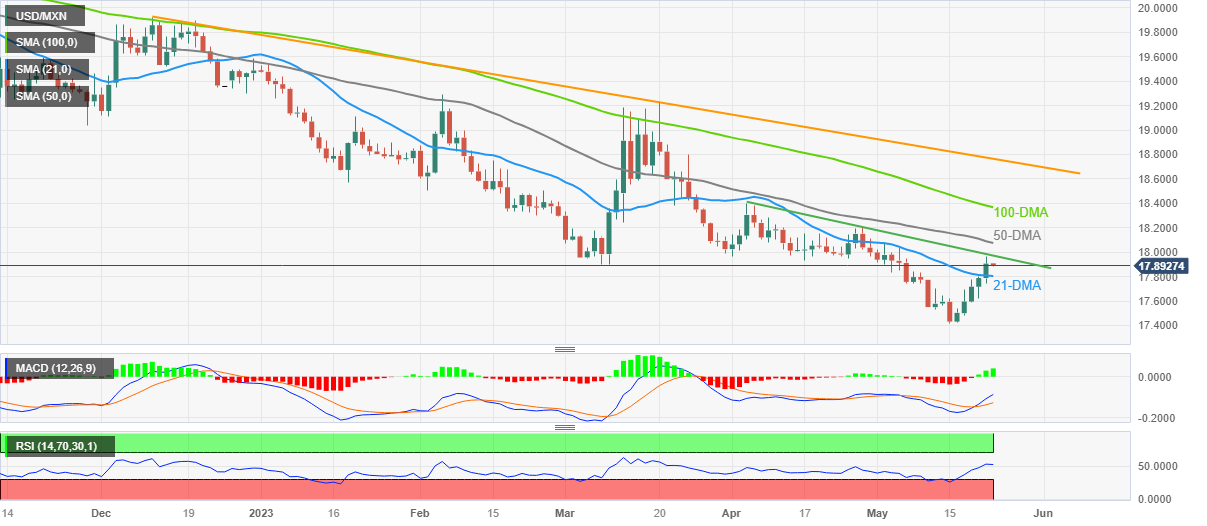
Trend: Further upside expected
- GBP/USD picks up bids to refresh intraday high, reverses the week-start loss.
- US President Biden, House Speaker McCarthy fail to offer deal on debt ceiling extension but sound hopeful of avoiding default.
- UK’s inflation fears jostle with BoE’s dovish hike to prod Pound Sterling buyers.
- UK/US Preliminary PMIs for May will guide intraday moves, risk catalysts are the key.
GBP/USD cheers the US Dollar pullback to regain upside momentum, after a downbeat start of the week, as it renews its intraday high near 1.2450 during early Tuesday. In doing so, Cable also benefits from the hawkish hopes surrounding the Bank of England (BoE) amid inflation fears.
That said, US President Joe Biden and House Speaker Kevin McCarthy failed to offer a deal to avoid the debt ceiling expiry during the latest negotiations. Even so, the policymakers remain hopeful of reaching an agreement to avoid the US default. “I just concluded a productive meeting with Speaker McCarthy about the need to prevent default,” said US President Joe Biden per the White House announcements shared by Reuters late Monday. On the other hand, US House Speaker McCarthy said that meeting with Biden was productive but no debt ceiling deal.
On the other hand, the Financial Times (FT) quotes the latest Ipsos Mori survey of 29 countries around the world while saying, “People in the UK are among the least confident that the financial authorities will bring inflation under control quickly.” It should be noted that the BoE policymakers’ expectations of easing inflation joined the hawkish Fed talks to weigh on the Pound Sterling previously.
While talking about the Fed statements, Minneapolis Federal Reserve President Neel Kashkari favored the rate hike trajectory while citing the fears of the US default and banking crisis, which in turn allowed the US Dollar to remain firmer. On the same line, St. Louis Federal Reserve President James Bullard ruled out the recession concerns on Monday while saying that He sees two more rate hikes this year before reaching the base rate. Furthermore, Atlanta Fed President Raphael Bostic, Richmond Fed President Thomas Barkin and San Francisco President Mary C Daly recently backed the calls for higher rates.
Elsewhere, market sentiment remains jittery amid the US default fears and the US-China tension. While portraying the mood, the S&P500 Futures print mild gains while tracing Wall Street’s performance whereas the US Treasury bond yields take a breather at the multi-day high.
Moving on, the first readings of the UK’s S&P Global/CIPS PMIs for May will precede the US S&P Global PMIs for the said month to direct intraday moves. However, major attention will be given to the aforementioned risk catalysts and the UK’s inflation data, to be published on Wednesday.
Also read: US S&P Global PMIs Preview: Dollar set to rise on a slip in the services sector
Technical analysis
A six-week-old ascending support line joins the 50-DMA to highlight 1.2420-15 region as the short-term key support. It’s worth noting that the oscillators and the latest GBP/USD price pattern has been less impressive for the bulls.
| Index | Change, points | Closed | Change, % |
|---|---|---|---|
| NIKKEI 225 | 278.47 | 31086.82 | 0.9 |
| Hang Seng | 227.6 | 19678.17 | 1.17 |
| KOSPI | 19.29 | 2557.08 | 0.76 |
| ASX 200 | -16.2 | 7263.3 | -0.22 |
| DAX | -51.39 | 16223.99 | -0.32 |
| CAC 40 | -13.8 | 7478.16 | -0.18 |
| Dow Jones | -140.05 | 33286.58 | -0.42 |
| S&P 500 | 0.65 | 4192.63 | 0.02 |
| NASDAQ Composite | 62.88 | 12720.78 | 0.5 |
- USD/JPY has slipped sharply below 138.50 following weak cues from the US Dollar Index.
- The USD Index has faced immense pressure as US debt-ceiling talks have been concluded without an agreement.
- Fed Kashkari cited that there is no way the Fed can protect the economy from the negative effects of default.
The USD/JPY pair has faced selling pressure as the meeting between US President Joe Biden and House of Representatives Speaker Kevin McCarthy has been concluded without an agreement. Speaker McCarthy has termed the meeting as constructive but an agreement has not been made yet. US Biden has denied agreeing over proposed spending cuts in the budget calling them ‘extreme’ while Republicans are not supportive of the proposed new taxes on the Wealthy community.
S&P500 futures are holding significant gains added in early Asia, portraying an overall upbeat market mood. The risk profile has turned positive while the US Dollar Index (DXY) is facing sheer pressure. The USD Index has tested the territory below 103.20 as investors are cautious over approval of the US debt-ceiling raise and the United States economy is inching positively towards a default, which could trigger a recession.
Apart from them, Minneapolis Fed Bank President Neel Kashkari cited that there is no way the Fed can protect the economy from the negative effects of default. Fed policymaker is interested in delivering a vote for a pause in the policy-tightening spell by the central bank but is not done with interest rate hikes yet.
Going forward, preliminary US S&P PMI data (May) will remain in the spotlight. Manufacturing PMI is seen softening to 50.0 from the former release of 50.2. While Services PMI is expected to remain steady at 53.6.
On the Japanese Yen front, a surprising recovery in economic prospects has improved the outlook for the Japanese economy. Analysts at UOB cited Japan’s growth momentum in the first quarter of CY2023 as stronger than forecast as we underestimated the impact of re-opening on private consumption and the surprise jump in business spending, while the fall in commodity prices helped further trim the country’s ballooning import bill.
- EUR/USD fades two-day rebound from the lowest levels since late March.
- Two-week-old bearish trend channel, sluggish oscillators keep Euro sellers hopeful.
- Bears need to conquer 1.0700 to topple the bulls.
EUR/USD buyers take a breather around the short-term key resistance after a two-day uptrend, making rounds to 1.0815 during early Tuesday in Asia. In doing so, the Euro pair prods the top line of a 13-day-old descending trend channel.
However, the recent easing strength of the bullish MACD signals and the sluggish RSI (14) line challenges the EUR/USD buyers in crossing the aforementioned key upside hurdle surrounding 1.0820 by the press time.
Even if the quote rises past 1.0820, a six-week-old horizontal resistance zone, near 1.0830-40, will be the key to challenging the EUR/USD bulls.
It’s worth noting, however, that the EUR/USD pair’s successful run-up beyond 1.0840, won’t hesitate to challenge the 1.1000 round figure before aiming to refresh the monthly high, currently around 1.1095.
Alternatively, pullback moves may target the latest swing low of around 1.0760 ahead of testing the 61.8% Fibonacci retracement level of the pair’s March-April upside, near 1.0735-40.
However, the EUR/USD bears may find it difficult to keep the reins past 1.0740 as the stated channel’s lower line, close to 1.0700 by the press time, may restrict the short-term downside of the pair.
Overall, EUR/USD buyers appear to run out of steam but the sellers need validation from 1.0760 to return.
EUR/USD: Four-hour chart
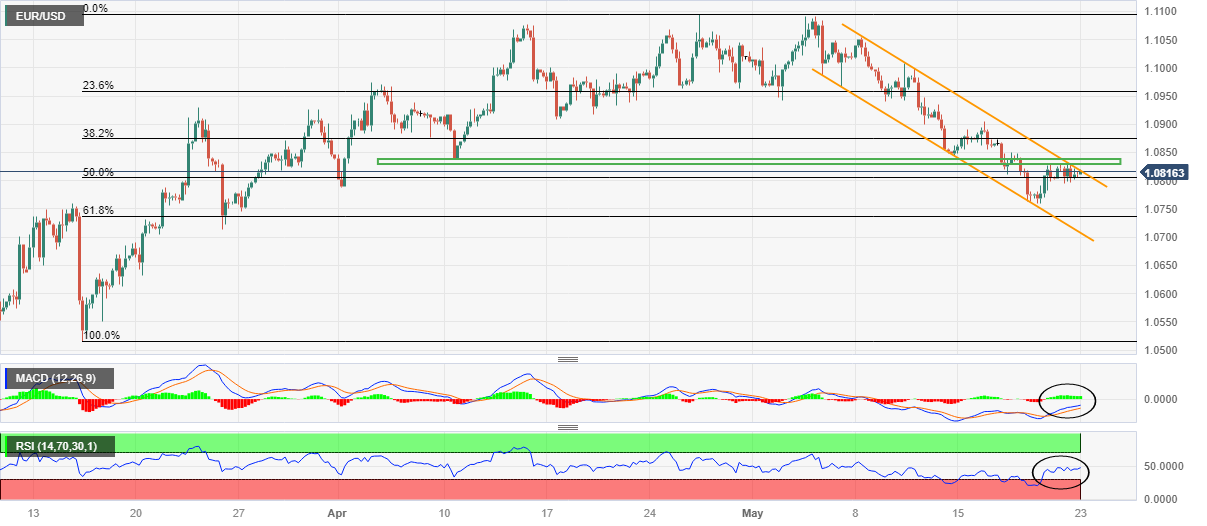
Trend: Further downside expected
| Pare | Closed | Change, % |
|---|---|---|
| AUDUSD | 0.6649 | 0.01 |
| EURJPY | 149.812 | 0.51 |
| EURUSD | 1.08116 | 0.02 |
| GBPJPY | 172.289 | 0.37 |
| GBPUSD | 1.24339 | -0.12 |
| NZDUSD | 0.62857 | 0.26 |
| USDCAD | 1.35014 | -0.02 |
| USDCHF | 0.89783 | -0.11 |
| USDJPY | 138.568 | 0.48 |
“I just concluded a productive meeting with Speaker McCarthy about the need to prevent default,” said US President Joe Biden per the White House announcements shared by Reuters late Monday.
Before him, US House Speaker Kevin McCarthy crossed wires and conveyed his optimism about reaching a deal on the US debt ceiling extension. However, US Republican Patrick Mchenry appeared less promising.
Also read: US House Speaker McCarthy: Meeting with Biden was productive but no debt ceiling deal
Additional comments
We reiterated once again that default is off the table.
We will continue to discuss the path forward.
US Dollar drops
The news fails to inspire the greenback bulls as the US Dollar Index (DXY) takes offers to refresh the intraday low near 103.18 by the press time.
- The US Dollar Index is oscillating in a narrow range above 103.20 as the US Biden-McCarthy meeting has ended without agreement.
- Mixed views from Fed policymakers over the interest rate guidance have also kept the USD Index sideways.
- The yields offered on 10-year US government bonds have jumped to near 3.72%.
The US Dollar Index (DXY) is consolidating in a narrow range above the immediate support of 103.20 in the early Asian session. The asset is expected to remain on tenterhooks as investors are awaiting the outcome of face-to-face negotiations between US President Joe Biden and House of Representatives Kevin McCarthy over the United States debt-ceiling issues.
S&P500 futures have added significant gains in the Asian session after a choppy Monday, portraying a quiet market mood.
US Biden-McCarthy negotiations over raising US borrowing cap
Investors were keeping an eye on the jaw-dropping event of face-to-face negotiations between US Biden and Speak McCarthy over raising the US borrowing cap to save the United States economy from a default. Positive development over the approval of the US debt-ceiling raise as Speaker McCarthy cited early Tuesday that we will have a deal improved market sentiment. However. the meeting has ended without an agreement on raising the US borrowing cap.
Meanwhile, US Biden is looking to officially announce the 72-hour rule under which he will wait for 72 hours and will make an immediate reaction after that. It seems that negotiations between parties are expected to remain heated as both are not comfortable with partisan terms made.
Caution over the US debt-ceiling has supported US Treasury yields further. The yields offered on 10-year US government bonds have jumped to near 3.72%.
Fed policymakers’ mixed views on interest rate guidance
While Minneapolis Federal Reserve (Fed) Bank President Neel Kashkari and Atlanta Fed Bank President Raphael Bostic remained in favor of holding interest rates steady in June, St. Louis Fed Bank President James Bullard said on Monday that the Fed wants to fight inflation amid a strong labor market. He further added that the policy rate will have to go higher this year, perhaps by 50 basis points (bps).
Apart from them, Fed chair Jerome Powell cited on Friday that tight credit conditions by the US regional banks have allowed them to keep interest rates steady as lower credit disbursals are keeping a check on US inflation.


© 2000-2026. Sva prava zaštićena.
Sajt je vlasništvo kompanije Teletrade D.J. LLC 2351 LLC 2022 (Euro House, Richmond Hill Road, Kingstown, VC0100, St. Vincent and the Grenadines).
Svi podaci koji se nalaze na sajtu ne predstavljaju osnovu za donošenje investicionih odluka, već su informativnog karaktera.
The company does not serve or provide services to customers who are residents of the US, Canada, Iran, The Democratic People's Republic of Korea, Yemen and FATF blacklisted countries.
Izvršenje trgovinskih operacija sa finansijskim instrumentima upotrebom marginalne trgovine pruža velike mogućnosti i omogućava investitorima ostvarivanje visokih prihoda. Međutim, takav vid trgovine povezan je sa potencijalno visokim nivoom rizika od gubitka sredstava. Проведение торговых операций на финанcовых рынках c маржинальными финанcовыми инcтрументами открывает широкие возможноcти, и позволяет инвеcторам, готовым пойти на риcк, получать выcокую прибыль, но при этом неcет в cебе потенциально выcокий уровень риcка получения убытков. Iz tog razloga je pre započinjanja trgovine potrebno odlučiti o izboru odgovarajuće investicione strategije, uzimajući u obzir raspoložive resurse.
Upotreba informacija: U slučaju potpunog ili delimičnog preuzimanja i daljeg korišćenja materijala koji se nalazi na sajtu, potrebno je navesti link odgovarajuće stranice na sajtu kompanije TeleTrade-a kao izvora informacija. Upotreba materijala na internetu mora biti praćena hiper linkom do web stranice teletrade.org. Automatski uvoz materijala i informacija sa stranice je zabranjen.
Ako imate bilo kakvih pitanja, obratite nam se pr@teletrade.global.
транcфери