- Phân tích
- Tin tức và các công cụ
- Tin tức thị trường
- Gold Price Forecast: Battle lines well-mapped for XAU/USD ahead of key US inflation – Confluence Detector
Gold Price Forecast: Battle lines well-mapped for XAU/USD ahead of key US inflation – Confluence Detector
- Gold price tests the higher levels once again amid steady USD, Treasury yields.
- Gold traders remain cautious of the critical US inflation data, Fed minutes.
- Gold on the back foot as NFP fails to alter taper prospects.
Gold price is posting modest gains but remains well within the recent trading range above the $1750 level so far this Tuesday. A flight to safety amid intensifying stagflation fears offers support to the traditional safe-haven gold. Further, a pause in the US Treasury yields rally aides the rebound in gold price. However, the Fed’s tapering expectations continue to limit gold’s upside potential, as investors await the return of full markets and Wednesday’s critical US inflation report for a fresh directional move in gold price.
Read: Gold Price Forecast: Will XAU/USD find a foothold above 21-DMA? US inflation in focus
Gold Price: Key levels to watch
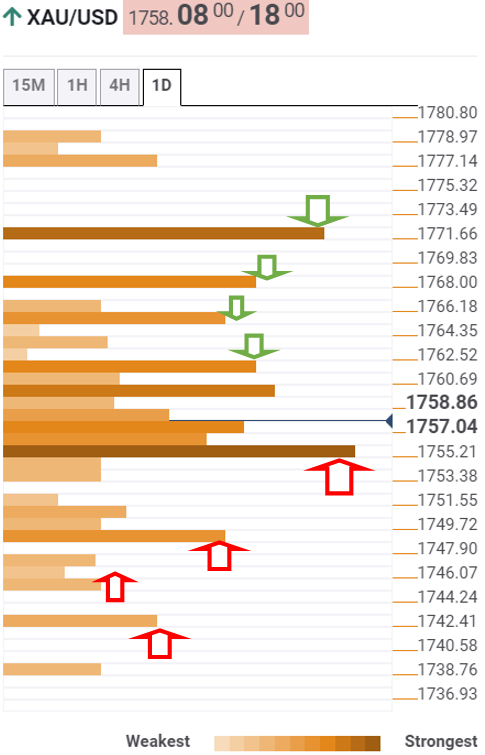
According to the Technical Confluences Detector, gold is moving back and forth, without a clear directional bias, with a bunch of healthy barriers stacked up in either direction.
Immediate upside is capped at $1762, which is the convergence of the Bollinger Band one-hour Upper and the previous day’s high.
The next significant topside hurdle is seen at $1765, where the Fibonacci 38.2% one-month aligns.
The Fibonacci 61.8% one-week at $1767 will then challenge the bearish commitments.
Gold bulls need to find acceptance above the pivot point one-day R3 at $1771 to initiate a meaningful uptrend.
Alternatively, gold buyers will once again challenge bids at $1755, the convergence of the Fibonacci 23.6% one-week and Fibonacci 38.2% one-day.
A sustained move below the latter will expose the $1750 psychological level, below which the next downside target at $1748 could get tested. That level is the Fibonacci 23.6% one-month.
The next cushion appears around $1745, where the previous week’s low intersects the pivot point one-day S2.
The pivot point one-week S1 at $1741 will be the level to beat for gold bears.
Here is how it looks on the tool
About Technical Confluences Detector
The TCD (Technical Confluences Detector) is a tool to locate and point out those price levels where there is a congestion of indicators, moving averages, Fibonacci levels, Pivot Points, etc. If you are a short-term trader, you will find entry points for counter-trend strategies and hunt a few points at a time. If you are a medium-to-long-term trader, this tool will allow you to know in advance the price levels where a medium-to-long-term trend may stop and rest, where to unwind positions, or where to increase your position size.


© 2000-2026. Bản quyền Teletrade.
Trang web này được quản lý bởi Teletrade D.J. LLC 2351 LLC 2022 (Euro House, Richmond Hill Road, Kingstown, VC0100, St. Vincent and the Grenadines).
Thông tin trên trang web không phải là cơ sở để đưa ra quyết định đầu tư và chỉ được cung cấp cho mục đích làm quen.
Giao dịch trên thị trường tài chính (đặc biệt là giao dịch sử dụng các công cụ biên) mở ra những cơ hội lớn và tạo điều kiện cho các nhà đầu tư sẵn sàng mạo hiểm để thu lợi nhuận, tuy nhiên nó mang trong mình nguy cơ rủi ro khá cao. Chính vì vậy trước khi tiến hành giao dịch cần phải xem xét mọi mặt vấn đề chấp nhận tiến hành giao dịch cụ thể xét theo quan điểm của nguồn lực tài chính sẵn có và mức độ am hiểu thị trường tài chính.
Sử dụng thông tin: sử dụng toàn bộ hay riêng biệt các dữ liệu trên trang web của công ty TeleTrade như một nguồn cung cấp thông tin nhất định. Việc sử dụng tư liệu từ trang web cần kèm theo liên kết đến trang teletrade.vn. Việc tự động thu thập số liệu cũng như thông tin từ trang web TeleTrade đều không được phép.
Xin vui lòng liên hệ với pr@teletrade.global nếu có câu hỏi.
ngân hàng