- Phân tích
- Tin tức và các công cụ
- Tin tức thị trường
- Gold Price Forecast: $1791 appears a tough nut to crack for XAU/USD bulls – Confluence Detector
Gold Price Forecast: $1791 appears a tough nut to crack for XAU/USD bulls – Confluence Detector
- Gold price extends previous gains, with eyes again on the $1791 level.
- Gold bulls defy the uptick in the USD, as Treasury yields pare gains.
- Gold: Sellers defend $1,800, all eyes on US T-bond yields.
Gold price is holding the higher ground, extending the previous advance amid a pullback in the US 10-year Treasury yields from five-month highs of 1.672%. However, with the risk-off mood seeping back into the market, amid mixed European corporate earnings, the US dollar is finding its feet across the board, which could likely cap the upside in gold price. In absence of the first-tier US economic data, the broader market sentiment will continue to lead the way while investors will closely follow the price action in the yields and the dollar.
Read: Gold Price Forecast: XAU/USD’s bullish potential appears limited amid bear cross, firmer yields
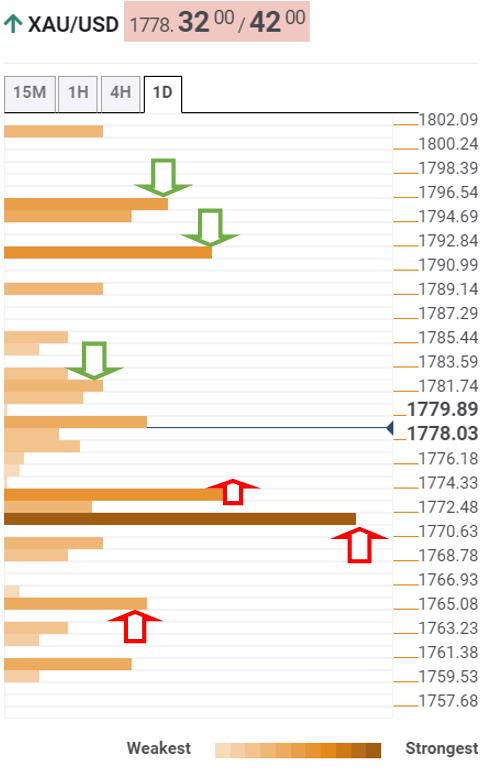
Gold Price: Key levels to watch
According to the Technical Confluences Detector, gold eyes a smooth sail towards the Fibonacci 23.6% one-week at $1789.
However, a bunch of minor resistance levels stacked up around $1783 could challenge the bullish attempts. That zone is the confluence of the Fibonacci 38.2% one-week, pivot point one-day R1 and Fibonacci 23.6% one-day.
The crucial upside target at $1791 still remains on gold buyers’ radars. That level is the intersection of the Fibonacci 61.8% one-month and Bollinger Band one-hour Upper.
Sellers will then need to the defend $1795, which is the convergence of the SMA100 and 200 one-day.
On the flip side, strong support awaits at $1774, the point where the previous low four-hour coincides with the SMA10 four-hour.
The confluence of the SMA200 four-hour, Fibonacci 61.8% one-day and SMA50 four-hour at $1771 will be the level to beat for gold bears.
The next downside target is envisioned at the Fibonacci 38.2% one-month at $1766.
Here is how it looks on the tool
About Technical Confluences Detector
The TCD (Technical Confluences Detector) is a tool to locate and point out those price levels where there is a congestion of indicators, moving averages, Fibonacci levels, Pivot Points, etc. If you are a short-term trader, you will find entry points for counter-trend strategies and hunt a few points at a time. If you are a medium-to-long-term trader, this tool will allow you to know in advance the price levels where a medium-to-long-term trend may stop and rest, where to unwind positions, or where to increase your position size.


© 2000-2026. Bản quyền Teletrade.
Trang web này được quản lý bởi Teletrade D.J. LLC 2351 LLC 2022 (Euro House, Richmond Hill Road, Kingstown, VC0100, St. Vincent and the Grenadines).
Thông tin trên trang web không phải là cơ sở để đưa ra quyết định đầu tư và chỉ được cung cấp cho mục đích làm quen.
Giao dịch trên thị trường tài chính (đặc biệt là giao dịch sử dụng các công cụ biên) mở ra những cơ hội lớn và tạo điều kiện cho các nhà đầu tư sẵn sàng mạo hiểm để thu lợi nhuận, tuy nhiên nó mang trong mình nguy cơ rủi ro khá cao. Chính vì vậy trước khi tiến hành giao dịch cần phải xem xét mọi mặt vấn đề chấp nhận tiến hành giao dịch cụ thể xét theo quan điểm của nguồn lực tài chính sẵn có và mức độ am hiểu thị trường tài chính.
Sử dụng thông tin: sử dụng toàn bộ hay riêng biệt các dữ liệu trên trang web của công ty TeleTrade như một nguồn cung cấp thông tin nhất định. Việc sử dụng tư liệu từ trang web cần kèm theo liên kết đến trang teletrade.vn. Việc tự động thu thập số liệu cũng như thông tin từ trang web TeleTrade đều không được phép.
Xin vui lòng liên hệ với pr@teletrade.global nếu có câu hỏi.
ngân hàng