- Phân tích
- Tin tức và các công cụ
- Tin tức thị trường
- Gold Price Forecast: XAU/USD faces a wall of resistance near $1791 – Confluence Detector
Gold Price Forecast: XAU/USD faces a wall of resistance near $1791 – Confluence Detector
- Gold price stalls its three-day uptrend, as USD recovers ground broadly.
- Gold’s retreat remains capped by easing Treasury yields amid risk-off mood.
- Gold: Sellers defend $1,800, all eyes on US T-bond yields.
Gold price is consolidating the three-day winning streak, although the bulls appear to lack follow-through upside amid a rebound in the US dollar across the board. Mixing European earnings reports and China’s property sector woes are weighing on the investors’ sentiment, boding well for the safe-haven dollar while capping the upside in gold price. Going forward, the broader risk sentiment will continue to remain the market driver, impacting the USD valuations, in turn, gold’s.
Read: Gold Price Forecast: Will XAU/USD find acceptance above channel hurdle at $1791?
Gold Price: Key levels to watch
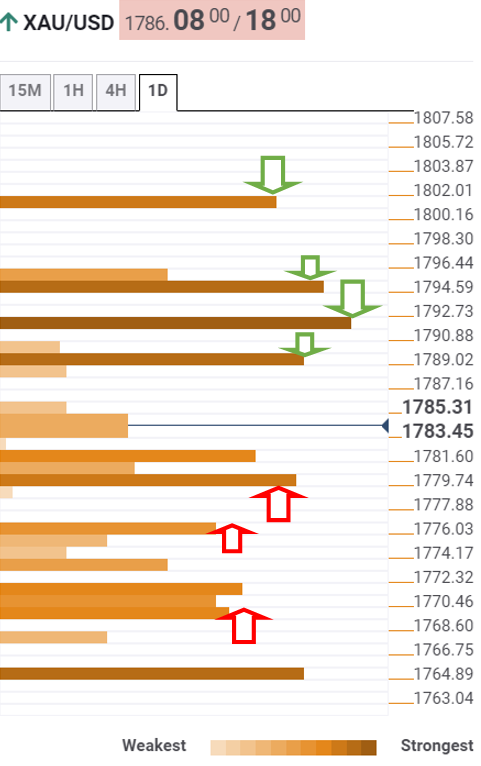
The Technical Confluences Detector shows that gold is heading back towards the daily highs of $1789, where the Fibonacci 23.6% one-week aligns.
If that barrier is crossed on a sustained basis, then gold bulls will target the next crucial resistance at $1791, the confluence of the Fibonacci 61.8% one-month and pivot point one-day R1.
Further up, gold will face another critical resistance at $1795, the convergence of the pivot point one-week R1, SMA100 and 200 one-day.
The last line of defense for gold sellers is the intersection of the previous week’s high and pivot point one-day R2 at $1801.
On the flip side, a dense cluster of support levels awaits around $1780, where the Fibonacci 38.2% one-week meets with the Fibonacci 38.2% one-day.
The next cushion is placed at $1776, the confluence of the Fibonacci 61.8% one-day and SMA5 one-day.
$1769 will challenge the bullish commitment, as the SMA10 one-day, pivot point one-day S1 SMA200 four-hour and Fibonacci 61.8% one-week coincide at that level.
Here is how it looks on the tool
About Technical Confluences Detector
The TCD (Technical Confluences Detector) is a tool to locate and point out those price levels where there is a congestion of indicators, moving averages, Fibonacci levels, Pivot Points, etc. If you are a short-term trader, you will find entry points for counter-trend strategies and hunt a few points at a time. If you are a medium-to-long-term trader, this tool will allow you to know in advance the price levels where a medium-to-long-term trend may stop and rest, where to unwind positions, or where to increase your position size.


© 2000-2026. Bản quyền Teletrade.
Trang web này được quản lý bởi Teletrade D.J. LLC 2351 LLC 2022 (Euro House, Richmond Hill Road, Kingstown, VC0100, St. Vincent and the Grenadines).
Thông tin trên trang web không phải là cơ sở để đưa ra quyết định đầu tư và chỉ được cung cấp cho mục đích làm quen.
Giao dịch trên thị trường tài chính (đặc biệt là giao dịch sử dụng các công cụ biên) mở ra những cơ hội lớn và tạo điều kiện cho các nhà đầu tư sẵn sàng mạo hiểm để thu lợi nhuận, tuy nhiên nó mang trong mình nguy cơ rủi ro khá cao. Chính vì vậy trước khi tiến hành giao dịch cần phải xem xét mọi mặt vấn đề chấp nhận tiến hành giao dịch cụ thể xét theo quan điểm của nguồn lực tài chính sẵn có và mức độ am hiểu thị trường tài chính.
Sử dụng thông tin: sử dụng toàn bộ hay riêng biệt các dữ liệu trên trang web của công ty TeleTrade như một nguồn cung cấp thông tin nhất định. Việc sử dụng tư liệu từ trang web cần kèm theo liên kết đến trang teletrade.vn. Việc tự động thu thập số liệu cũng như thông tin từ trang web TeleTrade đều không được phép.
Xin vui lòng liên hệ với pr@teletrade.global nếu có câu hỏi.
ngân hàng