- Phân tích
- Tin tức và các công cụ
- Tin tức thị trường
- NZD/JPY Price Analysis: Upside move capped at 82.50, dip buyers could emerge around 81.00
NZD/JPY Price Analysis: Upside move capped at 82.50, dip buyers could emerge around 81.00
- A downbeat market sentiment put a lid on the NZD/JPY ten-day rally.
- NZD/JPY: The daily chart indicates the pair is tilted to the upside, but the RSI confirms a correction is underway.
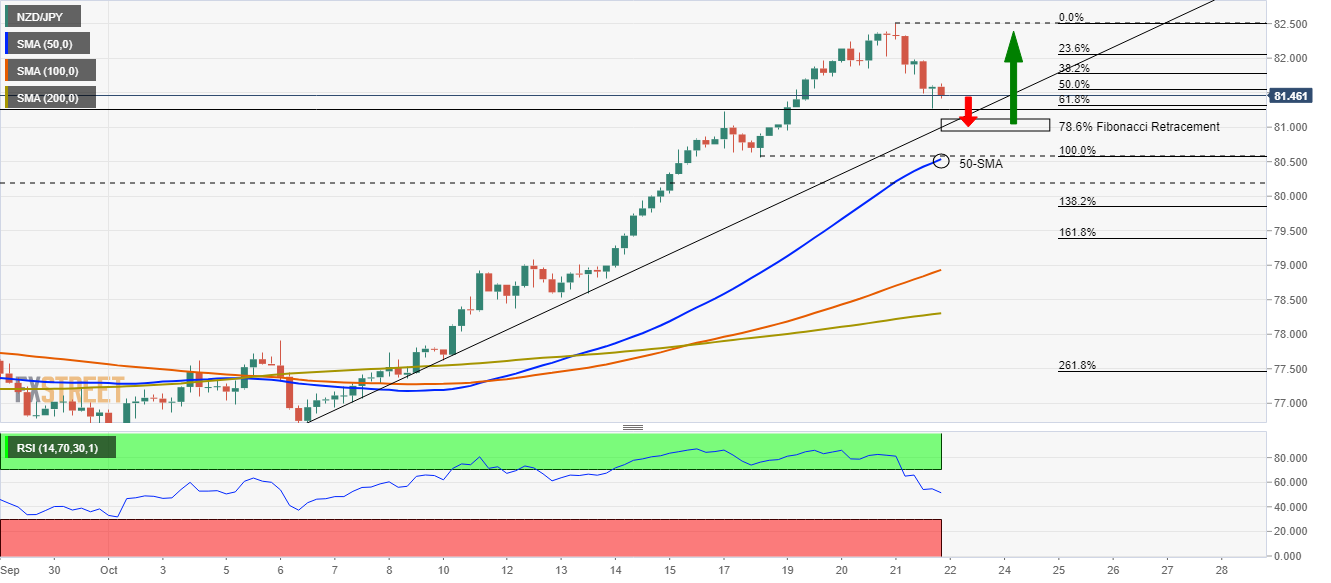
- NZD/JPY: The 4-hour chart depicts the pair has an upward bias, but a correction towards the 78.6 Fibonacci retracement is on the cards.
The NZD/JPY is flat early in the Asian session, trading at 81.51 during the day at the time of writing. The market sentiment is mixed, as Asian equity futures seesaw between gainers and losers. However, on Thursday, a negative market sentiment capped the 10-day rally of the New Zealand dollar against the Japanese yen.
Nevertheless, the long-term trend is tilted to the upside as the bond yield differential widens. Furthermore, the Reserve Bank of New Zealand is in a hike-rate stance, adding further upward pressure on the cross-currency pair.
NZD/JPY Price Forecast: Technical outlook
Daily chart
The NZD/JPY upward trend is overextended, as it was a steep move, from 77.00 towards 82.57, a 500 plus upside move. The cross-currency is tilted to the upside, depicted by the daily moving averages (DMA’s) with an upslope located below the spot price. The Relative Strength Index (RSI) is at 71 in overbought levels, confirming that the pair could correct lower before resuming the prevailing trend.
If the NZD/JPY breaks below the Thursday low of 81.25, traders could expect a correction towards two crucial support levels. The first would be the October 18 low at 80.90 or the May 27 high at 80.17. Either way, in both cases, the NZD/JPY pair could resume the upward trend towards a renewed challenge of the 82.57 level.

4-hour chart
The 4-hour chart confirms the upward bias of the NZD/JPY pair, though it is approaching an upward slope trendline that acts as support. However, a move towards the confluence of the 78.6% Fibonacci retracement and the upslope trendline is on the cards. The intersection lies around 81.00.
In case of a break lower of the latter, it would expose the 50-simple moving average (SMA) at 80.47. A breach of the abovementioned could send the pair tumbling towards the psychological 80.00
On the flip side, an upward rejection at 81.00 could open the way for a renewed test of the 2021 highs, but there would be some hurdles in the way. The first resistance would be the 50% Fibonacci retracement at 81.50, followed by 82.00. A breach above that level would expose the 82.50.


© 2000-2026. Bản quyền Teletrade.
Trang web này được quản lý bởi Teletrade D.J. LLC 2351 LLC 2022 (Euro House, Richmond Hill Road, Kingstown, VC0100, St. Vincent and the Grenadines).
Thông tin trên trang web không phải là cơ sở để đưa ra quyết định đầu tư và chỉ được cung cấp cho mục đích làm quen.
Giao dịch trên thị trường tài chính (đặc biệt là giao dịch sử dụng các công cụ biên) mở ra những cơ hội lớn và tạo điều kiện cho các nhà đầu tư sẵn sàng mạo hiểm để thu lợi nhuận, tuy nhiên nó mang trong mình nguy cơ rủi ro khá cao. Chính vì vậy trước khi tiến hành giao dịch cần phải xem xét mọi mặt vấn đề chấp nhận tiến hành giao dịch cụ thể xét theo quan điểm của nguồn lực tài chính sẵn có và mức độ am hiểu thị trường tài chính.
Sử dụng thông tin: sử dụng toàn bộ hay riêng biệt các dữ liệu trên trang web của công ty TeleTrade như một nguồn cung cấp thông tin nhất định. Việc sử dụng tư liệu từ trang web cần kèm theo liên kết đến trang teletrade.vn. Việc tự động thu thập số liệu cũng như thông tin từ trang web TeleTrade đều không được phép.
Xin vui lòng liên hệ với pr@teletrade.global nếu có câu hỏi.
ngân hàng